


Abstract
Concrete placement surfaces are characterized by intensive construction processes, frequent equipment interactions, and strong spatial dynamics, which make it difficult to identify unsafe actions of construction workers in real time and to accurately quantify and warn about regional safety risks. To address these challenges, this study proposes a safety monitoring method for construction workers operating on complex concrete placement surfaces. First, a coupled risk assessment framework integrating regional hazard levels, unsafe action risks, and worker authorization is established based on trajectory intersection theory (TIT). Subsequently, a multi-source continuous sensing system is developed by integrating global navigation satellite system (GNSS) positioning, inertial measurement unit (IMU)-based human activity recognition (HAR) using a BiLSTM-Attention model, and unmanned aerial vehicle (UAV)-based 3D realistic scene modeling. On this basis, real-time visualization and risk warning of worker trajectories, action states, and spatial risks are achieved through multi-source data fusion and a WebGL-based visualization platform. Field validation results indicate that the proposed system can generate alarm outputs that are consistent with the predefined risk rules within 3 s in typical construction scenarios, demonstrating rule-consistent real-time feasibility and stable system response performance.
1. Introduction
Concrete placement is a critical stage in hydraulic engineering projects, such as dams and pumping stations. In this study, concrete placement surfaces refer to working areas where concrete placing, surface preparation, and curing operations are conducted. Due to constrained working conditions, complex process organization, and strong environmental disturbances, concrete placement surface operations are consistently exposed to high safety risks. Consequently, workers’ walking, stopping, and operational trajectories are highly likely to overlap spatially and temporally with the operating paths of gantry cranes, cable cranes, and construction machinery, thereby increasing the likelihood of struck-by-object, mechanical injury, and fall-from-height accidents. From the perspective of work trajectory and environment interactions, construction workers’ future positions and their spatiotemporal relationships with surrounding environmental elements have been modeled to support the early identification and pre-warning of collision risks [1]. Previous studies have shown that insufficient hazard identification or inadequate supervision of worker actions during construction stages not only significantly increases accident probability but may also adversely affect structural safety and subsequent construction organization [2,3,4,5,6,7]. Therefore, achieving real-time monitoring of worker states and effective risk identification in dynamic and complex concrete placement surface environments has become a key scientific and engineering challenge for construction safety assurance.
To address construction safety issues, extensive studies have been conducted from the perspective of risk identification and assessment [8]. Traditional construction safety risk assessment methods mainly rely on risk matrices, analytic hierarchy processes, and fuzzy comprehensive evaluation to classify hazards based on accident probability and consequence severity. With the increasing dynamic nature of construction environments, research attention has gradually shifted toward dynamic risk identification supported by multi-source information fusion and building information modeling (BIM). Xun et al. integrated BIM with intuitionistic fuzzy sets and D–S evidence theory to enhance risk discrimination in complex construction scenarios [9]. Guo et al. proposed a Copula–cloud model-based multi-source risk assessment method to improve uncertainty representation [10]. Gao et al. achieved construction risk warning decisions by integrating multi-source quality data with deep learning techniques [11].
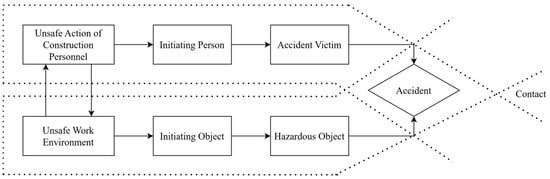
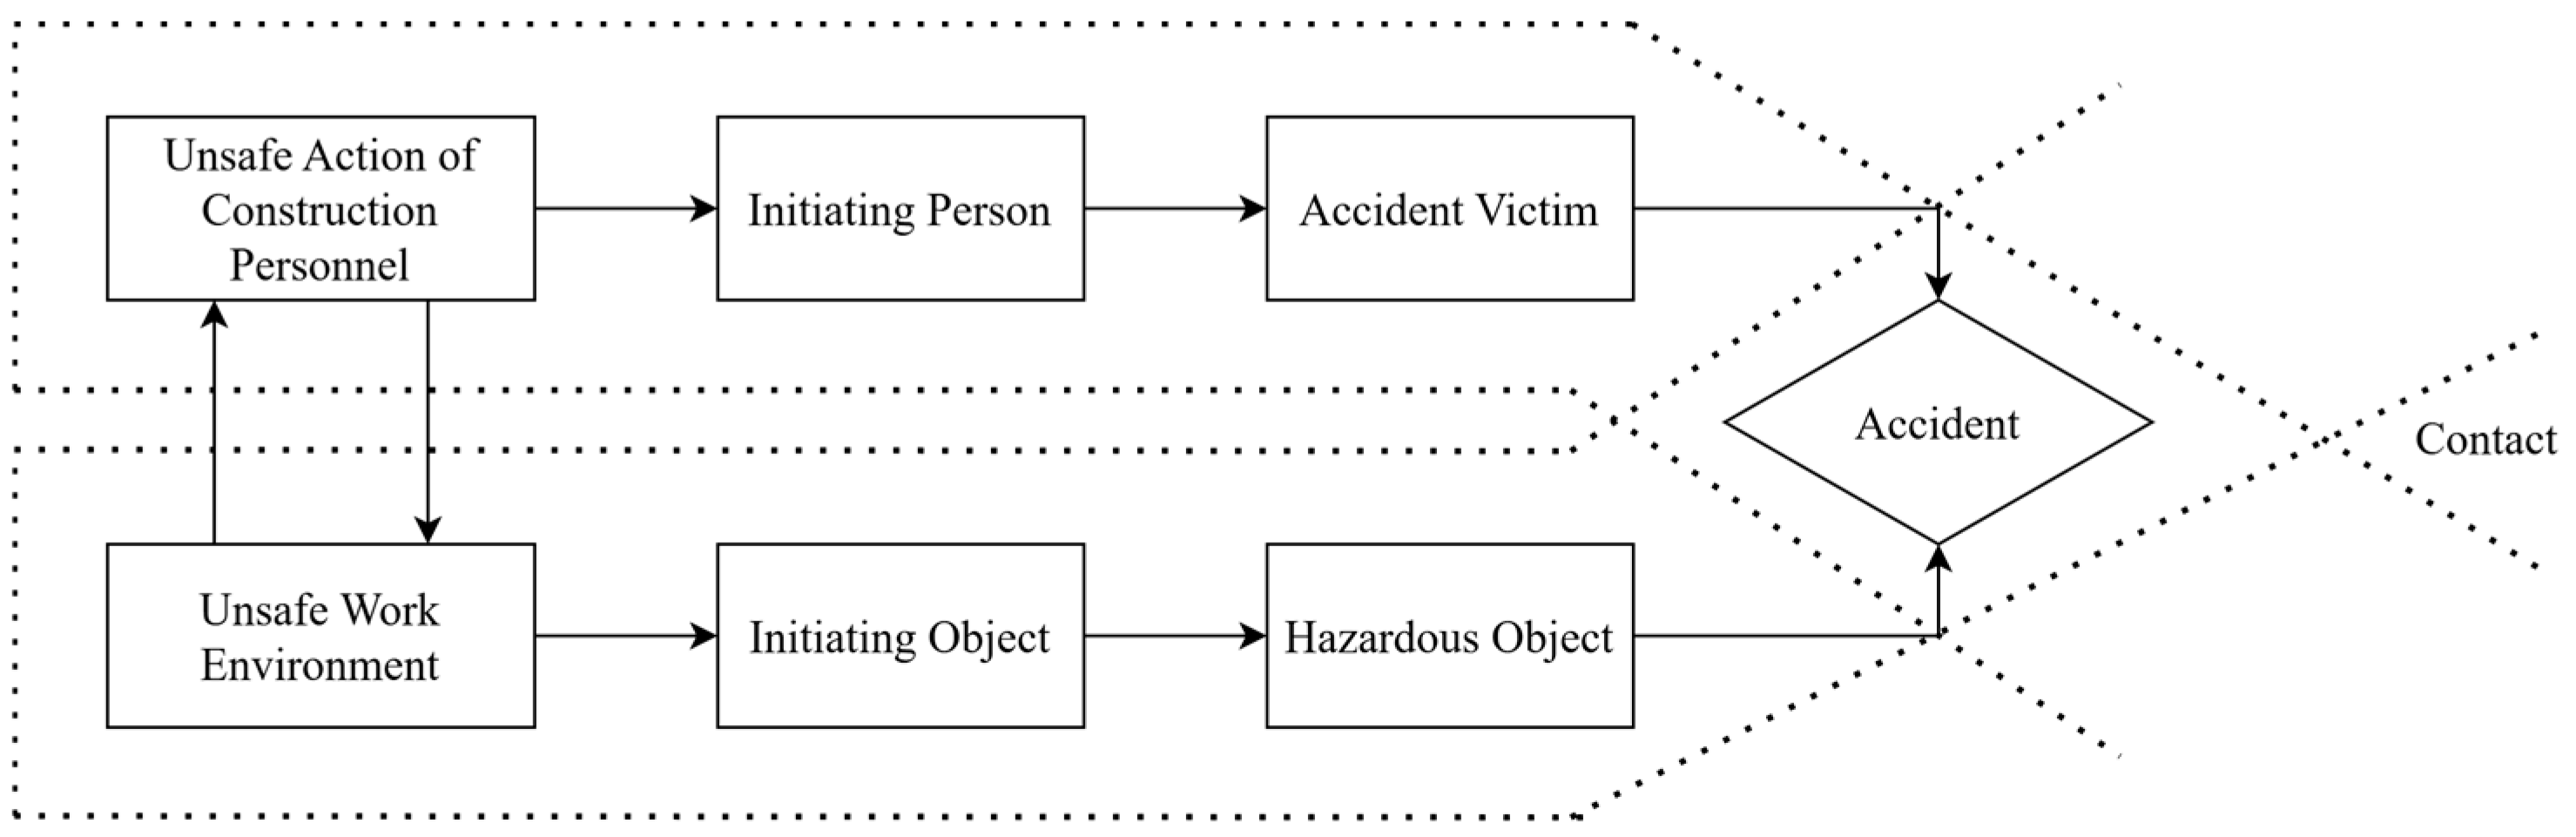
In terms of accident causation mechanisms, trajectory intersection theory (TIT) explains accident formation from the spatiotemporal intersection of unsafe actions and unsafe conditions, and has been applied to risk analysis in tunneling collapse scenarios [12]. In addition, typical dynamic risks such as surrounding rock instability and collapse have increasingly been investigated by combining multi-source sensing data with numerical simulation methods [13]. Despite these advances in dynamic risk identification and BIM integration, existing studies have predominantly focused on structured construction conditions such as tunnels and foundation pits. For concrete placement surfaces characterized by complex spatial features, dense equipment interaction, and continuous evolution across construction stages, fine-grained hazard zoning and risk modeling methods applicable to the construction process remain insufficiently explored.
On the other hand, to overcome sensing challenges such as severe visual occlusion and highly variable construction environments, two main technical approaches have been adopted for monitoring construction worker behaviors: computer vision (CV)-based methods and wearable sensing technologies. In recent years, CV-based approaches have achieved notable progress in personal protective equipment detection and unsafe action recognition by leveraging deep learning models such as YOLOv8 and Transformer architectures [14,15,16,17,18]. However, their monitoring performance remains limited in concrete placement surface environments characterized by frequent occlusions, restricted viewing angles, and dense equipment interactions. By contrast, wearable sensing technologies have attracted increasing attention due to their strong anti-interference capability and flexible deployment [19,20]. Zhao et al. utilized inertial measurement units (IMUs) to monitor construction workers’ work efficiency and posture [21]. Yan et al. proposed a real-time motion warning system for the prevention of musculoskeletal disorders [22]. At the algorithmic level, Mekruksavanich, Tezcan, and Karatas demonstrated that the application of deep learning, multimodal data fusion, and ensemble classifiers can significantly enhance HAR performance under complex working conditions [23,24,25]. Nevertheless, despite the maturity of wearable sensing technologies in HAR and ergonomic assessment, most existing studies focus on isolated actions or localized behaviors, and lack real-time coupling mechanisms with spatial position and regional hazard levels. As a result, they are insufficient to support integrated “behavior–location–risk” safety monitoring and analysis [26].
Meanwhile, the deep integration of BIM and the Internet of Things (IoT) has provided systematic data integration and 3D representation capabilities for construction safety monitoring. The CoSMoS system integrates sensor networks with BIM models to enable risk visualization in confined-space operations [27], while BIM–sensor data management platforms have further promoted the informatization and systematization of construction safety monitoring [28]. Review studies by Wu et al. and Manzoor et al. indicate that integrating BIM with sensor, schedule, and environmental data can significantly enhance the spatial representation of construction risks and support proactive safety management [29,30]. Pereira et al. further combined BIM with real-time monitoring technologies to prevent fall-from-height risks in construction environments [31]. Moreover, real time location system (RTLS)-based methods have been proposed for construction scenarios with confined spaces, limited visibility, and frequent worker and equipment interactions, enabling worker and equipment proximity risk monitoring and bidirectional warnings, and demonstrating real-time feasibility via threshold-triggered alerts [32]. Despite these achievements in environmental monitoring and task-specific safety management, existing systems generally lack deep integration of multi-source information—such as Global Navigation Satellite System (GNSS) positioning, IMU-based activity recognition, and 3D realistic scene modeling—when applied to machinery-intensive and highly dynamic scenarios like concrete placement surfaces. Consequently, comprehensive analysis of worker behaviors, spatial locations, and regional hazard levels has not yet been fully realized.
In summary, existing studies still exhibit limitations in the dynamic representation of hazardous areas, the spatiotemporal coupling of worker behaviors, and the engineering-oriented deployment of safety monitoring systems. To address these issues, this study aims to develop and implement an integrated safety monitoring and early-warning method for construction workers on concrete placement surfaces by coupling worker behaviors, spatial locations, and dynamic hazardous regions in real time. The following tasks are carried out:
Task 1: establish a TIT-based dynamic hazardous-region classification for concrete placement surfaces;
Task 2: develop a BiLSTM attention-based HAR model to identify typical workers’ actions;
Task 3: design an authorization-based warning mechanism by fusing hazardous regions, action risks, and worker permissions;
Task 4: implement a web-based 3D monitoring system and conduct field validation to evaluate system response and performance.
2. General Description of Safety Monitoring System
2.1. Characteristics of Construction on Concrete Placement Surface
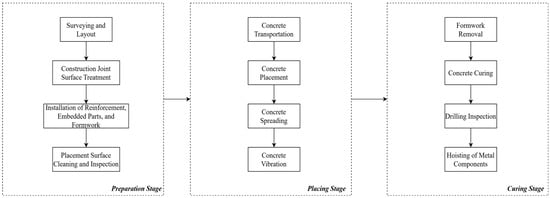
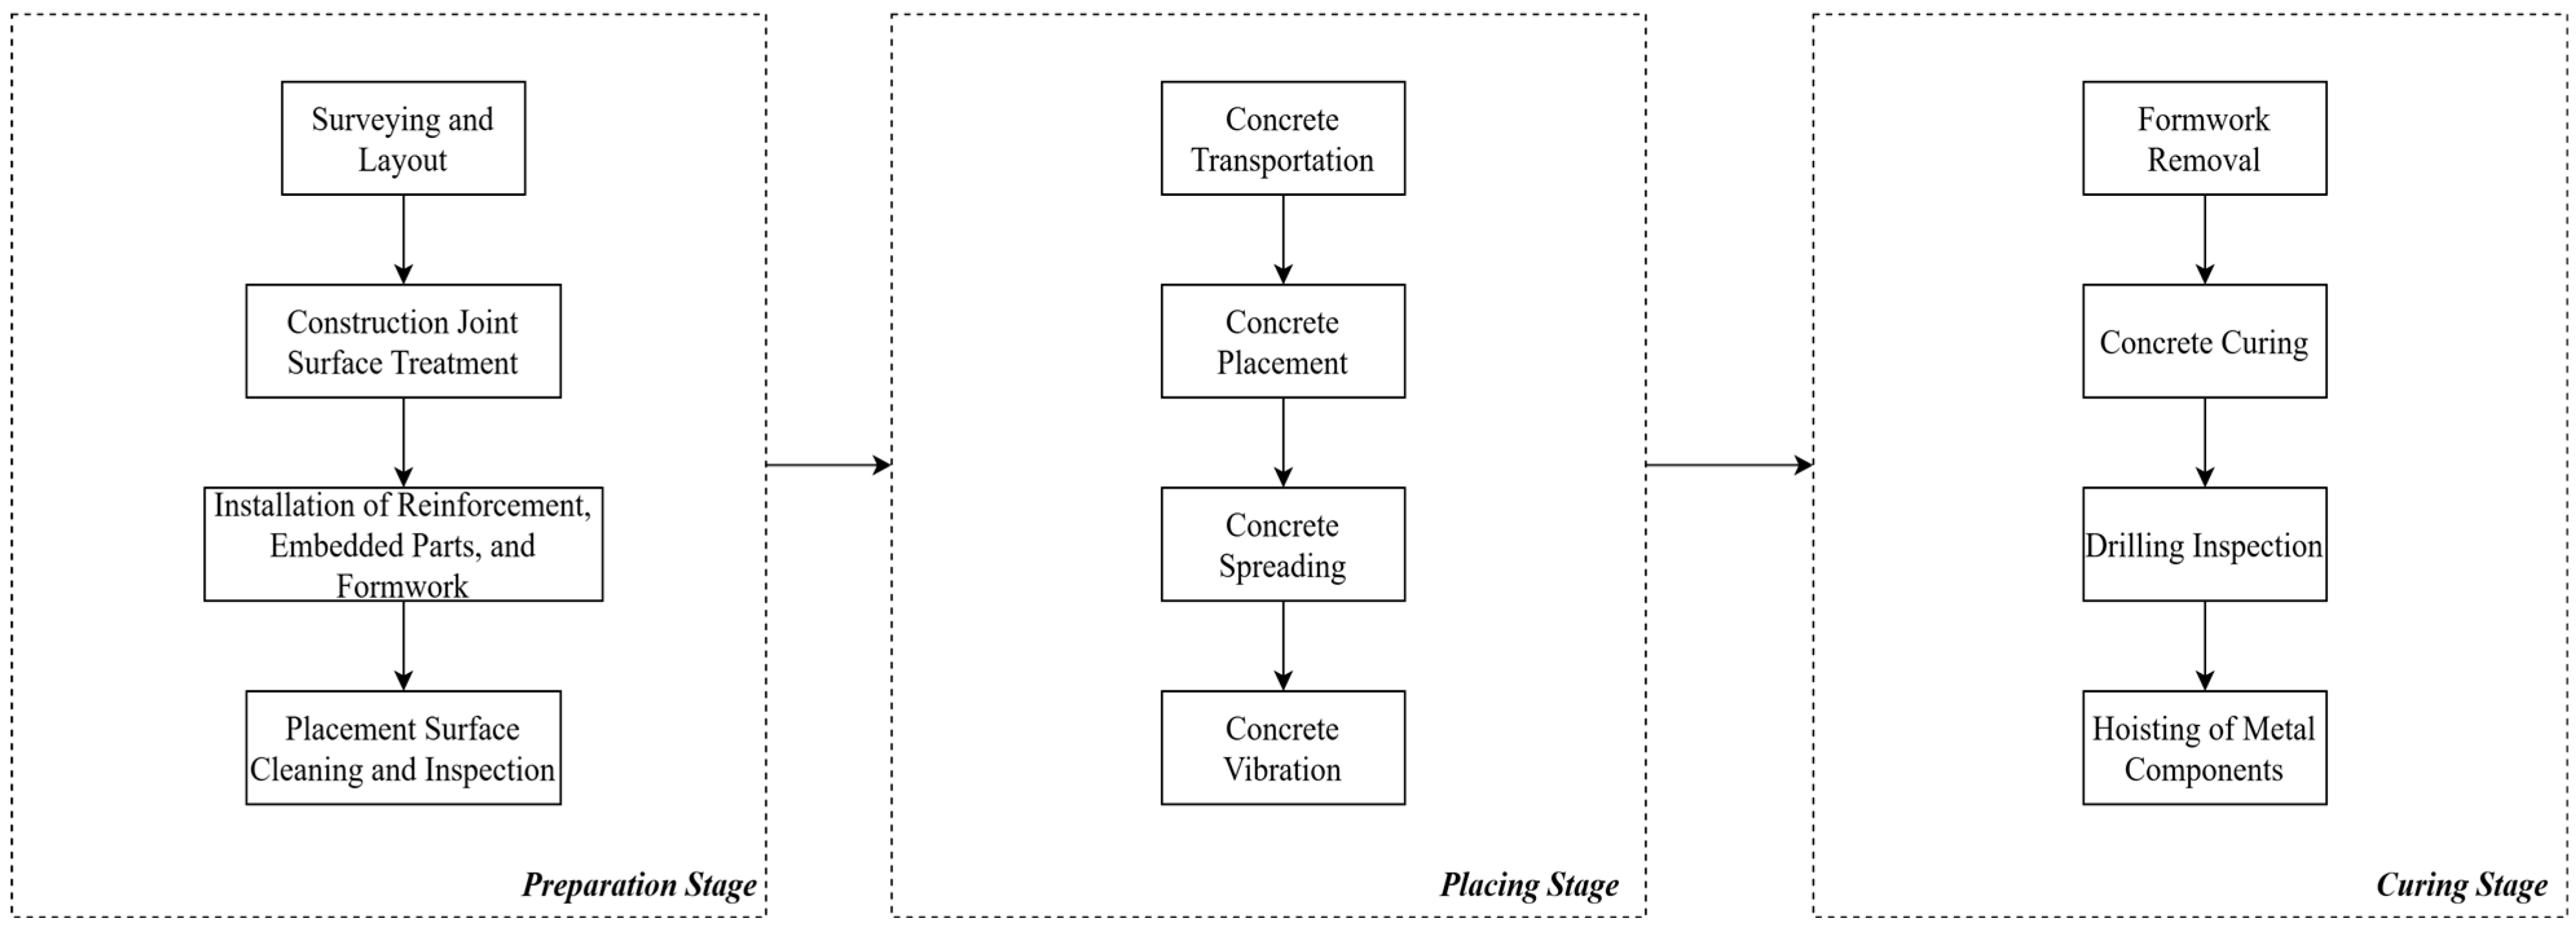
Concrete placement surfaces represent a typical confined working space, where multiple types of construction equipment and workers operate collaboratively within a limited area. Construction activities on concrete placement surfaces generally alternate among three stages, namely surface preparation, concrete placing, and curing, as illustrated in Figure 1.
Figure 1.
Schematic illustration of construction stages on concrete placement surfaces.
During surface preparation, workers operate near edges and formwork, requiring frequent movement in these zones and elevating risks of falls, struck-by incidents, and formwork instability. During placing, cranes and concrete transport equipment run continuously with routes shifting by placement location, creating strong spatiotemporal overlap between worker paths and equipment trajectories and increasing collision and falling-object hazards. During curing, formwork removal and inspections return workers to edge and elevated zones with longer dwelling times, re-intensifying action-related risks.
Worker trajectories are continuous and context-dependent, with walking, stopping, and operations changing with task demands, equipment status, and site organization. The spatiotemporal overlap between worker trajectories and hazard-zone boundaries is a key trigger of unsafe events, and moving machinery and dynamic hazard zones can further amplify this coupling between behavioral and regional risks [33,34,35,36].
2.2. Overall Framework and Fundamental Assumption of the System
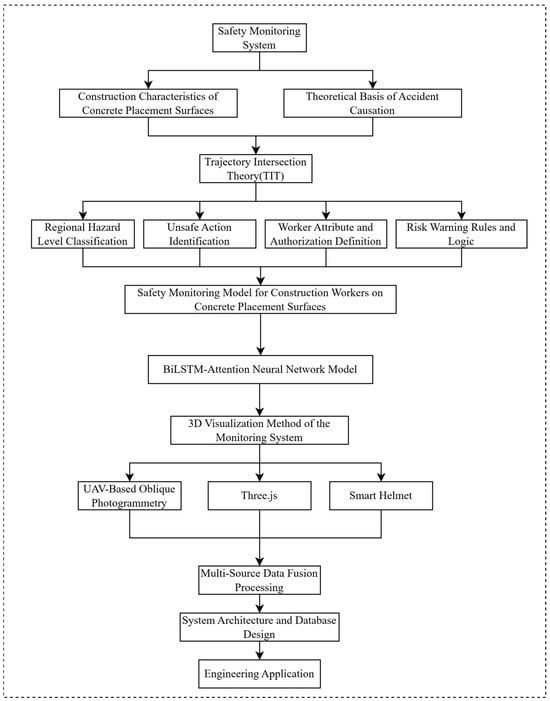
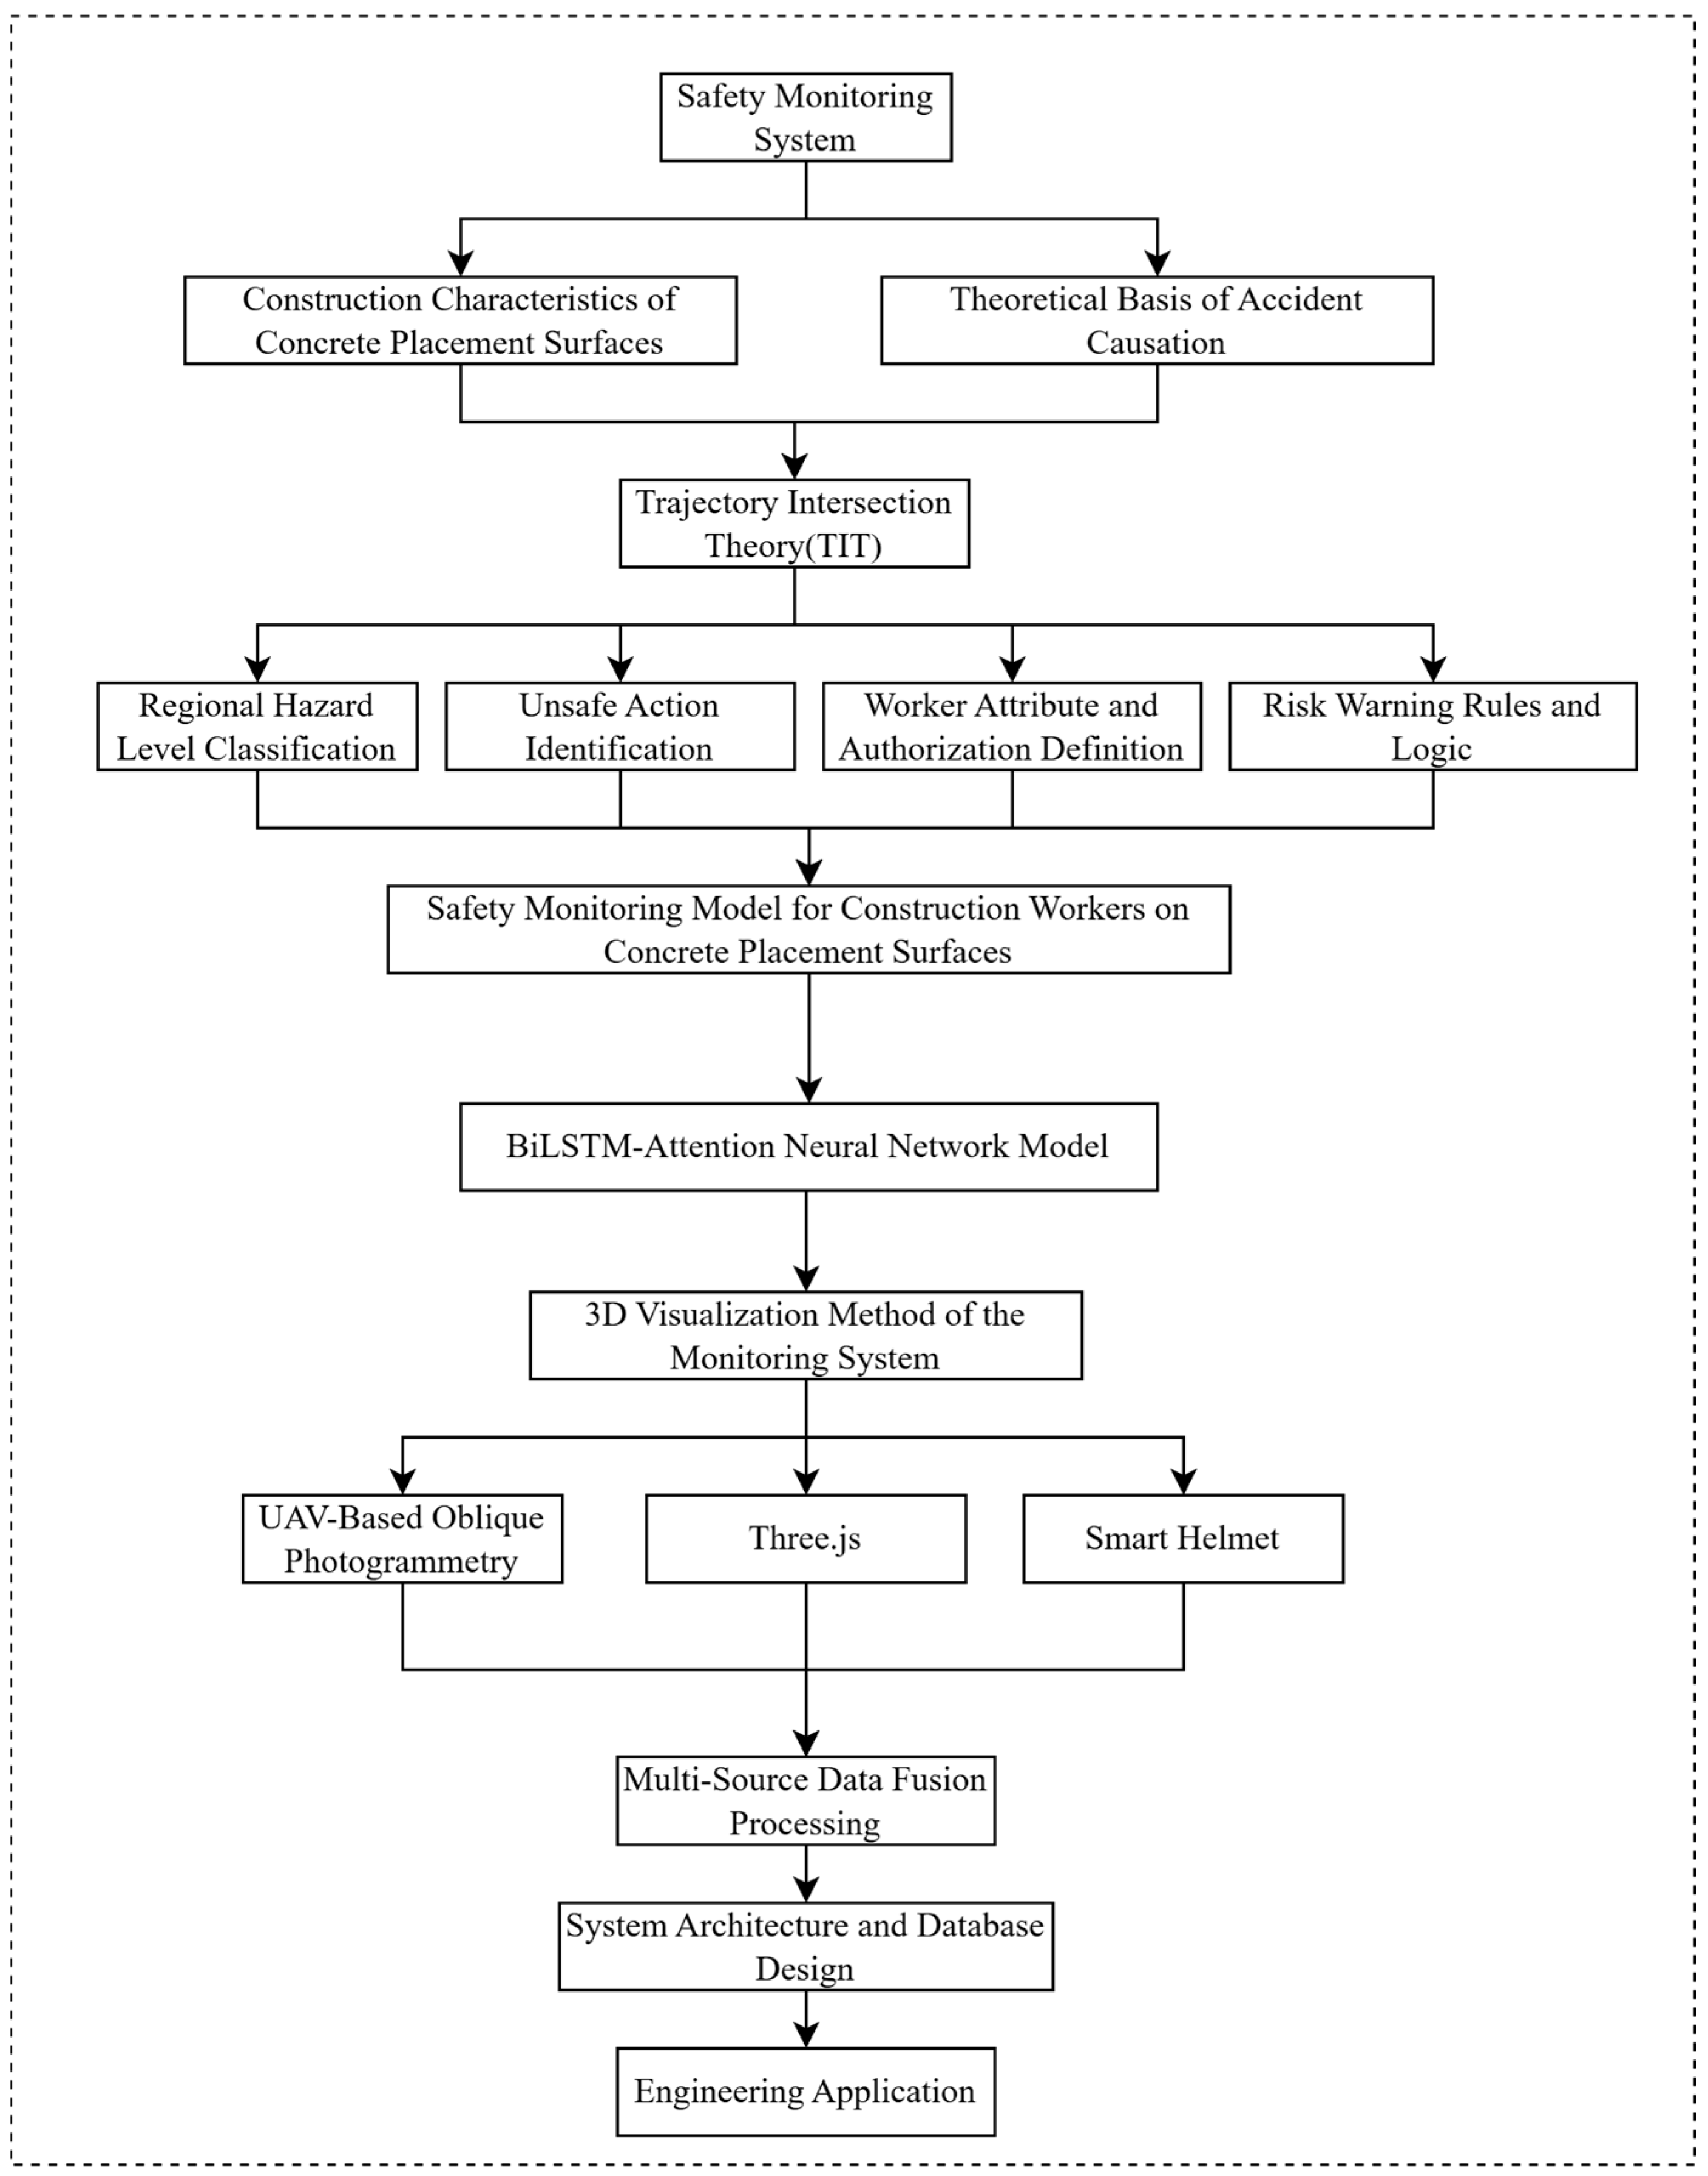
Base on the above-mentioned characteristics, the safety monitoring system for construction workers on concrete placement surfaces developed in this study consists of four core modules: regional hazard level classification, unsafe action recognition, worker attribute and authorization definition, and risk warning rules.
The system first performs spatial risk zoning of the concrete placement surface, which provides environmental constraints for subsequent assessment of workers’ behaviors. Subsequently, real-time action states of construction workers are identified based on multi-source sensing data, enabling characterization of behavior-related risk features. On this basis, worker job attributes and operation authorization information are incorporated to constrain the rationality of workers’ behaviors within different spatial regions. Finally, by jointly considering spatial risk levels, action states, and worker attribute information, safety risks of construction workers are evaluated and graded warning outputs are generated according to predefined warning rules. Although each module is functionally independent, they are hierarchically coupled in terms of information flow and decision logic, collectively forming an integrated safety monitoring and early-warning system for construction workers on concrete placement surfaces.
Specifically, GNSS positioning devices worn by construction workers, implemented as wearable devices such as helmets, are used to continuously collect their spatial location, while IMU sensors are employed to acquire time-series posture and motion data. Based on the IMU signals, HAR is performed using a BiLSTM-Attention neural network model to identify unsafe actions of workers. UAV-based oblique photogrammetry is employed to reconstruct 3D scene models of the concrete placement surface, which are used to define spatial boundaries and hazard-source distributions of the construction area. Subsequently, based on the TIT, regional hazard levels are classified by analyzing the spatiotemporal intersections between worker trajectories and hazard regions. Action-related risks are further quantified using a modified LEC method by integrating unsafe action identification results with worker attribute and authorization information. Finally, risk assessment and warning outputs are generated according to predefined risk warning rules and logic. The overall system framework is illustrated in Figure 2, enabling unified representation and dynamic monitoring of working areas, worker behaviors, and risk levels. It should be noted that Three.js serves only for web-based 3D visualization/rendering, and does not constitute a standalone system module nor a separate development stage.
Figure 2.
Overall framework of the proposed safety monitoring method for construction workers on concrete placement surfaces.
To ensure effective operation of the proposed model, several fundamental assumptions are made to provide the necessary foundation for subsequent model construction, risk inference, and risk warning rule design:
(1) Construction workers continuously wear positioning devices and IMU sensors during operations, and the corresponding data can be stably acquired and transmitted in concrete placement surface environments.
(2) Geometric boundaries of the construction area remain relatively stable within a single construction stage.
(3) Action recognition module can output continuous and time-synchronized action category sequences.
(4) All sensing data can be mapped into a unified coordinate system of the concrete placement surface.
3. Methodology
3.1. TIT-Based Dynamic Hazardous-Region Classification
3.1.1. Hazard Level Classification Criteria for Different Zones on Concrete Placement Surfaces
As mentioned before, risks on concrete placement surfaces exhibit stage dependency, dynamic evolution, and spatiotemporal coupling. Thus, a TIT-based [12] dynamic regional modeling approach is required to support hazard classification, unsafe-action identification, and early-warning rules. Unlike traditional static zoning methods that rely on fixed boundaries, TIT can consistently describe dynamic processes such as equipment relocation, edge condition changes, formwork installation and removal, and material transportation during construction. This makes it particularly suitable for complex concrete placement surface environments characterized by multiple machines, multiple processes, and intersecting operational paths, as illustrated in Figure 3.
Figure 3.
Schematic illustration of TIT.
Within this theoretical framework, the primary hazard sources on concrete placement surfaces can be categorized into five types of regions: edge-adjacent zones, formwork-adjacent zones, cable crane operation route zones, construction machinery operation zones, and general placement surface zones. The hazard level of each region is determined not only by its inherent properties (e.g., fall height and mechanical envelopes), but also by construction stage-dependent dynamic ranges. For instance, cable crane bucket operation routes shift with changing placing locations, formwork support projection zones vary with installation and removal processes, and construction machinery operation zones are governed by equipment scheduling, all of which exhibit pronounced temporal dynamics in their spatial boundaries.
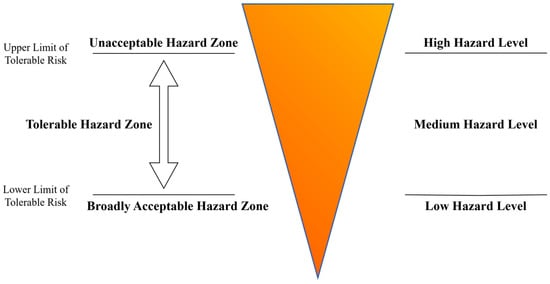
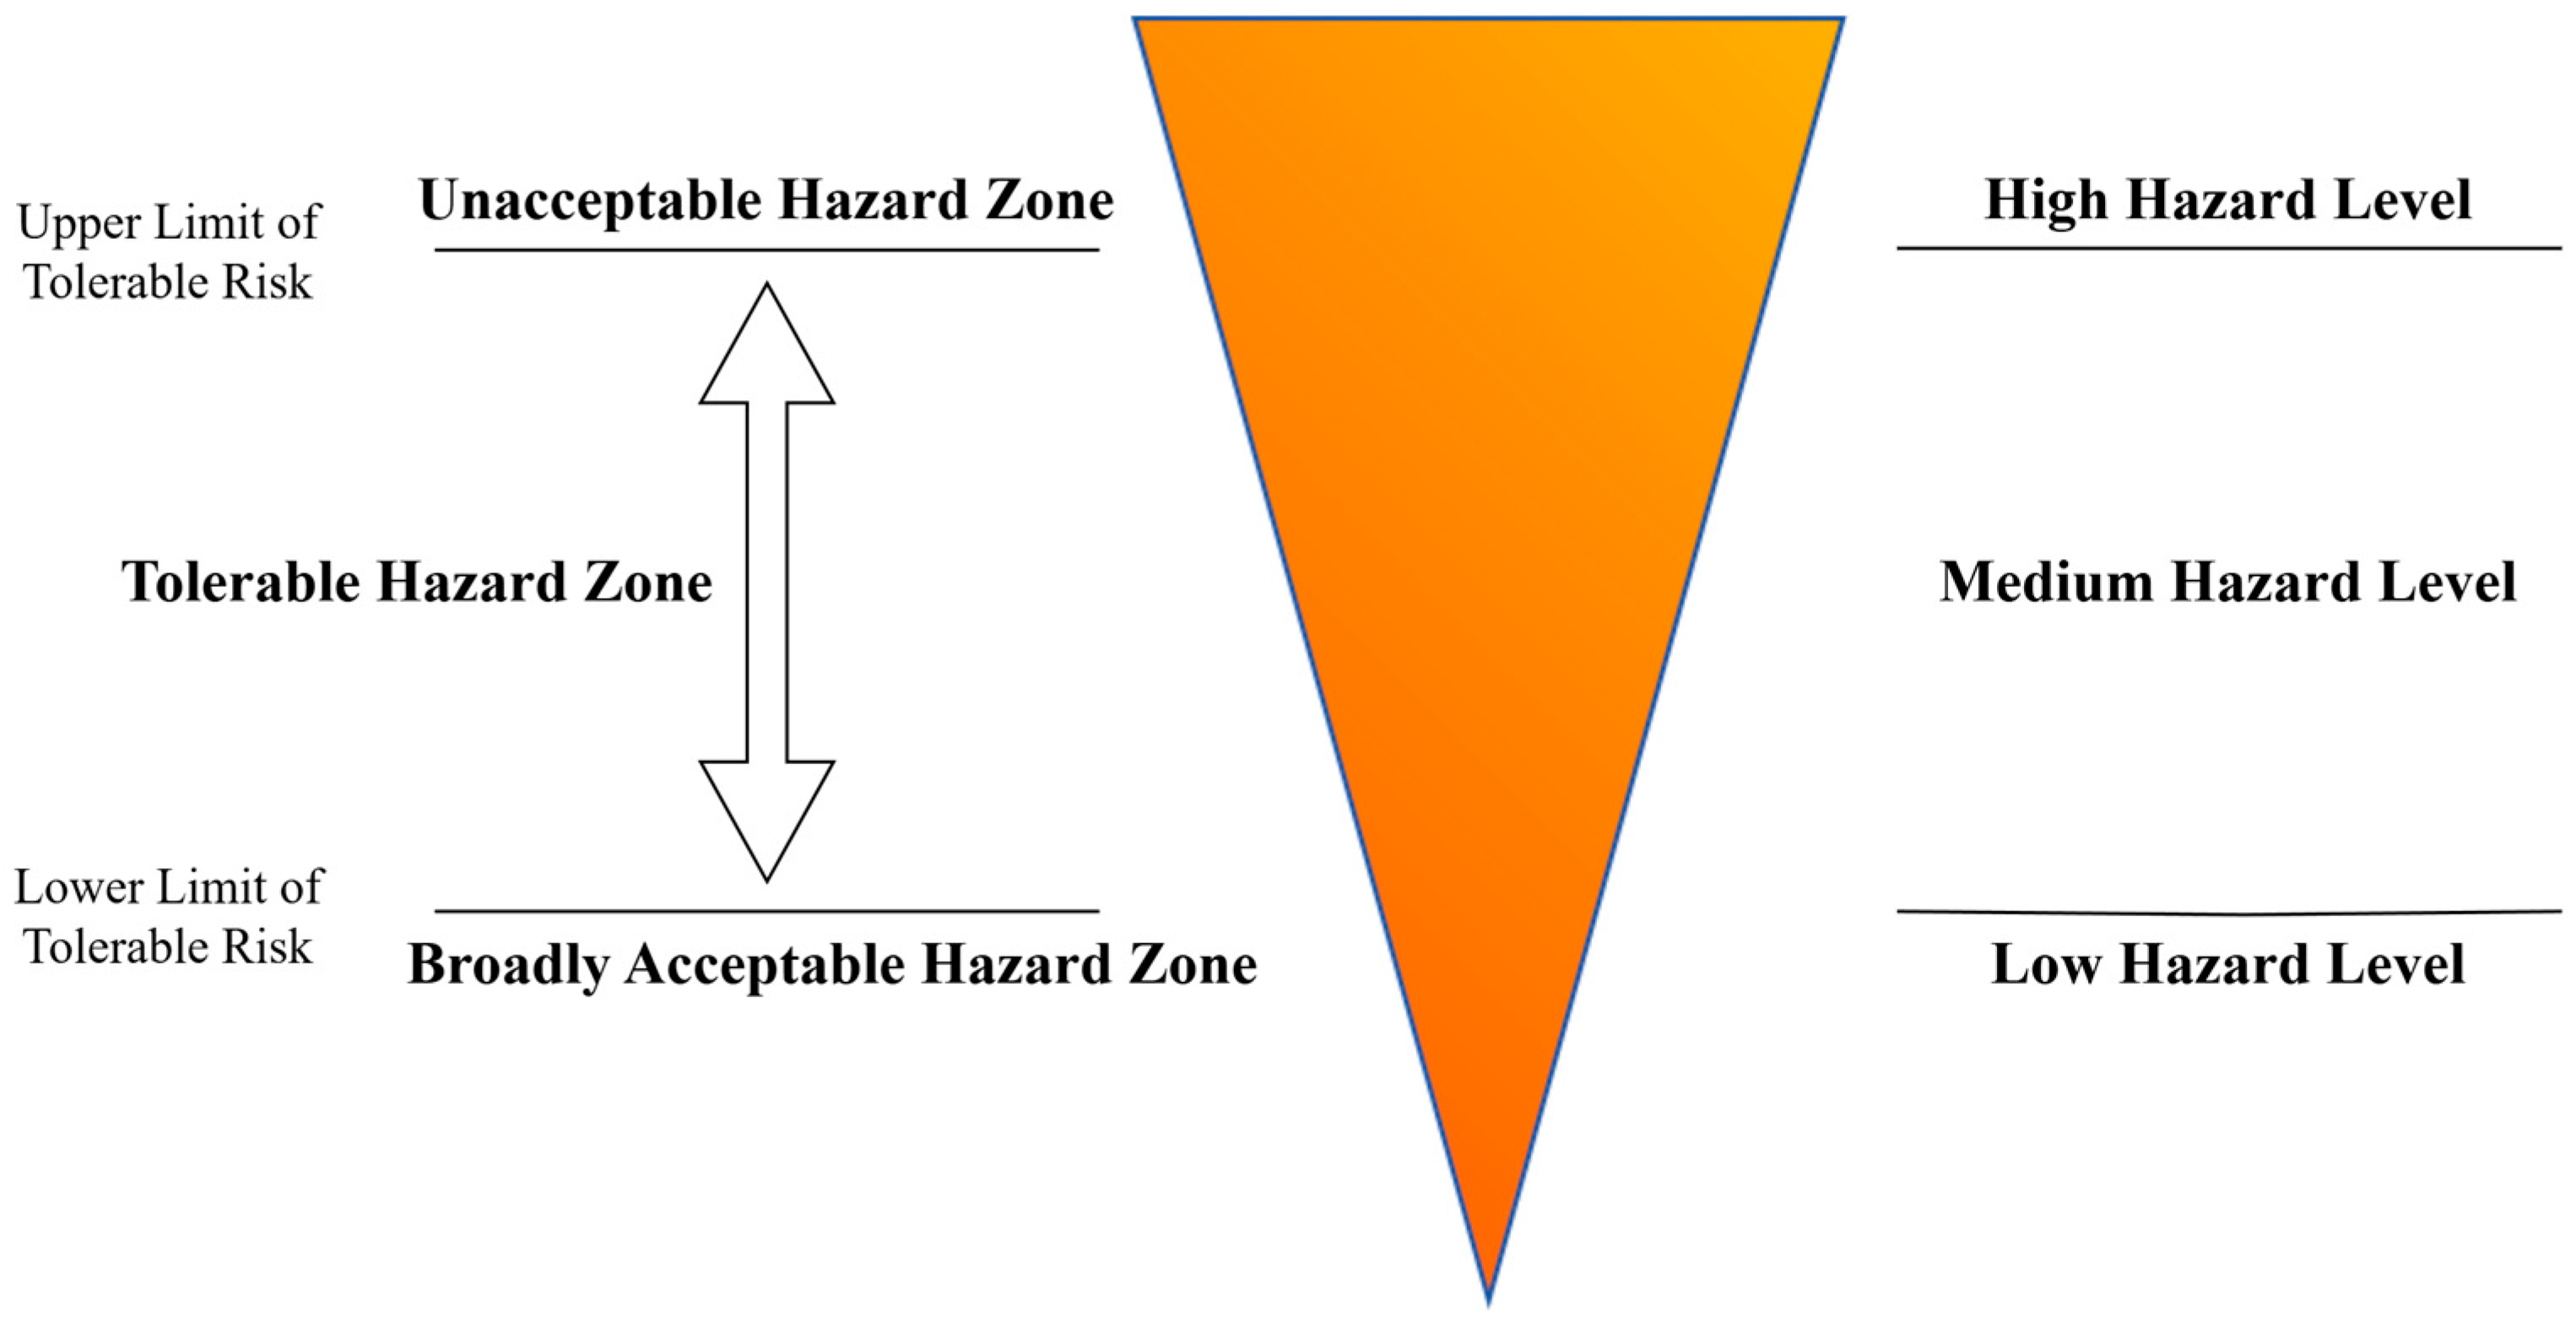
Considering the unavoidable spatial errors associated with GNSS positioning and sensor-based distance measurements, as well as the stochastic variability in construction workers’ gait and posture, a buffer zone based on the ALARP principle is introduced outside the geometric boundaries of hazard sources to reduce the probability of misclassification and missed detection in hazard zone classification [37]. The schematic layout of the buffer zone is illustrated in Figure 4. The introduction of buffer zones effectively accommodates uncertainties arising from positioning errors, posture variations, and equipment operation fluctuations, thereby enhancing the robustness and reliability of regional hazard level classification. Consequently, each type of hazard source is represented by a two-level structure consisting of a “core hazard zone” and a “buffer zone,” whose dynamic boundaries are automatically updated according to construction stages. The specific zoning criteria are summarized in Table 1.
Figure 4.
Schematic illustration of regional hazard level classification based on TIT and the ALARP principle.
Table 1.
Hazard level classification criteria for different zones on concrete placement surfaces (derived based on standards and literature [38,39,40,41,42,43,44,45]).
After regional hazard level classification is completed, all hazard zones are mapped into a unified coordinate system of the concrete placement surface and discretized into grid cells suitable for subsequent computations. By projecting the real-time positioning information of construction workers onto the corresponding grids, it becomes possible to determine whether a worker has entered a specific hazard zone. Combined with action-related risk levels, this information serves as input for subsequent worker authorization rules and risk warning logic inference. Consequently, the regional zoning method developed in this section provides a unified spatial foundation for the construction of the comprehensive risk identification model presented in the following sections.
3.1.2. Unsafe Action Classification Based on an Improved LEC Method
The LEC method is a representative semi-quantitative risk assessment approach that has been widely applied to risk level classification in construction scenarios. However, in the conventional LEC method, the consequence severity term C is typically defined for a single risk event, which makes it difficult to directly represent the comprehensive risk characteristics jointly determined by regional attributes and worker behaviors in concrete placement surface construction [46,47]. To address this limitation, this study introduces regional hazard-related factors and action-related characteristics into the LEC framework and proposes an adapted model capable of quantifying dynamic risks associated with complex construction activities on concrete placement surfaces.
In the improved model, Li denotes the likelihood of accident occurrence associated with region i, while Ci represents the severity of accident consequences associated with the hazard level of the corresponding region. The values of Li and Ci are determined according to the regional hazard levels defined in Section 3.1.1, as summarized in Table 2. Owing to differences in body stability, operational urgency, and posture variation, different worker actions exhibit distinct inherent risk levels. To characterize the intrinsic hazardousness of worker actions, an action hazard coefficient A is introduced, and different weighting values are assigned to typical actions such as walking, standing, sitting, running, climbing (ladder climbing), and lying [48]. For clarity and reproducibility, the action terms are unified across Table 3 and Appendix A.
Table 2.
Assignment criteria for accident occurrence likelihood (Li) and consequence severity (Ci) for different regions.
Table 3.
Hazard coefficient (A) values for different worker actions.
Under the same regional conditions, longer action durations result in higher levels of worker exposure to hazard sources, and the corresponding risk level therefore exhibits an increasing trend. To enable continuous quantification of the effect of action duration, the standard normal probability density function φ(x), as proposed in reference [48], is adopted to transform action duration into an exposure index. Accordingly, a monotonic relationship between the action duration t and the exposure level E is established as follows:
where x is a random variable and φ(x) denotes the corresponding probability density function. In this study, the action duration interval [0 s, 180 s] is mapped to the domain [0, 3] of the standard normal probability density function, and subsequently rescaled to the exposure level range [0, 10]. Specifically, we adopt a linear mapping x = t/60. Through this mapping process, a quantitative relationship between action duration and the exposure level E is established. The resulting continuous exposure function is employed to characterize the cumulative effect of action duration on the overall risk level.
By jointly considering regional hazard levels, intrinsic action hazardousness, and action duration effects, the improved LEC risk assessment model can be expressed as follows:
where Li and Ci are determined by the regional hazard levels (Table 2) and represent the hazard-based inherent risk characteristics of region i; A is determined by the action category (Table 3) and characterizes the intrinsic hazardousness of the action; and E is determined by the action duration and reflects the degree of worker exposure to hazard sources.
3.2. BiLSTM-Attention-Based HAR Model
3.2.1. Multi-Source Sensing Hardware Selection and Deployment
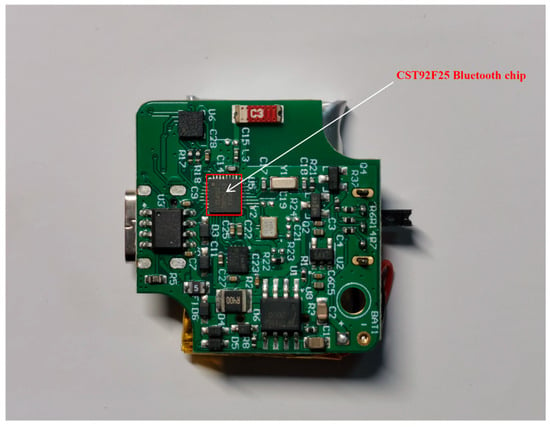
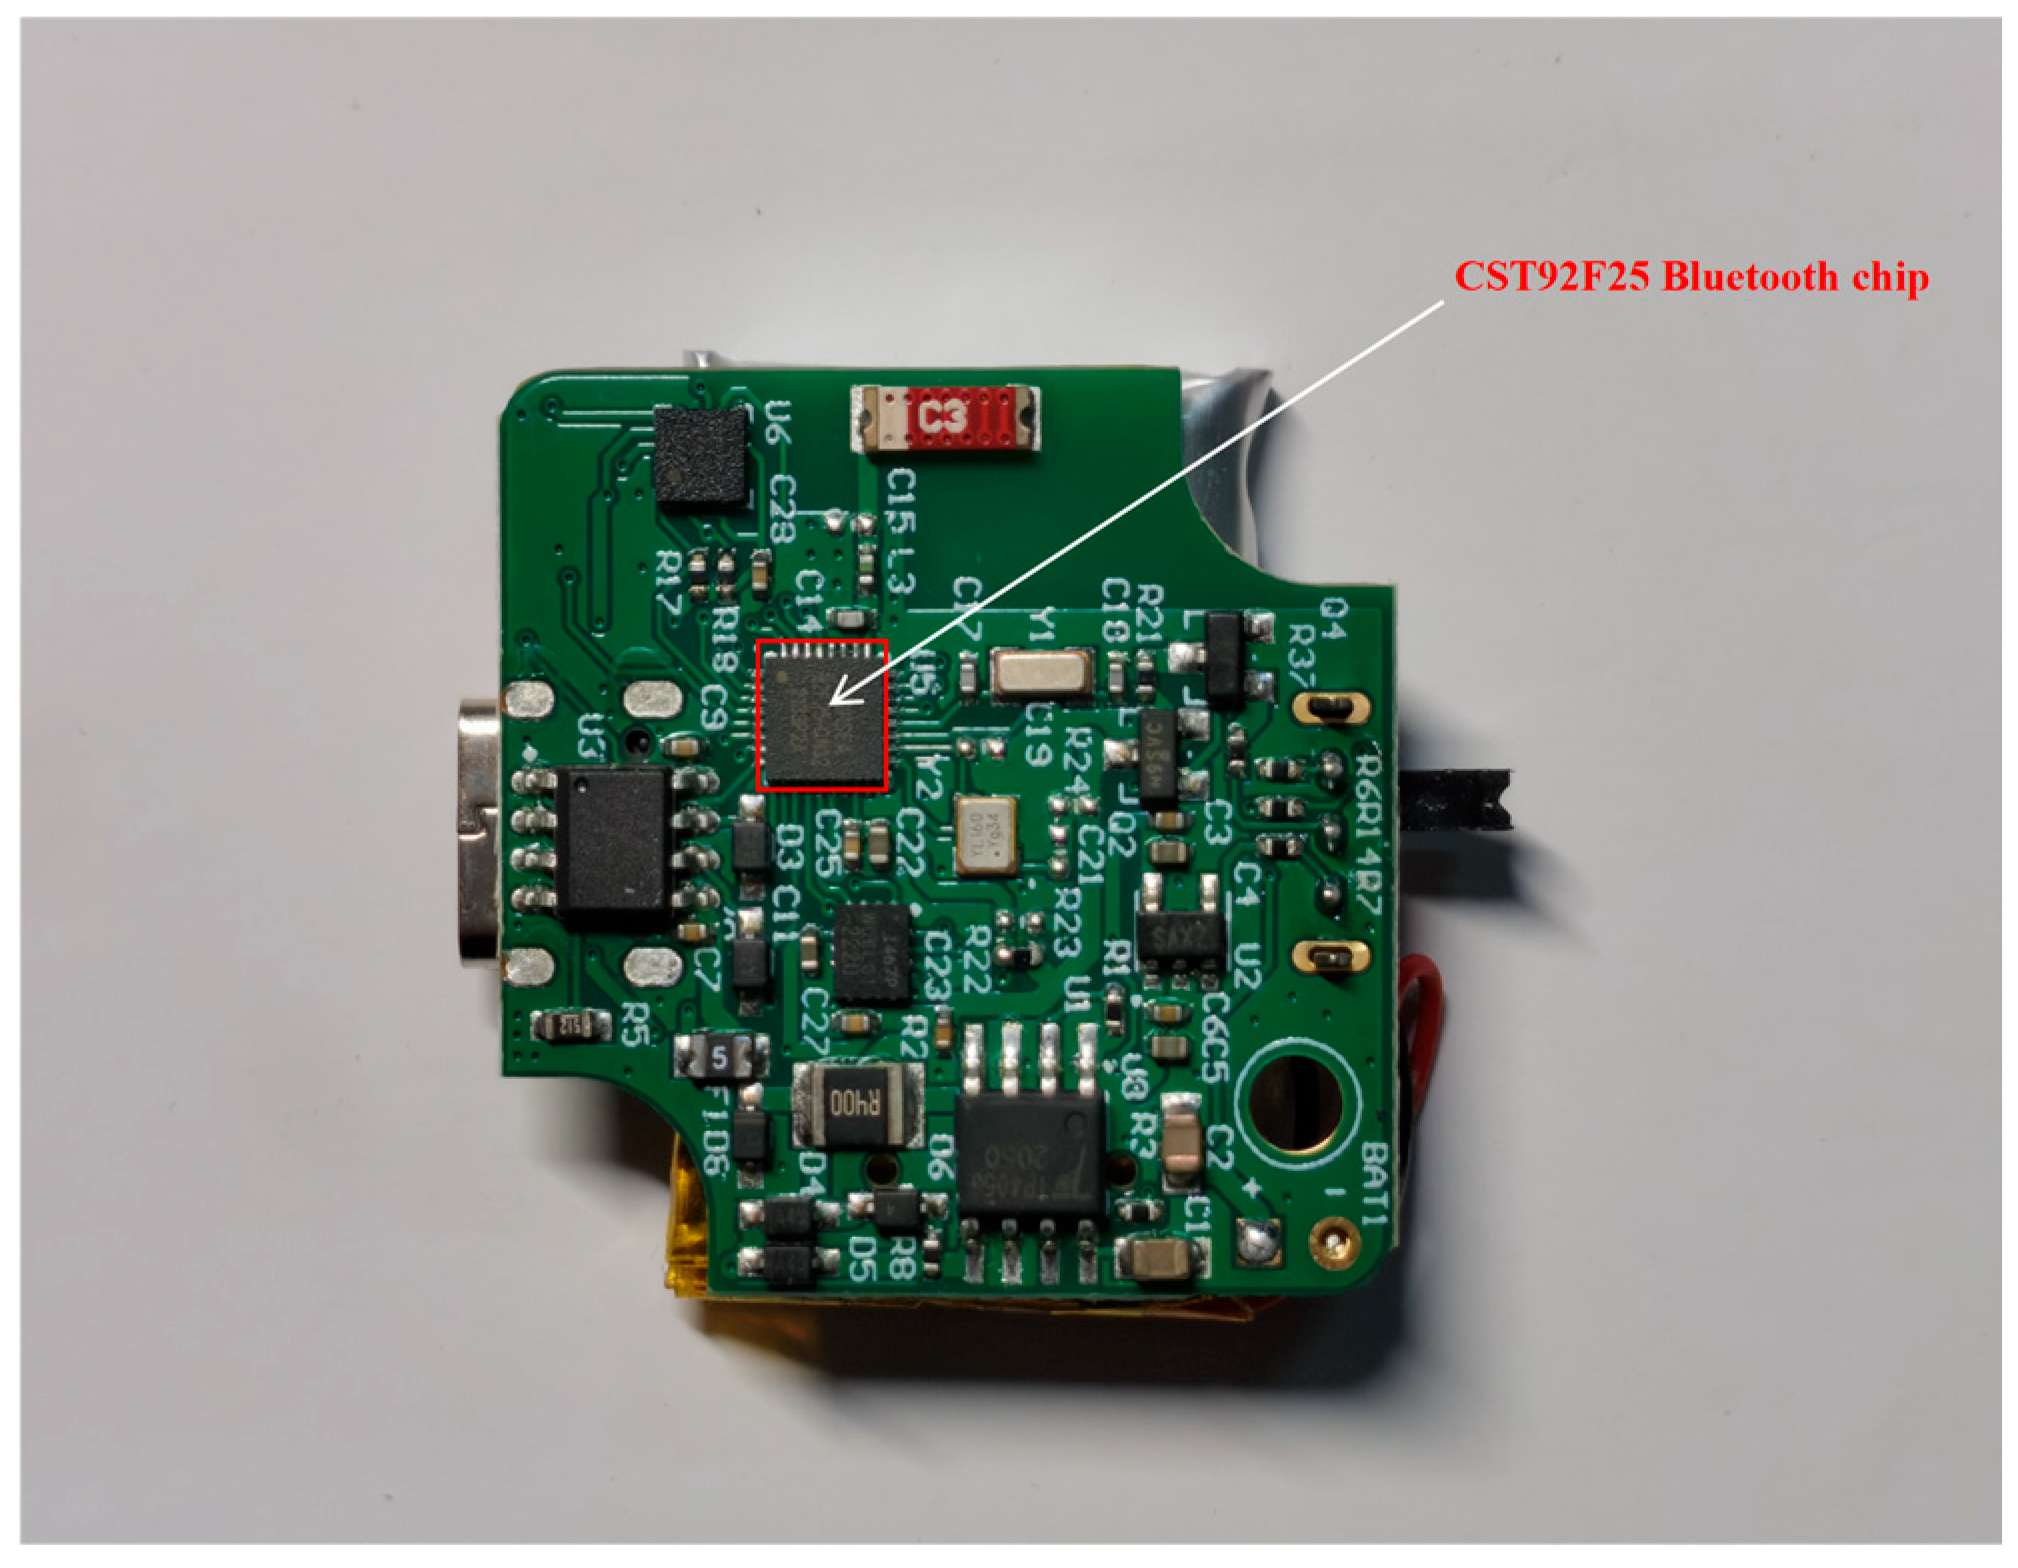
To enable stable, real-time operation of the proposed safety monitoring model on construction sites, continuous and reliable acquisition of worker motion and posture data is required. We therefore selected the WIT BWT901BLEC5.0 sensor (Figure 5) for HAR. It integrates a tri-axial accelerometer and tri-axial gyroscope, providing synchronized measurements of tri-axial acceleration, angular velocity, and angular acceleration for continuous posture monitoring on concrete placement surfaces. The sensor records nine-axis time-series data at 50 Hz and stores them locally on an SD card in 16-bit format, ensuring stable acquisition and adequate precision. It supports Bluetooth 5.0 with an effective range of ~50 m, and its 250 mAh battery provides around 6–8 h of continuous operation, covering a typical shift. In deployment, data are transmitted via Bluetooth to a mobile terminal and uploaded to a cloud server for HAR and risk assessment.
Figure 5.
BWT901BLEC5.0 inertial measurement unit (IMU) sensor.
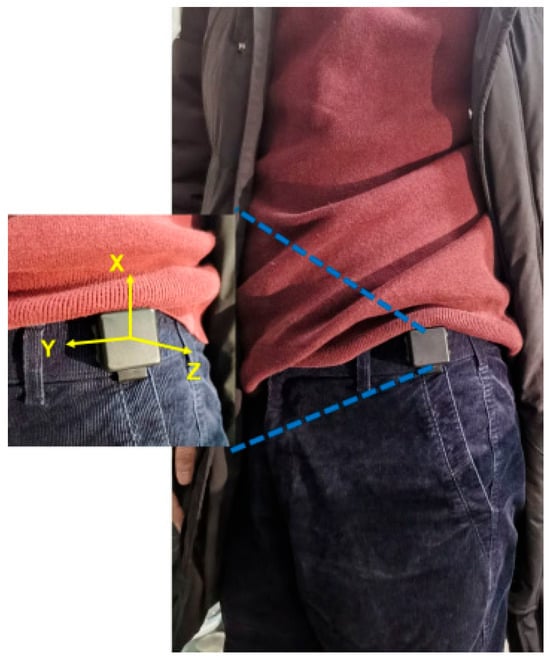
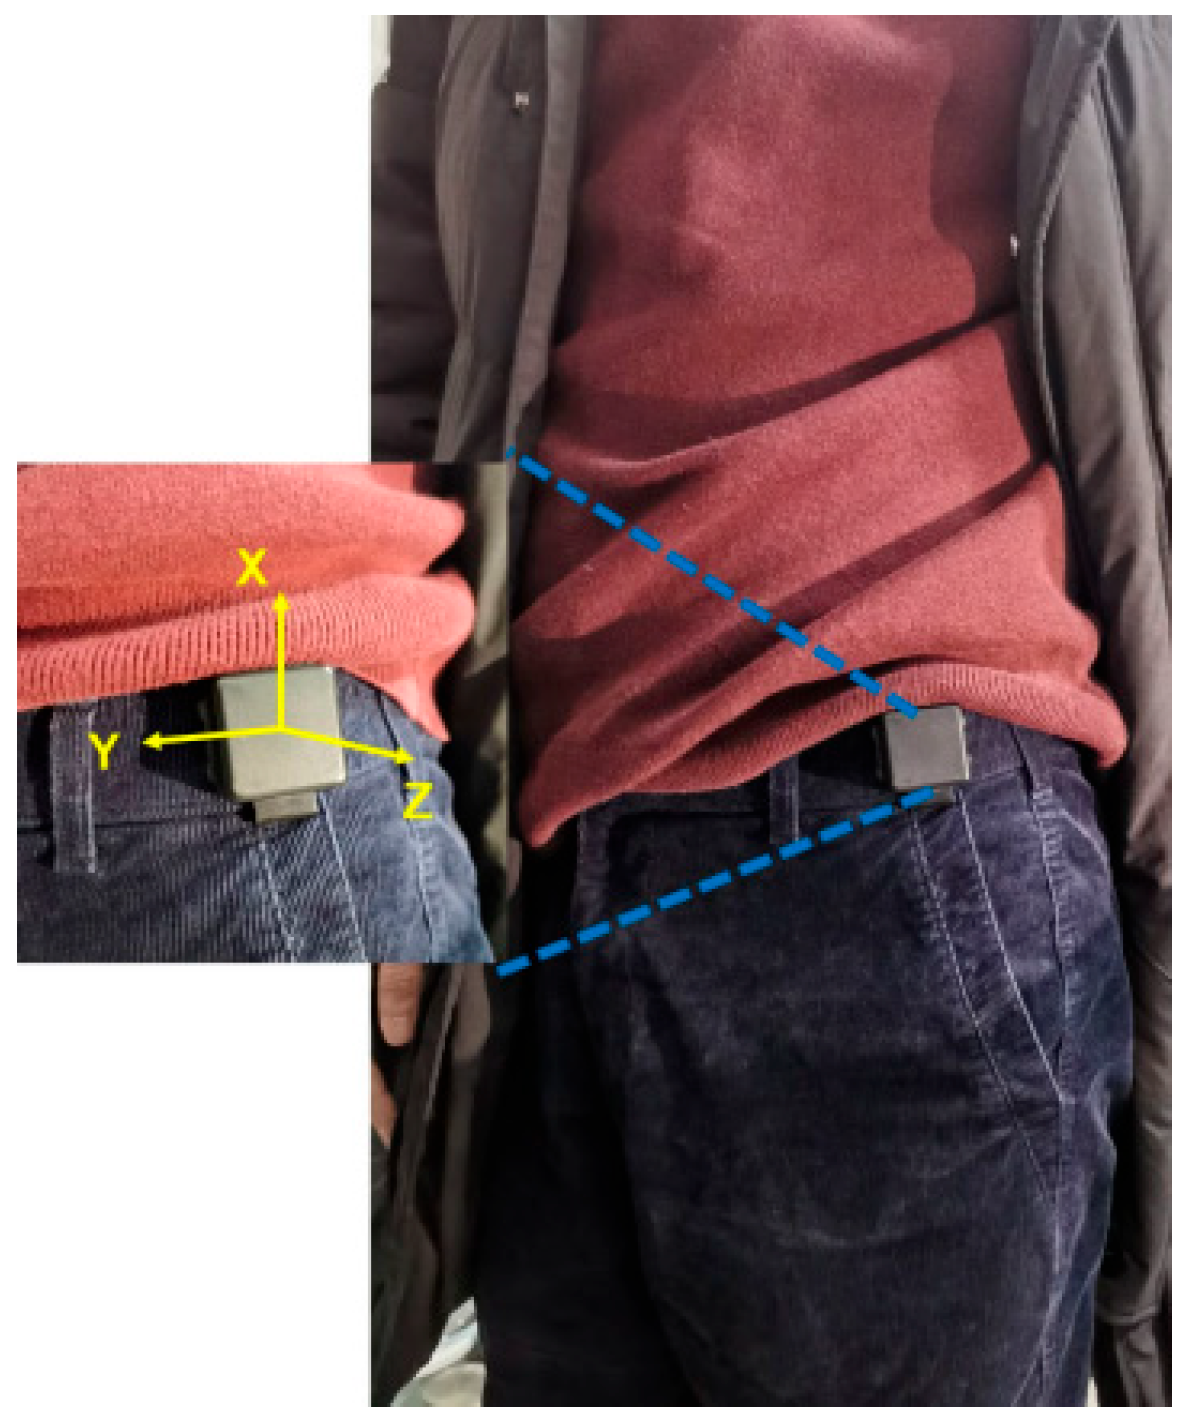
To minimize interference with on-site operations, the sensor is deployed at the worker’s waist, allowing it to avoid areas prone to collision, such as formwork support and vibration compaction zones, while effectively capturing overall human posture variations (Figure 6). This deployment strategy ensures the completeness and reliability of motion data acquisition without introducing noticeable disturbance to normal construction activities.
Figure 6.
Waist-mounted placement of the IMU sensor on a construction worker.
Real-time worker localization on concrete placement surfaces requires positioning devices that operate stably in open, dynamic construction environments. While UWB can provide centimeter-level accuracy, they typically involve substantial deployment effort, and require frequent adjustment as placement elevations change, limiting their practicality for fast-moving pours. Industrial-grade multi-constellation GNSS-RTK devices are easier to deploy, more adaptable, and lower in maintenance cost, making them better suited to this study.
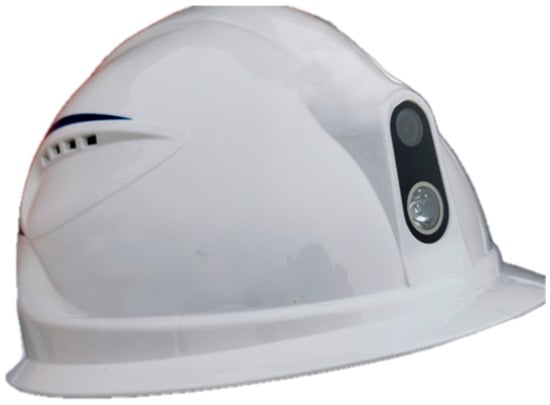
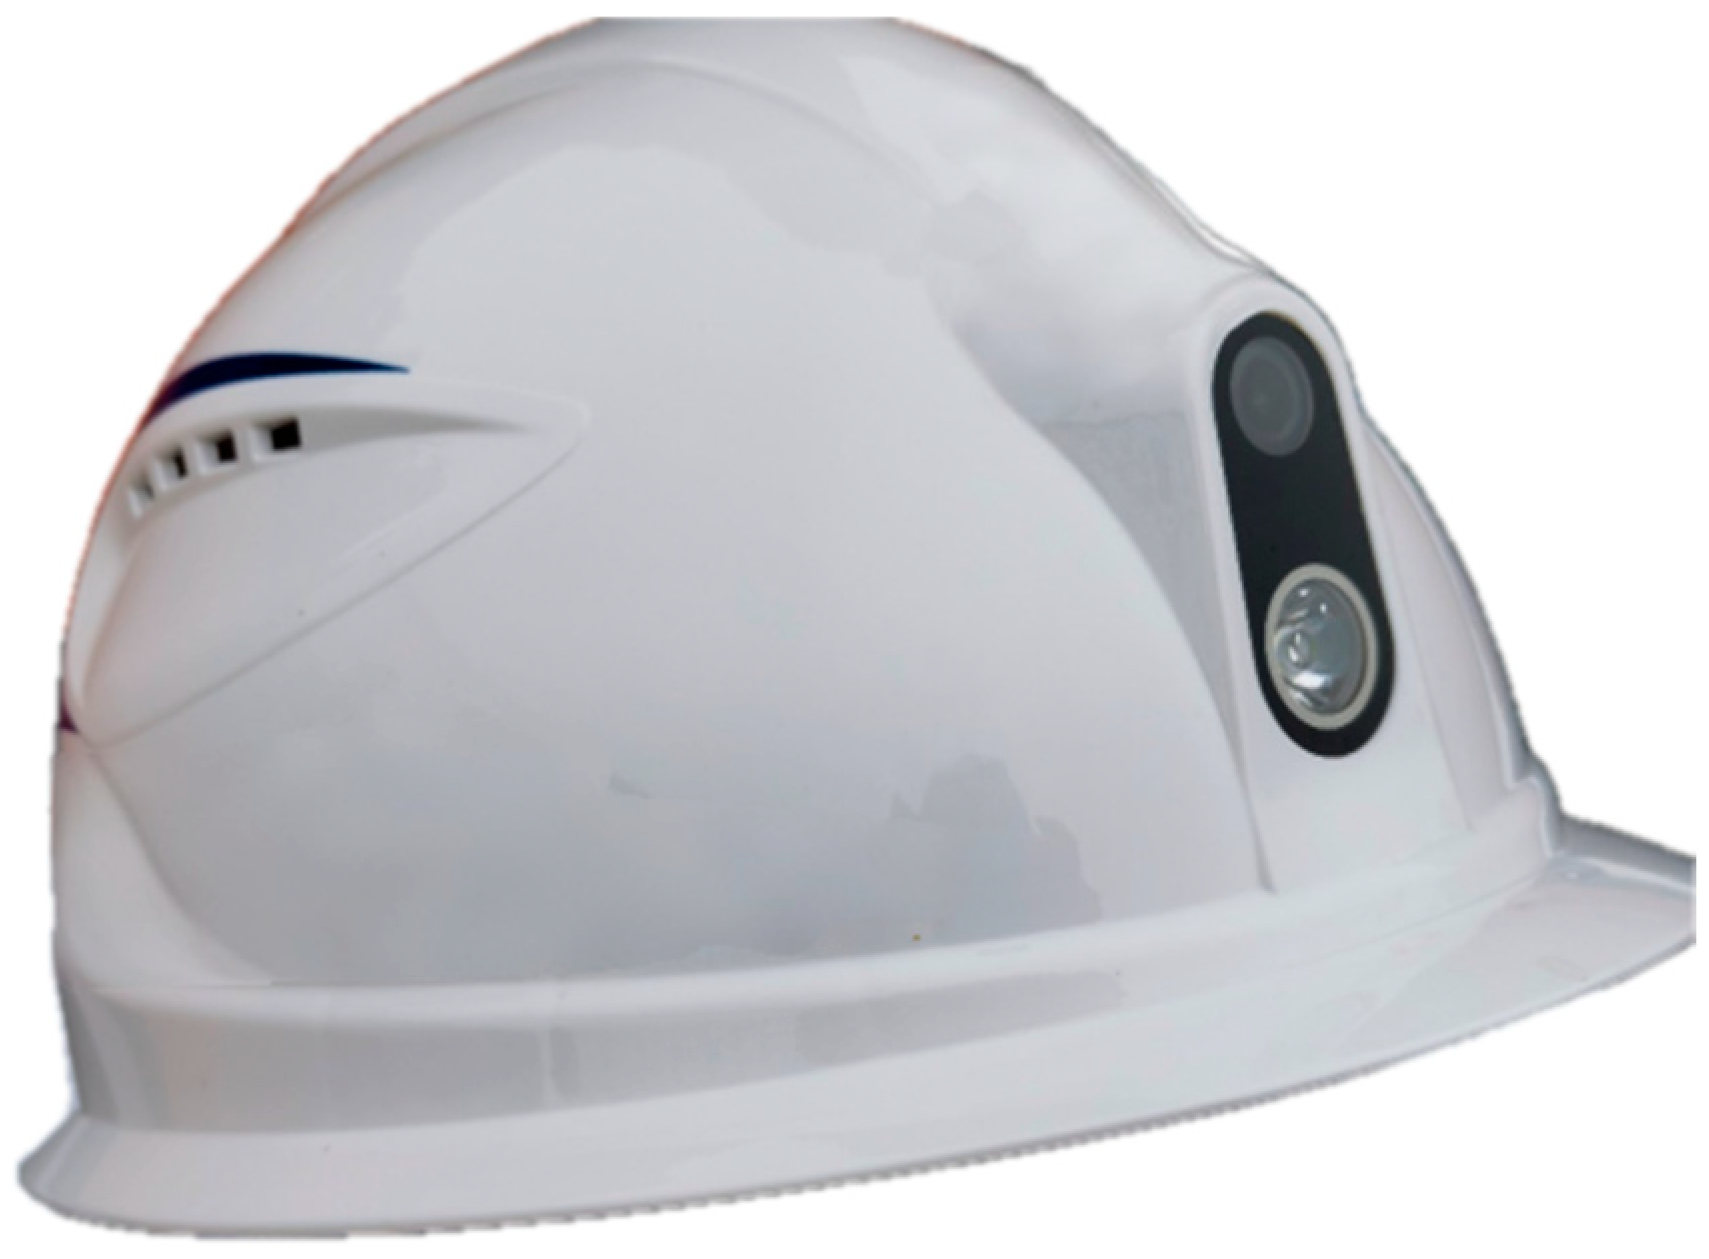
Accordingly, this study used the digital helmet as the worker positioning terminal (Figure 7). It integrates a multi-constellation GNSS-RTK module (GPS, BDS, GLONASS, Galileo, and QZSS) and achieves 1 m accuracy in open environments. The helmet also supports wireless communication and audio/video recording, and its 5000 mAh battery provides 8 h of operation. In use, the helmet connects to a mobile app via Bluetooth, and positioning data are relayed to a cloud server as location inputs for regional risk assessment and alarm logic.
Figure 7.
IHS smart helmet positioning terminal.
The main technical parameters of the positioning module are summarized in Table 4, including the supported satellite constellations, data types, update frequency, and positioning accuracy. These parameters provide the necessary data foundation to ensure stable and real-time personnel localization within the proposed system.
Table 4.
Main technical parameters of the positioning module.
3.2.2. HAR Model Architecture and Temporal Modeling Principle
Deep learning approaches have demonstrated high accuracy in processing IMU-based time-series data and recognizing human activities, which makes them well suited for action analysis in complex operational environments [23,24,49,50,51]. To enable reliable identification of unsafe actions performed by construction workers, this study adopts a BiLSTM-Attention algorithm to develop IMU-based HAR, which has been reported in our previous work [52].
The algorithm performs online analysis of continuous IMU time-series data collected from construction workers and outputs basic action category labels. These outputs serve as essential inputs for subsequent action risk quantification, worker authorization assessment, and alarm decision-making. As the model architecture and training procedure of the BiLSTM-Attention algorithm have been described in detail in our previous work [52], IMU-based multi-dimensional time-series data are denoised and normalized, and continuous data streams are segmented into fixed-length sequences using a sliding time window to construct action samples. The processed sequences are then fed into a BiLSTM network for feature modeling, and the extracted temporal features are used for action state classification and subsequent safety monitoring analysis.
From a temporal modeling perspective, in IMU-based HAR tasks, action categories are typically determined by posture variations over a continuous time interval, and sensor data at a single time instant are insufficient to fully characterize complete action patterns. It is necessary to model the temporal dependencies inherent in IMU time-series data. LSTM networks effectively capture long-term temporal dependencies through gated update mechanisms [53], and the state update process of a basic LSTM unit can be expressed as follows:
where it, ft, and ot denote the input gate, forget gate, and output gate, respectively, all of which are vectors with elements ranging from 0 to 1; ct represents the memory cell state; σ() denotes the sigmoid activation function; ⊙ indicates element-wise multiplication; and [ht−1,xt] represents the concatenation of the previous hidden state ht−1 and the current input xt.
Furthermore, to capture the forward and backward dependencies commonly observed in construction-related actions—such as “lying–standing” and “pausing–walking”—a BiLSTM architecture is adopted to perform bidirectional feature modeling of IMU time-series data, thereby enhancing the model’s ability to represent complex action transition processes.
In addition, an attention mechanism is further incorporated to enhance the model’s ability to focus on critical temporal segments, thereby improving the stability and robustness of action recognition. The computation procedure of the attention mechanism and its core steps are summarized as follows [52]:
First, a nonlinear transformation is applied to the feature vector at each time step to obtain an intermediate attention score:
where Wi and bi denote the weight matrix and bias term of the attention layer, respectively; hi represents the feature vector corresponding to the i-th time step; and Scorei denotes the attention score at the i-th time step.
Subsequently, the Softmax function is applied to normalize the attention scores across all time steps, mapping them into corresponding attention weights:
where ai denotes the attention weight corresponding to the i-th time step.
Finally, the time-series features are aggregated using the attention weights to obtain an enhanced action feature representation:
where h′ denotes the action feature representation vector after attention-based weighting, and l represents the length of the time series.
3.2.3. IMU Data Acquisition, Signal Characteristics, and Deployment
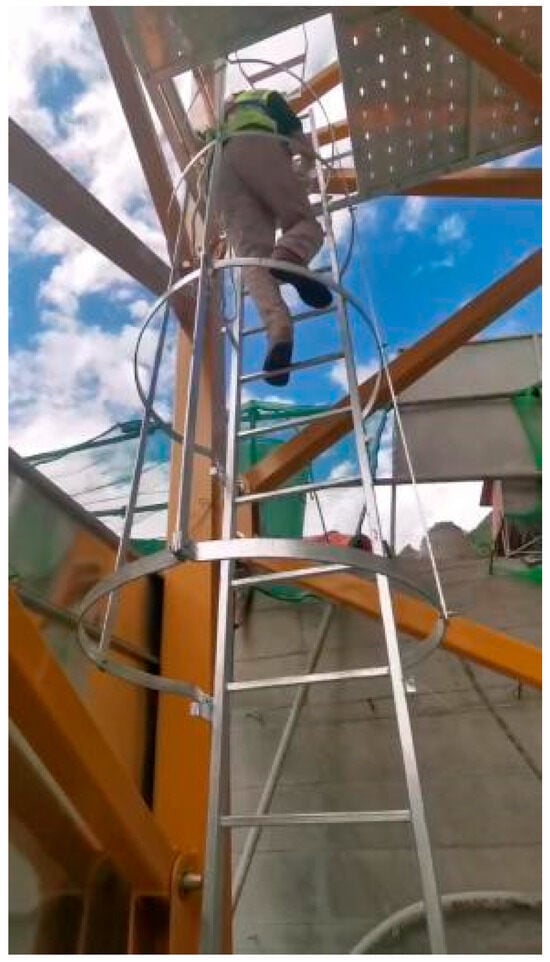
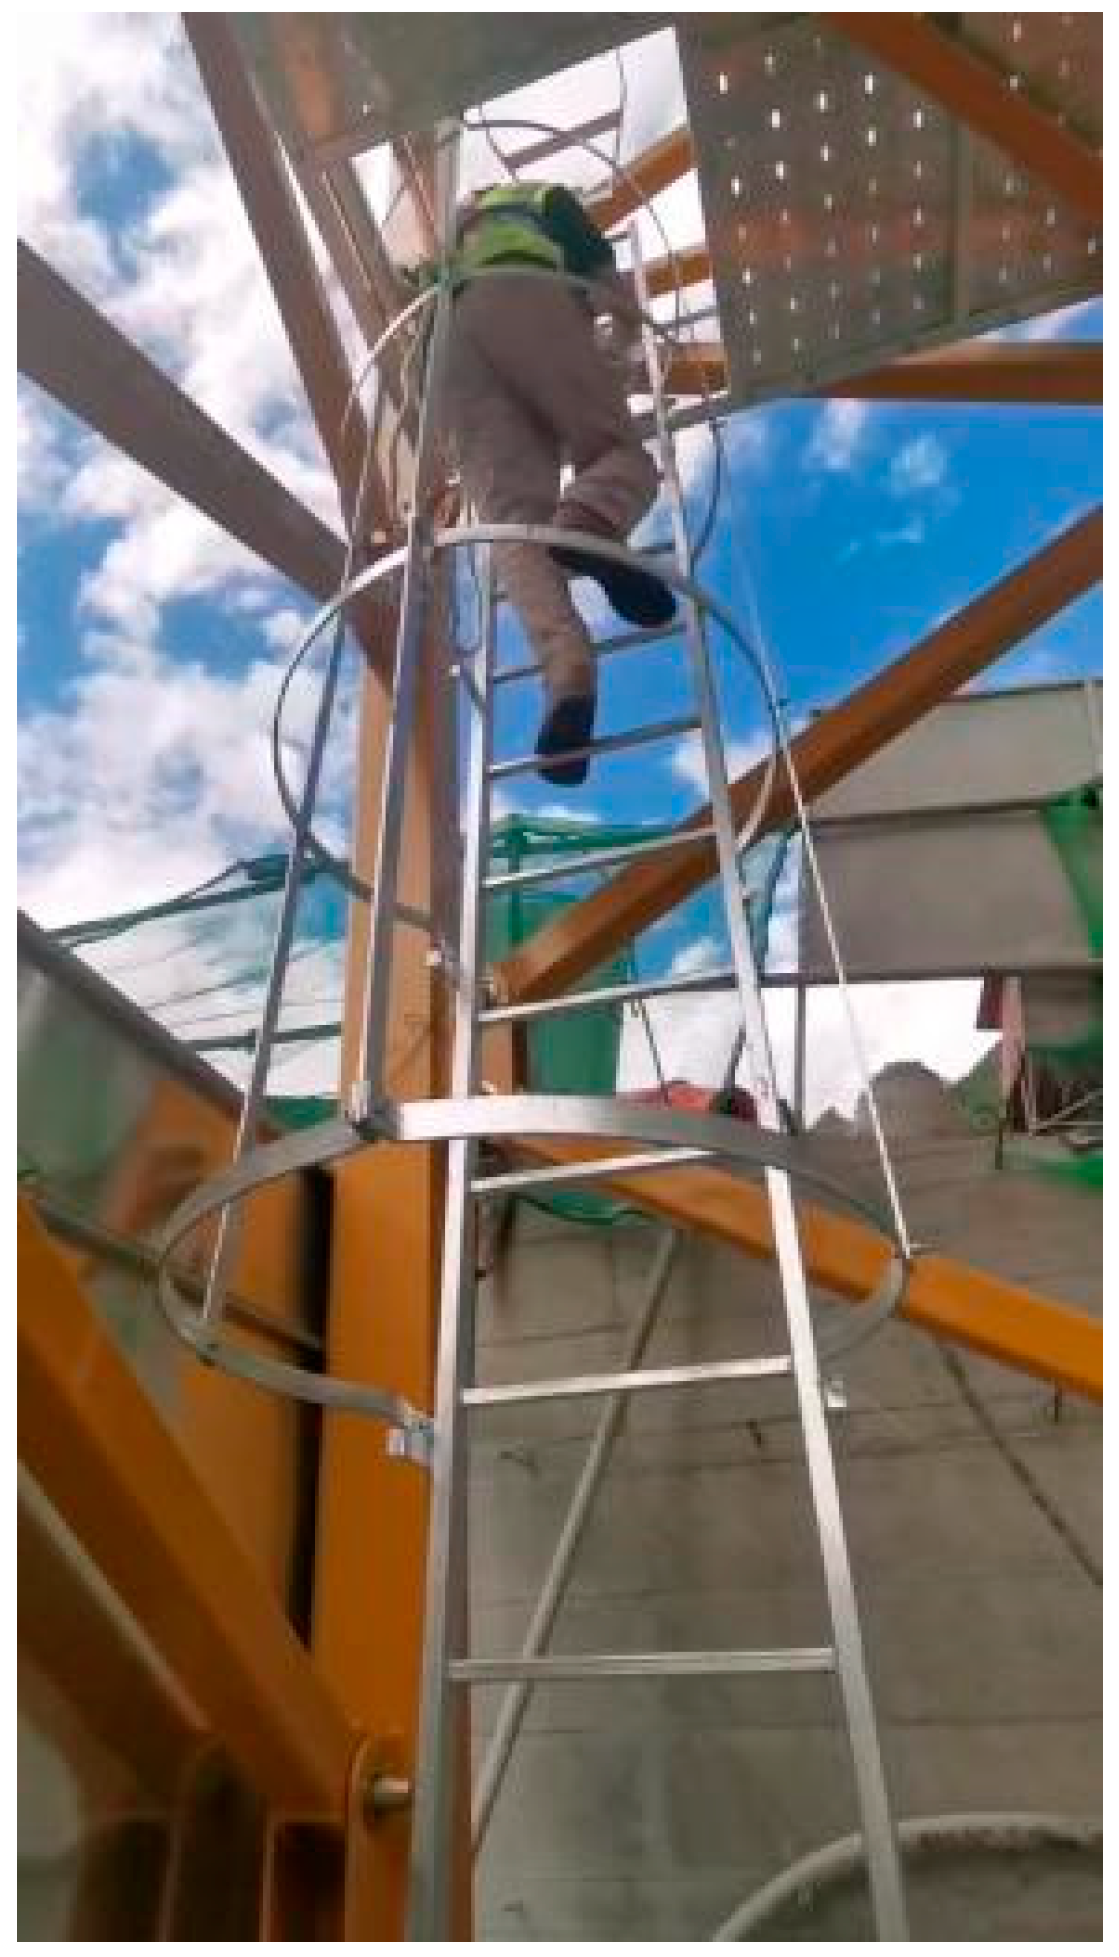
To enable on-site HAR, Figure 8 illustrates the on-site process of collecting climbing data from experimental participants. Repeated climbing and descending actions were performed in rotation after sensor activation, until the total data collection duration exceeded 1 h.
Figure 8.
On-site IMU-based data acquisition process for experimental participants.
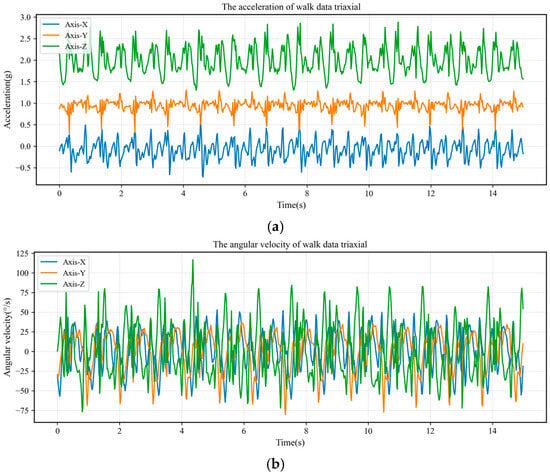
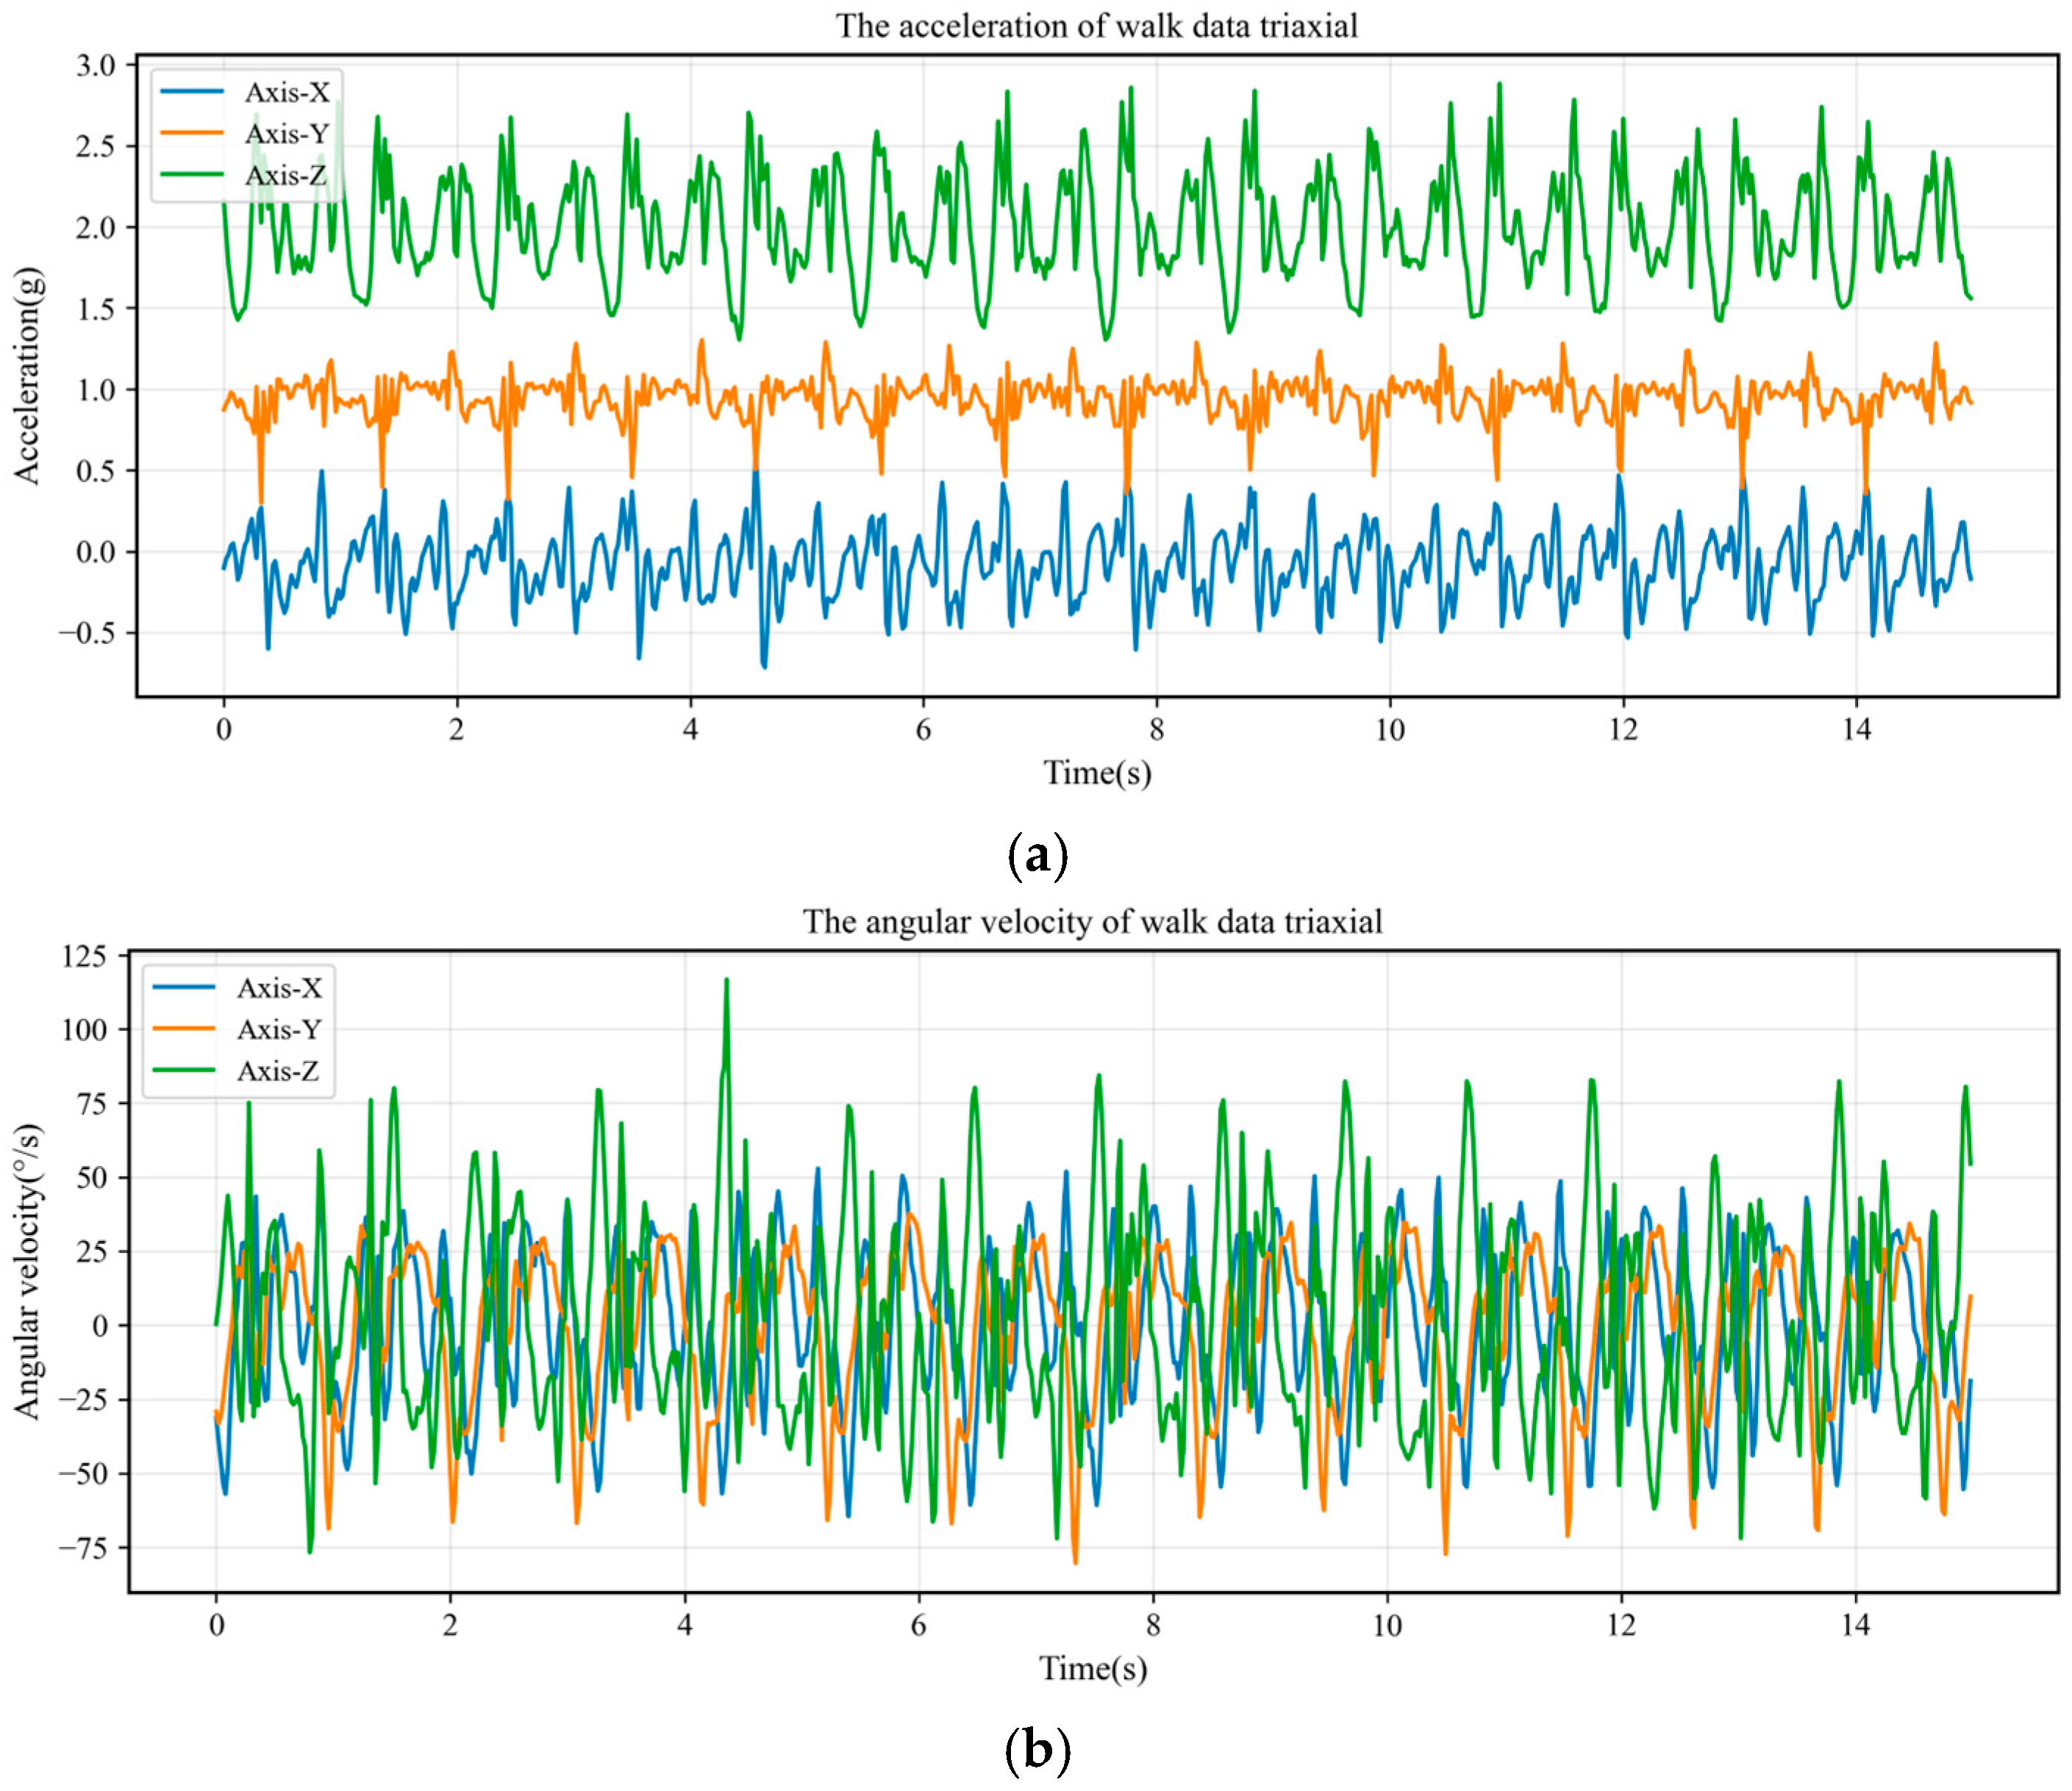
To further illustrate the characteristics of the collected signals, Figure 9 presents the raw three-axis acceleration and angular velocity time-series data of typical construction actions. As can be observed, different actions exhibit distinct temporal periodicity and noise fluctuation characteristics, and the most discriminative information for action classification is often concentrated within specific time intervals.
Figure 9.
IMU tri-axial acceleration and angular velocity time-series features of the typical construction action “walking”. (a) Tri-axial acceleration time-series features of the walking action; (b) Tri-axial angular velocity time-series features of the walking action.
The model has been fully trained and performance-validated in previous studies, achieving an HAR accuracy of 91.65% on common construction-related basic activities and demonstrating good generalization capability [52]. The quantitative comparison results of different machine learning models are summarized in Table 5. Compared with traditional machine learning methods, the proposed approach yields a substantial improvement in recognition accuracy, and further improves accuracy by 5.9% and 3.29% over the LSTM and BiLSTM baselines, respectively. In the safety monitoring system developed in this study, the trained model is deployed as a cloud-based service. Real-time IMU data uploaded from wearable devices worn by construction workers are processed online to generate HAR category outputs, which serve as real-time inputs for subsequent system modules.
Table 5.
Comparison results of machine learning models.
3.3. Authorization-Based Warning Mechanism
3.3.1. Worker Attribute-Based Authorization Classification
In dynamic risk assessment, worker exposure depends not only on actions and local hazard levels, but also on worker category and on-site authorization. To prevent misclassifying legitimate operations as violations, personnel on concrete placement surfaces should be grouped into four categories: placement surface workers, machinery operators, supervisory/management staff, and other workers, and they are assessed under a differentiated authorization framework. Because tasks vary by stage and zone, acceptable behavior can differ within the same hazardous area; for instance, formwork installers may legitimately remain in formwork-adjacent zones during surface preparation, whereas entry by general workers may be unauthorized.
Thus, in accordance with construction organization characteristics and safety management requirements, worker authorizations are classified into four levels (Levels I–IV), and their definitions and classification criteria are summarized in Table 6. In practice, authorization levels should reflect how closely each role is associated with hazardous zones. For example, machinery operators who must enter equipment operation zones to perform their duties may be granted Level I authorization, whereas other personnel (e.g., logistics or administrative staff) should be restricted to Level IV to minimize entry into high-hazard zones. Incorporating worker attributes and authorizations into the joint assessment of regional hazards and action-related risks reduces false alarms while accommodating legitimate operations, thereby improving the engineering acceptability and implement ability of the alarm logic.
Table 6.
Definition of worker authorization levels.
3.3.2. Multi-Source Data Fusion-Based Alarm Logic
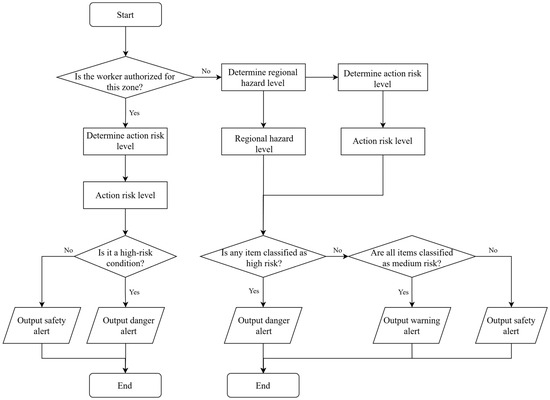
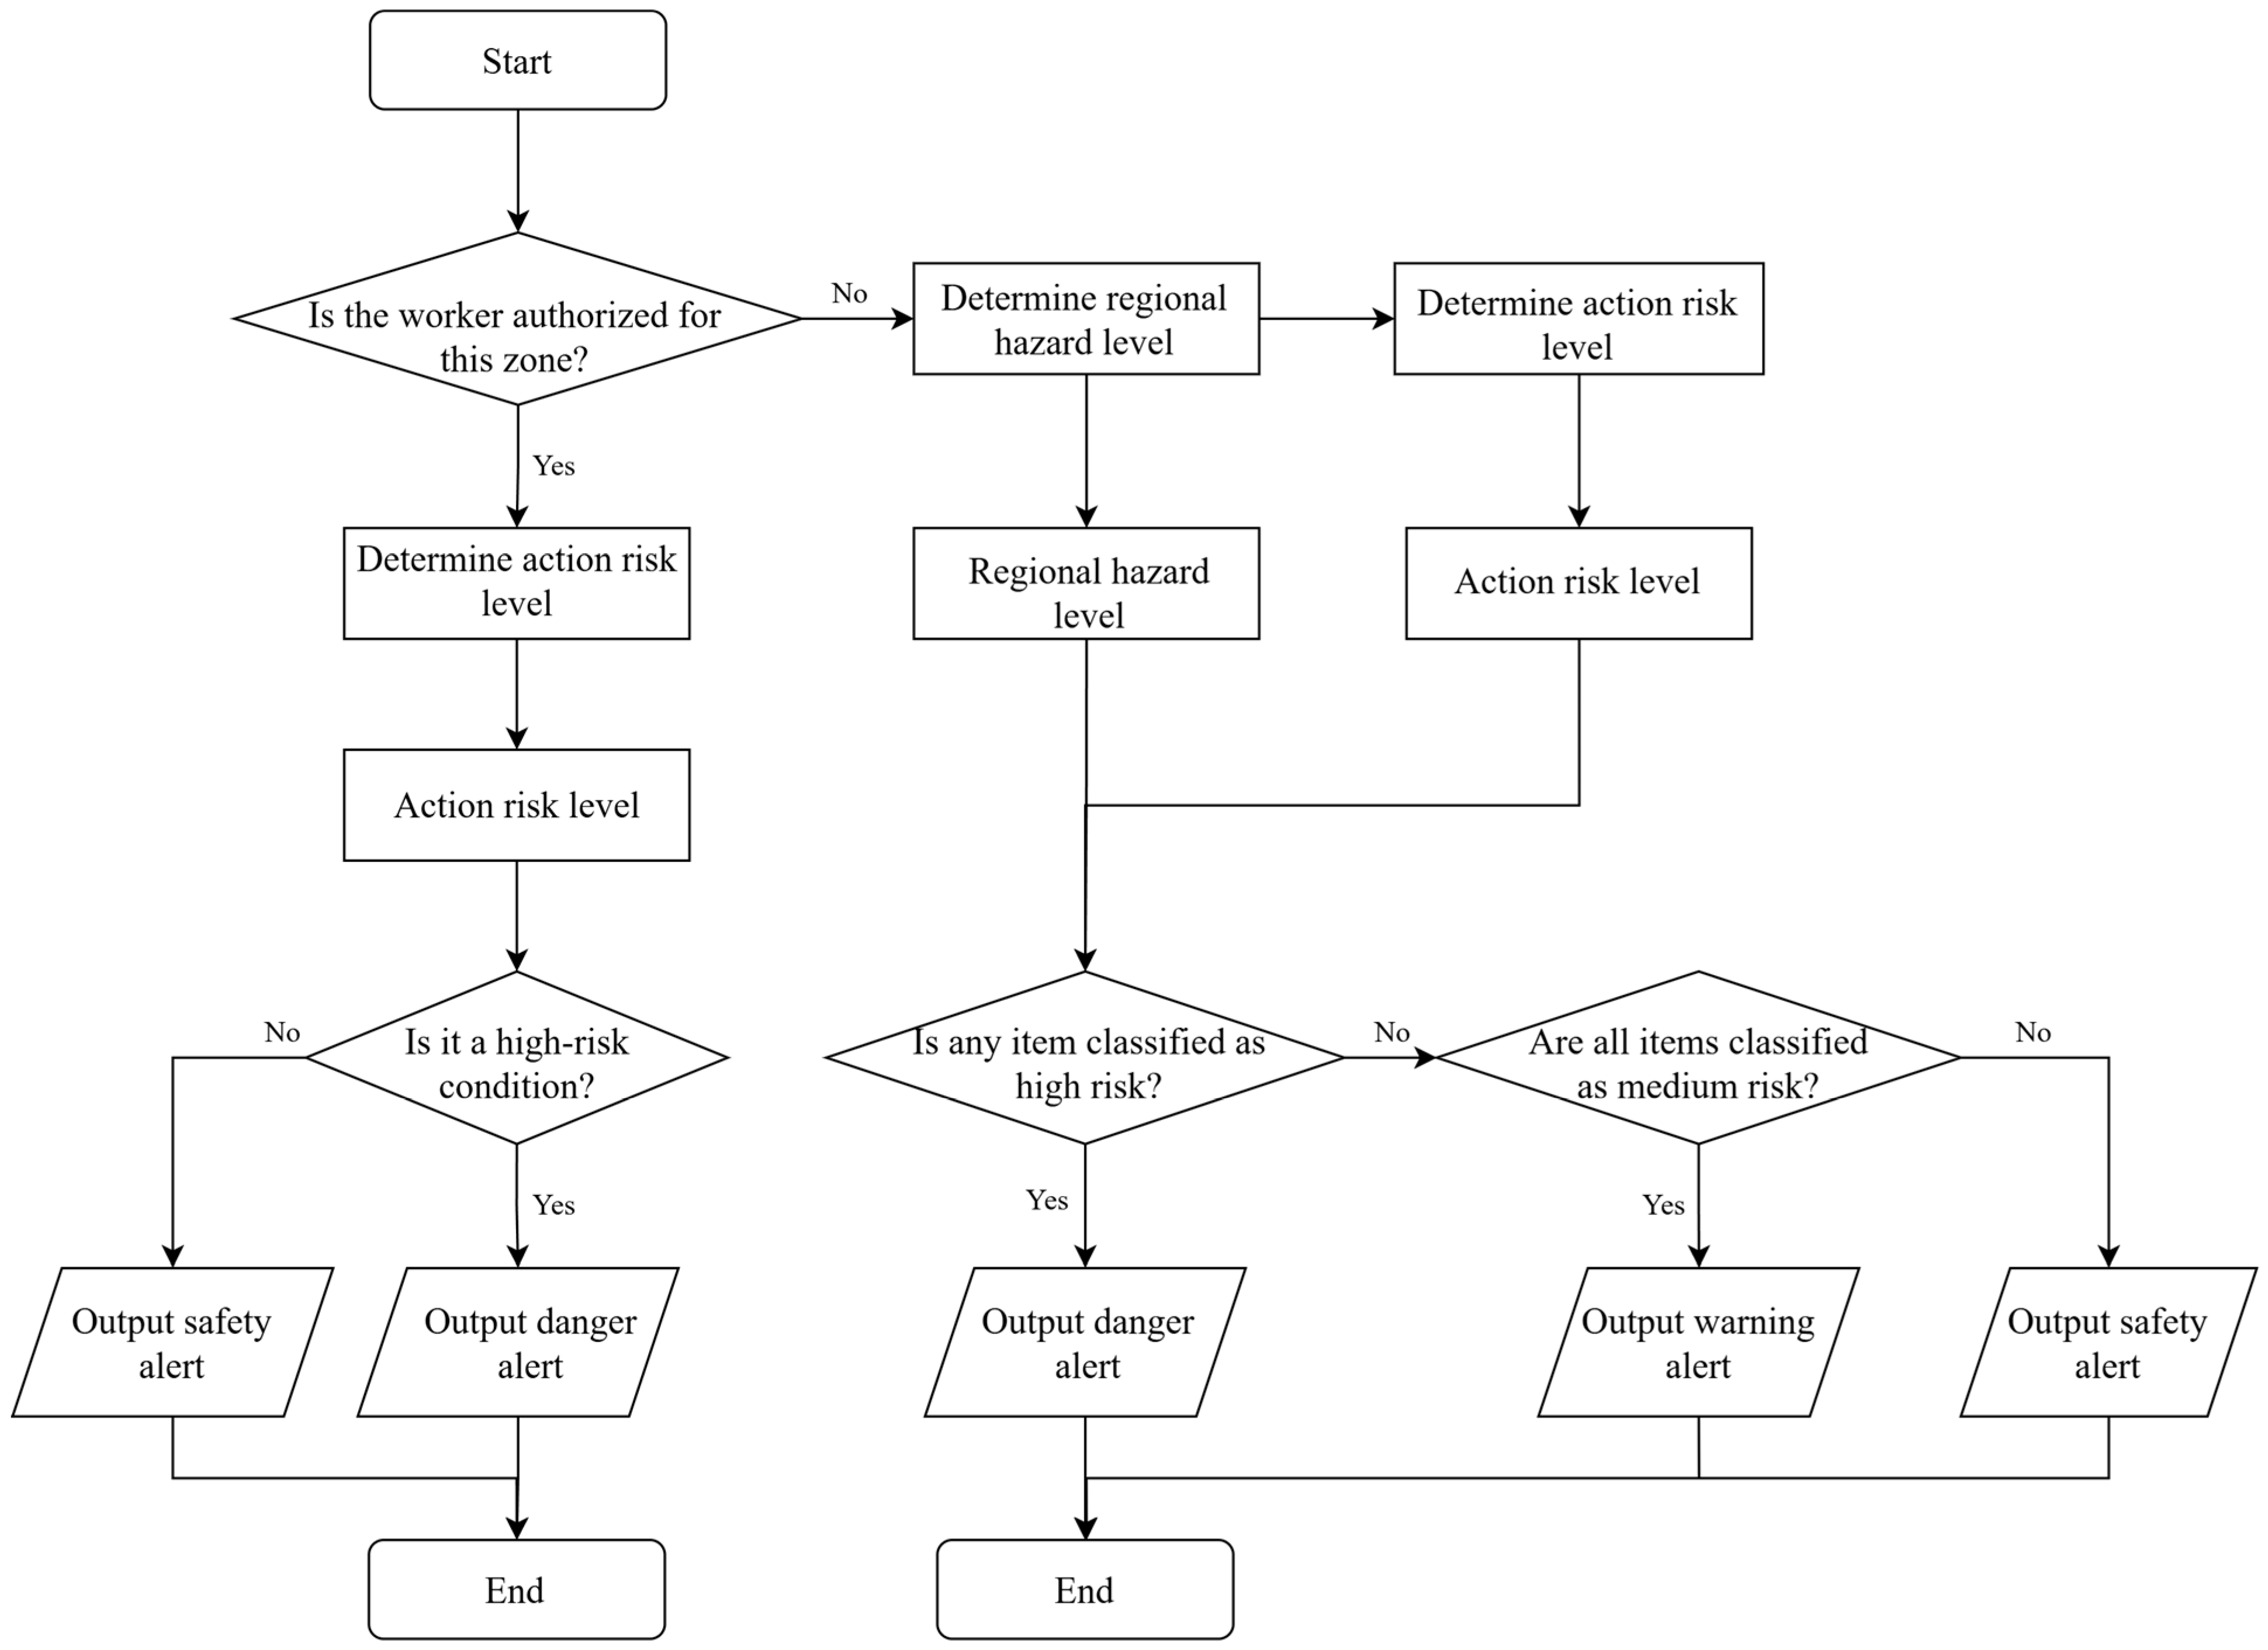
Based on the established frameworks for regional risk, action risk, and worker authorization, a real-time monitoring and warning mechanism is designed to support continuous safety supervision. The monitoring process first determines operational authorization according to worker categories, which distinguishes different risk assessment pathways. When a worker is authorized to perform the assigned task, risk evaluation is dominated by the action risk level, and the system outputs a dangerous or safe state accordingly. In contrast, when a worker lacks the required authorization, both regional hazard and action risk are simultaneously evaluated, and the final risk state is determined based on their combined results. Specifically, if either risk level is classified as high, a danger warning is issued; if both are classified as medium, a warning alert is generated; and if both are classified as low, the state is considered safe.
By integrating worker authorization with spatial and action-related risks, the proposed mechanism maintains high sensitivity to unsafe behaviors while effectively reducing false alarms caused by differences in job responsibilities and access permissions. This design is well suited for real-time dynamic monitoring in concrete placement surface environments characterized by multiple construction processes and intensive equipment interactions. The monitoring and warning logic is illustrated in Figure 10, which presents the sequential relationships and information flow among authorization verification, regional hazard assessment, action risk assessment, and warning output.
Figure 10.
Schematic illustration of the safety monitoring and alarm workflow for construction workers.
3.4. 3D Safety Monitoring System
3.4.1. System Architecture
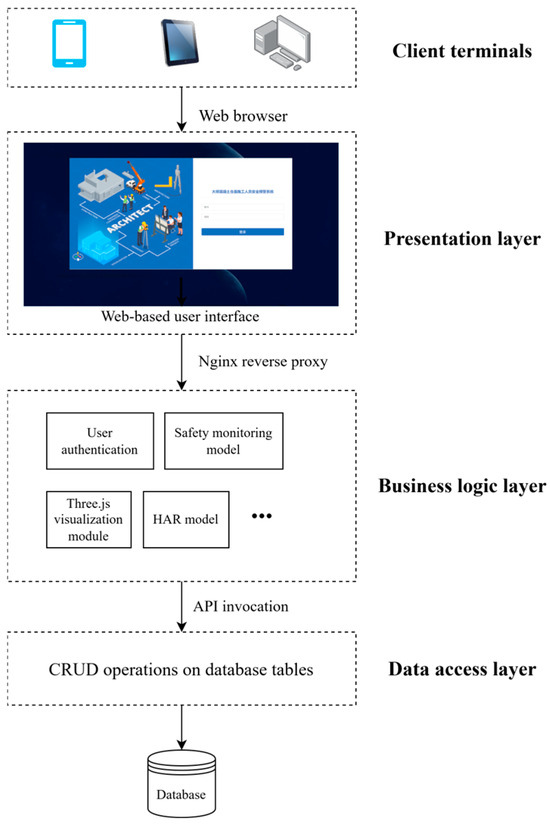
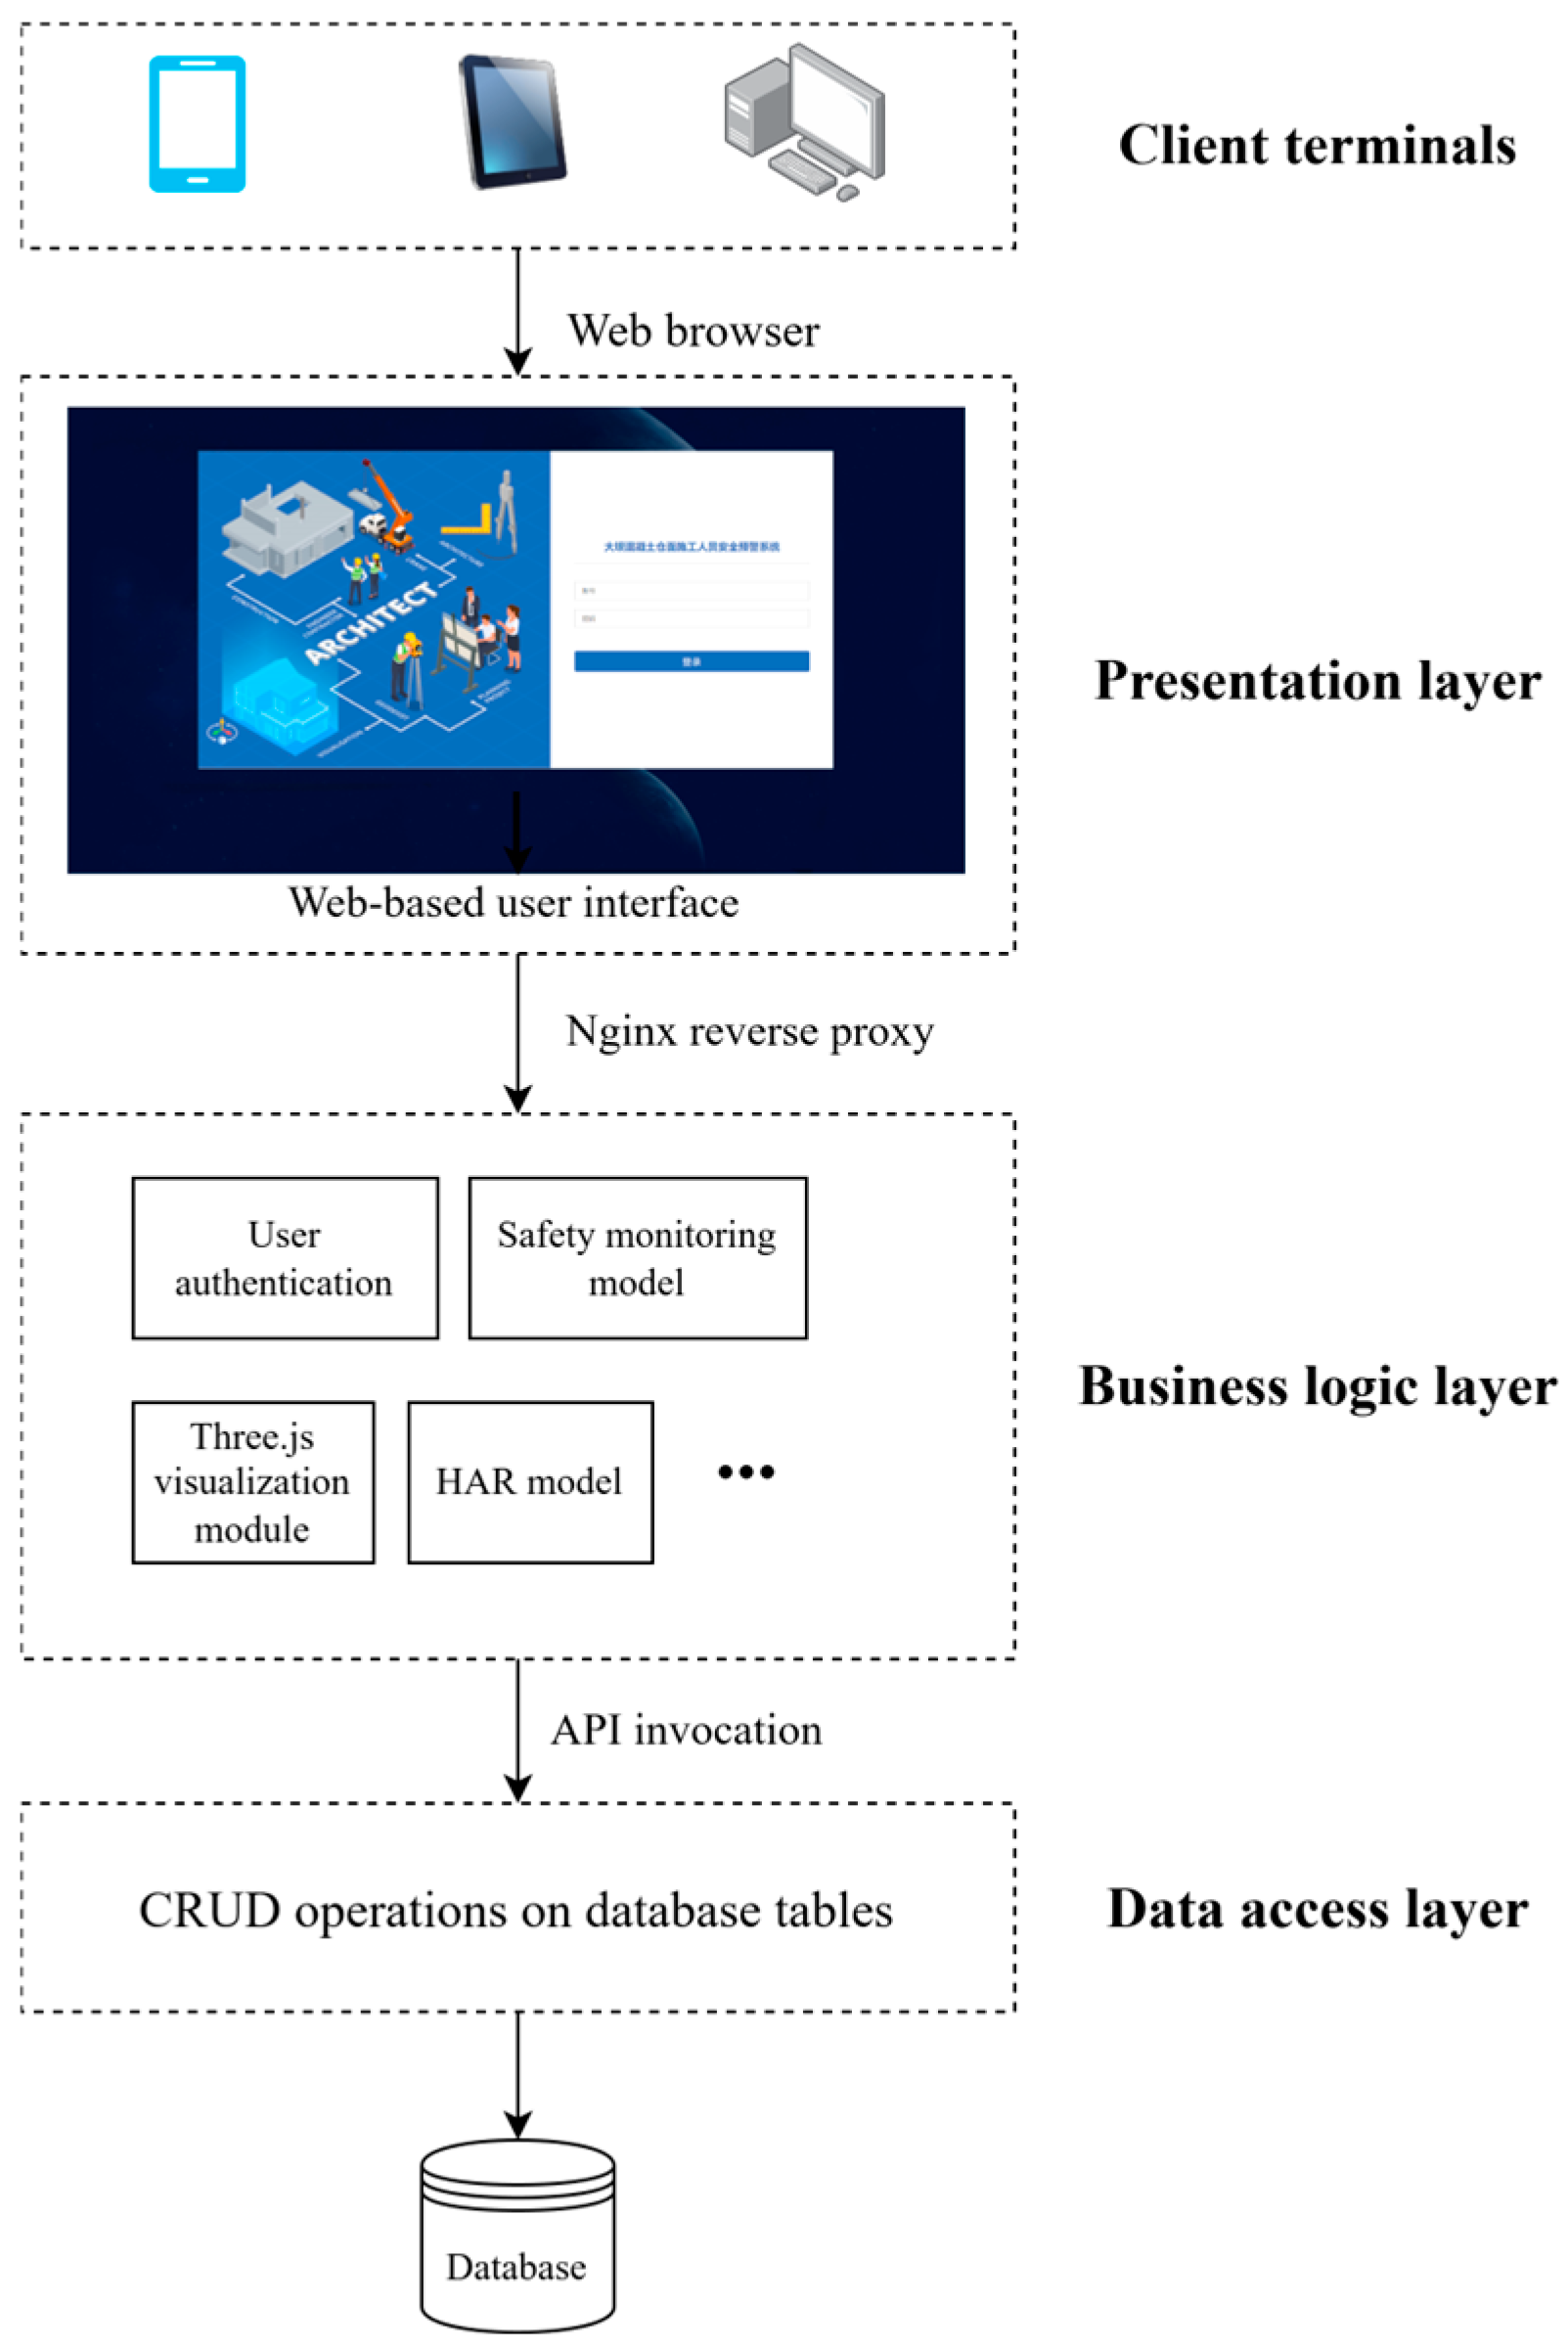
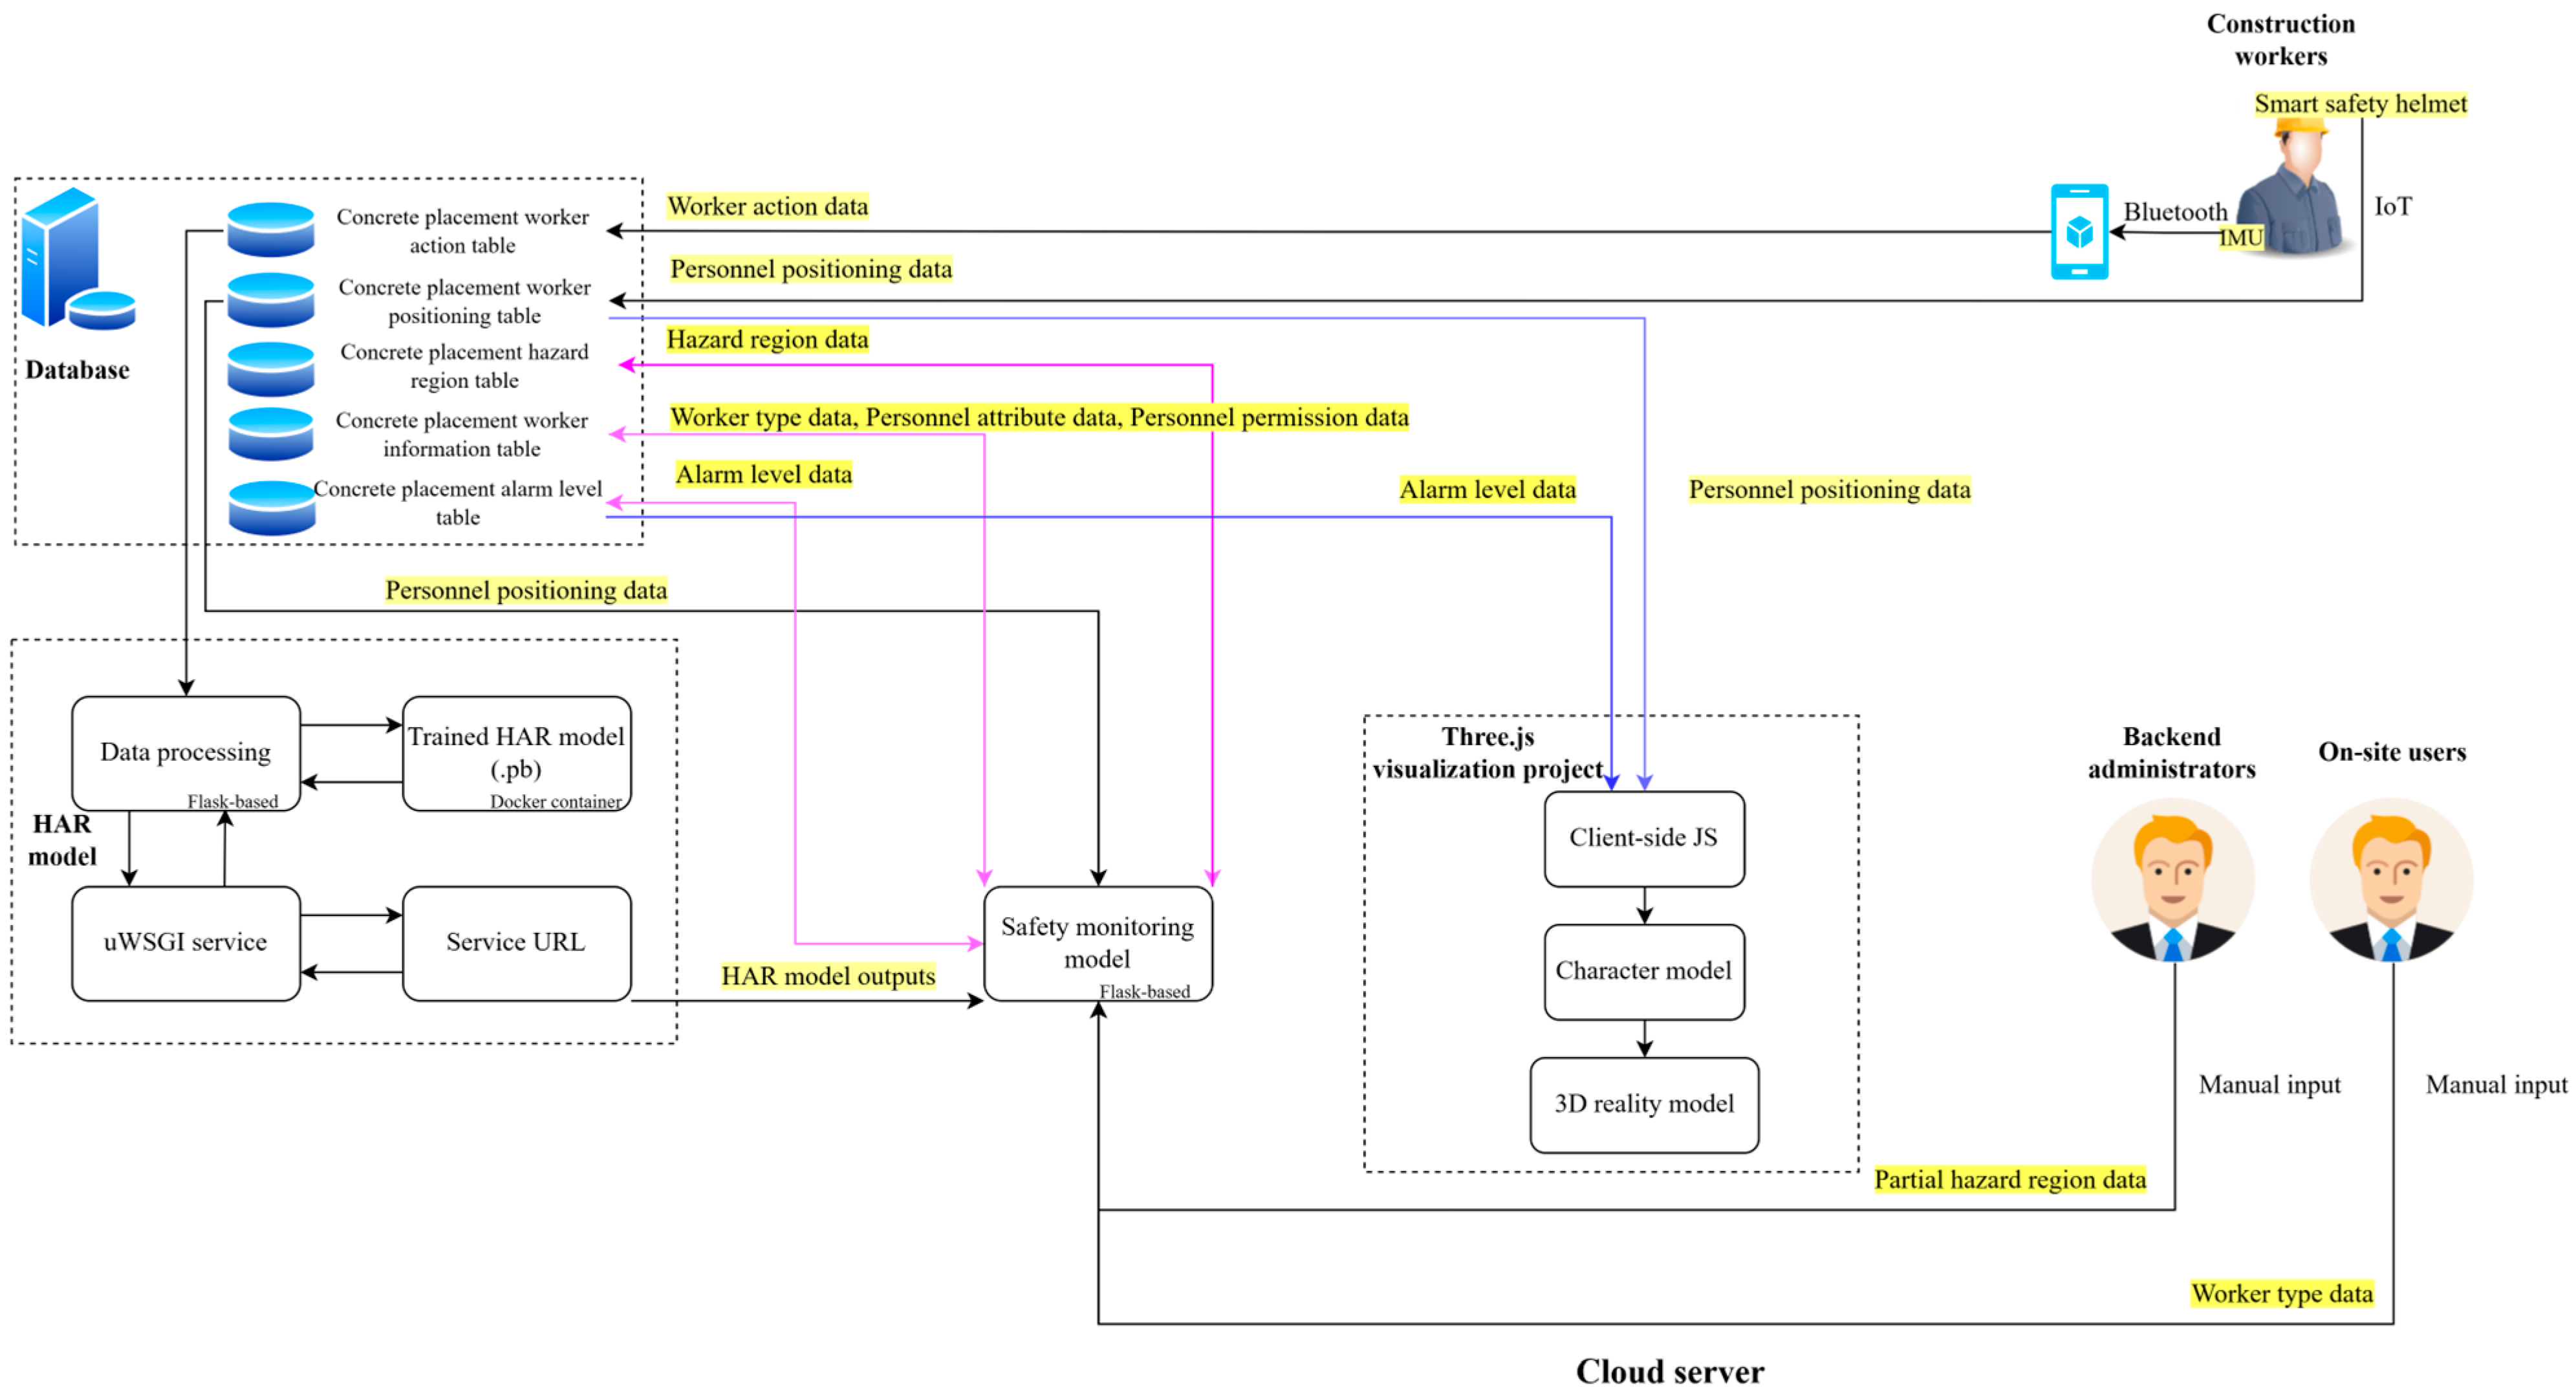
Following common implementations [27,31] in construction safety monitoring systems, two architectures are typically used in practice: client/server (C/S) and browser/server (B/S). C/S can provide faster responses and stronger security, but it requires dedicated client installation and incurs higher cross-platform adaptation and version-maintenance costs, reducing flexibility on sites with multiple terminals and frequent user turnover. B/S offers easier deployment through standard web browsers and is better suited to heterogeneous devices and dynamic user groups, despite slightly lower performance for highly complex functions. Moreover, Three.js is natively based on WebGL, enabling stable cross-browser 3D visualization and aligning naturally with a B/S setup. Therefore, a B/S architecture was adopted (Figure 11).
Figure 11.
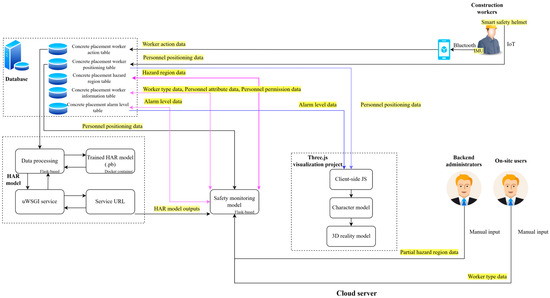
Architecture of the multi-source data-driven safety monitoring system.
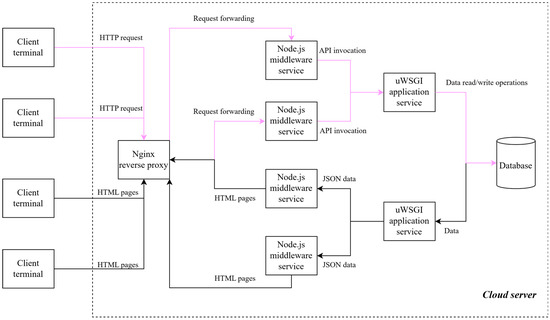
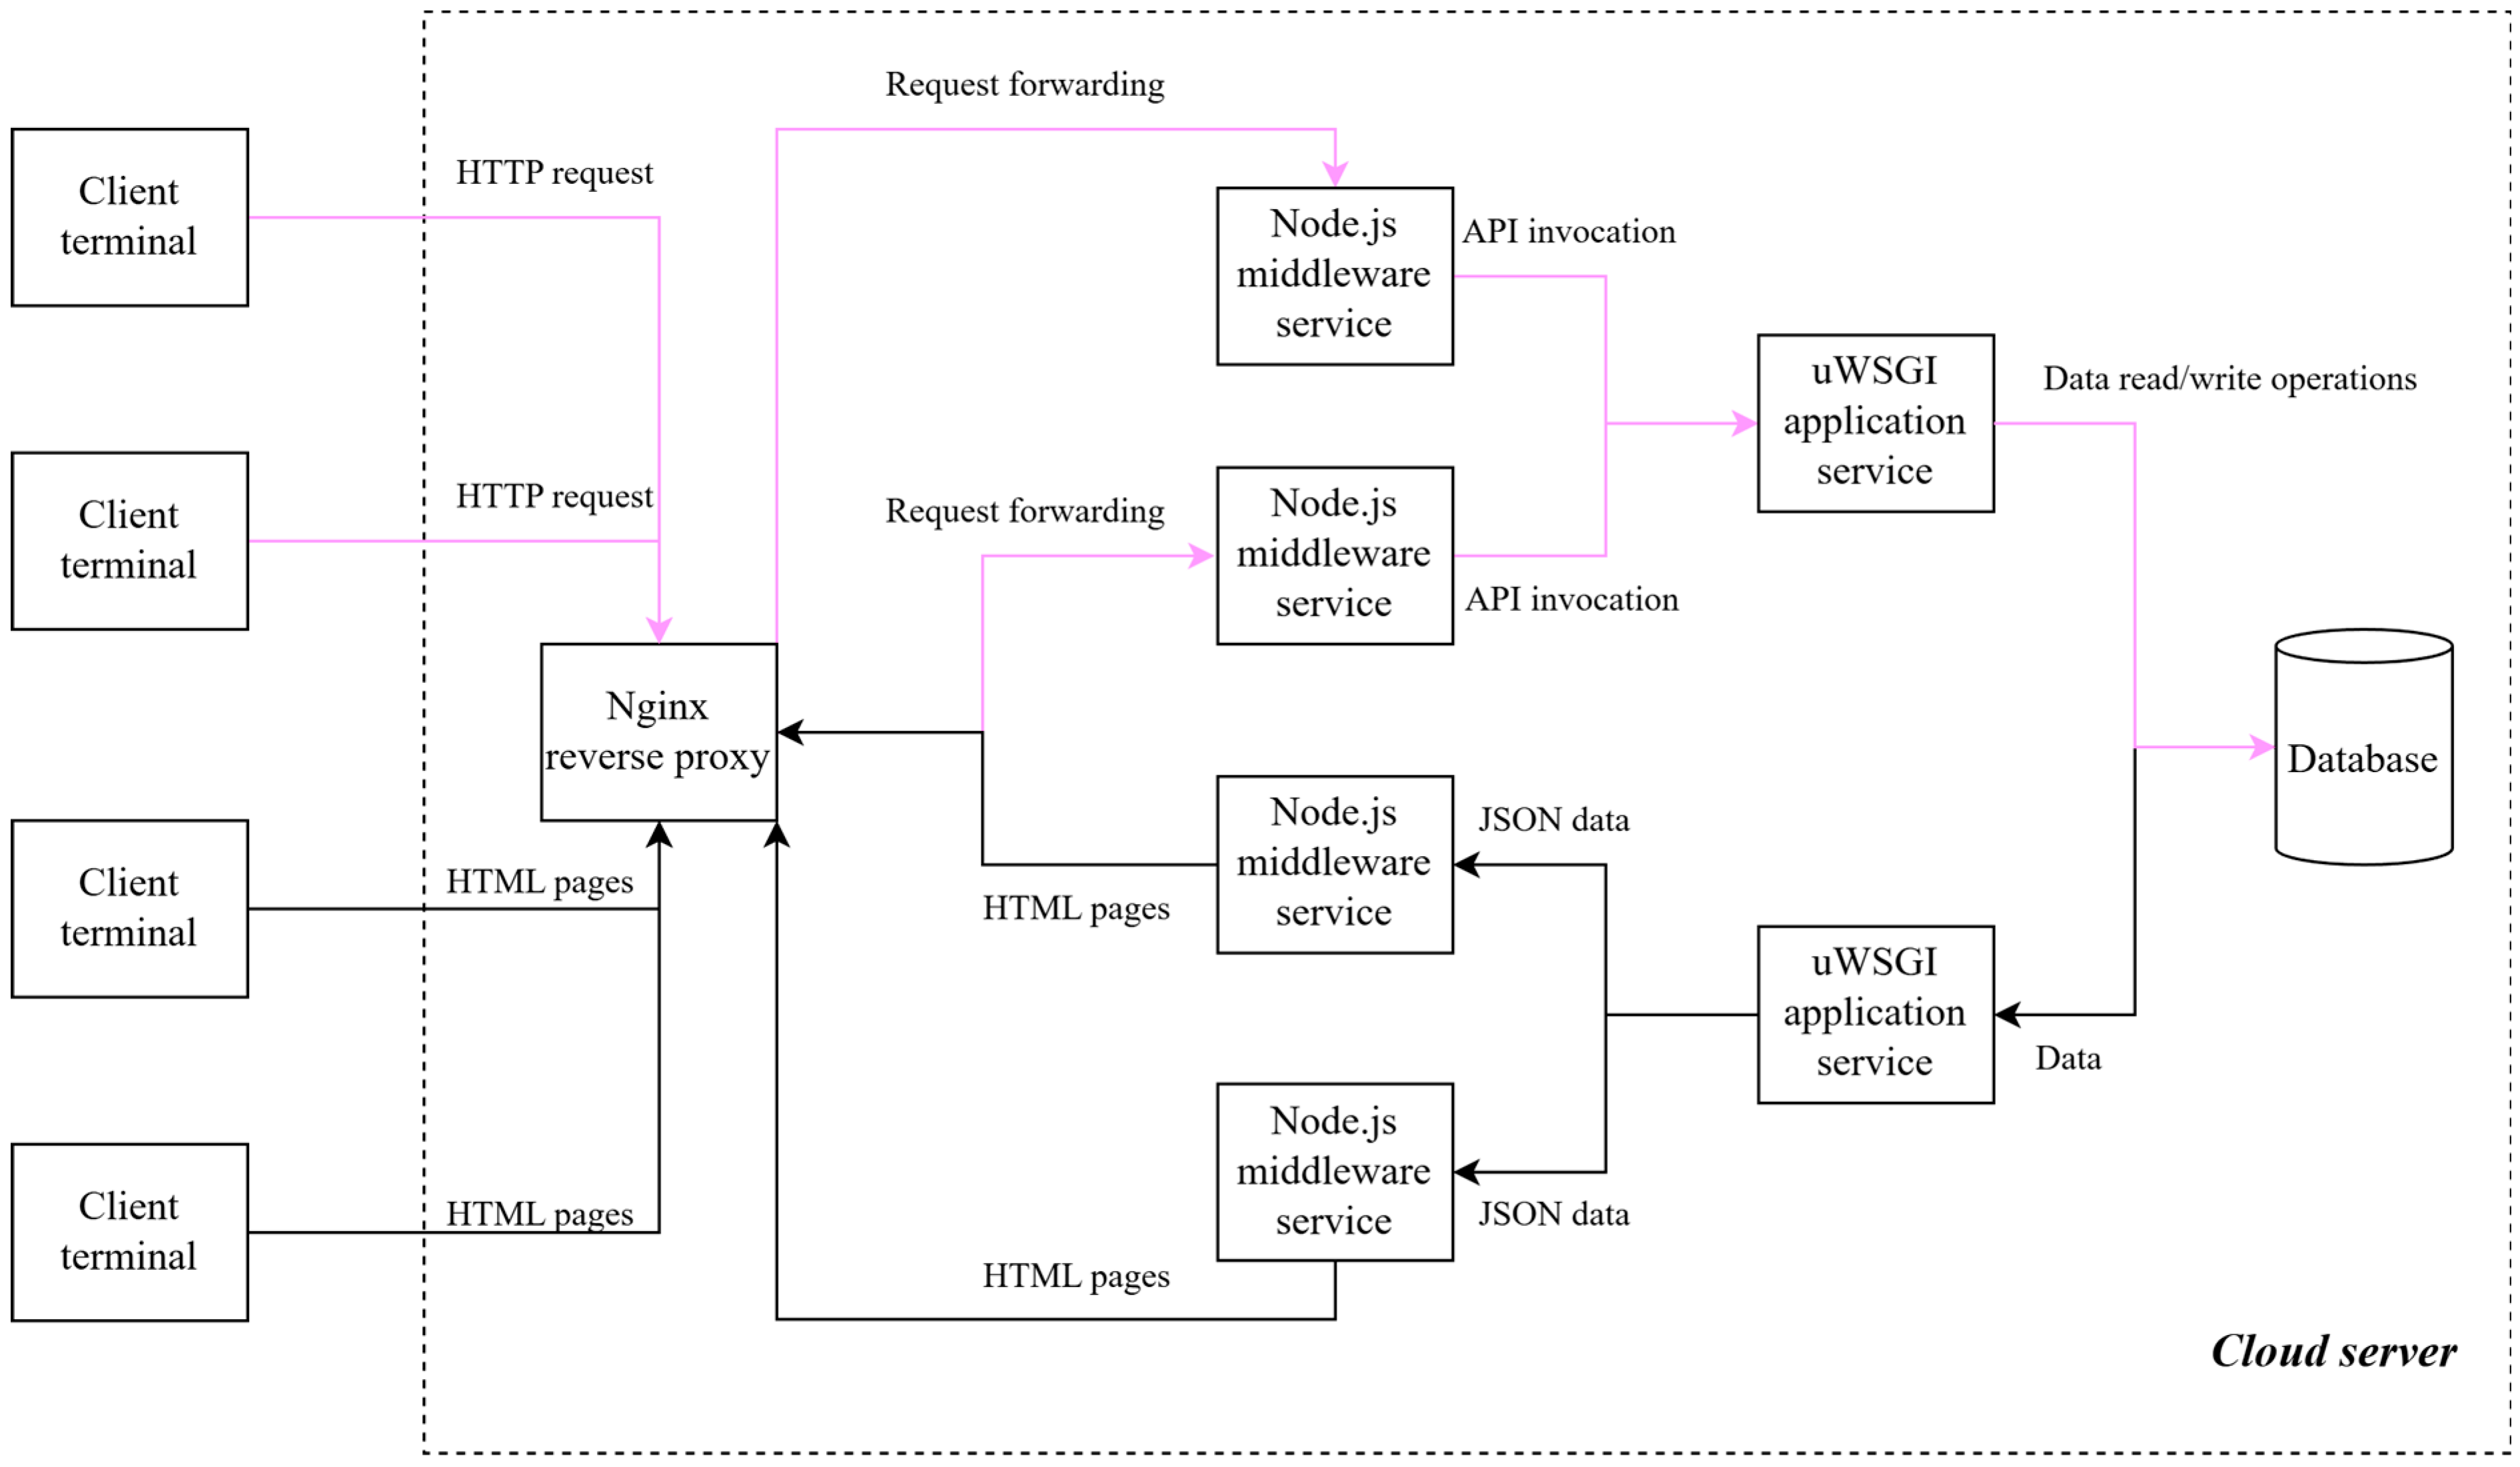
At the deployment level, a layered “client–load balancer–middleware–application–database” architecture (Figure 12) was adopted to support concurrent access and real-time data exchange. Nginx performs load balancing and static-content delivery. Node.js acts as the middleware, handling client requests, data forwarding, and service orchestration. Application services are hosted via uWSGI to run algorithmic modules (e.g., action recognition and risk assessment). The database provides persistent storage for multi-source monitoring data. This design improves scalability and front–back-end efficiency, ensuring stable real-time monitoring and 3D visualization.
Figure 12.
System deployment and data interaction workflow under the B/S architecture.
3.4.2. 3D Scene Construction and Modeling
Concrete placement surfaces are dynamic environments where hazardous regions evolve continuously with construction progress. Manual 3D modeling is labor-intensive, costly, and cannot support rapid on-site updates. Therefore, this study adopts UAV-based oblique photogrammetry for fast 3D reconstruction of the placement-surface environment.
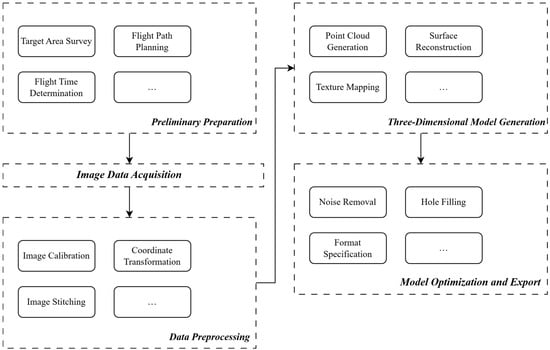
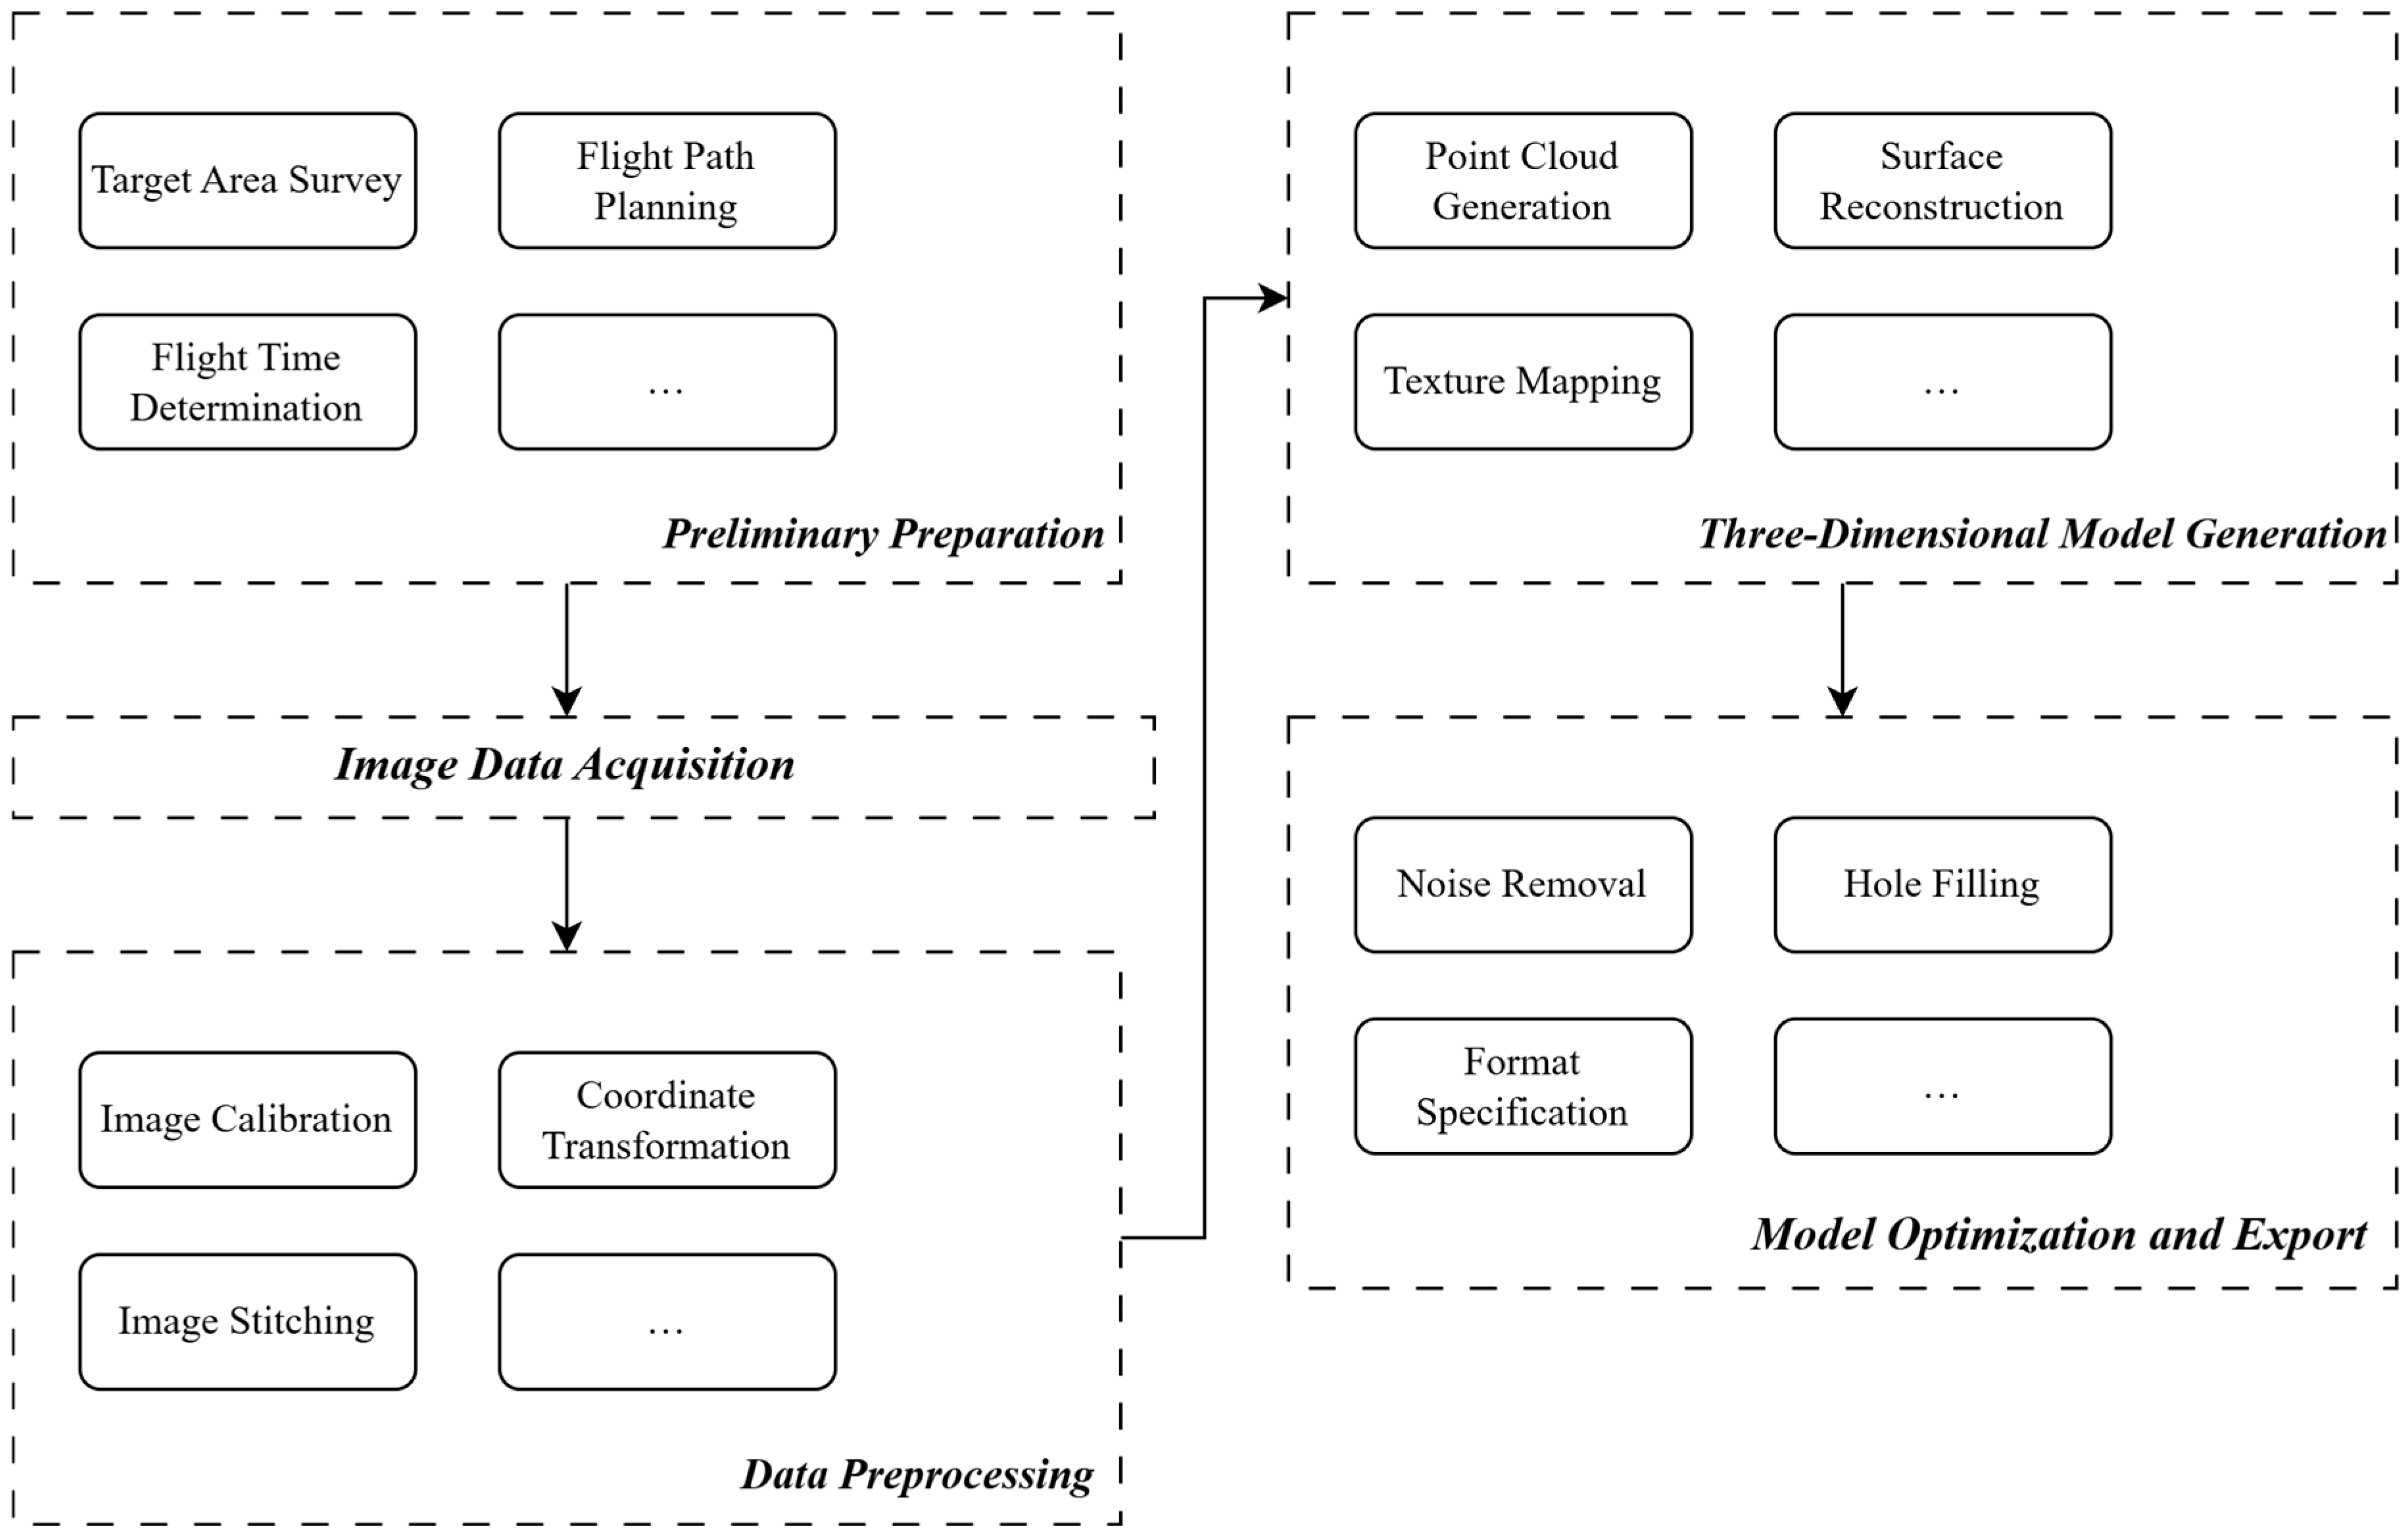
Oblique photogrammetry captures high-resolution imagery from a nadir view and multiple oblique angles, enabling detailed representation of both top and side textures and overcoming the limitations of vertical-only orthophotos. Using Cloud Earth, a cloud-based photogrammetric platform (accessed in July-August 2023), the workflow—camera calibration, point-cloud generation, meshing, and texture mapping—can be largely automated to produce high-fidelity 3D reality models. As shown in Figure 13, the adopted pipeline includes flight planning, image acquisition, data preprocessing, and model construction and optimization.
Figure 13.
Workflow of UAV-based oblique photogrammetry for 3D reality modeling.
A DJI Air 3 UAV was used for image acquisition due to its flight endurance, maneuverability, and multi-directional imaging capability, supporting data capture at multiple elevations and viewing angles over the placement surface (key parameters in Table 7). The acquired multi-view imagery enables rapid 3D reconstruction of the concrete placement surface, which is then used for spatial calibration of hazard-zone delineation, visualization of worker locations, and 3D scene representation in the monitoring system [54].
Table 7.
Main technical parameters of the DJI Air 3 UAV.
To dynamically visualize worker locations, hazardous regions, and site conditions, a web-based 3D interactive visualization in Three.js is developed. Here, Three.js serves only as the front-end visualization layer, while data processing and decision-making are handled by the back-end modules. Three.js provides real-time rendering and strong extensibility, enabling multi-source data integration, spatial mapping, and dynamic scene updates. The system includes modules for 3D scene loading, positioning data parsing, coordinate mapping/transformation, and character-model driving to support real-time visualization of worker states and the construction environment.
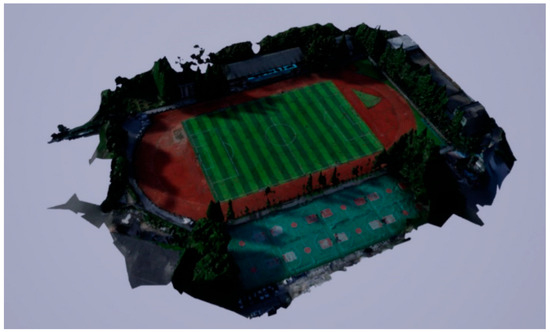
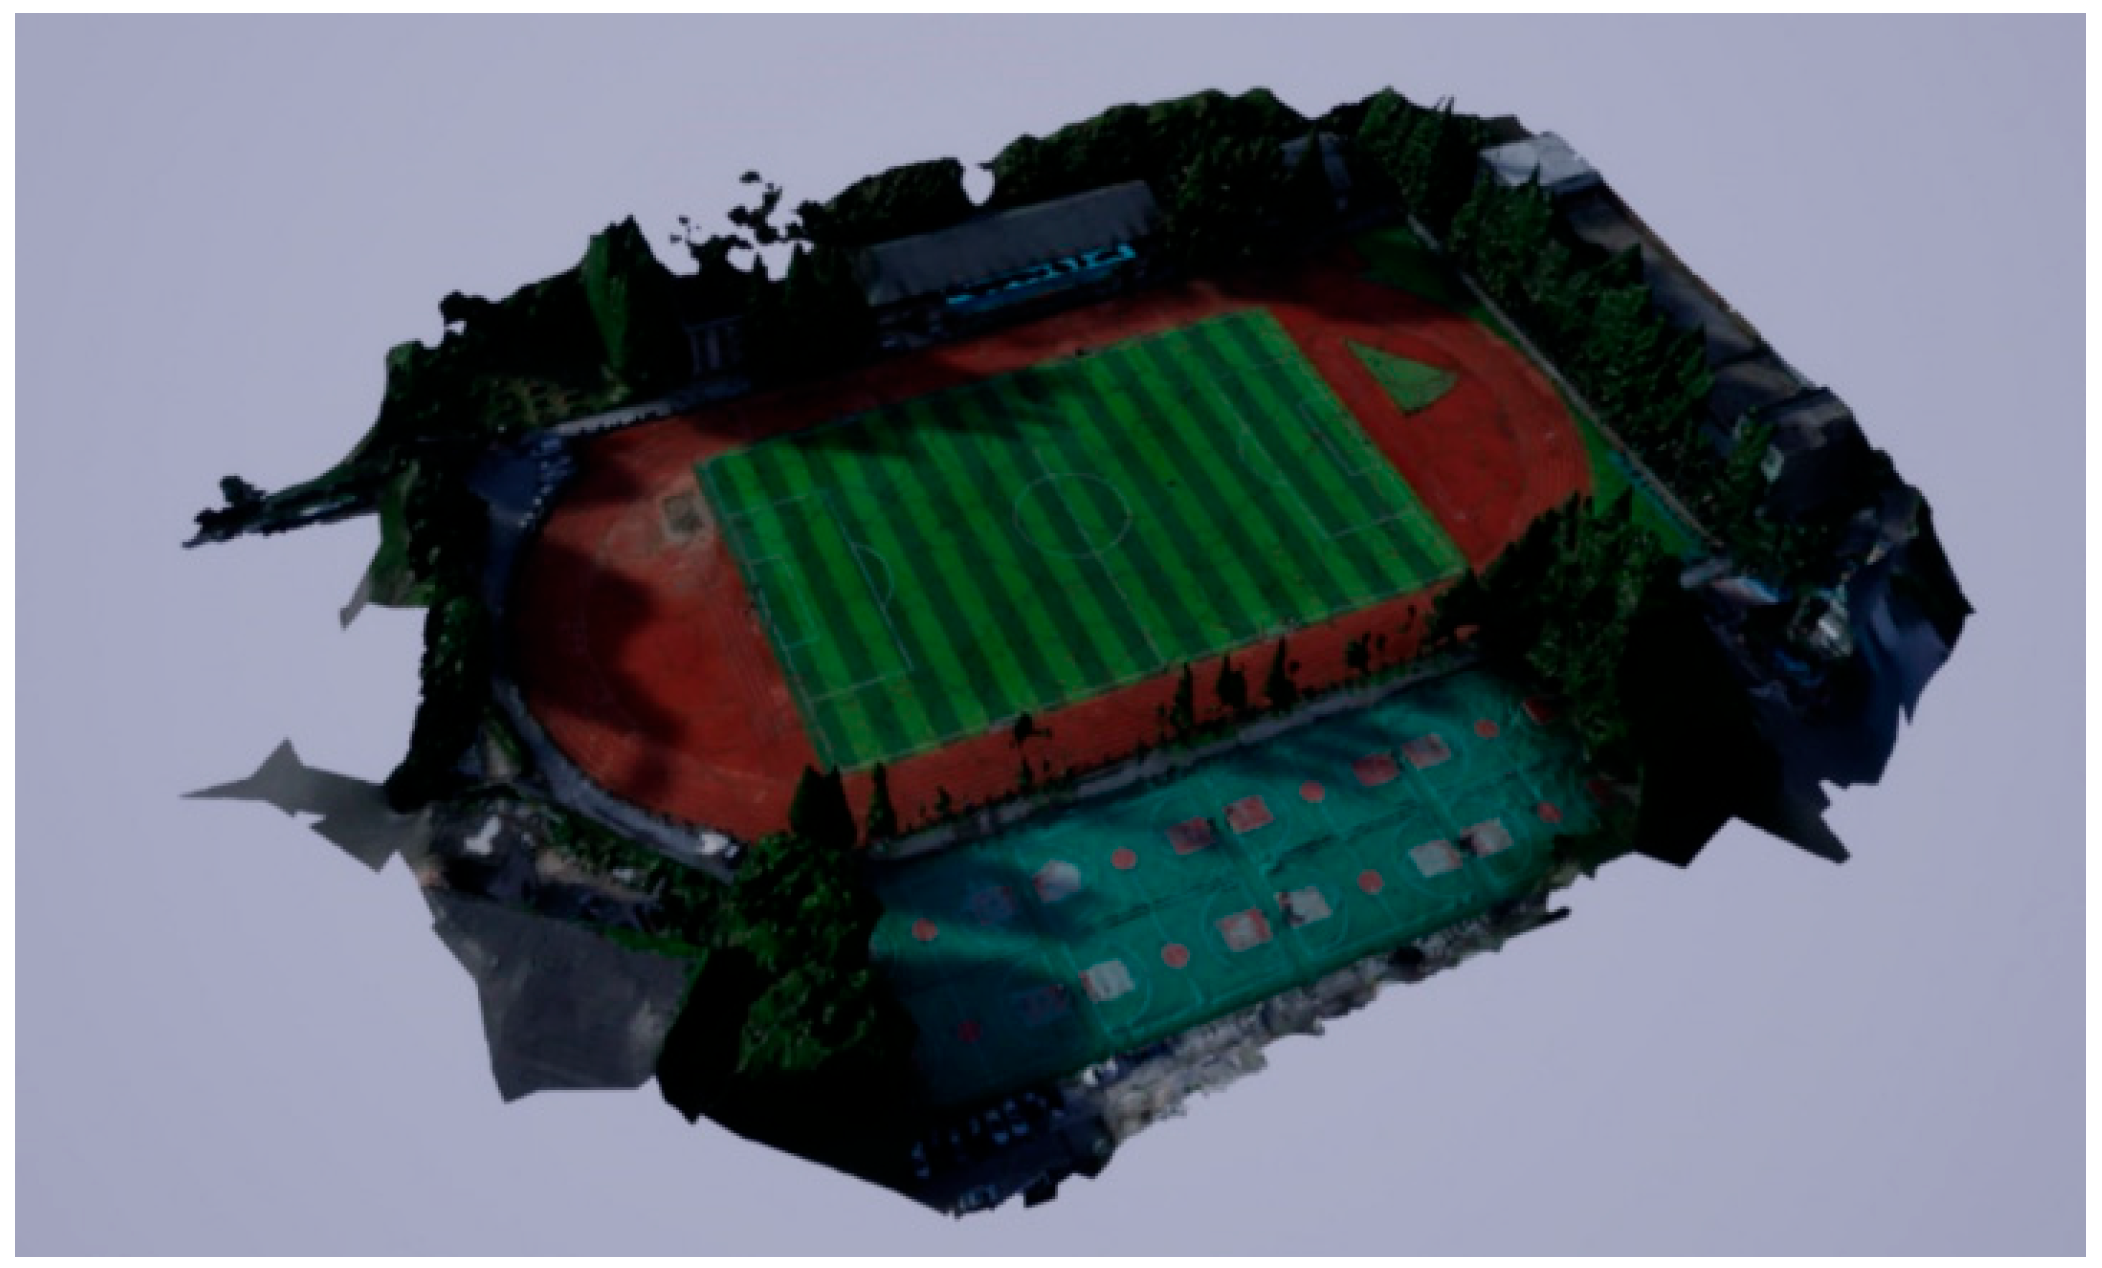
A test visualization scene is built from the UAV oblique-photogrammetry reality model (Figure 14). The reconstructed mesh data, derived from point-cloud processing, are exported in OBJ format and imported into Three.js. Scale normalization and axis calibration are applied to align the model with the measured placement-surface coordinate system, providing the base layer for rendering hazard-zone distribution, worker trajectories, and site context.
Figure 14.
Example of a 3D reality model constructed using UAV-based oblique photogrammetry.
To accurately map GNSS positioning data collected by the smart helmet to the Three.js world coordinate system, a transformation between the geodetic coordinate system and the Cartesian coordinate system is required. In this study, the coordinate transformation method [55] is adopted to convert latitude, longitude, and height (B,L,H) into Cartesian coordinates (X,Y,Z). On this basis, local coordinate alignment and translation correction are further performed. The corresponding transformation relationship is given in Equation (7), which establishes a one-to-one correspondence between the worker positioning points and the locations in the 3D scene, thereby enabling accurate visualization of positioning results within the proposed system.
where (x,y,z) denote the Cartesian coordinates of the character model in the 3D scene; (B,L,H) represent the geodetic coordinates of the test subject, including latitude, longitude, and height; (B0,L0,H0) denote the geodetic coordinates of the origin of the Cartesian coordinate system; N is the radius of curvature of the Earth, and e is the first eccentricity of the Earth.
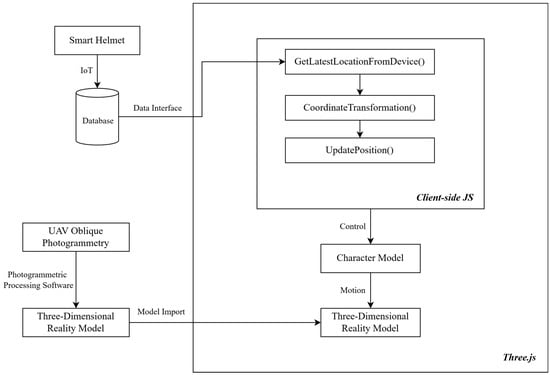
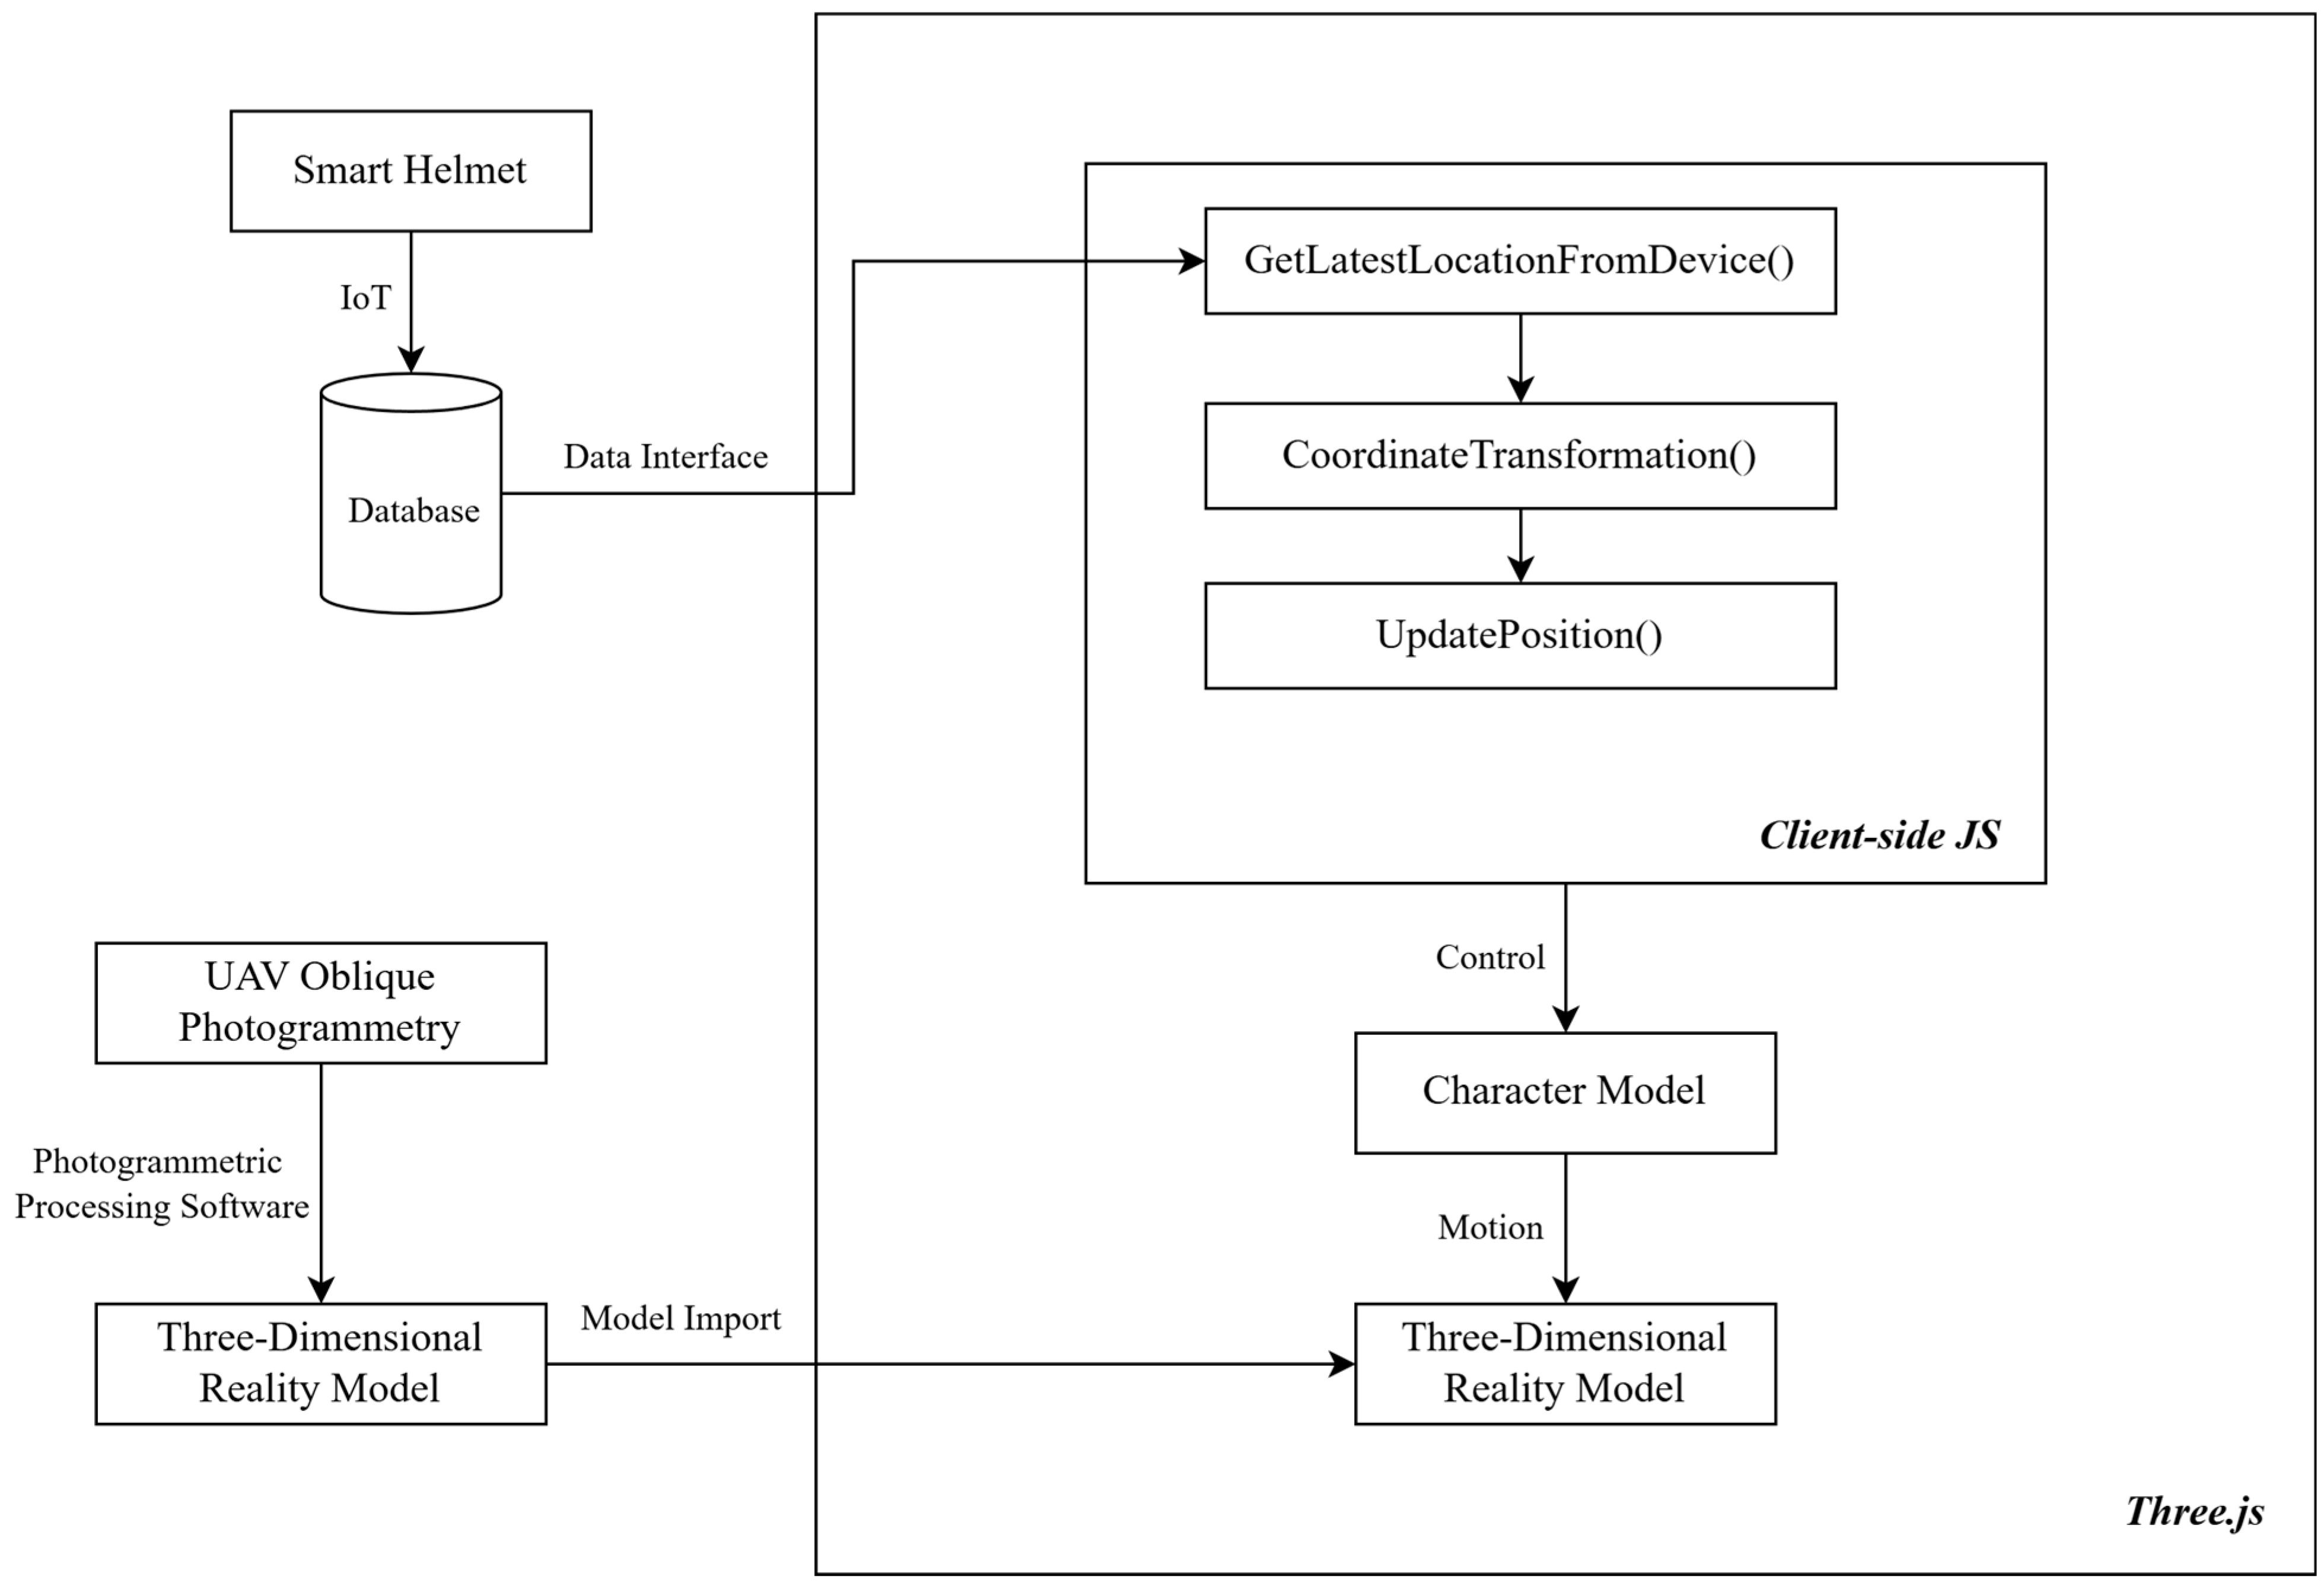
The system implements key rendering and interaction logic through client-side JavaScript (JS), including positioning data acquisition, coordinate transformation, and worker avatar position updating. Specifically, functions such as GetLatestLocationFromDevice(), CoordinateTransformation(), and UpdatePosition() are employed to retrieve the latest positioning data, perform coordinate conversion, and update avatar positions, respectively. The transformed 3D coordinates are then assigned to the avatar’s position attribute in the 3D scene, enabling real-time movement of the avatar within the 3D scene and generating dynamic trajectories consistent with on-site personnel motion. In addition, the movement behavior and posture changes of the avatar are synchronized with the outputs of the HAR module, achieving integrated visualization of spatial position and behavioral state. The overall workflow of the visualization implementation is illustrated in Figure 15.
Figure 15.
Workflow of real-time 3D visualization.
3.4.3. Database Design
To support efficient storage, real-time access, and traceability of multi-source monitoring data, the relational database was constructed. Following the monitoring workflow, seven core tables were designed (Table 8) to manage: (1) user authentication, (2) raw nine-axis IMU data, (3) helmet positioning data, (4) hazard-region delineation parameters, (5) personnel attributes and permission levels, (6) alarm records, and (7) system operation logs. Each table uses a unique primary key, with data types and constraints matched to the stored fields (e.g., FLOAT for coordinates and DATETIME for timestamps). Records are indexed by worker ID and time to form a traceable “action–position–region–alarm” chain, supporting real-time risk monitoring, authorization checks, and retrospective analysis.
Table 8.
Overview of database tables.
3.4.4. Multi-Source Data Fusion Scheme
The proposed personnel safety monitoring system involves multiple types of core data, including human motion sensor data, outputs of the HAR model, personnel positioning data, regional hazard classification data, and personnel attribute and permission data. These data originate from heterogeneous sources with different transmission paths, data formats, and update frequencies. To achieve real-time safety monitoring of construction personnel, an effective multi-source data fusion scheme is required to integrate and process the heterogeneous data in a unified manner [56,57].
During the data fusion process, the system first determines whether a worker is authorized to enter the current region based on personnel attributes and permission levels, and then selects the corresponding risk inference pathway. If the worker is authorized to enter the region, the risk assessment is primarily determined by the action risk level. If the worker is not authorized, both the action risk level and the regional hazard level are jointly evaluated, and the final state is classified as hazardous, warning, or safe according to their combined results. This logic strictly follows the monitoring and alarm rules defined in Section 3.3.2, enabling effective differentiation among normal operations, boundary violations, and high-risk actions.
The fused risk states are stored in the database in real time and synchronized with the Three.js visualization module. Personnel locations and corresponding risk levels are displayed using color-coded representations, allowing dynamic visualization of safety conditions on the concrete placement surface. The overall multi-source data fusion and risk assessment workflow is illustrated in Figure 16, providing reliable data support for the real-time monitoring capability of the system.
Figure 16.
Workflow of multi-source data fusion and risk assessment.
3.4.5. System Working Flow
Operationally, the system first determines the worker’s current hazardous region (Section 3.1.1), action type (HAR), and the action duration t. The duration is mapped to the exposure index E using the continuous mapping described above. A quantitative risk score is then computed using Equation (2), and the final alarm level (High/Medium/Low) is assigned by applying the corresponding region–action thresholds summarized in Appendix A (which are the discretized implementation of the model for real-time decision-making).
For example, consider running in the edge-adjacent zone. When the running duration is t = 15 s, the alarm level is assigned as Medium risk according to Appendix A (10 s ≤ t < 30 s). When the duration increases to t ≥ 30 s, the alarm level is upgraded to High risk. This example illustrates how the duration-dependent model output is discretized into final alarm levels through the region–action thresholds in Appendix A.
For specific threshold definitions of action risk levels in different regions of the concrete placement surface, the complete classification rules are provided in Appendix A. Finally, the improved LEC method serves as a computable basis for subsequent worker authorization constraints and risk warning logic.
4. Results and Discussion
4.1. Project Overview for Validation
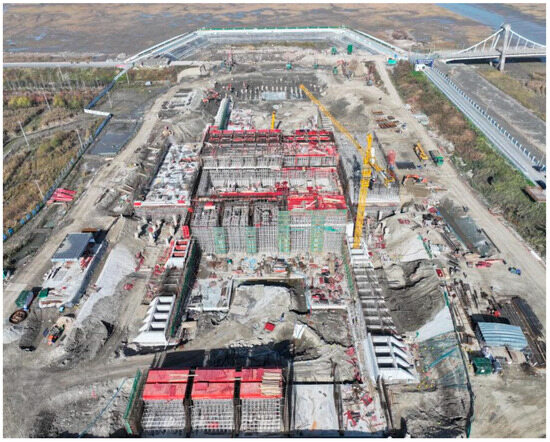
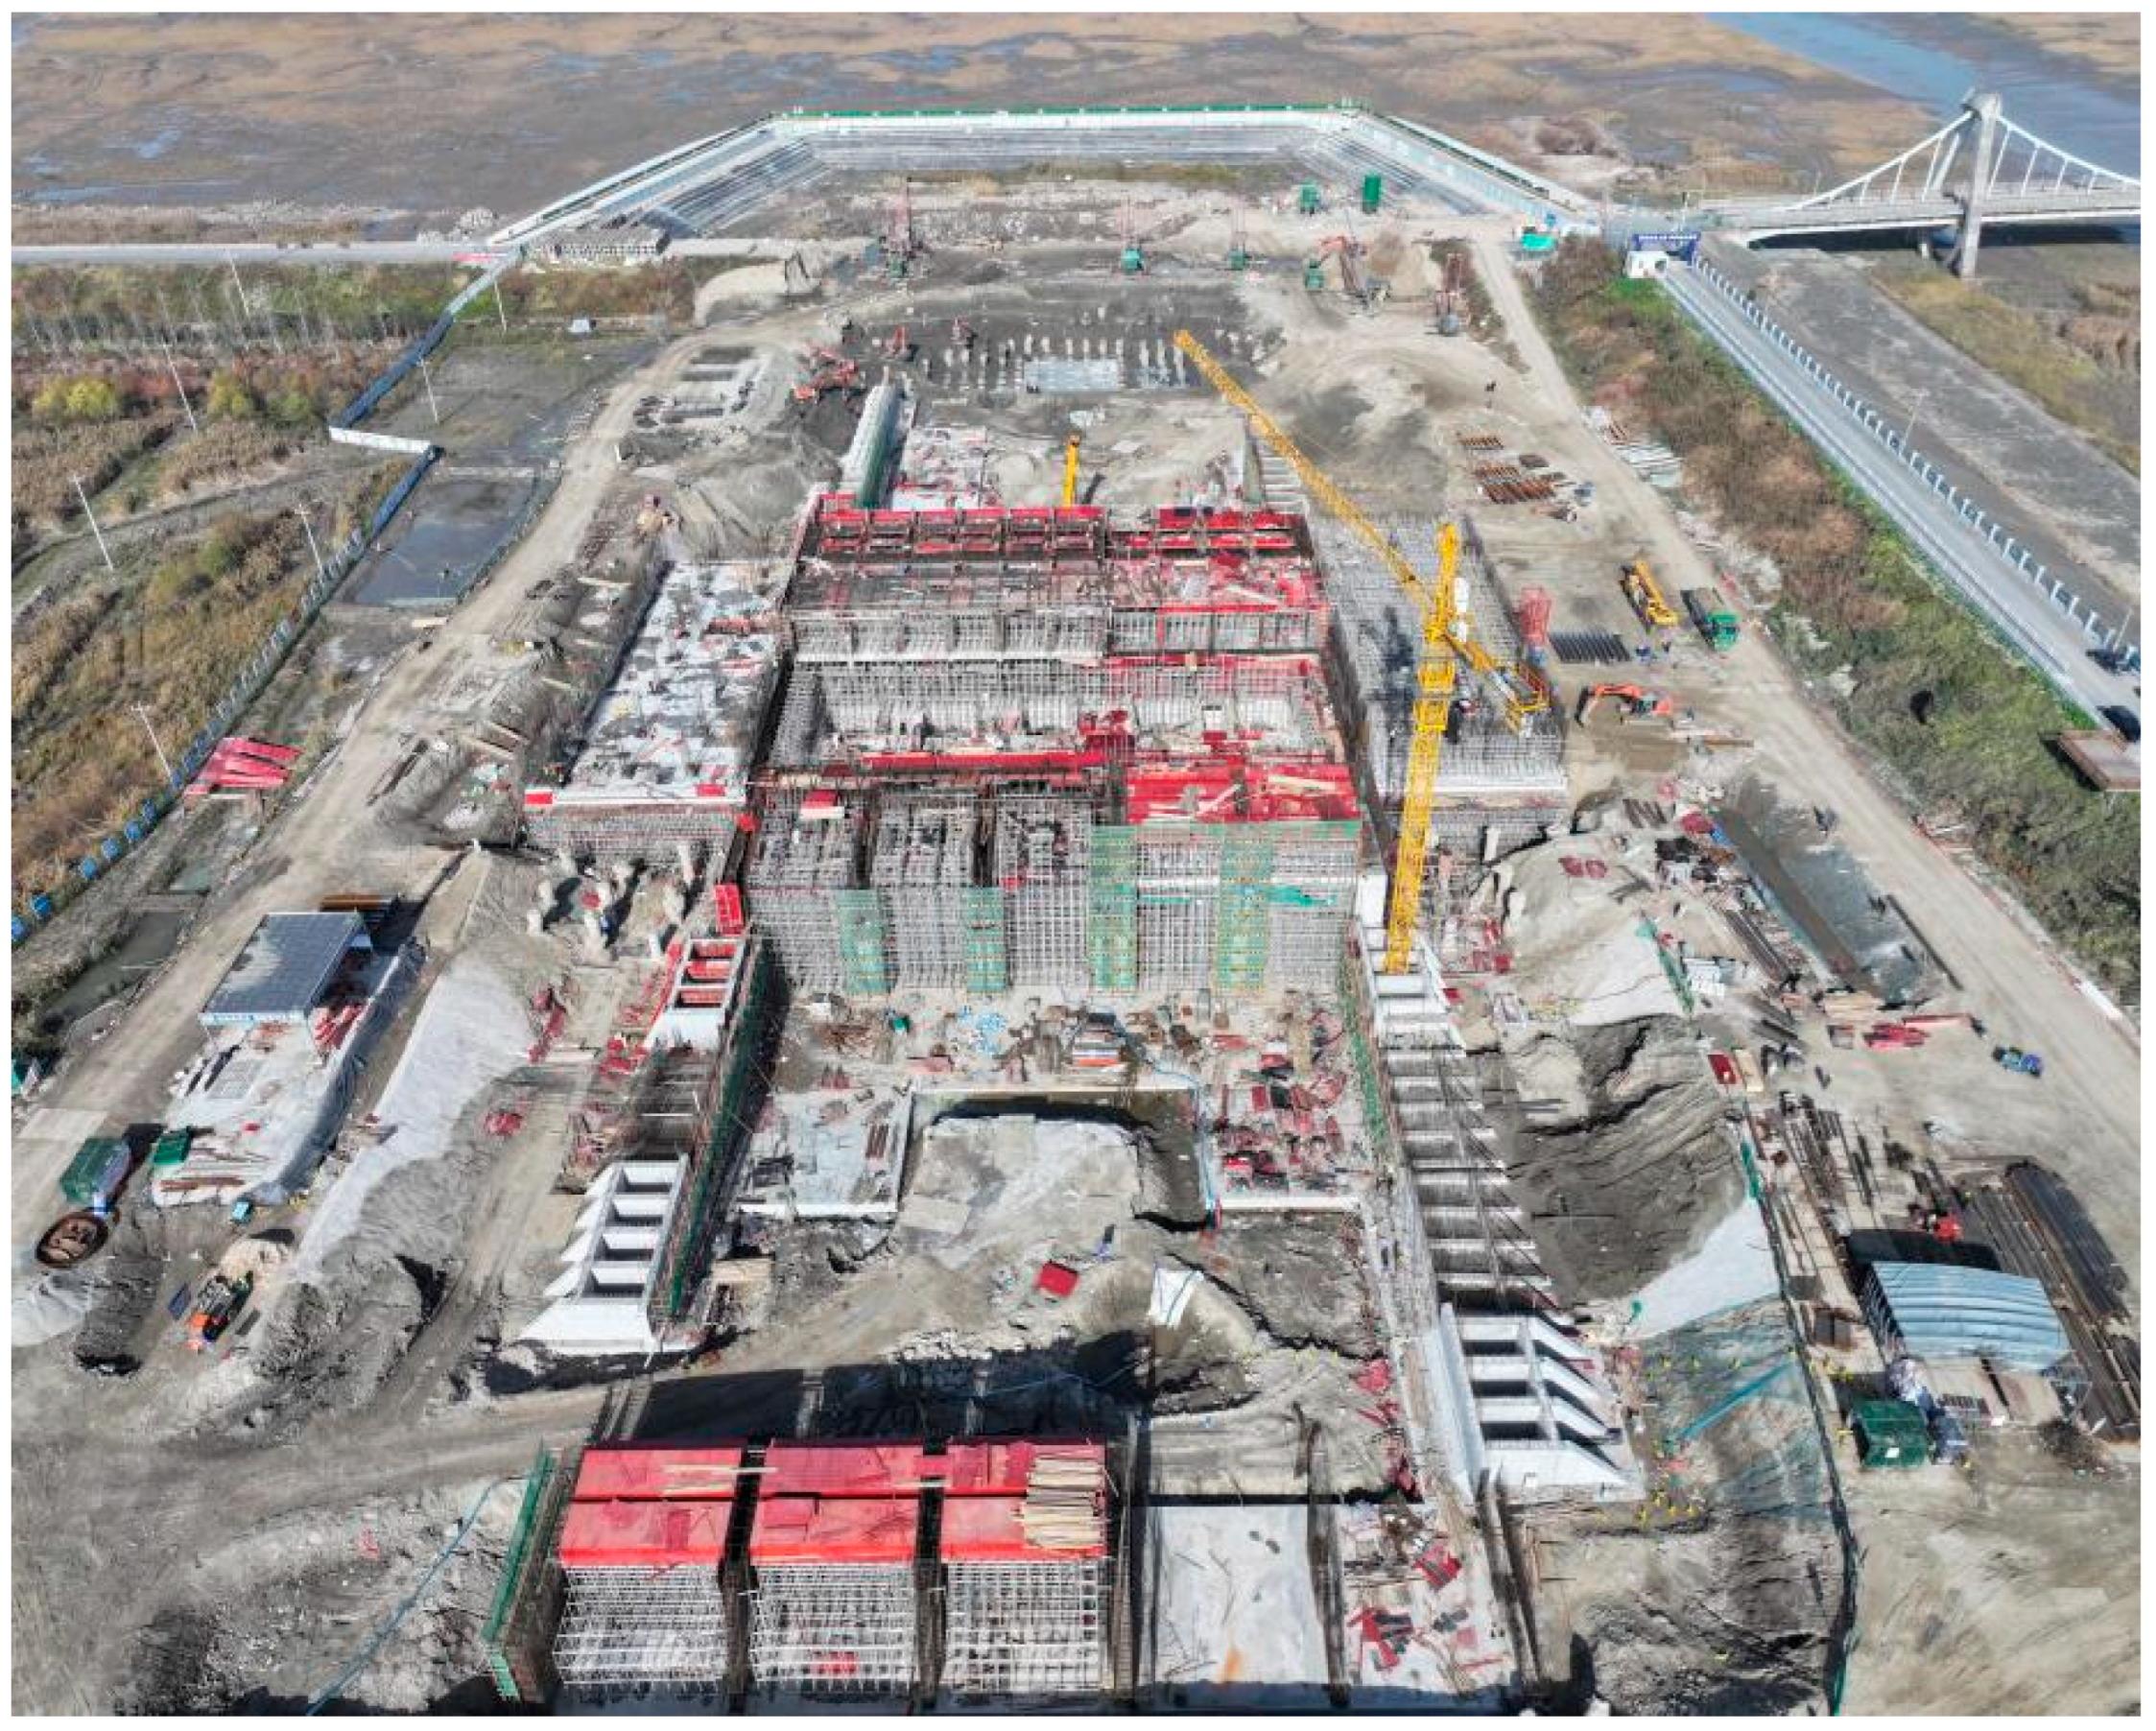
To evaluate the applicability and operational stability of the proposed monitoring system in real engineering scenarios, an on-site field test was conducted on a concrete placement surface at a pumping station, as shown in Figure 17. The construction environment is characterized by limited working space, frequent cross-operation of mechanical equipment, and an overall high safety risk level, which poses strong practical demands for real-time monitoring of construction personnel. A representative concrete placement surface was selected as the experimental area.
Figure 17.
Overview of the experimental pumping station environment.
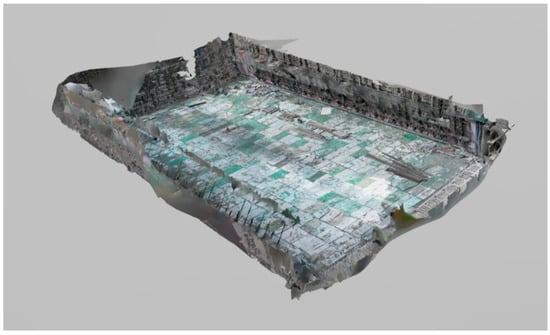
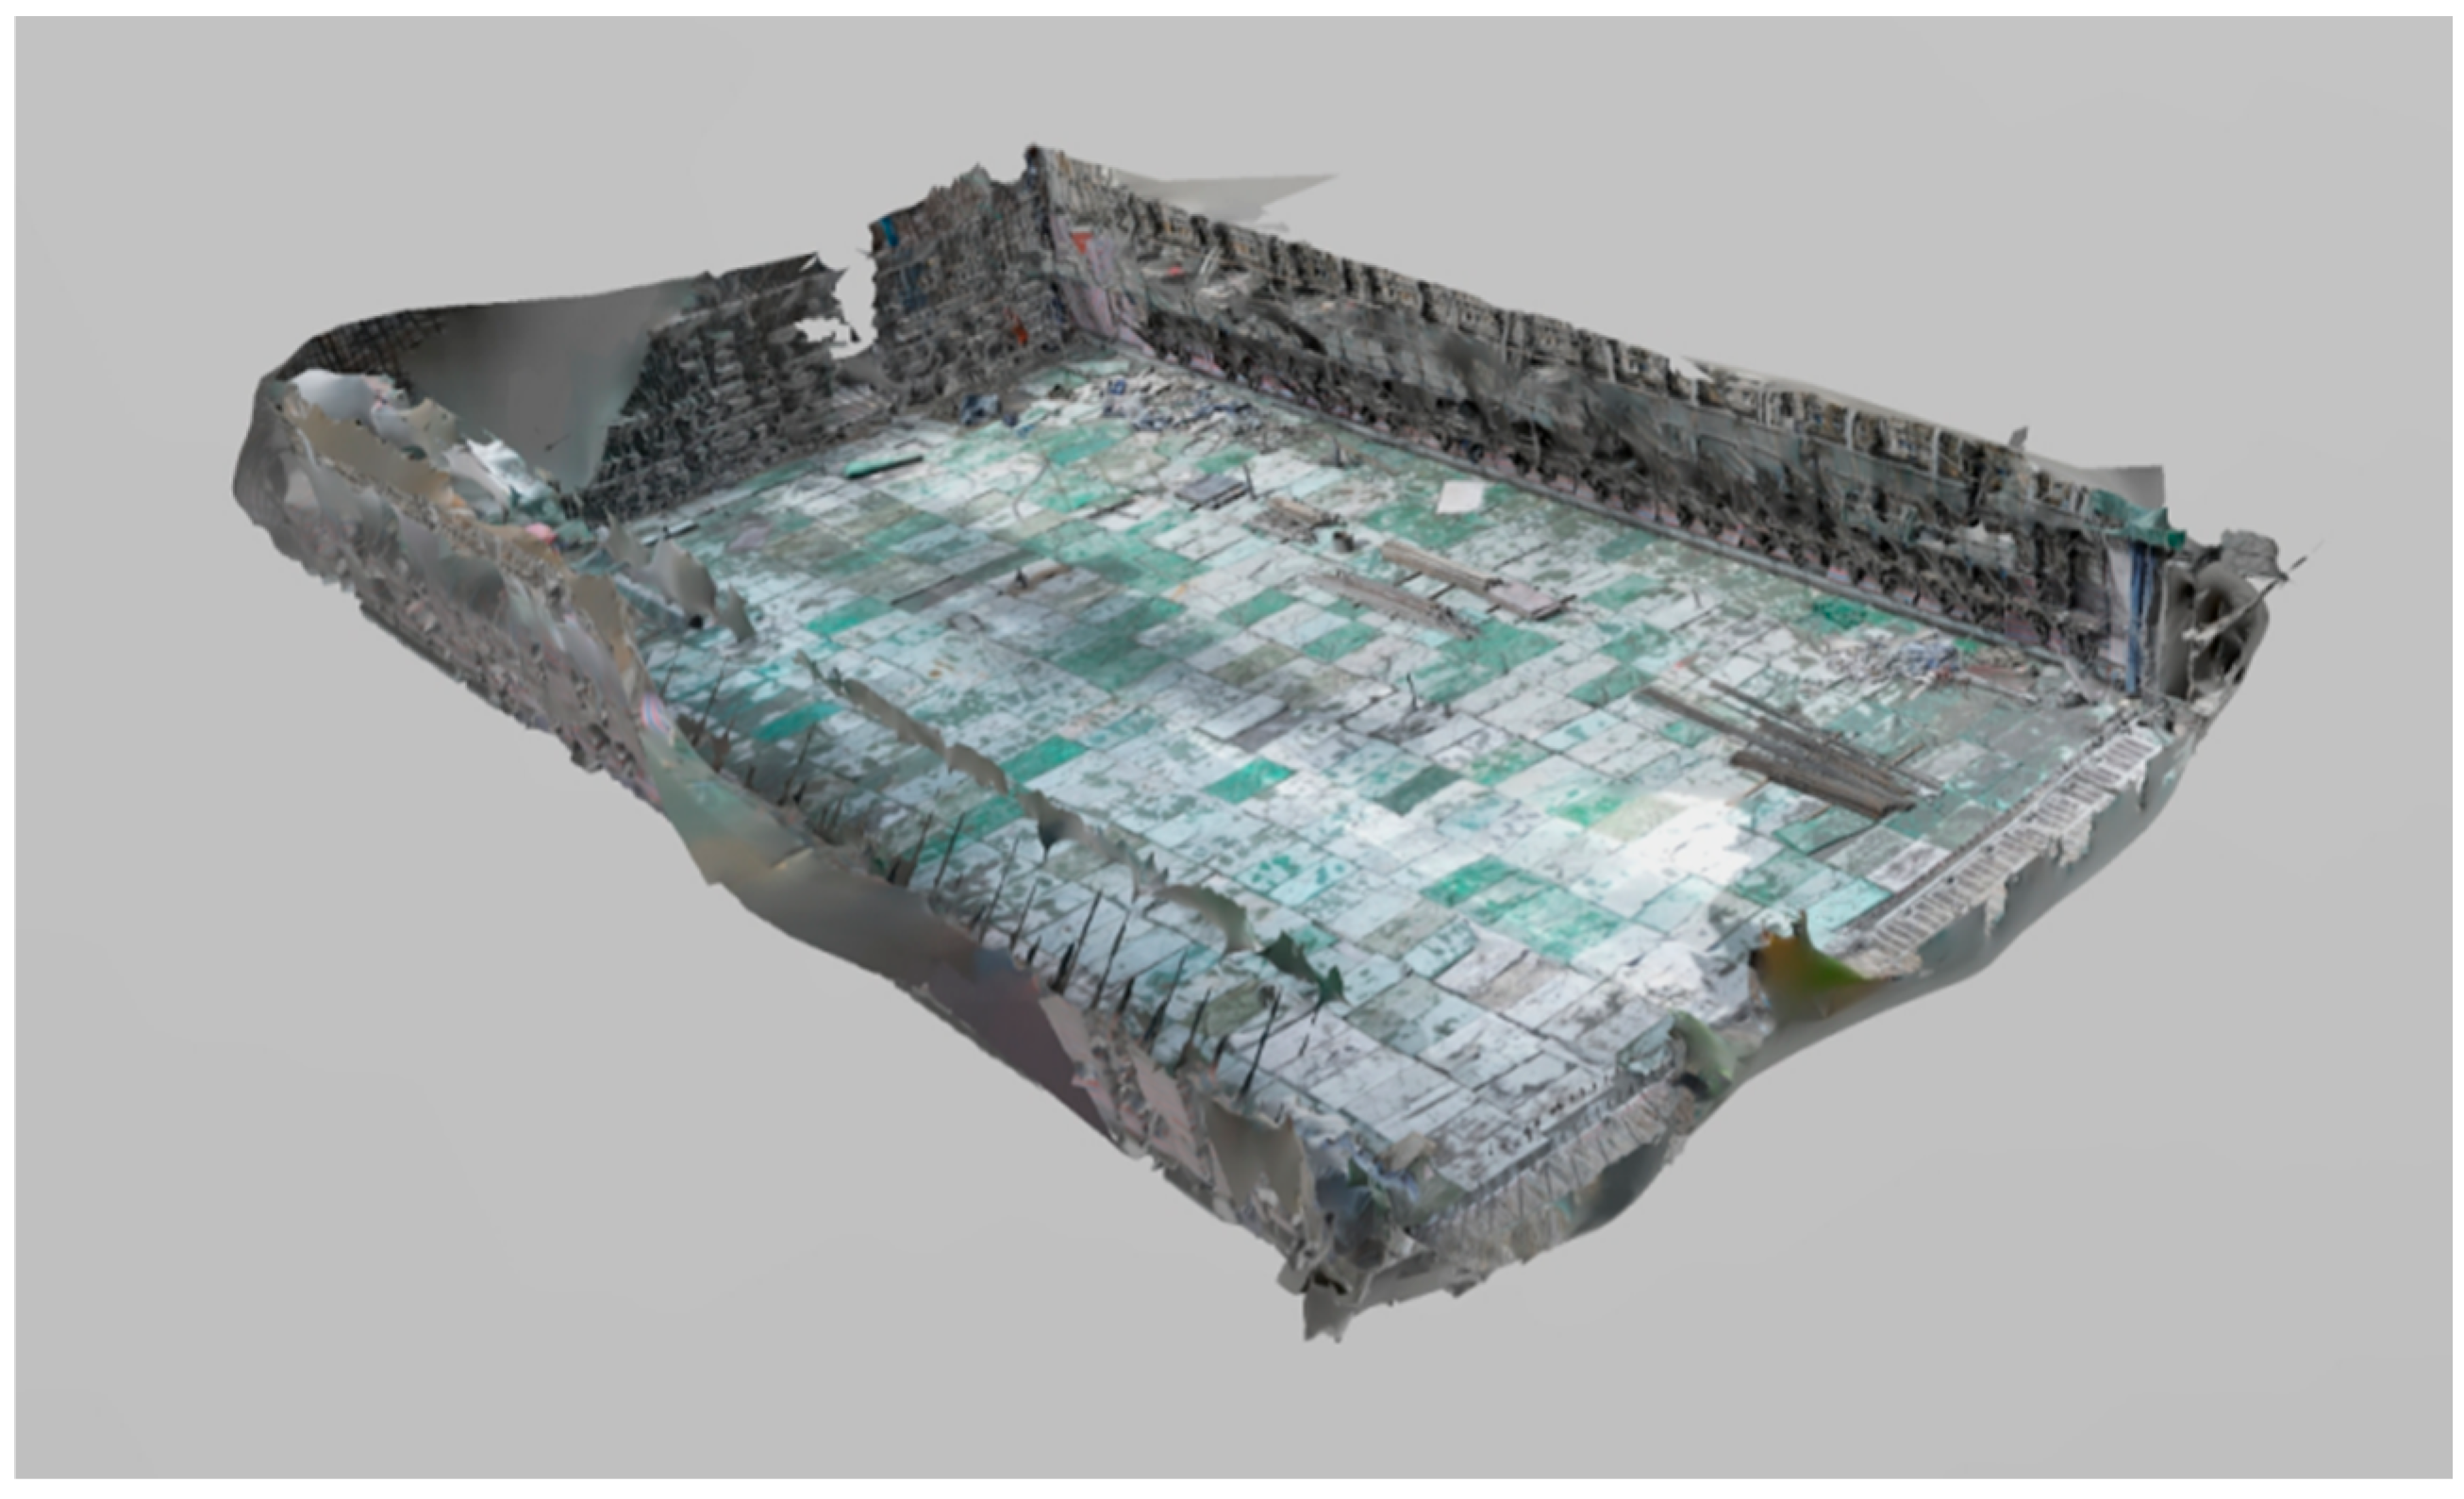
Following the UAV-based oblique photogrammetry workflow described in Section 3.4.2, image data of the target concrete placement surface were acquired and processed to generate a 3D reality model. After post-processing, the model was exported in OBJ format and served as the spatial basis for system visualization and personnel positioning mapping. The final 3D modeling result is shown in Figure 18.
Figure 18.
3D reality model of the selected concrete placement surface.
4.2. Hazardous Region Classification and System Application
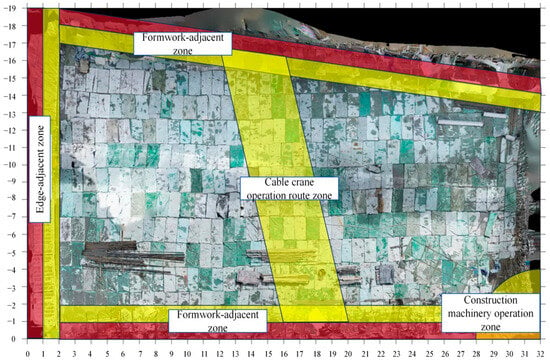
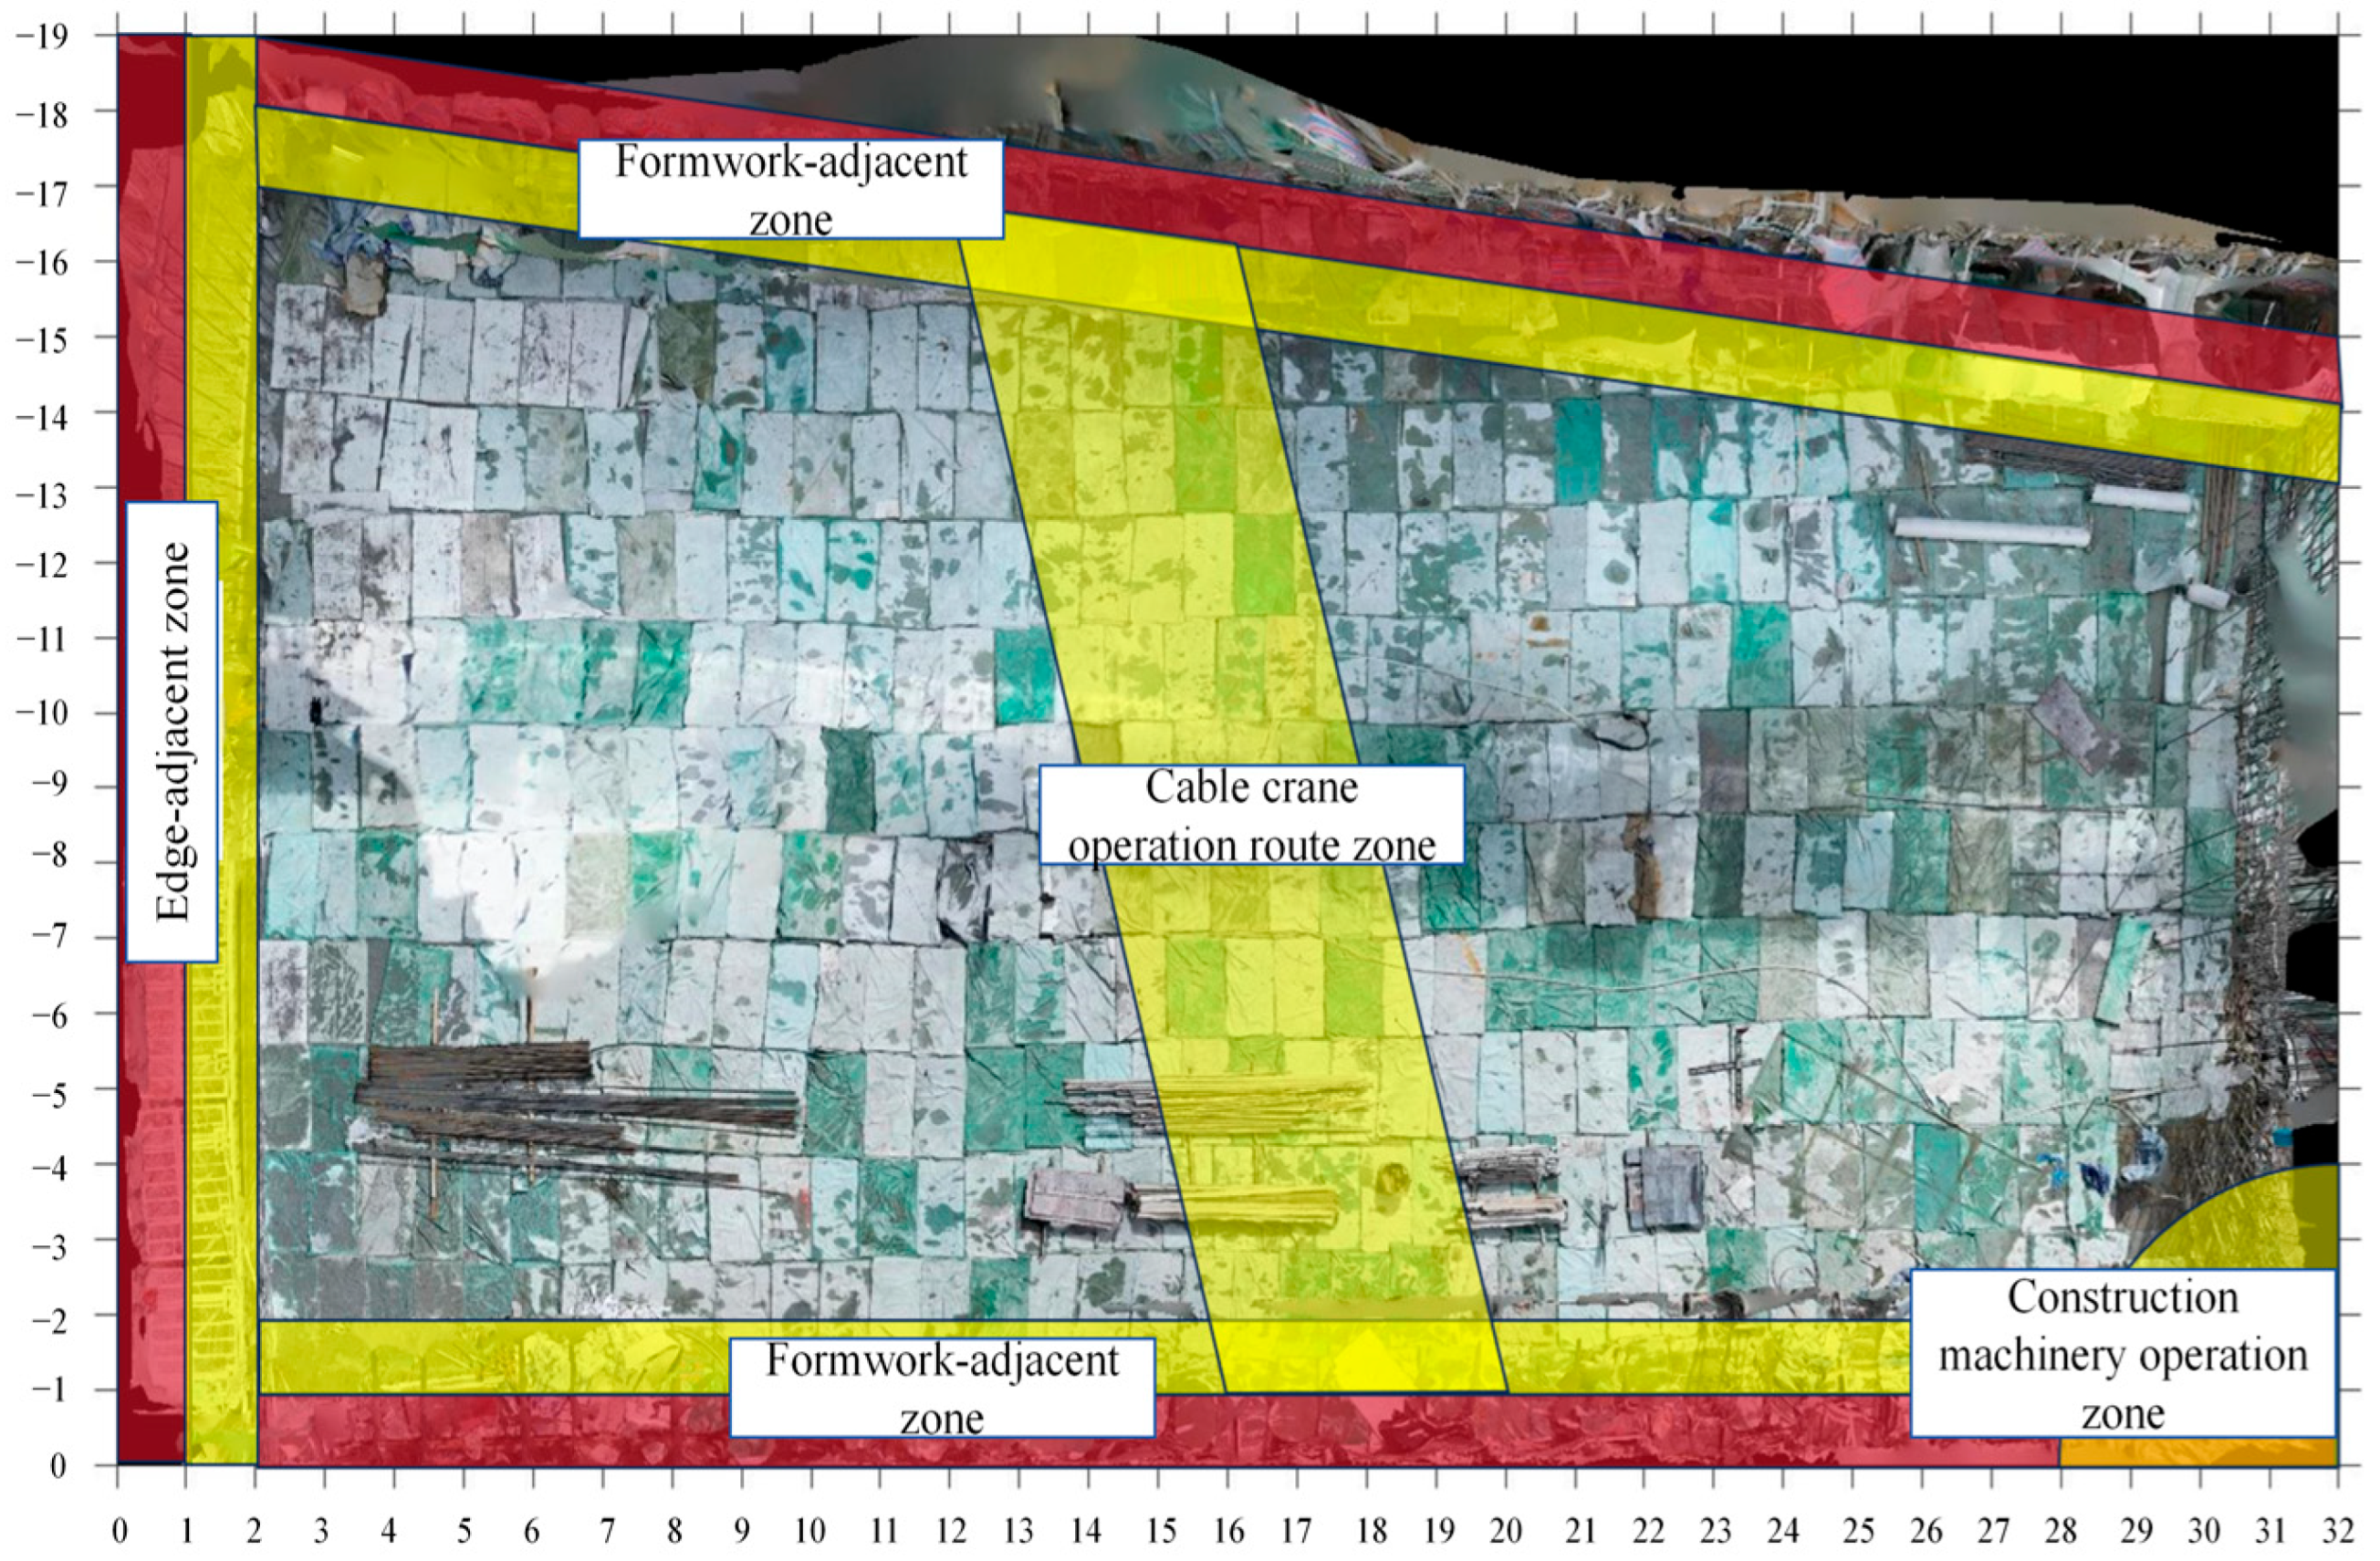
During the field test, the selected concrete placement surface was in the curing stage. Based on on-site inspection, the primary hazardous zones included the upstream edge-adjacent zone, the formwork-adjacent zones on both sides, the cable crane operation route zone, and the construction machinery operation zone affected by adjacent placement activities. According to the regional risk classification criteria listed in Table 1, hazard levels were assigned to these zones, and the resulting spatial distribution is illustrated in Figure 19, where red and yellow represent high-risk and medium-risk areas, respectively.
Figure 19.
Hazard level classification results of different regions on the placement surface. Red indicates the High Hazard Level, and yellow indicates the Medium Hazard Level.
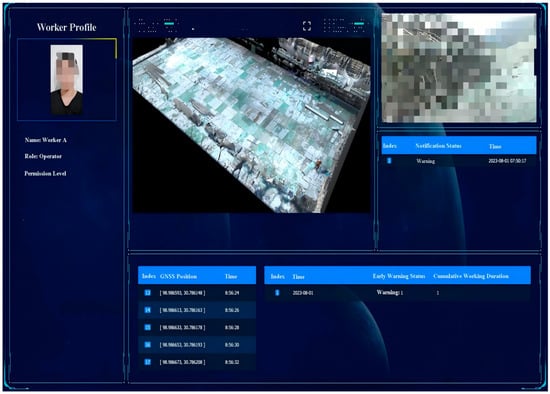
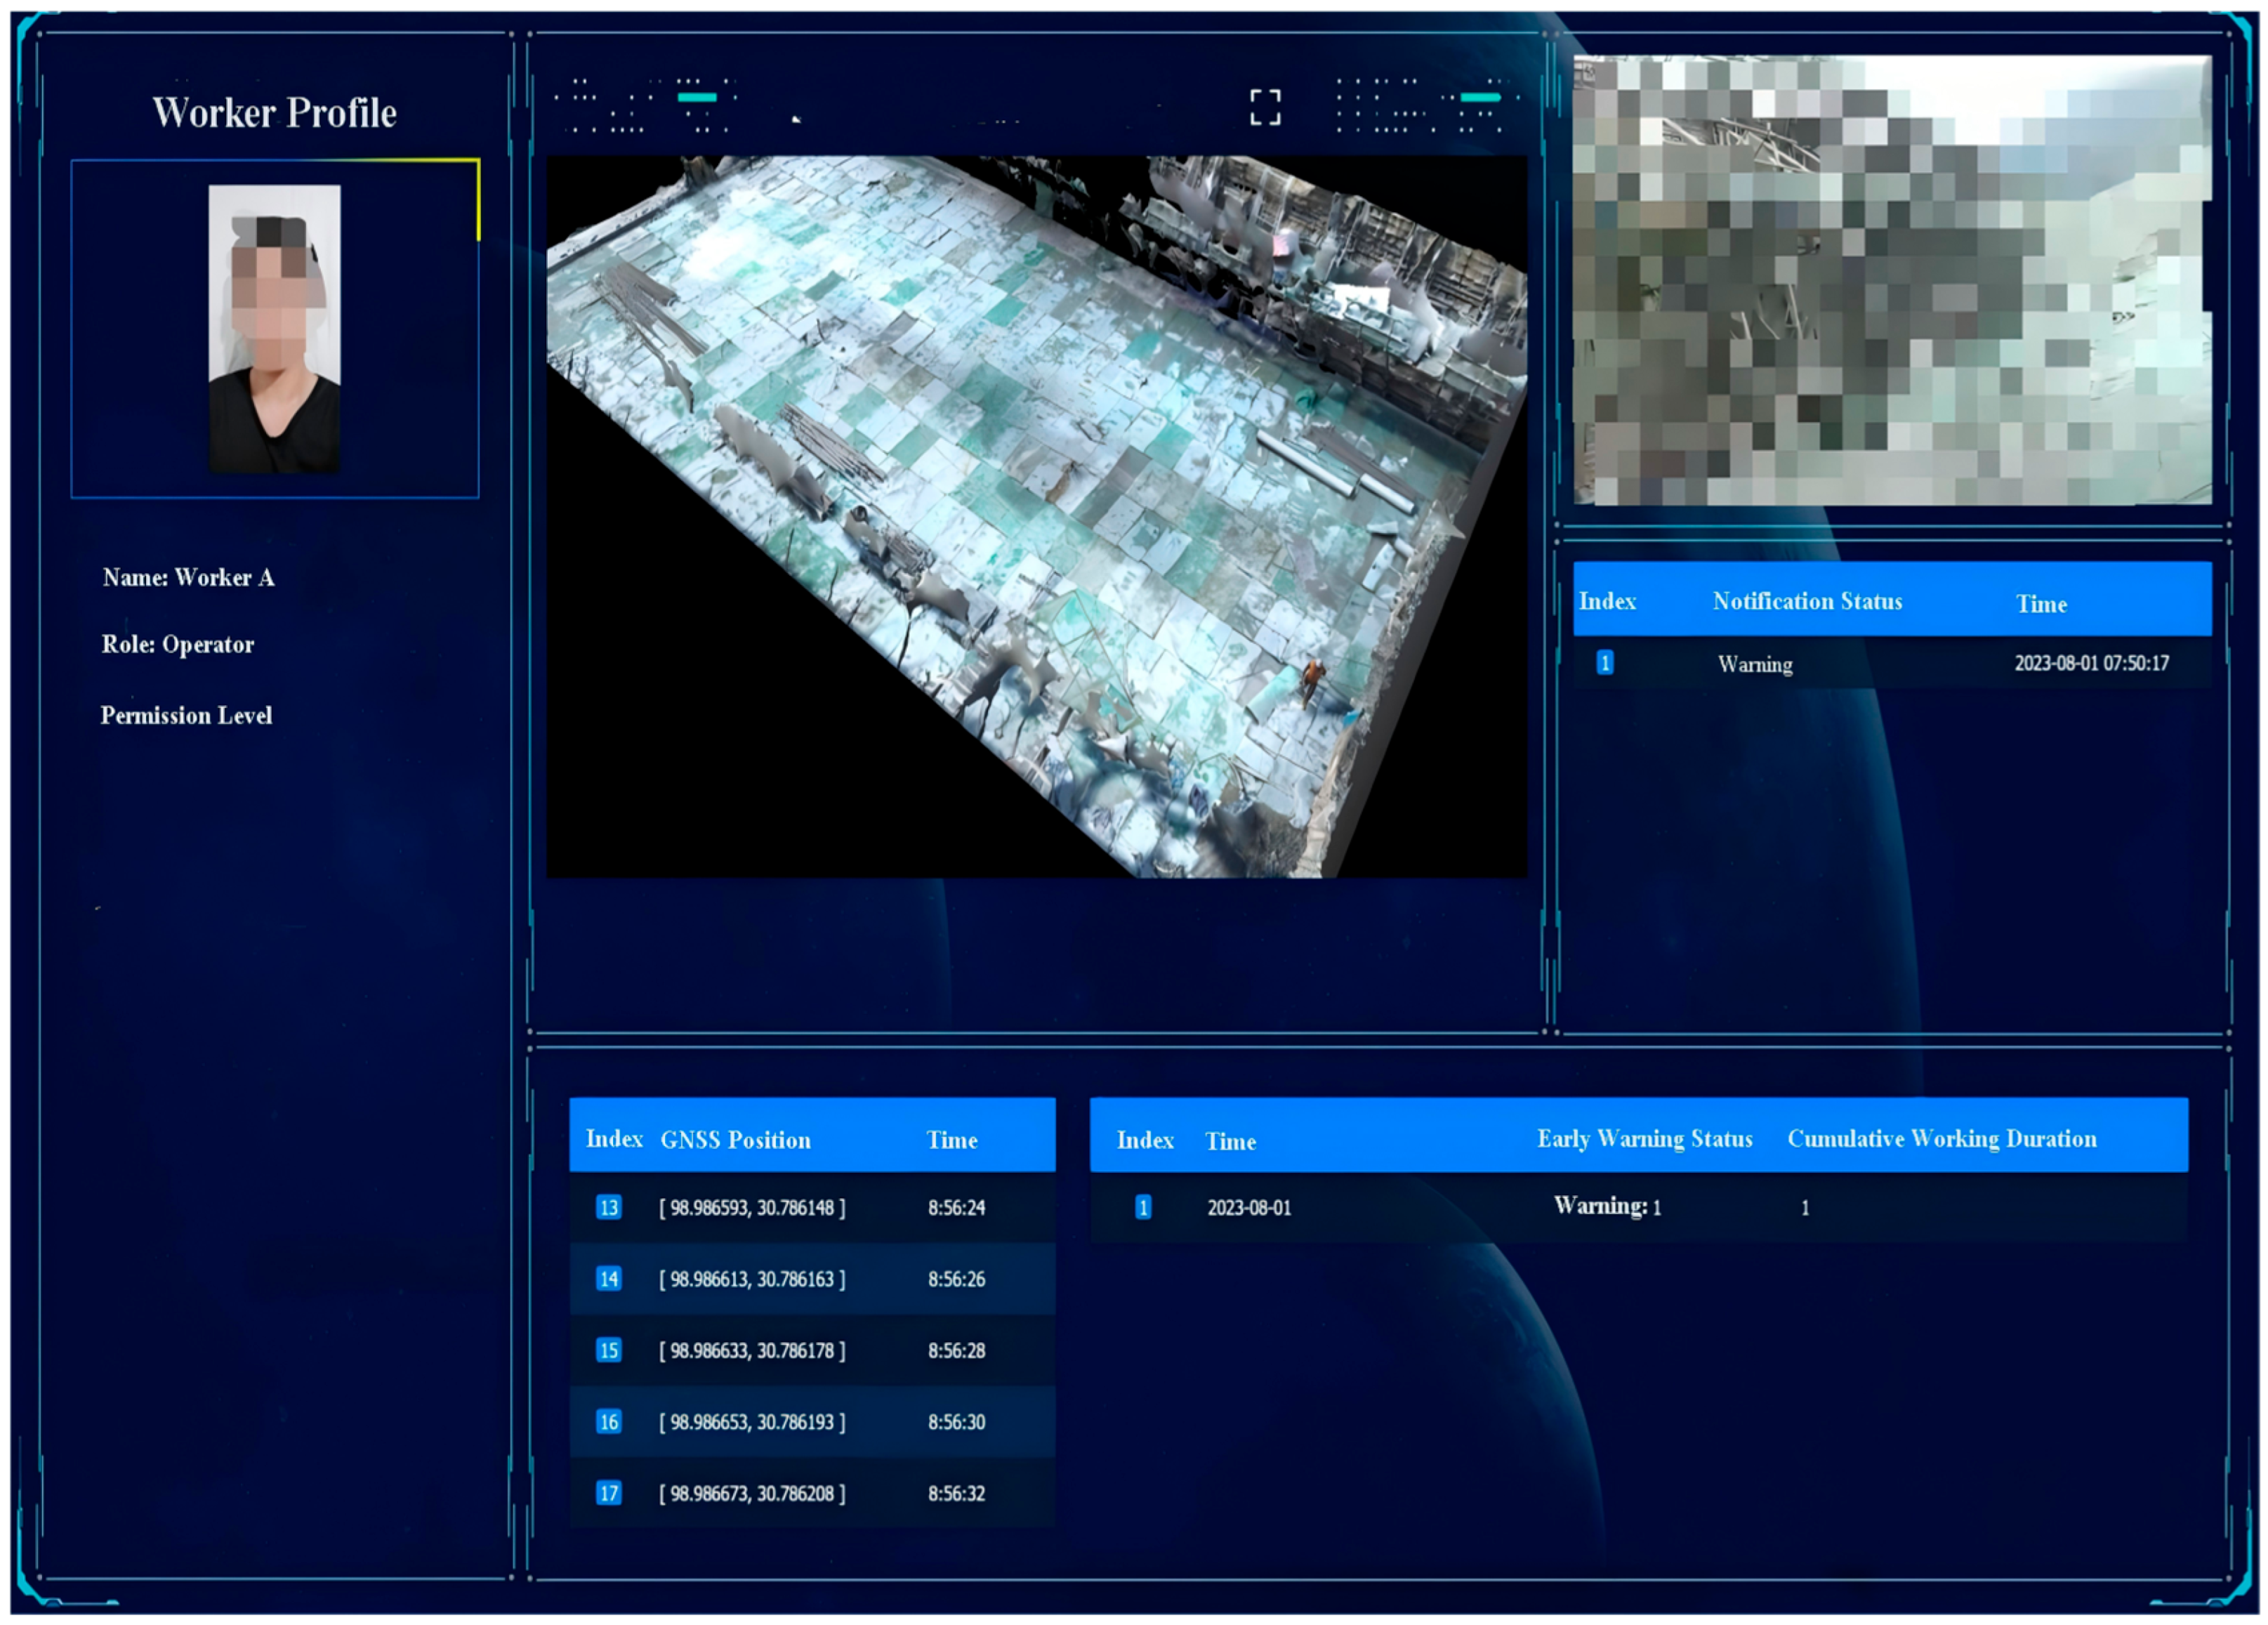
Based on the hazardous region classification results, the system was implemented with a personnel login module, a main monitoring interface, and integrated personnel management functions. Users can add or switch monitored personnel through the personnel selection module, and a global display mode is provided to accommodate centralized visualization on large-screen terminals. The main interface of the personnel safety monitoring system is illustrated in Figure 20.
Figure 20.
Main interface of the personnel safety monitoring system.
The interface embeds a 3D visualization module within a web browser, enabling real-time visualization of personnel locations, motion states, and regional risk information. When abnormal behaviors are detected or personnel enter hazardous regions, the system automatically highlights the corresponding regions and displays alarm indicators above the associated character models. In addition, the interface integrates positioning information, video feedback streams, alarm notification panels, and daily operation statistics, enabling centralized visualization and unified management of multi-source monitoring data.
4.3. Validation of 3D Visualization Model
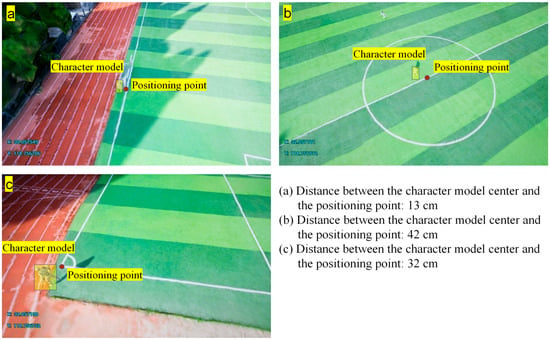
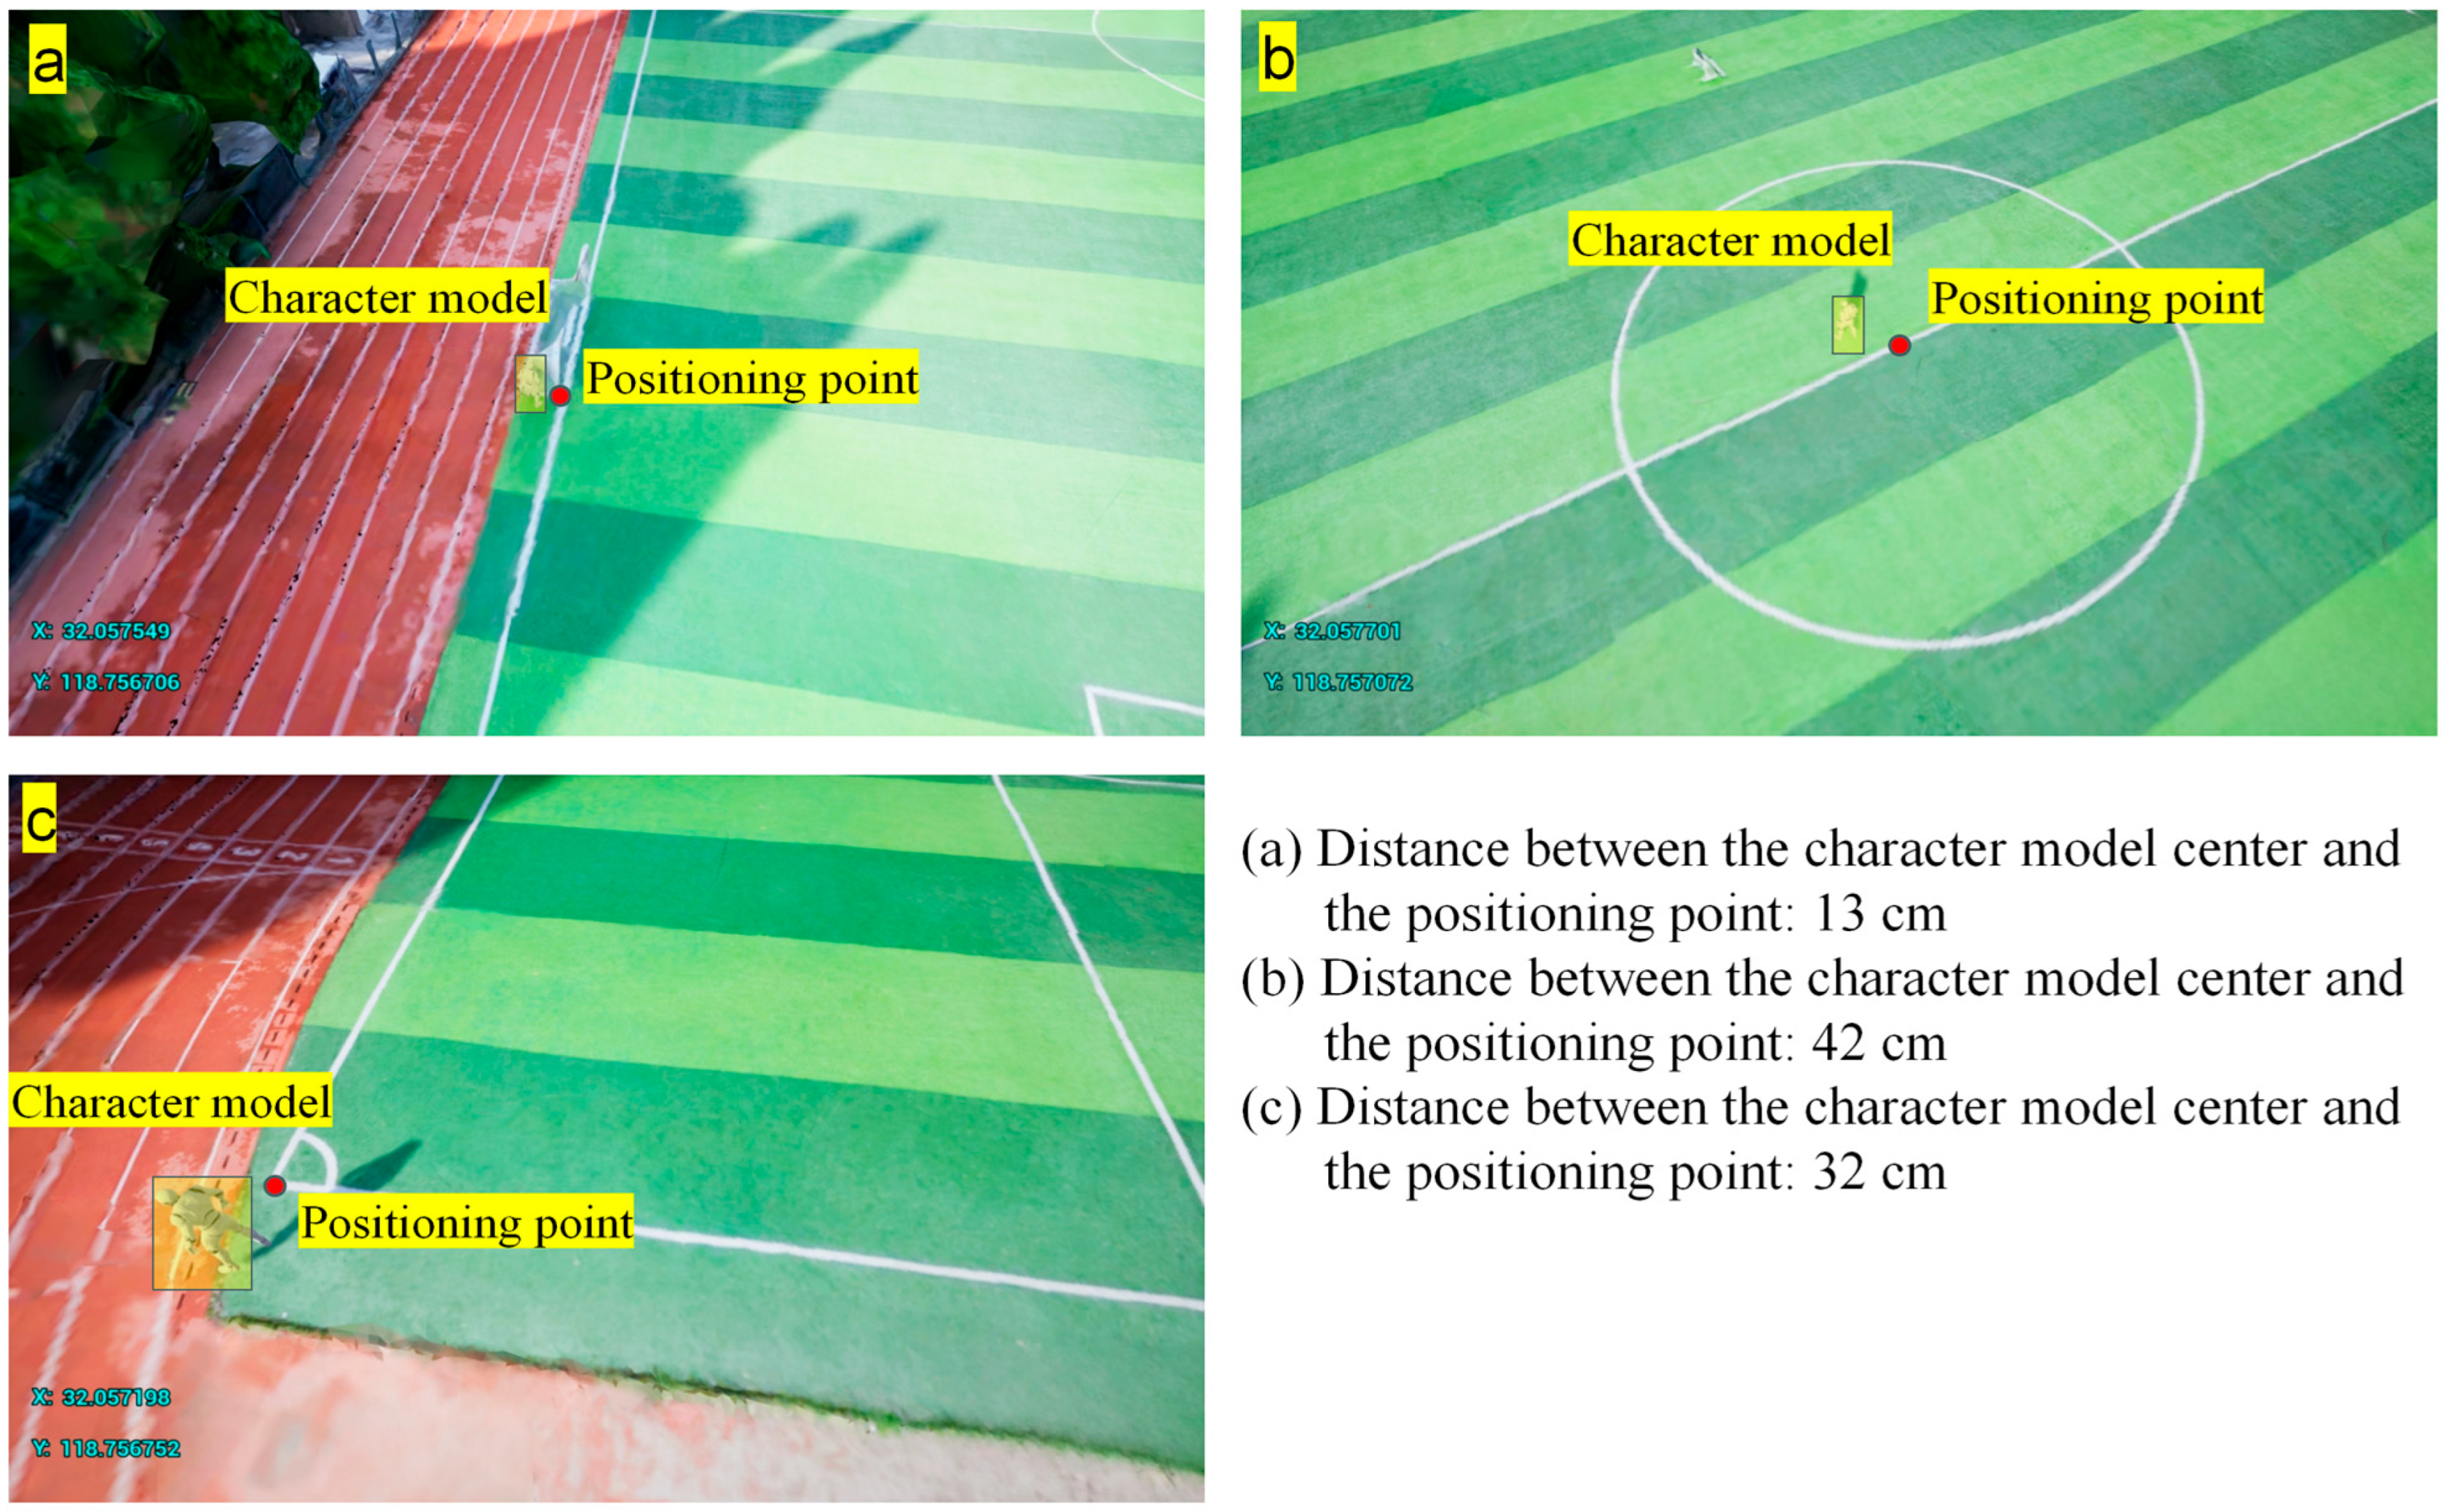
To assess the positioning and spatial-mapping accuracy of the 3D visualization system, reference points with known coordinates were placed in an open area. The spatial deviation between the digital helmet GNSS-RTK positions and the corresponding avatar locations in the Three.js scene were quantified. In each trial, the test participant followed predefined walking paths with brief stops, and measurements were repeated under the same conditions. Three representative results are shown in Figure 21, with deviations of 13, 42, and 32 cm. Overall, the error ranged from 13 to 78 cm, and the update latency was 1 s to 2 s. This level of accuracy and responsiveness meets the practical requirements for concrete placement surface monitoring.
Figure 21.
Experimental results of positioning-to-visualization mapping accuracy.
4.4. Validation of Warning Mechanism
To evaluate the reliability and response performance of the proposed system under practical engineering conditions, field validation experiments were conducted in which test participants equipped with smart helmets, IMU sensors, and mobile terminals entered the experimental concrete placement surface. Three participants were involved in the validation test. The participants followed predefined routes and performed specified actions according to the experimental protocol. Each participant took around 45 min to finish the test. System performance was evaluated based on whether the generated alarm levels were consistent with the predefined monitoring and warning rules, and whether the alarms could be issued within an acceptable response time. Rule-consistency was checked against Appendix A, and response time was measured from sensing/data transmission to warning output and visualization. The recorded GNSS-RTK localization data exhibit a minimum deviation of 0.33 m and a maximum deviation of 1.97 m, with deviations generally following a normal distribution. The median deviation is 1.15 m, and the 95th percentile is 1.60 m. These values are higher than those reported in Section 4.3, which can be attributed to the complex environment of the actual construction site. In particular, larger localization deviations are frequently observed near the formwork region, due to strong signal interference caused by the tall and large metallic formwork. As described in Section 3.2.1, the IMU sensor data are transmitted to a mobile terminal via Bluetooth 5.0. Due to the short communication range, the IMU data loss rate measured across three trials was 2.71% ± 0.49%.
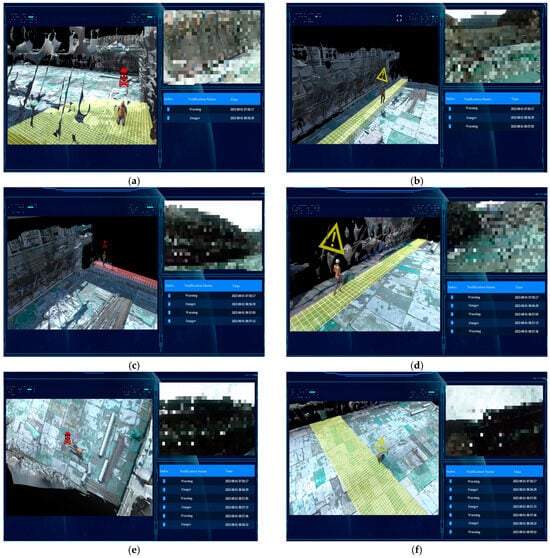
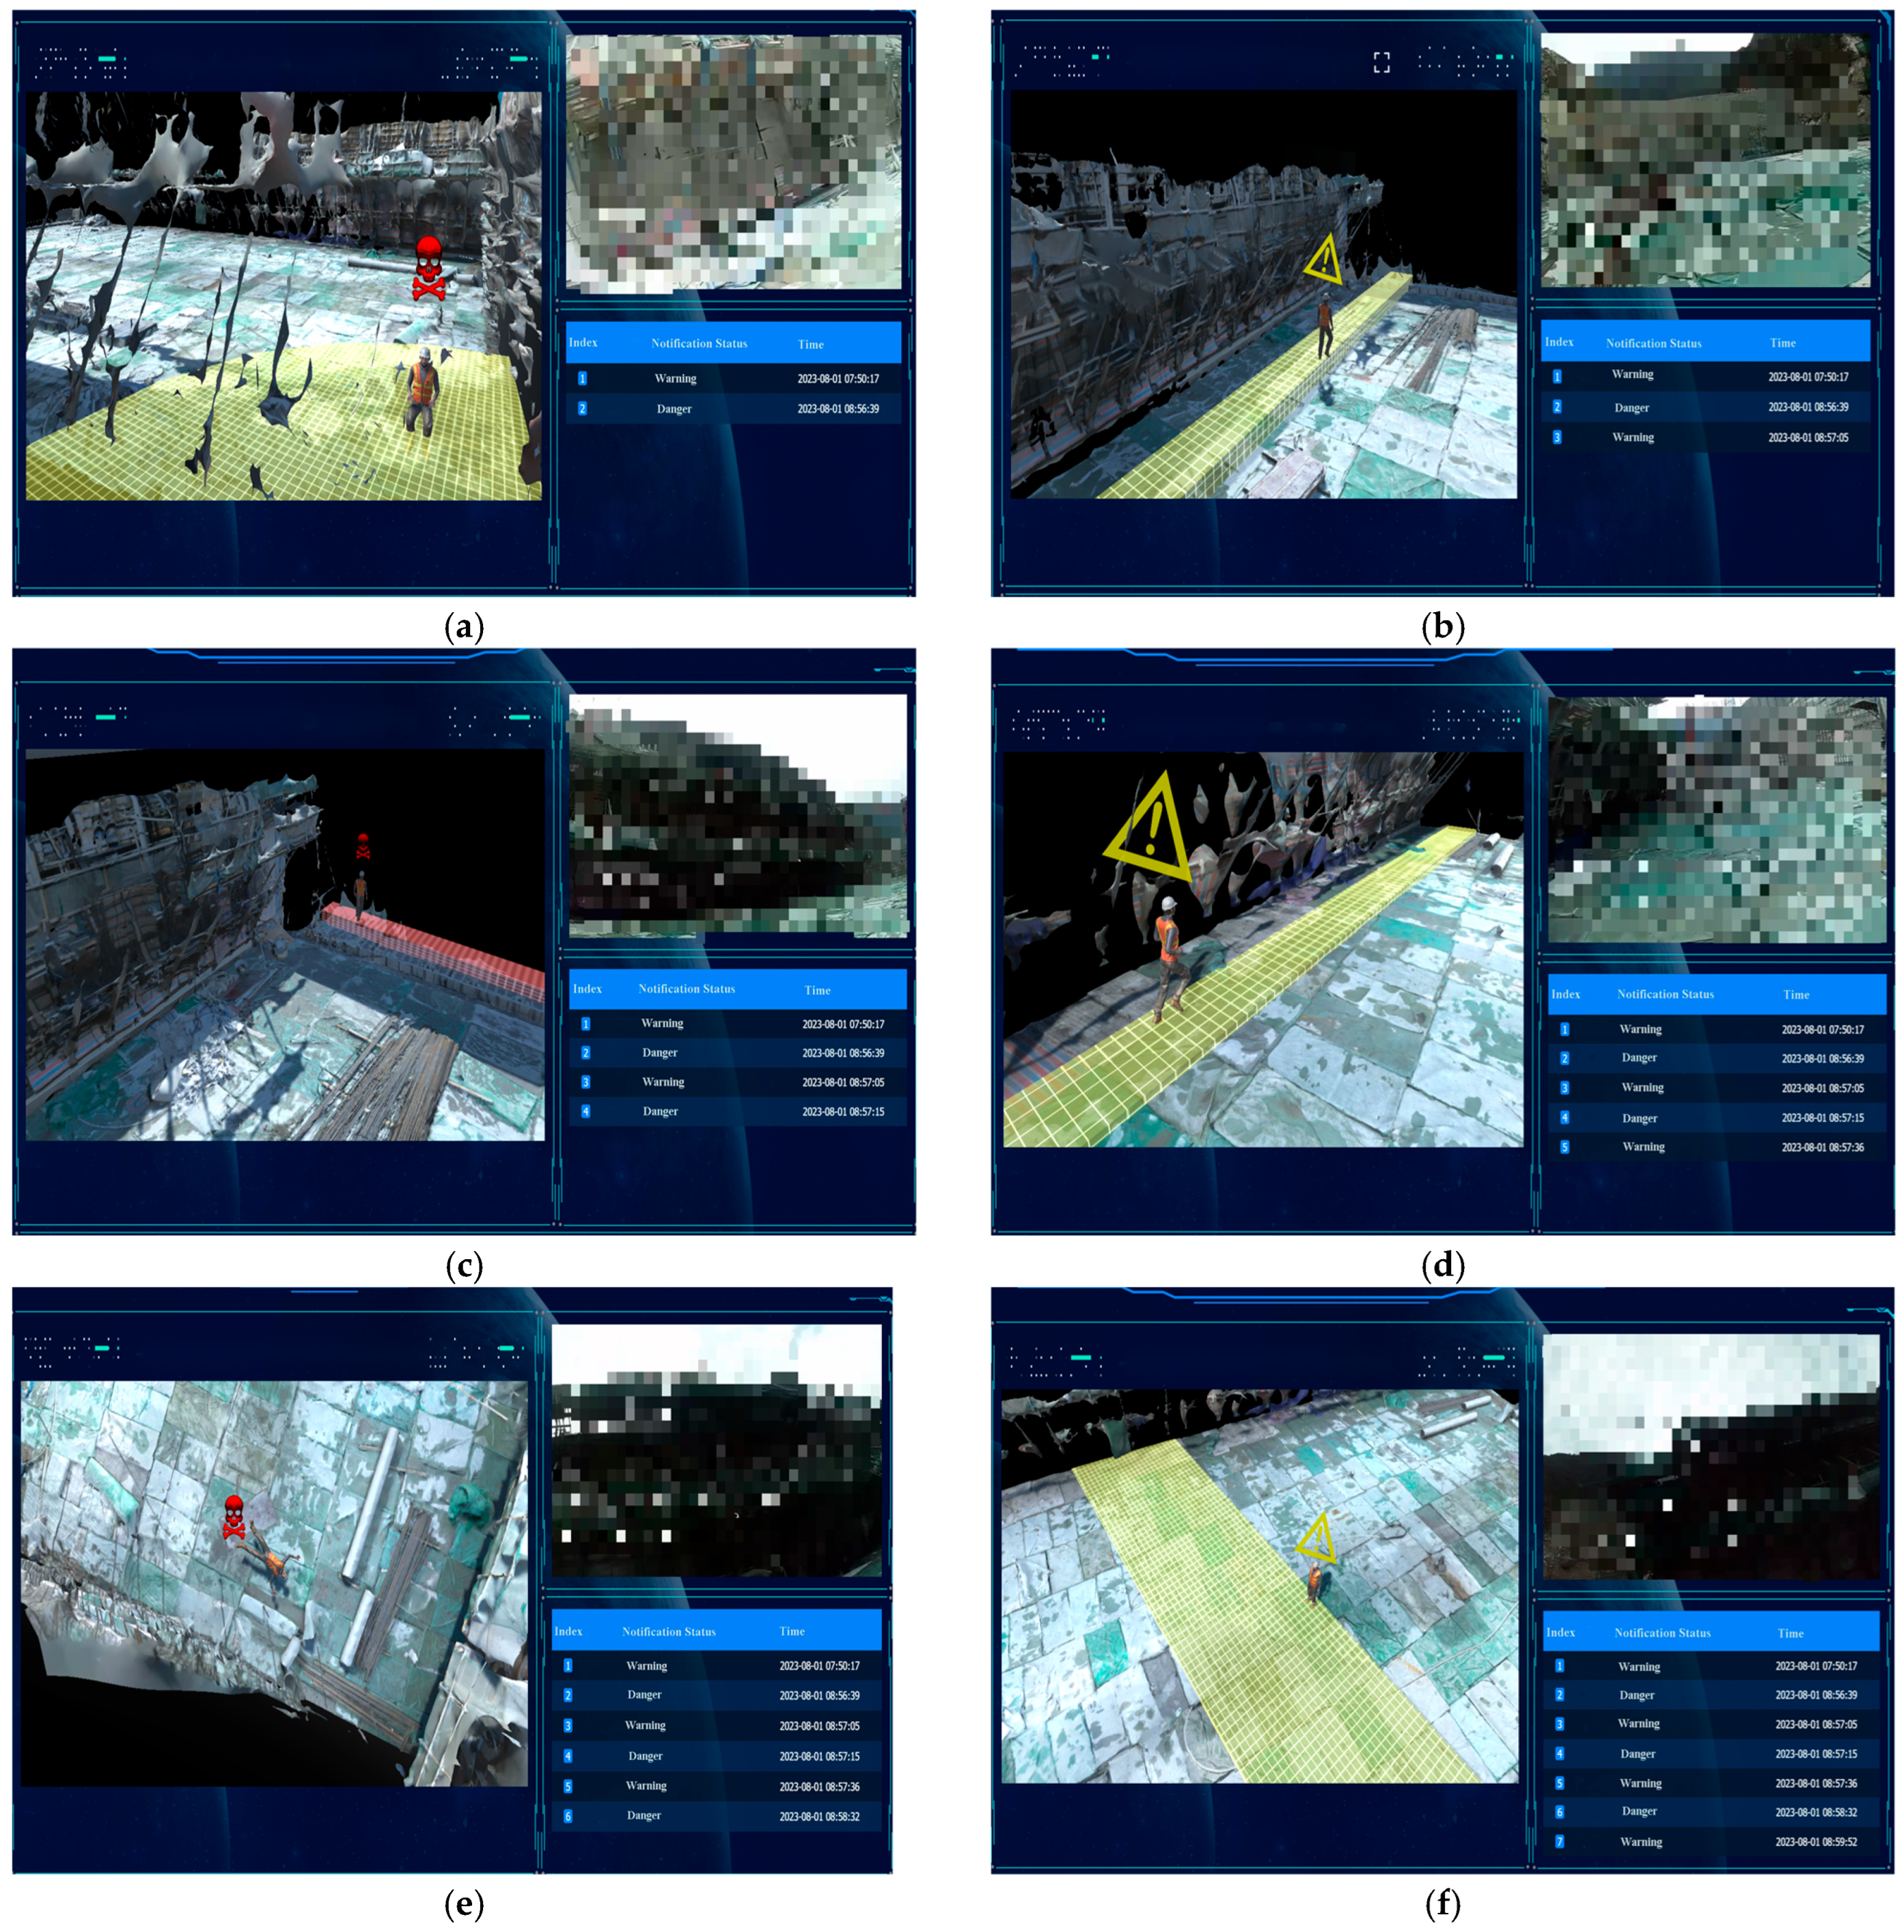
Representative scenarios are presented in Figure 22a–f to verify that the alarm outputs strictly follow the predefined rules. As shown in Figure 22a, when a sitting action was performed in the medium-risk construction machinery operation zone, the behavior was classified as high risk (see Appendix A), and the system correctly triggered a danger alarm within 2 s. Subsequently, as illustrated in Figure 22b, when the participant continuously performed a walking action for 30 s in a medium-risk formwork-adjacent zone, a warning alarm was issued within 1 s, which was consistent with the rule-based assessment. After the participant entered the high-risk edge-adjacent zone of the placement surface (Figure 22c), the system triggered a danger alarm within 3 s. In addition, as shown in Figure 22d, when a running action was performed for 10 s in another medium-risk formwork-adjacent zone, the system also generated a warning alarm within 1 s. Furthermore, when a lying action was performed in the high-risk general placement surface zone (Figure 22e), and a standing action was maintained for 1 min in the medium-risk cable crane operation corridor (Figure 22f), the system correctly and promptly output danger and warning alarms, respectively. Across all tested scenarios, the generated alarm levels were fully consistent with the predefined theoretical rules.
Figure 22.
Results of the engineering validation experiments. (a) Sitting action in a medium-risk construction machinery operation zone; (b) Walking action in a medium-risk formwork-adjacent zone; (c) Entering a high-risk edge-adjacent zone; (d) Running action in a medium-risk formwork-adjacent zone; (e) Lying action in a high-risk remaining placement surface area; (f) Standing action in a medium-risk cable crane operation corridor.
The end-to-end response time from sensing and data transmission to warning output and visualization was assessed during the on-site tests. Overall, the proposed system was able to issue alarms within 1–3 s, satisfying the real-time and reliability requirements for construction-site monitoring.
4.5. Discussion and Limitation
Based on the above validation results, this section discusses the practical implications, advantages over conventional approaches, and deployment considerations of the proposed method.
Compared with conventional on-site safety management, the proposed method improves data continuity, risk granularity, and dynamic early warning. Manual inspections provide limited coverage, delayed feedback, and are highly experience-dependent. Although computer-vision approaches for construction monitoring have progressed [18], they remain sensitive to illumination, viewing angle, and occlusion, and are limited in quantitatively capturing workers’ actions and postures. Static warning boundaries further fail to reflect risk migration across construction stages.
By integrating BiLSTM-attention-based HAR, GNSS-RTK positioning, and regional risk classification, the proposed system jointly evaluates actions, locations, and spatial hazards, shifting risk assessment from static or experience-driven judgments to a structured, dynamic process. Multi-source fusion enhances robustness and can help reduce false alarms under unoccluded, partially occluded, and dynamic site conditions. Overall, the framework demonstrates feasibility and potential in deployability, real-time feedback, and adaptability to complex scenarios, supporting practical safety monitoring and early warning on concrete placement surfaces, consistent with current trends in construction safety systems [19,58].
For the limitations and deployment considerations, the on-site validation was conducted under a controlled protocol and may not capture the full variability of real construction environments (e.g., dense worker interactions and frequent layout changes). System performance may be affected by sensing and communication conditions; GNSS signal degradation, multipath effects, and intermittent connectivity can introduce additional latency or location uncertainty. In addition, practical deployment requires integrating multiple digital components (IMU devices, digital helmet, and mobile terminals), which may increase efforts in device management, calibration, and long-term maintenance. Moreover, the current field validation focuses on system integration, rule-consistent alarm execution, and response performance, rather than independent verification of rule thresholds against expert-labeled ground truth; such ground-truth validation will be pursued in future work. Future large-scale deployments are needed to further refine thresholds and improve robustness across diverse projects.
5. Conclusions
To address the challenges of real-time identification, quantitative assessment, and early warning of unsafe behaviors during concrete placement surface construction, this study proposes a personnel safety monitoring and alarm method for complex construction scenarios, and validates its effectiveness through system implementation and field experiments. The main conclusions are summarized as follows.
(1) A personnel safety monitoring framework integrating regional hazards, action risks, and personnel permissions is proposed for concrete placement surfaces characterized by multi-process operations and intensive equipment interaction. By jointly considering hazardous spatial regions, unsafe action types, and personnel attributes and permission levels, a unified, rule-based, and executable risk assessment and alarm logic is established.
(2) A BiLSTM-Attention-based HAR algorithm is integrated into the construction safety monitoring system for unsafe action identification. Using time-series motion data collected by IMU sensors, the BiLSTM structure models forward and backward temporal dependencies of human actions, while the attention mechanism emphasizes key temporal segments, providing stable and reliable action features for subsequent risk quantification and decision-making.
(3) By fusing HAR results, personnel positioning information, hazardous region parameters, and personnel permission data, a multi-source data–driven personnel safety monitoring and alarm system is developed. A real-time monitoring and alarm mechanism suitable for construction sites is implemented, and 3D visualization is employed to intuitively present personnel locations, behavioral states, and risk levels, thereby enhancing the real-time performance and deployment feasibility of risk assessment.
(4) On-site validation demonstrates that the proposed system can execute the predefined rule base consistently and generate appropriate alarm outputs under different personnel permission and spatial risk conditions, with an end-to-end response time of 1 s to 3 s. These results support the feasibility of a rule-consistent real-time proof-of-concept in typical field scenarios.
Author Contributions
Conceptualization, J.C. and Z.Z.; methodology, J.C.; software, J.C. and X.S.; validation, J.C., Y.Z. (Yanyin Zhou), Y.Z. (Yao Zhou) and Y.Z. (Yingjie Zhao); formal analysis, J.C.; investigation, J.C., Y.Z. (Yanyin Zhou), Y.Z. (Yao Zhou) and Y.Z. (Yingjie Zhao); resources, J.S.; data curation, X.S. and Y.Z. (Yao Zhou); writing—original draft preparation, J.C.; writing—review and editing, Z.Z. and J.S.; supervision, Z.Z. All authors have read and agreed to the published version of the manuscript.
Funding
Project supported by the National Basic Research Program of China for Young Scientist [Grant number 2024YFB3714900] and the National Natural Science Foundation of China [Grant number 52279131].
Data Availability Statement
The original contributions presented in this study are included in the article. Further inquiries can be directed to the corresponding author.
Conflicts of Interest
Yanyin Zhou is employed by Zhejiang Design Institute of Water Conservancy & Hydro-Electric Power Co., Ltd. The authors declare no other conflicts of interest.
Appendix A
Table A1.
Rule-based unsafe action classification for different hazardous regions.
References
- Yang, Q.; Mei, Q.; Fan, C.; Ma, M.; Li, X. Environment-aware worker trajectory prediction using surveillance camera in modular construction facilities. Buildings 2023, 13, 1502. [Google Scholar] [CrossRef] [Scilit]
- Celik, E.; Gul, M. Hazard identification, risk assessment and control for dam construction safety using an integrated BWM and MARCOS approach under interval type-2 fuzzy sets environment. Autom. Constr. 2021, 127, 103699. [Google Scholar] [CrossRef] [Scilit]
- Jiang, H.; Lin, P.; Fan, Q.; Qiang, M. Real-Time Safety Risk Assessment Based on a Real-Time Location System for Hydropower Construction Sites. Sci. World J. 2014, 2014, 235970. [Google Scholar] [CrossRef] [Scilit]
- Shaktawat, A.; Vadhera, S. Risk management of hydropower projects for sustainable development: A review. Environ. Dev. Sustain. 2021, 23, 45–76. [Google Scholar] [CrossRef] [Scilit]
- Zhao, J.; Wang, Y.; Li, H.; Fan, J.; Cao, Y.; Li, H.; Yang, Y.; Sun, B. Analysis of Construction Safety Risk Management for Cold Region Concrete Gravity Dams Based on Fuzzy VIKOR-LEC. Buildings 2025, 15, 1981. [Google Scholar] [CrossRef] [Scilit]
- Zhou, J.-L.; Zhe-Hua, B.; Sun, Z.-Y. Safety assessment of high-risk operations in hydroelectric-project based on accidents analysis, SEM, and ANP. Math. Probl. Eng. 2013, 2013, 530198. [Google Scholar] [CrossRef] [Scilit]
- Zhang, S.; Liang, B.; Ma, Z.; Dong, F.; Wang, C.; Wang, X. Recognition method of unsafe behaviors of construction workers in hydraulic engineering. J. Hydroelectr. Eng. 2023, 42, 98–109. [Google Scholar]
- Daniel, E.I.; Oshodi, O.S.; Nwankwo, N.I.; Emuze, F.A.; Chinyio, E. The use of digital technologies in construction safety: A systematic review. Buildings 2025, 15, 1386. [Google Scholar] [CrossRef] [Scilit]
- Xun, X.; Zhang, J.; Yuan, Y. Multi-information fusion based on BIM and intuitionistic fuzzy DS evidence theory for safety risk assessment of undersea tunnel construction projects. Buildings 2022, 12, 1802. [Google Scholar] [CrossRef] [Scilit]
- Guo, K.; Zhang, L. Multisource information fusion for safety risk assessment in complex projects considering dependence and uncertainty. Risk Anal. 2025, 45, 944–967. [Google Scholar] [CrossRef] [Scilit]
- Gao, B.; Ma, Z.; Gu, J.; Han, X.; Xiang, P.; Lv, X. Fusing multi-source quality statistical data for construction risk assessment and warning based on deep learning. Knowl.-Based Syst. 2024, 284, 111223. [Google Scholar] [CrossRef] [Scilit]
- Cai, X.; Huang, J.; Peng, C. Research on construction workers’ safety risk sharing in tunneling projects based on a two-mode network: A case study of the SHANGWU tunnel. Buildings 2023, 13, 2689. [Google Scholar] [CrossRef] [Scilit]
- Wu, B.; Wan, Y.; Xu, S.; Lin, Y.; Huang, Y.; Lin, X.; Zhang, K. Research on safety evaluation of collapse risk in highway tunnel construction based on intelligent fusion. Heliyon 2024, 10, e26152. [Google Scholar] [CrossRef] [Scilit]
- Hussain, A.; Hussain, T.; Ullah, W.; Baik, S.W. Vision transformer and deep sequence learning for human activity recognition in surveillance videos. Comput. Intell. Neurosci. 2022, 2022, 3454167. [Google Scholar] [CrossRef] [Scilit]
- Kim, D.; Xiong, S. Enhancing Worker Safety: Real-Time Automated Detection of Personal Protective Equipment to Prevent Falls from Heights at Construction Sites Using Improved YOLOv8 and Edge Devices. J. Constr. Eng. Manag. 2025, 151, 04024187. [Google Scholar] [CrossRef] [Scilit]
- Seo, J.; Han, S.; Lee, S.; Kim, H. Computer vision techniques for construction safety and health monitoring. Adv. Eng. Inform. 2015, 29, 239–251. [Google Scholar] [CrossRef] [Scilit]
- Upadhyay, B.; Sankrityayan, A. YOLO V8: An improved real-time detection of safety equipment in different lighting scenarios on construction sites. Res. Sq. 2024. [Google Scholar] [CrossRef] [Scilit]
- Wang, Q.; Liu, H.; Peng, W.; Tian, C.; Li, C. A vision-based approach for detecting occluded objects in construction sites. Neural Comput. Appl. 2024, 36, 10825–10837. [Google Scholar] [CrossRef] [Scilit]
- Fasoyinu, A.A.; Azhar, S.; Sattineni, A.; Toyin, J.O. Wearable sensing devices for construction safety: Research trends, applications, challenges, and future opportunities. Autom. Constr. 2025, 179, 106424. [Google Scholar] [CrossRef] [Scilit]
- Mäkela, S.-M.; Lämsä, A.; Keränen, J.S.; Liikka, J.; Ronkainen, J.; Peltola, J.; Häikiö, J.; Järvinen, S.; Bordallo López, M. Introducing VTT-ConIot: A realistic dataset for activity recognition of construction workers using IMU devices. Sustainability 2021, 14, 220. [Google Scholar] [CrossRef] [Scilit]
- Zhao, J.; Obonyo, E.; Bilén, S.G. Wearable inertial measurement unit sensing system for musculoskeletal disorders prevention in construction. Sensors 2021, 21, 1324. [Google Scholar] [CrossRef] [Scilit]
- Yan, X.; Li, H.; Li, A.R.; Zhang, H. Wearable IMU-based real-time motion warning system for construction workers’ musculoskeletal disorders prevention. Autom. Constr. 2017, 74, 2–11. [Google Scholar] [CrossRef] [Scilit]
- Mekruksavanich, S.; Jitpattanakul, A. Construction Worker Activity Recognition Using Deep Residual Convolutional Network Based on Fused IMU Sensor Data in Internet-of-Things Environment. IoT 2025, 6, 36. [Google Scholar] [CrossRef] [Scilit]
- Tezcan, Ö.; Akcay, C.; Sari, M.; Cavus, M. Sensor-Based Automatic Recognition of Construction Worker Activities Using Deep Learning Network. Sensors 2025, 25, 3988. [Google Scholar] [CrossRef] [Scilit]
- Karatas, I.; Budak, A. Sensor-based activity recognition for construction activities on site using stacking ensemble method. Rev. Construcción 2025, 24, 235–255. [Google Scholar] [CrossRef] [Scilit]
- Chen, H.; Mao, Y.; Xu, Y.; Wang, R. The impact of wearable devices on the construction safety of building workers: A systematic review. Sustainability 2023, 15, 11165. [Google Scholar] [CrossRef] [Scilit]
- Riaz, Z.; Arslan, M.; Kiani, A.K.; Azhar, S. CoSMoS: A BIM and wireless sensor based integrated solution for worker safety in confined spaces. Autom. Constr. 2014, 45, 96–106. [Google Scholar] [CrossRef] [Scilit]
- Riaz, Z.; Parn, E.A.; Edwards, D.J.; Arslan, M.; Shen, C.; Pena-Mora, F. BIM and sensor-based data management system for construction safety monitoring. J. Eng. Des. Technol. 2017, 15, 738–753. [Google Scholar] [CrossRef] [Scilit]
- Wu, Z.; Chen, C.; Cai, Y.; Lu, C.; Wang, H.; Yu, T. BIM-based visualization research in the construction industry: A network analysis. Int. J. Environ. Res. Public Health 2019, 16, 3473. [Google Scholar] [CrossRef] [Scilit]
- Manzoor, B.; Charef, R.; Antwi-Afari, M.F.; Alotaibi, K.S.; Harirchian, E. Revolutionizing Construction Safety: Unveiling the Digital Potential of Building Information Modeling (BIM). Buildings 2025, 15, 828. [Google Scholar] [CrossRef] [Scilit]
- Pereira, F.; González García, M.d.l.N.; Poças Martins, J. BIM for Safety: Applying Real-Time Monitoring Technologies to Prevent Falls from Height in Construction. Appl. Sci. 2025, 15, 2218. [Google Scholar] [CrossRef] [Scilit]
- Afzal, F.; Khan, F.U.; Khan, A.A.; Jayasinghe, R.; Khan, N. RTLS-Enabled Bidirectional Alert System for Proximity Risk Mitigation in Tunnel Environments. Buildings 2025, 15, 2667. [Google Scholar] [CrossRef] [Scilit]
- Arslan, M.; Cruz, C.; Ginhac, D. Semantic enrichment of spatio-temporal trajectories for worker safety on construction sites. Pers. Ubiquitous Comput. 2019, 23, 749–764. [Google Scholar] [CrossRef] [Scilit]
- Duan, P.; Zhou, J.; Goh, Y.M. Spatial-temporal analysis of safety risks in trajectories of construction workers based on complex network theory. Adv. Eng. Inform. 2023, 56, 101990. [Google Scholar] [CrossRef] [Scilit]
- Wan, W.; Yan, G.; He, P.; Li, Y.; Chen, Y. A Risk Index Model for Construction Projects Based on Multi-Source Data. In Proceedings of the 2025 International Conference on Management Science and Computer Engineering, Dalian, China, 6–8 June 2025; pp. 704–715. [Google Scholar]
- Zhang, S.; Teizer, J.; Pradhananga, N.; Eastman, C.M. Workforce location tracking to model, visualize and analyze workspace requirements in building information models for construction safety planning. Autom. Constr. 2015, 60, 74–86. [Google Scholar] [CrossRef] [Scilit]
- Langdalen, H.; Abrahamsen, E.B.; Selvik, J.T. On the importance of systems thinking when using the ALARP principle for risk management. Reliab. Eng. Syst. Saf. 2020, 204, 107222. [Google Scholar] [CrossRef] [Scilit]
- JGJ 162-2008; Technical Code for Safety of Forms in Construction. China Architecture Publishing & Media Co., Ltd.: Beijing, China, 2008.
- JGJ 276-2012; Safety and Technical Specification for the Rigging and Lifting Work. China Architecture Publishing & Media Co., Ltd.: Beijing, China, 2012.
- JGJ 80-2016; Technical Code for Safety of Working at Height of Building Construction. China Architecture Publishing & Media Co., Ltd.: Beijing, China, 2016.
- GB 51210-2016; Unified Standard for Safety of Scaffold in Construction. China Architecture Publishing & Media Co., Ltd.: Beijing, China, 2016.
- Fan, L. Safety Situation Assessment of Construction Workers’ Trajectories Based on Real-Time Location Systems. Master’s Thesis, China University of Mining and Technology, Xuzhou, China, 2023. [Google Scholar]
- Feng, C. Optimized Scheduling of Concrete Placement Machinery for High Arch Dams Based on Spatiotemporal Conflict Simulation of Cable Cranes. Master’s Thesis, China Three Gorges University, Yichang, China, 2016. [Google Scholar]
- Liu, W. Research on a Construction Accident Early-Warning Mechanism Based on BIM and Positioning Technologies. Master’s Thesis, Tsinghua University, Beijing, China, 2015. [Google Scholar]
- Wang, K. Intrusion Detection for Hazardous Areas on Construction Sites Based on Binocular Stereo Vision. Master’s Thesis, Beijing University of Civil Engineering and Architecture, Beijing, China, 2023. [Google Scholar]
- Kim, D.; Yoo, T.; Tran, S.V.-T.; Lee, D.; Park, C.; Lee, D. Automated safety risk assessment framework by integrating safety regulation and 4D BIM-based rule modeling. Buildings 2024, 14, 2529. [Google Scholar] [CrossRef] [Scilit]
- Zeng, X.; Yin, H.; Li, Y. Application of modified LEC method in the large municipal bridge construction hazard evaluation. In Proceedings of the 2015 8th International Symposium on Computational Intelligence and Design (ISCID), Hangzhou, China, 12–13 December 2015; pp. 614–617. [Google Scholar]
- Zhao, T.; Xu, K.; Zhou, W. Hierarchical management of hazardous areas at construction sites. Ind. Saf. Environ. Prot. 2018, 44, 43–46. [Google Scholar]
- Konak, O.; Wegner, P.; Arnrich, B. IMU-based movement trajectory heatmaps for human activity recognition. Sensors 2020, 20, 7179. [Google Scholar] [CrossRef] [Scilit] [PubMed]
- Mekruksavanich, S.; Jitpattanakul, A. Biometric user identification based on human activity recognition using wearable sensors: An experiment using deep learning models. Electronics 2021, 10, 308. [Google Scholar] [CrossRef] [Scilit]
- Wang, J.; Chen, Y.; Hao, S.; Peng, X.; Hu, L. Deep learning for sensor-based activity recognition: A survey. Pattern Recognit. Lett. 2019, 119, 3–11. [Google Scholar] [CrossRef] [Scilit]
- Li, W.; Sun, X.; He, T.; Jiang, T. Development of a human activity recognition algorithm based on bilstm for construction workers. In Proceedings of the 2024 7th International Conference on Advanced Algorithms and Control Engineering (ICAACE), Shanghai, China, 1–3 March 2024; pp. 198–204. [Google Scholar]
- Xia, K.; Huang, J.G.; Wang, H.Y. LSTM-CNN Architecture for Human Activity Recognition. IEEE Access 2020, 8, 56855–56866. [Google Scholar] [CrossRef] [Scilit]
- Deliry, S.I.; Avdan, U. Accuracy evaluation of UAS photogrammetry and structure from motion in 3D modeling and volumetric calculations. J. Appl. Remote Sens. 2023, 17, 024515. [Google Scholar] [CrossRef] [Scilit]
- Yao, G. Research on GPS Positioning Control for High-Rise and Super High-Rise Building Projects. Ph.D. Dissertation, Chongqing University, Chongqing, China, 2002. [Google Scholar]
- Hussain, M.; O’Nils, M.; Lundgren, J.; Mousavirad, S.J. A comprehensive review on deep learning-based data fusion. IEEE Access 2024, 12, 180093–180124. [Google Scholar] [CrossRef] [Scilit]
- Li, X.; Yu, Q.; Alzahrani, B.; Barnawi, A.; Alhindi, A.; Alghazzawi, D.; Miao, Y. Data fusion for intelligent crowd monitoring and management systems: A survey. IEEE Access 2021, 9, 47069–47083. [Google Scholar] [CrossRef] [Scilit]
- Park, J.; Kim, K.; Cho, Y.K. Framework of automated construction-safety monitoring using cloud-enabled BIM and BLE mobile tracking sensors. J. Constr. Eng. Manag. 2017, 143, 05016019. [Google Scholar] [CrossRef] [Scilit]

Disclaimer/Publisher’s Note: The statements, opinions and data contained in all publications are solely those of the individual author(s) and contributor(s) and not of MDPI and/or the editor(s). MDPI and/or the editor(s) disclaim responsibility for any injury to people or property resulting from any ideas, methods, instructions or products referred to in the content. |
© 2026 by the authors. Licensee MDPI, Basel, Switzerland. This article is an open access article distributed under the terms and conditions of the Creative Commons Attribution (CC BY) license.