


Abstract
Short auditory cues in enclosed built environments (such as elevator calls, access control, navigation, and heating, ventilation, and air conditioning (HVAC) notifications) influence not only usability but also stress and perceptions of well-being in daily indoor life. However, acoustic research remains largely focused on physical properties, and the psychophysiological impact of such short auditory cues remains under-quantified. To address this gap, a neuroscience-based evaluation approach, the Acoustic User Experience and Emotion (AUEX) model, is proposed. This model integrates functional near-infrared spectroscopy (fNIRS), electrodermal activity (EDA), and the User Experience Questionnaire (UEQ). With 33 in-cabin prompt sounds as a controlled typology of short auditory cues in an enclosed setting, we set up a simulated interaction experiment with 20 participants in a driving simulator vehicle cabin to investigate the relationship between acoustic properties and cognitive load, arousal, and user experience. The results show that timbre is the key factor, which was correlated positively with overall UX (r = 0.414) and negatively with prefrontal ΔHbO (CH3: r = −0.368; l-DLPFC: r = −0.449), indicating a decrease in cognitive load and a relaxed affective state. Conversely, high-frequency signals improved pragmatic quality but increased physiological arousal, which negatively affected hedonic assessment. To facilitate the translation of evaluation results into practice, we also completed a design phase that converted the AUEX results into scenario-based parameter targets and prototype designs for functional, warning, and brand/affective cues, illustrating how evidence-based relationships can be translated into design-ready outputs for enclosed built environments. These results confirm the AUEX approach as a transferable method for designing short auditory cues for well-being and provide parameter-level implications for therapeutic and human-centered sound design in smart buildings, intelligent vehicles, and other enclosed built environments. Overall, the AUEX approach provides a transferable evaluation-to-design workflow for short auditory cues in enclosed interactive contexts; however, direct generalization from a single controlled vehicle cabin setting to real-world building environments should be validated through future field studies. Accordingly, the present findings are positioned as evidence from a controlled enclosed case rather than universal conclusions for all enclosed spaces.
1. Introduction
In recent years, architectural acoustics has broadened from noise reduction to sound experience and indoor soundscape design with a focus on comfort, restoration, and well-being [1,2]. Short auditory cues are now ubiquitous in enclosed built environments and interactive facilities, and include elevator signals, access/entry feedback, wayfinding sounds, and HVAC notifications [3]. These short auditory cues usually involve perceptual dimensions (such as timbre, pitch/frequency, and urgency cues) to convey meaning and can affect attention, subjective comfort, and psychophysiological state [4,5]. Since these perceptual processes interact with in-cabin prompt sounds, vehicle cabins can be used as a controlled environment to examine the effects of short auditory cues on affective experience and cognitive load, which has implications for indoor interactive facilities [5,6].
In everyday indoor interactions, occupants are repeatedly exposed to short auditory signals that contribute to the overall soundscape experience and its appraisal in context [7]. From a health-oriented building research perspective, well-being is shaped by repeated exposures to environmental stimuli that influence stress regulation, perceived control, and restoration [7]. In enclosed interactive contexts, brief acoustic cues can rapidly capture attention and elicit autonomic reactions because they are often designed to be salient (e.g., distinctive timbre or high-frequency components) [8]. Such salience can improve usability and safety; however, frequent or intrusive cues may also increase arousal and cognitive load, especially when they are unpredictable or difficult to interpret [8]. Over time, repeated exposure to high-arousal or cognitively demanding signals may contribute to perceived stress and reduced comfort, whereas cues designed to be informative while maintaining low intrusiveness may support calmer affective states and a more positive sense of well-being [9]. In this sense, the relevance of short auditory cues to mental health is discussed in terms of everyday stress and perceived well-being rather than clinical diagnosis, motivating the need for evaluation approaches that jointly quantify acoustic properties, subjective experience, and psychophysiological responses [10].
In-cabin prompt sounds serve diverse functions in human–machine interaction, including feedback, warnings, and affective/brand communication. The growing integration of intelligent cockpit concepts has further complicated in-cabin audio systems, creating numerous challenges in testing and design. In acoustic engineering, vehicle cabins are routinely modeled for sound field analysis and control, making them controllable interior settings for evaluating short auditory cues [11]. Indoor soundscape studies have shown that occupants’ comfort- and well-being-related appraisals in enclosed interiors can be systematically linked to acoustic/perceptual attributes, and that such relationships can be studied in controlled settings to inform design. Accordingly, the simulator cabin is treated as a controlled “enclosed interactive” case, so that cue-level findings can provide testable design hypotheses for other cue-driven enclosed building contexts (e.g., elevators, access control, wayfinding confirmation, and HVAC/equipment notifications) [12,13,14,15]. Previous research has demonstrated that prompt sounds have a psychological, physiological, cognitive, and behavioral impact on users [16]. Well-designed auditory cues can improve information recognition and response efficiency under time pressure [17,18,19,20]. Market research and user experience surveys confirm that prompt sounds strongly influence user perception [21,22,23,24]. Industry practice also suggests that auditory cues contribute to both functional communication and affective/brand-related experience [25].
In theoretical research, scholars have noted that sound itself carries independent symbolic meaning. For example, the music of an ice cream truck can trigger brand associations without visual cues [26]. Moreover, adjusting acoustic properties such as frequency and timbre can create specific emotional atmospheres [27]. These findings provide theoretical support for the critical role of prompt sounds in enhancing brand value and emotional connections with users, offering an interdisciplinary foundation for further studies. Accordingly, evaluating short auditory cues is important not only for functional effectiveness but also for minimizing cognitive burden and supporting positive affective experience during interaction.
Currently, most studies on prompt sounds are concentrated in the engineering domain, focusing on functional aspects such as acoustic design, noise control, and optimization [28,29,30]. These studies typically emphasize physical parameters and recognizability to ensure efficient information transmission. However, research on sound quality and hedonic attributes remains relatively limited. As a result, many prompt sounds are functionally effective but fail to achieve deeper alignment with brand identity and users’ emotional needs.
User experience (UX) research can provide new perspectives and methods for prompt sound design, enabling a more comprehensive evaluation of its effects on user emotions and experiences. Previous studies have shown that UX research not only improves the pragmatic quality of prompt sounds but also enhances their hedonic attributes, making them more consistent with brand identity and user expectations [31,32,33].
Although UX research can significantly increase user satisfaction and brand loyalty, it faces several challenges. Traditional UX methods rely on post-task self-report, which is vulnerable to recall bias and rating-scale interpretation issues [34,35].
To address these limitations, researchers increasingly integrate UX with methods from psychology and cognitive science, including psychophysiological measurement [36]. For example, psychophysiological studies have been applied to investigate and document user experience during human–computer interaction. By leveraging the real-time characteristics of psychophysiological data, researchers can gain deeper insights into participants’ mental states [37]. However, such approaches place higher demands on the interdisciplinary expertise of research teams.
Nevertheless, with technological advances, the application of physiological monitoring has gradually addressed many limitations of traditional subjective evaluations, opening new possibilities for deeper UX research. Psychophysiological measures, such as functional near-infrared spectroscopy (fNIRS) and electrodermal activity (EDA), have been applied to assess cognitive load, emotional arousal, and emotion regulation during interaction [37,38,39].
Furthermore, physiological monitoring enables more fine-grained UX research. By integrating physiological data with questionnaire-based results, researchers can build more accurate UX models and identify the key factors that influence user satisfaction. In this study, analyzing users’ physiological responses to different prompt sounds enables designers to better understand which sound design elements evoke positive emotions and, in turn, refine and optimize prompt sounds more effectively.
In summary, applying physiological monitoring in UX research not only improves the scientific rigor and objectivity of evaluation but also equips designers with new tools and perspectives to create products and services that align more closely with users’ emotional needs. Because short auditory cues are often encountered repeatedly during interaction, we focus on sustained cognitive load and emotion regulation rather than transient onset-evoked responses. fNIRS over the prefrontal cortex provides an interpretable index of such sustained regulatory demands, complementing peripheral arousal captured by EDA.
In neuroscience-related research, both EEG and fNIRS are compact, non-invasive, and portable neuroimaging tools. Although EEG offers superior temporal resolution (on the millisecond scale) compared with fNIRS (typically <10 Hz), EEG recordings in the present interactive scenario can be more vulnerable to motion artifacts and facial/neck electromyographic activity. In contrast, fNIRS provides better spatial specificity for superficial cortical regions and is often more robust in simulator-based or naturalistic seated interactions, enabling higher-quality recordings of cortical functional activity in our setting [40]. Although fNIRS does not achieve the spatial resolution of fMRI, both methods reflect hemodynamic changes associated with neural activity. For the prefrontal cortex in particular, relatively limited hair coverage can facilitate optode–scalp contact and improve signal stability, allowing fNIRS to capture prefrontal activity with sufficient reliability [41]. Therefore, fNIRS was selected to capture the sustained regulatory demands elicited by repeatedly encountered short cues in a simulator-based interactive environment, while EEG will be used in future work to examine rapid electrophysiological dynamics (e.g., event-related potentials).
Building on prior research, this study proposes the AUEX model (Acoustic User Experience and Emotion Model, Figure 1) to enhance the comprehensiveness of prompt sound evaluation while mitigating the biases and memory errors that commonly affect subjective methods. The AUEX model emphasizes the integration of acoustics, user experience, and emotion, aiming to evaluate the overall impact of prompt sounds on users. By analyzing the relationship between the physical attributes of prompt sounds and users’ emotional states, the model provides a more holistic framework for prompt sound assessment.
Figure 1.
The structure of the Acoustic User Experience and Emotion (AUEX) model.
As illustrated in Figure 1, the AUEX framework integrates three complementary components—Acoustic (A), User Experience (UX), and Emotion (E)—through a dual-track structure consisting of a Quantitative Plan and a Qualitative analysis track, aiming to reveal “Paths to Enhance Emotional Value”. In the Quantitative Plan, “A” represents cue-level acoustic feature characterization (e.g., frequency-/pitch-related attributes, timbre, and rhythmic structure), “UX” captures users’ multidimensional appraisal (e.g., pragmatic and hedonic qualities), and “E” captures affective and regulatory states via physiological monitoring; EDA indexes autonomic arousal and prefrontal fNIRS (ΔHbO) indexes sustained cognitive-control and emotion-regulation demands under repeated exposure. Joint analysis across A–UX–E enables the triangulation of convergent and divergent patterns, thereby identifying design-relevant trade-offs (e.g., recognizability/urgency versus intrusiveness) and translating empirical relationships into scenario-based parameter targets. In parallel, the Qualitative analysis track uses post-task interviews to interpret why certain cues are perceived as emotionally valuable (or intrusive), to clarify meaning-making and context dependence, and to summarize themes that complement quantitative findings; details of the interview protocol and thematic results are provided in Appendix C and Appendix D. Together, the quantitative and qualitative evidence supports the central goal of AUEX—transforming evaluation outputs into design-oriented knowledge for short auditory cues in enclosed interactive environments.
Based on this integration logic, this study addresses the following research questions:
RQ1. How do cue-level acoustic attributes relate to subjective UX appraisal (e.g., pragmatic and hedonic dimensions) in a controlled enclosed interaction setting?
RQ2. How do the same acoustic attributes relate to psychophysiological responses, including autonomic arousal (EDA) and sustained prefrontal activation associated with regulatory demands (fNIRS ΔHbO), during repeated cue exposure?
RQ3. What themes emerge from post-task interviews regarding perceived emotional value, comfort, and intrusiveness of short cues, and how do these themes help explain quantitative patterns?
RQ4. When quantitative evidence (A–UX–E) and qualitative themes are integrated within AUEX, what design-relevant parameter targets and scenario-based hypotheses can be derived for cue-driven enclosed built environments (e.g., elevators, access control, wayfinding confirmation, and service notifications)?
2. Methods
2.1. Physical Attributes of Prompt Sounds
2.1.1. Functional Classification of Prompt Sounds
In both academic research and industry practice, prompt sounds are generally divided into three categories: functional sounds, warning sounds, and brand-emotional sounds. This classification has been widely adopted and supported in multiple studies [42,43].
Functional sounds include turn signals, hazard lights, gear shifts, and seat adjustments. Their primary role is to provide feedback, confirm the user’s actions, and enhance vehicle operability.
Warning sounds are critical to automotive safety systems. They include seatbelt alerts, overspeed warnings, lane departure warnings, collision alerts, reversing alarms, and fault notifications. Unlike functional sounds, warning sounds are typically shorter, sharper, and more prominent.
Brand-emotional sounds include start-up tones, sport mode switching sounds, welcome tones, and ambient sounds. These focus on pleasure and brand personalization. In recent years, automotive brands have increasingly invested in the development of brand-emotional sounds, often collaborating with artists to create exclusive brand signatures [44]. According to [45], effective sound design can achieve goals such as brand recognition, attribute identification, enhanced sensory experience, and the elicitation of positive emotions. Compared with purely visual advertising, the creative use of sound can produce a significantly higher impact with less effort.
2.1.2. Physical Attributes of Prompt Sounds
The physical attributes of prompt sounds mainly include the timbre, pitch, frequency, and beats per minute (BPM) [16]. Together, these attributes shape the fundamental sound quality and expressive characteristics of prompt sounds.
The timbre reflects how people perceive the qualitative characteristics of a sound. It is determined by both the properties of the sound source and its formants. Variations in these factors can make a sound appear soft, hard, powerful, or cool [16].
Pitch refers to the perceived height of a sound and is directly proportional to its frequency. As the pitch increases, the frequency also rises, producing sharper and more piercing sounds. Conversely, as the pitch decreases, the frequency lowers, resulting in deeper and heavier sounds. Sharp sounds have been shown to stimulate the brain to release cortisol, accelerating the heart rate, and triggering the stress responses [46].
Beats per minute (BPM) indicates the number of beats in one minute. For example, 120 BPM corresponds to one beat every half second. The tempo of a piece of music strongly influences its potential effect on stress regulation. Tempos range from very slow (35–45 BPM), which promotes deeper breathing, lower blood pressure, and reduced heart rate, to very fast (up to 200 BPM), which produces the opposite effect [47].
2.1.3. Selection of Experimental Samples
To construct an ecologically valid stimulus set, we compiled prompt sounds from commercially available vehicles spanning multiple market segments. Sounds were obtained via a combination of online sources and in situ recordings, then denoised and standardized. To reduce redundancy, acoustically similar samples (timbre/pitch/frequency/BPM) were removed, resulting in 33 distinct cues (Appendix A).
2.2. User Experience Research Methods
A key element in user experience (UX) research is evaluation, which refers to the application of methods and tools aimed at assessing users’ perceptions of a system or product. UX evaluation methods often include standardized questionnaires in which end users describe their impressions of a product’s usability, clarity, complexity, originality, and other attributes. Among these instruments, the User Experience Questionnaire (UEQ), proposed by Laugwitz et al. in 2008 [48], has been recognized as one of the most effective tools for evaluating UX. Since 2017, its use has far exceeded that of other standardized questionnaires [49].
The advantage of the UEQ lies in its ability to combine well-known product characteristics, such as efficiency and effectiveness, with additional dimensions, such as esthetics and enjoyment of use. Standards such as efficiency and effectiveness are categorized as Pragmatic Quality, while esthetics and enjoyment are classified as Hedonic Quality (see Figure 2).
Figure 2.
Structure of the UEQ.
In terms of methodology, the UEQ is based on the semantic differential scale, which employs pairs of opposite adjectives (see Figure 3). Each pair describes a specific attribute of the product. A seven-point scale, represented by circles between the two adjectives, is used for evaluation. Participants rate the product by selecting the point that best reflects the degree of agreement with the given attribute.
Figure 3.
Example of the UEQ usage.
2.3. Emotions and Physiological Indicators
Integrating emotion research into UX evaluation can significantly enhance both its dimensions and methodologies. Emotion research provides real-time affective data through physiological indicators such as the blood oxygen concentration measured by functional near-infrared spectroscopy (fNIRS) and electrodermal activity (EDA) signals. These data capture users’ emotional changes during product interaction, thereby compensating for the latency of traditional UX evaluation methods.
Variations in physiological signals often accompany emotional changes in humans. Compared with facial expressions or vocal cues, physiological signals more reliably reflect genuine emotional states, as facial and vocal expressions are less nuanced and more easily disguised [50]. For this reason, physiological signals have become an essential input for affective computing. In the context of emotion measurement, researchers have found that both blood oxygenation levels measured by fNIRS and EDA signals serve as important sources of information about users’ emotional states.
2.3.1. Functional Near-Infrared Spectroscopy (fNIRS)
fNIRS is based on the correlation between neural activity and cerebral blood flow [51]. It emits near-infrared light (650–950 nm) through the scalp and measures changes in oxygenated hemoglobin (HbO) and deoxygenated hemoglobin (HbR), thereby indirectly reflecting brain activity. The core principle is neurovascular coupling: when neuronal activity increases, local HbO levels rise, while HbR levels decrease [52].
Among emotion-related indicators, the prefrontal cortex (PFC) has been a significant focus of research due to its role in memory, cognition, and emotion [53]. Prior studies using fNIRS have shown that changes in HbO concentration in the PFC are significantly associated with emotional states [54]. Pleasant emotions are typically accompanied by reduced HbO in the left dorsolateral prefrontal cortex (l-DLPFC). In contrast, unpleasant emotions are associated with increased HbO in the bilateral ventrolateral prefrontal cortex (b-VLPFC). These two indicators are independent and should not be regarded as directly related [55]. This phenomenon has also been confirmed by functional magnetic resonance imaging (fMRI) [56], making changes in HbO concentration in specific PFC regions a standard paradigm in fNIRS-based emotion research [57]. In contrast, HbR concentration changes have shown weaker and less specific associations with emotion [58,59]. Therefore, this study focuses exclusively on HbO concentration changes in the l-DLPFC and b-VLPFC as the primary research indicators.
In this study, the l-DLPFC was monitored using channels CH3 and CH4 in the left hemisphere, while the b-VLPFC was monitored using channels CH1 and CH3 in the left hemisphere and CH6 in the right hemisphere. Based on these, two regions of interest (ROIs) were defined (Figure 4). Other fNIRS channels also provide some PFC-related information but lack strong associations with specific emotional states; thus, they were not prioritized.
Figure 4.
Schematic diagram of fNIRS channels in the PFC.
To link the PFC hemodynamic changes with the emotional responses during the experiment, the mean change in HbO concentration (ΔHbO) was calculated for the selected ROIs. As shown in Equation (1), HbO0 denotes the mean HbO concentration during the resting state, while HbOt represents the HbO concentration at a given time t during the experiment. The change at time t (ΔHbOt) was calculated as follows:
The mean ΔHbO over the experimental period was then computed by summing all ΔHbOt values across n time points and dividing by n [60,61].
2.3.2. Electrodermal Activity (EDA)
Electrodermal activity (EDA) is highly effective for emotion recognition. As one of the most sensitive indicators of emotional feedback, it originates from the autonomic activation of sweat glands. EDA is closely associated with emotion, arousal, and attention and is one of the most widely applied measures in psychophysiological research [62].
Regarding physiological parameters, the skin conductance level (SCL) is the most commonly used EDA index. By applying a small constant voltage between two points on the skin, the electrical conductivity of the skin can be measured. Since the nervous system regulates EDA, SCL is linearly correlated with the arousal level [63]. Changes in the SCL reflect emotional experiences over a sustained period (e.g., pleasant and sad emotions tend to increase skin conductance levels).
The skin conductance response (SCR) is a highly sensitive index for assessing emotional arousal. Governed by the sympathetic nervous system, the SCR reflects the activation of sweat gland secretion. In most studies, the change in SCR (i.e., the difference between the experimental values and baseline values) is used as an indicator of physiological arousal [64]. In this study, since the prompt sounds are short-term stimuli, SCL—typically used to measure long-term baseline changes in skin activity—was not prioritized. Instead, SCR was selected as the primary evaluation indicator.
2.3.3. Physiological Signal Monitoring Equipment
This experiment utilized the ErgoLAB Human–Machine Environment Synchronization Platform (Version 3.0) and the wearable EDA module for skin conductance analysis, both of which were provided by Kingfar International Inc. (Beijing, China). In addition, functional near-infrared spectroscopy (fNIRS) data were collected using the NirsCute-3000C system supplied by Huichuang Medical Equipment Co., Ltd. (Beijing, China). Data acquisition was performed with the NirSmart platform, and data analysis was carried out using the NirSpark platform.
2.4. Prompt Sound Evaluation Experiment
In user-centered perceptual evaluation, the typical number of participants ranges from 10 to 30 [65,66,67]. After reviewing recent emotion evaluation studies [68,69,70], we recruited 20 university students as participants in this experiment. To ensure data quality and consistency across subjective and physiological measures, data from four participants were excluded due to poor sensor contact and/or unusable signal quality; therefore, all subsequent analyses were conducted on a final sample of n = 16 (11 males (68.8%) and 5 females (31.3%)). Participants were aged M = 21.63 years (SD = 2.00, range = 19–25). We chose those groups for their distinctive characteristics: they had generally obtained driving licenses only recently, were highly enthusiastic about driving, and actively engaged with automotive news and driving experiences. For this study, such participants were more likely to express clear preferences and attitudes toward prompt sounds from different brands.
All participants were required to have at least one year of driving experience. The inclusion criteria specified normal or corrected-to-normal vision, normal color perception, normal hearing in both ears, and no history of psychiatric disorders. To ensure accurate data collection, participants were instructed to refrain from alcohol consumption, caffeine intake, and sleep deprivation for 24 h prior to the experiment. This study was approved by the Human Research Ethics Committee of Shantou University (Approval No.: STU20250714). All participants provided written informed consent after being informed of the study’s purpose and potential risks. Data were anonymized to protect privacy, and participants were free to withdraw at any time without penalty. For physiological analyses (fNIRS/EDA), 4 out of 20 participants were excluded due to poor sensor contact and/or unusable signal quality, resulting in a final physiological sample of n = 16.
The experimental setup and conditions are shown in Figure 5. The driving simulator was placed at the center of the laboratory, with a leveled base, adjustable seat, and gearshift device. An INNOCN 4K monitor (3840 × 1080 resolution) was positioned 1.2 m in front of the participant, aligned with the seated eye level. We installed a light-absorbing curtain behind the simulator to enhance the immersion experience. Surrounding JBL speakers were connected to a computer and adjusted for channel balance to reproduce realistic environmental sound effects. We connected a Dell laptop to the simulator and physiological monitoring devices (fNIRS/EDA). We initialized data acquisition parameters (e.g., sampling frequency, gain) via the ErgoLAB platform to ensure precise physiological recordings.
Figure 5.
Experimental setup.
To improve the accuracy and validity of the experimental data on the experience of in-cabin prompt sounds, we used Unity3D (2021.3.0f1) to create a virtual simulation interactive interface. We used a Logitech G29 steering wheel to allow the participants to operate the device through the interactive interface. For example, participants could use buttons on the steering wheel to select scenes, sound effects, etc. The participants interacted with the interface as follows: select a scene, select a sound effect, start the task prompt, end the task, and proceed to the next level, as shown in Figure 6 and Figure 7 below.
Figure 6.
Virtual simulation interface design (UI). (A) Start screen; (B) Select Interface.
Figure 7.
Task interaction interface screenshot. (A) Task Start Screen; (B) Task completion screen.
Raw EDA signals were visually inspected in ErgoLAB. Trials with signal loss or incomplete recordings were excluded. After participant-level quality control (final n = 16), no additional EDA trials were excluded; thus, 0/528 trials were removed (0.0%), and all retained participants contributed valid trials for all 33 cues (valid trials per participant: mean ± SD = 33 ± 0, range = 33–33). The remaining signals were smoothed using a Gaussian kernel and low-pass filtered (5 Hz). For each cue, SCR amplitude (µS) was extracted using the built-in peak-detection algorithm (sensitivity: high; max rise time: 4 s; max half-decay time: 4 s; minimum amplitude: 0.03 µS). Baseline-corrected SCR was computed by subtracting the mean SCR during a 30 s resting baseline from cue-evoked SCR.
After acquiring the fNIRS data with the portable NirSmart functional near-infrared spectroscopy system, we first visually inspected the raw time-series signals to verify channel integrity and remove obvious noise and motion artifacts. All channels passed the predefined signal-quality check; therefore, no fNIRS channels were excluded (0% channel exclusion). Following participant-level quality control, fNIRS analyses were conducted on n = 16 participants, and all retained participants contributed valid trials for all 33 cues (mean ± SD = 33 ± 0, range = 33–33). The fNIRS data were then temporally aligned with the EDA signals and behavioral video recordings using the corresponding timestamps to determine the key frames marking stimulus onset and offset. Subsequently, the raw light intensity data was imported into the Nirspark (version 3.0) software running in the MATLAB environment (R2021b). Based on the markers defined in keyframes, we extracted data for the task cycle at least 10 s before and after each stimulus. We applied amplitude threshold (amp_thr = 0.5) and standard deviation threshold (STD_thr = 6) for signal quality control, and used a 0.01–0.2 Hz bandpass filter to remove low-frequency drift and high-frequency noise [52]. The optical intensity, I(t), was then converted into changes in optical density (ΔOD) via a logarithmic transformation (Equation (2)). With the differential pathlength factor (DPF) set to 6, the ΔOD signals at the three wavelengths (λ = 730, 808, 850 nm) were entered into the modified Beer–Lambert law (Equation (3)) to obtain changes in oxygenated and deoxygenated hemoglobin (Δ[HbO] and Δ[HbR]) [71,72]. Finally, using markers, the hemoglobin concentration time series was divided into task-related windows from 10 s before the start of the stimulus to 15 s after the start of the stimulus. The data from 10 s before the start of the stimulus to the start itself and from the stimulus offset to 5 s after the offset were used for baseline correction. Event-related averaging was performed on each task segment and the channel signals were averaged within each ROI to obtain a representative hemodynamic response for that ROI [73].
To validate the applicability of the AUEX evaluation model for in-cabin prompt sounds, we evaluated prompt sounds from high-selling vehicle models with the following objectives: (i) examine the dimensional correlations of the model; (ii) assess the overall effectiveness of prompt sounds; (iii) identify cross-sensory synergy opportunities; (iv) and confirm the brand’s emotional impact.
The experiment was carried out in the following steps (see Figure 8):
Figure 8.
Experimental procedure.
- Participants arrived at the laboratory and signed informed consent forms.
- Research assistants helped participants to put on the fNIRS and EDA monitoring devices.
- The experiment was introduced, and the participants received training.
- Before the experiment began, the experimental assistant collected 2 min of baseline data from the participants and simultaneously started recording the time for later marking.
- The experimental tasks were conducted in simulated driving scenarios. Each auditory cue was presented for 5 s, followed by a brief cognitive–emotional processing period before participants completed the questionnaire. To control for order effects and fatigue, stimulus presentation was randomized across participants using a pseudo-random sequence, short rest breaks were provided between blocks, and participants were allowed to pause the experiment when needed.
- Upon completion of all tasks, the participants were debriefed and dismissed.
To analyze the impact of prompt sounds on user experience, we processed the data using SPSS statistical software (version 26.0). First, we conducted descriptive statistics on the collected data. Then, we performed analysis of variance (ANOVA), using the three functional categories of in-cabin prompt sounds as grouping variables, to examine whether significant differences existed among physical attributes, UX measures, and physiological indicators. The one-way ANOVA was conducted at the sound-cue level (N = 33 cues). For each cue, participant-level values (n = 20 for UEQ ratings; n = 16 for physiological indicators after quality control) were first averaged to obtain a single cue-level estimate, and these cue-level estimates were then compared across cue categories (Functional, Warning, and Brand/Affective). Finally, we conducted a correlation analysis (Spearman correlation coefficients) to investigate the relationships among the physical attributes of prompt sounds, user experience ratings, and physiological responses.
2.5. Design Translation Study (Interview-Based Requirement Elicitation and Parameter Mapping)
To reduce user stress and promote mental health through application design, we translated AUEX research findings into actionable guidelines for creating concise, wellness-enhancing acoustic cues in enclosed environments.
We divided the audio materials into two groups: traditional musical instruments and regular prompts. Specifically, these included the warning prompts of the guzheng (high-frequency short notes), the vehicle distance reminders of the bamboo flute (continuous long notes), the feedback sounds of the chime bell system (low-frequency resonant timbre), an electronic buzzer (warning), piano chords (status feedback), and short synthesizer sounds (system interaction).
We played traditional instrument prompts in pairs with regular prompts (e.g., a guzheng warning sound vs. an electronic buzzer sound), with a 5-s interval between each pair. We also added simulated background noise from a driving scenario (e.g., urban road sounds) to enhance realism.
During the interview phase, we invited 10 car owners aged 20–50 with 1–15 years of driving experience. We conducted semi-structured in-depth interviews combined with focus group discussions (5 people per group), using a virtual simulation system to play sound effects in real time and record feedback. Participants experienced in-cabin prompt sounds (including conventional electronic cues and culturally themed “Chinese-style” cues) under controlled intervals and contextual framing, and then provided immediate verbal feedback.
We structured our interview questions around three dimensions consistent with the design process: timbre, context, and emotion/culture (see Appendix C for details). The timbre dimension focuses on the efficiency of different timbres in conveying information in complex environments. The context dimension explores the adaptation of acoustic environments and interaction needs in various scenarios. The emotion/culture dimension analyzes whether sound categories with cultural attributes can effectively alleviate participants’ emotional stress.
All interviews were audio-recorded and summarized into clear design requirements. To make the derivation of these requirements transparent, we applied a structured thematic analysis to the interview notes. Recordings were summarized into anonymized text and segmented into meaning units (one evaluative idea per unit). We then coded the units using a hybrid approach: a deductive frame aligned with the three interview dimensions (timbre, context, and emotion/culture; Appendix C) combined with inductive open codes capturing recurring patterns (e.g., intrusiveness, recognizability, and context dependence). Codes were iteratively refined into a codebook and clustered into sub-themes, which were then consolidated into the three convergent requirement themes reported in Section 3.5. Appendix D documents the code-to-theme mapping with paraphrased exemplar statements to support traceability.
We then translated these requirements into practical parameter guidelines that link each usage scenario to a small set of adjustable sound parameters. Specifically, we adjusted dominant frequency range, pitch contour, duration, repetition rate, and loudness, and selected appropriate sound sources/timbres (e.g., softer, instrument-like timbres for comfort-oriented cues; sharper high-frequency components for urgent cues). These guidelines were used to build prototype sounds and to ensure that each design change could be explained by either the AUEX findings or the interview feedback.
Sound materials were prepared using multiple sources (electronic simulations, online libraries, and professional recordings when necessary), followed by post-processing in Adobe Audition. Processing included frequency/pitch adjustment, tempo shaping, noise reduction, and loudness normalization to produce a coherent prototype set for design validation.
3. Results
All physiological and subjective results are reported with respect to the cognitive–emotional processing phase defined in each trial. All analyses are based on the final sample of n = 16 participants after quality control (total trials = 16 × 33 = 528; 0/528 trials excluded).
3.1. Differential Analysis
Acoustic Features
As shown in Table 1, prompt sounds exhibited significant group differences in frequency (F = 4.459, p = 0.020, η2 = 0.229). Post hoc comparisons indicated that functional sounds > warning sounds and functional sounds > brand sounds. The functional group also showed the most significant standard deviation (SD = 1224.22), suggesting wide variability in frequency and the possible presence of extremely high-frequency samples. Since higher frequencies generally capture attention more easily, these results imply that functional sounds may have greater perceptual salience.
Table 1.
Acoustic characteristics of in-cabin prompt sounds.
In terms of the BPM, which may affect the urgency and emotional response, no significant differences were observed between functional and warning sounds (F = 0.188, p = 0.669, η2 = 0.009). Higher BPM values typically convey stronger urgency in warning signals. However, in this study, the brand sounds were one-time events that generally did not rely on rhythm; therefore, the BPM was not a design parameter for them.
For pitch, the functional sounds recorded the highest values (73.50 ± 20.61), approximately 30% higher than those of warning (56.43 ± 16.44) and brand sounds (57.55 ± 11.29). This difference approached statistical significance (F = 3.234, p = 0.053, η2 = 0.146).
For timbre, no significant group differences were found (F = 0.709, p = 0.500, η2 = 0.045). However, brand sounds displayed the smallest standard deviation (SD = 1.40), indicating relatively consistent timbre design within this category.
3.2. User Experience Evaluation
The user experience (UX) pragmatic quality scores reflected participants’ evaluations of the practical aspects of using a product or service (Figure 9). These scores helped us to assess how well the prompt sounds met the user needs and expectations. In terms of the prompt sound performance, the scores indicated users’ judgments of the usability, efficiency, functionality, error rate, and ease of learning. The results showed that the functional sounds had a mean pragmatic quality score of (0.57 ± 0.33), slightly higher than the warning sounds (0.49 ± 0.37) and brand sounds (0.47 ± 0.22). However, we found that the differences between the three categories were not significant (F = 0.231, p = 0.795, η2 = 0.015), indicating that all sound types had comparable effects on usability.
Figure 9.
User experience evaluation results for in-cabin prompt sounds. Notes: “*” indicates p < 0.05, “**” indicates p < 0.01, and “ns” indicates no statistically significant difference.
In contrast, we observed significant differences in hedonic quality and overall UX scores among sound categories. Specifically, the functional sounds recorded a hedonic quality score of (−0.45 ± 0.24), which was significantly lower than the warning (0.19 ± 0.33) and brand sounds (0.21 ± 0.38) at the 0.01 level (F = 11.807, p < 0.001, η2 = 0.440). The hedonic quality scores reflect the degree of enjoyment and emotional experience associated with using a product or service, focusing on satisfaction at both affective and sensory levels.
By comparing the relatively high pragmatic scores and acoustic features (higher frequency and pitch) of functional sounds, we inferred that they successfully conveyed functional requirements. However, their delivery method may have been perceived as harsh, leading users to dislike them. Regarding the overall UX scores, we found that the functional sounds were also significantly lower than the warning and brand sounds (F = 4.368, p = 0.022, η2 = 0.226).
3.3. Physiological Indicators
As shown in Figure 10, we found that the SCR values did not differ significantly across prompt sound categories (F = 2.744, p = 0.080, η2 = 0.155). However, the p-value of 0.08 showed a trend towards significance, suggesting the potential presence of a practical effect. The mean SCR for functional sounds was 0.12 (±0.24), higher than that for warning sounds (0.04 ± 0.11) and brand sounds (−0.03 ± 0.06). Since the SCR is closely related to physiological arousal, these results indicate that the functional sounds elicited slightly higher arousal than the other two categories. Combined with their higher frequency and pitch, we inferred that the acoustic features of prompt sounds were associated with participants’ physiological responses. Descriptive statistics for SCR are provided in Appendix B for transparency.
Figure 10.
Boxplots and scatter distributions of physiological indicators for functional, warning, and brand prompt sounds.
Regarding the fNIRS data, we examined the mean ΔHbO values in different prefrontal cortex (PFC) regions (l-DLPFC and b-VLPFC) and their corresponding left and right hemisphere channels (CH3, CH4, CH1, CH6). These values were compared using ANOVA. The results showed that there were no statistically significant differences among categories. However, the l-DLPFC result yielded a p-value of 0.084, which approached significance (p < 0.1). This suggests that prompt sounds may exert a practical influence on mean ΔHbO levels in the l-DLPFC.
Since a reduction in HbO in the l-DLPFC is associated with pleasant emotional states, we observed that warning (0.011 ± 0.023) and brand sounds (0.018 ± 0.021) produced lower ΔHbO values compared to functional sounds (0.033 ± 0.019). This indicates that participants experienced greater pleasure with warning and brand sounds than with functional sounds. When combined with the lower hedonic quality score of functional sounds (−0.45 ± 0.24), these findings help explain the low subjective ratings for functional sounds. Detailed mean ± SD values for ΔHbO signals are provided in Appendix B.
3.4. Correlation Analysis
3.4.1. Relationship Between Acoustic Attributes and User Experience
Table 2 presents the Spearman correlation coefficients between the acoustic attributes and subjective evaluations. We analyzed the relationships between the timbre, frequency, BPM, and pitch and their impact on the pragmatic quality, hedonic quality, and overall UX scores. This analysis enabled us to gain a deeper understanding of how the acoustic attributes of automotive prompts influence user experience.
Table 2.
Correlation analysis between acoustic attributes and user experience.
The results showed that the timbre was positively correlated with all UX indicators and significantly correlated with the overall UX score (p < 0.05). These findings suggest that when the timbre shifts from sharp and bright to softer and deeper, participants are more likely to provide higher subjective ratings.
3.4.2. Relationship Between Acoustic Attributes and Physiological Indicators
Figure 11 presents the Spearman correlation coefficients between acoustic attributes and physiological indicators. We found that the timbre showed significant correlations with several physiological measures, particularly the fNIRS indicators.
Figure 11.
Correlation analysis between acoustic attributes and physiological indicators. Notes: “*” indicates p < 0.05, “**” indicates p < 0.01.
According to Brodmann’s functional brain regions, channel CH3 is located in the left frontal lobe areas 44–45, corresponding to the bilateral ventrolateral prefrontal cortex (b-VLPFC), which is closely related to emotional regulation, including the processing of affective sound features [74]. By analyzing the mean ΔHbO in this region, we were able to link timbre with participants’ emotions and general sound preferences from a physiological perspective. The results showed that the timbre was negatively correlated with CH3 mean ΔHbO (r = −0.368, p < 0.05). This suggests that softer and deeper prompt sounds reduce the cognitive load in the brain, ease the burden of emotional regulation in the b-VLPFC, and consequently provide a more relaxed emotional experience.
In addition, the timbre exhibited a significant negative correlation with the mean ΔHbO in the l-DLPFC (r = −0.449, p < 0.01). These results indicate that when timbre shifts toward a deeper tone, the ΔHbO levels in this region decrease in response to auditory stimuli, thereby evoking pleasant emotions. This finding is consistent with the subjective evaluation results, which showed a positive correlation between the timbre (from sharp to deep) and total UX score. Together, these findings demonstrate that prompt sounds with a softer and deeper timbre are more effective in eliciting positive emotions and maintaining a pleasant state in participants.
3.4.3. Relationship Between User Experience and Physiological Indicators
Figure 12 presents the Spearman correlation coefficients between the UX scores and physiological indicators. We found that the pragmatic quality was significantly and positively correlated with the SCR. Based on this result, we confirmed that during the UX process of different prompt sounds, pragmatic considerations were more closely related to instantaneous auditory stimulation. In other words, high-frequency and high-pitch sounds elevated physiological arousal, likely because such features attracted users’ attention or triggered a state of alertness. As a result, we observed that users rated these sounds higher in pragmatic quality. However, the pragmatic quality also showed a negative trend with the total UX score, which was consistent with other physiological results. This suggests that softer and deeper timbres were associated with higher overall UX scores, which are less tied to initial intense stimulation but more related to longer-term experiential feedback.
Figure 12.
Correlation analysis between user experience and physiological indicators. Notes: “*” indicates p < 0.05.
For hedonic quality, we found no significant correlations with physiological indicators. This result indicates that users’ hedonic judgments of prompt sounds were shaped more by subjective perception and personal experience than by direct physiological responses.
Regarding the fNIRS data, we observed that CH1 (r = −0.388, p < 0.05) and CH4 (r = −0.370, p < 0.05) were negatively correlated with the pragmatic quality. Other channels also showed negative correlations with HbO concentrations. These findings suggest that users rated prompt sounds with lower cognitive load in the brain as having higher pragmatic quality. This may reflect improved information recognition efficiency, which is often associated with pleasant emotions. Ultimately, this pattern was also reflected in the correlation trends between the fNIRS channels and overall UX scores.
In the prefrontal ROI analysis, we found that the l-DLPFC was significantly correlated with total UX score (r = −0.388, p < 0.05). This negative correlation corresponded with the strong relationship between timbre and both variables. These results demonstrate that softer and deeper timbres were more strongly associated with pleasant emotions, which in turn led to higher total UX scores for prompt sounds with these acoustic characteristics. These relationships between acoustic attributes, emotional responses, and cognitive load suggest transferable principles for designing auditory cues in smart indoor environments and other enclosed architectural spaces.
3.5. Design Translation Outputs
The thematic analysis of the interview data produced three convergent requirement themes: timbre, context, and emotion/culture (see Appendix D for details). These themes were then translated into scenario-based parameter targets to guide prototyping (Table 3; Appendix E).
Table 3.
Representative scenario-based parameter settings derived from design translation.
Based on the interview results, in the timbre dimension, in-cabin prompt sounds design should optimize acoustic parameters—combining high-frequency, short staccato scales (e.g., guzheng overtones at 2000–4000 Hz superimposed with a 0.05 s electronic pulse) with low-frequency resonant timbres (e.g., bianzhong with a 50–200 Hz fundamental component accounting for ≥60%)—to improve warning effectiveness in complex acoustic environments.
In the context dimension, for high-speed and night-time scenarios, the system should dynamically adjust frequency-related parameters (e.g., increasing low-frequency overtones by 6 dB at high speed; limiting loudness to ≤55 dB at night while extending the reverberation tail to 0.8 s) and retain electronic beeps in emergency conditions to ensure sufficient warning intensity.
In the emotion and culture dimension, participants generally reported lower irritation with traditional instrument timbres compared with electronic buzzer sounds. This suggests that enhancing the culturally “weighty” character of the bianzhong start-up sound can increase participants’ emotional acceptance.
In the prototyping phase, we selected instrument targets for functional, warning, and brand/emotional cues and defined corresponding parameter settings according to their timbral features (Table 3; detailed parameter list is provided in Appendix E).
4. Discussion
4.1. Interpretation of Behavioral, Physiological, and UX Results
This study systematically analyzed the physical attributes, physiological monitoring data, and UX scores of 33 in-cabin prompt sounds. We revealed the general acoustic patterns of three sound categories and summarized their differences in terms of the physiological arousal, functional communication, and emotional experience. From a behavioral science perspective, these results highlight how short auditory cues modulate cognitive load and emotional regulation through interacting perceptual and affective processes.
Regarding acoustic features, we found that functional sounds differed markedly from warning and brand sounds, especially in terms of frequency (1047.10 ± 1224.22 Hz) and pitch (73.50 ± 20.61). From a functional communication perspective, high-frequency and high-pitch designs improved penetrability in complex environments and ensured users’ recognition efficiency. However, although the functional sounds enhanced the pragmatic quality (mean = 0.57), we observed that they also induced higher physiological arousal (0.12 ± 0.24) and cognitive load (ΔHbO in the l-DLPFC = 0.033 ± 0.019). From a UX perspective, these effects resulted in significantly lower hedonic scores for functional sounds (−0.45 ± 0.24).
Compared with functional sounds, we found no strong optimization needs for warning and brand sounds. Warning sounds exhibited the highest BPM variability (SD = 83.10), reflecting the flexibility in rhythmic design; however, this did not significantly impact the UX or physiological indicators. Brand sounds, on the other hand, displayed the lowest timbre variability (SD = 1.40), which supports the automotive industry’s trend toward “family acoustic genes.” For example, BMW’s “Angel Wings” start-up sound strengthens auditory memory of the brand through unified spectral characteristics. This result aligns with consumer psychology research demonstrating that sensory consistency enhances brand loyalty [75].
Correlation analysis further showed that the timbre was a key mediating variable, linking acoustic attributes, physiological responses, and UX outcomes. The timbre was positively correlated with overall UX score (r = 0.414, p < 0.05) and negatively correlated with ΔHbO in both the l-DLPFC and CH3 channels (r = −0.449; −0.368). These results demonstrate that shifting the timbre from sharp and bright to soft and deep improved the subjective evaluations and reduced the emotional regulation load and cognitive resource consumption at the neural level.
4.2. Implications for Healing and Wellness in Enclosed Built Environments
Soundscape research shifts scholarly attention from purely physical indicators to human perception and well-being, marking a paradigm shift in noise-control policy toward a new multidisciplinary approach [76]. The World Health Organization (WHO), in its updated environmental noise guidelines, likewise emphasizes that environmental sound design is closely linked to human health [77]. Based on the evidence presented above, an important implication for wellness-oriented enclosed built environment design is the need to balance detectability and emotional gentleness.
Our results show that functional cues with higher frequency/pitch achieve more efficient information transmission and slightly higher pragmatic quality scores. However, higher frequency/pitch is also accompanied by higher arousal and regulatory demand (as reflected by trends in SCR and l-DLPFC ΔHbO), and when such cues are repeatedly encountered, hedonic evaluation decreases significantly. For practical applications in architectural environments, these findings can be translated into a simple deployment rule for enclosed interactive facilities: routine, frequently repeated confirmations (e.g., elevator arrival/confirmation, access feedback, wayfinding confirmation, and HVAC status updates) should prioritize low-intrusiveness timbres, whereas safety-critical events (e.g., door obstruction/emergency situations, access denied/security alarms, and equipment faults) may adopt higher frequency/pitch to ensure detectability but should constrain duration and repetition to avoid chronic annoyance and sustained arousal. Similar links between comfort-related appraisal and acoustic/perceptual attributes have been demonstrated in indoor soundscape research, and the trade-off between detectability and discomfort/annoyance is widely recognized in alert-sound design, where timbre/envelope adjustments can reduce annoyance without compromising recognizability [78,79,80].
In Section 3.5 and Table 3, we present a health-oriented design pathway for prompt sounds implemented through adjustments to acoustic parameters. Unlike approaches that focus solely on physical acoustic metrics, our experiments and interviews indicate that culturally resonant timbres can provide additional emotional value, thereby increasing user acceptance—an observation consistent with the concept of healing design. This concept emphasizes that multisensory experiences and emotional regulation are key components of healing spatial environments [81].
Moreover, a soundscape-based study has shown that targeted sound design (e.g., introducing natural sounds in waiting areas) can significantly enhance patients’ tranquility and reduce anxiety [82], providing a theoretical basis for extending the present findings.
Collectively, these results suggest that health-oriented prompt-sound design can move beyond a “loudness-first” mindset toward a comprehensive evaluation approach. Based on our findings, the proposed AUEX model can serve as a method for the development and iterative evaluation of health-oriented prompt sounds in enclosed built environments. The model offers designers and researchers an actionable integrative assessment toolkit—combining user-experience evaluation with physiological monitoring—to ensure that designed prompt sounds are functionally effective while remaining comfortable.
4.3. Limitations and Future Directions
Several limitations of the present study should be acknowledged. First, the sample size was relatively modest and consisted primarily of young adult participants with similar educational backgrounds, which may limit the generalizability of the findings. Future studies could include more diverse age groups and cultural backgrounds to examine potential individual differences in auditory cue perception.
Second, although physiological measures provided objective indices of cognitive load and emotional arousal, they cannot fully disentangle all underlying psychological processes. Combining fNIRS and EDA with additional behavioral or neural measures, such as reaction time or electroencephalography, may offer a more comprehensive understanding of auditory cue processing.
Finally, the experimental context focused on a specific interaction scenario. While the findings highlight general behavioral mechanisms associated with short auditory cues, future research could extend this framework to other interaction contexts to further validate the robustness of the AUEX model.
5. Conclusions
In this study, physiological monitoring was combined with a user experience questionnaire to construct a multimodal evaluation framework—the AUEX model—for analyzing the user experience of short prompt sounds. Using a set of 33 in-cabin cues as a pilot stimulus library, cue-level analyses examined how acoustic attributes (e.g., timbre, frequency, pitch, and rhythm-related features) relate to subjective UX appraisal and psychophysiological responses (fNIRS and EDA) during repeated cue exposure. Integrating subjective and physiological evidence enabled assessment not only of immediate affective reactions but also of sustained regulatory demand that conventional post-task UX methods may not fully capture.
Results highlight a design-relevant trade-off between detectability and comfort-related acceptance. Timbre showed a positive association with overall UX, suggesting that timbral choices can materially shape perceived quality and acceptance. Meanwhile, higher-frequency and higher-pitch cue patterns—especially in the functional category—tended to improve functional communication yet coincided with reduced hedonic quality and lower overall UX. Physiological evidence provided convergent support: higher salience cues were accompanied by increased arousal and elevated prefrontal activation trends, consistent with higher regulatory demand. Together, these findings indicate that cue design benefits from differentiating between routine, frequently repeated confirmations (where low intrusiveness is critical) and genuinely urgent events (where higher salience is justified but should be constrained in duration and repetition).
An evaluation-to-design translation step further converted these relationships into scenario-based parameter targets and prototype concepts (Table 3), demonstrating a practical route from empirical evaluation outputs to implementable design hypotheses.
Interpretation and generalization should nevertheless remain bounded by the study context. A simulator-based vehicle cabin was used as a controlled enclosed interactive environment, which supports internal validity by reducing environmental confounds, but real-world building settings may introduce moderating factors such as reverberation, masking noise, source–listener distance, occupancy density, and contextual expectations. Accordingly, the primary contribution lies in the AUEX evaluation logic and mechanism-level relationships (e.g., the salience–intrusiveness trade-off and the role of timbre in comfort-related appraisal), whereas parameter-level targets require calibration. Future work will validate and adjust the proposed design hypotheses through field studies in representative architectural scenarios (e.g., elevators, access control, wayfinding confirmation, and building-service notifications), combining in situ prototyping with behavioral and user-experience outcomes to test robustness under real acoustic and contextual conditions.
Author Contributions
Conceptualization, S.T. and P.G.; Methodology, P.G.; Software, S.T. and Z.L. (Zhiyu Long); Validation, P.G.; Formal analysis, P.G.; Investigation, S.T., Z.F. and R.D.; Data curation, S.T. and P.G.; Writing—original draft, P.G.; Writing—review and editing, P.G.; Visualization, Z.F., Z.L. (Zhiyu Long), R.D. and Z.L. (Zihao Li); Supervision, P.G.; Project administration, P.G.; Funding acquisition, S.T. All authors have read and agreed to the published version of the manuscript.
Funding
This project is funded by the Guangdong Provincial Department of Science and Technology and the Guangzhou Academy of Fine Arts Art and Technology Support Platform (221101CZ03); Guangdong Provincial Ordinary University Scientific Research Platforms and Projects (2025WQNCX031); Guangdong Philosophy and Social Science Planning Project (GD25CYS33).
Institutional Review Board Statement
This study was conducted in accordance with the Declaration of Helsinki and approved by the Research Ethics Committee of Shantou University (protocol code STU20250714), approval date: 14 July 2025.
Informed Consent Statement
Informed consent was obtained from all subjects involved in the study.
Data Availability Statement
The data presented in this study are available on request from the corresponding author. The data are not publicly available due to privacy or ethical restrictions.
Conflicts of Interest
The authors declare no conflicts of interest.
Appendix A
| No. | Category | Frequency (Hz) | Pitch (Cents) | BPM (Tempo) | Timbre |
| 1 | Functional Prompt1 | 508.57 | C5-59 | 149.43 | Crisp |
| 2 | Functional Prompt2 | 188.13 | F#3+29 | 150 | Deep |
| 3 | Functional Prompt3 | 937.6 | A#5+9 | 140.85 | Sharp |
| 4 | Functional Prompt4 | 147.20 | D3+4 | 50.94 | Deep |
| 5 | Functional Prompt5 | 233.96 | A#3+6 | 148.51 | Crisp |
| 6 | Functional Prompt6 | 2902.28 | F#7-34 | 141.18 | Sharp |
| 7 | Functional Prompt7 | 386.56 | G4-24 | 164.38 | Crisp |
| 8 | Functional Prompt8 | 3072.47 | G7-35 | 118.81 | Sharp |
| 9 | Warning Prompt1 | 58.78 | A#1+15 | 120 | Sharp |
| 10 | Warning Prompt2 | 784.75 | G5+1 | 60 | Full-bodied |
| 11 | Warning Prompt3 | 238.73 | A#3+41 | 43.92 | Deep |
| 12 | Warning Prompt4 | 36.61 | D1-4 | 148.15 | Crisp |
| 13 | Warning Prompt5 | 584.1 | D5-9 | 199.34 | Deep |
| 14 | Warning Prompt6 | 151.36 | D#3-47 | 60 | Deep |
| 15 | Warning Prompt7 | 164.61 | E3-2 | 59.52 | Deep |
| 16 | Warning Prompt8 | 234.53 | A#3+10 | 200 | Deep |
| 17 | Warning Prompt9 | 152.26 | D#3-37 | 66.59 | Crisp |
| 18 | Warning Prompt10 | 397.6 | G4+24 | 72.99 | Resonant |
| 19 | Warning Prompt11 | 585.74 | D5-4 | 83.45 | Crisp |
| 20 | Warning Prompt12 | 618.53 | D#5-10 | 348.82 | Sharp |
| 21 | Warning Prompt13 | 196.76 | G3+6 | 90.36 | Sharp |
| 22 | Warning Prompt14 | 63.73 | C2-45 | 120 | Crisp |
| 23 | Brand Prompt1 | 241.65 | B3-27 | — | Light |
| 24 | Brand Prompt2 | 73.98 | D2+13 | — | Soothing |
| 25 | Brand Prompt3 | 210.89 | G#3+26 | — | Light |
| 26 | Brand Prompt4 | 674.87 | E5+40 | — | Bright |
| 27 | Brand Prompt5 | 159.16 | D#3+39 | — | Deep |
| 28 | Brand Prompt6 | 179.65 | F3+49 | — | Full-bodied |
| 29 | Brand Prompt7 | 531.03 | C5+25 | — | Light |
| 30 | Brand Prompt8 | 104.01 | G#2+3 | — | Soft |
| 31 | Brand Prompt9 | 401.89 | G4+43 | — | Crisp |
| 32 | Brand Prompt10 | 238.16 | A#3+37 | — | Deep |
| 33 | Brand Prompt11 | 244.37 | B3-18 | — | Light |
Appendix B
| Category (Mean ± SD) | F | p | η2 | |||
| Functional (n = 8) | Warning (n = 14) | Brand (n = 11) | ||||
| SCR | 0.12 ± 0.24 | 0.04 ± 0.11 | −0.03 ± 0.06 | 2.744 | 0.080 | 0.155 |
| CH3ΔHbO | 0.020 ± 0.024 | 0.021 ± 0.035 | 0.033 ± 0.023 | 0.614 | 0.548 | 0.039 |
| CH4ΔHbO | 0.004 ± 0.035 | 0.000 ± 0.024 | 0.001 ± 0.027 | 0.046 | 0.955 | 0.003 |
| CH1ΔHbO | 0.000 ± 0.021 | −0.010 ± 0.016 | −0.003 ± 0.022 | 0.797 | 0.460 | 0.050 |
| CH6ΔHbO | −0.007 ± 0.027 | 0.007 ± 0.024 | 0.020 ± 0.045 | 1.586 | 0.222 | 0.096 |
| I_DLPFCΔHbO | 0.033 ± 0.019 | 0.011 ± 0.023 | 0.018 ± 0.021 | 2.694 | 0.084 | 0.152 |
| b_VLPFCΔHbO | 0.008 ± 0.026 | 0.006 ± 0.016 | 0.017 ± 0.015 | 1.194 | 0.317 | 0.074 |
Appendix C
| Interview Dimensions | Questions |
| Timbre Dimension | 1. Compared with conventional electronic sound effects, which type of prompt sound (e.g., traditional-instrument-based sounds such as the guzheng) allows you to become aware of danger or warning signals more quickly? (Follow-up: evaluation of recognition clarity and degree of interference.) |
| 2. If the low-frequency overtones of the guzheng (50–200 Hz) are used in vehicle prompt sounds, do you think that the resulting sense of “solemnity” conflicts with the technological attributes of new energy vehicles? | |
| Context Dimension | 1. Do different driving scenarios (urban/highway/nighttime) require differentiated sound effect design? For example, reducing loudness during nighttime driving (≤55 dB) and extending the reverberation tail (≥0.8 s). |
| 2. If traditional-instrument-based prompt sounds are commercialized, in which driving scenarios do you think they should be applied with priority? (Safety warnings/welcome interactions/status feedback.) | |
| Emotion and Culture Dimension | 1. Does the bianzhong-based system feedback sound make you associate it with a “sense of ritual” or “cultural solemnity”? (Semantic differential scale: mechanical feeling—culturally weighty feeling.) |
| 2. Do traditional-instrument sound effects help alleviate your feelings of irritation caused by frequent prompt sounds? | |
| Integrative Validation | 1. Among functional warning efficiency, cultural imagery conveyance, and emotional pleasantness, which do you consider to be the core value of traditional-style (“Chinese-style”) sound effect design? |
| 2. Would you be willing to pay for a “customized traditional-style sound effect package”? What price range would you consider acceptable? |
Appendix D
| Interview Dimensions | Results | Attribute | Coding Evidence |
| Timbre Dimension | 1. Response speed: The average reaction time for guzheng-based prompt sounds (2000–4000 Hz) was 0.8 s, which was 0.3 s faster than that for electronic sound effects. | Comparison of warning efficiency | Codes: recognition clarity; salience/urgency; faster response Sub-theme: warning efficiency via salient timbre Exemplar paraphrase: Instrument-based warning cues were described as clearer and more attention-grabbing than conventional electronic effects, which participants associated with quicker reactions. |
| 2. Adaptability of low-frequency overtones: The perceived “solemnity” of the guzheng low-frequency overtones (50–200 Hz) received a conflict score of 6.5/10 with the technological attributes of new energy vehicles. Acceptance among younger users (<35 years old) was significantly lower than that of middle-aged and older users (conflict score: 4.1/10). | Codes: solemnity; tech-image mismatch; user-segment difference (age); brand fit Sub-theme: timbre–brand identity fit and segment-dependent acceptance Exemplar paraphrase: Low-frequency “solemn” overtones were perceived by some users as conflicting with a “high-tech” vehicle image, with younger users expressing stronger mismatch concerns than older users. | ||
| Context Dimension | 1. Nighttime optimization requirement: 87% of interviewees supported reducing prompt sound loudness to 55 dB and extending the reverberation tail to 0.8 s during nighttime driving, while emphasizing that the peak intensity of emergency warning sounds should remain ≥ 85 dB. | Differentiated design for driving scenarios | Codes: nighttime low-intrusiveness; loudness reduction; longer decay/reverb tail; maintain emergency salience Sub-theme: scenario-adaptive parameter tuning Exemplar paraphrase: Participants preferred softer cues at night and supported extending the decay tail, while emphasizing that emergency warnings should remain clearly noticeable and sufficiently intense. |
| 2. Commercialization priority: Support was highest for safety warning scenarios (40%), followed by welcome interactions (30%) and status feedback (23%). Emergency scenarios were considered to still require the retention of electronic buzzer sounds. | Codes: safety-first prioritization; welcome/ritual interaction; status feedback; retain electronic buzzer for emergencies Sub-theme: scenario prioritization for deployment Exemplar paraphrase: Safety-warning applications were viewed as the most suitable first-use scenario, whereas some emergency contexts were considered to still require conventional electronic buzzer cues. | ||
| Emotion and Culture Dimension | 1. Bianzhong prompt sound: The perceived score for cultural weight/heaviness was 8.5/10, while the mechanical feeling scored 3.8/10. | Perception of cultural symbolism | Codes: cultural “weight/heaviness”; ritual-like association; semantic contrast (mechanical vs. culturally weighty) Sub-theme: cultural symbolism as emotional value Exemplar paraphrase: Bianzhong-based cues were commonly associated with cultural “weight” and a ritual-like tone, contrasting with a more “mechanical” impression of conventional electronic sounds. |
| 2. Emotion regulation effect: Traditional-instrument-based timbral prompt sounds reduced the irritation index by 34% compared with electronic buzzer sounds. | Codes: reduced irritation; less harsh timbre; repetition tolerance; comfort/pleasantness Sub-theme: timbre-driven reduction in irritation under repetition Exemplar paraphrase: Compared with electronic buzzers, traditional-instrument timbres were perceived as less irritating during frequent prompting and more acceptable for repeated exposure. | ||
| Integrative Validation | 1. Priority weighting: Functional warning efficiency (50%) > emotional pleasantness (40%) > cultural imagery (10%), indicating that safety warning remains the core requirement. | Core value ranking | Codes: functional efficiency; safety core requirement; emotional pleasantness; cultural imagery (lower priority) Sub-theme: value hierarchy for design adoption Exemplar paraphrase: Participants tended to rank safety/functional efficiency as the primary value, followed by emotional pleasantness, with cultural imagery treated as a secondary enhancer rather than the core requirement. |
| 2. Willingness to pay: 73% of users were willing to pay for a customized traditional-style sound effect package, with an acceptable price range of 250–700 RMB. Users also required the provision of a free trial version covering at least three scenarios. | Willingness to pay | Codes: willingness to pay; acceptable price range; customization value; free trial requirement; scenario coverage Sub-theme: commercialization feasibility and adoption conditions Exemplar paraphrase: Many participants expressed willingness to pay within a stated range for a customized package, typically expecting a free trial and coverage of multiple key scenarios before purchase. |
Appendix E
| Prompt Sound Type | Prompt Sound Category | Instrument Selection | Acoustic Parameters | Rationale for Selection |
| Functional prompt sound | Turn signal (left/right) | Xylophone | Short glissando (0.3 s); frequency range 500–2000 Hz; loudness 45–55 dB | Simulates flowing water, metaphorically expressing the Eastern philosophy of “acting in accordance with the situation” |
| Hazard lights (double flash) | Guzheng | Mid-range string frequencies, approximately 200–500 Hz; enhanced overtones with prominent harmonics at 800 Hz and 1200 Hz based on a 400 Hz fundamental | A “double-note” rhythmic pattern (“da–da”) is used to reinforce a sense of urgency | |
| Trunk opening sound | Guqin open-string sound (deep low-frequency vibration) | Sustained low-frequency resonance at C2 (65.4 Hz) for 1 s, combined with a 0.5 s crescendo envelope | The “earth-like sound” characteristic of the guqin open string forms a metaphorical association with the “load-bearing” function of the trunk | |
| Gear shift sound | Wooden fish percussion | Single strike duration: 0.3–0.5 s; frequency range 2000–4000 Hz; short harmonic burst | Light and crisp wooden percussive sound | |
| Warning prompt sound | Seatbelt warning | Bianzhong reverberation | 800 Hz main-frequency pulse (0.8 s duration), repeated every 2 s, overlaid with the chordal decay tail of the Zeng Hou Yi bianzhong | The tile-like structural form generates a dual-frequency region that enhances penetrability, effectively covering tire noise and low-frequency ambient noise inside the cabin |
| Lane departure warning | Bamboo flute | Single sound duration of 0.5–0.8 s; QF-tuned bamboo flute with 2 kHz high-frequency vibrato (amplitude ±50 Hz) | The bamboo flute timbre possesses a naturally “lingering and expressive” character (e.g., F-tuned bamboo flute) | |
| Collision warning | Pipa | Seven-hit rhythmic pattern with 200 ms intervals; main frequency linearly increasing from 500 Hz to 1.5 kHz; maximum loudness 68 dB | The pipa’s “ripping silk” sound quality (“four strings struck at once, like tearing silk”) conveys a strong sense of urgency | |
| Reverse warning | Wooden fish percussion + sanxian glissando | Wooden percussive hits at 0.25 s intervals, combined with a glissando from C3 to C4; spatial localization enhanced through left–right panning | Simulates the night watchman’s drumbeat rhythm to convey warning information | |
| Brand/emotional prompt sound | Vehicle start-up sound | Zeng Hou Yi bianzhong (C mode) + guqin harmonics | 3 s resonant chordal ringing (C2–C5 across four octaves), overlaid with the harmonic series of the 13th hui of the guqin; reverberation time 2.8 s | The bianzhong represents “ritual and musical heritage,” while the guqin symbolizes the “scholarly spirit” |
| Sport mode switching | War drum | Fundamental frequency 80 Hz ±20; pipa strumming noise (20–200 Hz) added to each measure | War drum The “low, pulsing” characteristic of war drums reinforces the sense of “power” associated with sport mode |
References
- Cale, J.E. From Noise Reduction to Positive Soundscapes: Enhancing School Acoustic Design Through Integration of Soundscape and Well-Being Considerations. Noise Health 2025, 27, 805–810. [Google Scholar] [CrossRef] [Scilit]
- Erçakmak Osma, N.; Dökmeci Yörükoğlu, P. Indoor Soundscape Intervention: Criteria to Enhance Well-Being and Comfort in Indoor Environments. Acoustics 2025, 7, 46. [Google Scholar] [CrossRef] [Scilit]
- Adachi, C.; Kakio, S. Human–Facility Interaction System in an Elevator Environment. Front. Robot. AI 2025, 12, 1681187. [Google Scholar] [CrossRef] [Scilit]
- Nees, M.A. Auditory Icons, Earcons, Spearcons, and Speech: A Systematic Review and Meta-Analysis of Brief Audio Alerts in Human–Machine Interfaces. Audit. Percept. Cogn. 2023, 6, 300–329. [Google Scholar] [CrossRef] [Scilit]
- Song, Y.; Kim, W.; Yun, M.H. Auditory experience in vehicles: A systematic review and future research directions. Heliyon 2024, 10, e34838. [Google Scholar] [CrossRef] [Scilit]
- Grasso-Cladera, A.; Arenas-Perez, M.; Wegertseder-Martinez, P.; Vilina, E.; Mattoli-Sanchez, J.; Parada, F.J. Neuroscientific Insights into the Built Environment: A Systematic Review of Empirical Research on Indoor Environmental Quality, Physiological Dynamics, and Psychological Well-Being in Real-Life Contexts. Int. J. Environ. Res. Public Health 2025, 22, 824. [Google Scholar] [CrossRef] [Scilit]
- Axelsson, Ö.; Guastavino, C.; Payne, S.R. Editorial: Soundscape Assessment. Front. Psychol. 2019, 10, 2514. [Google Scholar] [CrossRef] [Scilit] [PubMed]
- Ribeiro Ferreira, V.; Pereira, A.R.; Vieira, J.; Pereira, F.; Marques, R.; Campos, G.; Sampaio, A.; Crego, A. Capturing the Attentional Response to Clinical Auditory Alarms: An ERP Study on Priority Pulses. PLoS ONE 2023, 18, e0281680. [Google Scholar] [CrossRef] [Scilit]
- Einhäuser, W.; Neubert, C.R.; Grimm, S.; Bendixen, A. High Visual Salience of Alert Signals Can Lead to a Counterintuitive Increase of Reaction Times. Sci. Rep. 2024, 14, 8858. [Google Scholar] [CrossRef] [Scilit]
- World Health Organization. Environmental Noise Guidelines for the European Region; World Health Organization: Geneva, Switzerland, 2018; ISBN 978-92-8-905356-3. [Google Scholar]
- Cheer, J.; Elliott, S.J.; Jung, W. Sound Field Control in the Automotive Environment. In Proceedings of the 3rd International ATZ Automotive Acoustics Conference, Zurich, Switzerland, 23–24 June 2015; pp. 1–15. [Google Scholar] [CrossRef] [Scilit]
- Aletta, F.; Astolfi, A. Soundscapes of Buildings and Built Environments. Build. Acoust. 2018, 25, 195–197. [Google Scholar] [CrossRef] [Scilit]
- Torresin, S.; Albatici, R.; Aletta, F.; Babich, F.; Oberman, T.; Siboni, S.; Kang, J. Indoor Soundscape Assessment: A Principal Components Model of Acoustic Perception in Residential Buildings. Build. Environ. 2020, 182, 107152. [Google Scholar] [CrossRef] [Scilit]
- Erfanian, M.; Mitchell, A.J.; Kang, J.; Aletta, F. The Psychophysiological Implications of Soundscape: A Systematic Review of Empirical Literature and a Research Agenda. Int. J. Environ. Res. Public Health 2019, 16, 3533. [Google Scholar] [CrossRef] [Scilit] [PubMed]
- Chen, K.; Kang, J.; Ma, H. Evaluation of Healthy Indoor Acoustic Environments in Residential Buildings by the Occupants: A Mixed-Method Approach. Build. Environ. 2023, 246, 110950. [Google Scholar] [CrossRef] [Scilit]
- Zhong, T. Research and Interaction Design of Automotive Prompt Sounds. Master’s Thesis, Guangdong University of Technology, Guangzhou, China, 2021. Available online: https://kns.cnki.net/KCMS/detail/detail.aspx?dbname=CMFD202201&filename=1021636736.nh (accessed on 20 November 2024).
- Delle Monache, S.; Rocchesso, D. Bauhaus Legacy in Research through Design: The Case of Basic Sonic Interaction Design. Int. J. Des. 2014, 8, 139–154. Available online: https://www.ijdesign.org/index.php/IJDesign/article/view/1543/657 (accessed on 20 November 2024).
- Rocchesso, D.; Polotti, P.; Delle Monache, S. Designing Continuous Sonic Interaction. Int. J. Des. 2009, 3, 13–25. Available online: http://www.ijdesign.org/index.php/IJDesign/article/view/514 (accessed on 20 November 2024).
- Hosseinkhani, A.; Younesian, D.; Ranjbar, M. Vibro-Acoustic Analysis and Topology Optimization of Anti-Tetra Chiral Auxetic Lattices Driven by Different Colored Noises. Int. J. Struct. Stab. Dyn. 2020, 20, 2050113. [Google Scholar] [CrossRef] [Scilit]
- Kessissoglou, N.J.; Pan, J. Active Control of the Structural and Acoustic Responses of a Fluid-Loaded Plate. Part I: Analysis of the Physical System. J. Low. Freq. Noise Vib. Act. Control 1998, 17, 11–25. [Google Scholar] [CrossRef] [Scilit]
- James, P.; Bliss, S.; Acton, A. Alarm Mistrust in Automobiles: How Collision Alarm Reliability Affects Driving. Appl. Ergon. 2003, 34, 499–509. [Google Scholar] [CrossRef] [Scilit]
- Graham, R. Use of Auditory Icons as Emergency Warnings: Evaluation within a Vehicle Collision Avoidance Application. Ergonomics 1999, 42, 1233–1248. [Google Scholar] [CrossRef] [Scilit]
- Liu, Y.; Zhao, D. In-Car Sound Design Under the Framework of Emotional Design. Ergon. Des. 2022, 47, 47. Available online: https://openaccess.cms-conferences.org/publications/book/978-1-958651-23-0/article/978-1-958651-23-0_52 (accessed on 20 November 2024).
- Dupré, T.; Denjean, S.; Aramaki, M.; Kronland-Martinet, R. Spatial Integration of Dynamic Auditory Feedback in Electric Vehicle Interior. J. Audio Eng. Soc. 2023, 71, 349–362. [Google Scholar] [CrossRef] [Scilit]
- Gasgoo. Design and Evaluation of Sound in Intelligent Vehicles [EB/OL]. 9 December 2022. Available online: https://auto.gasgoo.com/news/202212/9I70324509C103.shtml (accessed on 20 November 2024).
- Bliss-Moreau, E.; Owren, M.J.; Barrett, L.F. I Like the Sound of Your Voice: Affective Learning About Vocal Signals. J. Exp. Soc. Psychol. 2010, 46, 557–563. [Google Scholar] [CrossRef] [Scilit] [PubMed]
- Wang, X.; Deng, Y.; Wen, R. Emotional Design of Indoor Environment from the Perspective of Perceptual Psychology. Furnit. Inter. Decor. 2023, 30, 130–133. Available online: https://kns.cnki.net/kcms2/article/abstract?v=3nHqkK4aVbA-BCu7q&uniplatform=NZKPT&language=CHS (accessed on 20 November 2024).
- Baldwin, C.L.; Lewis, B.A. Perceived Urgency Mapping Across Modalities Within a Driving Context. Appl. Ergon. 2014, 45, 1270–1277. [Google Scholar] [CrossRef] [Scilit] [PubMed]
- Lewis, B.A.; Eisert, J.L.; Baldwin, C.L. Validation of Essential Acoustic Parameters for Highly Urgent In-Vehicle Collision Warnings. Hum. Factors 2018, 60, 248–261. [Google Scholar] [CrossRef] [Scilit]
- Cao, Y.; Tang, L.; Liu, Y. Research on the Regulatory Adaptability of Low-Speed Warning System for Electric Vehicles. Automot. Eng. 2020, 42, 1110–1138. Available online: https://d.wanfangdata.com.cn/periodical/qcgc202008016 (accessed on 20 November 2024).
- Lin, S.; Huang, R. Research on Product Sound Perception Based on Multimodal Sensory User Experience. Ornament 2019, 8, 102–105. Available online: https://d.wanfangdata.com.cn/periodical/zhuangshi201908022 (accessed on 20 November 2024).
- Chen, X.; Gong, C. Exploring Intelligent Audio UX Models from the Perspective of Scene Theory. Contemp. Commun. 2021, 2, 89–92. Available online: https://d.wanfangdata.com.cn/periodical/ddcb202102021 (accessed on 20 November 2024).
- Shi, P.; Dong, T.; Liu, C. Research on In-Vehicle Infotainment System Based on User Experience. Mech. Eng. Autom. 2019, 3, 224–226. Available online: https://wenku.baidu.com/view/8e29803f747f5acfa1c7aa00b52acfc789eb9fe0?fr=xueshu&_wkts_=1772016081383&needWelcomeRecommand=1 (accessed on 20 November 2024).
- Iriarte, A.A.; Erle, G.L.; Etxabe, M.M. Evaluating User Experience with Physiological Monitoring: A Systematic Literature Review. Dyna New Technol. 2021, 8, 1. [Google Scholar]
- Bradley, M.M.; Lang, P.J. Measuring Emotion: The Self-Assessment Manikin and the Semantic Differential. J. Behav. Ther. Exp. Psychiatry 1994, 25, 49–59. [Google Scholar] [CrossRef] [Scilit]
- Brade, J.; Lorenz, M.; Busch, M.; Hammer, N.; Tscheligi, M.; Klimant, P. Being There Again—Presence in Real and Virtual Environments and Its Relation to Usability and User Experience Using a Mobile Navigation Task. Int. J. Hum.-Comput. Stud. 2017, 101, 76–87. [Google Scholar] [CrossRef] [Scilit]
- Baig, M.Z.; Kavakli, M. A Survey on Psycho-Physiological Analysis and Measurement Methods in Multimodal Systems. Multimodal Technol. Interact. 2019, 3, 37. [Google Scholar] [CrossRef] [Scilit]
- Biofeedback, D. Biofeedback: An Overview in the Context of Heart–Brain Medicine. Clevel. Clin. J. Med. 2008, 75, S31. [Google Scholar] [CrossRef] [Scilit]
- Saariluoma, P.; Jokinen, J.P.P. Emotional Dimensions of User Experience: A User Psychological Analysis. Int. J. Hum.-Comput. Interact. 2014, 30, 303–320. [Google Scholar] [CrossRef] [Scilit]
- Pinti, P.; Tachtsidis, I.; Hamilton, A.; Hirsch, J.; Aichelburg, C.; Gilbert, S.; Burgess, P.W. The Present and Future Use of Functional Near-Infrared Spectroscopy (fNIRS) for Cognitive Neuroscience. Ann. N. Y. Acad. Sci. 2020, 1464, 5–29. [Google Scholar] [CrossRef] [Scilit] [PubMed]
- Cui, X.; Bray, S.; Bryant, D.M.; Glover, G.H.; Reiss, A.L. A Quantitative Comparison of NIRS and fMRI across Multiple Cognitive Tasks. NeuroImage 2011, 54, 2808–2821. [Google Scholar] [CrossRef] [Scilit] [PubMed]
- Bazilinskyy, P.; Cieler, S.; de Winter, J.C.F. Structuring the Sound Design Process in the Automotive Industry with a Web-Based Application. Preprint 2018. Available online: https://www.researchgate.net/profile/Pavlo-Bazilinskyy/publication/325846614_Sound_design_process_for_the_automotive_industry/links/5e654c5b4585153fb3cdf575/Sound-design-process-for-the-automotive-industry.pdf (accessed on 20 November 2024).
- Wang, L.; Lü, G.; Gao, H.; Fan, L. Design and Implementation of Multi-Source Fusion Service for In-Vehicle Entertainment Systems. Automot. Dig. 2024, 9, 20–27. Available online: https://d.wanfangdata.com.cn/periodical/qcwz202409005 (accessed on 20 November 2024).
- China Quality News. Quality Travel, Sound Experience|BYD Automotive Active Sound Improves Driving Quality [EB/OL]. 16 August 2022. Available online: https://www.cqn.com.cn/auto/content/2022-08/16/content_8850721.htm (accessed on 20 November 2024).
- Wang, Y. Shaping Brands with Sound. Peking. Univ. Bus. Rev. 2016, 1, 20–29. Available online: https://www.zhangqiaokeyan.com/academic-journal-cn_pku-business-review_thesis/0201287342540.html (accessed on 20 November 2024).
- Thoma, M.V.; La Marca, R.; Brönnimann, R.; Finkel, L.; Ehlert, U.; Nater, U.M. The Effect of Music on the Human Stress Response. PLoS ONE 2013, 8, e70156. [Google Scholar] [CrossRef] [Scilit] [PubMed]
- Bora, B.; Krishna, M.; Phukan, K.D. The Effects of Tempo of Music on Heart Rate, Blood Pressure and Respiratory Rate: A Study in Gauhati Medical College. Indian J. Physiol. Pharmacol. 2017, 61, 445–448. Available online: https://pubmed.ncbi.nlm.nih.gov/30020615/ (accessed on 20 November 2024).
- Laugwitz, B.; Held, T.; Schrepp, M. Construction and Evaluation of a User Experience Questionnaire. In Proceedings of the HCI and Usability for Education and Work: 4th Symposium of the Workgroup Human-Computer Interaction and Usability Engineering of the Austrian Computer Society, USAB 2008, Graz, Austria, 20–21 November 2008; Springer: Berlin/Heidelberg, Germany, 2008; pp. 63–76. [Google Scholar] [CrossRef] [Scilit]
- Díaz-Oreiro, I.; López, G.; Quesada, L.; Guerrero, L.A. Standardized Questionnaires for User Experience Evaluation: A Systematic Literature Review. Proceedings 2019, 31, 14. [Google Scholar] [CrossRef] [Scilit]
- Quan, X.; Zeng, Z.; Jiang, J.; Zhang, Y.; Li, B.; Wu, D. A Review of Affective Computing Research Based on Physiological Signals. Acta Autom. Sin. 2021, 47, 1769–1784. [Google Scholar] [CrossRef]
- Ekkekakis, P. Illuminating the Black Box: Investigating Prefrontal Cortical Hemodynamics during Exercise with Near-Infrared Spectroscopy. J. Sport. Exerc. Psychol. 2009, 31, 505–553. [Google Scholar] [CrossRef] [Scilit]
- Scholkmann, F.; Kleiser, S.; Metz, A.J.; Zimmermann, R.; Pavia, J.M.; Wolf, U.; Wolf, M. A Review on Continuous Wave Functional Near-Infrared Spectroscopy and Imaging Instrumentation and Methodology. NeuroImage 2014, 85, 6–27. [Google Scholar] [CrossRef] [Scilit] [PubMed]
- León-Carrión, J.; León-Domínguez, U. Functional Near-Infrared Spectroscopy (fNIRS): Principles and Neuroscientific Applications. Neuroimaging Methods 2012, 97, 48–74. [Google Scholar] [CrossRef] [Scilit]
- Moghimi, S.; Kushki, A.; Guerguerian, A.M.; Chau, T. Characterizing Emotional Response to Music in the Prefrontal Cortex Using Near Infrared Spectroscopy. Neurosci. Lett. 2012, 525, 7–11. [Google Scholar] [CrossRef] [Scilit]
- Hoshi, Y.; Huang, J.; Kohri, S.; Iguchi, Y.; Naya, M.; Okamoto, T.; Ono, S. Recognition of Human Emotions from Cerebral Blood Flow Changes in the Frontal Region: A Study with Event-Related Near-Infrared Spectroscopy. J. Neuroimaging 2011, 21, 94–101. [Google Scholar] [CrossRef] [Scilit]
- Kohno, S.; Noriuchi, M.; Iguchi, Y.; Kikuchi, Y.; Hoshi, Y. Emotional Discrimination during Viewing Unpleasant Pictures: Timing in Human Anterior Ventrolateral Prefrontal Cortex and Amygdala. Front. Hum. Neurosci. 2015, 9, 51. [Google Scholar] [CrossRef] [Scilit]
- Hori, S.; Mori, K.; Mashimo, T.; Seiyama, A. Effects of Light and Sound on the Prefrontal Cortex Activation and Emotional Function: A Functional Near-Infrared Spectroscopy Study. Front. Neurosci. 2017, 11, 29. [Google Scholar] [CrossRef] [Scilit]
- Hu, X.; Zhuang, C.; Wang, F.; Liu, Y.J.; Im, C.H.; Zhang, D. fNIRS Evidence for Recognizably Different Positive Emotions. Front. Hum. Neurosci. 2019, 13, 120. [Google Scholar] [CrossRef] [Scilit] [PubMed]
- Duan, L.; Feng, Q.; Xu, P. Using Functional Near-Infrared Spectroscopy to Assess Brain Activation Evoked by Guilt and Shame. Front. Hum. Neurosci. 2020, 14, 197. [Google Scholar] [CrossRef] [Scilit]
- Peck, E.M.M.; Yuksel, B.F.; Ottley, A.; Jacob, R.J.K.; Chang, R. Using fNIRS Brain Sensing to Evaluate Information Visualization Interfaces. In Proceedings of the SIGCHI Conference on Human Factors in Computing Systems (CHI ’13), Paris, France, 27 April–2 May 2013; Association for Computing Machinery: New York, NY, USA, 2013; pp. 473–482. [Google Scholar] [CrossRef] [Scilit]
- Ayaz, H.; Shewokis, P.A.; Bunce, S.; Izzetoglu, K.; Willems, B.; Onaral, B. Optical Brain Monitoring for Operator Training and Mental Workload Assessment. NeuroImage 2012, 59, 36–47. [Google Scholar] [CrossRef] [Scilit] [PubMed]
- Caruelle, D.; Gustafsson, A.; Shams, P.; Lervik-Olsen, L. The Use of Electrodermal Activity (EDA) Measurement to Understand Consumer Emotions—A Literature Review and a Call for Action. J. Bus. Res. 2019, 104, 146–160. [Google Scholar] [CrossRef] [Scilit]
- Ge, Y.; Chen, Y.; Liu, Y.; Li, W.; Sun, X. Electrophysiological Measures Applied in User Experience Studies. Adv. Psychol. Sci. 2014, 22, 959–970. [Google Scholar] [CrossRef] [Scilit]
- Harley, J.M.; Jarrell, A.; Lajoie, S.P. Emotion Regulation Tendencies, Achievement Emotions, and Physiological Arousal in a Medical Diagnostic Reasoning Simulation. Instr. Sci. 2019, 47, 151–180. [Google Scholar] [CrossRef] [Scilit]
- Marschallek, B.E.; Löw, A.; Jacobsen, T. You Can Touch This! Brain Correlates of Aesthetic Processing of Active Fingertip Exploration of Material Surfaces. Neuropsychologia 2023, 182, 108520. [Google Scholar] [CrossRef] [Scilit]
- Sorinas, J.; Ferrández, J.M.; Fernandez, E. Brain and Body Emotional Responses: Multimodal Approximation for Valence Classification. Sensors 2020, 20, 313. [Google Scholar] [CrossRef] [Scilit]
- Gao, P.; Zhang, Y.; Long, Z. Kansei Drives Sustainable Material Innovation—An Approach to Enhance the Added Value of Biomass Materials. Sustainability 2024, 16, 5546. [Google Scholar] [CrossRef] [Scilit]
- Tan, S.; Gao, P.; Fan, Z.; Lin, N.; Long, Z. Emotion Drives Material Innovation—A Method for Investigating Emotional Reactions to Wood Materials. Buildings 2025, 15, 846. [Google Scholar] [CrossRef] [Scilit]
- Lei, M.; Tan, S.; Gao, P. A Multidimensional Perspective on the Impact of Gamification on Visitors’ Emotions and Revisit Intention in Virtual Museum Spaces: A Case Study of the Southern Han Mausoleums Museum. Buildings 2025, 15, 1430. [Google Scholar] [CrossRef] [Scilit]
- Lei, M.; Tan, S.; Gao, P.; Long, Z.; Sun, L.; Dong, Y. Impact of Emotional Design: Improving Sustainable Well-Being Through Bio-Based Tea Waste Materials. Buildings 2025, 15, 1559. [Google Scholar] [CrossRef] [Scilit]
- Kocsis, L.; Herman, P.; Eke, A. The Modified Beer–Lambert Law Revisited. Phys. Med. Biol. 2006, 51, N91. [Google Scholar] [CrossRef] [Scilit]
- Essenpreis, M.; Cope, M.; Elwell, C.E.; Arridge, S.R.; van der Zee, P.; Delpy, D.T. Wavelength Dependence of the Differential Pathlength Factor and the Log Slope in Time-Resolved Tissue Spectroscopy. In Optical Imaging of Brain Function and Metabolism; Springer US: Boston, MA, USA, 1993; pp. 9–20. [Google Scholar] [CrossRef] [Scilit]
- Huppert, T.J.; Diamond, S.G.; Franceschini, M.A.; Boas, D.A. HomER: A Review of Time-Series Analysis Methods for near-Infrared Spectroscopy of the Brain. Appl. Opt. 2009, 48, D280–D298. [Google Scholar] [CrossRef] [Scilit] [PubMed]
- Zhou, S.; Yang, H.; Liu, Y.; Li, F.; Wei, Z.; Bai, X. Processing of Prefrontal Cortex (PFC) to Different Emotion-Induced Materials: Progress of Research on fNIRS. Available online: https://www.hanspub.org/journal/paperinformation?paperid=14340 (accessed on 20 November 2024).
- Shahid, S.; Paul, J.; Gilal, F.G.; Ansari, S. The Role of Sensory Marketing and Brand Experience in Building Emotional Attachment and Brand Loyalty in Luxury Retail Stores. Psychol. Mark. 2022, 39, 1398–1412. [Google Scholar] [CrossRef] [Scilit]
- Kang, J.; Aletta, F.; Gjestland, T.T.; Brown, L.A.; Botteldooren, D.; Schulte-Fortkamp, B.; Lercher, P.; van Kamp, I.; Genuit, K.; Fiebig, A.; et al. Ten Questions on the Soundscapes of the Built Environment. Build. Environ. 2016, 108, 284–294. [Google Scholar] [CrossRef] [Scilit]
- Jarosińska, D.; Héroux, M.È.; Wilkhu, P.; Creswick, J.; Verbeek, J.; Wothge, J.; Paunović, E. Development of the WHO Environmental Noise Guidelines for the European Region: An Introduction. Int. J. Environ. Res. Public Health 2018, 15, 813. [Google Scholar] [CrossRef] [Scilit]
- Souaille, T.; Petiot, J.-F.; Misdariis, N.; Lagrange, M. An Interactive Bi-Objective Optimisation Process to Guide the Design of Electric Vehicle Warning Sounds. Des. Sci. 2022, 8, e26. [Google Scholar] [CrossRef] [Scilit]
- Foley, L.; Schlesinger, J.J.; Schutz, M. Improving Detectability of Auditory Interfaces for Medical Alarms Through Temporal Variation in Amplitude Envelope. Br. J. Anaesth. 2023, 130, 351–359. [Google Scholar] [CrossRef] [Scilit] [PubMed]
- Anderson, C.J.; Sreetharan, S.; Elizondo López, A.E.; Schlesinger, J.J.; Schutz, M. Improving Auditory Alarms: Reducing Perceived Annoyance with Musical Timbre (a Randomized Trial). Perioper. Care Oper. Room Manag. 2023, 32, 100332. [Google Scholar] [CrossRef] [Scilit]
- Yan, S.; Azmi, A.; Mansor, N.; Wang, Z.; Wang, Y. Healing Spaces as a Design Approach to Optimize Emotional Regulation for Patients with Mood Disorders. Buildings 2024, 14, 472. [Google Scholar] [CrossRef] [Scilit]
- Watts, G.; Khan, A.; Pheasant, R. Influence of soundscape and interior design on anxiety and perceived tranquillity of patients in a healthcare setting. Appl. Acoust. 2016, 104, 135–141. [Google Scholar] [CrossRef] [Scilit]
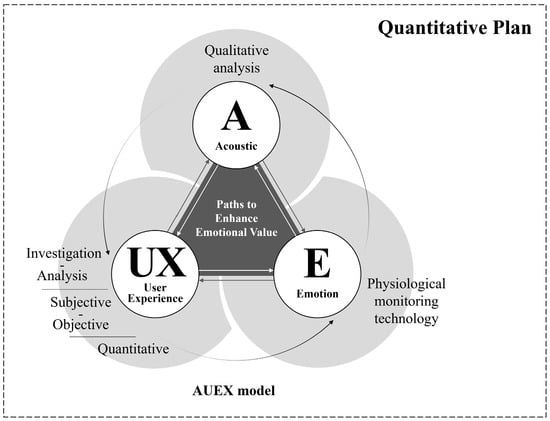
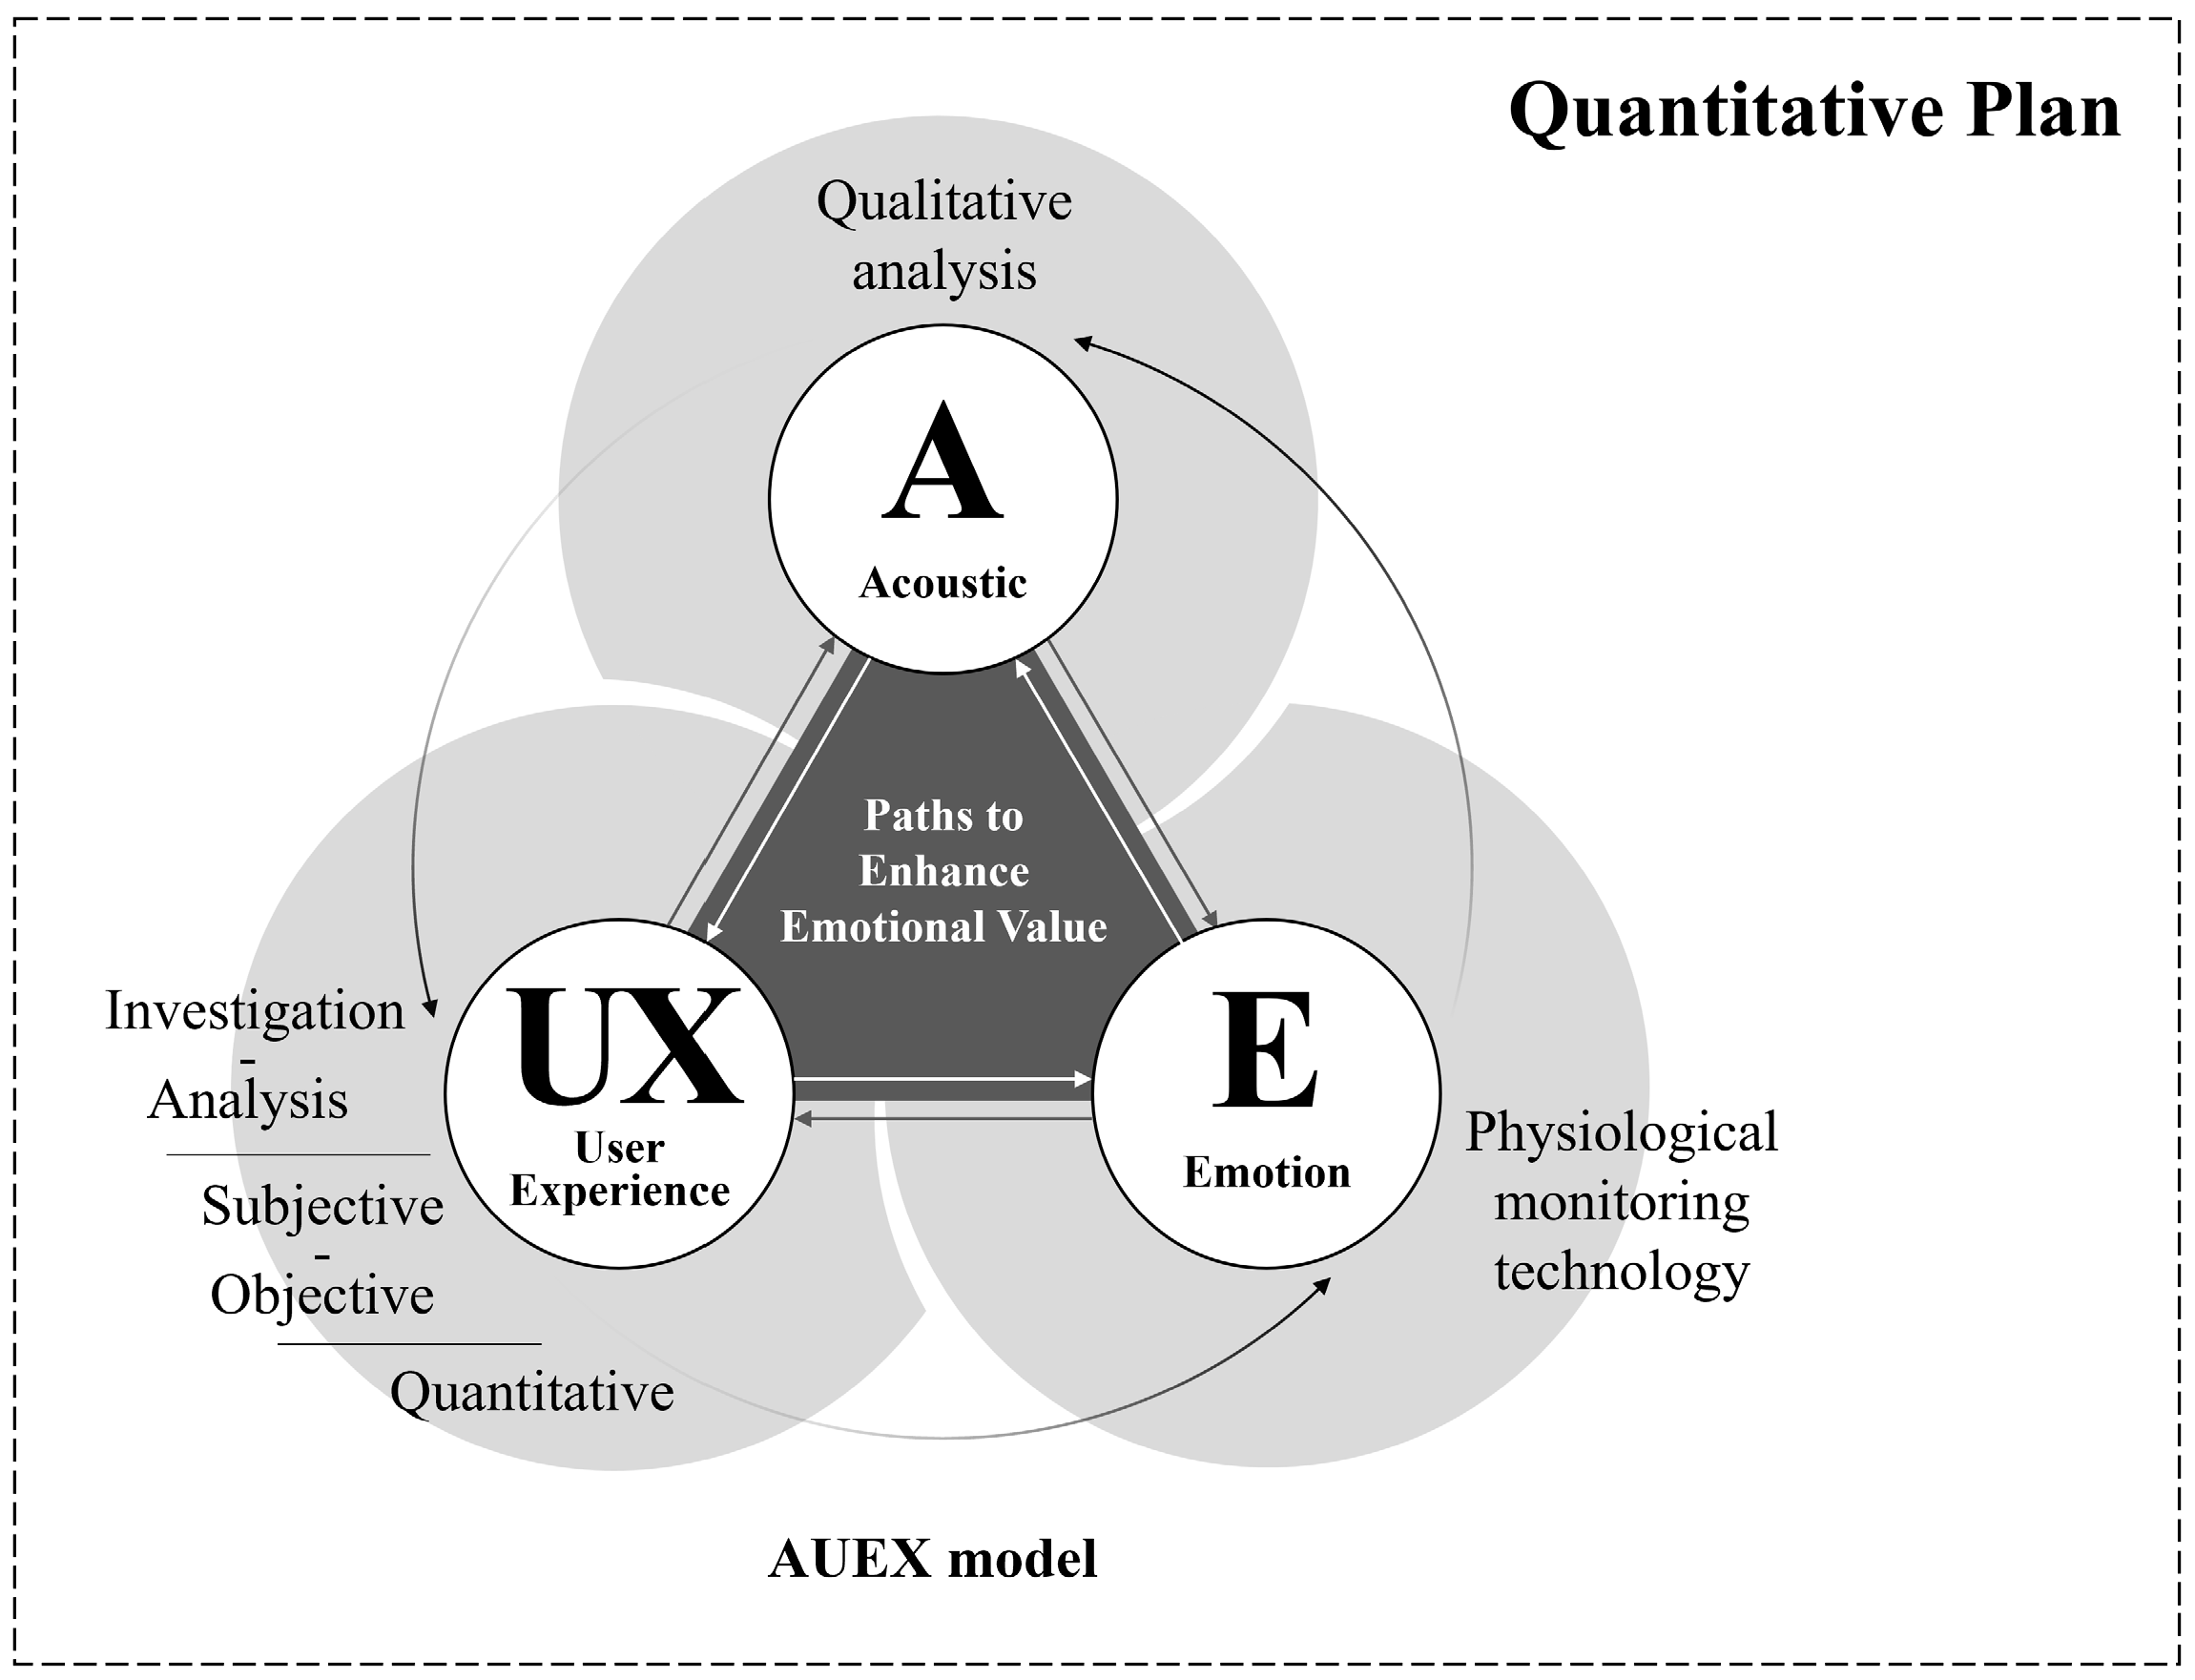
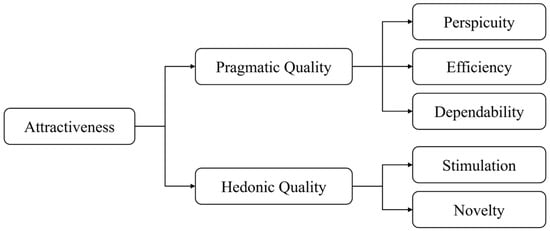
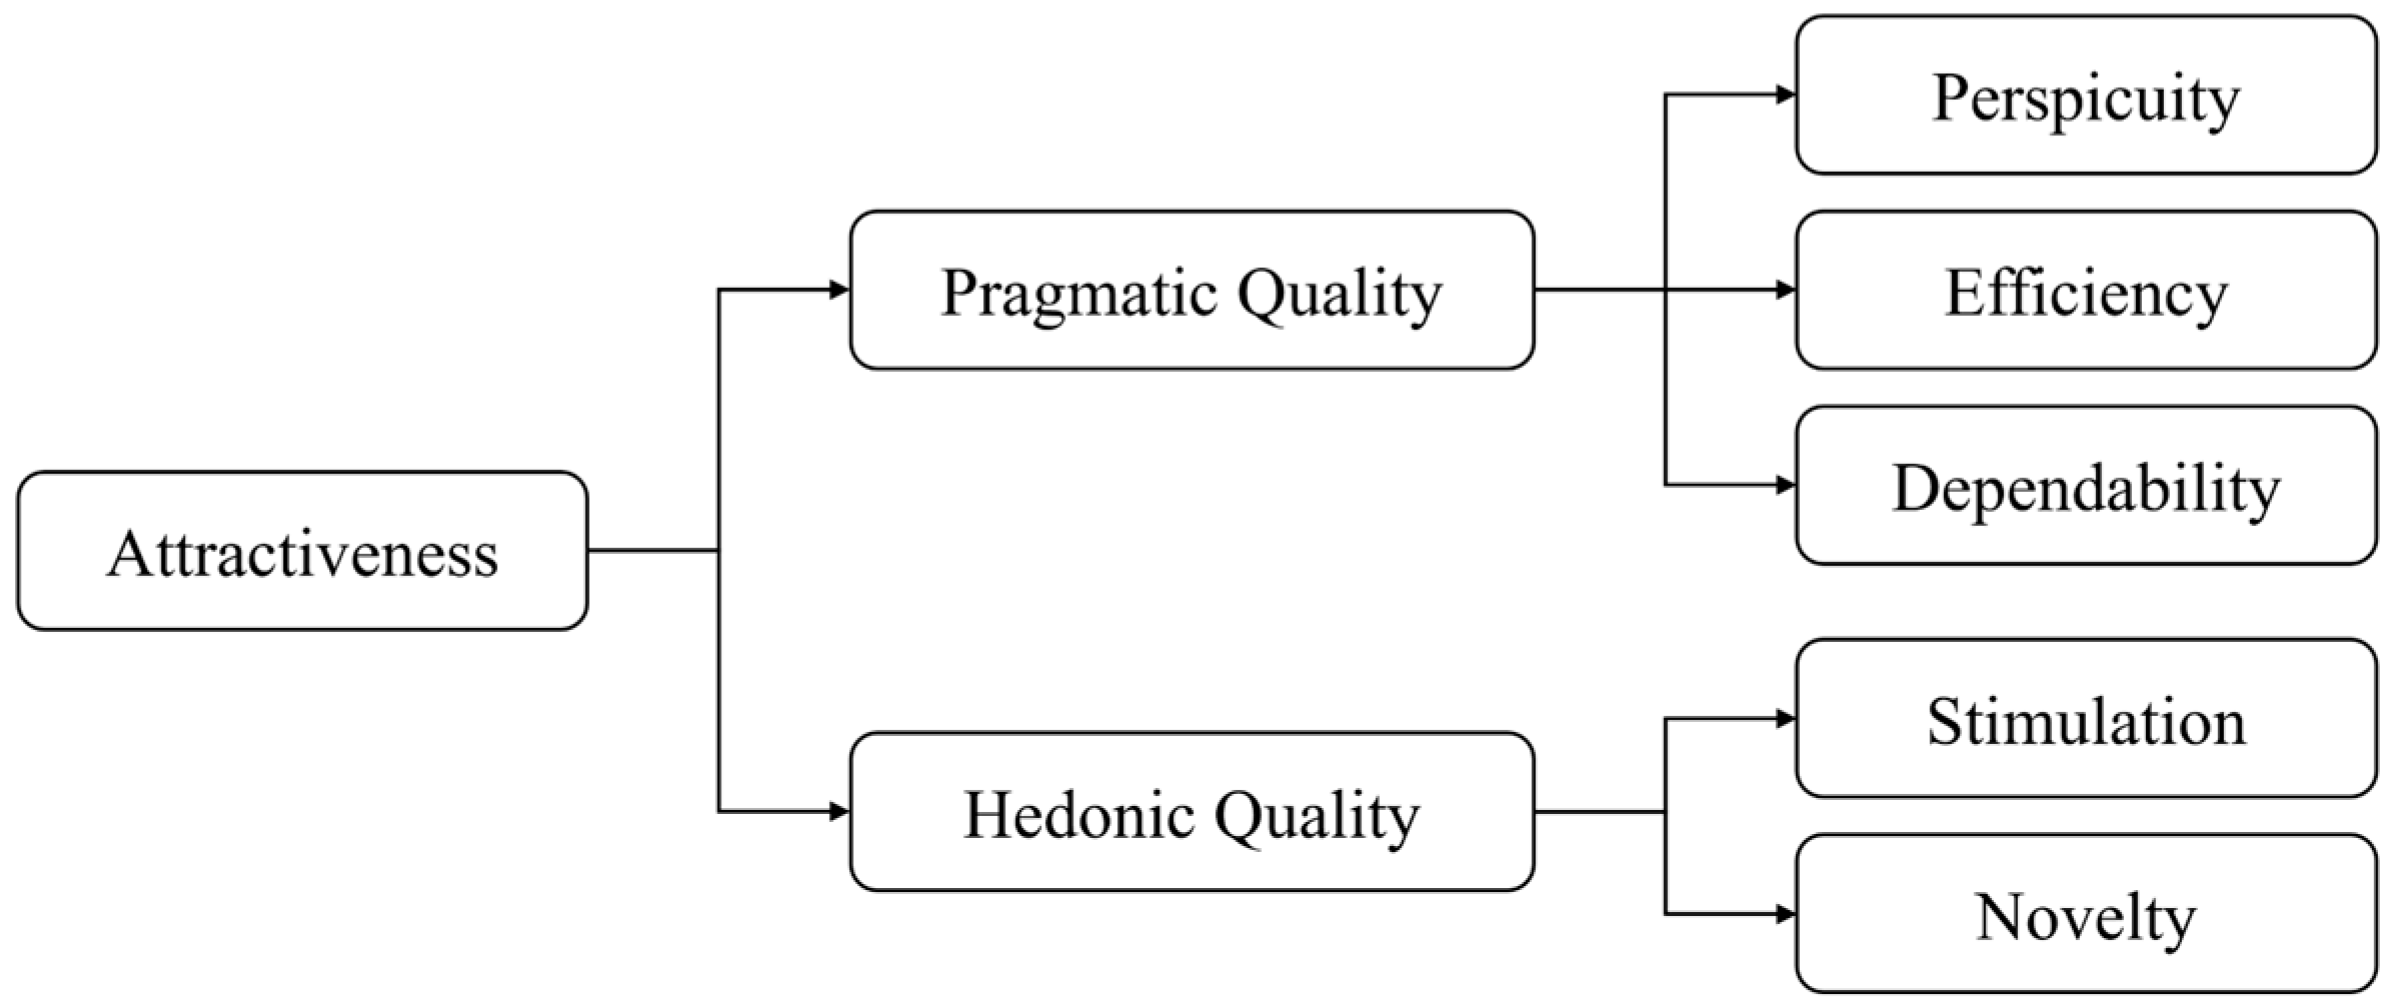
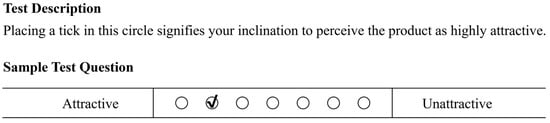
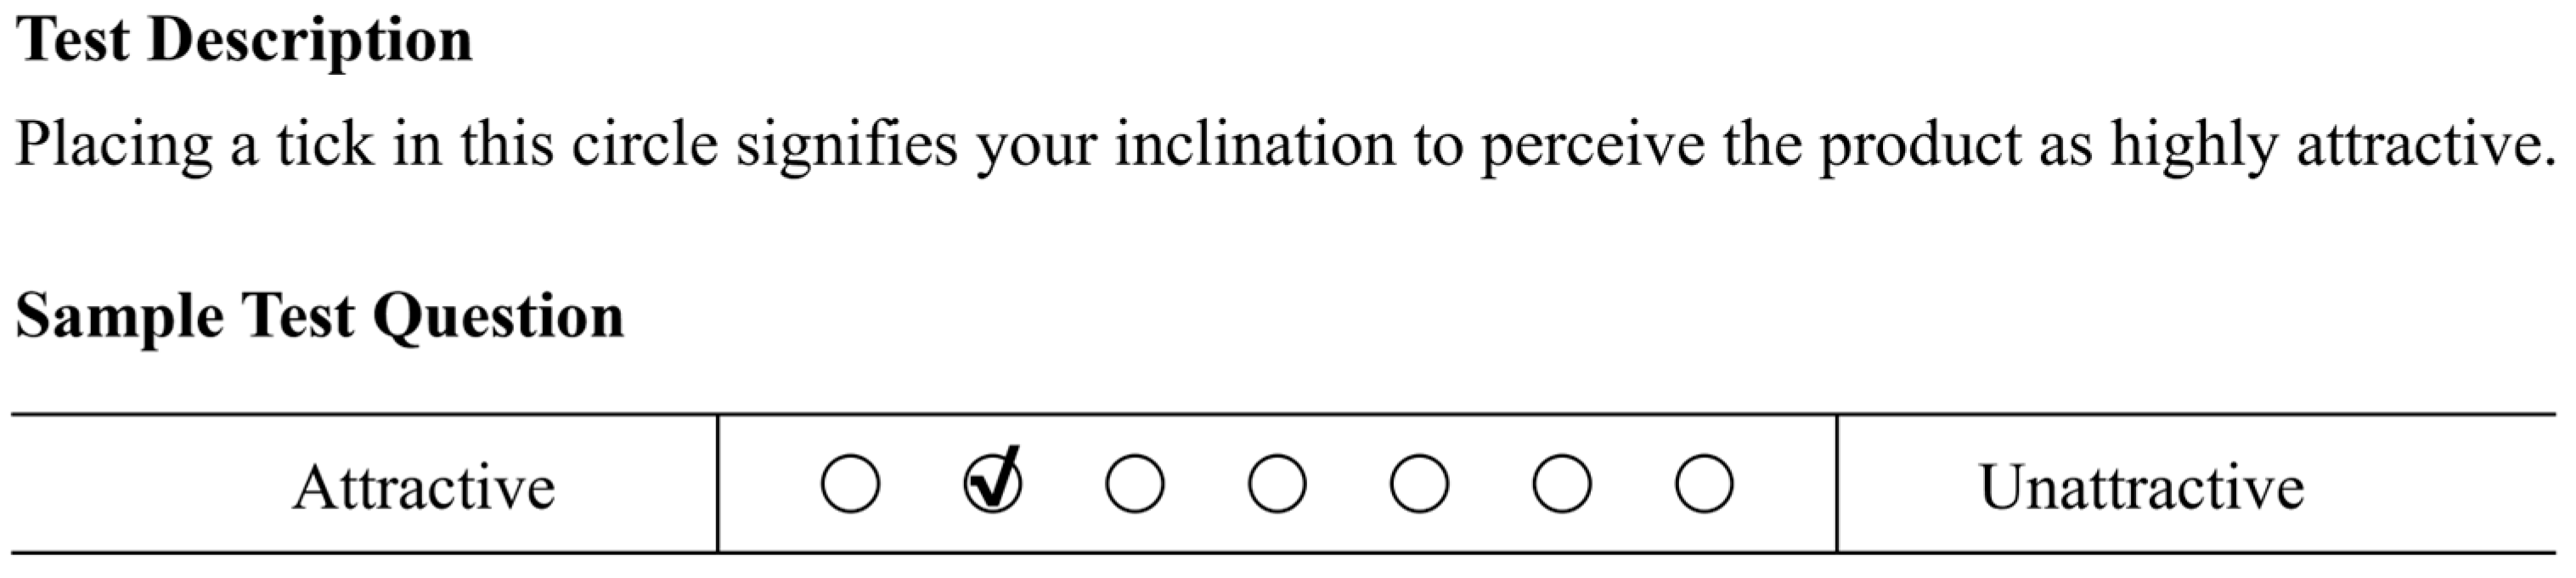
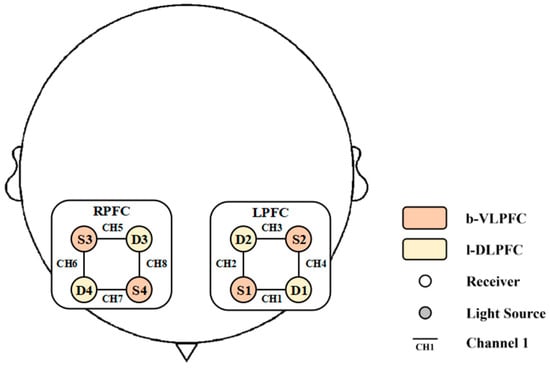
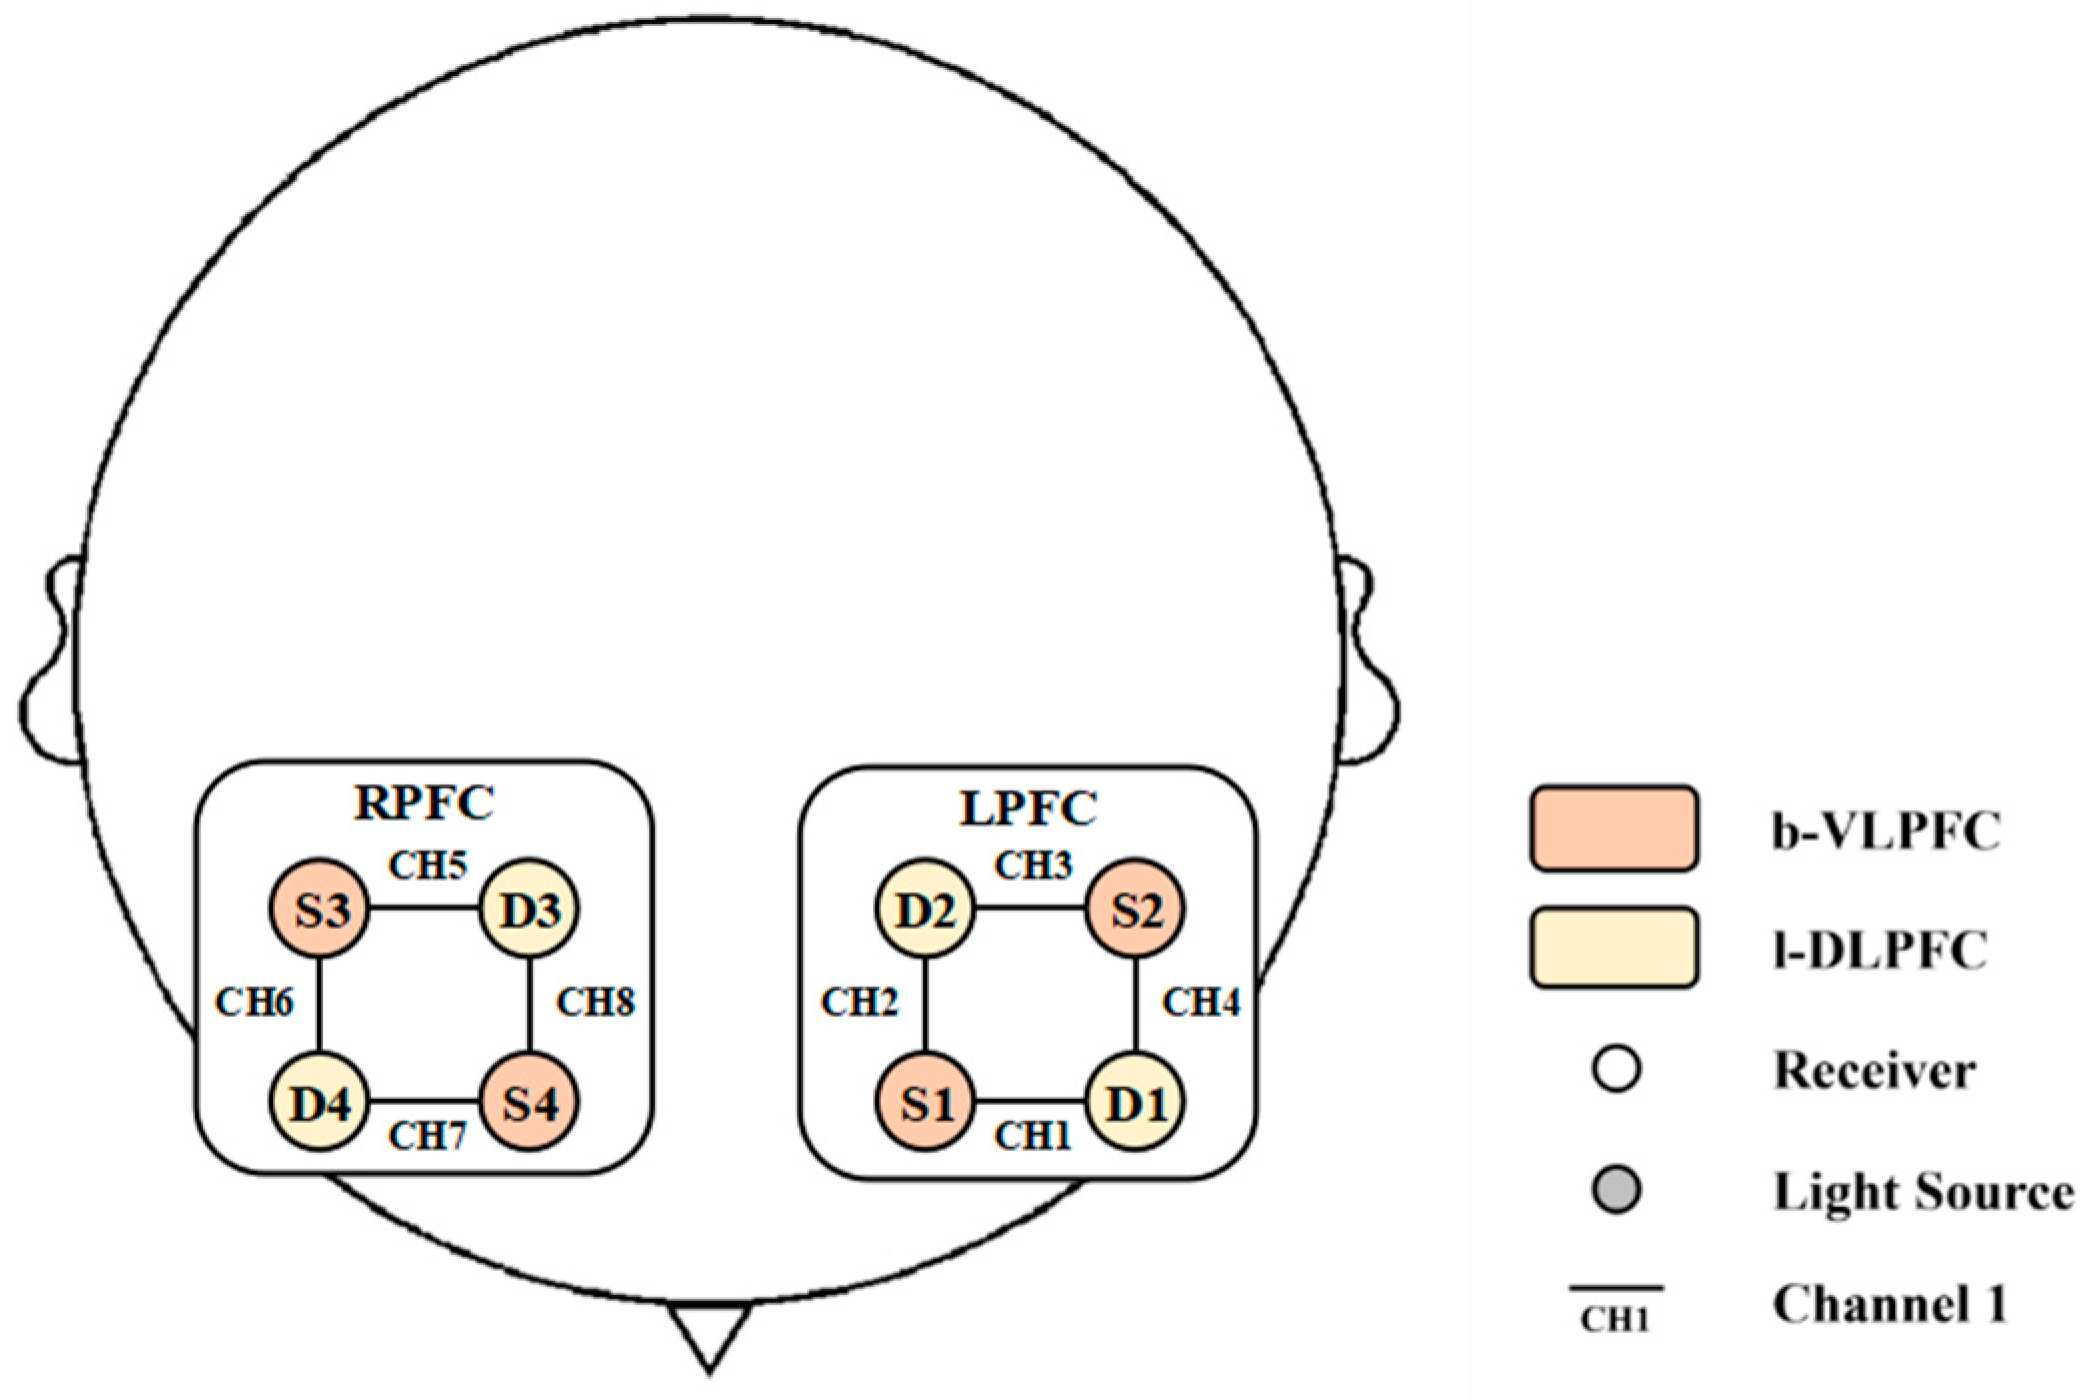
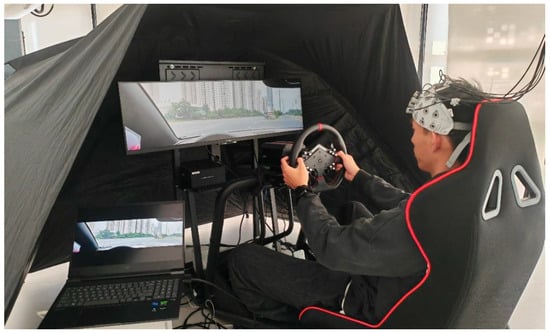
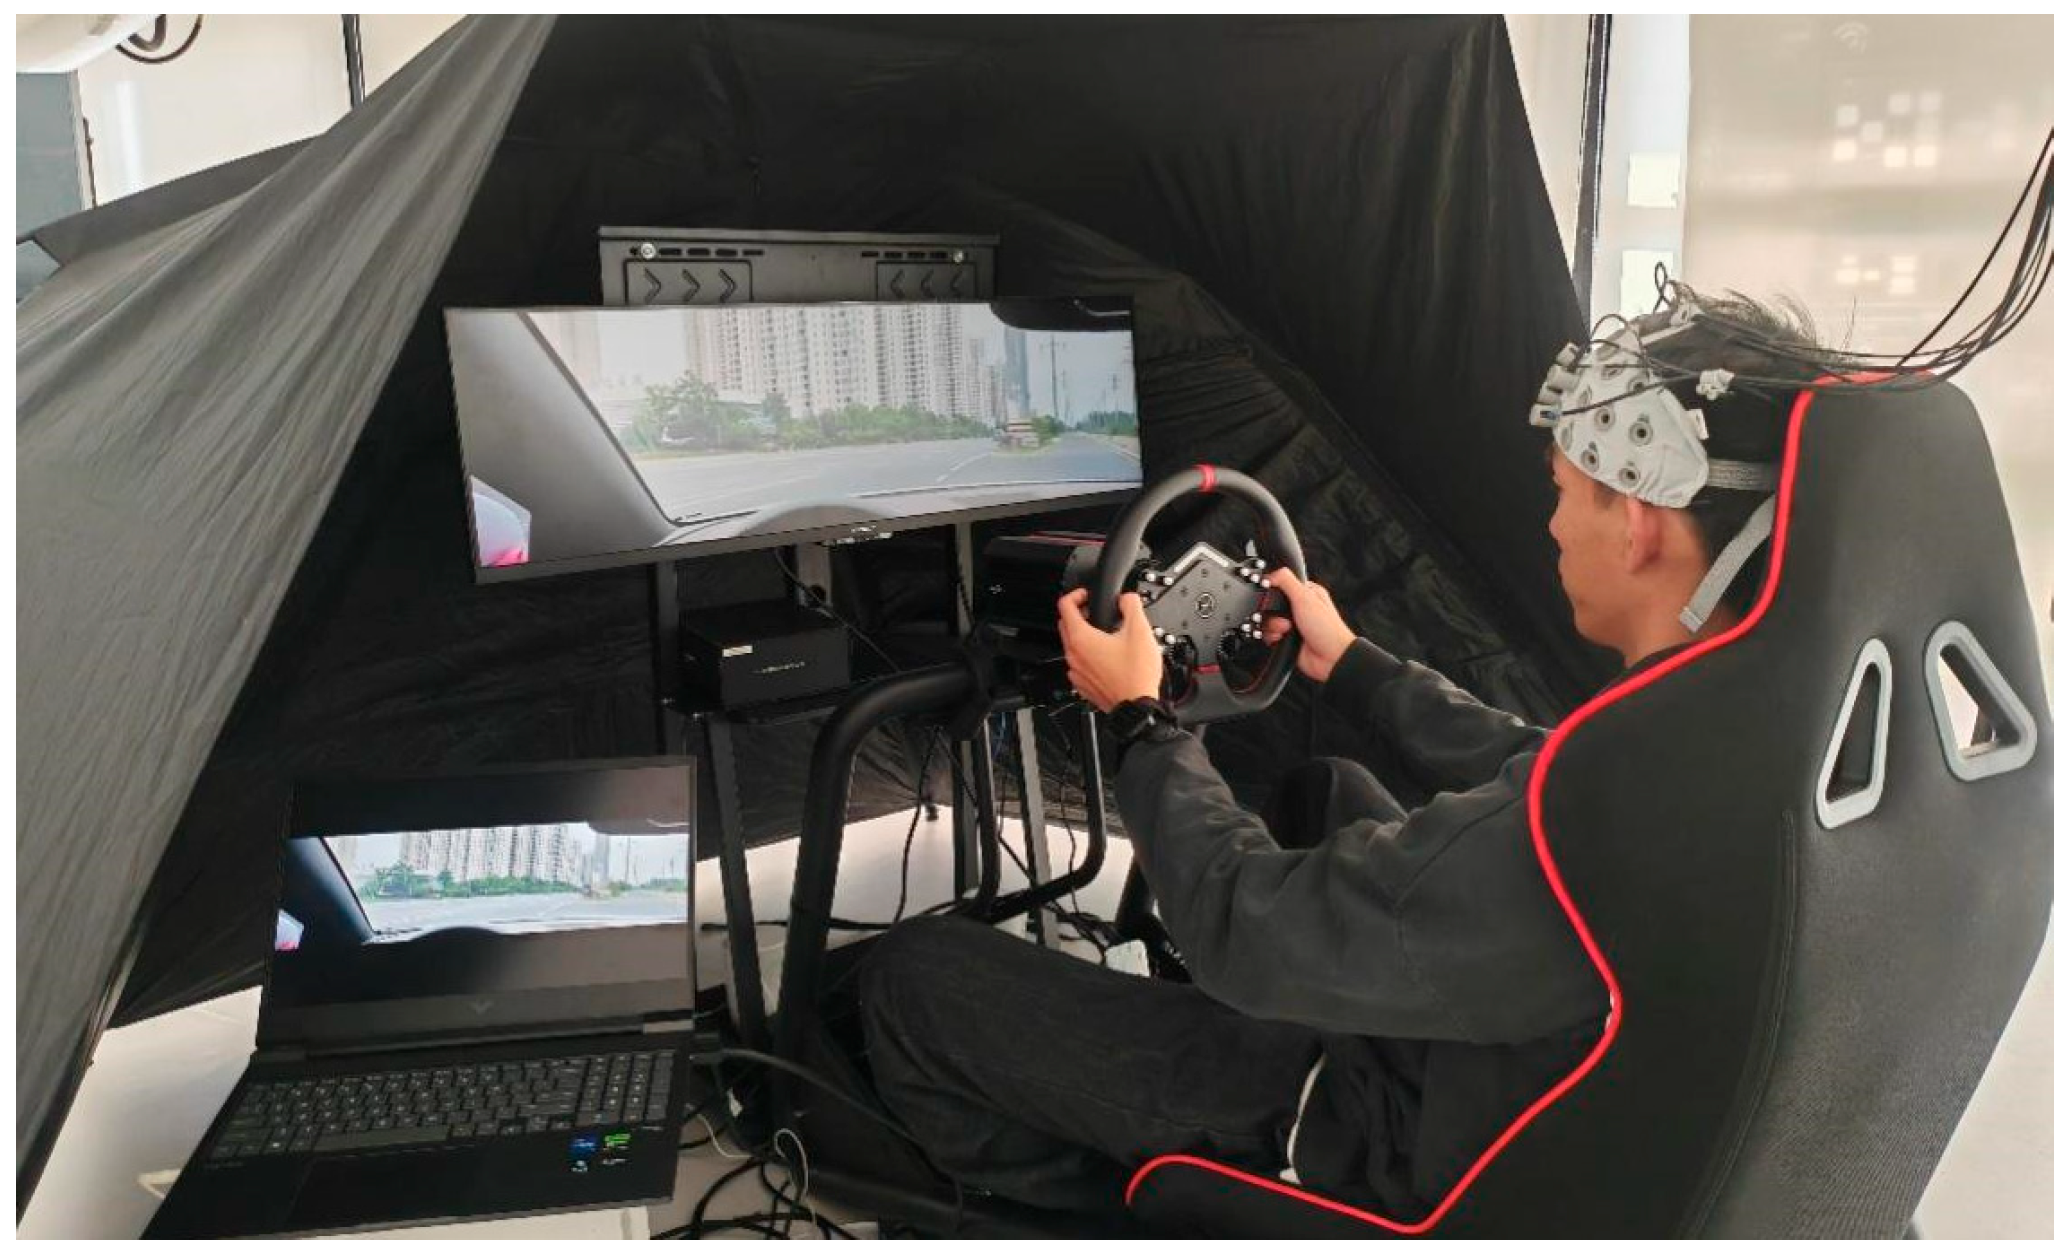
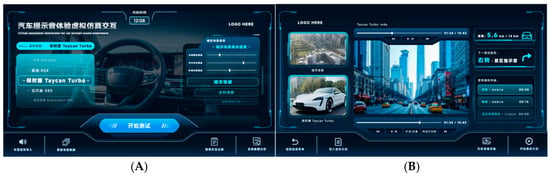
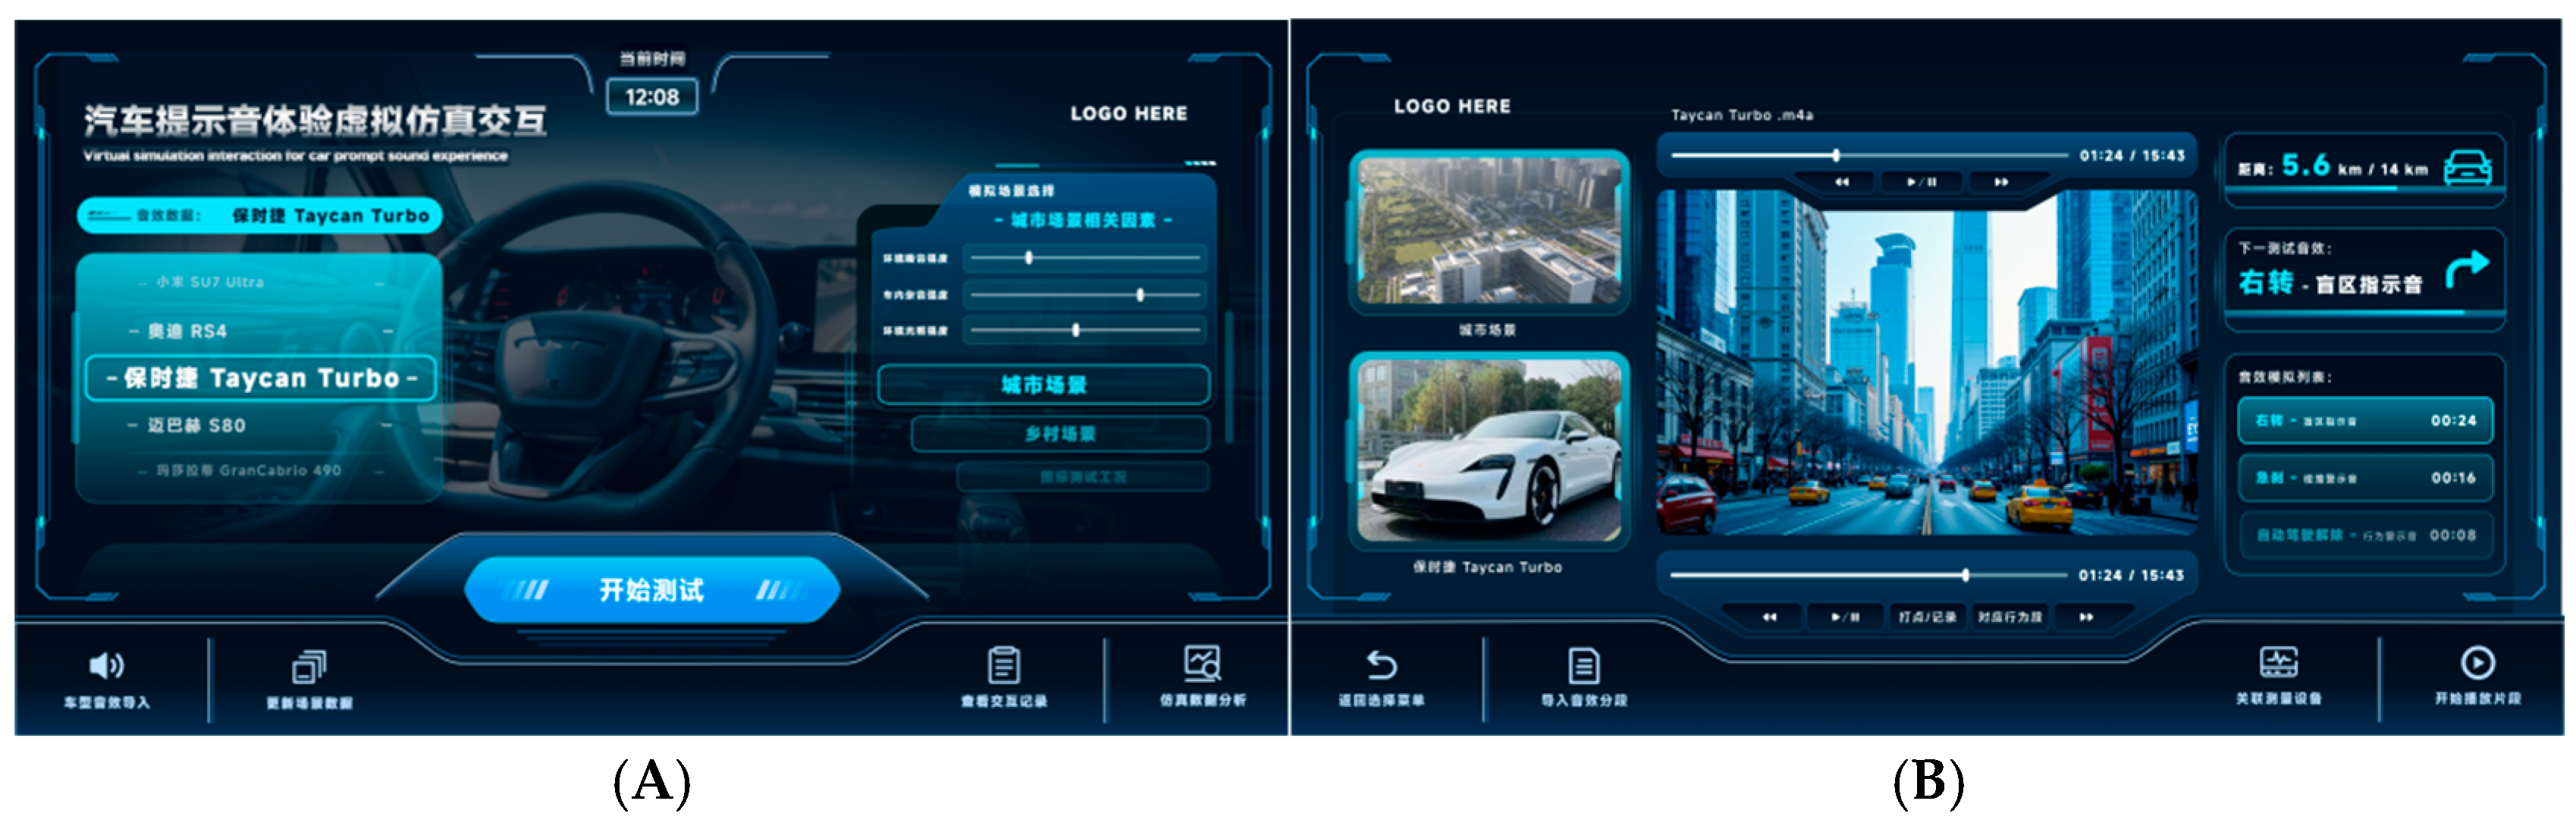
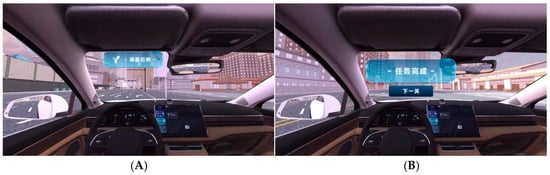
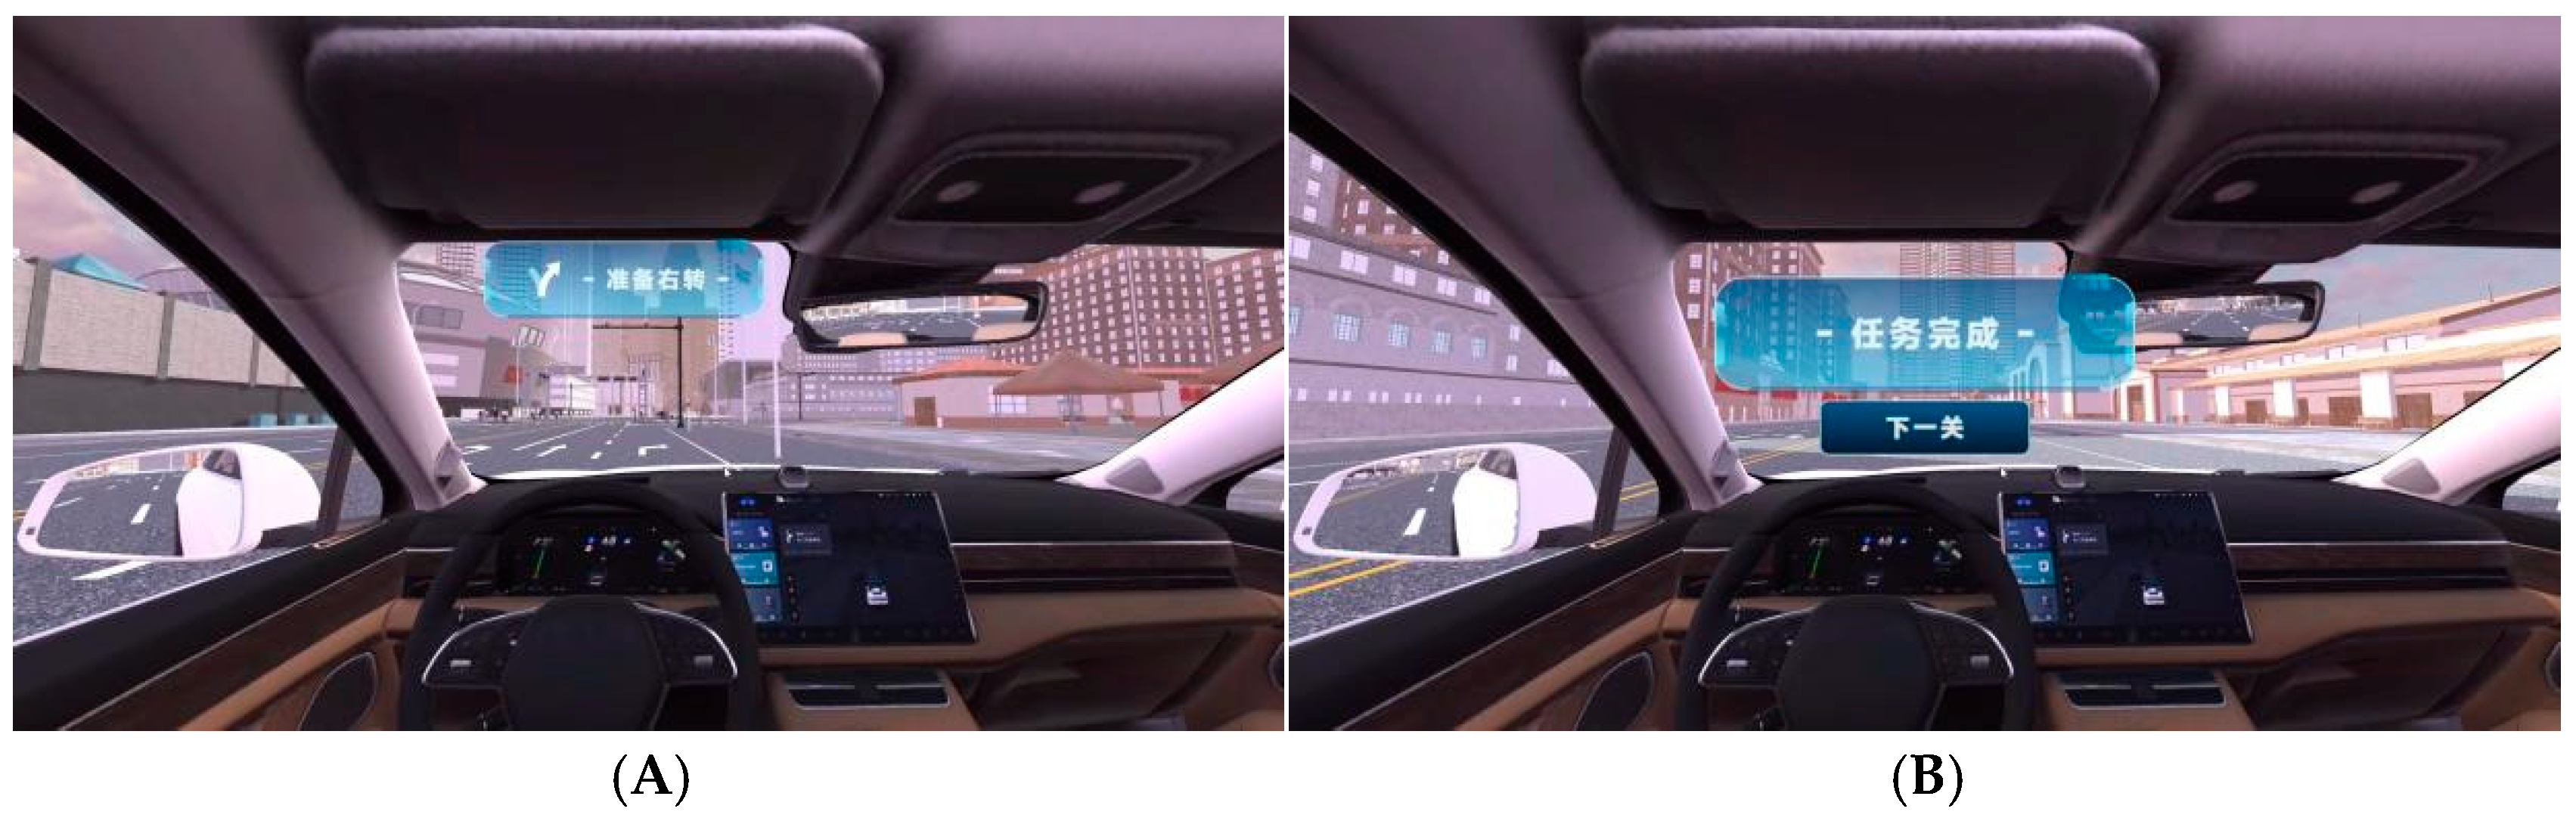
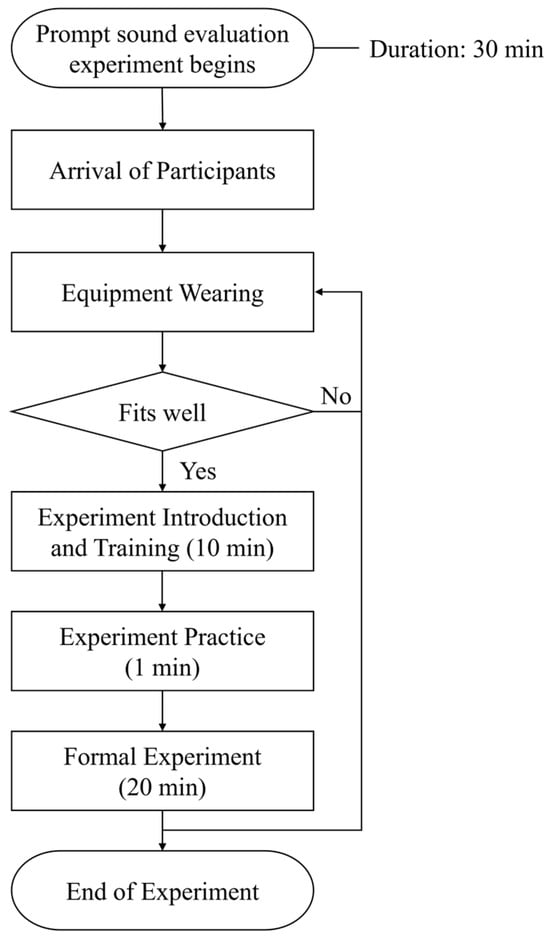
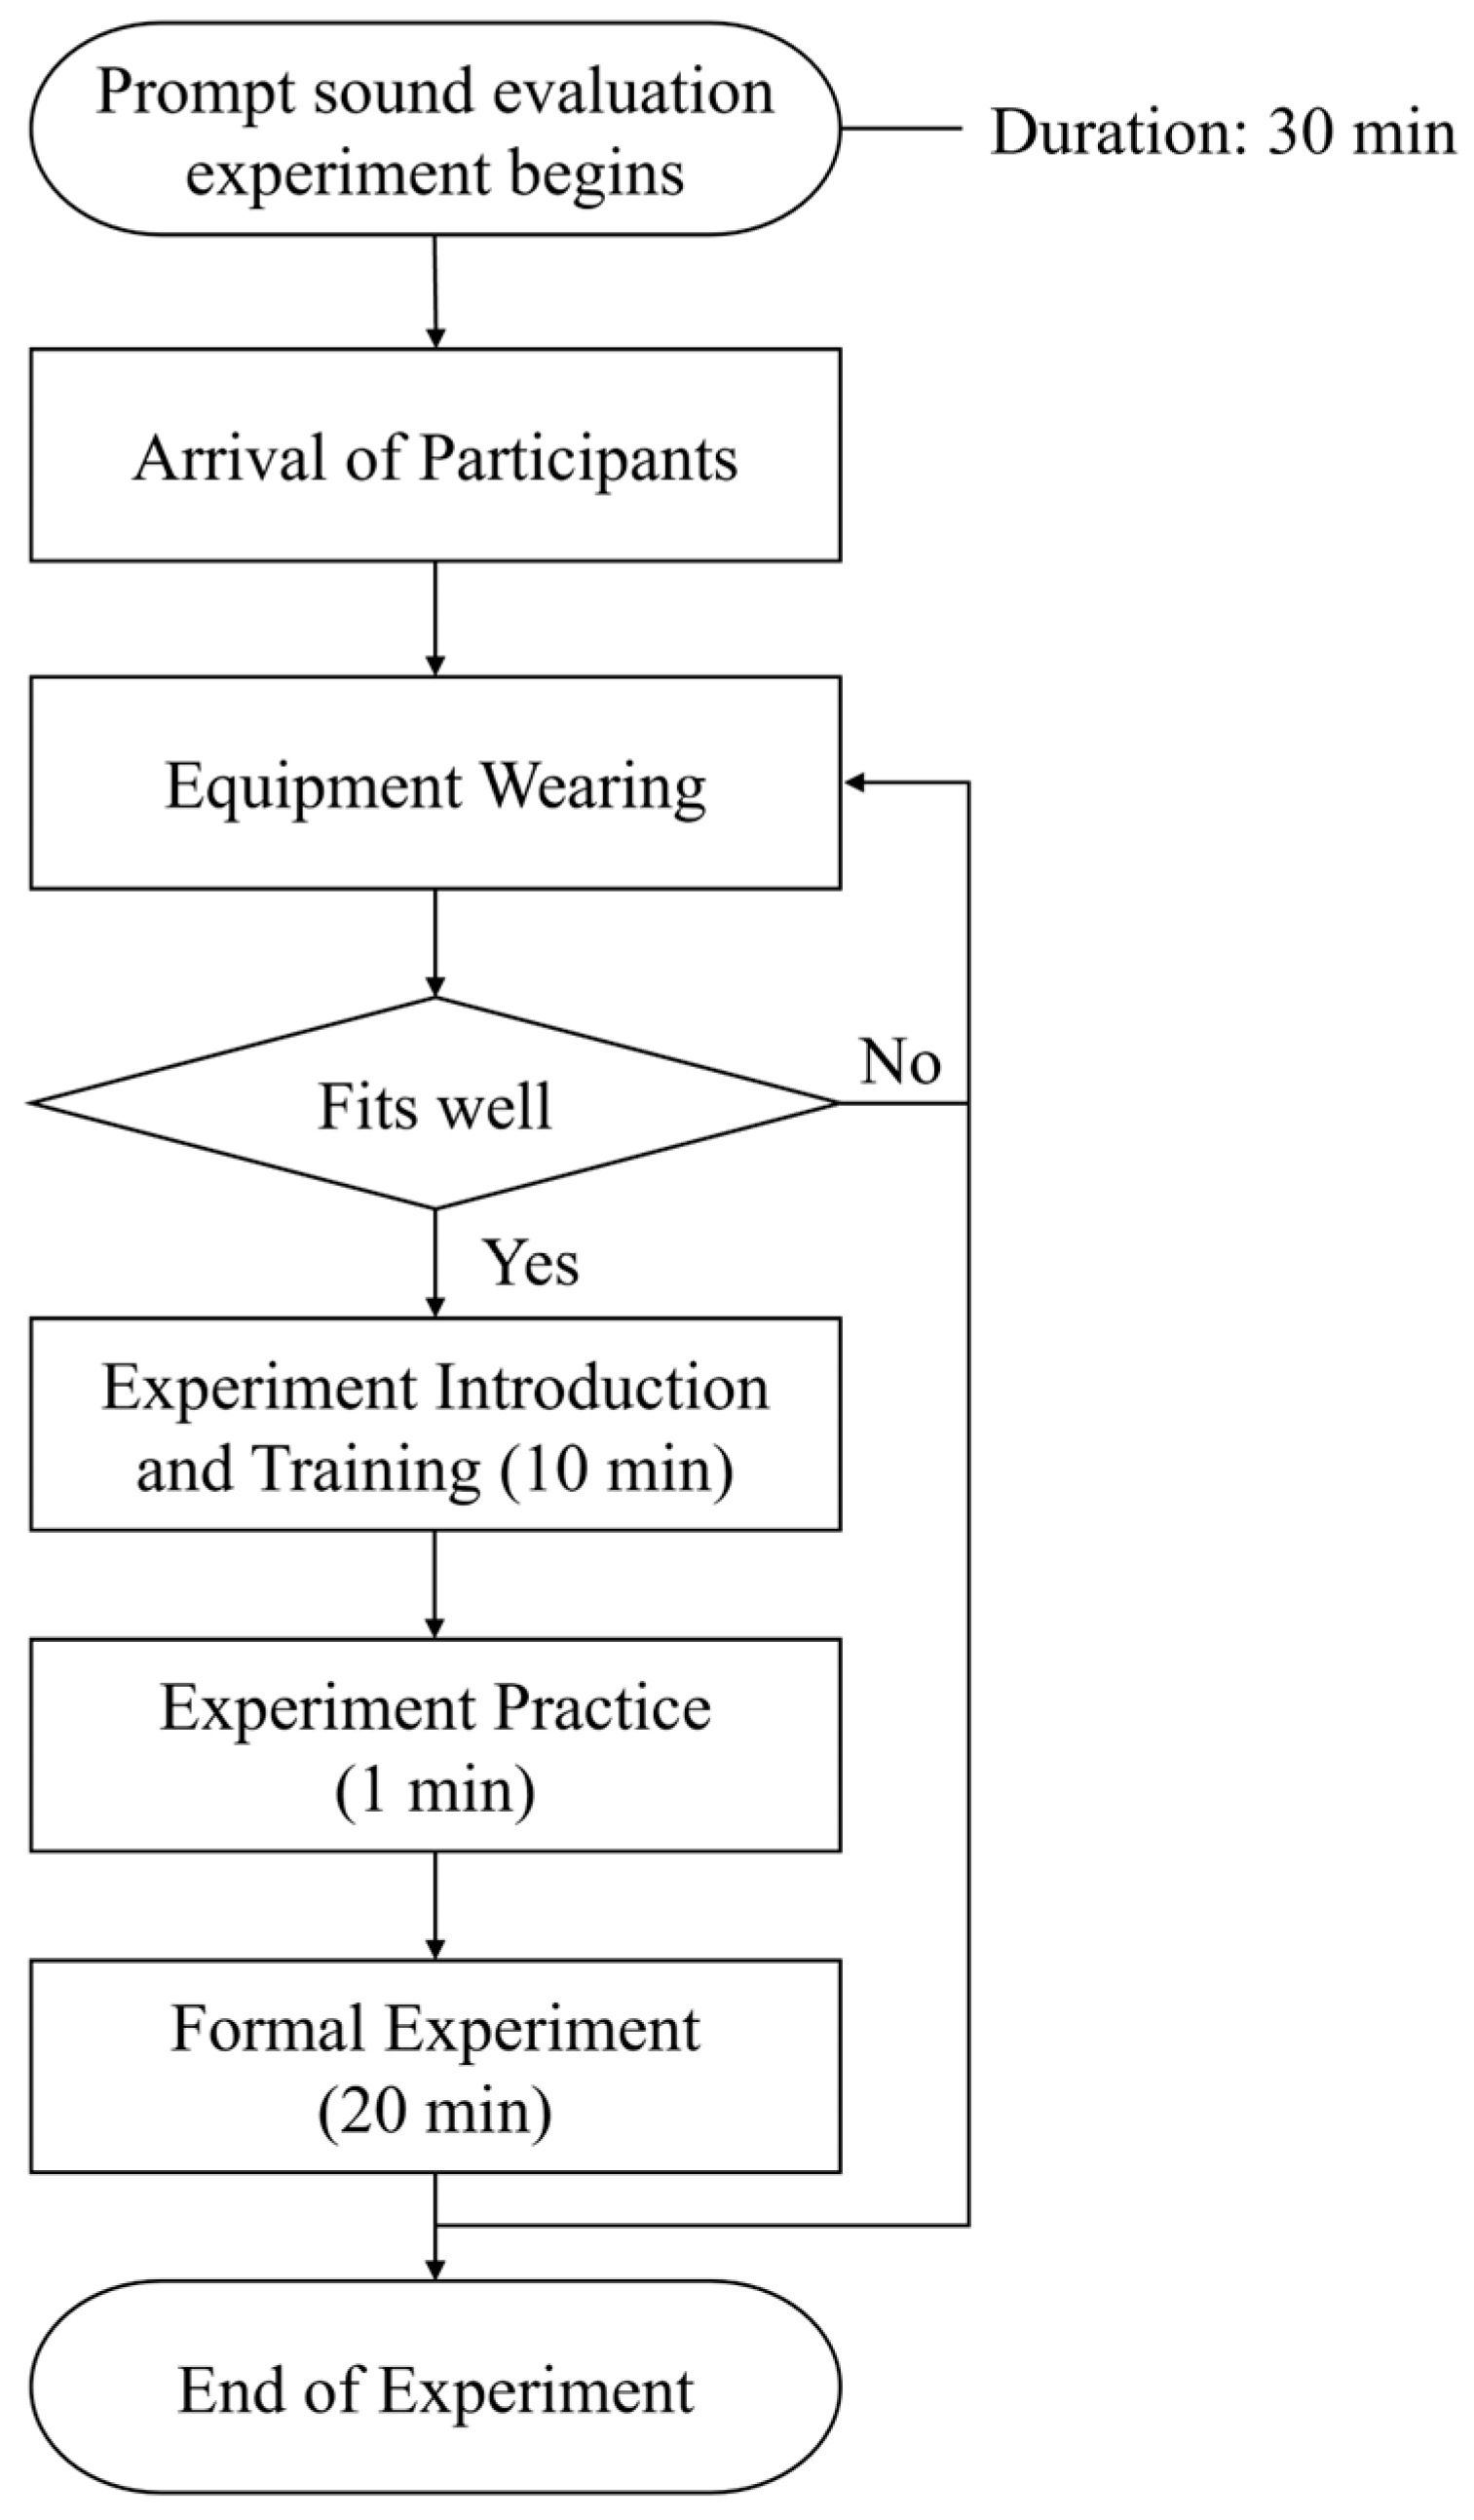
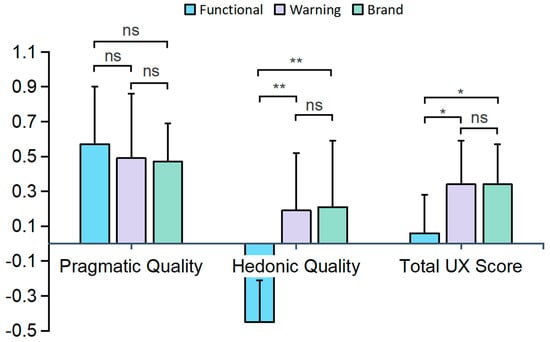
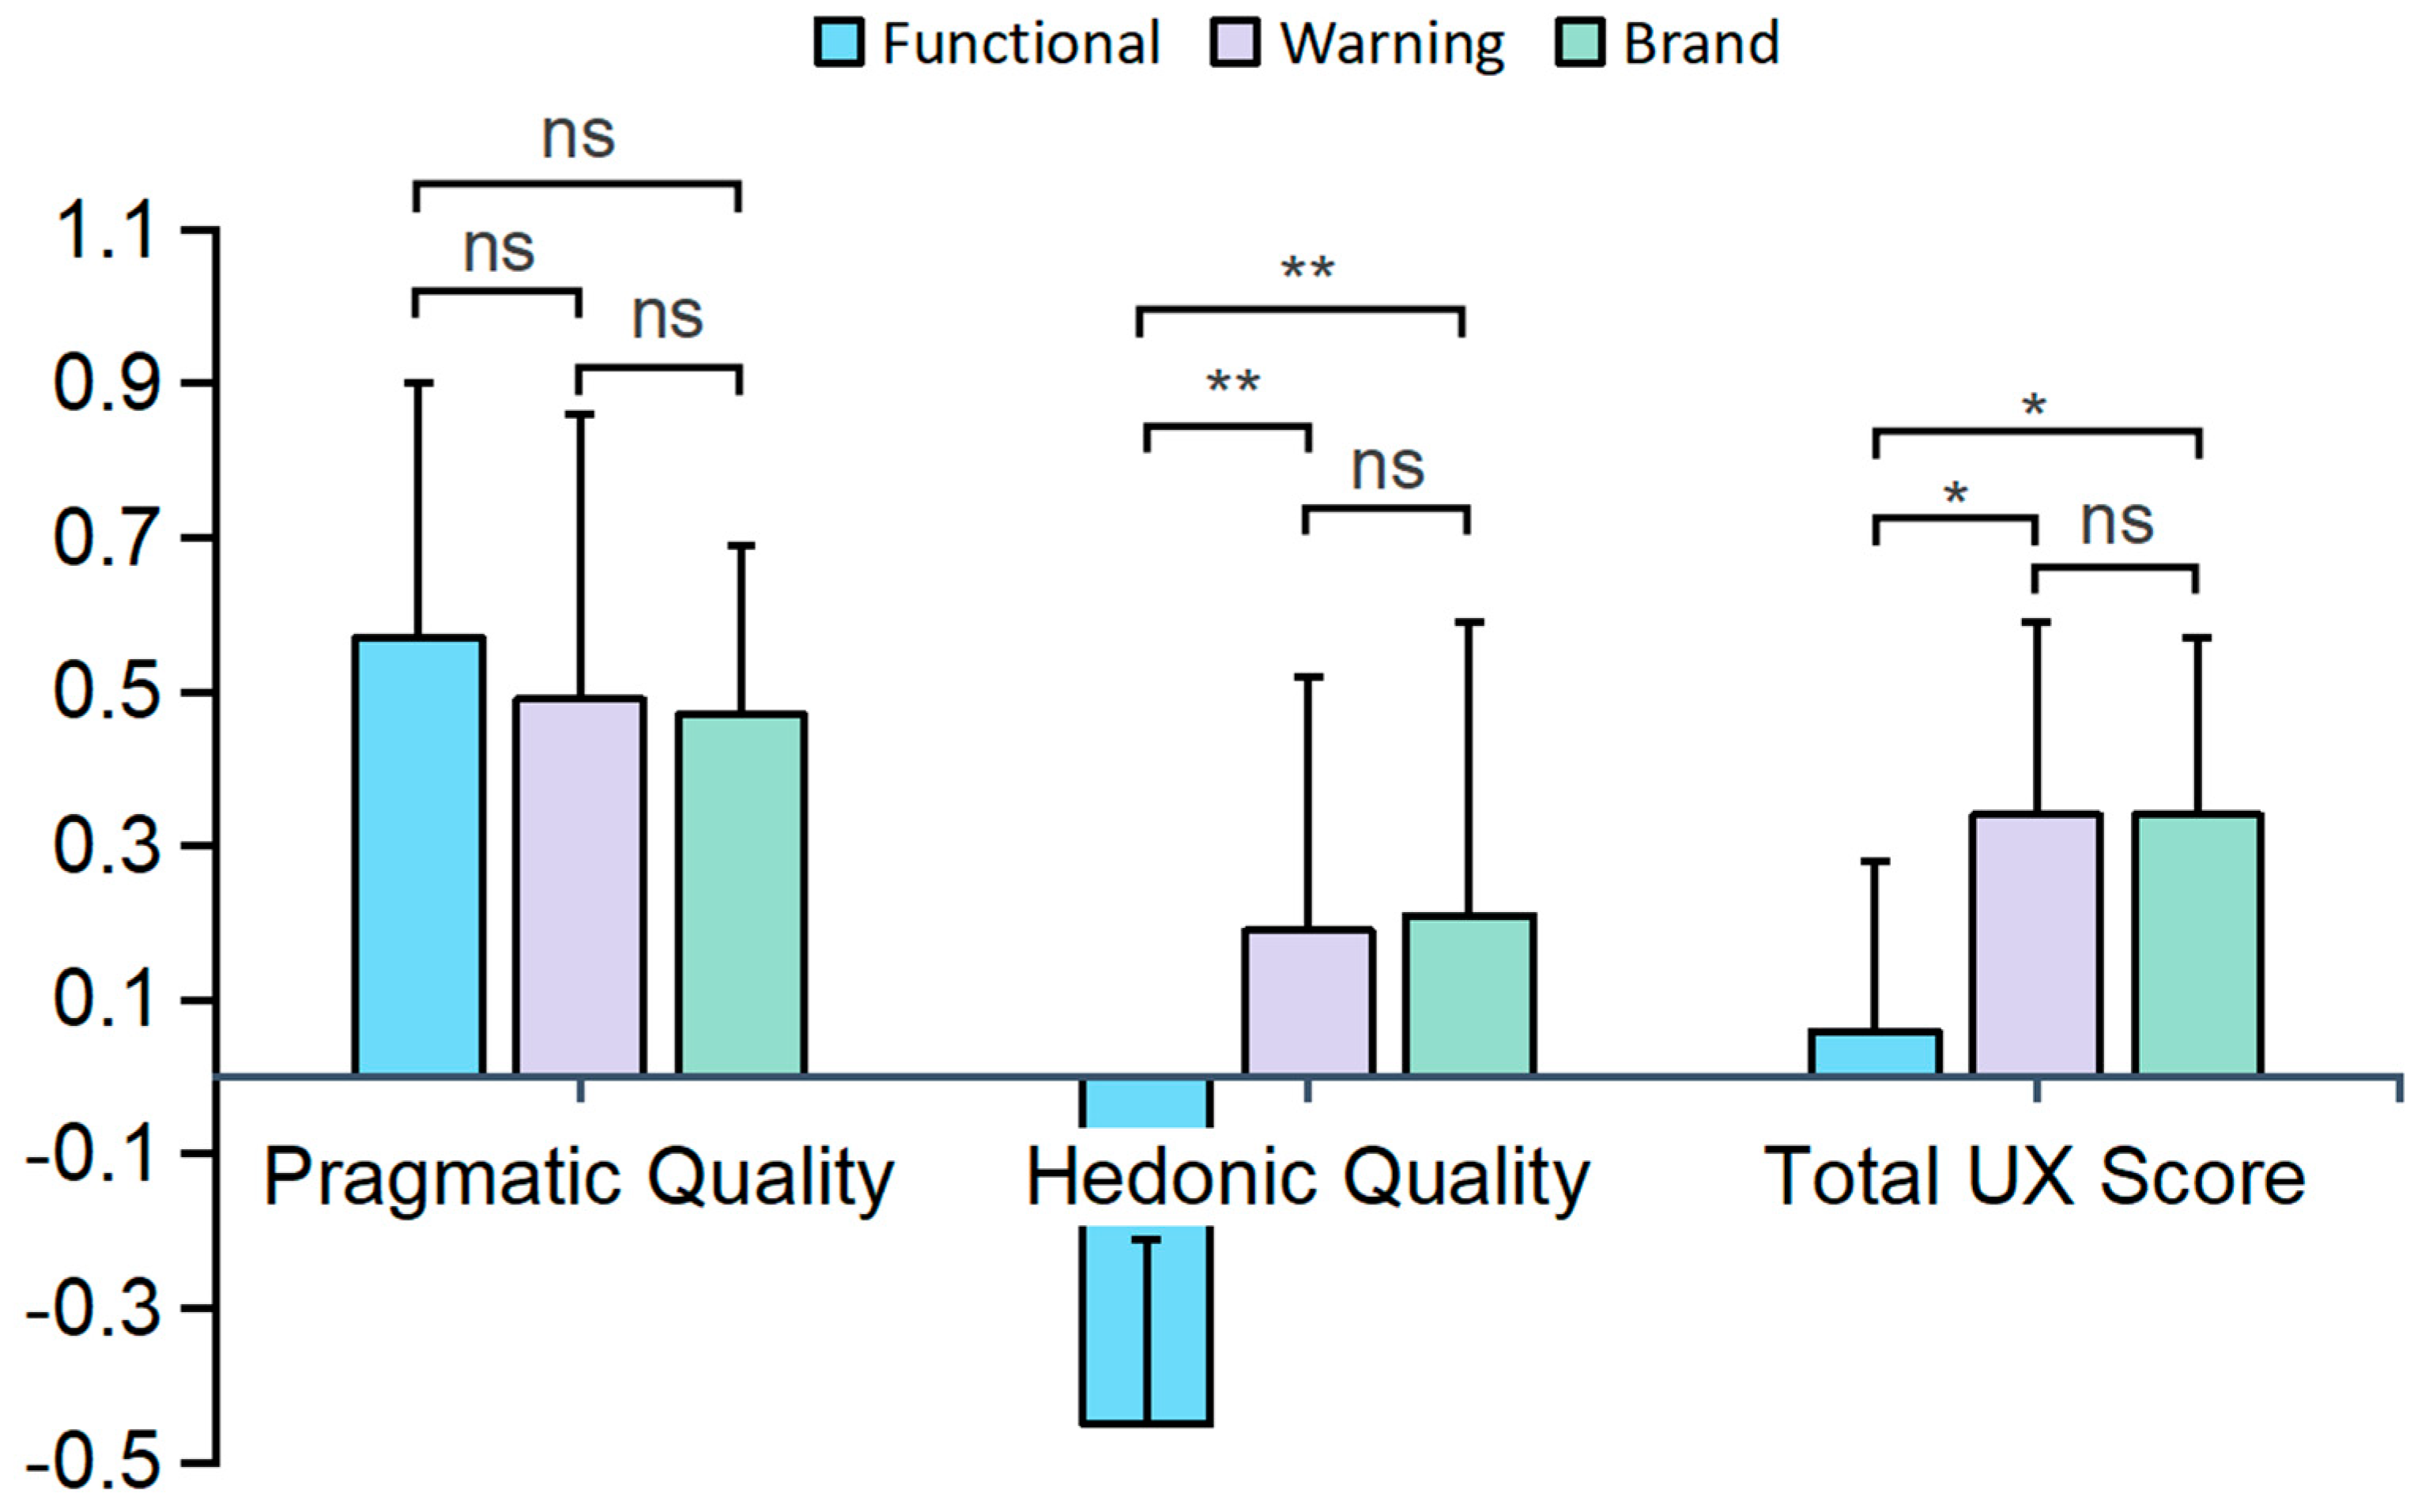
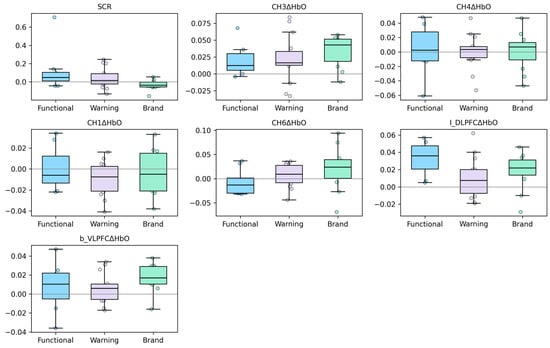
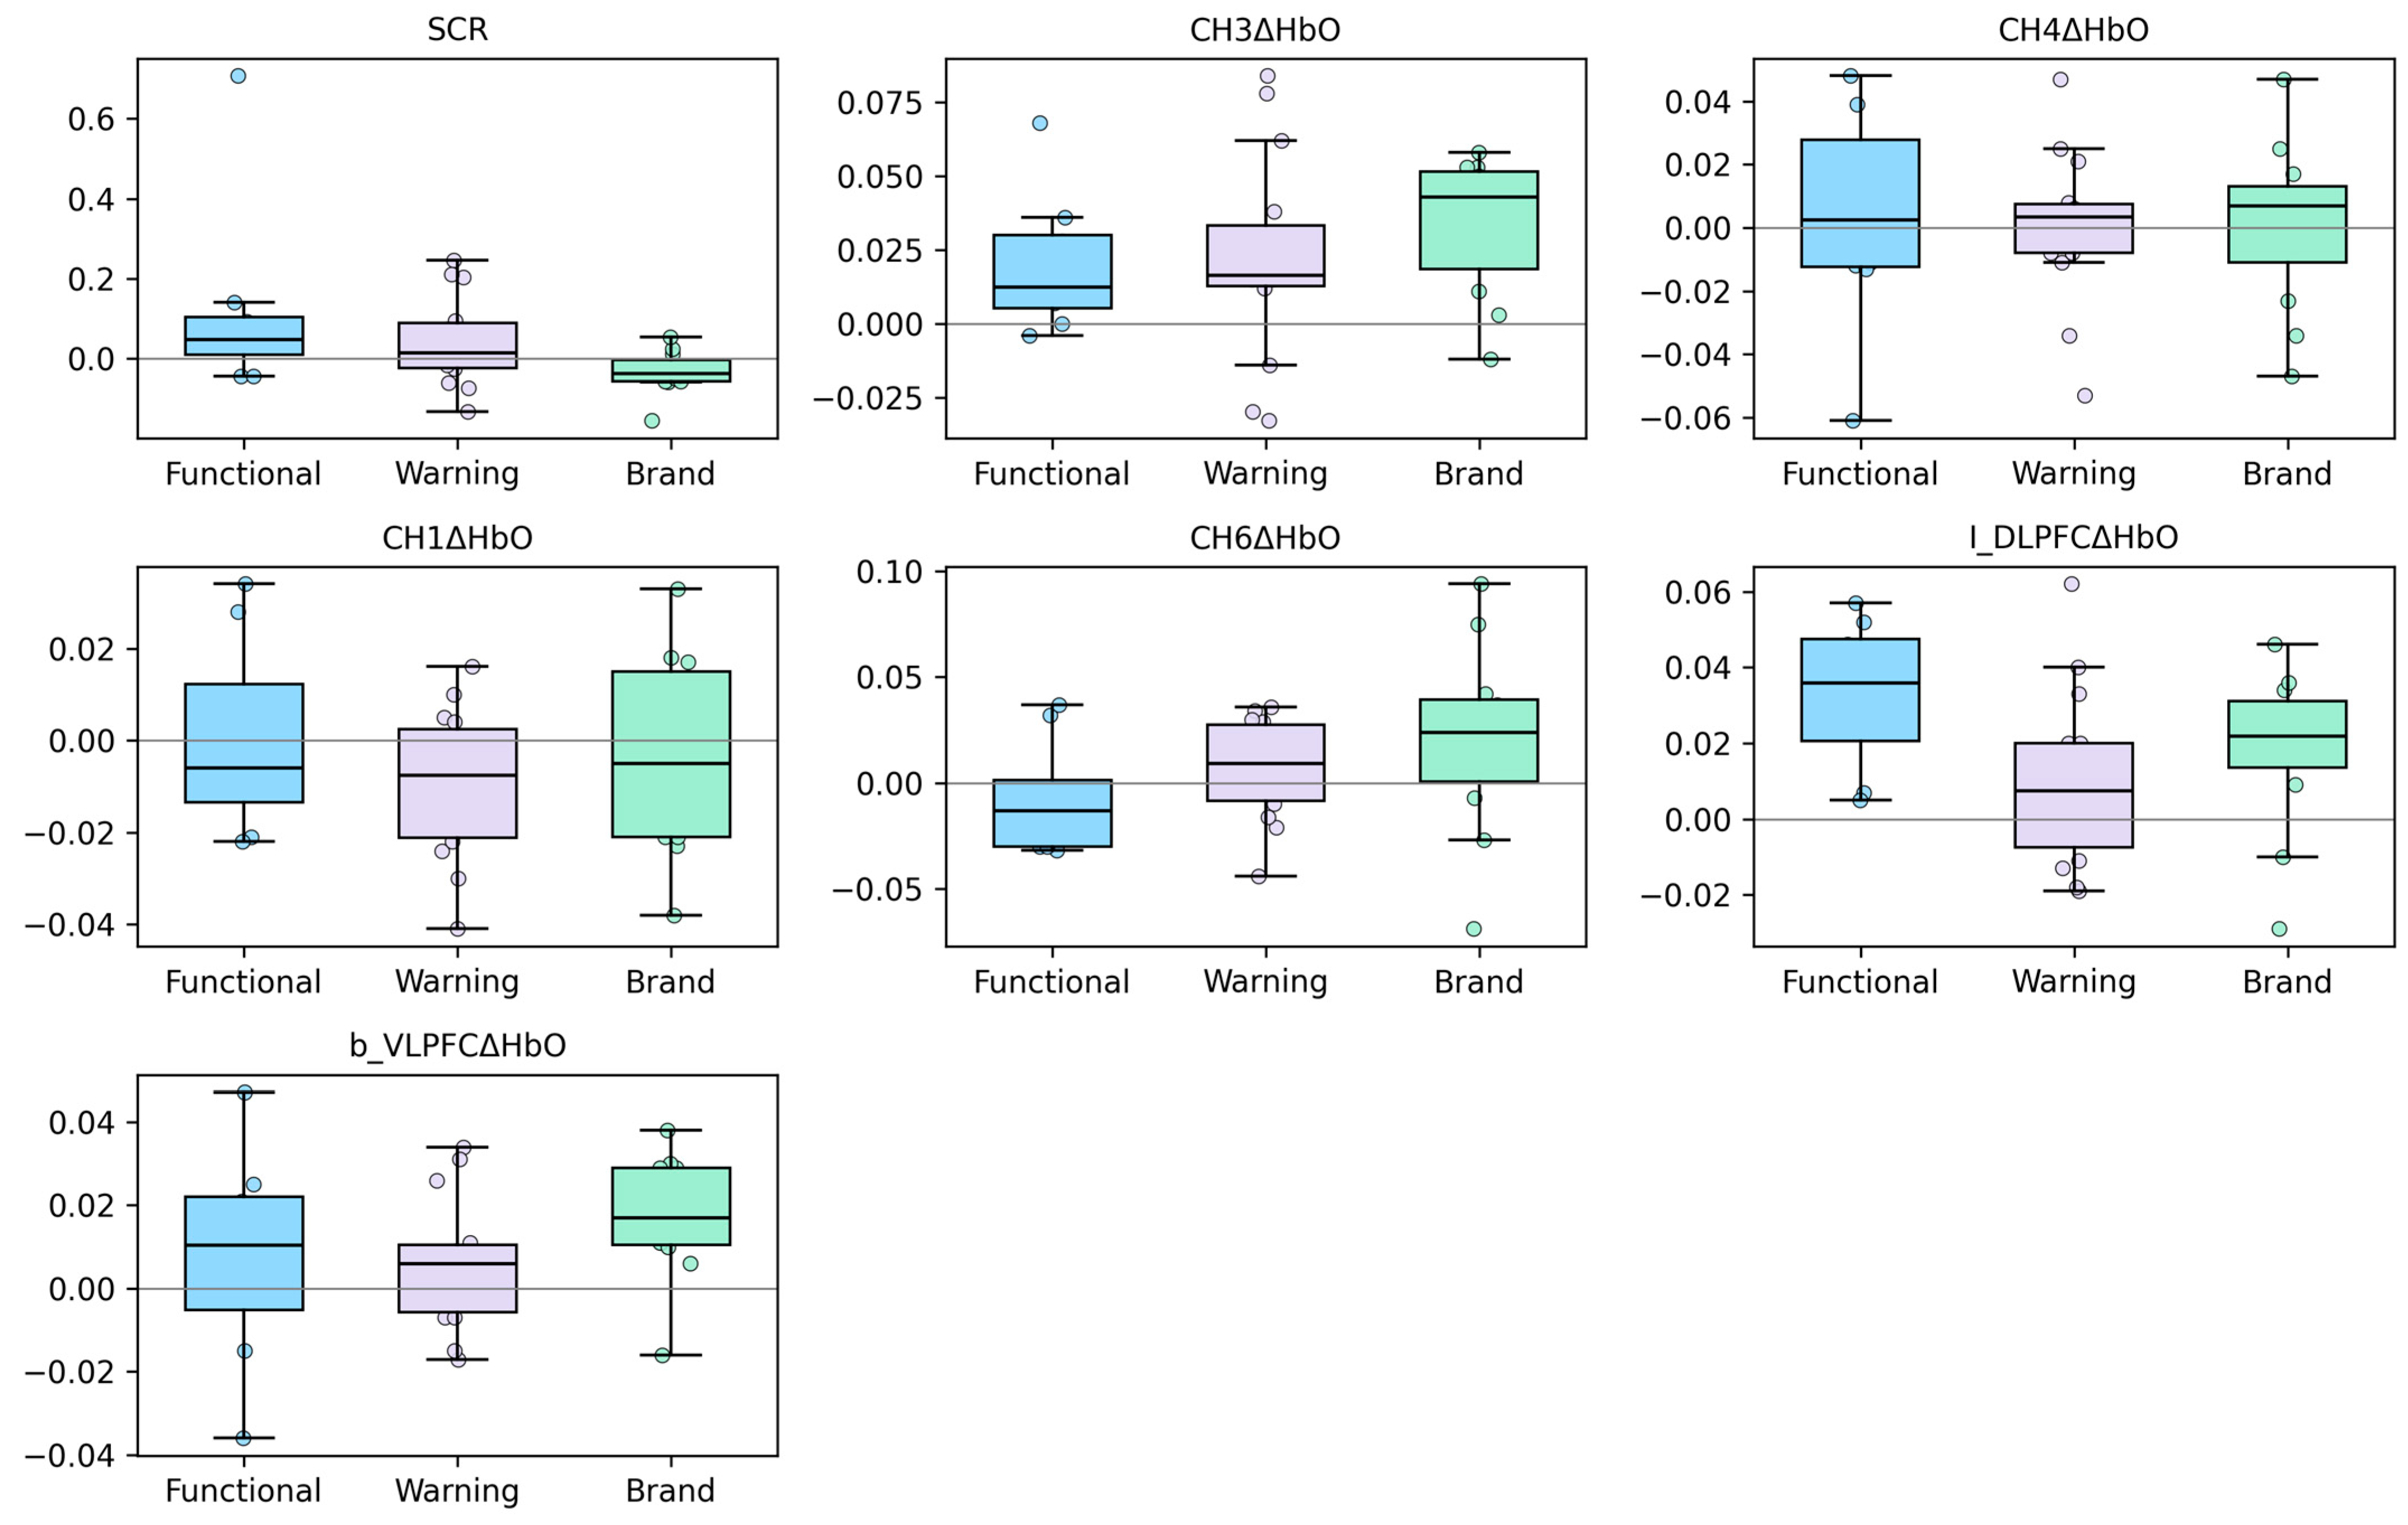
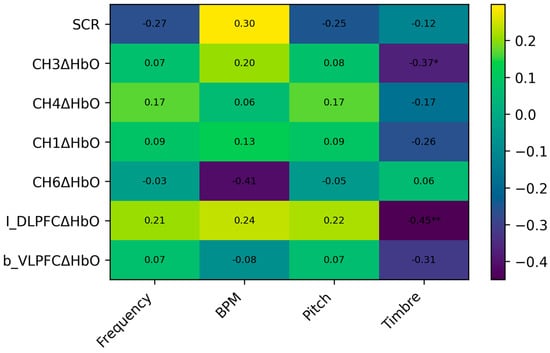
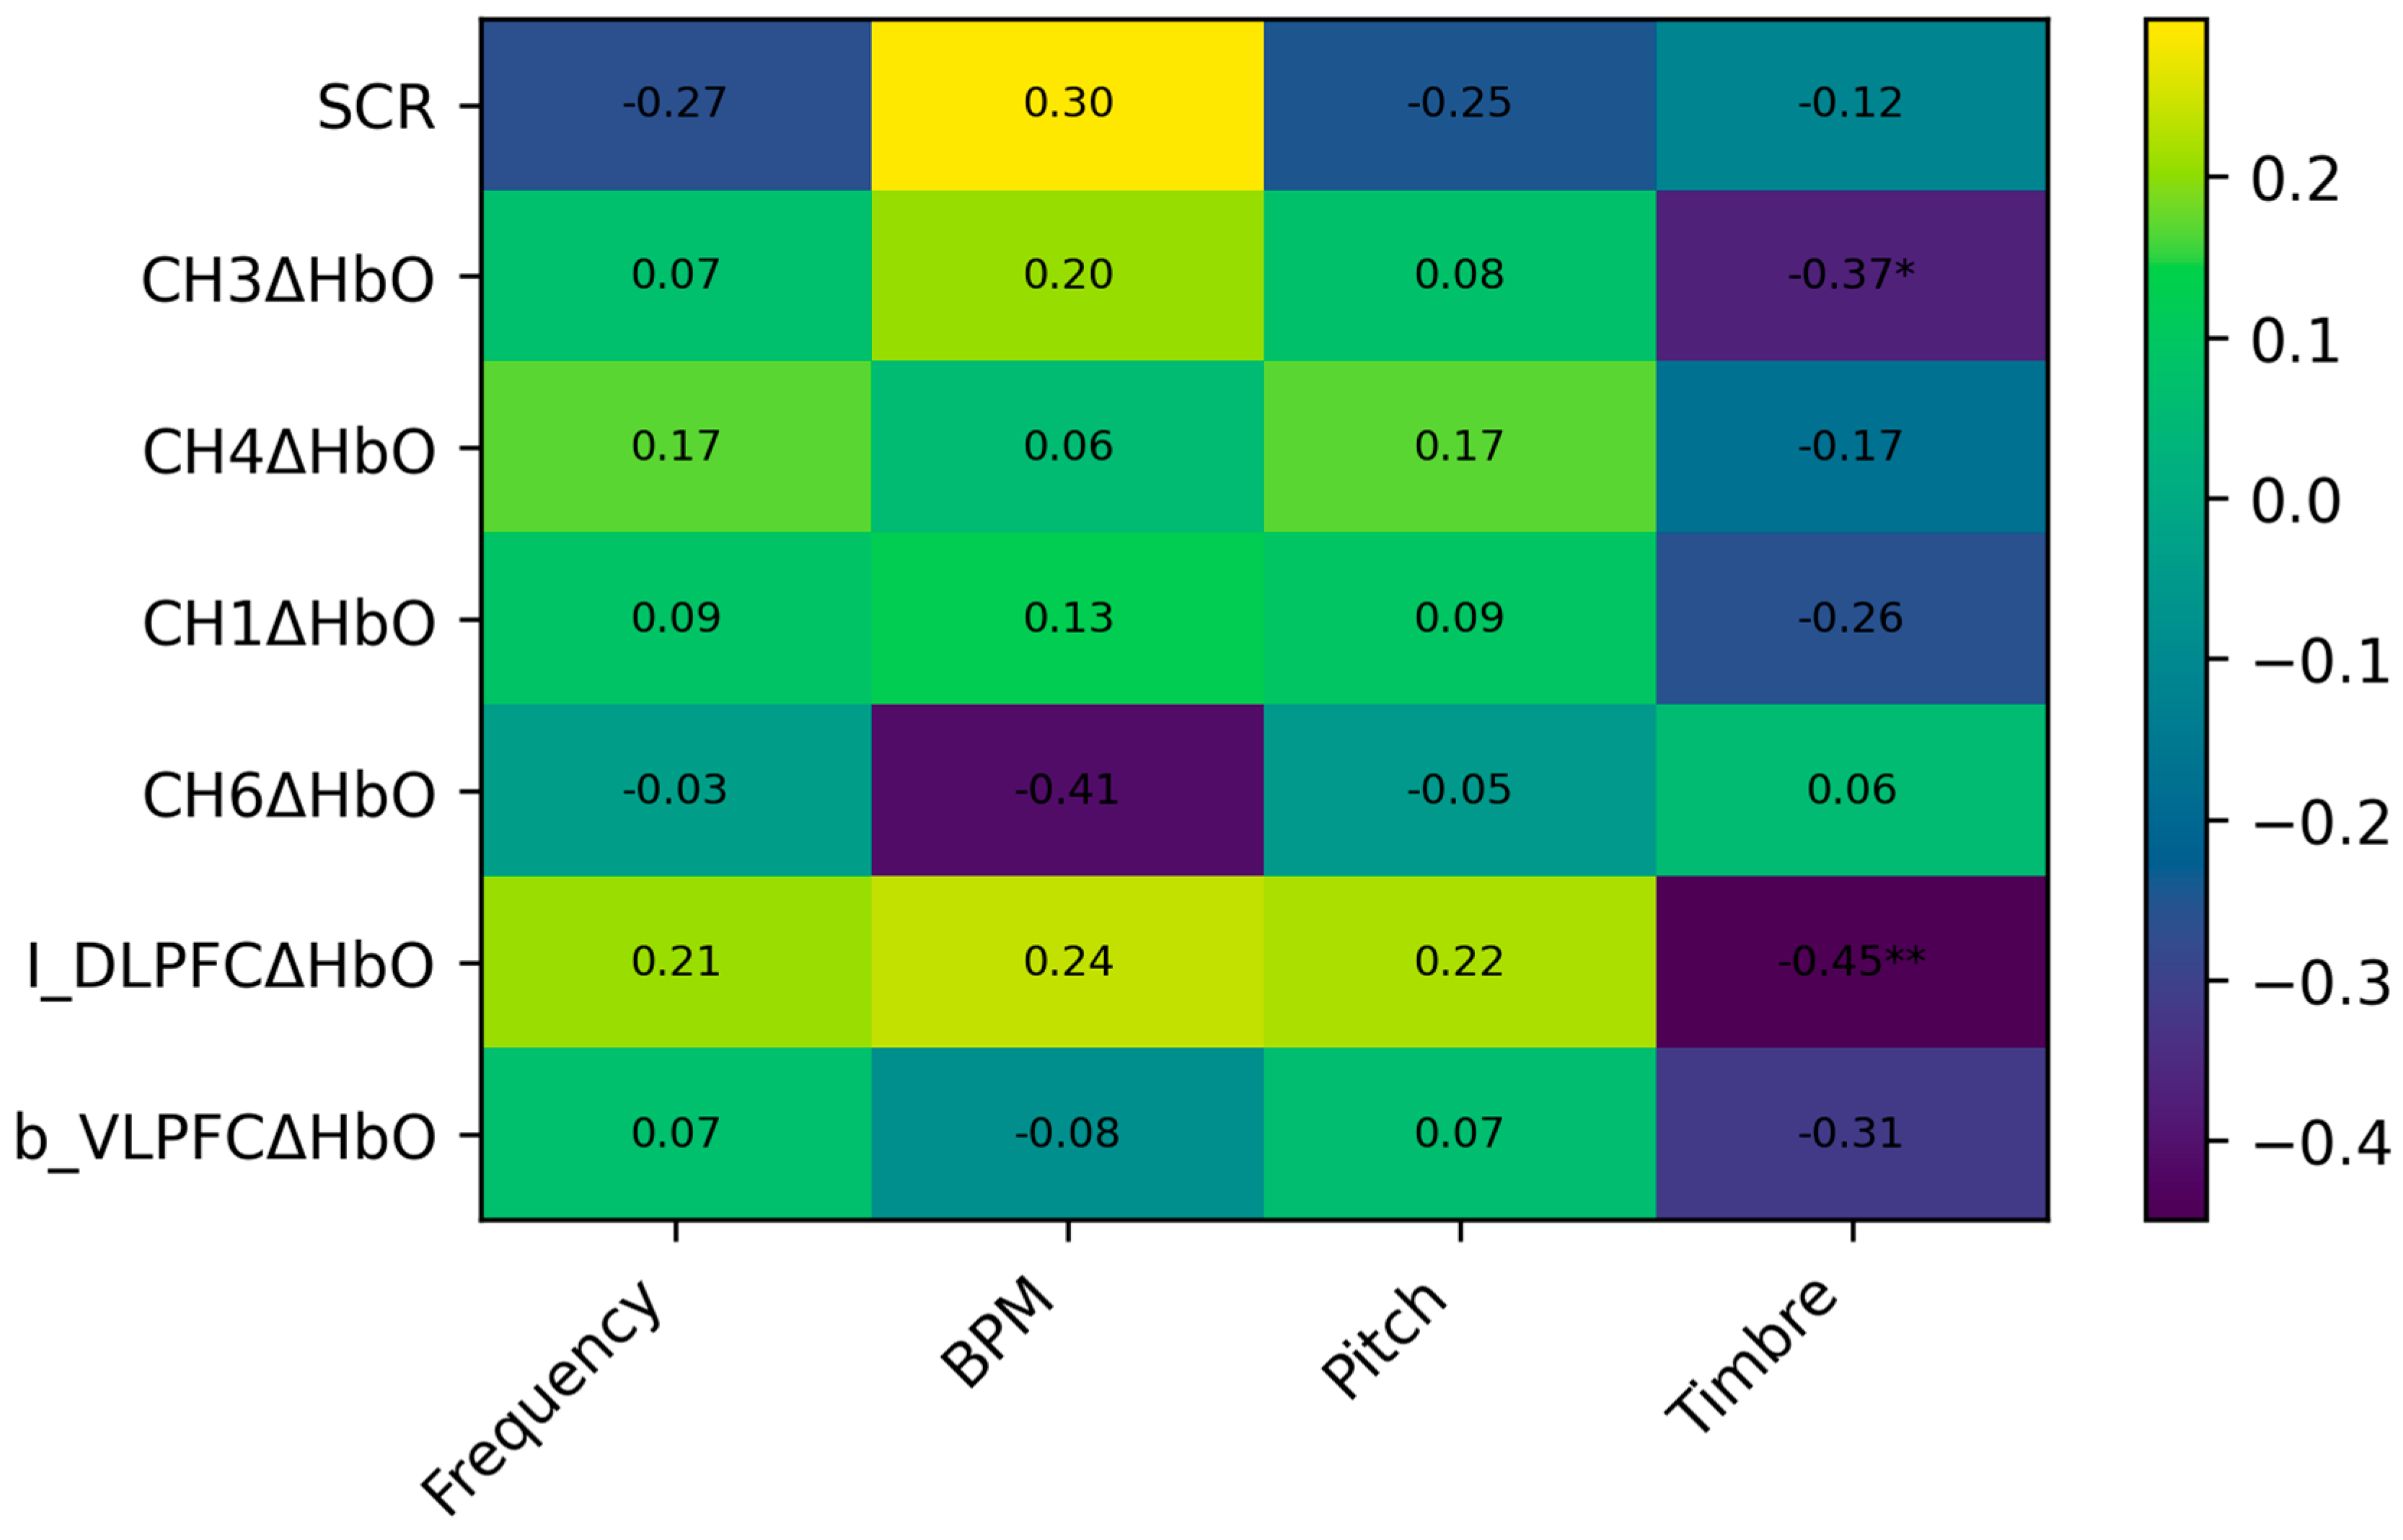
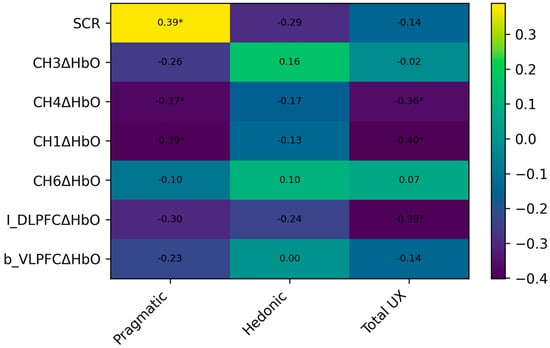
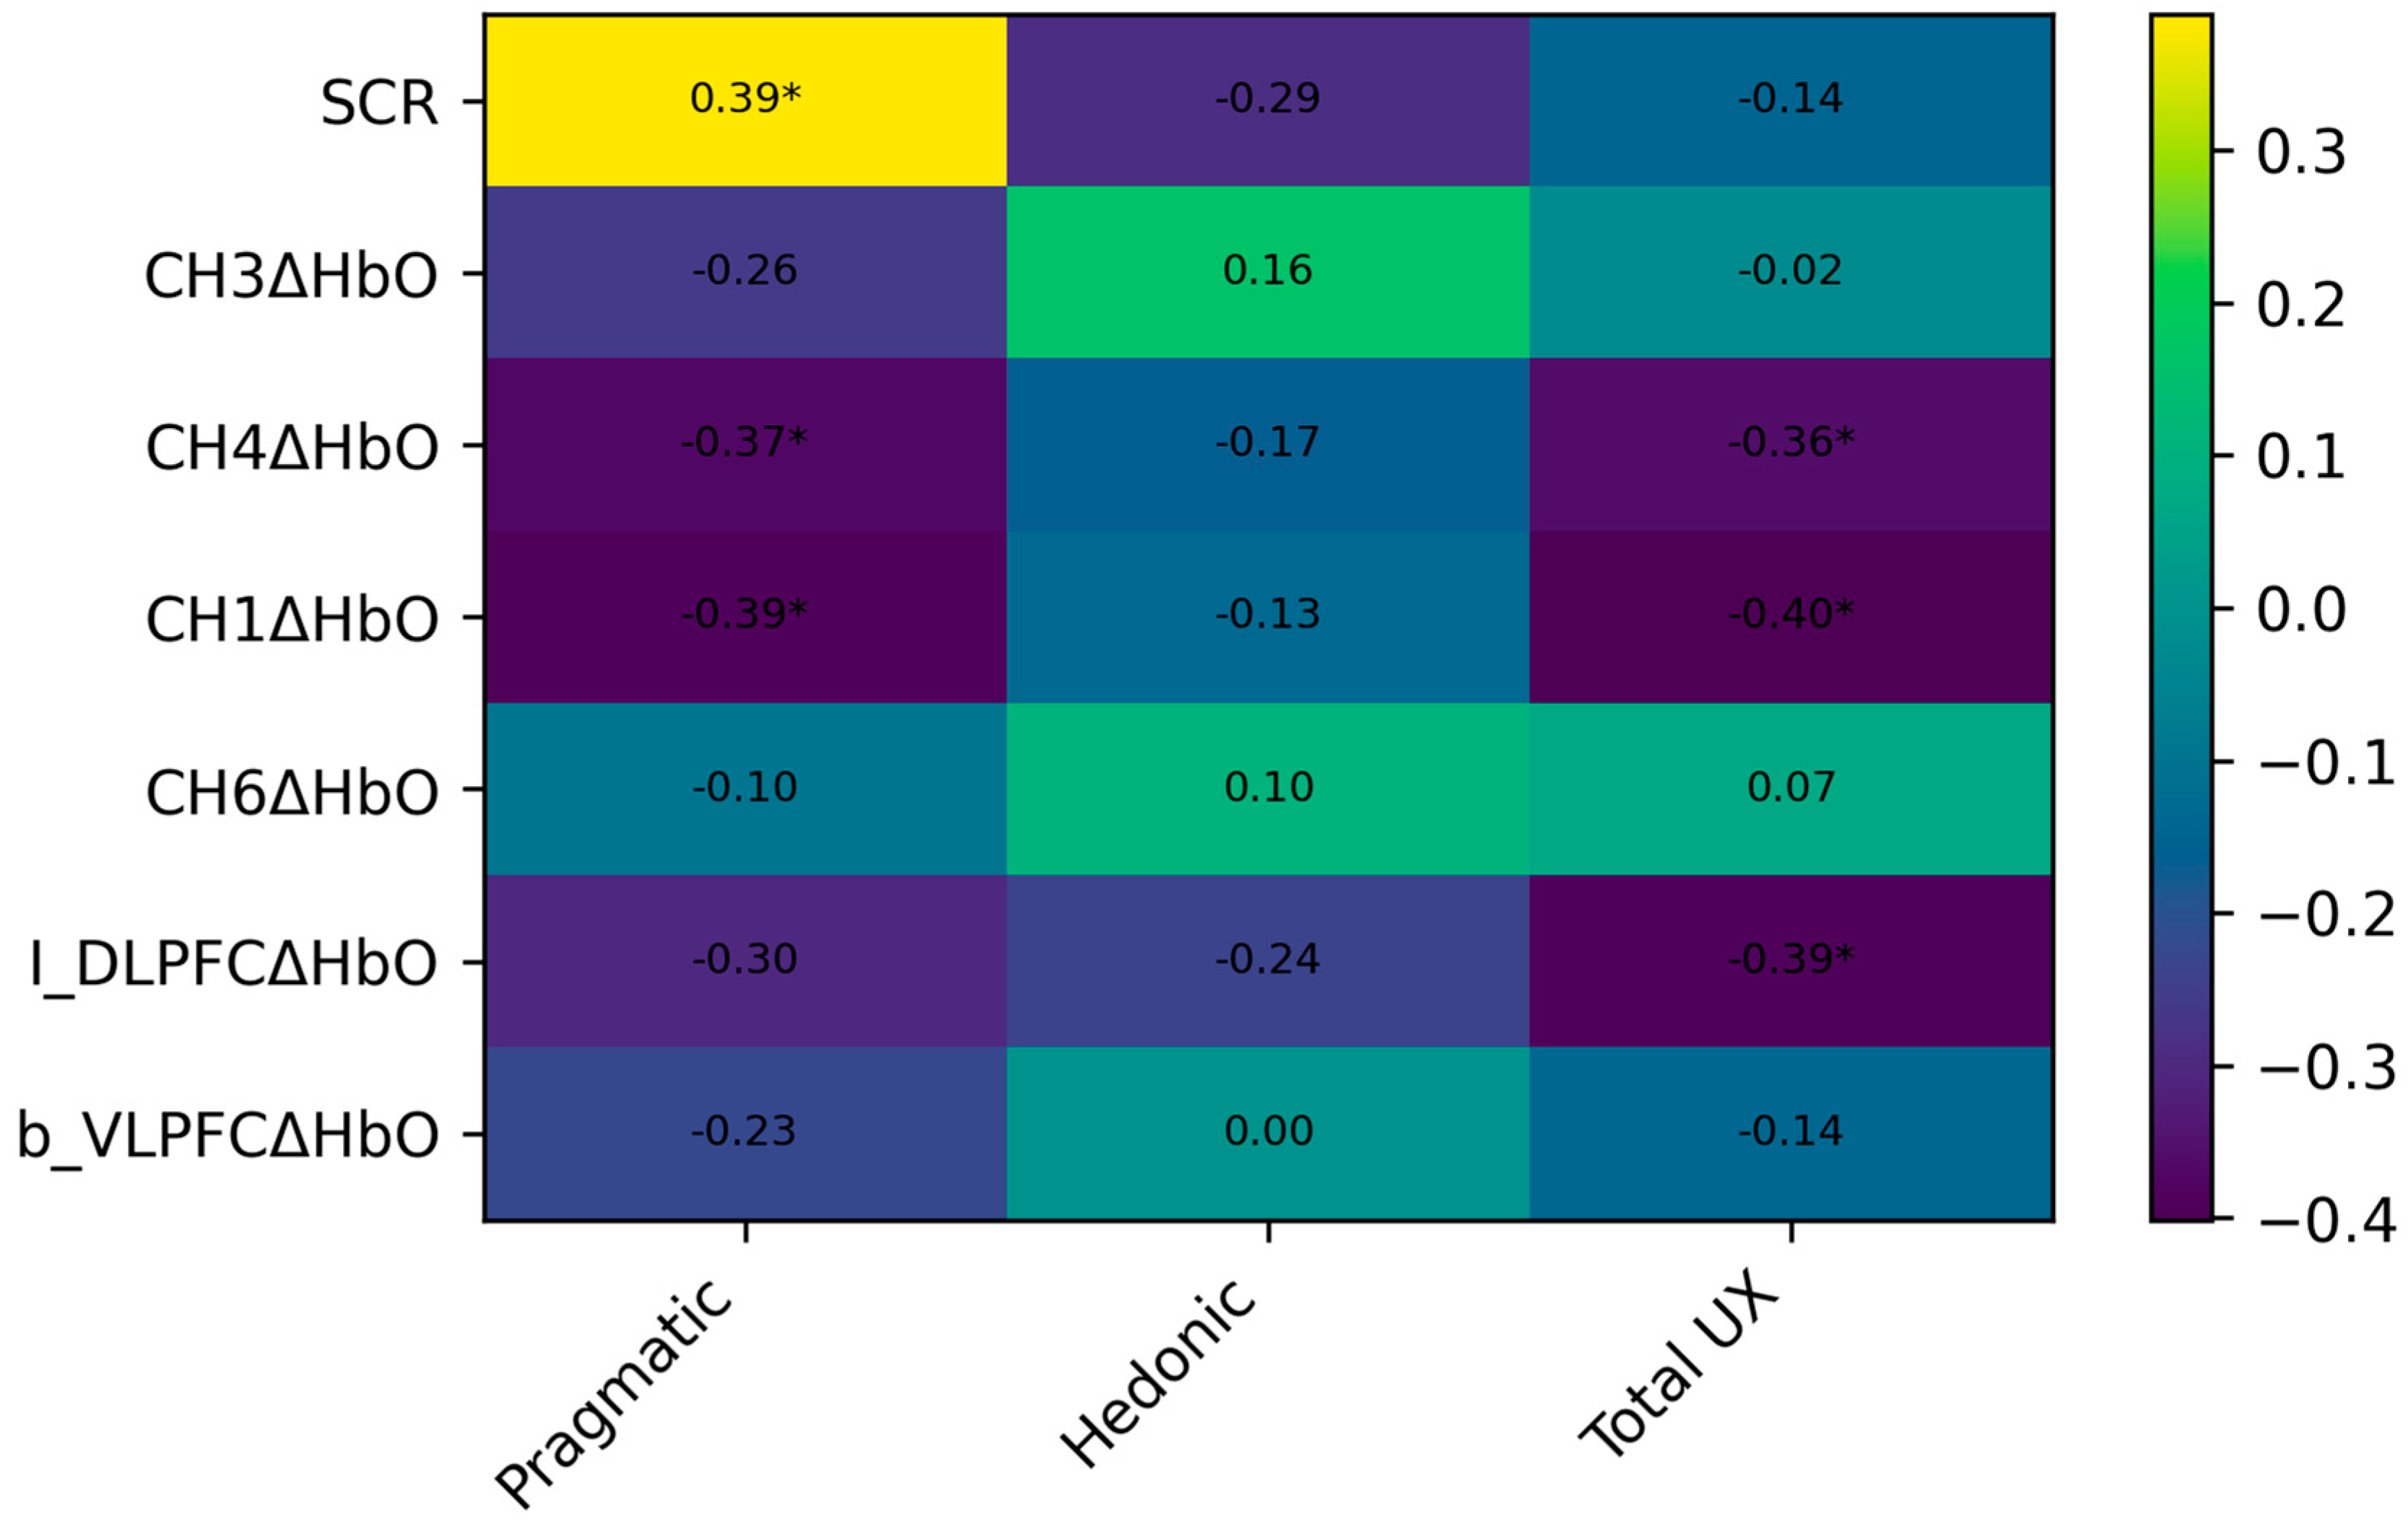

Disclaimer/Publisher’s Note: The statements, opinions and data contained in all publications are solely those of the individual author(s) and contributor(s) and not of MDPI and/or the editor(s). MDPI and/or the editor(s) disclaim responsibility for any injury to people or property resulting from any ideas, methods, instructions or products referred to in the content. |
© 2026 by the authors. Licensee MDPI, Basel, Switzerland. This article is an open access article distributed under the terms and conditions of the Creative Commons Attribution (CC BY) license.