Article

The Effect of Window Presence and Size on Human Recovery: An EEG Microstate Study

1
Innovation Institute for Sustainable Maritime Architecture Research and Technology, Qingdao University of Technology, Qingdao 266033, China
2
Faculty of Environmental Engineering, The University of Kitakyushu, Kitakyushu 808-0135, Japan
*
Author to whom correspondence should be addressed.
Buildings 2026, 16(5), 1092; https://doi.org/10.3390/buildings16051092
Submission received: 11 February 2026 / Revised: 1 March 2026 / Accepted: 6 March 2026 / Published: 9 March 2026
(This article belongs to the Section Building Energy, Physics, Environment, and Systems)

Abstract

Although windows are known to modulate occupant well-being, the specific capacity of window dimensions to alleviate stress requires deeper empirical validation. To address this, we evaluated 36 young, healthy subjects (aged 20–27) within a virtual office configured with four window-to-wall ratios (WWR: 0%, 25%, 50%, and 75%). Stress levels were quantified by integrating subjective evaluations with EEG time–frequency domains and microstate transitions. The results demonstrated that windowed conditions consistently elevated subjective comfort ratings and α-wave activity, reflecting enhanced psychological relaxation. Notably, measured brain activity exhibited a peak at 0% WWR and a global minimum at 50% WWR, suggesting a potential physiological threshold for maximum relaxation within the tested demographic. Subsequent microstate analysis confirmed that windowed environments extended the duration of states B (visual processing), C (saliency network), and D (attention orientation), alongside increased transition shifts from state A to B and from state B to C. Utilizing these extracted physiological biomarkers, a developed neural network model predicted human comfort with 78.79% accuracy. Ultimately, these preliminary findings indicate that optimized window scaling can measurably mitigate urban stress, providing a data-driven theoretical framework for architectural design.

1. Introduction

Currently, as the process of social transformation and urbanization intensifies, there is a growing burden on people’s mental well-being. Adverse emotions can activate a stress reaction in the human body. If not resolved promptly, this can disrupt the internal balance of bodily functions and have severe detrimental effects on individuals’ physical and mental well-being [1]. The indoor-space environment significantly influences the well-being, comfort, productivity, and overall health of building users. Windows are the sole method of connecting indoor and outdoor spaces in a building. They significantly impact the perceived quality of the indoor spatial environment. Good window conditions can enhance the overall psychological and physiological comfort of the users. They also play a crucial role in regulating the physical and mental stress of the human body and providing restorative benefits [2].
Research has been carried out to validate the impact of the presence or absence of windows on the human body [3]. According to Stone, a survey conducted through questionnaires revealed that the majority of individuals prefer offices with windows when it comes to their preferences for office space surroundings [4]. Chang et al. found that windowed office spaces were effective in reducing anxiety and tension among office workers [5]. Korpela et al. demonstrated that office workstations equipped with windows correlate positively with elevated job satisfaction and productivity, while simultaneously mitigating turnover intentions and accelerating stress recovery [6]. Conversely, windowless environments precipitate heightened adverse affect and a significant escalation in occupational stress [7]. Moving beyond physical window access, visual-interface quality significantly dictates view perception; within virtual reality frameworks, display characteristics and motion dynamics modulate this perception, as evidenced by subjective comfort ratings and objective physiological markers [8]. This visual restorative potential extends to educational settings, where Li observed superior attentional recovery in students exposed to natural classroom landscapes [9]. Such restoration operates closely with biophilic elements, as Dravigne and Olszewska revealed that expansive greenery bolsters overall job satisfaction and induces deeper relaxation in a dose-dependent manner relative to vegetation coverage [10,11]. Extending these physiological and psychological benefits to clinical domains, patients in rooms with unobstructed external views exhibit accelerated healing trajectories and reduced hospitalization durations compared to those in visually obstructed or windowless settings [12]. Studies have demonstrated that windows are a crucial element in building design. They provide the opportunity for individuals to experience fresh air, scenic views, and natural light simultaneously. Furthermore, windows have a beneficial effect on human health and well-being within indoor spaces. Therefore, windows are an essential component in architectural design.
Researchers have examined the desire for window size as the main factor influencing the circumstances of architectural windows, using the window-to-wall ratio (WWR) as the measure of evaluation. WWR, also known as the ratio of window-to-wall area, is the proportion of the total area covered by exterior windows (including transparent curtain walls) in a specific direction, compared to the total area covered by walls in the same direction (including the area occupied by windows). The study by scholars on the desire for window size primarily depends on subjective human feelings and psychological assessments. Keighley et al. conducted an experimental study to determine the window–wall ratio that humans find most comfortable. They found that window–wall ratios ranging from 25% to 30% were rated as the most comfortable by subjects [13]. Ne’eman et al. demonstrated that the minimum permissible WWR for subjects is 35%. In other words, the WWR of a structure should exceed 35% [14]. Dogrusoy et al. surveyed office workers’ preferences for window size through a subjective questionnaire and found that large window sizes with a WWR of 44–100% were favored by the majority of the population, and 48.6% of subjects rated the best subjective rating at a WWR of 100% [15]. Meanwhile, Ludlow et al. suggested that the preferred WWR is 50–80% for optimal human visual satisfaction [16]. The above studies were conducted only through subjective evaluations, but there are also scholars who have objectively evaluated the effects of different WWR conditions on the human body through physiological indicators. For example, Abd-Alhamid et al. conducted a study to assess the impact of three different WWRs (i.e., 10%, 20%, and 30%) on human stress recovery, physiology, and psychology in virtual environments, and found that when the WWR was increased from 10% to 30% of the maximum size, the subjects’ average overall view perception scores increased 51% (p < 0.05). In addition, the skin conductance level and HRV physiological indicator also showed that subjects had significantly better stress recovery levels when viewing larger window sizes [17]. In randomized controlled tests, Zhang et al. quantified variations in HRV-n LF/n HF and EEG (β-frequency power) across five WWR configurations (25%, 40%, 55%, 70%, and 85%). Initial observations recorded shifts as the WWR increased from 25% to 30% of the largest size. Notably, integrating the physiological responses revealed that expanding the WWR from 25% to 55% elicited an HRV-n LF/HF increase of 1.02; mirroring this pattern, the subjects’ EEG tiredness index concurrently decreased by 64.8% under the same spatial expansion [18]. The above studies explored the optimal thresholds for WWR through subjective evaluation and some physiological indicators but did not reach consistent conclusions. The variability of results is due to the different experimental settings in different window size studies. In addition, the majority of this research depends solely on subjective assessments, which are frequently influenced by methodological bias [19]. Consequently, there exist some constraints. It is important to mention that when the human body is exposed to a visual stimulus, it will cause alterations in the EEG, which is becoming more and more useful for evaluating landscapes. Additionally, we can study human comfort by measuring brain activity using EEG recordings. This study seeks to improve the impartiality and thoroughness of its findings by combining subjective evaluation and EEG measurements to investigate the psychological and physiological alterations observed in individuals across different WWR contexts.
In summary, since there is no consistent conclusion about the optimal threshold of WWR, there is also a lack of research that combines both subjective and objective indicators as evaluation methods. Based on this, we simulated the office scene through virtual reality (VR) technology, and used WWR 0% as the control group, and WWRs 25%, 50%, and 75% as the experimental group, to derive the effects of different WWRs on the relief of human stress through the subjective evaluation and EEG indicators. While the general influence of WWR on occupant stress dynamics has been documented, the underlying neuro-temporal mechanisms remain elusive. To elucidate these transient brain network transitions during stress recovery, this research integrates EEG microstate analysis with traditional time–frequency metrics. Leveraging these combined physiological markers, the subsequent development of a neural network-based comfort prediction model translates observational data into a predictive evaluation framework for indoor environmental quality (IEQ). This study combines architectural design with medicine and psychology and uses an interdisciplinary approach to preliminarily reveal the trend of the influence of architectural window scale on the psychology and physiology of urban populations, and to determine the size of the WWR that is most conducive to physical and mental health through visualization technology. This study provides a new research framework and knowledge system for understanding the cognitive activities of the brain in indoor environments and the application of intelligent buildings.

2. Materials and Methods

2.1. Experimental Environment and Equipment

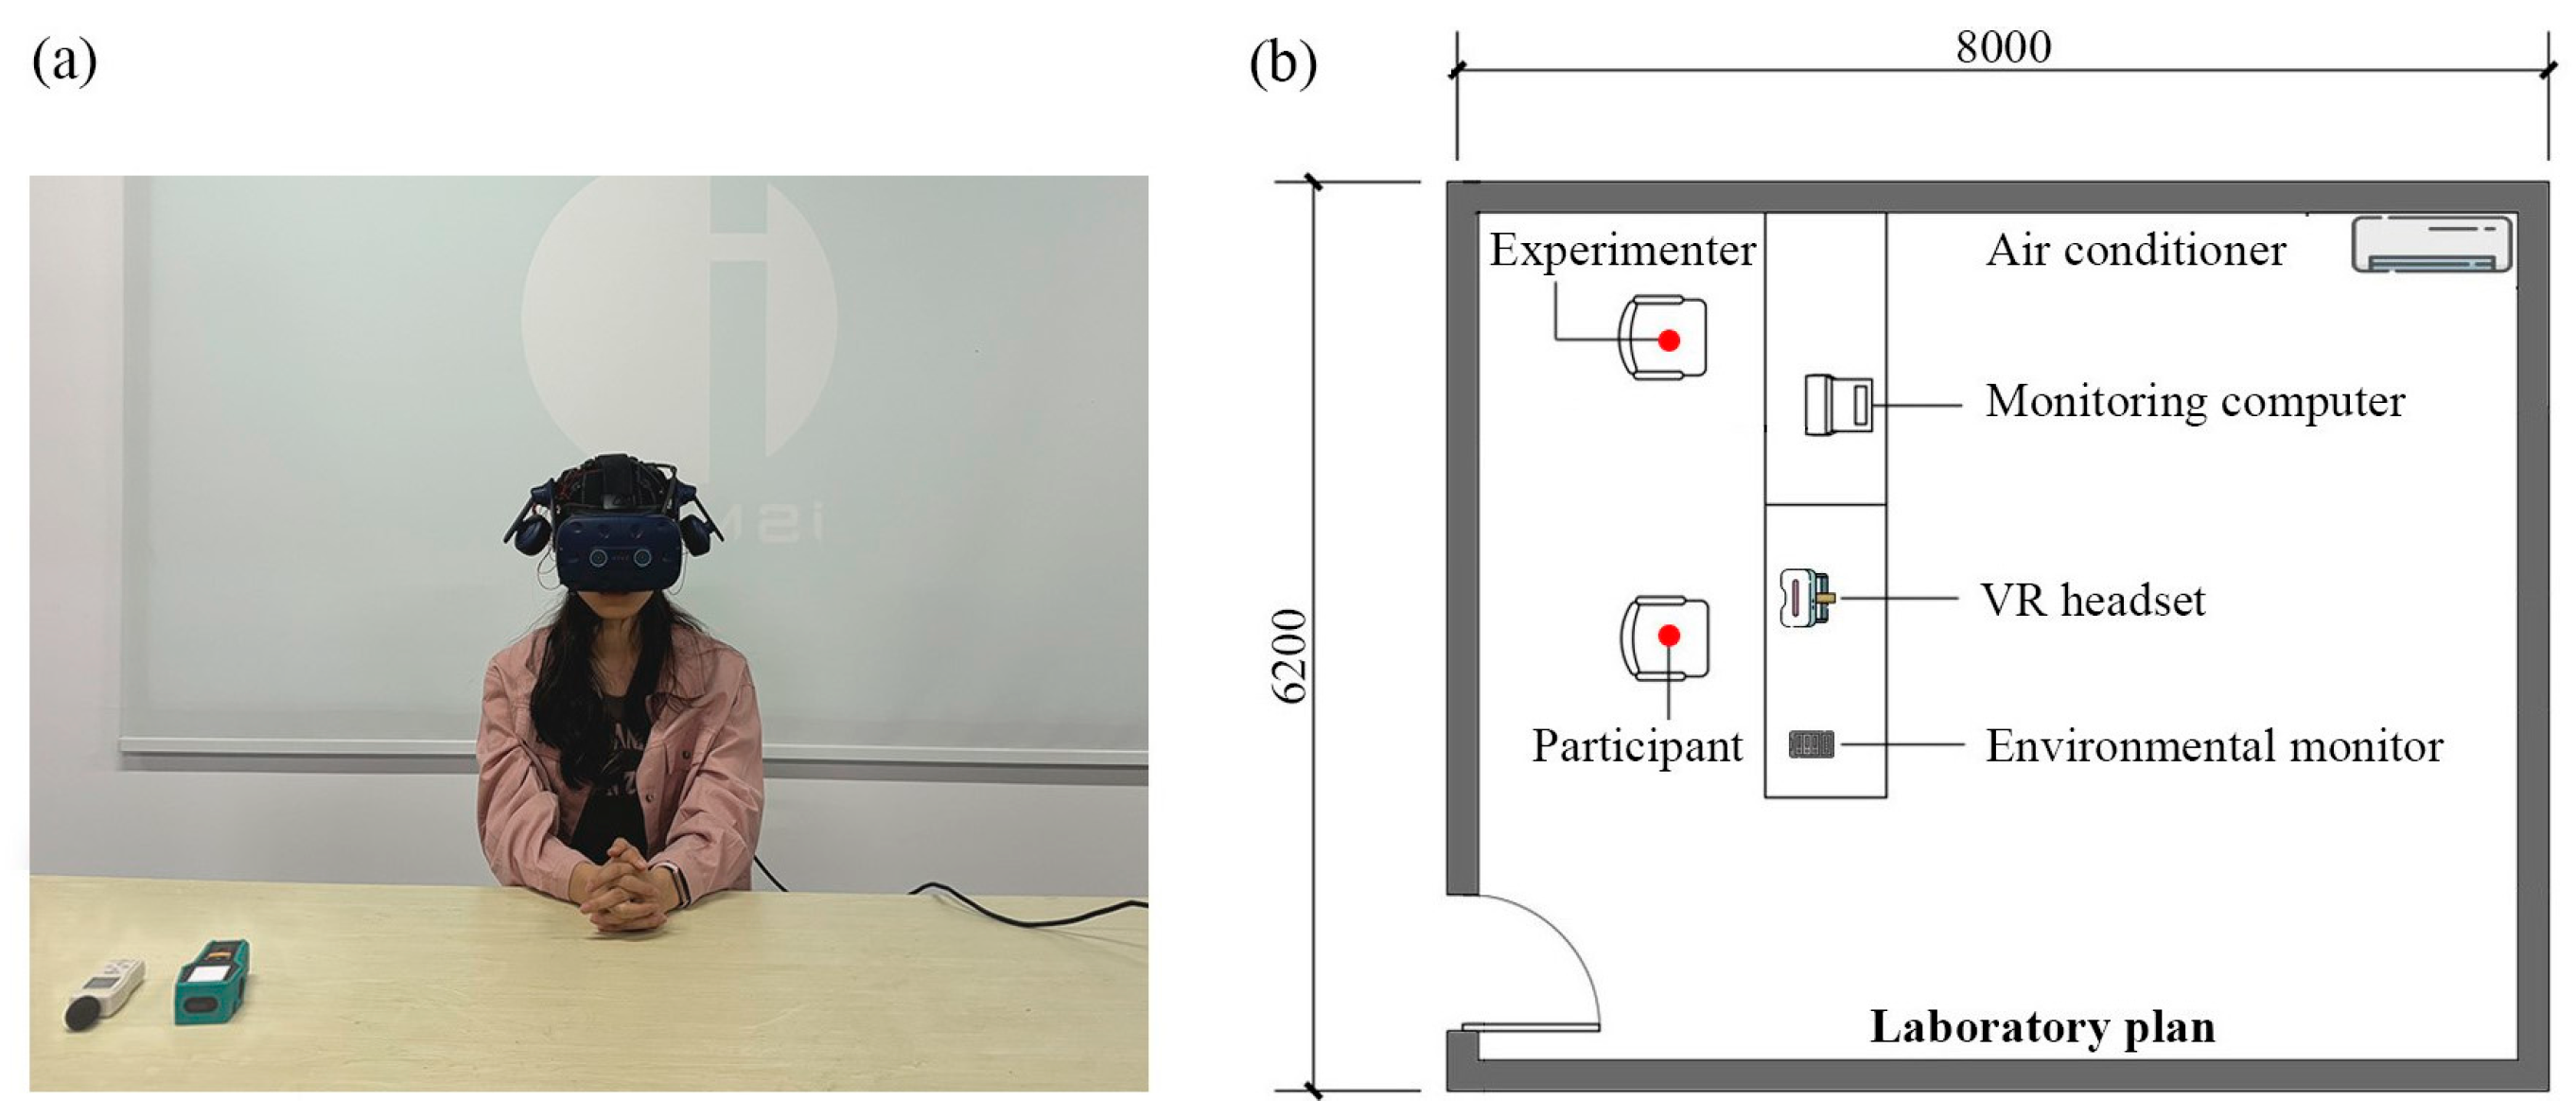
The experiments were carried out in a controlled indoor simulation laboratory located at Qingdao University of Technology. In order to maintain consistent testing settings, split-type air conditioners and humidifiers were employed to adjust the environmental parameters, ensuring that they fell within the range of human sensory comfort. More precisely, the indoor temperature in the laboratory was maintained at 22 °C ± 0.5 °C and the relative humidity was controlled at 40% ± 5%. The configuration of the experimental setting is outlined in Figure 1. Experimental equipment and parameters are listed in Table 1. The Emotiv EPOC Flex EEG acquisition device was used to gather physiological data. We recruited subjects from schools with an age limit of 18 to 30 years old, who were required to be in good health with no record of mental illness or cardiovascular disease. The sample size of 36 was determined based on similar experimental paradigms in the fields of indoor environmental quality (IEQ) and EEG analysis, which typically employ 20–40 subjects to achieve sufficient statistical sensitivity for within-subject designs [20,21,22]. Table 1 displays the enrollment of 36 subjects in the study, with an equal distribution of males and females. Prior to the commencement of the experiment, every subject had a comprehensive comprehension of the experimental procedure, potential hazards, and measures taken to safeguard privacy. Additionally, they provided their consent by signing a document that confirmed their awareness and grasp of these aspects. Subjects were instructed to abstain from consuming any food or beverages that include alcohol or caffeine for a minimum of 12 h prior to the commencement of the experiment. Table 2 presents the subjects’ information. The experimental procedures adhered to the ethical principles of the Declaration of Helsinki and received approval from the Institutional Review Board of the Innovation Institute for Sustainable Maritime Architecture Research and Technology at Qingdao University of Technology. Before participation, all subjects were thoroughly briefed on the study’s objectives, potential risks, and their right to voluntary withdrawal, subsequently providing written informed consent.

2.2. Experimental Design

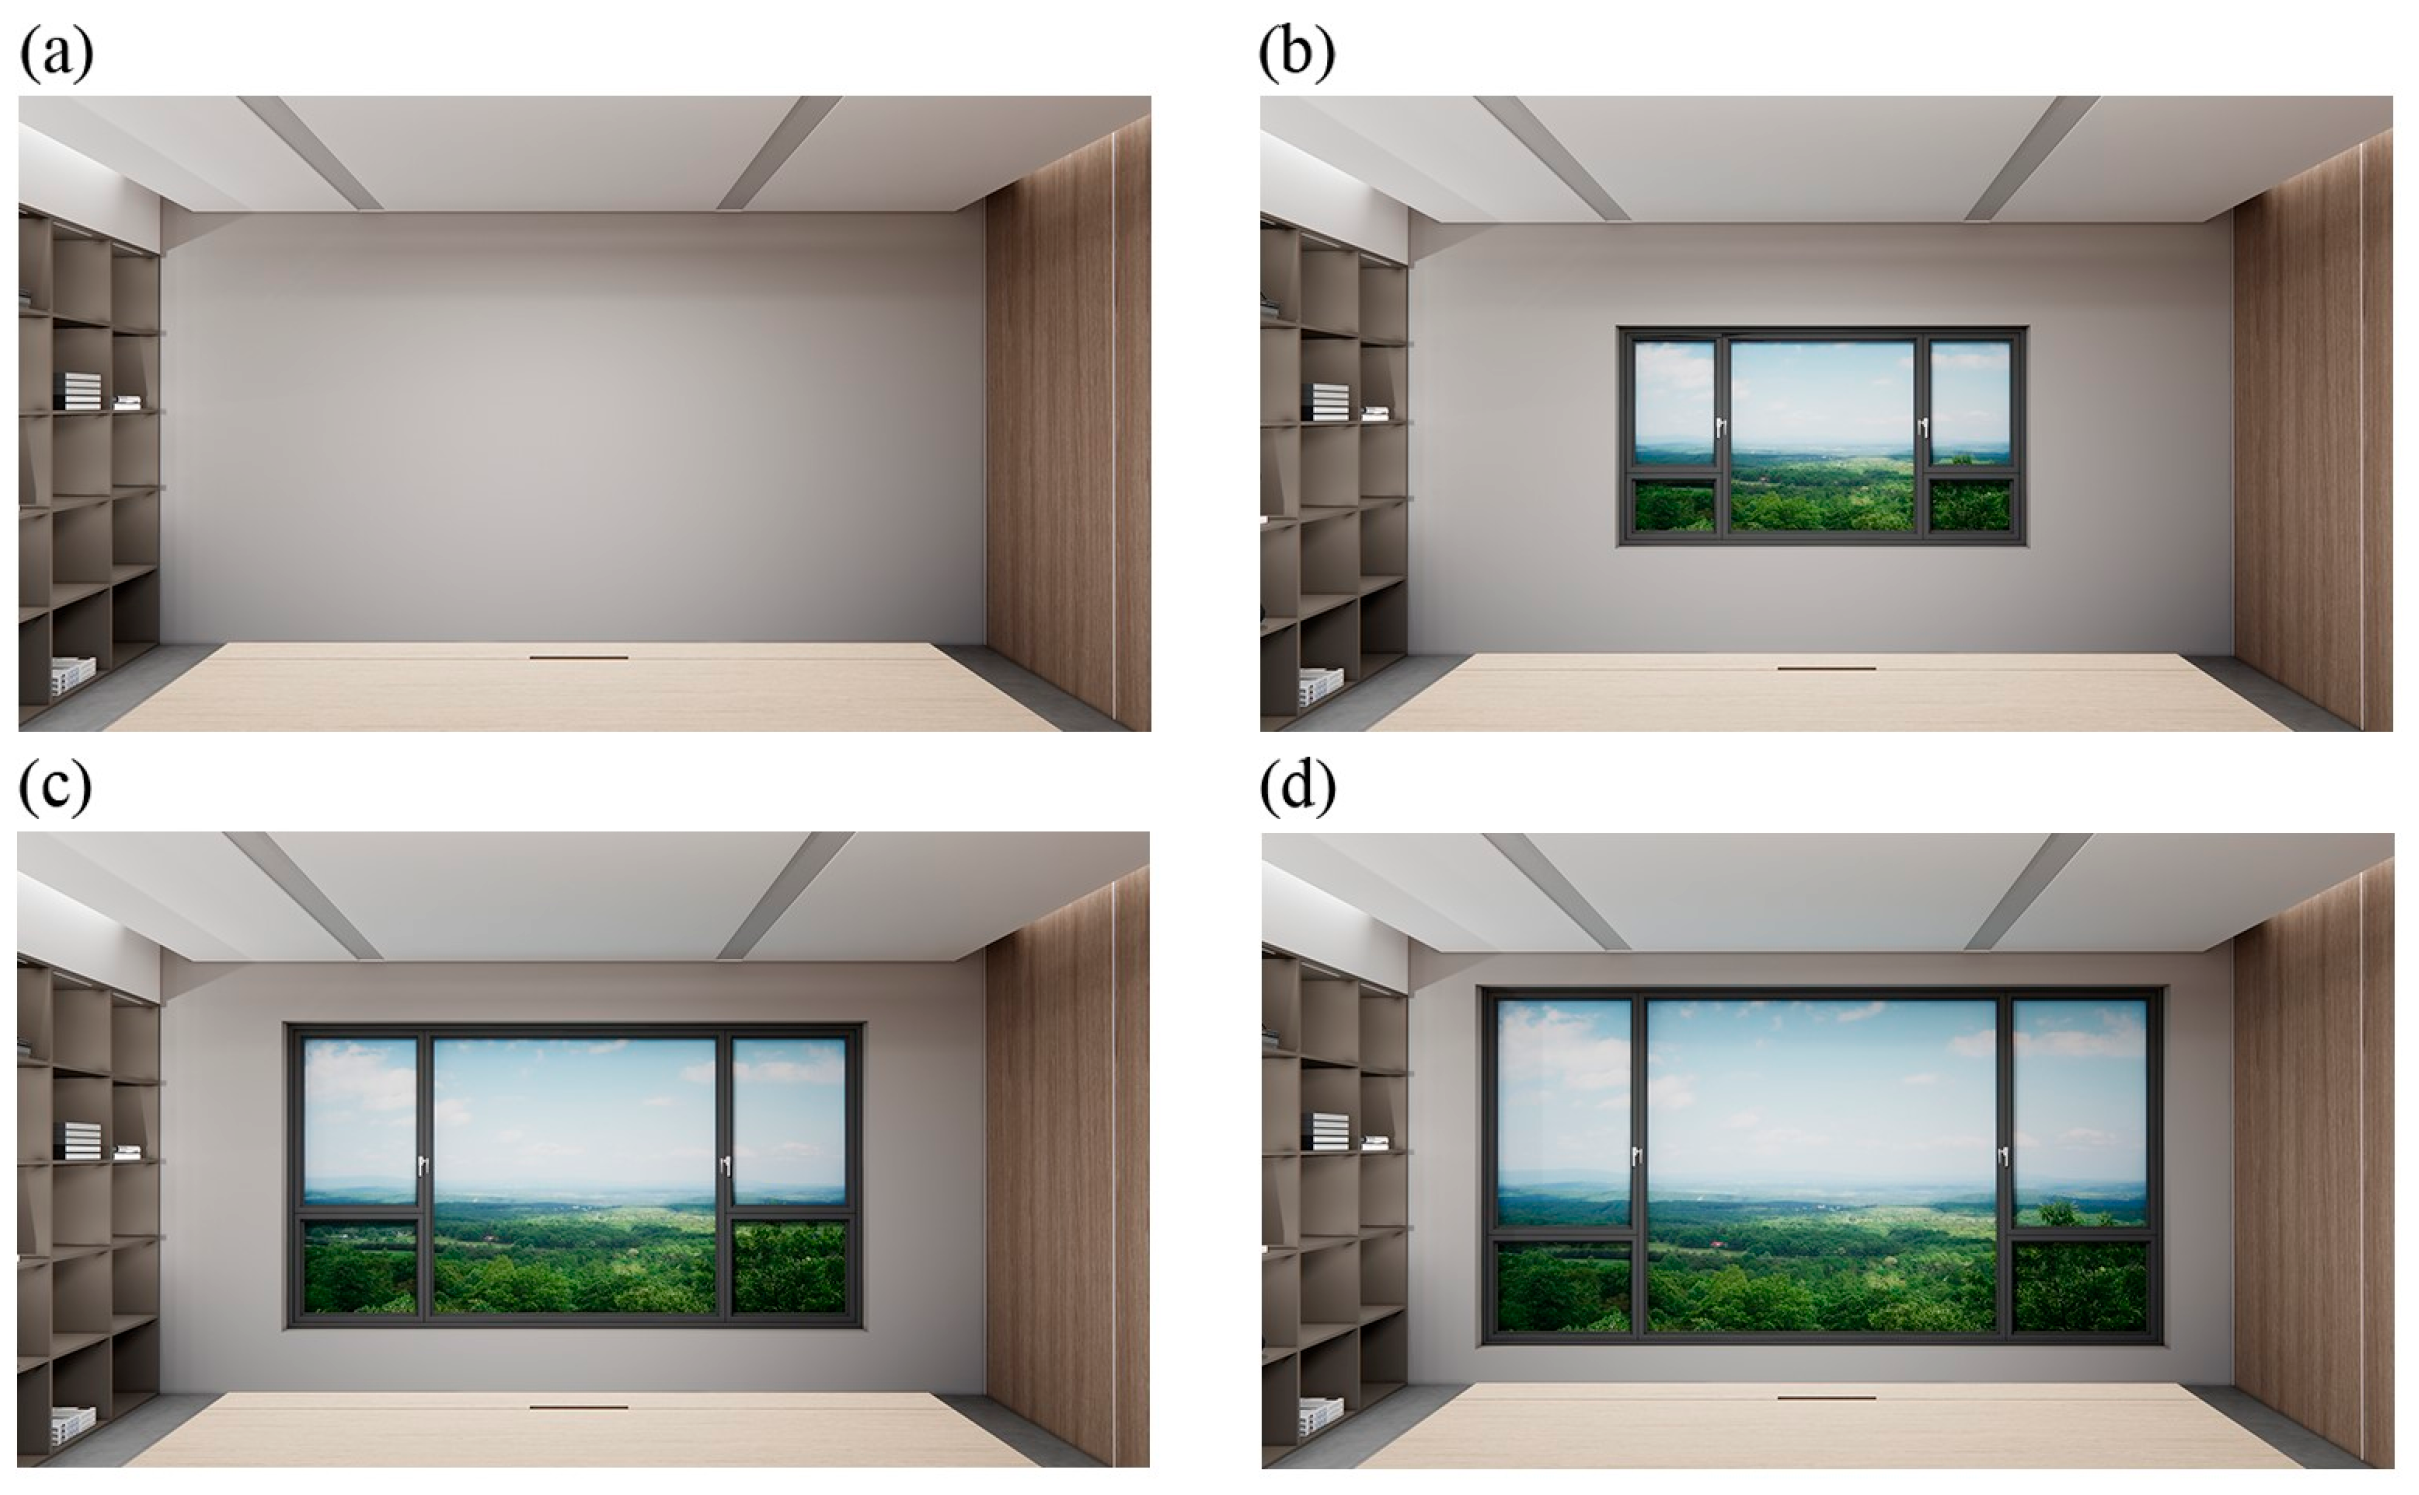
Windows can significantly affect the level of individual stress recovery, but there are few studies on the effect of visually perceived WWR on human stress recovery. Therefore, this paper investigates the effect of indoor WWR on human stress recovery. Different office spaces with WWRs of 0%, 25%, 50% and 75% were selected for the study to compare the differences in stress recoverability, and the windowless environment was used as the control group (WWR 0%). The window views in the experimental situations encompassed a combination of artificial constructions and elements from nature. To maintain a consistent proportion of each element in the landscape visible via the window, we implemented relative control over the window view distance while adjusting the window size. Figure 2 displays the effect diagram of the virtual office environment setting.

2.3. Experimental Procedures

Figure 3 shows the experimental procedure. In order to provide subjects with a comprehensive experience of the experimental setting and minimize the potential fatigue resulting from extended operation, each subject was allocated approximately 110 min for the experiment, covering four different scenarios, with each scenario lasting 20 min on average. The experiment was divided into two main phases: the preparation phase and the experimental phase. In the preparation phase, subjects wore VR glasses and were equipped with physiological monitoring equipment and sat still for 10 min to eliminate the effects of any pre-experimental physiological activity. The experiment then officially began with the recording of 1 min of baseline physiological data. Subjects then experienced the introduction of stressful stimuli, starting with a simplified version of the Maastricht Acute Stress Test (MAST), which has been shown in research to mimic the body’s physiological and psychological responses under stress [23]. Subjects were first subjected to a 30 s cold stress test, followed by a 90 s mental arithmetic task in which subjects were asked to perform a four-digit subtraction operation and verbally report the result. For example, they would say “2020 subtracted from 17 in order”. If they answered incorrectly, they were instructed to start over. The purpose of this technique was to induce a feeling of stress in order to amplify the psychological burden on the person. In order to confirm the accuracy of the stress test, it was conducted twice. Subjects engaged in a stress recovery phase by observing the window view for a duration of 6 min, during which their EEG activity was constantly measured. Following the conclusion of each scenario in the experiment, subjects were obligated to complete a subjective evaluation questionnaire and then take a 10 min break. Subsequently, the experimental process was replicated by sequentially choosing distinct scenarios in the predetermined sequence. To minimize potential carry-over effects, such as fatigue or habituation, the presentation order of the four WWR conditions (0%, 25%, 50%, and 75%) was fully randomized for each participant.

2.4. Subjective Evaluation Index

As shown in Table 3, the simplified versions of the Perceived Restoration Scale (PRS) [24] and the State-Trait Anxiety Inventory (STAI) from the full State-Trait Anxiety Inventory (STAI-S) [25] were used as subjective assessment tools in this study. The PRS questionnaire uses a seven-point Likert scale to comprehensively assess the restorative effects of window size [26], with higher scores indicating a more restorative environment. In addition, the STAI-S is designed to measure an individual’s negative emotional experience, such as emotional states of nervousness, fear, or worry. We selected six questions from the STAI-S to form a simplified version on a scale of 1 to 4 (with questions 2 and 3 scored in the opposite way), with higher scores indicating relatively lower levels of anxiety in subjects.

2.5. EEG Physiological Index

2.5.1. EEG

EEG, as a widely recognized indicator of cortical activity, provides insight into brainwave patterns [27]. The time–frequency domain analysis method of EEG has significant advantages in demonstrating the energy distribution of EEG signals at different frequencies. And the frequency characteristics can help to reveal the variability and correlation of emotional expression in specific frequency bands. In order to extract the EEG signals related to brain activity, data preprocessing is required. In this study, signal preprocessing was performed using EEGLAB based on MATLAB open software 2013b, as shown in Equations (1) and (2), and the preprocessed EEG signals were converted from time domain signals to frequency domain signals by Fast Fourier Transform (FFT). The power indexes of each frequency band were extracted separately according to the frequency, which were used to reflect the energy consumption of brain activities. When people are in a stressful state, neuronal interactions are activated, and the energy is high; in a relaxed state, the brain is in a low-load state, and the energy is low [28,29].
F [ k ] = n = 0 N 1 x [ n ] e j 2 π k n N .
P ( k ) = lim N | F ( k ) | 2 N .
F is the Fourier transform, x is the EEG signal, and P is the power spectral density.
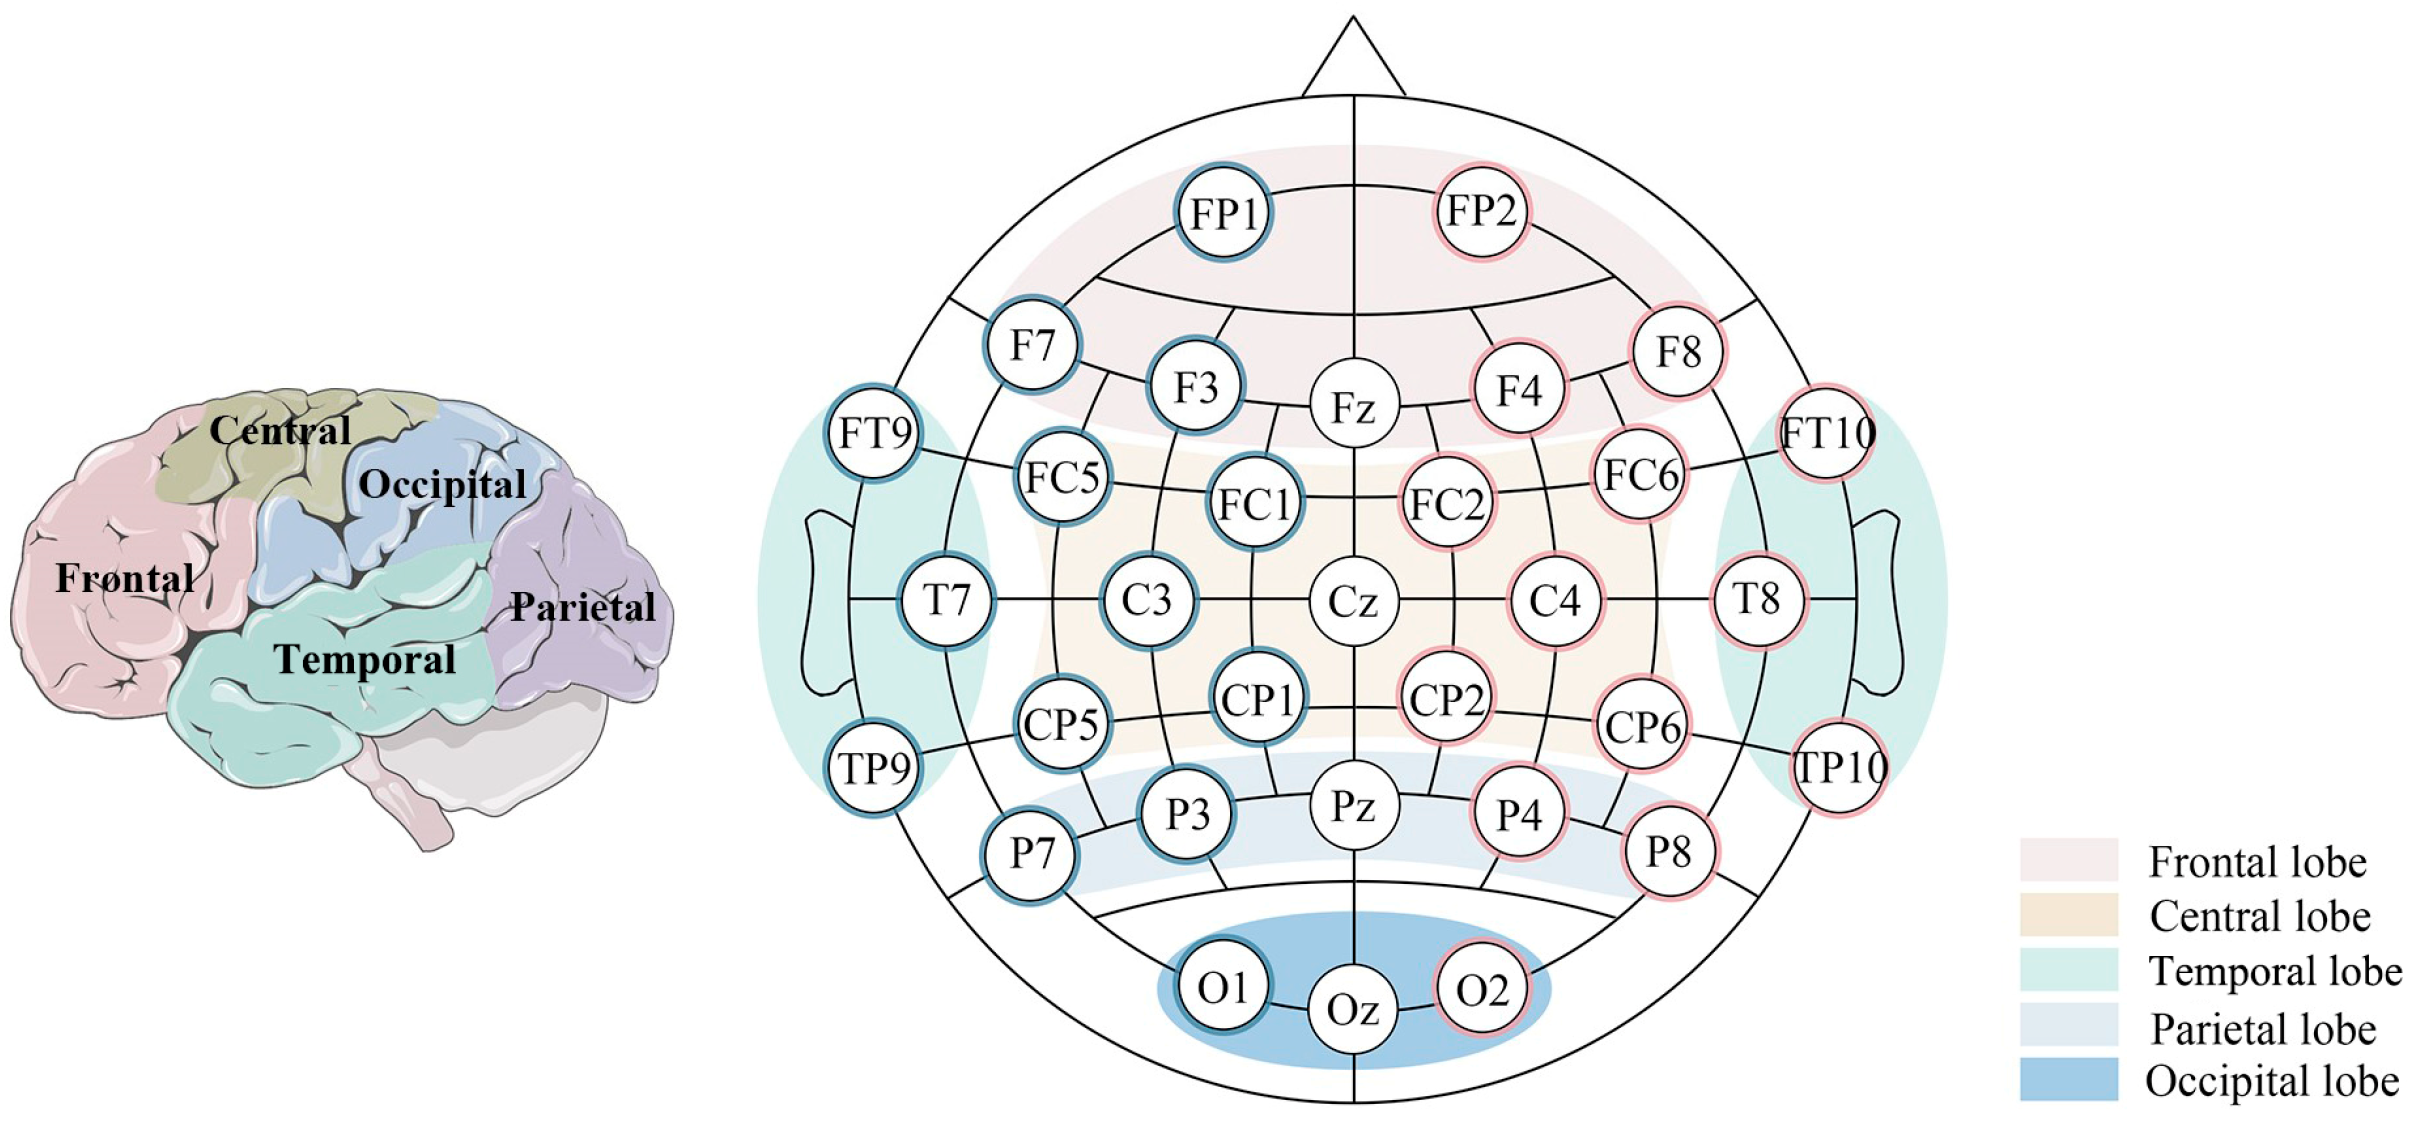
The α frequency, which is related to relaxation, was selected for the study as shown in Equation (3). The higher the α index, the more stable people’s moods are and the higher the stress recoverability is [30]. The study partitioned the EEG electrodes according to the 10-20 international system (Figure 4), including the frontal, central, temporal, parietal, and occipital lobes. EEG relaxation degree (RD) [31] and mental stress (MS) [32] were investigated using the relative band power of EEG waves, calculated as in Equations (4) and (5). Studies have shown that there is an asymmetry between the left and right hemispheres of the brain [33] and that this asymmetry can be indicative of the subject’s emotional state [34]; for example, the ratio between hemispheric asymmetric electrode powers features asymmetry (ASM), as shown in Equation (6) [35]. In addition, several studies have demonstrated that the frontal asymmetry index (FAI) is associated with mood and motivation in response to different environmental stimuli. A Higher ASM and FAI reflect positive feelings and relaxation [36], as shown in Equation (7).
E E G   α = R P α   R P δ + R P θ + R P α + R P β .
R e l a x a t i o n   d e g r e e = R P α R P β .
M e n t a l   s t r e s s = R P θ f r o n t a l   l o b e R P α p a r i e t a l   l o b e .
RPθfrontal lobe is the θ relative power of the frontal lobe, and RPαparietal lobe is the α relative power of the parietal lobe.
A S M = p o w e r   o f   X r i g h t p o w e r   o f   X l e f t .
Xleft and Xright indicate the electrodes for the right and left brain hemispheres, respectively.
F A I = l n   ( α   p o w e r   o f   F 4 α   p o w e r   o f   F 3 ) .

2.5.2. Microstate

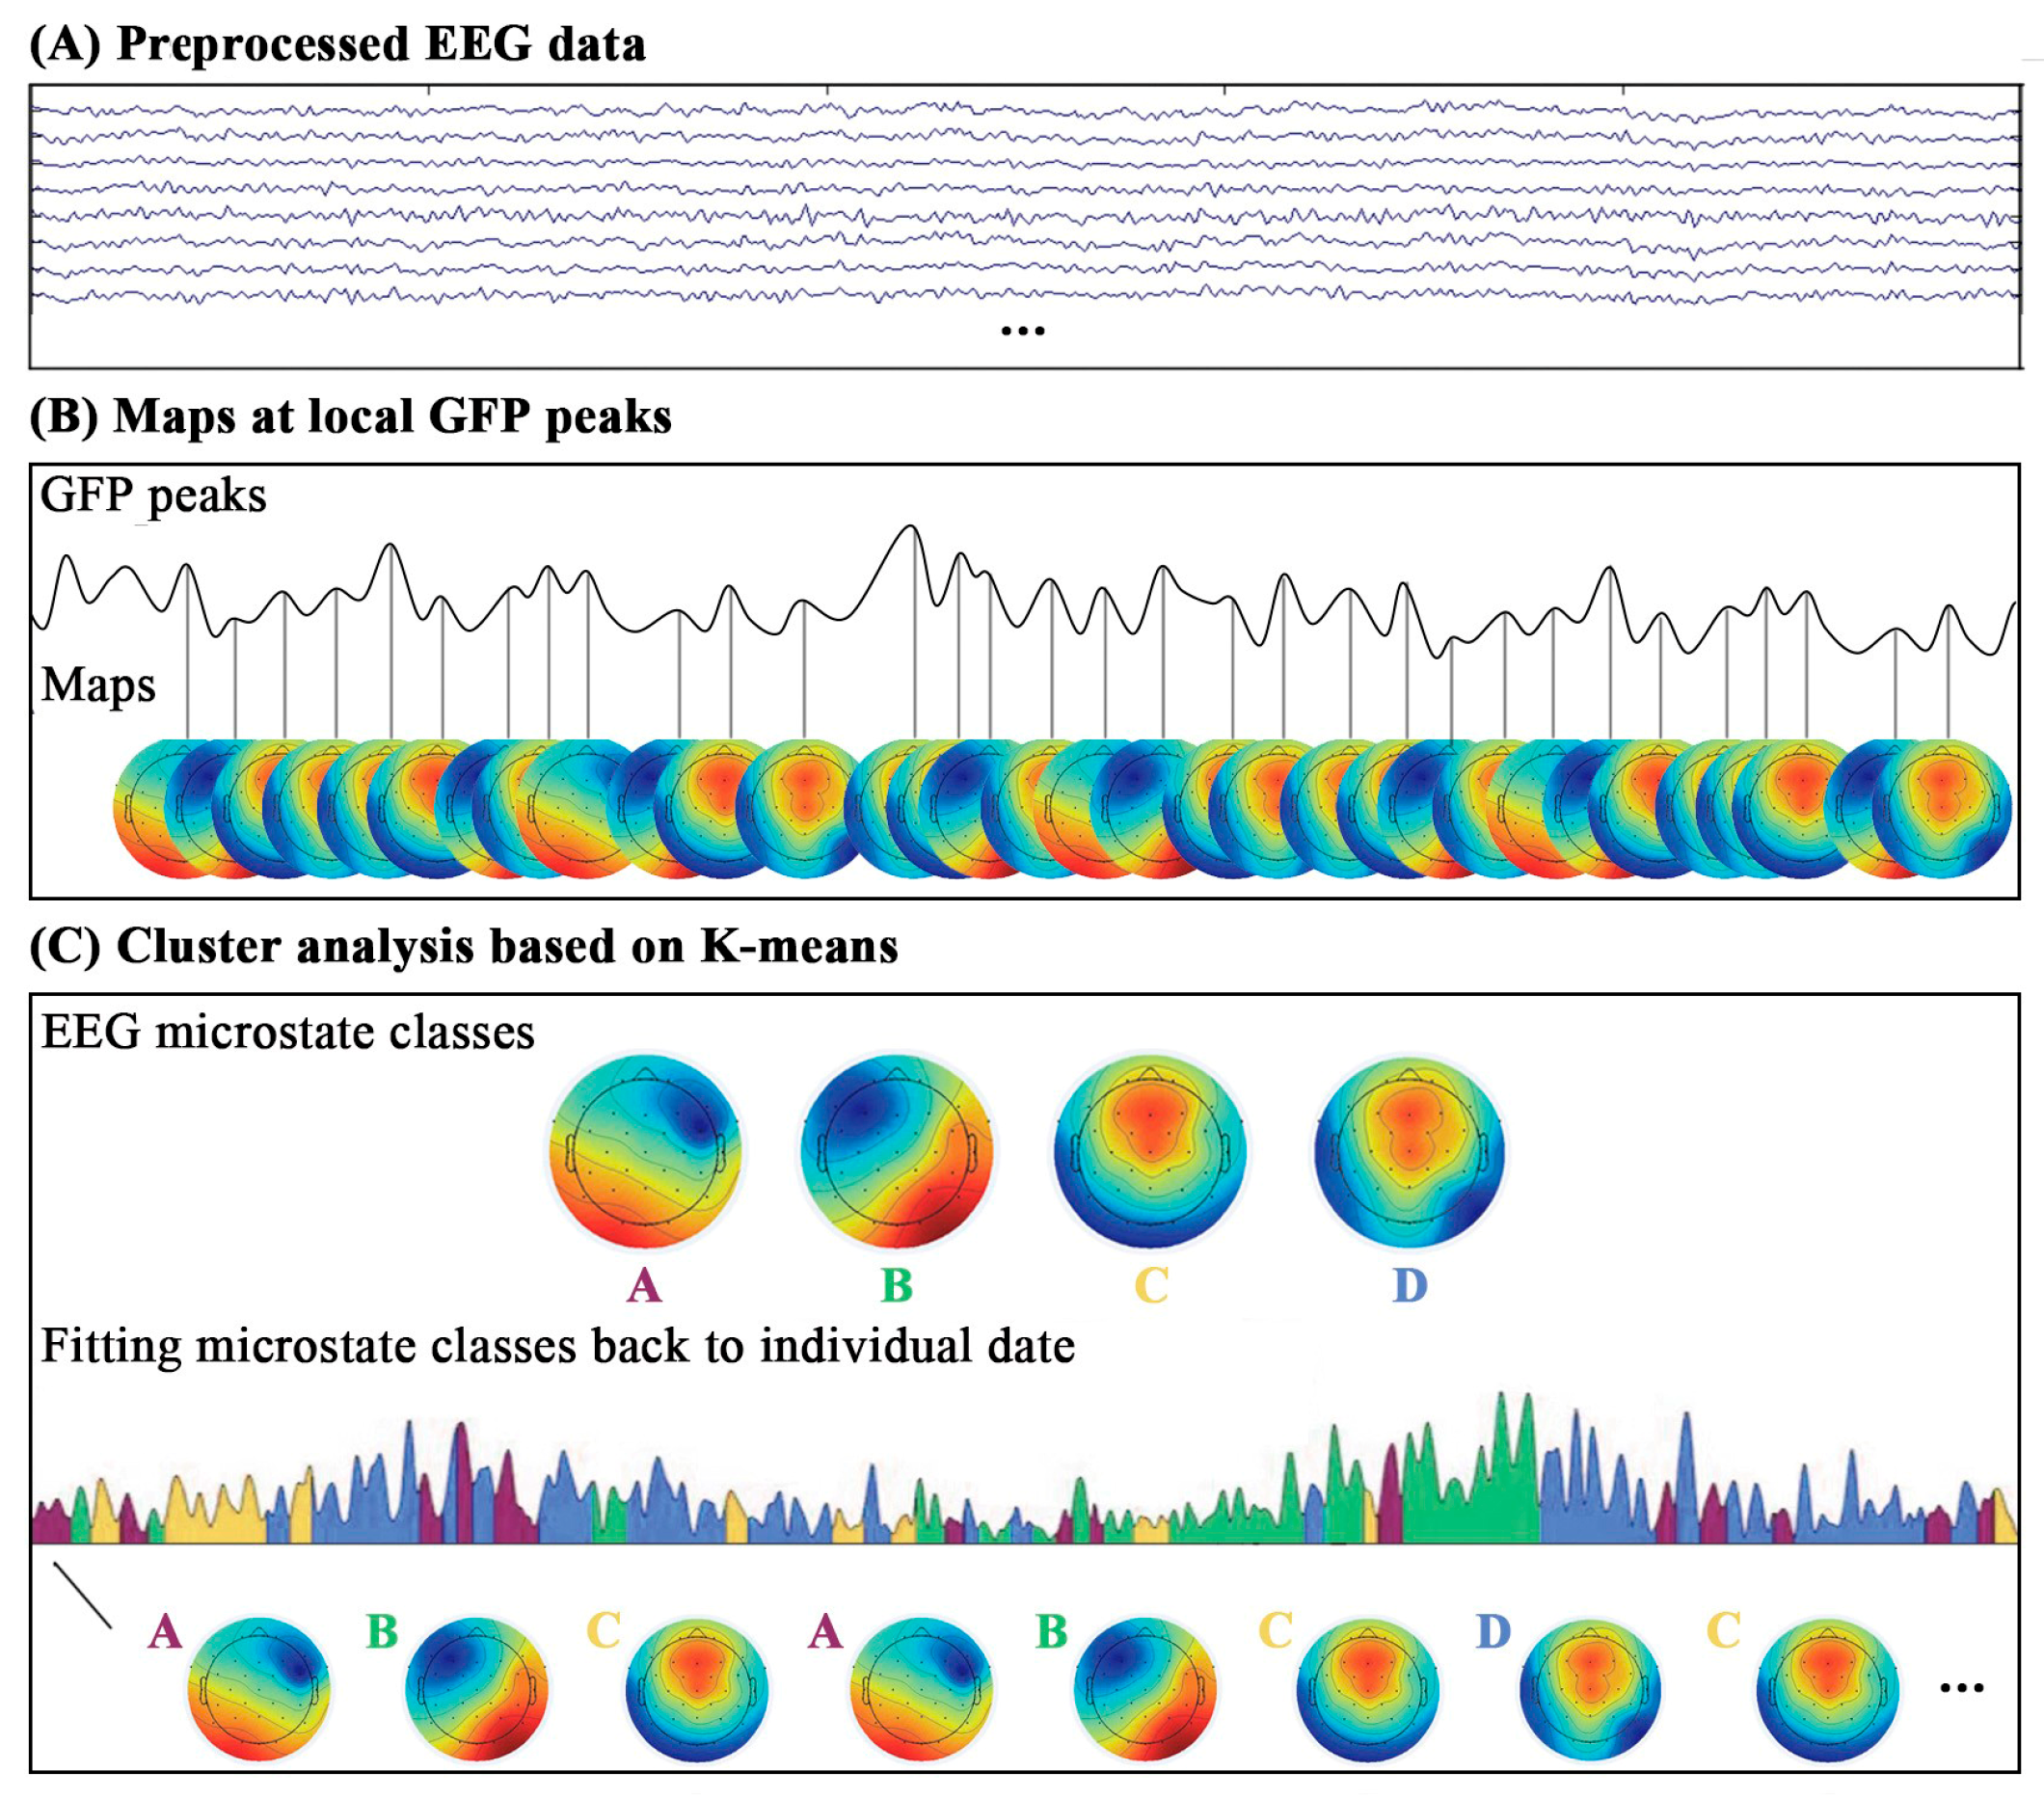
Figure 5 shows the steps of EEG microstate analysis. First, the preprocessed EEG data were imported into the CARTOOL 3.91 software for microstate analysis. Next, the magnitude of scalp potentials was originally evaluated using the Global Field Power (GFP) index, which was computed according to Equation (8). GFP refers to the spatial variability of EEG topography at a particular moment. The peak region of GFP exhibits the highest signal-to-noise ratio, indicating that the spatial pattern of the EEG at that moment is stable. Therefore, the peak-GFP moment was chosen to determine the instantaneous voltage amplitude of each electrode for cluster analysis [37]. The study refers to the instantaneous EEG potential field at the GFP peak as a map. Afterwards, the microstate maps of each subject were evaluated using clustering techniques. The microstates were segmented using the K-means clustering approach as described in the literature. Multiple studies have indicated that the ideal number of clusters is 4 [38]. Therefore, we chose to establish the number of clusters within the range of 2 to 6 and picked the most suitable set of classes based on the highest value of global explained variance (GEV). Next, the raw instantaneous maps of the four sets of experimental data were grouped into four distinct microstate groups. The polarity (blue or red color) of the microstate topography, whether positive or negative, should be disregarded for identifying microstates [39]. Research has demonstrated that EEG microstates can indicate the functioning of extensive brain networks during mental exhaustion [40]. This approach enhances the comprehension of the attributes of EEG signals in various states and offers novel insights for investigating emotional and cognitive processes. The four canonical EEG microstates correspond to well-established functional brain networks: Class A aligns with the auditory/vestibular network; Class B maps to the visual system, governing spatial and visual information processing; Class C operates within the saliency network to integrate interoceptive and autonomic information; and Class D drives the dorsal attention network, facilitating focus and attentional reorientation. Crucially, windowed environments modulated the temporal dynamics of Classes B, C, and D, suggesting an enhanced cognitive engagement with the restorative visual environment.
G F P = i = 1 n μ i 2 n .
where i denotes each electrode, n is the number of electrodes, and μ denotes the measured voltage for each channel.

2.6. Statistical Analysis

In this study, the Shapiro–Wilk test was used to assess whether the collected data satisfied normal distribution. Differences in subjects’ subjective evaluations as well as objective physiological indicators under different window-to-wall ratio conditions were analyzed by one-way ANOVA. To verify sample size adequacy, a post hoc power analysis was conducted based on physiological recovery indicators. The calculated statistical power (1~β) exceeded 0.80, confirming that the cohort of 36 subjects provided sufficient statistical sensitivity to ensure the reliability of the study findings.

3. Results

3.1. PRS and STAI-S

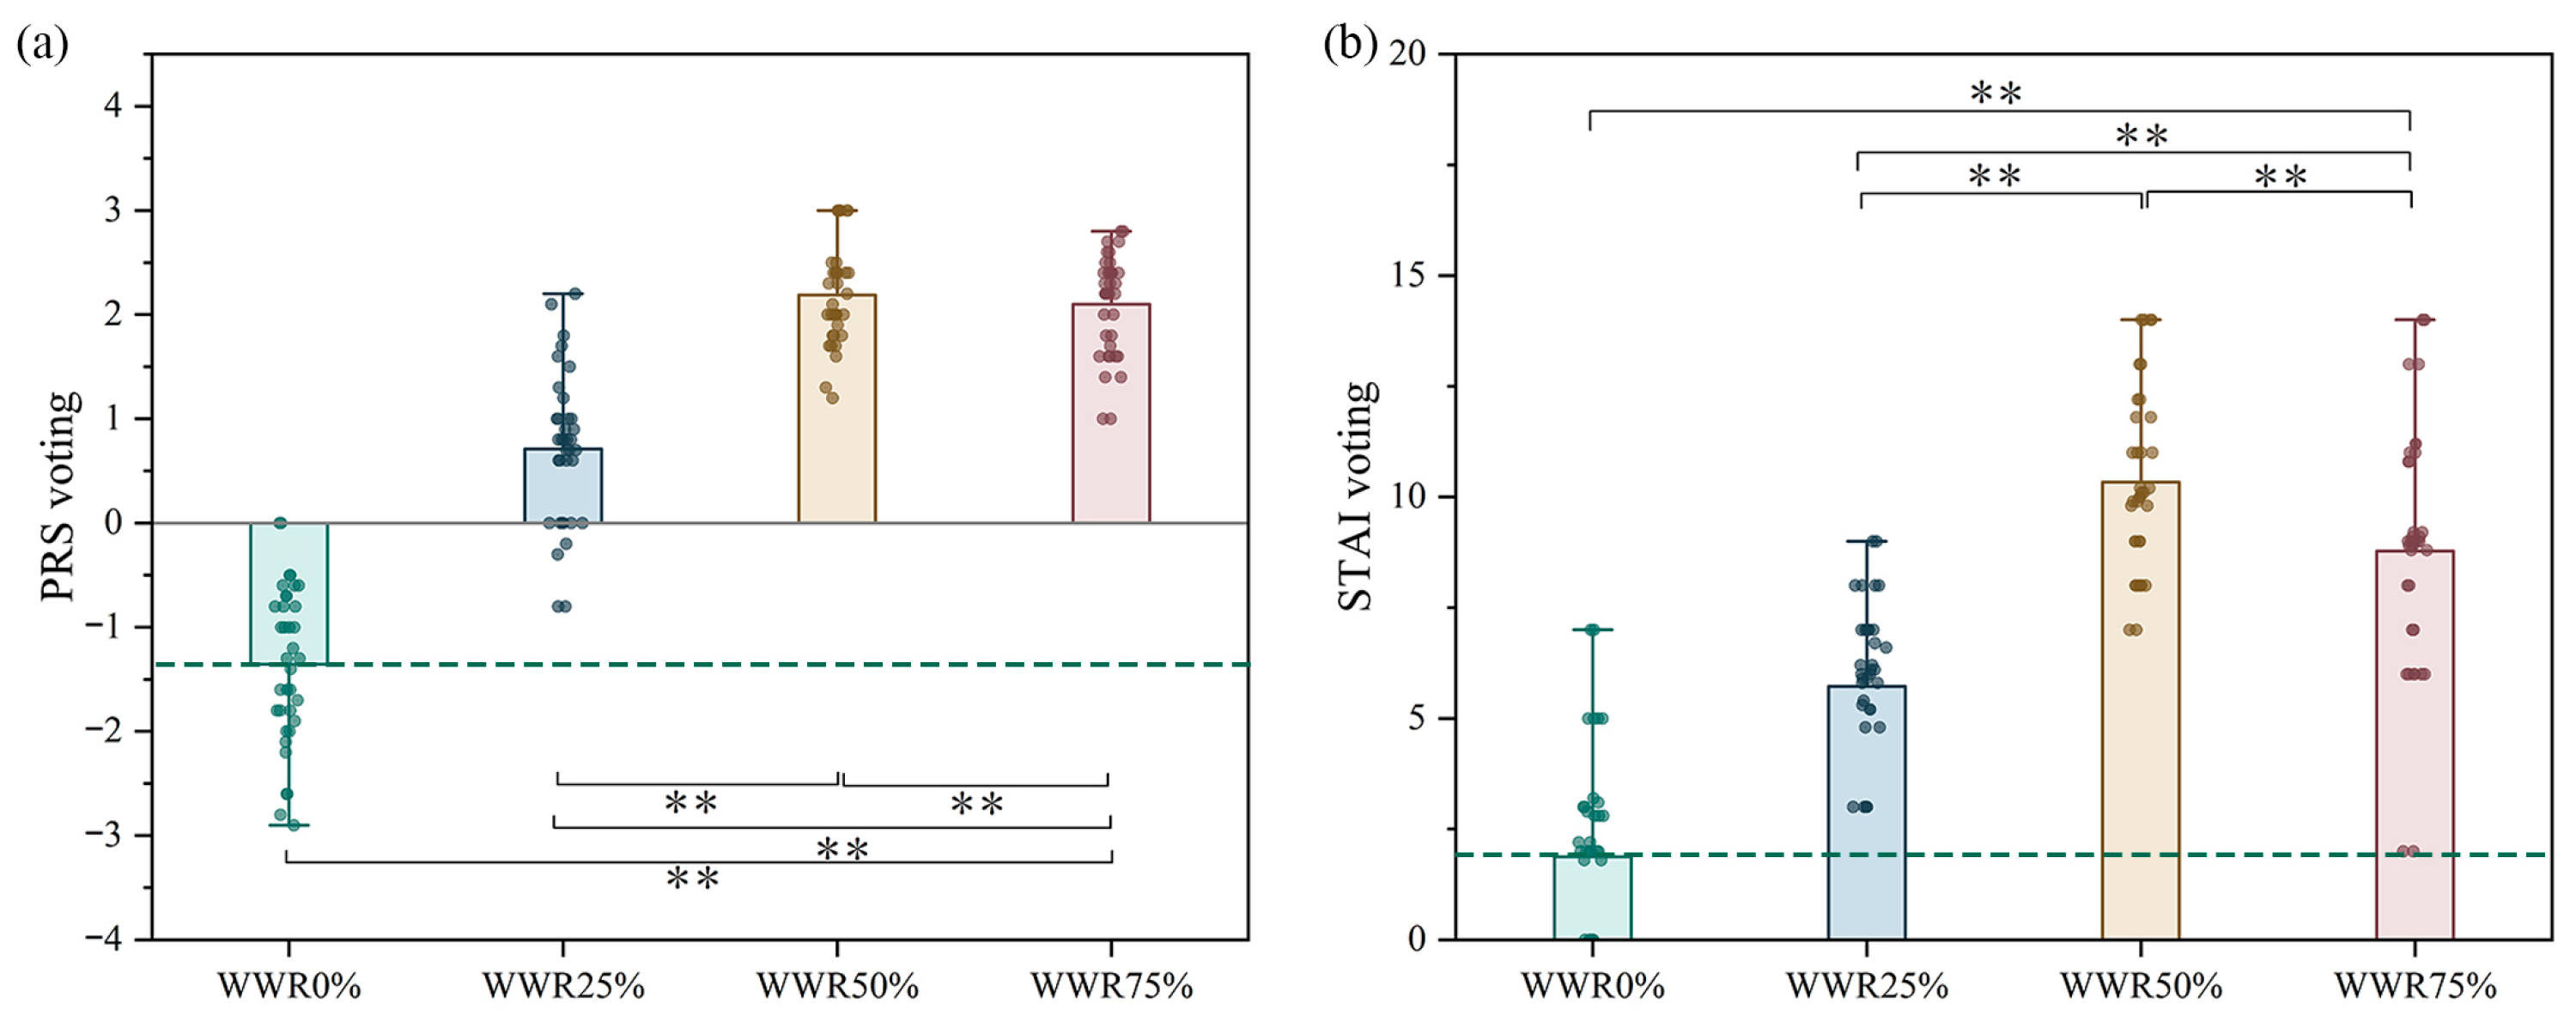
Figure 6 gives the subjective evaluation scores of subjects under four different WWR conditions. Figure 6a shows the average voting results for the degree of PRS perceptual recovery. As the WWR increases, the PRS perceptual recovery first increases and then decreases. The minimum rating was −1.36 in a windowless environment (WWR 0%), while the PRS in environments with WWRs of 25%, 50%, and 75% exhibited a substantial increase. The maximum rating reached 2.19 at a WWR of 50%, representing an increase of 3.55 compared to a WWR of 0% (−1.36), with a statistically significant difference (p < 0.05). Figure 6b shows the average voting results of the degree of STAI. As the WWR increased, the STAI-S anxiety recovery level initially rose and subsequently declined. The figure illustrates that the minimum rating was 1.87 with a WWR of 0%, while the maximum rating was 10.33 at a WWR of 50%, representing an increase of 8.46 compared to the windowless environment (1.87), with a statistically significant difference (p < 0.05). In conclusion, people in a windowless setting experience pronounced negative feelings, whereas a windowed environment can markedly alleviate these emotions, improve subjective assessments of the human body, and promote mental well-being. This may be attributed to the window offering a natural outside atmosphere for indoor occupants, which can enhance good feelings and successfully mitigate anxiety and the risk of depression [41].

3.2. EEG Time–Frequency Domain Features

3.2.1. EEG Average Power

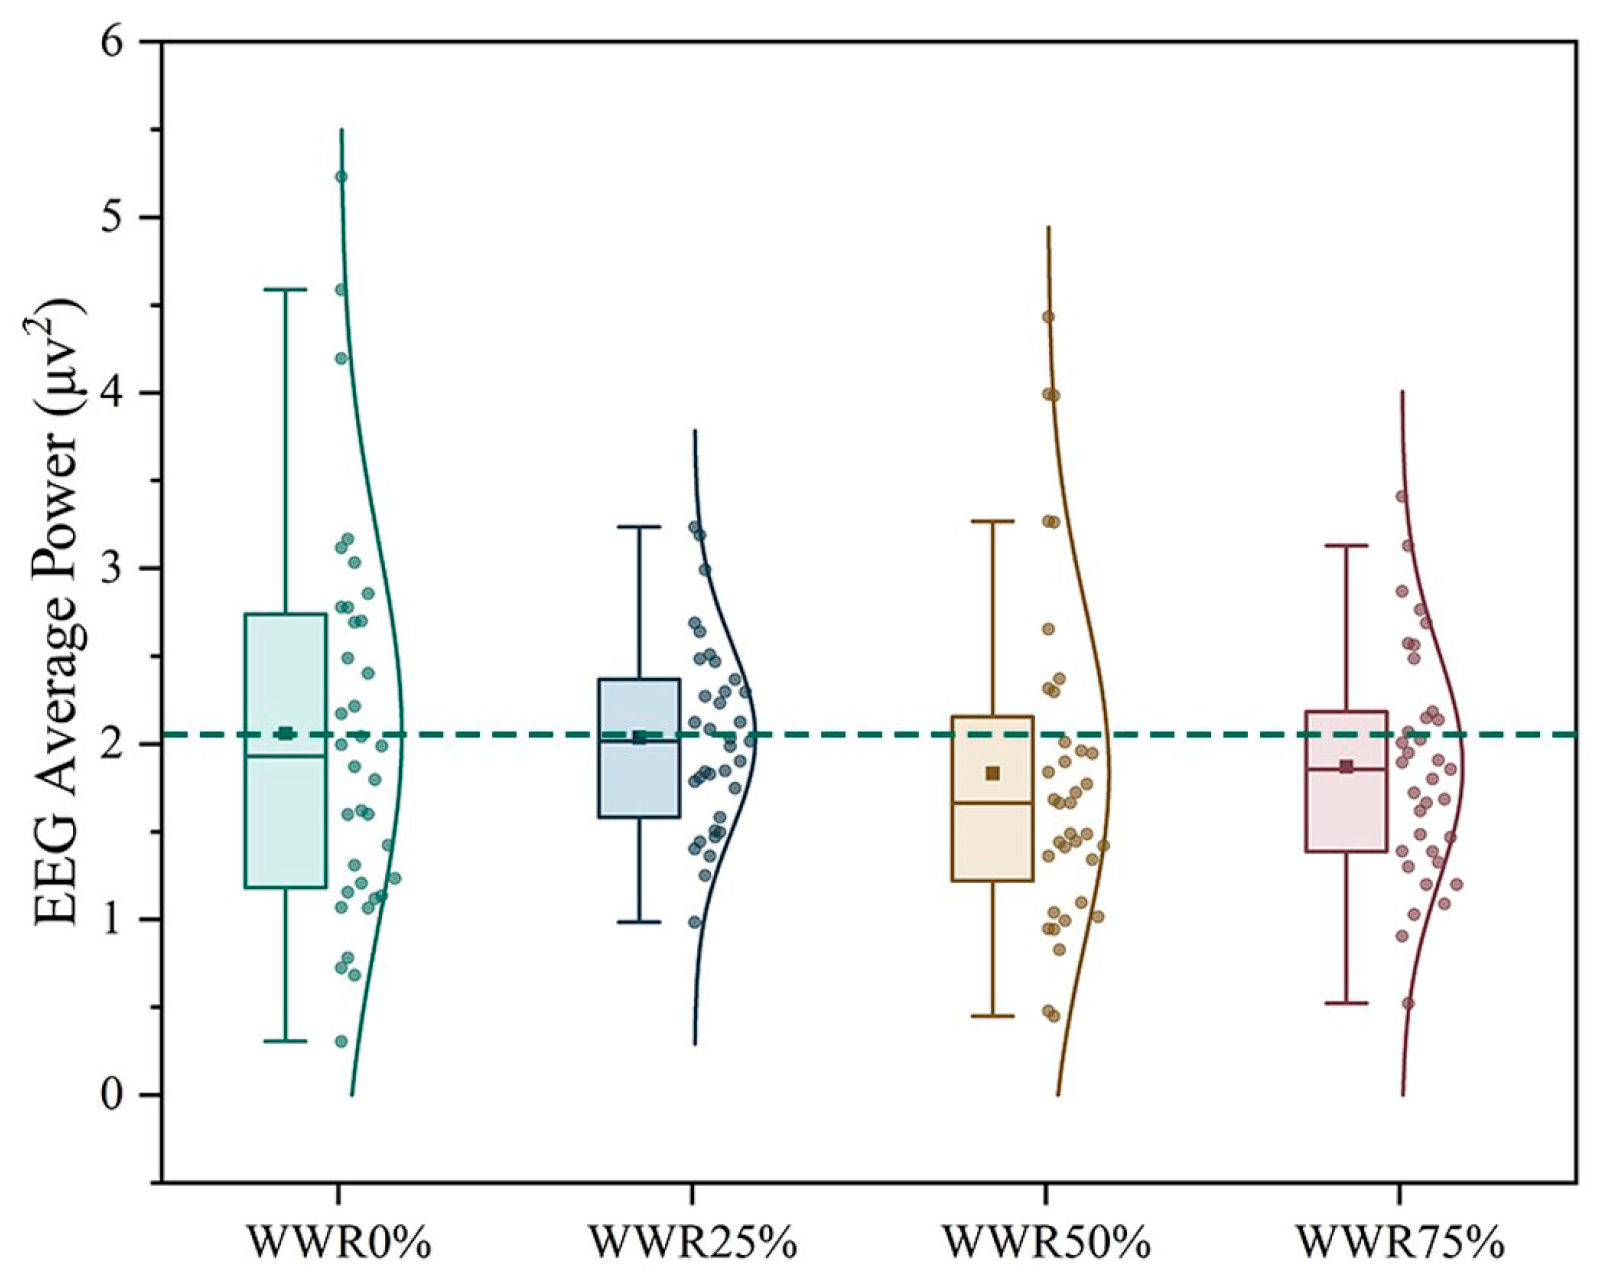
Figure 7 illustrates the average EEG power of subjects under different WWR conditions. The average power can reflect the level of energy consumption of neural activities in the brain. It has been shown that when the human body perceives the environment as uncomfortable, the synchronized firing activity of neuronal groups is enhanced, and the neural activity of the brain needs to consume more energy [42]. Compared with a WWR of 0%, the average EEG power was reduced in three windowed conditions. The maximum average power was 2.06 at a WWR of 0%, while the minimum average power was 1.83 at a WWR of 50%, representing a decrease of 0.23 compared to the control group. This indicates reduced energy consumption by the brain during this condition, resulting in greater comfort for the human body. The elevated average power of the EEG in subjects situated in a windowless environment implies that the absence of windows leads to increased energy expenditure by the brain.

3.2.2. EEG Relative Power

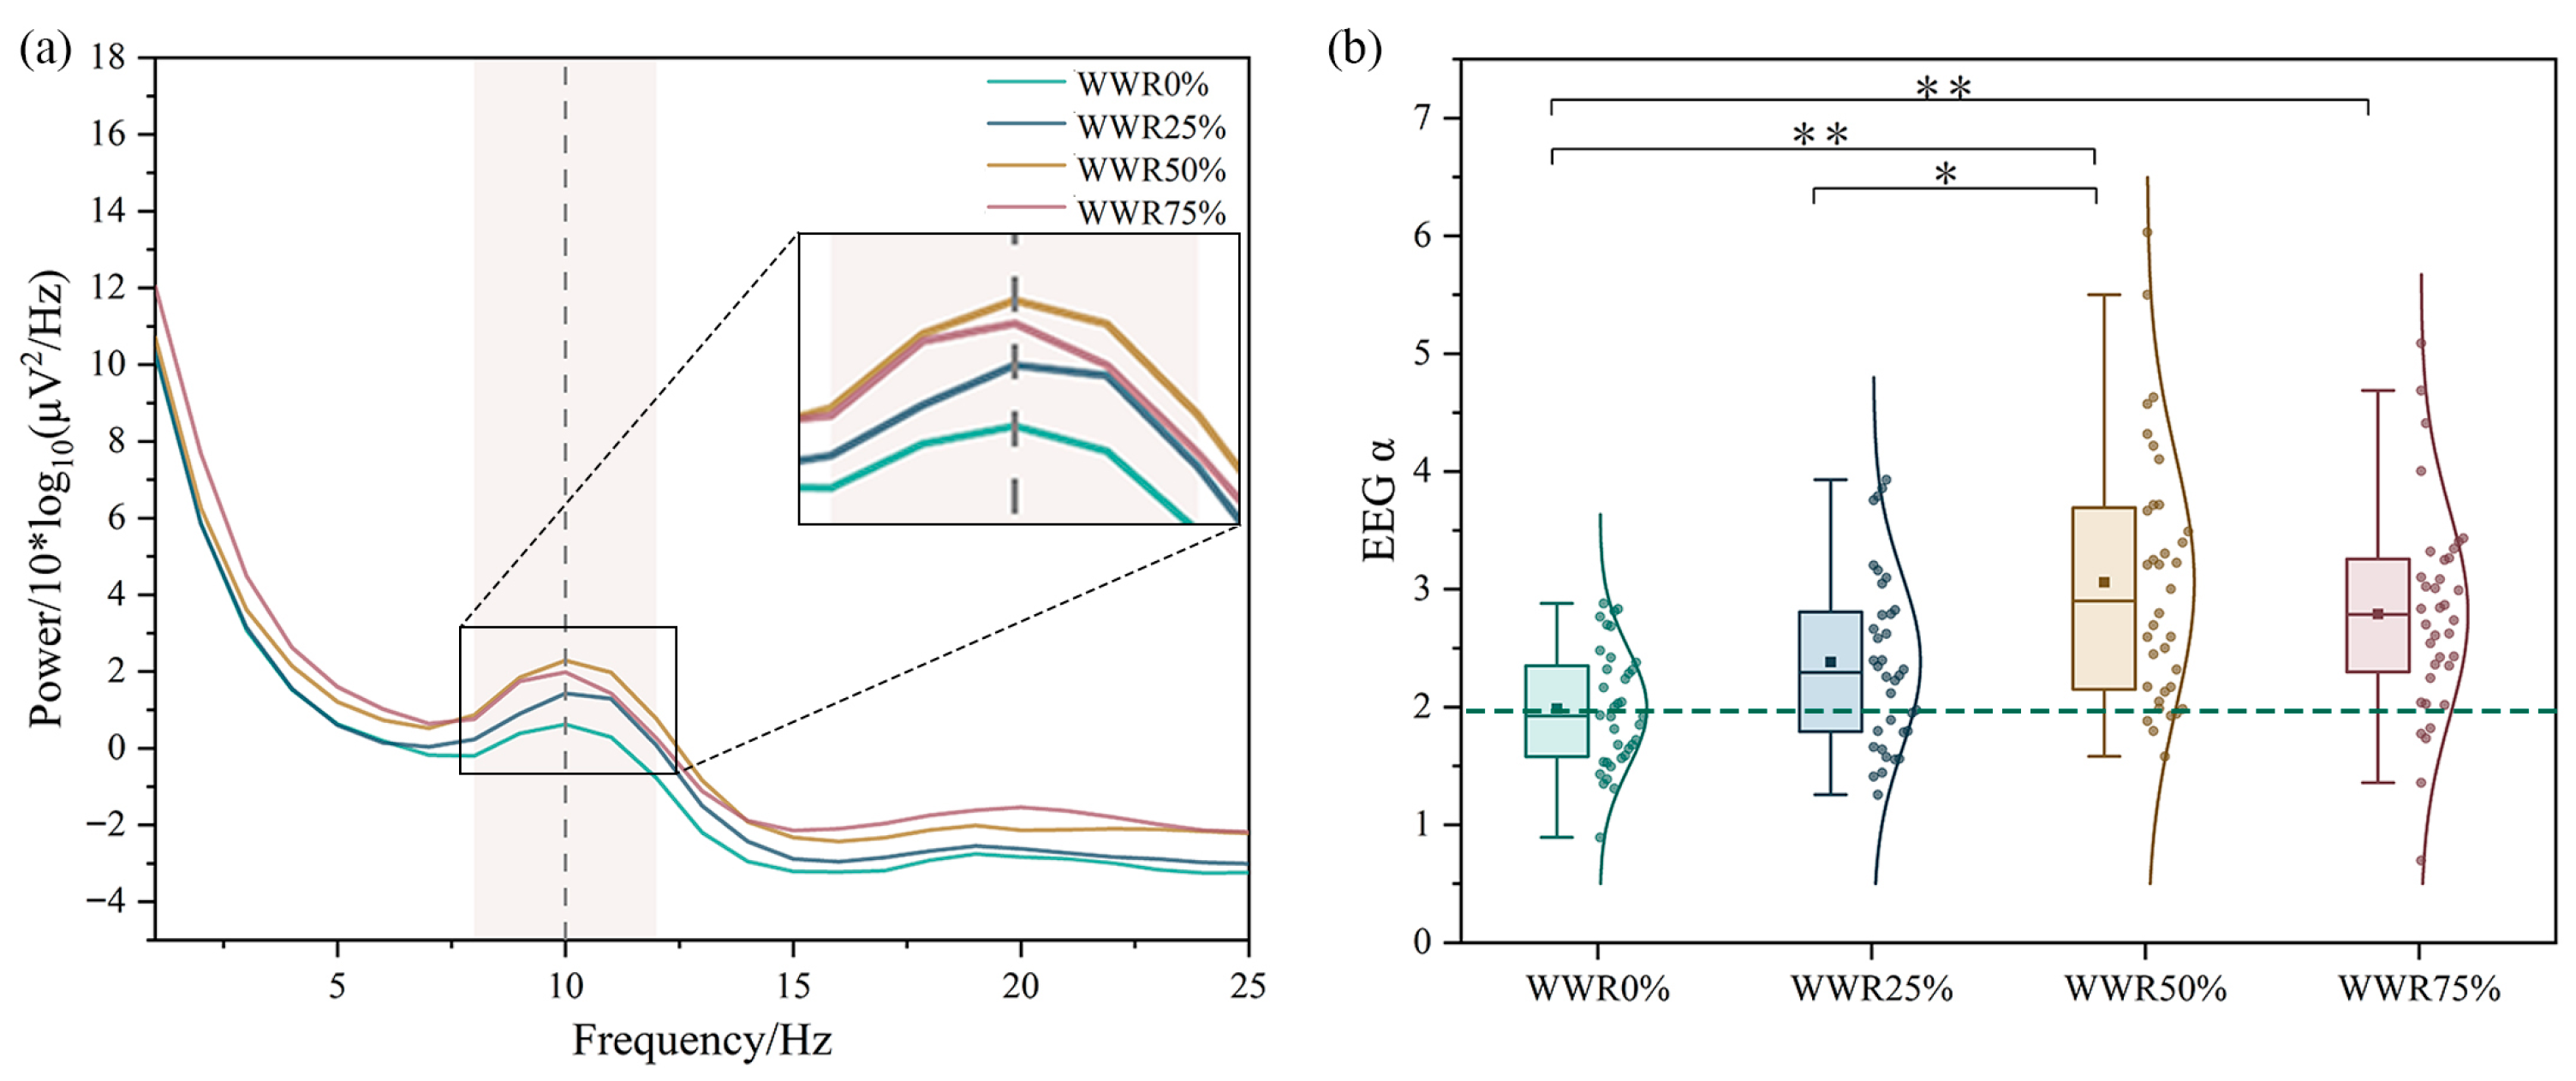
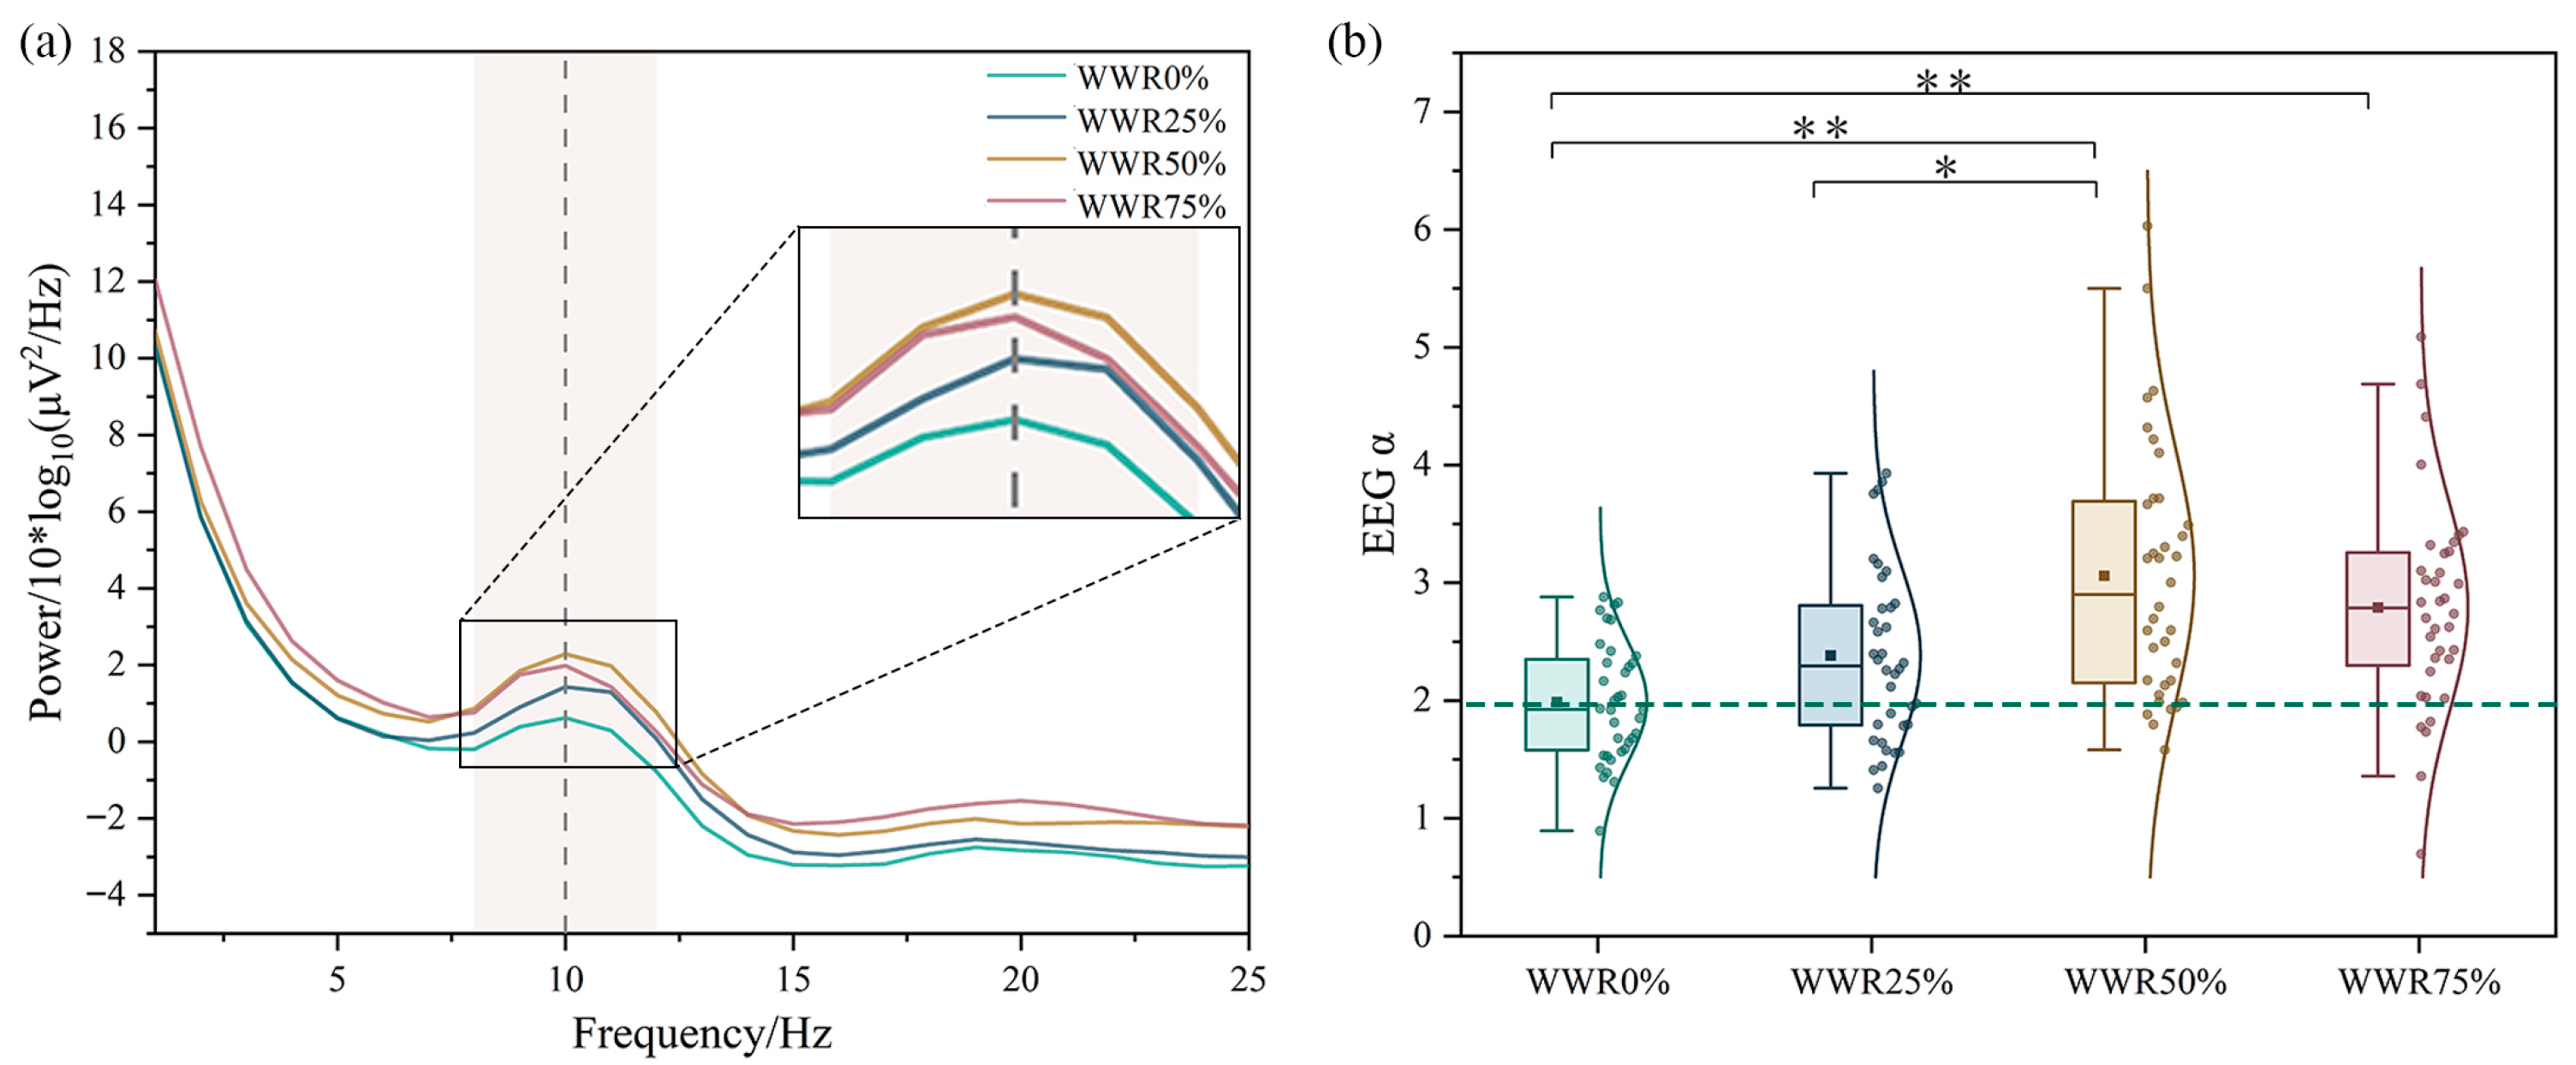
Figure 8a shows the power spectral density curves of subjects under different WWRs. In the α-frequency range (8–12 Hz), the α-waves peaks were approximately 10 Hz under different WWRs. The peak energy of the α-wave was the lowest in the WWR of 0%, and the peak energy of the α-wave in the windowed condition was higher than that in the windowless group. This suggests that the mental stress of the subjects at a WWR of 0% was elevated, but the mental stress of subjects in windowed environments was reduced. Figure 8b illustrates the average energy values of all subjects in the α-frequency range (8–12 Hz) of all channels for different WWRs. The graphic illustrates that an increase in WWR exhibited an inverted U-shaped trend in the α energy values. The maximum α energy value recorded was 0.19 DB at a WWR of 50%, above the control group with a WWR of 0% (0.12) by 0.07 (p < 0.05). This was succeeded by a WWR of 75%, which yielded a value of 0.17, surpassing the control group by 0.05. α-wave activity was elevated at a WWR of 25–75%, indicating a more relaxed brain state in a windowed environment. Brainwave analysis of human emotions indicates that α-waves correlate with pleasant emotions [43], whereas favorable views are frequently associated with reduced anxiety [44].
Figure 9a shows the relaxation level of all subjects under different WWR conditions. Compared with the windowless group (2.15), a windowed environment promotes relaxation. At WWRs of 25% (2.36), 50% (2.94), and 75% (2.57), relaxation levels increased by 0.21, 0.79, and 0.42, respectively, with statistically significant changes (p < 0.05). Figure 9b shows the psychological stress at different WWRs, with an opposite trend to that in Figure 9a. As the WWR rose from 0% to 75%, mental stress initially diminished before subsequently escalating. The windowless group exhibited the highest mental stress level of 1.70, while the ratios of 25% (1.38), 50% (0.93), and 75% (0.85) corresponded to reductions in mental stress of 0.32, 0.77, and 0.85, respectively, with a statistically significant difference (p < 0.05). This suggests that individuals experience increased mental tension in windowless environments and heightened relaxation in windowed environments.

3.2.3. Power Differences Among Brain Regions

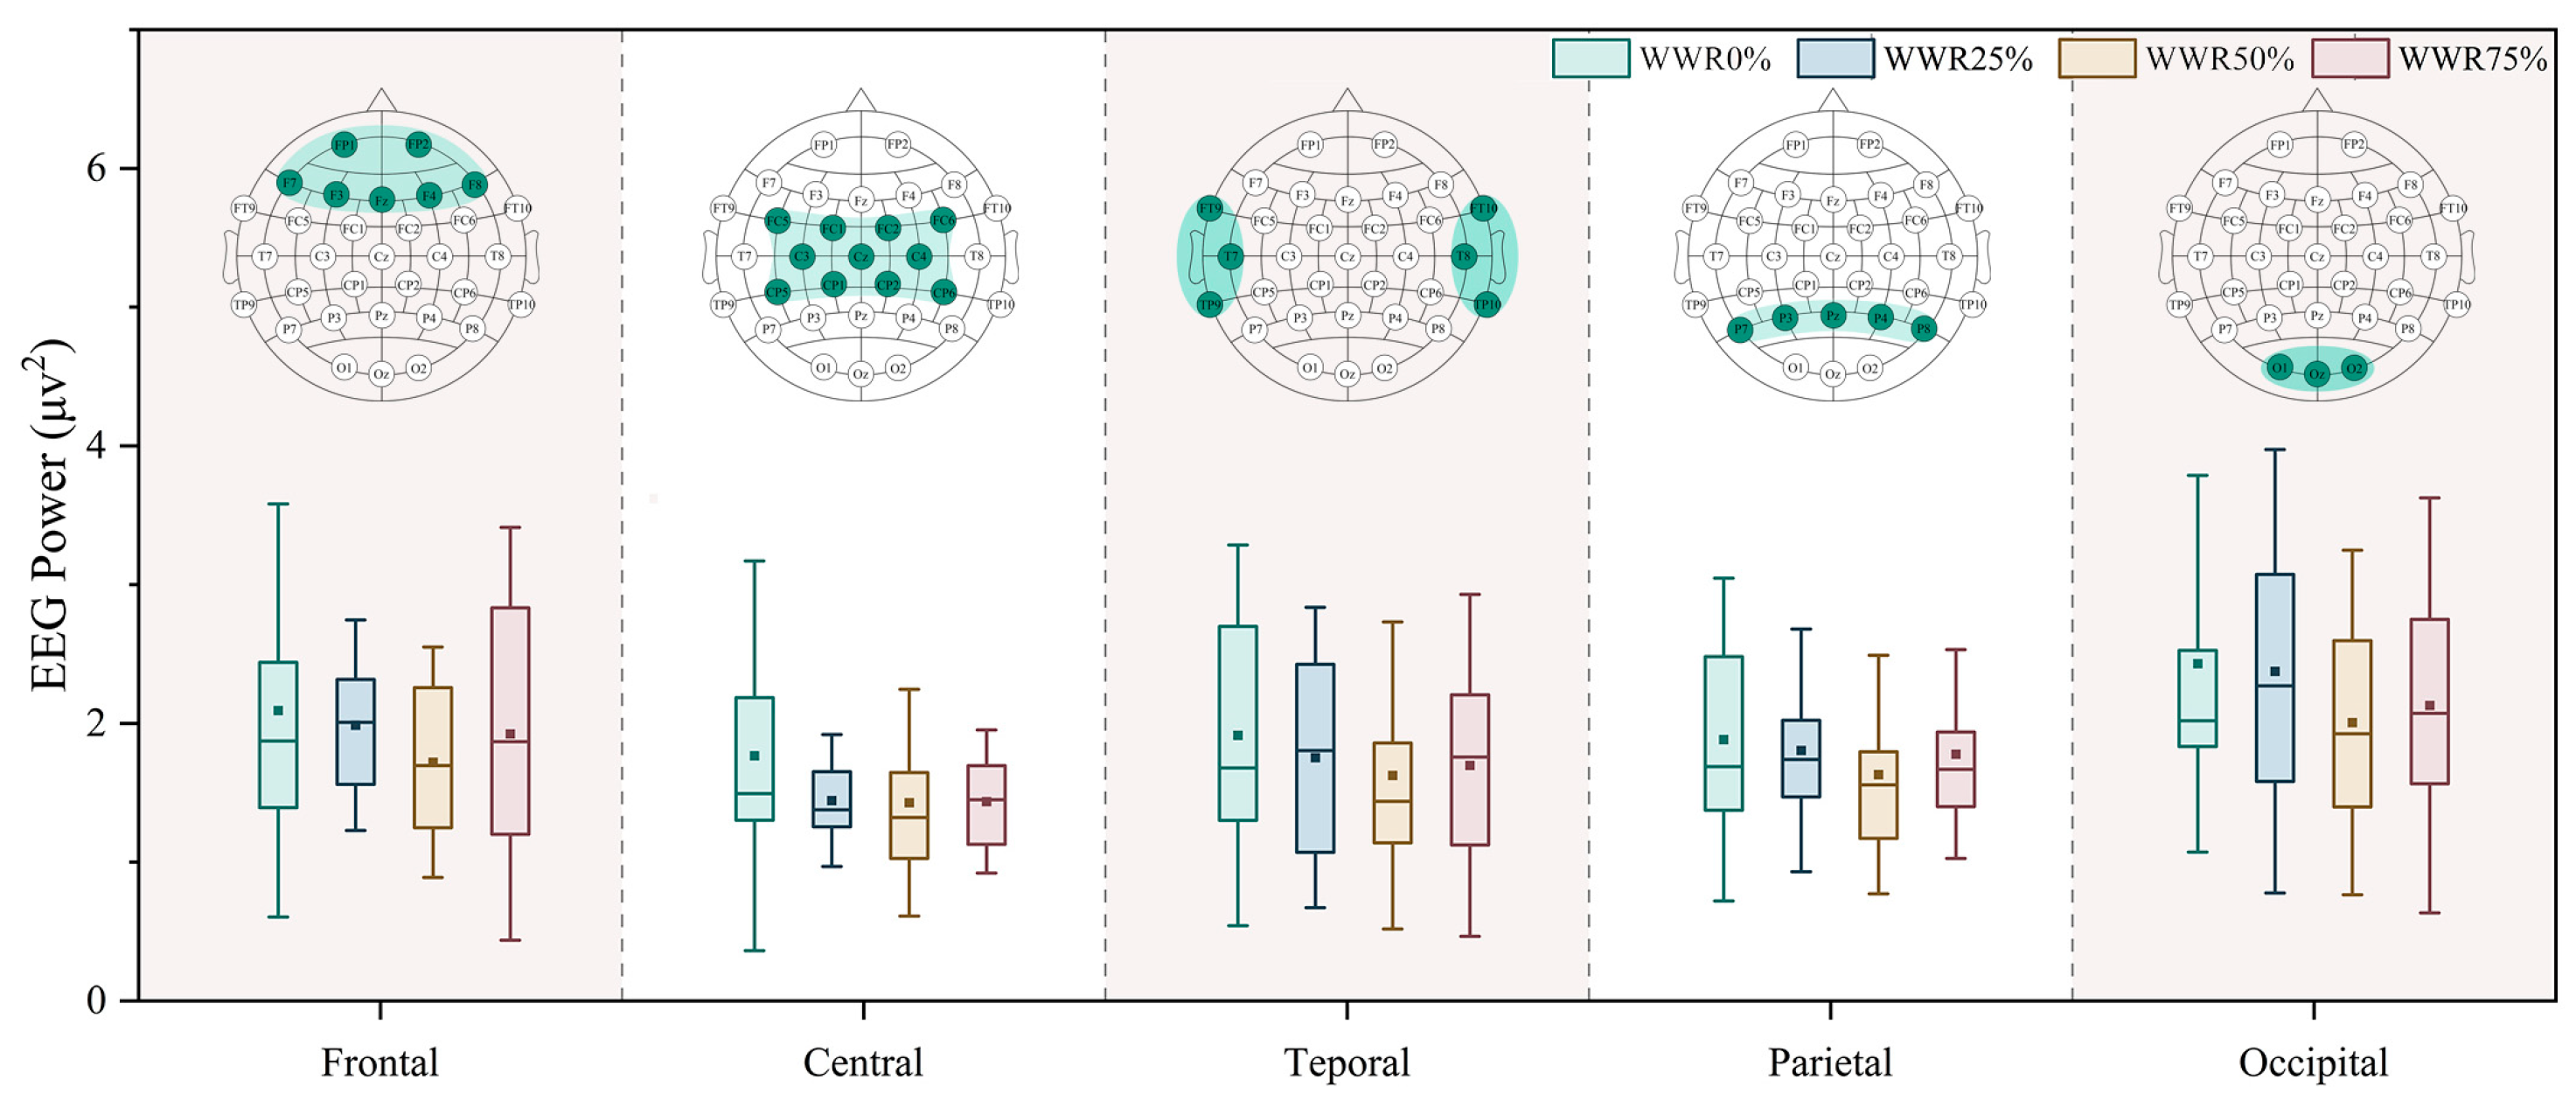
Figure 10 shows power changes across different brain regions. Variations in WWR conditions can influence cerebral activity, and the impact of diverse visual inputs on various brain regions is distinct [45]. Given that the occipital and parietal lobes are crucial to the preliminary processing and synthesis of visual information [46,47], neural activity was heightened in these regions across all situations. Brain activity was diminished across all regions at a WWR of 50% compared to WWRs of 25% and 75%, potentially because the WWR of 50% promoted stress recovery in subjects. Frontal and temporal lobe brain activity was significantly elevated in the WWR of 0% compared to the windowed condition, as these lobes are integral to higher cognitive functions, including attention, working memory, and decision-making [48]. This indicates that the absence of windows was less conducive to stress recovery following tasks such as cognitive calculations in the experiment. In addition, the alteration in the WWR situation exerted a diminished impact on the central regions of the brain. In summary, the occipital and parietal lobes, which are responsible for preliminary processing and integration of visual information, showed heightened brain activity across all working conditions. Frontal and temporal lobe brain activity was notably elevated at a WWR of 0%, whereas the lowest brain activity across all areas occurred at a WWR of 50%, suggesting that a WWR of 50% can substantially diminish subjects’ stress levels.
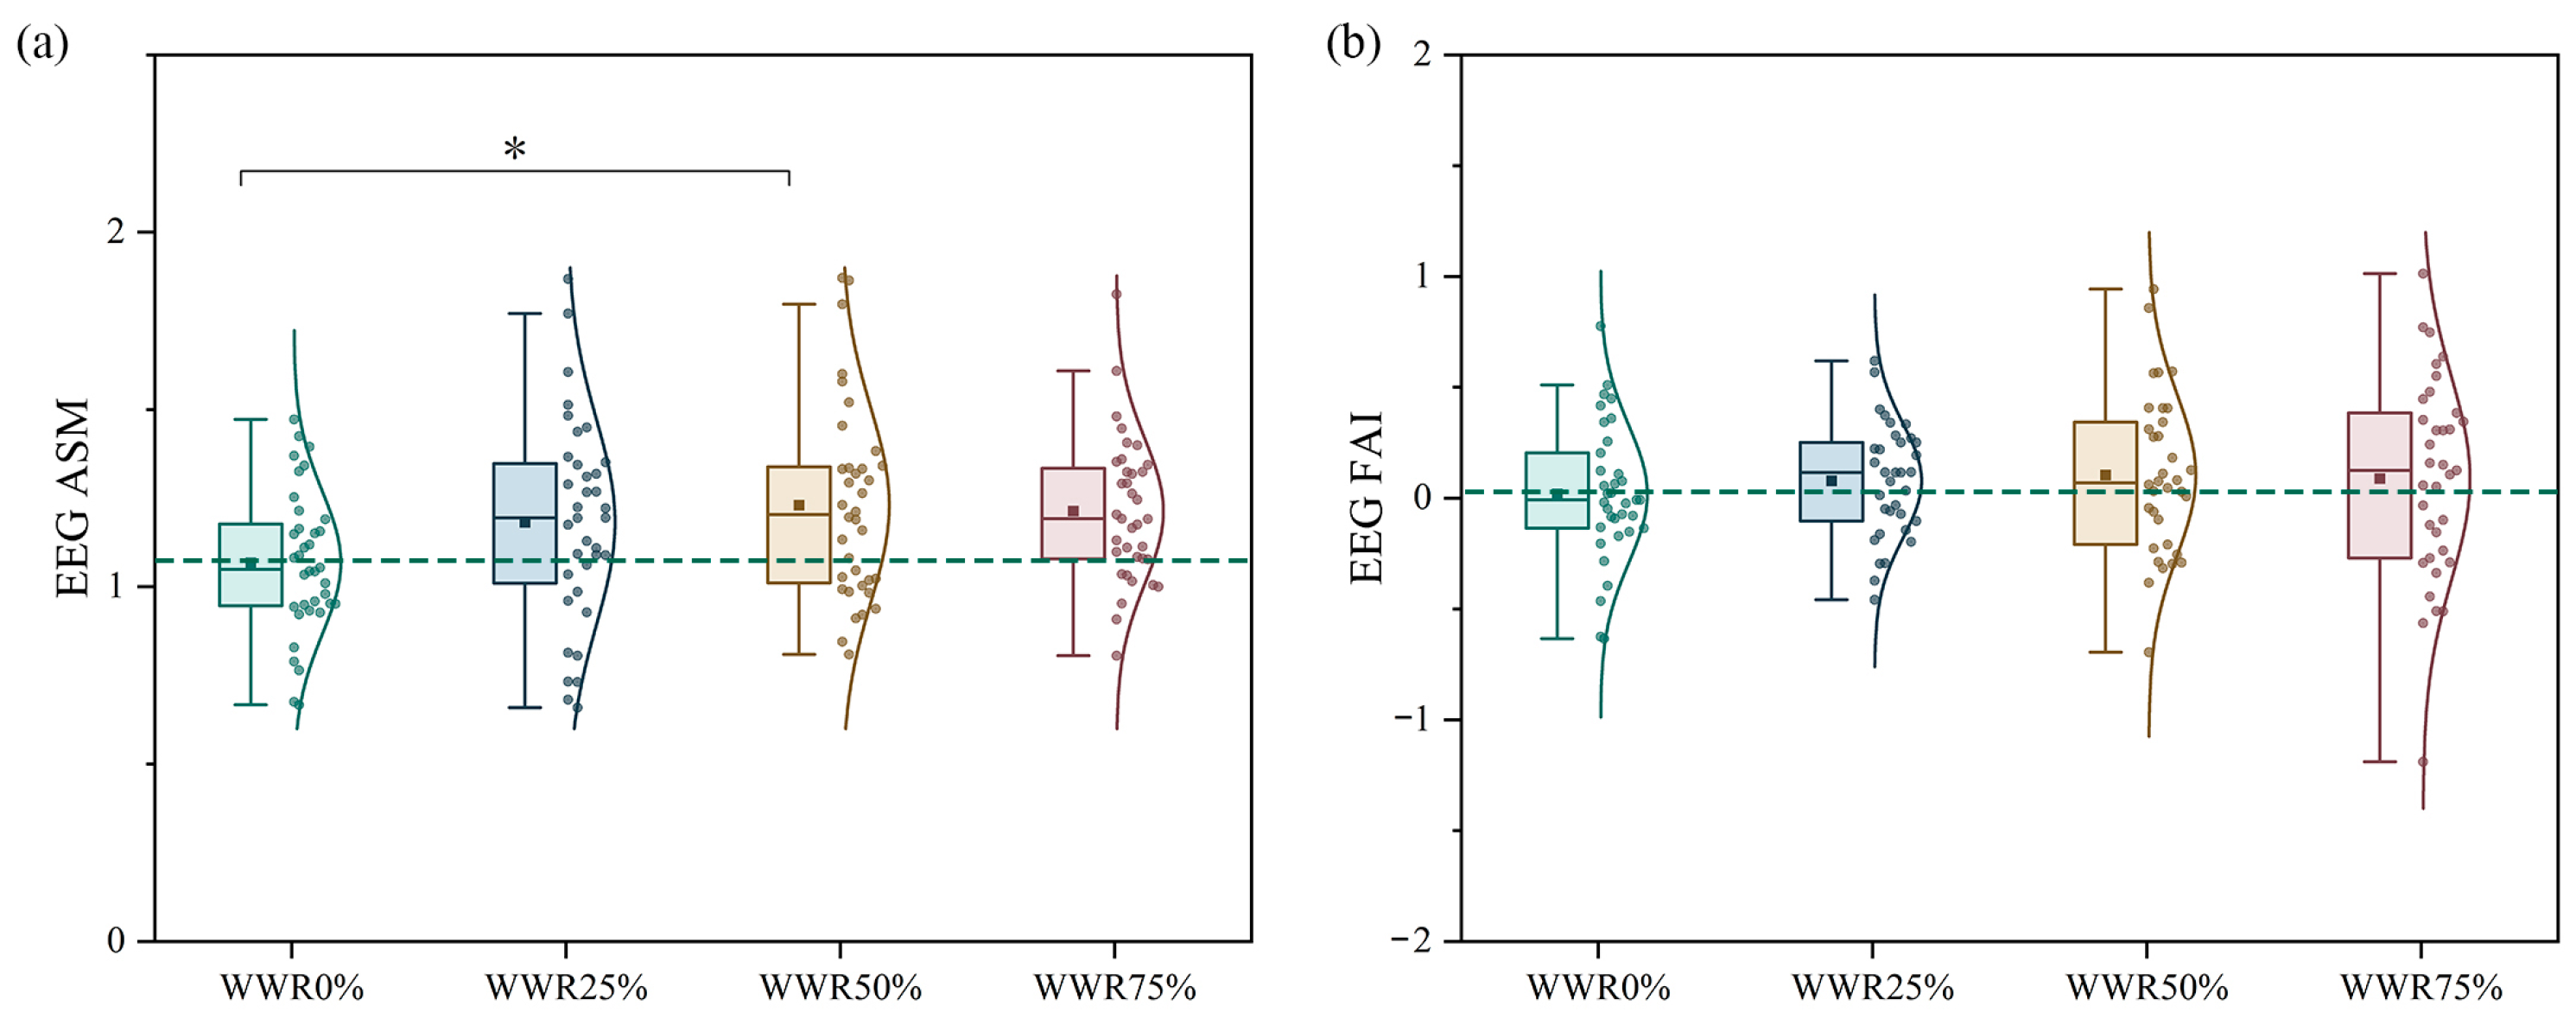
Figure 11a illustrates the ASM indices of the left and right hemispheres for all subjects across various WWR circumstances. The right hemisphere is typically linked to positive emotions, approach motivation, and cognitive functions [49]. The number of ASMs will be heightened in a windowed environment compared to the control group with a WWR of 0% (1.07). The ASM increased by 0.15, 0.16, and 0.14 for WWRs of 25% (1.18), 50% (1.23), and 75% (1.21), respectively. Figure 11b shows the FAI for all subjects in different WWR conditions, and studies have shown that a higher FAI is associated with positive emotions [50]. A similar tendency was noted in Figure 11a regarding the ASM. The minimum FAI recorded was 0.02 at a WWR of 0%, with increases of 0.06, 0.08, and 0.07 observed at WWRs of 25% (0.08), 50% (0.10), and 75% (0.09), respectively. In summary, the ASM of the human body is more evident in the windowed room, which is more conducive to cognitive activity. Correspondingly, the FAI is elevated at this time, signifying that subjects experience heightened pleasant emotions and improved recovery during this period. Windowed areas have proven useful in alleviating anxiety and tension while reducing stress among building occupants [5]. The WWR does not benefit from being excessively high; an overly big ratio might induce feelings of insecurity, resulting in adverse effects.

3.3. EEG Microstate

3.3.1. EEG Microstate Analysis

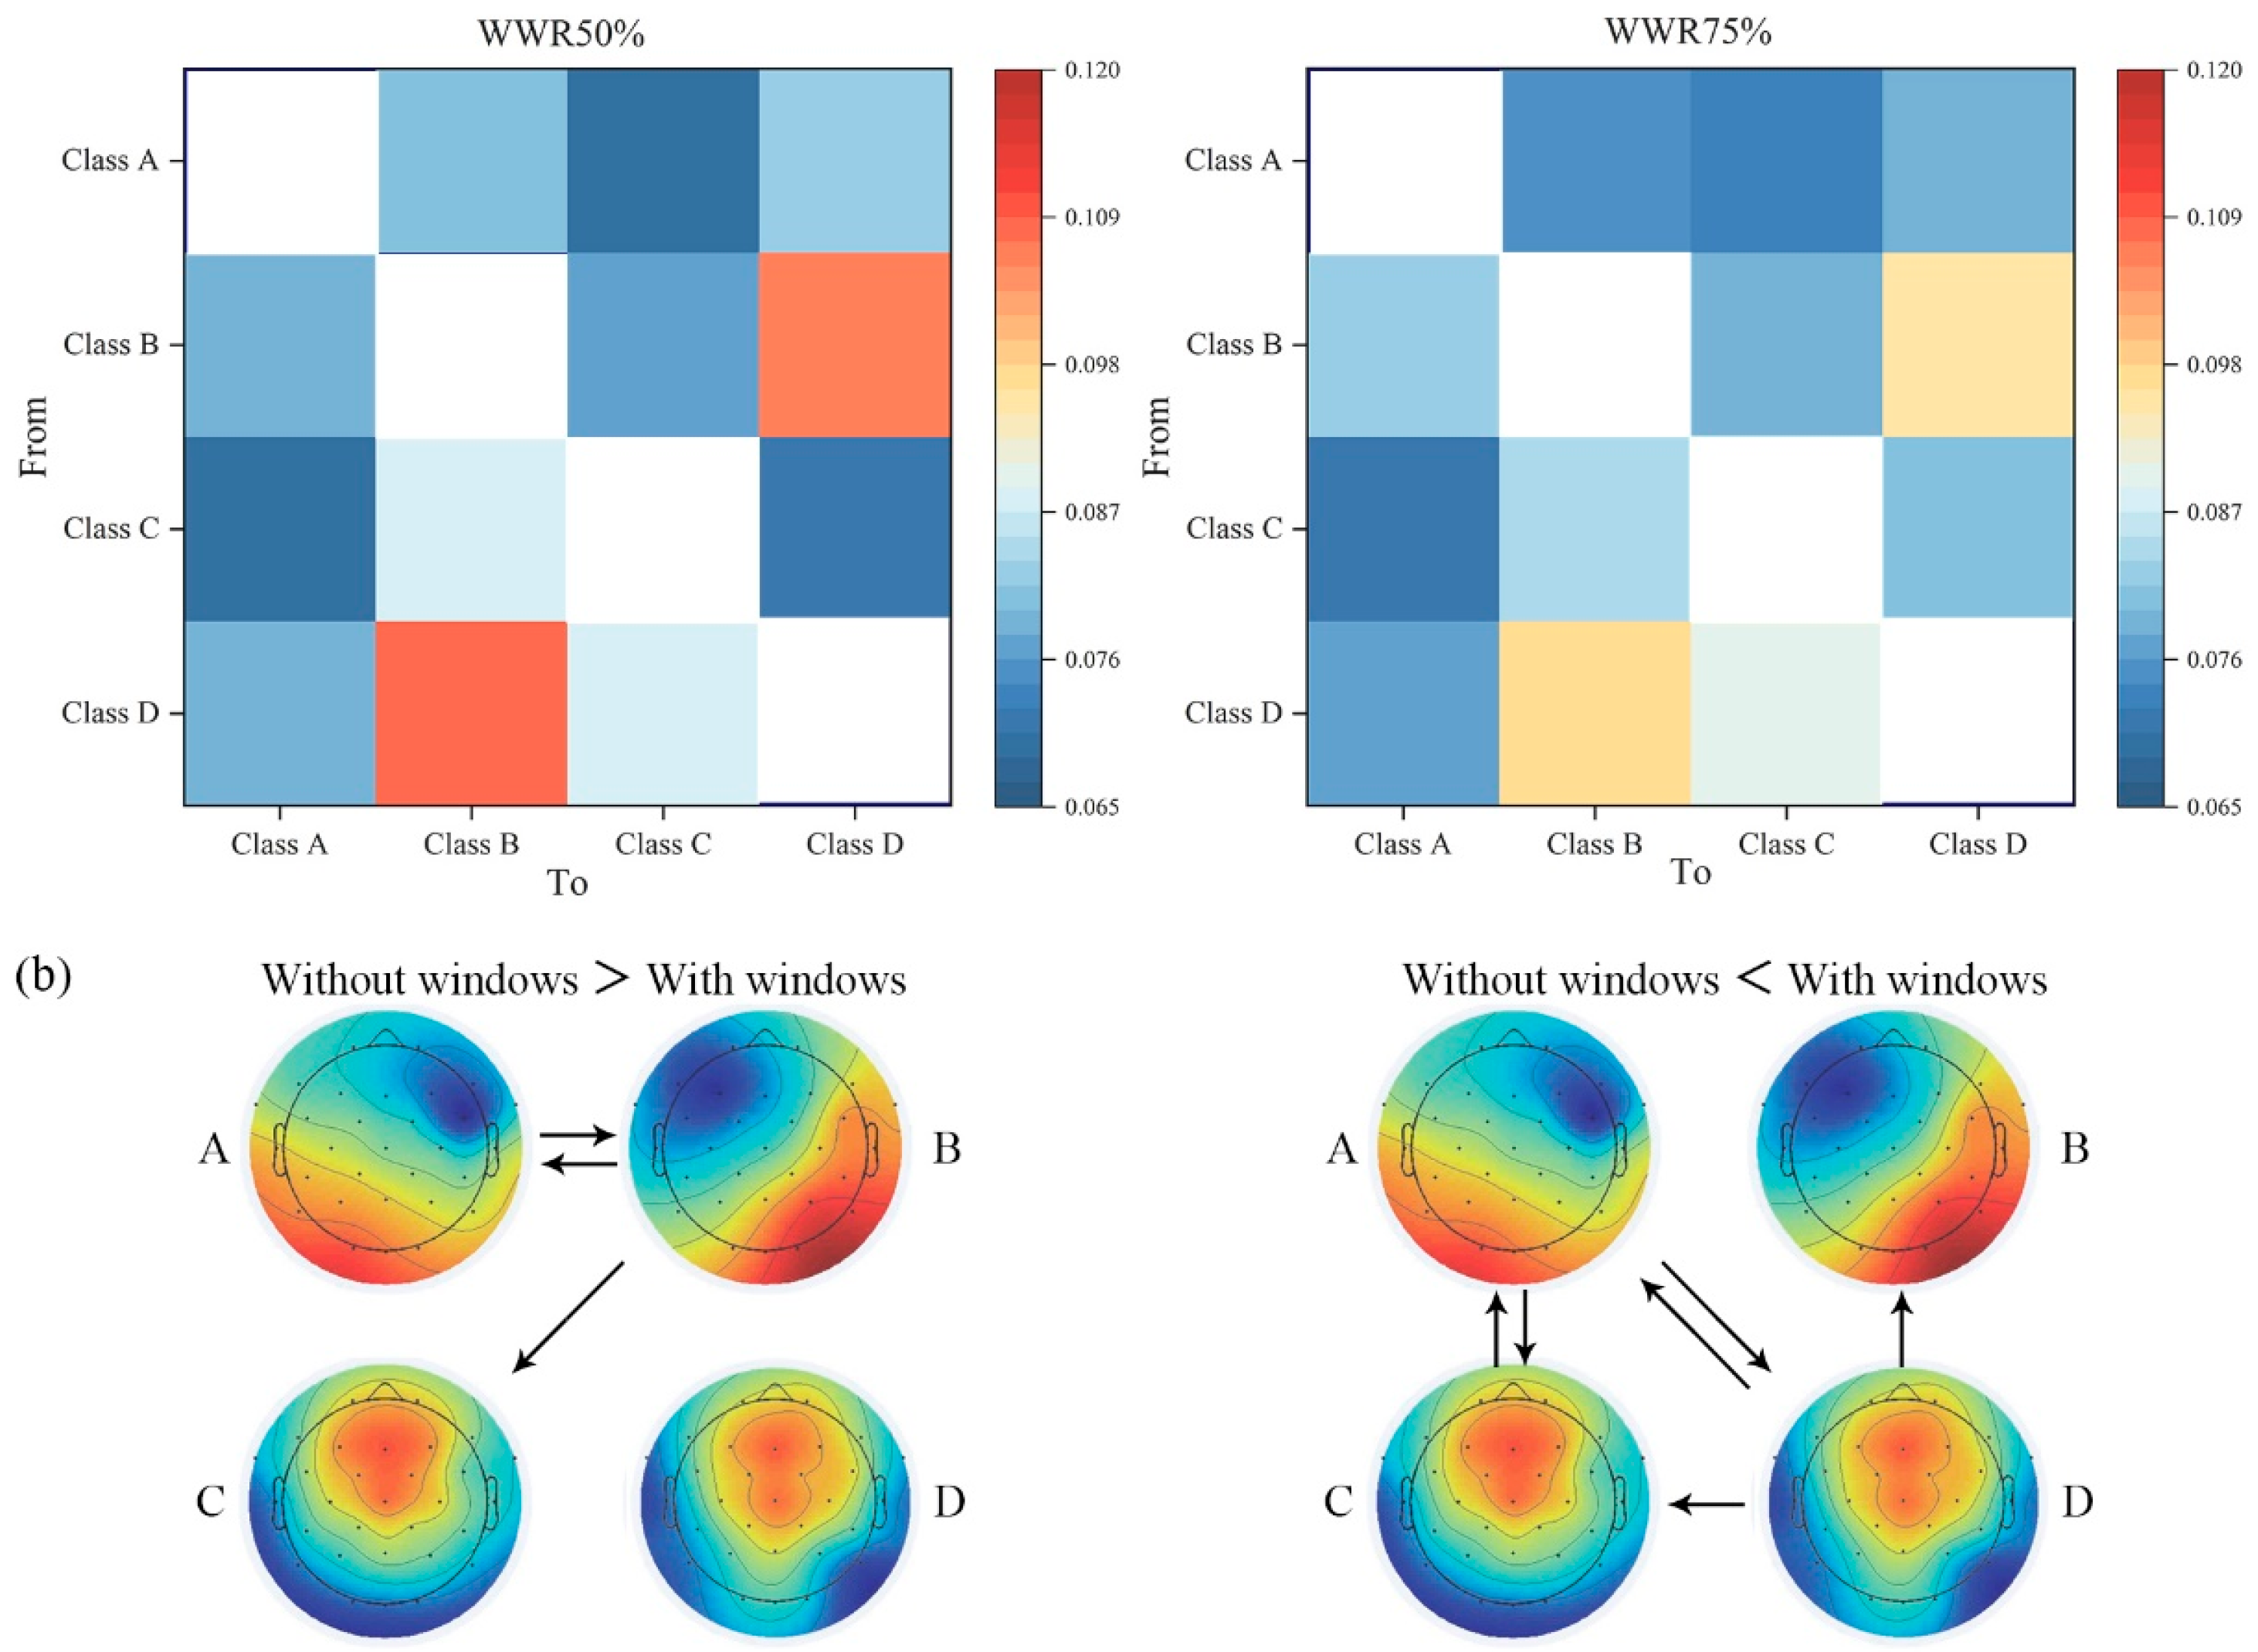
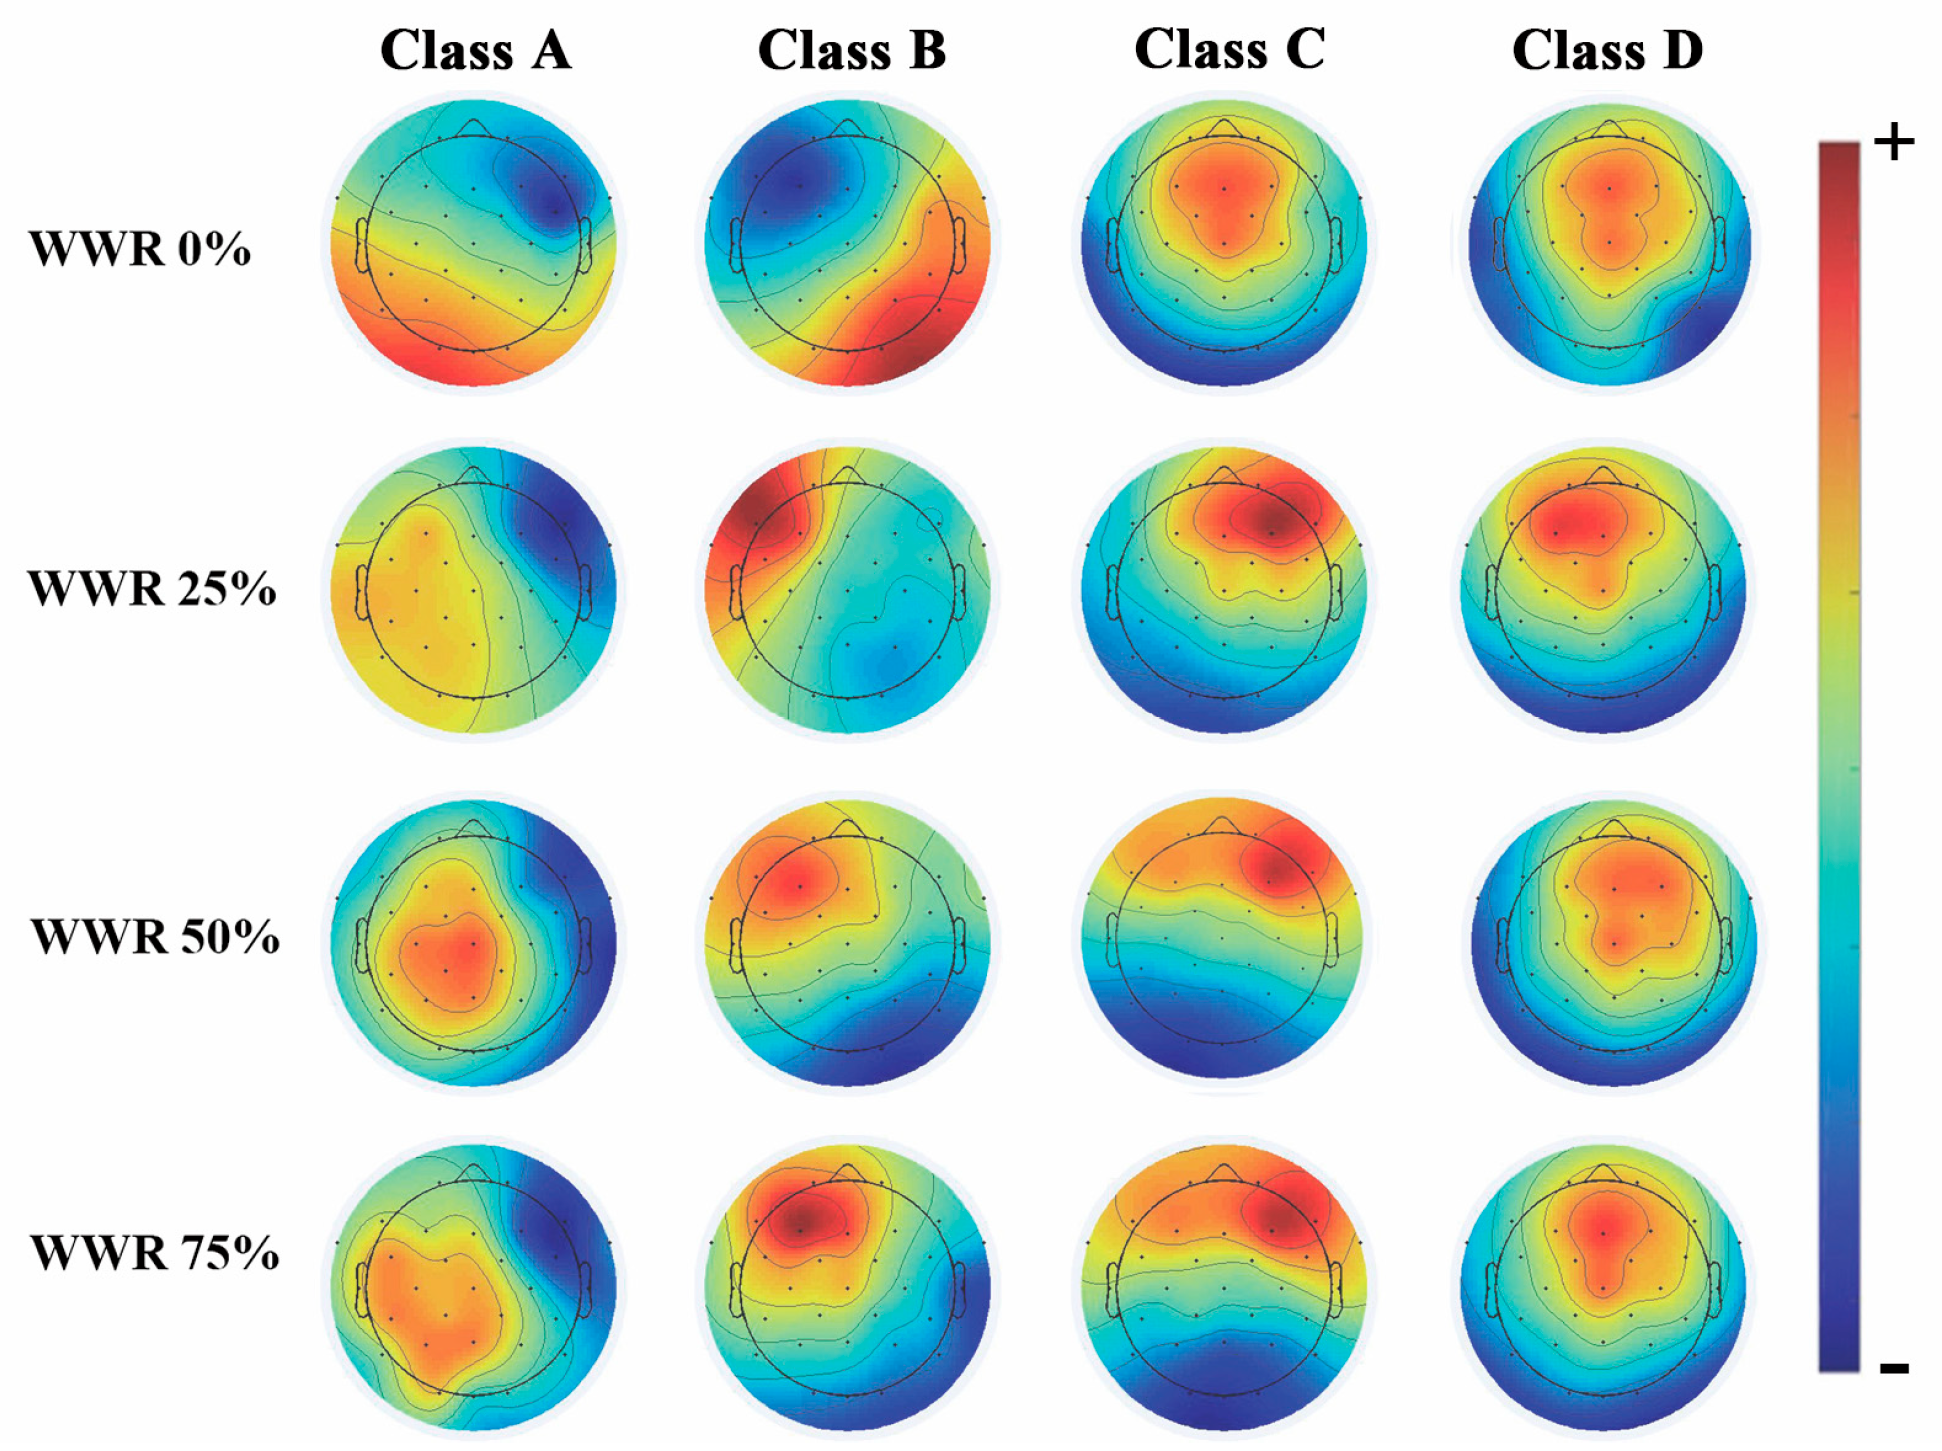
By clustering microstates at both the individual and group levels, we identified four distinct topographic map types. Figure 12 shows the four categories of EEG microstates under different WWR conditions, which are named as categories A, B, C, and D. It has been shown that microstate A is mainly associated with the auditory network, microstate B is mainly associated with the visual network, microstate C is mainly associated with the salient network, and microstate D is mainly associated with the attentional network [51]. Based on the four microstate segmentation templates, we conducted a topographic analysis (TANOVA) for each microstate category across the four groups to determine whether microstates differed significantly under different window-to-wall ratio conditions. It was found that microstates B and C were significantly different, whereas the other two were not.
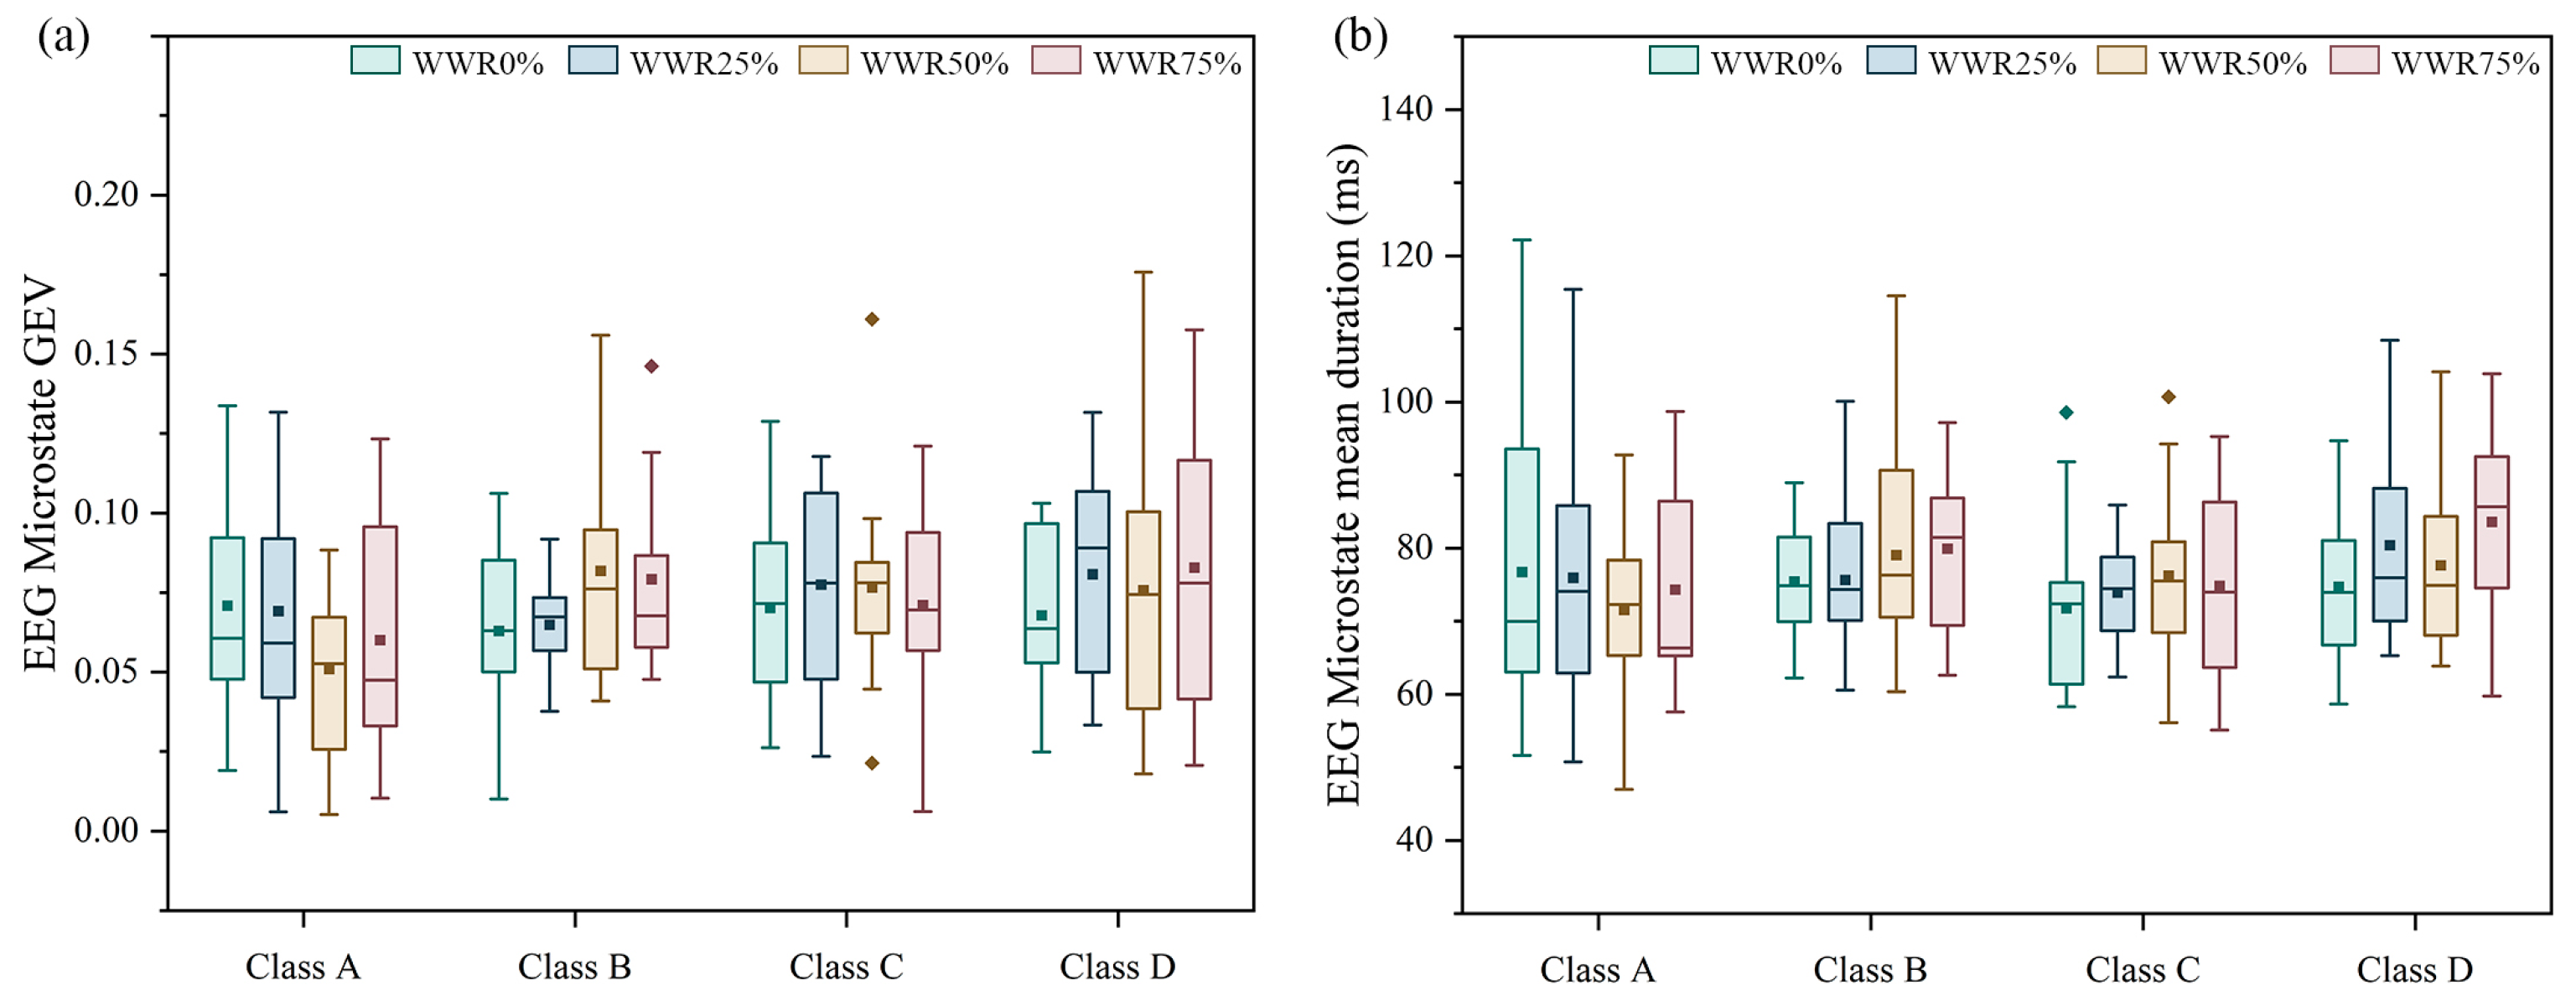
Figure 13 shows the temporal parameters of the four microstates under varying WWR situations. As shown in Figure 13a, the differences in GEV for different WWR conditions are statistically significant. The global explained variance of microstates B and D is large, but that of microstates A and C is comparatively low. The GEV for microstate B in the windowless condition (0.06) was considerably lower than in the three WWR settings in the windowed area, with the GEV for microstate B (0.08) being highest at a WWR of 50%, which was 0.02 greater than at a WWR of 0% (p < 0.05). This trend is similar to microstate D, where GEV (0.07) is lowest in the WWR-of-0% microstate and 0.01 (p < 0.05) lower than with a WWR of 75%. Figure 13b illustrates the mean duration of the four microstate types across varying WWR conditions, aligning more closely with the GEV trend and exhibiting a higher global explained variance for microstates B and D. The mean duration of the four types of microstates under different WWR conditions is more consistent with the GEV trend. The maximum mean duration occurs in WWR 50% microstate B (79.91), which is 4.48 greater than in WWR0%. The maximum mean durations occur in WWR 75% microstates C (76.22) and D (83.60), exceeding WWR 0% by 4.45 and 8.87, respectively. The duration of microstate Class A is diminished in the windowed condition relative to the windowless situation, whereas the durations of microstate Classes B, C, and D are increased. The increase in WWR may result in more-complex external information perceived by the human visual system, thereby elevating the GEV and prolonging the duration of microstate B. This further corroborates the findings that microstate B is associated with the visual system [52].

3.3.2. EEG Microstate Syntax

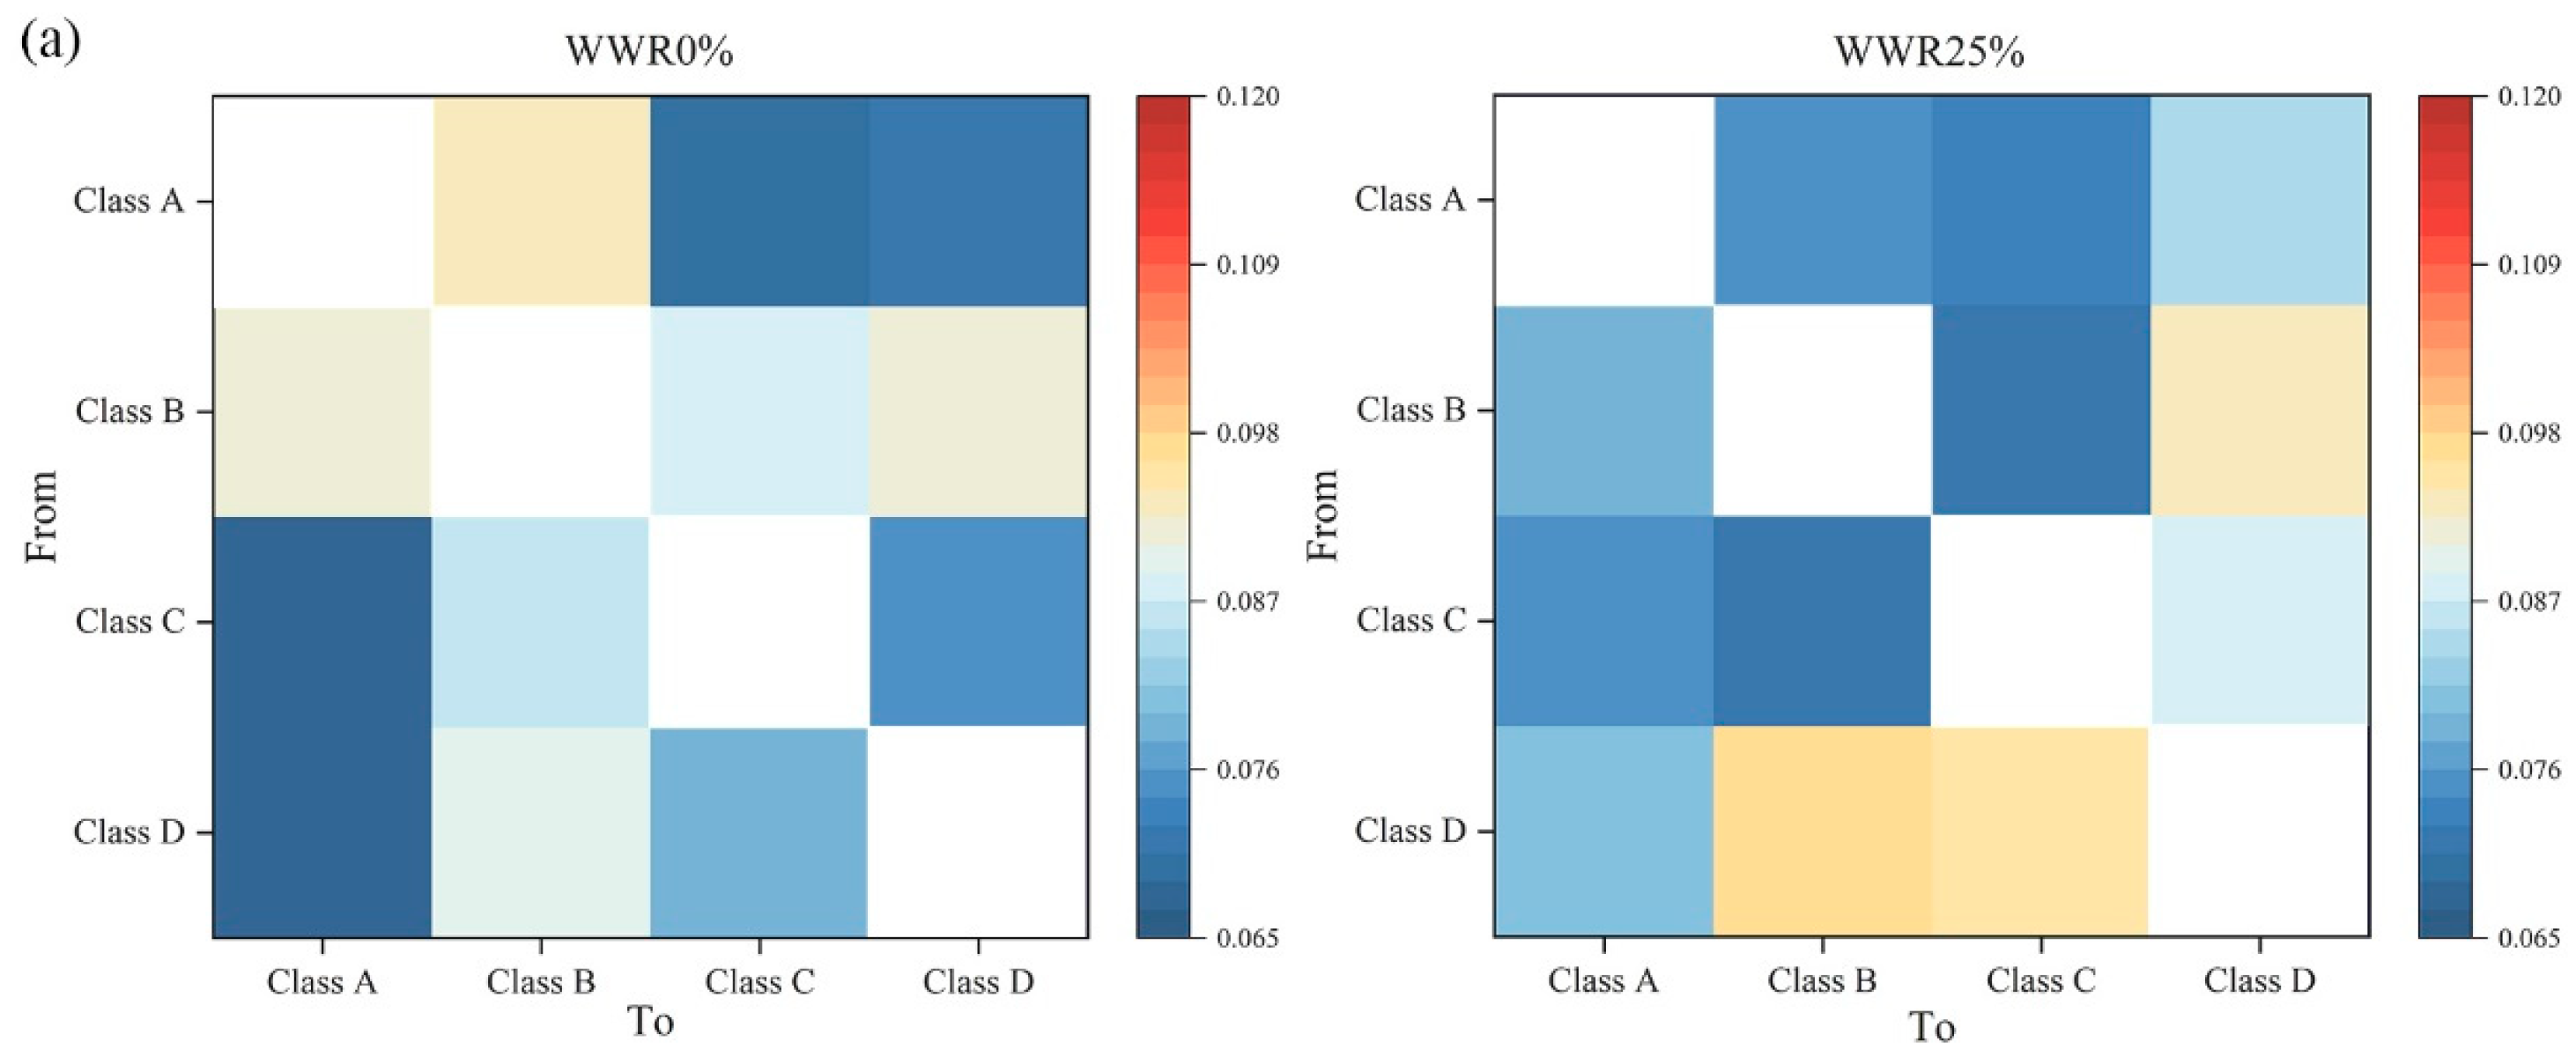
Figure 14a shows the transfer probabilities of the four microstates for different WWR conditions. The transfer probability between A and B is the highest at a WWR of 0% (A to B = 0.093, B to A = 0.092), and both are higher than the other WWR conditions. The transfer probability between A and D is the lowest (A to D = 0.071, D to A = 0.067), and both are lower than other WWR conditions. The transfer probability between B and D was highest at a WWR of 50% (B to D = 0.106, D to B = 0.109), both of which were higher than the other WWR conditions. Figure 14b shows the difference in the transfer probability between the windowed and windowless conditions. The transfer probabilities of A to B, B to A, and B to C in the conditions with windows are greater than those in the windowless condition. Conversely, the transfer probabilities of A to C, C to A, A to D, D to A, D to B, and D to C are less than those in the windowless condition.

3.4. Neural Network Model

A neural network model was developed to predict comfort based on EEG signals. To mitigate the risk of overfitting inherent to a restricted sample capacity (n = 36), the dataset was randomly partitioned into training, validation, and testing subsets. This specific division facilitated an Early Stopping mechanism, halting training once validation errors plateaued. Concurrently, network regularization techniques were implemented to penalize excessive weight magnitudes, collectively enhancing the model’s overall generalization capacity. It was found that the model with one hidden layer always performs better than the model with two hidden layers. Therefore, the number of hidden layers of the BP model was set to one, and the hidden unit was the optimal value within 1–50. The pleasantness score (representing human comfort) was classified into three levels: unpleasant (−1), average (0), and pleasant (1). Table 4 demonstrates the accuracy of the neural network models based on different EEG features. The findings indicate that human comfort can be accurately forecasted using several physiological indicator traits. Notably, the analysis revealed that the accuracy achieved with the complete feature set was not the highest. The feature sets of EEG average power and relative power showed superior classification capability, attaining an accuracy of 78.79%.

4. Discussion

The beneficial impacts of window physical qualities on human health have been examined [4,15,16]. Nonetheless, a definitive conclusion on the ideal WWR remains elusive, and limited research has examined the interplay between subjective perceptions and objective data. This study assesses the impact of WWR on stress resilience using a combination of comprehensive subjective and objective markers, employing VR technology and EEG. This study aims to elucidate the process by which architectural window views influence health benefits and to recommend an appropriate threshold for WWR based on restorative advantages. This research will serve as a significant reference for architectural design, particularly in enhancing the recovery quality of interior environments. It may also be significant for alleviating daily stress among building occupants, promoting public health, and enhancing social health and well-being.
The results of the subjective evaluation showed that the space with windows significantly enhanced the subject’s perceived recovery and alleviation of anxiety. As the window size increases, subjects’ subjective perception evaluation improves, suggesting greater restorative benefits within the tested demographic. Windows serve as the sole conduit for building occupants to observe the external natural world, linking indoor and outdoor environments. The results suggest that human exposure to the natural environment in windowed settings may correlate with the generation of enhanced positive feelings and could be efficacious in alleviating anxiety [41]. This supports the findings of ART [53] and SRT [54] that favorable attitudes are correlated with reduced anxiety levels [44]. EEG data indicated that the average power of the brain was higher and α-wave activity was lower when the human body was in a windowless space. It has been found that α-waves can represent positive emotions [43], which suggests that the brain consumes higher energy and is in a state of tension when the human body is in a windowless space. In addition, EEG microstates are transient representations of the overall functional state of the brain and can reflect changes in overall brain network activation [55]. Due to the relatively obvious connection between the four typical microstates and different brain activities, many studies have set four clusters [51]. By performing microstate analysis on EEG data, we found that the GEV and mean duration of microstates B and D were lowest in the windowless condition relative to the windowed condition. We believe that the reason for this result is due to the simplicity of the visual information received by the human body in the windowless condition. Under the condition of windowless environments, the diminished complexity of visual stimuli may lead to reduced engagement of the visual system, as reflected by the decrease in GEV and duration of microstate Class B, a state fundamentally associated with visual attribute processing [51]. Parallel to these visual alterations, microstate Class D is closely linked to the dorsal attention network (DAN), mediating attentional reorientation and focus shifting [38]. Given that Class D dynamics correlate positively with alertness [56] and decrease during deep sleep [57] or periods of heightened mental fatigue [58], the observed reduction in microstate D in windowless conditions suggests decreased alertness and greater cognitive strain. Relative to these restricted settings, windowed environments appear to better maintain the brain’s attentional resources and restorative capacity. This also confirms our findings that microstate D is reduced in windowless conditions due to poorer recovery and higher mental stress. This study examined the transfer probabilities of the four microstates, revealing an increased frequency of transitions from microstate B to C under the windowless situation, which aligns with potential alterations in the temporal features of microstate B. More frequent switching between microstates B and C has been associated with a reduction in visual information, as well as task-related memory retrieval. In addition, the frequency of transition from microstate D to other microstates (A, B, and C) was elevated in the windowed condition [59,60,61]. It may be attributed to the fact that the human body is more restorative and less mentally fatigued in the windowed condition, resulting in a lower probability of occurrence of microstate D associated with human mental fatigue and alertness [62,63]. This is also consistent with the findings of Li et al. that task demands and mental fatigue will lead to an increase in microstate D.
Transitioning from traditional subjective assessments toward a data-driven paradigm, the obtained neurophysiological evidence establishes a robust basis for occupant-centric window design. Driven by the observation that a 50% WWR yielded peak α-wave activity and optimized microstate transitions, distinct architectural interventions become evident. Despite the contemporary tendency to maximize external views, our data suggests that a WWR of approximately 50% (or a range of 40–60%) establishes a physiological equilibrium point, balancing visual connectivity with a psychological sense of enclosure. Translating this into practical spatial organization, leveraging the 50% WWR configuration within high-stress work zones accelerates physiological and mental recovery, whereas smaller WWRs in cognitively demanding areas might be strategically coupled with high-quality artificial circadian lighting to reproduce the restorative effects. Far from isolated metrics, these physiological thresholds require careful integration with shading systems and high-performance glazing, ensuring that restorative benefits are maintained without exacerbating solar heat gain or compromising thermal comfort.
This work employed VR technology to precisely regulate experimental error, thereby mitigating the influence of light and ambient variables. Nevertheless, the study encountered certain constraints. The study subjects were predominantly aged between 20 and 27 years, thereby limiting the generalizability of the findings to this specific demographic. Considering the potential disparities in the perception of window views across various age demographics, subsequent research should enhance the representativeness and diversity of the sample population. Moreover, variables such as a person’s profession and residential surroundings may considerably influence the study’s outcomes. This study largely examined the effects of visual perception and insufficiently addressed the possible impacts of WWR on other sensory experiences, including indoor acoustics, thermal comfort, airflow, and scents. Future research should encompass multi-sensory integration, merging building ergonomics with energy analysis, to investigate a WWR threshold that improves human sensory experience while maximizing energy efficiency. Although the neural network achieved a prediction accuracy of 78.79%, this performance must be contextualized within the limited sample size (n = 36). As a preliminary ‘proof-of-concept’ exploratory model, it is not currently intended for immediate commercial deployment. Instead, the framework’s primary utility lies in demonstrating the feasibility of utilizing specific neurophysiological features, including EEG average and relative power, to objectively evaluate occupants’ environmental perception. Translating this exploratory baseline into a robust, generalizable tool inherently requires future validation across broader datasets.

5. Conclusions

This paper examines the subjects’ subjective assessments alongside EEG time–frequency domain metrics and EEG microstate analysis results to investigate the impact of various conditions on the stress recoverability of the windowless group (WWR of 0%) compared to windowed conditions (WWRs of 25%, 50%, and 75%). These findings build upon established research regarding the positive physiological and psychological influences of windowed environments, specifically identifying a potential WWR threshold trend for stress recovery in the tested population. By quantifying the latent neurophysiological effects of window geometry rather than relying exclusively on traditional metrics, this study informs evidence-based architectural practice and provides a data-driven paradigm for optimizing indoor environmental quality. The primary conclusions are as follows:
(1)
Subjective evaluations indicated that windowed spaces enhanced occupant ratings, significantly improving perceived PRS recovery and STAI-S anxiety alleviation compared to the windowless environment. Specifically, PRS and STAI scores increased by 3.55 and 8.46 at a WWR of 50%, implying that windowed conditions markedly alleviate psychological stress, whereas windowless environments may adversely impact individuals. Consequently, within this study’s demographic, a WWR of 50% was demonstrated to be particularly conducive to facilitating stress recovery.
(2)
Relative to the WWR-of-0% control, subjects’ EEG average power diminished in the windowed condition. The 0.23 reduction at a WWR of 50% directly suggests higher brain energy consumption in windowless spaces. Furthermore, elevated α-wave activity in a controlled setting resulted in a more relaxed brain state, where the maximum α energy value reached 0.19 dB at a WWR of 50%, a metric that exceeded the control group’s value of 0.12 at a WWR of 0% by 0.07 (p < 0.05).
(3)
WWR alterations differentially modulate regional brain activation: the occipital and parietal lobes, mediating visual information integration, exhibited heightened activity across all working contexts, whereas the frontal and temporal lobes, engaged in higher cognitive functions, showed comparatively strong activity at a WWR of 0%. At a WWR of 50%, subjects exhibited greater FAI, suggesting it may be more conducive to cognitive tasks for the tested age group, alongside elevated ASM, indicating heightened positive motivation and restorative effects.
(4)
Microstate analysis revealed that the GEV for Class B in the windowless condition (0.06) was substantially lower than in windowed environments, peaking at 0.08 under a WWR of 50%, which paired with the lowest Class D GEV of 0.07 at WWR 0%. Furthermore, windowed conditions diminished Class A duration while extending Classes B, C, and D. Concurrently, transition probabilities from state A to B, B to A, and B to C surpassed windowless baselines, while all other specified shifts (from A to C, C to A, A to D, D to A, D to B, and D to C) uniformly decreased.
(5)
The neural network model trained on EEG physiological signs can accurately predict human comfort with an accuracy of 78.79%. This provides a preliminary basis for utilizing EEG features (average and relative power) to predict occupant comfort levels in indoor environments.

Author Contributions

J.L.: Conceptualization, Methodology, Writing—Original Draft, Writing—Review and Editing. C.L.: Investigation, Software, Visualization, Formal Analysis, Writing—Original Draft. H.F.: Resources. G.G.: Software. W.G.: Resources, Supervision. X.J.: Writing—Review and Editing. All authors have read and agreed to the published version of the manuscript.

Funding

This research did not receive any specific grant from funding agencies in the public, commercial, or not-for-profit sectors.

Institutional Review Board Statement

The study was conducted in accordance with the Declaration of Helsinki and approved by the Ethics Committee of Innovation Institute for Sustainable Maritime Architecture Research and Technology Research Ethics Committee (protocol code 10 May 2024, date: 10 May 2024).

Informed Consent Statement

Informed consent was obtained from all participants involved in the study.

Data Availability Statement

The data are available from the corresponding author upon reasonable request.

Acknowledgments

We extend our gratitude to all authors and subjects for their contributions to this work.

Conflicts of Interest

The authors declare that there are no conflicts of interest.

References

  1. McEwen, B.S. Physiology and neurobiology of stress and adaptation: Central role of the brain. Physiol. Rev. 2007, 87, 873–904. [Google Scholar] [CrossRef]
  2. Du, Y.; Li, N.; Zhou, L.; A, Y.; Jiang, Y.; He, Y. Impact of natural window views on perceptions of indoor environmental quality: An overground experimental study. Sustain. Cities Soc. 2022, 86, 104133. [Google Scholar] [CrossRef]
  3. Kim, J.; Cha, S.H.; Koo, C.; Tang, S.K. The effects of indoor plants and artificial windows in an underground environment. Build. Environ. 2018, 138, 53–62. [Google Scholar] [CrossRef]
  4. Stone, N.J.; Irvine, J.M. Direct or Indirect Window Access, Task Type, and Performance. J. Environ. Psychol. 1994, 14, 57–63. [Google Scholar] [CrossRef]
  5. Chang, C.Y.; Chen, P.K. Human response to window views and indoor plants in the workplace. HortScience 2005, 40, 1354–1359. [Google Scholar] [CrossRef]
  6. Korpela, K.; De Bloom, J.; Sianoja, M.; Pasanen, T.; Kinnunen, U. Nature at home and at work: Naturally good? Links between window views, indoor plants, outdoor activities and employee well-being over one year. Landsc. Urban Plan. 2017, 160, 38–47. [Google Scholar] [CrossRef]
  7. Kahn, P.H., Jr.; Friedman, B.; Gill, B.; Hagman, J.; Severson, R.L.; Freier, N.G.; Feldman, E.N.; Carrère, S.; Stolyar, A. A plasma display window?—The shifting baseline problem in a technologically mediated natural world. J. Environ. Psychol. 2008, 28, 192–199. [Google Scholar] [CrossRef]
  8. Cho, Y.; Karmann, C.; Andersen, M. Perception of window views in VR: Impact of display and type of motion on subjective and physiological responses. Build. Environ. 2025, 274, 112757. [Google Scholar] [CrossRef]
  9. Li, D.; Sullivan, W.C. Impact of views to school landscapes on recovery from stress and mental fatigue. Landsc. Urban Plan. 2016, 148, 149–158. [Google Scholar] [CrossRef]
  10. Dravigne, A.; Waliczek, T.M.; Lineberger, R.D.; Zajicek, J.M. The effect of live plants and window views of green spaces on employee perceptions of job satisfaction. HortScience 2008, 43, 183–187. [Google Scholar] [CrossRef]
  11. Olszewska-Guizzo, A.; Escoffier, N.; Chan, J.; Puay Yok, T. Window View and the Brain: Effects of Floor Level and Green Cover on the Alpha and Beta Rhythms in a Passive Exposure EEG Experiment. Int. J. Environ. Res. Public Health 2018, 15, 2358. [Google Scholar] [CrossRef]
  12. Jafarifiroozabadi, R.; Joseph, A.; Bridges, W.; Franks, A. The impact of daylight and window views on length of stay among patients with heart disease: A retrospective study in a cardiac intensive care unit. J. Intensive Med. 2023, 3, 155–164. [Google Scholar] [CrossRef]
  13. Keighley, E.C. Visual requirements and reduced fenestration in office buildings—A study of window shape. Build. Sci. 1973, 8, 311–320. [Google Scholar] [CrossRef]
  14. Ne’eman, E.; Hopkinson, R.G. Critical minimum acceptable window size: A study of window design and provision of a view. Light. Res. Technol. 1970, 2, 17–27. [Google Scholar] [CrossRef]
  15. Dogrusoy, I.T.; Tureyen, M. A field study on determination of preferences for windows in office environments. Build. Environ. 2007, 42, 3660–3668. [Google Scholar] [CrossRef]
  16. Ludlow, A.M. The functions of windows in buildings. Light. Res. Technol. 1976, 8, 57–68. [Google Scholar] [CrossRef]
  17. Abd-Alhamid, F.; Kent, M.; Wu, Y. Assessment of Window Size and Layout Impact on a View Quality Perception in a Virtual Reality Environment. Leukos 2024, 20, 239–260. [Google Scholar] [CrossRef]
  18. Zhang, Y.; Jing, X.; Liu, C.; Sun, Y.; Wang, W.; Gao, W. Restorative benefits of classroom windows: A study on the effect of window:wall ratio on task load and learning performance based on VR technology. Int. J. Low-Carbon Technol. 2024, 19, 1491–1500. [Google Scholar] [CrossRef]
  19. Poulton, E.C. Quantitative subjective assessments are almost always biased, sometimes completely misleading. Br. J. Psychol. 1977, 68, 409–425. [Google Scholar] [CrossRef]
  20. Zhang, Z.; Li, Z.; Xu, J. Study on window size and indoor color of typical residential units based on EEG measurement and semantic differential method coupling analysis. Energy Build. 2025, 342, 115855. [Google Scholar] [CrossRef]
  21. Cruz-Garza, J.G.; Darfler, M.; Rounds, J.D.; Gao, E.; Kalantari, S. EEG-based investigation of the impact of room size and window placement on cognitive performance. J. Build. Eng. 2022, 53, 104540. [Google Scholar] [CrossRef]
  22. Li, W.; Peng, P.; Wang, T.; Gong, G. Effects of indoor environment on EEG and thermal comfort under the ceiling-fan-integrated air conditioning system. Build. Environ. 2024, 257, 111547. [Google Scholar] [CrossRef]
  23. Quaedflieg, C.W.E.M.; Meyer, T.; Smulders, F.T.Y.; Smeets, T. The functional role of individual-alpha based frontal asymmetry in stress responding. Biol. Psychol. 2015, 104, 75–81. [Google Scholar] [CrossRef] [PubMed]
  24. Hartig, T.; Korpela, K.; Evans, G.; Gärling, T. A Measure of restorative quality in environments. Hous. Theory Soc. 1997, 14, 175–194. [Google Scholar] [CrossRef]
  25. Spielberger, C.D. State-Trait Anxiety Inventory. In the Corsini Encyclopedia of Psychology; Wiley Online Library: Hoboken, NJ, USA, 2010; p. 1. [Google Scholar]
  26. Payne, S.R. The production of a Perceived Restorativeness Soundscape Scale. Appl. Acoust. 2013, 74, 255–263. [Google Scholar] [CrossRef]
  27. Hagerhall, C.M.; Laike, T.; Taylor, R.P.; Küller, M.; Küller, R.; Martin, T.P. Investigations of human EEG response to viewing fractal patterns. Perception 2008, 37, 1488–1494. [Google Scholar] [CrossRef]
  28. Zhang, F.; Haddad, S.; Nakisa, B.; Rastgoo, M.N.; Candido, C.; Tjondronegoro, D.; de Dear, R. The effects of higher temperature setpoints during summer on office workers’ cognitive load and thermal comfort. Build. Environ. 2017, 123, 176–188. [Google Scholar] [CrossRef]
  29. Zhang, X.; Li, J.; Liu, Y.; Zhang, Z.; Wang, Z.; Luo, D.; Zhou, X.; Zhu, M.; Salman, W.; Hu, G.; et al. Design of a Fatigue Detection System for High-Speed Trains Based on Driver Vigilance Using a Wireless Wearable EEG. Sensors 2017, 17, 486. [Google Scholar] [CrossRef]
  30. Klimesch, W. EEG alpha and theta oscillations reflect cognitive and memory performance: A review and analysis. Brain Res. Rev. 1999, 29, 169–195. [Google Scholar] [CrossRef] [PubMed]
  31. Wen, T.Y.; Aris, S.A.M. Electroencephalogram (EEG) stress analysis on alpha/beta ratio and theta/beta ratio. Indones. J. Electr. Eng. Comput. Sci. 2020, 17, 175–182. [Google Scholar]
  32. Kim, H.; Hong, T.; Kim, J.; Yeom, S. A psychophysiological effect of indoor thermal condition on college students’ learning performance through EEG measurement. Build. Environ. 2020, 184, 107223. [Google Scholar] [CrossRef]
  33. Davidson, R.J. EEG measures of cerebral asymmetry: Conceptual and methodological issues. Int. J. Neurosci. 1988, 39, 71–89. [Google Scholar] [CrossRef] [PubMed]
  34. Harmon-Jones, E.; Allen, J.J.B. Anger and frontal brain activity: EEG asymmetry consistent with approach motivation despite negative affective valence. J. Pers. Soc. Psychol. 1998, 74, 1310–1316. [Google Scholar] [CrossRef]
  35. Zheng, W.L.; Zhu, J.Y.; Lu, B.L. Identifying Stable Patterns over Time for Emotion Recognition from EEG. IEEE Trans. Affect. Comput. 2016, 10, 417–429. [Google Scholar] [CrossRef]
  36. Smith, E.E.; Reznik, S.J.; Stewart, J.L.; Allen, J.J.B. Assessing and conceptualizing frontal EEG asymmetry: An updated primer on recording, processing, analyzing, and interpreting frontal alpha asymmetry. Int. J. Psychophysiol. 2017, 111, 98–114. [Google Scholar] [CrossRef] [PubMed]
  37. Koenig, T.; Brandeis, D. Inappropriate assumptions about EEG state changes and their impact on the quantification of EEG state dynamics. NeuroImage 2016, 125, 1104–1106. [Google Scholar] [CrossRef]
  38. Britz, J.; Van De Ville, D.; Michel, C.M. BOLD correlates of EEG topography reveal rapid resting-state network dynamics. NeuroImage 2010, 52, 1162–1170. [Google Scholar] [CrossRef]
  39. Pipinis, E.; Melynyte, S.; Koenig, T.; Jarutyte, L.; Linkenkaer-Hansen, K.; Ruksenas, O.; Griskova-Bulanova, I. Association Between Resting-State Microstates and Ratings on the Amsterdam Resting-State Questionnaire. Brain Topogr. 2017, 30, 245–248. [Google Scholar] [CrossRef]
  40. Li, W.; Cheng, S.; Wang, H.; Chang, Y. EEG microstate changes according to mental fatigue induced by aircraft piloting simulation: An exploratory study. Behav. Brain Res. 2023, 438, 114203. [Google Scholar] [CrossRef]
  41. Zhang, Z.; Ye, B.; Yang, W.; Gao, Y. Effect of Nature Space on Enhancing Humans’ Health and Well-Being: An Integrative Narrative Review. Forests 2024, 15, 100. [Google Scholar] [CrossRef]
  42. Lu, M.; Hu, S.; Hu, Y.; Zheng, Y.; Liu, X.; Zhao, X.; Guan, H. Critical dynamic characteristics of brain activity in thermal comfort state. Build. Environ. 2023, 243, 110632. [Google Scholar] [CrossRef]
  43. Huang, S.C.; Chiang, N.; Kuo, N.F.; Chen, Y.J. An exploratory approach for using EEG to examine person-environment interaction. Landsc. Res. 2018, 44, 1–14. [Google Scholar] [CrossRef]
  44. Roe, J. Engaging the Brain: The Impact of Natural versus Urban Scenes Using Novel EEG Methods in an Experimental Setting. J. Environ. Sci. 2013, 1, 93–104. [Google Scholar] [CrossRef]
  45. Mostafavi, A.; Cruz-Garza, J.G.; Kalantari, S. Enhancing lighting design through the investigation of illuminance and correlated color Temperature’s effects on brain activity: An EEG-VR approach. J. Build. Eng. 2023, 75, 106776. [Google Scholar] [CrossRef]
  46. Karami, A.; Khodarahimi, S.; Mazaheri, M. Cognitive and perceptual functions in patients with occipital lobe epilepsy, patients with migraine, and healthy controls. Epilepsy Behav. 2019, 97, 265–268. [Google Scholar] [CrossRef]
  47. Braddick, O. Occipital Lobe (Visual Cortex): Functional Aspects. In International Encyclopedia of the Social & Behavioral Sciences, 2nd ed.; Wright, J.D., Ed.; Elsevier: Oxford, UK, 2015; pp. 127–132. [Google Scholar]
  48. Shin, Y.B.; Woo, S.H.; Kim, D.H.; Kim, J.; Kim, J.J.; Park, J.Y. The effect on emotions and brain activity by the direct/indirect lighting in the residential environment. Neurosci. Lett. 2015, 584, 28–32. [Google Scholar] [CrossRef]
  49. Allen, J.J.; Reznik, S.J. Frontal EEG Asymmetry as a Promising Marker of Depression Vulnerability: Summary and Methodological Considerations. Curr. Opin. Psychol. 2015, 4, 93–97. [Google Scholar] [CrossRef]
  50. Marshall, A.C.; Cooper, N.R.; Segrave, R.; Geeraert, N. The effects of long-term stress exposure on aging cognition: A behavioral and EEG investigation. Neurobiol. Aging 2015, 36, 2136–2144. [Google Scholar] [CrossRef]
  51. Michel, C.M.; Koenig, T. EEG microstates as a tool for studying the temporal dynamics of whole-brain neuronal networks: A review. NeuroImage 2018, 180, 577–593. [Google Scholar] [CrossRef] [PubMed]
  52. Seitzman, B.A.; Abell, M.; Bartley, S.C.; Erickson, M.A.; Bolbecker, A.R.; Hetrick, W.P. Cognitive manipulation of brain electric microstates. NeuroImage 2017, 146, 533–543. [Google Scholar] [CrossRef]
  53. Kaplan, R. Some Psychological Benefits of Gardening. Environ. Behav. 1973, 5, 145–162. [Google Scholar] [CrossRef]
  54. Ulrich, R.S.; Simons, R.F.; Losito, B.D.; Fiorito, E.; Miles, M.A.; Zelson, M. Stress recovery during exposure to natural and urban environments. J. Environ. Psychol. 1991, 11, 201–230. [Google Scholar] [CrossRef]
  55. Khanna, A.; Pascual-Leone, A.; Michel, C.M.; Farzan, F. Microstates in resting-state EEG: Current status and future directions. Neurosci. Biobehav. Rev. 2015, 49, 105–113. [Google Scholar] [CrossRef]
  56. Brodbeck, V.; Kuhn, A.; von Wegner, F.; Morzelewski, A.; Tagliazucchi, E.; Borisov, S.; Michel, C.M.; Laufs, H. EEG microstates of wakefulness and NREM sleep. NeuroImage 2012, 62, 2129–2139. [Google Scholar] [CrossRef]
  57. Krylova, M.; Alizadeh, S.; Izyurov, I.; Teckentrup, V.; Chang, C.; van der Meer, J.; Erb, M.; Kroemer, N.; Koenig, T.; Walter, M.; et al. Evidence for modulation of EEG microstate sequence by vigilance level. NeuroImage 2021, 224, 117393. [Google Scholar] [CrossRef]
  58. Wingelaar-Jagt, Y.Q.; Wingelaar, T.T.; Riedel, W.J.; Ramaekers, J.G. Fatigue in Aviation: Safety Risks, Preventive Strategies and Pharmacological Interventions. Front. Physiol. 2021, 12, 712628. [Google Scholar] [CrossRef]
  59. van der Hulst, M.; Meijman, T.; Rothengatter, T. Maintaining task set under fatigue: A study of time-on-task effects in simulated driving. Transp. Res. Part F Traffic Psychol. Behav. 2001, 4, 103–118. [Google Scholar] [CrossRef]
  60. Kim, K.; Duc, N.T.; Choi, M.; Lee, B. EEG microstate features according to performance on a mental arithmetic task. Sci. Rep. 2021, 11, 343. [Google Scholar] [CrossRef] [PubMed]
  61. Xu, S.; Yuan, F.; Liu, F.; Meng, X. Exploring Ventilation-assisted Desktop Living Walls to Regulate Office Microenvironments and Enhance Occupant Comfort. J. Build. Eng. 2026, 119, 115277. [Google Scholar] [CrossRef]
  62. Li, J.; Zou, J.; Wang, C.; Ge, L.; Meng, X. Employing local filling forms of copper foam to improve heat transfer performance of phase change material by an experimental study. Int. Commun. Heat Mass Transfer 2026, 172, 110738. [Google Scholar] [CrossRef]
  63. Zou, J.; Ge, W.; Li, J.; Fukuda, H.; Meng, X. Improvement of copper foam fin thickness on thermal performance of spherical encapsulated phase-change material. Therm. Sci. Eng. Prog. 2025, 68, 104394. [Google Scholar] [CrossRef]
Figure 1. Photographs of the (a) experimental site and (b) laboratory floor plan.
Buildings 16 01092 g001
Figure 2. (a) WWR0%, (b) WWR 25%, (c) WWR 50%, (d) WWR 75%.
Buildings 16 01092 g002
Figure 3. Experimental process.
Buildings 16 01092 g003
Figure 4. Brain partitioning and electrode distribution.
Buildings 16 01092 g004
Figure 5. EEG microstate analysis diagram.
Buildings 16 01092 g005
Figure 6. Subjective evaluation results of (a) PRS and (b) STAI-S under different WWRs (**, p < 0.01).
Buildings 16 01092 g006
Figure 7. Average EEG Power results under different WWRs.
Buildings 16 01092 g007
Figure 8. (a) EEG α-waves power spectral density curve and (b) α index under different WWRs (*, p < 0.05; **, p < 0.01).
Buildings 16 01092 g008
Figure 9. (a) EEG relaxation and (b) mental stress under different WWRs (*, p < 0.05; **, p < 0.01).
Buildings 16 01092 g009
Figure 10. Relative power of each brain region under different WWR.
Buildings 16 01092 g010
Figure 11. (a) EEG ASM and (b) FAI under different WWRs (*, p < 0.05).
Buildings 16 01092 g011
Figure 12. EEG microstate brain topographic map under different WWRs.
Buildings 16 01092 g012
Figure 13. (a) EEG microstate GEV and (b) mean duration under different WWRs.
Buildings 16 01092 g013
Figure 14. (a) EEG microstate transfer probability and (b) transfer diagram under different WWRs.
Buildings 16 01092 g014aBuildings 16 01092 g014b
Table 1. Experimental equipment.
ApplicationEquipmentBasic Parameters
FrequencyBandwidth
Scene controlBuildings 16 01092 i001
HTC Vive VR (manufacturer: HTC Corporation, New Taipei City, Taiwan)
90 Hz4896 × 2448
32-channel EEG monitoringBuildings 16 01092 i002
Emotiv EPOC Flex (manufacturer: Emotiv, San Francisco, CA, USA)
128 Hz0.16–13 Hz
Table 2. Basic information of subjects (n = 36).
MaleFemaleTotal
N181836
Age22.18 ± 1.5923.02 ± 2.0822.60 ± 1.79
BMI22.88 ± 2.0620.43 ± 1.3021.66 ± 1.99
Table 3. Subjective questionnaire.
PRSScore
Totally disagree (−3), Disagree (−2), Slightly disagree (−1), Neutral (0), Slightly agree (1), Agree (2), Totally agree (3),
Being-Away1. This kind of environment allows me to temporarily escape the pressure of daily study life.
2. This kind of environment helps me relax.
Fascination3. This kind of environment is charming.
Consistency4. There are too many things distracting me here
Compatibility5. I can do what I want here.
6. I can feel happiness here.
STAI-SScore
1234
1. I feel calm.Not at allA littleIntermediateVery obvious
2. I’m nervous.Not at allA littleIntermediateVery obvious
3. I feel uneasy.Not at allA littleIntermediateVery obvious
4. I’m relaxed.Not at allA littleIntermediateVery obvious
5. I feel satisfied.Not at allA littleIntermediateVery obvious
6. I feel comfortable.Not at allA littleIntermediateVery obvious
Table 4. The accuracy of the neural network model.
IndexAccuracyPrecisionF1-Score
EEG average power63.89%40.82%0.498
EEG relative power75.76%70.37%0.724
EEG power differences among brain regions73.33%53.78%0.621
EEG average power & relative power78.79%72.65%0.752
EEG average power & power differences among brain regions73.33%53.78%0.621
EEG relative power & power differences among brain regions61.54%79.17%0.685
EEG all indicators76.92%83.85%0.802
Disclaimer/Publisher’s Note: The statements, opinions and data contained in all publications are solely those of the individual author(s) and contributor(s) and not of MDPI and/or the editor(s). MDPI and/or the editor(s) disclaim responsibility for any injury to people or property resulting from any ideas, methods, instructions or products referred to in the content.