


Abstract
To investigate how lateral impact influences the residual axial resistance capacity of cross-shaped steel-reinforced concrete (CSRC) columns, the residual axial resistance test was carried out following impact test. A finite element model (FEM) was developed to simulate axial and lateral impact loading, and its accuracy was confirmed through comparison with test results. The analysis shows that the numerical model can simulate the impact force, deflection, deformation mode and residual axial resistance of the column with adequate accuracy. With the verified finite element models, the residual axial resistance (Nr) of CSRC columns under six different parameters was further analyzed. Results demonstrate that the column primarily undergoes flexural deformation under impact, whereas shear effects are localized at the impact zone. A higher structural steel ratio (α) and yield strength of the cross-shaped steel (q) contribute to improved Nr and reduced mid-span displacement (Δmax). With the increase in compressive strength of concrete (c) and axial compression ratio (n), the Nr increases to a certain level and then decreases, and the Δmax decreases first and then increases in a similar manner. The change in slenderness ratio (γ) in a small range can improve the Nr of the column, and the significant increase in γ results in instability and failure. In particular, when the slenderness ratio increases from 8 to 12, the residual bearing capacity of the column decreases by 19.4%. This study proposes a residual bearing capacity-prediction formula based on seven key influencing parameters, which shows high accuracy (R2 = 0.93). A damage evaluation index based on flexural bearing capacity (Ddag) is introduced, and the structural state is accordingly classified into four damage levels. Compared with conventional numerical simulations that typically require more than 3 h of computation time, the proposed method can rapidly complete the damage assessment of columns within 5 min, providing an efficient approach for structural safety evaluation and response strategies.
1. Introduction
SRC columns have superior seismic performance, durability and load–axial resistance in engineering structures. Meanwhile, accidental impacts occurring during structural service have increasingly become a focus of attention among engineers, with many documented cases of structural damage and failure induced by impact loading. For example, it could be collapse of bridge structures due to the impact of vehicles and ships [1,2,3], partial collapse of structures as a result of the impact of derailed trains on station structures [4,5,6], and the destruction of buildings owing to the impact of aircraft [7,8]. Therefore, the investigation of structural impact behavior, including residual load-carrying capacity, has gained considerable attention recently.
The impact performance of structural columns has been widely investigated in previous studies. For instance, Sha et al. [9] performed experimental and numerical investigations on barge collisions with reinforced concrete (RC) columns and developed empirical expressions to estimate peak impact force and impulse. Fan et al. [10] investigated the post-impact axial behavior of circular RC columns subjected to low-velocity impacts. An assessment method grounded in the post-impact condition was presented, and empirical expressions for residual strength incorporating reinforcement ratio and axial load ratio were derived. Han et al. [11] explored the impact behavior of concrete members reinforced with high-strength steel tubes using drop-hammer tests and developed a simplified model for flexural capacity estimation. Yousuf et al. [12,13] evaluated the lateral impact behavior of concrete columns reinforced with low-carbon versus stainless-steel tubes, revealing superior energy dissipation in the stainless-steel specimens. Yang et al. [14] studied square steel tube-recycled concrete columns using experimental and numerical methods, and demonstrated that square steel tube-recycled concrete columns exhibit impact resistance on par with steel tube-reinforced concrete counterparts. Zhu et al. [15,16,17,18,19] explored the impact behavior of multiple column types, including RC, SRC, CFST, SRCFST, CFDST, and CFDT members. The results demonstrated that RC columns performed the poorest under impact loading, while steel tube composite columns showed superior overall resistance. Among them, CFDT columns displayed the best impact capacity, followed by CFDST and SRCFST columns. SRC columns also showed satisfactory resistance, yet the concrete cover was prone to shear failure under higher impact energy, which weakened their axial load-bearing performance. Xian et al. [20,21] found that circular and square steel tube-reinforced concrete members with internal steel bars could absorb a large amount of impact energy. However, the plateau stages of force and displacement are greatly influenced by axial load and boundary conditions, resulting in significant modifications to lateral bending stiffness. Wang et al. [22,23,24] performed impact tests on various composite CFST members and examined the effects of multiple parameters on their impact performance. These studies indicate that substantial research has been devoted to the impact resistance of main structural columns, and it is of great significance to choose the appropriate cross-sectional shape of the columns for structures that are prone to impact. However, there is still a need to consider the damage evaluation of structural columns after impact and whether they can continue to remain in service.
The evaluation of residual capacity of damaged columns is a significant issue that needs to be considered by the engineering community. This is crucial for preventing progressive collapse of engineering structures after impact.
Regarding traditional reinforced concrete (RC) and tubular structures, Fu et al. [25] developed an assessment model for RC piers subjected to vehicle collisions through vehicle–bridge impact simulations, while Zhao et al. [26] focused on the residual load-bearing capacity of hollow RC piers after impact and proposed a simplified calculation formula. For concrete-filled steel tubular (CFST) columns, research focus has shifted from dynamic response to the quantification of residual strength [27,28]. Gao et al. [29] and Cui et al. [30] utilized numerical simulations and experimental methods, respectively, to investigate the dynamic behavior of square and high-strength circular CFSTs under repeated or varied impact scenarios. Li et al. [31] conducted finite element analysis (FEA) on the impact resistance of full-scale square CFST columns under truck strikes. To evaluate the post-accident safety of structural members, Zhang et al. [32] tested the residual axial compressive resistance of square CFSTs. Yang et al. [33] found that increasing the confinement pressure can effectively inhibit the initiation and propagation of micro-cracks within the ultra-high-performance concrete (UHPC) core, thereby significantly enhancing the post-impact residual capacity of high-strength square CFST columns.
In the field of steel–concrete composite structures, researchers have explored more complex encased steel configurations. Venkateshwaran et al. [34] investigated the mechanical performance of steel fiber-reinforced concrete-encased steel (CES) composite columns through flexural tests. Wang et al. [35] performed both experimental and numerical studies on impact behavior of H-shaped steel columns and proposed an empirical formula to estimate the residual axial resistance of H-shaped steel columns, providing a basis for rapid post-impact damage assessment. Xiang et al. [36] conducted impact tests and numerical simulations on steel-reinforced concrete columns (SRC columns) with built-in T-shaped steel bars, and the results showed that increasing the ratio of stirrup and axial compression ratio can effectively improve the flexural response and shear resistance of SRC columns. Zeng et al. [37] carried out tests on SRC columns containing L-shaped steel bars and found their impact resistance and residual axial performance. Lai et al. [38] systematically studied the effects of material strength, stirrup ratio, and steel section geometry on the strength and ductility of high-strength CES columns. Their findings emphasized that, at an equivalent steel ratio, specimens with cross-shaped steel sections exhibit superior residual strength and ductility compared to those with H-shaped sections. Furthermore, Lai et al. [39] developed a theoretical model to predict the load-carrying capacity of such high-strength composite structures, providing a vital foundation for the performance evaluation of the cross-shaped steel-reinforced concrete (CSRC) columns investigated in this study. Current research lacks a well-defined criterion for assessing the residual axial capacity of SRC columns. Further research is needed to identify impact damage to components and determine whether the structural components can continue supporting the structure.
Although previous studies have focused on the impact resistance of columns, further investigation is still required on the impact damage mechanisms and residual bearing capacity degradation of CSRC columns, particularly with respect to establishing quantitative relationships between key parameters and residual bearing capacity. Therefore, based on previous lateral impact tests [19], the residual axial resistance test, numerical simulation analysis and damage assessment were carried out in this paper. Axial compression tests were carried out on 11 specimens after lateral impact to investigate the residual bearing capacity of cross-shaped steel-reinforced concrete columns subjected to lateral impact. A finite element model for predicting the Nr of CSRC columns under impact loading was established and validated against the experimental results. Subsequently, the parametric study was conducted to examine the effects of key factors, including impact energy, axial load, and impact location, on impact resistance. Existing evaluation approaches largely rely on time-consuming numerical simulations, which limit their applicability for rapid post-impact decision-making in engineering practice. In this study, a residual bearing capacity prediction model based on key parameters is proposed, and a damage evaluation index is introduced to enable rapid and reliable assessment of post-impact structural conditions.
2. Experiment
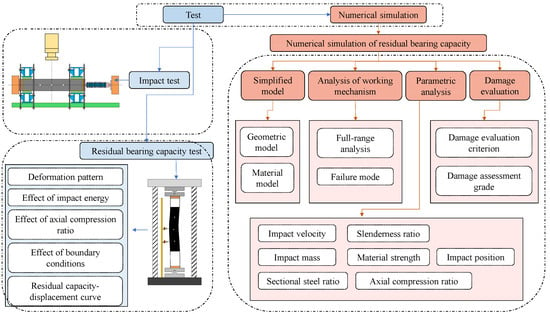
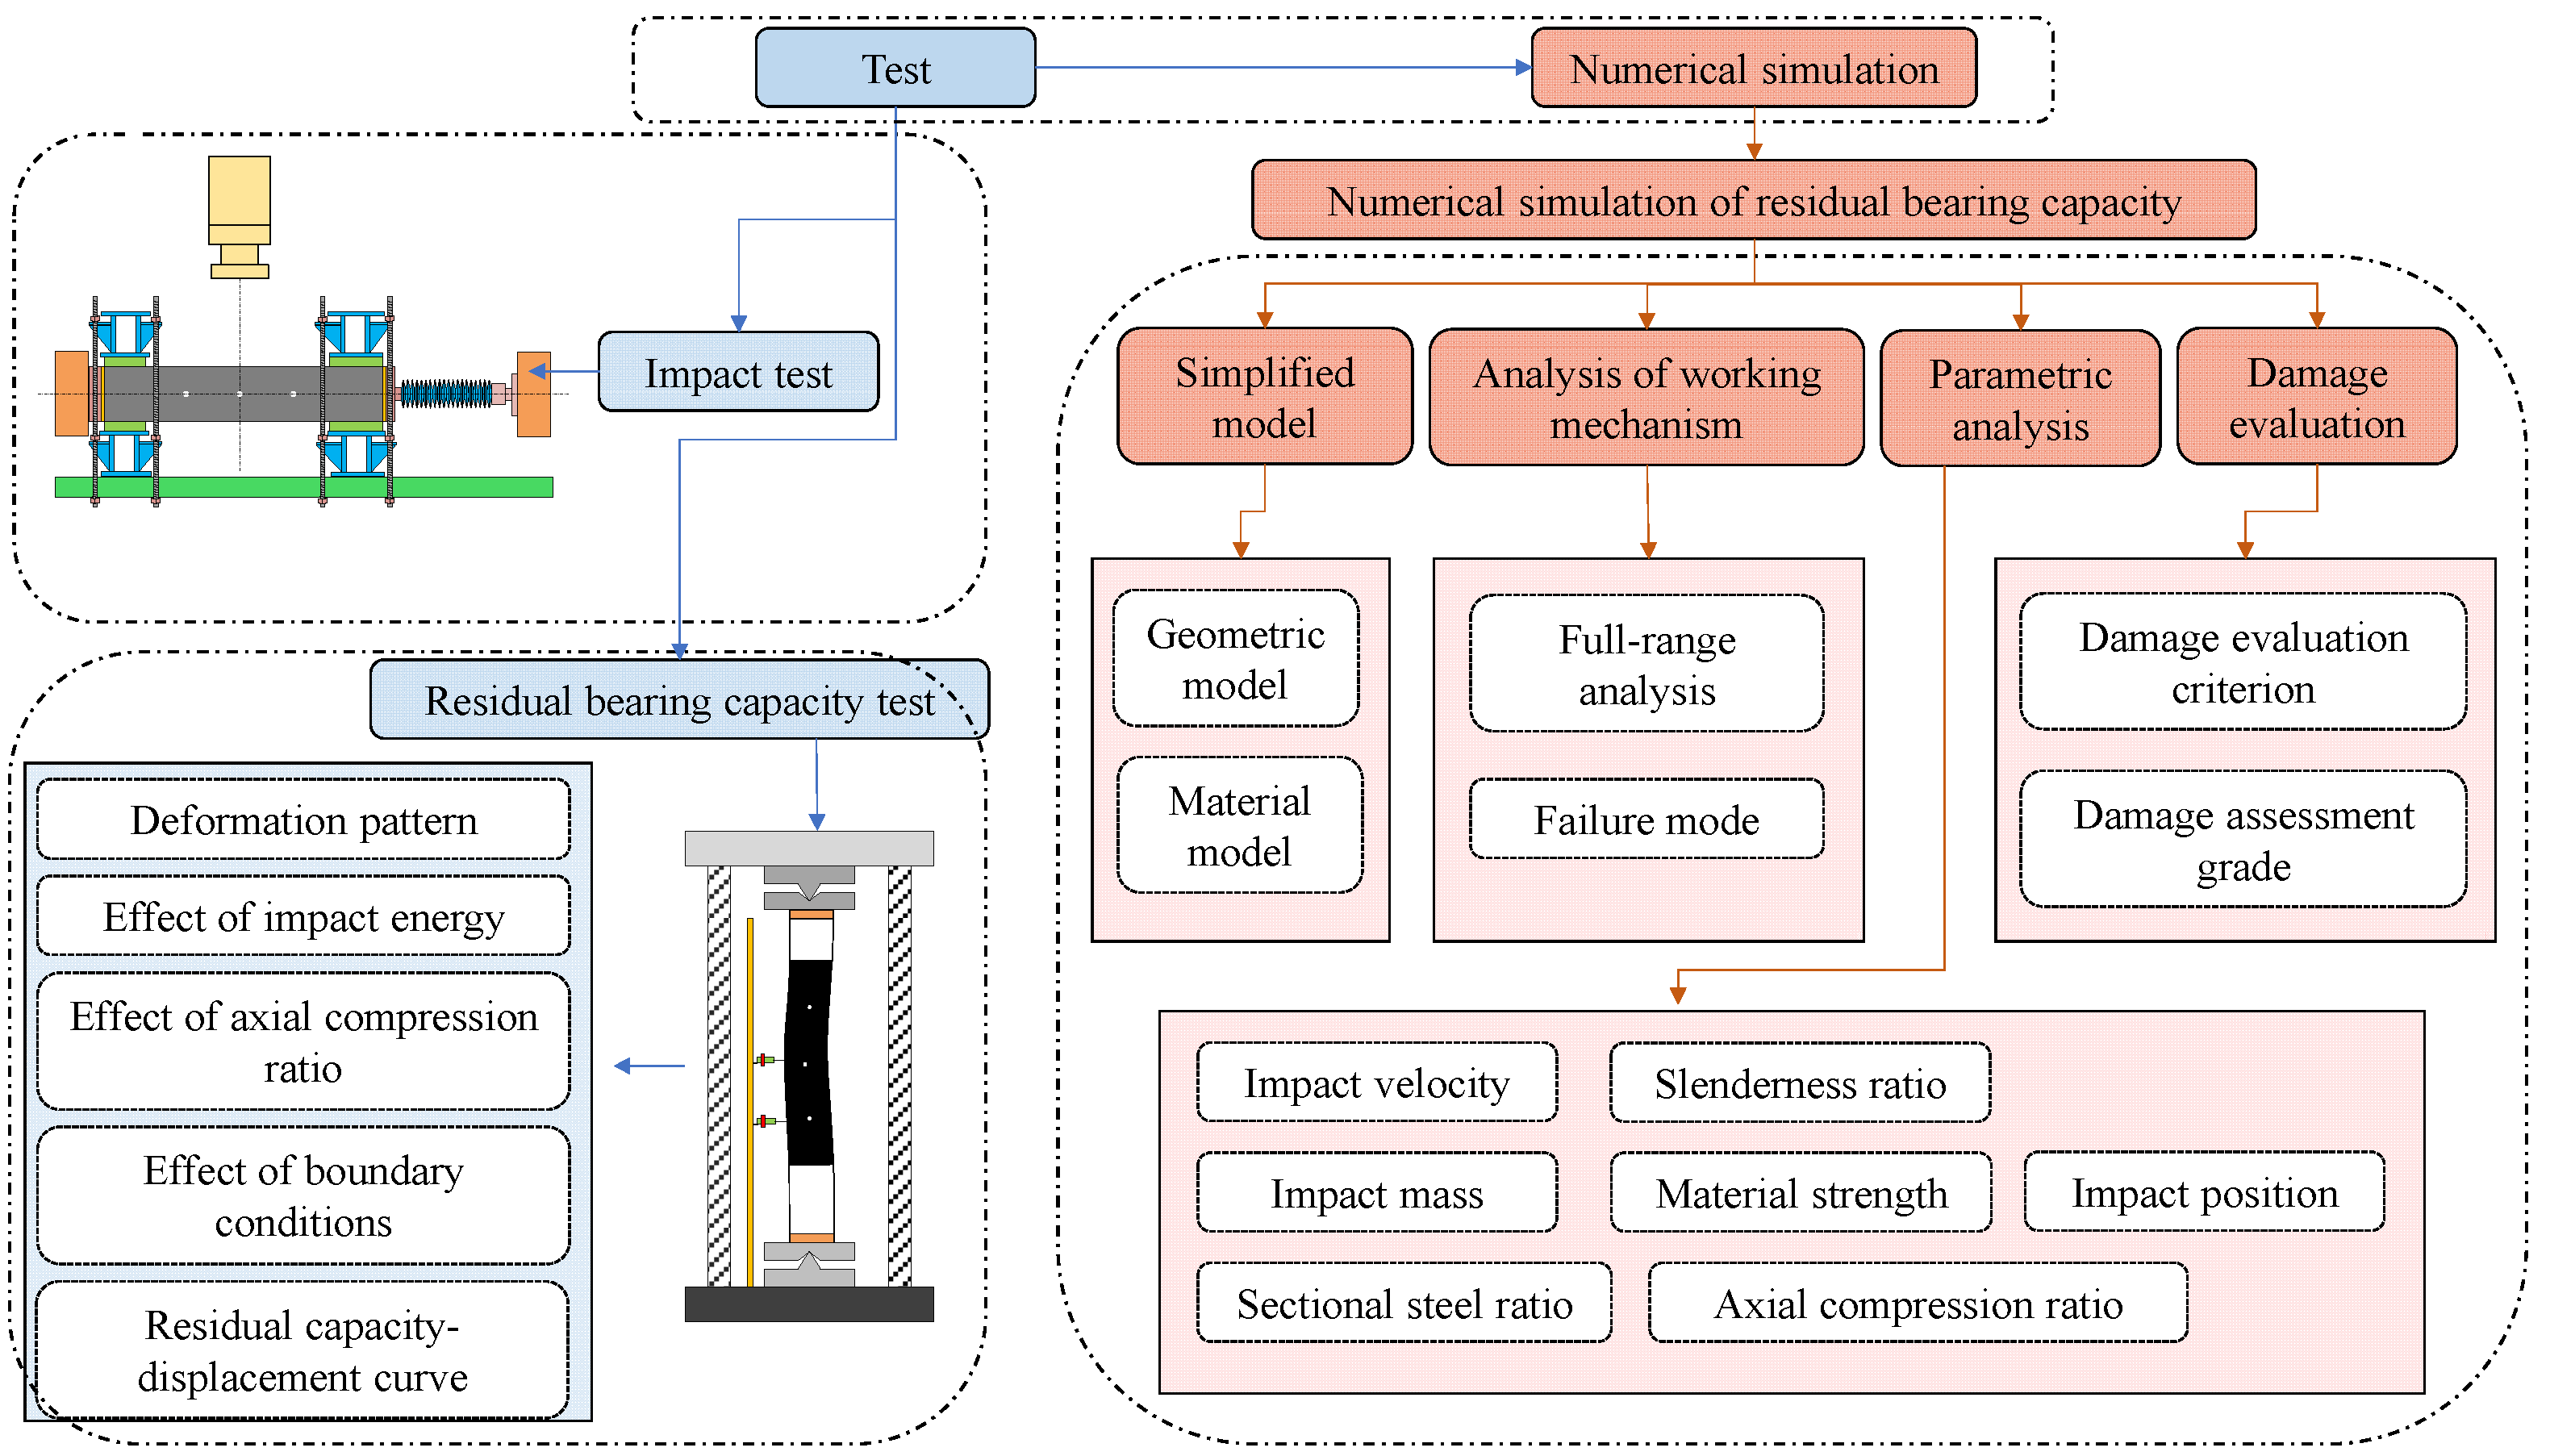
To systematically evaluate the structural performance of CSRC columns, a comprehensive experimental research program was implemented as illustrated in Figure 1. Building upon the initial lateral impact tests, a series of subsequent residual axial capacity tests were conducted to investigate the post-impact mechanical behavior and failure modes of the damaged columns. These experiments provide a preliminary analysis of the CSRC columns’ strength degradation and deformation characteristics. More importantly, the datasets obtained from this experimental program serve as the vital empirical foundation for the subsequent advanced finite element analysis, enabling further parametric investigations and the validation of the numerical models.
Figure 1.
Research flowchart.
2.1. Specimen Design and Preparation
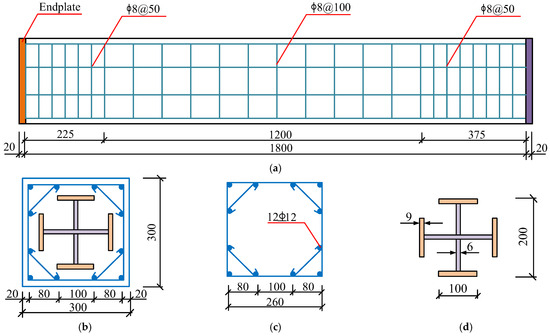
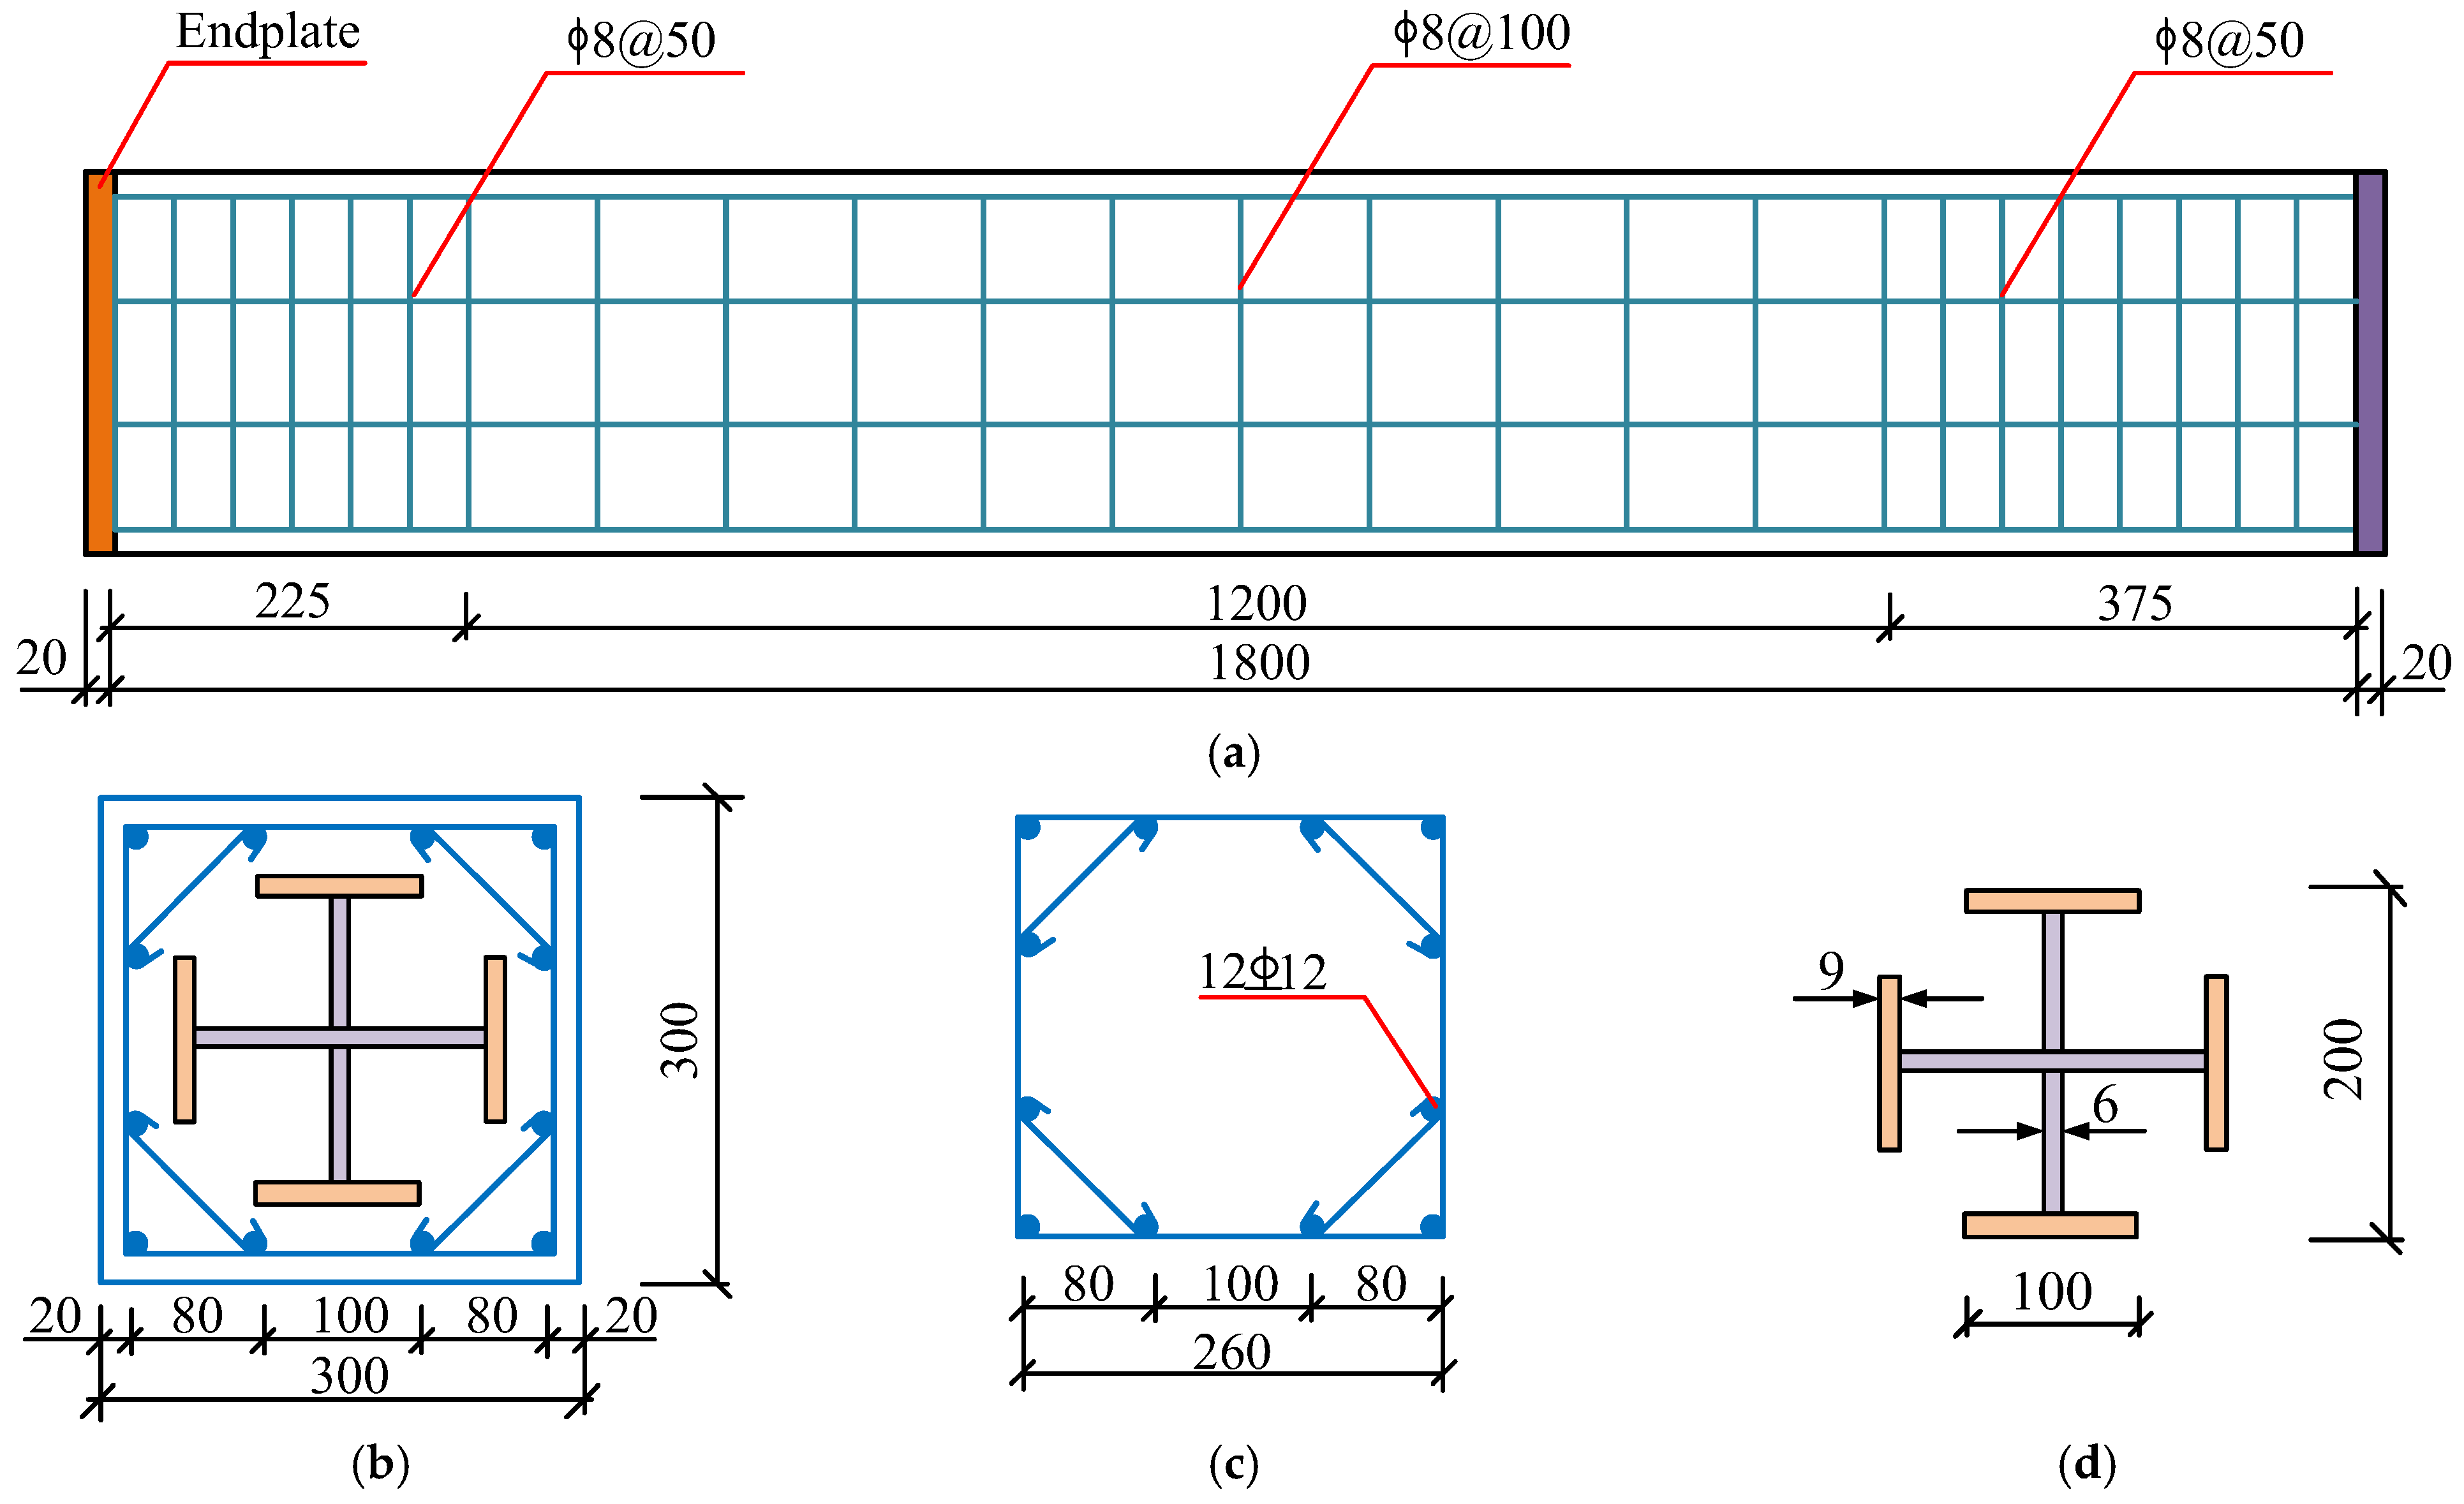
The specimens have been designed as part of previous research [19] for the lateral impact test of CSRC columns. The details of the study can be found in reference [19] and only essential information directly used in this paper are presented here for the convenience of the readers. A set of eleven identical column specimens was designed for testing, with different boundary constraints and axial load levels applied. Their dimensions and reinforcement details are presented in Figure 2. The cross sections including the steel bars and cross-shaped structural steel of the specimens are shown in Figure 3. The cross-section width (B) and length (L) of all specimens were 300 mm and 1800 mm, respectively. A total of 12 longitudinal steel bars is distributed around the section. The boundary condition positions of the specimens are 225 mm at the left end and 375 mm at the right end, respectively. The right side is the side of the axial force loading. The effective length (L0) of the specimen is 1200 mm. The aspect ratio of all specimens is 6, and the effective aspect ratio is 4 (due to the length of the support conditions). The spacing of stirrups is 100 mm for the central portion of the column, and 50 mm for the portions within 375 mm of the two ends. The nominal diameters of longitudinal reinforcement (Dl) and stirrup (Ds) are 12 mm and 8 mm, respectively. The concrete cover thickness is 20 mm.
Figure 2.
Specimen dimensions and details. (a) Specimen geometry and overall dimensions. (b) Longitudinal layout of the specimen. (c) Stirrup arrangement and spacing details. (d) Cross-shaped structural steel section. (: Symbol for steel grade and diameter; 8: Diameter of the rebar (in mm); @: Symbol for equal center-to-center spacing; 200: Center-to-center spacing between adjacent rebars (in mm). For instance, “8@200” denotes plain round rebars with a diameter of 8 mm and a yield strength of 235 MPa, arranged at a spacing of 200 mm).
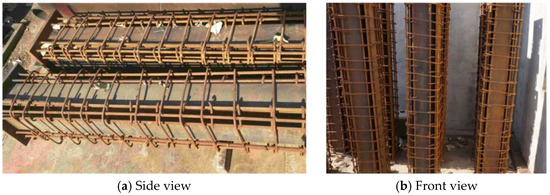
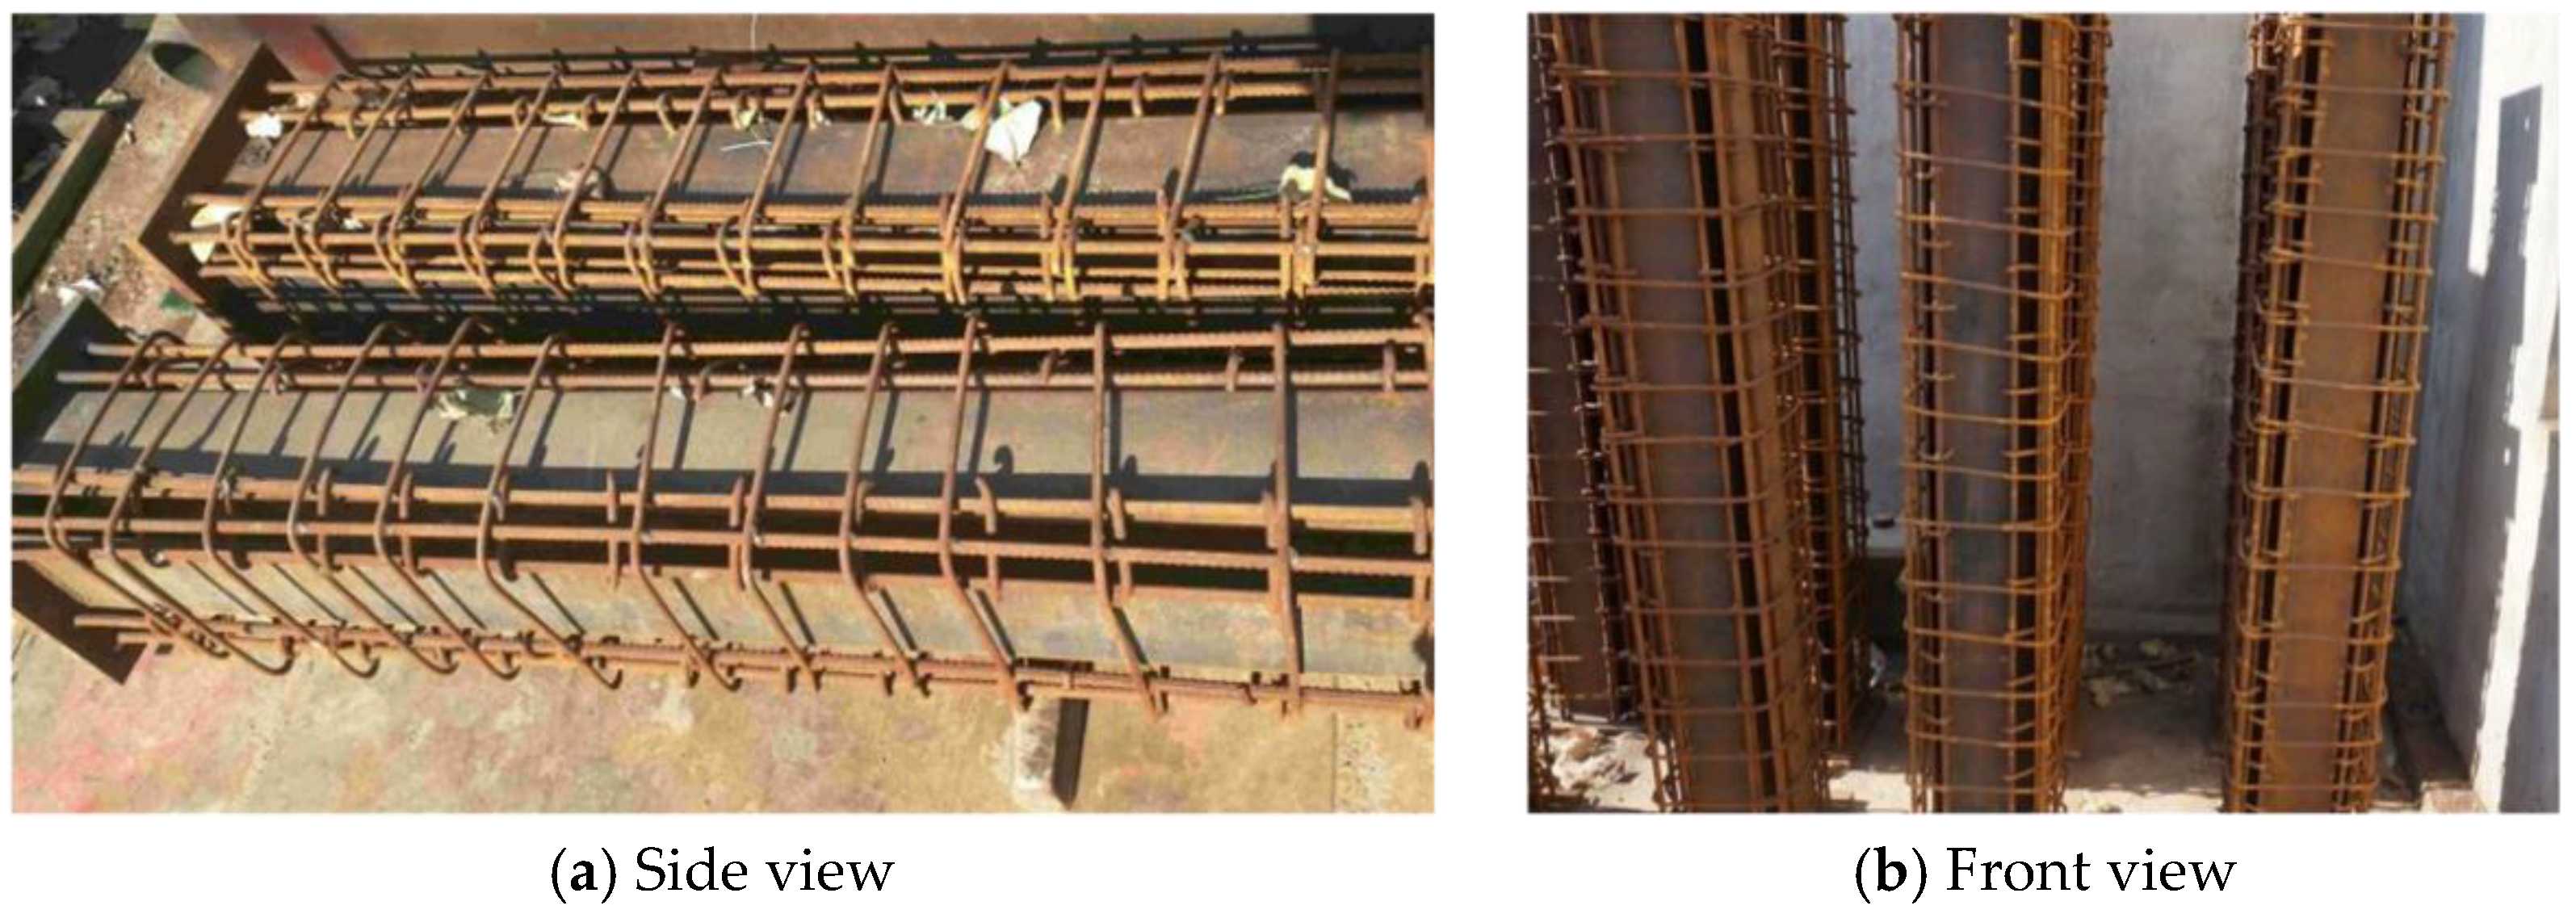
Figure 3.
Preparation of steel reinforcement and embedded structural steel.
In Table 1, the naming system of specimens is defined such that S corresponds to a square section and C to a cruciform steel core. The letters F and P designate fixed and pinned boundaries; therefore, FF, FP, and PP indicate fixed–fixed, fixed–pinned, and pinned–pinned configurations respectively. The fifth digit denotes the impact velocity level, where 1, 2, and 3 correspond to 5.42 m/s, 7.67 m/s, and 9.39 m/s, respectively. The final digit indicates the applied axial load: 0 means no axial load, 1 represents 340.4 kN, and 2 represents 680.8 kN. For example, the specimen SCFF1-2 indicates that the structural steel is cross-shaped steel, fixed at both ends, the impact velocity is 5.42 m/s, and the axial force applied is 680.80 kN.
Table 1.
Testing parameters.
2.2. Test Stages and Process
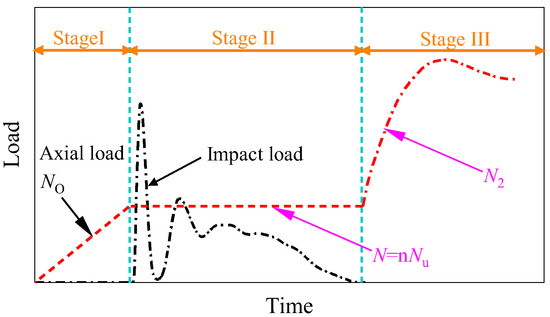
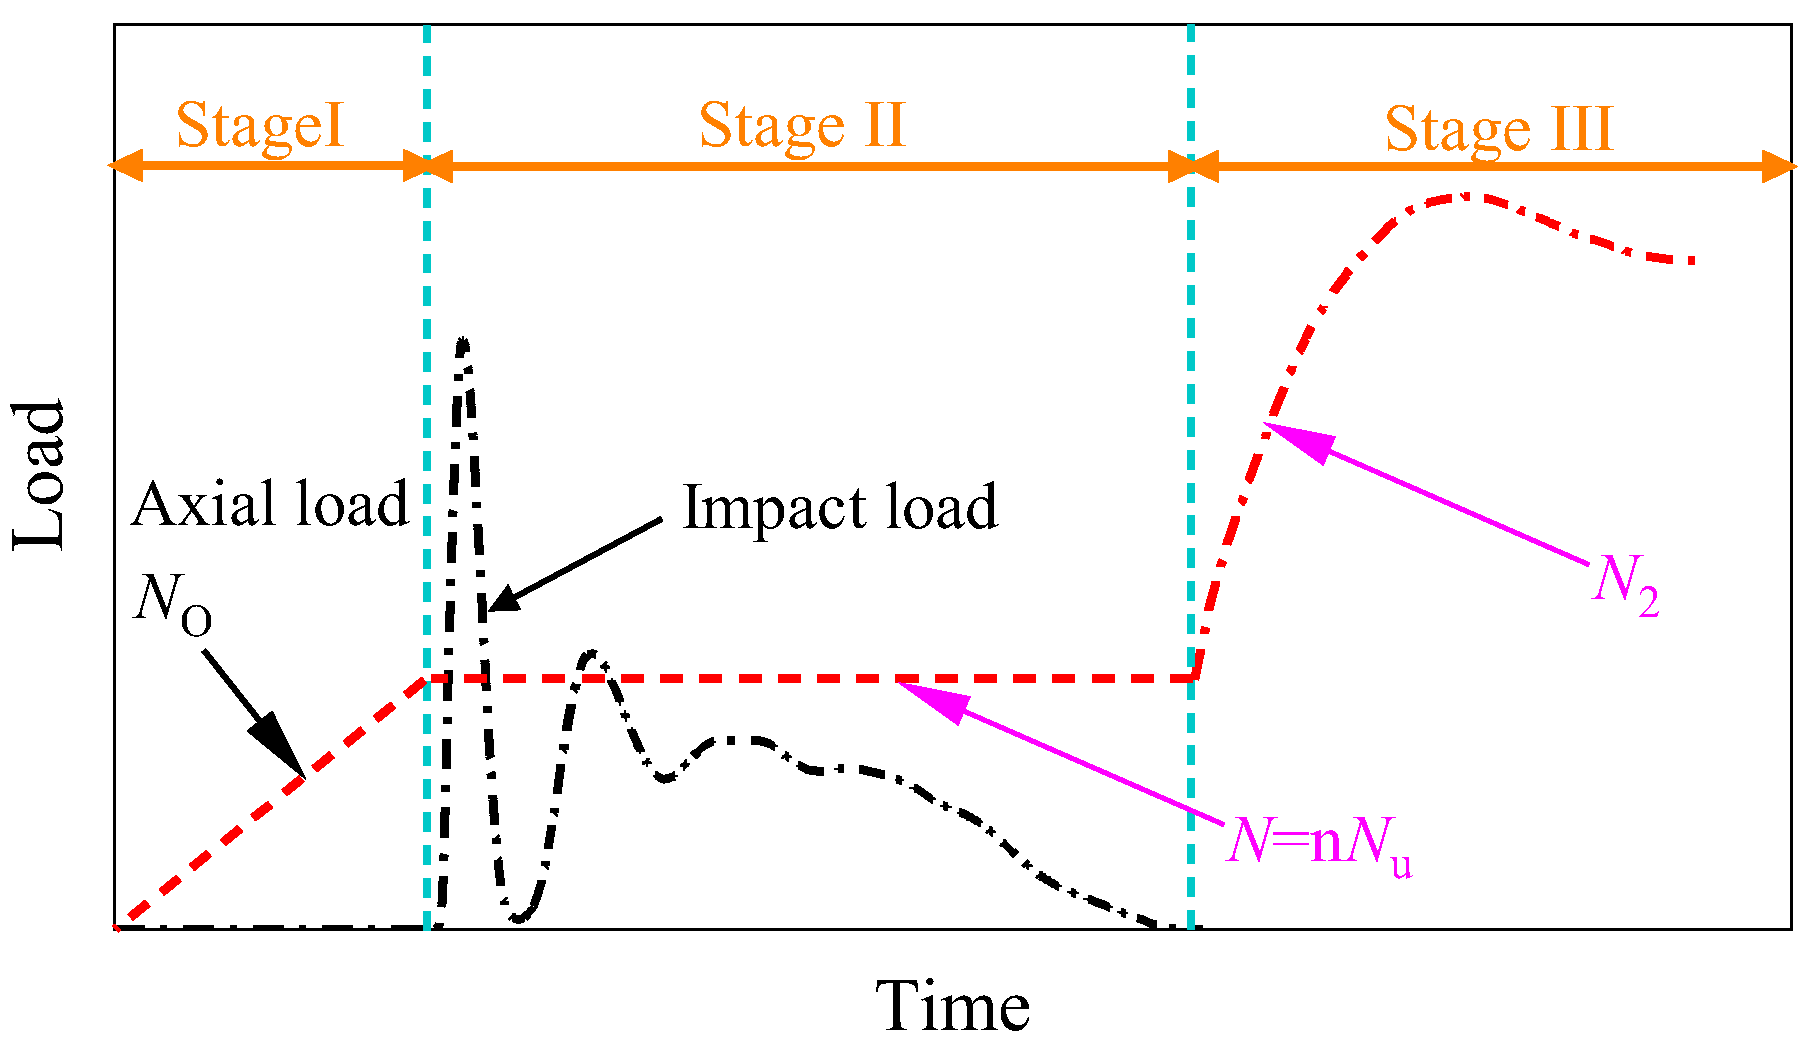
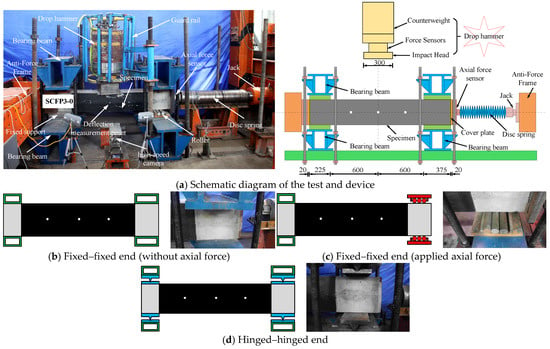
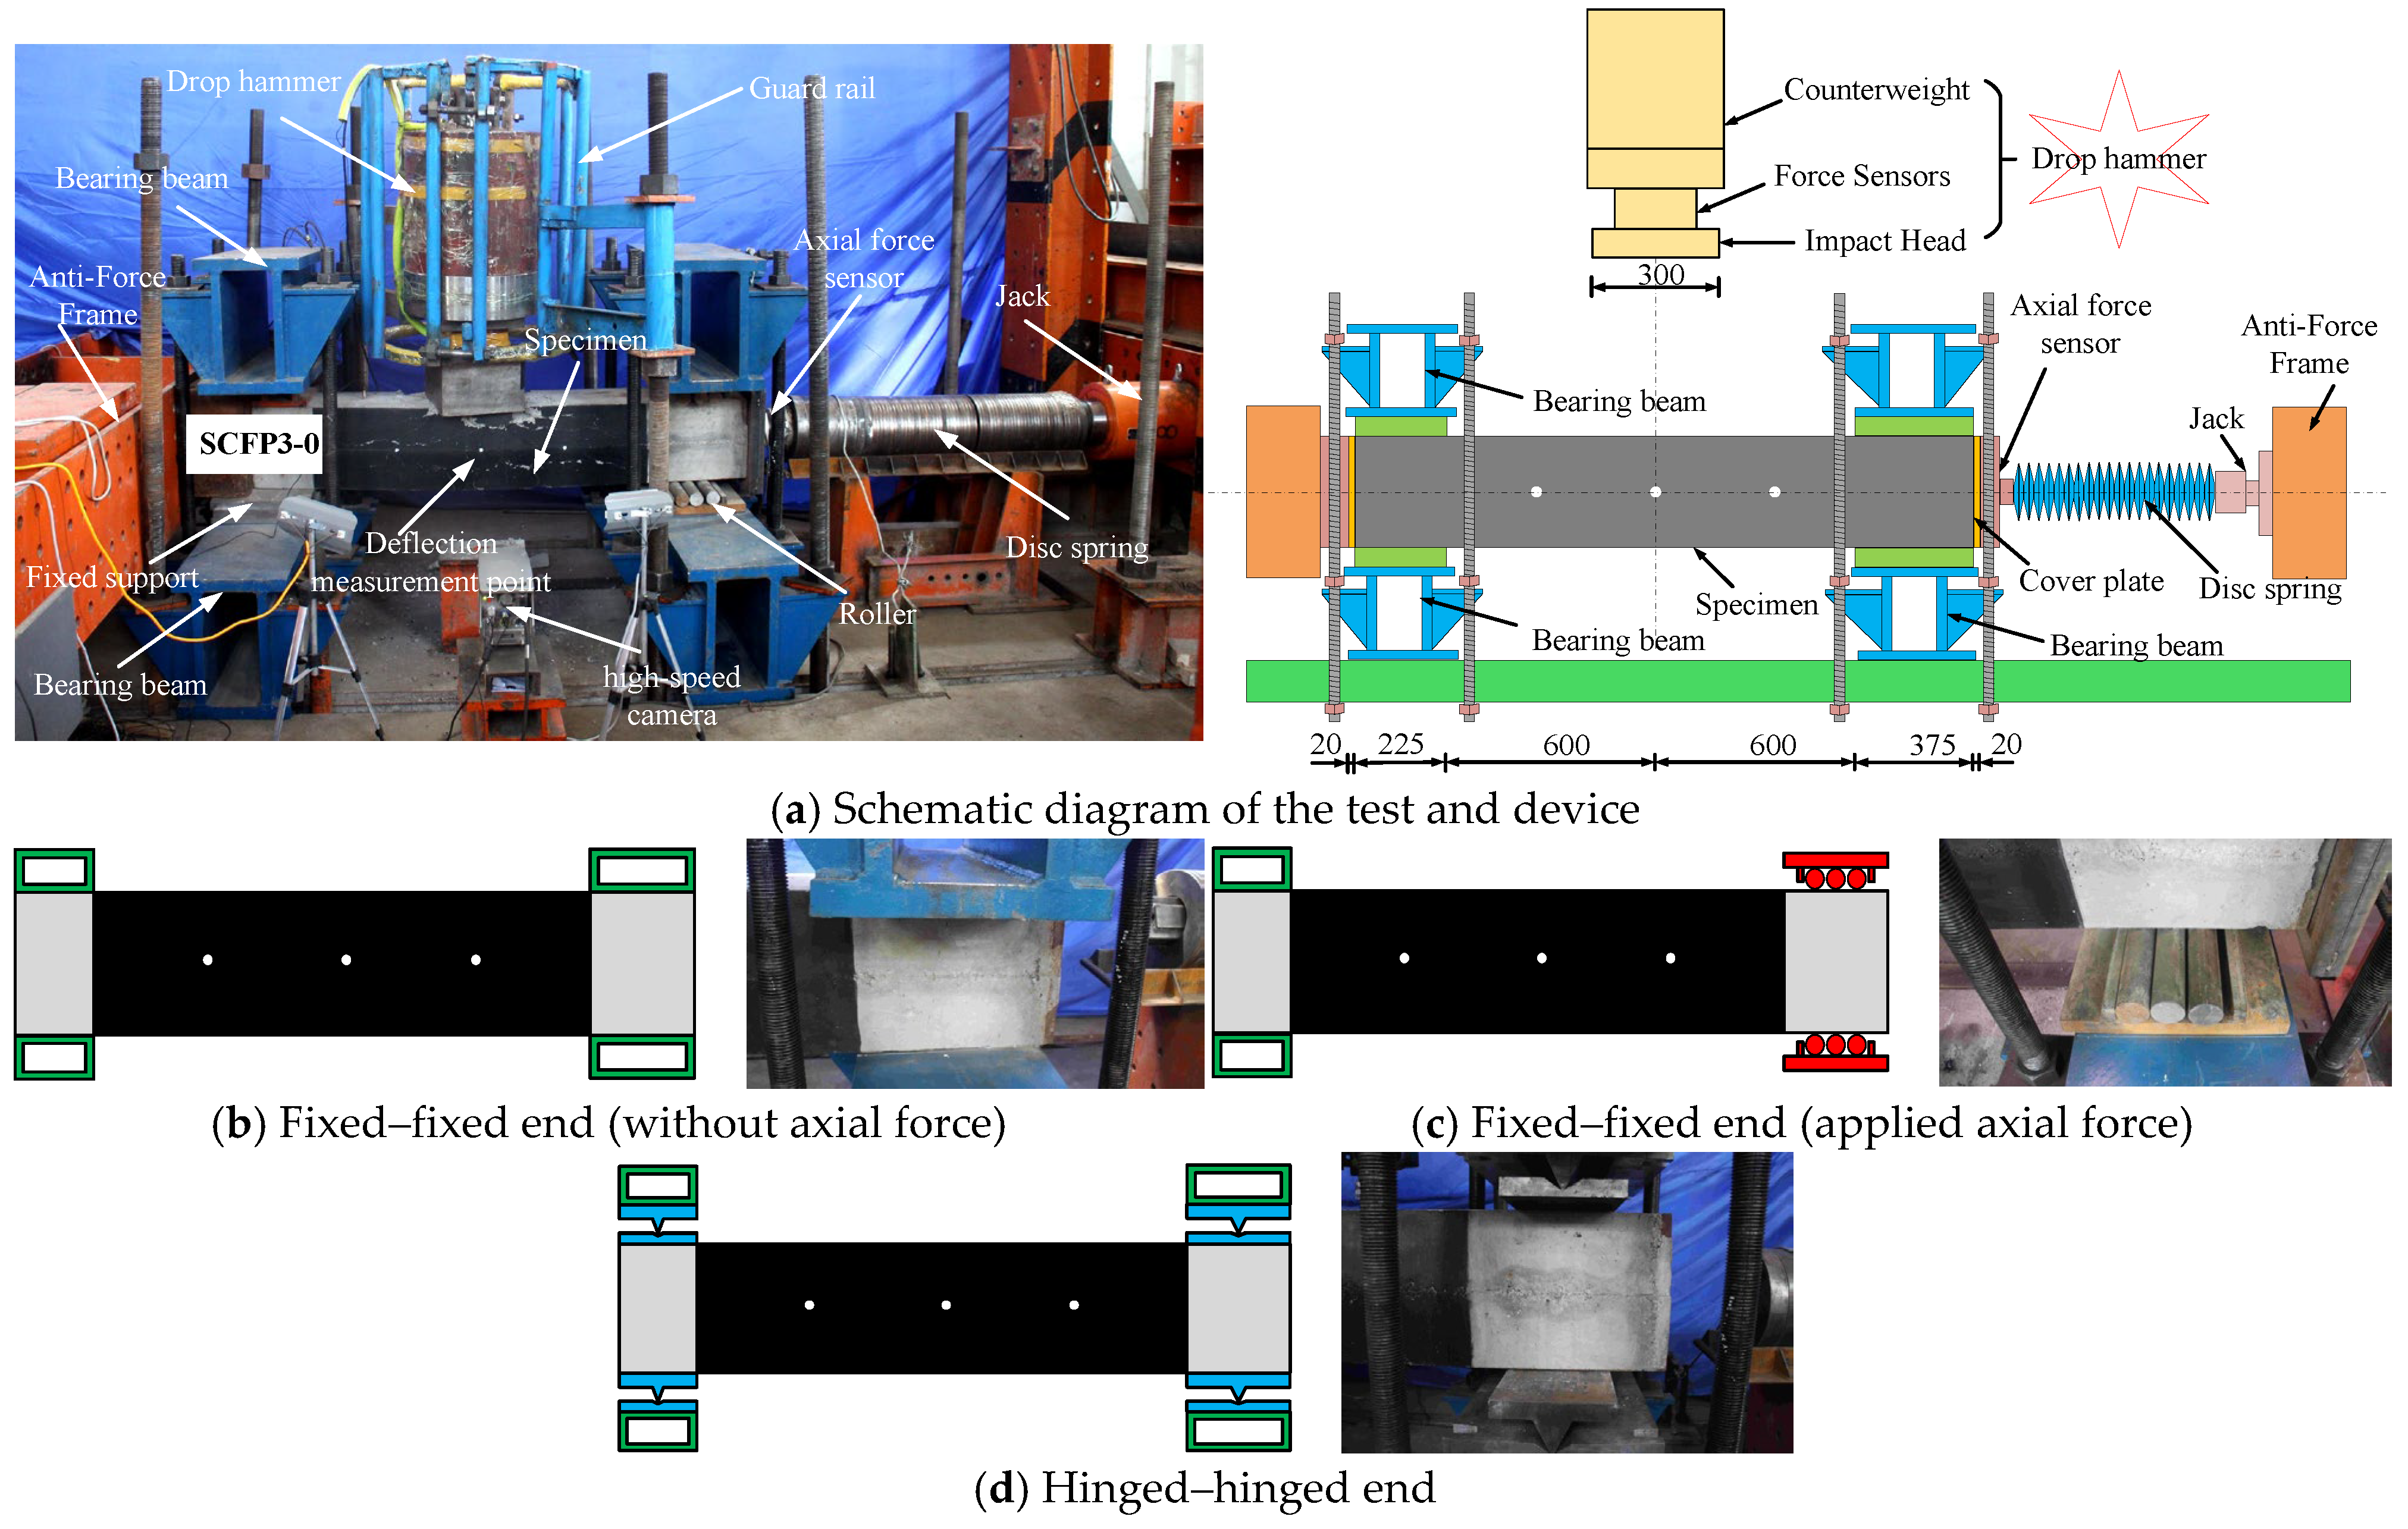
The loading process applied to specimen is depicted in Figure 4, which includes three stages: (1) applying a constant axial load N0 in the axial load direction; (2) dropping the hammer for lateral impact; and (3) increasing the axial load N2 until the column fails. This current study is focused on stage (3) as stages (1) and (2) were investigated in a prior study [19]. The equipment and testing environment of the stage (2) impact test are shown in Figure 5.
Figure 4.
Schematic of the loading history.
Figure 5.
Impact test.
2.3. Axial Compression Test Set-Up
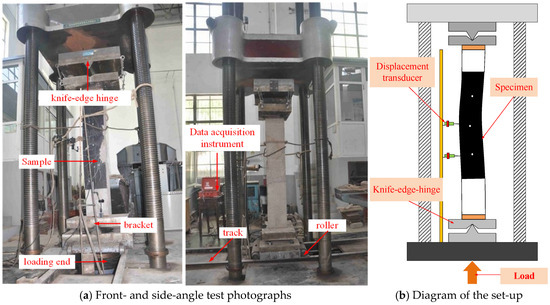
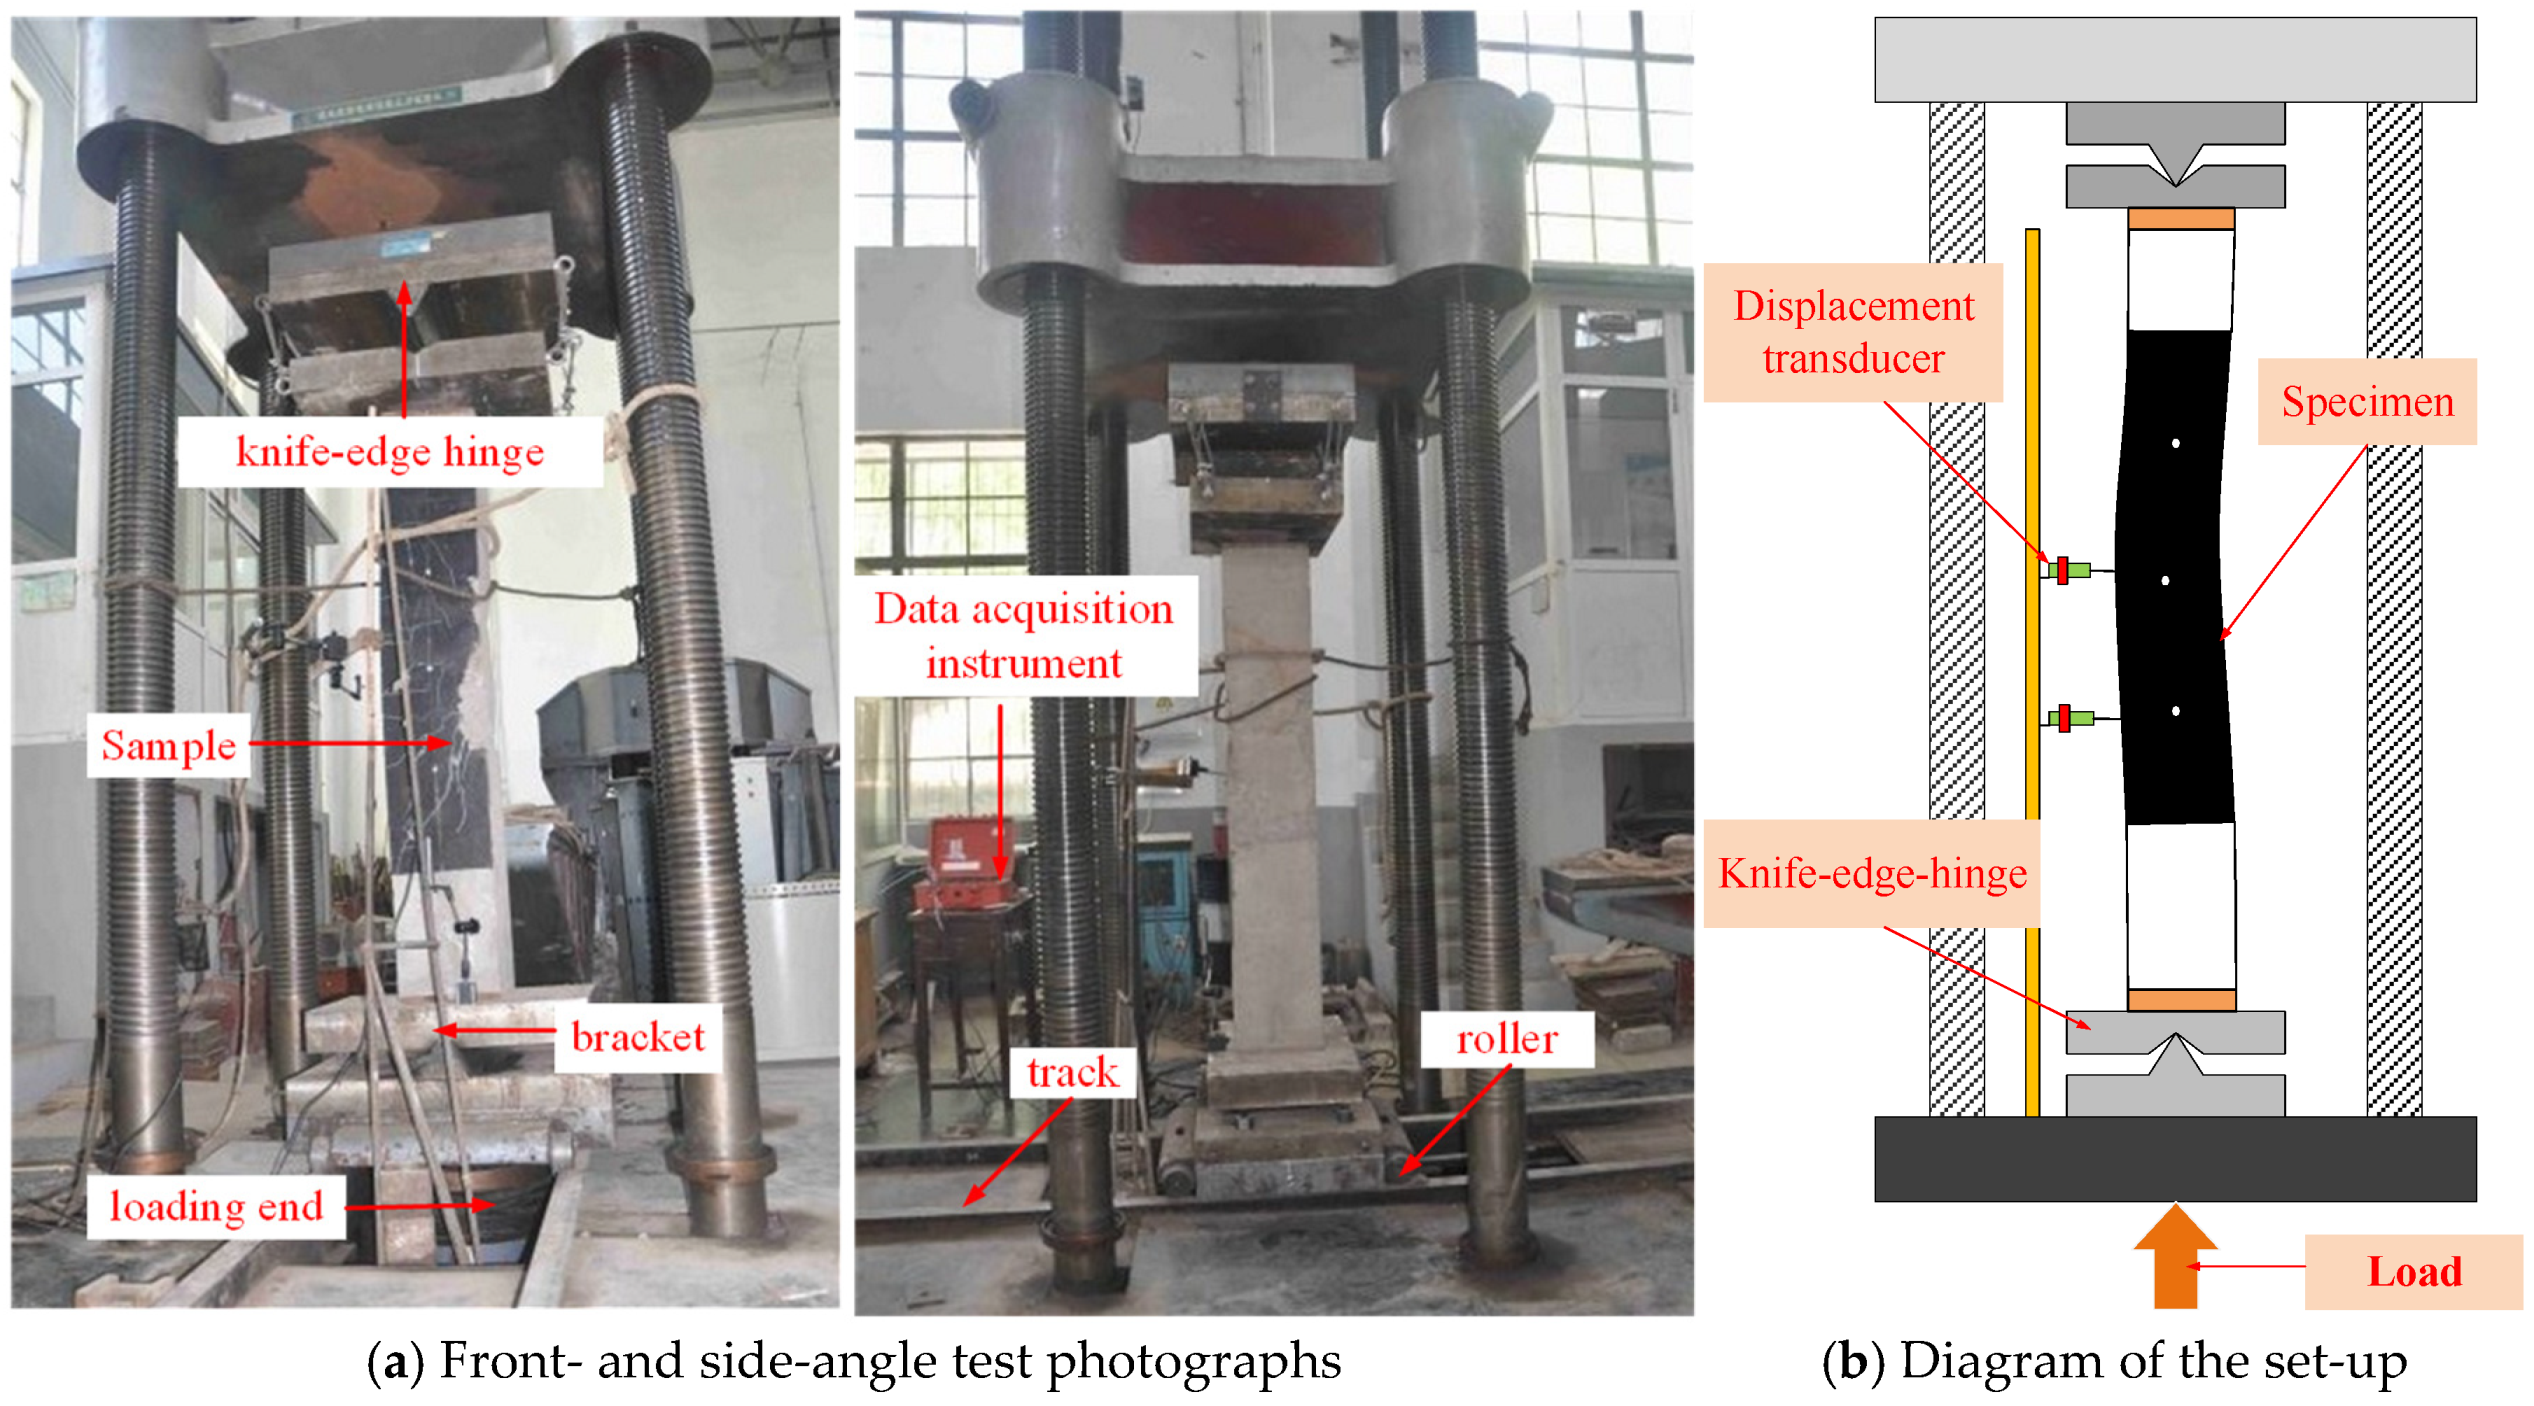
After completing the lateral impact test, residual axial resistance was measured using a 1000-ton hydraulic testing machine. The test set-up and photographs of the equipment are provided in Figure 6. The specimen is loaded by the knife hinges and the loading plates. When the specimen was set in place, the knife hinge edge was aligned to the loading plate centerline, and three displacement transducers were installed to measure in-plane deformation. Before the test loading, the specimen is preloaded to reduce the influence of the contact surface gap. Displacement controlled loading is used throughout the process, and the monotonic loading is carried out at a constant speed of 0.5 mm/min. The control system of the testing machine was used to obtain axial load and displacement data. However, surface concrete peeling after impact made lateral deformation measurement difficult for certain specimens.
Figure 6.
Location of the test set-up and instruments for the residual axial resistance.
3. Experimental Results and Analysis
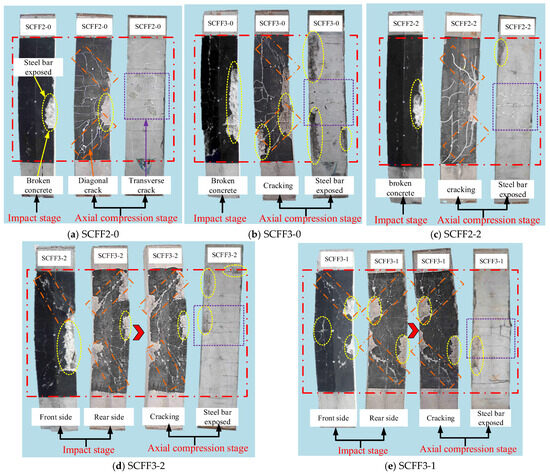
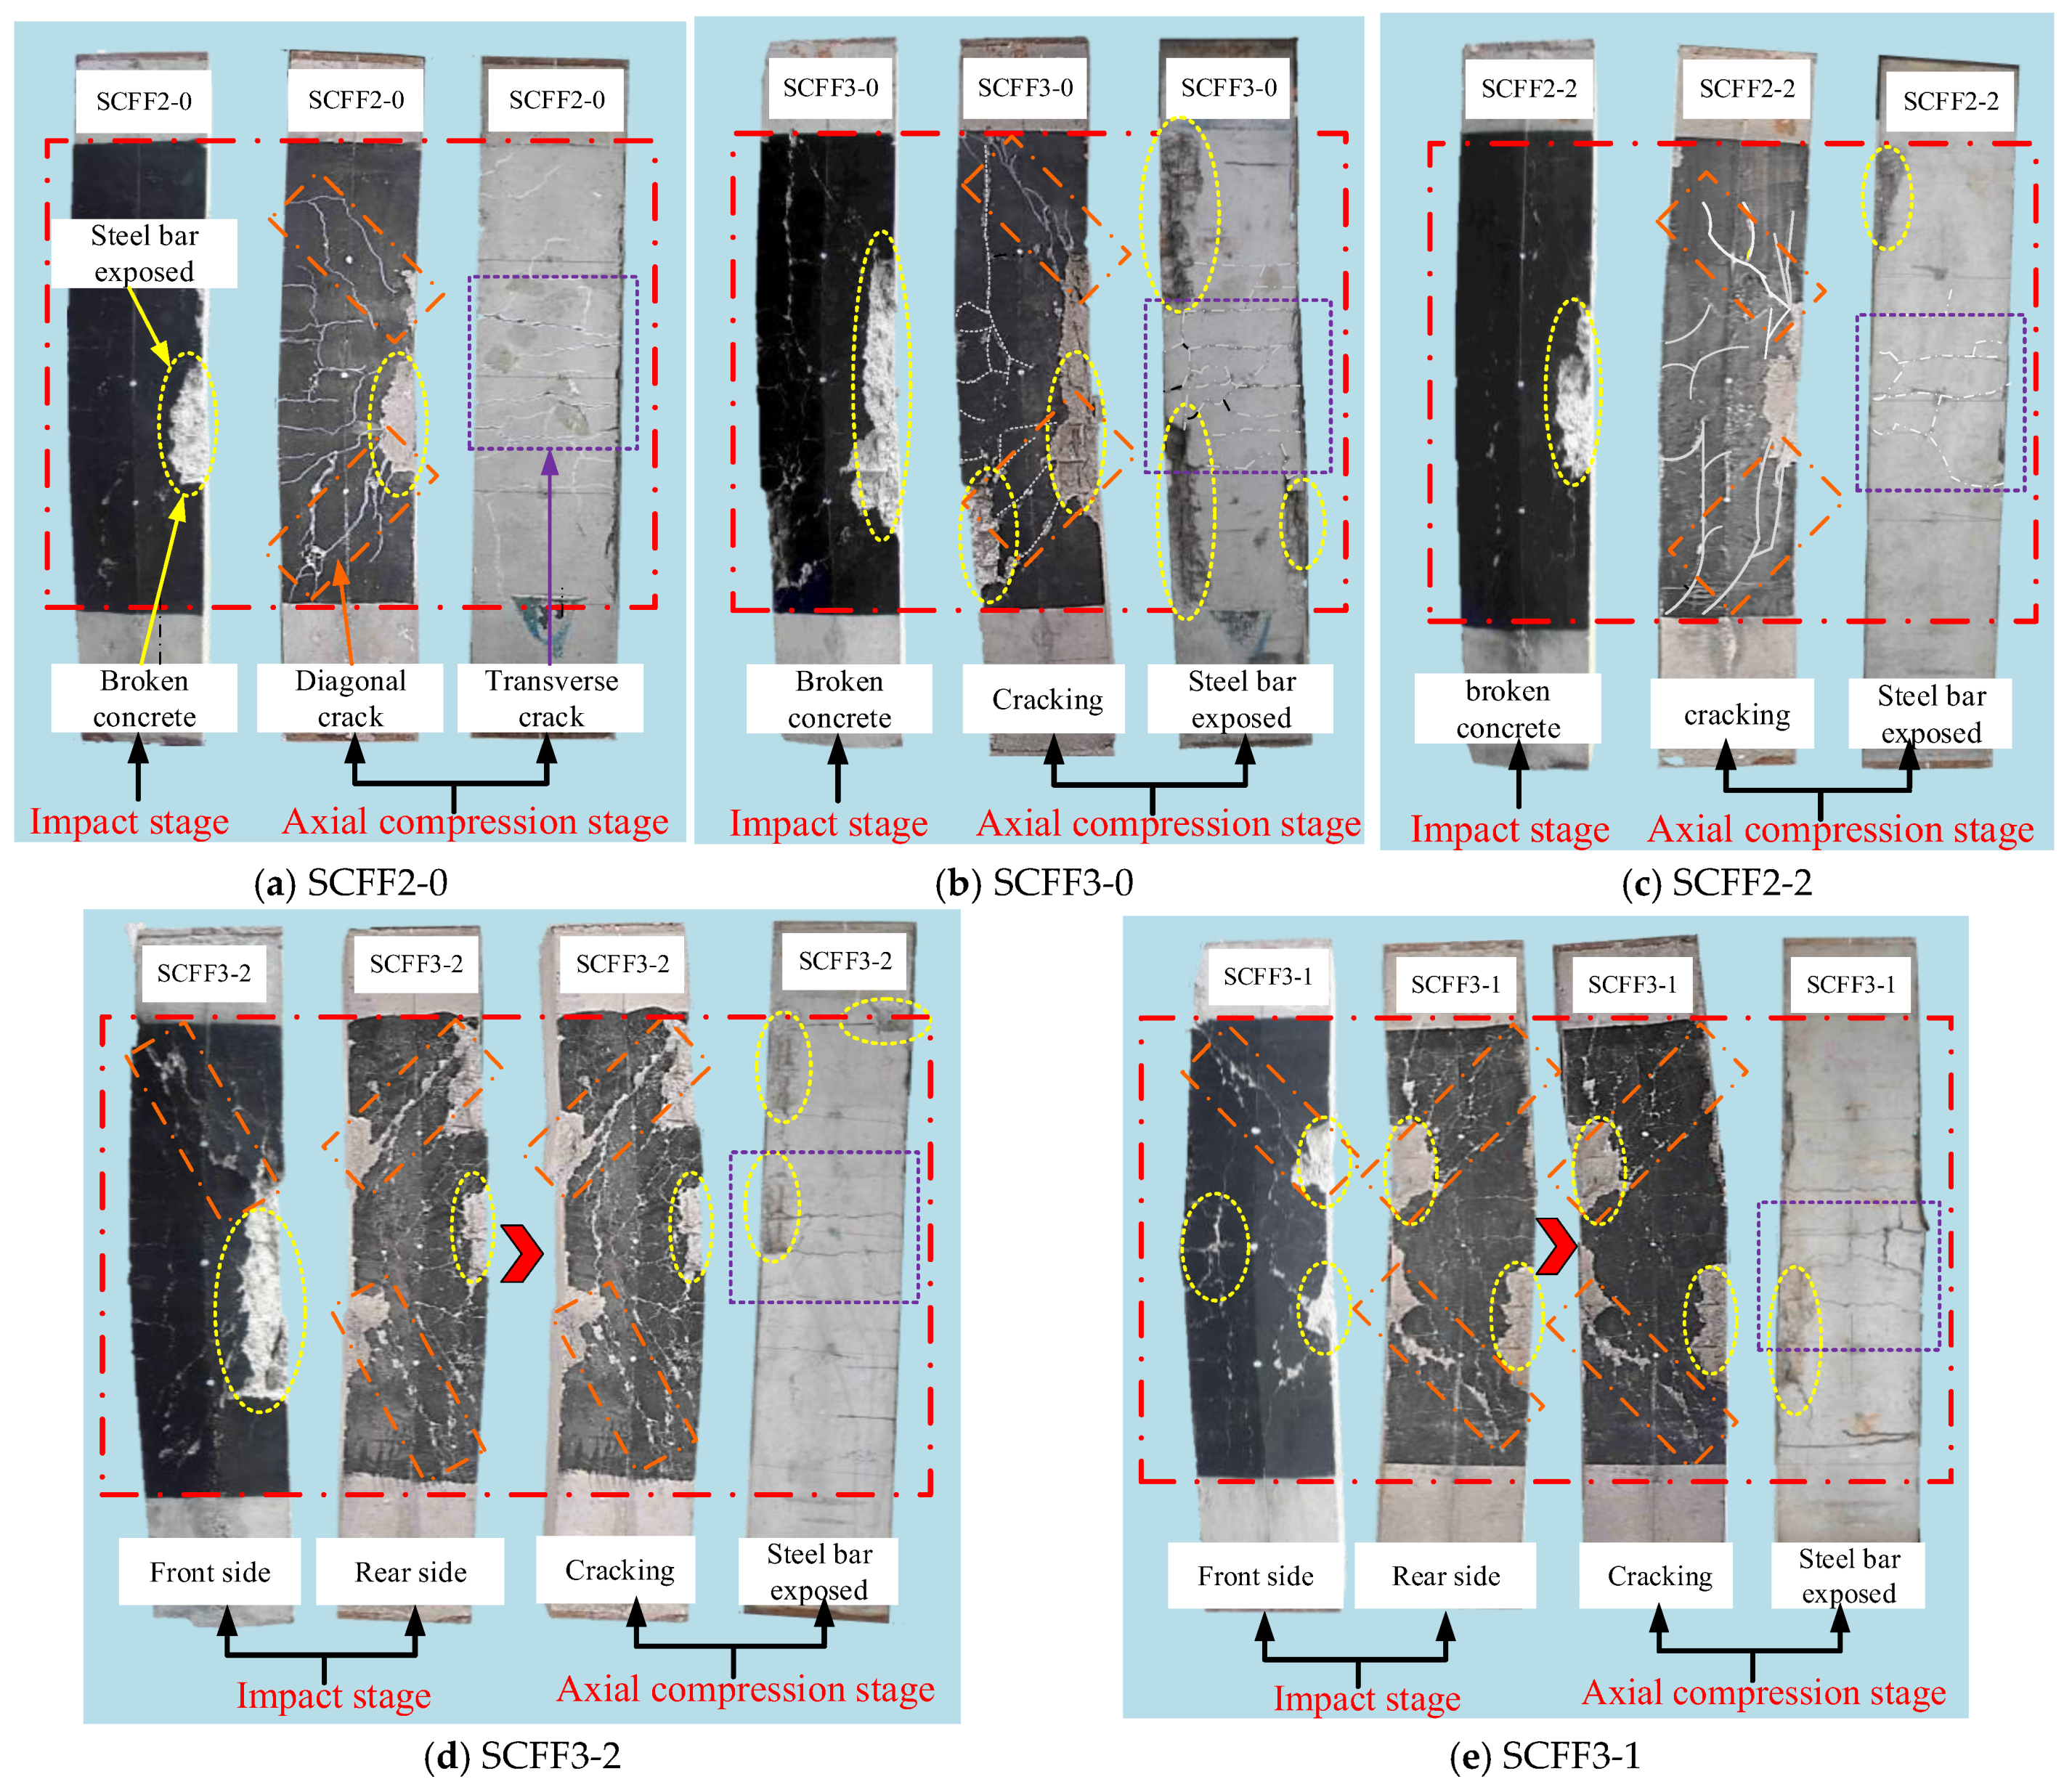
Following the lateral impact test, a residual axial capacity test was carried out. The associated deformation and damage under impact and compression conditions are displayed in Figure 7. Before the axial loading, a large initial deflection was generated at the mid-span region caused by lateral impact. When the axial load is at 70~80% of the ultimate load, the lateral displacement of the specimen in the mid-span starts to increase rapidly due to the P-Delta effects. When the load is close to the peak, the axial resistance of the specimen starts to decrease. The above results show that the damage to the specimen under axial compression is significantly contributed from P-Delta effects.
Figure 7.
Deformation modes of damage and axial compression after impact.
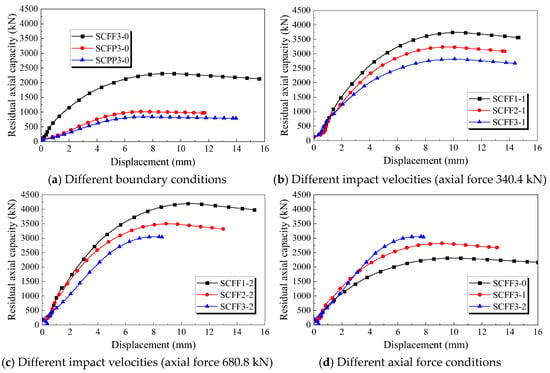
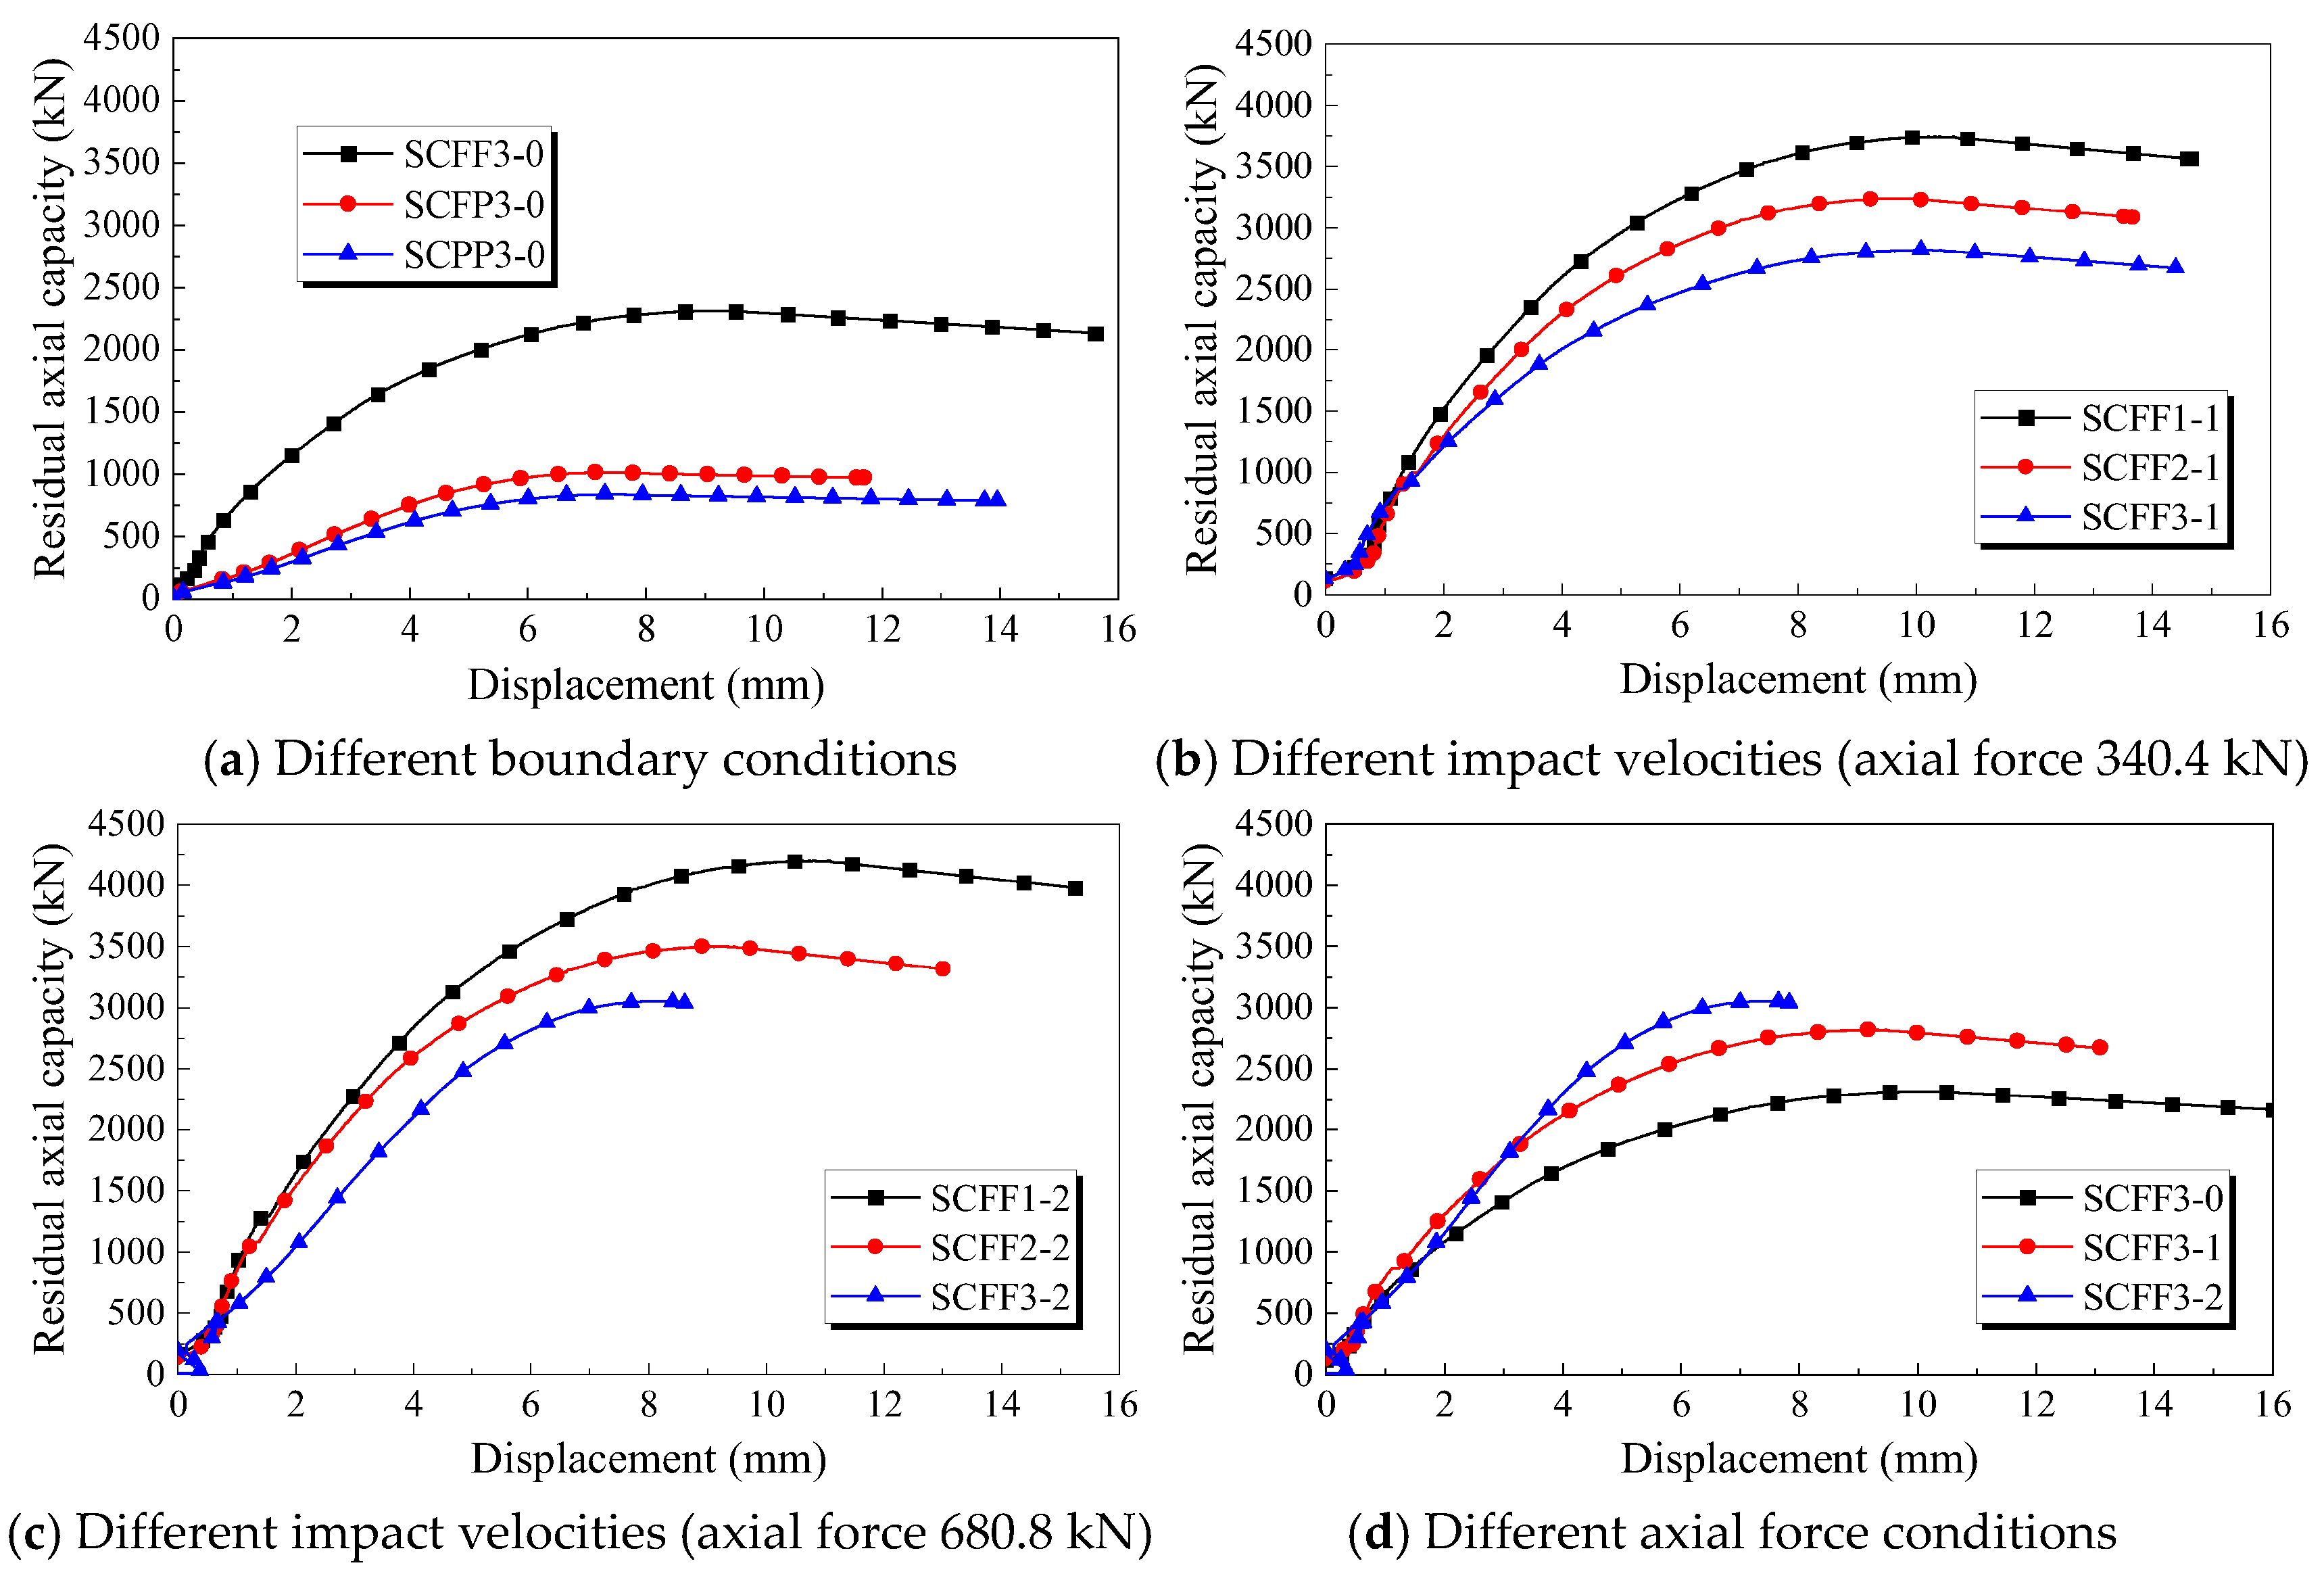
The post-impact residual axial load–displacement curve is illustrated in Figure 8. All specimens show the similar characteristics including three stages. At the initial stage of the loading, loading head is not in perfect contact with the cutter, and there are gaps on the surface, which results in minor nonlinearity. Subsequently, before the load approaches 70% to 80% of Nu (ultimate strength), the specimen is in the essentially elastic stage. With load increasing, the axial displacement exhibits an almost linear rise, while the specimen shows only slight axial and transverse deformation.
Figure 8.
Relationship curve between load and axial displacement.
Then, as the specimen enters the elastic–plastic stage, the load reaches the peak value. After that, the load began to decrease. For different specimens, the rate of load decline was different under different factors, but they are generally ductile. It can be observed from Figure 8 that the residual load capacity (Nr) of the specimen is affected by boundary conditions, impact energy and initial axial load. Based on Figure 8a, with weaker boundary conditions, the Nr of specimen SCFP3-0 and specimen SCPP3-0 are lower by 56.01% and 63.62%, respectively, compared with that of specimen SCFF3-0. In Figure 8b, with the same axial load of 340.40 kN but different impact velocities, the Nr of specimen SCFF2-1 and specimen SCFF3-1 (higher impact velocity) are lower by 13.42% and 24.71%, respectively, compared with that of specimen SCFF1-1 (lower impact velocity); in Figure 8c, similarly, with the increase in the impact velocity, the Nr of specimen SCFF2-2 and specimen SCFF3-2 are lower by 16.65% and 27.27%, respectively, compared with specimen SCFF1-2. In Figure 8d, when the initial axial load applied during lateral impact increased from 0 to 340.40 kN and 680.80 kN, the Nr of specimen SCFF3-2 and specimen SCFF3-1 are higher by 21.77% and 31.99%, respectively, compared with that of specimen SCFF3-0. This is because a certain axial force during lateral impact makes the specimen stronger, and reduces the plastic deformation during impact.
4. Finite Element Analysis (FEA)
4.1. Finite Element Model
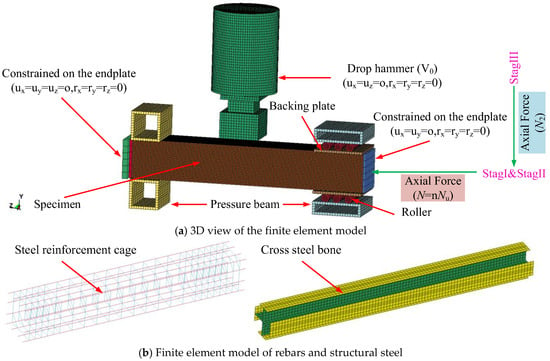
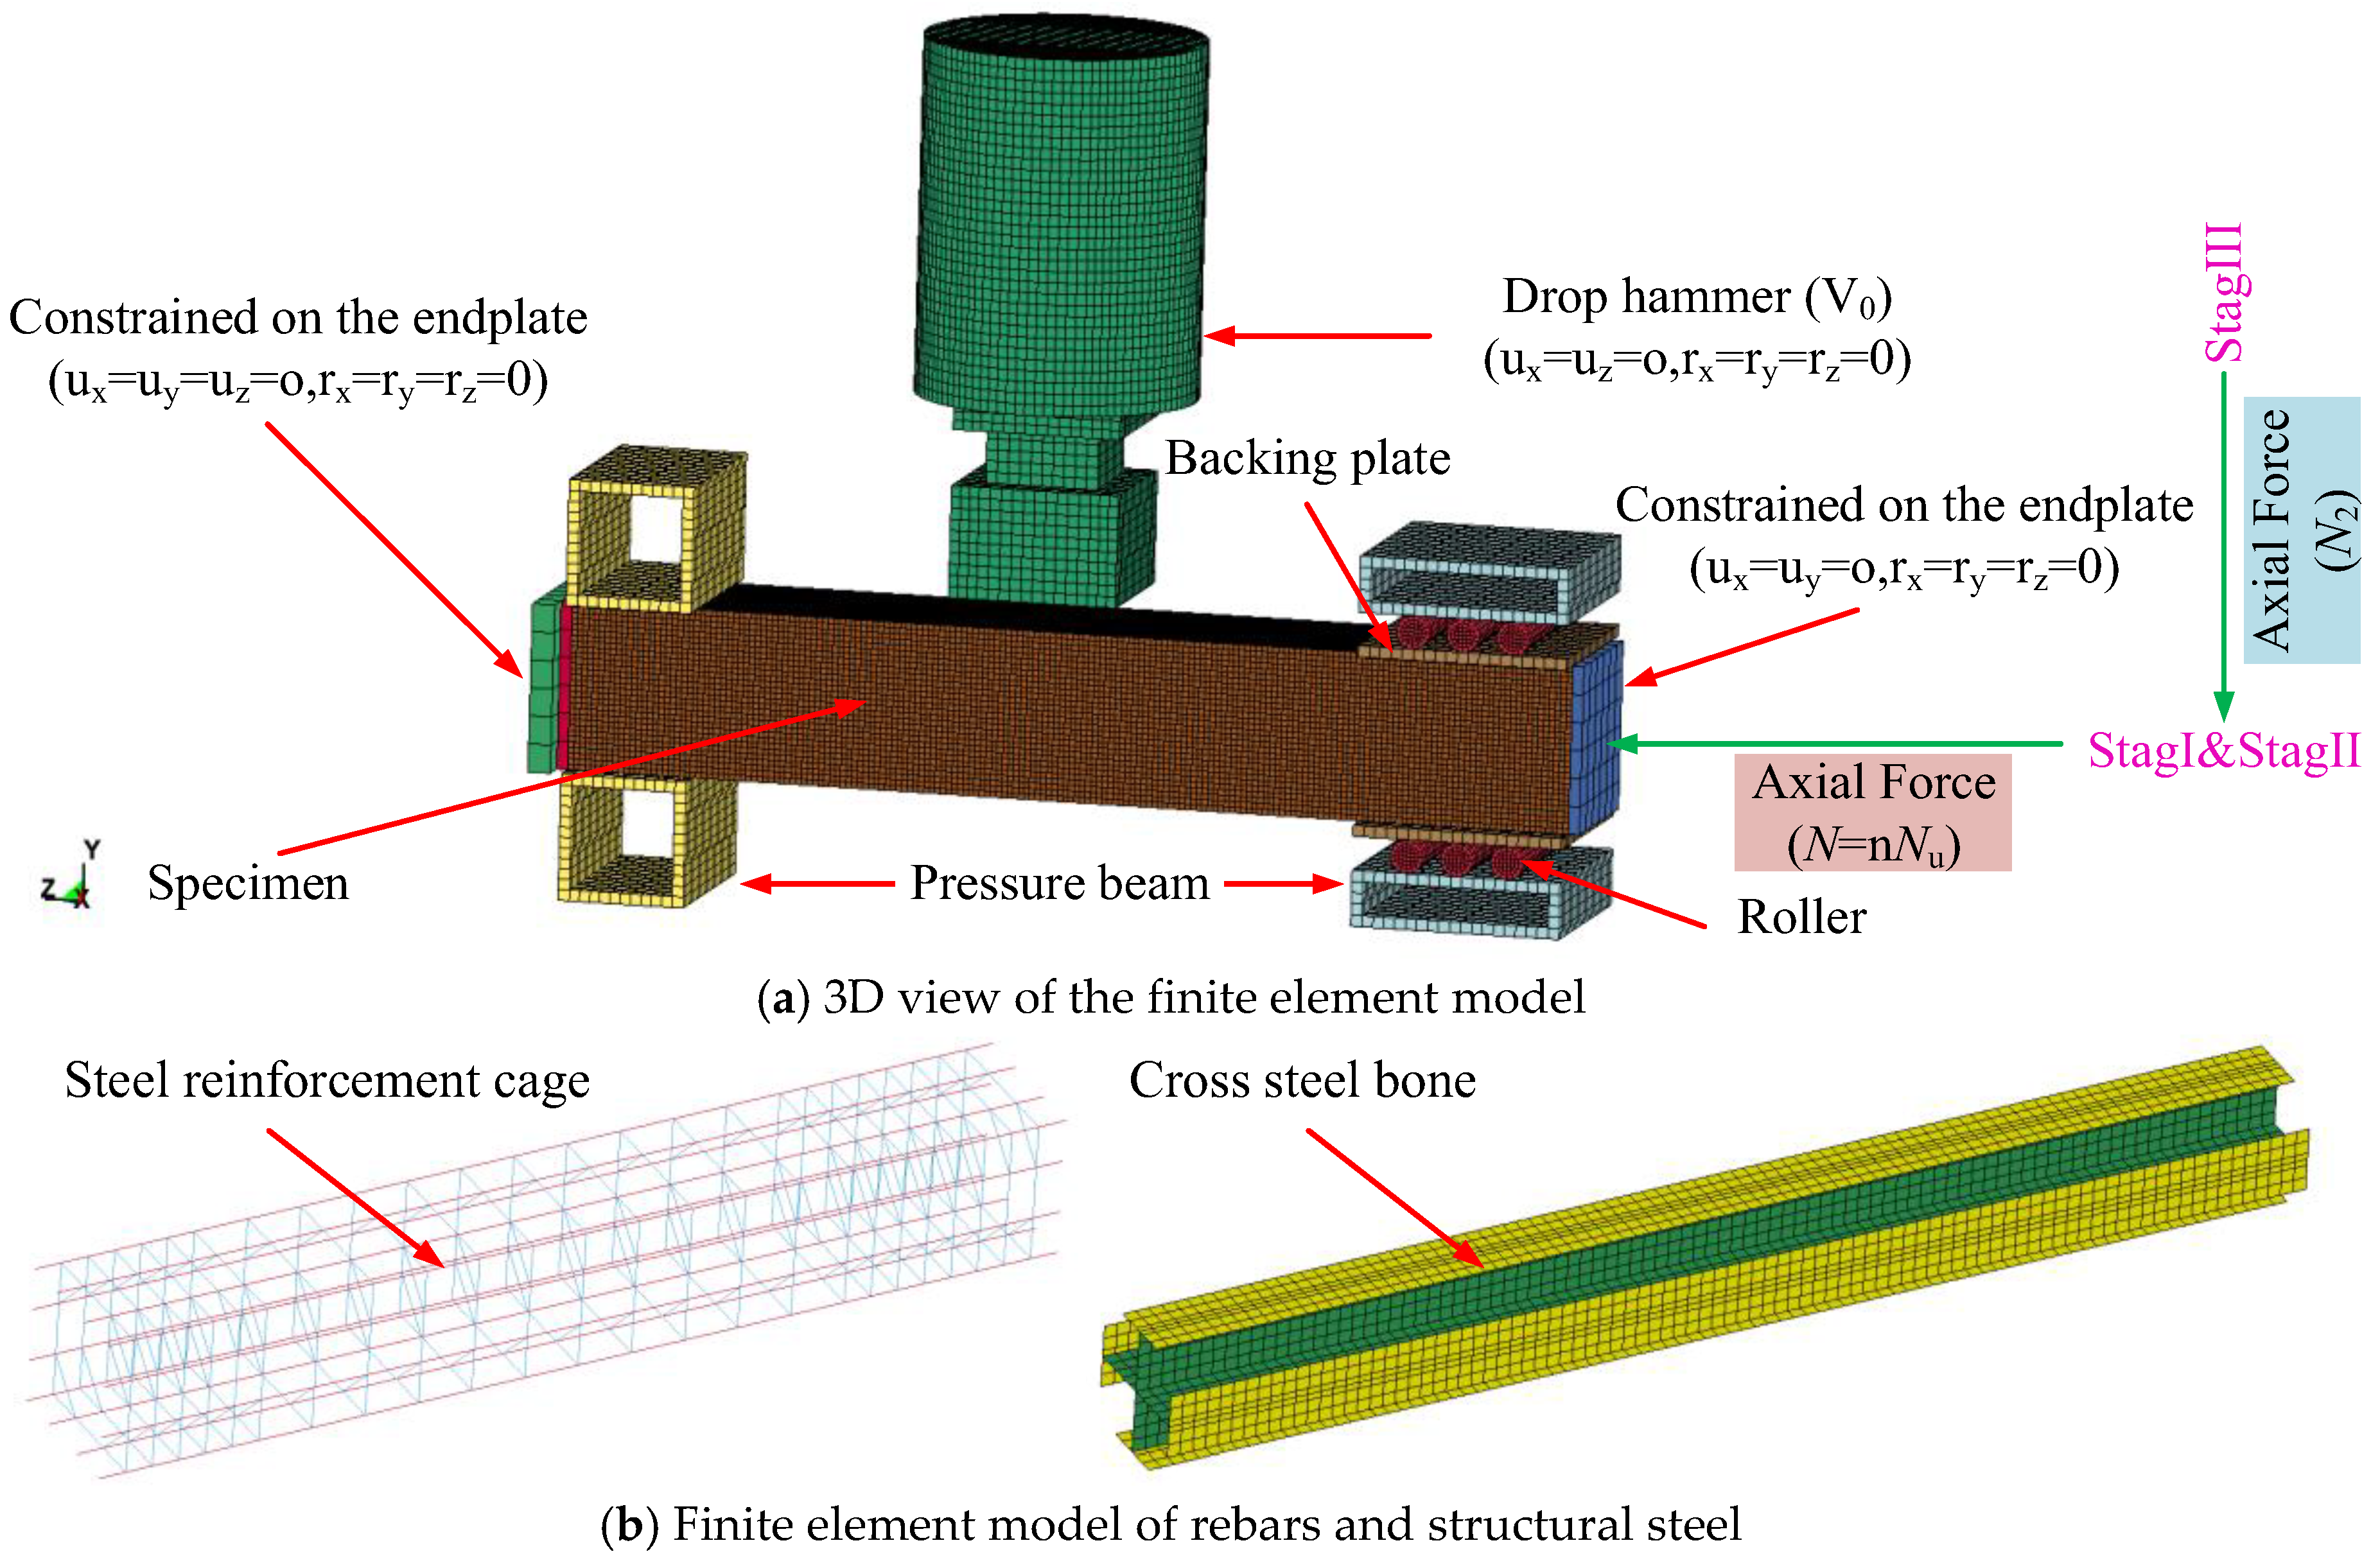
The FEM of CSRC columns under axial compression is established using ANSYS (18.0)/LS-DYNA. The influences of impact velocity, impact energy, boundary conditions, and axial force on the residual axial resistance are analyzed in this section. It includes six parts—embedded structural steel, longitudinal reinforcement, stirrup, concrete, impact body and steel end plates positioned on both ends of the specimen—which are shown in Figure 9. The three-dimensional solid element (SOLID164) with eight nodes is used for bearing, steel end plate, drop hammer and concrete. The thin shell element (SHELL163) is used for cross steel, while the beam element (BEAM161) is adopted for longitudinal reinforcement and stirrup. The axial force–impact coupling model and the FEM of the axial compression process are illustrated in Figure 8a. The axial force application in Figure 9a is divided into two parts: the first part is the initial axial load N applied and impact forces (stage I and stage II); the second part is the axially applied load N2 after impact damage. The finite element models of rebar and cross-shaped steel are shown in Figure 9b.
Figure 9.
Schematic diagram of the FEM.
In order to prevent penetration problems between the structural steel and steel end plate, the FEM developed in this study adopts the automatic contact in the surface-to-surface contact. When defining the boundary conditions, the constraint is applied to the steel end plate, and end plate is connected with the steel and concrete by ‘tie’. The initial hammer impact velocity was then assigned in the model.
4.2. Material Models
(1) Steel material models
In this study, the mechanical behavior of structural steel, reinforcement bars, and end plates was simulated using a kinematic-hardening bilinear elastoplastic model (MAT_PLASTIC_KINEMATIC). Considering the strain-rate sensitivity of steel under both low- and high-velocity impact loading, the yield and ultimate strengths increase with increasing strain rate. This effect was incorporated using the Cowper–Symonds formulation [40], as expressed in Equation (1).
where σy represents the stress when the plastic strain is ; is the plastic strain rate; σ0 is the stress in the steel at static loading; with C taken as 40 s−1 and p taken as 5 as suggested by Abramowitz et al. [41].
(2) Concrete material models
The concrete under impact conditions was simulated using the continuous cap model (MAT_CSCM_CONCRETE) [42]. This model is capable of representing key features such as strain softening, stiffness loss, dilation, shear compaction, and strain-rate strengthening under low confinement and tension. For ordinary concrete with uniaxial compressive strength of 20 MPa~58 MPa and aggregate size of 8 mm~32 mm, the CSCM model only needs to provide two material parameters, namely uniaxial compressive strength and maximum aggregate size.
(3) Rigid body models
The drop hammer, beam, roller and top plate were simulated with MAT_RIGID, as their stiffness is sufficiently large to be treated as rigid bodies.
(4) Meshing
Mesh size is an important factor affecting the accuracy and efficiency. To obtain an efficient calculation model, four different mesh sizes of 10 mm, 15 mm, 20 mm and 30 mm were selected to test the convergence. When the mesh size is 15 mm and 20 mm, the time histories of impact force and displacement are consistent, and thus the 20 mm mesh size is chosen for the subsequent numerical simulation.
4.3. Validations of the FEM
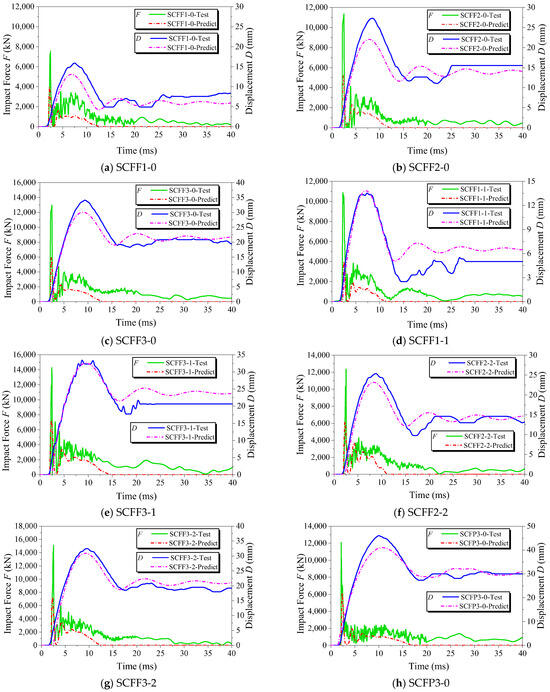
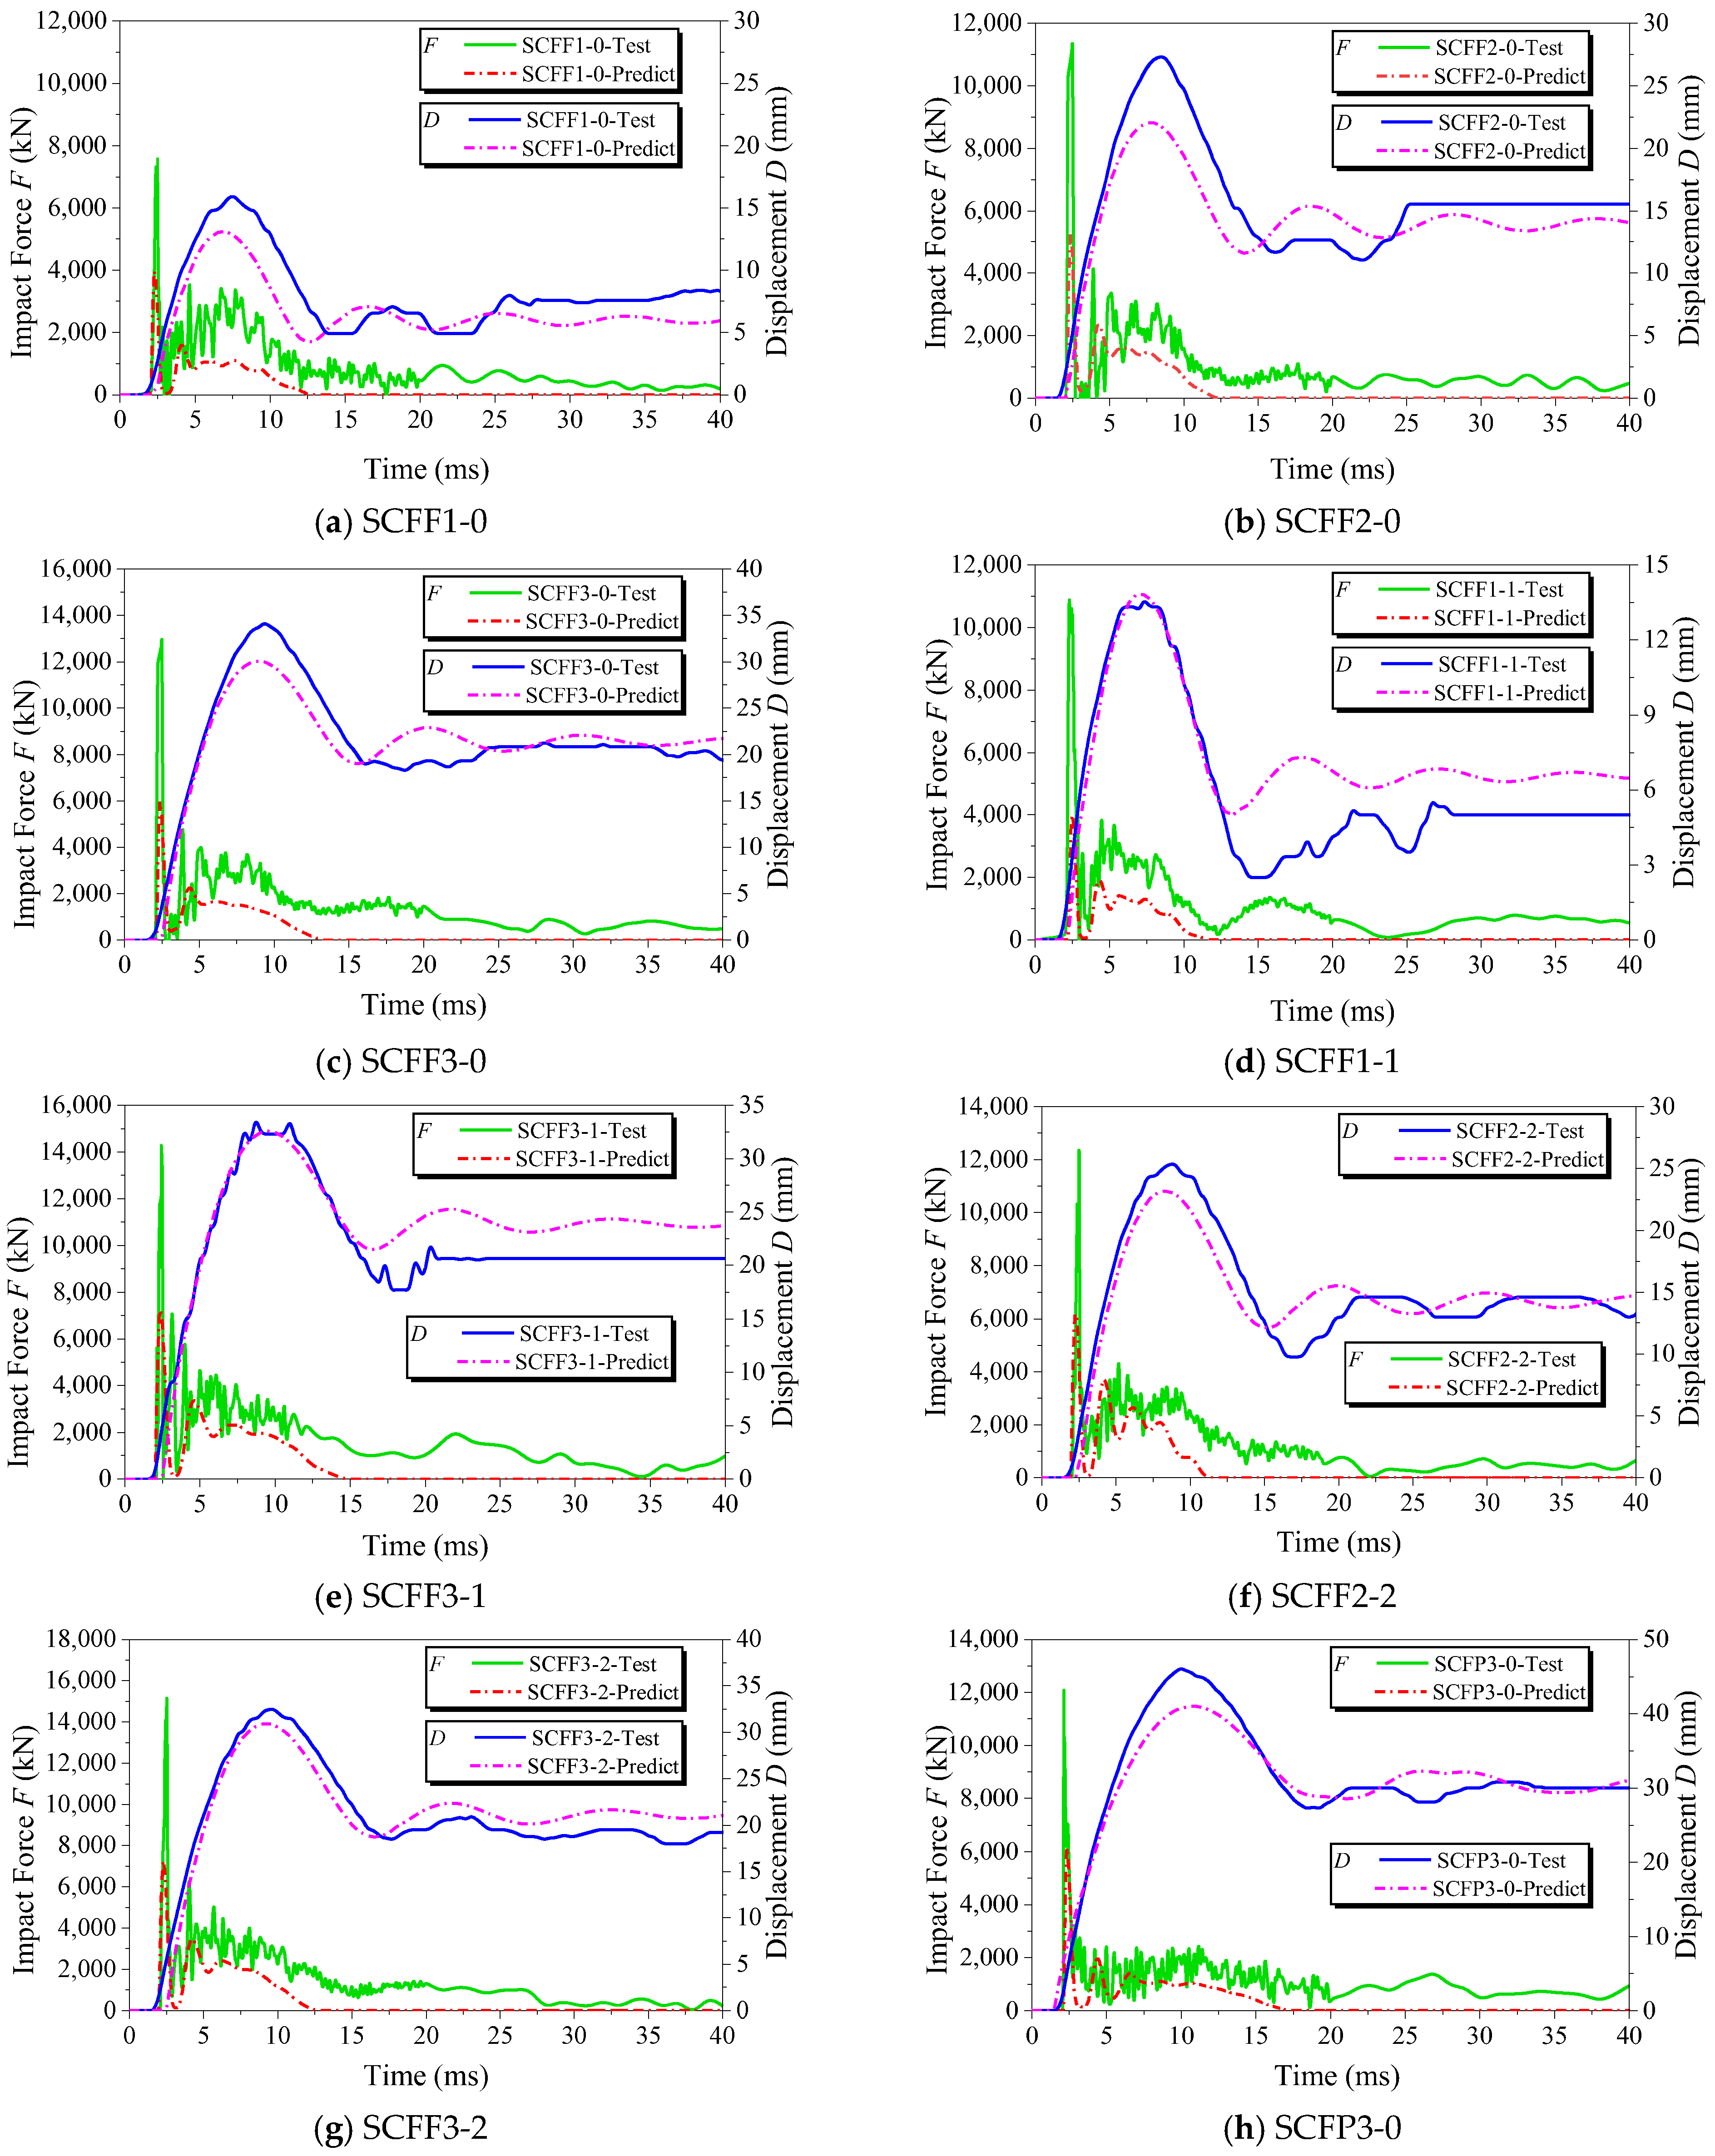
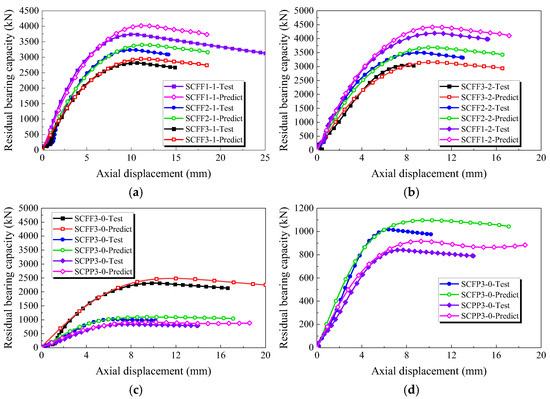
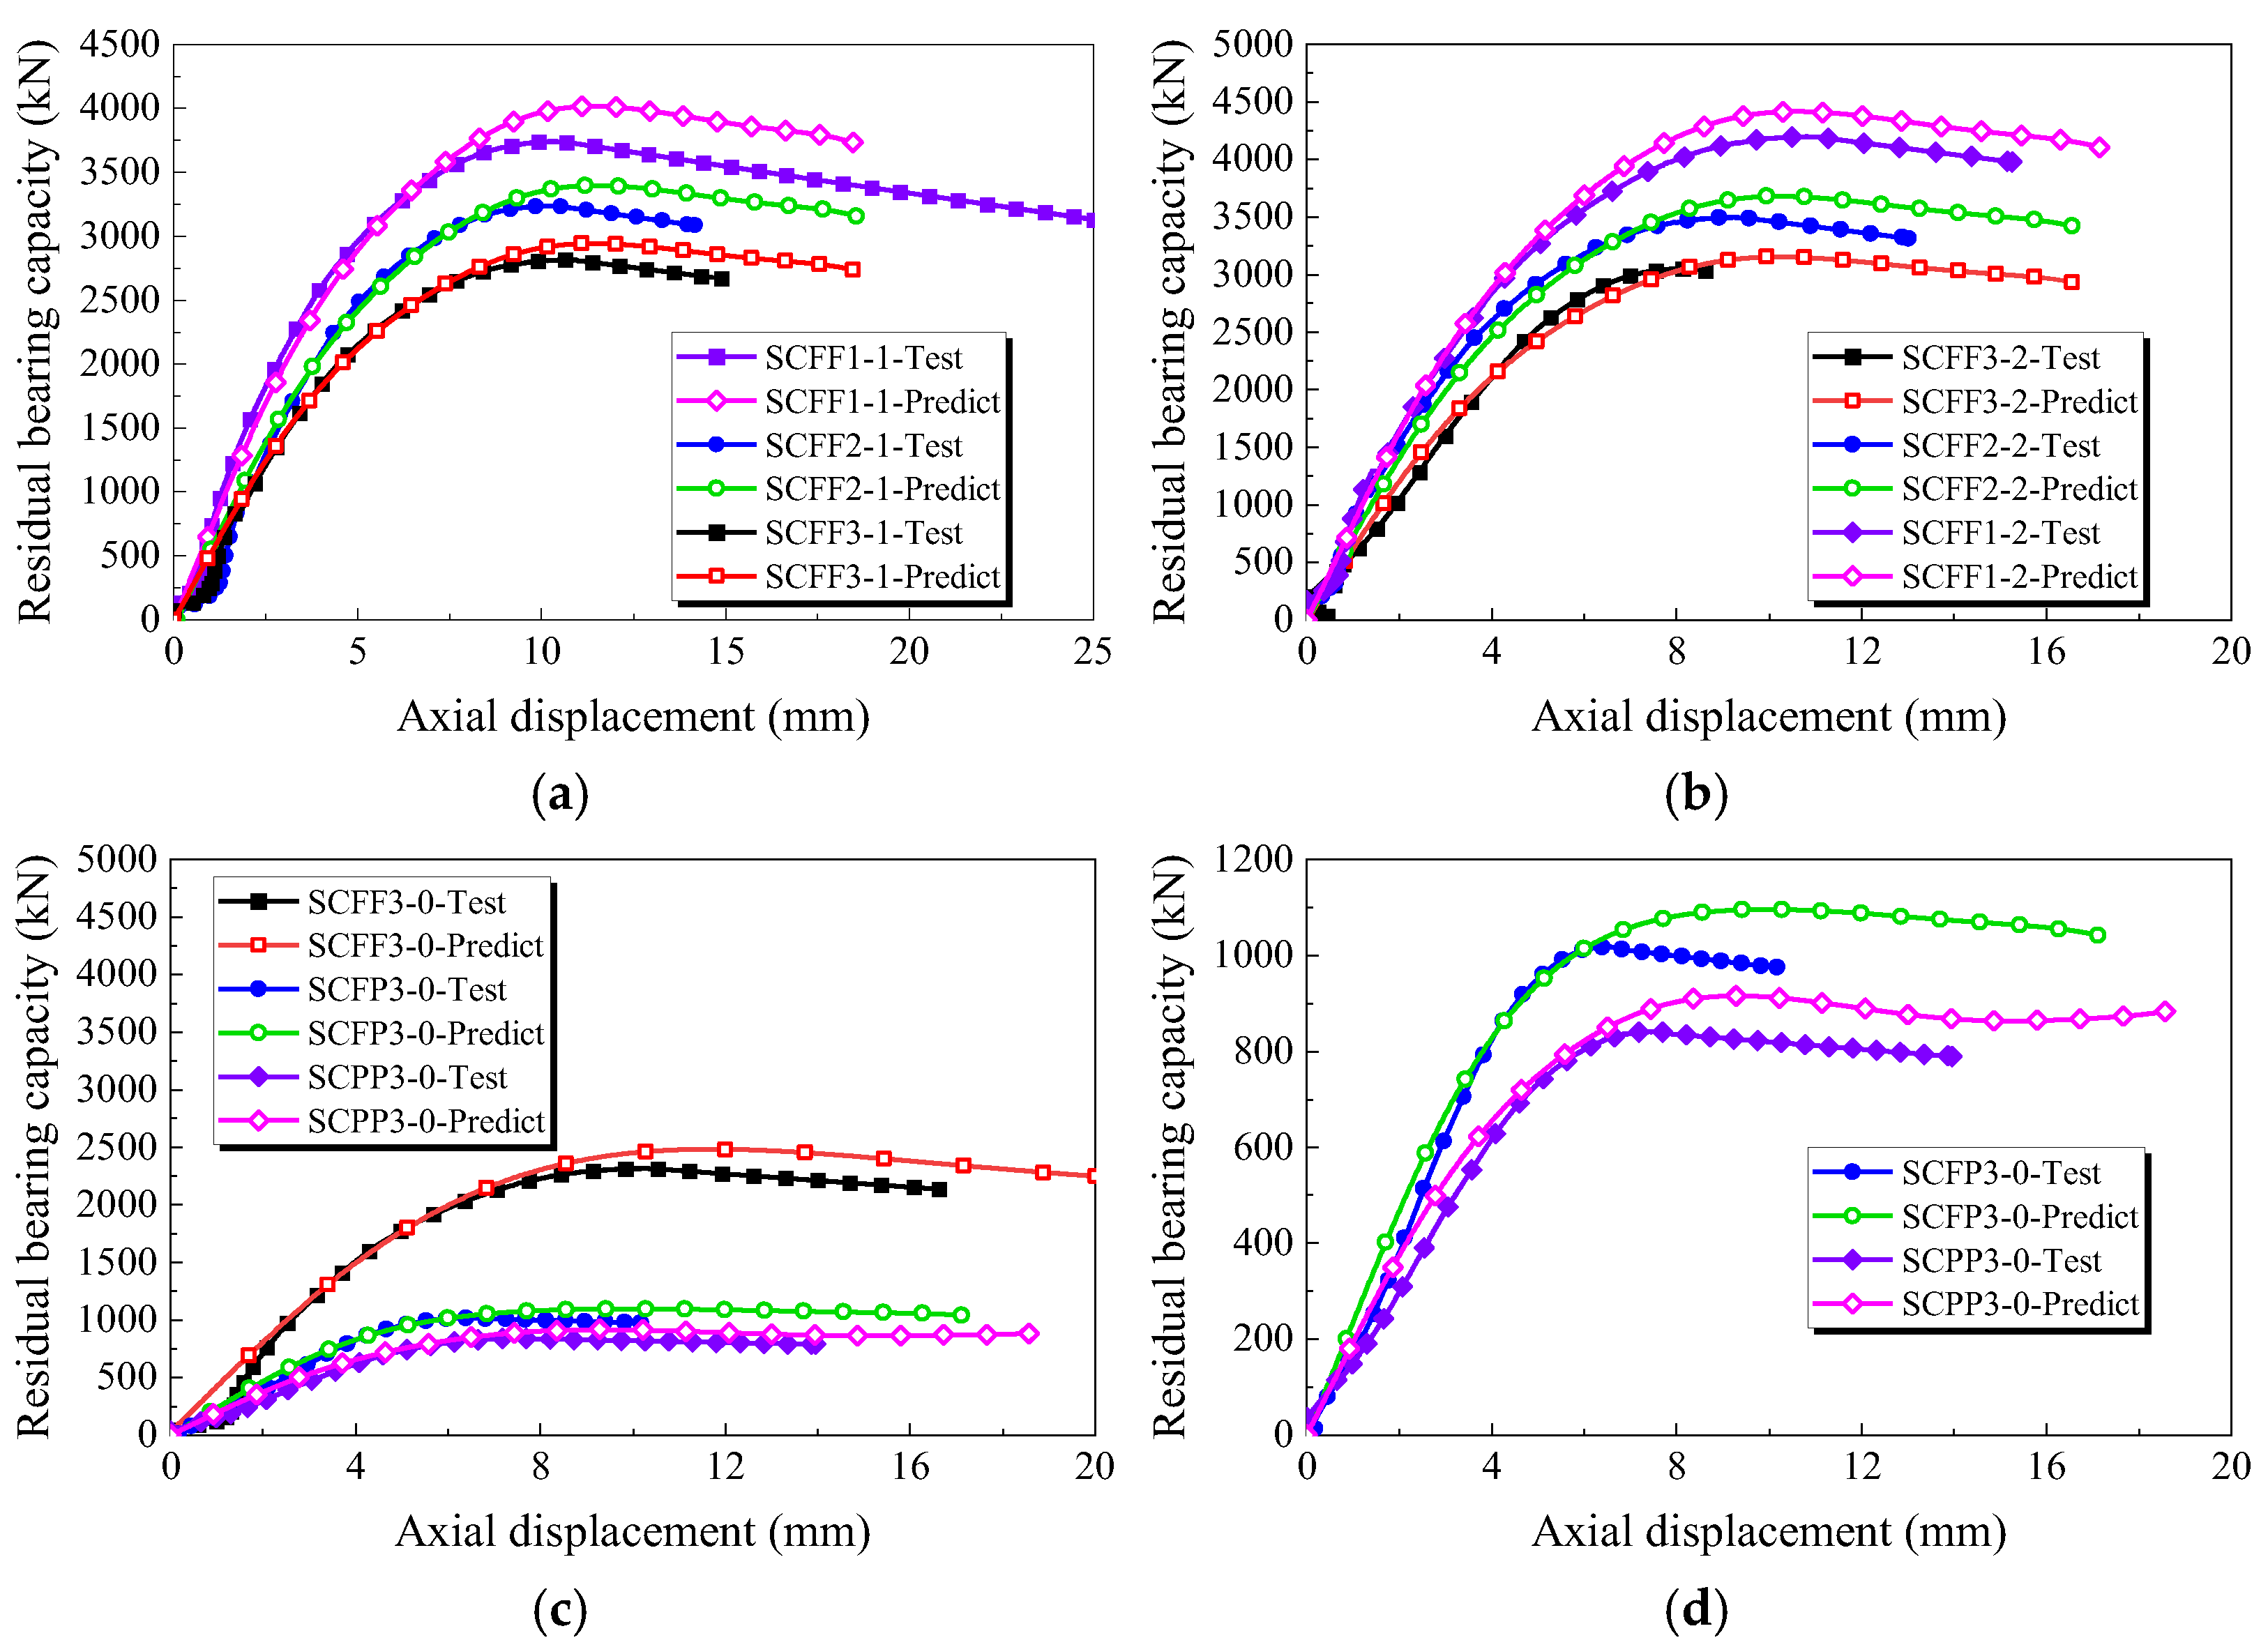
On the basis of the impact test and residual load capacity test, numerical simulations and comparative test analysis are carried out. The parameters and the comparison of test and numerical outcomes are listed in Table 2. The time history results are plotted in Figure 10; the force and displacement obtained from the simulation are consistent with the test values, and the Fstab and Δmax are in good agreement. As illustrated in Figure 11, the simulated residual axial resistance–displacement response matches the experimental data well. It can be seen that regardless of the lateral impact stage or the axial compression stage of the Nr, the results of simulation are in great accordance with the test results.
Table 2.
Test and simulation results.
Figure 10.
Comparison of the impact force and displacement.
Figure 11.
Comparison of residual axial resistance–displacement curves. (a) Residual axial resistance–displacement curves. (b) Residual axial resistance–displacement curves. (c) Residual axial resistance–displacement curves. (d) Residual axial resistance–displacement curves.
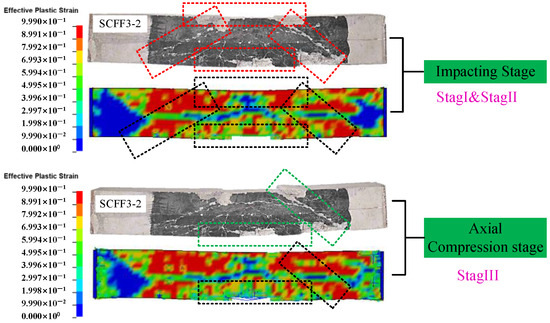
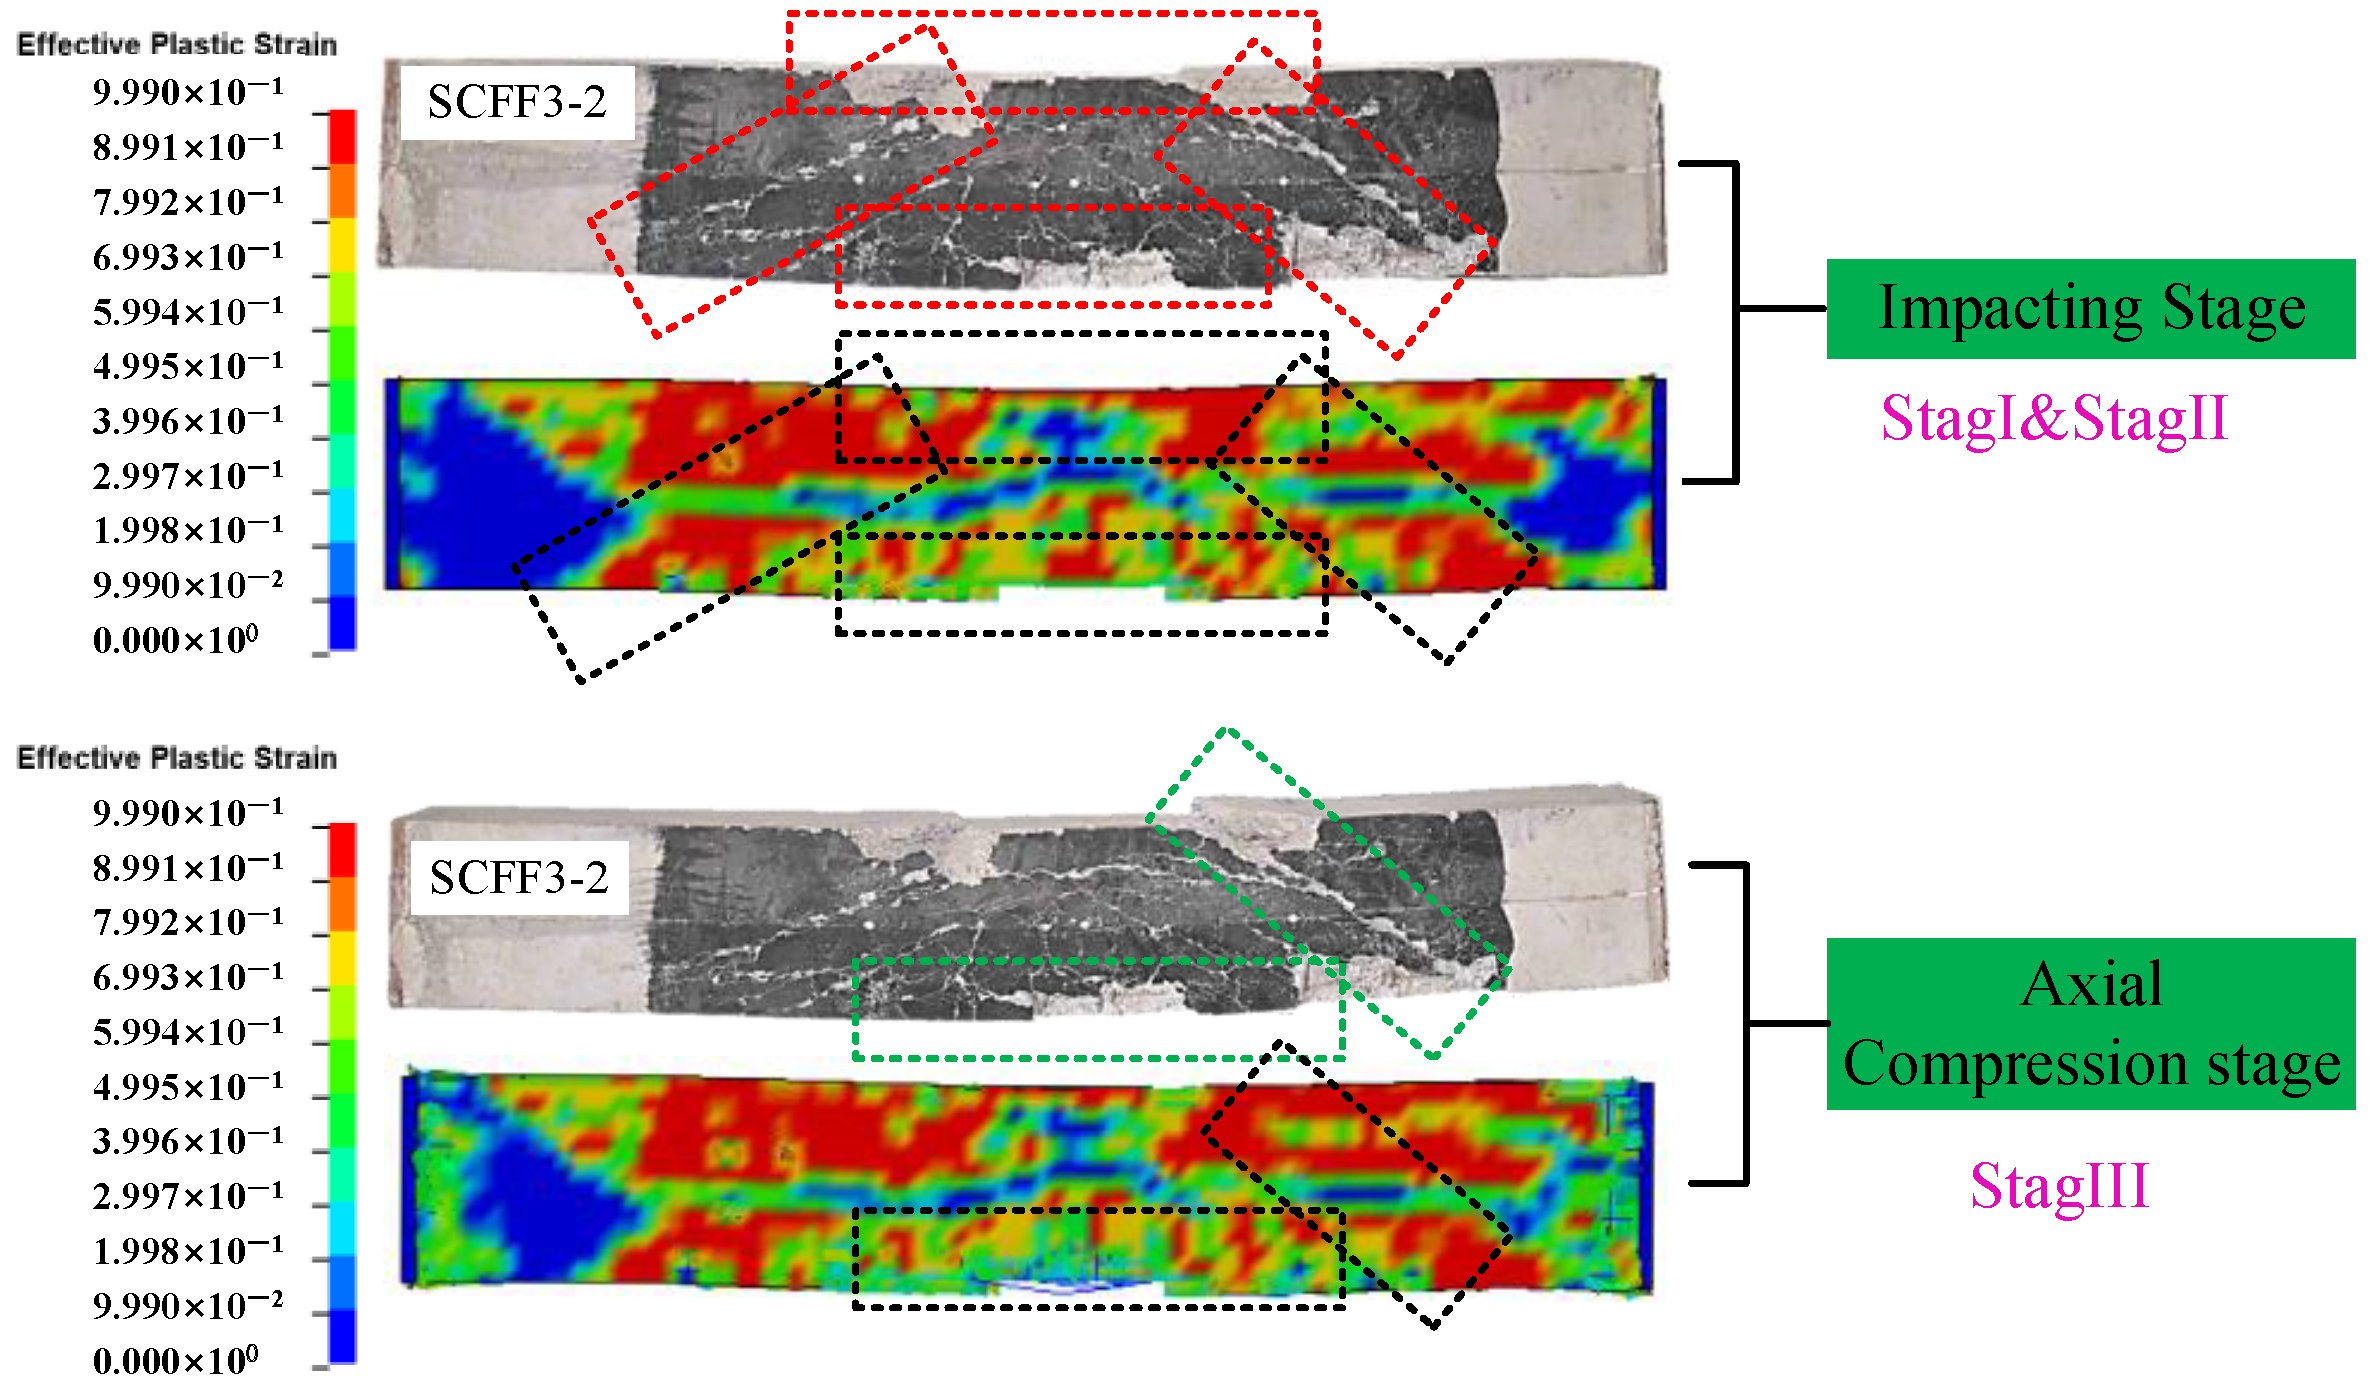
Figure 12 shows a visual comparison of the overall damage of the SCFF3-2 test and the finite element simulation, where the mid-span undergoes significant bending deformation under the impact load and concrete fragmentation occurs at the impact areas, and the simulated deformation pattern shows good consistency with the test results.
Figure 12.
Overall damage modal comparison of specimen SCFF3-2 test and finite element.
4.4. Comparison with UHPC-FHST
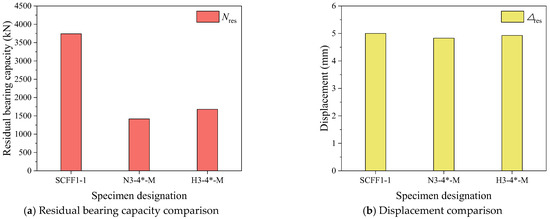
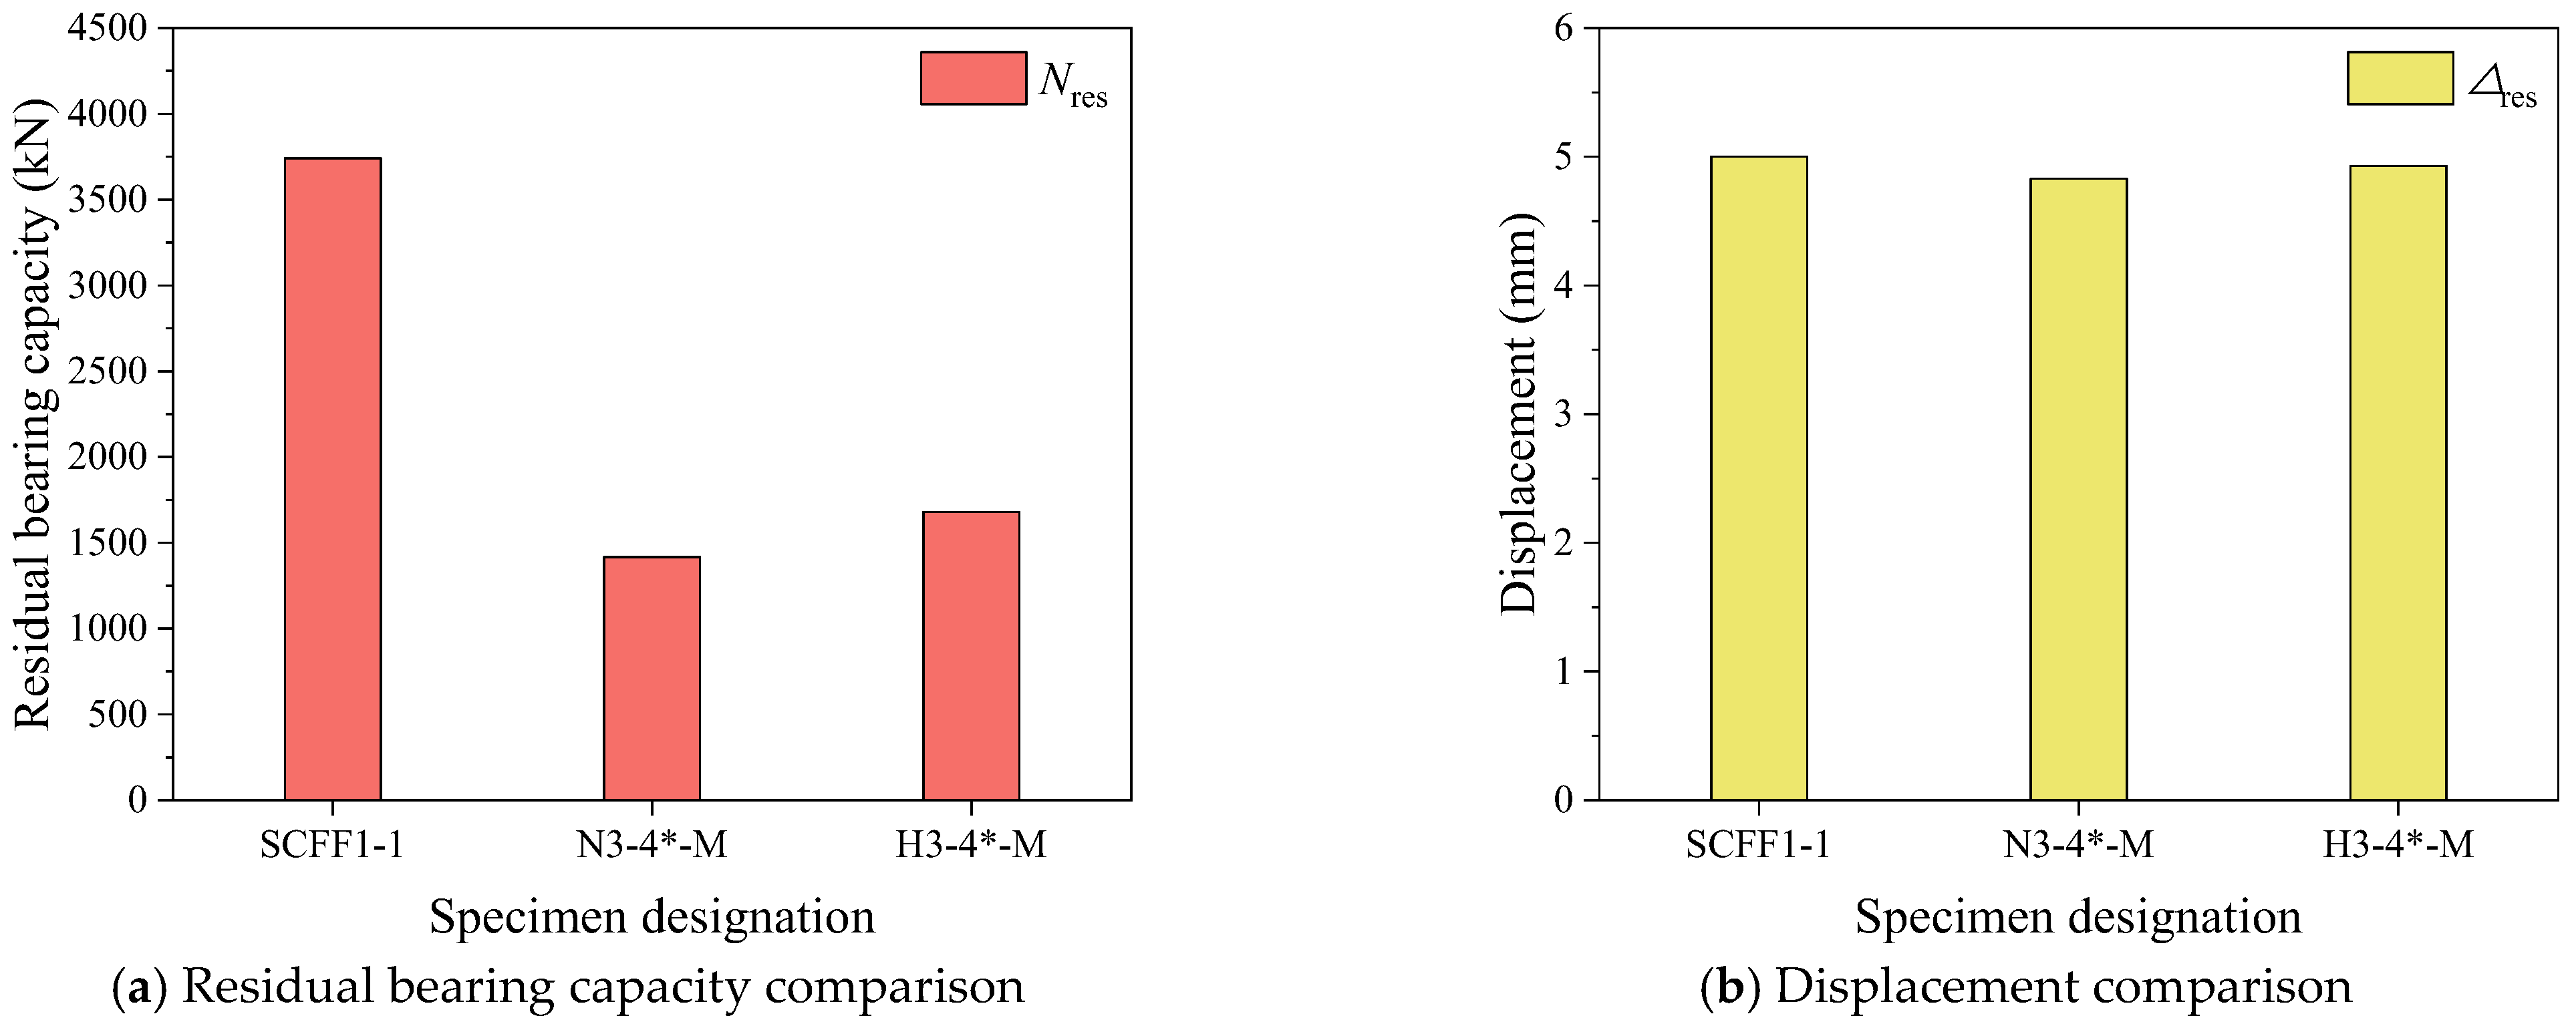
To further compare the residual bearing capacity performance of the CSRC columns investigated in this study, a comparative analysis is conducted between the CSRC columns and UHPC-FHST specimens reported in the literature [33] under the same impact energy conditions.
The UHPC-FHST specimens [33] have a cross-sectional dimension of 140 × 140 mm. The total specimen length is 1680 mm, with a clear span of 1200 mm and a steel tube thickness of 3 mm. The specimens are fabricated using two grades of steel, where “H” denotes high-strength steel Q690 and “N” denotes normal-strength steel Q355. All specimens are infilled with ultra-high-performance concrete (UHPC) with a compressive strength of 162.2 MPa. As shown in Figure 13, a comparison of the residual bearing capacity and displacement response between the CSRC columns and UHPC-FHST columns is presented. The results indicate that, under the same impact energy, the displacement responses of the CSRC columns are generally comparable to those of the UHPC-FHST columns, while the residual bearing capacities of the CSRC columns are increased by 62.1% and 55.09%, respectively. This demonstrates that, compared with UHPC-FHST columns, CSRC columns exhibit superior post-impact bearing capacity retention, indicating better impact resistance and load-carrying performance.
Figure 13.
Comparison between CSRC and UHPC-FHST.
5. Parametric Analysis
To evaluate the impact resistance and Nr of the structural columns. The FEM is developed, focusing on the effects of critical factors such as impact energy, axial compression ratio, material strength, sectional steel ratio, and impact location. Table 3 gives the Nr of CSRC columns after impact under different conditions. A parametric analysis is performed considering several factors: condition 1 presents the Nr of CSRC columns without impact; condition 2 investigates the Nr of CSRC columns at different impact energy (changes in impact velocity and impact mass); condition 3 examines the Nr of CSRC columns at different yield strength of steel; condition 4 analyzes the Nr of CSRC columns at different concrete strength; condition 5 shows the Nr of CSRC columns at different axial compression ratio; condition 6 compares columns with different sectional steel ratios; condition 7 investigates the effect of impact location on the Nr; condition 8 studies the Nr of CSRC columns with different slenderness ratios.
Table 3.
Residual axial load capacity after impact (under different conditions).
In this section, the impact velocities (v) are set to 0 m/s, 3.15 m/s, 5.42 m/s, 7.67 m/s and 9.39 m/s; the impact masses (m) are 500 kg, 1200 kg, 2000 kg, 3000 kg and 4000 kg; the axial compression ratios (n) are 10%, 30%, 40%, 50% and 70% of axial capacity; the compressive strength of concrete (c) are 30, 40, 50, 60, 70 and 80 in MPa; yield strength of cross steel (q) are 235, 345, 420, 500 and 600 in MPa, respectively; structural steel sectional ratios (α) are 6.42%, 7.24%, 8.46% and 9.24%, respectively; impact location (L) is 1/2 and 1/4 of the effective length; slenderness ratios (γ) are 4, 5, 6, 8, 10 and 12. The residual axial resistance coefficient (λ) is used to determine the degree of column damage, and the λ is defined as the ratio of the Nr of the damaged column to the ultimate axial resistance (Nu) of the undamaged column, i.e., λ = Nr/Nu.
In this study, the value of Nu is determined based on a finite element model that has been validated by experimental results. For each parametric case, the specimen was subjected to axial compression loading without impact until failure occurred, in order to obtain the corresponding Nu. Therefore, Nu is not a constant, but varies with changes in parameters such as slenderness ratio, material strength, and steel ratio. For instance, an increase in the slenderness ratio or a reduction in concrete strength leads to a decrease in Nu. Subsequently, by calculating λ using the value of Nu obtained for each parametric case, the results are normalized. This provides a unified evaluation metric for specimens with different configurations, enabling a more accurate assessment of the bearing capacity loss caused by impact damage.
5.1. Impact Energy (Ek)
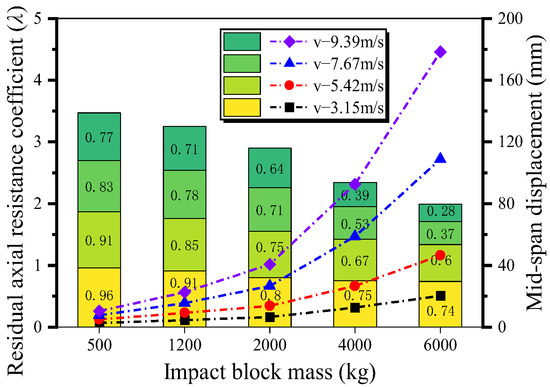
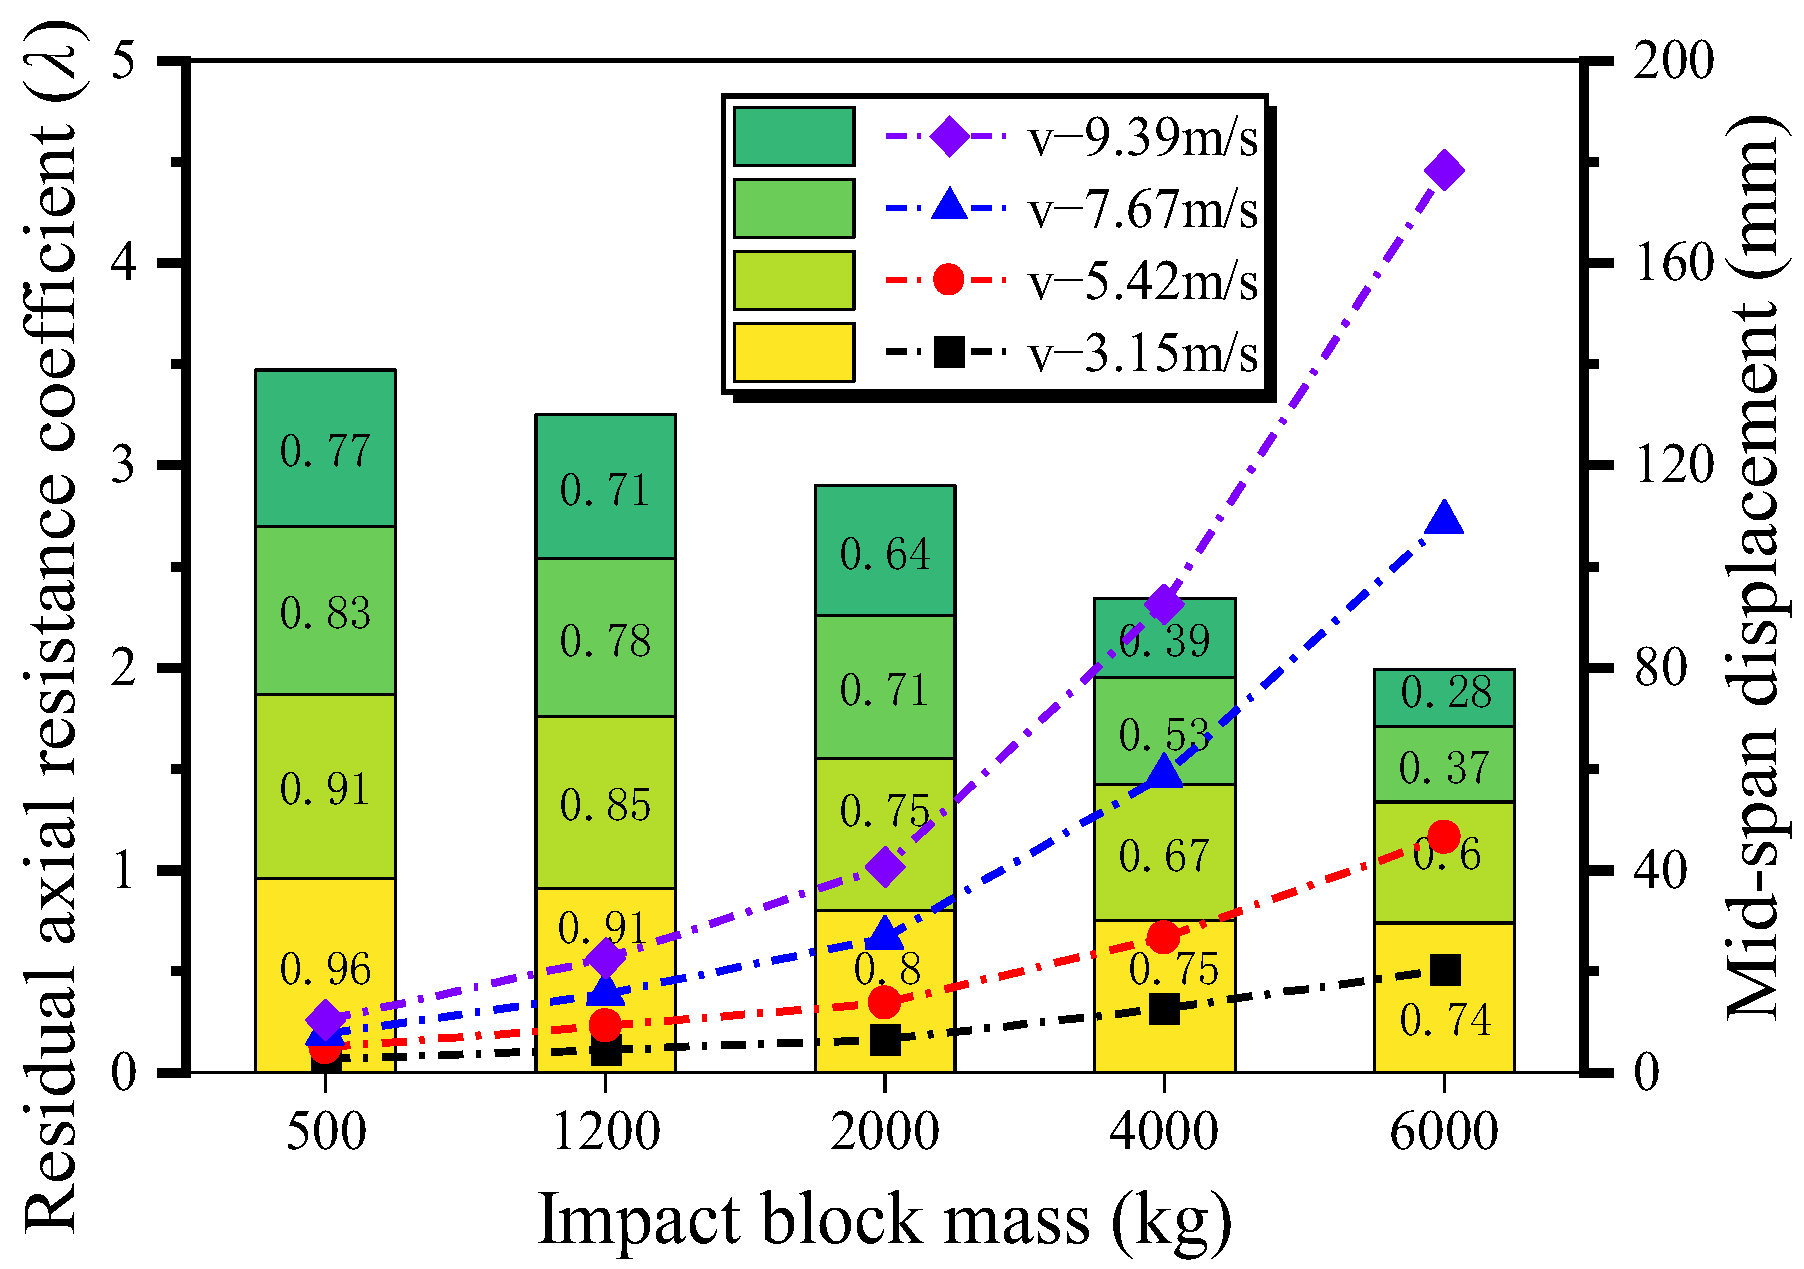
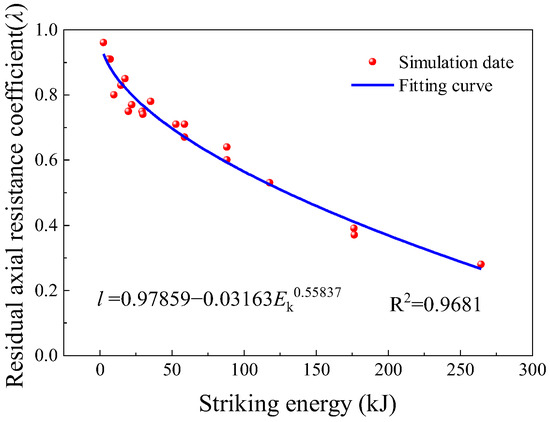
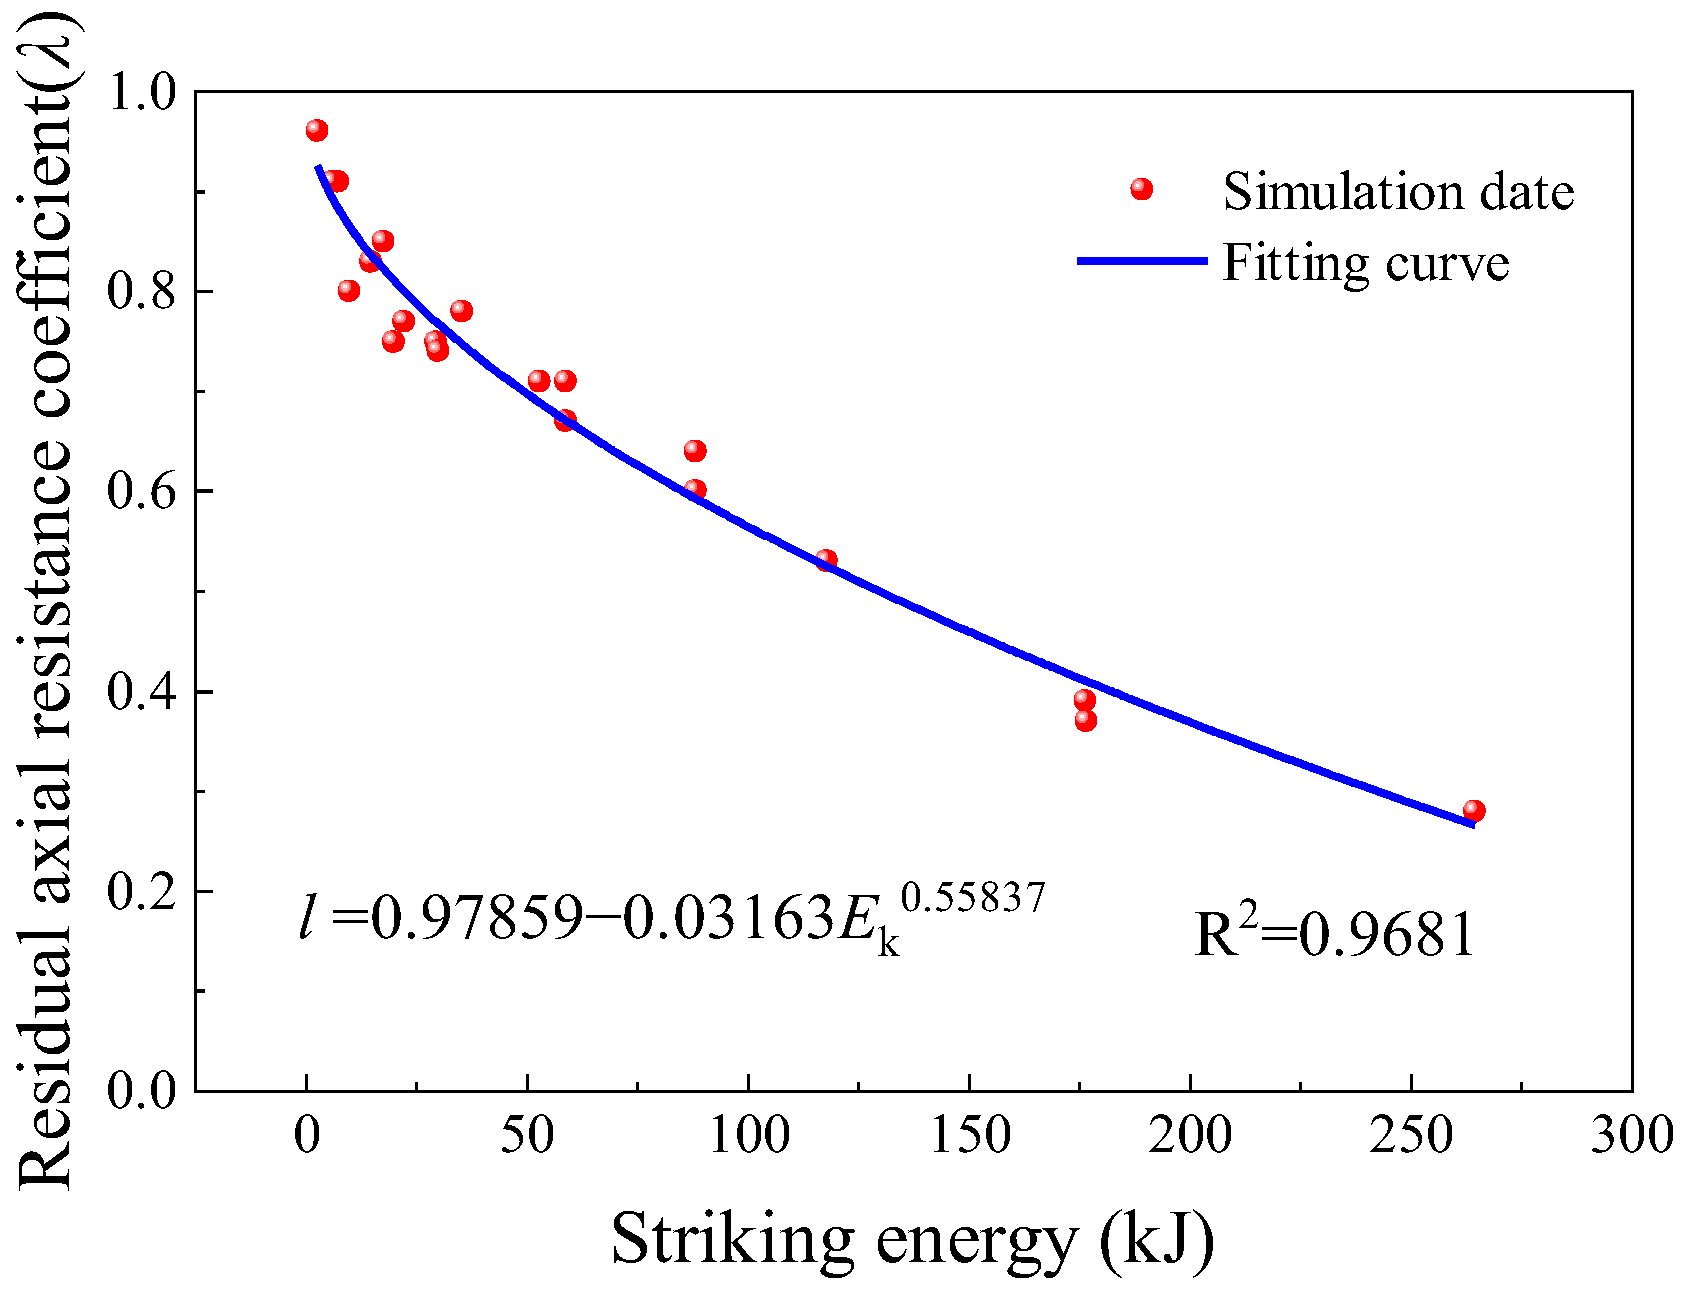
Figure 14 illustrates the effects of the impact energy Ek = 0.5 mv2, which is governed primarily by the impact mass and velocity. Under the same impact mass, increasing the impact velocity leads to a reduction in the Nr, and the λ, while the maximum lateral displacement of the CSRC column increases.
Figure 14.
Effect of different impact mass and impact velocity on the λ of CSRC columns.
When the impact mass is small (500~2000 kg), the λ of the column is larger, and the λ ranges from 0.6 to 1.0; when the impact velocity is the same, the Δmax of CSRC column increases with the increase in impact mass, and the λ decreases gradually as the impact mass increases, but when the impact velocity is larger (9.39 m/s), the λ of the column decreases very obviously, indicating that the impact mass and impact velocity have a greater influence on the λ of the CSRC column. Therefore, the Ek is applied to consider the effect of the two factors, and the relation between the Ek and the λ is fitted as
Figure 15.
Fitting curve.
5.2. Structural Steel Sectional Area Ratio (α)
The embedded structural steel of CSRC column has a significant effect on its structural performance [43,44,45,46]. The cross-section area ratio of steel to concrete (Equation (3)) is frequently used for estimating the characteristics of CSRC columns or structural columns in terms of seismic performance; thus, they are used in this study.
In Equation (3), As is the cross-sectional area of embedded structural steel, and Ac is the cross-sectional area of concrete.
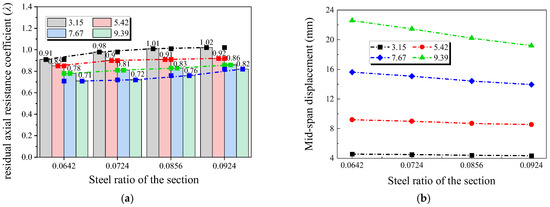
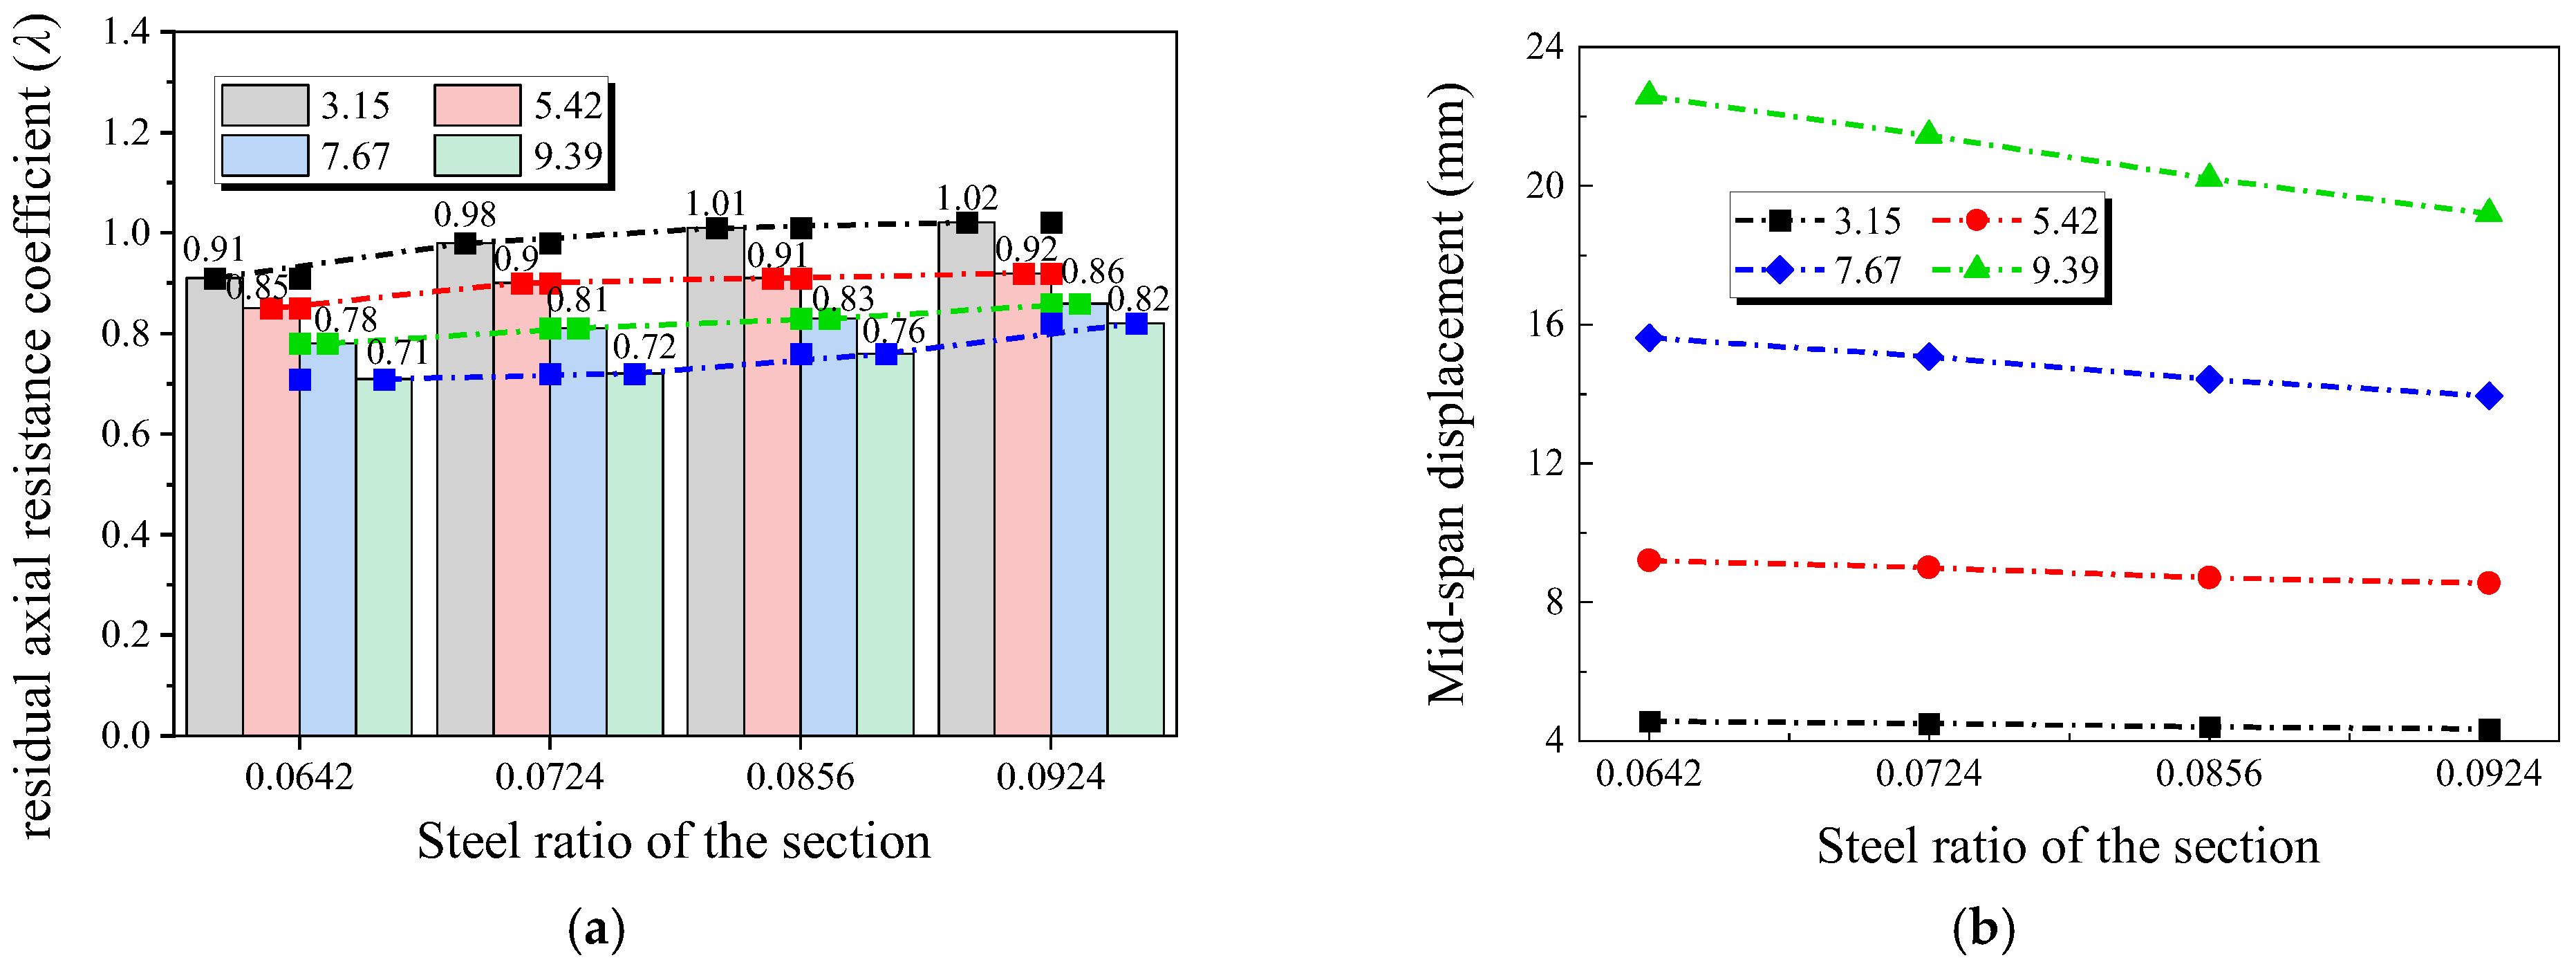
In this paper, the Nr of CSRC columns with embedded structural steel ratio ranges from 4% to 10%. The effects of different structural steel ratios on the Nr and maximum mid-span displacement (Δmax) of CSRC columns are shown in Figure 16. Figure 16a shows the effect of structural steel content on the residual axial resistance coefficient (λ), and Figure 16b shows the effect of structural steel content on the mid-span displacement. Increasing the steel content can improve the Nr and λ of the column and reduce the Δmax. For example, when the impact velocity is 9.39 m/s and the steel ratio increases from 6.42% to 9.24%, the Nr of the specimen increases by 16.25% and the Δmax decreases by 17.67%. The impact resistance of the specimen is significantly improved when the steel ratio is increased.
Figure 16.
Effect of different sectional steel ratios on the λ and mid-span displacement of CSRC columns. (a) Effect of sectional steel ratios on the λ. (b) Effect of sectional steel ratios on the mid-span displacement.
5.3. Material Strength
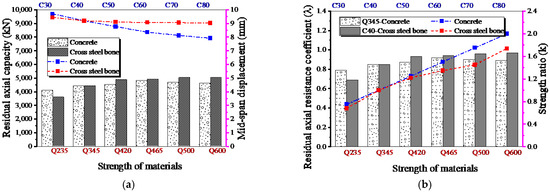
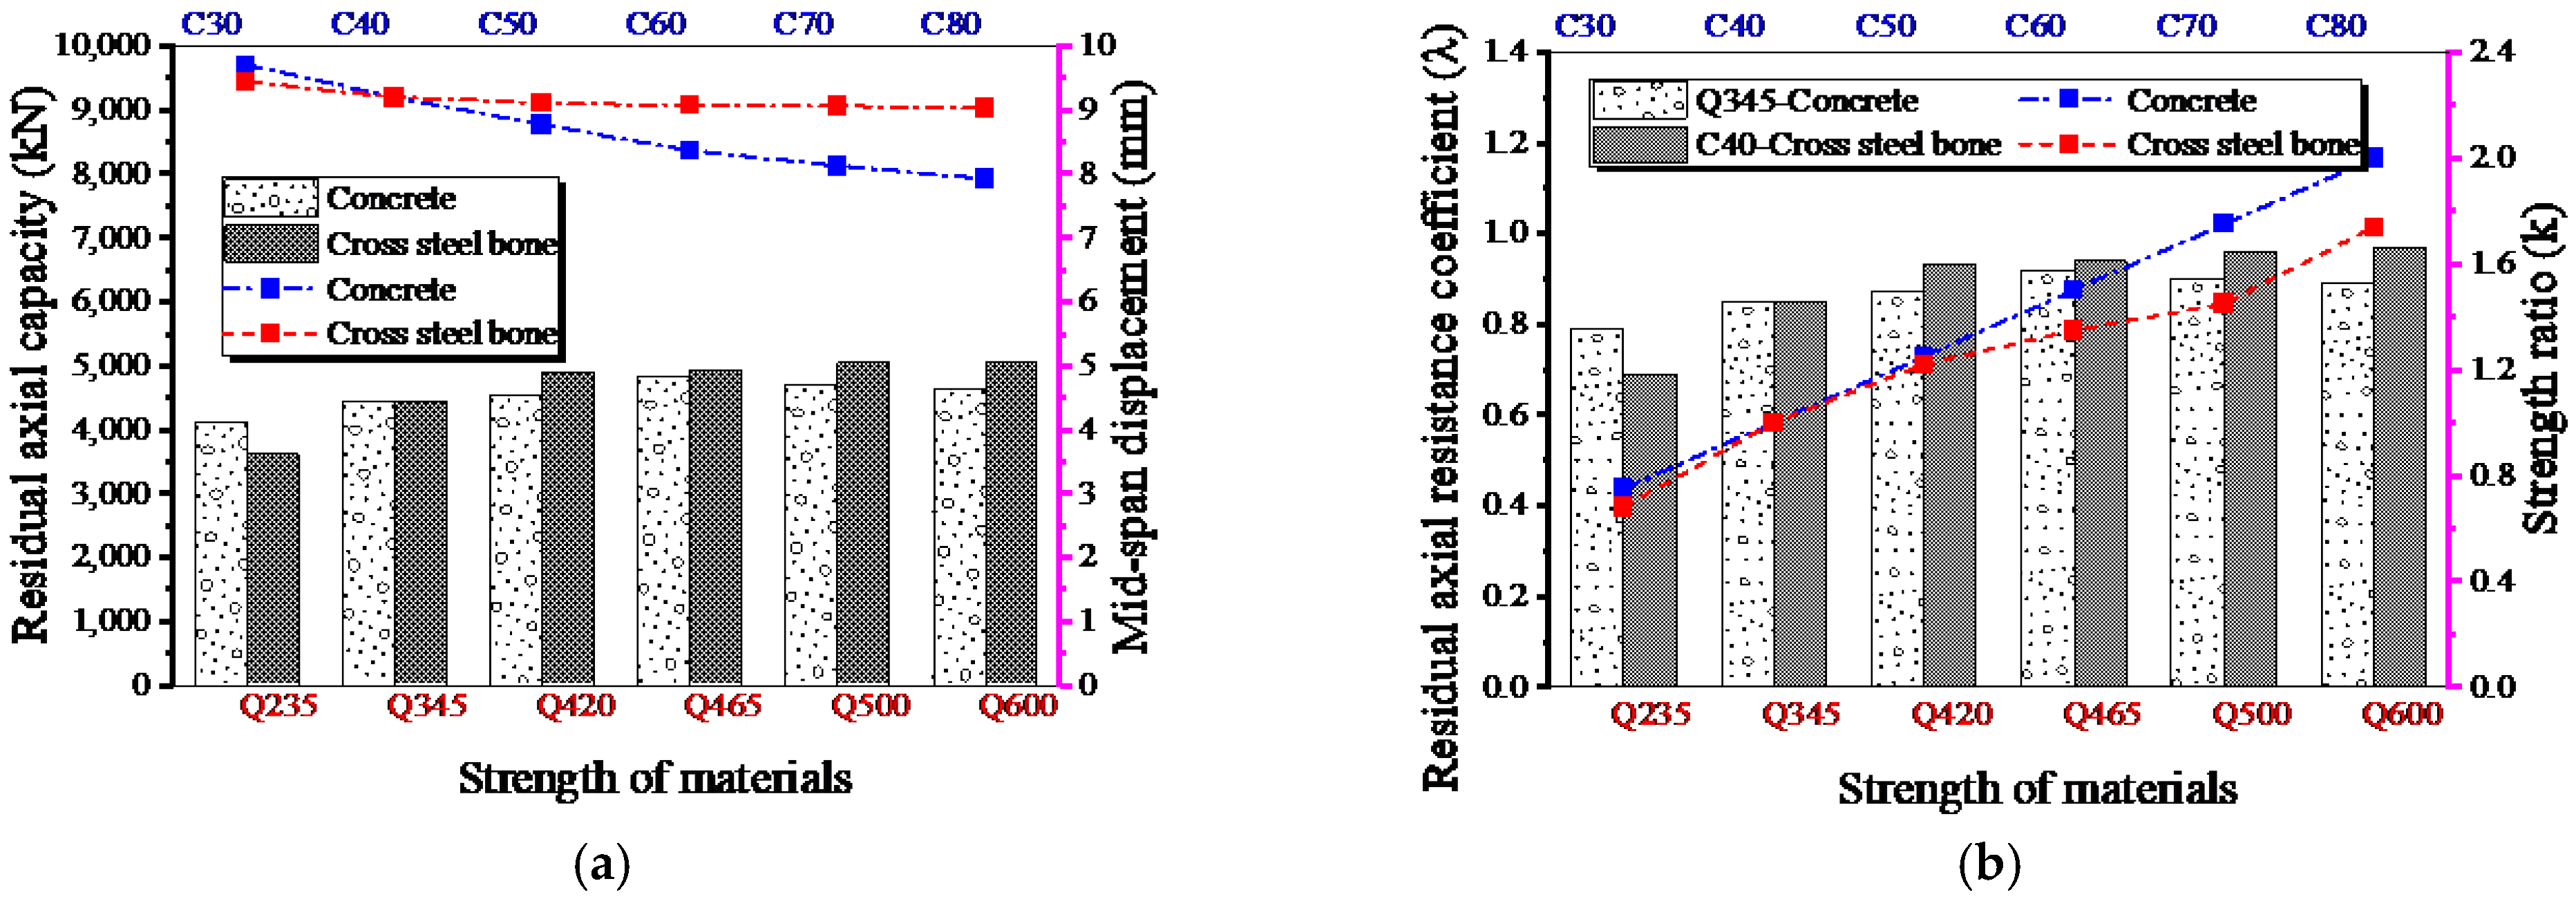
Figure 17 represents the effect of different concrete strengths and steel strengths on the Nr, the λ and Δmax of CSRC columns. In Figure 17, C40-Cross steel bone indicates that the concrete strength is C40 and so the yield strength of steel is changed to study the corresponding residual axial resistance of CSRC column at the same impact energy; Q345-concrete represents that the strength of cross steel bone is Q345 and so the compressive strength of concrete is changed to study the corresponding Nr of CSRC column at the same impact energy. The right axis of Figure 17b shows the strength ratios, which indicates the ratio of the varying material strength versus the material strength used in the standard model of the CSRC column, where the steel material strength ratio is the ratio of the yield strength of steel versus the yield strength of Q345 steel at different strengths, and the concrete strength ratio refers to the ratio of the actual axial compressive strength to the standard strength of C40 concrete.
Figure 17.
Effect of different material strengths on the Nr (or λ) and mid-span displacement of CSRC columns. (a) Effect of material strengths on Nr and mid-span displacement. (b) Effect of material strengths on λ and strength ratios.
As illustrated in Figure 17, increasing the yield strength of the cross-shaped steel leads to a notable rise in Nr and λ, while Δmax decreases. This occurs because higher steel strength enhances the flexural capacity of the specimen, thereby improving impact resistance and elevating Nr. With the increase in concrete strength ratio, the Nr increases first and then decreases. This is because higher concrete strength can increase the local stiffness at the impact zone and enhance the flexural and shear capacities of the specimen. Secondly, as the strength of concrete becomes greater and greater, the ductility becomes worse, and the plastic deformation becomes correspondingly worse, which will lead to brittle damage for impact-damaged specimens. Therefore, increasing the reinforcement content enhances the ductility of the specimen.
5.4. Axial Compression Ratio (n)
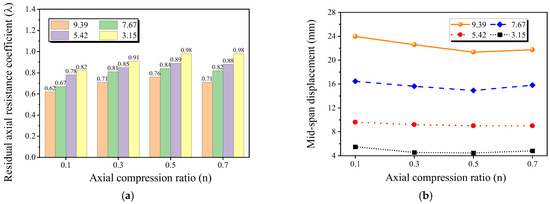
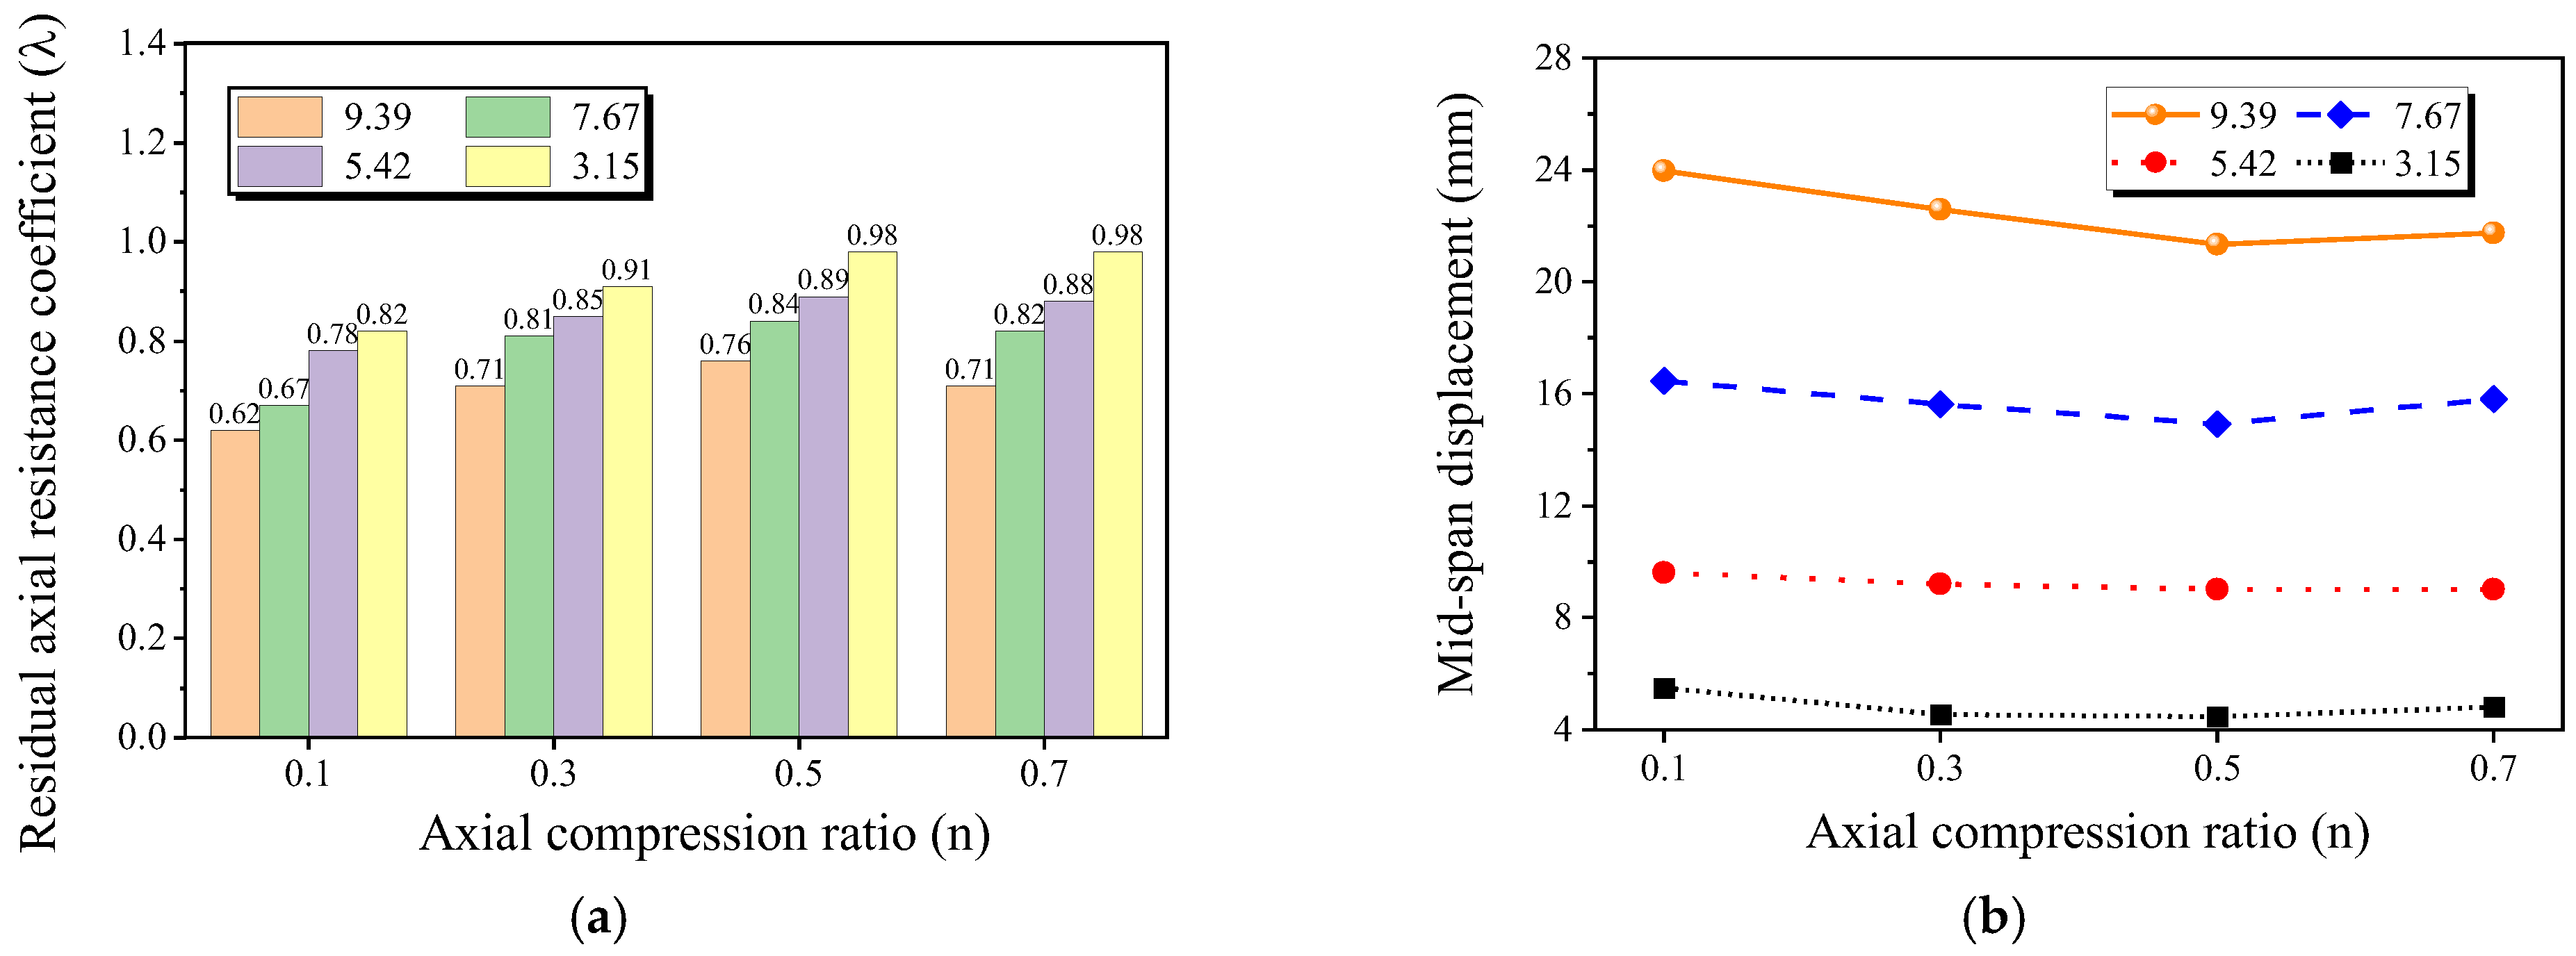
Figure 18 shows the effects of different axial compression ratios on the λ and Δmax of CSRC columns. As the axial compression ratio increases, the Nr increases and then decreases, while the Δmax decreases and then increases. This occurs because a small axial compression ratio enhances the flexural load-carrying capacity of the specimen, whereas a high axial compression ratio induces compression-related damage, reducing flexural resistance and ultimately lowering Nr. For instance, within the parameter range of this study, when the impact velocity was 5.42 m/s, increasing the n from 0.1 to 0.3 resulted in a 9.1% increase in Nr, and further increasing it from 0.3 to 0.5 led to a 4.8% increase. However, when the n increased from 0.5 to 0.7, Nr decreased by 0.9%.
Figure 18.
Effect of different axial compression ratios on the λ and mid-span displacement of CSRC columns. (a) Effect of axial compression ratios on the λ. (b) Effect of axial compression ratios on the mid-span displacement.
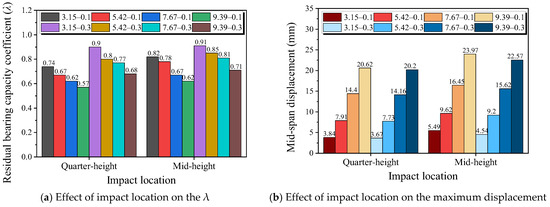
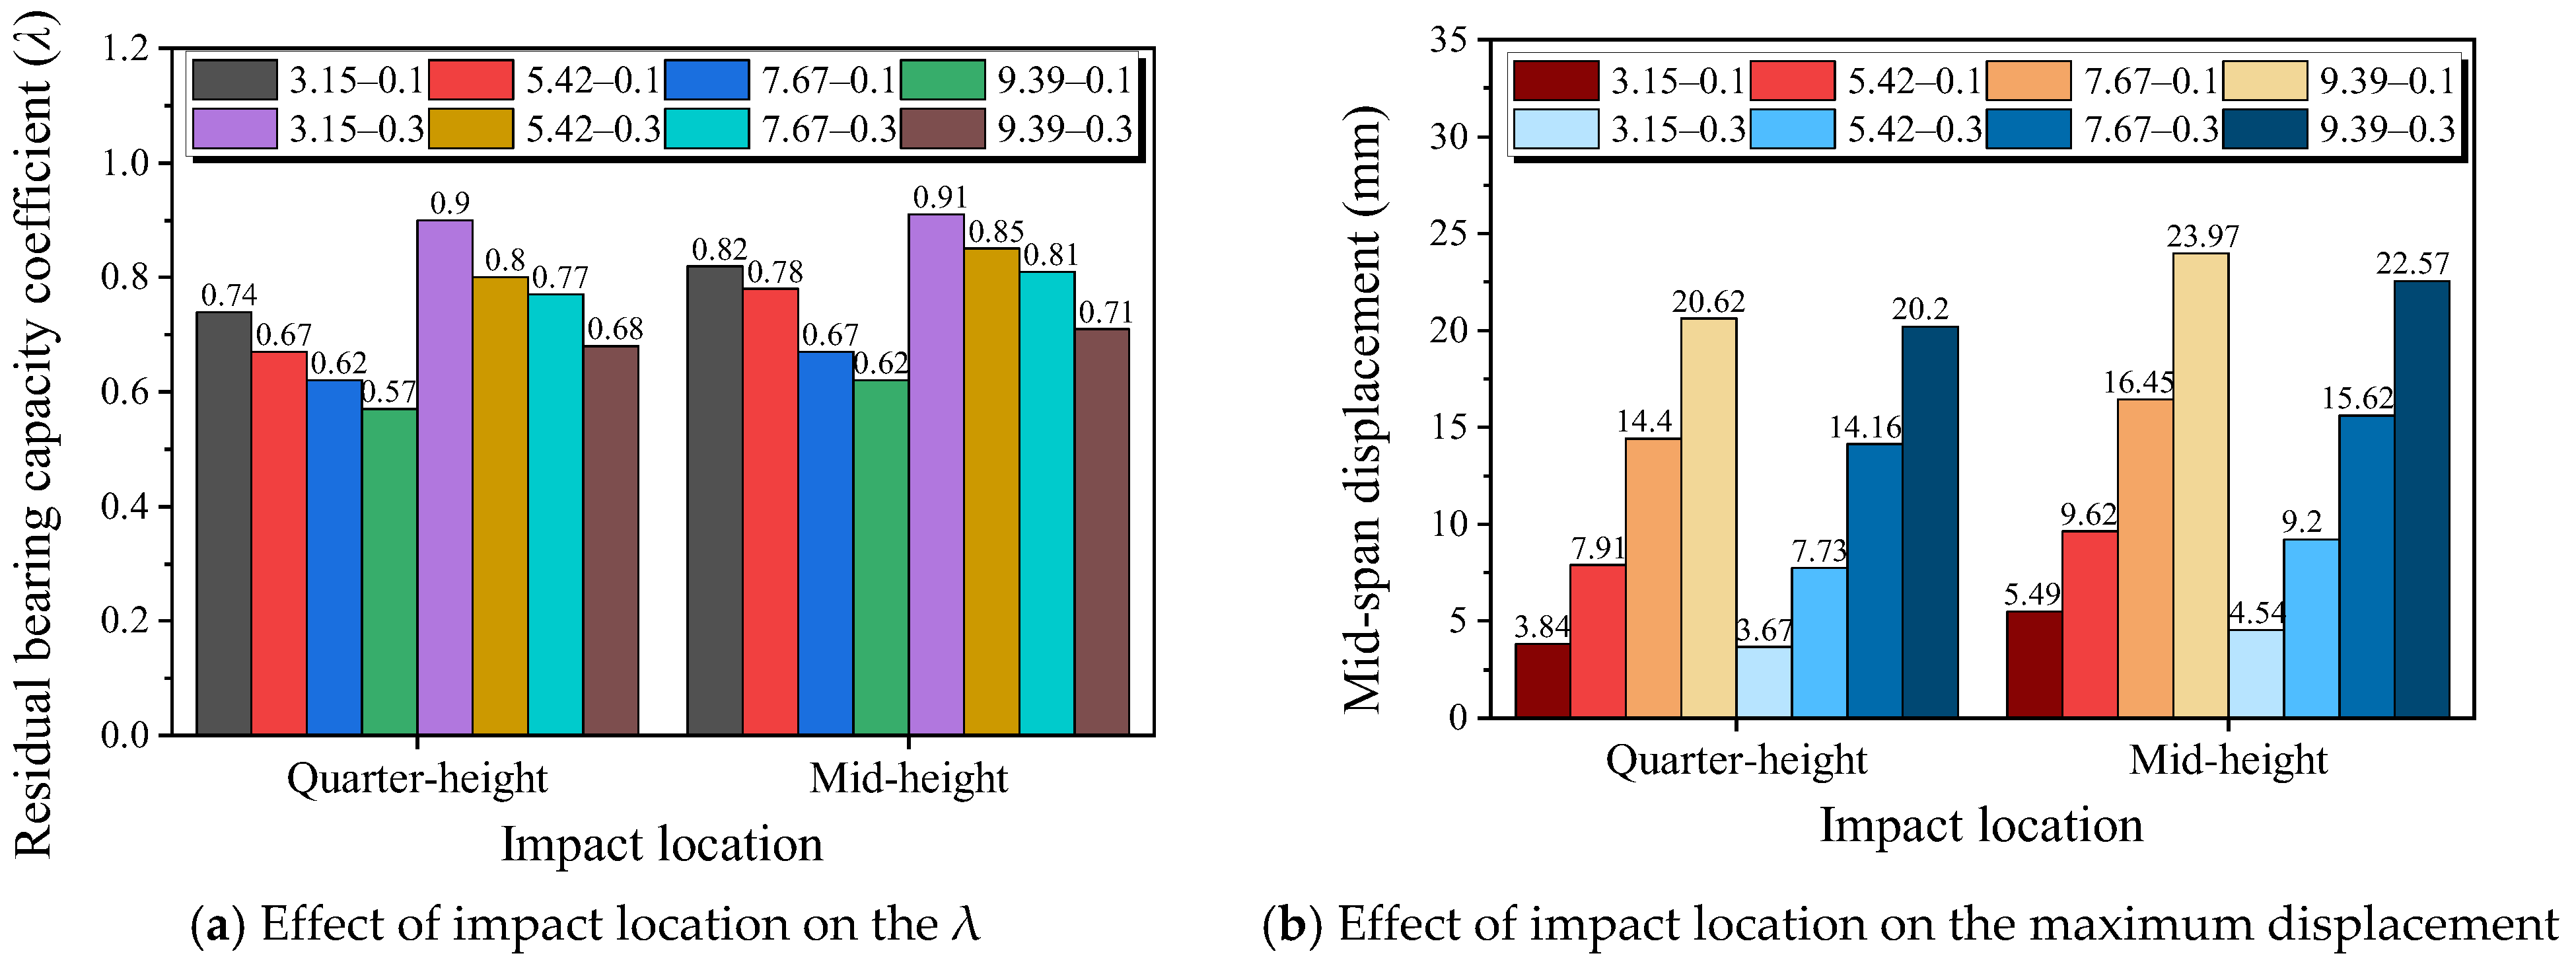
5.5. Impact Location
The impact location has a significant influence on the Nr of the specimen. The effects on the residual axial resistance coefficient (λ) and maximum displacement of CSRC columns at mid-height and quarter-height were investigated, as shown in Figure 19, which illustrates the responses under impacts applied at the two positions. Both Nr and the maximum displacement decrease when the impact location shifts from mid-height to quarter-height. This is mainly because for these columns, the plastic damage is concentrated near the quarter point (plastic hinge) which overlaps with the impact location. In addition, when impact location is moved from mid-span to quarter point, the flexural failure gradually shifts to a combined response including shear damage. The axial compression is easy to aggravate the damage degree of the specimen, which makes the Nr and the λ decrease.
Figure 19.
The λ and maximum displacement of CSRC columns under impact of mid-height and quarter-height.
5.6. Slenderness Ratio (γ)
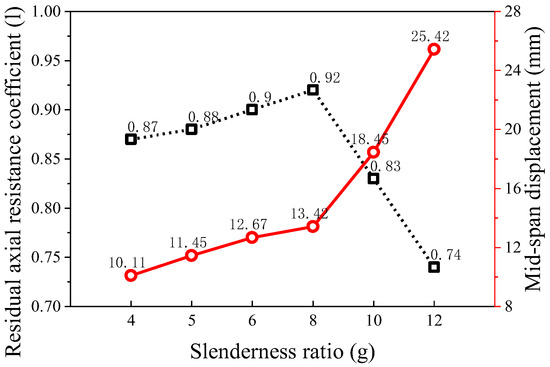
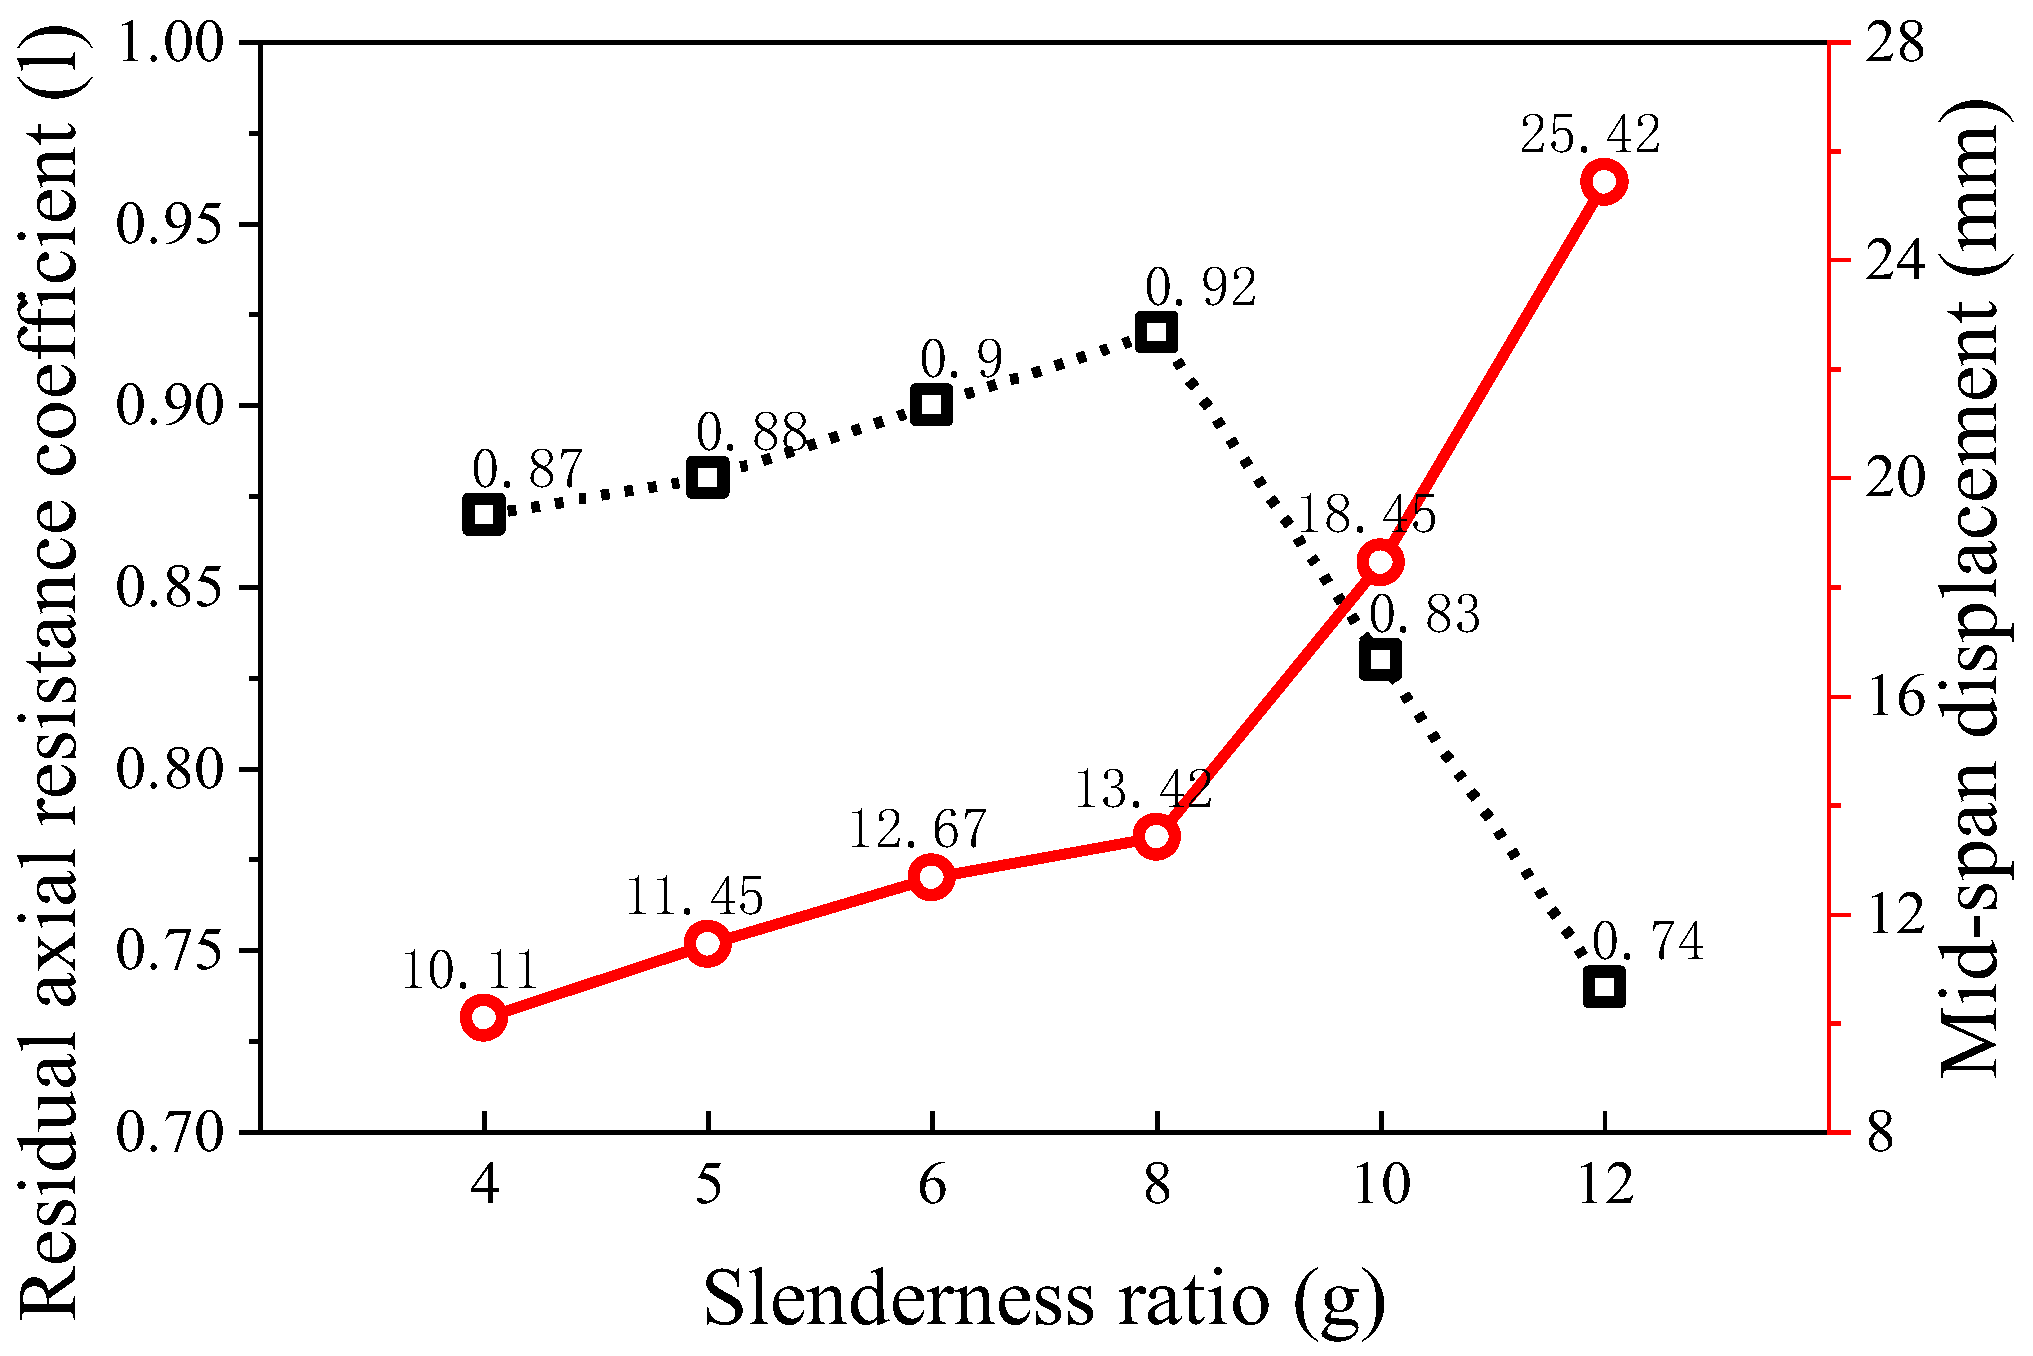
Figure 20 shows the effects of different slenderness ratios (γ) on the residual axial resistance coefficient (λ) and maximum mid-span displacement (Δmax) of CSRC columns. In the range studied in this paper, as the slenderness ratio (γ is 4~8) increases, the Δmax increases, while the residual axial resistance (Nr) increases and the λ increases; as the slenderness ratio (γ is 8~12) increases, the Δmax increases, while the Nr decreases and the λ decreases. The results show that the variation in the γ in a small range can enhance the Nr of the column, and the variation in the γ in a larger range makes the column destabilized and damaged. For example, the Nr of the corresponding CSRC columns are 4556.2 kN, 4605.3 kN, 4725.5 kN, 4785.6 kN, 4352.6 kN and 3856.4 kN when the slenderness ratios (γ = l0/b) are taken as 4, 5, 6, 8, 10 and 12, respectively.
Figure 20.
The λ and Δmax of CSRC column with different γ.
5.7. Prediction of Residual Axial Resistance
The residual axial resistance coefficient is related to the impact energy, material strength, impact position and axial compression ratio. Considering the impact energy (Ek), axial compression ratio (n), concrete compressive strength (c), yield strength of cross steel (q), structural steel section area ratio (α), impact position from support length (L) and slenderness ratio (γ), using multiple linear regression analysis, the fitting formula of calculated residual axial resistance coefficient (λf) and each influencing parameter is obtained:
In Equation (4), the unit of Ek is kJ, the unit of material strength is MPa, the unit of L is mm, and the n, α and γ are dimensionless.
Nr of CSRC columns can be expressed as
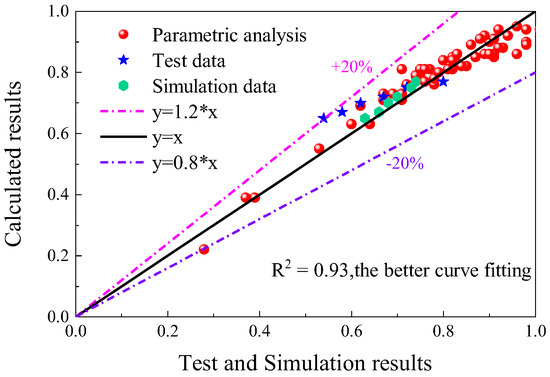
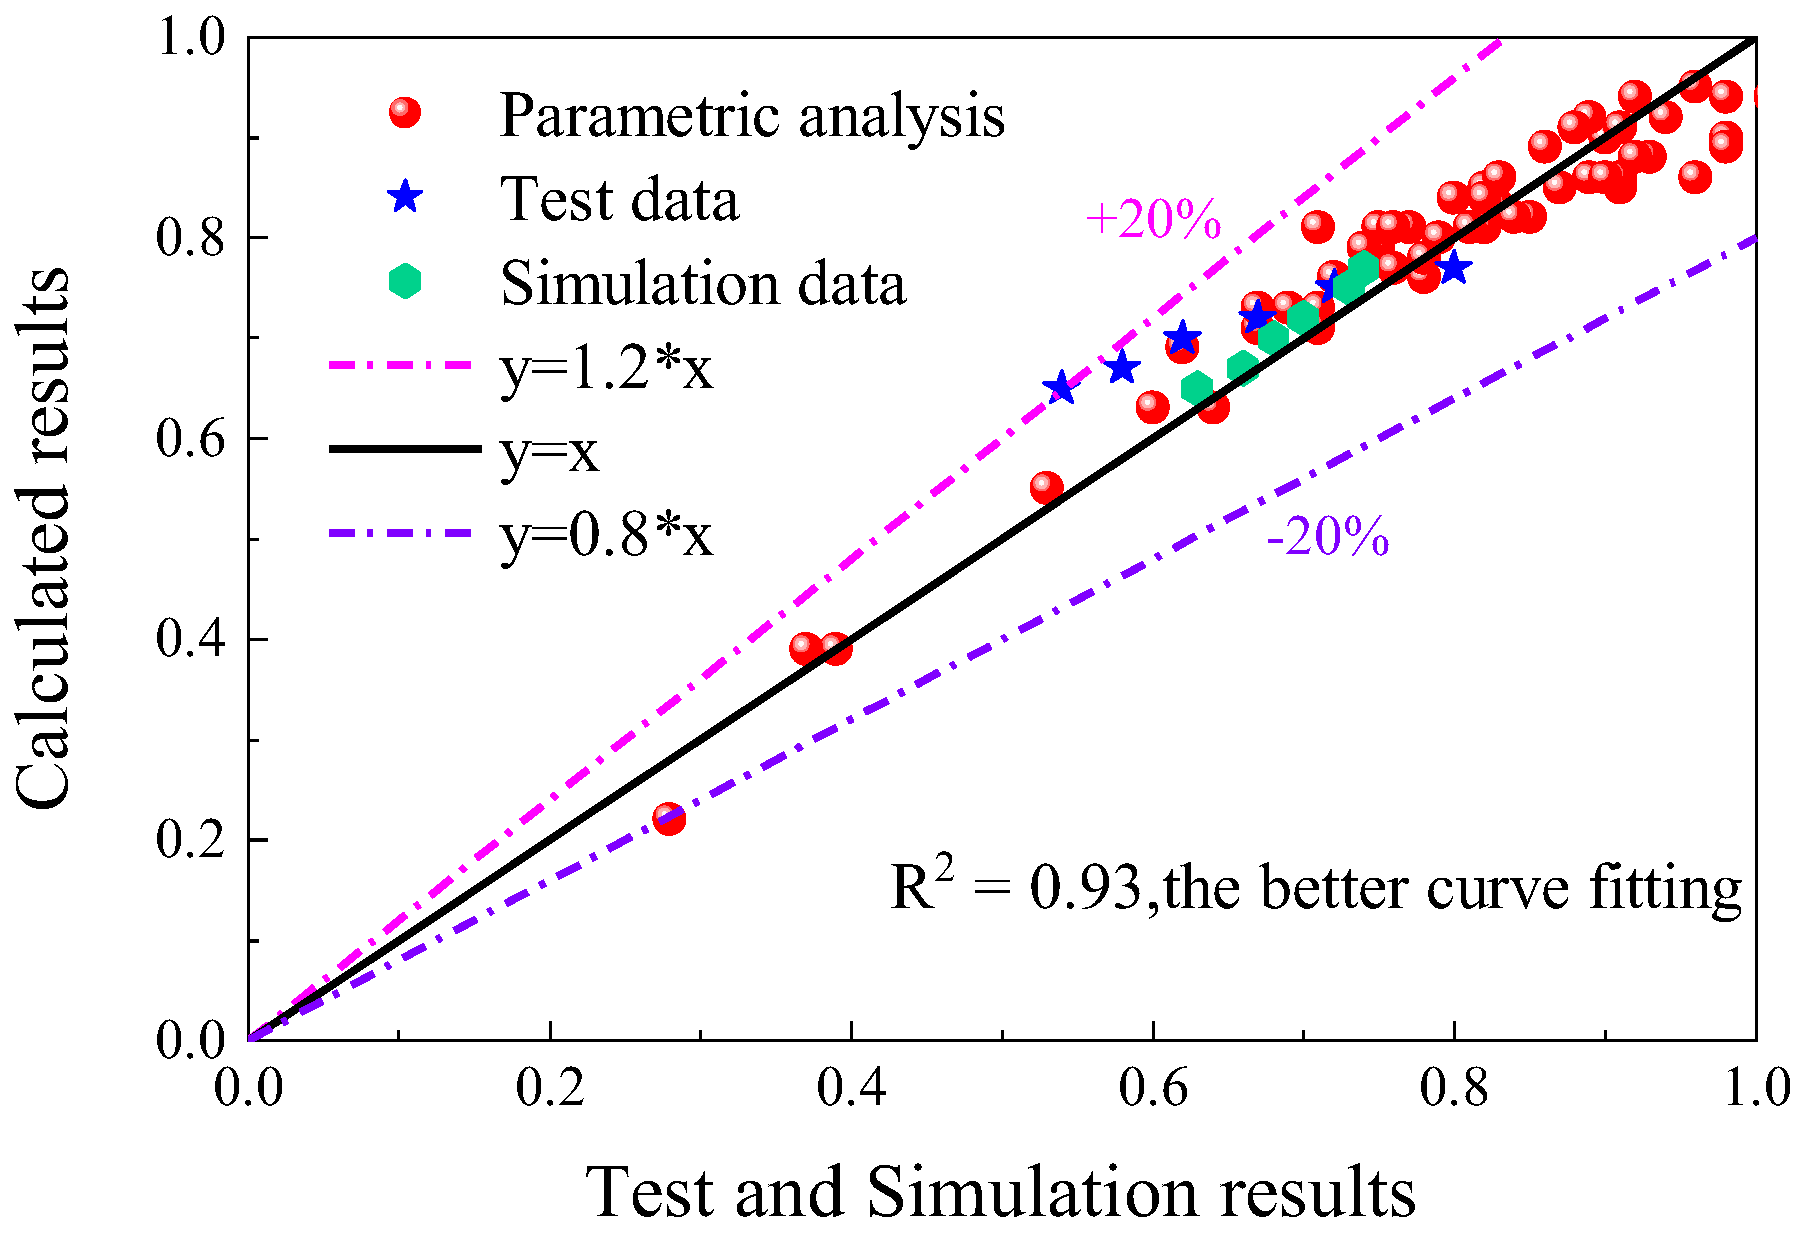
In order to verify the accuracy of the proposed residual axial resistance coefficient (λf), the λf by the fitting formula is compared with the λ obtained from the test results as well as the λ obtained from the finite element simulation data. The results are shown in Figure 21. The horizontal coordinates in Figure 21 are the values of the λ from the test and numerical simulation, and the vertical coordinates are the values calculated by the fitting formula. The data points in the figure include the calculated values of the fitted formula, the experimental values and the finite element simulation values. The reliability of Equation (5) is further validated by the comparison shown in Figure 21. The coefficient of determination R2 is 0.93, and the mean squared error is minimized, indicating that the regression model captures the underlying relationship between the impact parameters and the residual resistance effectively. As depicted in Figure 21, the majority of the data points lie within the ±20% error bounds, which can be used for reference in practical engineering applications.
Figure 21.
Comparison of the fitted and simulated values.
6. Damage Assessment
6.1. Damage Assessment Criteria
In order to more intuitively reflect and evaluate the degree of damage of CSRC columns after impact and provide a more convenient evaluation method for practical engineering, in this paper, the vertical axial resistance of CSRC column is used to evaluate the damage level of the structural column under the impact load. The damage level evaluation index (Ddag) is defined as shown in Equation (6).
M1 and M2 represent the bearing capacities of the column after impact and without impact, respectively (in kN). Specifically, M1 is determined from post-impact finite element analyses or residual bearing capacity tests by extracting the peak lateral load sustained by the column. Similarly, M2 is obtained from the corresponding non-impact finite element model.
6.2. Damage Assessment Level
According to the calculation results of damage level evaluation index (Ddag), the damage levels of CSRC columns after lateral impact is defined as follows:
Ddag ∈ (0.0, 0.2]: light damage, no obvious deformation of CSRC column, a small amount of rupture of concrete skin, no damage to steel bars, stirrups and cross steel; it is recommended to use the same strength grade of concrete for repair and continue to use;
Ddag ∈ (0.2, 0.6]: moderate damage, large amount of cracks in the external concrete pressure and tension zones of the CSRC column, bending of reinforcement and hoop bars, no damage to the internal cross steel bones; it is recommended for use after consolidation with ultra-high-performance concrete (UHPC) and Carbon Fiber-Reinforced Polymer composites (CFRP);
Ddag ∈ (0.6, 0.8]: severe damage, the steel bars and stirrups of CSRC columns have yielded, a large number of external concretes have fallen off, and the internal cross steel has obviously bent; it is recommended to redesign and construct;
Ddag ∈ (0.8, 1]: completely destroyed, the steel bars and stirrups of CSRC columns have been broken, the external concrete has also been completely crushed, the internal cross steel has a large bending deformation, and the residual axial resistance has been unable to support the structure; it is recommended to analyze the progressive collapse resistance of the structure.
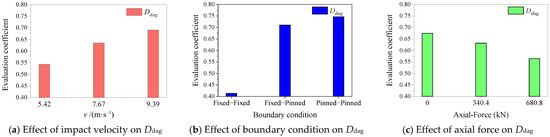
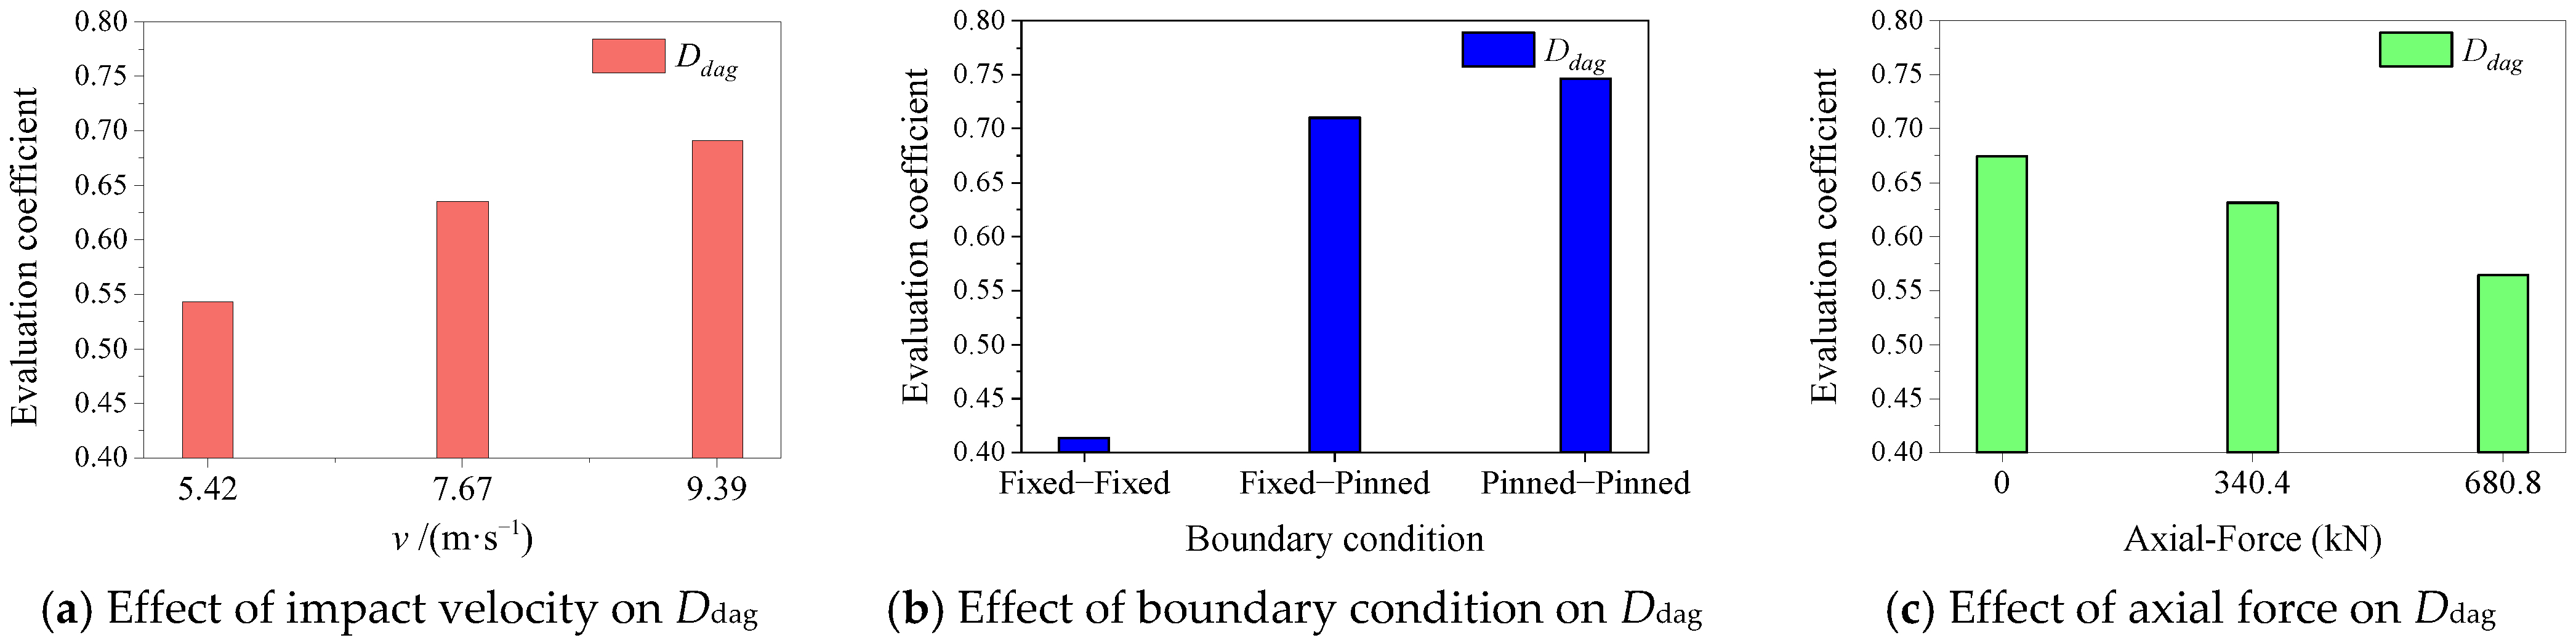
Based on the above damage evaluation analysis, the damage evaluation index of CSRC column after lateral impact was calculated in this paper and the corresponding damage level was given as shown in Table 4. Based on the calculation results in Table 4, the average value under each influencing factor was obtained through a comprehensive test method, and then the damage range under each parameter was calculated, from which the damage level evaluation indexes under the influence of different parameters were obtained as shown in Figure 22. Furthermore, for structures identified with repairable damage levels, tailored retrofitting strategies can be implemented to restore structural integrity. Specifically, depending on the severity of the damage, reinforcement techniques such as the application of Engineered Cementitious Composite (ECC) jackets [47], Carbon Fiber-Reinforced Polymer (CFRP) wrapping [48], or Ultra-High-Performance Fiber-Reinforced Concrete (UHPFRC) [49] encasement can be adopted to strengthen the impacted columns and enhance their residual load-bearing capacity.
Table 4.
Damage evaluation after lateral impact of CSRC columns.
Figure 22.
Damage evaluation coefficient of CSRC column under different factors.
It can be seen from Figure 22a that with the increase in impact velocity, the damage coefficient (Ddag) of CSRC columns after impact also increases gradually. The damage level of components is in the range of 0.54–0.7, which belongs to moderate damage and severe damage. It can be seen from Figure 22b that with the weakening of boundary condition constraints, the damage coefficient (Ddag) of CSRC columns increases after impact, and the damage coefficient of CSRC columns is between 0.41 and 0.75, which belongs to moderate damage and severe damage. It can be seen from Figure 22c that with the increase in axial pressure, the damage coefficient (Ddag) of CSRC columns decreases after impact, and the damage coefficient of components is between 0.56 and 0.68, which belongs to moderate damage and severe damage.
7. Conclusions
In this paper, the residual axial resistance of cross-shaped steel-reinforced concrete columns after impact is tested and analyzed by finite element method, and the previous impact test of our research group is reasonably verified. On this basis, the influence of different factors on the residual axial resistance of CSRC columns after lateral impact is analyzed, and the calculation formula of different parameters on the axial resistance is obtained. Finally, based on the overall failure mode of the specimen, the damage level evaluation index is proposed for engineering application. The following main conclusions are drawn within the scope of this study:
(1) Under the impact load, the deformation mode of the steel-reinforced concrete column with cross-shaped steel is mainly bending deformation, which is easy to produce shear deformation at the impact position. Under the action of axial compression, the specimen after impact has more significant damage to the early bending deformation and shear deformation area, and no obvious out-of-plane bending is observed.
(2) The impact energy is negatively correlated with the residual axial resistance coefficient (λ) of CSRC columns, but is positively correlated with the maximum mid-span displacement (Δmax). The α and the q are positively correlated with the λ of the CSRC columns and negatively correlated with the Δmax. With the increase in the c, the λ of CSRC columns increases first and then decreases. The decrease is mainly because the higher the c, the worse the ductility and the worse the plasticity, which is easy to lead to brittle failure.
(3) The influence of n on the axial resistance of CSRC columns has variability. With the increase in n, the Nr increases first and then decreases, the λ also increases first and then decreases, and the mid-span displacement decreases first and then increases. According to the P-δ effect theory, when the impact load or lateral displacement exceeds a certain value, the increase in axial load will cause a huge increase in lateral displacement. The variation value of n in this paper is 0.5.
(4) The Nr decreases and maximum displacement also decreases as the impact position changes from mid-height of the specimen to quarter-height. This is mainly because the plastic damage is concentrated at the bottom of the mid-span, the support position and the impact position of the specimen. After the impact of the specimen, it is in the form of bending shear failure, and the height of the specimen is in the middle of the plastic damage. The damage level of CSRC column increases, and the Nr and the λ decrease.
(5) In the range studied in this paper, as the slenderness ratio (γ is 4~8) increases, the Δmax increases, while the Nr increases and the λ increases; as the slenderness ratio (γ is 8~12) increases, the Δmax increases, while the Nr decreases and the λ decreases. The results show that the variation in the γ in a small range can enhance the Nr of the column, and the variation in the γ in a larger range makes the column destabilized and damaged.
(6) Considering the influence parameters such as impact energy, material strength, impact position and axial compression ratio, the calculation formula of the residual axial resistance coefficient of CSRC column after impact damage is obtained. By comparing the finite element results, it is shown that the fitting accuracy of the calculation formula is high. While the proposed formulas demonstrate high reliability within the specified ranges, it should be noted that these findings are based on scaled-down models. Future research involving full-scale testing is planned to further account for scale effects in real bridge structures.
Author Contributions
Conceptualization, Y.G.; Methodology, W.L. and G.L.; Validation, G.L.; Formal analysis, X.Z.; Investigation, Y.G., X.Z. and G.L.; Data curation, G.L.; Writing—original draft, X.Z.; Writing—review and editing, Y.G. and W.L.; Supervision, Y.G.; Project administration, W.L. All authors have read and agreed to the published version of the manuscript.
Funding
This research was supported by the National Natural Science Foundation of China (52178291), Fundamental Research Program of Shanxi Province (202103021223022), and Scientific and Technological Innovation Programs of Higher Education Institutions in Shanxi (2023L413).
Data Availability Statement
The original contributions presented in this study are included in the article. Further inquiries can be directed to the corresponding author.
Conflicts of Interest
The authors declare no conflicts of interest.
Nomenclature
| B | cross-section width of the specimen |
| c | compressive strength of concrete |
| Dl | diameter of longitudinal reinforcement |
| Ds | diameter of stirrups |
| Eab | energy absorbed by the vertical deformation of the specimen |
| Ek | impact energy of the dropping hammer |
| Eg | gravitational potential energy of the dropping hammer |
| Etoal | sum of Ek and Eg |
| Fmax | peak value of impact force |
| Fstab | plateau value of impact force |
| L | overall length of specimen |
| L0 | effective length of specimen |
| m | impact mass |
| M | the weight of the dropping hammer |
| n | axial compression ratio |
| q | yield strength of cross-shaped steel |
| SRC | steel-reinforced concrete |
| N | axial load applied in axial force–impact coupling stage |
| N2 | axial load applied in the residual axial compression stage |
| Nr | residual axial resistance |
| Nu | ultimate axial resistance |
| td | duration of impact force |
| v | impact velocity |
| α | sectional steel ratio |
| λ | residual axial resistance coefficient |
| λf | calculated residual axial resistance coefficient |
| Δmax | maximum mid-span displacement |
| Δres | residual mid-span displacement |
| γ | slenderness ratio |
References
- Xu, L.J.; Lu, X.Z.; Smith, S.T.; He, S.T. Scaled model test for collision between over-height truck and bridge superstructure. Int. J. Impact Eng. 2012, 49, 31–42. [Google Scholar] [CrossRef] [Scilit]
- Xu, L.; Lu, X.; Guan, H.; Zhang, Y. Finite-Element and Simplified Models for Collision Simulation between over-height Trucks and Bridge Superstructures. J. Bridge Eng. 2013, 18, 1140–1151. [Google Scholar] [CrossRef] [Scilit]
- Sun, W.; Fan, W.; Yang, C.; Peng, W. Lessons learned from vehicle collision accident of Dongguofenli Bridge: FE modeling and analysis. Eng. Struct. 2021, 244, 112813. [Google Scholar] [CrossRef] [Scilit]
- Zhu, X.; Lu, X.-Z.; Cheng, Q.-L.; Li, Y. Simulation of the running attitude of a train after derailment. Int. J. Crashworthiness 2020, 25, 213–219. [Google Scholar] [CrossRef] [Scilit]
- Shultz, J.M.; Garcia-Vera, M.P.; Santos, C.G.; Sanz, J.; Bibel, G.; Schulman, C.; Bahouth, G.; Guichot, Y.D.; Espinel, Z.; Rechkemmer, A. Disaster complexity and the Santiago de Compostela train derailment. Disaster Health 2016, 3, 11–31. [Google Scholar] [CrossRef] [Scilit]
- Esslinger, V.; Kieselbach, R.; Koller, R.; Weisse, B. The railway accident of Eschede–technical background. Eng. Fail. Anal. 2004, 11, 515–535. [Google Scholar] [CrossRef] [Scilit]
- Lu, X.; Lin, K.; Cen, S.; Xu, Z.; Lin, L. Comparing different fidelity models for the impact analysis of large commercial aircrafts on a containment building. Eng. Fail. Anal. 2015, 57, 254–269. [Google Scholar] [CrossRef] [Scilit]
- Qu, Y.G.; Wu, H.; Xu, Z.Y.; Liu, X.; Dong, Z.F.; Fang, Q. Safety assessment of Generation III nuclear power plant buildings subjected to commercial aircraft crash Part II: Structural damage and vibrations. Nucl. Eng. Technol. 2020, 52, 397–416. [Google Scholar] [CrossRef] [Scilit]
- Sha, Y.; Hao, H. Laboratory tests and numerical simulations of barge impact on circular reinforced concrete piers. Eng. Struct. 2013, 46, 593–605. [Google Scholar] [CrossRef] [Scilit]
- Fan, W.; Liu, B.; Consolazio, G.R. Residual capacity of axially loaded circular RC columns after lateral low-velocity impact. J. Struct. Eng. 2019, 145, 04019039. [Google Scholar] [CrossRef] [Scilit]
- Han, L.-H.; Hou, C.-C.; Zhao, X.-L.; Rasmussen, K.J.R. Behaviour of high-strength concrete filled steel tubes under transverse impact loading. J. Constr. Steel Res. 2014, 92, 25–39. [Google Scholar] [CrossRef] [Scilit]
- Yousuf, M.; Uy, B.; Tao, Z.; Remennikov, A.; Liew, J.Y.R. Transverse impact resistance of hollow and concrete filled stainless steel columns. J. Constr. Steel Res. 2013, 82, 177–189. [Google Scholar] [CrossRef] [Scilit]
- Yousuf, M.; Uy, B.; Tao, Z.; Remennikov, A.; Liew, J.Y.R. Impact behaviour of pre-compressed hollow and concrete filled mild and stainless steel columns. J. Constr. Steel Res. 2014, 96, 54–68. [Google Scholar] [CrossRef] [Scilit]
- Yang, Y.-F.; Zhang, Z.-C.; Fu, F. Experimental and numerical study on square RACFST members under lateral impact loading. J. Constr. Steel Res. 2015, 111, 43–56. [Google Scholar] [CrossRef] [Scilit]
- Zhu, X.; Lu, X.Z.; Du, Y.F.; Ye, L.P. Experimental study on impact resistance of reinforced concrete columns strengthened with steel jackets. J. Eng. Mech. 2016, 33, 23–33. (In Chinese) [Google Scholar]
- Zhu, X.; Lu, X.Z.; Du, Y.F.; Ye, L.P. Experimental study and finite element analysis of impact resistance of novel composite columns. J. Eng. Mech. 2016, 33, 158–166. (In Chinese) [Google Scholar]
- Zhu, X.; Zhao, P.; Tian, Y.; Wang, R. Experimental study of RC columns and composite columns under low-velocity impact. Thin-Walled Struct. 2021, 160, 107374. [Google Scholar] [CrossRef] [Scilit]
- Zhu, X.; Kang, M.; Fei, Y.; Zhang, Q.; Wang, R. Impact behavior of concrete-filled steel tube with cruciform reinforcing steel under lateral impact load. Eng. Struct. 2021, 247, 113104. [Google Scholar] [CrossRef] [Scilit]
- Zhu, X.; Zhang, Q.; Zhang, D.; Du, Y.; Zhang, Q. Experimental and numerical study on the dynamic response of steel-reinforced concrete composite members under lateral impact. Thin-Walled Struct. 2021, 169, 108477. [Google Scholar] [CrossRef] [Scilit]
- Xian, W.; Wang, W.-D.; Wang, R.; Chen, W.; Hao, H. Dynamic response of steel-reinforced concrete-filled circular steel tubular members under lateral impact loads. Thin-Walled Struct. 2020, 151, 106736. [Google Scholar] [CrossRef] [Scilit]
- Xian, W.; Chen, W.; Hao, H.; Wang, W.-D. Experimental and numerical studies on square steel-reinforced concrete-filled steel tubular (SRCFST) members subjected to lateral impact. Thin-Walled Struct. 2021, 160, 107409. [Google Scholar] [CrossRef] [Scilit]
- Wang, R.; Han, L.-H.; Hou, C.-C. Behavior of concrete filled steel tubular (CFST) members under lateral impact: Experiment and FEA model. J. Constr. Steel Res. 2013, 80, 188–201. [Google Scholar] [CrossRef] [Scilit]
- Wang, R.; Han, L.-H.; Zhao, X.-L.; Rasmussen, K.J.R. Experimental behavior of concrete filled double steel tubular (CFDST) members under low velocity drop weight impact. Thin-Walled Struct. 2015, 97, 279–295. [Google Scholar] [CrossRef] [Scilit]
- Wang, R.; Han, L.-H.; Zhao, X.-L.; Rasmussen, K.J.R. Analytical behavior of concrete filled double steel tubular (CFDST) members under lateral impact. Thin-Walled Struct. 2016, 101, 129–140. [Google Scholar] [CrossRef] [Scilit]
- Fu, J.; Wang, W.; Wang, X.; Zhao, W.; Zhou, R.; Lu, Z. Fragility assessment of RC bridge piers subjected to vehicle collision based on residual load-bearing capacity. Structures 2024, 68, 107103. [Google Scholar] [CrossRef] [Scilit]
- Zhao, W.; Li, W.; Feng, H.; Ye, J.; Lan, G.; Qian, J. Residual performance of hollow RC piers damaged by rockfall impact. Structures 2024, 59, 105726. [Google Scholar] [CrossRef] [Scilit]
- Zhu, X.; Lei, G.; Hou, L.; Tian, Z.; Zhang, Z. Experimental and numerical study of steel tubes filled with steel slag-based artificial aggregate (SA-CFST) under lateral impact load. Constr. Build. Mater. 2025, 458, 139532. [Google Scholar] [CrossRef] [Scilit]
- Zhu, X.; Tian, Z.; Lei, G.; Hou, L.; Wu, Q. Impact resistance and residual axial capacity of concrete-filled cold-formed steel built-up columns under two subsequent impacts. Eng. Struct. 2025, 345, 121475. [Google Scholar] [CrossRef] [Scilit]
- Gao, S.; Xu, Y.; Zhang, S.; Derlatka, A. Performance of square concrete-filled steel tubular columns under repeated lateral impact. Eng. Struct. 2023, 280, 115719. [Google Scholar] [CrossRef] [Scilit]
- Cui, G.; Zhai, X.; Meng, L. Behavior of axially loaded high-strength steel circular hollow section tubes under low velocity lateral impact. Thin-Walled Struct. 2023, 185, 110595. [Google Scholar] [CrossRef] [Scilit]
- Li, G.; Zhou, Y.; Li, X.; Wang, J.; Cui, W. Vehicular impact resistance of concrete-filled square steel tube columns with inner CFRP circular tube. J. Constr. Steel Res. 2026, 237, 110130. [Google Scholar] [CrossRef] [Scilit]
- Zhang, X.; Chen, Y.; Wan, J.; Wang, K.; He, K.; Chen, X.; Wei, J.; Jiang, G. Tests on residual ultimate bearing capacity of square CFST columns after impact. J. Constr. Steel Res. 2018, 147, 27–42. [Google Scholar] [CrossRef] [Scilit]
- Yang, X.; Huang, J.; Zhang, Z.; Fang, X.; Li, D.; Bi, K. Residual axial compressive behavior of UHPC-filled high-strength square steel tubular members after lateral impact. Eng. Struct. 2025, 341, 120805. [Google Scholar] [CrossRef] [Scilit]
- Venkateshwaran, A.; Lai, B.-L.; Liew, J.Y.R. Buckling resistance of steel fibre-reinforced concrete encased steel composite columns. J. Constr. Steel Res. 2022, 190, 107140. [Google Scholar] [CrossRef] [Scilit]
- Wang, R.; Yang, X.; Zhao, H.; Zhai, M.; Chen, W.; Lam, D. Damage evaluation of axial-loaded H-section steel columns during and after impact loading. J. Constr. Steel Res. 2022, 196, 107426. [Google Scholar] [CrossRef] [Scilit]
- Xiang, S.; Zeng, L.; Liu, Y.; Mo, J.; Ma, L.; Zhang, J.; Chen, J. Experimental study on the dynamic behavior of T-shaped steel reinforced concrete columns under impact loading. Eng. Struct. 2020, 208, 110307. [Google Scholar] [CrossRef] [Scilit]
- Zeng, L.; Liu, Y.; Zhang, H.; Mo, J.; Liu, C.; Xiao, Y. Experimental study on dynamic response and residual mechanical behavior of SRC columns under repeated lateral impacts. Eng. Fail. Anal. 2022, 138, 106343. [Google Scholar] [CrossRef] [Scilit]
- Lai, B.; Liew, J.Y.R.; Hoang, A.L. Behavior of high strength concrete encased steel composite stub columns with C130 concrete and S690 steel. Eng. Struct. 2019, 200, 109743. [Google Scholar] [CrossRef] [Scilit]
- Lai, B.; Liew, J.Y.R. Investigation on axial load-shorting behaviour of high strength concrete encased steel composite section. Eng. Struct. 2021, 227, 111401. [Google Scholar] [CrossRef] [Scilit]
- LSTC. LS-DYNA Keyword User’s Manual; Livermore Software Technology Corporation (LSTC): Livermore, CA, USA, 2014. [Google Scholar]
- Abramowicz, W.; Jones, N. Dynamic axial crushing of square tubes. Int. J. Impact Eng. 1984, 2, 179–208. [Google Scholar] [CrossRef] [Scilit]
- Murray, Y.D. Users Manual for LS-DYNA Concrete Material Model 159; United States, Federal Highway Administration, Office of Research, Development, and Technology: McLean, VA, USA, 2007. [Google Scholar]
- Wang, Q.; Zhao, D.; Guan, P. Experimental study on the strength and ductility of steel tubular columns filled with steel-reinforced concrete. Eng. Struct. 2004, 26, 907–915. [Google Scholar] [CrossRef] [Scilit]
- Farajpourbonab, E.; Kute, S.Y.; Inamdar, V.M. Steel reinforced concrete-filled steel tubular columns under axial and lateral cyclic loading. Int. J. Adv. Struct. Eng. 2018, 10, 61–72. [Google Scholar] [CrossRef] [Scilit]
- Cai, J.; Pan, J.; Wu, Y. Mechanical behavior of steel-reinforced concrete-filled steel tubular (SRCFST) columns under uniaxial compressive loading. Thin-Walled Struct. 2015, 97, 1–10. [Google Scholar] [CrossRef] [Scilit]
- Ding, F.-X.; Zhang, T.; Liu, X.-M.; Lu, Z.-H.; Guo, Q.; Jiang, G.-S. Behavior of steel-reinforced concrete-filled square steel tubular stub columns under axial loading. Thin-Walled Struct. 2017, 119, 737–748. [Google Scholar] [CrossRef] [Scilit]
- Lai, B.-L.; Zhou, X.; Zhang, M.-Y.; Zheng, X.-F.; Fan, S.-G. Experimental study on the eccentric compressive behavior of steel reinforced concrete composite columns with stay-in-place ECC jacket. J. Build. Eng. 2025, 102, 112007. [Google Scholar] [CrossRef] [Scilit]
- Luo, J.; Zhang, J.; Mao, B.; Zhang, X.; Ma, J.; Wu, J. Impact and post-impact performance of RC beams strengthened with near-surface mounted CFRP strips: Experimental and numerical evaluation. Structures 2026, 86, 111452. [Google Scholar] [CrossRef] [Scilit]
- Fan, W.; Xu, X.; Zhang, Z.; Shao, X. Performance and sensitivity analysis of UHPFRC-strengthened bridge columns subjected to vehicle collisions. Eng. Struct. 2018, 173, 251–268. [Google Scholar] [CrossRef] [Scilit]

Disclaimer/Publisher’s Note: The statements, opinions and data contained in all publications are solely those of the individual author(s) and contributor(s) and not of MDPI and/or the editor(s). MDPI and/or the editor(s) disclaim responsibility for any injury to people or property resulting from any ideas, methods, instructions or products referred to in the content. |
© 2026 by the authors. Licensee MDPI, Basel, Switzerland. This article is an open access article distributed under the terms and conditions of the Creative Commons Attribution (CC BY) license.