


Abstract
Transmission towers are continuously exposed to corrosive environments, and corrosion of their structural members can significantly reduce the overall load-carrying capacity and stability. In this study, four locally corroded angle steel specimens with single-side connections were fabricated using an electrochemical method. Eccentric compression tests were conducted on these four corroded specimens together with two uncorroded reference specimens. The failure modes, load–displacement curves, and load–strain responses of the corroded specimens were systematically analyzed. It was observed that the strain in the compression leg exceeded that in the free leg. A finite element model, validated against experimental results, was employed for a parametric study to investigate the effects of the spacing between two corrosion regions, their respective relative corrosion depths, and corrosion areas on the degradation rate of load-carrying capacity. Based on the observed influence patterns of these corrosion parameters, an assessment method for capacity degradation under a “dual corrosion region” configuration was developed, accounting for three scenarios: corrosion on the compression leg, the free leg, or both sides simultaneously. This method comprehensively captures realistic corrosion characteristics and demonstrates improved rationality and accuracy. Finally, a sensitivity analysis was performed using the proposed assessment approach, examining key parameters including section corrosion ratio, corrosion area, corrosion location, and slenderness ratio. The results indicate that, under the dual corrosion region condition, the section corrosion ratio is the most dominant factor influencing the capacity degradation rate.
1. Introduction
Transmission lines are characterized by numerous nodes, extensive spatial distribution, and large spans, inevitably passing through regions with complex meteorological conditions and variable geographical environments. Harsh natural environments cause corrosion of transmission tower members, leading to a reduction in effective load-bearing cross-sectional area, degradation of load-carrying capacity, and serious threats to the safe operation of power transmission systems. Statistics indicate that metallic components exposed to natural environments account for approximately 80% of total metal usage, of which about 50% is lost due to corrosion [1,2,3,4]. From the perspective of material resistance, corrosion is identified as the primary factor contributing to the failure of transmission tower members [5,6,7,8]. Therefore, an in-depth investigation into the influence of corrosion on the load-bearing capacity of these members is of significant social and economic importance for ensuring the safe and reliable operation of transmission lines throughout their design service life.
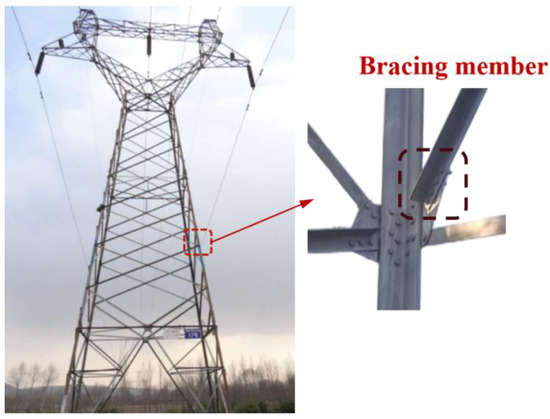
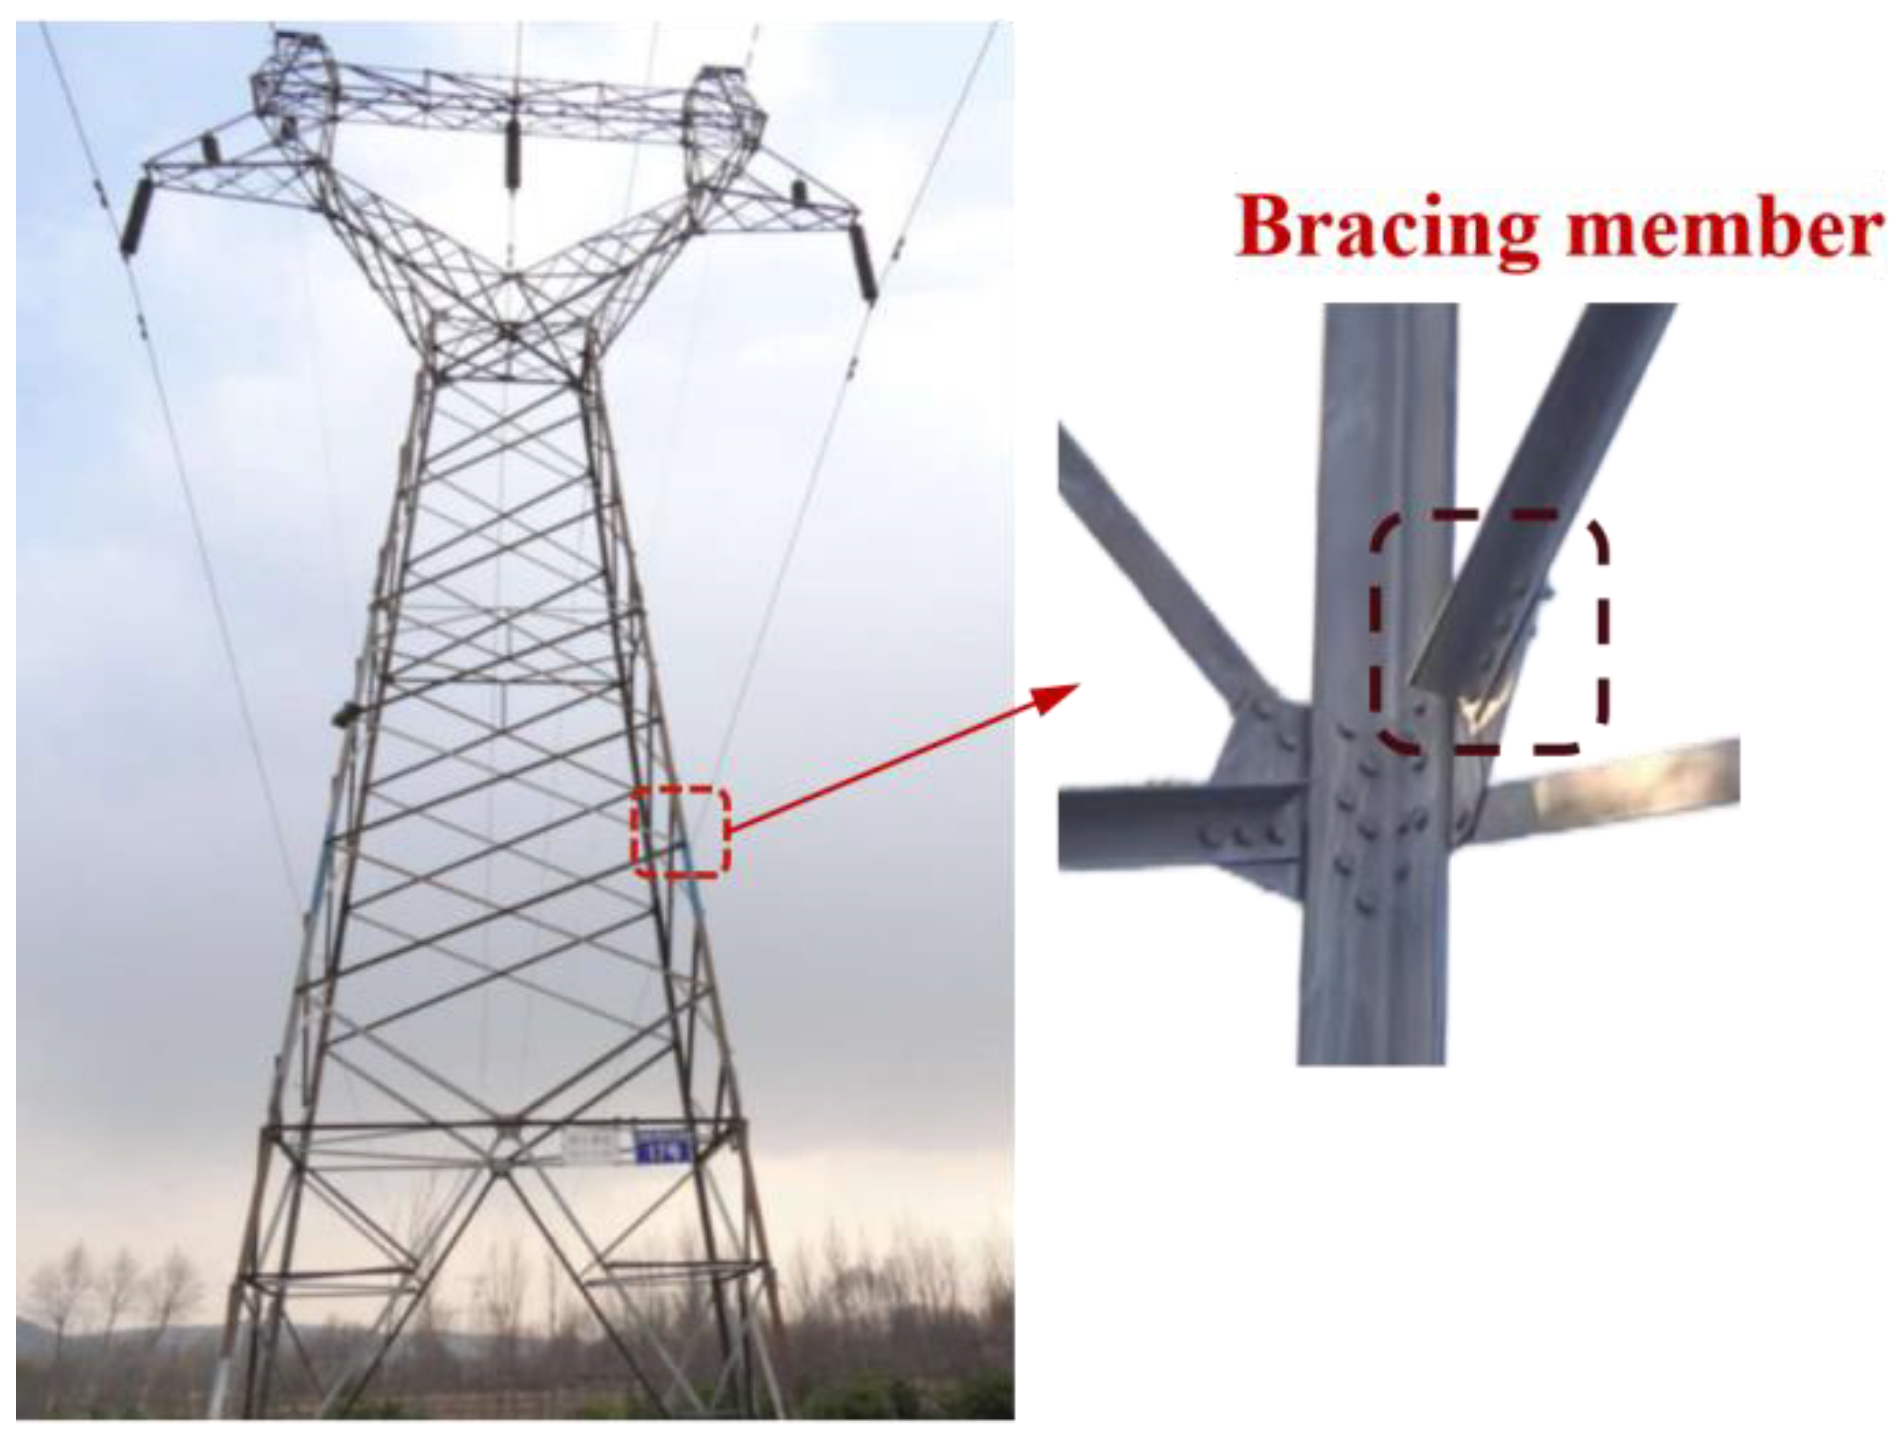
Extensive research has shown that the key corrosion-susceptible components in transmission towers primarily include chord members, bracing members, and tower legs (Figure 1). Among these, bracing members are typically single-sided connected and serve as critical load-resisting elements, mainly subjected to shear forces and bending moments. The compression leg of the angle section is bolted unilaterally to the chord member, forming spatial triangular units that resist transverse forces and torsional moments, thereby ensuring the overall stability and stiffness of the transmission tower [9]. Consequently, bracing members serve as primary load-bearing components in transmission towers, and their corrosion poses a significant threat to the structural stability of the entire tower system.
Figure 1.
Bracing member of transmission towers.
Current research on the effects of corrosion on structural performance is generally categorized into two approaches: material property degradation models and geometric section reduction models. The former focuses on the reduction in nominal material strength due to corrosion, typically assuming an unchanged cross-sectional geometry [10,11,12,13]. The latter evaluates the impact of corrosion by reducing member thickness to simulate cross-sectional loss, thereby assessing capacity degradation; however, it often considers only uniform corrosion or a single geometric parameter [14,15,16,17]. This study adopts the geometric reduction approach, which better reflects the actual localized corrosion morphology observed in engineering practice.
Based on corrosion mechanisms, corrosion can be classified into chemical corrosion and electrochemical corrosion [18]. Chemical corrosion refers to direct chemical reactions between metal and non-electrolytic media, proceeding relatively slowly. In contrast, electrochemical corrosion occurs in electrolyte solutions through electrochemical reactions and exhibits a faster rate, making it the commonly adopted method for accelerated laboratory corrosion testing [19,20,21,22]. For instance, Aamna Sarfaraz [23] employed electrochemical corrosion to fabricate corroded rebars and investigated the combined effects of fatigue damage and rebar corrosion on the structural performance of reinforced concrete deep beams. Papakonstantinou et al. [24] conducted a global sensitivity analysis using Sobol indices to evaluate the relative importance of corrosion parameters under chloride-induced reinforcement corrosion. Xiaoting Gu [25] performed a sensitivity analysis on six major factors influencing post-corrosion internal stress in natural gas pipelines and found that, except for axial corrosion location, the remaining five factors exhibited positive correlations with internal pipeline stress. Oszvald et al. [26] simulated corrosion damage via mechanical grinding and analyzed the relationship between corrosion depth and specimen load-bearing capacity.
Although numerous experimental and numerical studies have been conducted on various structural members, most focus on deformation capacity and ultimate load-bearing capacity under uniform corrosion conditions [27,28,29,30,31]. However, extensive field investigations reveal that, due to the complex and variable service environments, corrosion in real structures is predominantly localized, and localized corrosion poses a more severe threat to load-bearing capacity due to stress concentration effects [32,33,34,35].
In summary, existing research on steel corrosion has largely concentrated on material-level aspects such as corrosion rate and pit depth, with loading conditions primarily limited to axial compression or tension. Studies on the load-bearing performance of corroded members under eccentric compression, particularly those involving sensitivity analysis of corrosion parameters, remain scarce. This gap is especially pronounced for single-sided connected angle bracing members widely used in transmission towers. Therefore, developing an assessment method for load-bearing capacity degradation and conducting sensitivity analysis of key corrosion parameters for eccentrically compressed locally corroded angle steel is of great significance for enhancing the safety of transmission towers.
Accordingly, this study conducts eccentric compression tests on six bracing angle steel specimens, including four locally corroded specimens and two non-corroded control specimens. Localized corrosion is induced via an electrochemical method, with key corrosion parameters including corrosion depth and spacing between corrosion regions. A finite element model, validated against experimental results, is then employed for parametric analysis, focusing on multiple corrosion regions, spacing between dual corrosion regions, relative corrosion depth, and corrosion area, to investigate their influence on the degradation ratio of load-bearing capacity. Based on the observed influence patterns, an evaluation method for the degradation ratio of load-bearing capacity under a dual corrosion region configuration is established. Subsequently, a sensitivity analysis of key corrosion parameters is performed using the proposed method. This research provides a reliable technical reference for the safety assessment of transmission towers operating in corrosive environments.
2. Corrosion Test Design and Results
2.1. Material Properties
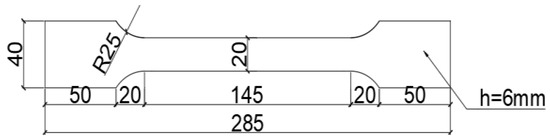
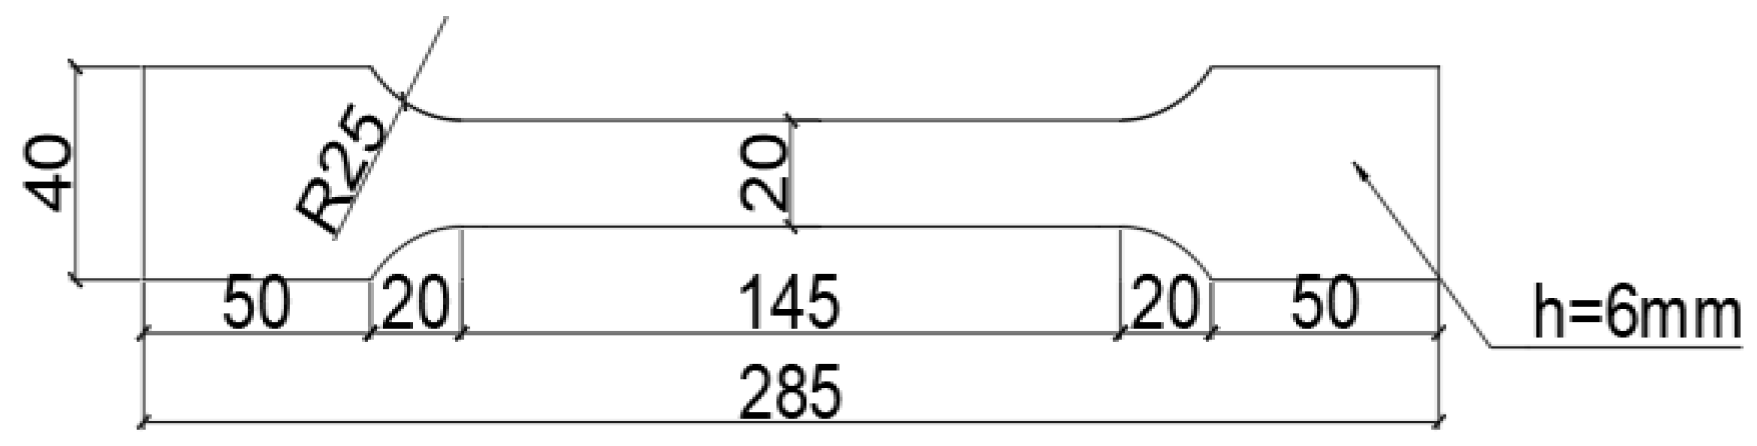
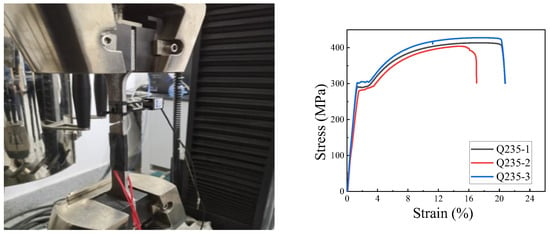
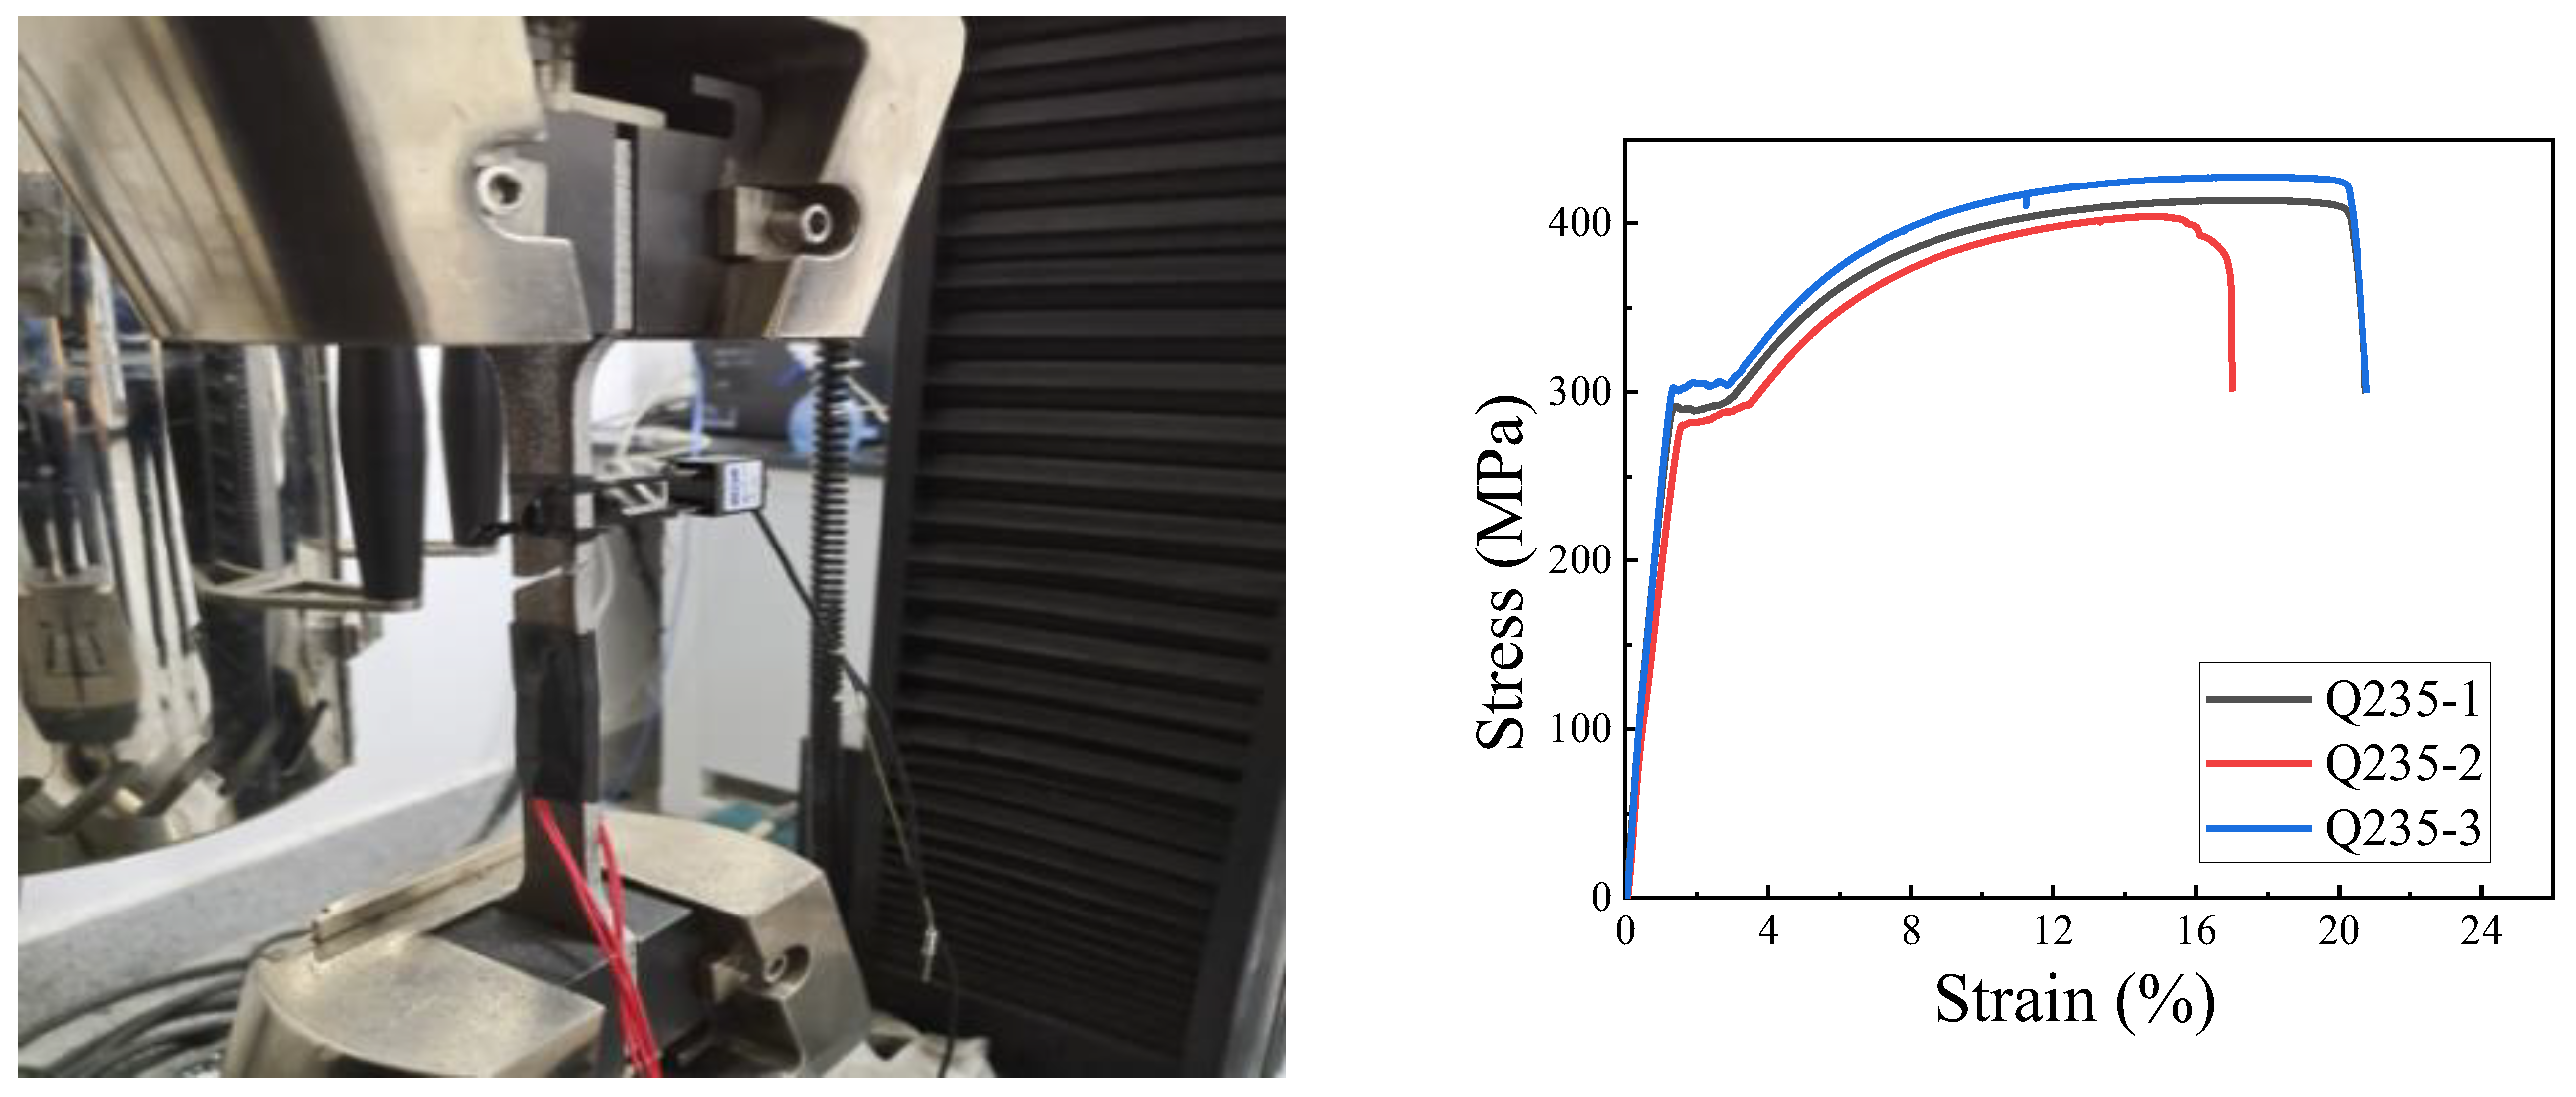
This study focuses on Q235, a commonly used material for transmission tower bracing members. According to GB/T 228.1–2021 “Metallic materials—Tensile testing—Part 1: Method of test at room temperature” [36], sample locations were selected. The dimensions of standard tensile specimens are shown in Figure 2. The stress–strain curves obtained from the tests are depicted in Figure 3, revealing an average yield strength of 292.27 MPa and ultimate strength of 415.26 MPa (Table 1).
Figure 2.
Detailed drawing of the sample size of the standard specimen for the metal tensile test.
Figure 3.
Test of material properties.
Table 1.
Mechanical properties of Q235 steel.
2.2. Preparation and Analysis of Corroded Members
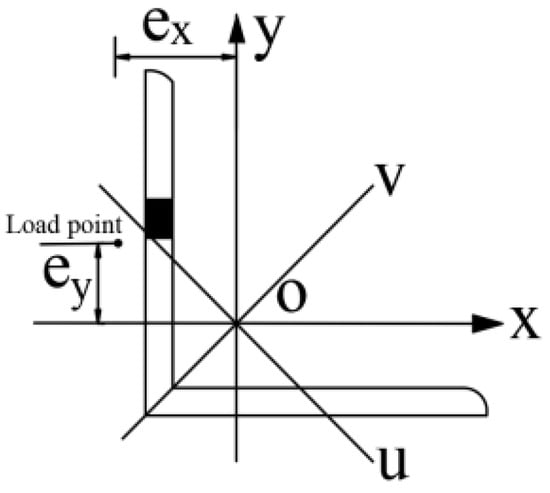
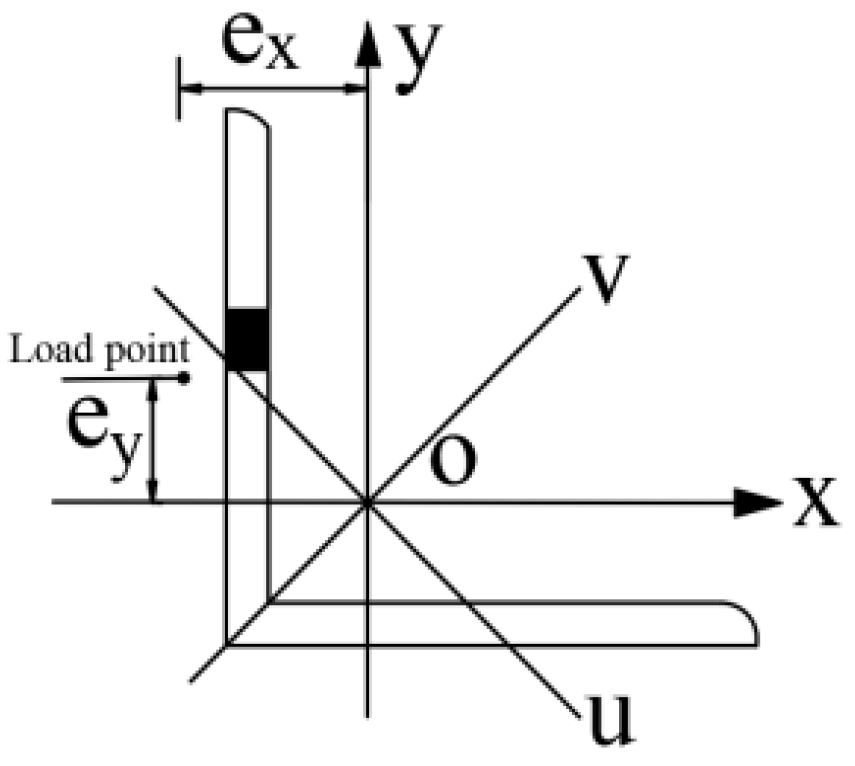
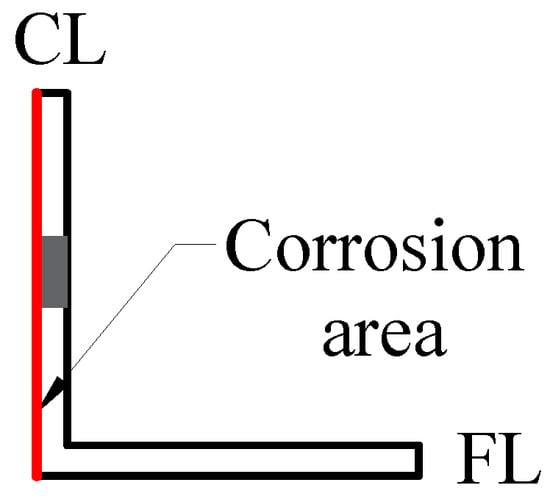
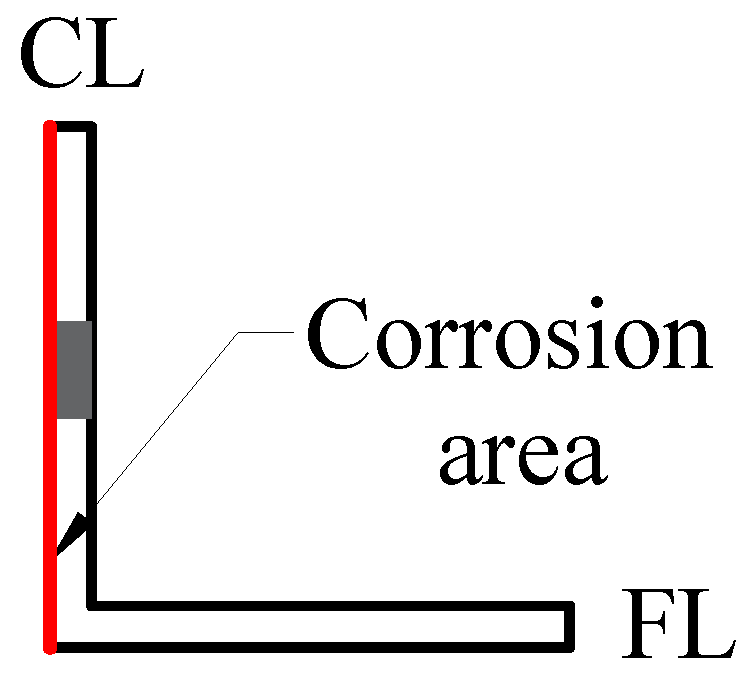
Based on the BM specifications commonly used for transmission tower bracing members, four specimens of the same L75 × 6 specification (where H = 75 mm and T = 6 mm) were subjected to corrosion tests, all with a slenderness ratio of 90. Bracing angle sections were connected via single-sided connections. The eccentricity schematic diagram is shown in Figure 4, where the resultant force line deviates from the centroid axis, generating additional bending moments during compression. Based on their loading characteristics and connection methods, the specimens were categorized into three types: corrosion of the compression leg (CL), free leg (FL), and both sides (BS) (Figure 5).
Figure 4.
Schematic diagram of the eccentricity of the angle steel.
Figure 5.
Schematic diagram of corrosion.
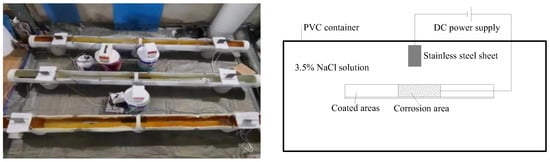
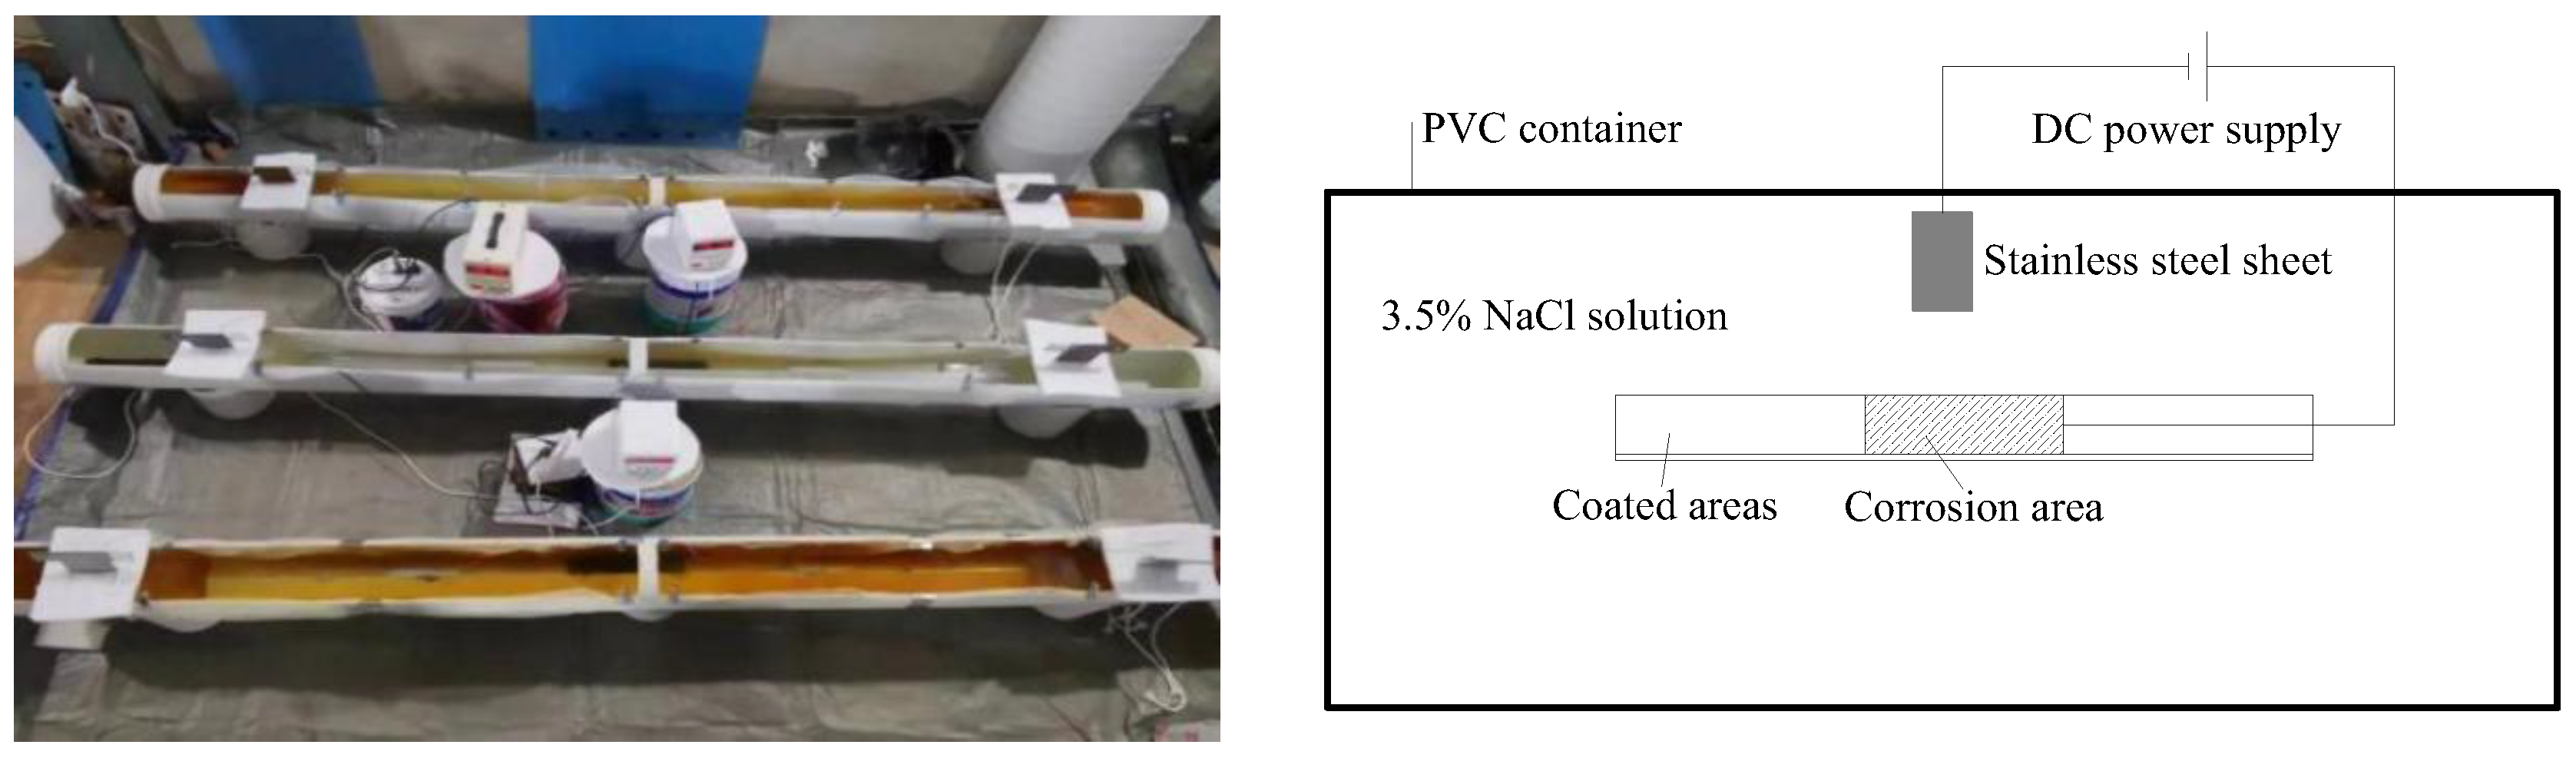
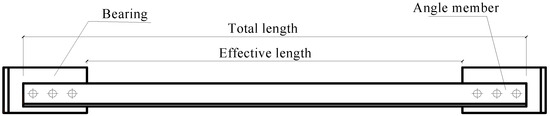
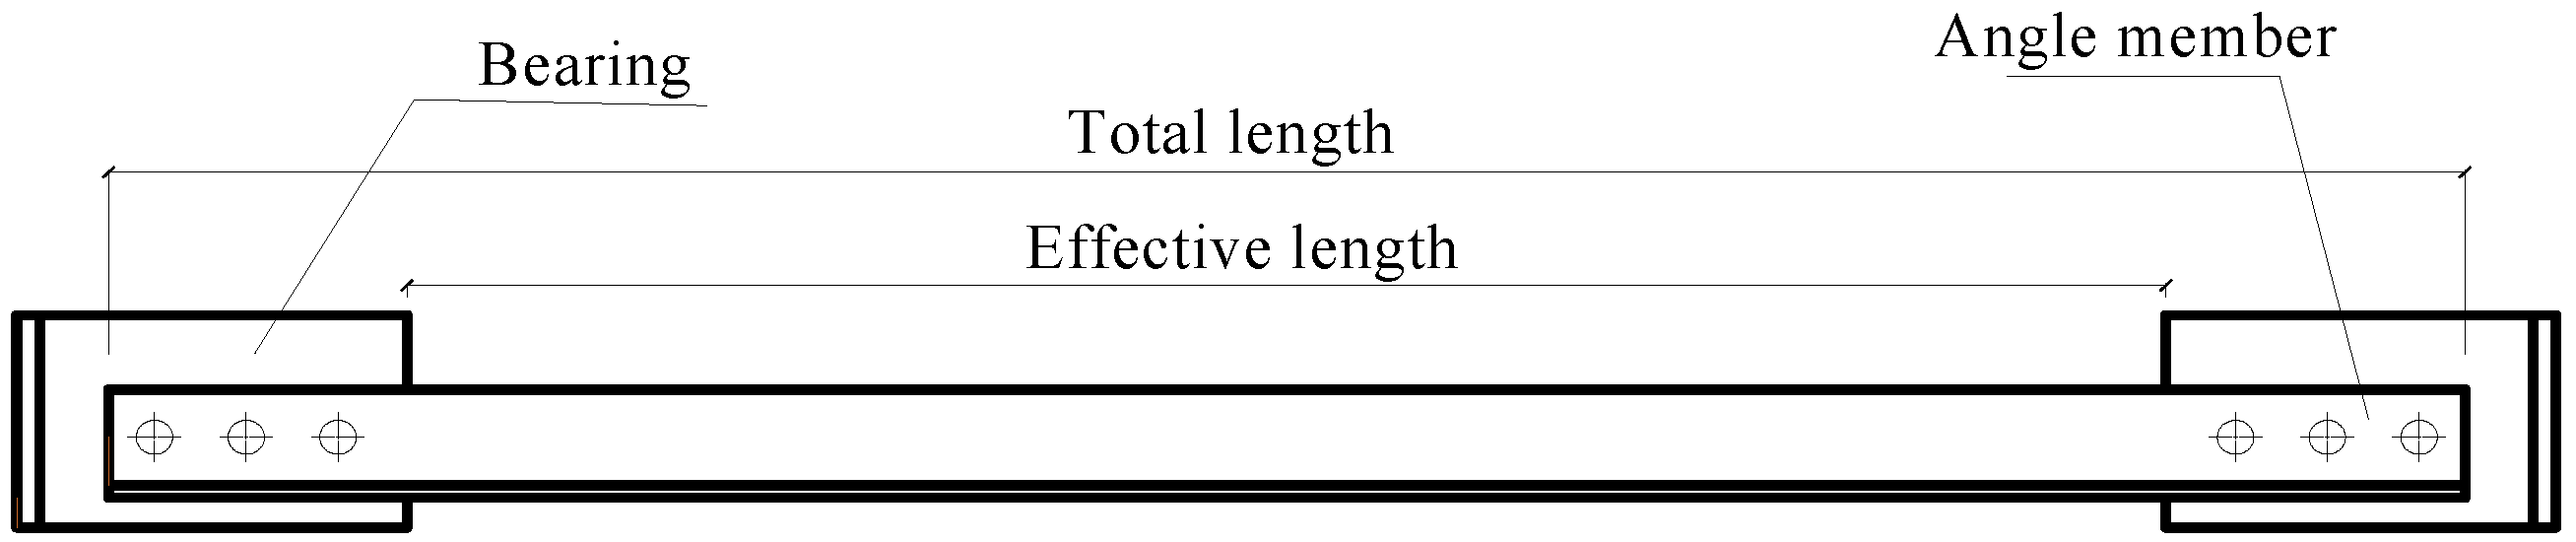
Electrochemical corrosion testing is a widely adopted method by researchers for preparing corroded specimens; hence, this study also employed electrochemical corrosion to prepare the test specimens (Figure 6). Key corrosion parameters included the depth of single-corrosion regions (5% and 30% thickness) and the spacing between dual corrosion regions. The width of corrosion was uniformly set as H (the width of the angle section), and the width of each corrosion region was 1/5L, where L is the calculation length, defined as the product of the slenderness ratio and the minimum radius of gyration (Figure 7). The corrosion depth in dual corrosion regions was uniformly set at 20% of the thickness.
Figure 6.
Electrochemical corrosion test.
Figure 7.
Schematic diagram of angle steel components.
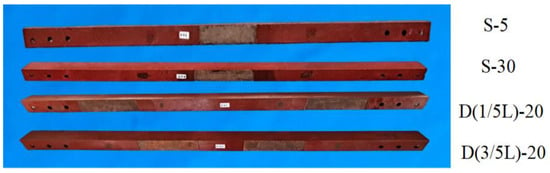
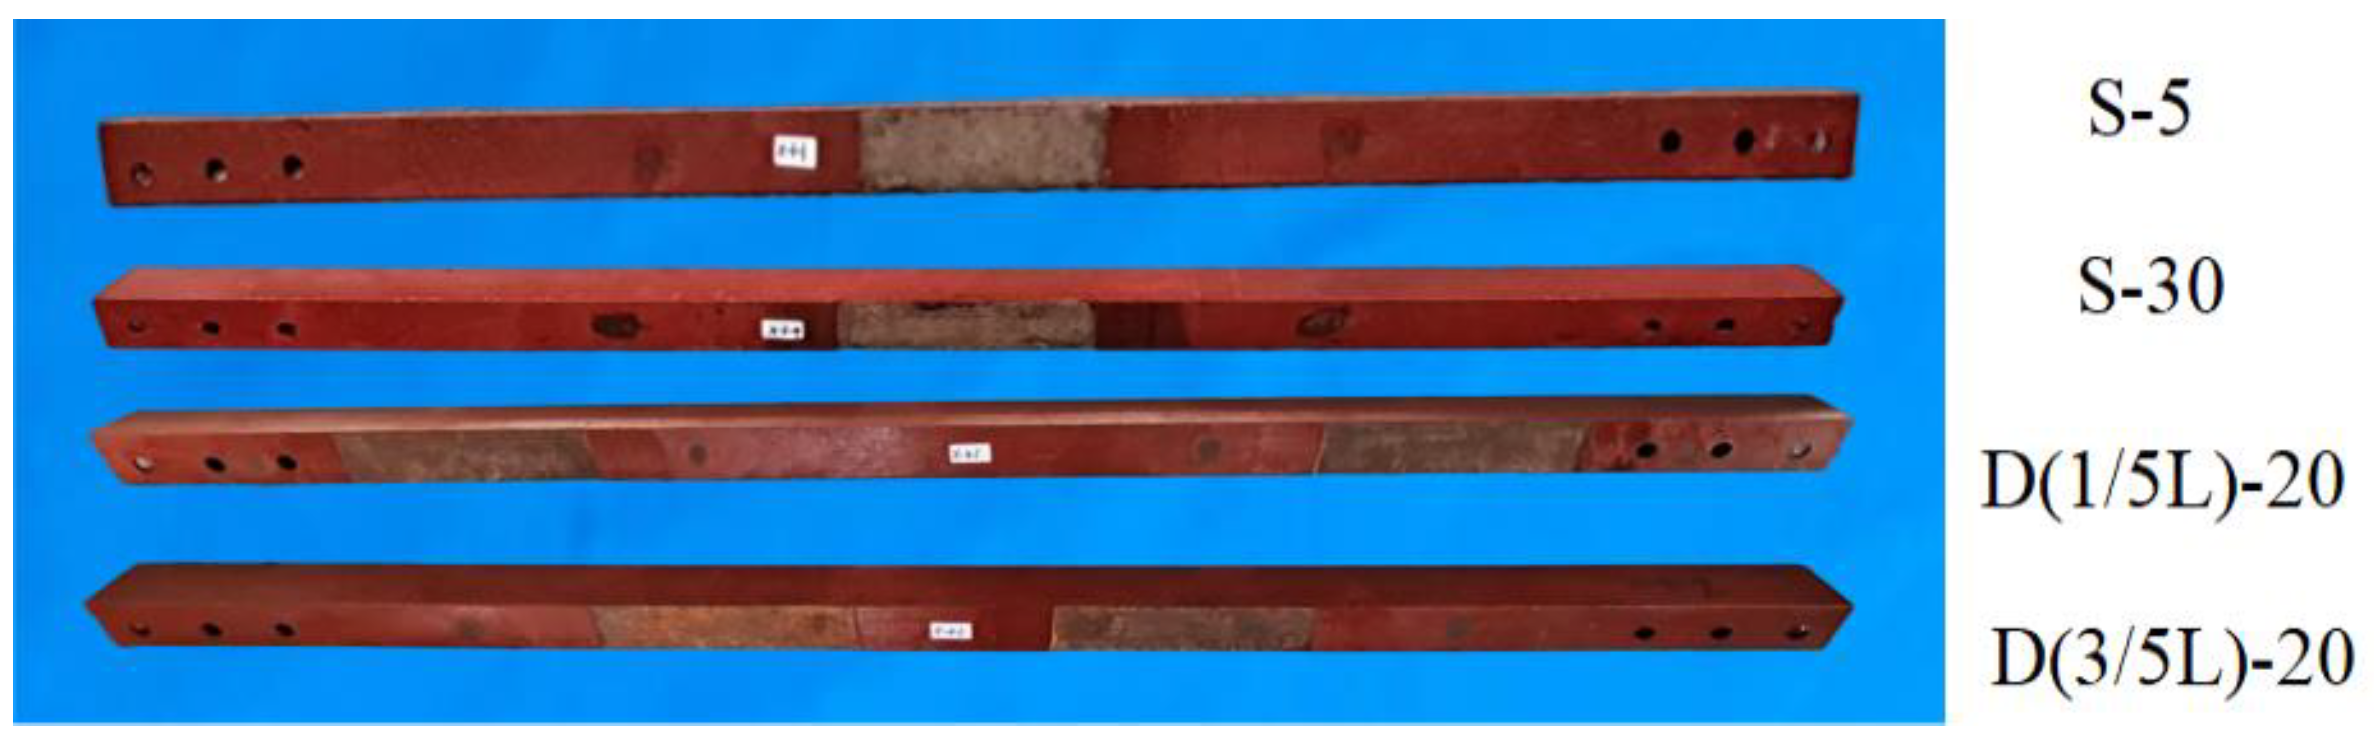
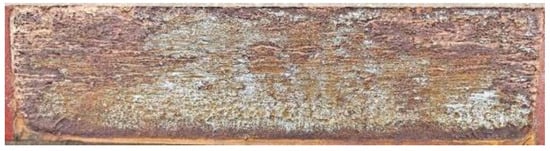
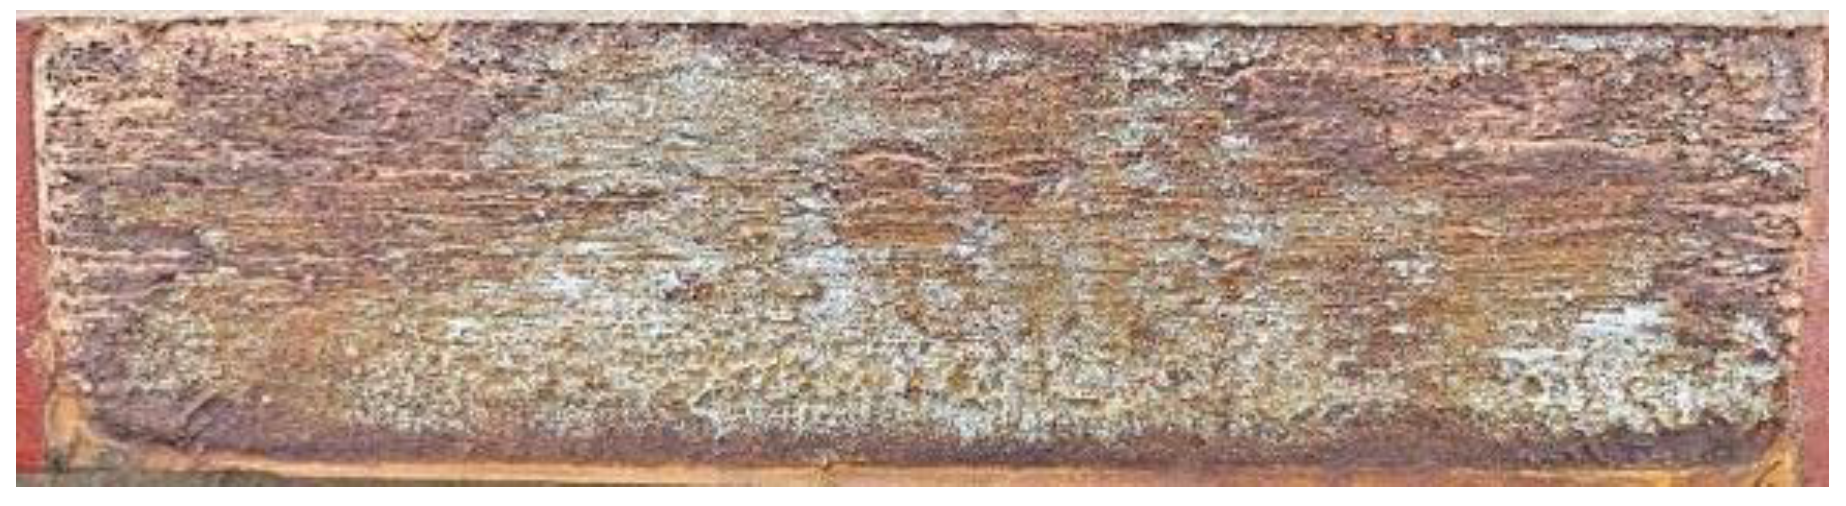
The specimen coding follows the format X(J)-C, where X denotes the number of corrosion regions (S for single and D for dual), J represents the spacing between dual corrosion regions (applicable only for dual regions), and C indicates the corrosion rate of the cross-section (H × T). Figure 8 shows the corroded specimens, confirming that corrosion occurred precisely in the predetermined areas while preserving uncorroded regions and bolt holes intact. Figure 9 provides measured images of local corrosion morphology, revealing deeper corrosion at the limb tips and axial edges compared to mid-regions due to electron accumulation during electrochemical testing. Table 2 summarizes the results of electrochemical corrosion tests, where M1 represents the calculated corrosion mass, M2 the actual corrosion mass, and M∆ the difference between the two, with an error margin within 4.0%.
Figure 8.
Corroded specimen.
Figure 9.
Morphological characteristics of the specimen.
Table 2.
Dimensions of corroded angle members.
3. Eccentric Compression Tests
3.1. Loading Scheme and Measurement Point Arrangement
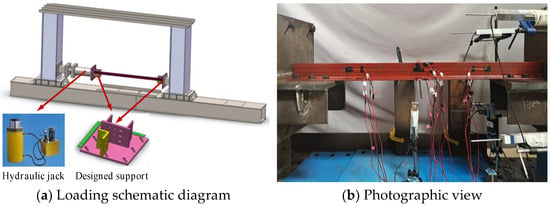
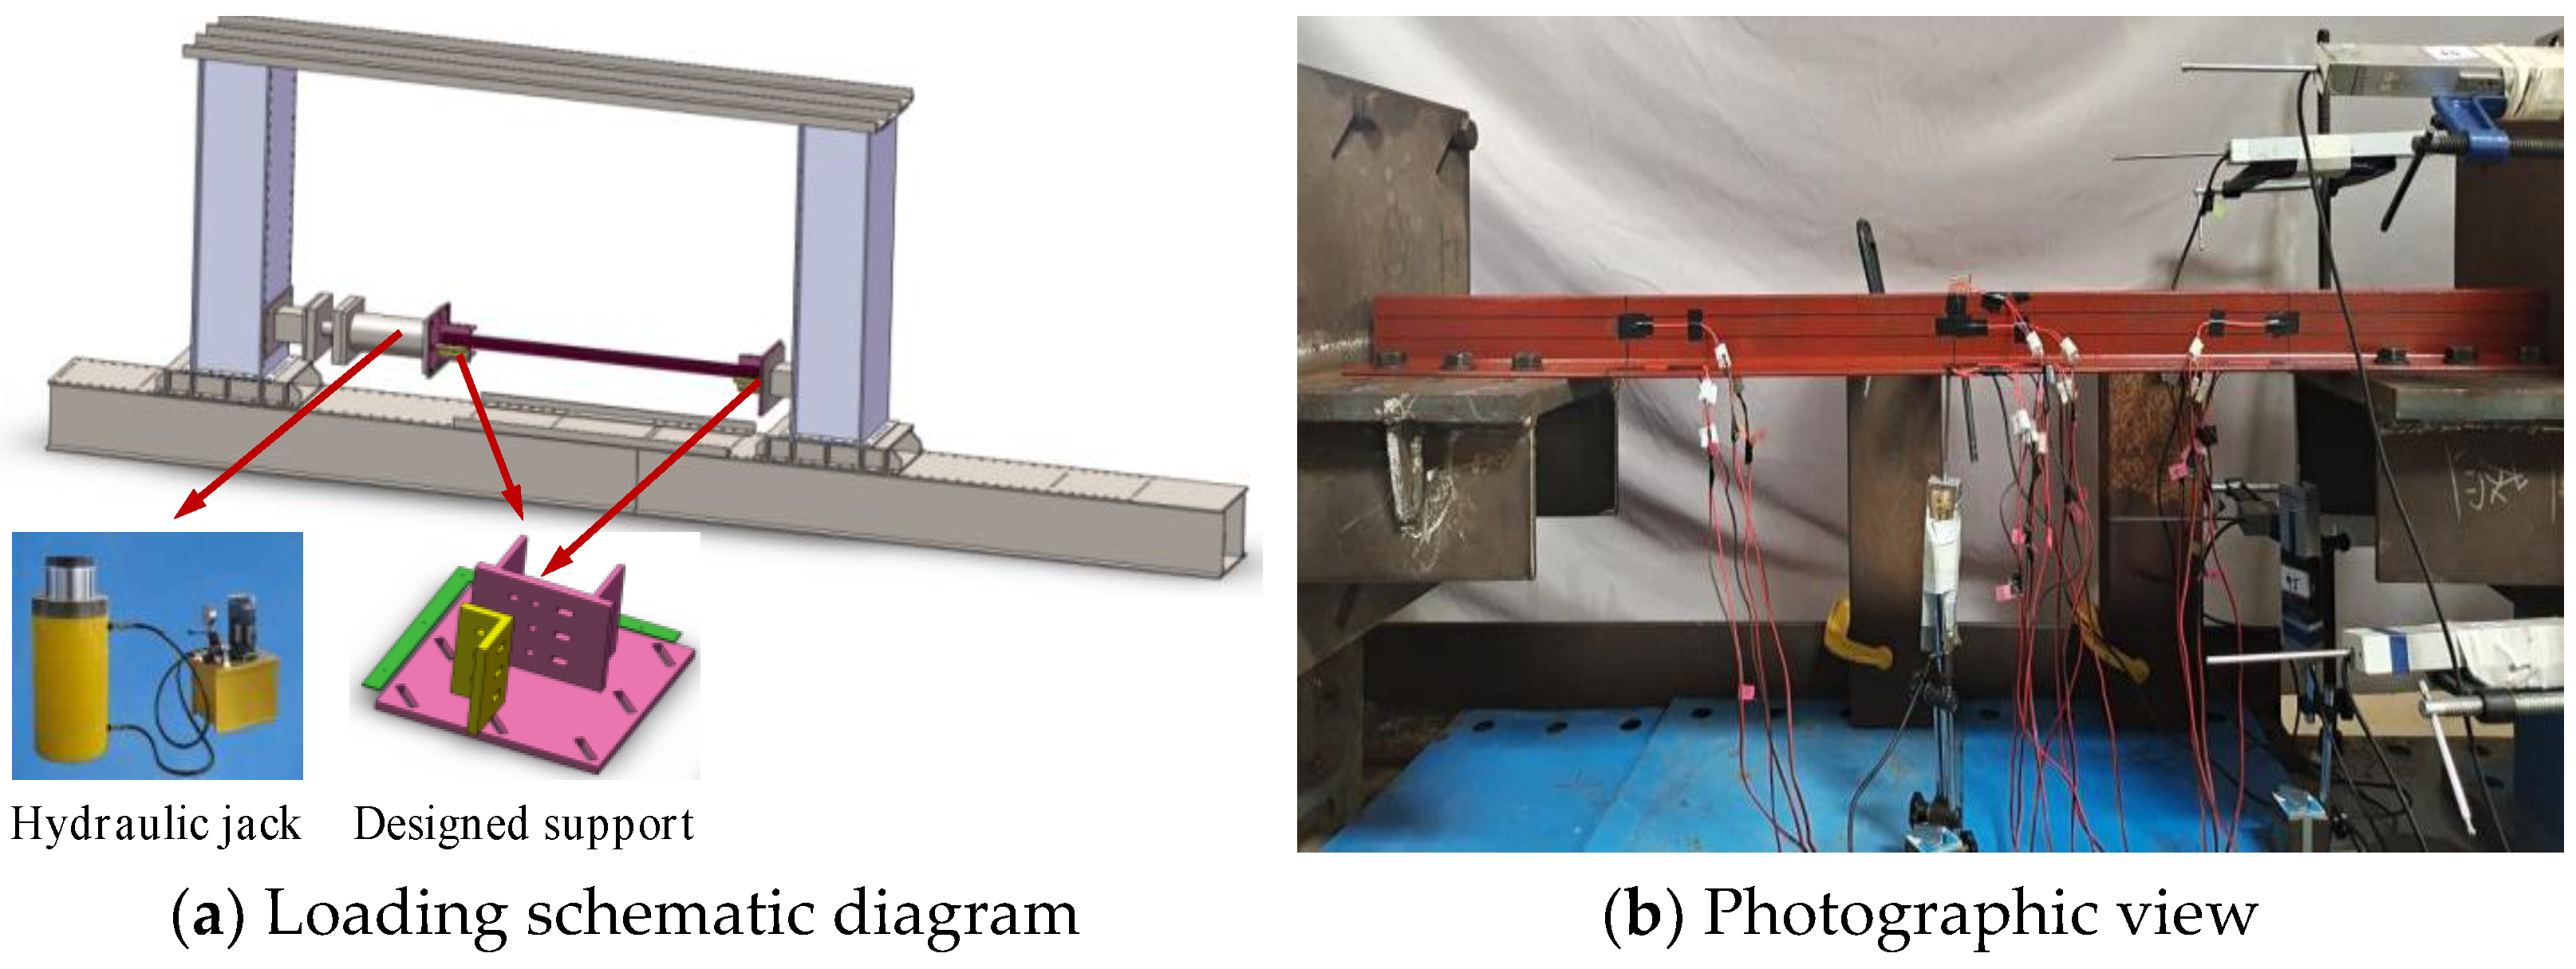
The eccentric compression loading setup for corroded angle sections is shown in Figure 10. During the loading test, pressure was applied using a hydraulic jack, with the specimen connected to the testing machine through specially designed supports at both ends. These supports were designed based on the loading characteristics and connection methods of bracing members in transmission towers and can be connected to the testing machine via bolts. The rectangular holes on the top of the supports not only accommodate various specifications of angle sections but also minimize errors during the connection process, ensuring uniform force distribution at both ends of the specimen.
Figure 10.
Experimental loading setup.
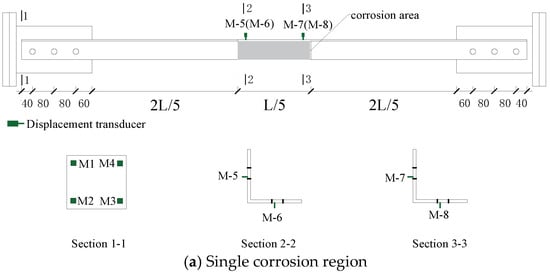
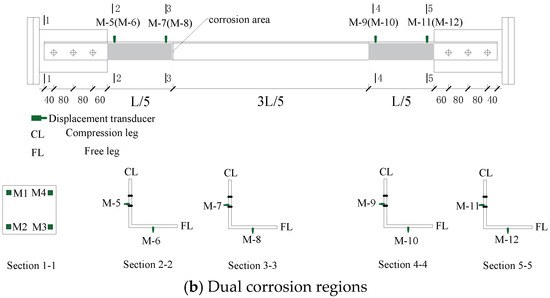
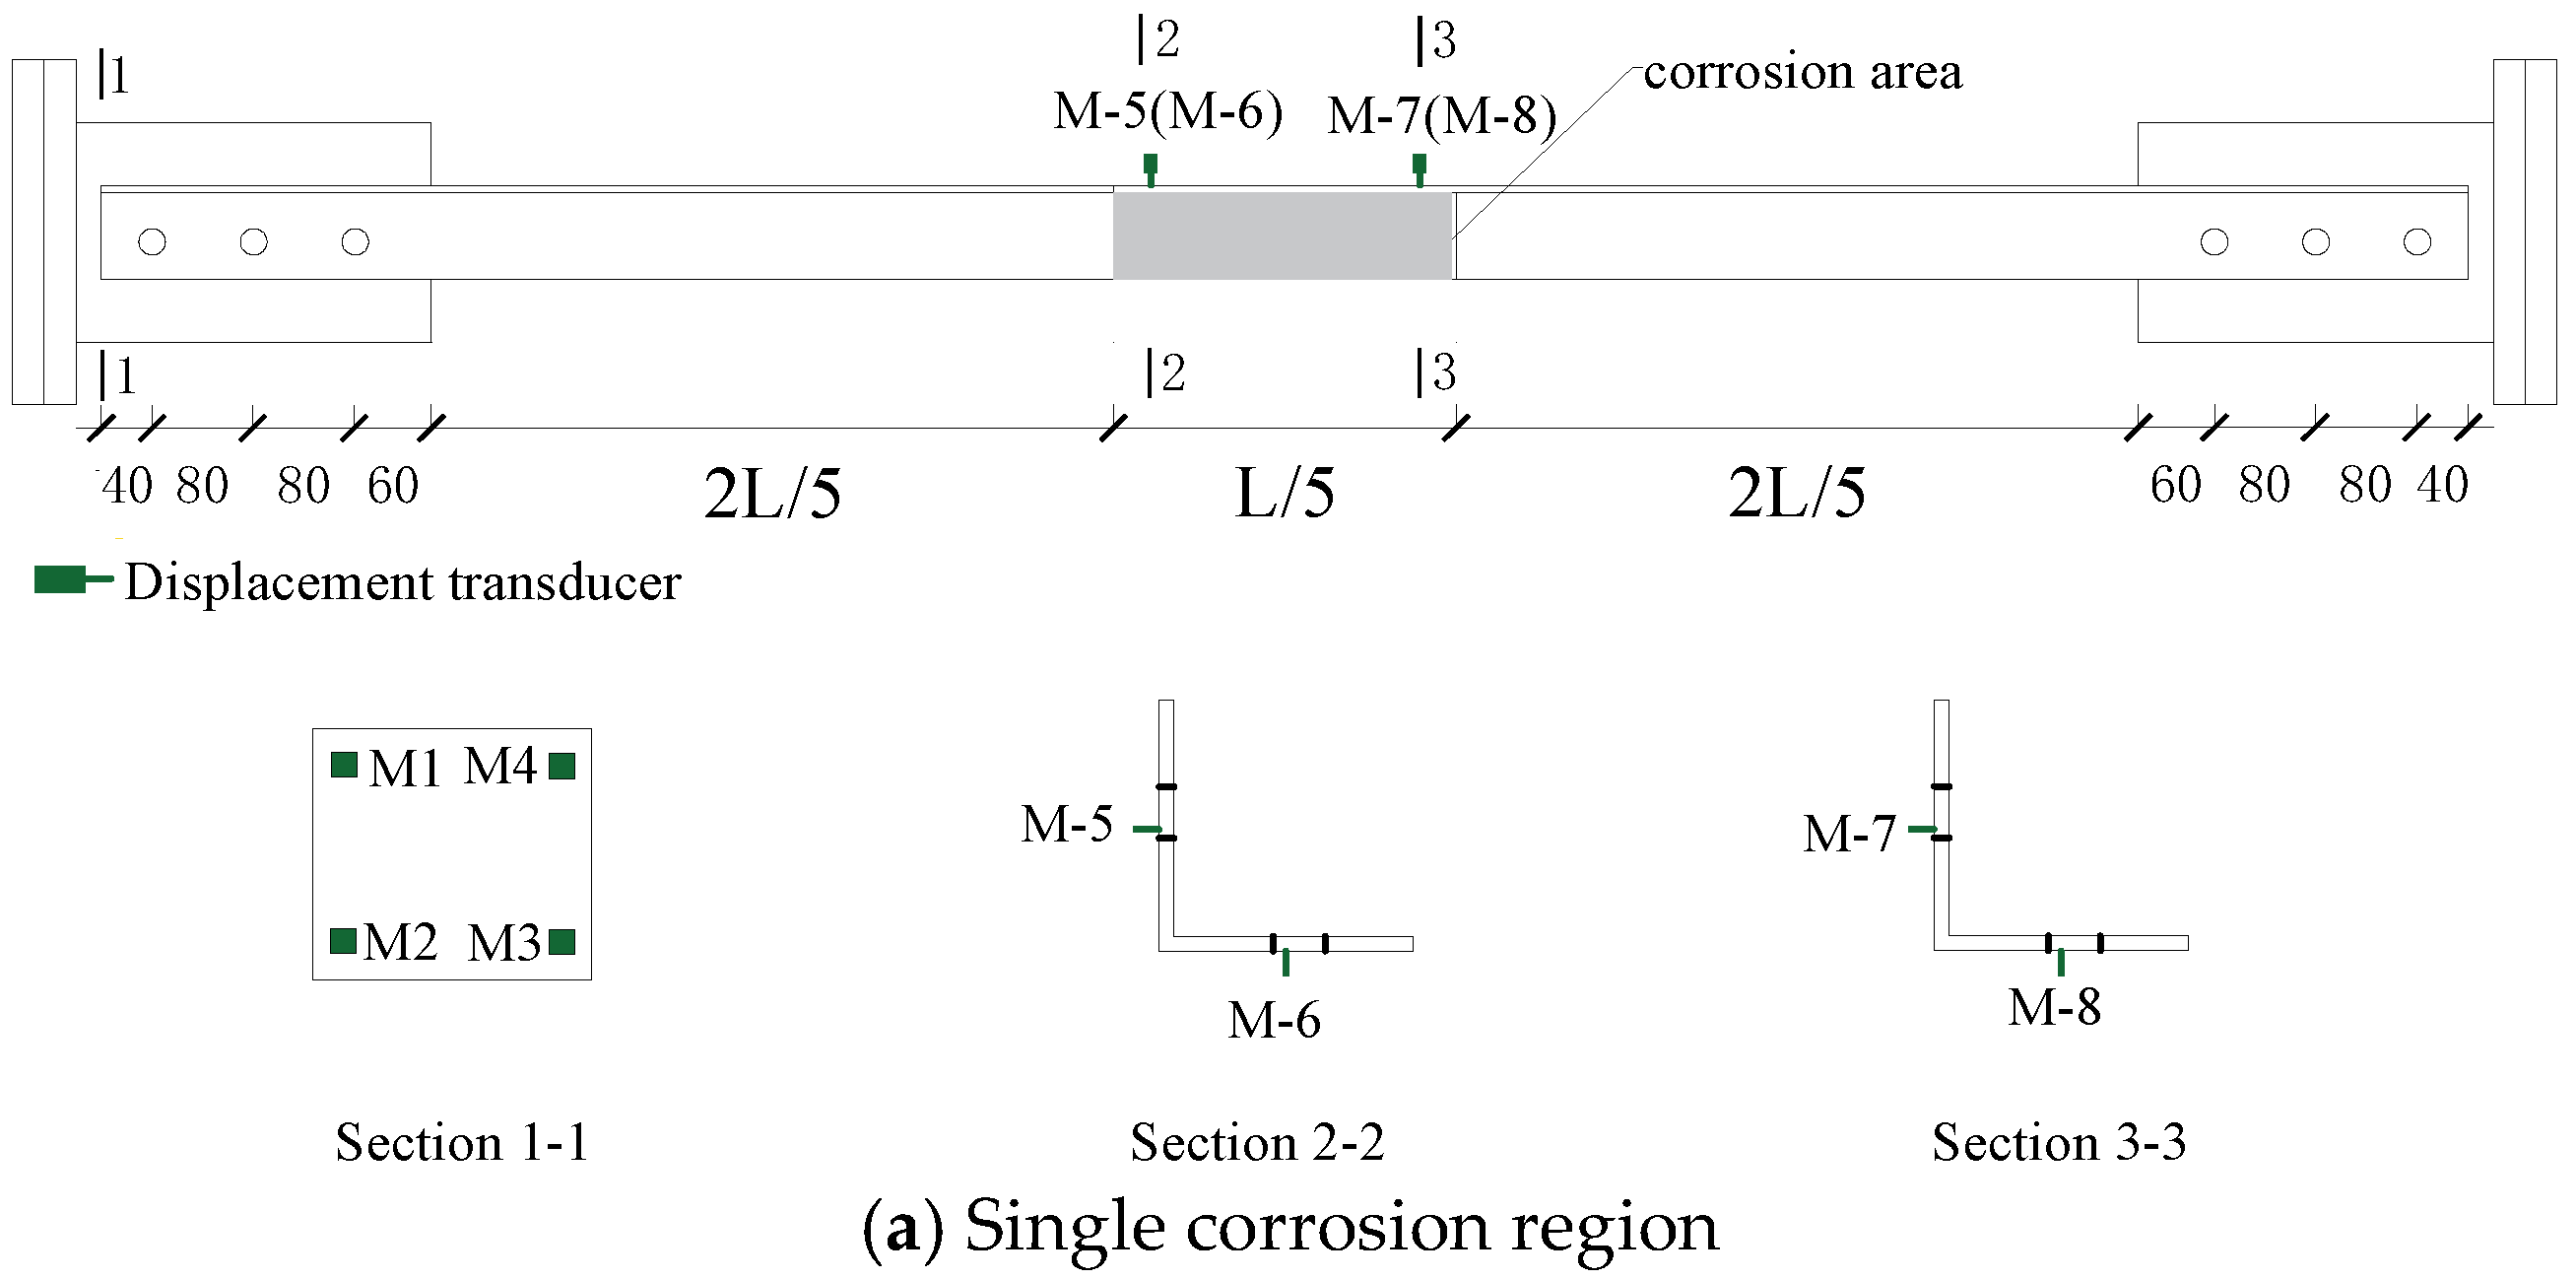
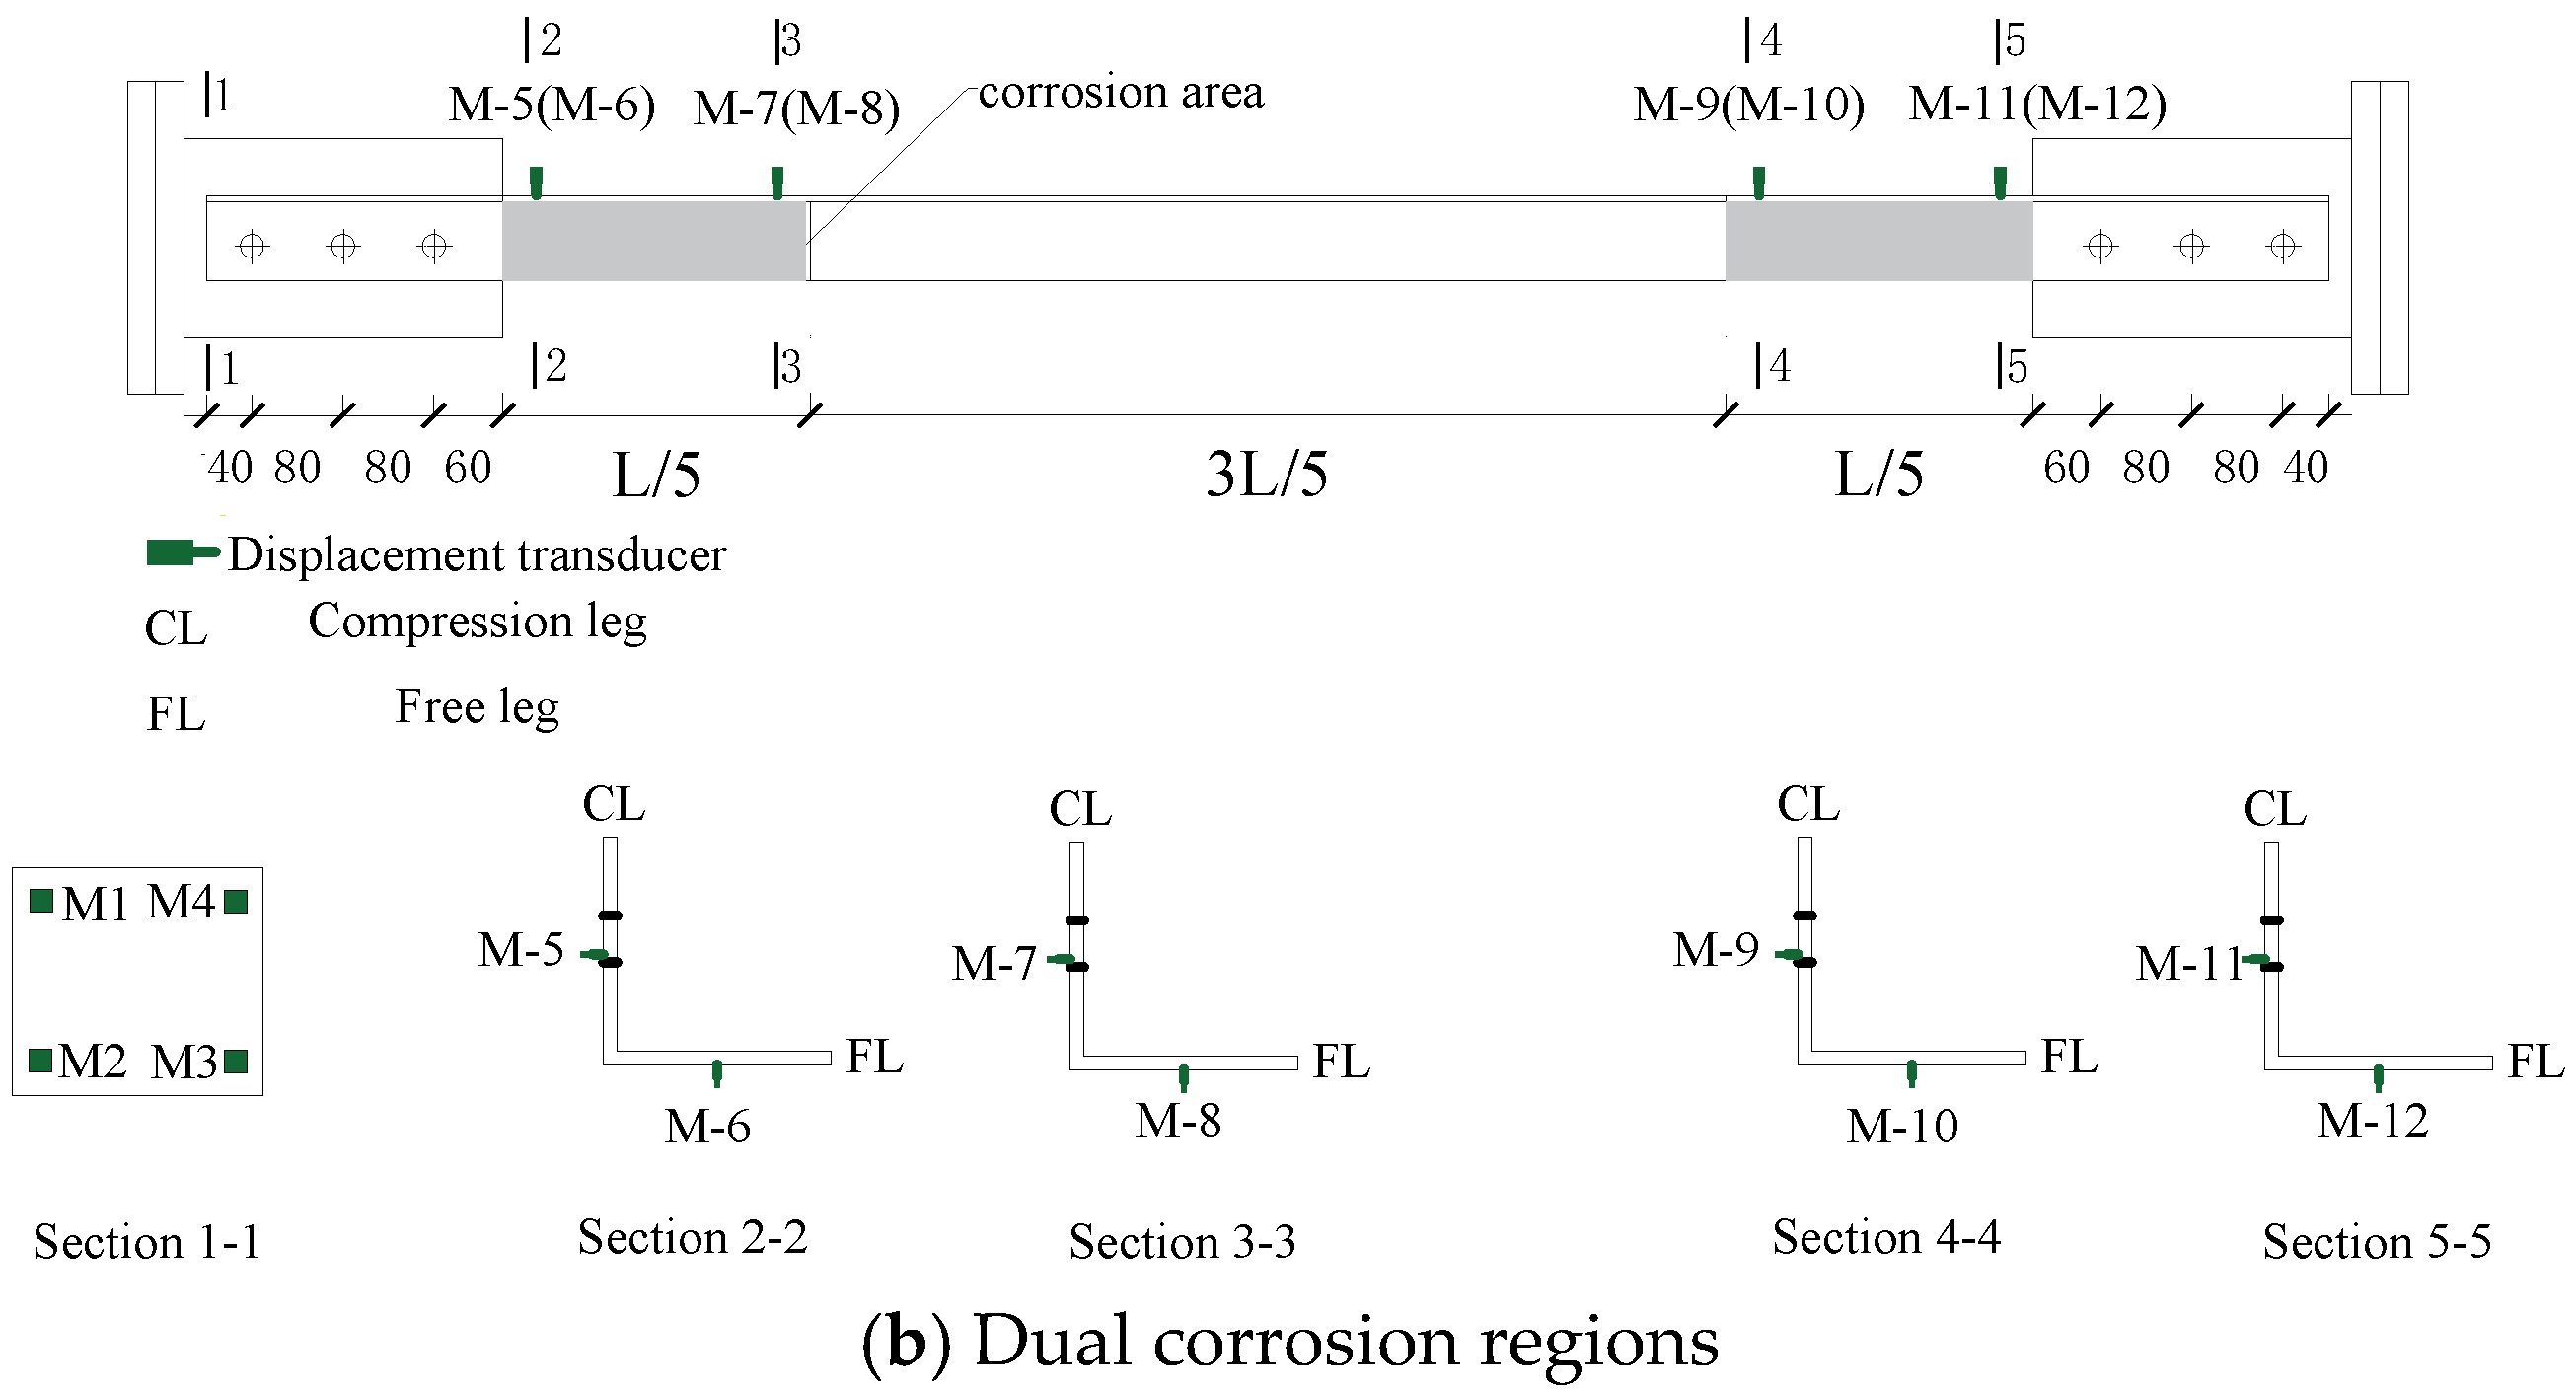
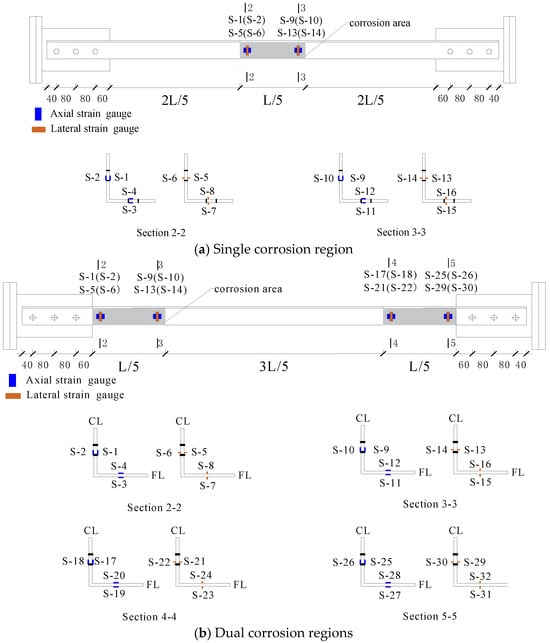
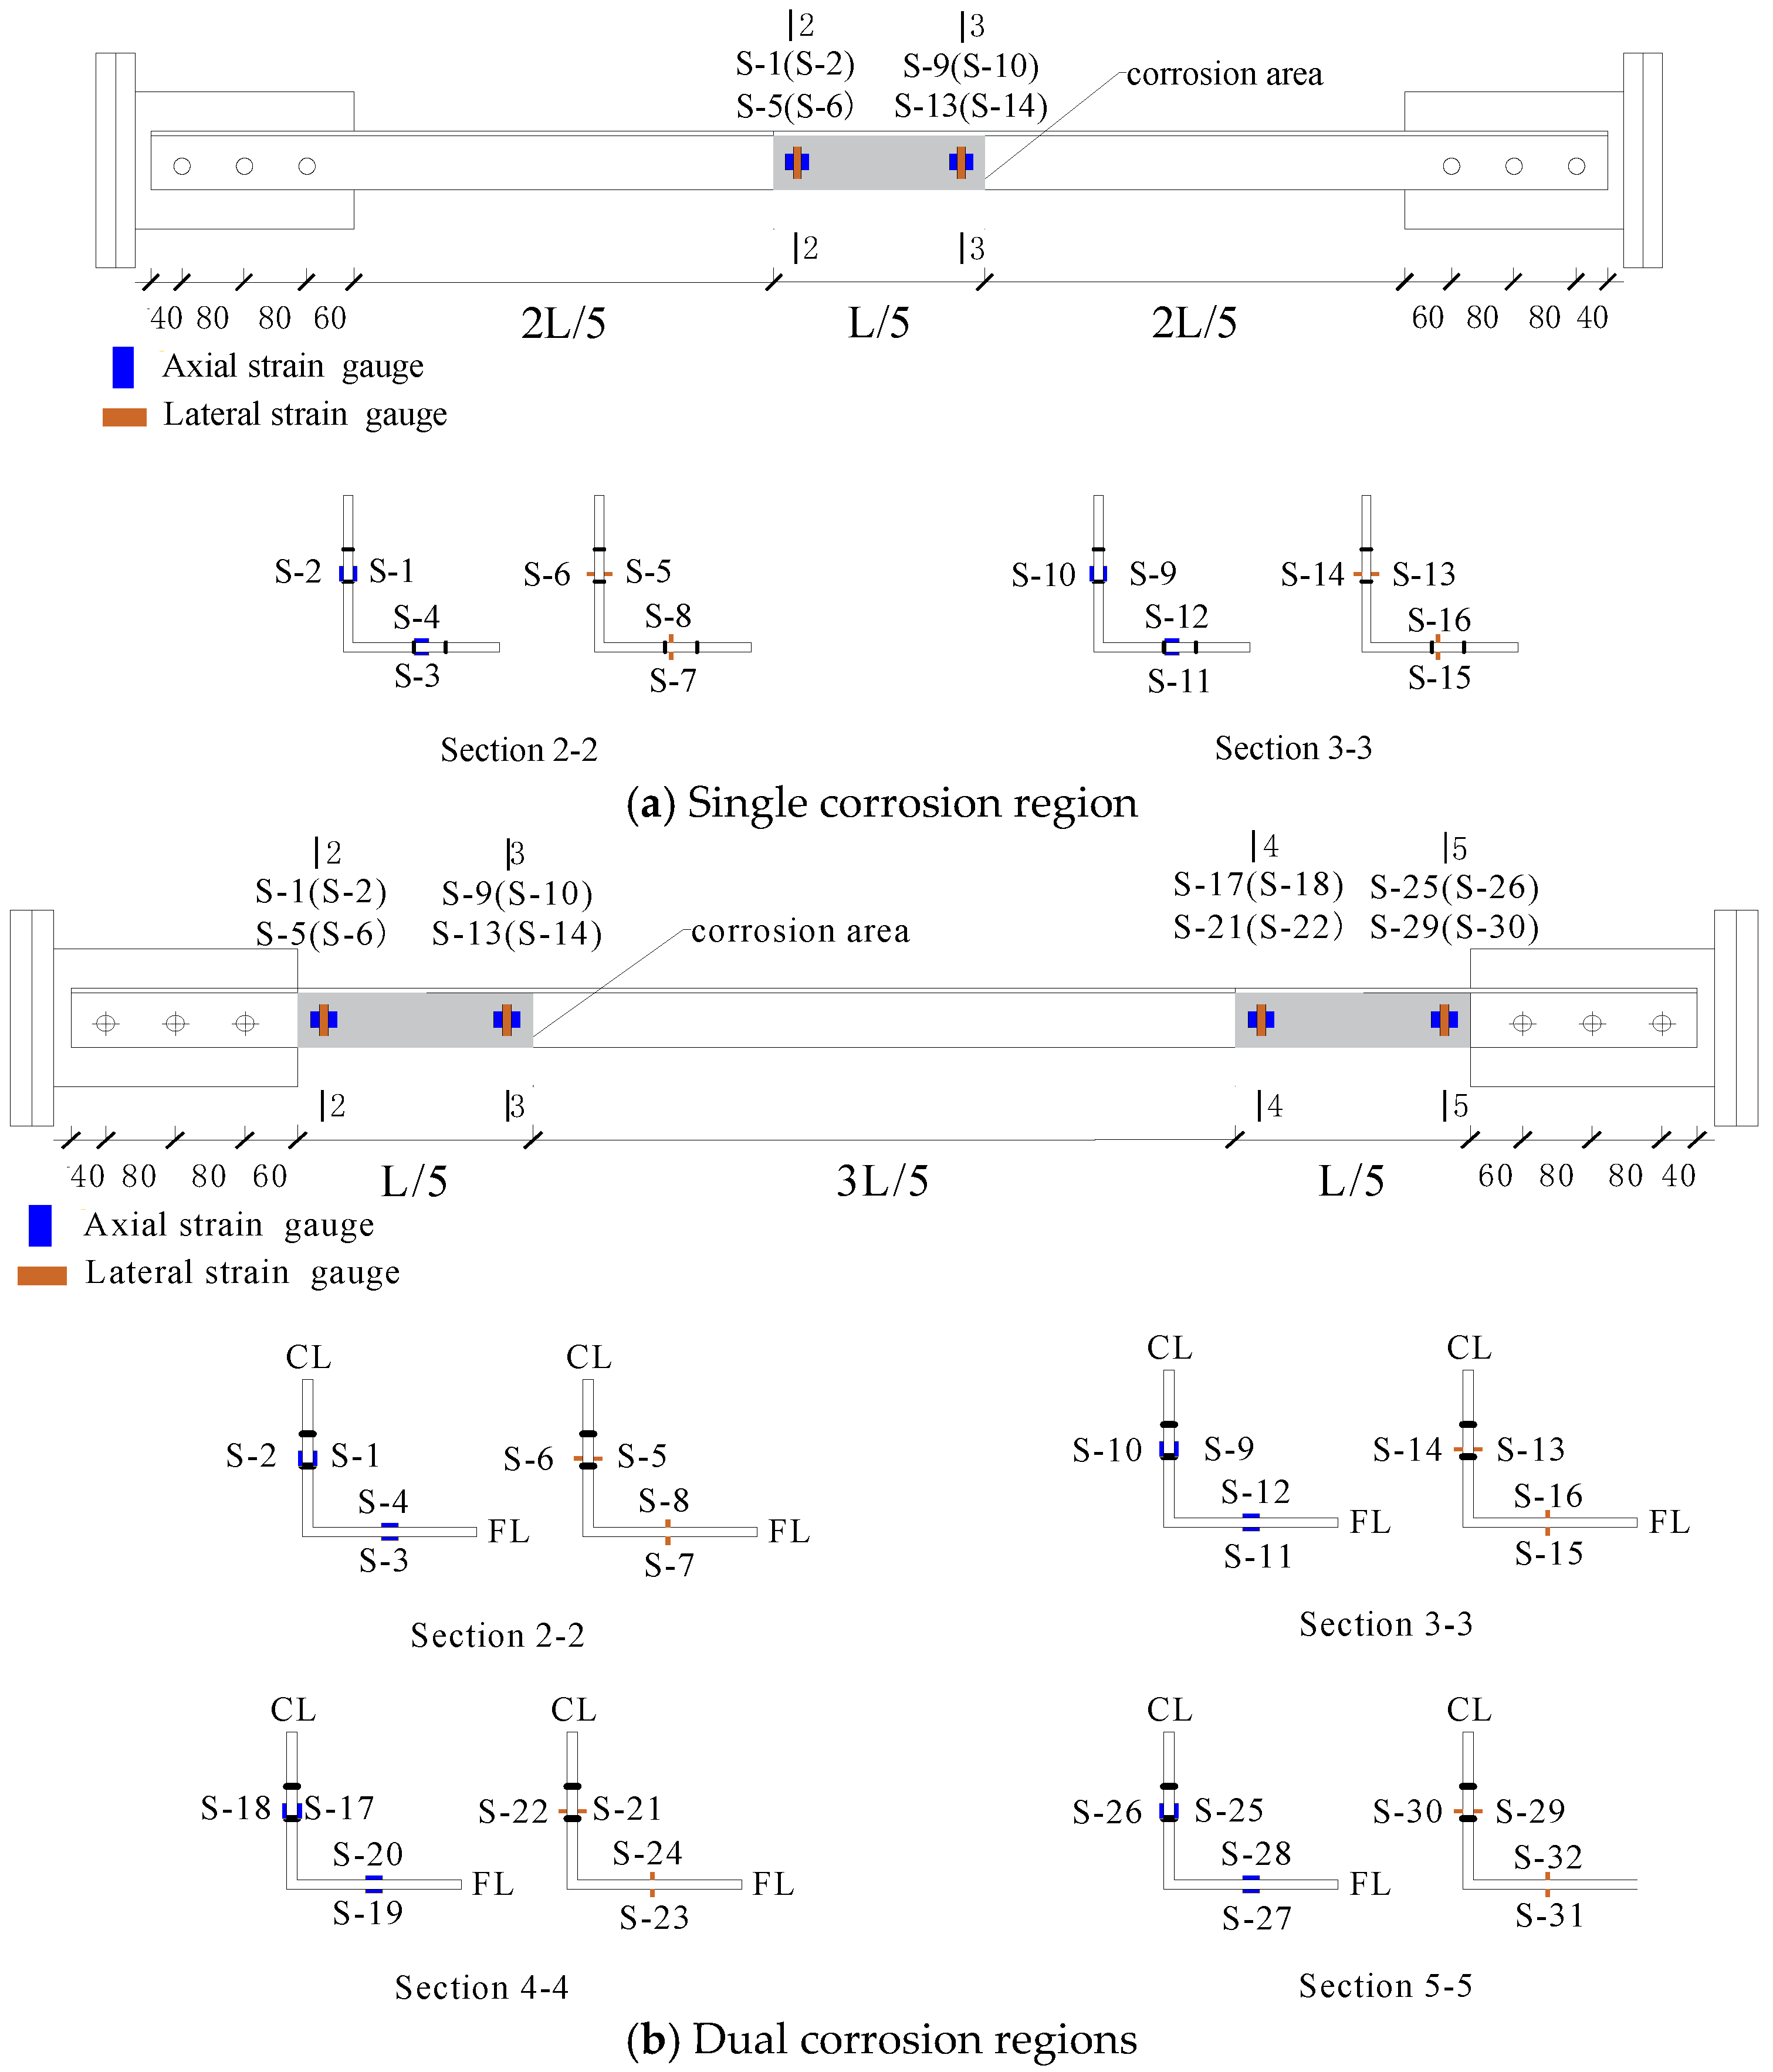
To measure axial and lateral displacements and strains during loading, four displacement gauges were arranged at the loading supports (Figure 11) to measure axial displacements. Additionally, two displacement gauges were placed at each end of the corrosion regions to monitor lateral displacements of the compression leg and free leg during loading. Similarly, Figure 12 illustrates the strain gauge arrangement, with four strain gauges placed at each end of the corrosion regions to continuously monitor deformations at the corrosion locations.
Figure 11.
Layout of the displacement transducers.
Figure 12.
Layout of the strain gauges.
During installation, a level was used to ensure that the specimens were horizontally positioned. The test employed a stepwise loading method controlled by hydraulic jacks, with a loading rate of 20 kN/s to ensure uniform force distribution. According to DL/T5486-2020 “Technical specification for design of tower structures of overhead transmission lines” [37], the theoretical load-bearing capacity of the specimens was calculated. Each loading step increased by 10% of the theoretical capacity until reaching 80%, after which increments were reduced to 5% of the theoretical capacity until failure or when the ultimate load dropped to 80%.
3.2. Test Results and Analysis
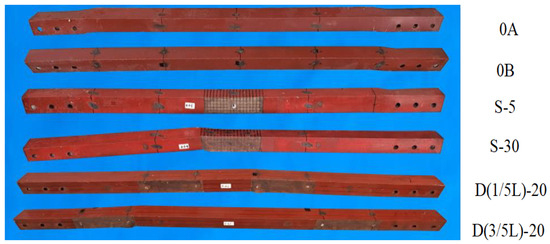
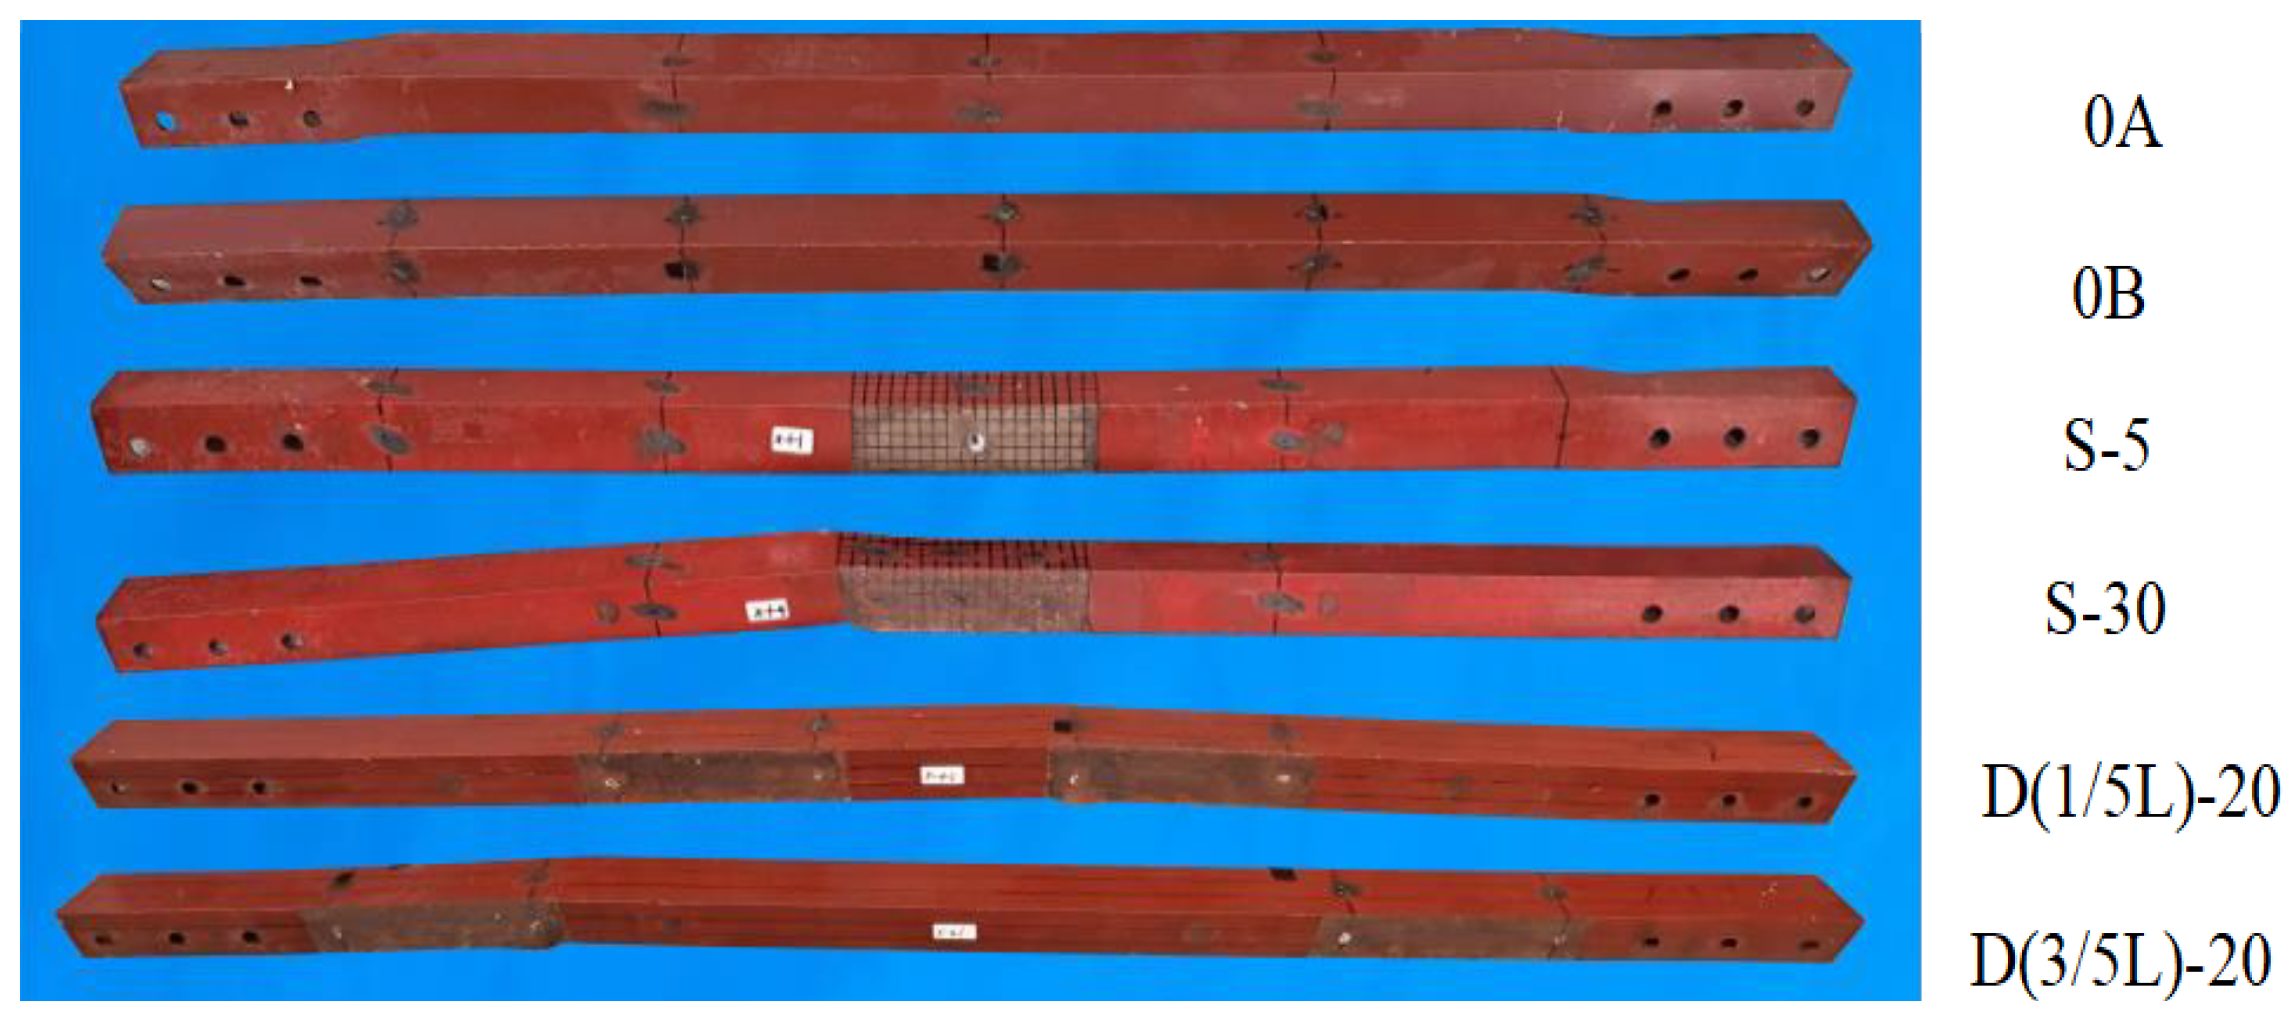
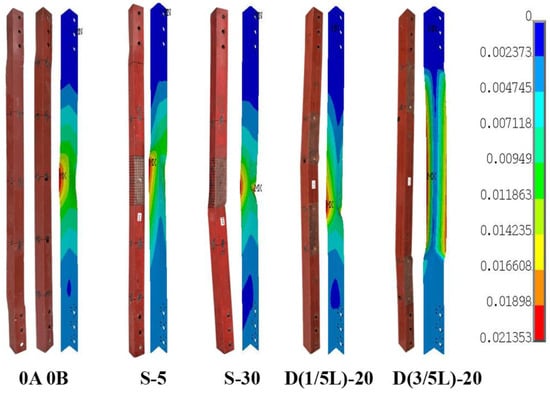
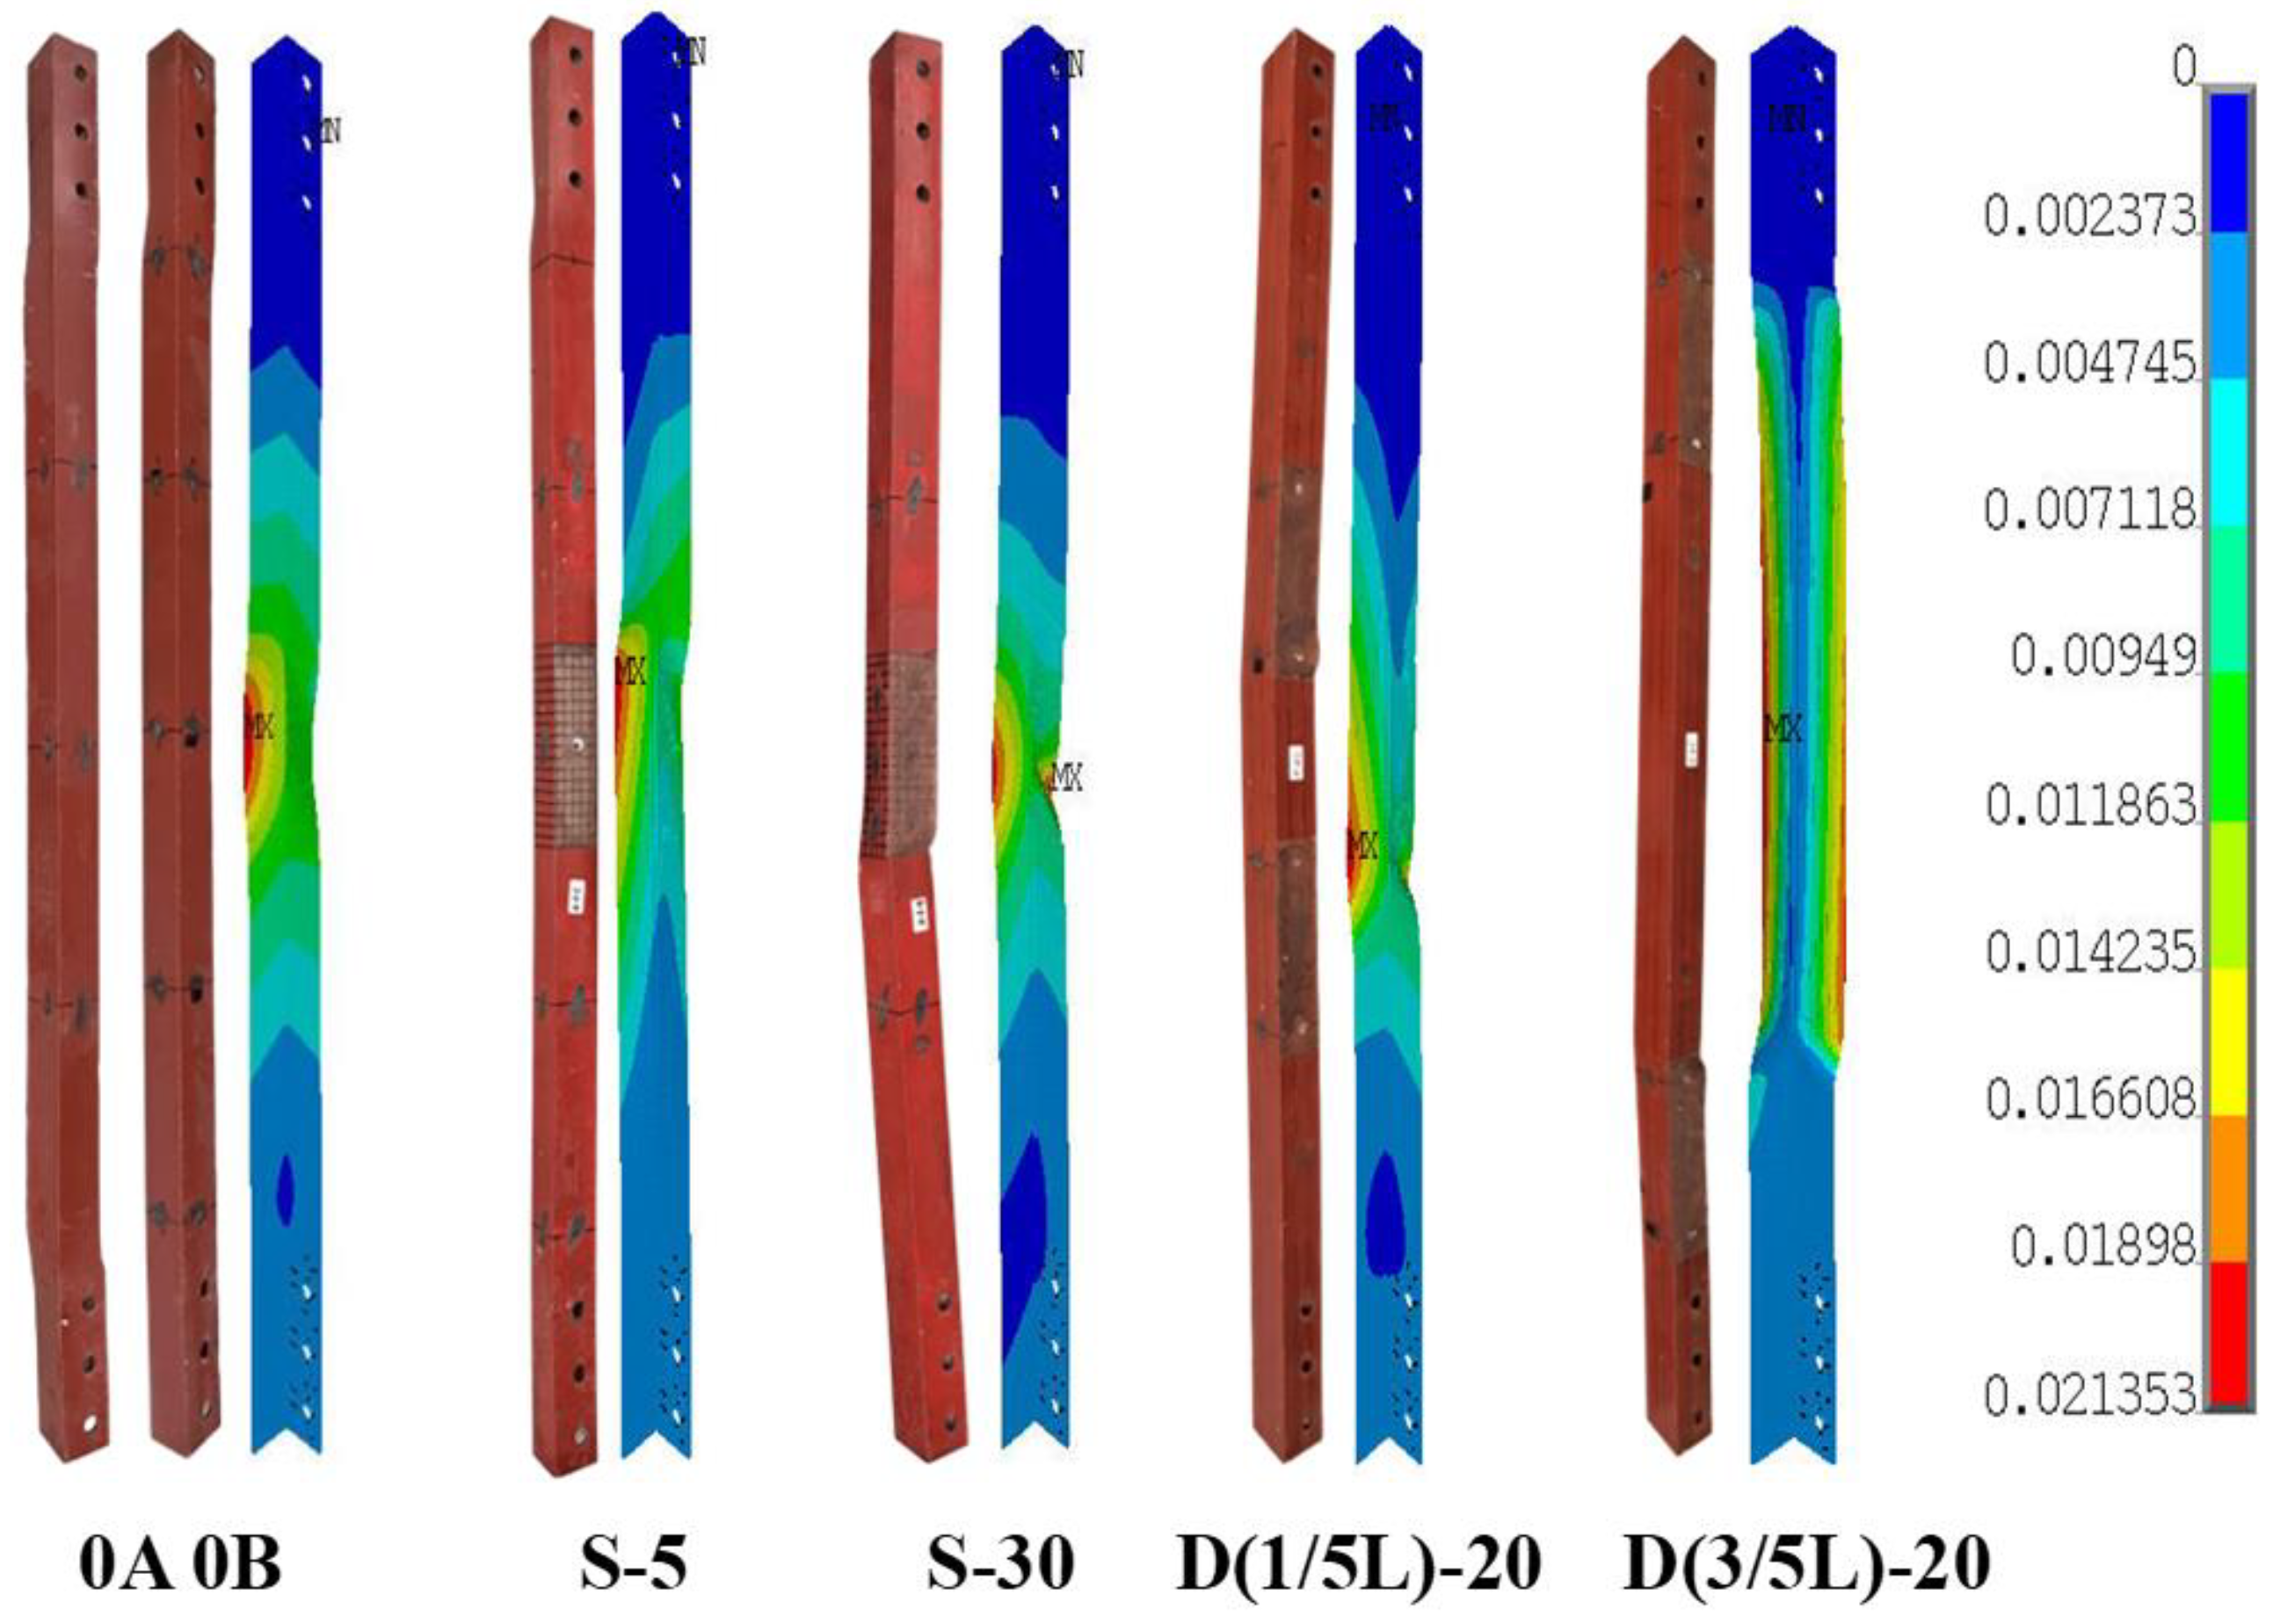
Figure 13 shows the failure modes of the angle section specimens. It was observed that when the sectional loss rate was 5%, the failure mode of the corroded specimens was similar to that of uncorroded specimens, exhibiting overall instability. When the sectional loss rates were 20% and 30%, the failure modes were localized within the corrosion zones, indicating localized instability. Due to the deeper corrosion at the edges caused by electrochemical tests, stress concentrations occurred at these locations during compression, leading to instability primarily at the edges of the corrosion zones.
Figure 13.
Failure modes of the steel angle specimens.
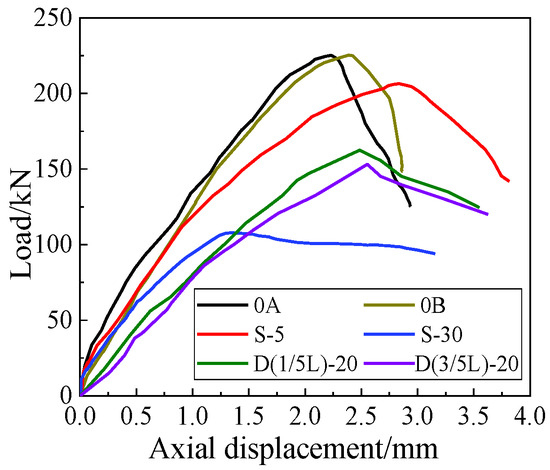
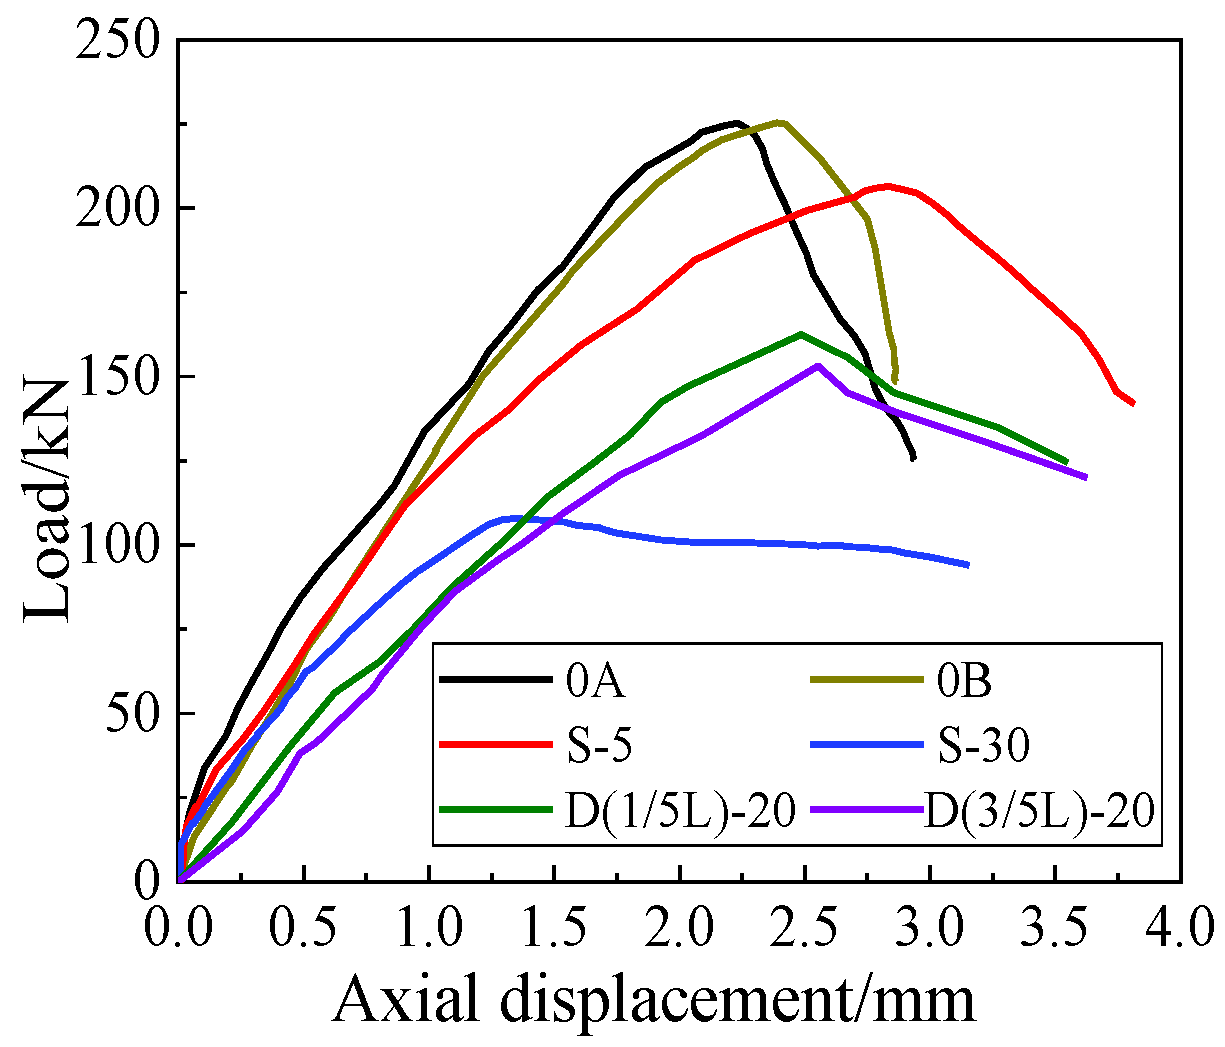
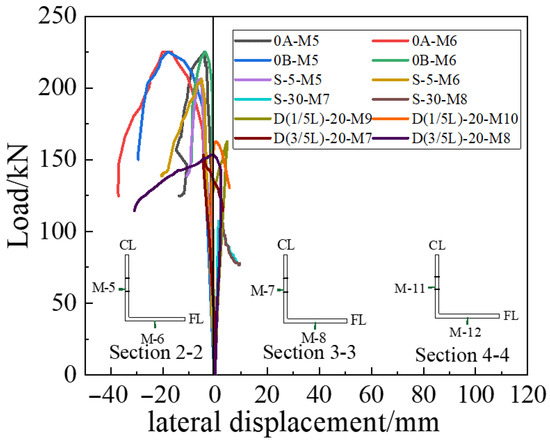
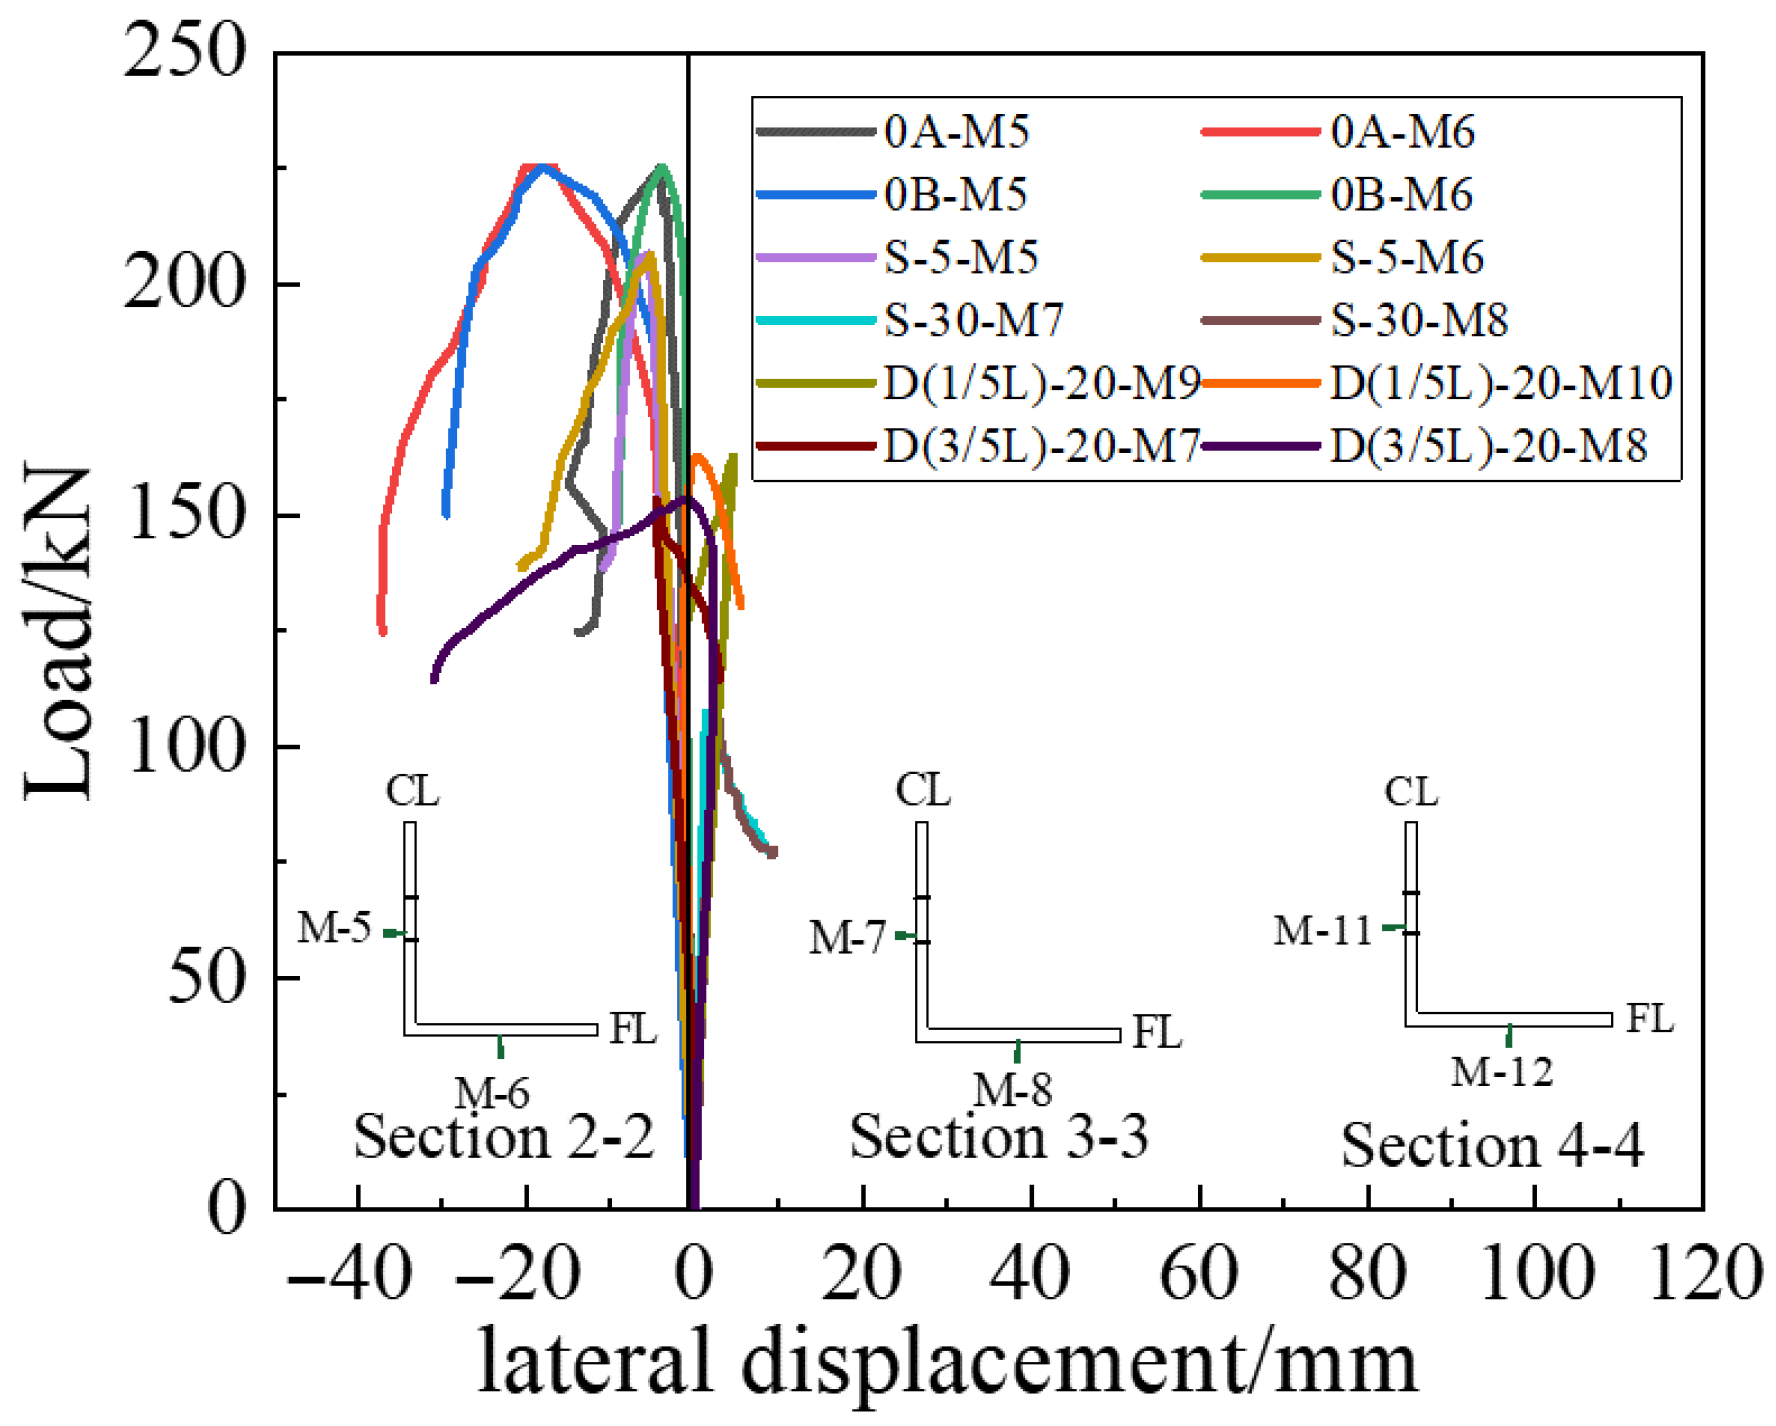
Figure 14 presents the axial load–displacement curves of the specimens, revealing differences in stiffness among specimens. This variation is mainly attributed to the reduction in effective cross-sectional area due to localized corrosion, resulting in decreased moment of inertia and overall stiffness. During the initial loading phase, the lateral load–displacement curves showed a gradual increase (Figure 15), indicating an elastic stage. Upon yielding of the steel in the localized corrosion regions, the overall stiffness of the specimens decreased, transitioning into plastic deformation with a sharp increase in lateral displacement.
Figure 14.
Axial load–displacement curve.
Figure 15.
Lateral load–displacement curve.
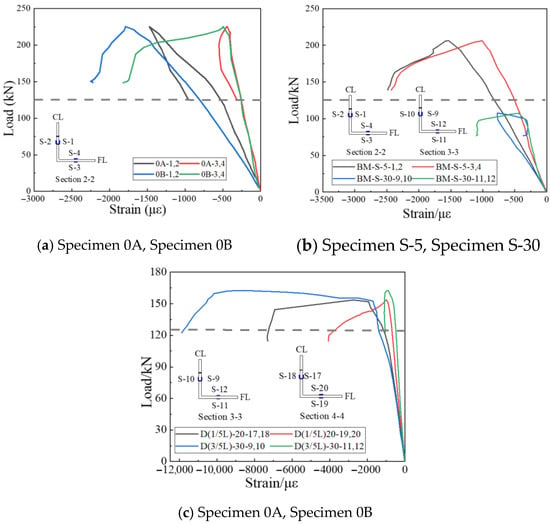
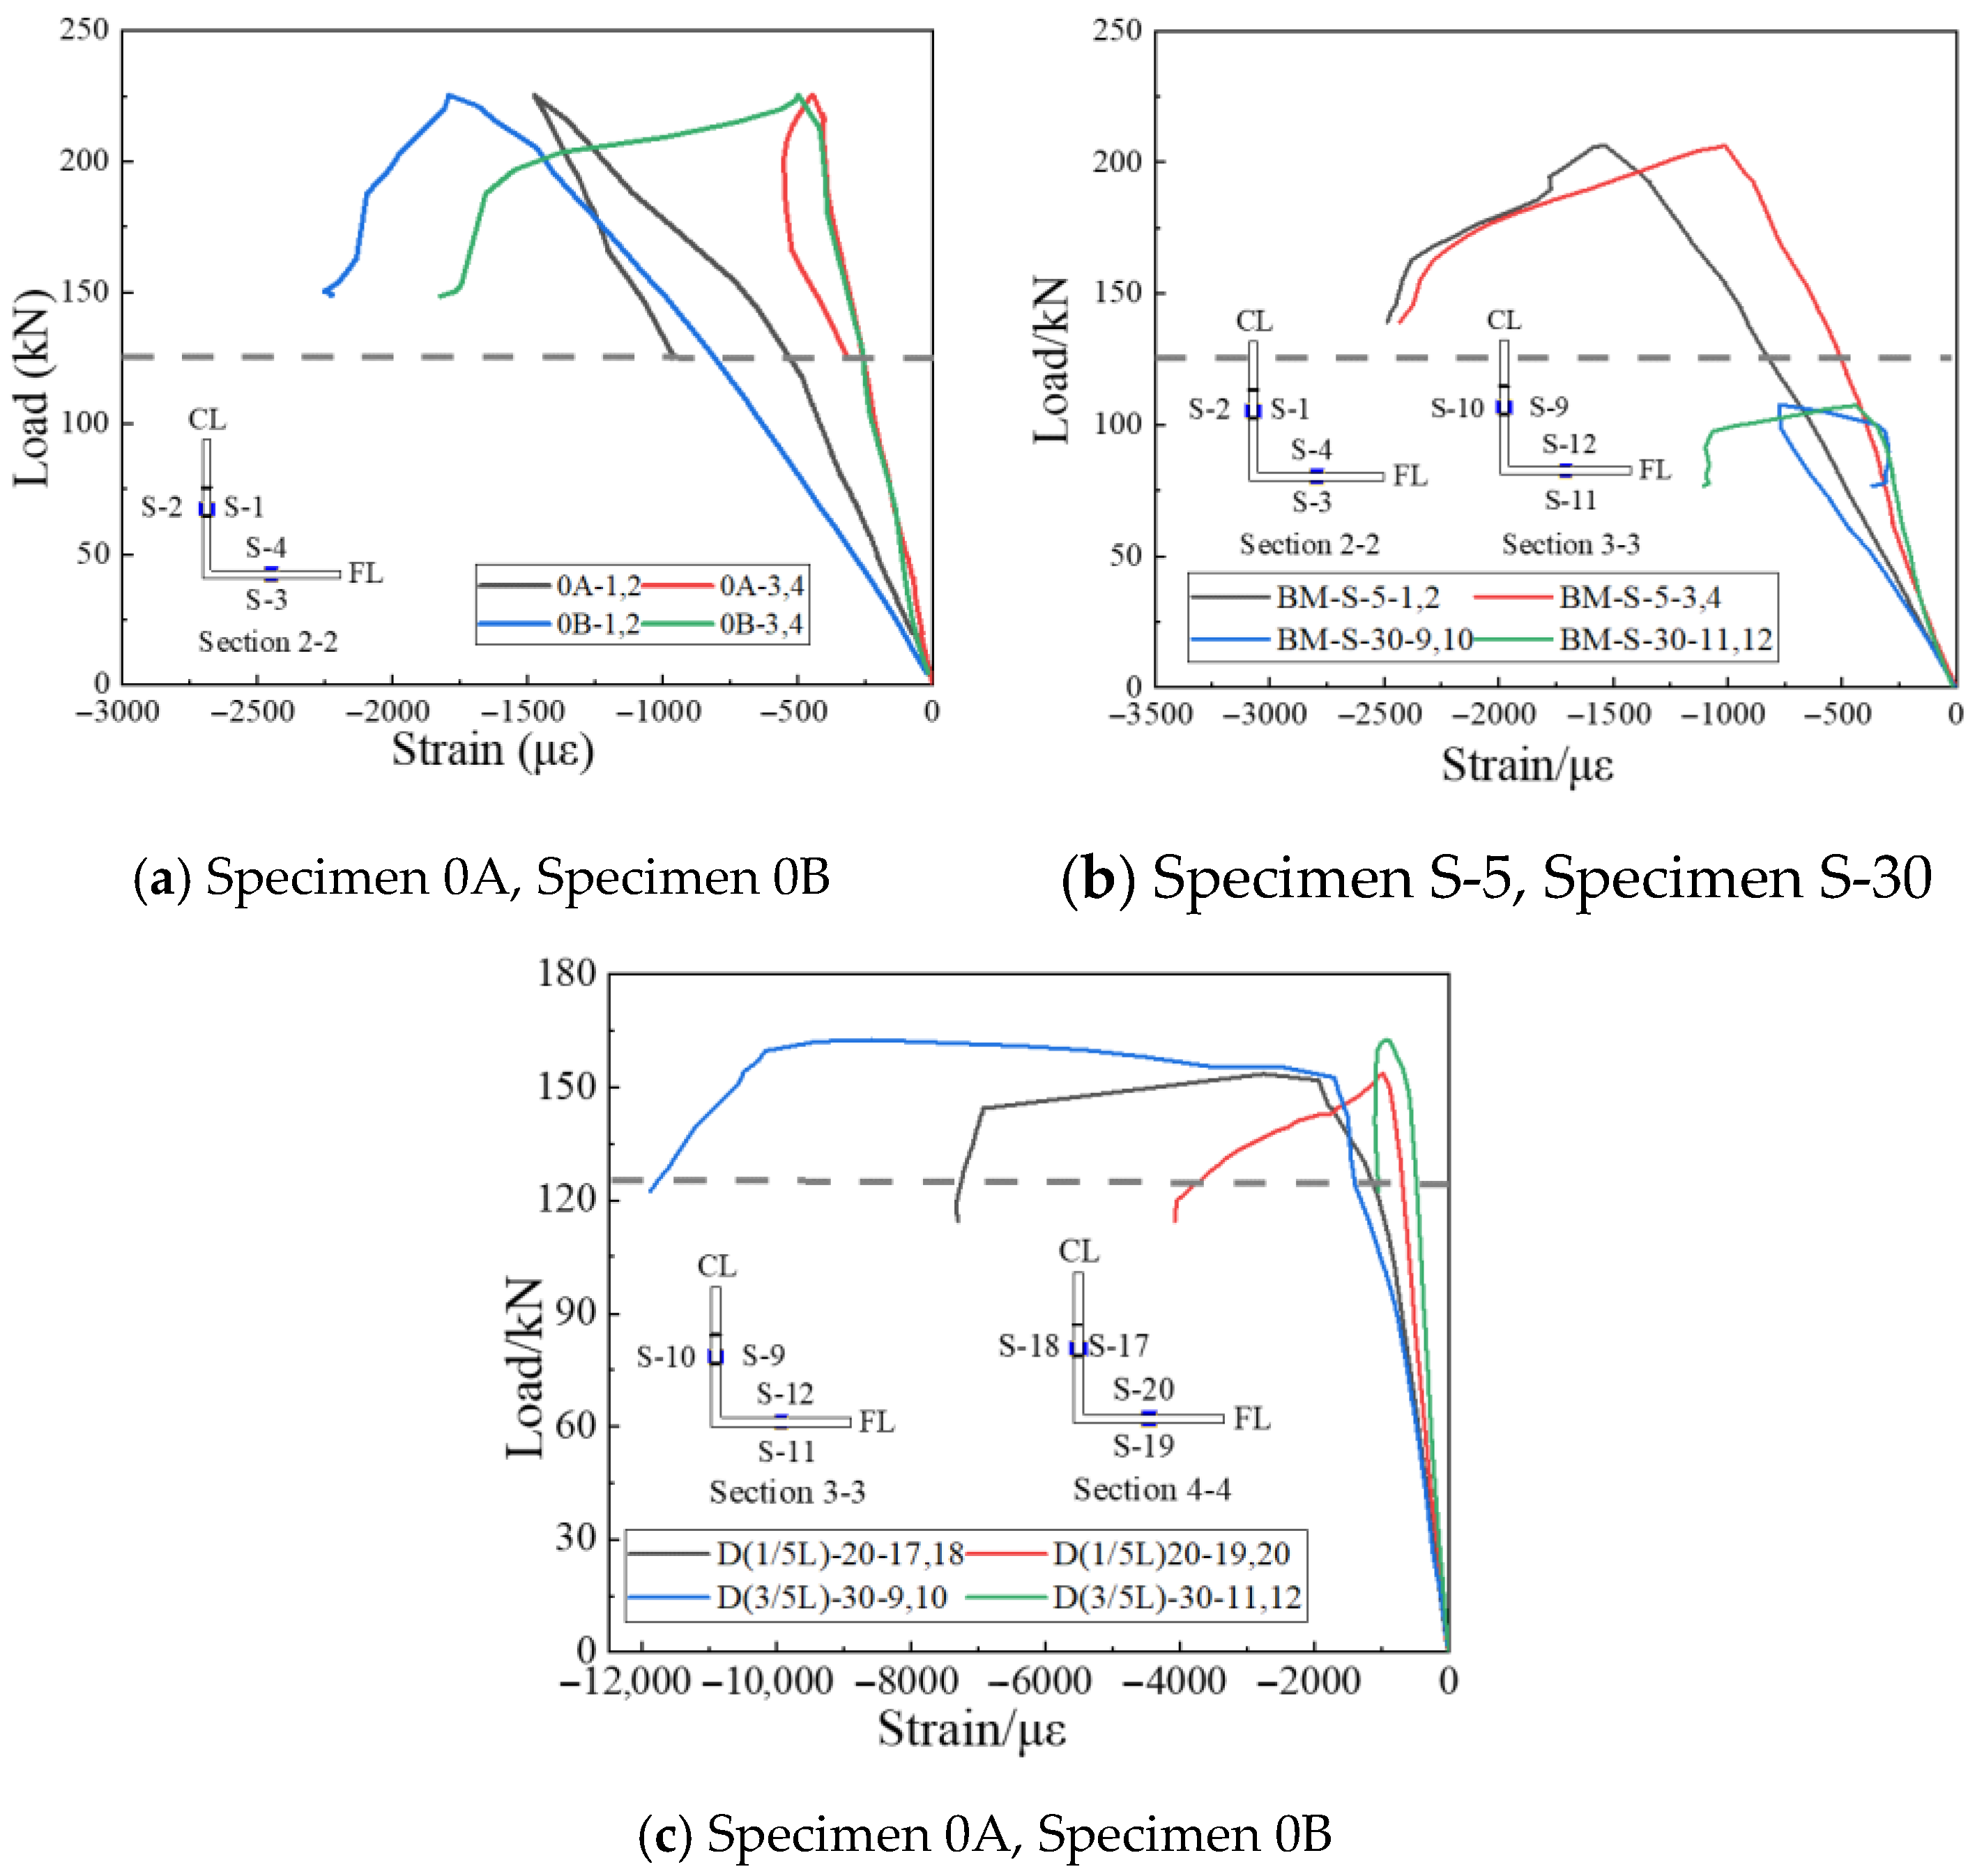
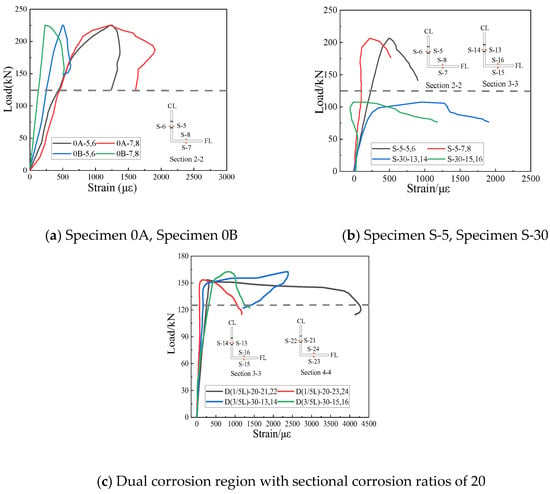
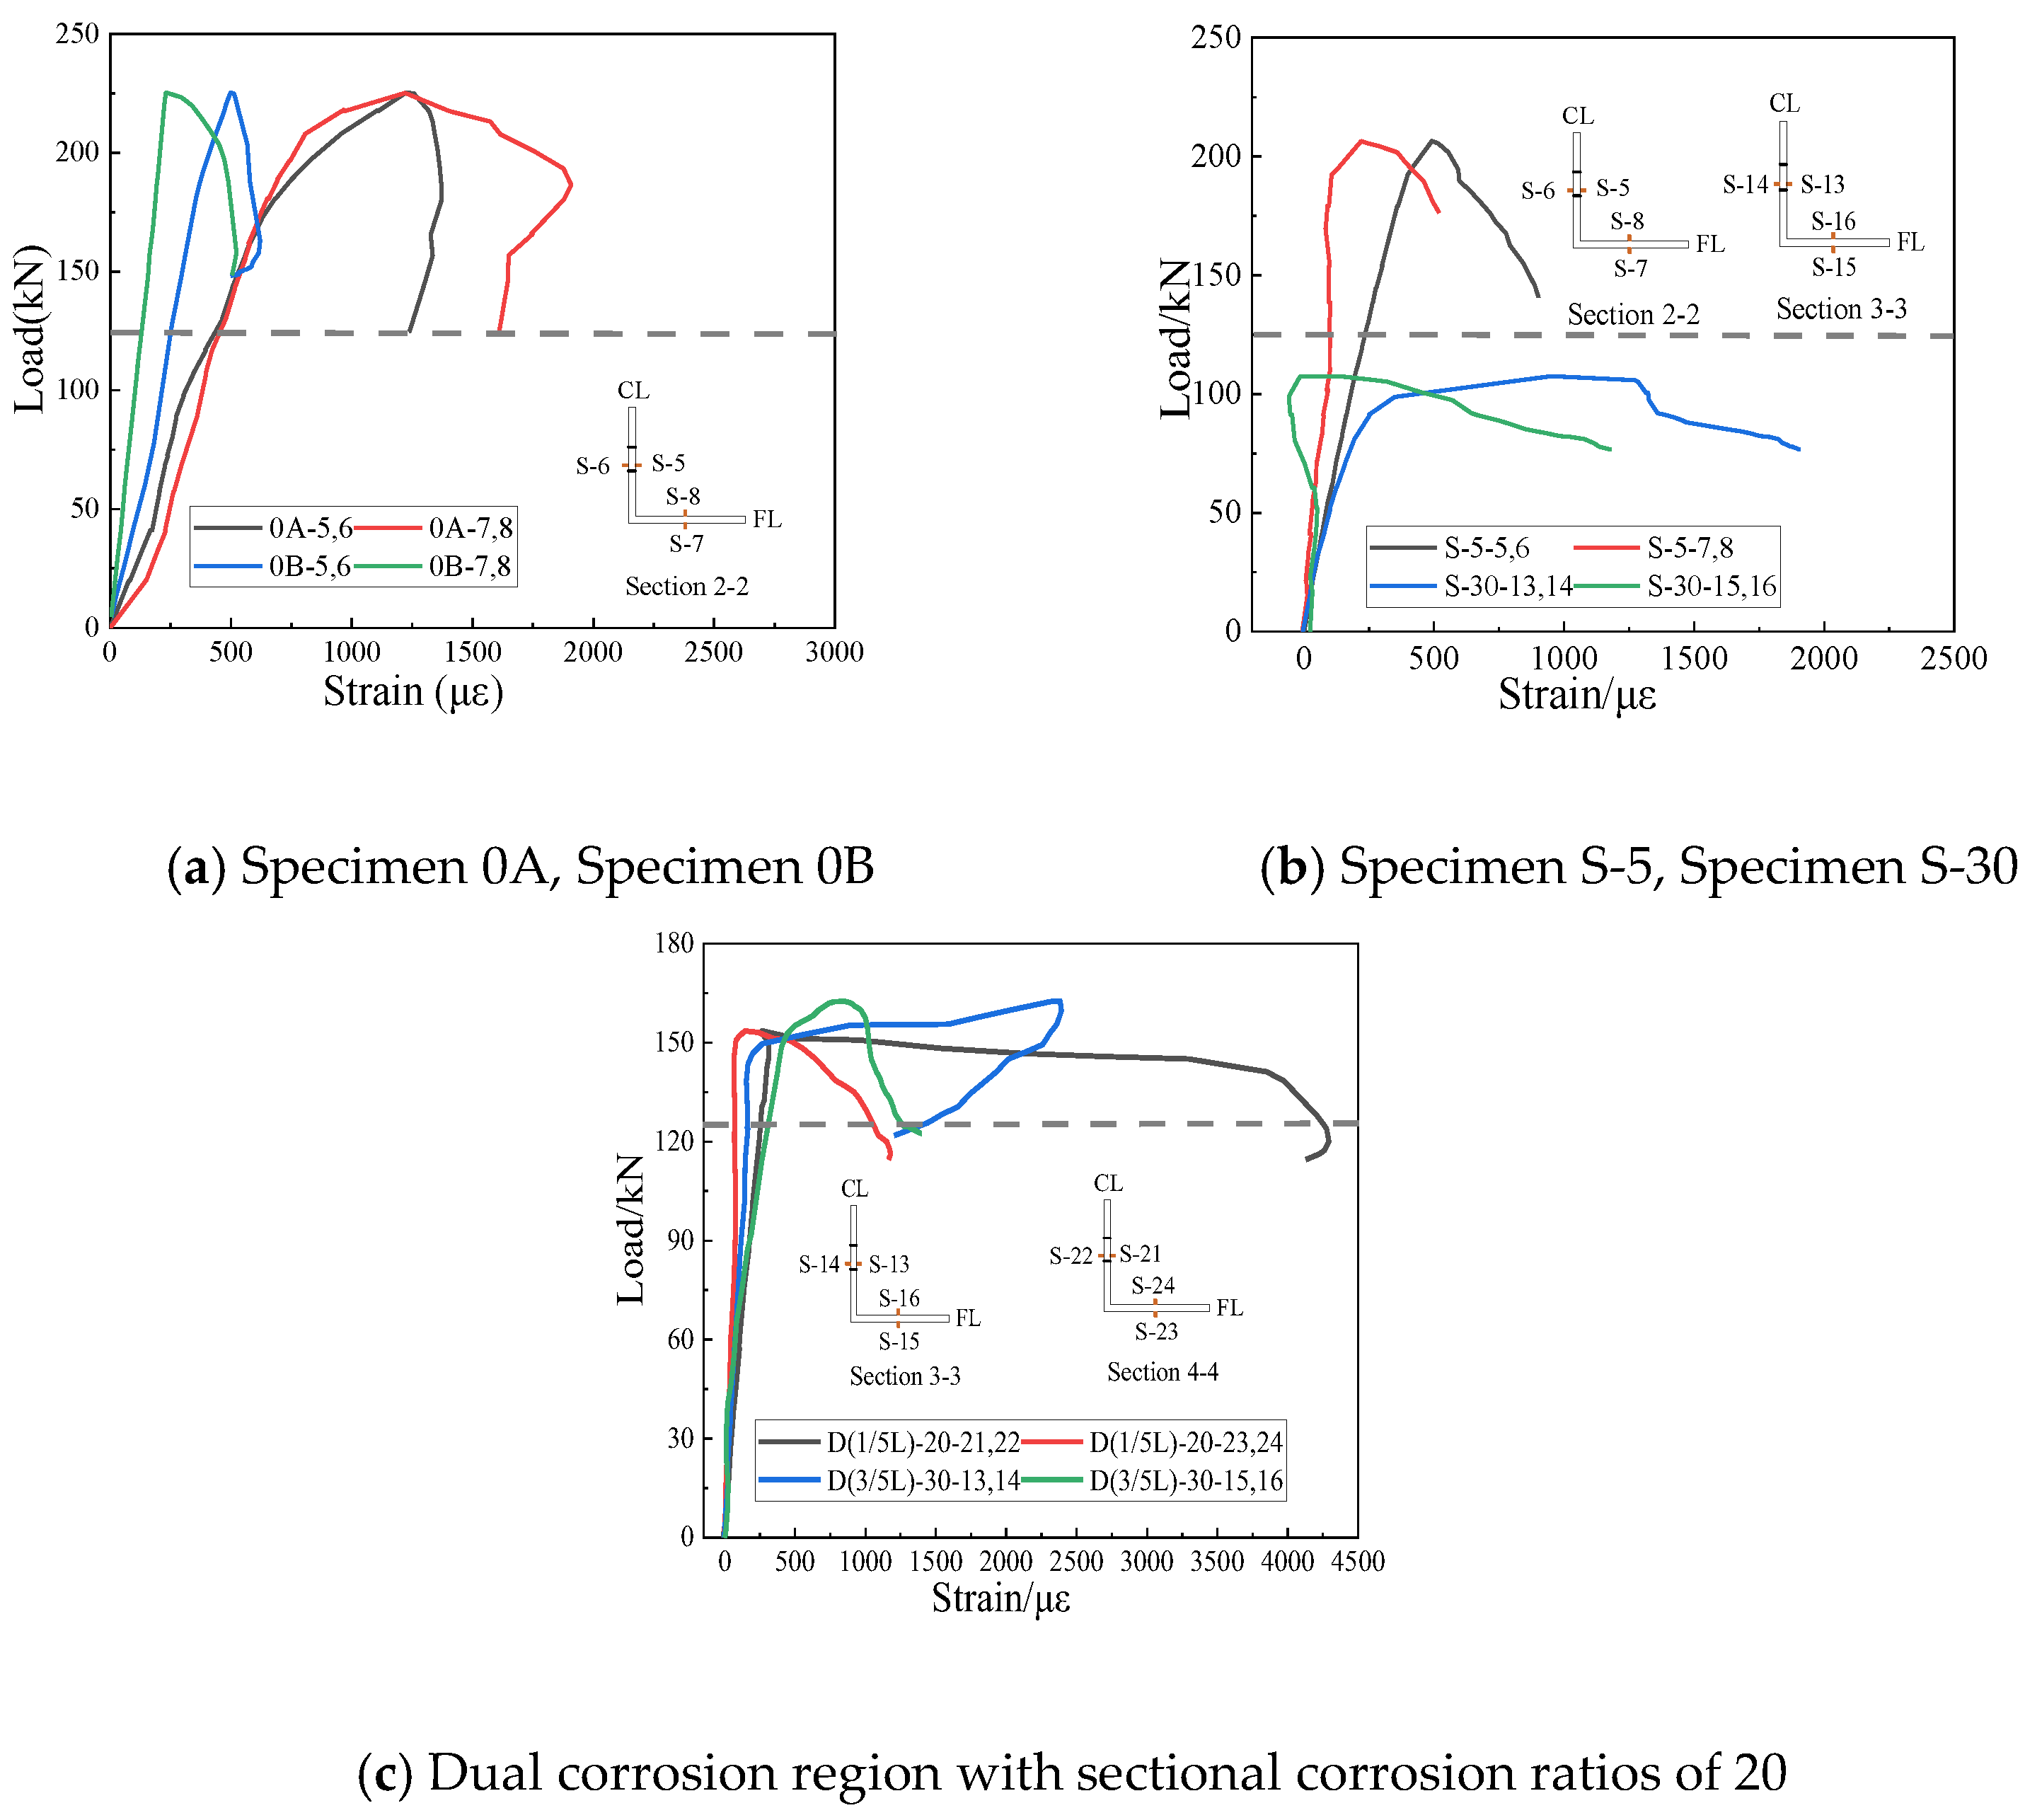
Figure 16 and Figure 17 depict the axial load–strain and lateral load–strain curves of the specimens, respectively. During the initial loading phase, strains increased slowly under different corrosion parameters, with minimal differences among them. After reaching yield, significant differences emerged. For example, at yield of specimen D(1/5L)-20, the axial load–strain and lateral load–strain values for the compression leg were 0.3% and 0.03%, while those for the free leg were 0.1% and 0.02%. Strains in the compression leg were greater than those in the free leg, consistent across both corroded and uncorroded specimens. This phenomenon is primarily due to the direct axial loading on the compression leg, whereas the free leg does not directly bear the load. Especially after corrosion, the compression leg experiences reduced local effective bearing capacity and stiffness, making it more prone to larger strains, while the free leg serves mainly as a stabilizer, resulting in smaller strains.
Figure 16.
Axial strain-load curve at the localized failure point of the angle steel.
Figure 17.
Lateral strain-load curve at the localized failure point of the angle steel.
4. Numerical Analysis
4.1. Finite Element Model and Validation
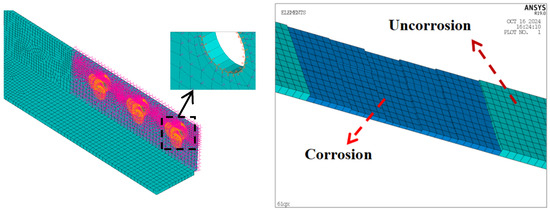
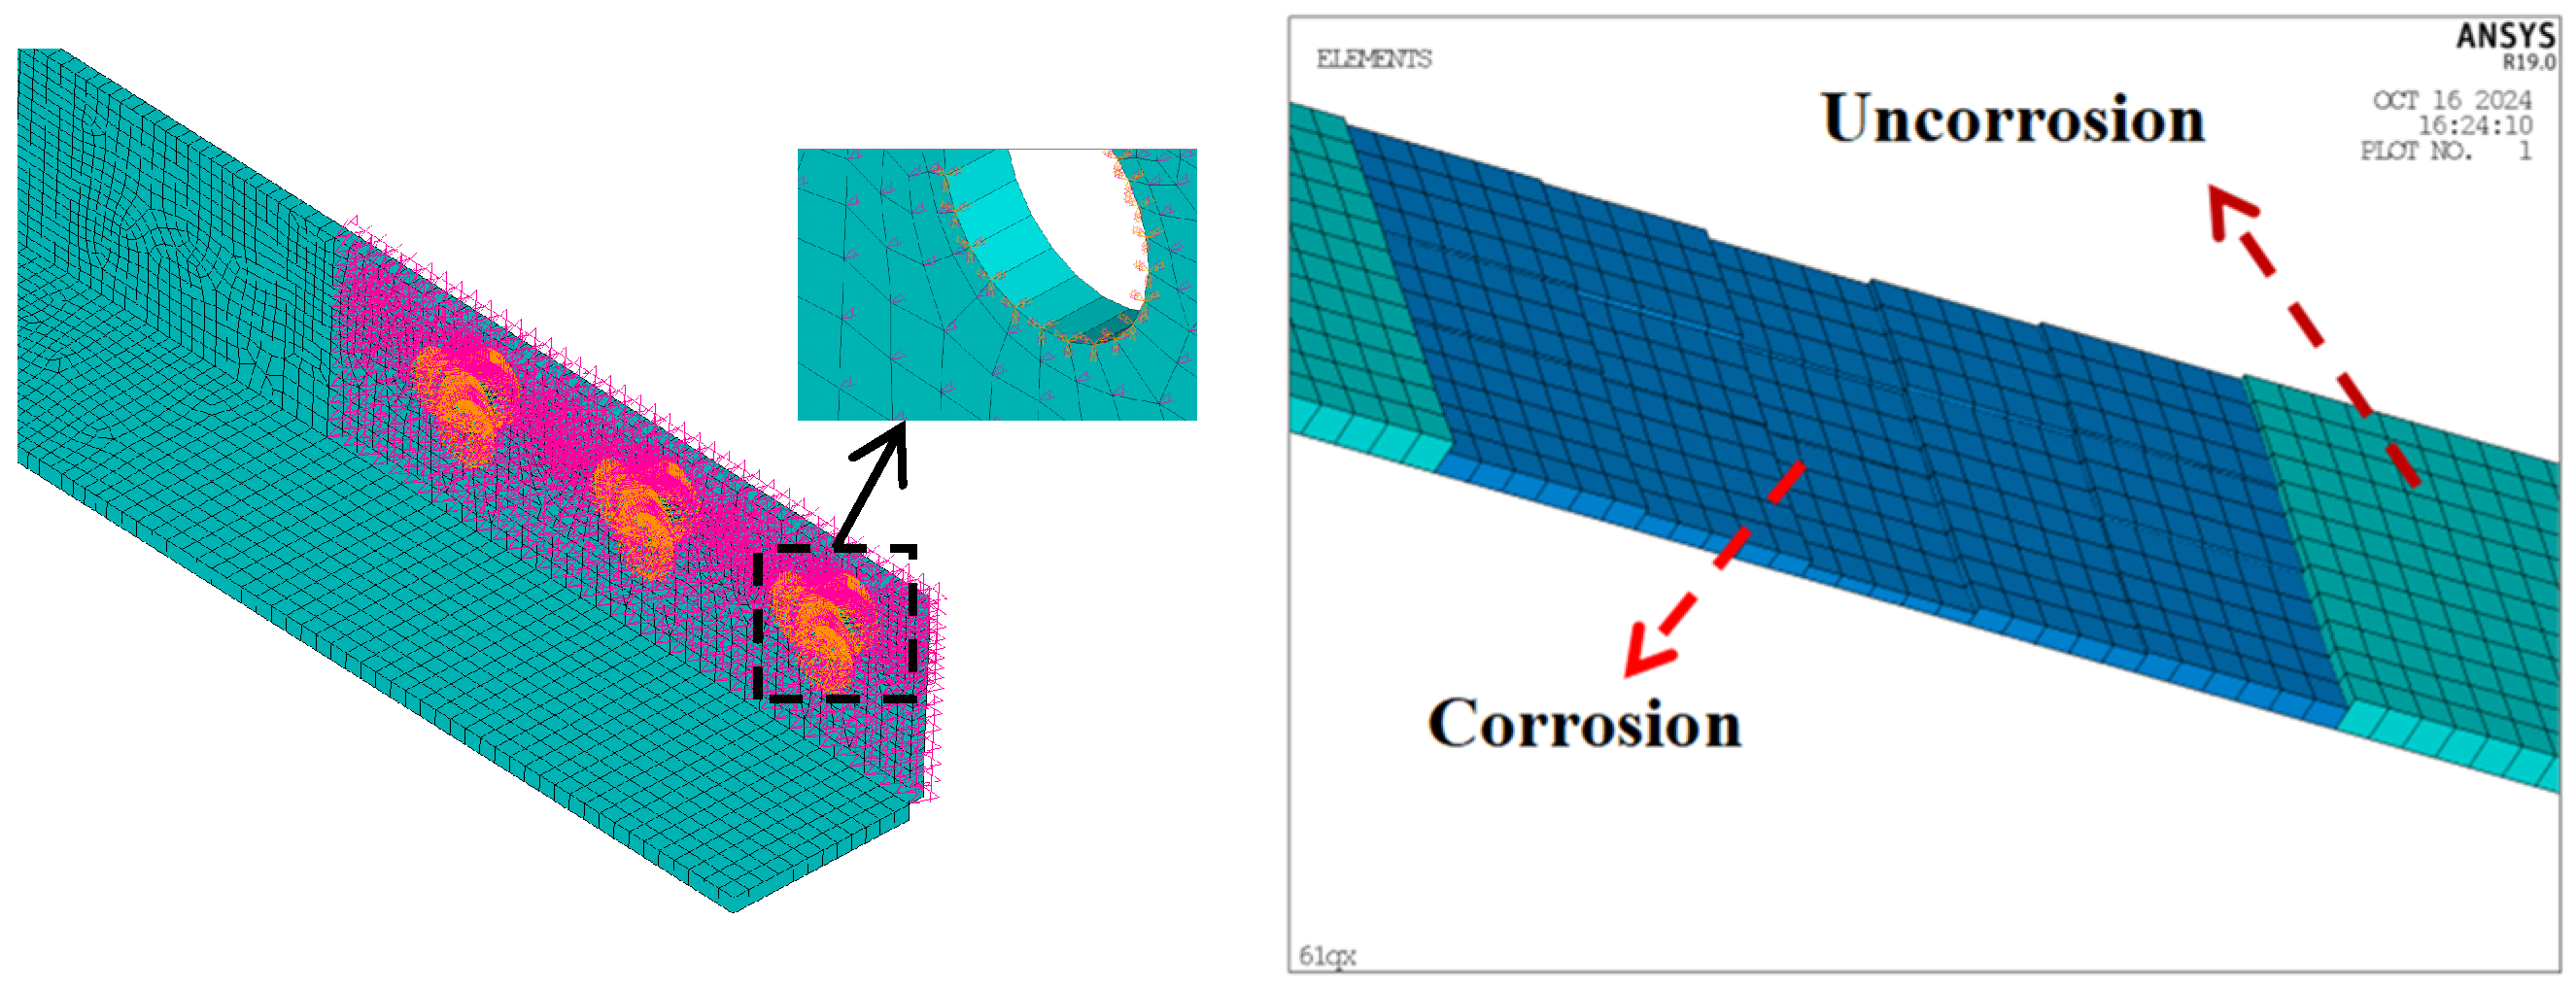
Based on the electrochemical corrosion and eccentric compression test results, a finite element model was developed in ANSYS 19 to simulate the behavior of corroded angle sections under eccentric compression. Considering the actual loading conditions and boundary constraints of bracing members in transmission towers, the SHELL181 shell element was employed. Displacement and rotational constraints were applied at bolt hole locations, while lateral restraints were imposed at the contact surfaces between the specimen and supports to replicate the restraining effect of T-shaped plates in the test setup (Figure 18). The mechanical behavior of Q235 steel was described using a trilinear constitutive model based on the von Mises yield criterion, with yield strength (292.27 MPa) and ultimate strength (415.26 MPa) obtained from material tensile tests.
Figure 18.
Finite element model.
Extensive studies indicate that the base material properties remain largely unchanged after corrosion [38,39]. Therefore, localized corrosion was simulated by reducing the cross-sectional thickness in targeted regions. Given the significant surface roughness induced by electrochemical corrosion—which affects stress distribution and failure modes—the corroded zones were finely meshed into 15 sub-regions (Figure 18). Initial out-of-straightness, which critically influences the stability of eccentrically loaded members, was measured prior to testing; the average initial curvature was found to be 1.22‰. In the FE model, this imperfection was idealized as a half-sine wave. To account for large geometric nonlinearities during eccentric compression, a large-deformation analysis was adopted to enhance simulation accuracy.
Table 3 compares the experimental and simulated load-bearing capacities of corroded specimens. The simulation results show excellent agreement with test data, with errors within 7.5%. Moreover, the failure modes observed in tests and simulations are consistent: all locally corroded specimens exhibited local buckling within the corroded zones due to reduced effective cross-sections (Figure 19). Thus, the proposed FE approach reliably captures both the capacity degradation and failure mechanisms of corroded angle sections.
Table 3.
Comparison of tests and finite element simulation results for corroded angle steel.
Figure 19.
Deformation of corrosion members.
4.2. Parametric Analysis
Bracing members in transmission towers, typically connected by welding or bolting, are exposed to harsh environments including intense UV radiation, thermal cycling, humidity, and mechanical impacts. Consequently, localized corrosion is predominant, whereas uniform corrosion occurs only in specific environments such as coastal, high-humidity/high-salinity, or heavily industrialized areas [40]. Therefore, an experimentally validated finite element simulation method was employed to investigate the effects of local corrosion on the load-bearing capacity of members. In this study, the relatively high surface roughness observed in the corroded regions was primarily attributed to localized electron accumulation during the electrochemical corrosion process. However, in practical engineering, local corrosion surfaces of members naturally exhibit certain unevenness. Previous studies have indicated that such surface roughness has a limited effect on the load-bearing capacity of specimens, particularly under compression, where its influence on structural performance is even less pronounced [41,42,43]. Therefore, the corroded regions were simulated using a method based on uniform cross-sectional reduction. Key parameters include: number of corrosion zones, spacing between dual corrosion zones, relative corrosion depth, and corrosion area.
To quantify the impact of different corrosion patterns, the load-bearing capacity degradation ratio (RD) is introduced.
where RD—The load-bearing capacity degradation ratio; F—The capacity of the uncorroded member; Fc—The capacity of the corroded member.
4.2.1. Rationality Analysis of the Dual Corrosion Regions
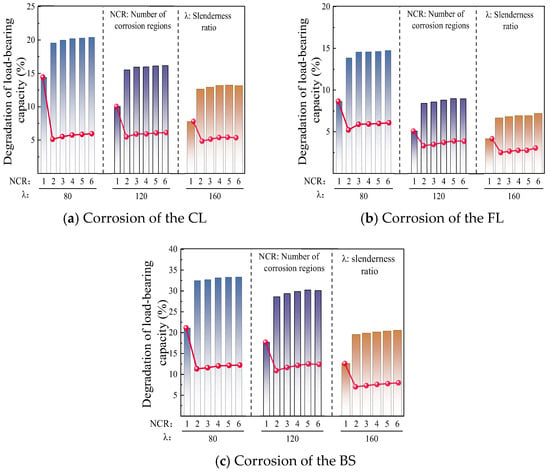
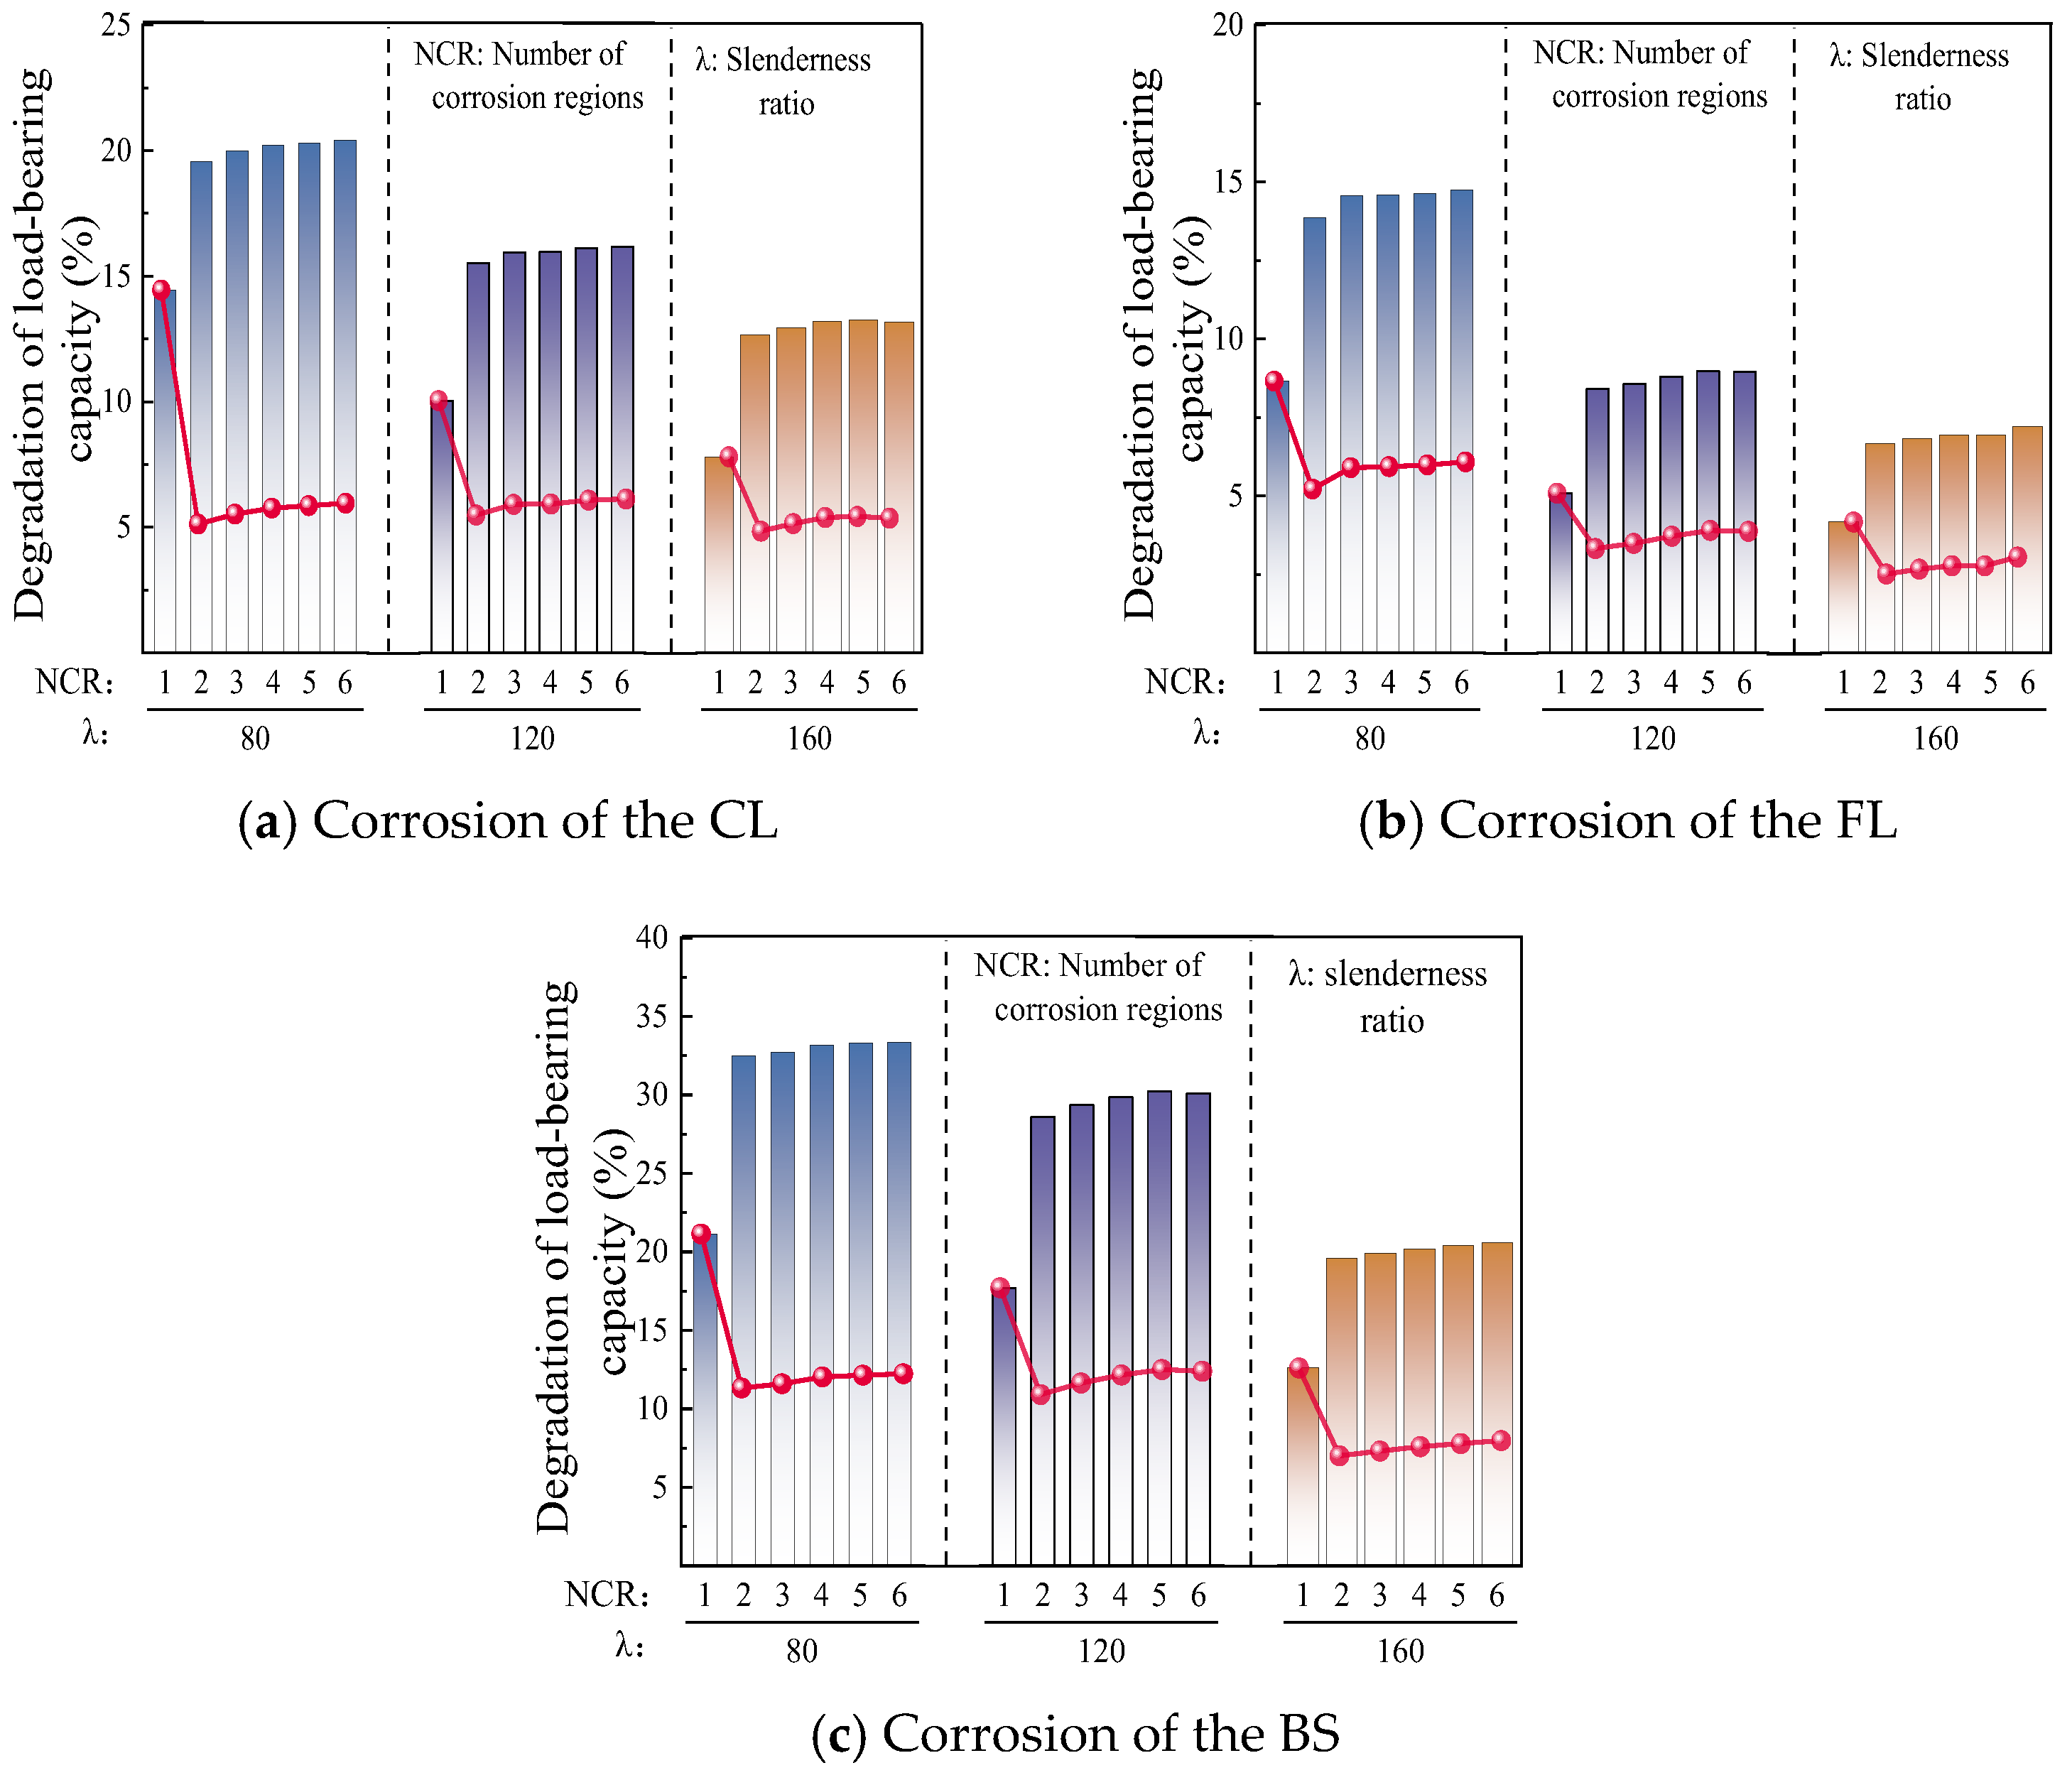
Transmission towers are exposed to corrosive environments for long periods, leading to multiple corrosion sites developing on the same member over time. Therefore, considering only a single corrosion region may underestimate the impact of corrosion on the specimen. Hence, six independent corrosion regions were randomly generated, with differences in area and corrosion depth among these six regions. As shown in Figure 20, the distribution of corrosion regions was systematically analyzed. To investigate their influence, the corrosion regions farthest from the mid span (i.e., those located near the ends of the angle steel) were gradually removed in the numerical analysis. It was found that when the number of remaining corrosion regions decreased to two, located near the midspan and close to each other, the decreasing trend of RD became relatively gentle. However, when only one corrosion region remained, RD dropped sharply. The dotted-line plots in Figure 20 show the difference in RD between adjacent numbers of corrosion regions. For corrosion on the CL, with a slenderness ratio of 80, when the number of corrosion regions increased from 1 to 2, RD increased by 5.23%; when it increased from 2 to 6, RD increased by 0.84%. For corrosion on the FL, with a slenderness ratio of 120, when the number of corrosion regions increased from 1 to 2, RD increased by 3.32%; when it increased from 2 to 6, RD increased by 0.54%. For corrosion on the BS, with a slenderness ratio of 160, when the number of corrosion regions increased from 1 to 2, RD increased by 7.0%; when it increased from 2 to 6, RD increased by 0.97%. When multiple corrosion regions exist on a member, RD is primarily controlled by the most critical corroded section. When the corrosion depth is large and the corrosion spacing is small, a coupling effect forms between the corroded sections, significantly affecting RD. Especially for bracing members under eccentric compression, additional bending moments are generated, which amplify the sensitivity of stresses and defects in the corroded regions. Thus, the corrosion-sensitive regions have already significantly reduced the member’s bearing capacity and stability, and further increasing the number of corrosion regions has only a minor additional effect on RD. Therefore, studying the influence of dual corrosion regions on member bearing capacity is of great significance.
Figure 20.
Effect of multiple corroded regions on load-bearing capacity.
4.2.2. Influence of Spacing Between Dual Corrosion Regions on Angle Steel Bearing Capacity
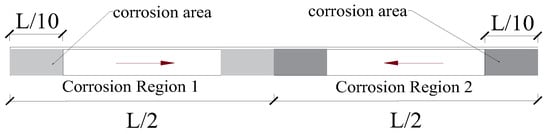
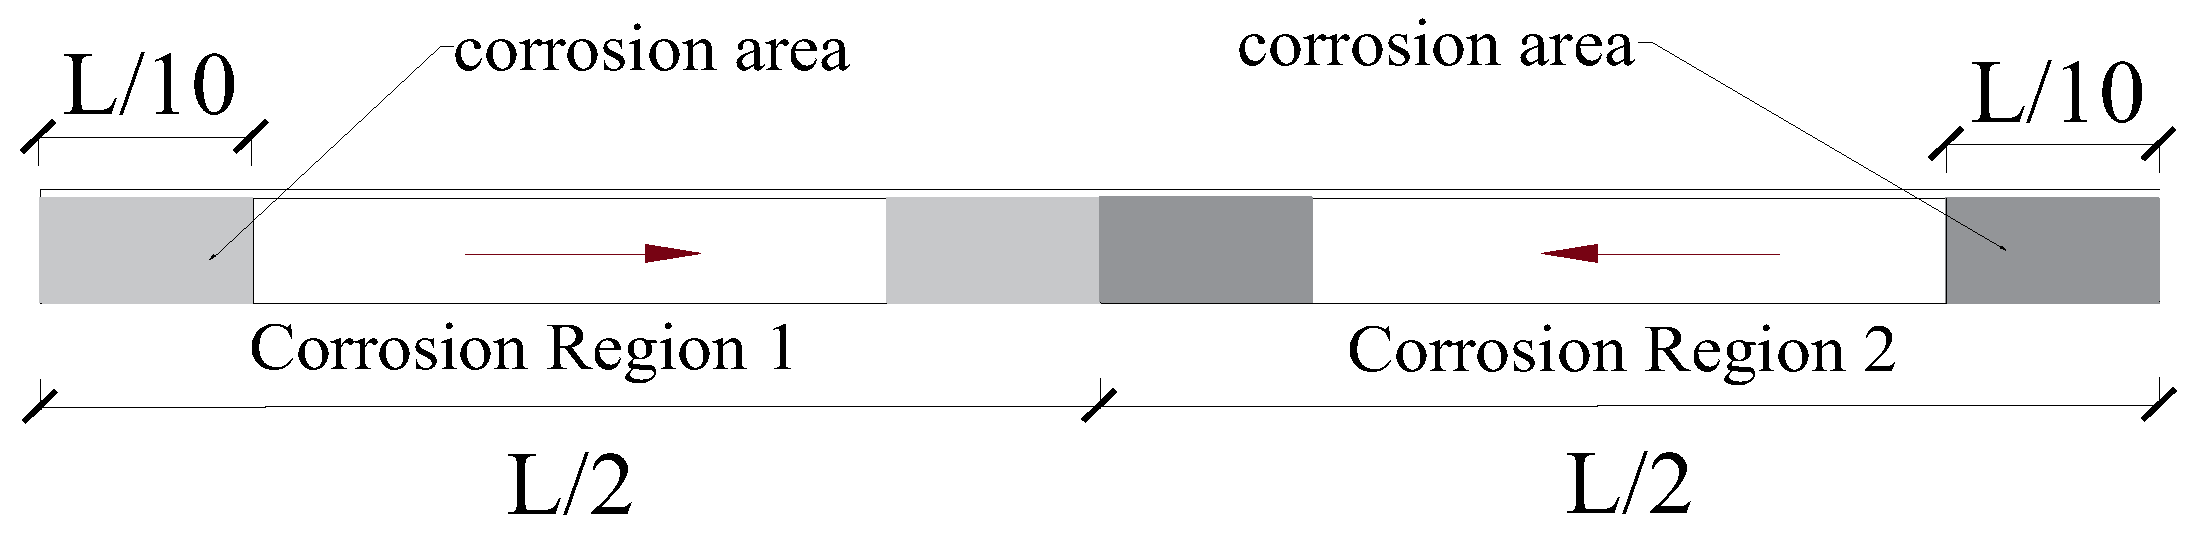
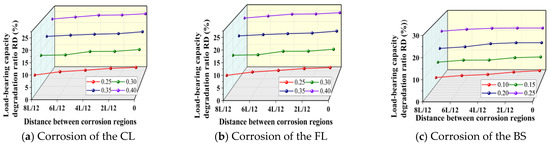
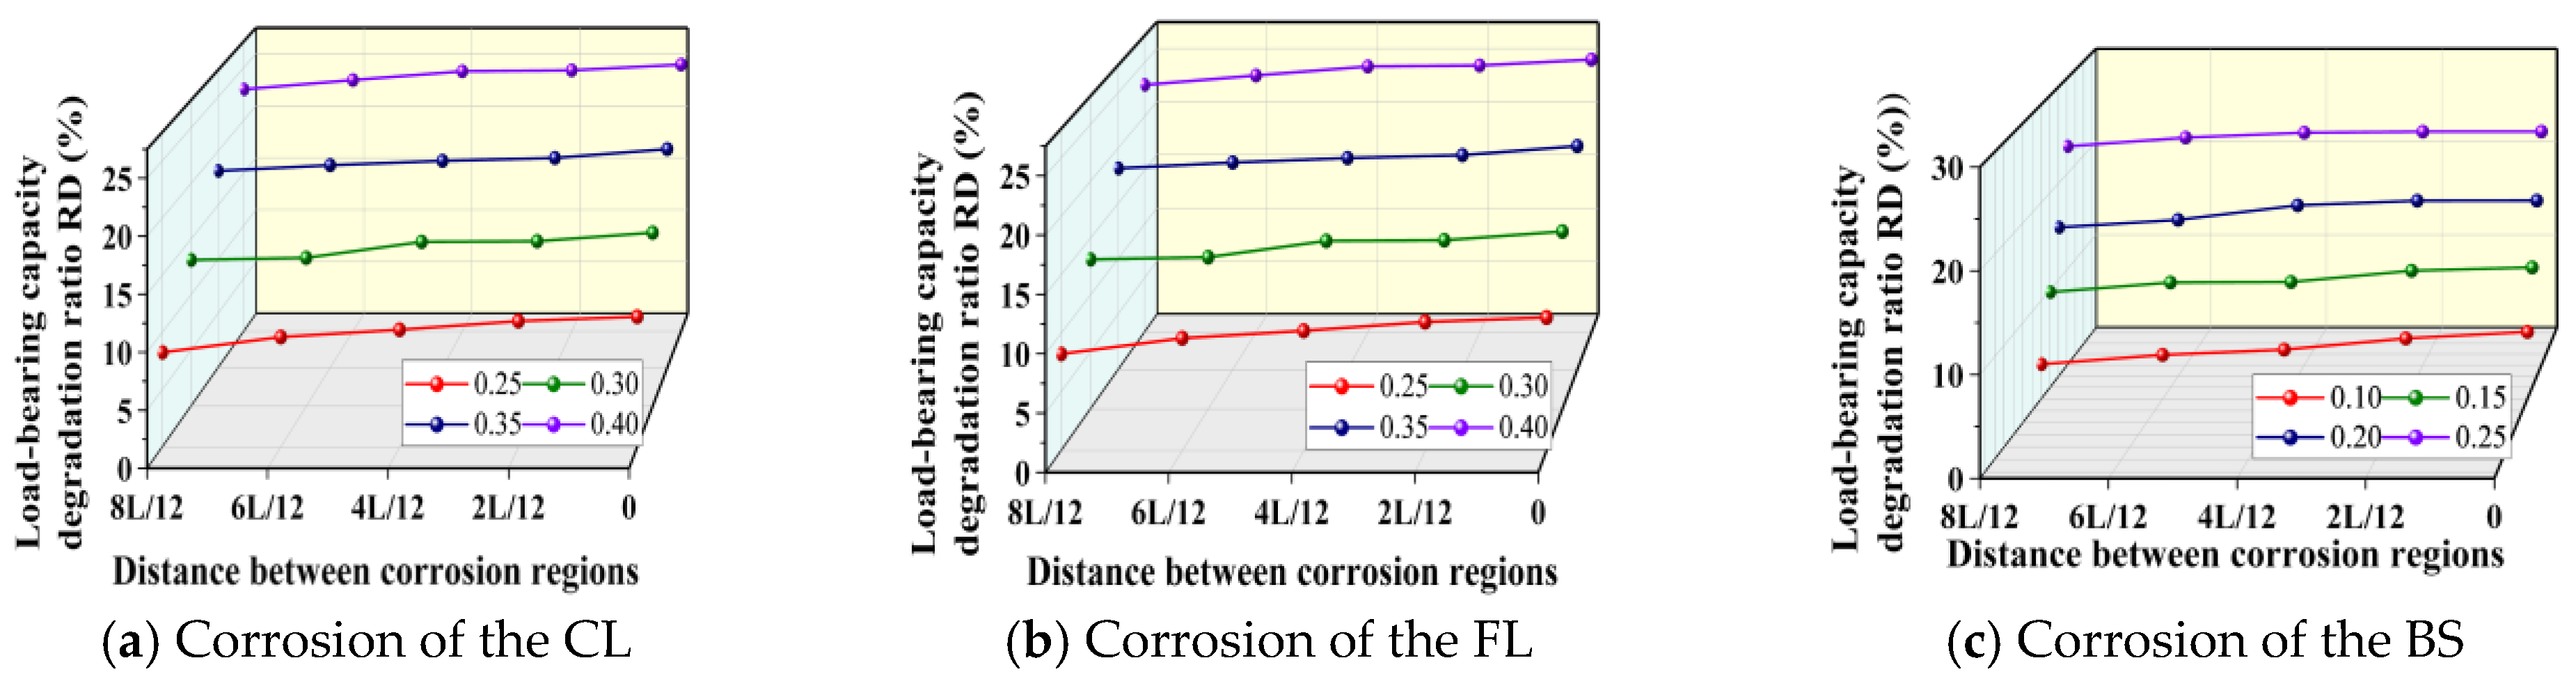
To investigate the influence of spacing between dual corrosion regions on RD, the commonly used angle steel specification L75 × 6 (75 is the leg width H, 6 is the thickness T) for transmission tower bracing members was selected, with a slenderness ratio of 90. The corrosion width was set to H (angle steel leg width), the corrosion length was L/12, and the spacing between dual corrosion regions was set to 8L/12, 6L/12, 4L/12, 2L/12, and 0, respectively. The corresponding corrosion locations are shown in Figure 21. Figure 22 shows the bearing capacity degradation ratio of angle steel under the dual corrosion pattern. It was found that as the spacing between dual corrosion regions decreases, the RD of the member gradually increases. When the sectional corrosion ratio of the compression leg is 30%, and the spacing between dual corrosion regions is 8L/12, 6L/12, 4L/12, 2L/12, and 0, the corresponding RD values are 17.61%, 19.18%, 21.04%, 22.28%, and 24.27%, respectively.
Figure 21.
Schematic diagram of the distance between two corrosion regions.
Figure 22.
Load-bearing capacity degradation ratio of angle steel under dual corrosion regions.
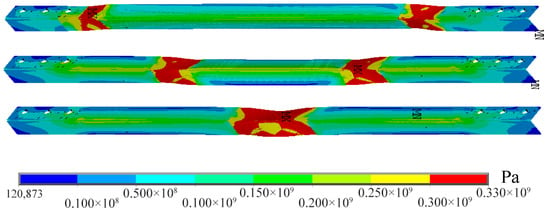
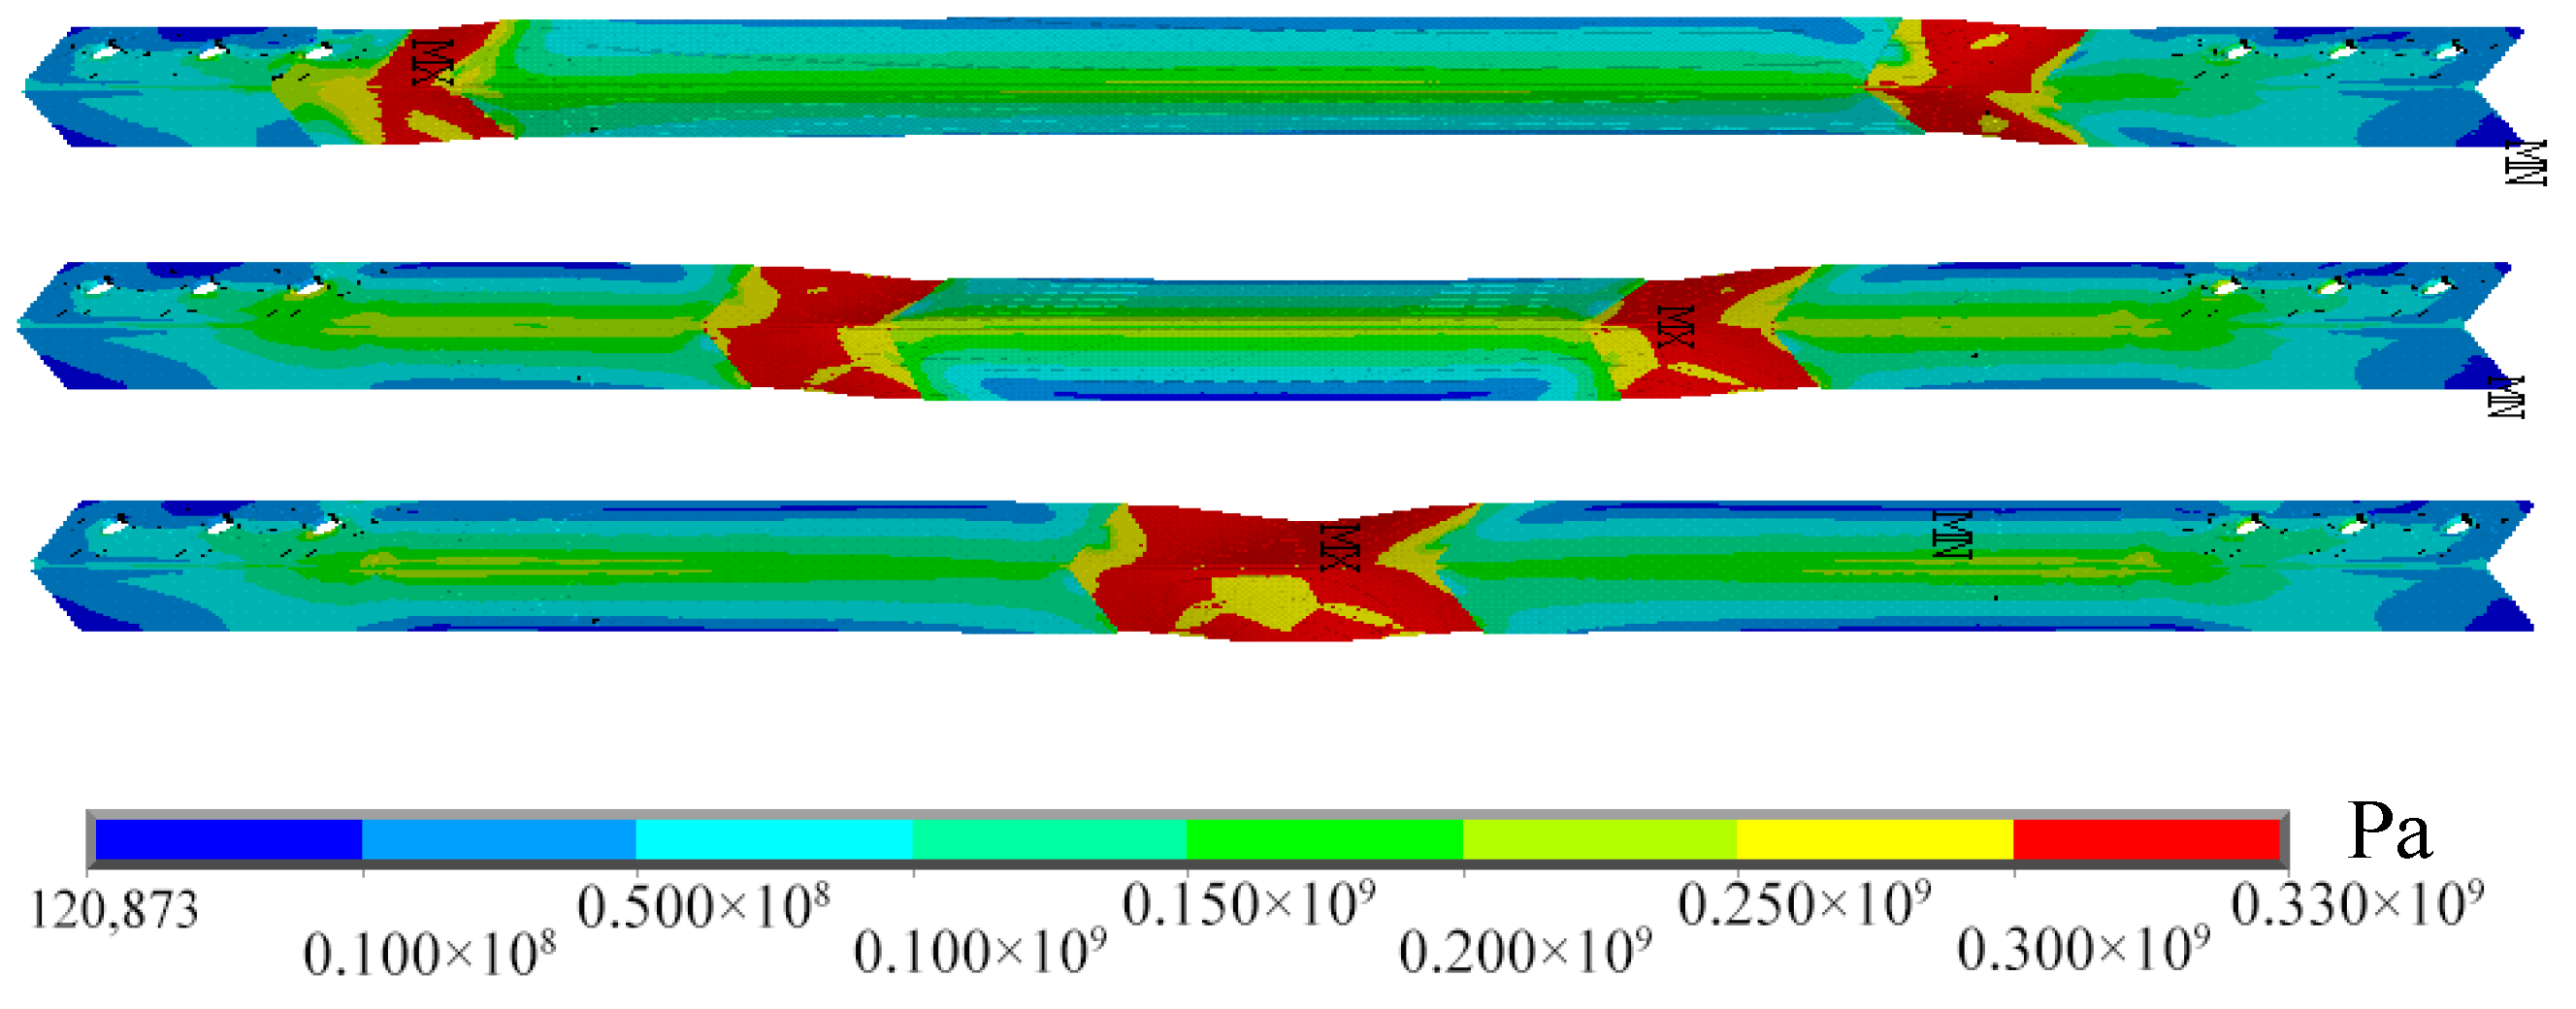
When the corrosion spacing is relatively large, the interaction between the stress fields of the two corrosion regions is weak. The regions may therefore be regarded as independent defects, and their effect on RD is limited, as shown in Figure 23. As the spacing between the dual corrosion regions decreases, stress-field interaction becomes more pronounced, promoting earlier local buckling and amplifying additional bending moments, which accelerate the deterioration of load-bearing capacity. When the corrosion regions are extremely close, adjacent, or overlapping, their mechanical effect is equivalent to large-area continuous corrosion. The effective load-carrying cross-section is substantially reduced, and stress concentration zones tend to merge. This results in a significant shift in the sectional centroid and an increase in eccentricity, generating larger secondary bending moments and ultimately a marked increase in RD.
Figure 23.
Stress contours under different corrosion spacing.
4.2.3. Influence of Relative Corrosion Area and Depth of Dual Corrosion Regions on Angle Steel Bearing Capacity
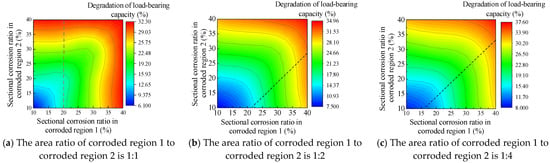
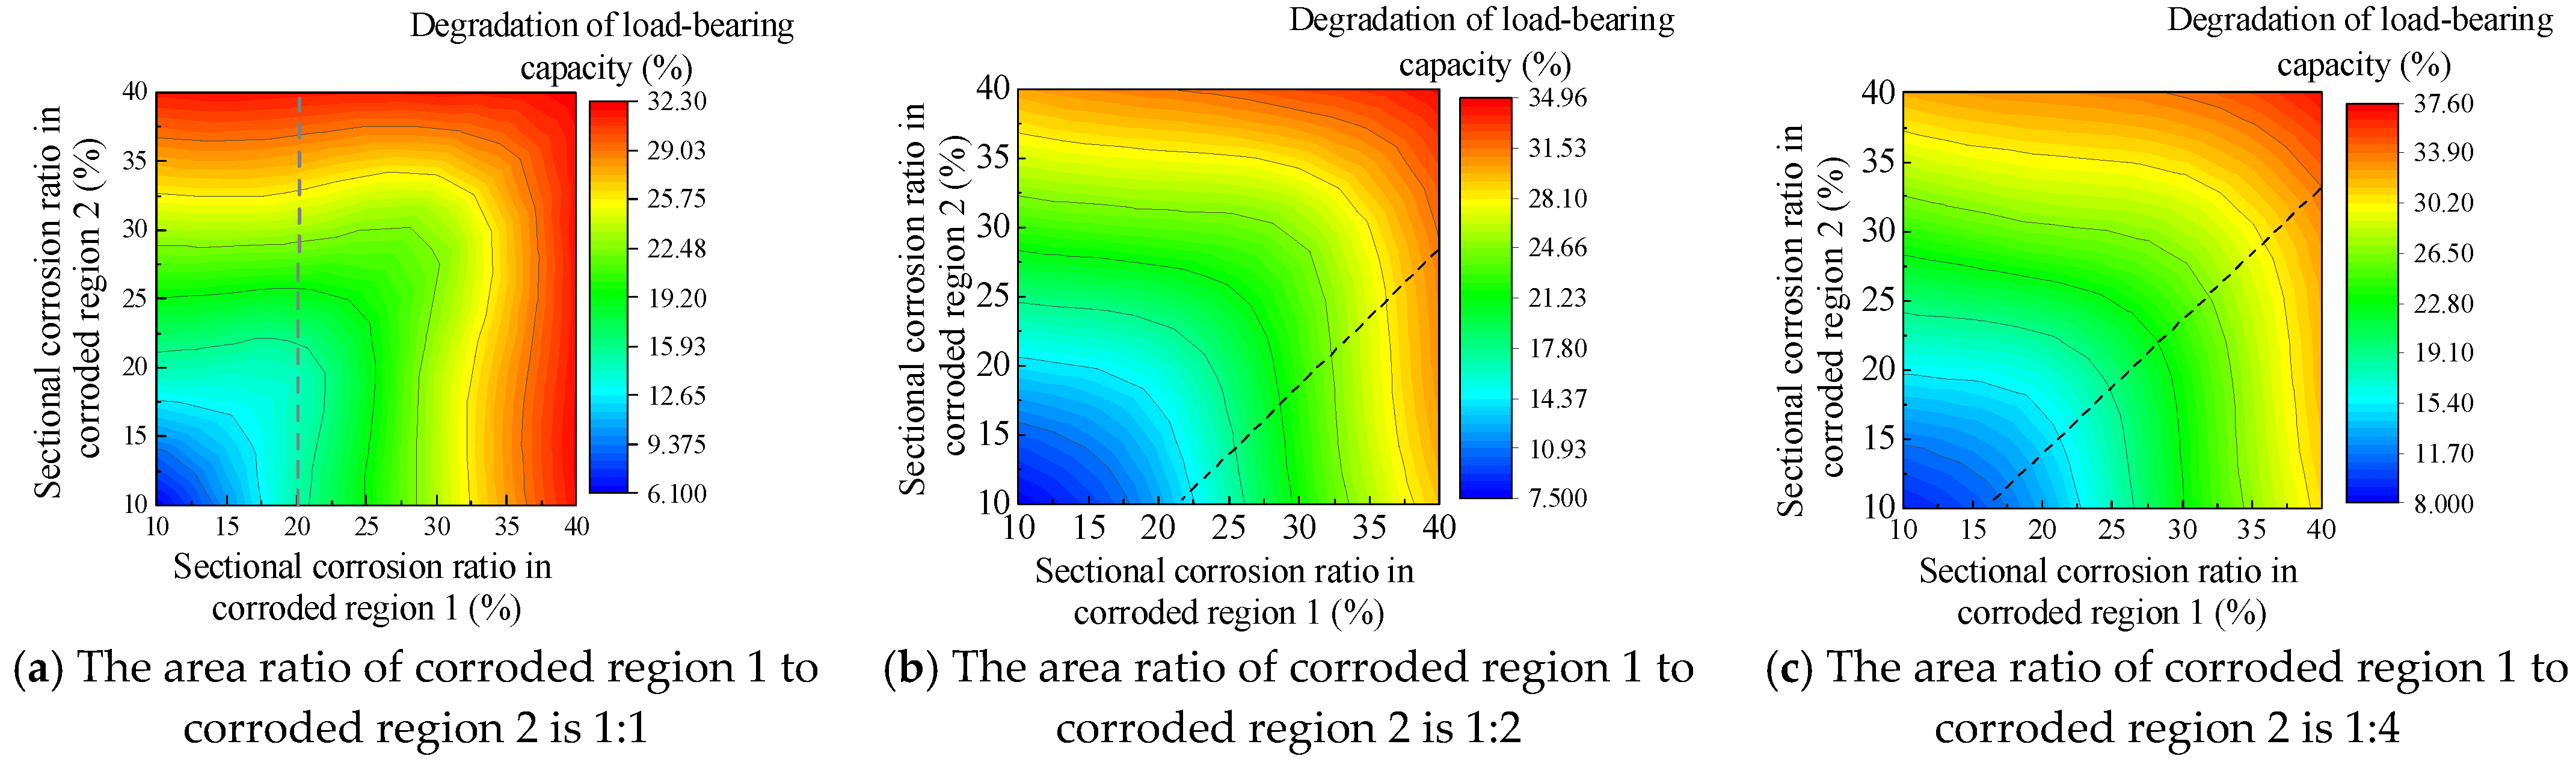
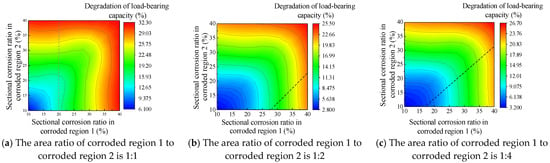
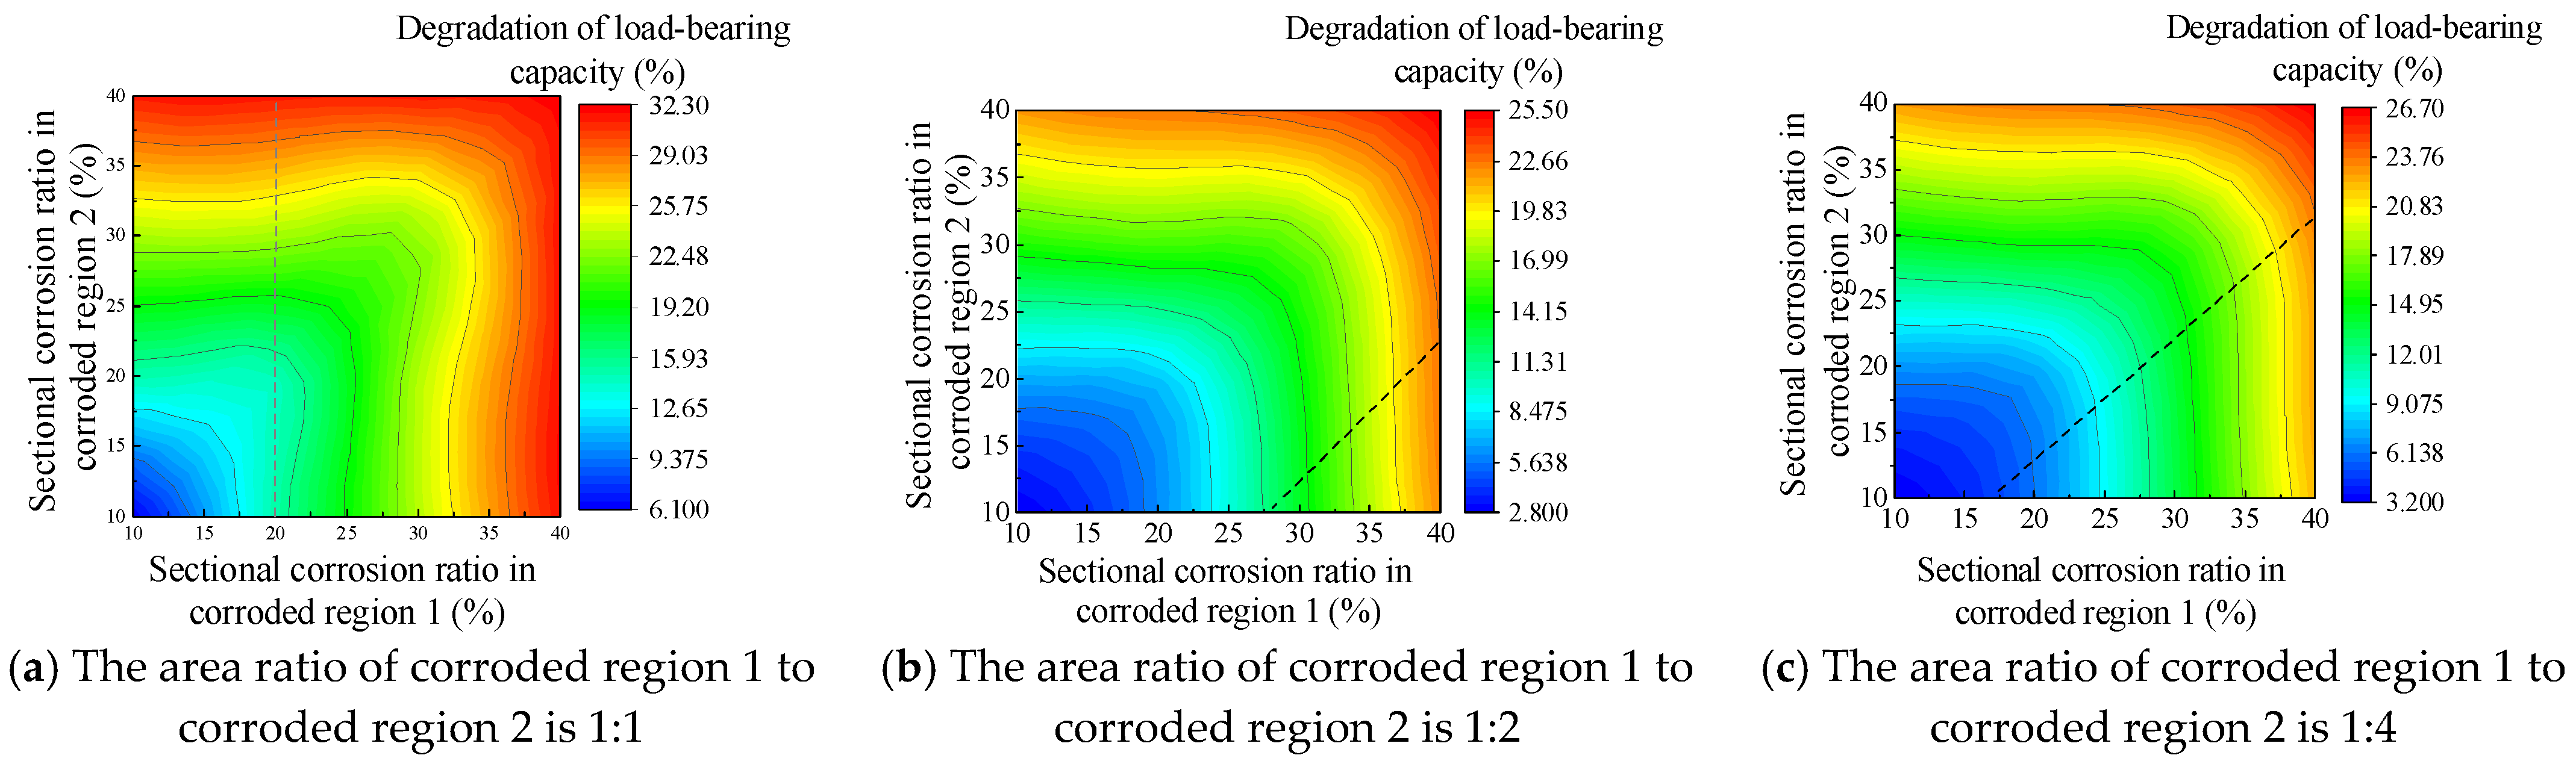
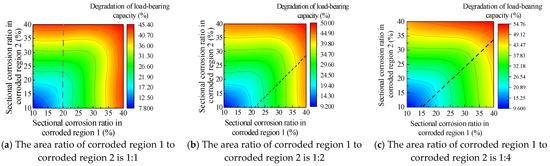
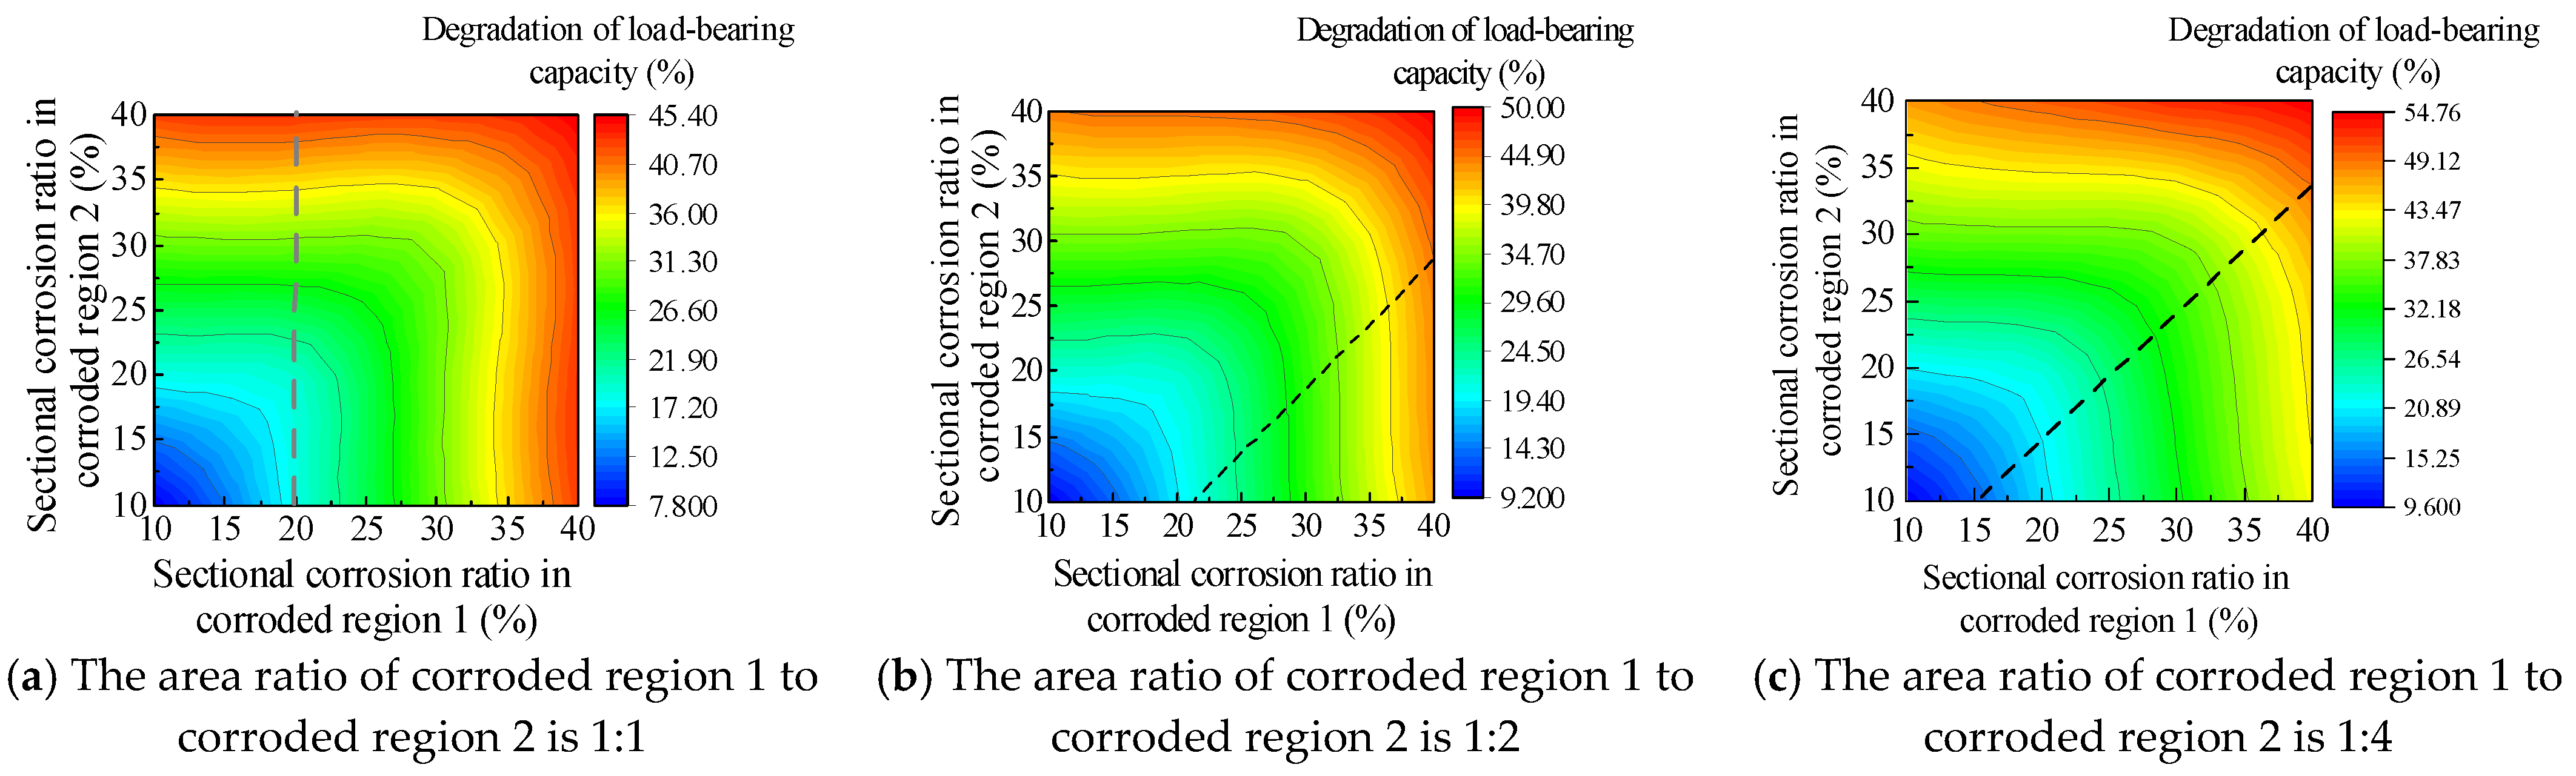
Due to differences in corrosion exposure conditions, including solar radiation, pollutant accumulation, and water retention, variations may occur in the relative corrosion depth and area between the two corrosion regions within the same structural member. Accordingly, the angle steel section (L75 × 6) was selected. The corrosion width was defined as H, and the cross-sectional corrosion ratios were set to 10%, 20%, 30%, and 40%. The corrosion length of region 1 was fixed at L/10, whereas that of region 2 was taken as L/10, 2L/10, and 4L/10, corresponding to corrosion area ratios of 1:1, 1:2, and 1:4 between the two regions, respectively. The spacing between the two corrosion regions was kept constant at L/5. Based on these parameters, the effects of the relative corrosion area and depth of the two regions on the RD were systematically investigated. Figure 24 shows the dual-region corrosion on the compression leg of the component. It was found that when the corrosion depths of the dual regions are equal, RD increases as the relative area ratio of the dual corrosion regions increases. According to Figure 24a, when the relative areas of the dual corrosion regions are equal, and the cross-sectional corrosion rate of region 1 is 20%, the color scale in the contour plot gradually transitions from blue to red as the cross-sectional corrosion rate of region 2 increases. This indicates a continuous upward trend in RD. As shown in Figure 24, Figure 25 and Figure 26, when the cross-sectional corrosion rate of region 1 is 20% and the cross-sectional corrosion rate of region 2 increases from 10% to 40%, the RD for the compression leg corrosion, the free leg corrosion, and both sides corrosion increased by 17.05%, 14.67%, and 25.09%, respectively.
Figure 24.
Influence of corrosion depth (Dc) and area (Ac) on the degradation ratio for specimens with corrosion on the compression leg.
Figure 25.
Influence of corrosion depth (Dc) and area (Ac) on the degradation ratio for specimens with corrosion on the free leg.
Figure 26.
Influence of corrosion depth (Dc) and area (Ac) on the degradation ratio for specimens with corrosion on both sides.
According to the connection form and loading characteristics of transmission tower bracing members, the load during compression generally does not pass through the centroid. When a member has two corrosion regions, the region with greater corrosion depth causes more severe weakening of the local effective load-bearing cross-section, significantly reducing the moment of inertia. The eccentric additional bending moment caused by corrosion is further amplified, and there is also a significant coupling effect between the two corrosion regions, thus having a more pronounced impact on the member’s bearing capacity. Moreover, when the corrosion area of one region increases, the coupling effect between the two regions implies an increase in the total corrosion area, which is more detrimental to the specimen’s bearing capacity.
5. Evaluation Method and Sensitivity Analysis of Corroded Regions in Angle Steel
5.1. Bearing Capacity Calculation Method for Locally Corroded Members
A finite element model validated through experimental results was employed to perform a parametric analysis of the corroded specimens. The numerical model covered the principal variation ranges of the corrosion parameters, and a total of 3600 finite element simulations were conducted to ensure the accuracy and reliability of the proposed prediction method. The influence of dual corrosion regions on the bearing capacity of angle steels was subsequently analyzed. It was found that for bracing angle members in transmission towers, the degradation ratio RD after corrosion differs among the compression leg (CL), free leg (FL), and both sides (BS). Therefore, the partitioned research approach was employed to fit the calculation models for the RD of the compression leg and free leg, denoted as KCL and KFL (Equations (2) and (3)), respectively. Based on the evaluation methods for the compression leg and free leg, a calculation model for the RD of both sides was established, denoted as KBS (Equation (4)). Here, CL represents corrosion of the compression leg of the angle steel, FL represents corrosion of the free leg of the angle steel, and BS represents corrosion of both sides of the angle steel. The factor 0.01 in the equation is introduced during the data fitting process as a numerical scaling parameter, solely for the purpose of simplifying the expression and computation, and does not alter the physical meaning of the model. The ranges of the corrosion parameters considered are summarized in Table 4.
where λ—Slenderness ratio of the angle steel;
Dc—Sectional loss ratios of corrosion region, Dc1 ≤ Dc2;
Ac—Area ratios of corrosion region, Ac1 = (Hc × Bc)/(L × H);
Hc—Width of corrosion region, Hc1 ≤ Hc2;
Bc—Length of corrosion region;
Lr—Axial distance from the midpoint of the corrosion region to the end (mm);
Lc—Location of corrosion region, Lc = Lr/L, Lc1 ≤ Lc2;
Ar—Ratio of the corrosion area on the free leg relative to the total corrosion area under double-leg corrosion.
Table 4.
Ranges of corrosion parameters.
The fitted formulas for RD of the compression leg, free leg, and both sides have coefficients of determination R2 of 0.90, 0.90, and 0.91, indicating that they can reliably predict the bearing capacity degradation ratio of corroded angle steel. It should be noted that the proposed fitting equation is valid only within the specified range of corrosion parameters.
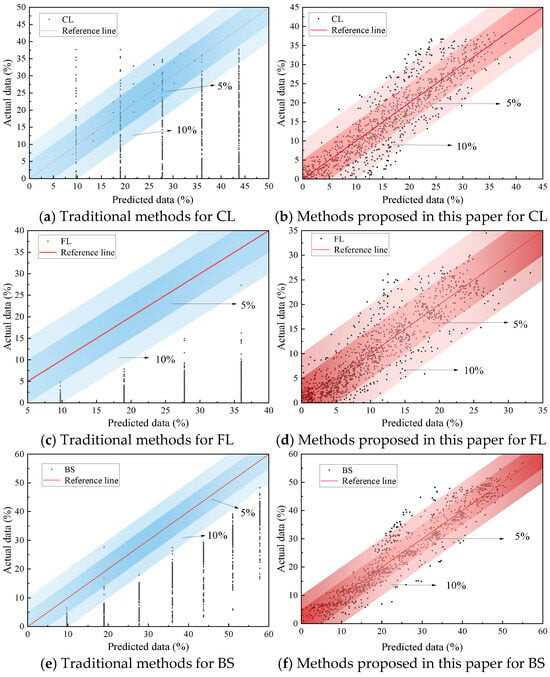
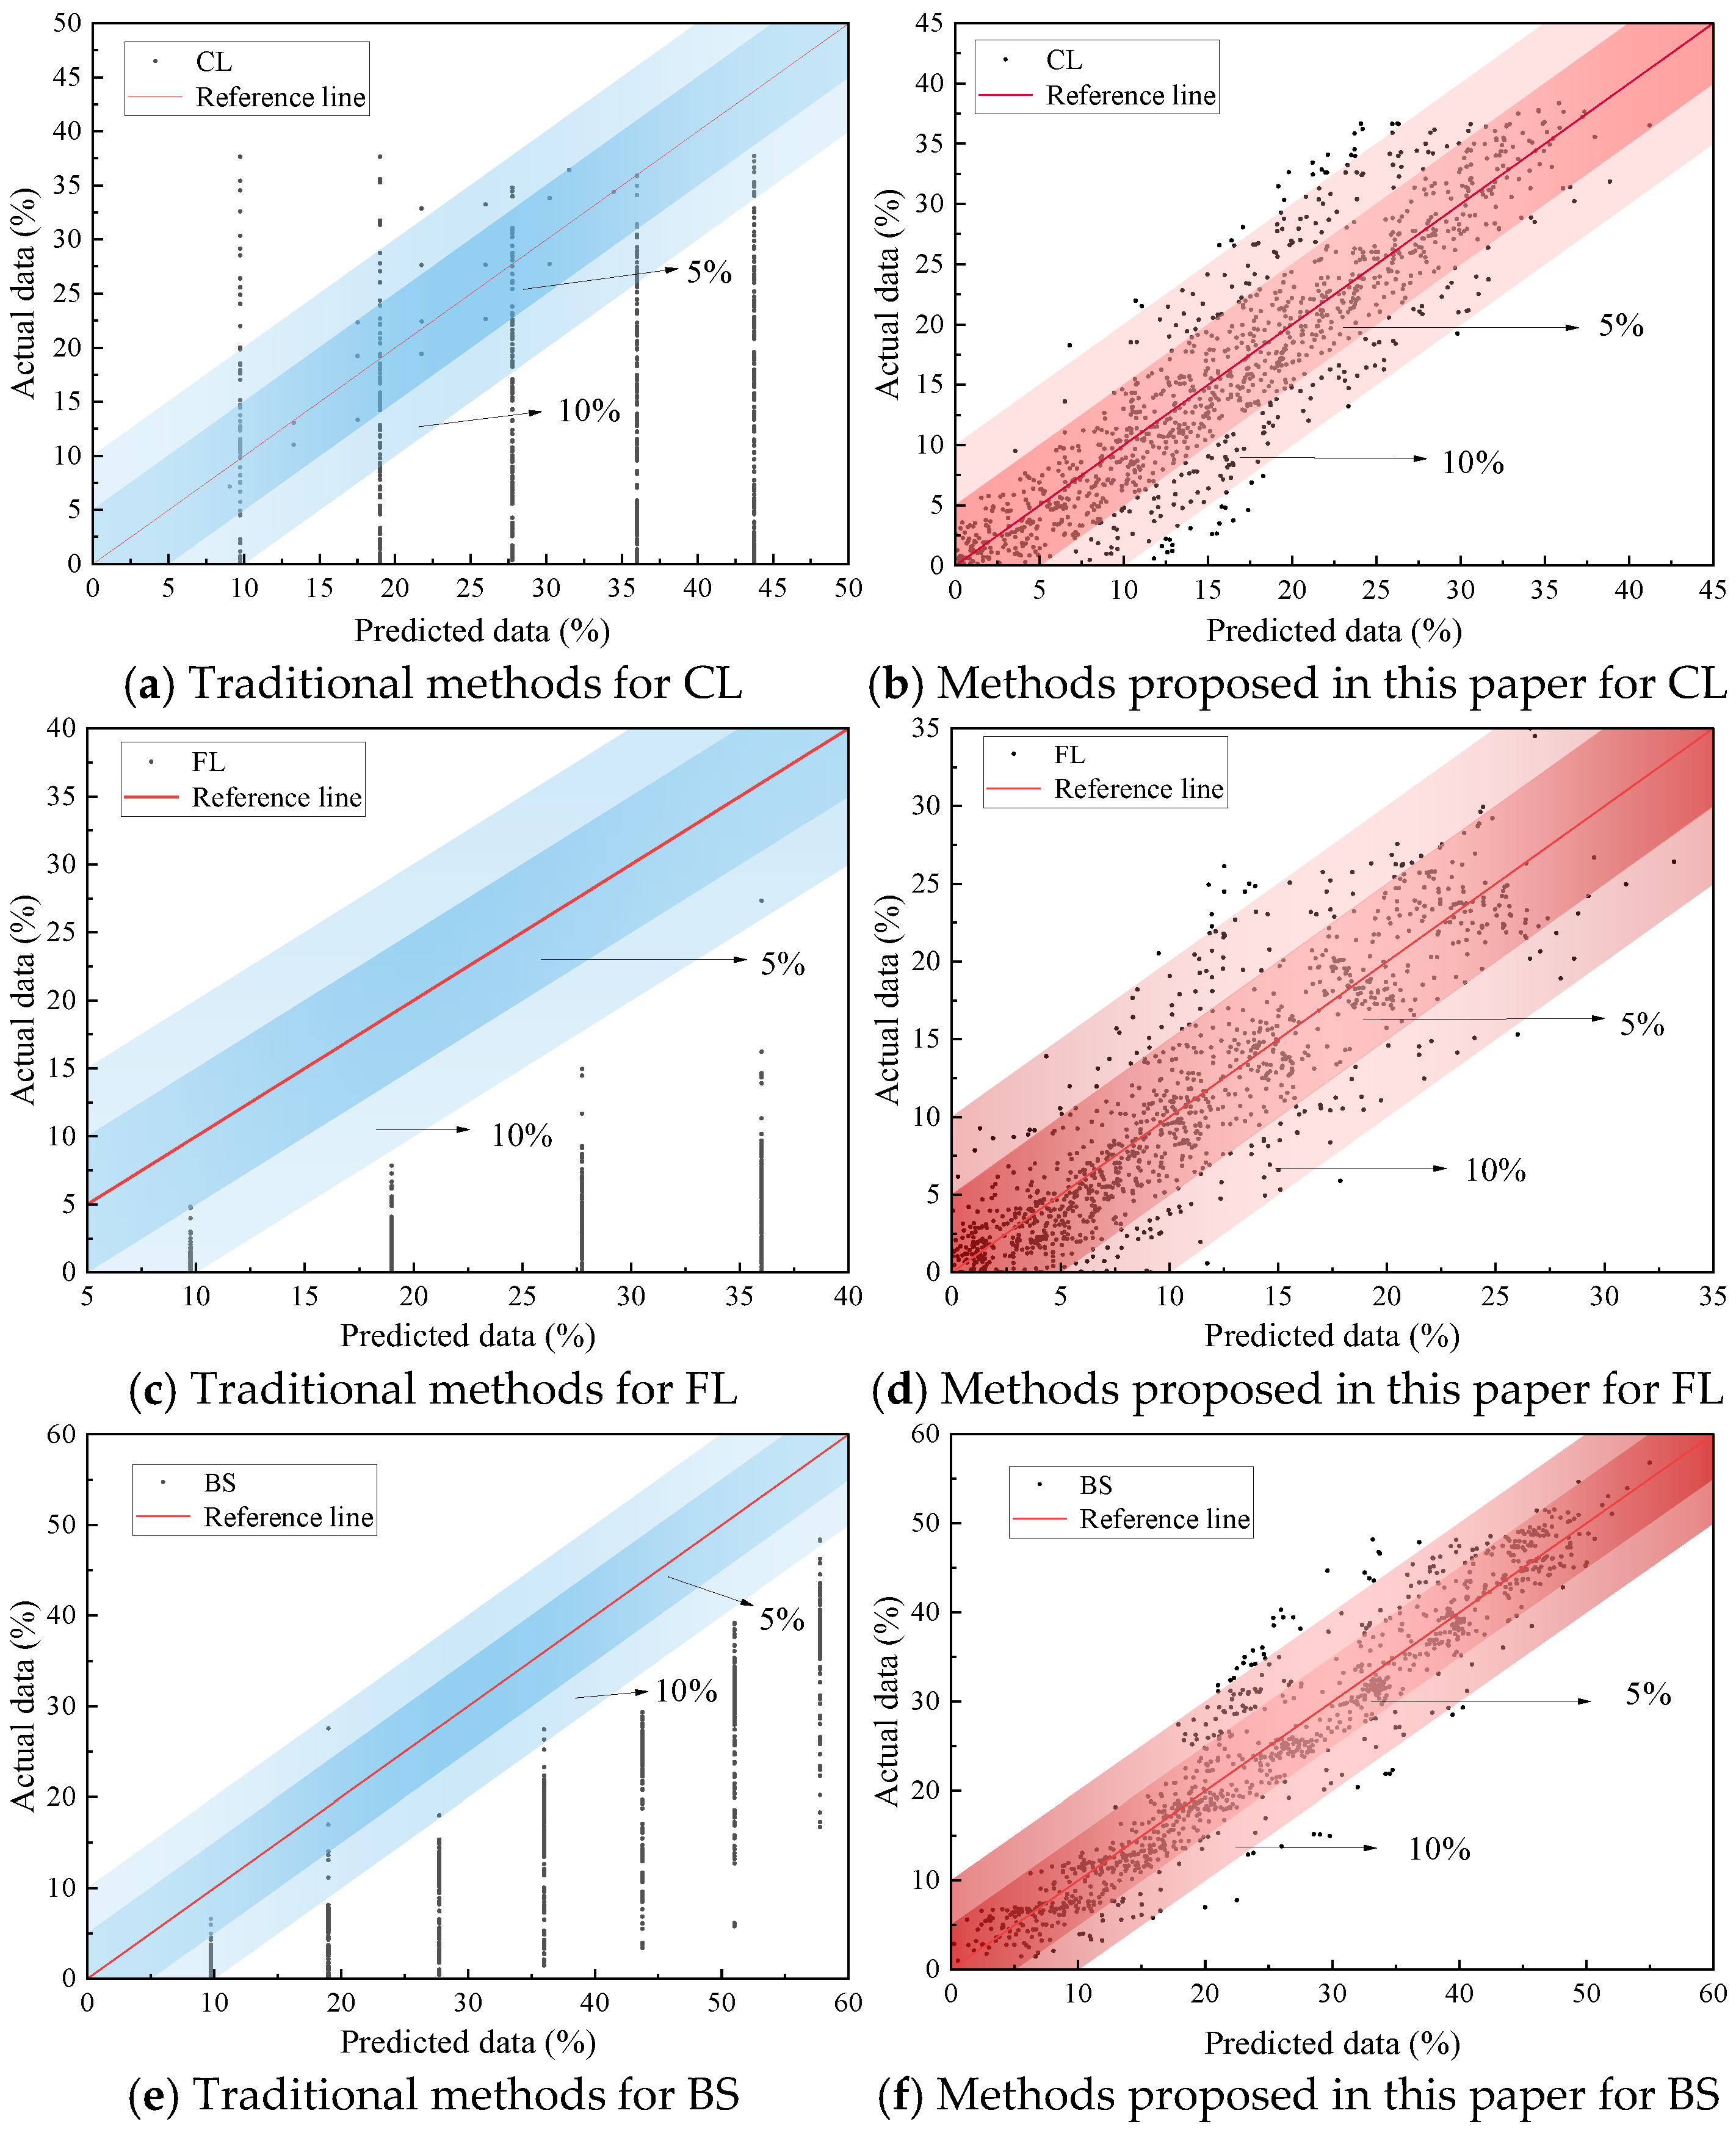
In Figure 27, the horizontal axis represents the predicted values from the fitted formulas, and the vertical axis represents the original RD data from finite element simulations. The data points are relatively uniformly distributed on both sides of the reference line. The farther the points are from the reference line, the lower the fitting accuracy. Data points below the reference line indicate that the predicted values from the formula are lower than the original simulation values. At a relative distance of 5% from the reference line, the data error rates for compression leg, free leg, and both-leg corrosion are 15.2%, 14.7%, and 12.3%. At a relative distance of 8% from the reference line, the corresponding error rates are 7.8%, 7.1%, and 6.2%.
Figure 27.
Comparing traditional methods with the methods proposed in this paper.
Many scholars have studied the effect of corrosion on steel bearing capacity by considering only a single corrosion factor—the sectional loss ratio—and have established relevant calculation models [44,45,46]. A typical corrosion model expression is γ = (1 − Dc)2, where γ is the residual bearing capacity of corroded steel. As shown in Figure 27a,c,e, the horizontal axis represents the RD obtained from the calculation model (1 − γ), while the vertical axis displays the original RD data derived from finite element simulations. The study finds that, for the same section loss rate, the data exhibit a relatively high degree of dispersion. Compared to traditional methods, the approach proposed in this study, based on finite element data, provides better fitting performance and considers a broader range of corrosion parameters, making it more aligned with practical engineering applications.
5.2. Sensitivity Analysis Based on the K–S Statistic
The K–S sensitivity analysis is a typical non-parametric, distribution-based global sensitivity analysis method that uses cumulative distribution functions to evaluate the influence of input variables. Equations (5) and (6) are Kolmogorov–Smirnov formulas, which measure sensitivity by estimating the changes in the output distribution when one or more input uncertainties are removed. Specifically, assuming samples are represented as (x1, x2, x3, …, xn) and the output variable is y, the sensitivity of an input variable xi is measured by comparing the unconditional probability distribution of the output with the conditional distribution when xi takes a specific value. If the change in xi significantly alters the shape or position of the output distribution, it indicates that this input has a high sensitivity to the model output [47,48]. From Equation (6), it can be seen that the range of sensitivity is [0, 1]; the lower the Ti sensitivity, the smaller the impact of xi. If it is 0, then xi has no effect on y, ensuring that the sensitivity coefficient is an absolute measure. Moreover, if an input variable xi is fixed, and there is no significant difference between the output distributions before and after fixing, it indicates that the input has a minor effect on the output.
This paper conducts sensitivity analysis on corrosion parameters using the computational model for multiple corrosion modes in angle steel. The corrosion parameters include slenderness ratio λ, corrosion depth, corrosion area, and corrosion location. The ranges of the corrosion parameters are specified in Section 5.1, with all parameters assumed to follow uniform probability distributions. When using the K–S method for sensitivity analysis, the confidence level is set at 95%, meaning that if the sensitivity coefficient is greater than 0.05, the parameter has a significant impact on the analysis results. To enhance the accuracy and reliability of the sensitivity analysis, 75,000 samples were generated using Latin Hypercube Sampling, ensuring uniform coverage of the entire parameter space, and subsequently employed in the K–S sensitivity analysis. As shown in Table 5, the sensitivity analysis results for dual corrosion regions in angle steel indicate that all sensitive parameters under compression leg corrosion, free leg corrosion, and both-leg corrosion scenarios are greater than 0.05, indicating that these seven corrosion parameters have some influence on RD.
Table 5.
Sensitivity analysis results based on the Kolmogorov–Smirnov statistic.
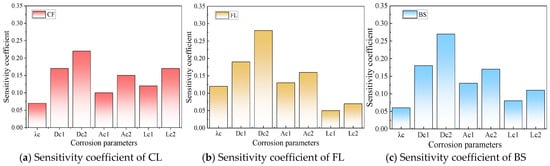
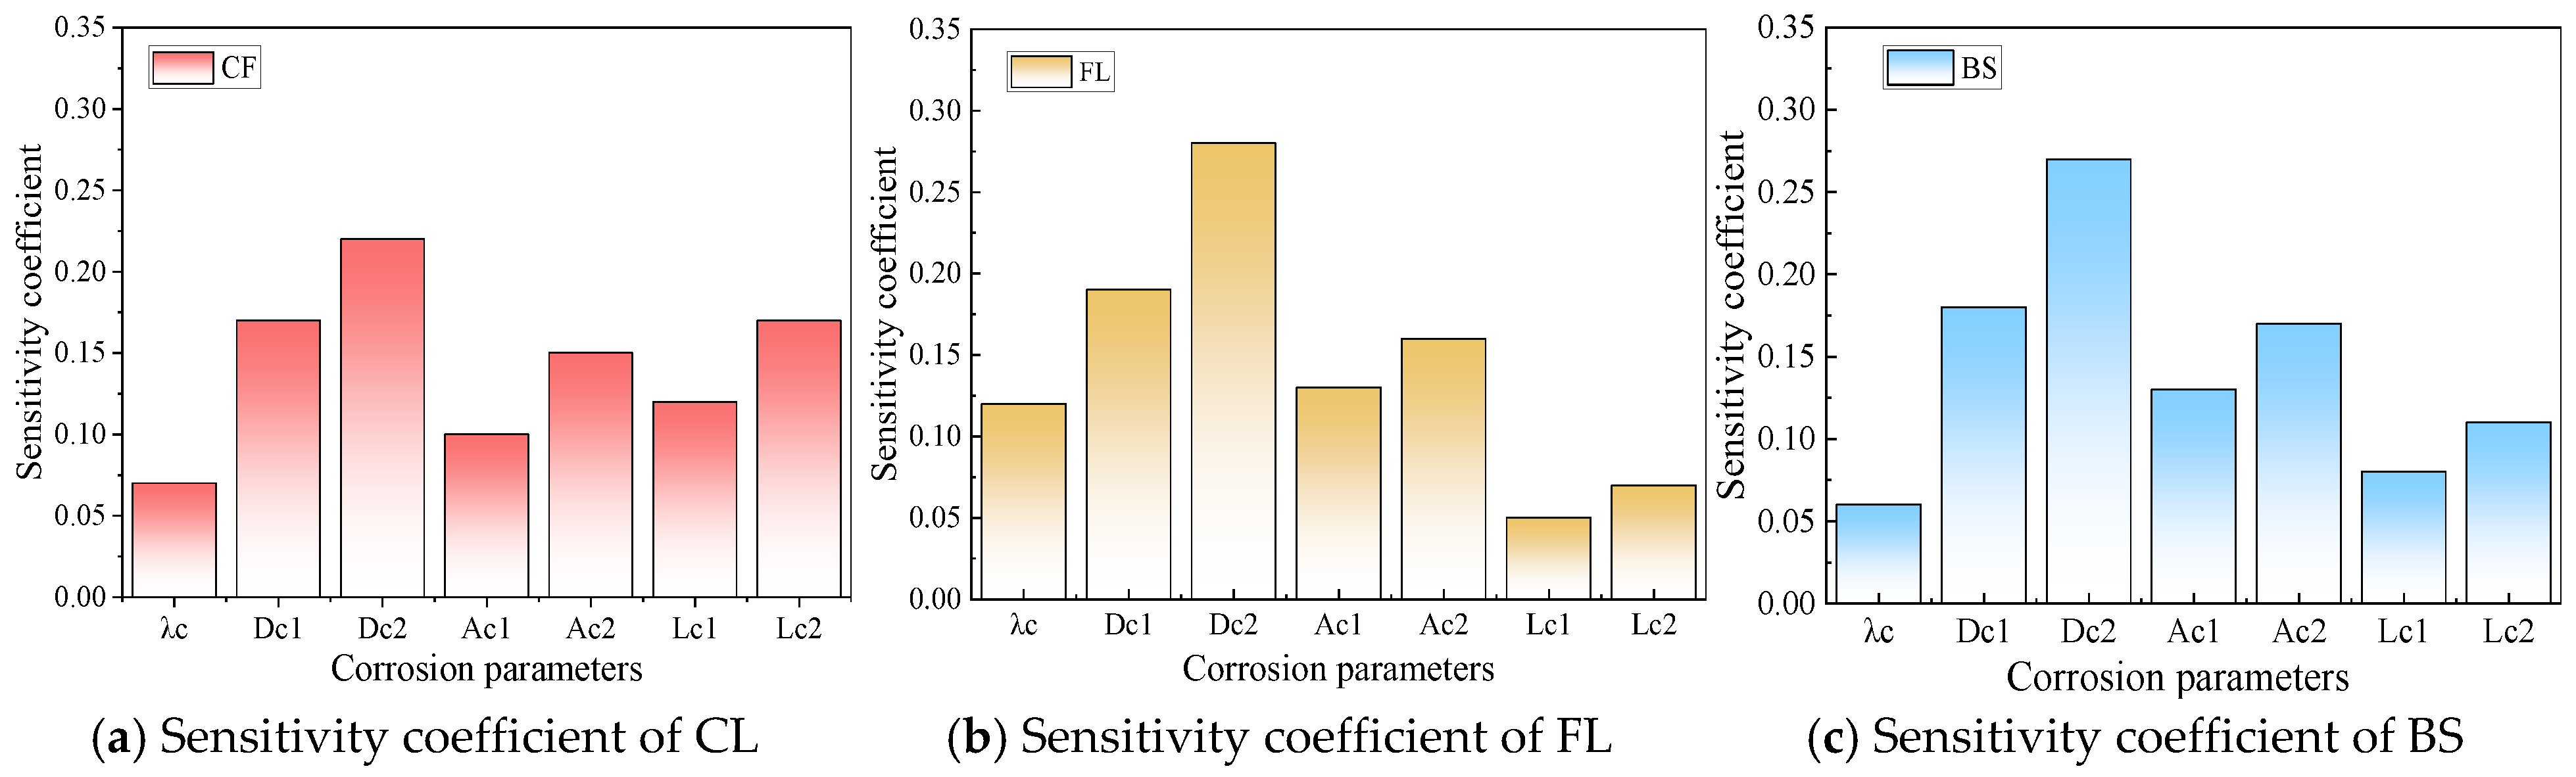
By normalizing the data in Table 5 using Equation (6), as shown in Figure 28, it was found that under compression leg corrosion conditions, the sectional loss rates Dc1 and Dc2 of corrosion region 1 and region 2 had the most significant impact on RD, with sensitivity coefficients of 0.17 and 0.22, respectively. Next were the corrosion area Ac2 and location Lc2 of corrosion region 2, with sensitivity coefficients of 0.15 and 0.17, respectively. The slenderness ratio λ had the least impact on RD. This is mainly because sectional loss not only reduces the effective load-bearing cross-section of the angle steel but also causes centroid shifts, especially for single-side connected bracing members. Corrosion exacerbates eccentric effects, leading to more pronounced eccentric bending, thus making the sectional loss rate highly influential on RD. The corrosion area primarily reflects the extent of local loss in the member, causing stress redistribution during loading, thereby affecting the overall stability and bearing capacity of the specimen.
Figure 28.
Normalized K–S sensitivity coefficients of parameters.
Under free leg corrosion conditions, the sectional loss rates Dc1 and Dc2 of corrosion region 1 and region 2 had the most significant impact on RD, with sensitivity coefficients of 0.19 and 0.28, respectively. Next were the corrosion areas Ac1 and Ac2 of corrosion regions 1 and 2, with sensitivity coefficients of 0.13 and 0.16, respectively. The corrosion locations Lc1 and Lc2 had less impact on RD, with sensitivity coefficients of 0.05 and 0.07, respectively. This is mainly because the free leg does not directly bear loads, so the axial corrosion location has a relatively small impact on the overall stability of the member.
Based on the sensitivity analysis results of the loaded and free legs, under double-leg corrosion conditions, the sectional loss rates Dc1 and Dc2 of corrosion region 1 and region 2 had the most significant impact on RD, with sensitivity coefficients of 0.18 and 0.27, respectively. Since the sectional loss rate Dc1 of corrosion region 1 is less than that of Dc2, the impact of Dc1 on RD is relatively smaller. Next were the corrosion areas Ac1 and Ac2 of corrosion regions 1 and 2, with sensitivity coefficients of 0.13 and 0.17, respectively. The slenderness ratio λ had the least impact on RD, with a sensitivity coefficient of 0.06. In single-sided connected corroded angle steels, local corrosion reduces the effective load-bearing section and increases the additional bending moment, leading to premature global yielding and a subsequent decrease in the overall load-bearing capacity. Consequently, the slenderness ratio has a minimal effect on the RD of the angle steels.
6. Conclusions
This paper conducted electrochemical accelerated corrosion tests and eccentric compression tests on six single-side connected angle steel specimens under various corrosion parameter configurations, and performed parametric analysis under dual corrosion patterns based on an experimentally validated finite element simulation method. The main conclusions are as follows:
- (1)
- Corroded specimens were prepared using the electrochemical accelerated corrosion method, with the error between the target corrosion mass and the actual corrosion mass within 4.0%.
- (2)
- Eccentric compression tests were conducted on six single-sided connected angle steels. Analysis of the results revealed a significant strain difference between the compression and free legs, the compression leg exhibiting higher strain. A finite element model capable of effectively simulating the eccentric compression behavior and deformation of corroded members was established, and the error between the simulated ultimate bearing capacity and the experimental ultimate bearing capacity was less than 7.5%.
- (3)
- A finite element model validated by experimental results was employed to conduct a parametric analysis of corroded members. The results indicate that, compared with a single corrosion region, a dual corrosion configuration exhibits a more pronounced effect on the load-bearing capacity of the member. Moreover, as the spacing between the two corrosion regions decreases, the degradation ratio of load-bearing capacity increases accordingly. In addition, the relative corrosion depth and area ratio of the two corrosion regions have a significant influence on the bearing capacity degradation ratio.
- (4)
- Through systematic analysis of the effects of corrosion parameters under the dual corrosion region configuration, evaluation methods were developed to predict the bearing capacity degradation ratio of the compression leg and the free leg. Based on the computational models for corrosion in the compression leg and the free leg, an assessment approach for corrosion on both sides incorporating multiple corrosion parameters was established. This assessment method incorporates multiple corrosion parameters and, compared with traditional approaches, can more reasonably and accurately evaluate the bearing capacity degradation ratio of members under multiple corrosion patterns.
- (5)
- Based on a computational model incorporating dual corrosion regions, sensitivity analysis of the corrosion parameters was conducted using the K–S statistic method. The results show that the cross-sectional corrosion ratio has the greatest influence on the load-bearing capacity degradation ratio, followed by the corrosion area ratio. In contrast, corrosion location has a relatively minor influence on load-bearing capacity degradation under free leg corrosion conditions.
Author Contributions
W.C.: writing—original draft, software, validation. S.C.: writing—review and editing, formal analysis, investigation. Z.Z.: conceptualization, resources, methodology. H.W.: resources, funding acquisition, supervision. H.Q.: funding acquisition, methodology. F.F.: project administration, funding acquisition. All authors have read and agreed to the published version of the manuscript.
Funding
This research was funded by the National Key Research and Development Project of China (No. 2023YFC3805601), the National Natural Science Foundation of China (No. 52478153), the National Natural Science Foundation of China (No. 52308161), and the Natural Science Foundation of Shandong Province (No. ZR2023ME215).
Data Availability Statement
The data presented in this study are available on request from the corresponding author.
Conflicts of Interest
The authors declare no conflicts of interest.
References
- Ke, W. Current investigation into the corrosion cost in China. Total Corros. Control 2003, 17, 1. [Google Scholar]
- Xia, X.J.; Jin, Y.; Qiao, H.W.; Li, X.G.; Lei, L.W.; Hao, W.K.; Lin, D.Y. Investigation and analysis on corrosion status of power transmission and transformation equipment. Corros. Sci. Prot. Technol. 2019, 31, 121–127. [Google Scholar]
- Shi, X.; Chen, H.; Qiao, X.; Fan, P.; Bai, H. Analysis on corrosion of angle steel used for 500 kV transmission tower. Inner Mong. Petrochem. Ind. 2021, 47, 38–41. [Google Scholar]
- Zhang, Y.J. Corrosion mechanism and protection technology of steel structure. Total Corros. Control 2022, 36, 104–105. [Google Scholar]
- Yang, Y.T. Time-Dependent Wind Reliability Analysis of In-Service Transmission Towers Considering Corrosion Effects. Master’s Thesis, Chongqing University, Chongqing, China, 2022. (In Chinese) [Google Scholar]
- Qian, X.H.; Liang, H.; Wu, J.G. Durability evaluation of corroded components for in-service transmission line towers. East China Electr. Power 2013, 41, 1695–1698. [Google Scholar]
- Di Sarno, L.; Majidian, A.; Karagiannakis, G. The effect of atmospheric corrosion on steel structures: A state-of-the-art and case-study. Buildings 2021, 11, 571. [Google Scholar] [CrossRef] [Scilit]
- Zhang, C.T.; Zhu, H.; Zhu, L. Effect of interaction between corrosion and high temperature on mechanical properties of Q355 structural steel. Constr. Build. Mater. 2021, 271, 121605. [Google Scholar] [CrossRef] [Scilit]
- Chen, S.; Wang, H.; Feng, D.; Zeng, E.; Wang, S.; Zhang, Z.; Qi, M.; Qian, H.; Fan, F. Multi-scale structural analysis method for transmission towers considering the combined effects of multiple imperfections. Eng. Struct. 2026, 353, 122242. [Google Scholar] [CrossRef] [Scilit]
- Zeng, Y.R.; Zhang, C. Corrosion and mechanical behavior of a new Q450 weathering steel. J. Constr. Steel Res. 2025, 225, 109156. [Google Scholar] [CrossRef] [Scilit]
- Li, Z.; Guo, J.; Li, W.; Zhao, Y.; Gong, J. Experimental study on mechanical properties of corroded steel used as containment liner in nuclear power plant. J. Nucl. Sci. Technol. 2022, 59, 1266–1284. [Google Scholar] [CrossRef] [Scilit]
- Shi, W.Z.; Tong, L.W.; Chen, Y.Y.; Li, Z.; Shen, K. Experimental study on influence of corrosion on behavior of steel material and steel beams. J. Build. Struct. 2012, 33, 53–60. [Google Scholar]
- Zhang, Z.; Dong, J.; Ma, M.; Chen, W.; Wang, H.; Qian, H.; Fan, F. The aging behavior and failure mechanism of epoxy-acrylic polyurethane coating system under different accelerated testing methods. Eng. Fail. Anal. 2026, 188, 110650. [Google Scholar] [CrossRef] [Scilit]
- Ahn, J.-H.; Kainuma, S.; Kim, I.-T. Shear failure behaviors of a web panel with local corrosion depending on web boundary conditions. Thin-Walled Struct. 2013, 73, 302–317. [Google Scholar] [CrossRef] [Scilit]
- Zheng, S.; Wang, X.; Han, Y.; Tian, J.; Cheng, Y.; Sun, L. Experimental study on seismic behavior of steel frame columns with different service ages in acidic atmospheric environment. China Civ. Eng. J. 2015, 48, 47–59. [Google Scholar]
- Xu, S.H.; Wang, H.; Xue, N. Deterioration law of bearing properties for corroded eccentric steel columns. J. Harbin Inst. Technol. 2016, 48, 157–163. [Google Scholar]
- Tohidi, S.; Sharifi, Y. Load-carrying capacity of locally corroded steel plate girder ends using artificial neural network. Thin-Walled Struct. 2016, 100, 48–61. [Google Scholar] [CrossRef] [Scilit]
- Cao, C.; Zheng, S.S.; Hu, W.B.; Zhang, X.; Liu, Y. A review on mechanical properties of steel structures under atmospheric corrosion. Mater. Rep. 2020, 34, 11162–11170. [Google Scholar]
- Zhang, J.; Hou, B.; Huang, Y.; Guo, G. Grey interrelation analysis of alloy elements and steel corrosion. Mater. Corros. 2000, 51, 514–517. [Google Scholar] [CrossRef]
- Katayama, H.; Noda, K.; Masuda, H.; Nagasawa, M.; Itagaki, M.; Watanabe, K. Corrosion simulation of carbon steels in atmospheric environment. Corros. Sci. 2004, 47, 2599–2606. [Google Scholar] [CrossRef] [Scilit]
- Akduman, S. Effect of reinforcement corrosion on structural behavior in RC structures according to initiation and propagation periods. Buildings 2024, 14, 4026. [Google Scholar] [CrossRef] [Scilit]
- Ni, Y.; Zhu, E.; Chen, L. Steel strand corrosion and corrosion-induced cracking in concrete structures under electrochemical corrosion. Buildings 2025, 15, 3681. [Google Scholar] [CrossRef] [Scilit]
- Sarfaraz, A.; Harish, K.V.; Misra, S. Experimental behaviour of deep reinforced concrete beams exposed to combined effect of pre-fatigue cycles and rebar corrosion. Structures 2025, 76, 108995. [Google Scholar] [CrossRef] [Scilit]
- Papakonstantinou, K.G.; Shinozuka, M. Spatial stochastic and sensitivity analysis of steel corrosion in a RC port structure. In Proceedings of the International Conference on Structural Safety and Reliability (ICOSSAR), Rome, Italy, 19–23 June 2005; pp. 1–8. [Google Scholar]
- Gu, X.; Zhang, Y.; Huang, C.; Luo, X.; Zhang, H.; Zhou, R.; Qiu, Y. Sensitivity analysis of influencing factors of gas pipelines with corrosion defects under the action of landslides. Energies 2022, 15, 6640. [Google Scholar] [CrossRef] [Scilit]
- Oszvald, K.; Tomka, P.; Dunai, L. The remaining load-bearing capacity of corroded steel angle compression members. J. Constr. Steel Res. 2016, 120, 188–198. [Google Scholar] [CrossRef] [Scilit]
- Zeng, S.; Gu, S.; Ren, S.; Gu, Y.; Kong, C.; Yang, L. A modeling method for finite element analysis of corroded steel structures with random pitting damage. Buildings 2022, 12, 1793. [Google Scholar] [CrossRef] [Scilit]
- Ranji, A.R. Buckling analysis of corroded angle beams with irregular random surfaces. J. Fail. Anal. Prev. 2016, 16, 912–918. [Google Scholar] [CrossRef] [Scilit]
- Ahn, J.H.; Choi, W.R.; Jeon, S.H.; Kim, S.H.; Kim, I.T. Residual compressive strength of inclined steel tubular members with local corrosion. Appl. Ocean Res. 2016, 59, 498–509. [Google Scholar] [CrossRef] [Scilit]
- Zhao, N.; Zhang, C. Experimental investigation of the mechanical behavior of corroded Q345 and Q420 structural steels. Buildings 2023, 13, 475. [Google Scholar] [CrossRef] [Scilit]
- Dong, J.; Zhang, Z.; Yang, T.; Wang, J.; Ma, M.; Chen, W.; Qian, H.; Fan, F. Comparative study on surface morphology evolution and mechanical property degradation of galvanized steel under different corrosion tests and its service life prediction. Case Stud. Constr. Mater. 2025, 23, e05242. [Google Scholar] [CrossRef] [Scilit]
- Wu, B.; Cao, J.; Kang, L. Influence of local corrosion on behavior of steel I-beams subjected to end patch loading: Experiments. J. Constr. Steel Res. 2017, 135, 150–161. [Google Scholar] [CrossRef] [Scilit]
- Wang, R.; Fang, Y.; Dou, P.; Lin, Z. Study on axial compressive ultimate bearing capacity of leg columns of jacket platforms with pitting corrosion damage. Ocean Eng. 2015, 33, 29–35. [Google Scholar]
- Nakai, T.; Matsushita, H.; Yamamoto, N.; Arai, H. Effect of pitting corrosion on local strength of Hold frames of bulk carriers (1st report). Mar. Struct. 2004, 17, 403–432. [Google Scholar] [CrossRef] [Scilit]
- Wang, R.H.; Zhao, S.S. Prediction of ultimate strength of steel plates with random pitting corrosion damage. Eng. Mech. 2018, 35, 248–256. [Google Scholar]
- GB/T 228.1-2021; Metallic Materials—Tensile Testing—Part 1: Method of Test at Room Temperature. Standards Press of China: Beijing, China, 2021. (In Chinese)
- DL/T 5486-2020; Technical Specification for Design of Tower Structures of Overhead Transmission Lines. Standards Press of China: Beijing, China, 2020. (In Chinese)
- Chen, B.; Xu, Y.L.; Qu, W.L. Evaluation of atmospheric corrosion damage to steel space structures in coastal areas. Int. J. Solids Struct. 2005, 42, 4673–4694. [Google Scholar] [CrossRef] [Scilit]
- Glinicka, A.; Imieowski, S.; Ajdukiewicz, C. Influence of Uniformly Distributed Corrosion on the Compressive Capacity of Selected Thin-Walled Metal Columns. Procedia Eng. 2015, 111, 262–268. [Google Scholar] [CrossRef] [Scilit]
- Luo, Y.H.; Huang, Y.; Yang, X.F.; Chen, G.; Teng, Y.; Liu, W.; Li, F. Effect of P elements on mechanical properties and corrosion resistance of high strength weathering steel used in transmission tower. Iron Steel Vanadium Titan. 2019, 40, 142–147. [Google Scholar]
- Rahgozar, R. Remaining Capacity Assessment of corrosion damaged beams using minimum curves. J. Constr. Steel Res. 2009, 65, 299–307. [Google Scholar] [CrossRef] [Scilit]
- Chen, M.; Fang, W.; Huang, H. Static behavior of corroded concrete-filled steel tubular members by simulating acid rain solution. J. Eng. Mech. 2020, 37, 34–43. [Google Scholar]
- Kim, Y.; Toledo, K.K.; Jeong, Y.S.; Song, S.Y.; Kim, I.T. Residual compressive strength of locally corroded intermediate tubular steel columns. J. Eng. Fail. Anal. 2022, 138, 106375. [Google Scholar] [CrossRef] [Scilit]
- Shu, Q.; Wang, K.; Yuan, G.; Zhang, Y.; Liu, Z. Assessing capacity of corroded angle members in steel structures based on experiment and simulation. Constr. Build. Mater. 2020, 244, 118210. [Google Scholar] [CrossRef] [Scilit]
- Beaulieu, L.; Legeron, F.; Langlois, S. Compression strength of corroded steel angle members. J. Constr. Steel Res. 2011, 66, 1366–1373. [Google Scholar] [CrossRef] [Scilit]
- Hisazumi, K.; Kanno, R. Column Buckling of Corroded Steel Angles and Channels: Experiments and Failure Mode Analyses. J. Struct. Eng. 2021, 147, 04021106. [Google Scholar] [CrossRef] [Scilit]
- Pianosi, F.; Wagener, T. A simple and efficient method for global sensitivity analysis based on cumulative distribution functions. Environ. Model. Softw. 2015, 67, 1–11. [Google Scholar] [CrossRef] [Scilit]
- Wang, H.; Ma, H.B.; Xu, H.L.; Hua, G.R. Remaining useful life prediction method for mechanical equipment based on K-S test and dynamic grey model. Instrum. Tech. Sens. 2015, 1, 97–100. [Google Scholar]

Disclaimer/Publisher’s Note: The statements, opinions and data contained in all publications are solely those of the individual author(s) and contributor(s) and not of MDPI and/or the editor(s). MDPI and/or the editor(s) disclaim responsibility for any injury to people or property resulting from any ideas, methods, instructions or products referred to in the content. |
© 2026 by the authors. Licensee MDPI, Basel, Switzerland. This article is an open access article distributed under the terms and conditions of the Creative Commons Attribution (CC BY) license.