


Abstract
Windows are key elements of the building’s system; they connect workers with the outdoor environment, influence daylight penetration, sound insulation, and thermal exchanges of façades, but they also moderate the workers’ well-being and productivity. This research investigates how the window-to-wall ratio, as well as the position and orientation of mullions, in movable offices affect the combination of workers’ perceptual and emotional responses. A smart co-working prefabricated movable office was modelled in virtual reality to include dynamic visual elements and acoustic stimuli. Experiments were performed in a laboratory under controlled thermal conditions involving 32 volunteers. The Igroup Presence and Emotional Salience Questionnaires were used to collect subjective responses. ANOVA analysis and post hoc test with the Bonferroni correction were used for data elaboration. Results revealed that window design affects emotional salience. High window-to-wall ratio and no mullions achieved the highest scores. Increasing the number of mullions, particularly when they obstruct key visual elements, reduced the positive emotional salience rating. Horizontal mullions diminish the outdoors’ spatial perception, interrupting visual continuity and restricting users’ capacity to recognise variations in the views. Finally, the results suggest some valuable insights and suggestions that can help designers improve window design and people’s well-being and satisfaction.
1. Introduction
Windows are crucial elements in architectural design, being strongly linked to the view of nature, sunlight penetration and non-visual effects of light [1,2]. The design of windows also plays a significant role in influencing thermal comfort perceptions [3,4,5], air quality [6,7,8,9], sound insulation [10,11], occupants’ health [12,13], well-being [3,14,15,16], and job performance [3,17,18,19]. Despite the insights gained from research conducted over the years, the lack of thorough guidelines contributes to ongoing uncertainty in the field [20]. Achieving optimal visual quality in architectural design remains a challenging objective, as it involves numerous factors, including environmental variables, fenestration dimensions, and the specific characteristics of glazing materials [21,22,23,24,25].
1.1. Window Design Literature Review
Among the various factors influencing window design, the literature indicates that the window-to-wall ratio (WWR) is the most critical parameter impacting both thermal efficiency and visual performance. WWR quantifies the proportion of the total wall surface area occupied by window openings and is linked to daylighting, thermal performance, and energy efficiency in buildings. Optimal WWR value depends strongly on the project’s objective, the task to perform, and people’s expectations. Higher WWR values are welcomed to reduce energy consumption in colder climates and meet users’ demand for daylight and views out [26,27]. In contrast, lower WWR values should be used to reduce cooling loads in warmer climates [28,29,30,31], as well as to prevent visual and thermal discomfort [32,33]. Studies conducted in both physical and virtual settings suggest different optimal WWR values for enhancing occupant comfort, satisfaction, and overall well-being, although WWR can also lead to privacy issues [27,34,35]. Other window design elements can influence functionality and user satisfaction, albeit to a lesser extent. Fenestration objects, including window frames or mullions, along with shading systems, are additional parameters that affect window design and performance, influencing view quality and users’ satisfaction in the architectural context [25,36]. Ijsselsteijn et al. [37] included mullions in a study aimed at investigating the effectiveness of virtual systems in reproducing the perception of a real window. Kent et al. [36] argued that the view clarity is often influenced by multiple obstructions rather than a single element. The effects of window objects, such as mullions, on view clarity were examined by Ko et al. [25], who found that horizontal mullions can impair visual clarity, whereas vertical mullions can help maintain it to some extent. Keighley [38] suggested that increasing the number of million reduces satisfaction with the view. The satisfaction reduction is even more marked for distant views, since mullions cover a greater part of the elements seen. Wang et al. [39] investigated the effects of different WWR and height-to-width ratios in office buildings on the sense of oppressiveness. Results pointed out that the high WWR values generally mitigated feelings of oppressiveness, whereas an increased height-to-width ratio intensified those feelings. Parsaee et al. [40] presented a computational method for analysing window-view access. The research examined different window configurations, window divisions, and overhangs. Results underline that increasing WWR improves the view access. Segmenting a single window into multiple smaller frames can enhance the uniformity of view access. However, excessive subdivision may compromise the overall view access. View access can be reduced by overhanding. Moscoso et al. [41] explored how window size affects our sense of space and satisfaction with natural light and views, particularly in small and large rooms in high-latitude areas. The findings indicated that both window size and the type of space significantly affected how people perceived the environment and their overall satisfaction with the view. Abboushi et al. [42] examined how different window designs and sunlight patterns affect how comfortable and engaged people feel in office spaces. The findings showed that there were not any major differences in visual comfort or interest across the three different setups they tested. Fractal and striped patterns on windows made the views feel less appealing compared to clear windows. The literature analysis acknowledges the importance of windows in influencing people’s perception, view clarity, and comfort and at the same time highlights that only a very few studies have investigated the effects of mullions and window design on people’s emotions.
1.2. Co-Working Spaces
Recent trends indicate an increasing amount of time individuals spend in built environments, underscoring the need for innovative design solutions that significantly improve visual comfort and maximise daylight access in co-working spaces [42,43]. Driven by people migration, co-working spaces have historically been located in urban centres [44]. The pandemic led to a change in the function, usage, and positioning of co-working spaces [45]. Progressively, co-working spaces moved towards rural and suburban areas [46,47], mainly driven by the desire to be in contact with restorative places [48,49], and by the need to reduce the environmental impact due to workers’ long commutes [50]. Schnieder [51] investigated how the co-working spaces’ location can help in reducing travel duration and distance, as well as pollutants. The CO2 reduction achievable from the use of co-working spaces in suburban and rural areas was investigated by Krasilnikova [47]. The type, location, and characteristics of co-working places can also affect users’ preferences, performance, as well as mental and physical health, as argued by some studies [49,52,53]. In the Italian scenario, where people are increasingly abandoning small rural and historic centres in favour of urban areas with better services and job opportunities, co-working spaces, especially prefabricated ones, have been proposed to offer a concrete and rapid solution to the depopulation of villages. The literature underlines the need of further investigations to better understand the effects of window design and outdoor view of movable offices on people’s perception and emotional effects.
1.3. Virtual Reality for Architectural Alternatives Explorations
Over the years, different tools have been proposed for multisensory research to investigate people’s performance and preferences. Among them, virtual reality is considered one of the most powerful, providing high-quality visual and auditory reproductions of existing or only designed environments, guaranteeing reliable simulations [54] and high ecological experiences for the participants [55,56] by offering, at the same time, new research opportunities [57,58]. An interesting application concerns its use in investigating the interactions between changes in the design-driven surrounding environment and human experiences. The latter can be described by collecting perceptions and emotions [59] using evaluation scales or questionnaires. Most of them cover the perceptual [60] or the emotional [61] sphere exclusively; others focus only on a specific environmental domain [62,63]. Chamilothori et al. [64] investigated how contemporary façade geometries and the daylight patterns affect occupants’ perceptual and physiological responses in interior spaces. VR is used to present fully immersive, stereoscopic simulations of a real architectural space, allowing participants to experience and evaluate daylit interiors that would be difficult to test consistently in real-world settings. In Cho et al. [65], VR was used to investigate people’s subjective responses when viewing static images or dynamic videos of identical scenes, thereby isolating the perceptual effects of movement while controlling for scene content, geometry, and viewing conditions. The literature confirms that VR is a suitable tool for research on people’s perceptions and subjective responses. At the same time, it highlights that research usually considers visual stimuli. Other stimuli that can influence people’s responses, such as acoustic stimuli or environmental parameters, are generally not considered.
1.4. Research Aim
This research investigates the effects of WWR design, the number and orientation of mullions of movable offices, on office workers’ emotional salience. With this aim, a Prefabricated Movable Building for Smart Co-working Office (PMB_SCO) was designed by the authors [49] and digitally modelled in VR to include visual and acoustic dynamisms (such as the movement of trees, people’s voices, or the roar of the fountain) in order to make the exploration even more immersive and realistic. It was virtually installed in the historic centre of a southern Italian village and used to experience and compare, together with a control scenario, different window configurations. Boundary conditions, namely temperature, humidity, and air speed, were controlled to mitigate confounding negative effects among tests. The Emotional Salience Questionnaire, developed by Masullo et al. [66], has been demonstrated to have a good structure [67], as well as a high consistency and flexibility to describe experiences of different domains, such as those of sound [68] and vision [69].
2. Materials and Methods
2.1. Materials
2.1.1. Prefabricated Movable Building for Smart Co-Working Office
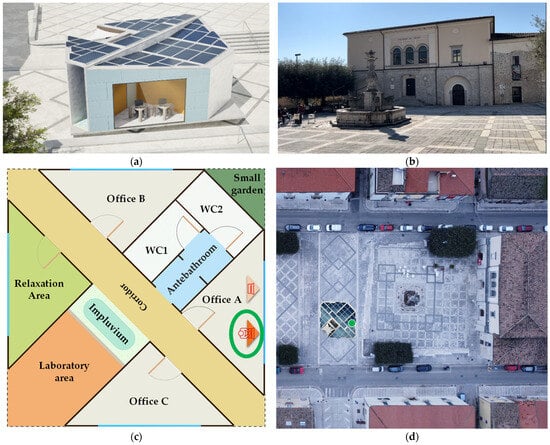
A new prefabricated, energy self-sufficient movable co-working module was considered in this research. This innovative PMB_SCO structure was designed to accommodate office workers and to be placed in diverse locations. The building’s modular design enhances flexibility and scalability, making it suitable for various spatial and operational contexts. The PMB_SCO has a total floor area of 60 m2 and consists of four main spaces (a relaxation area and three offices) and a service area (two bathrooms and a corridor). Each main space is equipped with a large window that provides a visual and acoustic connection to the external environment. Each office is designed for two workers, while the colour and shape of the furniture and the room were defined to increase users’ comfort. Each office is equipped with a large double-glazed, filled with krypton, window (SageGlass® Climaplus Classic manufactured by “Saint-Gobain” based in Milan-Italy). A small (about 1 m2) ventilation grille (DucoGrille Close 105 manufactured by “DUCO Ventilation & Sun Control” based in Veurne-Belgium) is also considered to ensure proper room ventilation. More details can be found in [49]. Figure 1a shows the external view of the PMB_SCO model, underlining the shape of the office and the position of the window.
Figure 1.
Case study: (a) External view of the PMB_SCO model, (b) picture of San Martino square with characteristic elements, (c) PMB_SCO’s layout with position of users, identified with a green circle, and (d) PMB_SCO model positioned in the San Martino square, while the green dot identifies the participants’ point of view.
The PMB_SCO model was virtually located in two distinct surrounding places.
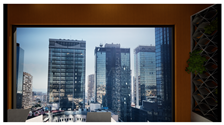
The first, used as a control scenario for the experiment, replicated the office environment on the 10th floor of a skyscraper in a city business district. The window view from the office is predominantly characterised by adjacent office buildings and surrounding skyscrapers. The outdoor view in this control scenario enabled the isolation of elements that can moderate individuals’ perception (e.g., people, trees, water features), while maintaining an acceptable, neutral, and realistic condition by including the sky and high-rise modern buildings.
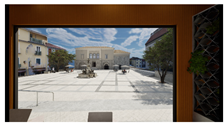
As a second surrounding scenario, the San Martino square in the historical centre of Cerreto Sannita, a Small Village (SV) of the Campania Region of southern Italy, was considered. The choice of this square is motivated by several reasons. Cerreto Sannita can be regarded as representative of a Campania town due to its slower and reflective lifestyle, as well as its cultural, historical, and architectural attributes [49]. More in detail, the window view shows the main square of Cerreto Sannita Municipality, characterised by a limestone pavement with a fountain (“Fontana dei Delfini”) in the centre surrounded by historic palaces, e.g., “Palazzo del Genio” (Figure 1b). Figure 1c shows the internal layout of the PMB_SCO with indications of the office and desk from which volunteers explored virtual scenarios, while Figure 1d displays the position of PMB_SCO in the San Martino square.
2.1.2. VR Environment Development
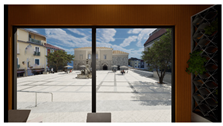
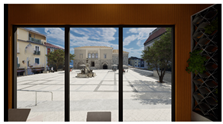
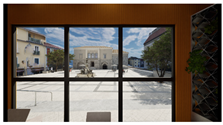
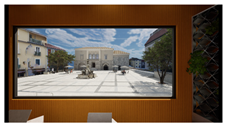
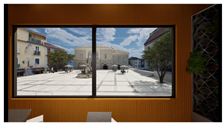
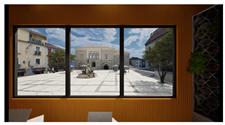
The PMB_SCO’s 3D model was created in SketchUp 2019 [70], with particular emphasis on modelling each of the window designs investigated. A total of seven different window designs were considered, varying the window height as well as the number and orientation of mullions. The area of the wall where the window is, and the window width, were kept constant at 20 m2 and 4.00 m, respectively. Each model was then imported into 3ds Max 2021 [71] for surface normal direction checks, material application, UV map handling, and light map generation. The optimised model was finally imported into UE5, where all materials (including colours and textures) were crafted and assigned to the appropriate surfaces. The same external climatic conditions, the glazing, and window glass were used across all scenarios. The window glass was modelled using a transparent material with the parameter opacity set to 0.35. Much attention has been paid to the correct reproduction of shadows under different window configurations.
For modelling the small village’s main square, an extensive geometric and photographic survey, focusing primarily on the architectural elements (“Palazzo del Genio” and “Fontana dei Delfini”), was carried out. The collected data were used to create a 3D model in SketchUp 2019 software. The visual accuracy of the 3D model was refined by comparing it with terrestrial photographs taken with an iPhone 13 Pro, which features a 12 MP (3024 × 4032 pixels) resolution. The optimised model was imported into UE5 to undergo further enhancement, incorporating vegetation, trees, hedges, and shrubs. Surface colours and textures were selected from photographic surveys in the UE5 database to match the real environment closely.
The virtual control scenario was obtained using a hybrid approach. The 2D image of the window view acquired from the office located on the 10th floor of the skyscraper was combined with the 3D model of the PMB_SCO. The sound environment inside the office was recorded by using a portable four-channel data acquisition system SQobold (Head Acoustics) combined with the Binaural Headset II [72] and analysed by the software Artemis 14.3 (Head Acoustics). On average, the A-weighted sound equivalent level was around 38 dB(A).
To improve the virtual scenario immersion, a representative soundtrack of the acoustic environment, including human activities, the voice of people, pedestrians traversing the square, the flow of fountain water and ambient low-level traffic noise, was captured with the same equipment and included in the virtual environment. The A-weighted sound equivalent level of about 62 dB(A) of the outdoor sound recordings was attenuated up to about 38 dB(A) by combining the octave band transmission losses due to the presence of the large window with those of the small ventilation grille, considering a minimal propagation distance of about 2 m of the facade from the sound recording point. The virtual scenarios for subjective assessment were created by importing the virtual model of the PMB_SCO’s into the virtual model of San Martino square.
Table 1 lists the investigated virtual scenarios and the main characteristics of the window design alternatives. For each scenario, information about the WWR, the Frame Ratio (FR), the number and orientation of the mullions, the window height and the window area is provided. The FR was calculated as the ratio of the frame area to the window area.
Table 1.
Window design investigated.
2.1.3. Hardware
Scenarios were prepared using Unreal Engine™ version 5.3.2, installed on a desktop computer with an Intel Core i7-9000, 3.00 GHz CPU, 64 GB RAM, and NVIDIA GeForce RTX 2080 Graphics Card.
Scenarios were displayed using an Oculus Rift S (resolution 1280 × 1440 per eye, refresh rate of 80 Hz, 88° horizontal and vertical field of view), equipped with integrated cameras which ensure fluid motion tracking without the need for external sensors.
The sound environment recordings acquired during the field survey were reproduced through the Astro Spatial Audio system [73]. To ensure that all volunteers conducted the test under the same boundary conditions, during the tests, the room temperature and relative humidity were controlled with the HVAC system. Air temperature was kept at 20° C with a dead band of ±1° C, while relative humidity was kept at 50% with a dead band of ±10% [74]. The temperature and humidity setpoints were defined to ensure thermal comfort in the winter period, when the experiments were performed. Both the return and supply air fans of the HVAC system operated at 30% speed to avoid interference with the soundtracks. At the same time, people were prevented from passing or stopping near the laboratory to prevent external noise from affecting the audio tracks.
2.2. Method
2.2.1. Data Collection
Before starting the test, participants were asked for general information to gather data on participants’ demographic and socioeconomic characteristics, such as age, gender, educational background, occupation, area of residence, daily working hours, preferred vacation destinations, and their inclination towards increasing the frequency of holiday travel. To collect the subjective feedback of participants to the presented scenarios, two different questionnaires were administered:
- The Igroup Presence Questionnaire (IPQ) [49] to assess the participants’ sense of presence in the virtual environments (English and Italian versions are in Appendix A);
- Emotional Salience Questionnaire [66], to evaluate both, the subjective perception of the surrounding environment by mean three positive perceptual, namely Pleasant (PLE), Attractive (ATT), and Stimulating (STI), and three negative perceptual, namely Unpleasant (UNP), Boring (BOR), and Unattractive (UNA), adjectives, and the emotions they felt while in the VR scenarios examined, by mean three positive emotional, namely Calm (CAL), Happy (HAP), Energetic (ENE), and three negative emotional, namely Nervous (NER), Sad (SAD), Weak (WEA), adjectives. Participants engaged in the virtual environment were asked to rate each item, using a 9-point Likert scale (1 = Not at all; 9 = Extremely). (English and Italian versions are in Appendix A).
A priori analysis for ANOVA repeated-measure test was conducted using G*Power [75], indicating that a minimum sample size of 31 participants is necessary to achieve statistical power equal to 0.95, an effect size equal to 0.33, and a level of significance equal to 0.05. Given the significance of colour vision in this study, only data from participants who successfully completed the Ishihara test were included in the analysis. Of the thirty-four volunteers recruited, two were excluded because they failed the Ishihara test. Ultimately, 32 volunteers participated in the research and completed the series of 8 scenarios, presented according to a balanced sequence. According to the results of the demographic and general information questionnaire, 53% of volunteers declared themselves female (47% male). A total of 25% of volunteers were aged 18–25, 47% aged 26–35, and 28% aged 36–65. In terms of education, 18.7% of participants had a high school diploma, 9.4% a bachelor’s degree, 50.0% a master’s degree, and 21.9% a PhD degree. Most participants reported daily working hours between 5 and 8 (53.1%) and between 8 and 10 (34.3%); only 6.3% reported working less than 5 h or more than 10. Regarding vacation preferences, all the volunteers would like to travel more, with the majority (37.5%) favouring visits to small villages. Most of the volunteers reside in intermediate (37.5%) and suburban areas (37.5%), while a smaller portion (9.3%) reside in historic centres or rural areas.
2.2.2. Experimental Protocol
Before starting the test, volunteers were informed about the objectives and the motivation of the research. They were then instructed to complete the Ishihara test to identify any colour vision deficiencies [76]. Subsequently, participants filled out a demographic and general information questionnaire to gather relevant background data.
Upon completing the initial step, the volunteer was guided to the test room of the SENS i-Lab [77], at the Department of Architecture and Industrial Design at the University of Campania “Luigi Vanvitelli”, to start the experimental session. The volunteer was directed to sit at a desk in the centre of the room, allowing for the simulation of an office work environment. Following a briefing on the experimental protocol and a training on how to answer questionnaires, the volunteer wore the HMD. For each scenario, the volunteer was allotted two minutes for visual adaptation and exploring the virtual environment. Subsequently, the volunteer verbally responded to the IPQ and Emotional Salience Questionnaire.
The scenarios were presented according to a balanced sequence, obtained using a Balanced Latin Square Generator [78], to mitigate presentation order effects.
3. Results
In the following sections, the results derived from the responses of the 32 volunteers to the IPQ (Section 3.1) and the emotional salience of stimuli (Section 3.2) are presented.
3.1. IPQ
The IPQ results [49] highlight a strong sense of presence in the virtual environment among participants. More specifically, General Presence, Spatial Presence, and Involvement fell within the Moderate range, indicating an acceptable sense of being present, spatially situated, and engagement with the environment. Experienced Realism falls within the Very High class, confirming a highly realistic perceived virtual scenario.
The overall IPQ score is classified as High, exceeding the scores of approximately 75% of comparable studies, and the REAL subscale is categorised as “Very High”, confirm that the virtual environment provides a sufficiently strong and credible sense of presence, making it suitable for experiments investigating windowed spaces and their perceptual effects.
3.2. Emotional Salience Scale
This section provides an overview of statistical analyses on both positive and negative dimensions of the emotional salience scale.
To analyse main effects and interaction of the scenario on the emotional salience character, two mixed factorial 8 × 6 ANOVAs that treated scenario as an 8-level within-subject factor (CBD_L1, SV_L1, SV_L2, SV_L3, SV_L4, SV_S1, SV_S2, and SV_S3) and the positive/negative character of the emotional salience scale as a 6-level between-subject factor (Pleasant, Attractive, Stimulating, Calm, Happy, Energetic/Boring, Unpleasant, Unattractive, Nervous, Sad, Weak) were carried out. Marginal mean (M) and standard error (SE) were calculated to analyse participants’ responses. Post hoc test with the Bonferroni correction was used to evaluate statistically significant differences among the within-subject factors when varying window configurations (WWR and mullions) and outdoor view types (SV or CBD). Analyses were performed separately for the positive (ES+) and negative (ES−) dimensions of the scale in terms of: (i) scenario factor, to investigate the significant differences across scenarios, (ii) character factor, to investigate the significant differences across factors and (iii) scenario vs. character factor, to evaluate the interrelated effects of both factors on responses.
3.2.1. Positive Dimension of Emotional Salience
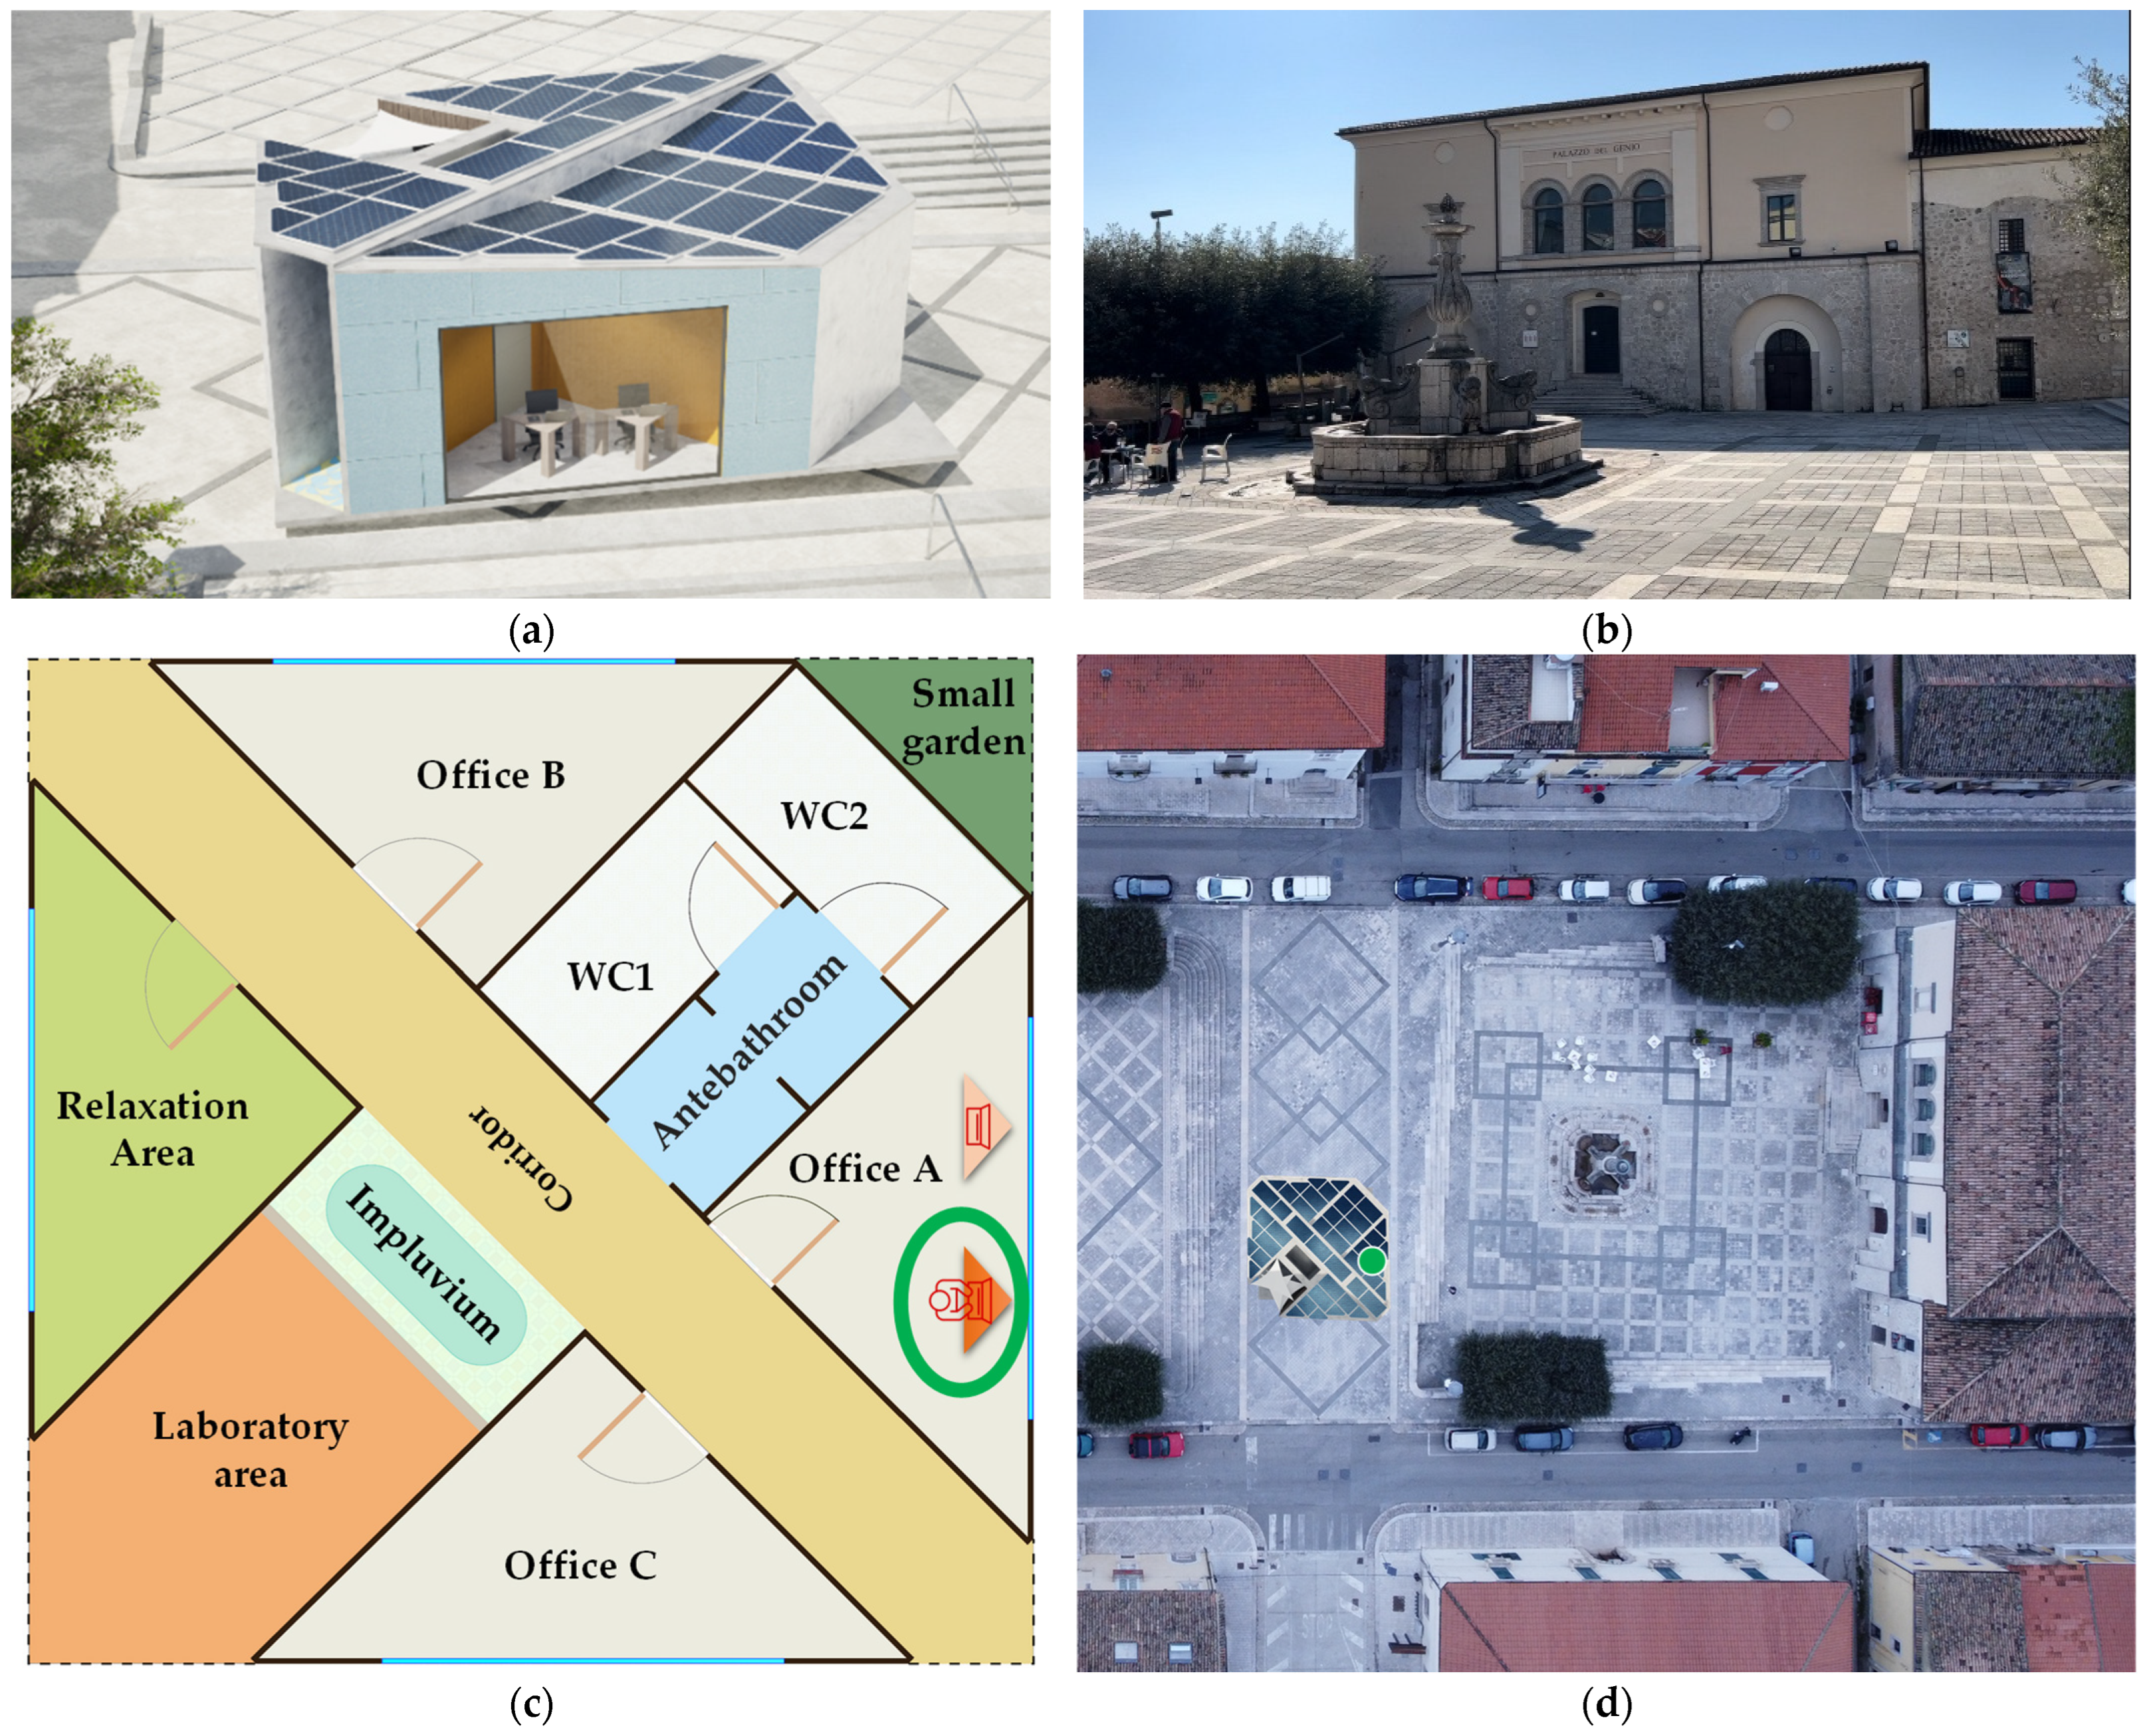
The ANOVA on the positive dimension revealed a significant main effect of the scenario factor, F(4.28, 132.82) =31.17, p < 0.0001, as listed in Table 2. Figure 2 displays the marginal means and standard errors for the positive dimension of the emotional salience and Frame Ratios in each condition, organised by WWR groups, as well as the statistically significant pairwise scenario comparisons. Bonferroni post hoc tests highlight clearly that the CBD_L1 and SV_L1 scenarios were the scenarios rated significantly differently (p < 0.001) from all others. In particular, CBD_L1 resulted in the scenario with the lowest positive rating (MCBD_L1 = 3.99, SECBD_L1 = 0.30), while SV_L1 resulted in the one with the highest rating (MSV_L1 = 7.17, SESV_L1 = 0.17). Additionally, SV_L2 (MSV_L2 = 6.41, SESV_L2 = 0.19) resulted significantly higher than SV_S2 (MSV_S2 = 5.92, SESV_S2 = 0.19), and SV_L3 (MSV_L3 = 6.67, SESV_L3 = 0.17) resulted significantly higher than SV_L4 (MSV_L4 = 6.10, SESV_L4 = 0.24), SV_S2 (MSV_S2 = 5.92, SESV_S2 = 0.19) and SV_S3 (MSV_S3 = 6.00, SESV_S3 = 0.21) scenarios.
Table 2.
Positive emotional salience.
Figure 2.
Marginal means, standard errors, and statistical significances of the positive dimension of the emotional salience scale, alongside the WWR and Frame Ratio values.
The figure underlines that:
- The highest and lowest positive ratings were associated with the largest WWR of 53.5% characterised by the absence of the mullions, and the minimum FR of 6.71%.
- Under identical window design conditions (WWR = 53.5%, FR = 6.8%), participants rated the scenarios with the Small Village view (SV_L1) significantly more positively than the City Business District (CBD_L1).
- Moreover, SV_L1 also shows a higher positive rating than scenarios SV_S1, SV_S2, and SV_S3, which are characterised by a lower WWR (35.7%), regardless of the number mullions and, consequently, the FR value.
- Scenario SV_L2 exhibits a significantly higher positive rating compared to scenarios SV_S2, which has the same vertical mullion but a lower WWR.
- Scenario SV_L3 exhibits a significantly higher positive rating compared to scenarios SV_L4, which have the same WWR (53.4%) but an internal horizontal mullion.
- The positive rating is significantly higher in SV_L3 (WWR = 53.4%, FR = 11.8%), also compared to SV_S2 (WWR = 35.7%, FR = 11.2%) and SV_S3 (WWR = 35.7%, FR = 13.7%), which combines a smaller WWR with the presence of a comparable or higher FR.
- No significant differences were detected between SV_L4 (WWR = 53.5%, FR = 15.4) and scenarios with lower WWR (35.7%), regardless of the number of mullions.
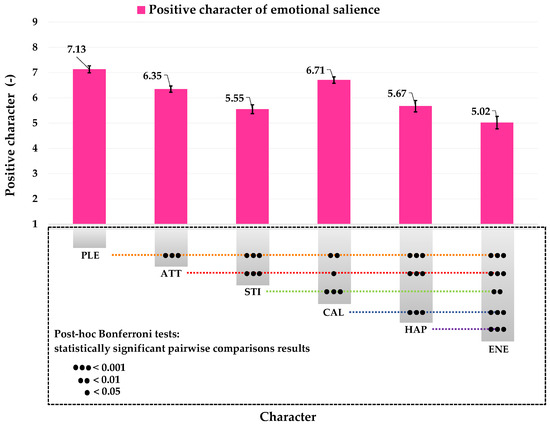
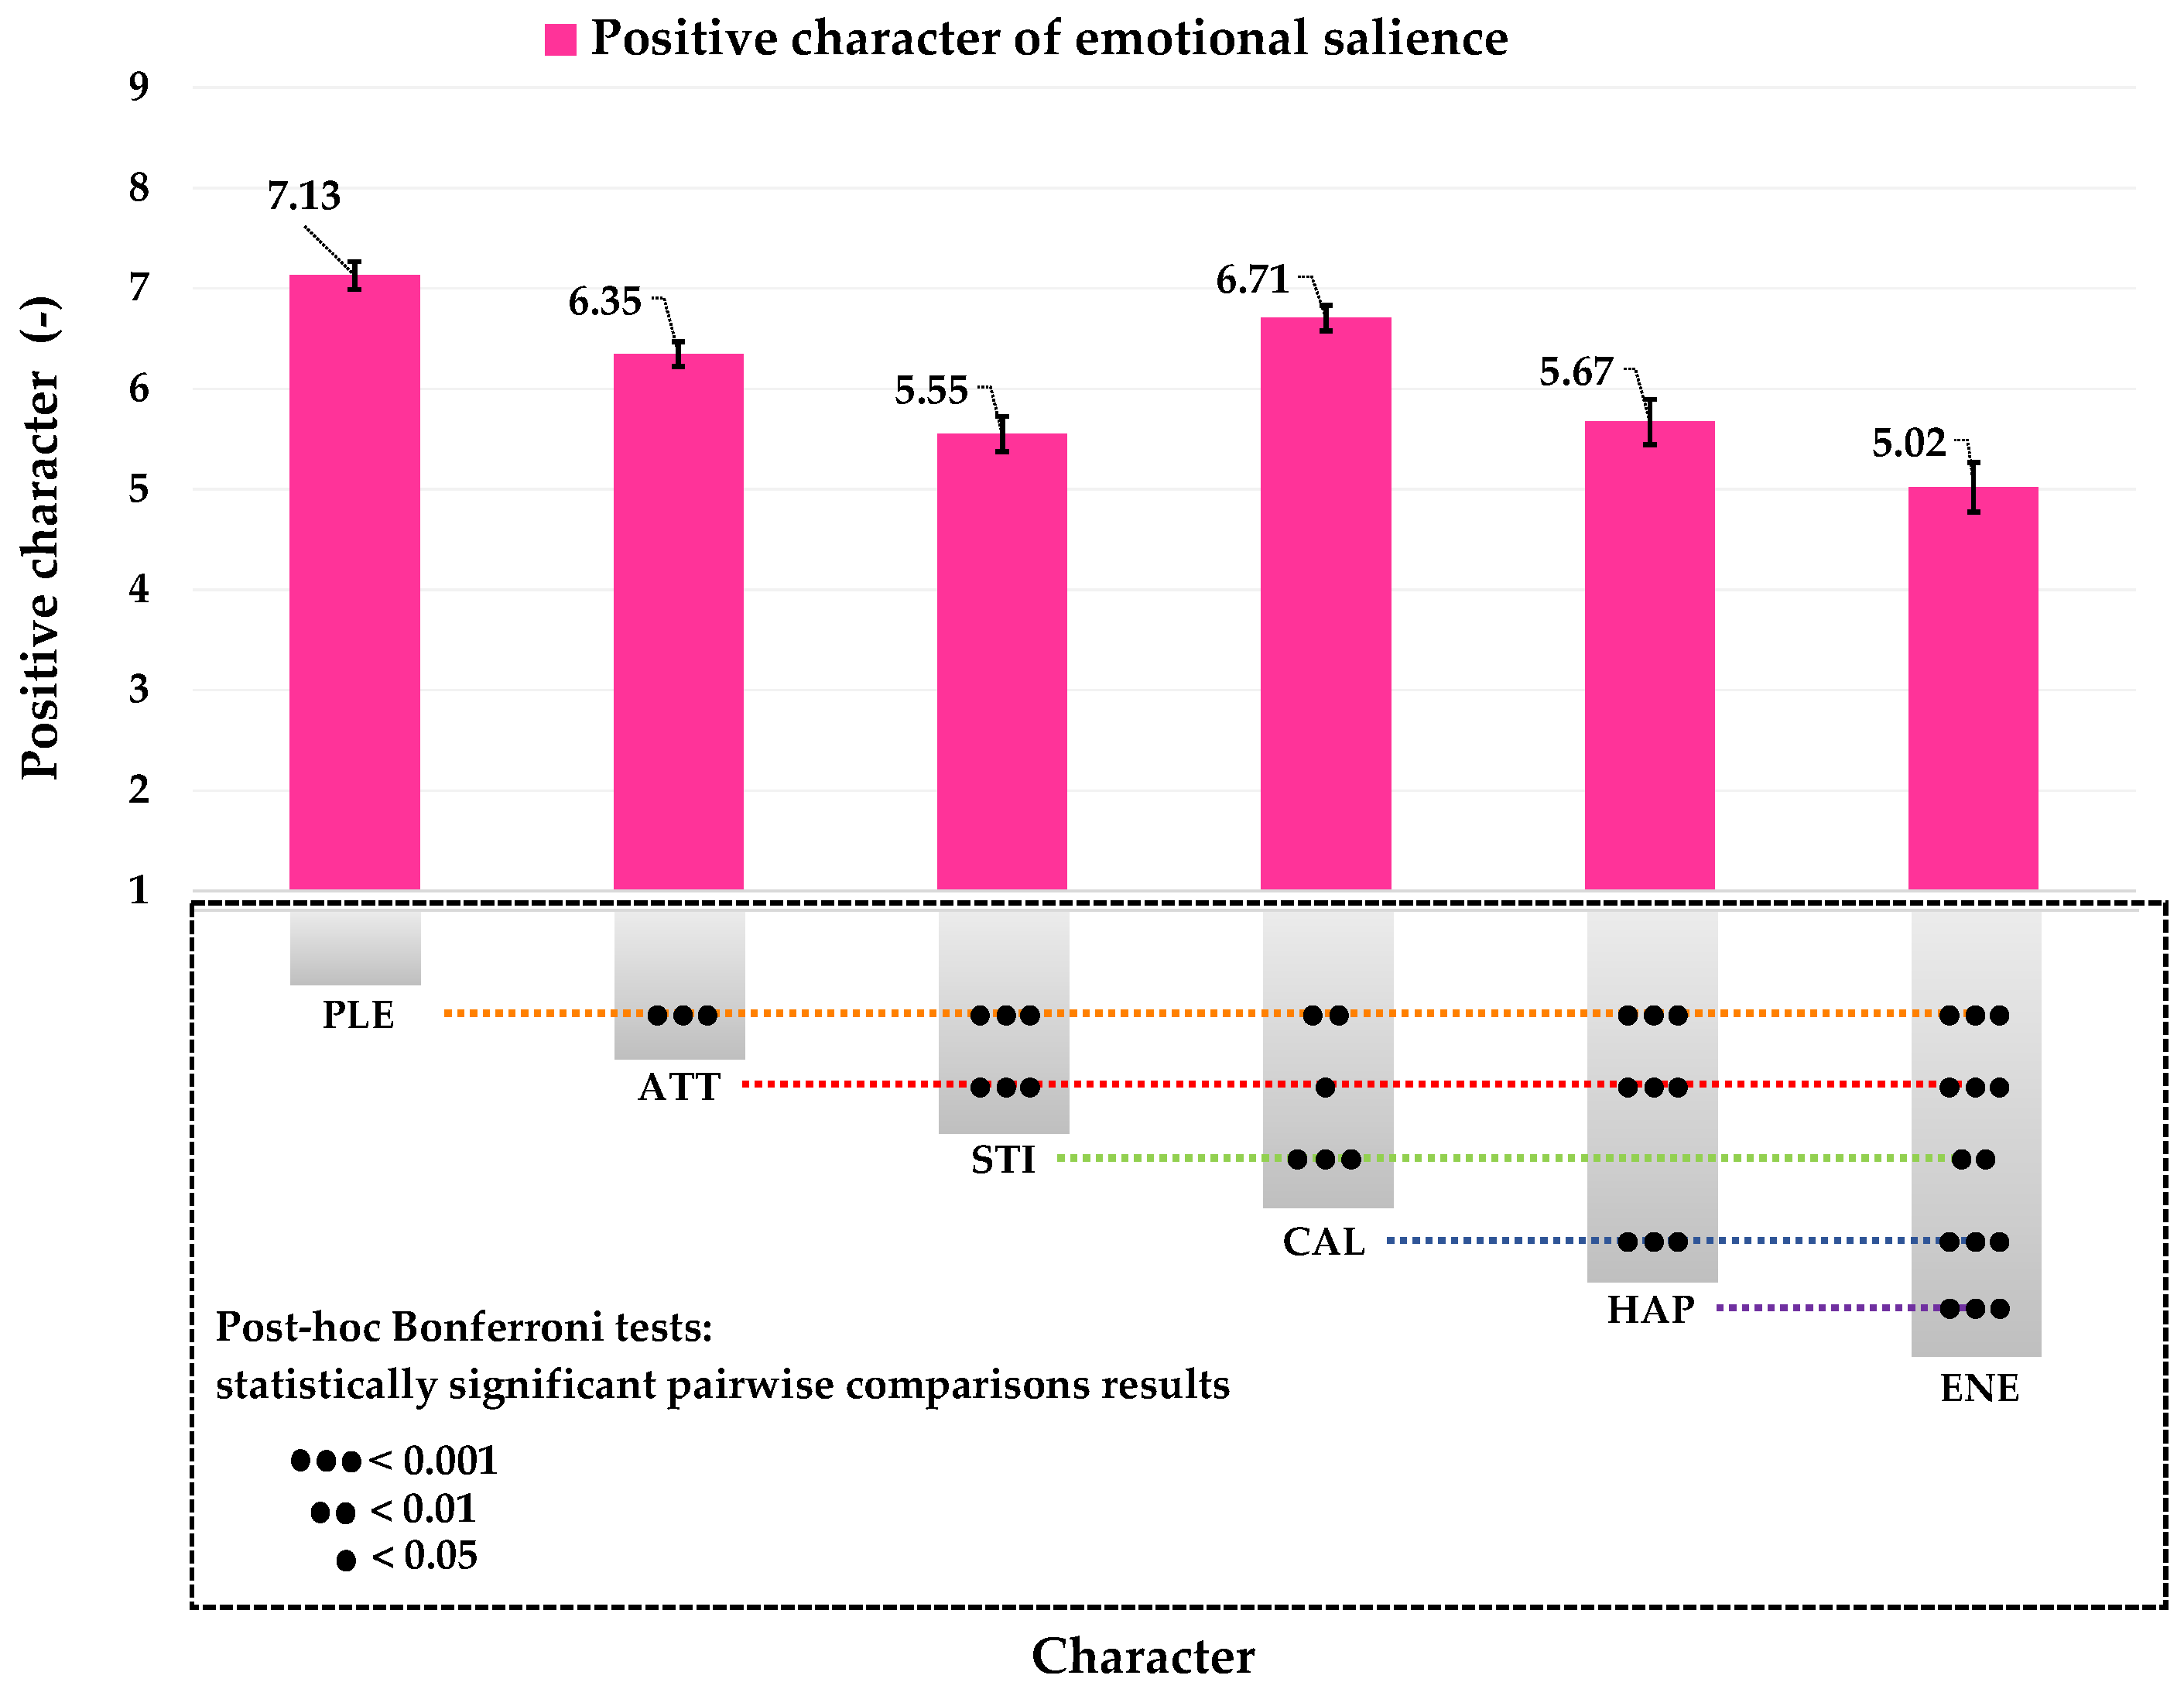
A significant main effect also emerged for the positive character of the emotional salience F(2.66, 82.35) = 44.42, p < 0.0001. Bonferroni post hoc tests revealed that the ratings of adjectives describing the positive character of emotional salience were all significantly different from one another, except for the pair Stimulating and Happy, as shown in Figure 3. The results suggest that the adjectives were not perceived as equivalent in subjective evaluations and could be used to discriminate among participants’ perceptions, with some characters conveying stronger, more positive, or more negative evaluations than others.
Figure 3.
Marginal means, standard errors, and statistical significances for the positive character of emotional salience.
Furthermore, interestingly, ANOVA on the positive dimension revealed a significant effect of interactions between the two factors, scenarios and character of the emotional salience F(12.26, 380.08) = 4.98, p < 0.0001.
Bonferroni post hoc tests revealed that, considering the perceptual positive adjectives Pleasantness, Attractive, and Stimulating, the scenario CBD_L1 resulted significantly worse than all others. The situation is consistent also when considering the emotional positive adjectives, Calm, Happy, and Energetic, but with some further evidence concerning SV_L1, which resulted in eliciting more calmness than SV_L4, suggesting an effect of horizontal mullions on users’ sense of agitation, and more happiness than SV_S3, suggesting that the combined effect of reducing WWR and the presence of more than one mullion contribute to making people sadder.
3.2.2. Negative Dimension of Emotional Salience
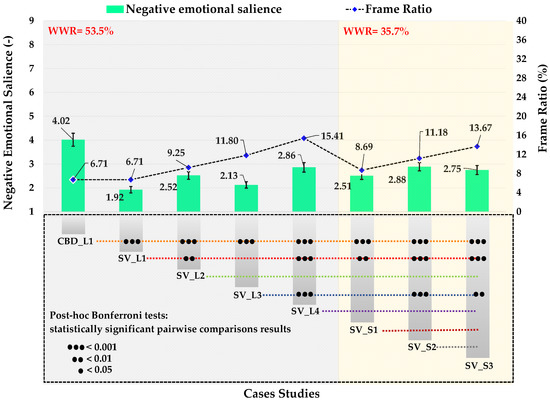
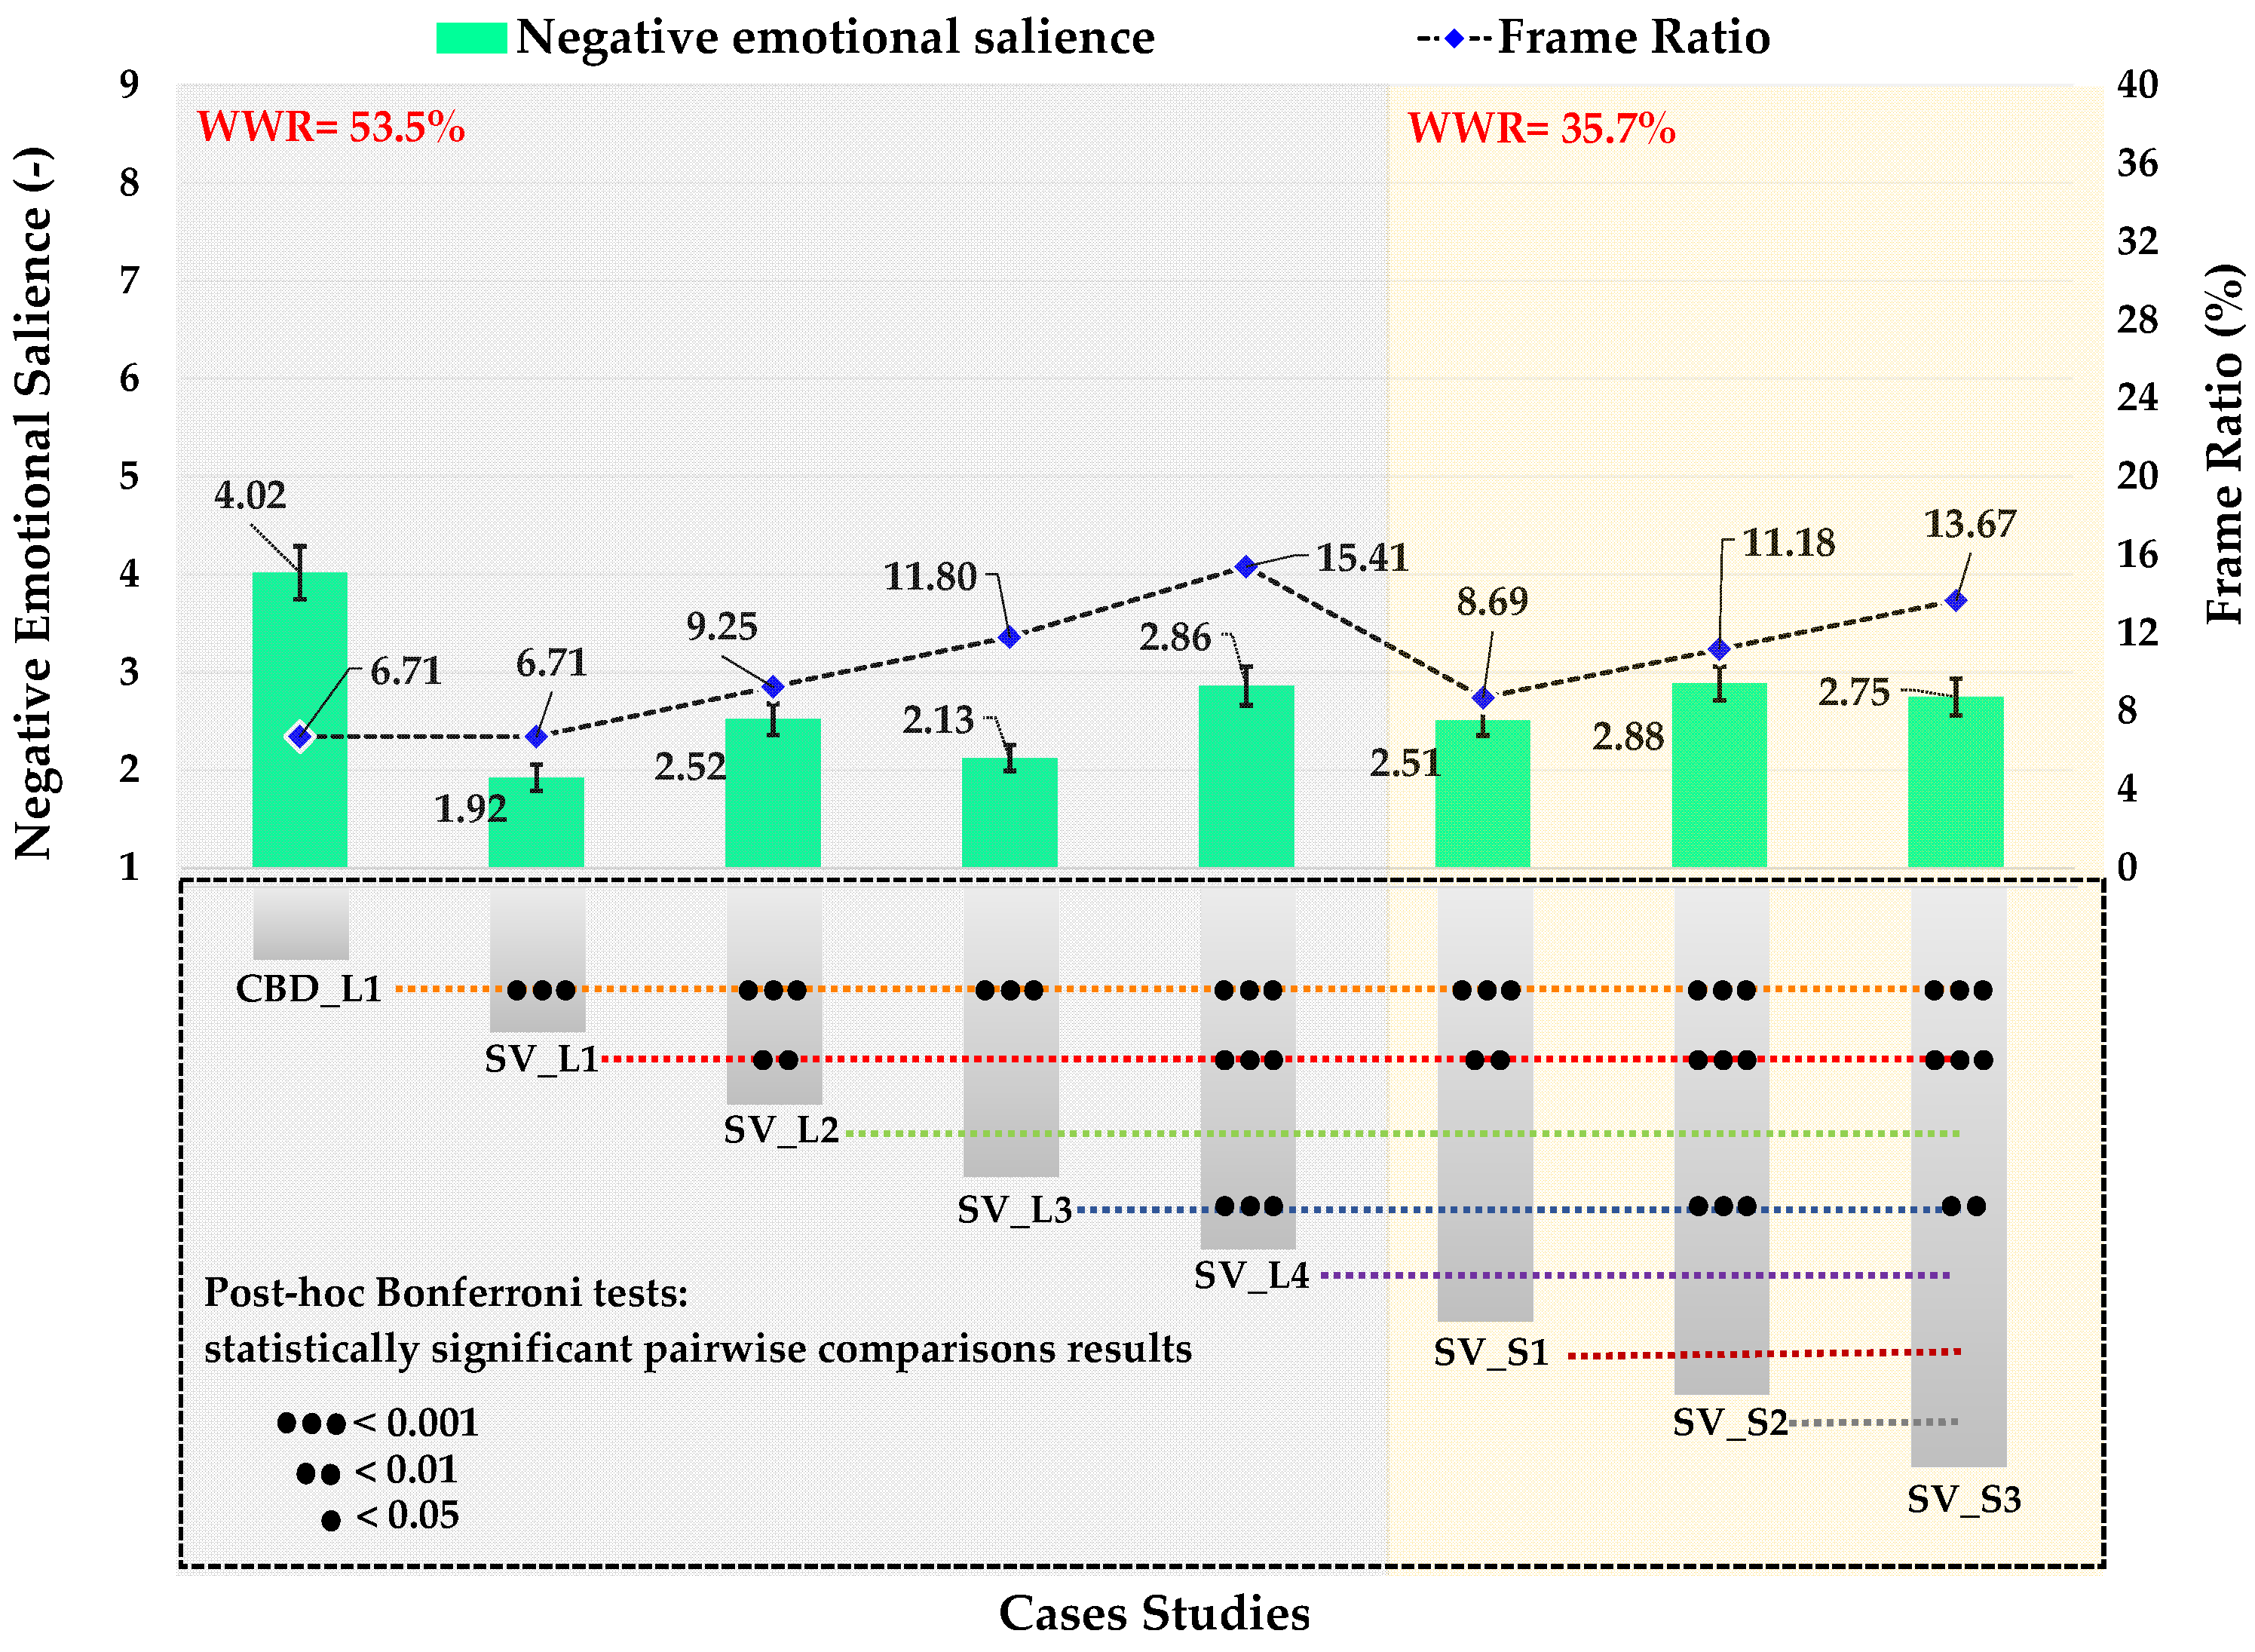
The ANOVA on the negative dimension revealed a significant main effect of the scenario factor, F(3.91,121.19) = 18.85, p < 0.0001, as reported in Table 3. According to Figure 4, Bonferroni post hoc tests highlight clearly that the CBD_L1 and SV_L1 scenarios were the scenarios rated significantly differently (p < 0.001) from all others. In particular, CBD_L1 resulted in the scenario with the highest negative rating (MCBD_L1 = 4.01, SECBD_L1 = 0.27), while SV_L1 resulted in the one with the lowest negative rating (MSV_L1 = 1.92, SESV_L1 = 0.13), except for SV_L3. Additionally, SV_L3 (MSV_L3 = 2.13, SESV_L3 = 0.13) resulted significantly lower than SV_L4 (MSV_L4 = 2.86, SESV_L4 = 0.20), SV_S2 (MSV_S2 = 2.88, SESV_S2 = 0.17) and SV_S3 (MSV_S3 = 2.75, SESV_S3 = 0.19) scenarios. No statistical differences were detected between SV_L2 and other scenarios, which suggests a significant effect of the mullion covering an important element of the scene on how people perceive the entire scene. Similarly to the results from positive emotional salience characters, no significant differences were detected between SV_L4 (WWR = 53.5%, FR = 15.4) and scenarios with lower WWR (35.7%), regardless of the number of mullions.
Table 3.
Negative emotional salience.
Figure 4.
Marginal means, standard errors, and statistical significances of the negative dimension of the emotional salience scale, alongside the WWR and Frame Ratio values.
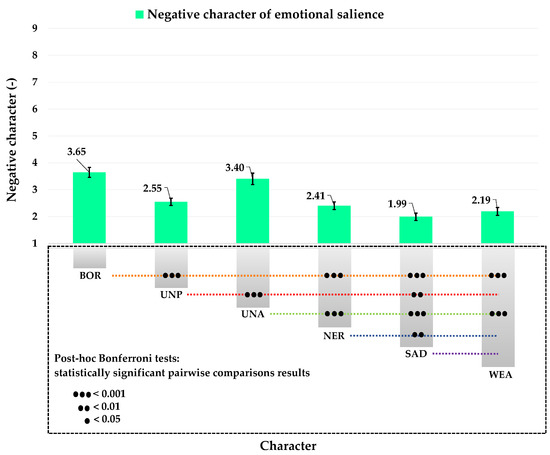
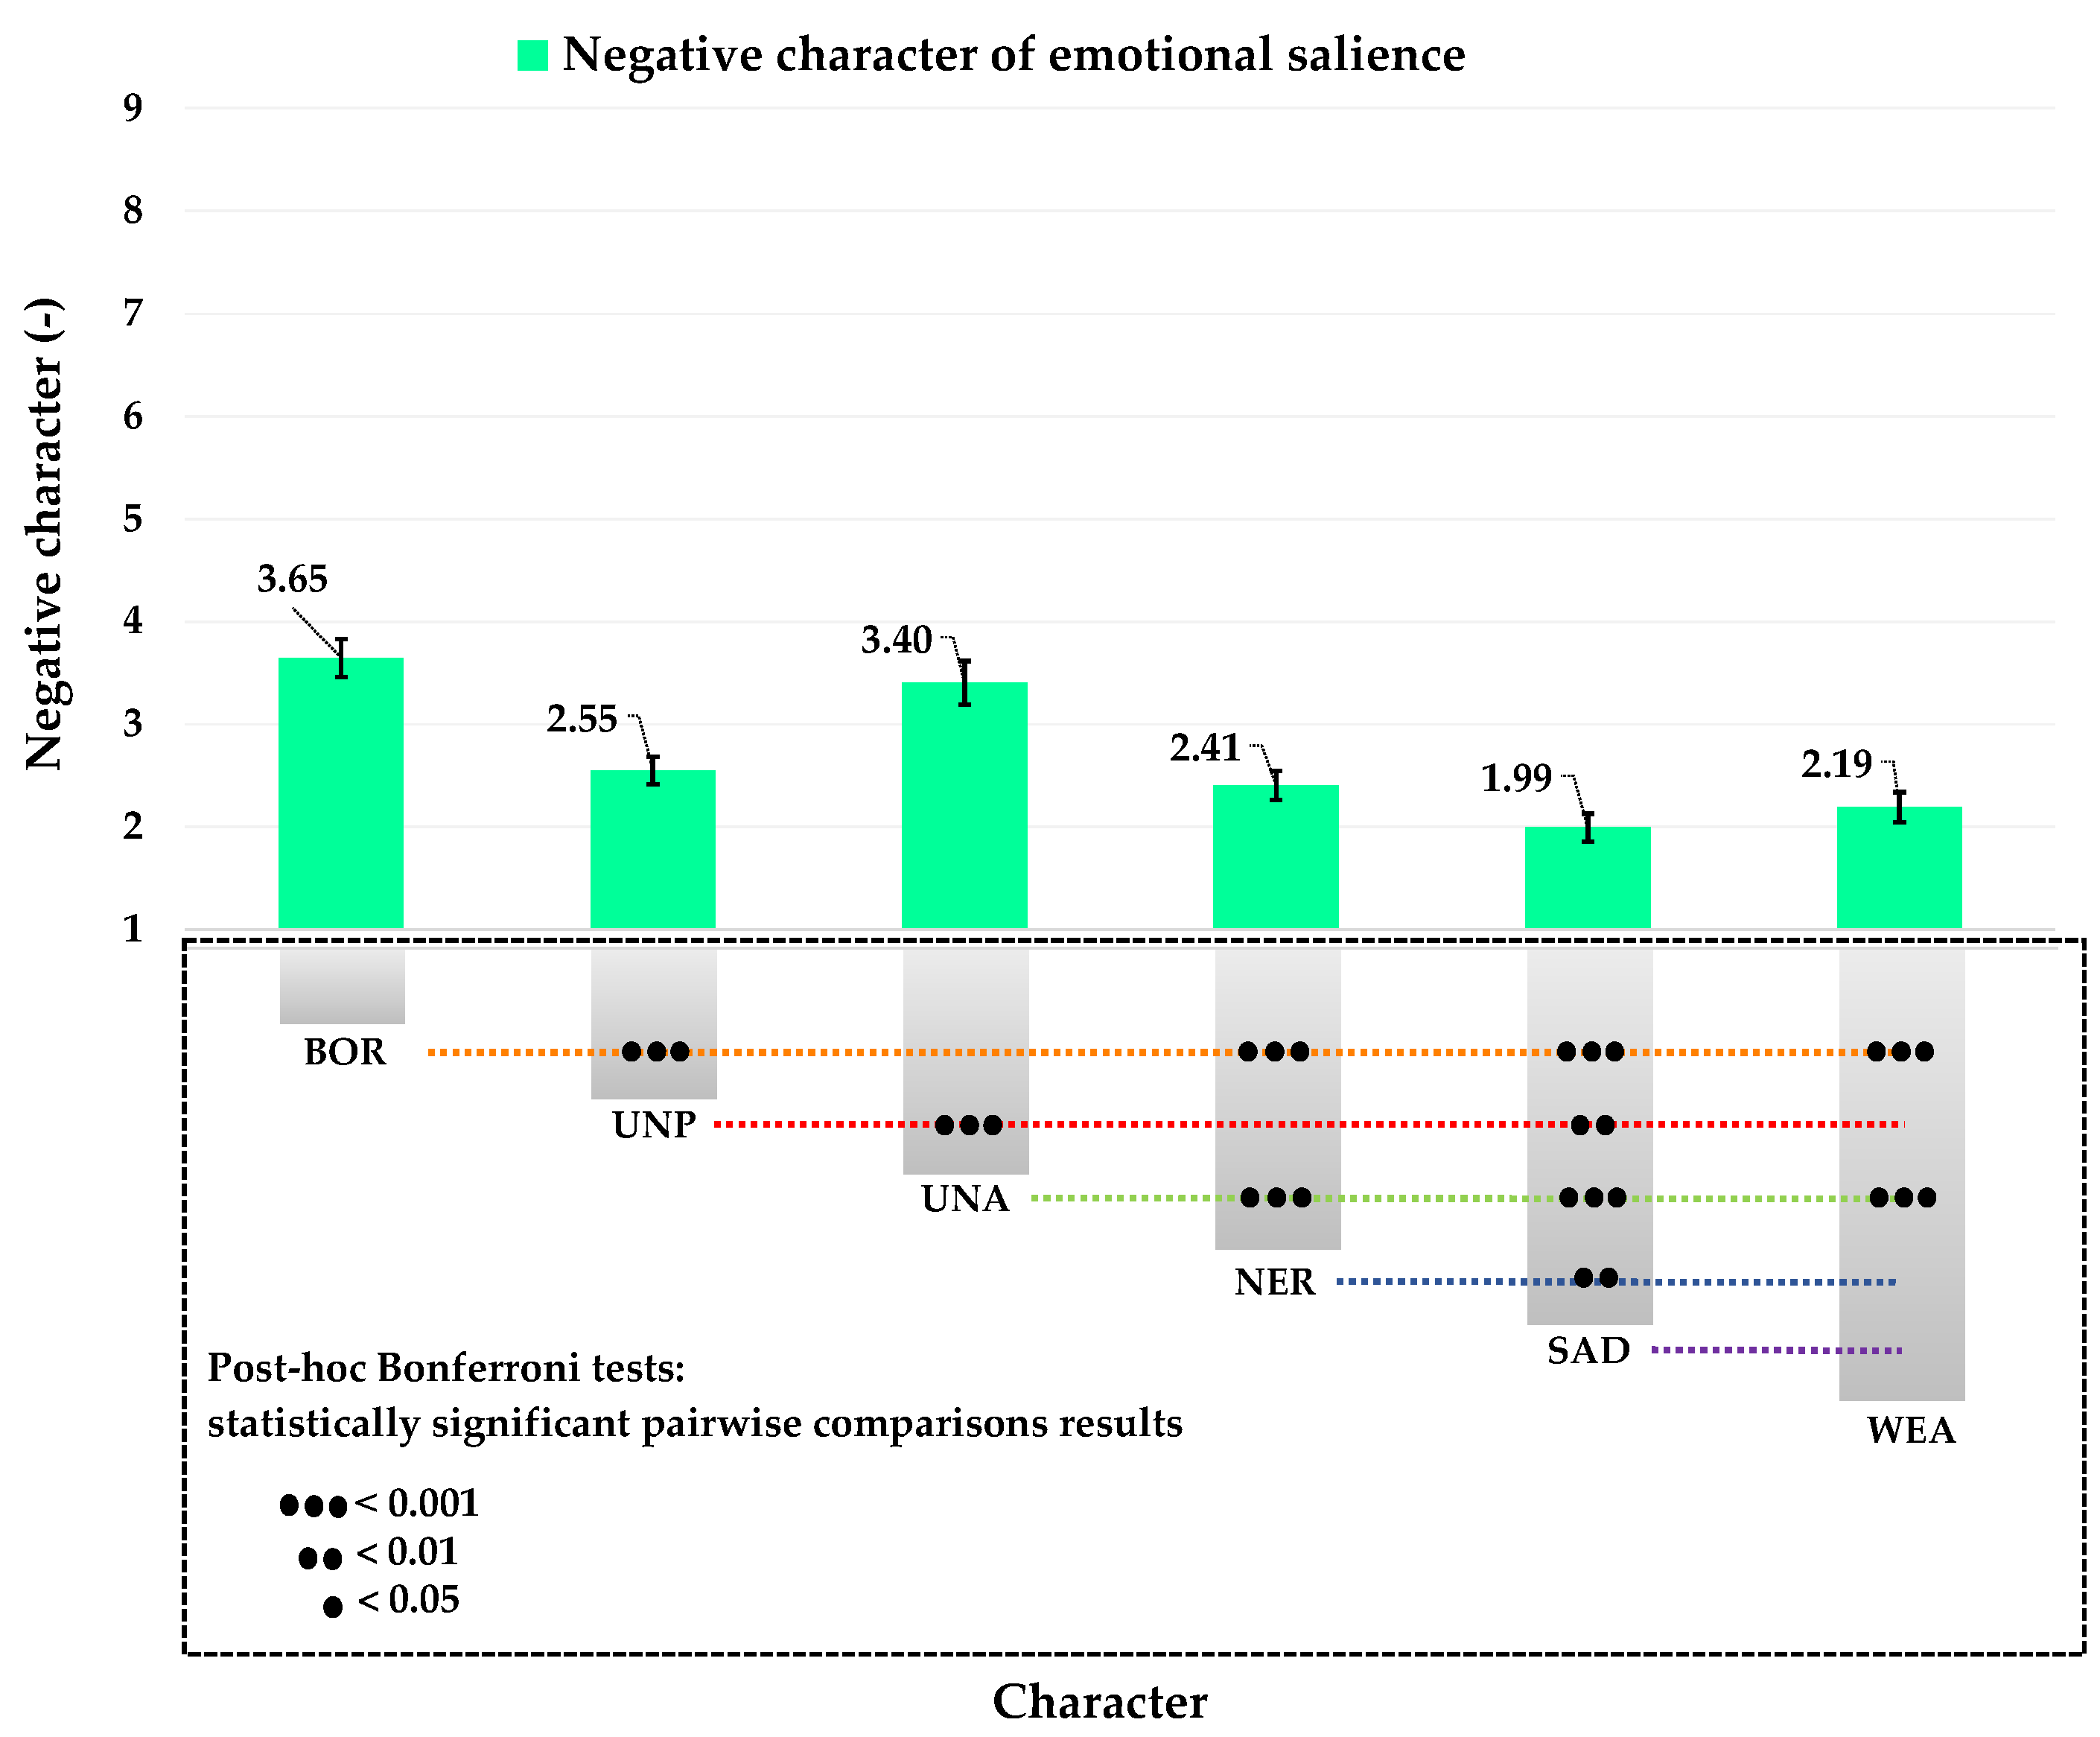
A significant main effect also emerged for the negative character of the emotional salience scale F(2.71, 83.88) = 30.82, p < 0.0001. Bonferroni post hoc tests revealed that the ratings of adjectives describing the negative character of the emotional salience were still substantially different from each other, but with some overlap between the perceptual, “Boring” and “Unattractive”, and emotional, “Sad” and “Nervous”, items, as shown in Figure 5. The results of the negative characters factor analysis are consistent with those obtained from the positive characters factor analysis, supporting the validity of the experimental setup.
Figure 5.
Marginal means, standard errors, and statistical significances for the negative character of emotional salience.
Furthermore, interestingly, ANOVA on the negative dimension revealed a significant effect of interactions between the two factors, scenarios and character of the emotional salience F(12.26, 391.22) = 2.69, p < 0.0001. Bonferroni post hoc tests revealed that, considering the negative adjectives, the scenario CBD_L1 resulted significantly worse than all others. This effect is clearly highlighted by the findings referring to the perceptual adjective “Unpleasant” and the emotional adjective “Nervous” but is consistent through all the adjectives when comparing the CBD_L1 and SV_L1. Considering the negative emotional adjectives, SV_L1 was rated as more boring than SV_S2.
4. Discussion
This research integrates architectural design, visual perception, and emotional response to assess the optimal window design for a prefabricated smart office in a rural village context. It provides technical guidance for designers on creating office windows that enhance workers’ well-being and performance by leveraging positive effects on visual perception and emotional salience.
The outcomes indicate a significant impact of the outdoor view on emotional salience. Under the same window design (WWR at 53.5% and FR at 6.8%), participants evaluate scenarios featuring the Small Village view (SV_L1) markedly more favourably than those depicting the City Business District (CBD_L1).
The findings highlight the significant influence of window design, particularly the window-to-wall ratio, the number and position (vertical and/or horizontal) mullions, and consequently the Frame Ratio, on the positive emotional salience of prefabricated smart or co-working offices in small village environments.
More in detail, the scenario SV_L1 scenario, featuring a large single-pane window (no mullions) overlooking a small village square with historic buildings and a fountain, receives the highest positive rating.
This underscores the advantage of designing a window featuring a large, unobstructed single-pane configuration, characterised by a high WWR and the absence of mullions, over all other proposed solutions.
These results are consistent with previous research indicating that larger, unobstructed windows and a higher window-to-wall ratio offer notable psychological and cognitive advantages [26,34], enhance mood and motivation [26], improve visual comfort and spatial satisfaction [27], and reduce perceived task load [34].
Also in scenarios featuring two vertical mullions and a high WWR (SV_L3), which, however, allow the view of the main elements of the scene, a higher perceived emotional salience is recorded, compared to the scenarios exhibiting a additional single horizontal mullion (SV_L4) and those with lower WWR characterised by either one or two vertical mullions (respectively SV_S2 and SV_S3). Particularly interesting is the lack of significant differences between the scenario SV_L3, with two vertical mullions and a large WWR, and the scenario SV_S1, with no mullions and a small WWR.
In contrast, the research reveals a noteworthy finding regarding the impact of mullions on visual perception. When mullions obstruct the view of key visual elements, like the Palazzo del Genio and the Fontana dei Delfini, there are no statistically significant differences in user ratings between scenario SV_L2 and other scenarios, with the exception of scenario SV_S2, which is rated significantly lower in terms of positive emotional salience. More in detail, scenario SV_S2 (lower WWR and one mullion covering key scene elements) was rated more boring than scenario SV_L1.
These results indicate that increasing the number of mullions or reducing WWR results in a visual composition perceived as less distinct, ultimately diminishing its attractiveness. When mullions hide primary scene elements, a reduction in WWR correlates with a decrease in positive emotional salience.
A comparable lack of significant differences is observed in the presence of a horizontal mullion; in scenario SV_L4, participants report an equivalent level of positive emotional salience to that observed in scenarios SV_S1, SV_S2, and SV_S3, which are characterised by a lower WWR and varying counts of vertical mullions. In addition, SV_L4 was judged less calm than SV_L1, suggesting a negative effect of horizontal mullions on users’ sense of agitation. The results are consistent with those of Ko et al. [25] stating that obstructions such as mullions can significantly affect the clarity and satisfaction of window views. Horizontal mullions tend to distort visual content more than vertical ones, as they often block key landscape and skyline features [25,36].
Finally, SV_S3 resulted in less happiness than SV_L1, suggesting that the combined effect of reducing WWR and the presence of more than one mullion contributes to making people sadder.
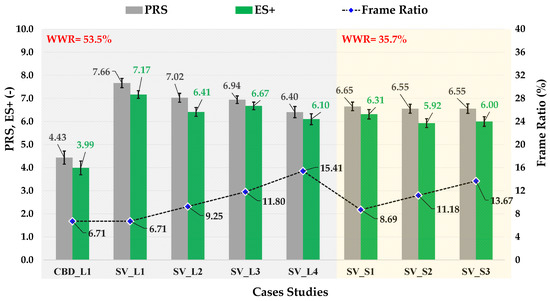
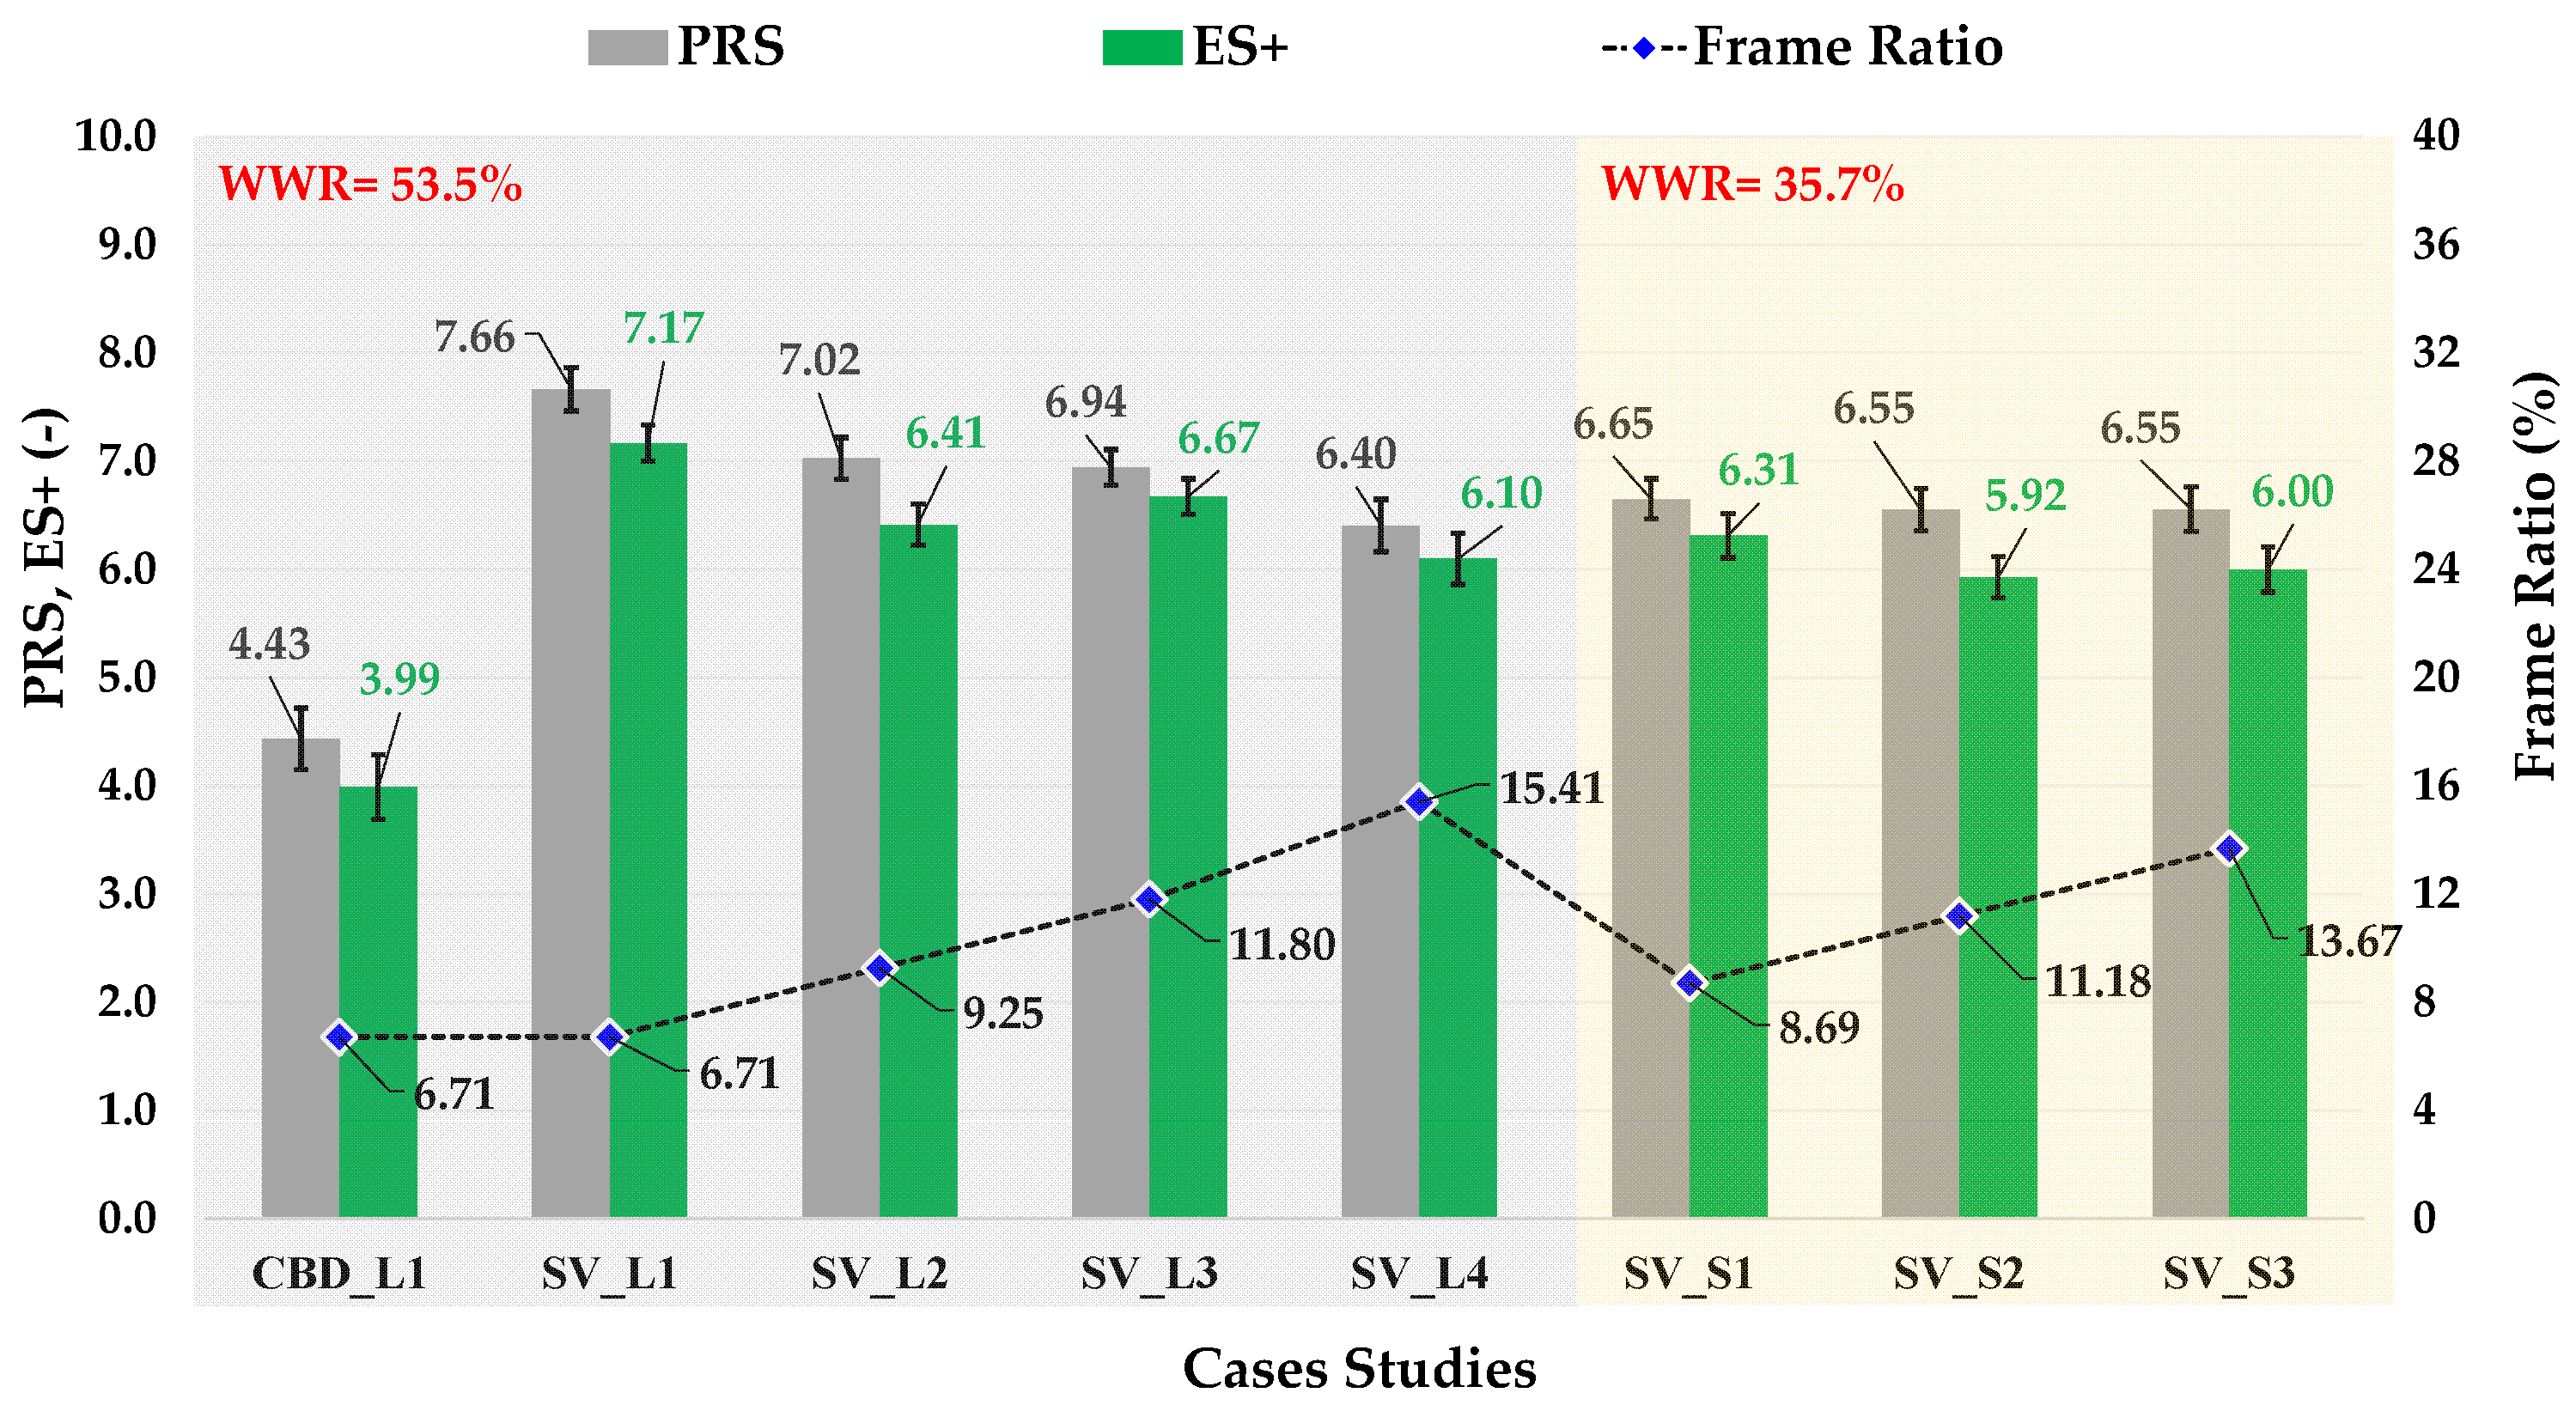
To further investigate how window design affects people’s perception, a comparative analysis of the positive emotional salience and the restorativeness examined in previous research [49] was conducted. In [49], window design influences on the restorative potential of movable smart co-working offices located in small villages compared to urban business districts were investigated. The same seven window configurations differing in size, window-to-wall ratio, and Frame Ratio were exposed to participants using VR. Stress reduction and cognitive restoration were assessed through the Perceived Restorativeness Scale (PRS) to capture psychological recovery related to fascination, being-away, coherence, and scope. Figure 6 presents the marginal means and standard errors of PRS and ES+ for the examined scenarios, while Table 4 summarises the statistically significant results of the post hoc Bonferroni tests. The results show that whenever a significant disparity in PRS is identified, a corresponding disparity in ES+ is also evident.
Figure 6.
Marginal means and standard errors of the PRS [49] and ES+ for the eight scenarios, along with the corresponding WWR and Frame Ratio values.
Table 4.
Statistically significant results post hoc Bonferroni tests of PRS and ES+.
On the contrary, some elements modify the ES+ rating, whereas they do not affect PRS. The introduction of vertical mullions, while preserving an identical WWR, leads to a reduction in the ES+ rating (SV_L1 compared with SV_L2 and SV_L3), indicating that window segmentation alone negatively affects experiential quality.
When vertical mullions obstruct or partially occlude key landmark features (e.g., scenarios SV_L2 and SV_S2), a reduction in WWR further implicates a reduction in ES+ rating, suggesting a compounded effect of visual obstruction and reduced transparency. Finally, for scenario SV_L3, the presence of horizontal mullions (SV_L4) or a decrease in WWR (SV_S2 and SV_S3) results in lower ES+ ratings, highlighting the interconnections among the experiential assessment, mullion orientation, and overall glazed surface area.
5. Conclusions
This research investigates the role of window design, namely WWR, as well as the number and orientation of mullions, in shaping perceptual and emotional experiences within prefabricated smart co-working offices. Using immersive VR to evaluate multiple window configurations in a rural village context, the outcomes confirm that both the amount of visible outdoor content and the degree of visual obstruction produced by different WWR and mullions strongly influence users’ judgments.
The findings underline that the configuration and proportion of glazing play a critical role in shaping users’ perceptual and emotional responses to the surrounding urban context, suggesting some design deductions and guidelines:
- When mullions interfere with the visibility of key landmark features, their presence tends to neutralise perceptual differences among window configurations. Under these conditions, variations in mullion count or WWR do not yield meaningful improvements in users’ visual perception.
- Increasing the number of mullions or reducing WWR generally leads to a less legible and distinctive visual composition of the outdoor environment, reducing the overall attractiveness of the view, and weakening its capacity to evoke positive emotional salience.
- The presence of horizontal mullions tends to flatten the outdoor perception, disrupting visual continuity and limiting users’ ability to perceive qualitative differences between views.
- Windows with less WWR but no mullions can be used in place of windows with large WWRs and two mullions. This would ensure the same emotional salience rating while potentially reducing air-conditioning energy consumption and preventing visual discomfort.
The study also reveals a clear relationship between restorative potential and emotional salience. Scenarios judged as more restorative were also perceived as more pleasant and emotionally positive. This highlights the value of integrating naturalistic and culturally rich outdoor views into the design, as well as the installation of small-scale prefabricated co-working modules.
Despite the outcomes, the research addressed some limitations. The sample size is relatively small despite being statistically adequate. Larger and more diverse samples would improve the generalisability of the results and the analysis of answers from different groups of respondents. A further limitation is the absence of an analysis that integrates respondents’ demographic and socioeconomic characteristics with their responses to the IPQ and the Emotional Salience Questionnaire.
Future research should investigate the relationship between the position or shape of the mullions and the hidden elements of the scene, or the effect of the window design on work performance. Future work could focus on analysing potential differences in responses among groups of participants stratified by gender, age, education, and other demographic factors, with respect to their subjective perceptions of the surrounding environment and the emotions experienced during the VR experience. Further investigations that integrate subjective outcomes with energy simulations and glare analysis could be conducted to better understand energy-related aspects and visual comfort.
Author Contributions
Conceptualisation, A.C., M.M., M.S., M.D.M. and L.M.; methodology, A.C., M.M., M.D.M., M.S. and L.M.; software, A.C.; validation, A.C., M.M., M.S. and L.M.; formal analysis, A.C., M.M., M.S. and L.M.; investigation, A.C., M.M. and L.M.; resources, A.C., M.M., M.S. and L.M.; data curation, A.C. and M.M.; writing—original draft preparation, A.C., M.M., M.S., R.A.T., M.D.M. and L.M.; writing—review and editing, A.C., M.M., M.S., R.A.T., M.D.M. and L.M.; visualisation, A.C., R.A.T., M.D.M. and M.S.; supervision, A.C., M.M., M.S. and L.M.; project administration, A.C., M.M., M.S. and L.M.; funding acquisition, A.C., M.S. and L.M. All authors have read and agreed to the published version of the manuscript.
Funding
This research was funded by the project “Physically based and multi-objEctive appRoah for Cultural hEritage valorIsation through Virtual rEality”—PERCEIVE, “Avviso pubblico di selezione per il finanziamento di progetti di ricerca fondamentale ed applicata dedicato ai docenti e ai ricercatori non destinatari di altri finanziamenti” of the University of Campania Luigi Vanvitelli (Italy), CUP: B63C24000990005.
Institutional Review Board Statement
The study received approval from the Ethics Committee (CERS) of the Department of Architecture and Industrial Design, University of Campania “Luigi Vanvitelli”, on 4 February 2025, authorization number CERS-2025-03”.
Informed Consent Statement
Informed consent was obtained from all subjects involved in the study.
Data Availability Statement
The materials and data that support the findings of this study are available from the authors.
Conflicts of Interest
The authors declare no conflicts of interest.
Appendix A
Table A1.
The English (Italian) version of the IPQ questionnaires used in the research.
Table A2.
The English (Italian) version of the Perception [M1.1] and emotional salience questionnaires used in the research.
References
- He, S.; Zhang, W.; Guan, Y. The Impact of Building Windows on Occupant Well-Being: A Review Integrating Visual and Non-Visual Pathways with Multi-Objective Optimization. Buildings 2025, 15, 2577. [Google Scholar] [CrossRef] [Scilit]
- Ko, W.H.; Schiavon, S.; Santos, L.; Kent, M.G.; Kim, H.; Keshavarzi, M. View Access Index: The Effects of Geometric Variables of Window Views on Occupants’ Satisfaction. Build. Environ. 2023, 234, 110132. [Google Scholar] [CrossRef] [Scilit]
- Ko, W.H.; Schiavon, S.; Zhang, H.; Graham, L.T.; Brager, G.; Mauss, I.; Lin, Y.W. The Impact of a View from a Window on Thermal Comfort, Emotion, and Cognitive Performance. Build. Environ. 2020, 175, 106779. [Google Scholar] [CrossRef] [Scilit]
- Liu, X.; Zhang, N.; Wang, Z.; Gao, W. Seasonal Effects of Window-to-Wall Ratio and Glazing Combinations on Office Building Performance in Qingdao. Buildings 2025, 15, 3156. [Google Scholar] [CrossRef] [Scilit]
- De Masi, R.F.; Festa, V.; Gigante, A.; Ruggiero, S.; Peter Vanoli, G. The Role of Windows on Building Performance under Current and Future Weather Conditions of European Climates. Energy Build. 2023, 292, 113177. [Google Scholar] [CrossRef] [Scilit]
- Kim, J.; de Dear, R. Nonlinear Relationships between Individual IEQ Factors and Overall Workspace Satisfaction. Build. Environ. 2012, 49, 33–40. [Google Scholar] [CrossRef] [Scilit]
- Ochoa, C.E.; Aries, M.B.C.; van Loenen, E.J.; Hensen, J.L.M. Considerations on Design Optimization Criteria for Windows Providing Low Energy Consumption and High Visual Comfort. Appl. Energy 2012, 95, 238–245. [Google Scholar] [CrossRef] [Scilit]
- Rosato, A.; El Youssef, M.; Guarino, F.; Ciervo, A.; Sibilio, S. Experimental Studies of Air-Handling Units’ Faulty Operation for the Development of Data-Driven Fault Detection and Diagnosis Tools: A Systematic Review. Energy Rep. 2022, 8, 494–503. [Google Scholar] [CrossRef] [Scilit]
- Ciampi, G.; Ciervo, A.; Rosato, A.; Sibilio, S.; Di Nardo, A. Parametric Simulation Analysis of a Centralized Solar Heating System with Long-Term Thermal Energy Storage Serving a District of Residential and School Buildings in Italy. Adv. Model. Anal. A 2018, 55, 165–172. [Google Scholar] [CrossRef]
- Rubino, C.; Liuzzi, S.; Fusaro, G.; Martellotta, F.; Scrosati, C.; Garai, M. Balancing Ventilation and Sound Insulation in Windows by Means of Metamaterials: A Review of the State of the Art. Build. Environ. 2025, 275, 112780. [Google Scholar] [CrossRef] [Scilit]
- Dulak, L.; Nowoświat, A. Effect of Window Structure and Mounting on Sound Insulation: A Laboratory-Based Study. Sustainability 2025, 17, 6892. [Google Scholar] [CrossRef] [Scilit]
- Beute, F.; de Kort, Y.A.W. Salutogenic Effects of the Environment: Review of Health Protective Effects of Nature and Daylight. Appl. Psychol. Health Well-Being 2014, 6, 67–95. [Google Scholar] [CrossRef] [Scilit]
- Küller, R.; Ballal, S.; Laike, T.; Mikellides, B.; Tonello, G. The Impact of Light and Colour on Psychological Mood: A Cross-Cultural Study of Indoor Work Environments. Ergonomics 2006, 49, 1496–1507. [Google Scholar] [CrossRef] [Scilit]
- Benfield, J.A.; Rainbolt, G.N.; Bell, P.A.; Donovan, G.H. Classrooms with Nature Views: Evidence of Differing Student Perceptions and Behaviors. Environ. Behav. 2015, 47, 140–157. [Google Scholar] [CrossRef] [Scilit]
- Leather, P.; Pyrgas, M.; Beale, D.; Lawrence, C. Windows in the Workplace: Sunlight, view, and occupational stress. Environ. Behav. 1998, 30, 739–762. [Google Scholar] [CrossRef] [Scilit]
- Yildirim, K.; Akalin-Baskaya, A.; Celebi, M. The Effects of Window Proximity, Partition Height, and Gender on Perceptions of Open-Plan Offices. J. Environ. Psychol. 2007, 27, 154–165. [Google Scholar] [CrossRef] [Scilit]
- Aries, M.B.C.; Veitch, J.A.; Newsham, G.R. Windows, View, and Office Characteristics Predict Physical and Psychological Discomfort. J. Environ. Psychol. 2010, 30, 533–541. [Google Scholar] [CrossRef] [Scilit]
- Hellinga, H.I. Daylight and View: The Influence of Windows on the Visual Quality of Indoor Spaces. Ph.D. Thesis, TU Delft, Delft, The Netherlands, 2013. [Google Scholar]
- Jamrozik, A.; Clements, N.; Hasan, S.S.; Zhao, J.; Zhang, R.; Campanella, C.; Loftness, V.; Porter, P.; Ly, S.; Wang, S.; et al. Access to Daylight and View in an Office Improves Cognitive Performance and Satisfaction and Reduces Eyestrain: A Controlled Crossover Study. Build. Environ. 2019, 165, 106379. [Google Scholar] [CrossRef] [Scilit]
- Ko, W.H.; Schiavon, S.; Altomonte, S.; Andersen, M.; Batool, A.; Browning, W.; Burrell, G.; Chamilothori, K.; Chan, Y.C.; Chinazzo, G.; et al. Window View Quality: Why It Matters and What We Should Do. Leukos J. Illum. Eng. Soc. N. Am. 2022, 18, 259–267. [Google Scholar] [CrossRef] [Scilit]
- Hill, A.R.; Markus, T.A. Some Factors Influencing Vision through Meshes. Archit. Sci. Rev. 1968, 11, 123–136. [Google Scholar] [CrossRef] [Scilit]
- Markus, T.A. The Function of Windows—A Reappraisal. Build. Sci. 1967, 2, 97–121. [Google Scholar] [CrossRef] [Scilit]
- Ne’eman, E.; Hopkinson, R.G. Critical Minimum Acceptable Window Size: A Study of Window Design and Provision of a View. Light. Res. Technol. 1970, 2, 17–27. [Google Scholar] [CrossRef] [Scilit]
- Meng, X.; Wang, M. Exploring the Health Impacts of Window Views: A Literature Review. J. Asian Archit. Build. Eng. 2025, 24, 5080–5103. [Google Scholar] [CrossRef] [Scilit]
- Ko, W.H.; Kent, M.G.; Schiavon, S.; Levitt, B.; Betti, G. A Window View Quality Assessment Framework. Leukos 2022, 18, 268–293. [Google Scholar] [CrossRef] [Scilit]
- Dogrusoy, I.T.; Tureyen, M. A Field Study on Determination of Preferences for Windows in Office Environments. Build. Environ. 2007, 42, 3660–3668. [Google Scholar] [CrossRef] [Scilit]
- Hong, T.; Lee, M.; Yeom, S.; Jeong, K. Occupant Responses on Satisfaction with Window Size in Physical and Virtual Built Environments. Build. Environ. 2019, 166, 106409. [Google Scholar] [CrossRef] [Scilit]
- Li, J.; Zheng, B.; Bedra, K.B.; Li, Z.; Chen, X. Evaluating the Effect of Window-to-Wall Ratios on Cooling-Energy Demand on a Typical Summer Day. Int. J. Environ. Res. Public Health 2021, 18, 8411. [Google Scholar] [CrossRef] [Scilit]
- Ma, R.; Ma, R.; Long, E. Analysis of the Rule of Window-to-Wall Ratio on Energy Demand of Residential Buildings in Different Locations in China. Heliyon 2023, 9, e12803. [Google Scholar] [CrossRef] [Scilit]
- Tawfeeq, H.; Qaradaghi, A.M.A. Optimising Window-to-Wall Ratio for Enhanced Energy Efficiency and Building Intelligence in Hot Summer Mediterranean Climates. Sustainability 2024, 16, 7342. [Google Scholar] [CrossRef] [Scilit]
- Cherier, M.K.; Hamdani, M.; Kamel, E.; El Amine Bekkouche, S.M.; Guermoui, M.; Al-Saadi, S.; Djeffal, R.; Bashir, M.O.; Elshekh, A.E.A.; Drozdova, L.; et al. Impact of Glazing Type, Window-to-Wall Ratio, and Orientation on Building Energy Savings Quality: A Parametric Analysis in Algerian Climatic Conditions. Case Stud. Therm. Eng. 2024, 61, 104902. [Google Scholar] [CrossRef] [Scilit]
- Zygmunt, M.; Gawin, D. Analysis of Energy Efficiency and Thermal Comfort for an Office Building Complex Located in Poland—A Case Study. IOP Conf. Ser. Mater. Sci. Eng. 2018, 415, 012023. [Google Scholar] [CrossRef] [Scilit]
- Scorpio, M.; Sabet, P.; Sokol, N.; Ciampi, G.; Martyniuk -Pęczek, J.; Sibilio, S. Optimising Building Design through Window View Analysis: A Case Study in Gdansk. In Proceedings of the CIE2025 Scientific Conference, Vienna, Austria, 7 July 2025. [Google Scholar]
- Yeom, S.; Kim, H.; Hong, T.; Lee, M. Determining the Optimal Window Size of Office Buildings Considering the Workers’ Task Performance and the Building’s Energy Consumption. Build. Environ. 2020, 177, 106872. [Google Scholar] [CrossRef] [Scilit]
- Zhang, Y.; Jing, X.; Liu, C.; Sun, Y.; Wang, W.; Gao, W. Restorative Benefits of Classroom Windows: A Study on the Effect of Window:Wall Ratio on Task Load and Learning Performance Based on VR Technology. Int. J. Low-Carbon Technol. 2024, 19, 1491–1500. [Google Scholar] [CrossRef] [Scilit]
- Kent, M.G.; Ko, W.H.; Konstantzos, I.; Schiavon, S.; MacNaughton, P.; Wilkins, A.J. The Design of Window Shades and Fenestration for View Clarity. Light. Res. Technol. 2025, 57, 553–578. [Google Scholar] [CrossRef] [Scilit]
- Ijsselsteijn, W.A.; Oosting, W.; Vogels, I.M.L.C.; De Kort, Y.A.W. A Room with a Cue: The Efficacy of Movement Parallax, Occlusion, and Blur in Creating a Virtual Window. Presence Teleoper. Virtual Environ. 2008, 17, 269–282. [Google Scholar] [CrossRef] [Scilit]
- Keighley, E.C. Visual Requirements and Reduced Fenestration in Offices—A Study of Multiple Apertures and Window Area. Build. Sci. 1973, 8, 321–331. [Google Scholar] [CrossRef] [Scilit]
- Wang, F.; Munakata, J. Assessing Effects of Facade Characteristics and Visual Elements on Perceived Oppressiveness in High-Rise Window Views via Virtual Reality. Build. Environ. 2024, 266, 112043. [Google Scholar] [CrossRef] [Scilit]
- Parsaee, M.; Demers, C.M.H.; Potvin, A.; Hébert, M.; Lalonde, J.F. Window View Access in Architecture: Spatial Visualization and Probability Evaluations Based on Human Vision Fields and Biophilia. Buildings 2021, 11, 627. [Google Scholar] [CrossRef] [Scilit]
- Moscoso, C.; Chamilothori, K.; Wienold, J.; Andersen, M.; Matusiak, B. Window Size Effects on Subjective Impressions of Daylit Spaces: Indoor Studies at High Latitudes Using Virtual Reality. Leukos J. Illum. Eng. Soc. N. Am. 2021, 17, 242–264. [Google Scholar] [CrossRef] [Scilit]
- Abboushi, B.; Elzeyadi, I.; Van Den Wymelenberg, K.; Taylor, R.; Sereno, M.; Jacobsen, G. Assessing the Visual Comfort, Visual Interest of Sunlight Patterns, and View Quality under Different Window Conditions in an Open-Plan Office. Leukos J. Illum. Eng. Soc. N. Am. 2021, 17, 321–337. [Google Scholar] [CrossRef] [Scilit]
- Acosta, I.; Campano, M.Á.; Molina, J.F. Window Design in Architecture: Analysis of Energy Savings for Lighting and Visual Comfort in Residential Spaces. Appl. Energy 2016, 168, 493–506. [Google Scholar] [CrossRef] [Scilit]
- Kelly, J.A.; Kelleher, L.; Guo, Y.; Deegan, C.; Larsen, B.; Shukla, S.; Collins, A. Assessing Preference and Potential for Working from Anywhere: A Spatial Index for Ireland. Environ. Sustain. Indic. 2022, 15, 100190. [Google Scholar] [CrossRef] [Scilit]
- Mariotti, I.; Di Marino, M.; Bednár, P. The COVID-19 Pandemic and the Future of Working Spaces, 1st ed.; Routledge: London, UK, 2022. [Google Scholar]
- Fai, F.M.; Tomlinson, P.R.; Barzotto, M. Coworking Spaces and Regional Development: A Role for Policy. Reg. Stud. 2025, 59, 2399282. [Google Scholar] [CrossRef] [Scilit]
- Krasilnikova, N. Re-Thinking the Role of Municipalities in Mobility Transitions: Co-Working Spaces in Suburban and Rural Areas as a “New Normal”. Cities 2024, 145, 104672. [Google Scholar] [CrossRef] [Scilit]
- Li, K.; Abidin, A.Z.; Mohamad, D.; Muhsein, A.S.; Luqman, I.; Ibrahim, H.; Suharjanto, G.; Taufik, C.; Mariana, Y.; Suryawinata, B.A. The Implementation of Biophilic Design in Co-Working Space Design as a Concept of Healthy Sustainable Architecture. IOP Conf. Ser. Earth Environ. Sci. 2020, 426, 012090. [Google Scholar] [CrossRef] [Scilit]
- Ciervo, A.; Masullo, M.; Morelli, M.D.; Maffei, L. Exploring the Effects of Window Design on the Restorative Potential of Movable Smart Co-Working Offices in Small Village Environments Through Immersive Virtual Reality. Sustainability 2025, 17, 5851. [Google Scholar] [CrossRef] [Scilit]
- Bosworth, G.; Whalley, J.; Fuzi, A.; Merrell, I.; Chapman, P.; Russell, E. Rural Co-Working: New Network Spaces and New Opportunities for a Smart Countryside. J. Rural Stud. 2023, 97, 550–559. [Google Scholar] [CrossRef] [Scilit]
- Schnieder, M. Visualising the Environmental Effects of Working near Home: Remote Working Hubs and Co-Working Spaces in England and Wales. Environments 2025, 12, 375. [Google Scholar] [CrossRef] [Scilit]
- Kinsman, N.; Marris, N.; Oakman, J. The Impact of Coworking Spaces on Workers’ Performance, Mental and Physical Health: A Scoping Review. Work 2024, 77, 61–75. [Google Scholar] [CrossRef] [Scilit]
- Weijs-Perrée, M.; van de Koevering, J.; Appel-Meulenbroek, R.; Arentze, T. Analysing User Preferences for Co-Working Space Characteristics. Build. Res. Inf. 2019, 47, 534–548. [Google Scholar] [CrossRef] [Scilit]
- Maffei, L.; Masullo, M.; Pascale, A.; Ruggiero, G.; Romero, V.P. Immersive Virtual Reality in Community Planning: Acoustic and Visual Congruence of Simulated vs. Real World. Sustain. Cities Soc. 2016, 27, 338–345. [Google Scholar] [CrossRef] [Scilit]
- Iachini, T.; Maffei, L.; Masullo, M.; Senese, V.P.; Rapuano, M.; Pascale, A.; Sorrentino, F.; Ruggiero, G. The Experience of Virtual Reality: Are Individual Differences in Mental Imagery Associated with Sense of Presence? Cogn. Process. 2019, 20, 291–298. [Google Scholar] [CrossRef] [Scilit]
- Gök Tokgöz, Ö.; Engel, M.S.; Othmani, C.; Altinsoy, E.M. Virtual Reality Application in Evaluating the Soundscape in Urban Environment: A Systematic Review. Acoustics 2025, 7, 68. [Google Scholar] [CrossRef] [Scilit]
- Rodriguez, J.K.C.; Yali, J.B.A.; Torres, V.S.M. Technology and Architecture: Impact of Artificial Intelligence and Virtual Reality on the Perception of Architectural Design. Civ. Eng. Archit. 2025, 13, 637–652. [Google Scholar] [CrossRef] [Scilit]
- Scorpio, M.; Bladowski, A.; Geisler-Moroder, D.; Martyniuk-Pęczek, J.; Sibilio, S.; Pfluger, R.; Sokół, N. Virtual Reality in Lighting Design: Insights from Academia and an International Survey among Professionals. J. Build. Eng. 2025, 102, 112036. [Google Scholar] [CrossRef] [Scilit]
- Mehrabian, A.; Russell, J.A. An Approach to Environmental Psychology; The MIT Press: Cambridge, MA, USA, 1974. [Google Scholar]
- Russell, J.A.; Pratt, G. A Description of the Affective Quality Attributed to Environments. J. Pers. Soc. Psychol. 1980, 38, 311–322. [Google Scholar] [CrossRef]
- Russell, J.A. The Measurement of Emotion; Plutchik, R., Kellerman, H., Eds.; Academic Press: Cambridge, MA, USA, 1989; pp. 83–111. [Google Scholar]
- Johansson, M.; Pedersen, E.; Maleetipwan-Mattsson, P.; Kuhn, L.; Laike, T. Perceived Outdoor Lighting Quality (POLQ): A Lighting Assessment Tool. J. Environ. Psychol. 2014, 39, 14–21. [Google Scholar] [CrossRef] [Scilit]
- Axelsson, Ö.; Nilsson, M.E.; Berglund, B. A Principal Components Model of Soundscape Perception. J. Acoust. Soc. Am. 2010, 128, 2836–2846. [Google Scholar] [CrossRef] [Scilit]
- Abboushi, B.; Elzeyadi, I.; Taylor, R.; Sereno, M. Subjective and Physiological Responses towards Daylit Spaces with Contemporary Façade Patterns in Virtual Reality: Influence of Sky Type, Space Function, and Latitude. J. Environ. Psychol. 2022, 82, 101839. [Google Scholar] [CrossRef] [Scilit]
- Cho, Y.; Karmann, C.; Andersen, M. Perception of Window Views in VR: Impact of Display and Type of Motion on Subjective and Physiological Responses. Build. Environ. 2025, 274, 112757. [Google Scholar] [CrossRef] [Scilit]
- Masullo, M.; Maffei, L.; Iachini, T.; Rapuano, M.; Cioffi, F.; Ruggiero, G.; Ruotolo, F. A Questionnaire Investigating the Emotional Salience of Sounds. Appl. Acoust. 2021, 182, 108281. [Google Scholar] [CrossRef] [Scilit]
- Huang, Q.; Zhang, Z.; Chen, Z. The Effects of Multi-Sensory Public Seating on Emotion Regulation in Youth Communities. Sci. Rep. 2025, 15, 30668. [Google Scholar] [CrossRef] [Scilit] [PubMed]
- Li, J.; Masullo, M.; Maffei, L.; Pascale, A.; Chau, C.-K.; Lin, M. Improving Informational-Attentional Masking of Water Sound on Traffic Noise by Spatial Variation Settings: An in Situ Study with Brain Activity Measurements. Appl. Acoust. 2024, 218, 109904. [Google Scholar] [CrossRef] [Scilit]
- Masullo, M.; Cioffi, F.; Li, J.; Maffei, L.; Scorpio, M.; Iachini, T.; Ruggiero, G.; Malferà, A.; Ruotolo, F. An Investigation of the Influence of the Night Lighting in a Urban Park on Individuals’ Emotions. Sustainability 2022, 14, 8556. [Google Scholar] [CrossRef] [Scilit]
- Trimble SketchUp Pro. Available online: https://www.sketchup.com/products/sketchup-pro (accessed on 20 February 2025).
- Autodesk 3ds Max Software. Available online: https://www.autodesk.com/asean/products/3ds-max/overview?term=1-YEAR&tab=subscription (accessed on 20 February 2025).
- Head Acoustics Sqobold. Available online: https://www.head-acoustics.com/products/data-acquisition/sqobold (accessed on 20 February 2025).
- Home—Astro Spatial Audio. Available online: https://www.astroaudio.eu/ (accessed on 20 February 2025).
- UNI/TS 11300-2:2019; Prestazioni Energetiche Degli Edifici—Parte 2: Determinazione del Fabbisogno di Energia Primaria e dei Rendimenti per la Climatizzazione Invernale, per la Produzione di Acqua Calda Sanitaria, per la Ventilazione e per L’illuminazione in Edifici non Residenziali. UNI Ente Italiano di Normazione: Milan, Italy, 2019.
- Universität Düsseldorf: G*Power. Available online: https://www.psychologie.hhu.de/arbeitsgruppen/allgemeine-psychologie-und-arbeitspsychologie/gpower (accessed on 20 February 2025).
- Marey, H.M.; Semary, N.A.; Mandour, S.S. Ishihara Electronic Color Blindness Test: An Evaluation Study. Ophthalmol. Res. Int. J. 2015, 3, 67–75. [Google Scholar] [CrossRef] [Scilit] [PubMed]
- Unicampania SENS I-Lab. Available online: https://www.architettura.unicampania.it/images/ricerca/laboratori/EN/SENS-i_Lab_2024_EN_REV01.pdf (accessed on 20 February 2025).
- Damien Masson Balanced Latin Square Generator. Available online: https://damienmasson.com/tools/latin_square/ (accessed on 20 February 2025).

Disclaimer/Publisher’s Note: The statements, opinions and data contained in all publications are solely those of the individual author(s) and contributor(s) and not of MDPI and/or the editor(s). MDPI and/or the editor(s) disclaim responsibility for any injury to people or property resulting from any ideas, methods, instructions or products referred to in the content. |
© 2026 by the authors. Licensee MDPI, Basel, Switzerland. This article is an open access article distributed under the terms and conditions of the Creative Commons Attribution (CC BY) license.