


Abstract
Accurately assessing urban green perception is crucial for sustainable urban development and human well-being, yet conventional approaches often depend on simplistic objective metrics and non-immersive, screen-based subjective surveys, undermining ecological validity. This study develops and validates a multidimensional assessment framework that integrates Large Vision Models (LVMs) and Mixed Reality (MR) to couple objective environmental features with immersive human perception. The framework comprises 30 objective and 6 subjective indicators; state-of-the-art LVMs including DINOv2 and Depth Anything were applied to accurately extract objective features from Street View Imagery (SVI); and the MR device, Meta Quest 3, was utilized for the immersive collection of high-quality subjective data. In an empirical study with 74 volunteers in Shenzhen, China, machine learning models trained on MR-based data achieved 20–50% higher R2 for subjective perception than models trained on traditional screen-based data. The validated framework was then applied to 61,131 SVIs citywide to map the spatial distribution of multidimensional green perception and to quantify relationships between objective and subjective indicators. Going beyond technical validation, this study demonstrates how the framework serves as a critical tool for urban planning and landscape upgrading. By diagnosing perceptual deficits where greening quantity does not translate into quality experiences, the framework supports a paradigm shift from quantity-oriented greening to perception-oriented spatial optimization. These findings offer actionable insights for policymakers to prioritize interventions that effectively enhance public health and environmental equity in high-density cities.
1. Introduction
Accurate assessment of complex socio-ecological systems is a cornerstone for promoting urban sustainability and enhancing human well-being [1,2]. As a key ecological indicator, urban green perception faces a unique dual challenge in its assessment methodology: it requires not only the precise quantification of the built environment’s objective features but also the authentic capture of subjective human spatial experiences. Therefore, developing a scientifically robust assessment framework that integrates both objective and subjective dimensions is crucial for research on urban spatial quality [3], resident satisfaction [4], social equity [5], and public health [6,7], as well as for informing public policies in urban planning and environmental management [8,9,10,11].
The necessity of assessing urban green perception transcends mere aesthetic appreciation; it is fundamentally intertwined with the resilience of socio-ecological systems [12,13]. Urbanization has led to a progressive ‘extinction of experience’ where residents are increasingly alienated from natural environments, leading to a surge in mental health disorders and reduced urban livability [14]. Accurate perception assessment is therefore a prerequisite for evidence-based urban intervention. From a public health perspective, the restorative qualities of greenery—such as stress reduction and cognitive fatigue recovery—are not determined by the physical presence of plants alone, but by how these elements are visually processed and psychologically interpreted by the perceiver [15].
Furthermore, from a socio-spatial equity standpoint, the ‘green gap’ in cities is often not just a matter of quantity, but of perceptual quality [16]. High-density urban areas frequently suffer from fragmented and poorly designed green corridors that fail to elicit positive emotional responses, despite meeting minimum greening quotas. Consequently, traditional planning metrics that rely on top-down land-use data often fail to reflect the ‘human-scale’ reality. There is a pressing need to transition from ‘supply-oriented’ greening to ‘perception-oriented’ spatial optimization [17], which necessitates a methodological framework capable of capturing the granular, multidimensional essence of the urban built environment.
However, prevailing methodologies for assessing urban green perception, despite their widespread use of SVI and computer vision [18,19], suffer from two major methodological limitations. First, the construction of objective indicators is often oversimplified, typically focusing on single-dimensional metrics like the GVI and landscape element types [20,21]. Landscape ecology suggests that the restorative potential of nature is deeply rooted in its structural complexity and spatial configuration. By reducing a three-dimensional ecological environment to a single-dimensional value, these methods overlook critical perceptual drivers such as visual depth and color diversity, leading to potential misalignments between urban planning and actual human experience.
Furthermore, subjective perception data are commonly collected through screen-based image evaluations [22,23], a method that lacks ecological validity. In a real-world setting, green perception is an embodied process involving spatial scale and immersive presence. Static screens strip away the dynamic and panoramic context of urban streetscapes, which may explain the low predictive consistency observed in many existing perception models.
Consequently, a methodological gap remains, highlighting the urgent need for an assessment framework and technical methods that can effectively integrate multidimensional objective environmental features with authentic human subjective perceptions.
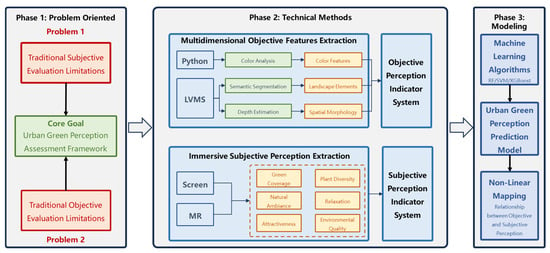
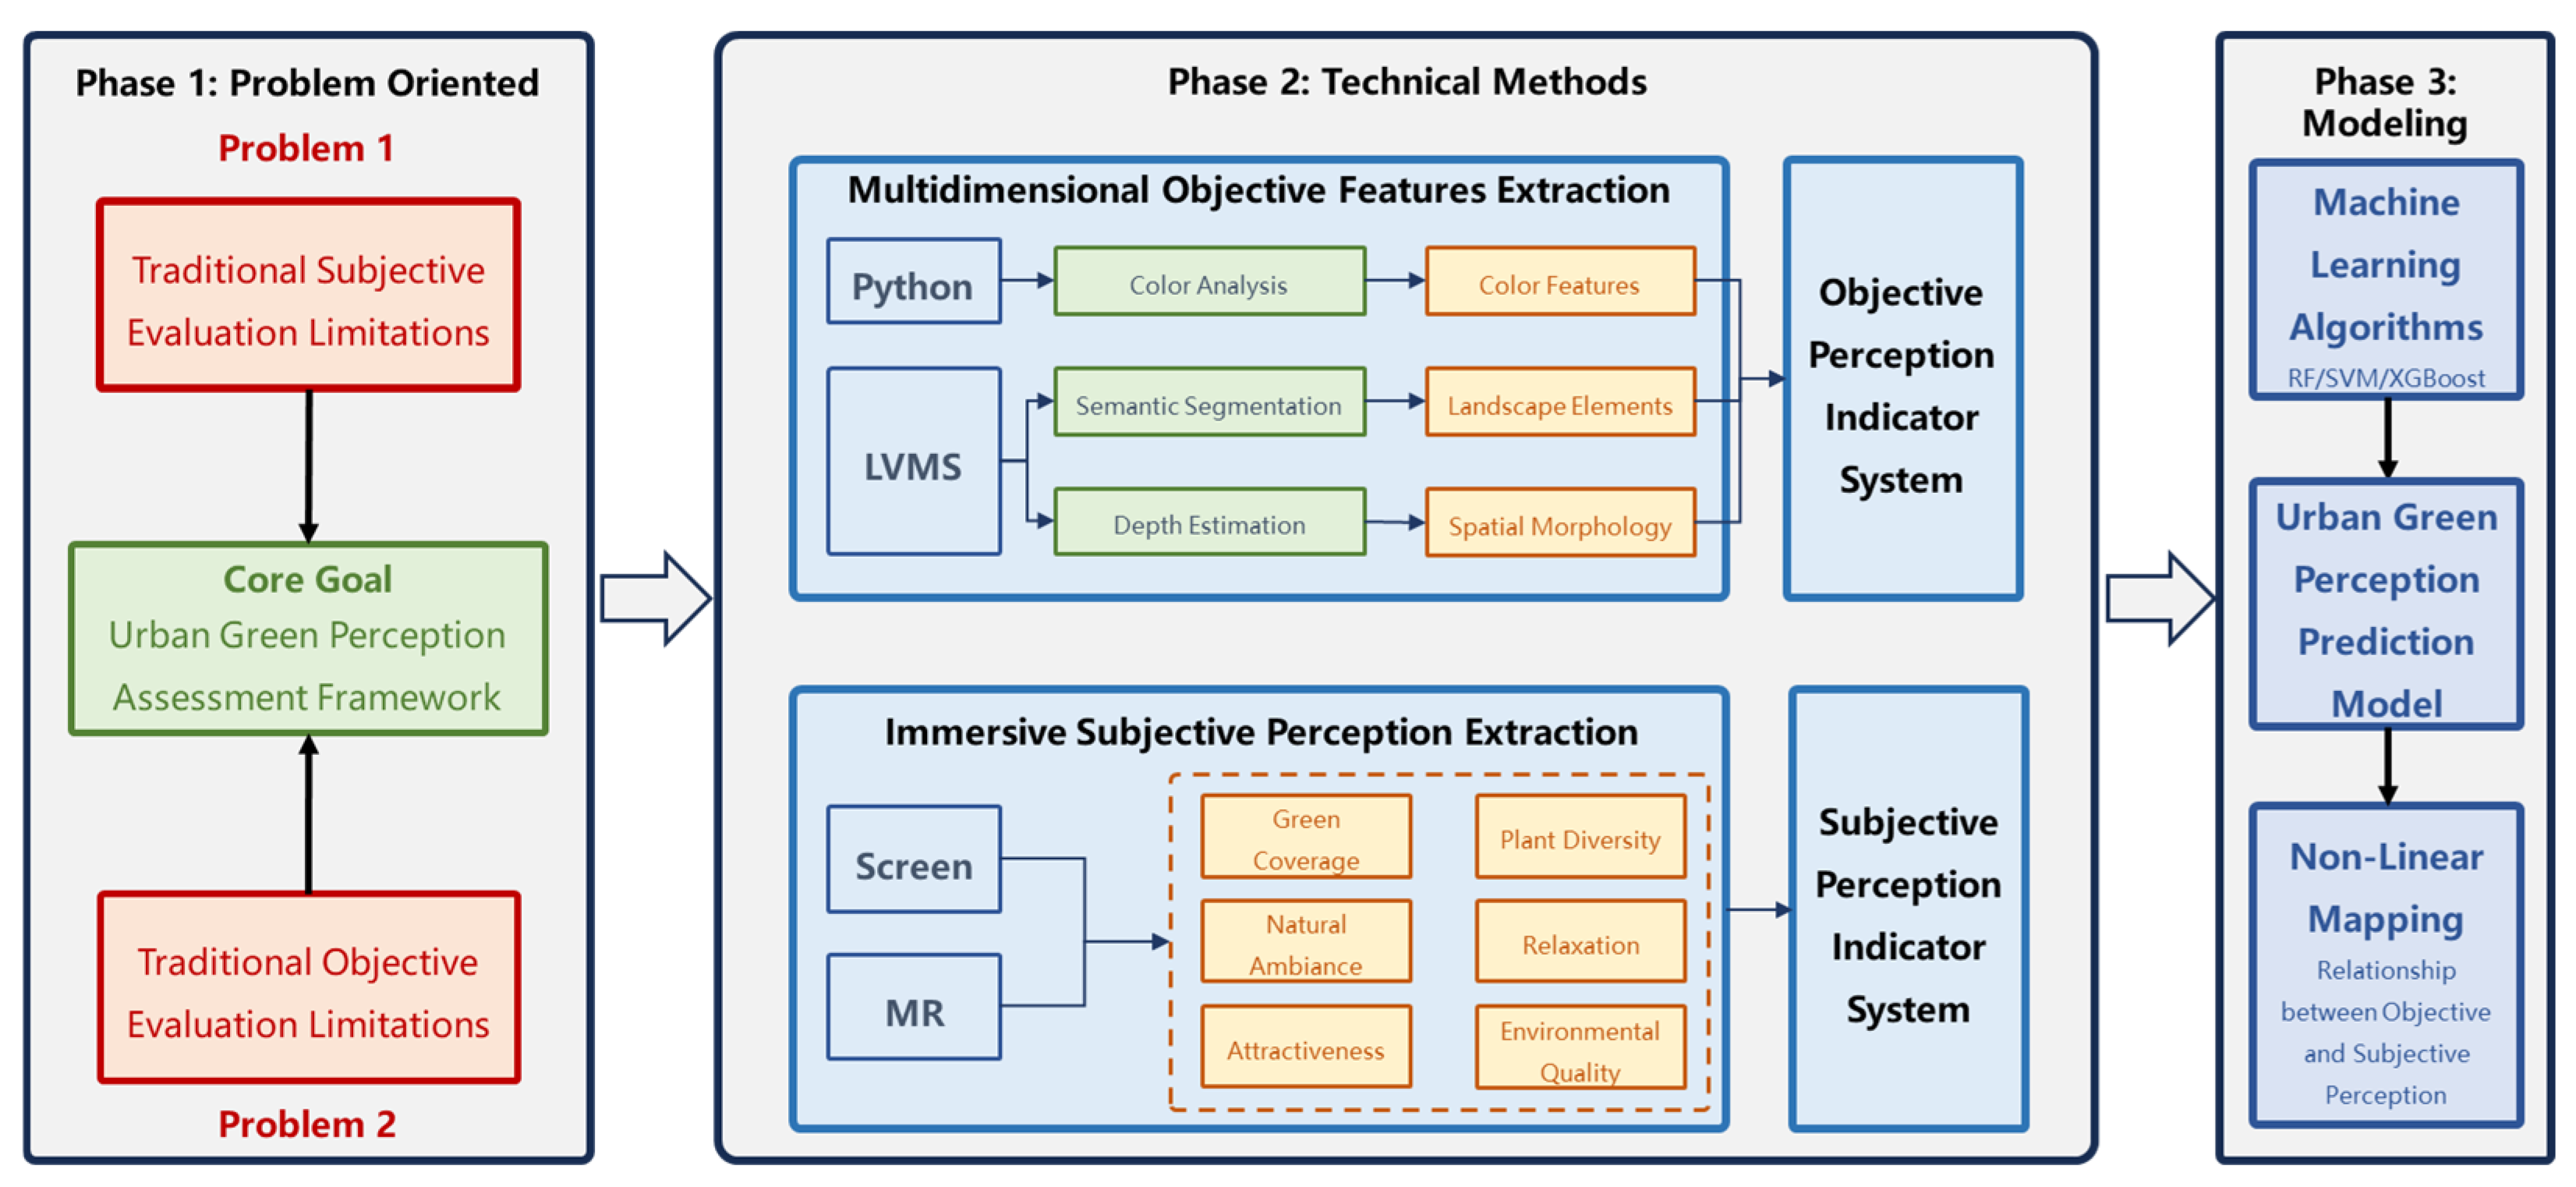
To address these challenges, this study constructs and validates a multidimensional urban green perception assessment framework that integrates Large Vision Models (LVMs) and Mixed Reality (MR). By leveraging LVMs to extract comprehensive environmental features and utilizing MR to capture authentic subjective responses, this study aims to build a high-accuracy predictive model for urban green quality as shown in Figure 1. Specifically, this research is guided by the following three research questions:
Figure 1.
The overall framework of this study.
RQ1: To what extent can a multidimensional objective indicator system provide a more comprehensive characterization of urban green landscapes compared to traditional single-dimensional metrics?
RQ2: How does the integration of MR influence the ecological validity and predictive accuracy of subjective perception models compared to traditional screen-based methods?
RQ3: What are the complex, non-linear relationships between multidimensional environmental features and authentic human subjective experiences in a complex urban context?
At the core of this framework is a comprehensive indicator system comprising 30 objective and 6 subjective indicators. Objective perception is categorized into three sub-dimensions: color features, element types, and spatial morphology. Subjective perception includes six indicators such as perceived greenness, natural ambiance, and relaxation. Based on this system, state-of-the-art LVMs, including DINOv2 [24] and Depth Anything [25], are employed to precisely extract objective indicators from SVIs. Concurrently, the Meta Quest 3, an MR headset, is used for the immersive collection of high-quality subjective data. Furthermore, machine learning algorithms, including RF, SVM, and XGBoost, are utilized to model the non-linear relationships between objective and subjective perception, enabling large-scale, high-precision prediction of subjective experiences.
The proposed framework was rigorously validated through a large-scale empirical study in Shenzhen, China. The results demonstrate that the prediction models developed using our integrated framework significantly outperform those based on traditional methods, demonstrating that data collected in immersive environments significantly enhances the predictive power of assessment models compared to traditional baselines. Therefore, the core contributions of this research are as follows: (1) Theoretically, we developed a comprehensive, multidimensional indicator system and assessment framework for urban green perception, expanding the content and dimensions of its evaluation. (2) Methodologically, we established a replicable methodology integrating LVMs and MR, which significantly enhances the assessment accuracy of both objective and subjective perception. (3) Practically, our work not only demonstrates the framework’s potential in large-scale environmental monitoring and assessment but also provides a powerful new tool for the field of ecological and environmental sciences.
The remainder of this paper is organized as follows. Section 2 critically reviews the existing literature to identify the key methodological gaps in current ecological assessment approaches for urban green perception. Section 3 details the theoretical underpinnings and components of our novel framework, including the multidimensional indicator system and the integrated LVM-MR methodology. Section 4 presents the results of our empirical validation, rigorously comparing the performance of our framework against conventional methods. Section 5 discusses the broader implications of these findings, exploring the complex relationships between objective and subjective indicators and reflecting on the methodological advancements. Finally, Section 6 concludes by summarizing the primary contributions of this work to the field of environmental assessment and outlining avenues for future research.
2. Related Works
Urban green perception refers to the comprehensive human cognition of green landscapes and their surrounding spatial environment within urban built-up areas, and has been widely recognized as a human-centered concept that plays a critical role in fine-grained urban planning, management, and ecological quality enhancement [26]. Research on urban green perception has demonstrated broad applicability across fields such as environmental management [27], public health [28], and urban design [29], providing critical insights to address increasingly complex urban challenges [30]. A substantial body of research consistently demonstrates that the precise assessment of urban green perception not only contributes to enhancing urban aesthetics and residential satisfaction but also positively impacts the physical and mental health of residents [31,32,33]. Collectively, these connections provide a solid scientific foundation for promoting urban sustainable development and improving human well-being.
Existing studies on urban green perception assessment generally follow two mainstream paradigms: the measurement of objective physical indicators of the built environment and the evaluation of subjective psychological indicators of human experience. Regarding objective physical assessment, large-scale image data and computer vision techniques are widely employed in recent studies [34,35]. Specifically, deep learning models such as DeepLab v3+ [36], YOLO [37], and ResNet [23] are commonly employed to conduct semantic segmentation on large-scale datasets of remote sensing images, SVIs, and crowd-sourced data. This paradigm enables the efficient calculation of green landscape proportions within a given field of view, thereby supporting large-scale, precise assessment. However, despite significant breakthroughs in data coverage and processing efficiency, these methods are limited by the incompleteness of their assessment dimensions and content. Specifically, existing evaluation metrics are predominantly centered on the proportion of various landscape elements, particularly the GVI, while neglecting the complexity of ecological landscapes in their objective representations, such as color characteristics and spatial morphology [38]. Consequently, although scalable, the inherent single-dimensional nature of metrics like GVI limits their ability to capture the true objective physical features of the built environment, rendering them ineffective tools for revealing deeper relationships between objective and subjective perception.
In contrast, subjective psychological assessment relies on tools such as questionnaire surveys and image auditing which are used to directly capture human perception. Traditionally, subjective assessment has relied on on-site field surveys [39], but their small sample sizes and high costs limit their scalability. In recent years, image auditing—typically involving online annotation of static images or video clips—has emerged as a more scalable alternative. The core deficiency of this approach, however, is its lack of ecological validity. The static, two-dimensional, non-immersive viewing experience on a screen is fundamentally different from the multi-sensory, dynamic, and embodied experience of being in a real environment. This paradigm creates a disconnect between the perceiving subject and the actual environment, meaning the collected data may not genuinely reflect human perception, cognition, and decision-making in the real world. As a result, such assessments are prone to systematic bias, thereby undermining the reliability and external validity of the derived research conclusions. In summary, while the assessment of urban green perception has made significant progress, a clear methodological gap has emerged, constituted by the low-dimensionality of objective assessment and the low validity of subjective measurement. Therefore, there is an urgent need for an assessment framework and associated technical methods capable of integrating multi-dimensional objective environmental characteristics with authentic human subjective perception. Such a development is essential to advance built environment research into a more precise and human-centered paradigm [40].
3. Methodology
3.1. Green Perception Indicators System
To overcome the limitations of single-metric assessments, we developed a comprehensive indicator system integrating both objective and subjective dimensions of urban green perception. Grounded in the principles of biological vision [41], this system serves as the conceptual core of our assessment framework. The system comprises two main components. The objective perception component consists of 30 indicators quantifying the inherent attributes of the urban landscape across three key dimensions: color features, landscape elements, and spatial morphology, detailed in Table 1. The subjective perception component reflects individual experiences and cognition of urban green landscapes, comprising six indicators: green coverage, plant diversity, natural ambiance, relaxation, attractiveness, and environmental quality, detailed in Table 2. By systematically integrating these two components, our indicator system provides a robust foundation for a more nuanced and accurate assessment of urban green perception.
Table 1.
Objective perception indicators.
Table 2.
Subjective perception indicators.
3.2. Research Framework
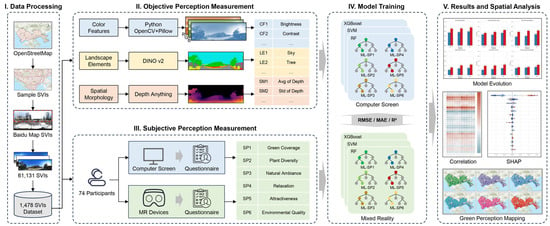
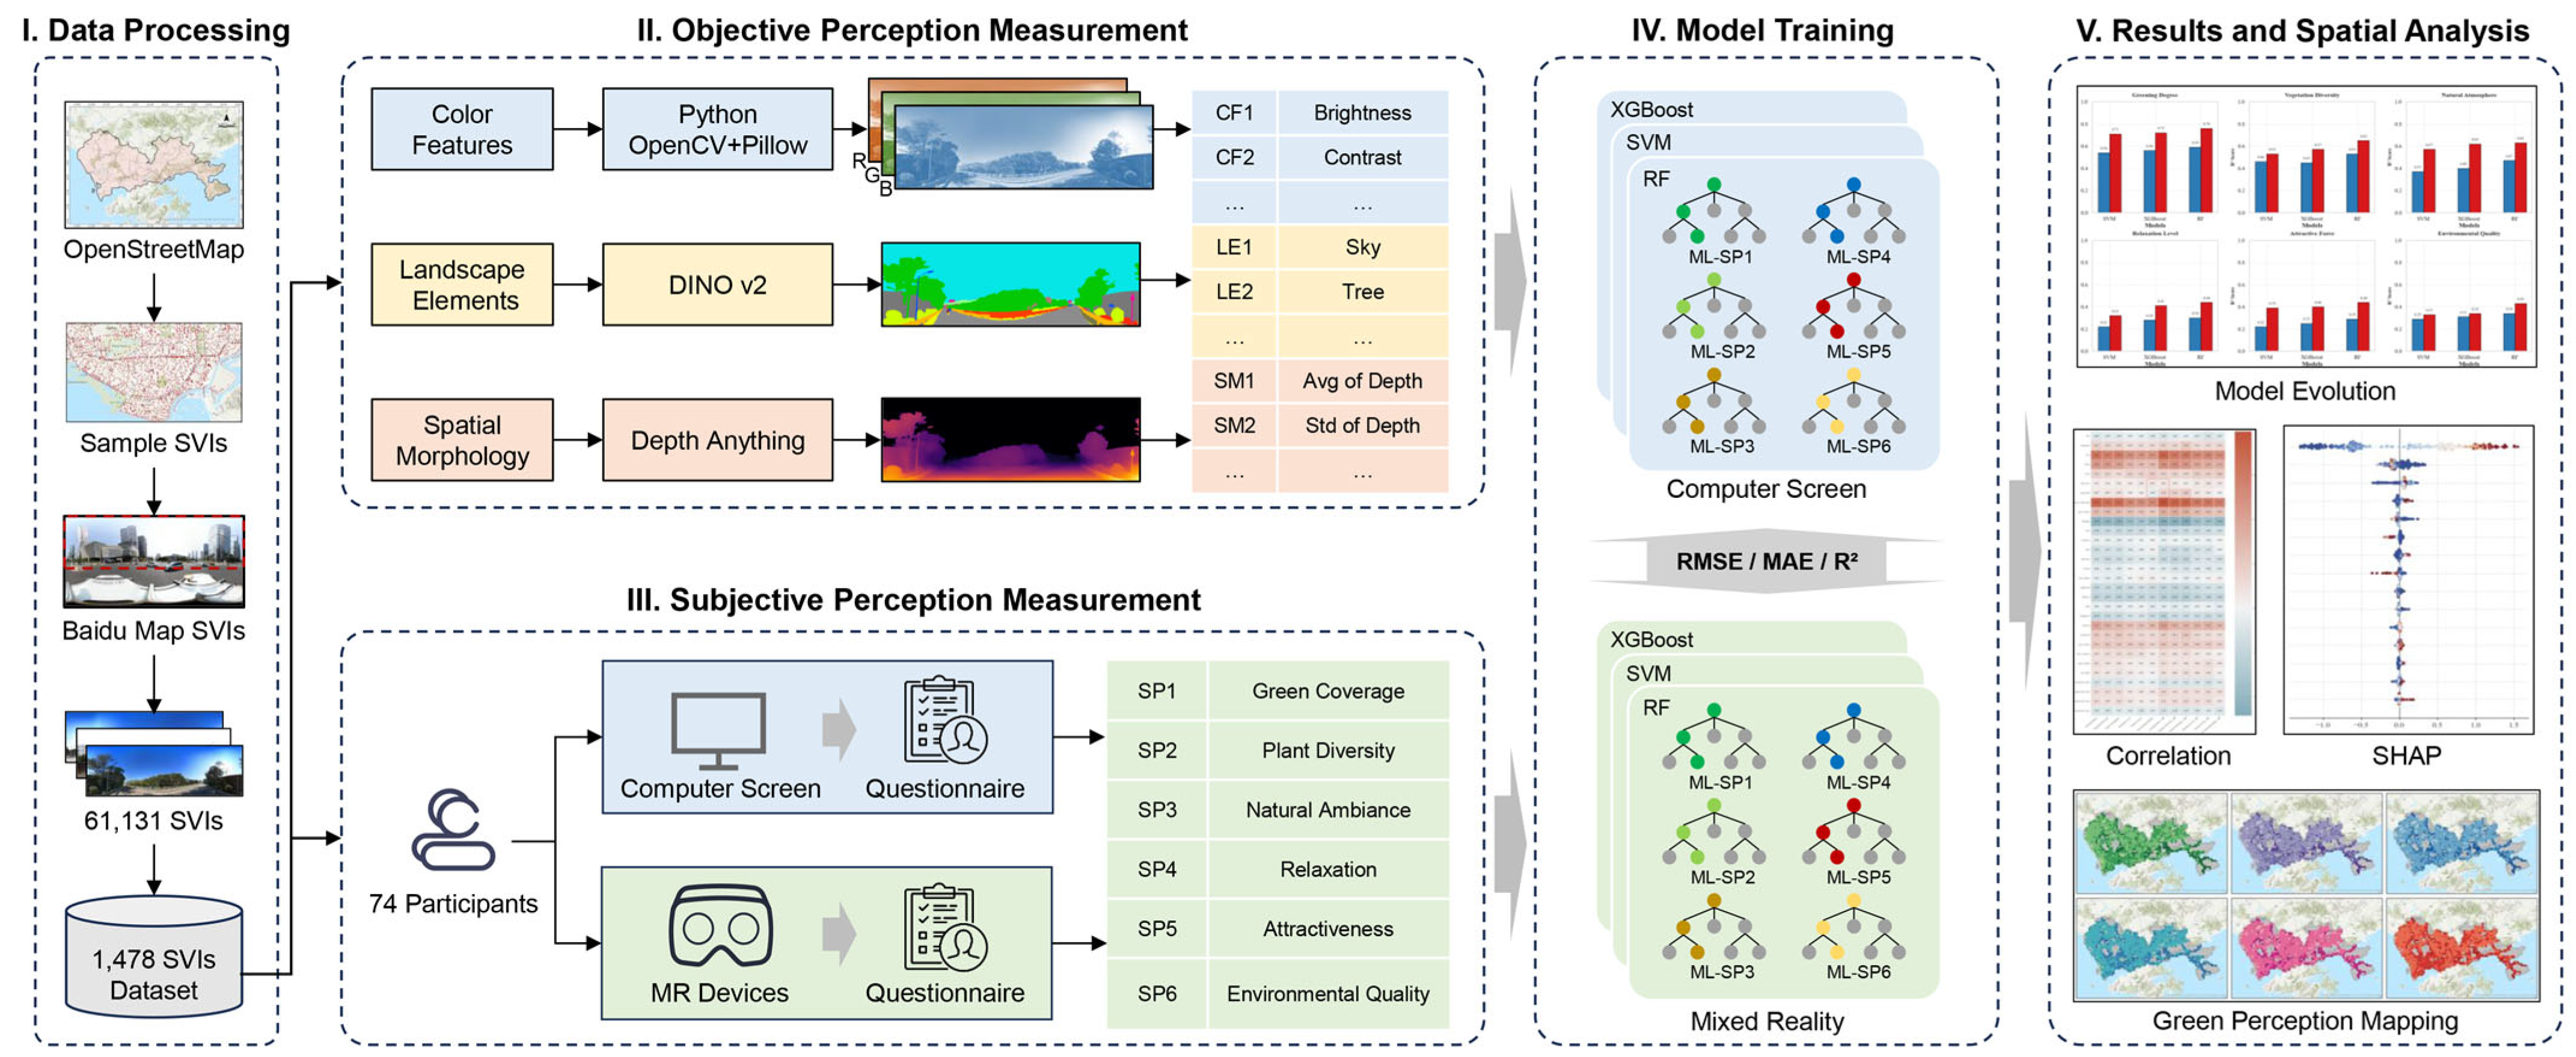
The research framework consists of the following five steps, as shown in Figure 2: (1) Data Processing: SVIs were sourced from Baidu Map, geometrically processed, and randomly sampled to form a representative experimental dataset. (2) Objective perception measurement: Advanced LVMs were applied to quantify objective environmental characteristics along three dimensions, including color features, landscape elements, and spatial morphology. (3) Subjective perception measurement: Human participant experiments, utilizing both screen-based and MR interfaces, were conducted to gather subjective ratings on six indicators, including green coverage, plant diversity, natural ambiance, relaxation, attractiveness, and environmental quality. (4) Model training: Machine learning algorithms were employed to train green perception prediction models, establishing nonlinear relationships between objective and subjective perceptions. (5) Results and spatial analysis: The trained models were applied to large-scale predictions of green perception across the study area. Subsequent spatial analysis generated perception maps and identified key spatial patterns and influencing factors.
Figure 2.
The overall technical roadmap of this study.
3.3. Study Area
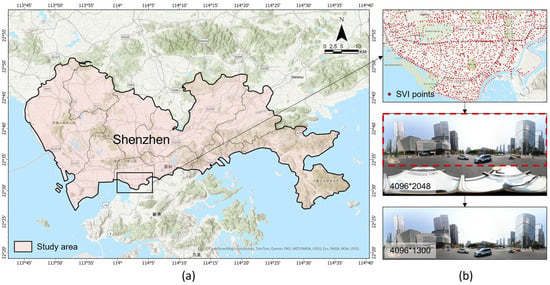
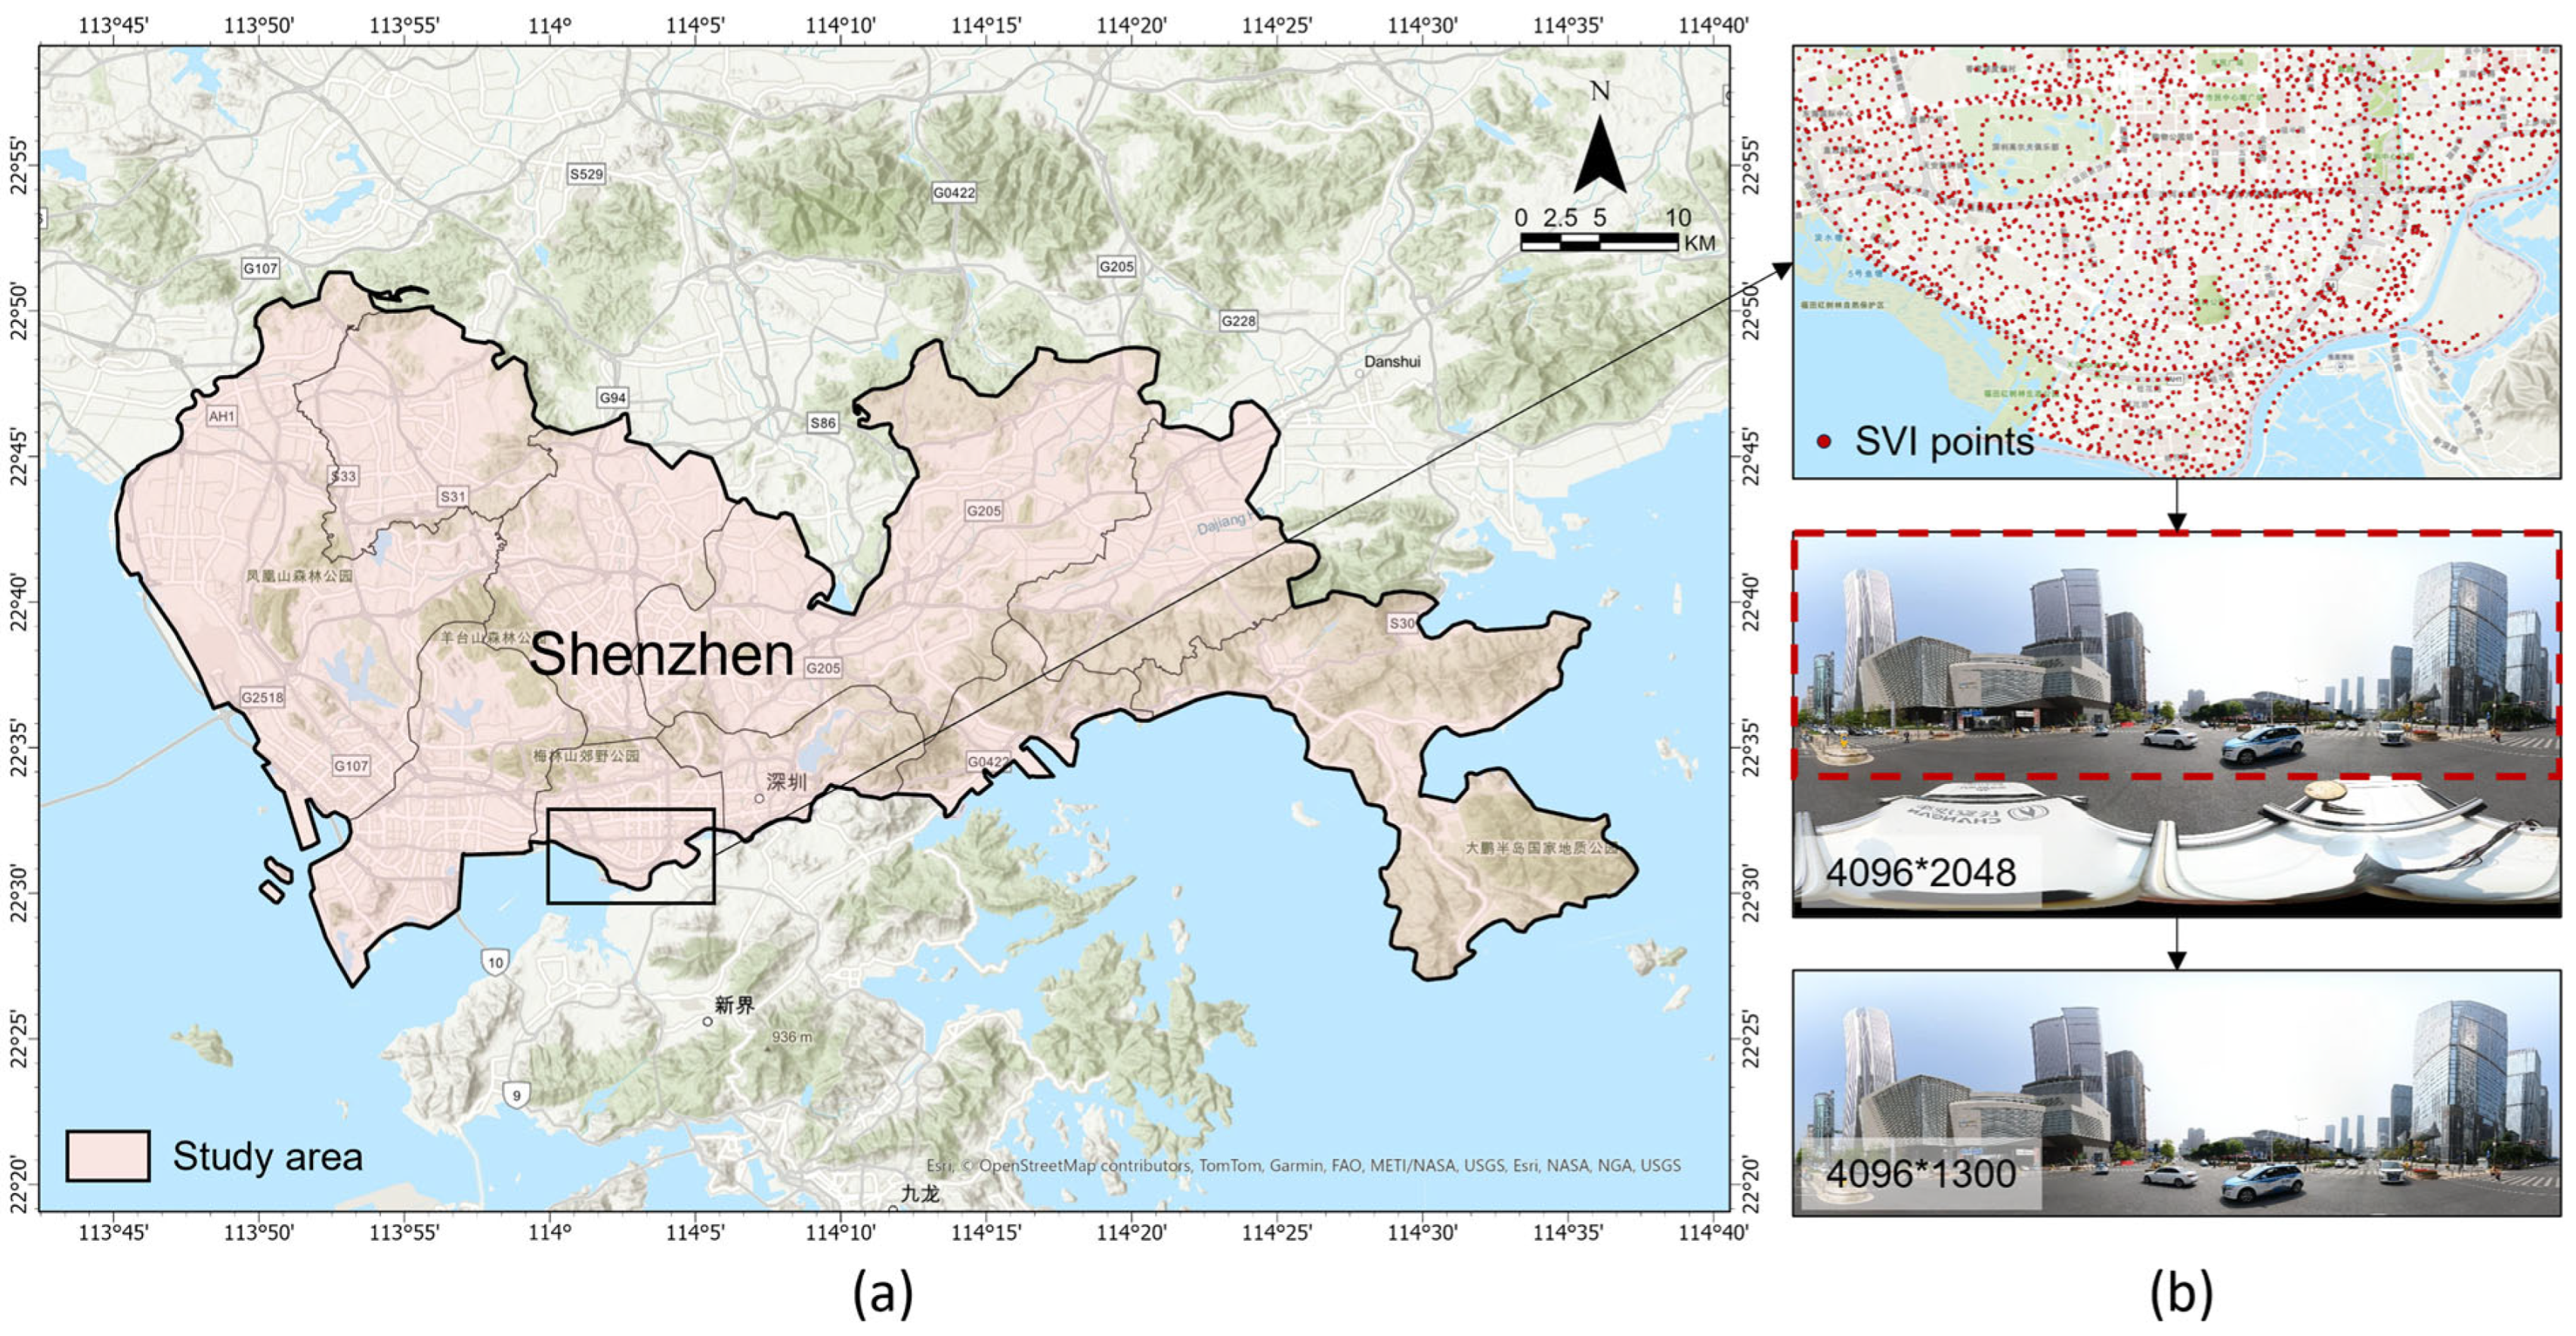
Shenzhen, Guangdong Province, China, was selected as the research site, as shown in Figure 3. The study area covers nine administrative districts, spanning a total area of 1997.47 km2 and a residential population of 17.7 million. Located in southern China adjacent to Hong Kong, Shenzhen is a Special Economic Zone, a national economic hub, and an innovative city. It also serves as one of the core engines of the Guangdong–Hong Kong–Macao Bay Area, with urban planning and infrastructure development at the forefront of the country [42]. As of the end of 2023, Shenzhen’s urban green coverage rate in built-up areas reached 43.56%, with 3379 km of greenways and 1290 parks. The city’s green space service coverage achieved 91%, aligning with its vision of creating an integrated urban landscape where mountains, water, and the city coexist harmoniously [43]. This vision has increasingly become a reality for Shenzhen residents. Thus, Shenzhen is an ideal case for studying green perception. It provided a robust context to validate the scientific and practical feasibility of the proposed research methods while enabling an individual-level assessment of green spaces from the perspective of subjective perception. This contributes to a more comprehensive understanding of the city’s green landscapes.
Figure 3.
Study area map and data collection and processing. (a) Study area in the main urban area of Shenzhen. (b) Example of street view imagery collection and processing.
3.4. Dataset
3.4.1. Baidu Map Street View Imagery
Baidu Map, as one of the largest online map service providers in China, has collected panoramic images across streetscapes in 652 cities. Characterized by its extensive coverage, high update frequency, and high resolution, Baidu Map is widely utilized in urban studies within China [44,45,46]. Therefore, Baidu Map was selected as the data source for SVIs.
The SVI acquisition process proceeded as follows: First, the vector road network of Shenzhen was obtained from OpenStreetMap and subjected to necessary processing such as polyline merging and topology checks to eliminate the influence of duplicate roads on SVI acquisition. Subsequently, using ArcGIS Pro 3, points were sampled every 100 m along the road network as acquisition points for SVIs, and their geographic coordinates under the WGS84 coordinate system were calculated. Subsequently, a Python 3.10 application was developed to retrieve SVI at these acquisition points via the Baidu Map Open Platform (https://lbsyun.baidu.com/ (accessed on 11 July 2025)). Each request was authenticated using a unique Application Key and included specific parameters such as the coordinates.
The system was configured to directly acquire panoramic images with a resolution of 4096 × 2048 pixels. Panoramic images integrate all directions at a given location into a single representation, thereby mitigating the impact of varying streetscape views from different directions on green perception. Furthermore, panoramic images can accurately reproduce 3D urban scenes in MR devices, significantly enhancing the viewer’s sense of immersion.
Ultimately, this study obtained a total of 61,131 panoramic SVIs. To eliminate the interference of the data collection vehicle at the bottom of the SVIs, the SVI was cropped to remove the bottom portion, resulting in a resolution of 4096*1300, which served as the image dataset for semantic segmentation and depth prediction.
3.4.2. Subjective Perception Dataset
(1) Experiment procedure
To ensure comprehensive spatial coverage and representativeness of the subjective perception dataset, a systematic grid-based random sampling strategy was employed. The study area was partitioned into a regular grid of 1 km × 1 km cells. Within each cell containing available SVIs, a single image was randomly selected to represent the urban scene typical of that spatial unit. This procedure yielded an experimental dataset comprising 1478 SVIs.
Subjective perception data were collected through a structured experimental protocol conducted in a controlled laboratory setting.
Following the protocol outlined in Table 3, a within-subjects design was implemented, requiring each participant to evaluate the identical set of SVIs under both screen and MR viewing condition. To ensure the rigor of the experimental process, the presentation order of the screen-based and MR-based tasks was strictly counterbalanced across participants (i.e., randomized AB/BA design). This measure was implemented to effectively neutralize potential order effects, fatigue, and learning effects that could arise from repeated evaluations. In both perception tasks, subjective ratings were collected for 6 indicators: green coverage, plant diversity, natural ambiance, relaxation, attractiveness, and environmental quality. Participants responded using a 5-point Likert scale, where 1 indicated ’strongly disagree’ and 5 indicated ’strongly agree’. This study strictly adhered to ethical guidelines, and the user experiment received approval from the local ethics review board. All respondents participated voluntarily and completed the survey after providing informed consent.
Table 3.
Summary of the experimental phases and technical specifications.
(2) Participants
A total of 74 participants were recruited through social media platforms. Specifically, to maximize the coverage of the study area within the experimental time constraints, the 1478 sampled SVIs were distributed among the 74 participants without overlap. Each participant was randomly assigned a unique subset of 20 SVIs to evaluate in both screen-based and MR-based perception tasks. Consequently, each SVI was paired with one participant, generating two distinct sets of ratings (Screen and MR) for every image. The participants were primarily young, highly educated students with near-balanced gender distribution. The majority of participants possessed master’s or bachelor’s level education, with limited prior experience in MR, VR or AR devices.
Specifically, the sample comprised 44 males and 30 females. The age distribution was as follows: 62 participants aged 18–24, 7 participants aged 25–34, and 5 participants aged 35–44. Regarding educational attainment, 3 participants had completed high school, 21 held bachelor’s degrees, 47 held master’s degrees, and 2 held doctoral degrees. Professional backgrounds included 61 university students, 2 teachers, 5 engineers, 3 government employees, and 3 participants from other professions. Prior experience with MR, VR, or AR devices was limited: 42 participants reported no prior usage, 27 reported occasional usage (a few times per year), and 5 reported infrequent usage (a few times per month).
While the sample size consists of 74 participants, its statistical adequacy is supported by two factors. First, a power analysis conducted via G*Power 3.1 indicated that for a multiple regression model with 30 predictors, a total sample size of approximately 66 is sufficient to achieve a power of 0.80 at a medium effect size ( = 0.15) and an alpha level of 0.05. Second, this study utilized a within-subjects design, where each participant evaluated identical scenes under two conditions, effectively doubling the data points for comparative analysis and reducing inter-individual variance.
(3) Experiment results
The results of the experiment are shown in Table 4. In the screen-based task, the mean scores were as follows: 2.80 for green coverage, 2.51 for plant diversity, 2.51 for natural ambiance, 2.54 for relaxation, 2.53 for attractiveness, and 2.87 for environmental quality. In the MR-based task, the mean scores were 3.16 for green coverage, 2.87 for plant diversity, 2.78 for natural ambiance, 2.76 for relaxation, 2.59 for attractiveness, and 3.01 for environmental quality. It can be observed that the MR-based task yielded higher mean scores across all indicators, with the advantages of MR devices being particularly pronounced in the perception of green coverage and natural ambiance. This suggests that MR devices are superior to traditional computer screen presentation methods in creating a more realistic and immersive experience of green spaces.
Table 4.
Results of green perception experiment.
Despite the differences in absolute scores between the two methods, it is essential to verify the reliability of the subjective data given the single-rater design. We performed a Pearson correlation analysis to quantify the consistency between the screen-based and MR-based ratings for the same SVIs. The results revealed significant positive correlations across all six indicators (0.60 < r < 0.80, p < 0.001). This high degree of internal consistency indicates that while the MR modality enhances the intensity of the perception (resulting in higher mean scores), the participants maintained stable and reliable evaluative standards relative to the visual content. This consistency between modalities provides evidence of the overall reliability of the subjective dataset.
3.5. Objective Perception Measurement
Based on the characteristics of the biological visual system, the objective perception of the urban built environment, which is the result of complex physiological and psychological processes in capturing environmental features, mainly encompasses three aspects: color features, landscape elements, and spatial morphology, totaling 30 indicators. This study employed state-of-the-art LVMs, specifically DINOv2 and Depth Anything, to process the SVIs and extract objective perception indicators. DINOv2 is a self-supervised model designed to learn high-level semantic visual features; concurrently, Depth Anything achieves high-fidelity monocular depth estimation for complex real-world scenes.
3.5.1. Color Features
Color features are fundamental to urban green perception, encompassing illumination and color information, and are proposed as potential factors associated with individuals’ landscape perception. Within the indicator system, color features are quantified by 5 indicators: brightness, contrast, saturation, number of colors, and color complexity. Python’s OpenCV and Pillow libraries were utilized to decompose SVIs into three RGB channels and quantify these five indicators, thereby characterizing the basic features of environmental color. Color complexity was analyzed by modeling the color distribution in histograms and computing the color entropy value to represent the color complexity. The color complexity can be represented as:
where E is the color entropy, ci are the distinct colors, p(ci) is the proportion of pixels of color ci, and M is the number of distinct colors.
3.5.2. Landscape Elements
The composition of landscape elements is a critical determinant of urban green space perception. Within the established indicator system, landscape elements encompass 19 indicators, including the proportion of 17 common urban landscape elements, the overall proportion and the types of green landscapes. These indicators represent the spatial distribution and visual characteristics of various elements in the urban environment from multiple dimensions, providing important references for investigations into green perception. The proportion of landscape element i can be represented as:
where Pi represents the percentage of points in image I identified as belonging to class i. Seg(I) is a function that segments image I into different regions or classes. Det(p) is a detection function that classifies pixel p into a specific class i.
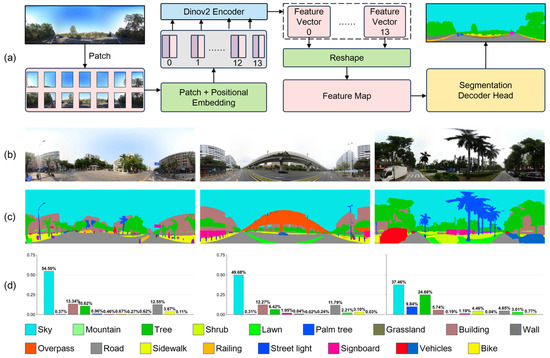
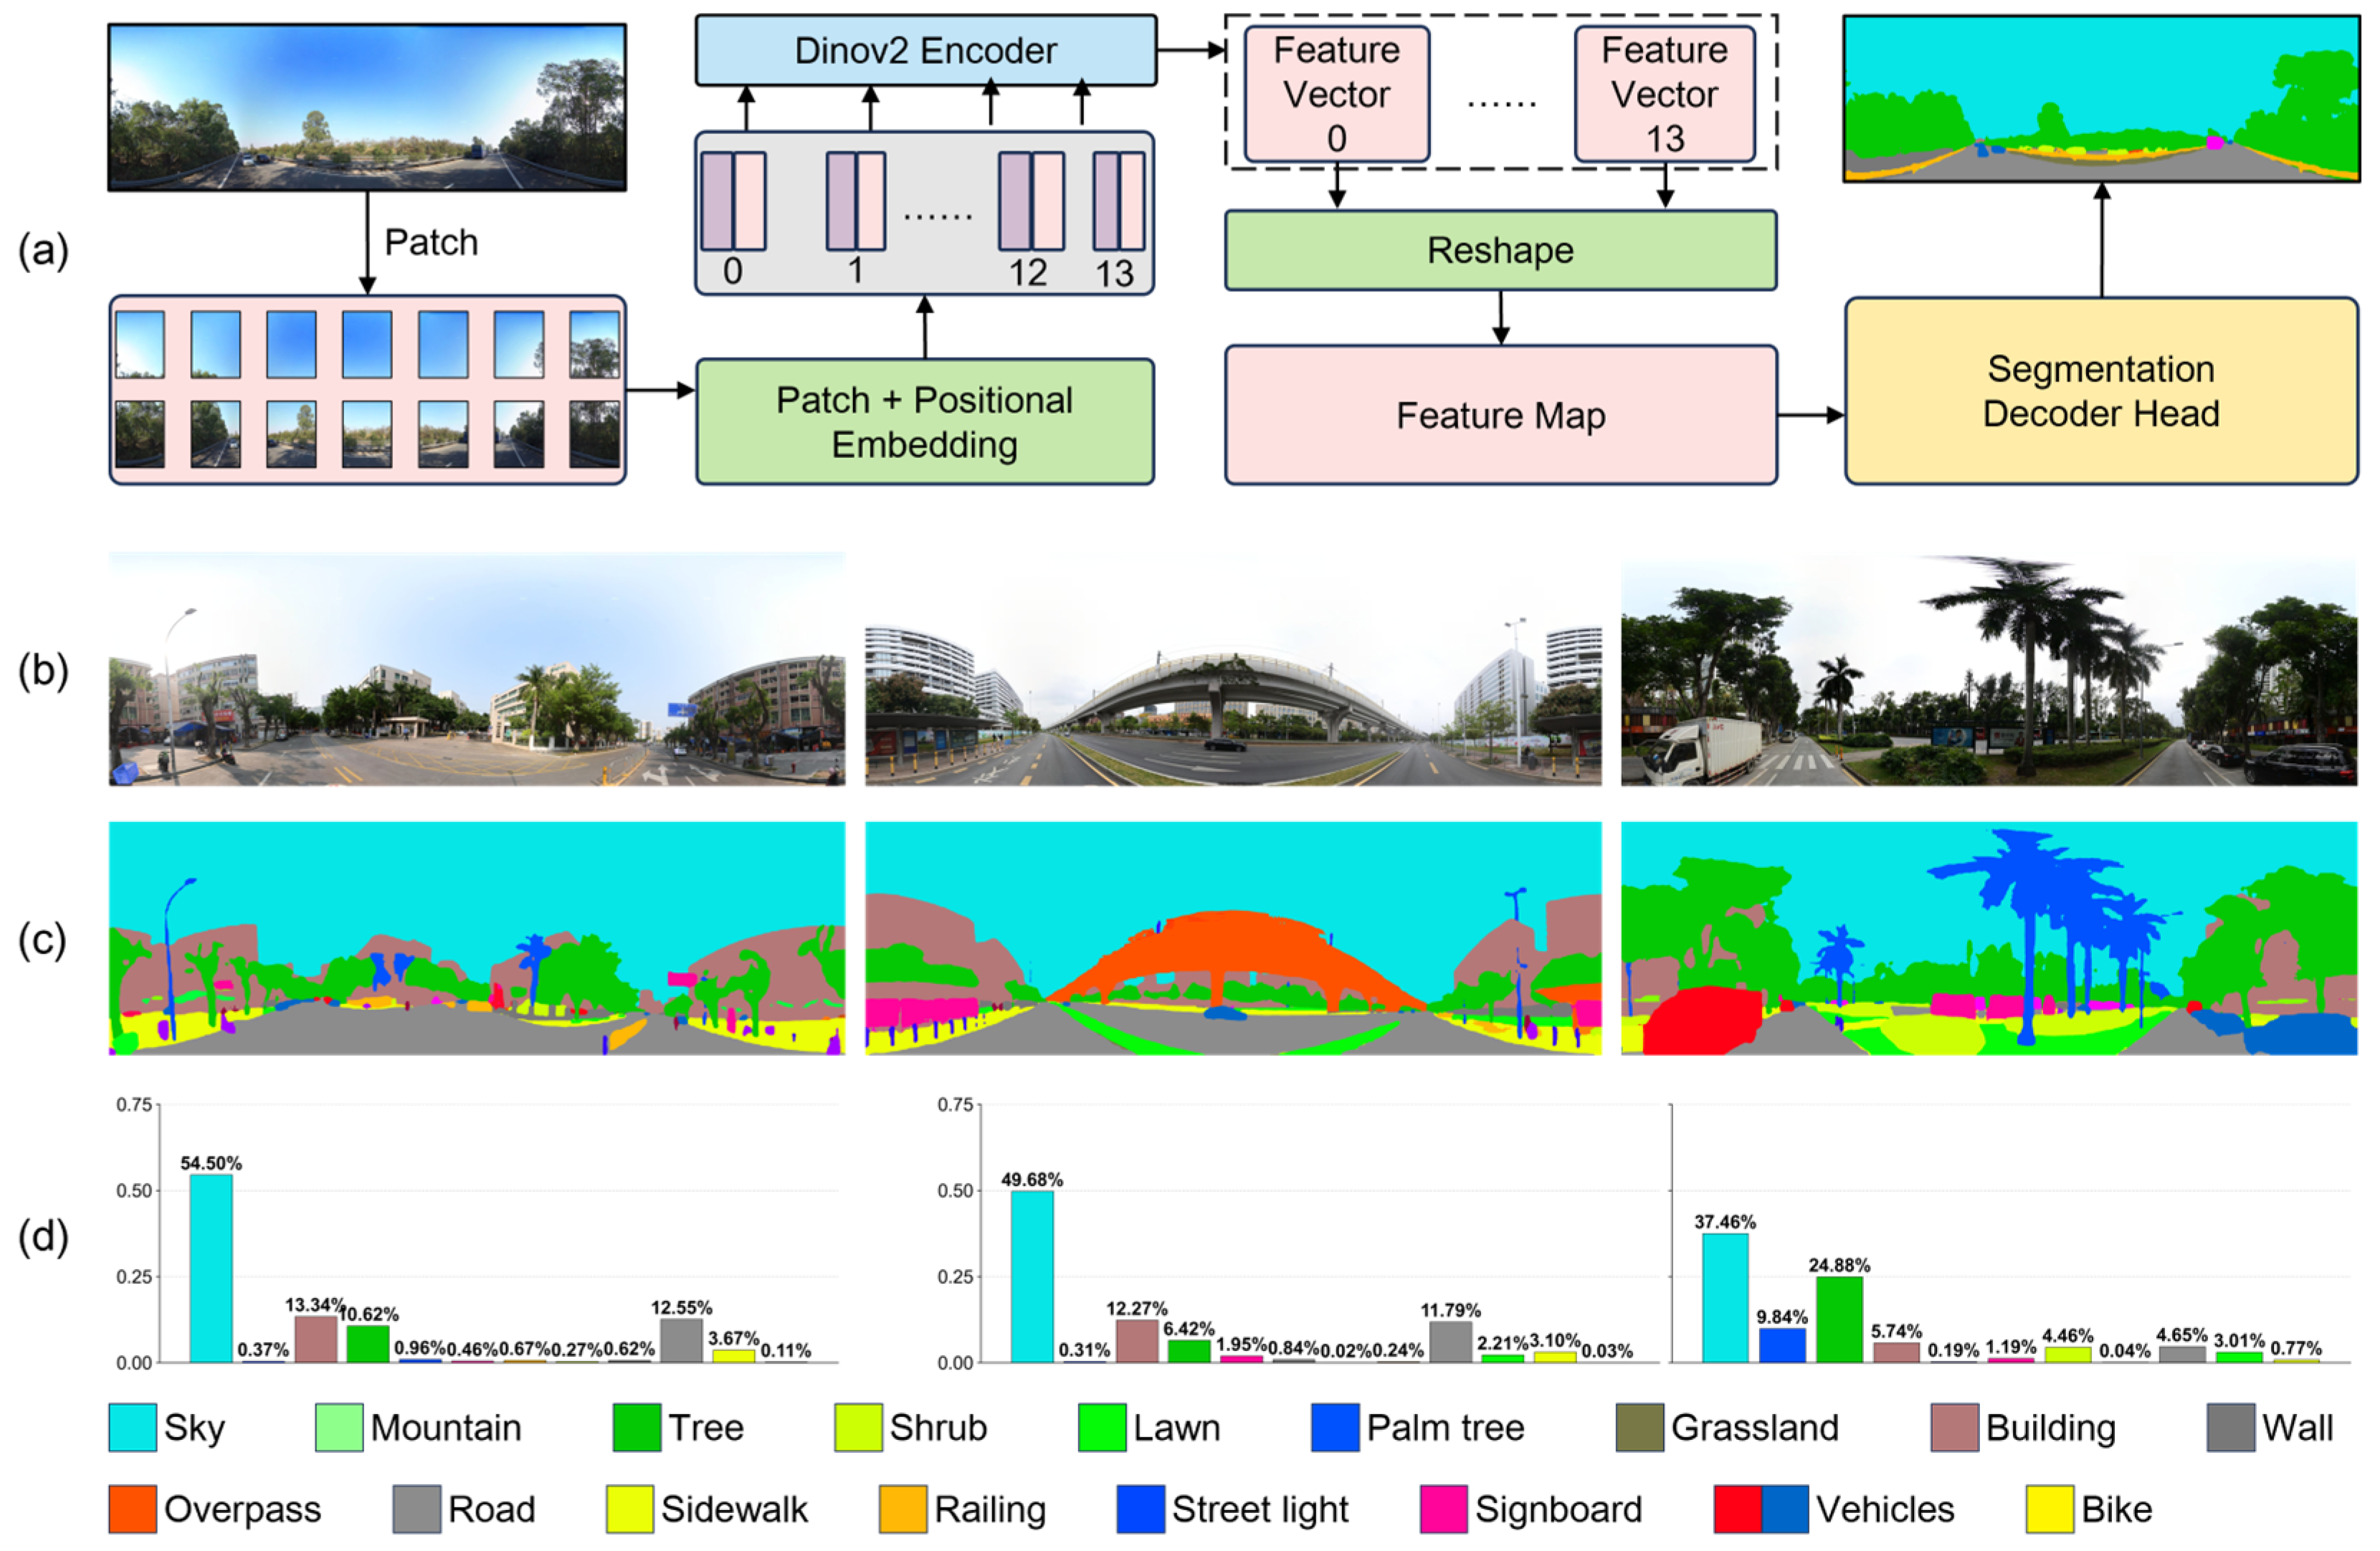
To achieve accurate detection of landscape element composition within SVIs and precise identification of green landscapes, the ViT-g/14 model with 1100M parameters from DINOv2 was adopted as the backbone model, utilizing weights pre-trained on the ADE20K dataset to segment the SVI, as shown in Figure 4. Compared to traditional methods, DINOv2 significantly reduced the reliance on manual annotation while also decreasing computational power requirements and time costs, providing strong support for efficient and accurate semantic segmentation.
Figure 4.
Example of semantic segmentation and landscape elements statistics. (a) Overview of the Dinov2-based semantic segmentation pipeline. (b) Baidu SVIs. (c) Segment maps generated by Dinov2 model. (d) Landscape elements statistical charts.
3.5.3. Spatial Morphology
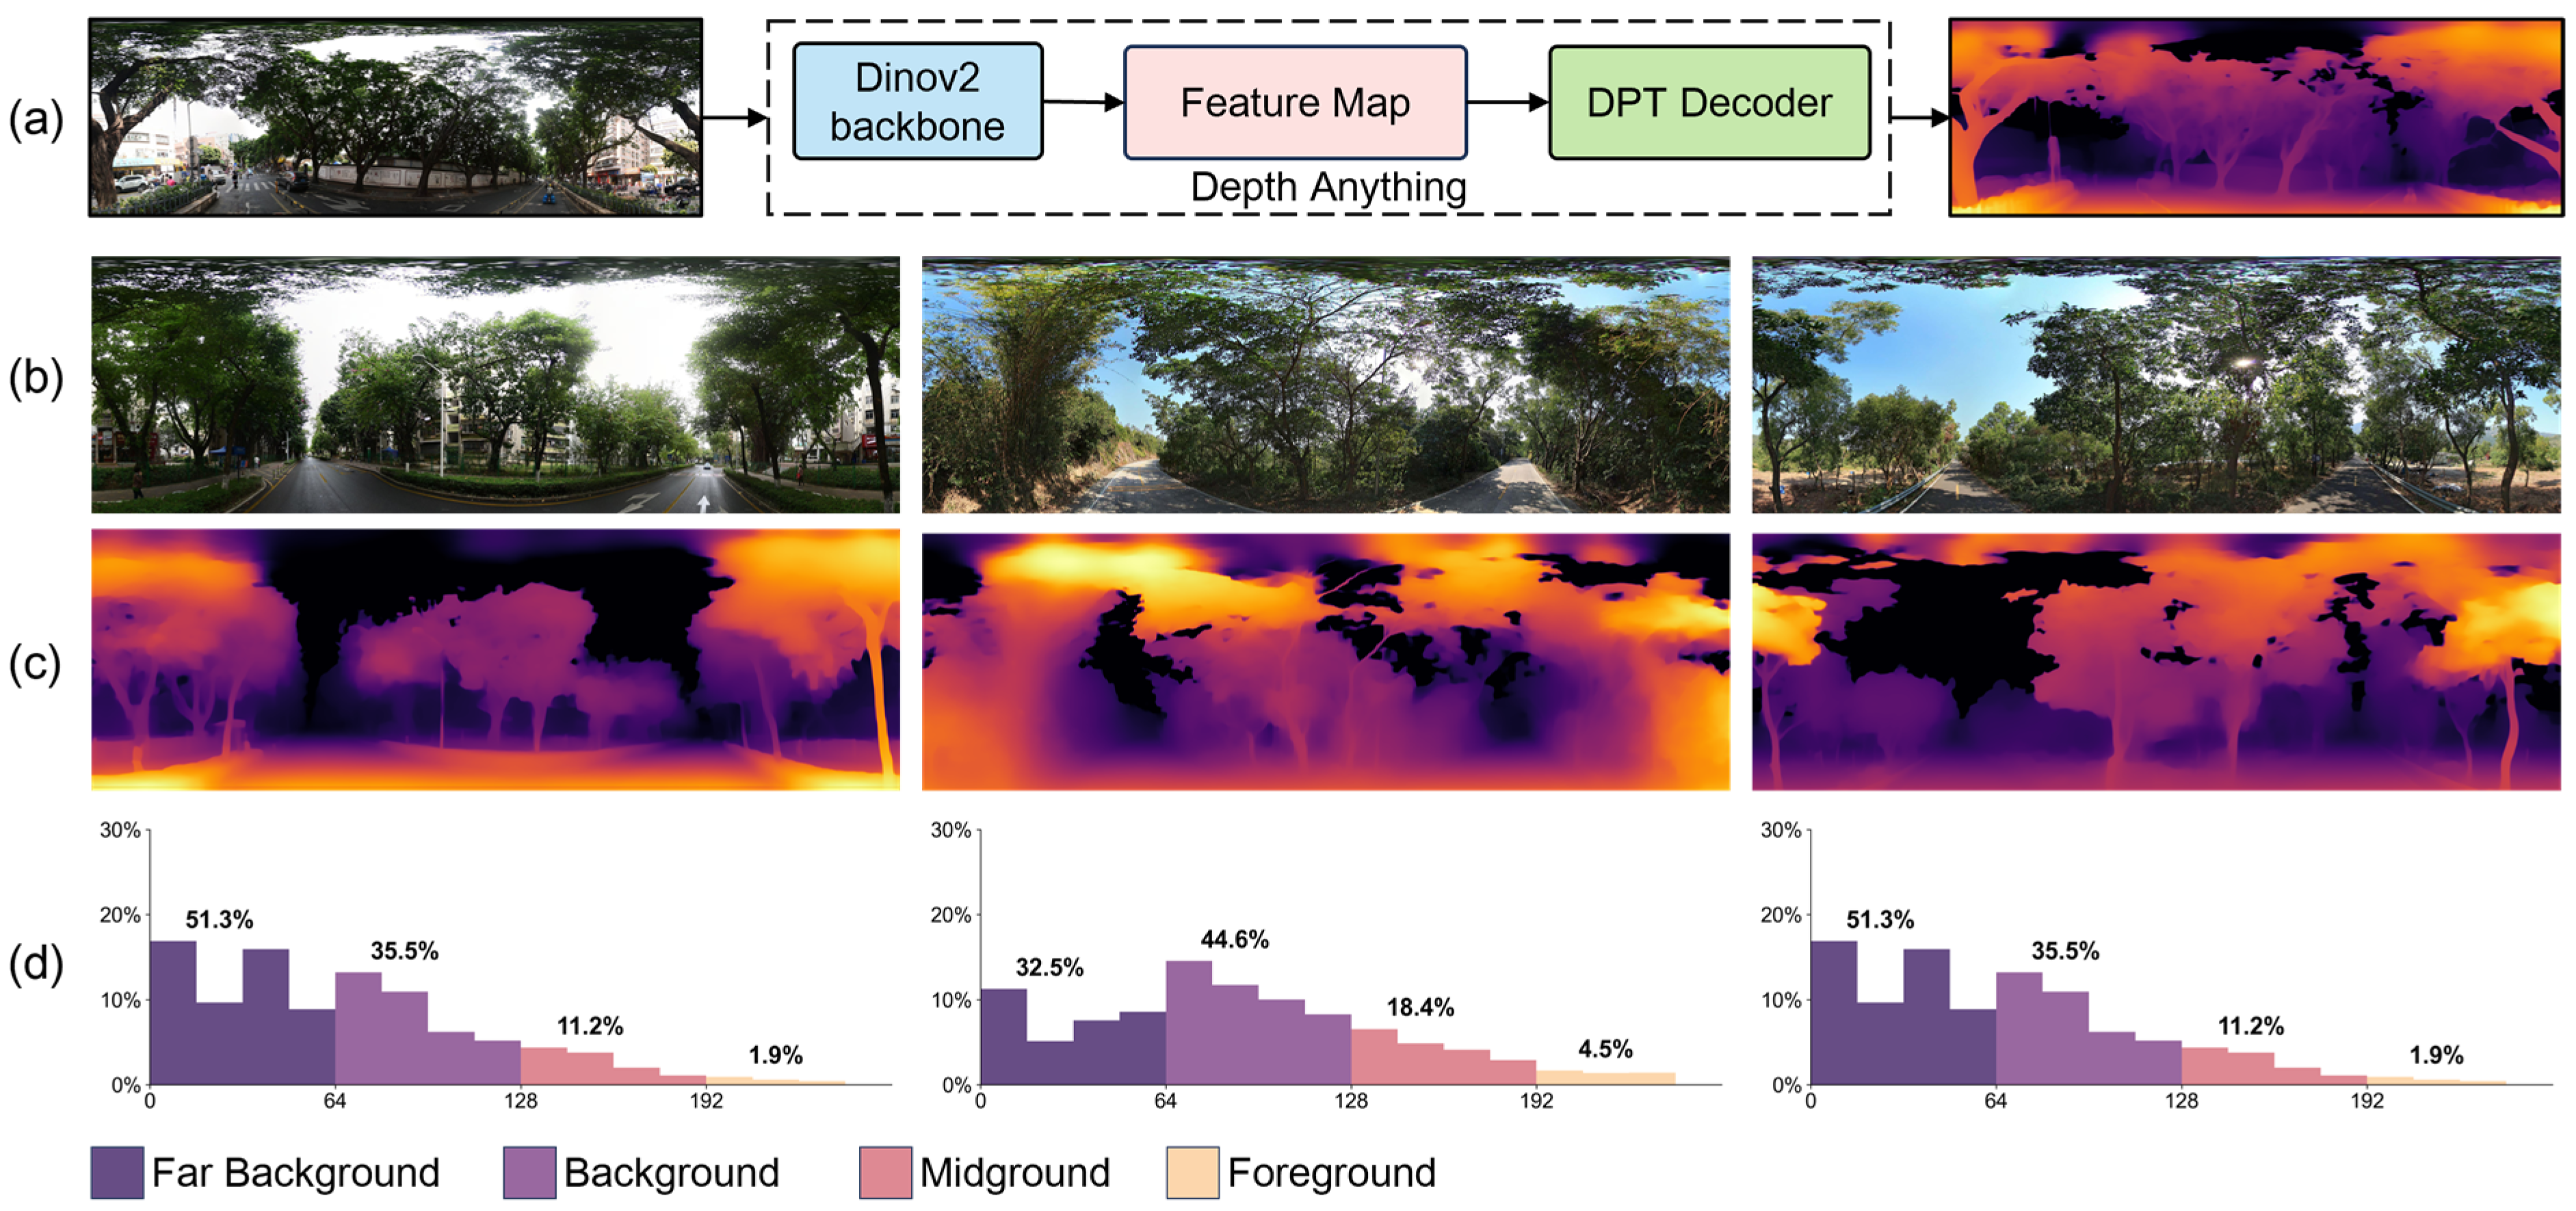
In the assessment of green perception, incorporating spatial depth and morphology information more realistically reflects the human experience of the urban built environment. Within the established indicator system, spatial morphology includes 6 indicators: the proportion of landscape at varying distances—foreground, middle ground, background, and far background—as well as avg and Std of depth. These indicators comprehensively describe the distribution characteristics and variations of green landscapes in the spatial dimension. The proportions of 4 spatial types can be represented as:
in which PFG, PMG, PBG, and PFBG represent the percentages of points within the image I that are classified into 4 categories: foreground, midground, background, and far background based on depth values di. The indicator function 1condition(di) equals 1 if the condition is met and 0 otherwise, with N representing the total number of pixels in the image I.
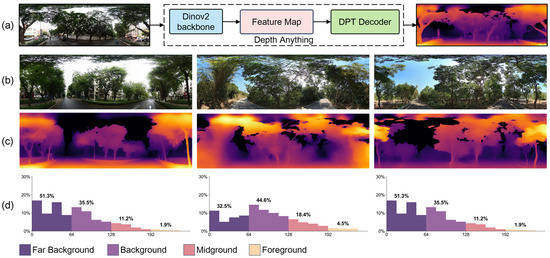
This study employed the Depth Anything model for depth prediction of the landscape scenes represented by SVIs, enabling a quantitative analysis of green landscape spatial morphology. Depth Anything was jointly trained on 1.5 million high-quality labeled images and 62 million unlabeled images, enabling high-quality monocular depth prediction. Employing this LVM, high-fidelity depth prediction maps were generated for SVIs, where pixel grayscale values represent relative distances from the observer, as shown in Figure 5. These maps facilitated the analysis of the green landscape spatial distribution, providing a quantitative foundation for evaluating the influence of spatial morphology on green perception.
Figure 5.
Example of depth estimation and spatial morphology classification. (a) Overview of the Depth Anything-based depth predication pipeline. (b) Baidu SVIs. (c) Depth maps generated by Depth Anything model. (d) Depth value statistical charts.
3.6. Subjective Perception
To accurately quantify subjective perceptions, this study employed three machine learning algorithms—RF, SVM, and XGBoost—to model the non-linear relationship between objective and subjective perception metrics and subsequently construct predictive models for urban green perception. The dataset for model training and validation consisted of 1478 SVIs selected previously, along with the corresponding 30 objective perception indicators and 6 subjective perception indicators.
Given the inherent spatial autocorrelation in street view data, we replaced the simple random 80/20 split with a spatially blocked cross-validation strategy. The study area was divided into 5 * 5 km spatial blocks, which were then assigned to training or testing sets to ensure that proximate samples did not artificially inflate predictive performance. All objective indicators were standardized using Z-score normalization to handle varying units. For SVM, a Radial Basis Function kernel was utilized, with the penalty parameter and kernel coefficient optimized via Grid Search. For XGBoost, we tuned the learning rate (0.01), maximum depth (10), and subsample ratio (0.8) to prevent overfitting. The RF model was configured with 500 trees.
To investigate variations in green perception elicited by the two data collection methods (computer screen vs. MR) and to assess the performance of the three machine learning algorithms across six perception dimensions, 36 models were constructed and trained.
During the model training phase, Mean Squared Error (MSE) was selected as the loss function to quantify the deviation between model predictions and true labels. Furthermore, to comprehensively evaluate model performance, A 5-fold cross-validation was employed to assess model stability, with uncertainty estimates derived from the standard deviation of performance metrics (RMSE, MAE, and R2) across folds. These metrics were used to measure the error between predicted and actual values and the model’s goodness of fit from multiple dimensions, ensuring the reliability and scientific validity of the results.
4. Results
4.1. Validation of the Framework: Methodological Superiority of Mixed Reality
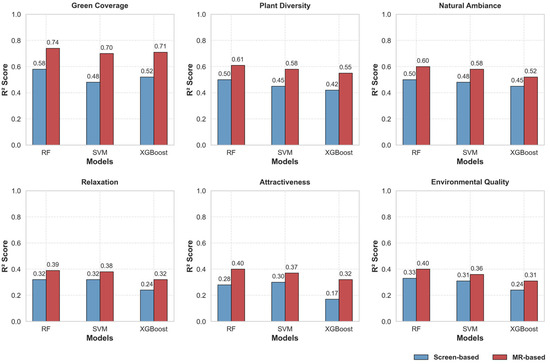
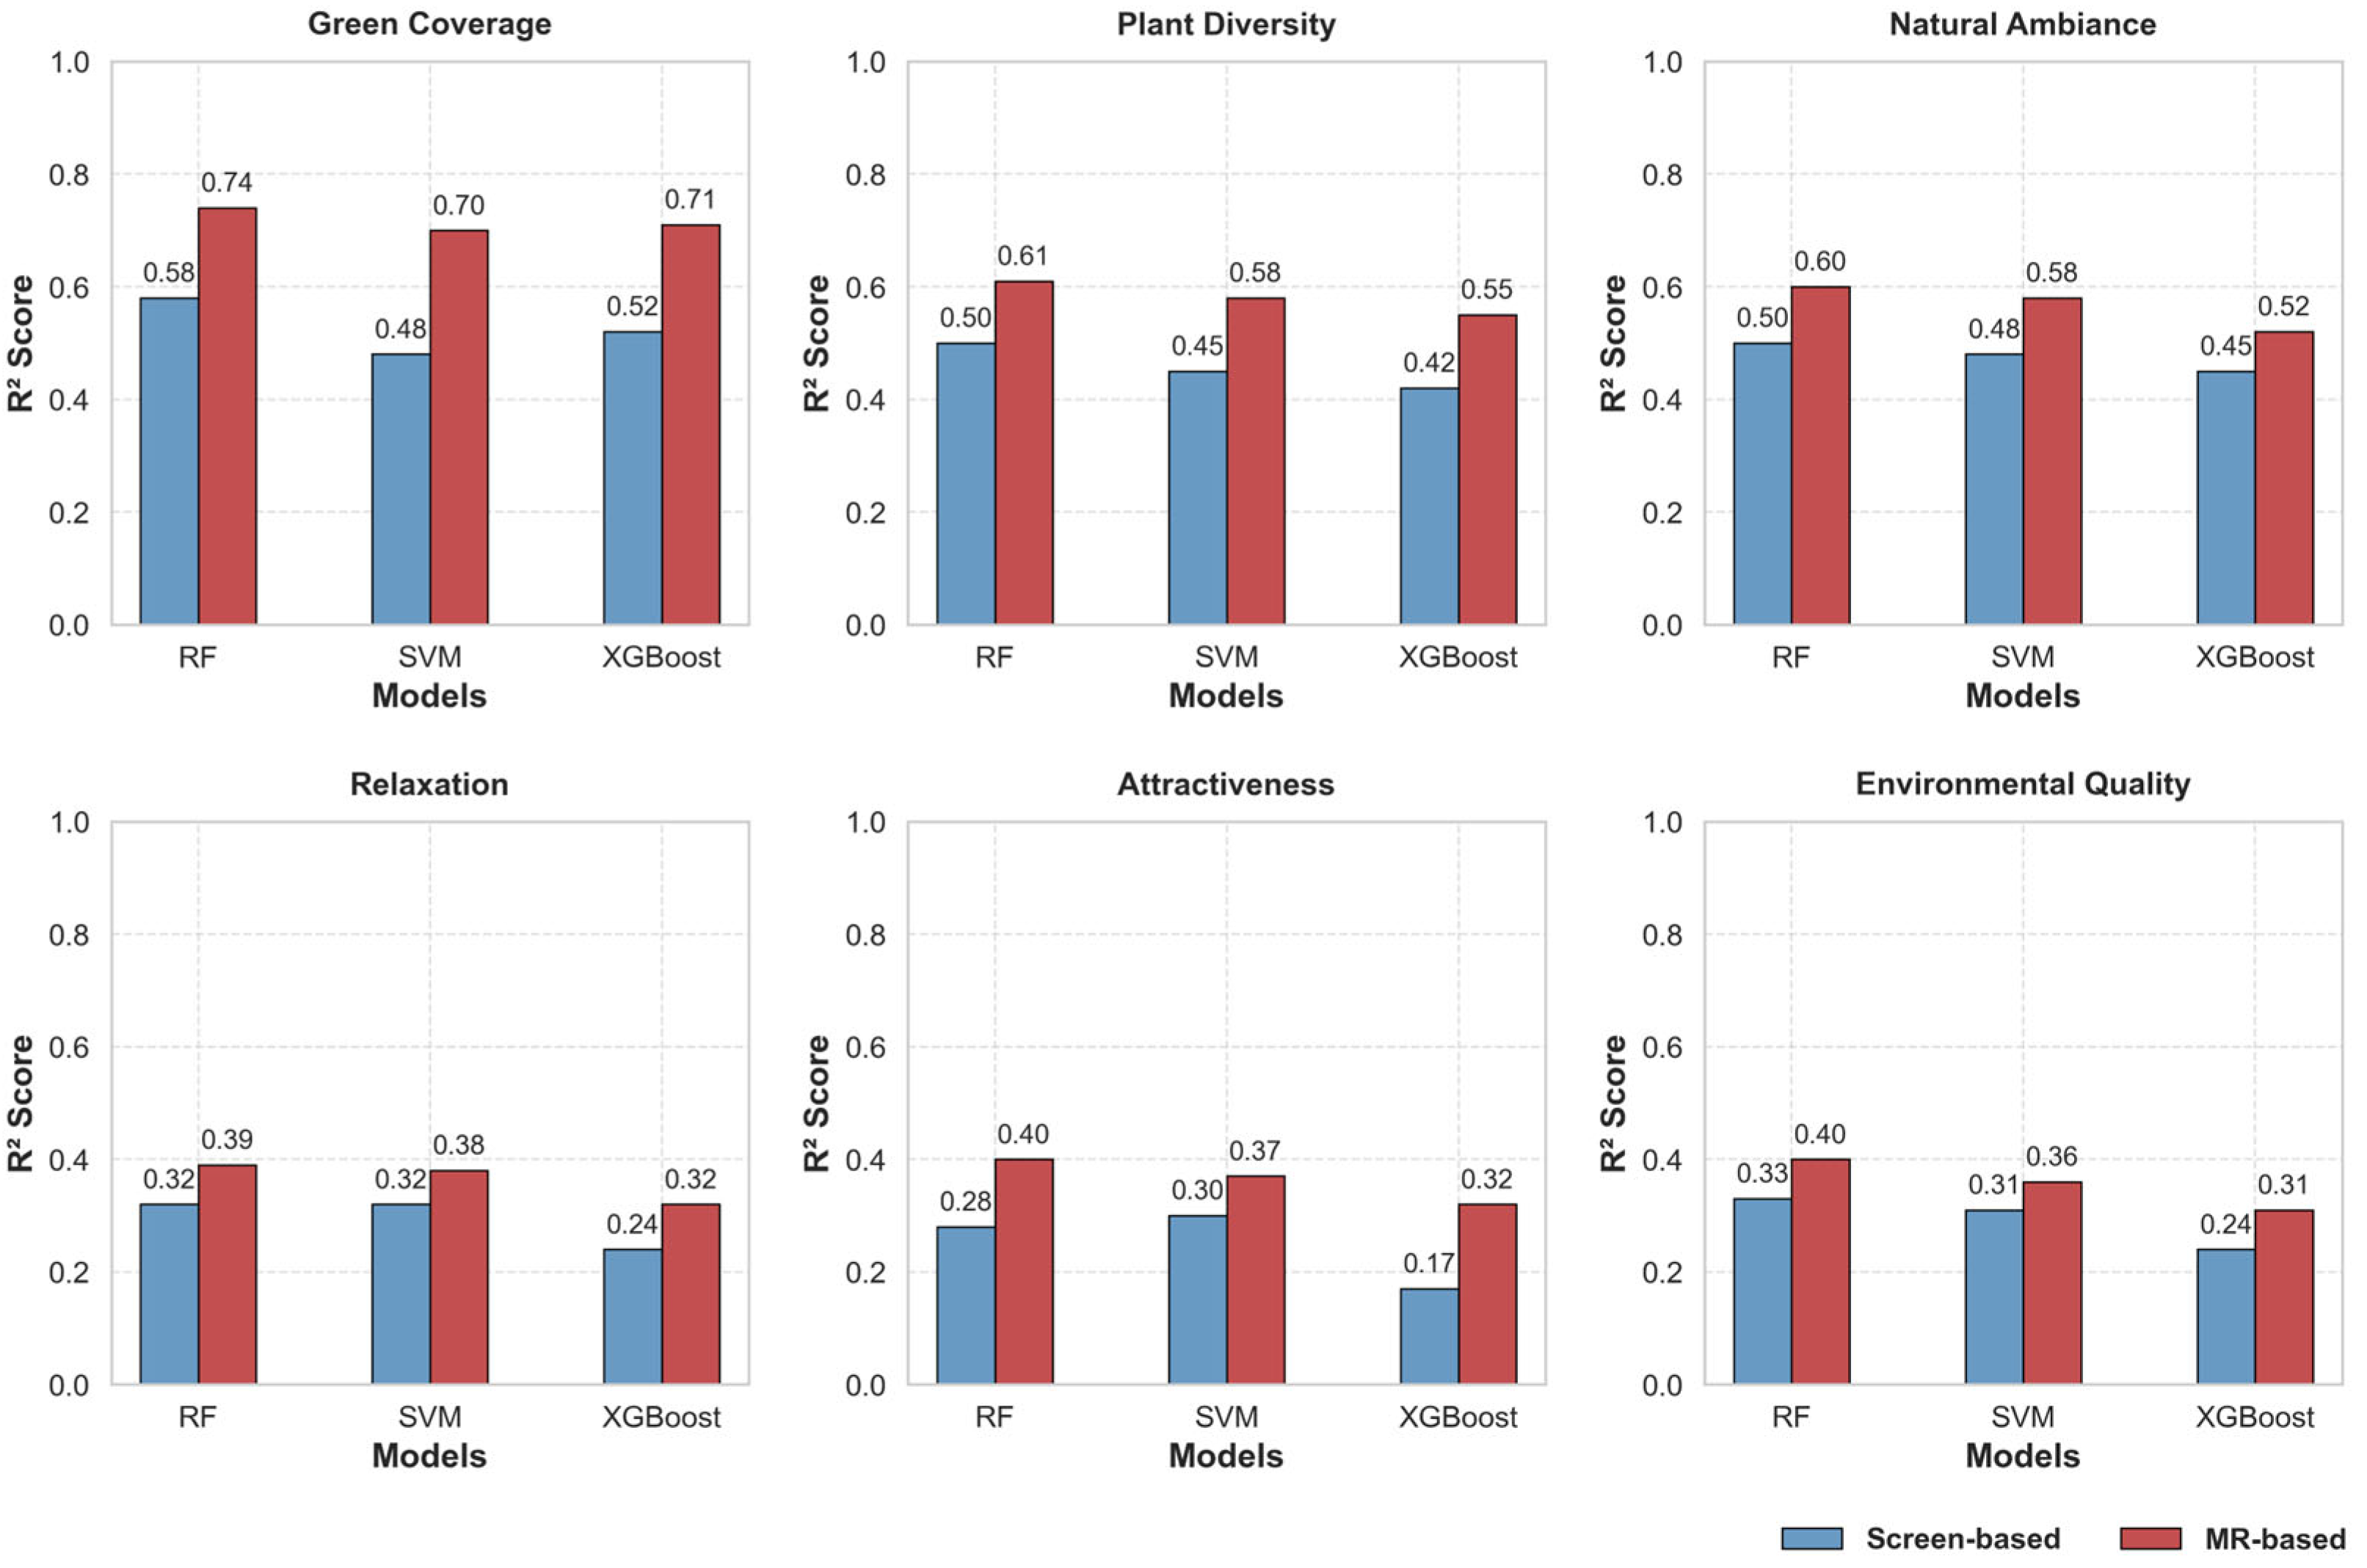
To empirically validate the proposed assessment framework, this study tested the hypothesis that data via MR yields predictive models superior to those based on conventional screen-based data. To this end, RF, SVM, and XGBoost models were trained to predict six subjective perception indicators using datasets from both conditions. A total of 36 models were trained. Table 5 and Figure 6 detail the experimental results, including RMSE, MAE, and R2. Overall, the models exhibited robust predictive performance for the majority of perception indicators. Furthermore, a systematic and significant performance gap was observed across all six subjective perception indicators and all three algorithms, with MR-based models consistently outperforming their screen-based counterparts. This is evidenced by their consistently higher R2 values and lower RMSE and MAE.
Table 5.
Results of green perception models.
Figure 6.
Performance evaluation chart of green perception models.
The advantage of the MR-based approach was substantial across all indicators. For instance, in the Green Coverage prediction, the R2 value for the best-performing RF model increased from 0.58 (screen-based) to 0.74 (MR-based). Notably, this performance improvement was even more pronounced for the more psychologically nuanced indicators, which are notoriously difficult to model. For Relaxation, the R2 value increased by nearly 25%, from 0.32 (screen-based) to 0.39 (MR-based), with a similar jump observed for Attractiveness, from 0.30 (screen-based) to 0.40 (MR-based). This performance discrepancy indicates that subjective ratings collected in the MR environment exhibit a stronger correlation with objective environmental features than those collected via screens. The higher values suggest that the immersive interface may elicit more consistent perceptual responses that are better captured by the objective indicators, thereby reducing the unexplained variance such as noise often present in screen-based evaluations.
Among the algorithms tested, the RF model consistently yielded the highest predictive accuracy across both experimental conditions. For example, in the MR-based task, RF’s R2 values ranged from 0.39 to 0.74, while SVM and XGBoost showed lower values ranged from 0.31 to 0.71. The result indicates its superior capacity for handling the complex, non-linear relationships inherent in perceptual data.
In conclusion, these findings provide compelling empirical evidence that the MR-based data acquisition approach yields training data that is more robustly predictable by machine learning algorithms within this framework. Based on its superior performance, the MR-trained Random Forest (MR-RF) model was selected as the validated scientific instrument for the large-scale green perception assessment presented in the subsequent section.
4.2. Application of the Framework: Large-Scale Green Perception Assessment
Following validation, the framework was deployed to conduct a comprehensive urban green perception assessment across 61,131 SVIs in Shenzhen. This application utilized the framework’s two primary components: a suite of objective perception indicators quantified using LVMs, and a set of subjective perception indicators predicted by the validated MR-RF model. This integrated analytical framework aims to provide a robust, evidence-based foundation for the development of optimized strategies and informed planning decisions pertaining to Shenzhen’s urban green spaces.
4.2.1. Objective Perception
The objective assessment of the urban environment was conducted across three dimensions:
(1) Color Features
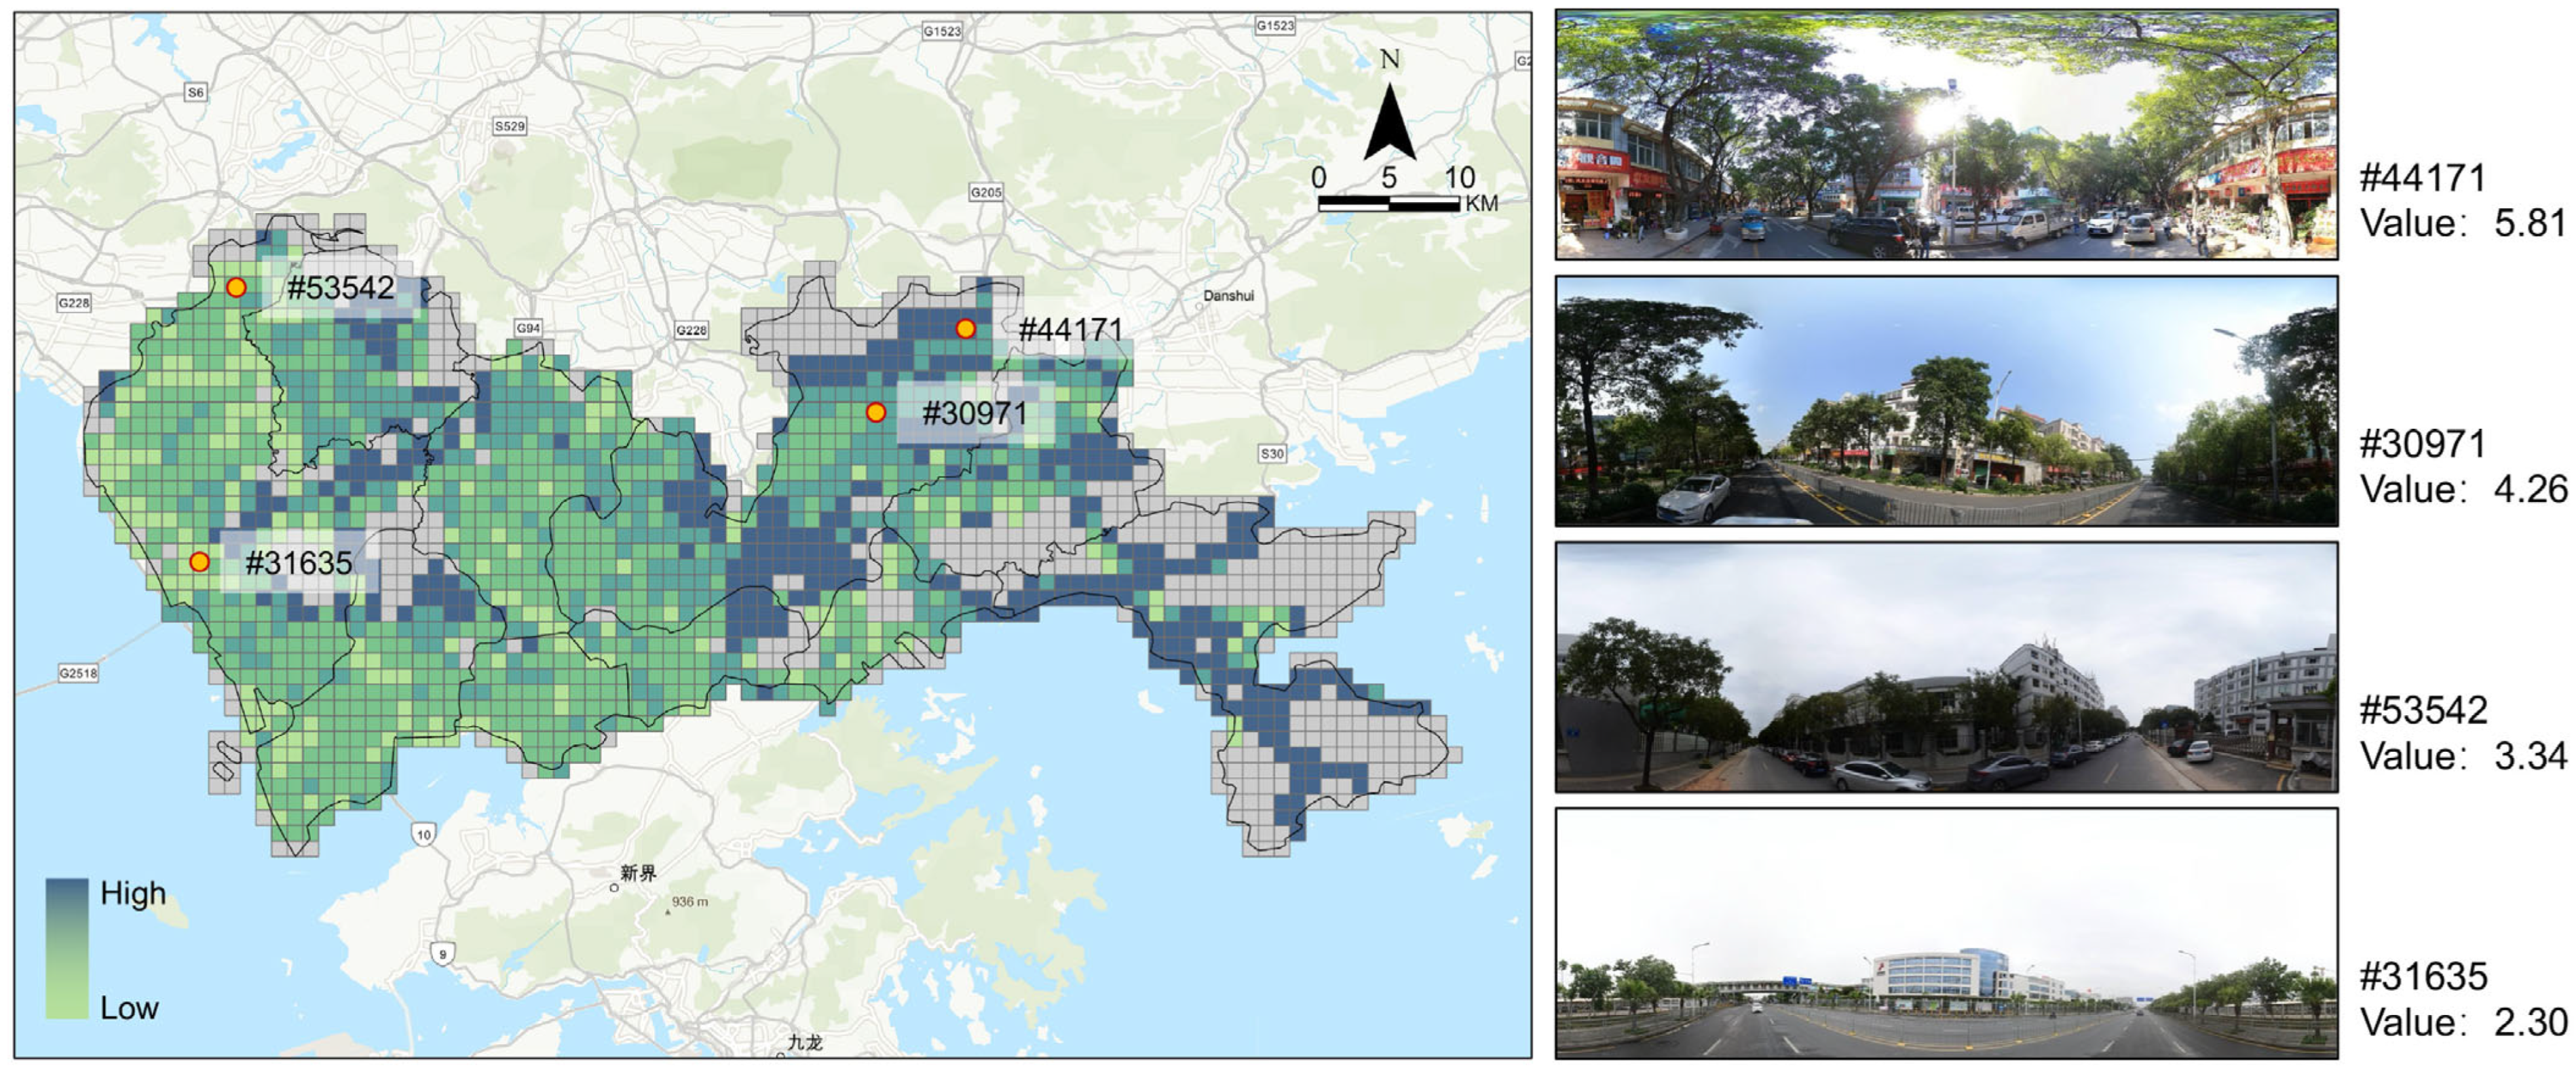
Analysis of color features revealed a landscape characterized by high brightness (Mean = 171.29) and moderate contrast (Mean = 79.32). The overall color saturation was relatively low (Mean = 57.62), while a high number of colors (Mean = 203,680) and complexity (Mean = 4.04) indicated significant visual diversity across the green landscape, as shown in Table 6. The spatial distribution of this color complexity is visualized in Figure 7.
Table 6.
Results of color features perception.
Figure 7.
Spatial distribution map of color complex perception. The left heatmap illustrates the grid-based distribution of color complexity across the study area. The right panels provide representative street-level panoramic images for selected sample points. Grey grids indicate regions with no available data.
(2) Landscape Elements
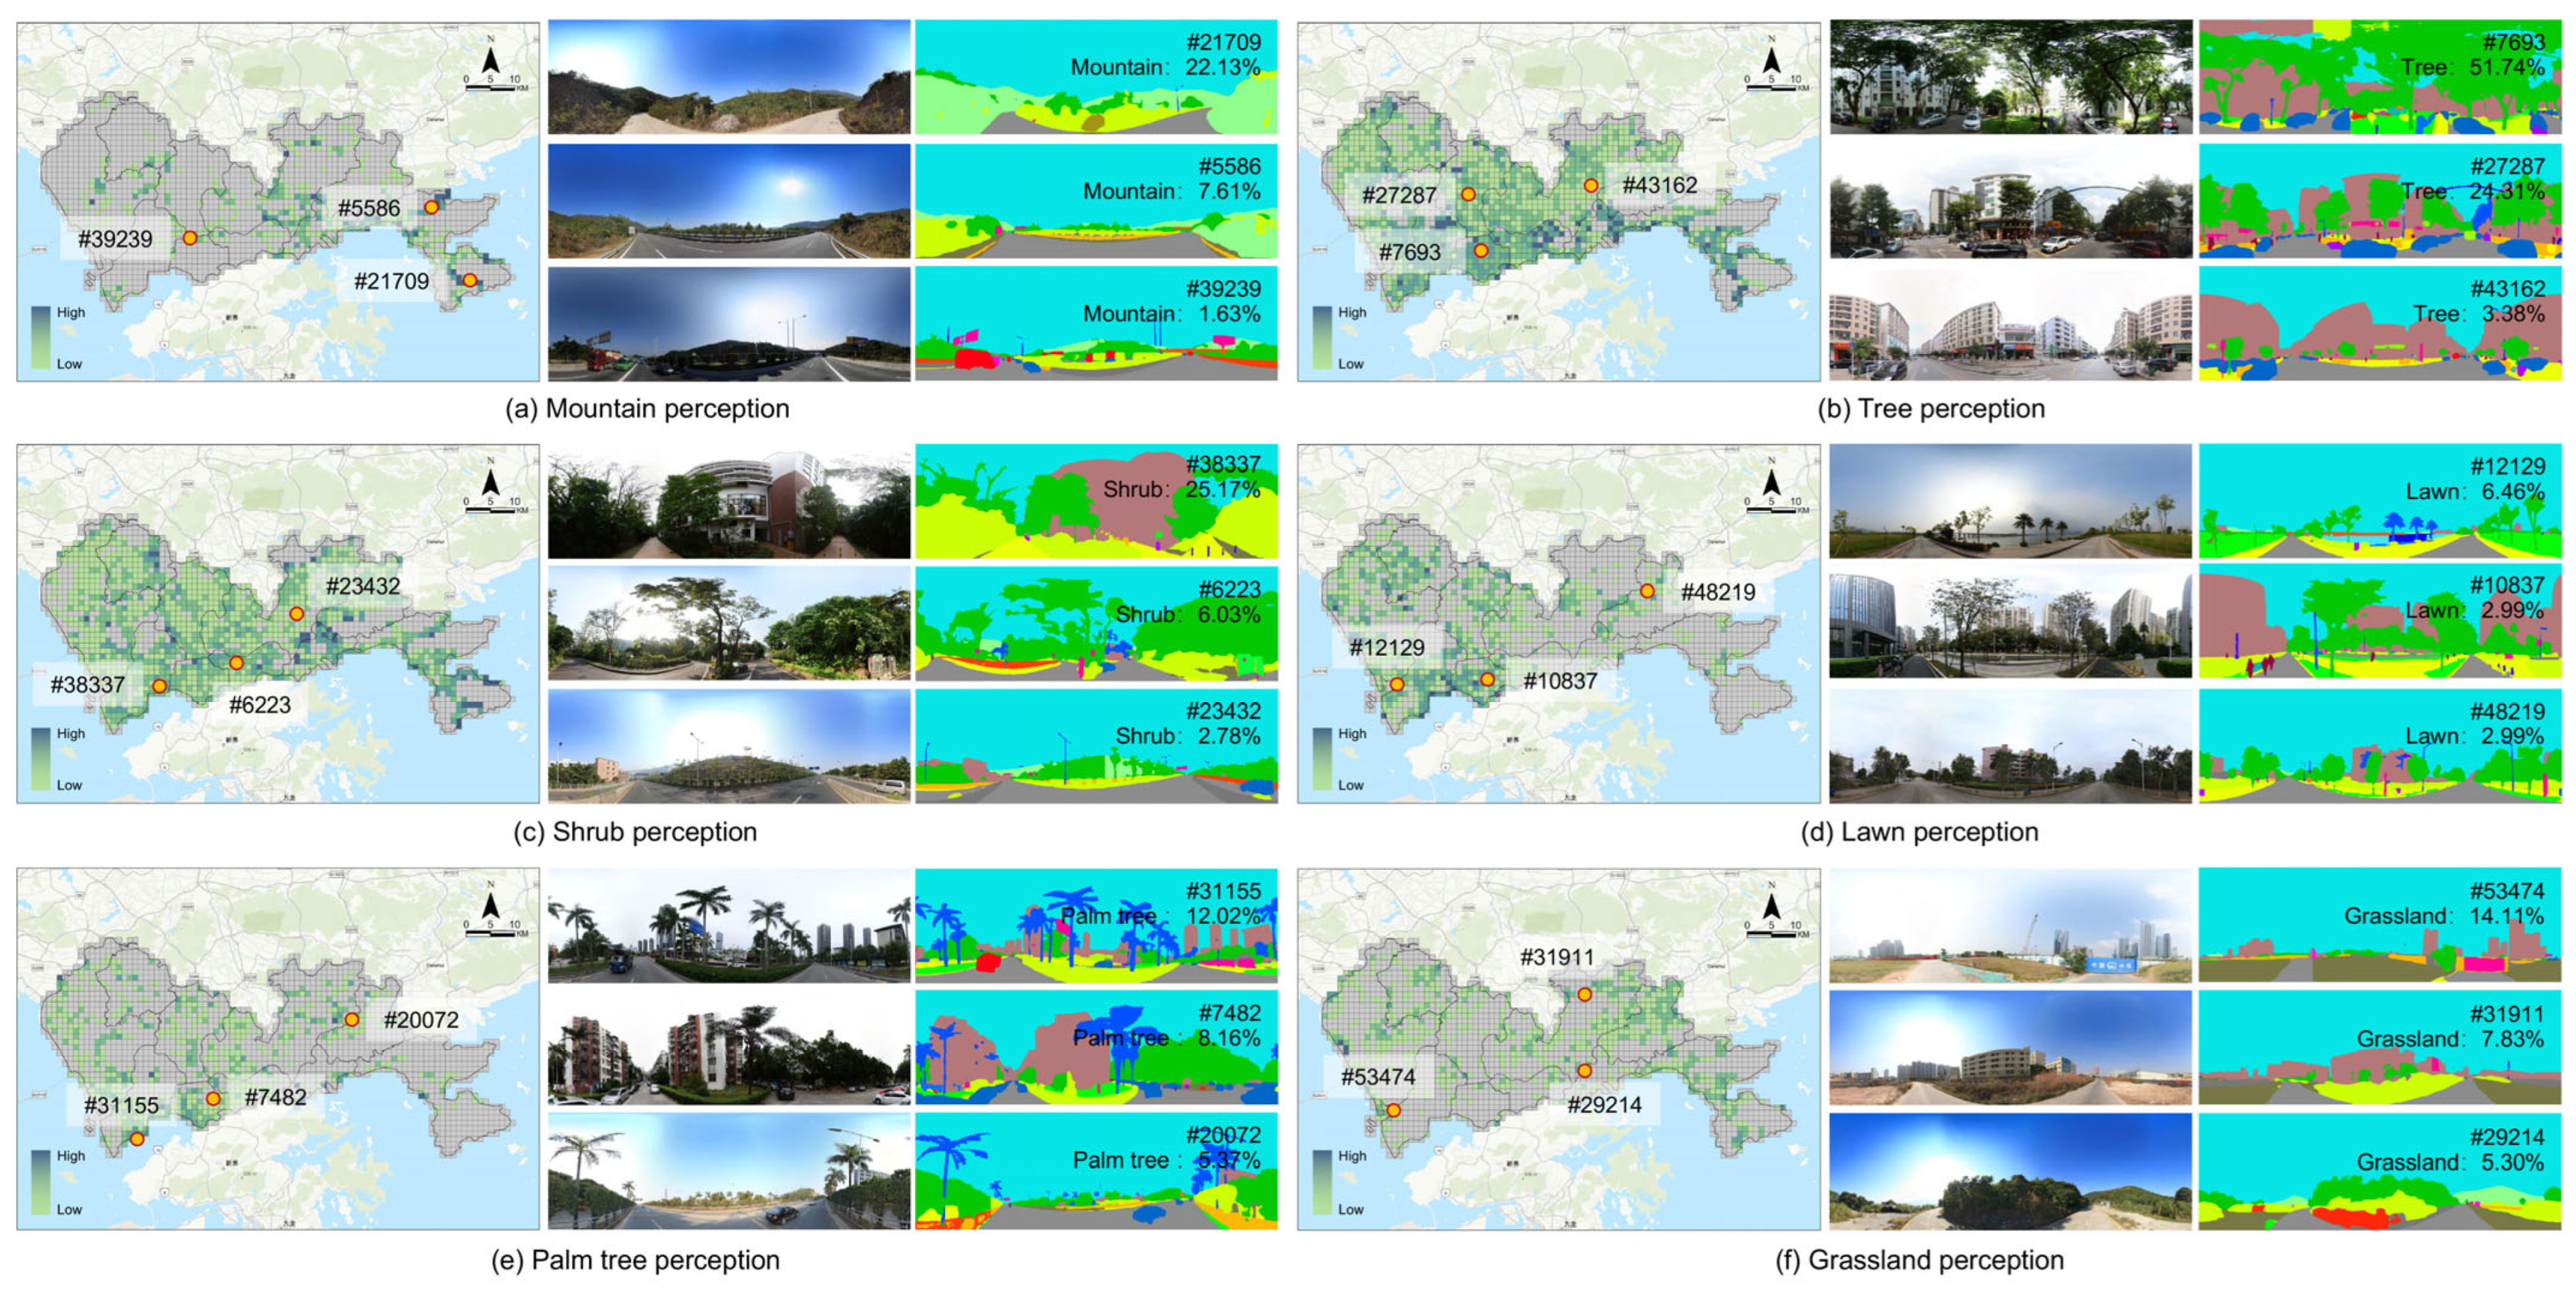
The DINOv2 model was employed to perform semantic segmentation on SVI, quantifying 19 landscape elements indicators, detailed in Table 7. The result identified tree (98.47% frequency), shrub (92.80%), lawn (62.55%) and grassland (61.46%) as core elements of the green landscape. On average, green landscape elements constituted 18.99% of the SVI area, with a mean of 3.86 different green element types per image, highlighting a multi-layered green system in Shenzhen. The spatial distribution of green landscape elements is shown in Figure 8.
Table 7.
Results of landscape elements perception.
Figure 8.
Spatial distribution map of green landscape elements perception. The grid-based heatmaps illustrate the spatial distribution of six specific landscape elements across the study area: (a) Mountain, (b) Tree, (c) Shrub, (d) Lawn, (e) Palm tree, and (f) Grassland. For each element, representative street-level panoramic images and their corresponding semantic segmentation results are provided on the right to validate the perception values. The red dot indicates a randomly selected sample location for the illustrative example. Grey grids indicate regions with no available data.
(3) Spatial Morphology
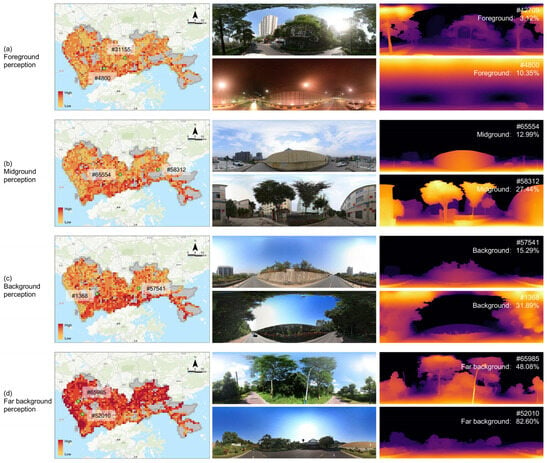
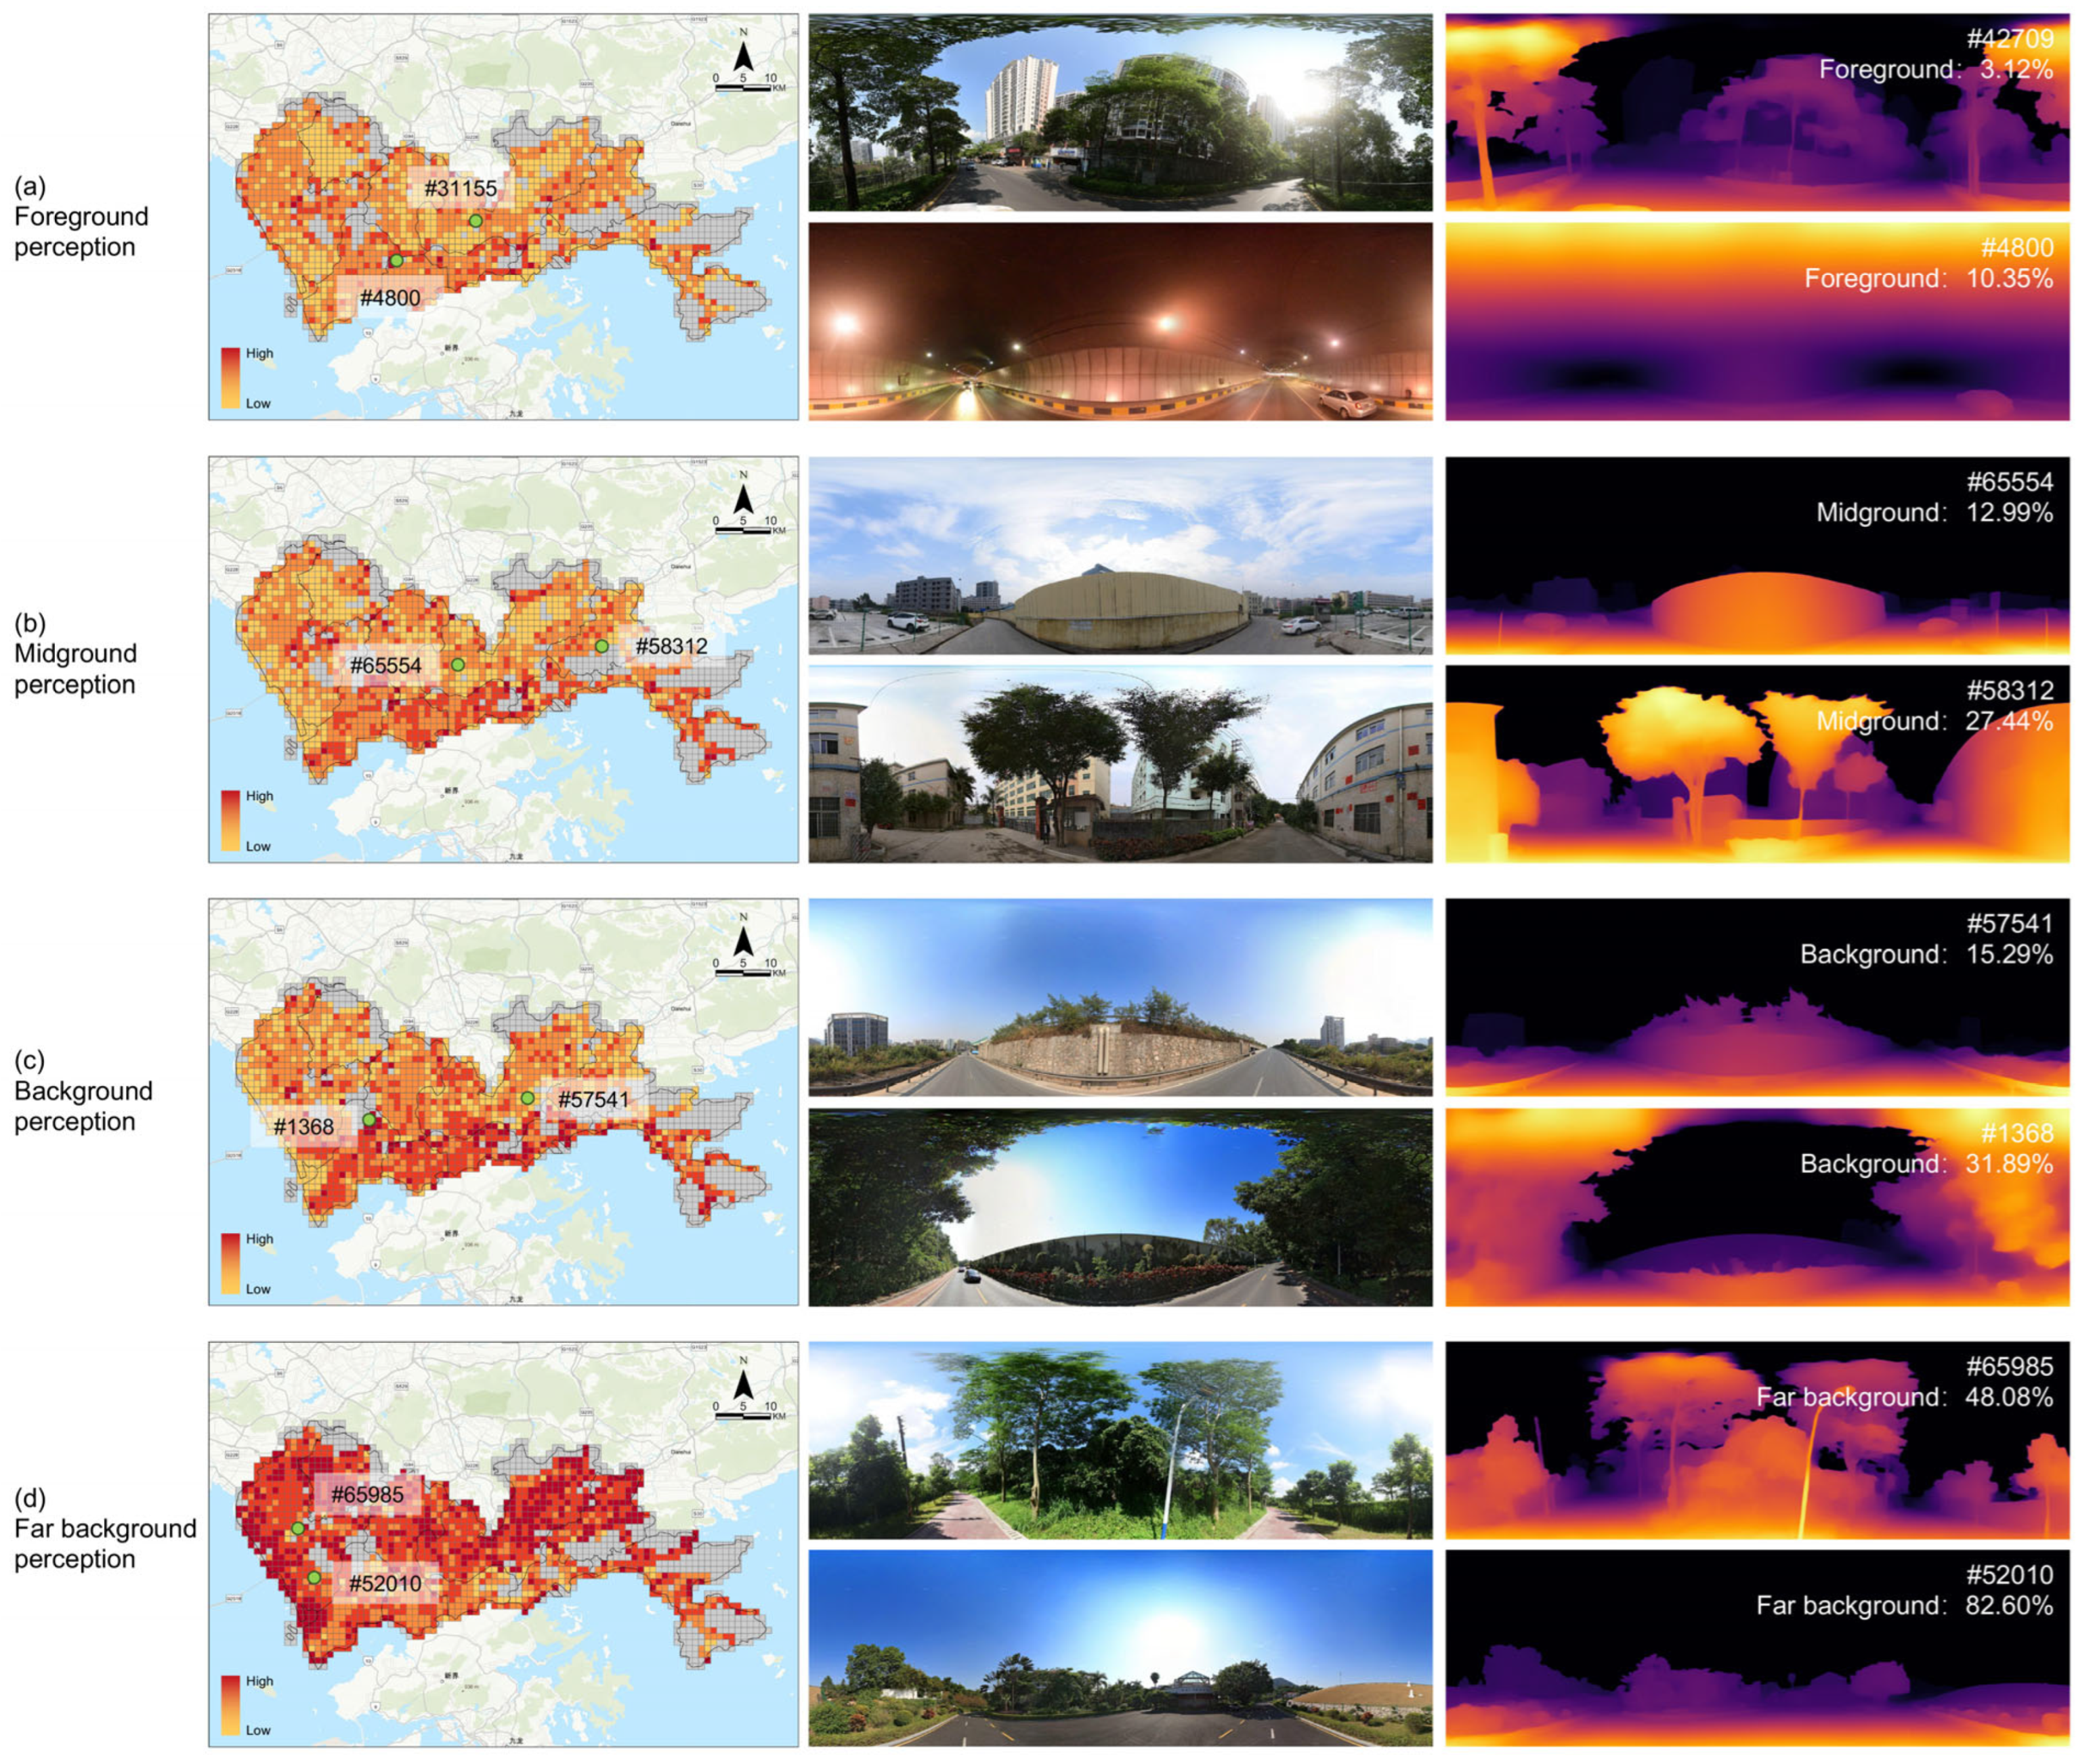
The Depth Anything model was employed to perform depth estimation on SVIs, quantifying 6 spatial morphology indicators, detailed in Table 8. The analysis revealed significant heterogeneity in spatial depth, evidenced by a large average of depth (Mean = 40.96) and a high Std of depth (Mean = 52.60). The breakdown of depth zones further detailed a distinct spatial pattern: the foreground was minimal (Mean = 2.21%), followed by a modest midground (Mean = 7.84%) and background (Mean = 17.39%). The visual field was dominated by the far background, which constituted an average of 72.57% of the SVI area. The spatial distribution of spatial morphology is shown in Figure 9.
Table 8.
Results of spatial morphology.
Figure 9.
Spatial distribution map of spatial morphology perception. The grid-based heatmaps illustrate the spatial distribution of four specific Spatial Morphology across the study area: (a) Foreground, (b) Midground, (c) Background, and (d) Far background. For each morphology, representative street-level panoramic images and their corresponding depth estimation results are provided on the right to validate the perception values. The green dot indicates a randomly selected sample location for the illustrative example. Grey grids indicate regions with no available data.
4.2.2. Subjective Perception
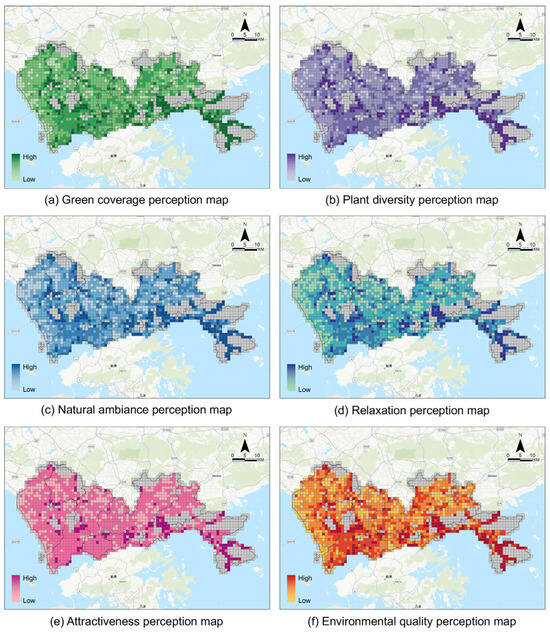
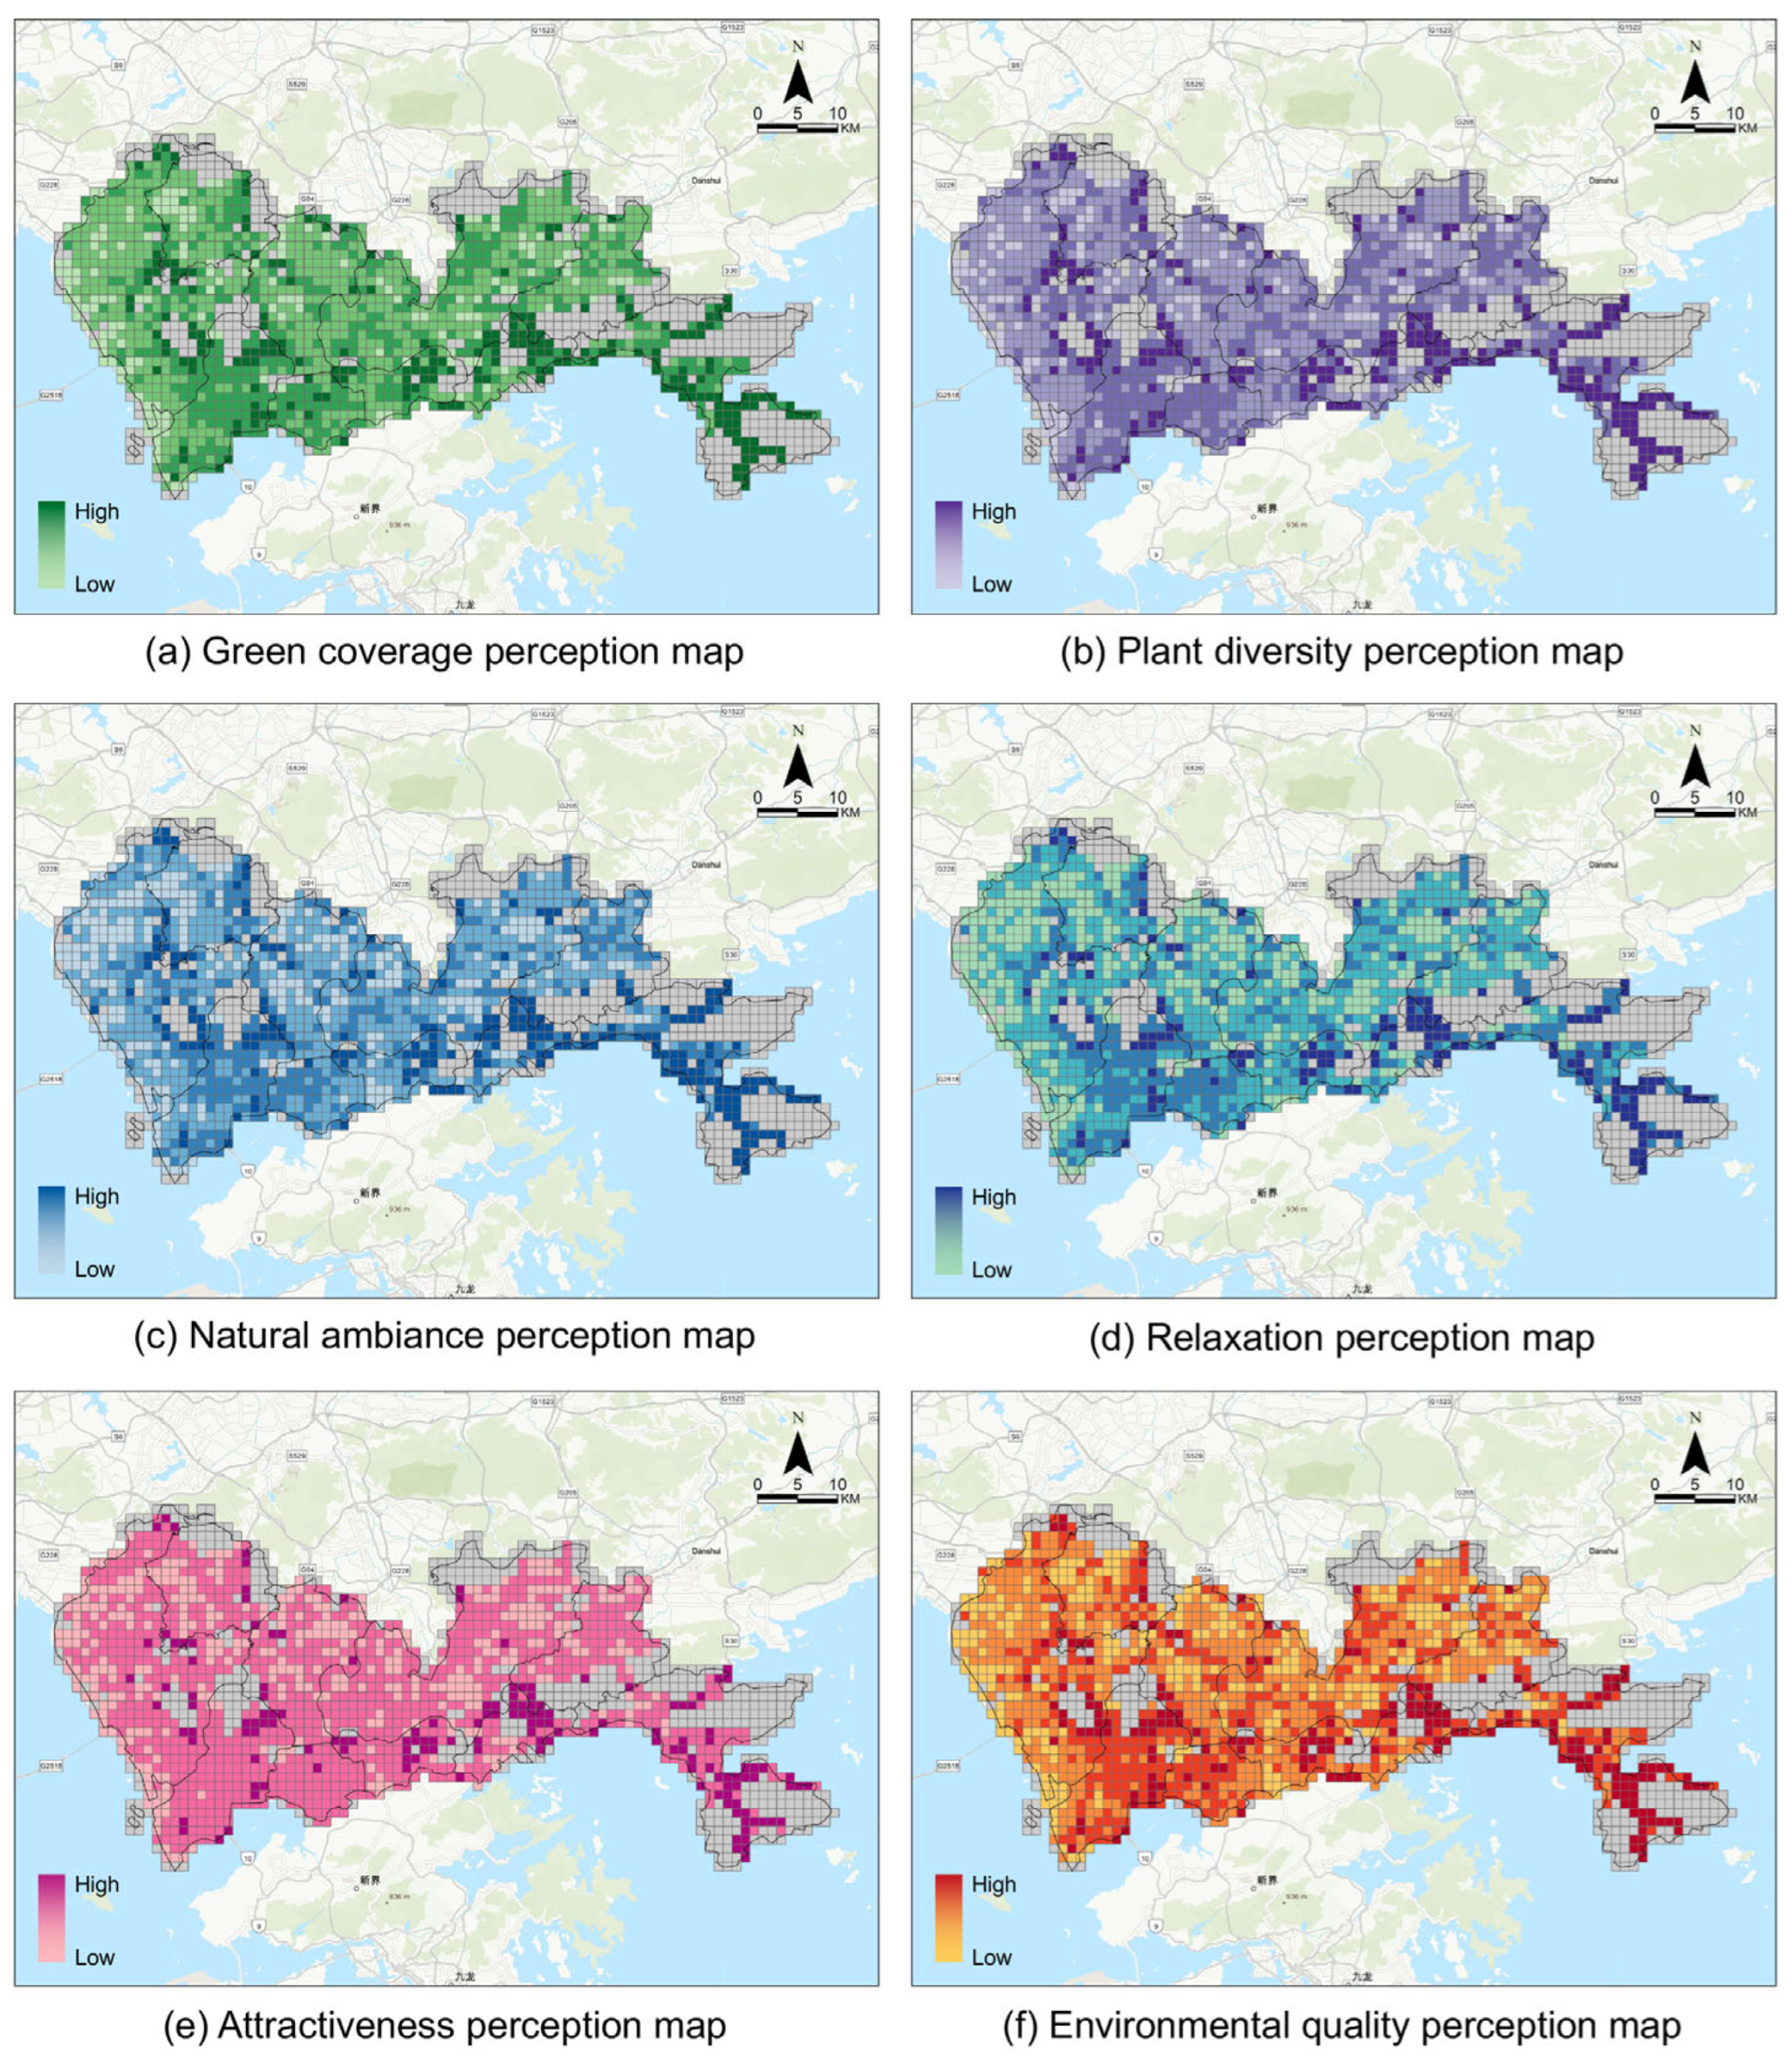
The validated MR-RF model was deployed to quantify the subjective perception dimension of the assessment framework, predicting six indicators for each SVI across Shenzhen. The city-wide prediction results are summarized in Table 9. The results reveal several key findings. First, the predicted scores for all indicators spanned nearly the entire 1-to-5 scale, demonstrating the model’s ability to capture a wide dynamic range of human perception from very low to very high. Second, the mean scores across all indicators fell within a moderate range of 2.51 to 3.00, with Green Coverage (Mean = 3.00) scoring the highest and Attractiveness (Mean = 2.51) the lowest. Third, the large standard deviations (ranging from 0.73 to 1.01) indicate substantial variability in perceptual quality across the city. Green Coverage exhibits the highest heterogeneity (SD = 1.01), underscoring the vast differences in perceived greenness across Shenzhen’s streetscapes.
Table 9.
The prediction results of subjective perception.
4.2.3. Spatial Pattern
To illustrate the framework’s practical utility for urban planning and environmental management, the predicted subjective perceptions were mapped, revealing significant spatial heterogeneity in the perceptual landscape, as shown in Figure 10. Dapeng New District exhibited the highest perception levels, consistent with its abundant mountain and marine resources and natural landscape endowments. Nanshan, Futian, Luohu, and Yantian Districts generally have high green perception levels. Among these, Nanshan and Futian show relatively balanced overall levels and a more uniform spatial distribution. Luohu and Yantian, however, exhibit stronger spatial heterogeneity, featuring both areas with high perception values and distinct zones with low perception. In contrast, Bao’an, Guangming, Longhua, Longgang, and Pingshan Districts generally display lower green perception levels.
Figure 10.
Spatial distribution map of subjective perceptions. Grey grids indicate regions with no available data.
High scores for Green Coverage, Plant Diversity, and Natural Ambiance were primarily concentrated near large ecological assets like urban parks, geoparks, and botanical gardens. The spatial distributions of Plant Diversity and Natural Ambiance were more restricted than that of Green Coverage, highlighting their dependence on high-quality, intentionally de-signed green spaces.
High scores for the more holistic perceptions of Relaxation, Attractiveness, and Environmental Quality were found in areas that combine diverse landscape elements with recreational functions, such as the OCT East resort, the Dasha River Ecological Corridor, and major urban parks. The distribution of high Environmental Quality closely follows urban ecological corridors, water bodies, and mountain resources, underscoring their critical role in shaping positive human experiences of the urban environment.
5. Discussion
This study establishes and validated a novel assessment framework integrating objective quantification using LVMs with high-ecological-validity subjective data acquisition through MR. This section first elaborates on the methodological contributions of the proposed framework to the field of ecological assessment. Subsequently, it demonstrates the framework’s capacity to uncover complex human–environment interactions previously obscured by conventional methods. Finally, it explores the broader implications for environmental management and outlines future research directions.
5.1. Methodological Implications for Ecological Assessment
The primary methodological contribution is the establishment of a new assessment framework that directly addressing a persistent challenge in environmental perception research: lack of ecological validity. Traditional screen-based studies, while offering high experimental control, inherently suffer from diminished immersion, spatial depth, and realism, potentially introducing systematic bias into subjective evaluations. Our framework addresses this fundamental gap by employing MR as a scientific instrument for collecting subjective data, bridging the chasm between controlled laboratory settings and authentic real-world experiences [47].
The empirical superiority of this approach is clearly demonstrated by our results. Models trained on the MR-collected data component of our framework consistently and significantly outperformed those trained on screen-based data across all tested algorithms (RF, SVM, XGBoost), achieving lower prediction errors (RMSE, MAE) and higher coefficients of determination () (see Section 4.1). This quantitative evidence suggests that data captured in immersive contexts possesses greater distinctiveness and consistency relative to objective features. The superior model fit implies that MR environments may facilitate more stable cognitive processing of environmental cues, resulting in subjective datasets that are mathematically more aligned with physical landscape metrics than screen-based alternatives.
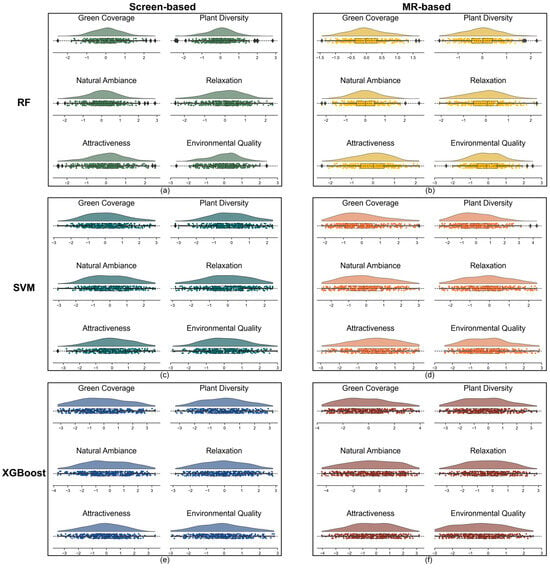
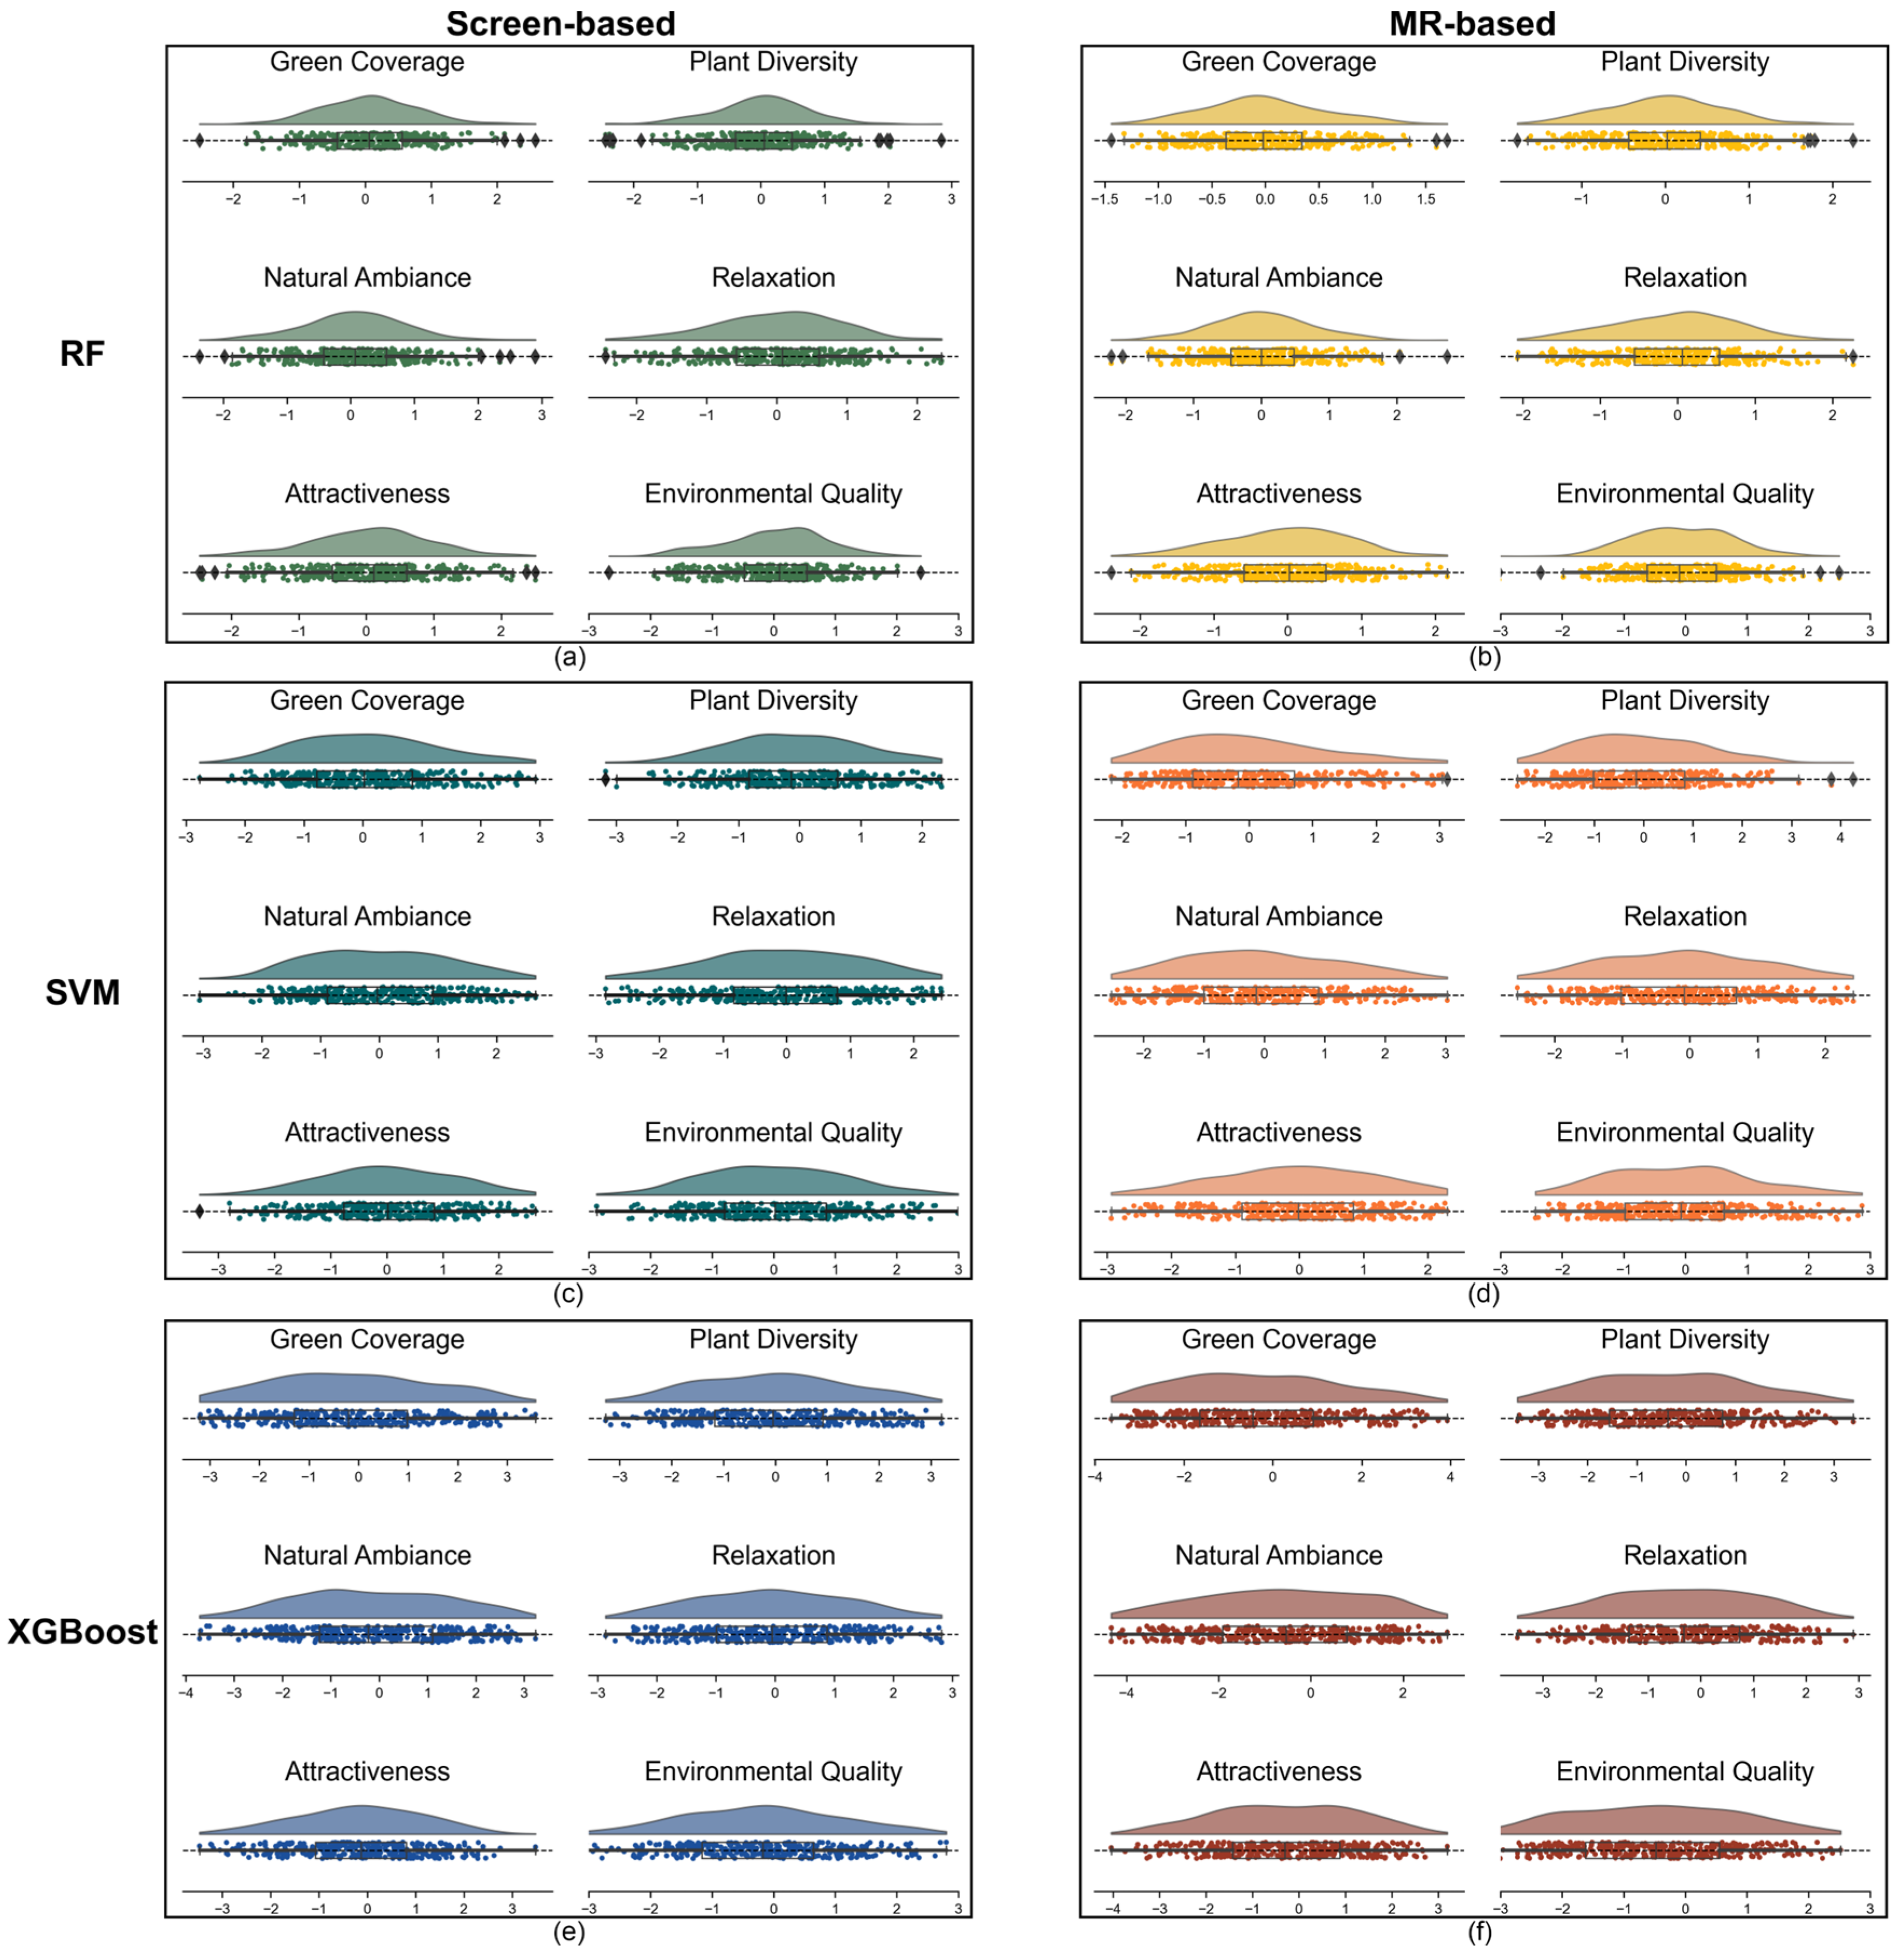
Further analysis of prediction residuals in Figure 11 reveals that MR-based models exhibit more favorable residual distributions, indicating a more robust and reliable modeling outcome. This finding is corroborated by direct participant feedback (Table 10), where over 90% of participants reported that MR significantly enhanced their sense of immersion, spatial perception, and awareness of detail compared to screen-based methods.
Figure 11.
Distribution of prediction residuals for six perceptual indicators. Subplots (a–f) display raincloud plots representing the difference between predicted perception scores and ground truth across three models (RF, SVM, and XGBoost) under two visual conditions: Screen (left) and MR (right). The horizontal dashed line at zero indicates perfect prediction; residual points above the line represent overestimation by the model, while those below indicate underestimation. The vertical density reveal the error distribution for each indicator.
Table 10.
Participants’ Experiential Evaluation of Two Perception Methods.
Collectively, these findings provide quantitative evidence that integrating MR into an assessment workflow can substantially enhance the robustness and predictive validity of subjective environmental assessment models. This methodological advancement is not merely an incremental technological upgrade but a critical step towards developing more reliable, replicable, and human-centric assessment paradigms in ecology and environmental science.
5.2. Revealing Complex Human–Environment Interactions
Beyond its methodological superiority, the framework provides a powerful analytical lens for exploring the intricate links between the physical environment and human perception. The framework’s strength lies in its multidimensional objective indicators, spanning landscape elements, color palettes, and spatial morphology. This comprehensive approach allows for a more granular analysis than was previously possible [48].
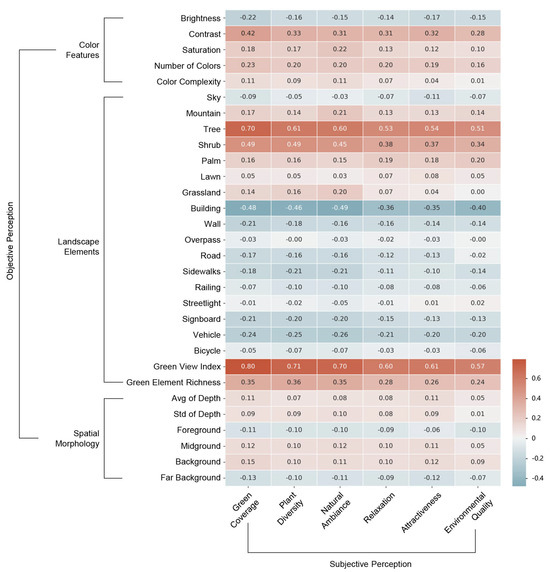
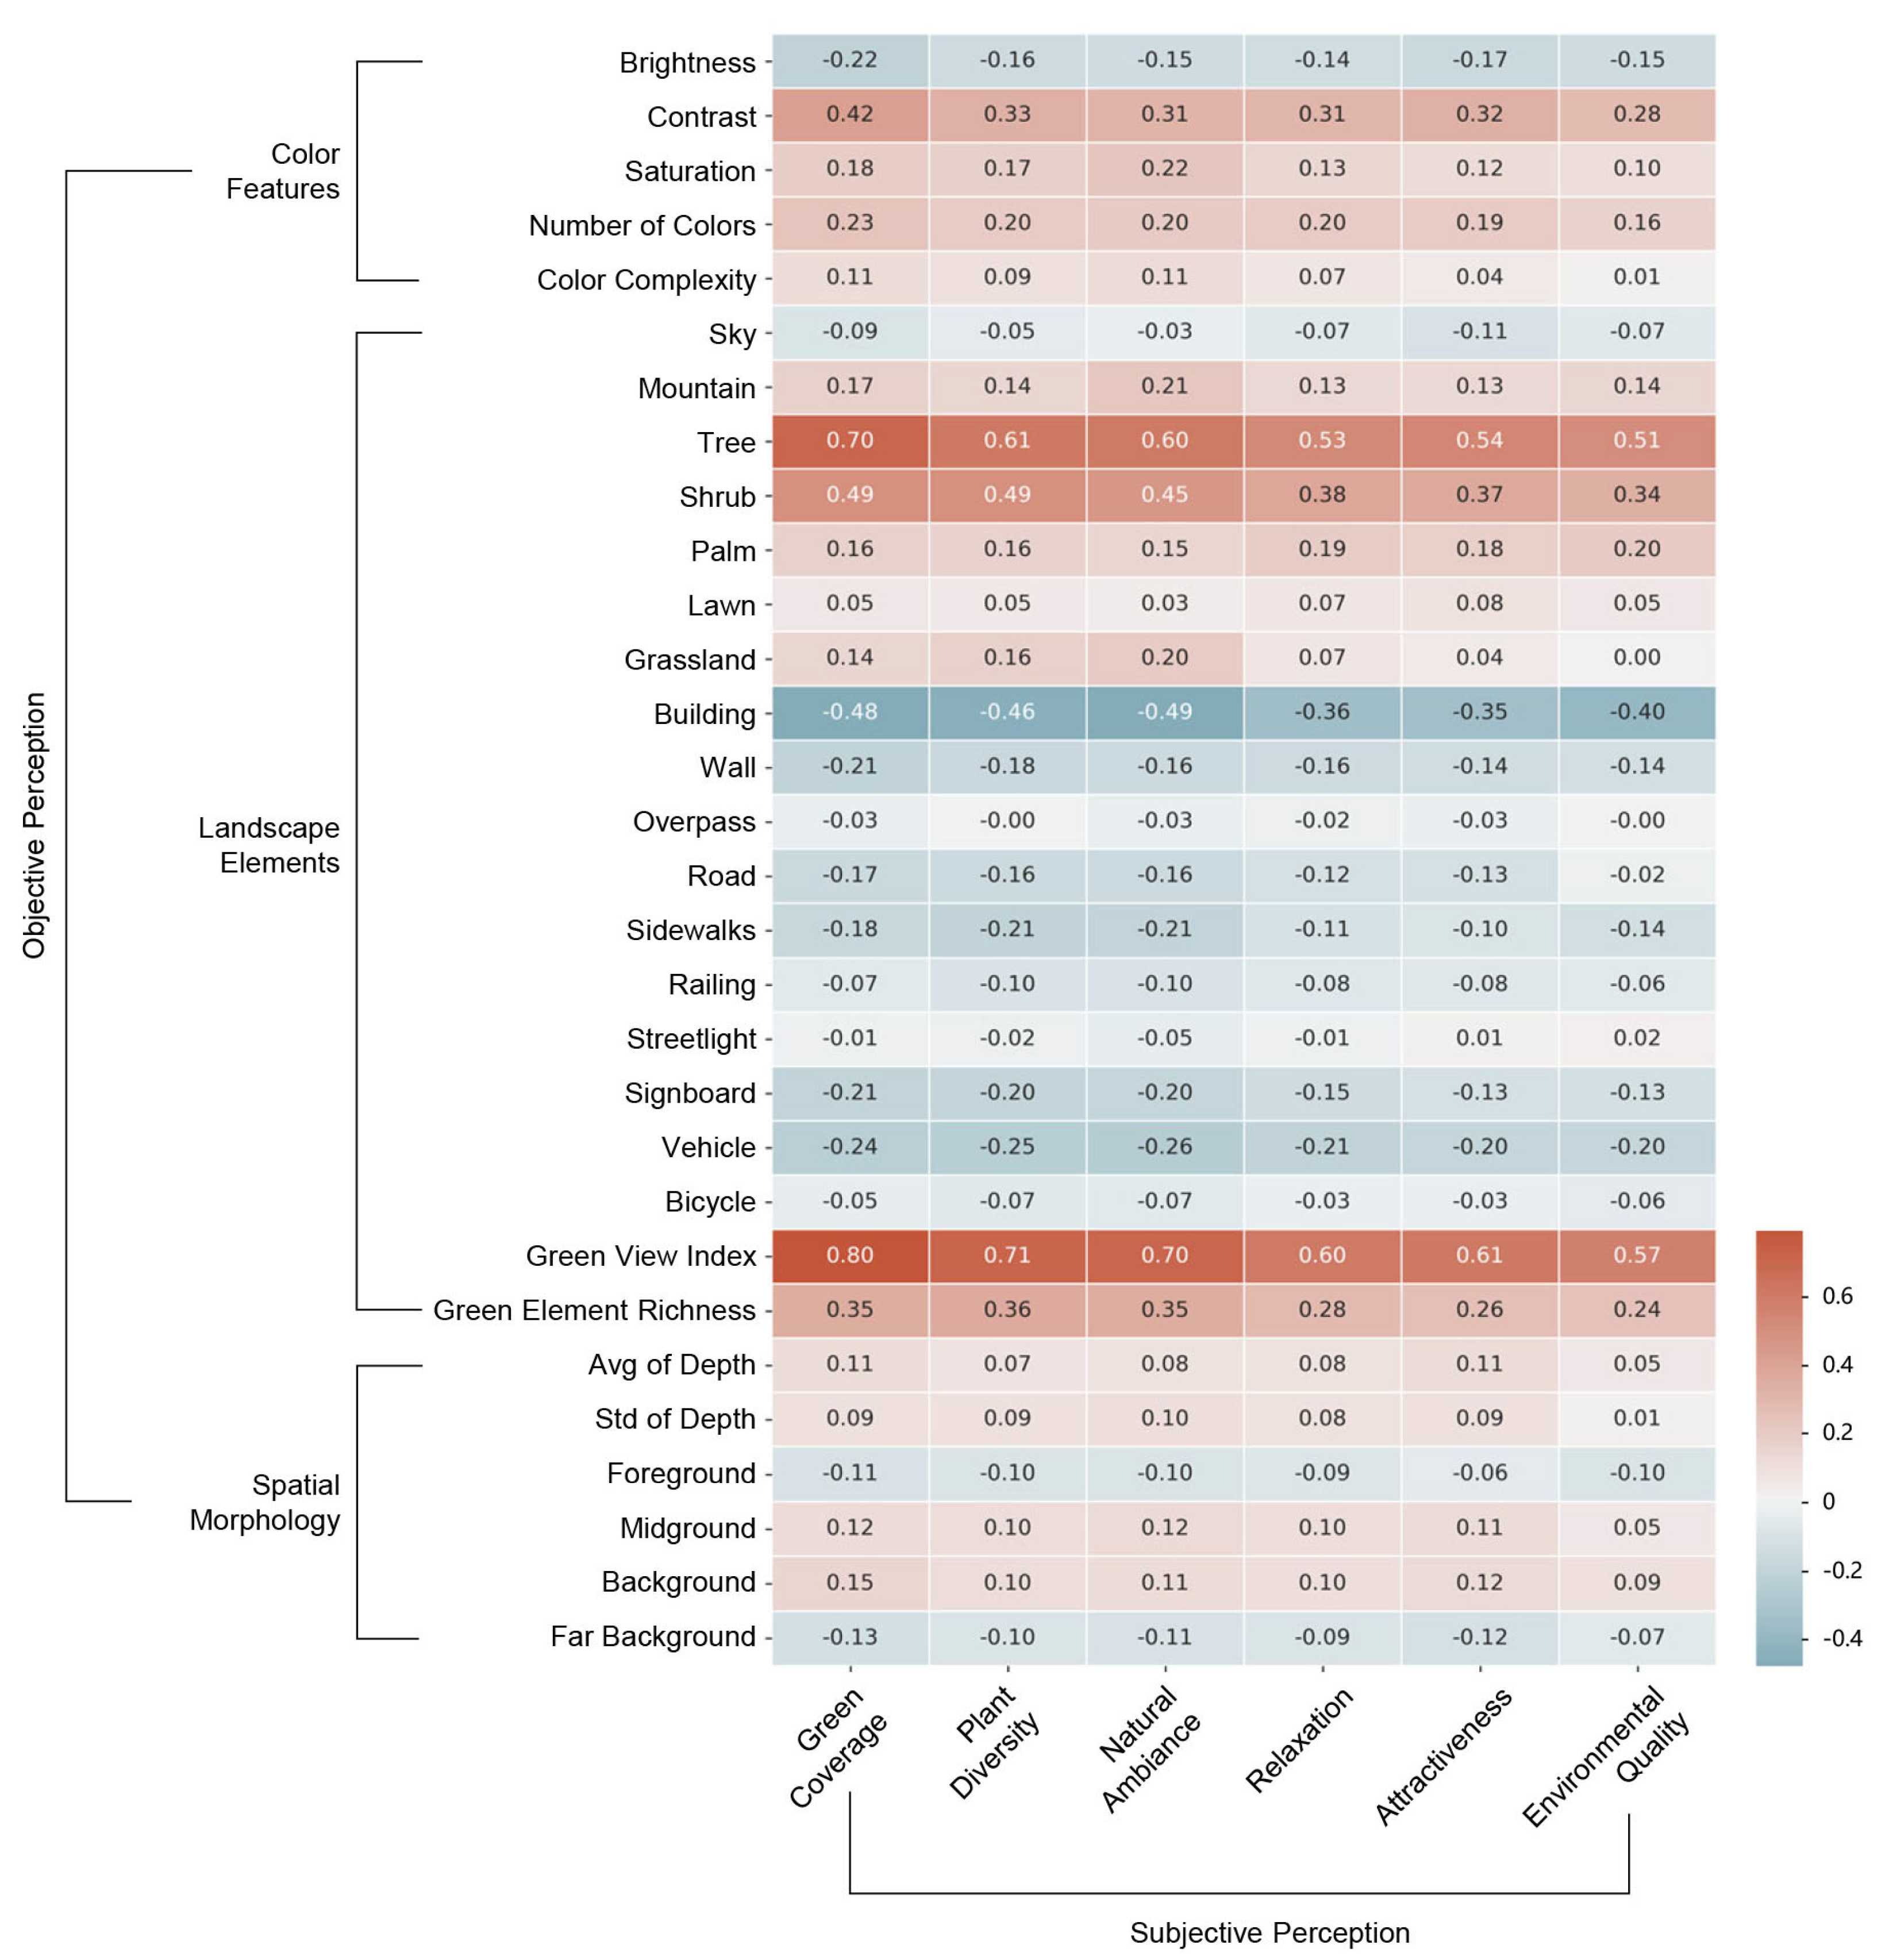
Our analysis reaffirms the strong positive association between green elements and positive perception, identifying them as the dominant predictors within the model. For instance, composite green landscape features exhibited strong positive correlations with nearly all positive subjective dimensions, including green coverage (r = 0.80), natural ambiance (r = 0.70), and relaxation (r = 0.60), as shown in Figure 12. Conversely, the framework quantifies the negative correlation between artificial elements and reported perceptual scores. Specifically, building features showed significant negative correlations with naturalness and green coverage, highlighting the challenges posed by dense urban forms. This ability to concurrently measure the positive contribution of nature and the negative pressure from artificial structures provides a more balanced and actionable assessment of the urban environment.
Figure 12.
Pearson correlation heat map of objective and subjective perception.
Beyond landscape elements, our assessment framework reveals the importance of more subtle visual qualities. For example, color features such as contrast and saturation showed moderate positive correlations with subjective perceptions. Elements in the midground and background were positively associated with attractiveness, whereas those in the immediate foreground were not. Our framework demonstrates that the relationship between the objective environment and subjective experience is far more complex and structured than conventional methods have been able to reveal. Regarding complex human–environment interactions, color features and spatial morphology—like landscape elements—play a crucial role in shaping urban green perception.
5.3. Implications for Urban Planning and Landscape Upgrading
Our framework is intended not only as a research instrument but also as a planning-oriented tool for urban environmental governance and landscape upgrading. Its key practical value is to complement conventional supply-side greening indicators by providing a human-centered, perception-based layer of evidence, thereby supporting a shift from quantity-oriented greening (e.g., meeting coverage targets) to perception-oriented spatial optimization (i.e., improving how greenery is actually experienced at the street level). This perspective is directly relevant to urban renewal and streetscape improvement, where the same amount of greenery can yield markedly different experiential outcomes depending on composition, configuration, and visual quality [13].
In practice, the framework can support three decision-critical tasks for planners and managers. First, city-wide perception maps can diagnose perceptual deficits by locating street segments and neighborhoods where perceived natural ambiance, relaxation, attractiveness, or overall environmental quality remain low, including cases where basic greening provision is not minimal [23,34]. Second, by linking perception outcomes to multidimensional objective indicators, the results can inform targeted upgrading strategies and project prioritization, distinguishing between “greening shortage” and “experience shortage” and enabling more efficient, context-sensitive interventions [20]. Third, the same workflow can be used for before–after evaluation of renewal and greening projects, providing an outcome metric that captures whether interventions actually improve perceived environmental quality rather than merely increasing green supply [48,49].
The framework has clear implications for health-oriented and equity-oriented urban planning. Since the public benefits of urban greenery depend not only on its presence but also on its experiential quality within daily activity spaces, the revealed spatial heterogeneity in perceived green quality can help identify communities exposed to persistently low-quality green experiences and support priority setting to reduce perceptual “green gaps” across districts. While routine adoption of the full MR component may be constrained by cost and operational burden, a tiered strategy is feasible: large-scale screening can rely on scalable LVM-based quantification and prediction, while MR-based data collection can be applied selectively in representative or high-stakes renewal areas to calibrate and validate planning decisions.
5.4. Limitations and Future Directions
While this study establishes a novel and effective framework, we identify six primary areas where future research could refine and expand upon this work.
First, regarding objective quantification, current LVMs, though powerful, can be further optimized. Future iterations should focus on fine-tuning these models to capture more granular environmental attributes known to influence perception, such as specific plant species, vegetation health, and landscape maintenance levels. Furthermore, integrating LVM outputs with GIS data would provide a richer, multi-source contextual understanding of the urban fabric.
Second, the generalizability of our subjective perception findings requires validation through larger and more diverse participant samples. As perception is culturally conditioned, cross-cultural studies would be particularly valuable in testing the universality of the observed human–environment relationships across different demographic backgrounds.
Third, although MR represents a major leap in ecological validity compared to screen-based methods, a gap remains between simulation and real-world experiences due to the lack of multi-sensory integration. Current MR environments primarily rely on vision; therefore, future research should explore in situ assessments using mobile sensors or next-generation MR systems that incorporate auditory cues and dynamic lighting to simulate a holistic street environment.
Fourth, the framework’s scalability is currently constrained by the availability of high-quality geospatial data. Its application in developing regions may be hindered by incomplete OpenStreetMap networks or sparse SVI coverage. To bridge this digital divide, future research should investigate the integration of low-cost, crowdsourced visual data as a viable alternative [50].
Fifth, to balance the high time and labor costs associated with large-scale MR experiments, each SVI in this study was evaluated by a single participant. We acknowledge that the lack of multiple ratings per image may leave the data sensitive to individual subjective variance. Future research will address this by adopting a multi-rater design on a representative subset of the dataset to rigorously validate the inter-rater reliability and robustness of the perception models.
Finally, a methodological discrepancy existed in the data collection protocols: screen-based ratings were self-administered, whereas MR ratings were verbally elicited, potentially introducing interviewer effects. To strictly harmonize the experimental protocol and eliminate confounding variables, future work will implement a unified self-administered questionnaire across both modalities. This will involve developing an immersive MR user interface where participants can input ratings directly via hand gestures or controllers, thereby ensuring complete methodological equivalence.
Despite these limitations, the framework presented here offers a robust tool for environmental science. It advances a new paradigm for built environment assessment—one that is more precise, human-centric, and fundamentally more ecologically valid.
6. Conclusions
This study has successfully constructed and validated a multidimensional assessment framework for urban green perception by integrating LVMs and MR. This framework effectively overcomes the fundamental limitations of conventional ecological assessment methods, namely their reliance on singular indicators and the lack of ecological validity in their measurement techniques, by integrating high-fidelity subjective experiential data with precise objective environmental quantification. Our empirical results clearly demonstrate that the methodology derived from this framework significantly surpasses traditional approaches in terms of accuracy and robustness for predicting human environmental perception, providing strong evidence for its scientific superiority.
The core contributions of this research are multifaceted. Theoretically, we moved beyond the conventional GVI to establish a more comprehensive, multidimensional indicator system grounded in biological vision mechanisms, deepening the understanding of complex human–environment interactions. Methodologically, this study is among the first to empirically demonstrate, through rigorous comparative experiments, the substantial advantage of MR technology in enhancing the ecological validity of environmental perception data. The replicable technological pipeline we have established provides a powerful new toolkit for measurement and assessment in future socio-ecological systems research.
Beyond methodological advances, the framework also provides direct value for planning practice by operationalizing “perception-oriented” green upgrading at scale. By mapping multidimensional green perception and linking it to interpretable environmental features, the framework enables planners to identify where experiential quality is deficient, distinguish “greening shortage” from “experience shortage,” and prioritize context-sensitive renewal strategies. Moreover, it supports outcome-based evaluation of greening and streetscape projects by quantifying whether interventions improve perceived environmental quality rather than merely increasing green supply, thereby providing an evidence base for health-oriented and equity-oriented urban renewal.
While acknowledging limitations such as sample diversity and the costs associated with MR technology, the value of this research extends beyond the specific domain of urban green spaces. It showcases the immense potential of integrating cutting-edge AI and immersive technologies for environmental monitoring and assessment. Future research should focus on lowering the barriers to applying this framework and extending its use to the assessment of other ecosystem types. We are confident that this human-centered, data-driven new paradigm of assessment will significantly advance the design and management of built environments towards a more sustainable and humanistic future, ultimately contributing to the enhancement of urban livability worldwide.
Author Contributions
Conceptualization, J.W. and Y.C.; methodology, Y.C.; software, J.W.; validation, X.Y. and L.W.; formal analysis, J.W.; investigation, X.Y. and L.W.; resources, J.W.; data curation, X.Y. and L.W.; writing—original draft preparation, J.W.; writing—review and editing, Y.C.; visualization, J.W. and X.Y.; supervision, Y.C.; project administration, Y.C.; funding acquisition, Y.C. All authors have read and agreed to the published version of the manuscript.
Funding
This research was funded by the National Key R&D Program of China under Grant Number 2023YFC3804803, the China Postdoctoral Science Foundation under Grant Number 2025M771598, and the Postdoctoral Fellowship Program of CPSF under Grant Number GZC20241084.
Institutional Review Board Statement
The study was conducted in accordance with the Declaration of Helsinki, and approved by the Ethics Committee of Shenzhen University (date of approval: 4 November 2025).
Informed Consent Statement
Informed consent was obtained from all subjects involved in the study.
Data Availability Statement
The original contributions presented in the study are included in the article. The street view imagery used in the multidimensional assessment was obtained from Baidu Street View API. The data presented (objective and subjective perception scores of street view imagery for model training and testing) in this study are available on request from the corresponding author. The data are not publicly available due to privacy restrictions.”
Acknowledgments
We express our gratitude to the volunteers who participated in the experiment for green perception measurement.
Conflicts of Interest
The authors declare no conflict of interest. The funders had no role in the design of the study; in the collection, analyses or interpretation of data; in the writing of the manuscript; or in the decision to publish the results.
References
- Wang, T.; Yang, Z.; Han, F.; Yu, J.; Ma, X.; Han, J. Assessment of tourism socio-ecological system resilience in arid areas: A case study of Xinjiang, China. Ecol. Indic. 2024, 159, 111748. [Google Scholar] [CrossRef] [Scilit]
- Berrio-Giraldo, L.; Villegas-Palacio, C.; Arango-Aramburo, S. Understating complex interactions in socio-ecological systems using system dynamics: A case in the tropical Andes. J. Environ. Manag. 2021, 291, 112675. [Google Scholar] [CrossRef] [Scilit] [PubMed]
- Yang, J.; Rong, H.; Kang, Y.; Zhang, F.; Chegut, A. The financial impact of street-level greenery on New York commercial buildings. Landsc. Urban Plan. 2021, 214, 104162. [Google Scholar] [CrossRef] [Scilit]
- Hu, C.; Jia, S.; Zhang, F.; Xiao, C.; Ruan, M.; Thrasher, J.; Li, X. UPDExplainer: An interpretable transformer-based framework for urban physical disorder detection using street view imagery. ISPRS J. Photogramm. Remote Sens. 2023, 204, 209–222. [Google Scholar] [CrossRef] [Scilit]
- Yang, H.; Jin, C.; Li, T. A paradox of economic benefit and social equity of green space in megacity: Evidence from Tianjin in China. Sustain. Cities Soc. 2024, 109, 105530. [Google Scholar] [CrossRef] [Scilit]
- Ma, H.; Zhang, Y.; Liu, P.; Zhang, F.; Zhu, P. How does spatial structure affect psychological restoration? A method based on graph neural networks and street view imagery. Landsc. Urban Plan. 2024, 251, 105171. [Google Scholar] [CrossRef] [Scilit]
- Kang, Y.; Zhang, F.; Gao, S.; Lin, H.; Liu, Y. A review of urban physical environment sensing using street view imagery in public health studies. Ann. GIS 2020, 26, 261–275. [Google Scholar] [CrossRef] [Scilit]
- Cao, Y.; Li, Y.; Shen, S.; Wang, W.; Peng, X.; Chen, J.; Liao, J.; Lv, X.; Liu, Y.; Ma, L.; et al. Mapping urban green equity and analysing its impacted mechanisms: A novel approach. Sustain. Cities Soc. 2024, 101, 105071. [Google Scholar] [CrossRef] [Scilit]
- Tian, D.; Wang, J.; Xia, C.; Zhang, J.; Zhou, J.; Tian, Z.; Zhao, J.; Li, B.; Zhou, C. The relationship between green space accessibility by multiple travel modes and housing prices: A case study of Beijing. Cities 2024, 145, 104694. [Google Scholar] [CrossRef] [Scilit]
- Liu, Z.; Chen, X.; Cui, H.; Ma, Y.; Gao, N.; Li, X.; Meng, X.; Lin, H.; Abudou, H.; Guo, L.; et al. Green space exposure on depression and anxiety outcomes: A meta-analysis. Environ. Res. 2023, 231, 116303. [Google Scholar] [CrossRef] [Scilit]
- Javadi, R.; Nasrollahi, N. Urban green space and health: The role of thermal comfort on the health benefits from the urban green space; a review study. Build. Environ. 2021, 202, 108039. [Google Scholar] [CrossRef] [Scilit]
- Bele, A.; Chakradeo, U. Public perception of biodiversity: A literature review of its role in urban green spaces. J. Landsc. Ecol. 2021, 14, 1–28. [Google Scholar] [CrossRef] [Scilit]
- Palliwoda, J.; Priess, J.A. What do people value in urban green? Linking characteristics of urban green spaces to users’ perceptions of nature benefits, disturbances, and disservices. Ecol. Soc. 2021, 26, 28. [Google Scholar] [CrossRef] [Scilit]
- Noe, E.E.; Stolte, O. Dwelling in the city: A qualitative exploration of the human-nature relationship in three types of urban greenspace. Landsc. Urban Plan. 2023, 230, 104633. [Google Scholar] [CrossRef] [Scilit]
- Browning, M.H.E.M.; Mimnaugh, K.J.; Van Riper, C.J.; Laurent, H.K.; LaValle, S.M. Can simulated nature support mental health? Comparing short, single-doses of 360-degree nature videos in virtual reality with the outdoors. Front. Psychol. 2020, 10, 2667. [Google Scholar] [CrossRef] [Scilit]
- Rigolon, A.; Browning, M.H.E.M.; McAnirlin, O.; Yoon, H.V. Green space and health equity: A systematic review on the potential of green space to reduce health disparities. Int. J. Environ. Res. Public Health 2021, 18, 2563. [Google Scholar] [CrossRef] [Scilit]
- Zhao, L.; Shen, Z.; Zhang, Y.; Sheng, F. Study on the impact of the objective characteristics and subjective perception of the built environment on residents’ physical activities in Fuzhou, China. Sustainability 2019, 12, 329. [Google Scholar] [CrossRef] [Scilit]
- Hou, Y.; Biljecki, F. A comprehensive framework for evaluating the quality of street view imagery. Int. J. Appl. Earth Obs. Geoinf. 2022, 115, 103094. [Google Scholar] [CrossRef] [Scilit]
- Fan, Z.; Feng, C.C.; Biljecki, F. Coverage and bias of street view imagery in mapping the urban environment. Comput. Environ. Urban Syst. 2025, 117, 102253. [Google Scholar] [CrossRef] [Scilit]
- Zhu, H.; Nan, X.; Yang, F.; Bao, Z. Utilizing the green view index to improve the urban street greenery index system: A statistical study using road patterns and vegetation structures as entry points. Landsc. Urban Plan. 2023, 237, 104780. [Google Scholar] [CrossRef] [Scilit]
- Ki, D.; Lee, S. Analyzing the effects of Green View Index of neighborhood streets on walking time using Google Street View and deep learning. Landsc. Urban Plan. 2021, 205, 103920. [Google Scholar] [CrossRef] [Scilit]
- Li, X.; Zhang, X.; Jia, T. Humanization of nature: Testing the influences of urban park characteristics and psychological factors on collegers’ perceived restoration. Urban For. Urban Green. 2023, 79, 127806. [Google Scholar] [CrossRef] [Scilit]
- Wei, J.; Yue, W.; Li, M.; Gao, J. Mapping human perception of urban landscape from street-view images: A deep-learning approach. Int. J. Appl. Earth Obs. Geoinf. 2022, 112, 102886. [Google Scholar] [CrossRef] [Scilit]
- Oquab, M.; Darcet, T.; Moutakanni, T.; Vo, H.; Szafraniec, M.; Khalidov, V.; Fernandez, P.; Haziza, D.; Massa, F.; El-Nouby, A.; et al. Dinov2, Learning robust visual features without supervision. arXiv 2023, arXiv:2304.07193. [Google Scholar]
- Yang, L.; Kang, B.; Huang, Z.; Xu, X.; Feng, J.; Zhao, H. Depth anything: Unleashing the power of large-scale unlabeled data. In Proceedings of the IEEE/CVF Conference on Computer Vision and Pattern Recognition, Seattle, WA, USA, 17–21 June 2024; pp. 10371–10381. [Google Scholar]
- Zhang, A.; Song, L.; Zhang, F. Perception of pleasure in the urban running environment with street view images and running routes. J. Geogr. Sci. 2022, 32, 2624–2640. [Google Scholar] [CrossRef] [Scilit]
- Huang, Y.; Aguilar, F.; Yang, J.; Qin, Y.; Wen, Y. Predicting citizens’ participatory behavior in urban green space governance: Application of the extended theory of planned behavior. Urban For. Urban Green. 2021, 61, 127110. [Google Scholar] [CrossRef] [Scilit]
- Lopez, B.; Kennedy, C.; Field, C.; McPhearson, T. Who benefits from urban green spaces during times of crisis? Perception and use of urban green spaces in New York City during the COVID-19 pandemic. Urban For. Urban Green. 2021, 65, 127354. [Google Scholar] [CrossRef] [Scilit] [PubMed]
- Lau, K.K.L.; Yung, C.C.Y.; Tan, Z. Usage and perception of urban green space of older adults in the high-density city of Hong Kong. Urban For. Urban Green. 2021, 64, 127251. [Google Scholar] [CrossRef] [Scilit]
- Reyes-Riveros, R.; Altamirano, A.; De La Barrera, F.; Rozas-Vásquez, D.; Vieli, L.; Meli, P. Linking public urban green spaces and human well-being: A systematic review. Urban For. Urban Green. 2021, 61, 127105. [Google Scholar] [CrossRef] [Scilit]
- Zhang, L.; Tan, P.Y.; Richards, D. Relative importance of quantitative and qualitative aspects of urban green spaces in promoting health. Landsc. Urban Plan. 2021, 213, 104131. [Google Scholar] [CrossRef] [Scilit]
- Zhang, R.; Zhang, C.Q.; Rhodes, R.E. The pathways linking objectively-measured greenspace exposure and mental health: A systematic review of observational studies. Environ. Res. 2021, 198, 111233. [Google Scholar] [CrossRef] [Scilit]
- He, Q.; Wu, L.; Lee, C.S.; Zhu, C.; Bai, W.; Guo, W.; Ye, X. Greener the safer? Effects of urban green space on community safety and perception of safety using satellite and street view imagery data. J. Crim. Justice 2025, 97, 102372. [Google Scholar] [CrossRef] [Scilit]
- Ito, K.; Kang, Y.; Zhang, Y.; Zhang, F.; Biljecki, F. Understanding urban perception with visual data: A systematic review. Cities 2024, 152, 105169. [Google Scholar] [CrossRef] [Scilit]
- Zhang, F.; Salazar-Miranda, A.; Duarte, F.; Vale, L.; Hack, G.; Chen, M.; Liu, Y.; Batty, M.; Ratti, C. Urban visual intelligence: Studying cities with artificial intelligence and street-level imagery. Ann. Am. Assoc. Geogr. 2024, 114, 876–897. [Google Scholar] [CrossRef] [Scilit]
- Zhang, L.; Wang, L.; Wu, J.; Li, P.; Dong, J.; Wang, T. Decoding urban green spaces: Deep learning and google street view measure greening structures. Urban For. Urban Green. 2023, 87, 128028. [Google Scholar] [CrossRef] [Scilit]
- Choi, K.; Lim, W.; Chang, B.; Jeong, J.; Kim, I.; Park, C.-R.; Ko, D.W. An automatic approach for tree species detection and profile estimation of urban street trees using deep learning and Google street view images. ISPRS J. Photogramm. Remote Sens. 2022, 190, 165–180. [Google Scholar] [CrossRef] [Scilit]
- Lu, Y.; Lau, S.K. Examining the ecological validity of VR experiments in soundscape and landscape research. Comput. Hum. Behav. 2025, 162, 108462. [Google Scholar] [CrossRef] [Scilit]
- Montello, D.R.; Goodchild, M.F.; Gottsegen, J.; Fohl, P. Where’s downtown?: Behavioral methods for determining referents of vague spatial queries. In Spatial Vagueness, Uncertainty, Granularity; Psychology Press: New York, NY, USA, 2017; pp. 185–204. [Google Scholar]
- Goh, C.S.; Chong, H.Y. Opportunities in the sustainable built environment: Perspectives on human-centric approaches. Energies 2023, 16, 1301. [Google Scholar] [CrossRef] [Scilit]
- Cao, Y.; Yang, P.; Xu, M.; Li, M.; Li, Y.; Guo, R. A novel method of urban landscape perception based on biological vision process. Landsc. Urban Plan. 2025, 254, 105246. [Google Scholar] [CrossRef] [Scilit]
- Wang, H.; Xue, H.; He, W.; Han, Q.; Xu, T.; Gao, X.; Liu, S.; Jiang, R.; Huang, M. Spatial-temporal evolution mechanism and dynamic simulation of the urban resilience system of the Guangdong-Hong Kong-Macao Greater Bay Area in China. Environ. Impact Assess. Rev. 2024, 104, 107333. [Google Scholar] [CrossRef] [Scilit]
- Li, Y.Y.; Zhang, Y.Z.; Jiang, Z.Y.; Guo, C.-X.; Zhao, M.-Y.; Yang, Z.-G.; Guo, M.-Y.; Wu, B.-Y.; Chen, Q.-L. Integrating morphological spatial pattern analysis and the minimal cumulative resistance model to optimize urban ecological networks: A case study in Shenzhen City, China. Ecol. Process. 2021, 10, 63. [Google Scholar] [CrossRef] [Scilit]
- Chen, L.; Lu, Y.; Sheng, Q.; Ye, Y.; Wang, R.; Liu, Y. Estimating pedestrian volume using Street View images: A large-scale validation test. Comput. Environ. Urban Syst. 2020, 81, 101481. [Google Scholar] [CrossRef] [Scilit]
- Rui, J. Exploring the association between the settlement environment and residents’ positive sentiments in urban villages and formal settlements in Shenzhen. Sustain. Cities Soc. 2023, 98, 104851. [Google Scholar] [CrossRef] [Scilit]
- Liu, M.; Deng, H.; Li, C.; Chen, H. The impact of street and building configurations on respiratory health risks in an urban environment considering street behavior heterogeneity. Sustain. Cities Soc. 2025, 118, 105992. [Google Scholar] [CrossRef] [Scilit]
- Zhao, X.; Lu, Y.; Lin, G. An integrated deep learning approach for assessing the visual qualities of built environments utilizing street view images. Eng. Appl. Artif. Intell. 2024, 130, 107805. [Google Scholar] [CrossRef] [Scilit]
- Xia, Y.; Yabuki, N.; Fukuda, T. Development of a system for assessing the quality of urban street-level greenery using street view images and deep learning. Urban For. Urban Green. 2021, 59, 126995. [Google Scholar] [CrossRef] [Scilit]
- Wang, S.; Cai, W.; Sun, Q.C.; Wu, C.Y.; Huang, X.; Giannopoulos, I.; Alinaghi, N.; Liu, Z. Human-perceived vs actual built environment: Using human-centred GeoAI and street view images to support urban planning in Australia. J. Environ. Manag. 2025, 389, 126070. [Google Scholar] [CrossRef] [Scilit]
- Huang, X.; Wang, S.; Yang, D.; Hu, T.; Chen, M.; Zhang, M.; Zhang, G.; Biljecki, F.; Lu, T.; Zou, L.; et al. Crowdsourcing geospatial data for earth and human observations: A review. J. Remote Sens. 2024, 4, 0105. [Google Scholar] [CrossRef] [Scilit]

Disclaimer/Publisher’s Note: The statements, opinions and data contained in all publications are solely those of the individual author(s) and contributor(s) and not of MDPI and/or the editor(s). MDPI and/or the editor(s) disclaim responsibility for any injury to people or property resulting from any ideas, methods, instructions or products referred to in the content. |
© 2026 by the authors. Licensee MDPI, Basel, Switzerland. This article is an open access article distributed under the terms and conditions of the Creative Commons Attribution (CC BY) license.