


Abstract
Business Intelligence (BI) comprises methods and technologies for collecting, organizing, and analyzing data to support managerial decision-making. This study presents a systematic literature review with a two-tier scope: first, identifying the most widely adopted BI tools across organizational contexts, and second, examining the specific application of Microsoft Power BI within the civil construction sector. The review followed the PRISMA guidelines and was complemented by the snowball sampling technique. A total of 81 articles published between 2015 and 2025 were analyzed to identify the most used tools, main application sectors, benefits, and challenges in BI adoption. The analysis combines descriptive bibliometric techniques with qualitative content analysis to examine publication trends, tools, application domains, and reported challenges. Results indicate that Power BI, Tableau, and Qlik Sense are the most frequent BI tools, with Power BI standing out for its integration with diverse data sources such as spreadsheets, databases, management software, and cloud platforms, enabling the creation of dashboards. The civil construction, business management, and manufacturing industries show the highest adoption rates, mainly for cost control, performance monitoring, and sustainability indicators. Reported benefits include operational efficiency, process automation, and improved decision-making. However, gaps remain regarding data standardization, interoperability, technological infrastructure, and user resistance. As a contribution, this review advances the existing literature by explicitly distinguishing general BI tool adoption from the sector-specific use of Power BI in civil construction, systematically classifying application domains and revealing limitations in maturity that remain underexplored in prior reviews.
1. Introduction
In the current corporate world, business environments face an increasingly dynamic scenario in which the amount of data produced daily grows exponentially [1,2]. Information on customers, suppliers, internal processes, financial performance, and market trends is available in different systems and formats, making data management and analysis a major challenge [3,4]. The ability to transform raw information into strategic knowledge has become a competitive advantage, directly impacting efficiency, innovation, and decision-making within organizations [5,6].
Given this need, Business Intelligence (BI) has emerged as a set of practices and tools aimed at data collection, integration, analysis, and visualization, allowing managers to monitor performance indicators and make more informed decisions [7,8,9]. The use of BI promotes a data-driven management culture, providing greater transparency, agility, and accuracy in decision-making [10,11,12]. According to [13,14,15], tools such as Power BI, Tableau, QlikView, and SAS Business Intelligence stand out for offering dashboards, dynamic reports, and the ability to consolidate data from different sources, making information more accessible and understandable across organizational areas.
Although civil construction handles large volumes of resources, digitalization and the adoption of advanced analytical tools still occur more slowly compared to other sectors [16,17,18,19]. This lag is linked to several barriers identified in the international literature, among which cultural resistance within organizations stands out, hindering the acceptance and full use of new technologies [20,21,22,23].
Despite these limitations, the need for strict control of schedules, costs, quality, and productivity reinforces the relevance of applying Business Intelligence tools in the construction sector [24,25,26]. In a national study, only 5% of Brazilian companies reported effectively utilizing data intelligence, while 43% stated they are unable to identify consumer behavior patterns through digital channels [27]. Although these findings are context-specific, they reflect challenges commonly observed in emerging economies and illustrate broader structural barriers to the adoption of analytical solutions in construction. This scenario underscores the significant growth potential for the use of Business Intelligence in the sector.
Specifically regarding Building Information Modelling (BIM), while the literature extensively covers its capabilities for 3D modelling and clash detection, there is a growing need to leverage the semantic data embedded in these models for performance prediction [28,29,30]. In this context, Business Intelligence (BI) tools emerge as the necessary ‘analytical layer’ that extracts, visualises, and democratises BIM data. By acting as a bridge, BI allows stakeholders to move beyond geometric visualisation to performance-based decision-making, aligning directly with the goals of sustainable building management.
According to [31,32,33], digital transformation requires managers and teams to rethink their strategic practices, going beyond the mere incorporation and maintenance of new technological tools. In the context of Business Intelligence, and particularly platforms such as Microsoft Power BI, this transition demands changes in how businesses are conducted, including the establishment of structured and standardized processes capable of generating reliable data from corporate systems and enabling automation and advanced analytical practices [34,35,36,37].
In this context, it becomes essential for companies to recognize the potential of digital technologies not only as instruments of modernization but also as means to increase competitiveness, reduce costs, and deliver higher value-added products and services to customers [33,38,39].
Accordingly, this study adopts a dual-scope approach. First, it maps the landscape of Business Intelligence tools applied across organizational contexts. Second, it specifically analyses the application of Microsoft Power BI within civil construction companies by addressing five research questions presented in the following section. To achieve these objectives, a Systematic Literature Review (SLR) is conducted in accordance with the PRISMA guidelines and complemented by the snowballing technique to compile and analyze the available evidence. This approach aims to advance our understanding of how Power BI has been used in civil construction and identify its reported benefits and application patterns.
2. Materials and Methods
The study employed a systematic literature review to identify, synthesize, and compare approaches to the use of Power BI. The review was conducted following the Preferred Reporting Items for Systematic Reviews and Meta-Analyses (PRISMA) guidelines, as described by [40] and updated by [41], which aim to optimize the reporting of systematic reviews to ensure the identification, evaluation, and interpretation of results relevant to the topic under study. In addition, the snowballing technique was used, which, in the context of systematic literature reviews, has proven effective for locating relevant studies that do not appear directly in initial keyword searches of traditional databases [42].
The research, exploratory in nature and grounded in a bibliographic review and bibliometric analysis, was characterized as applied research and adopted a qualitative-quantitative approach, focusing on the application of BI tools in companies, with subsequent emphasis on the use of Power BI in construction firms.
The research questions guiding the study were structured in two tiers: Tier 1 (General Scope): (RQ1) Which BI tools are most frequently applied in organizational management? (RQ2) Which economic sectors demonstrate the highest adoption of these tools? and Tier 2 (Specific Scope—Construction): (RQ3) How is Power BI specifically utilized within construction company processes? (RQ4) What are the main benefits reported from Power BI implementation in this sector? (RQ5) What technical and organizational gaps hinder the full adoption of Power BI in construction?
2.1. Eligibility Criteria
For the selection of articles, only those that appropriately met the inclusion, exclusion, and quality criteria specified in Table 1 were considered valid studies.
Table 1.
Eligibility Criteria.
The inclusion (CI) and exclusion (CE) criteria were defined to ensure the relevance, quality, and specificity of the studies selected for this research. The first inclusion criterion ensures that studies are directly relevant to the research topic, thereby reducing the risk of selecting only tangentially related works. The second inclusion criterion includes only peer-reviewed journal articles and conference proceedings, thereby ensuring methodological quality, academic rigor, and the reliability of the evidence reported.
The third criterion established a relevant temporal scope by considering scientific articles published since 2015. This lower bound was defined because Microsoft Power BI was officially launched in 2015 [43], which is directly aligned with the objective of this study: to reflect on the growing prominence of Business Intelligence tools in the civil construction sector and to identify Power BI as one of the most frequently adopted platforms through the analysis of tools and application sectors. By setting this temporal boundary, the review ensures that all analyzed studies address BI solutions within a period in which Power BI was available and increasingly applied in organizational contexts.
The systematic search across all databases was conducted in September 2025, aiming to retrieve all studies available and indexed at that time. Consequently, the review reflects the state of the literature as of the search date.
As the fourth inclusion criterion, language restrictions were applied to include only publications in English and Portuguese, ensuring consistency in data extraction and minimizing potential biases associated with translation and interpretation.
The exclusion criteria refine the selection process further, narrowing the scope of studies analyzed. Duplicate studies were excluded to avoid redundancies. Only primary academic articles that explicitly mention the use of BI tools in companies were considered, thereby ensuring that the analysis remains focused on the research domain. Lastly, articles not available in full text were disregarded to provide complete access to the information necessary for analysis.
The quality assessment was independently conducted by the authors of this study, who evaluated titles and abstracts against the inclusion criteria. Then, full texts were appraised for coherence between research objectives, methodology, and reported results. A decision-rule system assigned a positive or negative assessment, and only studies meeting the quality criteria were retained. Disagreements were resolved through consensus meetings, and the reliability of the selected studies was enhanced by prioritizing indexed sources within the selected databases. The review followed PRISMA 2020 guidelines, with the complete checklist provided as Supplementary Material.
These criteria were established to select studies that directly address the application of BI tools in companies, demonstrate methodological quality, are up to date, and provide sufficient feasibility for detailed analysis.
2.2. Data Sources and Search Strategy
Systematic searches were conducted in three online databases, as shown in Table 2, considering titles, keywords, and abstracts. All searches were performed using the exact query string, composed of the terms of interest and Boolean operators, in accordance with the PRISMA method.
Table 2.
Adapted search string for queries in scientific databases.
The search strategy was designed to accommodate a dual analytical scope. Broad organizational descriptors (e.g., enterprise, organization, company) were combined with construction-related terms through the OR operator to retrieve studies examining Business Intelligence applications across multiple organizational settings, while maintaining adequate coverage of the construction context required for the sector-specific analysis. This methodological choice was informed by evidence from prior systematic literature reviews, which indicate a higher concentration of BI-related studies within the construction sector, thereby justifying a dedicated second-tier analysis focused on this domain.
Within this framework, the first tier of analysis (Tier 1) offers a cross-sector and cross-departmental overview of BI tools and their organizational applications as reflected in the retrieved literature, without implying universal generalizability beyond the boundaries of the analyzed corpus.
During the full-text content analysis on the Parsifal platform, these specific topics emerged as inductive categories, reflecting the diverse departments and business units within an organization where Power BI is implemented. Each article was then tagged according to the specific operational process it addressed, allowing for the mapping of varied departmental applications presented in the Section 3.
The selection of the Scopus, Web of Science, and ScienceDirect databases was deliberate, aiming to ensure the inclusion of peer-reviewed and high-quality publications, thereby enhancing the reliability and consistency of the analysed evidence. In addition, ScienceDirect was included due to its strong concentration of publications focused on engineering and technology, which are central to the theme of this study.
The 67 articles selected via the PRISMA method served as the initial seed set for the snowballing process. One iteration of backward, which consists of analyzing the reference lists of the selected articles to identify earlier studies relevant to the topic, and forward snowballing, which seeks more recent works that have cited those articles, using Google Scholar. The inclusion/exclusion and quality criteria (Table 1) were applied to these candidate references, resulting in 14 additional studies. The former expands the review by retrieving past research, while the latter helps identify current studies and emerging trends [44]. Google Scholar was used exclusively for the application of the snowballing technique due to its extensive citation coverage and its capacity to identify both backward and forward references across multiple sources, thereby enhancing the comprehensiveness of the review.
The articles were downloaded in BibTeX format and uploaded to the Parsifal platform, a tool specifically developed to support researchers in conducting systematic literature reviews [45].
The selection process was conducted in two stages using the Parsifal platform. In the first stage, two authors independently screened the titles and abstracts of the 3165 retrieved records against the inclusion and exclusion criteria (Table 1). Any disagreements regarding the eligibility of specific articles were flagged by the platform and resolved through consensus. In the second stage, the full texts of the remaining articles were assessed by the same reviewers to ensure data consistency and accuracy in the extraction of variables such as BI tools, sectors, and benefits.
Figure 1 presents the Flow Diagram for the systematic literature review process according to [46].
Figure 1.
PRISMA Flow Diagram. Source: The Authors (2025).
The process detailed in Figure 1 began with an automated search in the selected databases, yielding a total of 3165 records using the search string. After removing 711 duplicate records, a screening of titles and abstracts was conducted, resulting in the exclusion of 2362 articles based on exclusion criteria CE2 and CE4, leaving 92 articles. Full-text reading was then performed, eliminating 25 articles according to CE3. This resulted in the selection of 67 articles through the PRISMA method, along with 14 additional articles identified through the snowballing technique, 5 obtained through forward snowballing and 9 through backward snowballing.
The bibliometric analysis was based on publication metadata exported from the Parsifal platform, which supported systematic screening, eligibility assessment, and selection of studies. The Parsifal database was populated using BibTeX files exported from the selected scientific databases. Quantitative and qualitative results were analyzed using descriptive statistics and descriptive bibliometric techniques to identify publication patterns, such as temporal evolution, geographic distribution, and tool frequency, and to comprehensively examine the primary forms of application of BI tools in the corporate context. Descriptive analyses were conducted using Microsoft Excel, and the visual representation of bibliometric results was generated using Excel and complementary visualization tools (Canva and Venngage) to enhance graphical clarity.
2.3. Limitations and Future Research
This review acknowledges certain limitations inherent to its methodological design. The database coverage was restricted to Scopus, Web of Science, and ScienceDirect, which was a deliberate choice aimed at ensuring the inclusion of peer-reviewed and high-quality publications. While this decision may have excluded studies indexed in other databases, it contributes to the reliability and consistency of the analyzed evidence. Language restrictions to English and Portuguese were applied to ensure accuracy in data extraction and interpretation.
From a methodological standpoint, this review followed established systematic review practices, including PRISMA guidelines and complementary snowballing. While no formal risk-of-bias assessment or protocol registration was conducted, the transparent reporting of search strategies, inclusion criteria, and screening procedures supports the reliability and replicability of the review. Future reviews may build upon this work by incorporating protocol registration and formal bias assessment tools to further strengthen methodological rigour.
In addition, the geographic concentration of publications in Brazil, as discussed in Section 3.1, should not be interpreted as a limitation of the review itself, but rather as an empirical reflection of where research on Business Intelligence, particularly Power BI, has been more actively developed within the construction sector. This finding offers insights into regional research dynamics and practical adoption contexts.
Regarding study design, the predominance of exploratory and descriptive research reflects the current maturity level of BI adoption in construction. Given the relatively recent diffusion of advanced BI tools in this sector, the prevalence of case-study and application-oriented studies is expected and provides an important foundation for future empirical and theory-driven research.
Concerning future research, the continuous evolution of Power BI functionalities, including the integration of Python (v. 3.15) and R (v. 4.5.2) for advanced analytics, suggests that some technical constraints identified in the literature may be transitional. Future studies are therefore encouraged to move beyond descriptive monitoring applications and to investigate predictive and prescriptive BI approaches, particularly AI-driven forecasting and decision-support systems. Additionally, further research should examine organizational, cultural, and governance-related factors that influence BI maturity and advanced analytics adoption in civil construction
3. Results
The results are structured into two complementary layers: a descriptive bibliometric analysis of the selected publications, followed by a qualitative synthesis of reported BI applications and challenges.
3.1. Bibliometric Analysis
Initially, the number of articles retrieved from each database can be observed in Figure 2. The majority of the selected articles were identified in the Scopus database, accounting for 39.50% of the total. This is followed by the Web of Science, which contributed 33.33%, highlighting its relevance and complementarity to Scopus. Google Scholar contributed 17.28% of the articles through the snowballing technique, gathering studies from diverse sources and broadening the scope of the review. Finally, ScienceDirect accounted for 9.87%, primarily comprising publications focused on engineering and technology.
Figure 2.
Number of articles by database. Source: The Authors (2025).
Figure 3 illustrates a significant growth in publications starting from 2020. This upward trend correlates with the global acceleration of digital transformation triggered by the COVID-19 pandemic, which forced construction companies to adopt remote monitoring tools. The peak between 2022 and 2024 reflects the maturation of these initiatives, where ad hoc dashboards evolved into integrated management systems. The continued interest in 2025 suggests that BI has moved from a ‘novelty’ to a fundamental competency in modern construction management.
Figure 3.
Temporal and quantitative analysis of published articles. Source: The Authors (2025).
In 2025, 14 publications were recorded, a number corresponding to the current year of the present study, suggesting that the volume of research may continue to grow throughout the remainder of the period. This trend confirms the consolidation of BI as a relevant theme and one of increasing scholarly interest.
The analysis of the geographical distribution of scientific production (Figure 4) reveals the presence of Business Intelligence applications in both developed and developing countries. In Europe and North America, countries such as the United States, Canada, Portugal, and the United Kingdom stand out, reflecting their established leadership in technological innovation and applied research. Notably, developing economies also play a prominent role, with Brazil exhibiting the highest number of publications, followed by India, Indonesia, South Africa, Egypt, and Saudi Arabia. This distribution suggests a growing adoption of BI in emerging markets, particularly in the construction sector, driven by the increasing accessibility and cost-effectiveness of digital technologies. In this context, Microsoft Power BI emerges as a preferred solution due to its low entry barriers, often integrated into existing Office 365 licences, when compared to high-cost enterprise platforms such as Oracle or SAP, making it especially attractive in cost-sensitive construction markets.
Figure 4.
Geographical distribution of publications. Source: The Authors (2025).
Figure 5 highlights that certain studies stand out for their extensive influence on the literature on BI in companies. The articles by [29,47] have 318 and 305 citations, respectively, establishing themselves as key references in the field. Other notable studies include [48,49,50], each with more than 80 citations, further underscoring the significance of these authors in disseminating BI concepts and applications in the corporate context.
Figure 5.
Most cited articles [29,47,48,49,50,51,52,53,54,55,56,57,58,59,60,61,62,63,64,65]. Source: The Authors (2025).
The majority of publications have fewer citations, which in many cases reflects their recent release and the growing interest of the scientific community in the topic. These studies contribute to diversifying approaches and updating discussions on the use of BI within organizations.
The following section explores the qualitative results of the research, focusing on the content analysis of the selected articles.
3.2. Qualitative Analysis
Table 3 presents the articles included in the final phase of the SLR, identified using the PRISMA method and snowball sampling, after applying the previously established eligibility criteria. A total of 81 scientific publications were analyzed, obtained from Scopus, Web of Science, Google Scholar, and ScienceDirect databases.
Table 3.
Finals Articles.
The complete characterization of the 81 analyzed articles, detailing authors, specific titles, databases, and methodological approaches, is available in Supplementary Material S1. The following section presents the answers to the previously established research questions, which guided the investigation and structured the data analysis.
3.2.1. BI Tools Applied in Companies (RQ1)
The main tools applied in company processes identified in the analyzed articles are presented below. As shown in Figure 6, the BI tools most used in companies are Microsoft Power BI, Tableau, Qlik, Oracle BI, SAP BusinessObjects, and Pentaho.
Figure 6.
Most cited BI tools. Source: The Authors (2025).
Power BI is the most frequently cited tool in the studies, used primarily to monitor performance indicators (KPIs), control operational costs, track construction schedules, and analyze financial results. Its widespread adoption is attributed to its ease of use, integration with the Microsoft suite, and low implementation cost, factors that make it accessible to small- and medium-sized companies [29,43,55].
Beyond cost and usability, the dominance of Power BI reflects a phenomenon of ‘Data Democratization’ in the construction sector. Unlike legacy systems as Oracle BI and SAP that require specialized IT teams [15,16,17], Power BI empowers engineers and project managers to act as ‘citizen developers’. This lowers the barrier to entry for SMEs but introduces challenges regarding data governance and standardization, as non-technical users create decentralized dashboards without rigorous validation.
Tableau and Qlik stand out among organizations seeking visual analytics and interactive data exploration, particularly for comparing departmental performance, identifying bottlenecks in production processes, and monitoring real-time data. These tools enable the development of dashboards through visual charts, facilitating the interpretation and cross-analysis of variables such as cost, time, and productivity across different business units [49,106], thus promoting greater agility in corporate management.
In large companies, there is a preference for more comprehensive corporate solutions such as Oracle BI and SAP BusinessObjects, employed for financial performance control, risk management, profitability analysis, and auditing [47,60]. These tools offer advanced data governance features and integration with ERP systems, enabling the consolidation of information from different departments into a single platform. However, their high licensing costs and technical complexity limit their adoption in smaller companies and in sectors with low digital maturity.
Pentaho, in turn, is used in industrial and technology-oriented companies for production control, quality management, and monitoring the performance of machines and processes [86,90]. In addition, complementary tools such as Google Data Studio, Python, and R Studio have been used alongside other platforms for predictive analyses, such as demand forecasting, inventory optimization, and projections of future sales [17,67].
The consolidation of BI tools within companies demonstrates a trend in management practices, as these tools have evolved from simple visualization instruments to integrated systems for analyzing and controlling corporate metrics [55,66,121]. Thus, it is observed that the adoption of these tools varies according to the application area and the company’s maturity level, an aspect that will be further discussed in the next section.
3.2.2. Sectors Benefiting from the Application of BI Tools (RQ2)
Among the most frequently mentioned business sectors are Construction, Business Management, and Manufacturing, which concentrate the largest investments in data visualization, system integration, and performance control, as shown in Figure 7.
Figure 7.
Sectors of BI application. Source: The Authors (2025).
In the Construction sector, tools such as Microsoft Power BI, Tableau, and Qlik Sense are used in combination with BIM (Building Information Modelling) to monitor costs, schedules, sustainability indicators, and productivity [65,76,80]. This integration has enabled a more predictive view of construction projects, reduced delays, and increased operational efficiency.
In Business Management, tools such as SAP BusinessObjects, Oracle BI, and IBM Cognos are used to monitor financial performance and control budgets [43,55,102]. In the Manufacturing Industry, as reported in eight publications, systems such as Power BI and Tableau predominate in production management, predictive maintenance, and quality control [66].
Other sectors, such as Health, Education, Public Institutions, and Supply Chains, have used tools such as Google Data Studio, Zoho Analytics, and Looker to visualize efficiency indicators, inventory management, and service performance [60,89,107].
Overall, the increasing use of BI across business sectors reflects a consistent trend toward digitalization. As observed, this trend is particularly prominent in the construction sector, especially with the widespread use of Power BI in its processes.
Crucially, the prominence of the Construction sector in these results, as shown in Figure 7, should be interpreted with caution. It likely reflects a concerted academic effort to address the industry’s historical lag in digitalization rather than implying that construction has achieved a higher level of BI maturity than data-native sectors like Finance or Retail. The high volume of publications indicates an ‘adoption phase’ where researchers are testing proofs-of-concept, contrasting with sectors where BI is already a consolidated commodity.
3.2.3. Power BI Applications in Construction Companies (RQ3)
The analysis of the studies shows that Power BI is the most frequently used BI tool in the construction sector, with applications across different stages of the project life cycle. As shown in Figure 8, its use is concentrated in design and planning (7 studies), construction management (5), and sustainability (3), in addition to complementary areas such as safety, budgeting, IT, procurement, and human resource management.
Figure 8.
Processes within the construction sector in which Power BI is applied. Source: The Authors (2025).
In the domain of Planning and Scheduling, Power BI integrates with BIM (Building Information Modelling) and Primavera/MS Project data to analyze costs, project schedules, and the performance of construction models. Within the Construction 4.0 framework, these integrations represent a shift from static Gantt charts to dynamic dashboards [30,55,76]. By linking BIM models with Power BI, companies can visualize deviations in the critical path and track the Schedule Performance Index (SPI) in real-time, allowing managers to anticipate delays before they impact the final delivery date.
The integration of Power BI with BIM represents the application cluster identified in this review. Studies indicate that Power BI serves as a bridge for the ‘Information’ component of BIM, enabling the visualization of non-geometric parameters, such as cost estimates, sustainability metrics (LCA), and facility management data, that are often buried within complex BIM authoring tools [29,76,77]. This symbiosis aligns directly with the goal of sustainable building performance prediction, as it allows managers to track real-time deviations against the planned BIM baseline.
By linking BIM models with Power BI, companies overcome the visualization limitations of native BIM software, democratizing access to semantic data for non-technical stakeholders. Furthermore, recent studies demonstrate that integrating Power BI with IoT sensors and UAV data facilitates the creation of rudimentary Digital Twins. In this configuration, Power BI acts as a dynamic interface that superimposes real-time physical data onto the digital model, enabling proactive monitoring of safety and progress. In construction management, the tool is used to monitor productivity, resource utilization, and physical progress through real-time dashboards that integrate data from UAVs, sensors, and control systems [52,65,122].
In sustainability initiatives, Power BI supports life-cycle and energy-efficiency analyses, enabling the visualization of environmental impacts and performance indicators [75,77,80].
Regarding Risk Management, the literature highlights the use of Power BI to reduce uncertainty in decision-making. Studies such as [109] demonstrate how dashboards can visualize risk registers and probability-impact matrices, allowing managers to prioritize mitigation actions based on data rather than intuition. In this context, Power BI acts as a centralizing interface that aggregates risk indicators from various project phases, preventing critical threats from being overlooked in complex data environments.
Other authors explored applications related to occupational safety [74], budget control and procurement [71,78], information management [69], and organizational development [79]. In all cases, Power BI stands out for its ability to integrate data and transform it into dashboards, strengthening decision-making and organizational culture within construction companies.
3.2.4. Benefits of Applying Power BI (RQ4)
The analysis of the studies indicates that Power BI has contributed to processes within construction companies, particularly in data integration, operational efficiency, and decision support, as shown in Figure 9. Among the articles examined, data integration was the most frequently reported benefit, appearing in eight studies, highlighting Power BI’s ability to integrate diverse databases and consolidate them into a unified structure, including data from BIM, GIS, the Microsoft Office Suite, sensors, and corporate systems [51,55,65,76]. This integration enhances communication between technical and management teams, reducing inconsistencies and strengthening control over sector indicators [30,75].
Figure 9.
Power BI’s benefits. Source: The Authors (2025).
The studies also highlight gains in operational efficiency [22,53,58,61,111], with the use of dashboards to monitor project progress, resources, and productivity in real time, optimizing planning and reducing rework. In parallel, process automation, reported by [50], demonstrates the potential of combining Power BI with PowerApps to digitize manual controls and accelerate administrative workflows. At the same time, the study of [113] emphasizes improvements in data accuracy for quantity estimates and automated measurements.
Finally, five studies emphasized the role of Power BI in decision support demonstrating its relevance for interpreting risks and projecting sustainability scenarios [80,98,110,114].
Overall, the reviewed articles corroborate that Power BI, as a Business Intelligence tool, has contributed to improved management by providing relevant information to process stakeholders. However, a critical analysis of the reported benefits reveals opportunities for improvement, which are discussed in the following section.
Specifically, the evidence indicates a dichotomy between descriptive and predictive capabilities. While studies frequently refer to “decision support,” most Power BI applications remain restricted to descriptive analytics, such as dashboards monitoring “what happened” in terms of costs and schedules. Empirical evidence of predictive analytics, using collected data to forecast risks or simulate future scenarios through AI, remains scarce. This suggests that although Power BI effectively visualizes the current project status, the transition towards prognostic management within the Construction 4.0 context remains at an early stage.
3.2.5. Gaps Identified in the Use and Implementation of Power BI in Companies (RQ5)
Despite significant advances in the adoption of Power BI in the construction sector, the reviewed studies reveal technical, operational, and organizational weaknesses that still hinder its full use. Figure 10 summarizes the main gaps identified: interoperability issues between BIM and BI, lack of data standardization, insufficient automation of information collection, deficiencies in technological infrastructure, and user resistance.
Figure 10.
Power BI’s gaps. Source: The Authors (2025).
Among these gaps, interoperability between BIM and BI is the most frequently encountered challenge. Authors such as [56,64,65,76] point out that automating the extraction of data from BIM models for integration with Power BI remains slow and labor-intensive due to format incompatibilities, the absence of standardized APIs, and the need for manual data conversion. This technical limitation prevents continuous information flows and hinders BI from achieving its full analytical capacity, making reports dependent on human adjustments and reducing the reliability of dashboards.
In addition, several authors [52,66,69] indicate that the lack of automation and data standardization, combined with undefined performance indicators (KPIs), restricts the potential of Power BI, keeping its use mostly descriptive. In parallel, human and organizational issues, such as lack of training, user resistance, and insufficient qualified technical staff, were also reported [51,79].
These factors reinforce a central point highlighted by multiple studies: no BI tool can operate at its full capacity without well-defined internal processes, consistent data, and trained professionals. Without these foundational elements, information management becomes fragmented, limiting the ability of BI to generate knowledge and serve as decision support. Thus, the successful use of Power BI in the construction sector depends less on the tool itself and more on companies’ digital and informational maturity, which requires standardization, interoperability, and an integrated analytical culture.
3.2.6. Practical Implications
To guide practitioners in overcoming the identified barriers, specifically data fragmentation and cultural resistance, this study proposes a four-stage implementation roadmap, illustrated in Figure 11. This roadmap is not prescriptive but synthesizes recurring success factors and implementation patterns identified across the reviewed case studies.
Figure 11.
Roadmap for Power BI Implementation in Construction 4.0. Source: The Authors (2025).
This framework synthesizes the success factors observed in the reviewed case studies and offers a structured path towards Construction 4.0 maturity:
Phase I: Data Structuring and Governance (The Foundation). The review highlighted that lack of standardization is a primary failure factor [48,58,118]. Therefore, the first step is not software acquisition but data governance. Companies must integrate disparate sources (ERPs, legacy spreadsheets, and financial software) into a structured data warehouse [57,63,73,97]. As consistently reported in the reviewed studies, digital transformation requires rethinking internal processes to ensure that data feeding Power BI is consistent, validated, and error-free [55,64,89,113,123].
Phase II: Strategic Alignment of KPIs. To avoid dashboard fatigue, where managers are overwhelmed by irrelevant data, implementation must be driven by strategy, not technology. As noted by [65,120], reducing data overload through selectivity and customization is essential to maintain user engagement and ensure accurate data interpretation. Based on the findings, it is crucial to define Key Performance Indicators (KPIs) before dashboard design, ensuring alignment with organizational strategy. For instance, studies by [66,67] demonstrate the utility of defining specific metrics like the Schedule Performance Index (SPI) and the Cost Performance Index (CPI) to monitor project health effectively. This ensures that visualizations directly support specific organizational goals, such as waste reduction or timeline adherence [54].
Phase III: Construction 4.0 Integration (CDE & Digital Twins). This phase addresses the critical interoperability gap identified in the reviewed case studies [55,70,78]. Practitioners should leverage Power BI’s API capabilities to serve as the visualization layer of the Common Data Environment (CDE). Advanced implementation involves linking semantic data from BIM models with dynamic feeds from IoT sensors and UAVs [122]. This integration enables the creation of Digital Twins, allowing managers to transition from static monthly reports to real-time monitoring of physical progress and facility management [121].
Phase IV: Cultural Democratization (Citizen Developers). Training empowers stakeholders to solve specific site-related problems autonomously, fostering a bottom-up culture of data-driven decision-making. As noted by [113], modern BI tools require only limited training to be effectively used by non-specialists, thereby reducing dependency on IT departments and associated operational costs. Similarly, according to [84], the active participation of employees in defining their own KPIs promotes a strong culture of responsibility and continuous improvement, ensuring greater commitment to organizational goals. To sustain this culture, as noted by [106], organizations must prioritize proficiency by training personnel to interpret data for decision-making, which drives community-led continuous improvement. In this context, as argued by [5], identifying skills gaps and implementing upskilling programs are essential steps for adapting the workforce to the technological profiles required by Industry 4.0. To mitigate user resistance and address skills gaps, firms should adopt a Citizen Developer strategy. Given the low-code nature of Power BI, non-IT professionals, such as civil engineers and site managers, can develop their own analytical solutions, with investments in data literacy further empowering stakeholders to address site challenges autonomously.
Although the roadmap is illustrated through Power BI, its phased structure is transferable to the implementation of other BI platforms in construction contexts.
4. Discussion
4.1. Dominance of Power BI in Relation to Prior BI Literature
The prevalence of Microsoft Power BI observed in this review reflects broader tendencies identified in the Business Intelligence literature toward the adoption of more accessible and user-oriented analytical platforms. Earlier studies on BI implementation have often focused on enterprise-scale solutions such as SAP BI, Oracle BI, or SAS, typically characterized by high implementation costs, strong dependence on specialized IT teams, and centralized analytical structures [124,125,126]. In contrast, the evidence reviewed suggests an increasing preference for platforms that enable decentralized data analysis and greater managerial autonomy.
Within the construction sector, according to [127,128], this shift appears to be closely associated with contextual constraints, including fragmented data environments, project-based organizational structures, and limited investment capacity. Rather than indicating technological superiority per se, the prominence of Power BI may therefore be interpreted as a response to sector-specific operational realities. This observation is consistent with prior research highlighting the importance of organizational fit in the adoption of digital technologies, suggesting that BI platform selection is influenced as much by usability and integration flexibility as by analytical capabilities [129,130].
In this context, rather than emerging as a fully integrated layer, BI in civil construction currently occupies an intermediate position within the broader Construction 4.0 agenda [39,131]. Although the literature increasingly associates Construction 4.0 with real-time data integration and intelligent decision support, the reviewed studies reveal that BI tools are most often used to consolidate and visualize information after events have occurred. This suggests that, in many cases, BI adoption follows digitalization efforts rather than actively shaping them.
Comparative studies on digital transformation in construction have long pointed to this sequencing problem, in which technologies are adopted in isolation rather than as part of a coherent data strategy. The findings of this review reinforce that observation by showing how BI tools frequently operate alongside BIM, ERP, or IoT systems without fully exploiting their analytical synergies. As a result, the promise of Construction 4.0 as a data-driven management paradigm remains only partially realized in current BI applications.
Furthermore, the review reveals that the entrepreneurs’ choice of a BI approach is primarily driven by a trade-off between accessibility and governance. As noted by [65], the lack of specialized skills often discourages the use of platforms, driving the selection of user-friendly tools that reduce data overload and support appropriate interpretation, For Small- and Medium-sized Enterprises (SMEs), the decision is guided by cost-effectiveness and ease of integration with existing tools (e.g., Office 365), unlike competitors such as Tableau, Power BI requires no programming skills and integrates seamlessly with the Microsoft ecosystem, making it a preferred entry point as also evidenced in the small retail case study by [119]. Conversely, large enterprises often prioritize robustness and centralized data governance, opting for legacy platforms like SAP or Oracle despite higher costs [57]. Thus, the selection of a BI tool is not merely technical but strategic, reflecting the organization’s specific digital maturity and investment capacity.
Finally, it is worth noting that the construction sector is highly practice-oriented, meaning that innovations and practical case studies are often disseminated through industry newsletters, trade magazines, and local professional journals, known as grey literature, rather than indexed academic channels. While these sources fall outside the scope of Scopus and Web of Science databases, selected here to ensure methodological rigor, they represent a layer of information that often captures the immediate state of practice faster than peer-reviewed journals. Therefore, the academic literature analyzed in this review represents the consolidated theoretical body of knowledge, which may lag slightly behind the rapid, informal experimentation occurring on construction sites.
4.2. Descriptive vs. Predictive BI: Confirming or Extending Prior Findings
The widespread reliance on descriptive dashboards raises important questions about how decision support is conceptualized in construction organizations. While performance visualization undoubtedly enhances transparency and managerial awareness, it does not necessarily alter decision-making logic. The evidence reviewed suggests that BI is often used to confirm known problems, such as cost overruns or schedule delays, rather than to anticipate or prevent them [132].
This tendency aligns with what [133] argues: predictive analytics requires not only appropriate tools but also stable data pipelines, analytical expertise, and organisational willingness to act on probabilistic insights. Despite the technical availability of advanced analytics within platforms such as Power BI, their limited use suggests that construction firms continue to prioritise control and reporting over experimentation and forecasting, a pattern also identified by [134]. Consequently, the progression from descriptive to predictive BI appears to be gradual and uneven, reflecting broader patterns of analytical maturity in the sector.
Beyond these limitations, the reviewed literature consistently highlights organisational and governance-related factors as influential in shaping BI outcomes. Challenges such as data fragmentation, lack of standardised processes, limited interoperability between systems, and user resistance recur across different organisational and geographic contexts, a pattern also identified in the systematic literature review conducted by [135]. These issues suggest that BI implementation challenges in construction are not isolated cases but rather reflect broader structural characteristics of the sector.
Previous studies have emphasized the role of data governance, organizational culture, and skills development in enabling effective use of analytical tools. The synthesis provided by this review reinforces these arguments by showing that, in the absence of coherent governance frameworks and analytical capabilities, BI tools tend to reinforce existing practices rather than support more advanced forms of decision-making. Consequently, organizational readiness emerges as a critical condition for translating BI adoption into meaningful analytical use.
Furthermore, the literature reveals, according to [70,84], a gap regarding the integration of Artificial Intelligence (AI). While the synergy between AI and BIM is theoretically established for predictive maintenance and automated scheduling, the reviewed applications of Power BI are predominantly descriptive (hindsight) rather than predictive (foresight) [74,82]. The findings suggest that the sector is currently in a transitional phase: companies are using BI to structure their data ecosystems, a prerequisite, before they can effectively deploy AI algorithms for predictive analytics. Thus, Power BI currently acts as the data aggregator that will eventually feed AI models in a mature Construction 4.0 environment [88].
5. Conclusions
This systematic literature review analyzed 81 articles to examine the landscape of Business Intelligence (BI) tools in organizations, with a specific focus on the application of Microsoft Power BI in civil construction. The findings reveal a clear predominance of Power BI as the most frequently adopted BI solution, followed by Tableau and Qlik Sense. In the construction sector, Power BI is mainly used to integrate heterogeneous data sources supporting the monitoring of costs, schedules, and physical progress.
Despite the reported benefits in terms of operational efficiency and improved decision-making, the review indicates that most BI applications in construction remain limited to descriptive analytics, focusing on reporting and monitoring past performance rather than enabling predictive or prescriptive decision support.
From a practical standpoint, the results indicate that digital transformation in construction cannot be achieved solely through the acquisition of BI software licences. Effective Power BI implementation requires foundational investments in data governance, process standardization, and organizational culture. Construction managers should prioritize data quality and interoperability before dashboard development to ensure reliable results.
Within the Construction 4.0 context, the integration of BI platforms with a Common Data Environment (CDE) emerges as an enabler for more advanced applications, such as Digital Twins. Such integration can enhance real-time monitoring and responsiveness to deviations in cost, schedule, and productivity at the project level.
From an academic perspective, this review identifies a significant research gap related to interoperability between BI and construction-specific digital technologies. The literature frequently reports the need for manual data handling to connect BIM and BI systems, underscoring the lack of automated interfaces, standardized data schemas, and robust APIs.
Moreover, there is a clear scarcity of studies investigating the progression from descriptive BI dashboards towards predictive and AI-driven analytics in construction. Future research should explore how Machine Learning and Generative AI techniques can be embedded within BI platforms to support risk forecasting, scenario analysis, and proactive decision-making, thereby advancing analytical maturity within Construction 4.0.
This review acknowledges limitations related to the concentration of empirical studies in specific geographic regions as well as the restriction to selected academic databases.
Future research should expand the scope of analysis through cross-country comparative studies and investigate the long-term return on investment (ROI) of BI adoption, especially in small- and medium-sized enterprises (SMEs). Longitudinal studies are also recommended to assess how BI maturity evolves in construction organizations.
Supplementary Materials
The following supporting information can be downloaded at: https://www.mdpi.com/article/10.3390/buildings16040869/s1, PRISMA-S checklist [136]; Table S1: Full version of Table 3.
Author Contributions
Conceptualization, O.I.S.Z. and A.C.L.J.; Methodology, O.I.S.Z.; Validation, A.C.L.J.; Formal Analysis, O.I.S.Z. and A.C.L.J.; Investigation, O.I.S.Z.; Resources, O.I.S.Z. and A.C.L.J.; Data Curation, O.I.S.Z.; Writing—Preparation of the Original Draft, O.I.S.Z.; Writing—Review and Editing, O.I.S.Z. and A.C.L.J.; Visualization, O.I.S.Z. and A.C.L.J.; Supervision, A.C.L.J. All authors have read and agreed to the published version of the manuscript.
Funding
This research has not received external funding.
Data Availability Statement
No new data were created or analyzed in this study. Data sharing is not applicable to this article.
Conflicts of Interest
The authors declare no conflicts of interest.
References
- Irigaray, H.A.R.; Stocker, F. Desafios e conexões nas dinâmicas organizacionais, econômicas e sociais contemporâneas. Cad. EBAPEBR 2024, 22, e91502. [Google Scholar] [CrossRef] [Scilit]
- Techio, L.R. MARRCO: Modelo Conceitual de Aprendizagem Organizacional em Rede para a Retenção do Conhecimento Organizacional; Universidade Federal de Santa Catarina Centro Tecnológico Programa de Pós-Graduação em Engenharia e Gestão do Conhecimento: Florianópolis, Brazil, 2024. [Google Scholar]
- Abdelfattah, F.; Madi, H.; Al-Washahi, M.; AlAraimi, A.; Nagi, S.; Abbas, M. Harnessing Artificial Intelligence, Business Intelligence, and Digital Technologies for Achieving Supply Chain Excellence in Oman: Investigating the Mediating Role of Predictive Analytics. J. Open Innov. Technol. Mark. Complex. 2025, 11, 100644. [Google Scholar] [CrossRef] [Scilit]
- Kgakatsi, M.; Galeboe, O.P.; Molelekwa, K.K.; Thango, B.A. The impact of big data on SME performance: A systematic review. Businesses 2024, 4, 632–695. [Google Scholar] [CrossRef] [Scilit]
- Silva, L.B.P.d.; Pontes, J.; Resende, L.M.; Marcondes, G.B.; Treinta, F.T.; Yoshino, R.T.; Mosconi, E. Smart skills decision-making tool for workforce 4.0 technology profile selection. Rev. Gest. Desenvolv. 2024, 21, 87–114. [Google Scholar]
- Isik, O.; Jones, M.; Sidorova, A. Business Intelligence Success: The Roles of BI Capabilities and Decision Environments. Inf. Manage. 2012, 50, 13–23. [Google Scholar] [CrossRef] [Scilit]
- Kalina, V.; Lhota, J.; Kalender, Z.T. Effective Project Portfolio Management for SMEs: A Conceptual Framework Using Business Intelligence Tools. Procedia Comput. Sci. 2025, 253, 745–756. [Google Scholar] [CrossRef] [Scilit]
- Lopes, A.B.; Boscarioli, C.; Pereira, E.N.; Bezerra, R.C. Business Intelligence para apoio à gestão na construção civil: Uma revisão sistemática da literatura. AtoZ Novas Prát. Em Inf. E Conhecimento 2020, 9, 74. [Google Scholar] [CrossRef] [Scilit]
- Qatawneh, N. Empirical Insights into Business Intelligence Adoption and Decision-Making Performance during the Digital Transformation Era: Extending the TOE Model in the Jordanian Banking Sector. J. Open Innov. Technol. Mark. Complex. 2024, 10, 100401. [Google Scholar] [CrossRef] [Scilit]
- Oliveira, J.P.; Araújo, E.P.O.; Oliveira, E. Gestão de dados para tomada de decisão em bibliotecas universitárias: A utilização de Power BI na construção de Dashboard. In Proceedings of the XXII Seminário Nacional de Bibliotecas Universitárias (2023), Florianópolis, Brazil, 28 November–1 December 2023. [Google Scholar]
- Tajeddini, O.; Tajeddini, K.; Gamage, T.C.; Hameed, W.U. Smart Insights, Stronger Performance: Leveraging Business Intelligence and Dynamic Capabilities in Tourism and Hospitality. Int. J. Hosp. Manag. 2026, 133, 104410. [Google Scholar] [CrossRef] [Scilit]
- Tirno, R.R. Effect of Business Intelligence on Organizational Competitiveness- Exploring the Mediation of Technology Anxiety. Comput. Hum. Behav. Rep. 2024, 16, 100536. [Google Scholar] [CrossRef] [Scilit]
- Silva, C.H.L.A.d.; Gonçalves, A.T.P.; Filho, M.L.L.; Filho, J.M.P. Aplicação do business intelligence e de ferramentas da qualidade na logística de uma indústria de acumuladores elétricos. Navus-Rev. Gest. E Tecnol. 2024, 14, 2. [Google Scholar] [CrossRef] [Scilit]
- Soares, A.C.F. Análise de Ferramentas de Business Intelligence com destaque dos serviços de BI na Cloud Computing. 2017. Available online: https://repositorio.uniube.br/handle/123456789/481 (accessed on 2 January 2026).
- Sharma, N.; Sarkar, D. Healthcare Data Analytics Using Power BI. Int. J. Softw. Innov. IJSI 2022, 10, 1–10. [Google Scholar] [CrossRef] [Scilit]
- Marroquim, B.S. Estudo da Arte da Metodologia Lean Construction no Brasil; Trabalho de Conclusão de Curso; Universidade Federal do Amazonas Faculdade de Tecnologia Curso de Engenharia Civil: Manaus, AM, Brazil, 2024. [Google Scholar]
- Oliveira, D.F.D. Proteção de Privacidade de Dados em Ambiente de Big Data Analytics: Um Estudo da Realidade Brasileira; Universidade de São Paulo: São Paulo, Brazil, 2023. [Google Scholar]
- Pregnolato, M.; Gunner, S.; Voyagaki, E.; De Risi, R.; Carhart, N.; Gavriel, G.; Tully, P.; Tryfonas, T.; Macdonald, J.; Taylor, C. Towards Civil Engineering 4.0: Concept, Workflow and Application of Digital Twins for Existing Infrastructure. Autom. Constr. 2022, 141, 104421. [Google Scholar] [CrossRef] [Scilit]
- Yoon, S.; Zhu, H.; Hwang, B.-G.; Min, O.S. Accelerating Digital Transformation in Construction: Best Practices for the Successful Implementation of Integrated Digital Delivery. Autom. Constr. 2025, 178, 106417. [Google Scholar] [CrossRef] [Scilit]
- Golestanizadeh, M.; Sarvari, H.; Chan, D.W.M.; Banaitienė, N.; Banaitis, A. Managerial Opportunities in Application of Business Intelligence in Construction Companies. J. Civ. Eng. Manag. 2023, 29, 487–500. [Google Scholar] [CrossRef] [Scilit]
- Kutnjak, A.; Pihir, I. Challenges, Issues, Barriers and Problems in Digital Transformation—Systematic Literature Review. In Proceedings of the 30th CECIIS, Varaždin, Croatia, 2–4 October 2019; pp. 133–140. [Google Scholar]
- Martins, A.; Bianchi de Aguiar, M.T.; Sambento, M.; Branco, M.C. Business Intelligence System Adoption and the Leveraging of Reporting Process Capabilities. J. Account. Organ. Change 2024, 21, 506–534. [Google Scholar] [CrossRef] [Scilit]
- Zavvari, A.; Jelodar, M.B.; Wilkinson, S.; Sutrisna, M. Construction Industry Capacity Evaluation: Using Business Intelligence for Data-Driven Insights. In Proceedings of the 23rd CIB World Building Congress EUA, West Lafayette, IN, USA, 19–23 May 2025; Volume 1. [Google Scholar]
- Alsaadi, O.; Alpkan, L.; Yildiz, B. Business Model Innovation as a Mediator between Construction 4.0 and Firm Performance: Evidence from Turkish Construction Companies. Int. J. Innov. Stud. 2024, 9, 77–89. [Google Scholar] [CrossRef] [Scilit]
- Dantas, A.T.C. A Importância da Simplificação de Informações na Construção Civil; Trabalho de Conclusão de Curso; Universidade Federal do Rio Grande do Norte: Natal, RN, Brazil, 2023. [Google Scholar]
- Xie, H.; Ge, Y.; Yi, J. Cost Control Analysis of Construction Projects Based on Wireless Communication and Artificial Intelligence Decisions. Wirel. Commun. Mob. Comput. 2022, 2022, 8505922. [Google Scholar] [CrossRef] [Scilit]
- Redação GS1 Brasil Apenas 5% das Empresas Brasileiras têm Inteligência de Dados. Available online: https://noticias.gs1br.org/5-das-empresas-tem-inteligencia-de-dados/ (accessed on 9 November 2025).
- Harode, A.; Ensafi, M.; Thabet, W. Buildings; Multidisciplinary Digital Publishing Institute: Basel, Switzerland, 2022; p. 852. [Google Scholar]
- Gerrish, T.; Ruikar, K.; Cook, M.; Johnson, M.; Phillip, M.; Lowry, C. BIM Application to Building Energy Performance Visualisation and Management: Challenges and Potential. Energy Build. 2017, 144, 218–228. [Google Scholar] [CrossRef] [Scilit]
- Santos, R.L.; Hüttl, R.M.C.; Vasconcelos, B.M. Uso do power BI para análises quantitativas de uma modelagem BIM arquitetônica: Um estudo de caso. Encontro Nac. Tecnol. Ambiente Construído 2024, 20, 1–13. [Google Scholar] [CrossRef] [Scilit]
- Leite, C.M.; Figueiredo, P.S.; Lopes, S.P.M.; Passos, F.U. Conceptualizing and measuring the digital transformation: A proposal for a measurement model. Cad. EBAPEBR 2024, 22, e2023-0081. [Google Scholar] [CrossRef] [Scilit]
- Rogers, D.L. The Digital Transformation Playbook: Rethink Your Business for the Digital Age, 1st ed.; Autêntica Business: São Paulo, Brazil, 2017; ISBN 978-85-513-0273-6. [Google Scholar]
- Guimarães, J.C.d.A. As Principais Barreiras para Implementação de Tecnologias Digitais na Construção Civil no Brasil: Uma Revisão da Literatura; Trabalho de Conclusão de Curso; Universidade Federal da Paraíba: João Pessoa, Brazil, 2025. [Google Scholar]
- Shafiee Kristensen, S.; Shafiee, S.; Shafiee, M.; Hvam, L. Challenges of Digital Transformation: The Case of the Non-Profit Sector. In Proceedings of the IEEM, Bangkok, Thailand, 16–19 December 2018. [Google Scholar]
- Boronos, V.; Plikus, I.; Aleksandrov, V.; Antoniuk, N. Digital Transformation of Ukraine: Challenges of Theory and Practice in Implementation of Digital Quality of Life. Econ. Ann.-XXI 2018, 172, 38–43. [Google Scholar] [CrossRef] [Scilit]
- Santos, S.M.A.V. Liderança 4.0: Navegando na era da Inteligência Artificial e da Transformação Digital; MultiAtual: Ciudad del Este, Paraguai, 2025; ISBN 978-65-6009-163-4. [Google Scholar]
- Trindade, J.T.P. Novas Tecnologias Como Fator de Mudanças no Processo de Modernização do Comércio Varejista: Estudos de Caso no Setor da Grande Distribuição. Tese de Dissertação, Universidade do Rio de Janeiro, Rio de Janeiro, Brazil, 1998. [Google Scholar]
- Segabinazzi, E.; Costa, F.B.d.; Silva, M.G. Impacto das novas tecnologias na gestão contábil das empresas. Res. Soc. Dev. 2025, 14, e5214749014. [Google Scholar] [CrossRef] [Scilit]
- Tanaka, C.A.; Matsuda, P.M.; Maclennan, M.L.F. Transformação Digital na Construção Civil no Brasil: Estratégias adotadas de desenvolvimento. Gest. Reg. 2024, 40, e20248242. [Google Scholar] [CrossRef] [Scilit]
- Moher, D.; Liberati, A.; Tetzlaff, J.; Altman, D.G.; the PRISMA Group. Preferred Reporting Items for Systematic Reviews and Meta-Analyses: The PRISMA Statement. Ann. Intern. Med. 2009, 151, 264–269. [Google Scholar] [CrossRef]
- Page, M.J.; McKenzie, J.E.; Bossuyt, P.M.; Boutron, I.; Hoffmann, T.C.; Mulrow, C.D.; Shamseer, L.; Tetzlaff, J.M.; Akl, E.A.; Brennan, S.E.; et al. Declaración PRISMA 2020: Una guía actualizada para la publicación de revisiones sistemáticas. Rev. Esp. Cardiol. 2021, 74, 790–799. [Google Scholar] [CrossRef]
- Toyoda, T.; Meyer, J.F. Revisão sistemática da literatura em arquitetura: Desafios e adaptações, aplicação às plantas de moradia. Ambiente Construído 2025, 25, e142895. [Google Scholar] [CrossRef] [Scilit]
- Nunes, I.D.S. Uso do Power BI para Tratamento de Dados de Aviação Operacional no CBMDF. In Monografia; Academia de Bombeiro Militar: Brasília, Brazil, 2021. [Google Scholar]
- Wohlin, C. Guidelines for Snowballing in Systematic Literature Studies and a Replication in Software Engineering. In Proceedings of the 18th International Conference on Evaluation and Assessment in Software Engineering, London, UK, 13–14 May 2014; Association for Computing Machinery: New York, NY, USA, 2014; pp. 1–10. [Google Scholar]
- Stefanovic, D.; Havzi, S.; Nikolic, D.; Dakic, D.; Lolic, T. Analysis of the Tools to Support Systematic Literature Review in Software Engineering. IOP Conf. Ser. Mater. Sci. Eng. 2021, 1163, 012013. [Google Scholar] [CrossRef] [Scilit]
- PRISMA. PRISMA 2020 Flow Diagram. Available online: https://www.prisma-statement.org/prisma-2020-flow-diagram (accessed on 13 November 2025).
- Ahmad, S.; Miskon, S.; Alabdan, R.; Tlili, I. Towards Sustainable Textile and Apparel Industry: Exploring the Role of Business Intelligence Systems in the Era of Industry 4.0. Sustainability 2020, 12, 2632. [Google Scholar] [CrossRef] [Scilit]
- Moscoso-Zea, O.; Castro, J.; Paredes-Gualtor, J.; Lujan-Mora, S. A Hybrid Infrastructure of Enterprise Architecture and Business Intelligence & Analytics for Knowledge Management in Education. IEEE Access 2019, 7, 38778–38788. [Google Scholar] [CrossRef] [Scilit]
- Dimara, E.; Zhang, H.; Tory, M.; Franconeri, S. The Unmet Data Visualization Needs of Decision Makers Within Organizations. IEEE Trans. Vis. Comput. Graph. 2022, 28, 4101–4112. [Google Scholar] [CrossRef] [Scilit] [PubMed]
- Hosen, M.; Islam, R.; Naeem, Z.; Folorunso, E.; Chu, T.S.; Mamun, M.A.A.; Orunbon, N. Data-Driven Decision Making: Advanced Database Systems for Business Intelligence. Nanotechnol. Percept. 2024, 20, 687–704. [Google Scholar] [CrossRef] [Scilit]
- Van Der Zwaag, M.; Wang, T.; Bakker, H.; Van Nederveen, S.; Schuurman, A.C.B.; Bosma, D. Evaluating Building Circularity in the Early Design Phase. Autom. Constr. 2023, 152, 104941. [Google Scholar] [CrossRef] [Scilit]
- Martinez, E.; Pfister, L. Benefits and Limitations of Using Low-Code Development to Support Digitalization in the Construction Industry. Autom. Constr. 2023, 152, 104909. [Google Scholar] [CrossRef] [Scilit]
- Mossalam, A.; Arafa, M. Using Artificial Neural Networks (ANN) in Projects Monitoring Dashboards’ Formulation. HBRC J. 2018, 14, 385–392. [Google Scholar] [CrossRef] [Scilit]
- Núñez-Cacho Utrilla, P.; Górecki, J.; Maqueira, J.M. Simulation-Based Management of Construction Companies under the Circular Economy Concept—Case Study. Buildings 2020, 10, 94. [Google Scholar] [CrossRef] [Scilit]
- Rodrigues, F.; Alves, A.D.; Matos, R. Construction Management Supported by BIM and a Business Intelligence Tool. Energies 2022, 15, 3412. [Google Scholar] [CrossRef] [Scilit]
- Valinejadshoubi, M.; Moselhi, O.; Iordanova, I.; Valdivieso, F.; Bagchi, A. Automated system for high-accuracy quantity takeoff using BIM. Autom. Constr. 2024, 157, 105155. [Google Scholar] [CrossRef] [Scilit]
- Gaol, F.L.; Abdillah, L.; Matsuo, T. Adoption of Business Intelligence to Support Cost Accounting Based Financial Systems—Case Study of XYZ Company. Open Eng. 2020, 11, 14–28. [Google Scholar] [CrossRef] [Scilit]
- Biagi, V.; Patriarca, R.; Di Gravio, G. Business Intelligence for IT Governance of a Technology Company. Data 2021, 7, 2. [Google Scholar] [CrossRef] [Scilit]
- Bugwandeen, K.; Ungerer, M. Exploring the Design of Performance Dashboards in Relation to Achieving Organisational Strategic Goals. S. Afr. J. Ind. Eng. 2019, 30, 161–175. [Google Scholar] [CrossRef] [Scilit]
- Mudau, T.N.; Cohen, J.; Papageorgiou, E. Determinants and Consequences of Routine and Advanced Use of Business Intelligence (BI) Systems by Management Accountants. Inf. Manag. 2024, 61, 103888. [Google Scholar] [CrossRef] [Scilit]
- Brooks, J.C.; Pinto, M.; Gill, A.; Hills, K.E.; Murthy, S.; Podgornik, M.N.; Hernandez, L.F.; Rose, D.A.; Angulo, F.J.; Rzeszotarski, P. Incident Management Systems and Building Emergency Management Capacity during the 2014–2016 Ebola Epidemic—Liberia, Sierra Leone, and Guinea. MMWR Suppl. 2016, 65, 28–34. [Google Scholar] [CrossRef] [Scilit] [PubMed]
- Alvarado, N.; McVey, L.; Elshehaly, M.; Greenhalgh, J.; Dowding, D.; Ruddle, R.; Gale, C.P.; Mamas, M.; Doherty, P.; West, R.; et al. Analysis of a Web-Based Dashboard to Support the Use of National Audit Data in Quality Improvement: Realist Evaluation. J. Med. Internet Res. 2021, 23, e28854. [Google Scholar] [CrossRef] [Scilit]
- Gonçalves, C.T.; Gonçalves, M.J.A.; Campante, M.I. Developing Integrated Performance Dashboards Visualisations Using Power BI as a Platform. Information 2023, 14, 614. [Google Scholar] [CrossRef] [Scilit]
- Nabil, D.H.; Rahman, M.d.H.; Chowdhury, A.H.; Menezes, B.C. Managing supply chain performance using a real time Microsoft Power BI dashboard by action design research (ADR) method. Cogent Eng. 2023, 10, 2257924. [Google Scholar] [CrossRef] [Scilit]
- Harode, A.; Thabet, W.; Dongre, P. A Tool-Based System Architecture for a Digital Twin: A Case Study in a Healthcare Facility. J. Inf. Technol. Constr. 2023, 28, 107–137. [Google Scholar] [CrossRef] [Scilit]
- Radman, K.; Jelodar, M.B.; Lovreglio, R.; Ghazizadeh, E.; Wilkinson, S. Real-Time Tracking and Analysis in Construction Projects: A RealCONs Framework. Adv. Eng. Inform. 2025, 67, 103511. [Google Scholar] [CrossRef] [Scilit]
- Pourrahimian, E.; Salhab, D.; Hamzeh, F.; AbouRizk, S. Entropy-Centric Framework for Understanding and Managing Project Dynamics in Construction. Autom. Constr. 2025, 170, 105928. [Google Scholar] [CrossRef] [Scilit]
- Cusumano, L.; Olsson, N.; Granath, M.; Jockwer, R.; Rempling, R. Clustering Techniques and Keyword Extraction with Large Language Models for Knowledge Discovery in Building Defects Data. Constr. Innov. 2025, 25, 76–97. [Google Scholar] [CrossRef] [Scilit]
- Böde, K.; Różycka, A.; Nowak, P. Development of a Pragmatic IT Concept for a Construction Company. Sustainability 2020, 12, 7142. [Google Scholar] [CrossRef] [Scilit]
- Gledson, B.; Rogage, K.; Thompson, A.; Ponton, H. Reporting on the Development of a Web-Based Prototype Dashboard for Construction Design Managers, Achieved through Design Science Research Methodology (DSRM). Buildings 2024, 14, 335. [Google Scholar] [CrossRef] [Scilit]
- Silva, P.M.; Domingo, N.; Ameer Ali, N.A.N. An Interactive Pre-Contract Dispute Avoidance Toolkit for New Zealand Construction Industry. Constr. Innov. 2025, 25, 268–291. [Google Scholar] [CrossRef] [Scilit]
- Teplická, K.; Steingartner, W.; Kádárová, J.; Hurná, S. Dashboards-Effective Instrument of Decision in Synergy with Software Support. Pol. J. Manag. Stud. 2020, 22, 565–582. [Google Scholar] [CrossRef] [Scilit]
- Andiani, F.M.; Abid, F.; Hendri, H.; Girsang, A.S. Business Intelligence for Generating Comprehensive Report in Electronic Completion and Handover. Adv. Sci. Technol. Eng. Syst. J. 2020, 5, 45–51. [Google Scholar] [CrossRef] [Scilit]
- Khan, N.; Nadeau, S.; Pham, X.-T.; Boton, C. Exploring Associations between Accident Types and Activities in Construction Using Natural Language Processing. Autom. Constr. 2024, 164, 105457. [Google Scholar] [CrossRef] [Scilit]
- Sadeghi, H.M.; Erhan, H. Comparative Analytics of Sustainability Data: A Dashboard for Exploring Alternatives through Life Cycle Assessment. In Proceedings of the CAADRIA, Hong Kong, China, 2–4 July 2025; Volume 3, pp. 549–558. [Google Scholar]
- Giuda, G.M.D.; Accardo, D.; Gasbarri, P.; Meschini, S.; Tagliabue, L.C.; Scomparin, L. BIM–GIS and BI Integration for Facility and Occupancy Management of Assets: The UNITe Pilot Case. In Proceedings of the CONVR 2023, Florence, Italy, 13–16 November 2023; pp. 419–430. [Google Scholar]
- Apellániz, D.; Alkewitz, T.; Gengnagel, C. Visualisation of building life cycle assessment results using 3D business intelligence dashboards. Int. J. Life Cycle Assess. 2024, 29, 1303–1314. [Google Scholar] [CrossRef] [Scilit]
- Valinejadshoubi, M.; Moselhi, O.; Iordanova, I.; Valdivieso, F.; Shakibabarough, A.; Bagchi, A. The Development of an Automated System for a Quality Evaluation of Engineering BIM Models: A Case Study. Appl. Sci. 2024, 14, 3244. [Google Scholar] [CrossRef] [Scilit]
- Hung, B.K.H.; To, C.C.N.; Fung, R.K.H.; Chan, C.C.S. Addressing Proficiency Gaps in Future Skills Between Employers and Learners Through Data Visualization. SN Comput. Sci. 2023, 4, 308. [Google Scholar] [CrossRef] [Scilit]
- Wei, G.; Mohd Sarman, A.; Gungat, L.; Li, M.; Shen, L.; Fang, G. Application of Building Information Modelling (BIM) Six Dimension (6D) in Green Buildings: A Case Study of Sunshine and Daylight Analysis. J. Kejuruter. 2023, 35, 511–521. [Google Scholar] [CrossRef] [Scilit]
- Parameswaran, A.; Ranadewa, K.A.T.O.; Rathnasinghe, A.P. Roles of lean learners for successful lean implementation in the construction industry: A force-directed graph. Int. J. Product. Perform. Manag. 2024, 73, 2673–2705. [Google Scholar] [CrossRef] [Scilit]
- Grobler-Dębska, K.; Mularczyk, R.; Gawęda, B.; Kucharska, E. Time Series Methods and Business Intelligent Tools for Budget Planning—Case Study. Appl. Sci. 2024, 15, 287. [Google Scholar] [CrossRef] [Scilit]
- Kočišová, M.; Slota, J.; Sukopová, D.; Fiľo, M. Enhancing Operational Efficiency with Business Intelligence: Industrial Applications. Adv. Sci. Technol. Res. J. 2025, 19, 252–265. [Google Scholar] [CrossRef] [Scilit]
- Nunes, F.; Alexandre, E.; Gaspar, P.D. Implementing Key Performance Indicators and Designing Dashboard Solutions in an Automotive Components Company: A Case Study. Adm. Sci. 2024, 14, 175. [Google Scholar] [CrossRef] [Scilit]
- Caldonazo, D.; Detro, S.P.; Rosa, C.R.M. Study for the Identification and Implementation of KPIs Monitored by Dashboards for an Electrical Discharge Machining Process in a Metalworking Industry. Gest. Prod. 2025, 32, e5324. [Google Scholar] [CrossRef] [Scilit]
- Araque González, G.; Suárez Hernández, A.; Gómez Vásquez, M.; Vélez Uribe, J.; Bernal Avellaneda, A. Sustainable Manufacturing in the Fourth Industrial Revolution: A Big Data Application Proposal in the Textile Industry. J. Ind. Eng. Manag. 2022, 15, 614. [Google Scholar] [CrossRef] [Scilit]
- Nascimento, J.; Frazão, N.; Teixeira, S.; Ribeiro, A.C. Dashboard for the Management and Acceptance of Customer Orders. Bus. Syst. Res. J. 2022, 13, 116–129. [Google Scholar] [CrossRef] [Scilit]
- Arman, A.; Lombardo, A.; Monti, F.; Mecella, M. Supporting Smart Manufacturing in the Space Industry: A Case Study. Eng. Rep. 2025, 7, e13089. [Google Scholar] [CrossRef] [Scilit]
- Lloret, Á.; Peral, J.; Ferrández, A.; Auladell, M.; Muñoz, R. A Data-Driven Framework for Digital Transformation in Smart Cities: Integrating AI, Dashboards, and IoT Readiness. Sensors 2025, 25, 5179. [Google Scholar] [CrossRef] [Scilit]
- Delgado, A.; Calegari, D.; Artus, A.; Borges, A. Integration of Business Process Data and Organizational Data for Evidence-Based Business Intelligence. CLEI Electron. J. 2021, 24, 7:1–7:19. [Google Scholar]
- Khayyat, M. JeddahDashboard (JDB): Visualization of Open Government Data in Kingdom of Saudi Arabia. Int. J. Adv. Comput. Sci. Appl. 2020, 11. [Google Scholar] [CrossRef] [Scilit]
- Lee, H.-M.; Long, J.; Visinescu, L. The Relationship between a Business Simulator, Constructivist Practices, and Motivation toward Developing Business Intelligence Skills. J. Inf. Technol. Educ. Res. 2016, 15, 593–609. [Google Scholar] [CrossRef] [Scilit] [PubMed]
- De Barba Perius, A.P.; Vasconcellos Leão Lyrio, M.; Silva Da Rosa, F. Estudo de caso sobre a participação das microempresas e empresas de pequeno porte em compras públicas no Estado de Santa Catarina com a utilização de data analytics. Navus-Rev. Gest. E Tecnol. 2023, 13, 1–23. [Google Scholar] [CrossRef] [Scilit]
- Kopnova, O.; Shaporeva, A.; Iklassova, K.; Kushumbayev, A.; Tadzhigitov, A.; Aitymova, A. Building an Information Analysis System within a Corporate Information System for Combining and Structuring Organization Data (on the Example of a University). East.-Eur. J. Enterp. Technol. 2022, 6, 20–29. [Google Scholar] [CrossRef] [Scilit]
- Oliveira, J.; Ayres Da Silva, A.L.M. A Data-Driven Analysis of Work-Related Accidents in the Brazilian Mining Sector (2019–2022). Int. J. Environ. Res. Public Health 2025, 22, 939. [Google Scholar] [CrossRef] [Scilit]
- Iris, N.; Nagalingham, S. Implementation of Business Intelligence Solution for United Airlines. Int. J. Adv. Comput. Sci. Appl. 2023, 14. [Google Scholar] [CrossRef] [Scilit]
- Hayardisi, G.; Seminar, K.B.; Ramadhan, A. Analysing Signal Strength and Connection Speed in Cloud Networks for Enterprise Business Intelligence. Telkomnika Telecommun. Comput. Electron. Control. 2018, 16, 1779. [Google Scholar] [CrossRef] [Scilit]
- Fernández-Sande, M.; Rodrí guez-Pallares, M. Big data in radio broadcasting companies: Applications and evolution. Prof. Inf. 2022, 31, e310516. [Google Scholar] [CrossRef] [Scilit]
- García-Santander, L.; San Martín-Ayala, J.; Ulloa-Vásquez, F.; Carrizo, D.; Esparza, V.; Rohten, J.; Mejias, C. Classification of Behavior Profiles for Non-Residential Customers Considering the Variable of Electrical Energy Consumption: Case Study—SAESA Group S.A. Company. Energies 2022, 15, 6634. [Google Scholar] [CrossRef] [Scilit]
- Castro, G.M.M.; Aitken, H.G.W.; Calvanapon, A.A. Business Intelligence Tools for a Digital Services Company in Peru, 2022. Int. J. Bus. Intell. Res. 2023, 14, 1–14. [Google Scholar] [CrossRef] [Scilit]
- Sanabia-Lizarraga, K.G.; Carballo-Mendívil, B.; Arellano-González, A.; Bueno-Solano, A. Business Intelligence for Agricultural Foreign Trade: Design and Application of Power BI Dashboard. Sustainability 2024, 16, 9576. [Google Scholar] [CrossRef] [Scilit]
- Santos, C.; Rocha, Á.; Silva, A. Management Accounting as a Business Intelligence System. Examination in Portuguese Small and Medium Enterprises. Neural Comput. Appl. 2025, 37, 25789–25803. [Google Scholar] [CrossRef] [Scilit]
- De Carvalho, C.P. Analysis of Payment Methods for a Candy Distributor Using BI Tools. Int. J. Prof. Bus. Rev. 2023, 8, e0952. [Google Scholar] [CrossRef] [Scilit]
- Risco-Ramos, R.; Pérez-Aguilar, D.; Casaverde-Pacherrez, L.; Vásquez-Díaz, E. Use of a Business Intelligence Framework in the Management of the Quality of the Electricity Supply in Small and Medium-Sized Companies. DYNA 2022, 89, 31–40. [Google Scholar] [CrossRef] [Scilit]
- Seguer, Z.S.; Hasna, A.M. Business Intelligence as a Challenge for the Managerial Function: Case Study on Managerial Decision Making in Algerian Companies. Bus. Ethics Leadersh. 2022, 6, 35–46. [Google Scholar] [CrossRef] [Scilit]
- Banerjee, S.; Fullerton, C.E.; Gaharwar, S.S.; Jaselskis, E.J. Strategic Web-Based Data Dashboards as Monitoring Tools for Promoting Organizational Innovation. Buildings 2025, 15, 2204. [Google Scholar] [CrossRef] [Scilit]
- Escalante Viteri, A.; Gamboa, J.A.; Asto Huaman, L.; Arangüena, M.R. Toma de decisiones en la usabilidad de la Banca por Internet Empresas mediante una Solución de Business Intelligence. Rev. Colomb. Comput. 2022, 23, 29–42. [Google Scholar] [CrossRef]
- Madyatmadja, E.D.; Madyatmadja, E.D.; Putri, A.S.; Hiqna, S.S.; Pratita, W. Data Dashboard for Decision Support Systems for Intrapreneurship in A Company. Adv. Sci. Technol. Eng. Syst. J. 2019, 4, 177–182. [Google Scholar] [CrossRef] [Scilit]
- Isah, M.A.; Kim, B.-S. Development of Knowledge Graph Based on Risk Register to Support Risk Management of Construction Projects. KSCE J. Civ. Eng. 2023, 27, 2733–2744. [Google Scholar] [CrossRef] [Scilit]
- Garani, G.; Tolis, D.; Savvas, I.K. A Trajectory Data Warehouse Solution for Workforce Management Decision-Making. Data Sci. Manag. 2023, 6, 88–97. [Google Scholar] [CrossRef] [Scilit]
- Mkhinini Gahar, R.; Arfaoui, O.; Sassi Hidri, M. Open Research Issues and Tools for Visualization and Big DataAnalytics. Int. J. Comput. Digit. Syst. 2024, 15, 1103–1117. [Google Scholar] [CrossRef] [Scilit] [PubMed]
- Al-Jazairi, A.S.; Horanieh, B.K.; Alswailem, O.A. The Usefulness of an Ambulatory Care Pharmacy Performance Dashboard during the COVID-19 Pandemic in a Complex Tertiary Care System. Am. J. Health. Syst. Pharm. 2021, 78, 813–817. [Google Scholar] [CrossRef] [Scilit] [PubMed]
- Torres, D.R.; Cardoso, G.C.P.; Abreu, D.M.F.D.; Soranz, D.R.; Oliveira, E.A.D. Aplicabilidade e potencialidades no uso de ferramentas de Business Intelligence na Atenção Primária em Saúde. Ciênc. Saúde Coletiva 2021, 26, 2065–2074. [Google Scholar] [CrossRef] [Scilit] [PubMed]
- Carvalho, M.G.; Adati, M.C.; Borges, H.C.B.G. Monitoramento Pós-Mercado Dos Testes Rápidos Para Detecção de Anticorpos Da COVID-19: Análise de Dados Da Plataforma Microsoft® Power Bi: Vigil Sanit Debate, Rio de Janeiro, 2024, v.12: E02131 | Publicado Em: 28/06/2024. Vigil. Sanit. Em Debate 2024, 12, e02131. [Google Scholar] [CrossRef] [Scilit]
- Sanchez-Obando, J.W.; Duque-Méndez, N.D.; Bedoya Herrera, O.M. Construction of the Invoicing Process through Process Mining and Business Intelligence in the Colombian Pharmaceutical Sector. Computers 2024, 13, 245. [Google Scholar] [CrossRef] [Scilit]
- Vicente, J.J.; Neves, L.; Bernardo, I. The Potential of Logistics 4.0 Technologies: A Case Study through Business Intelligence Framing by Applying the Delphi Method. Front. Artif. Intell. 2024, 7, 1469958. [Google Scholar] [CrossRef] [Scilit]
- Dibsi, J.; Cho, J. Data Management for Environmentally Sustainable and Profitable Business: Evidence from the Food Retail Industry. Sustainability 2023, 15, 16298. [Google Scholar] [CrossRef] [Scilit]
- Castillo-Cordero, L.; Contreras-Chihuán, M.; Meneses-Claudio, B. Datamart for the Analysis of Information in the Sales Process of the Company WC HVAC Engineering. Data Metadata 2024, 3, 184. [Google Scholar] [CrossRef] [Scilit]
- Ramírez, C.B.; Altamirano, J.Z.; Fierro, S.; Ramírez, A.M. Inteligencia de negocios para gestión de inventarios en las empresas importadoras de estructurales de calzado. Rev. Venez. Gerenc. 2025, 30, 994–1009. [Google Scholar] [CrossRef] [Scilit]
- Costinel Nica, I.; Crăciunescu, S.L.; Alexandru, D.; Ionescu, Ș.-A. Using of KPIs and Dashboard in the Analysis of Carrefour Company’s Performance Management. J. Organ. Manag. Stud. 2021, 2021, 852077. [Google Scholar] [CrossRef] [Scilit]
- Harode, A.; Ensafi, M.; Thabet, W. Linking BIM to Power BI and HoloLens 2 to Support Facility Management: A Case Study Approach. Buildings 2022, 12, 852. [Google Scholar] [CrossRef] [Scilit]
- Palomino Ojeda, J.M.; Quiñones Huatangari, L.; Cayatopa Calderon, B.A.; Piedra Tineo, J.L.; Apaza Panca, C.Z.; Milla Pino, M.E. Estimation of the Physical Progress of Work Using UAV and BIM in Construction Projects. Civ. Eng. J. 2024, 10, 362–383. [Google Scholar] [CrossRef] [Scilit]
- Aguiar, C.G.; Alcalá, S.G.S. Business Intelligence applied to inventory management: Case of a small retail company. Rev. Gest. E Secr. 2024, 15, e3457. [Google Scholar] [CrossRef] [Scilit]
- Breternitz, V.J. A Implementação de uma Ferramenta de Business Intelligence em uma Empresa de Pequeno Porte. Rev. Ubiquidade 2020, 2, 19–28. [Google Scholar]
- Bacarji, N.G.D. Implementação de uma Ferramenta de Business Intelligence na área de Recursos Humanos em uma Empresa de São Paulo; Universidade Federal de Uberlândia: Ituiutaba, Brazil, 2025; Available online: https://repositorio.ufu.br/handle/123456789/45500 (accessed on 2 January 2026).
- Sequeira, N.R.C. Roadmap para Implementação de Sistemas de Business Intelligence em Instituições de Ensino Superior. Tese de Doutorado, Universidade de Trás-os-Montes e Alto Douro, Vila Real, Portugal, 2024. [Google Scholar]
- Berlato, M.; Binni, L.; Durmus, D.; Gatto, C.; Giusti, L.; Massari, A.; Toldo, B.M.; Cascone, S.; Mirarchi, C. Digital platforms for the built environment: A systematic review across sectors and scales. Buildings 2025, 15, 2432. [Google Scholar] [CrossRef] [Scilit]
- dos Reis, B.; PAULA, D.; ENAMI, L.; Lapasini Leal, G.C. Construção e Implementação de Business Intelligence Para Gestão de Indicadores Em Uma Cooperativa Agroindustrial; ENEGEP: Natal, Brazil, 2023. [Google Scholar]
- Neto, P.F.d.S. Implementação de Business Intelligence Através da Metodologia CRISP-DM Para Apoiar Tomada de Decisão Estratégica em uma Corretora de Imóveis; Trabalho de Conclusão de Curso; Universidade Federal de Ouro Preto: Ouro Preto, Brazil, 2022. [Google Scholar]
- Sales, M.T.d.P.S.; Lima, E.C.S.; Caridade, E.R.d.S. Desenvolvimento e Implementação de um Sistema de Business Intelligence para Monitoramento de Acessos Corporativos. Rev. Ibero-Am. Humanidades Ciênc. E Educ. 2024, 10, 7087–7100. [Google Scholar] [CrossRef] [Scilit]
- Omol, E.; Mburu, L.; Abuonji, P. Unlocking Digital Transformation: The Pivotal Role of Data Analytics and Business Intelligence Strategies. Int. J. Knowl. Content Dev. Technol. 2024, 14, 77–91. [Google Scholar]
- Murguia, D.; Chen, Q.; van Vuuren, T.J.; Rathnayake, A.; Vilde, V.; Middleton, C. Digital Measurement of Construction Performance: Data-Todashboard Strategy. In Proceedings of the IOP Conference Series: Earth and Environmental Science, Chennai, India, 15–16 March 2022; IOP Publishing: Bristol, UK, 2022. [Google Scholar]
- Nyoni, R. Harnessing Data Analytics for Predictive Insights: Advancing Decision- Making with Big Data Innovations. Int. J. Res. Publ. Rev. 2025, 6, 2915–2936. [Google Scholar] [CrossRef] [Scilit]
- Gajera, R. International Journal of Scientific Research in Civil Engineering. Integr. Power Bi Proj. Control Syst. Enhancing Real-Time Cost Track Vis. Constr. 2023, 7, 154–160. [Google Scholar]
- Bena, Y.A.; Ibrahim, R.; Mahmood, J.; Al-Dhaqm, A.; Alshammari, A.; Nasser, M.; Nura Yusuf, M.; Ayemowa, M.O. Big Data Governance Challenges Arising from Data Generated by Intelligent Systems Technologies: A Systematic Literature Review. IEEE Access 2025, 13, 12859–12888. [Google Scholar] [CrossRef] [Scilit]
- Rethlefsen, M.L.; Kirtley, S.; Waffenschmidt, S.; Ayala, A.P.; Moher, D.; Page, M.J.; Koffel, J.B. PRISMA-S: An extension to the PRISMA statement for reporting literature searches in systematic reviews. Syst. Rev. 2021, 10, 39. [Google Scholar] [CrossRef] [Scilit]
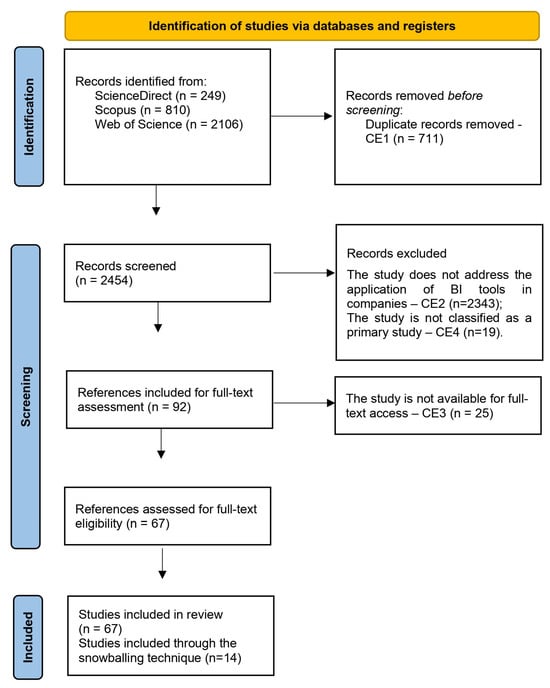
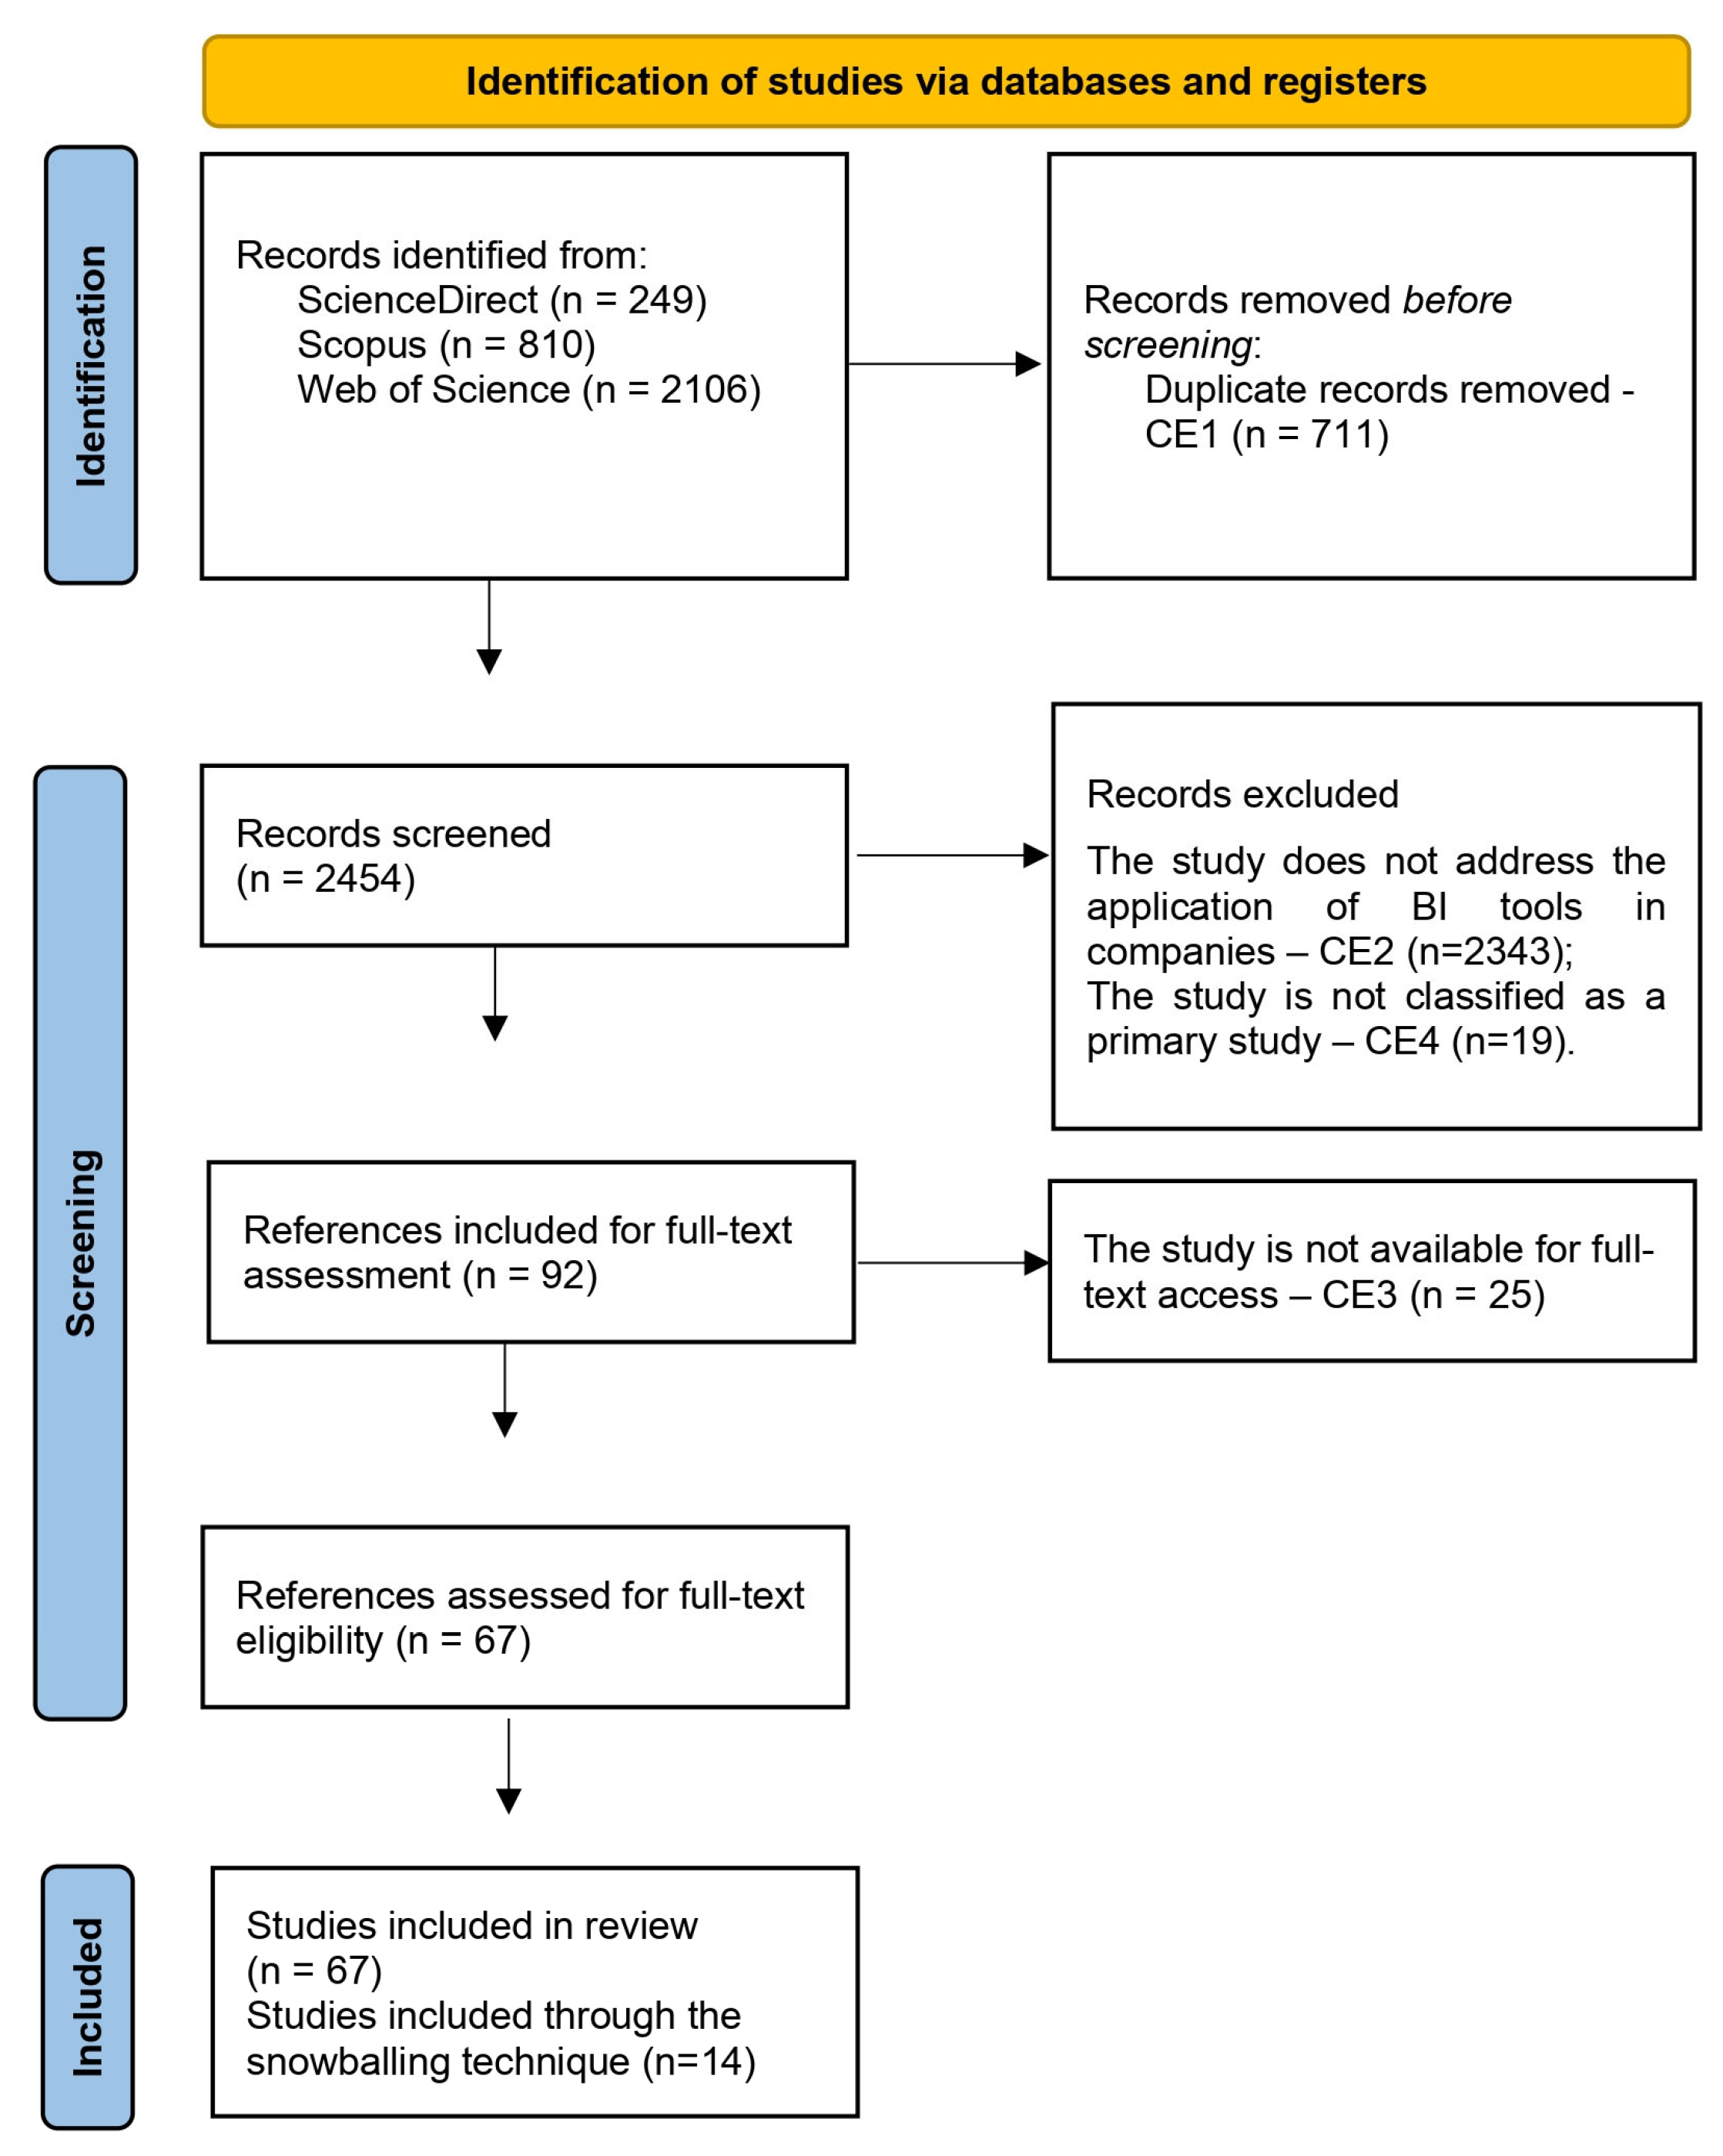
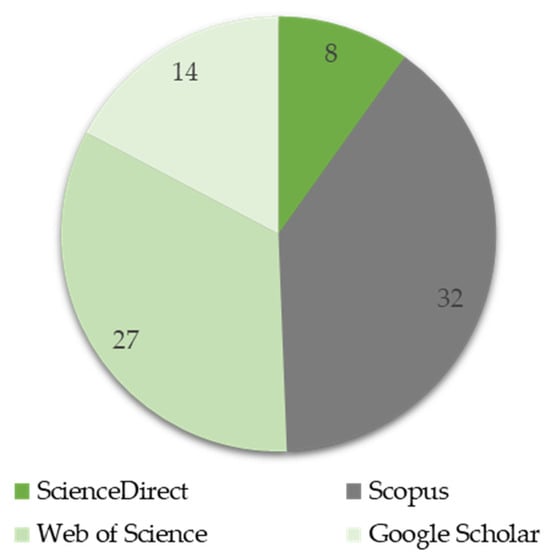
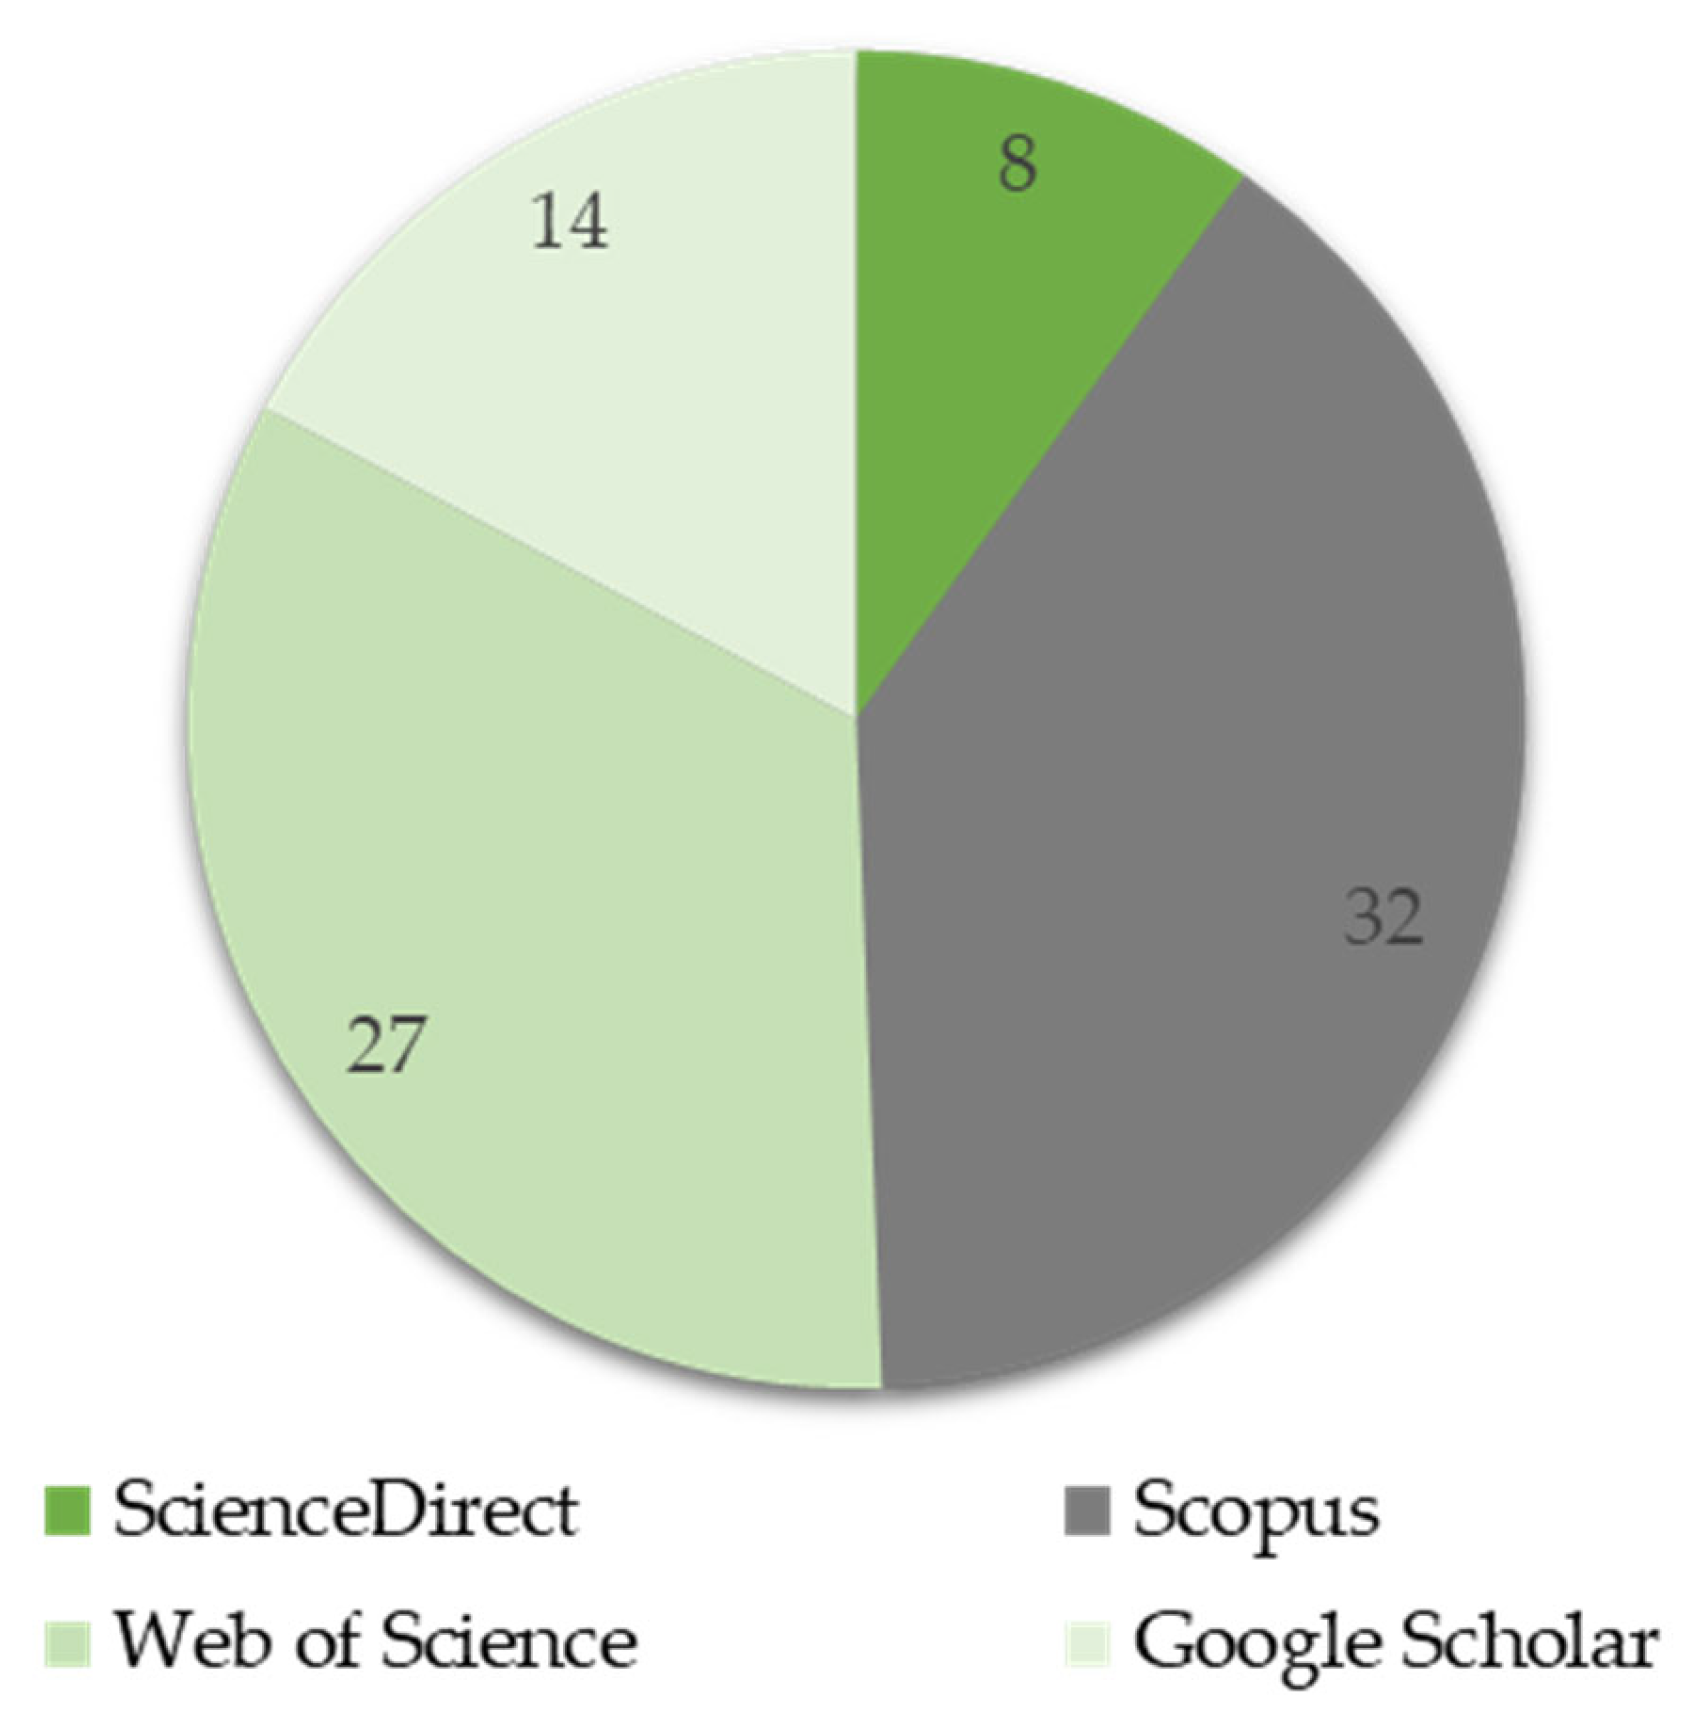
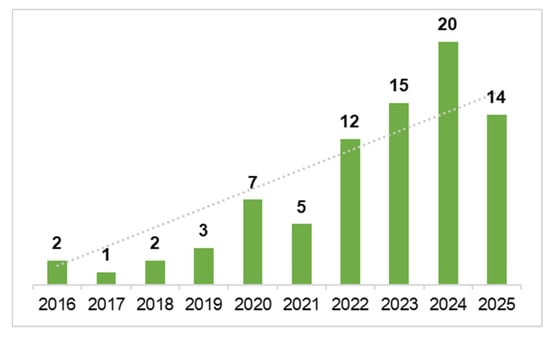
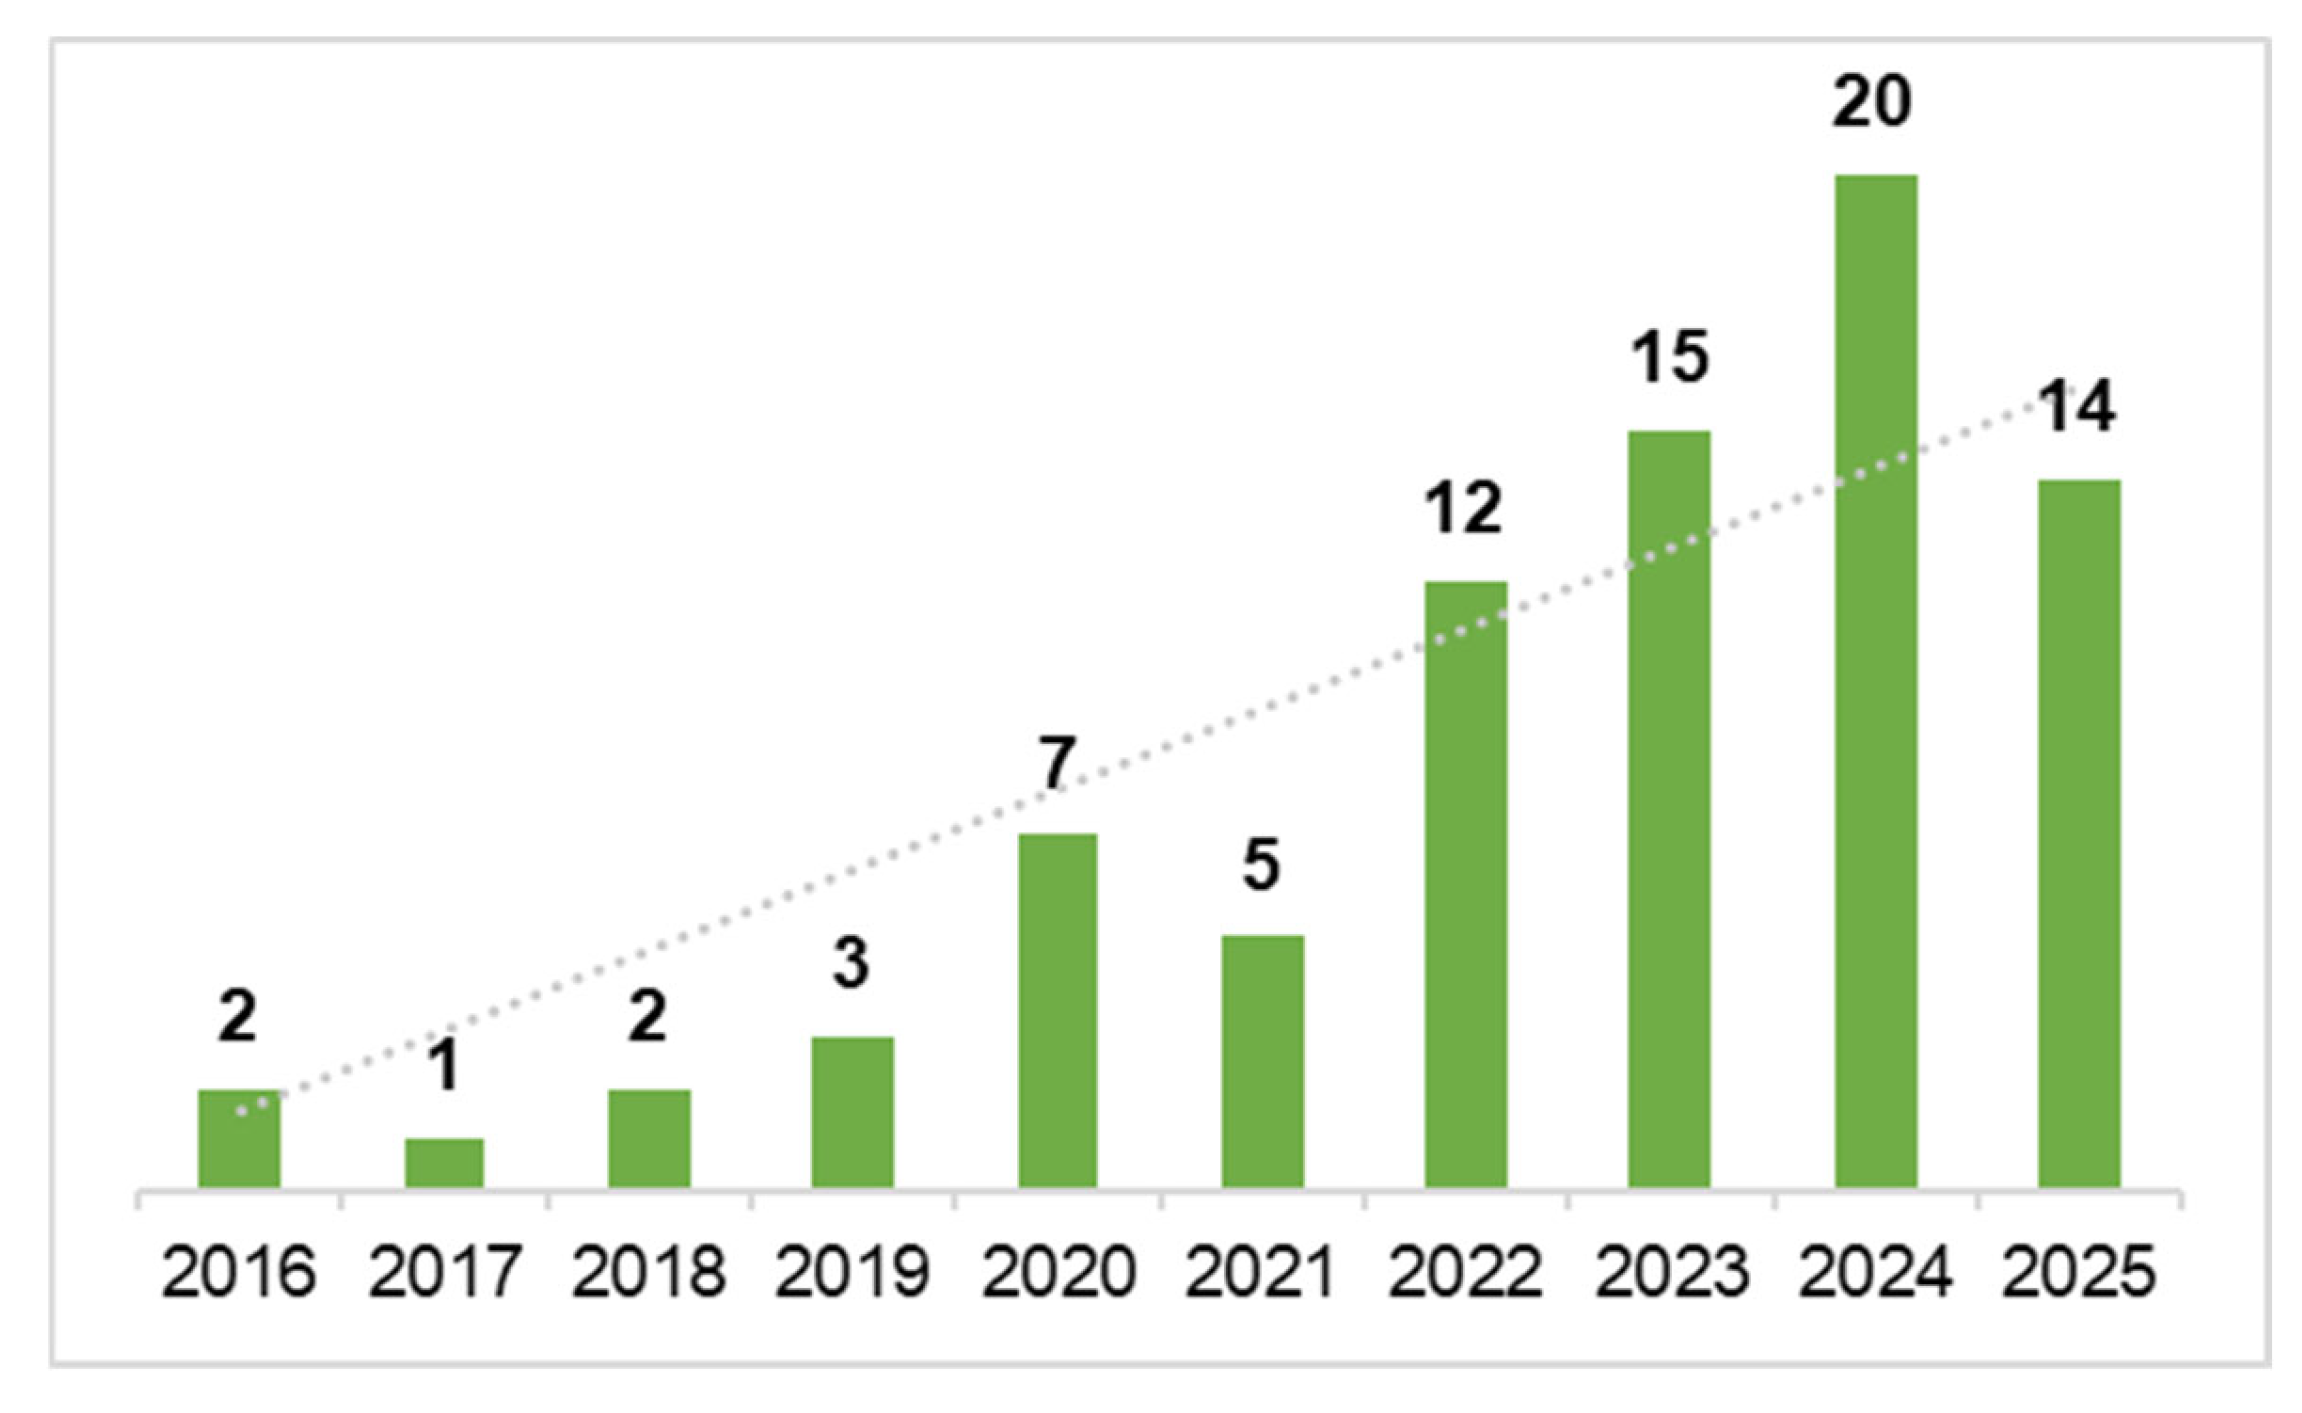
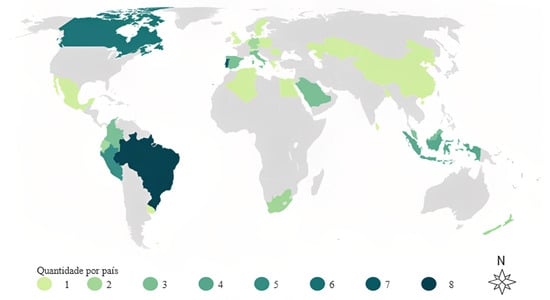
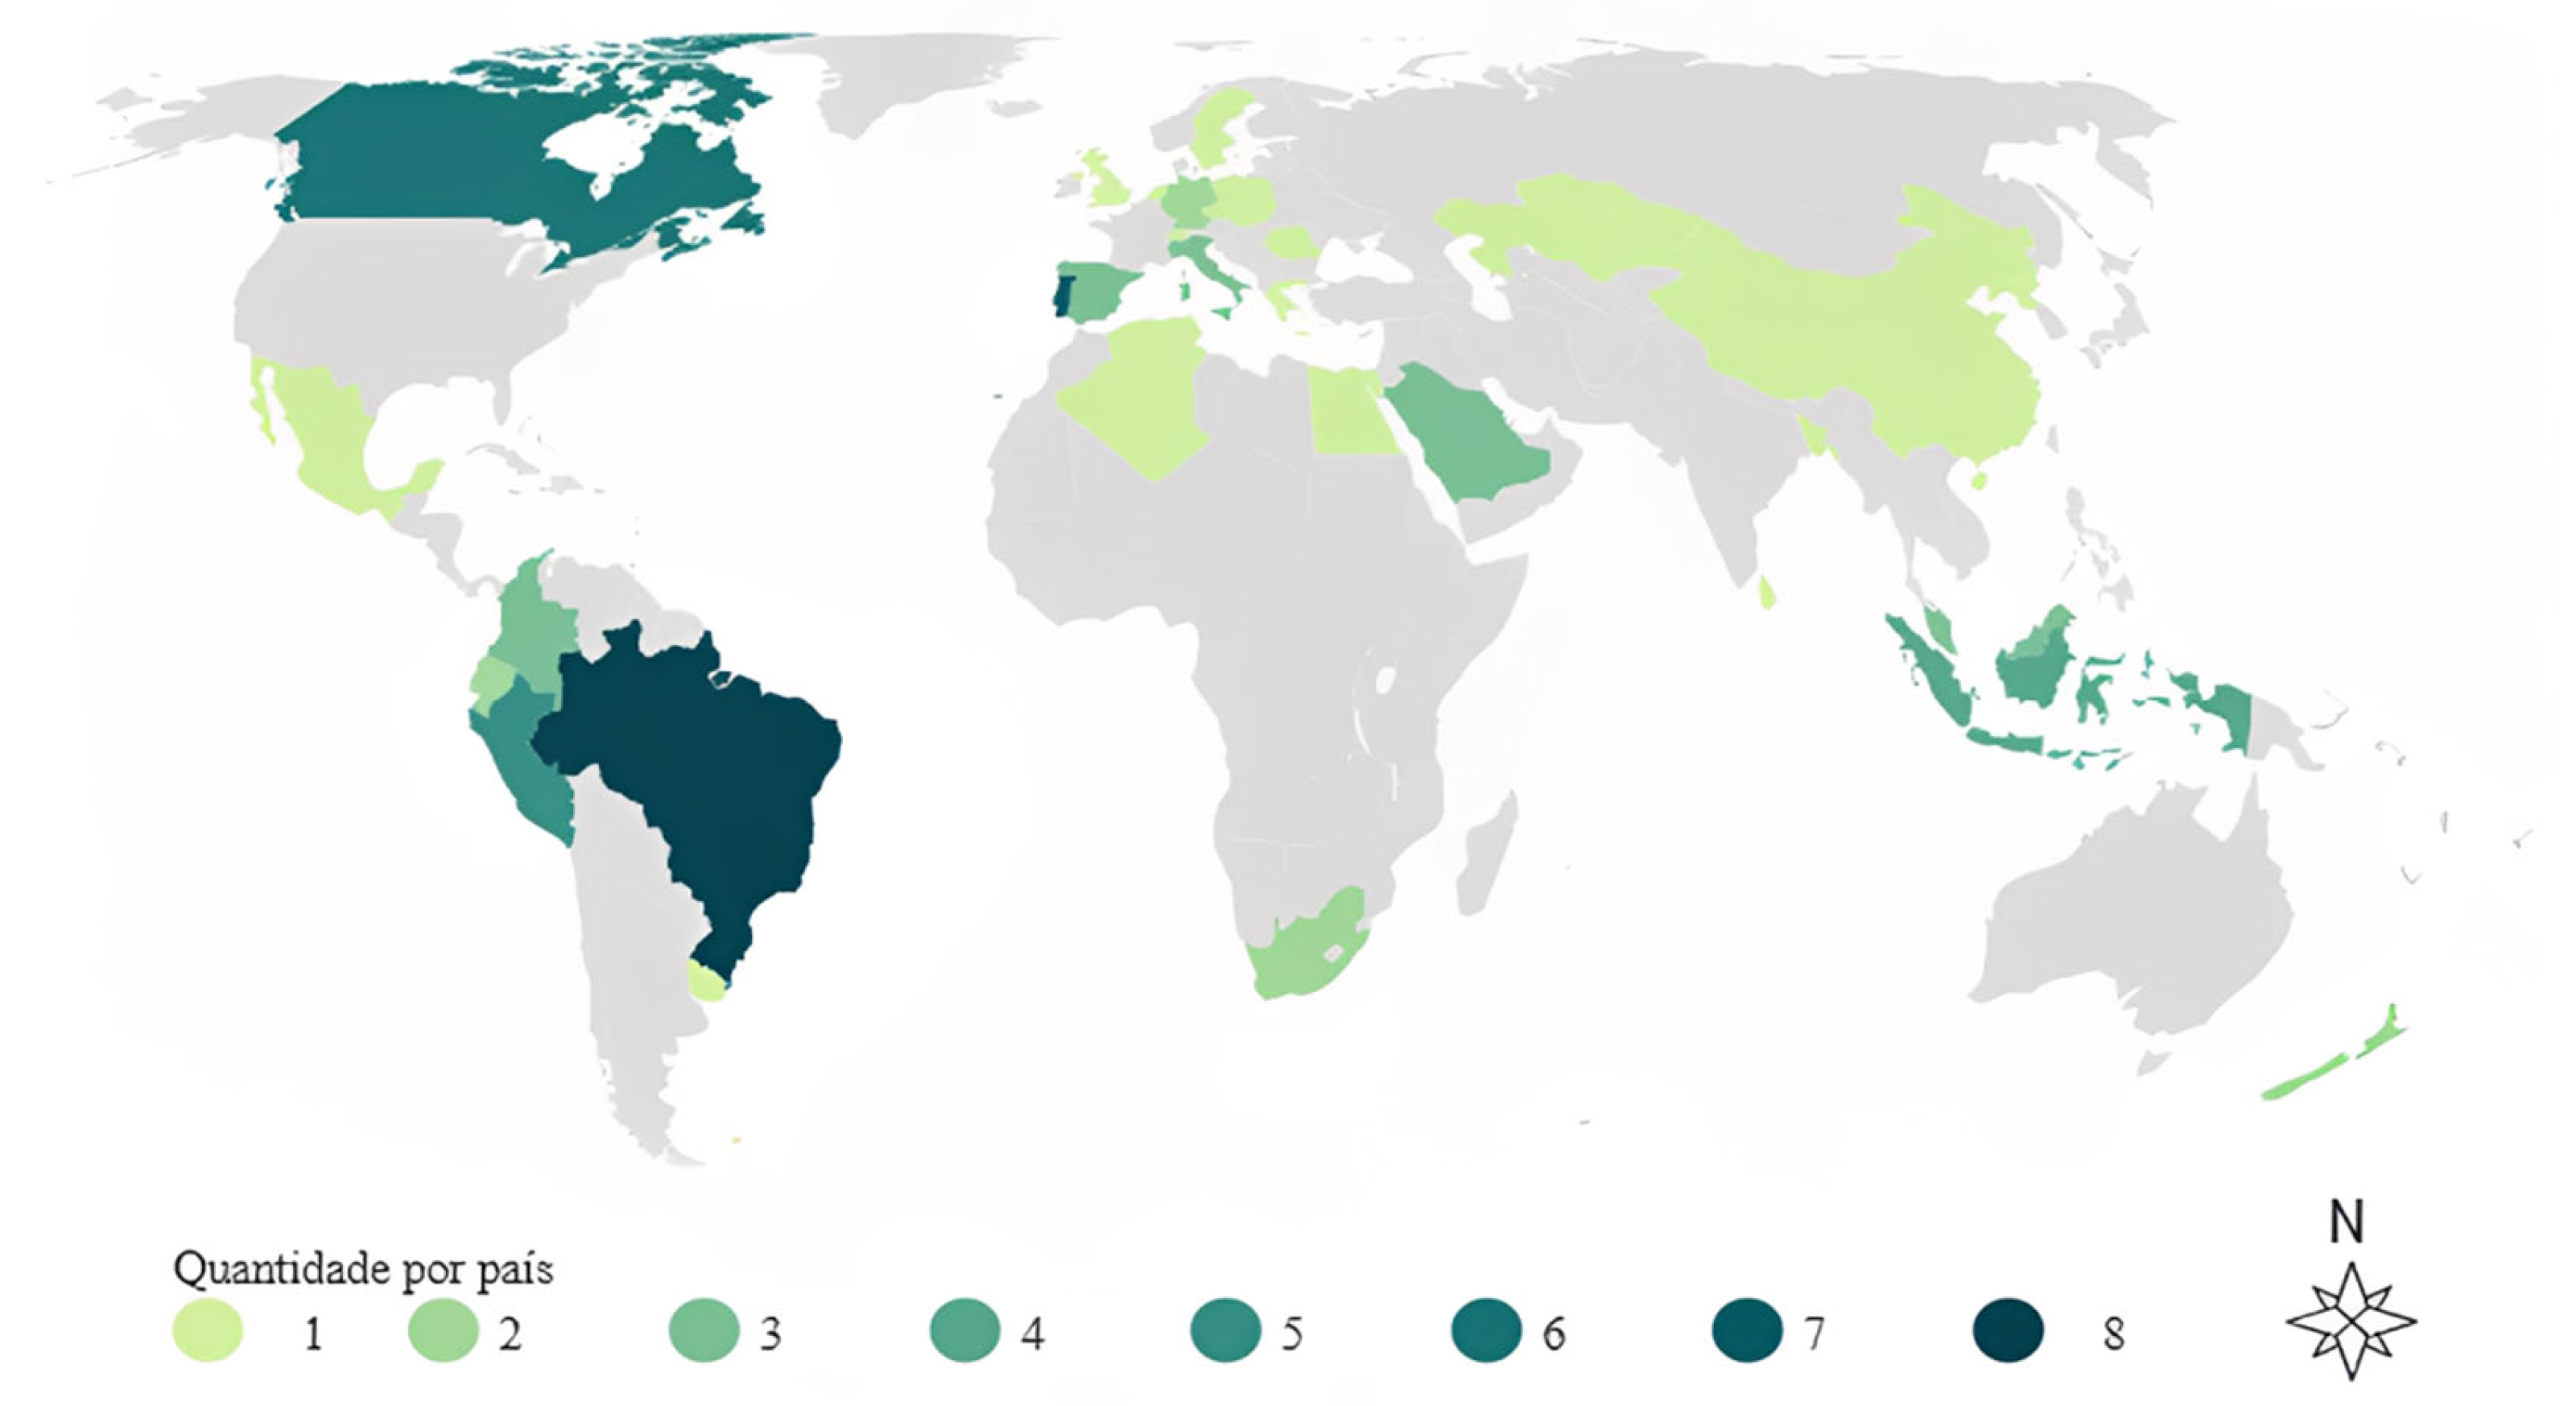
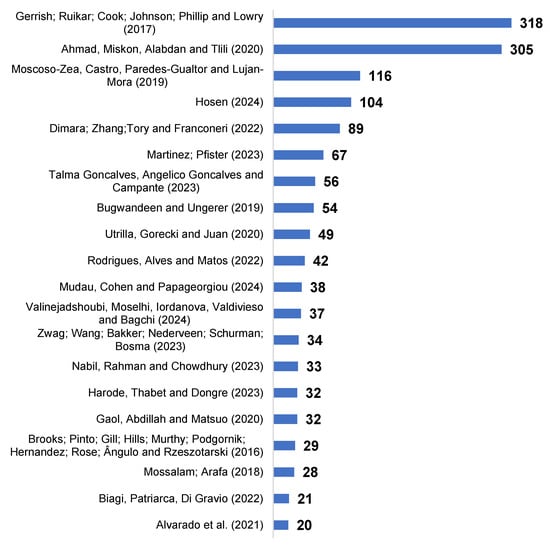
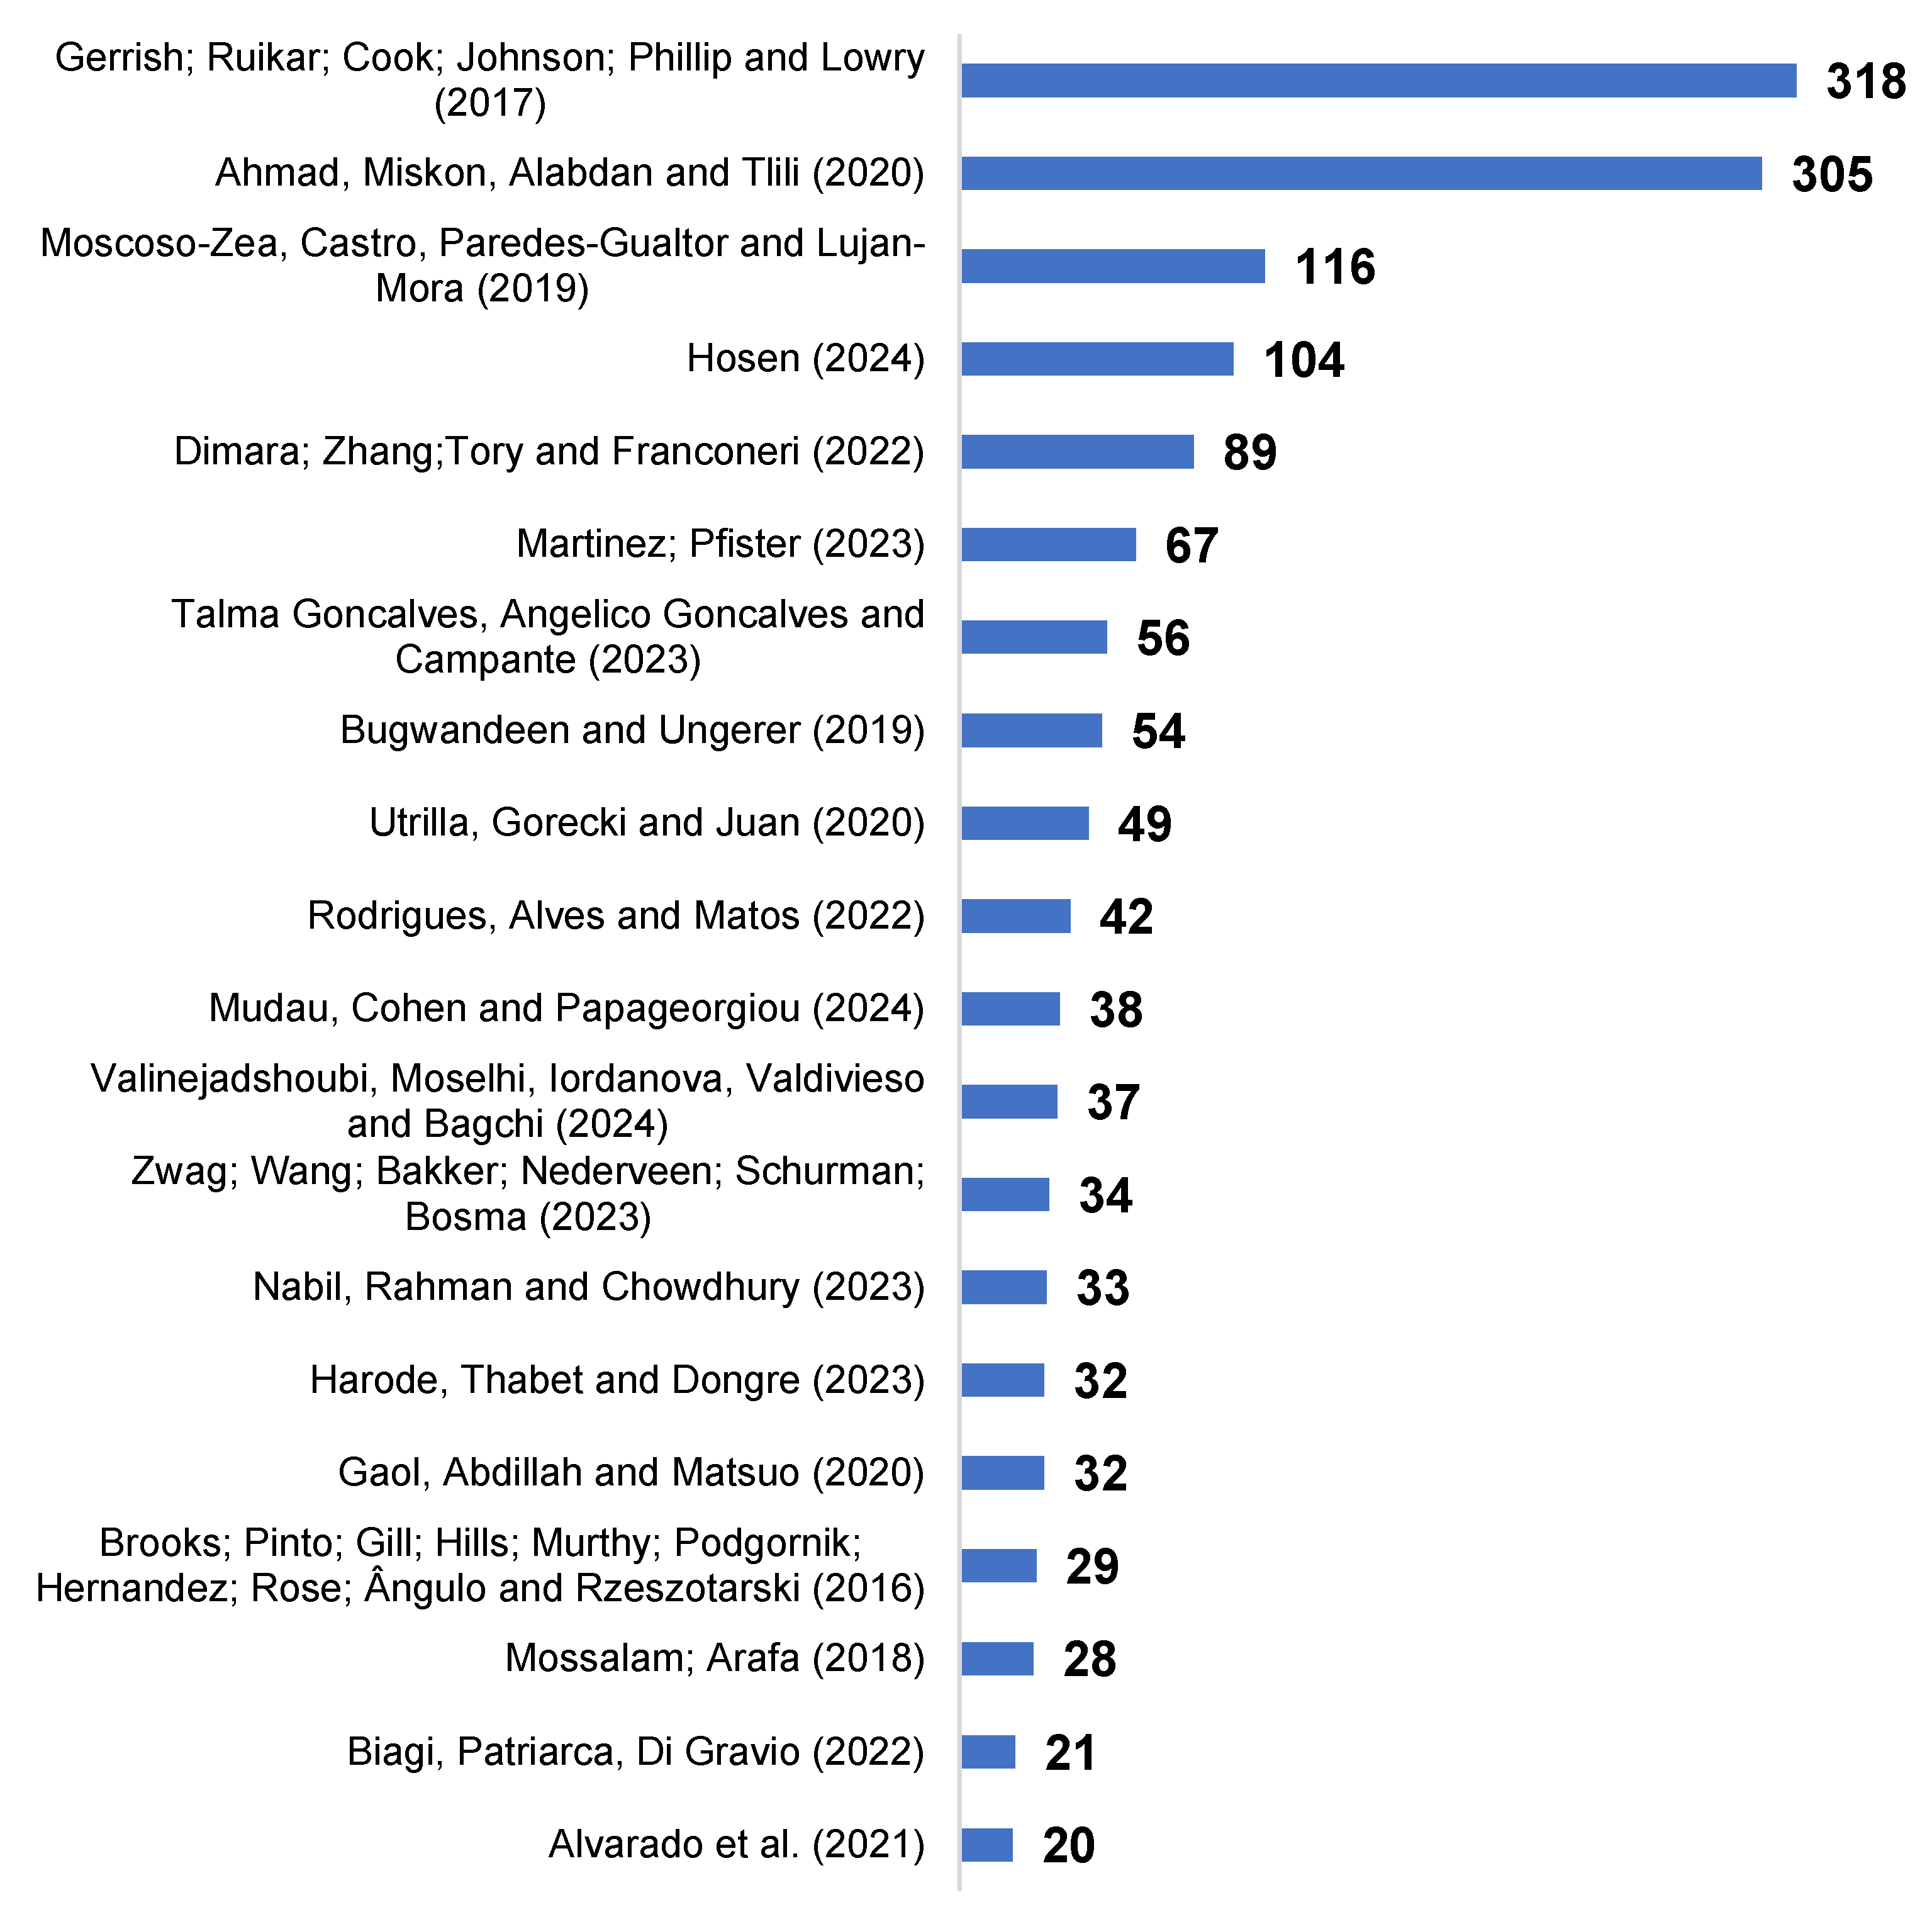
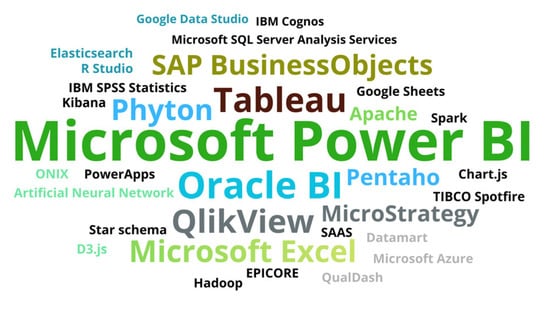
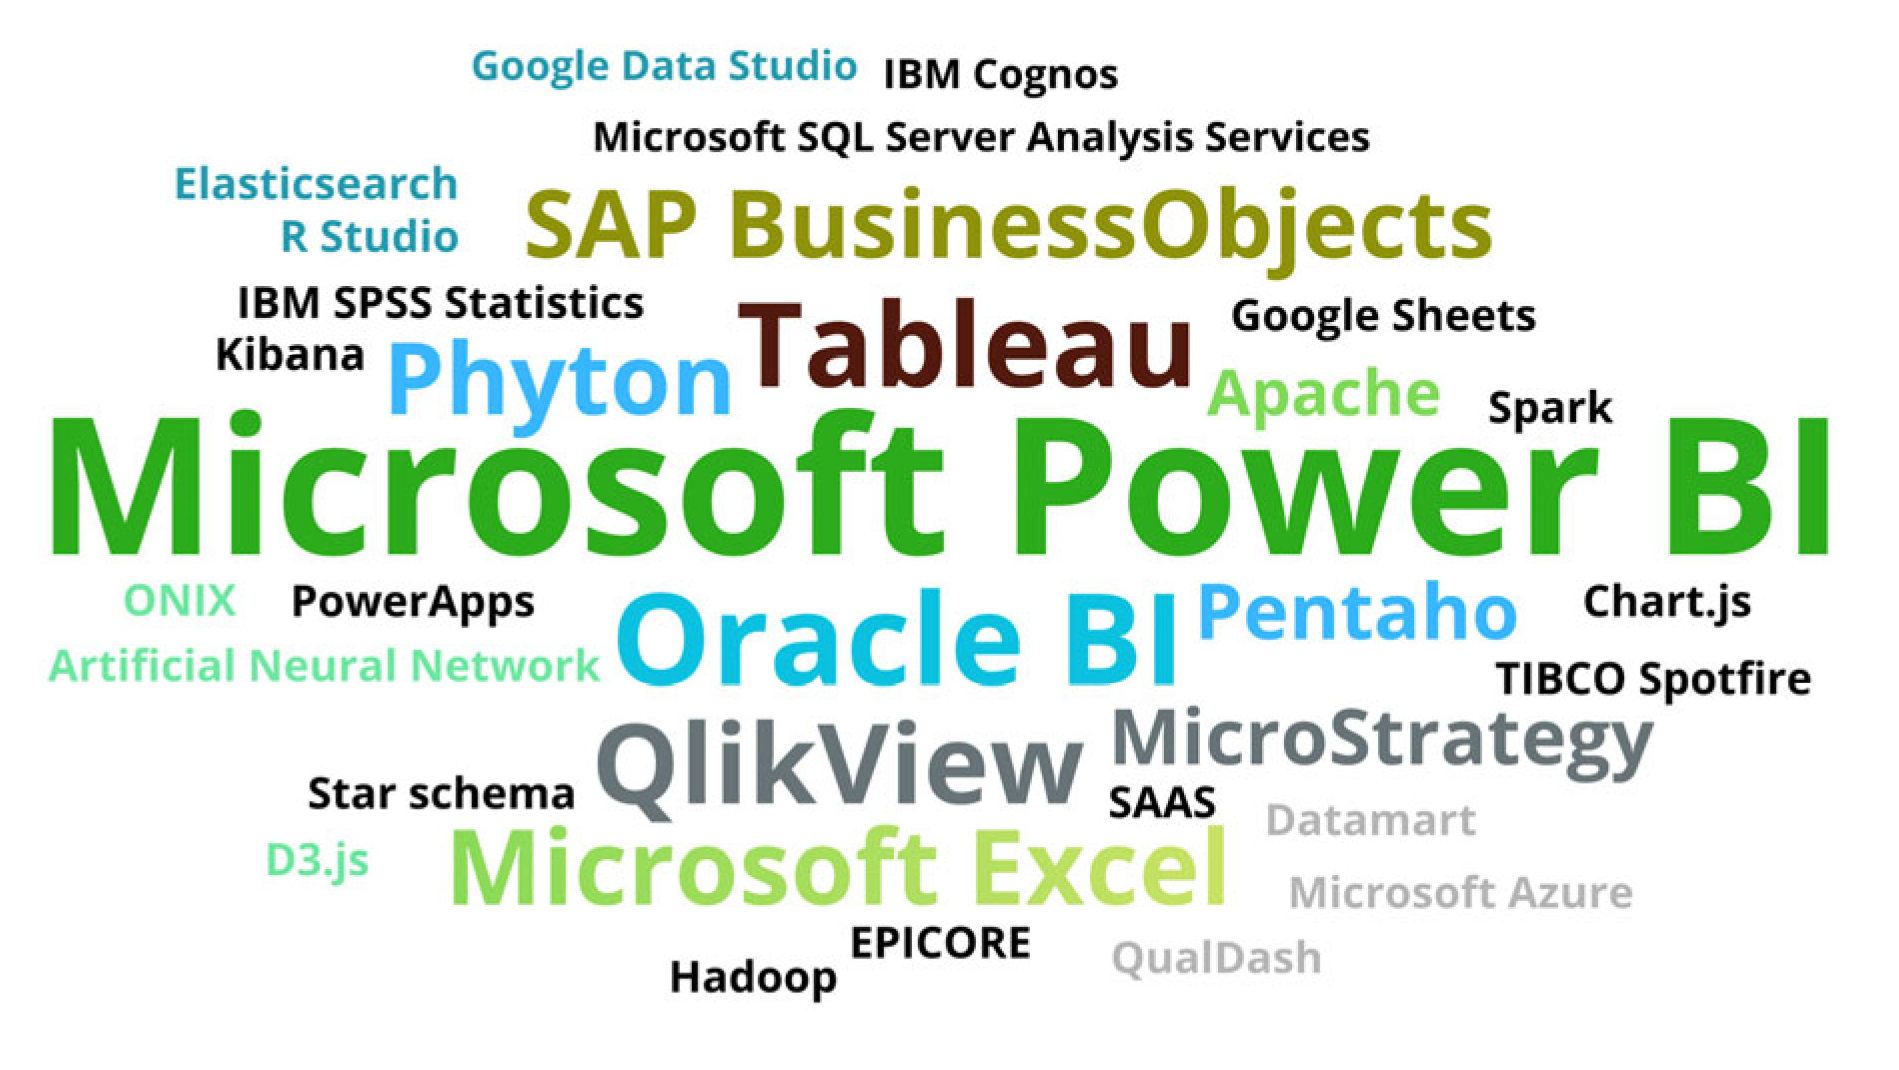
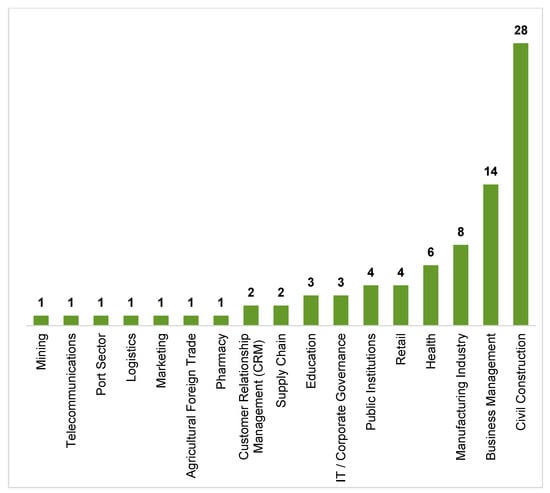
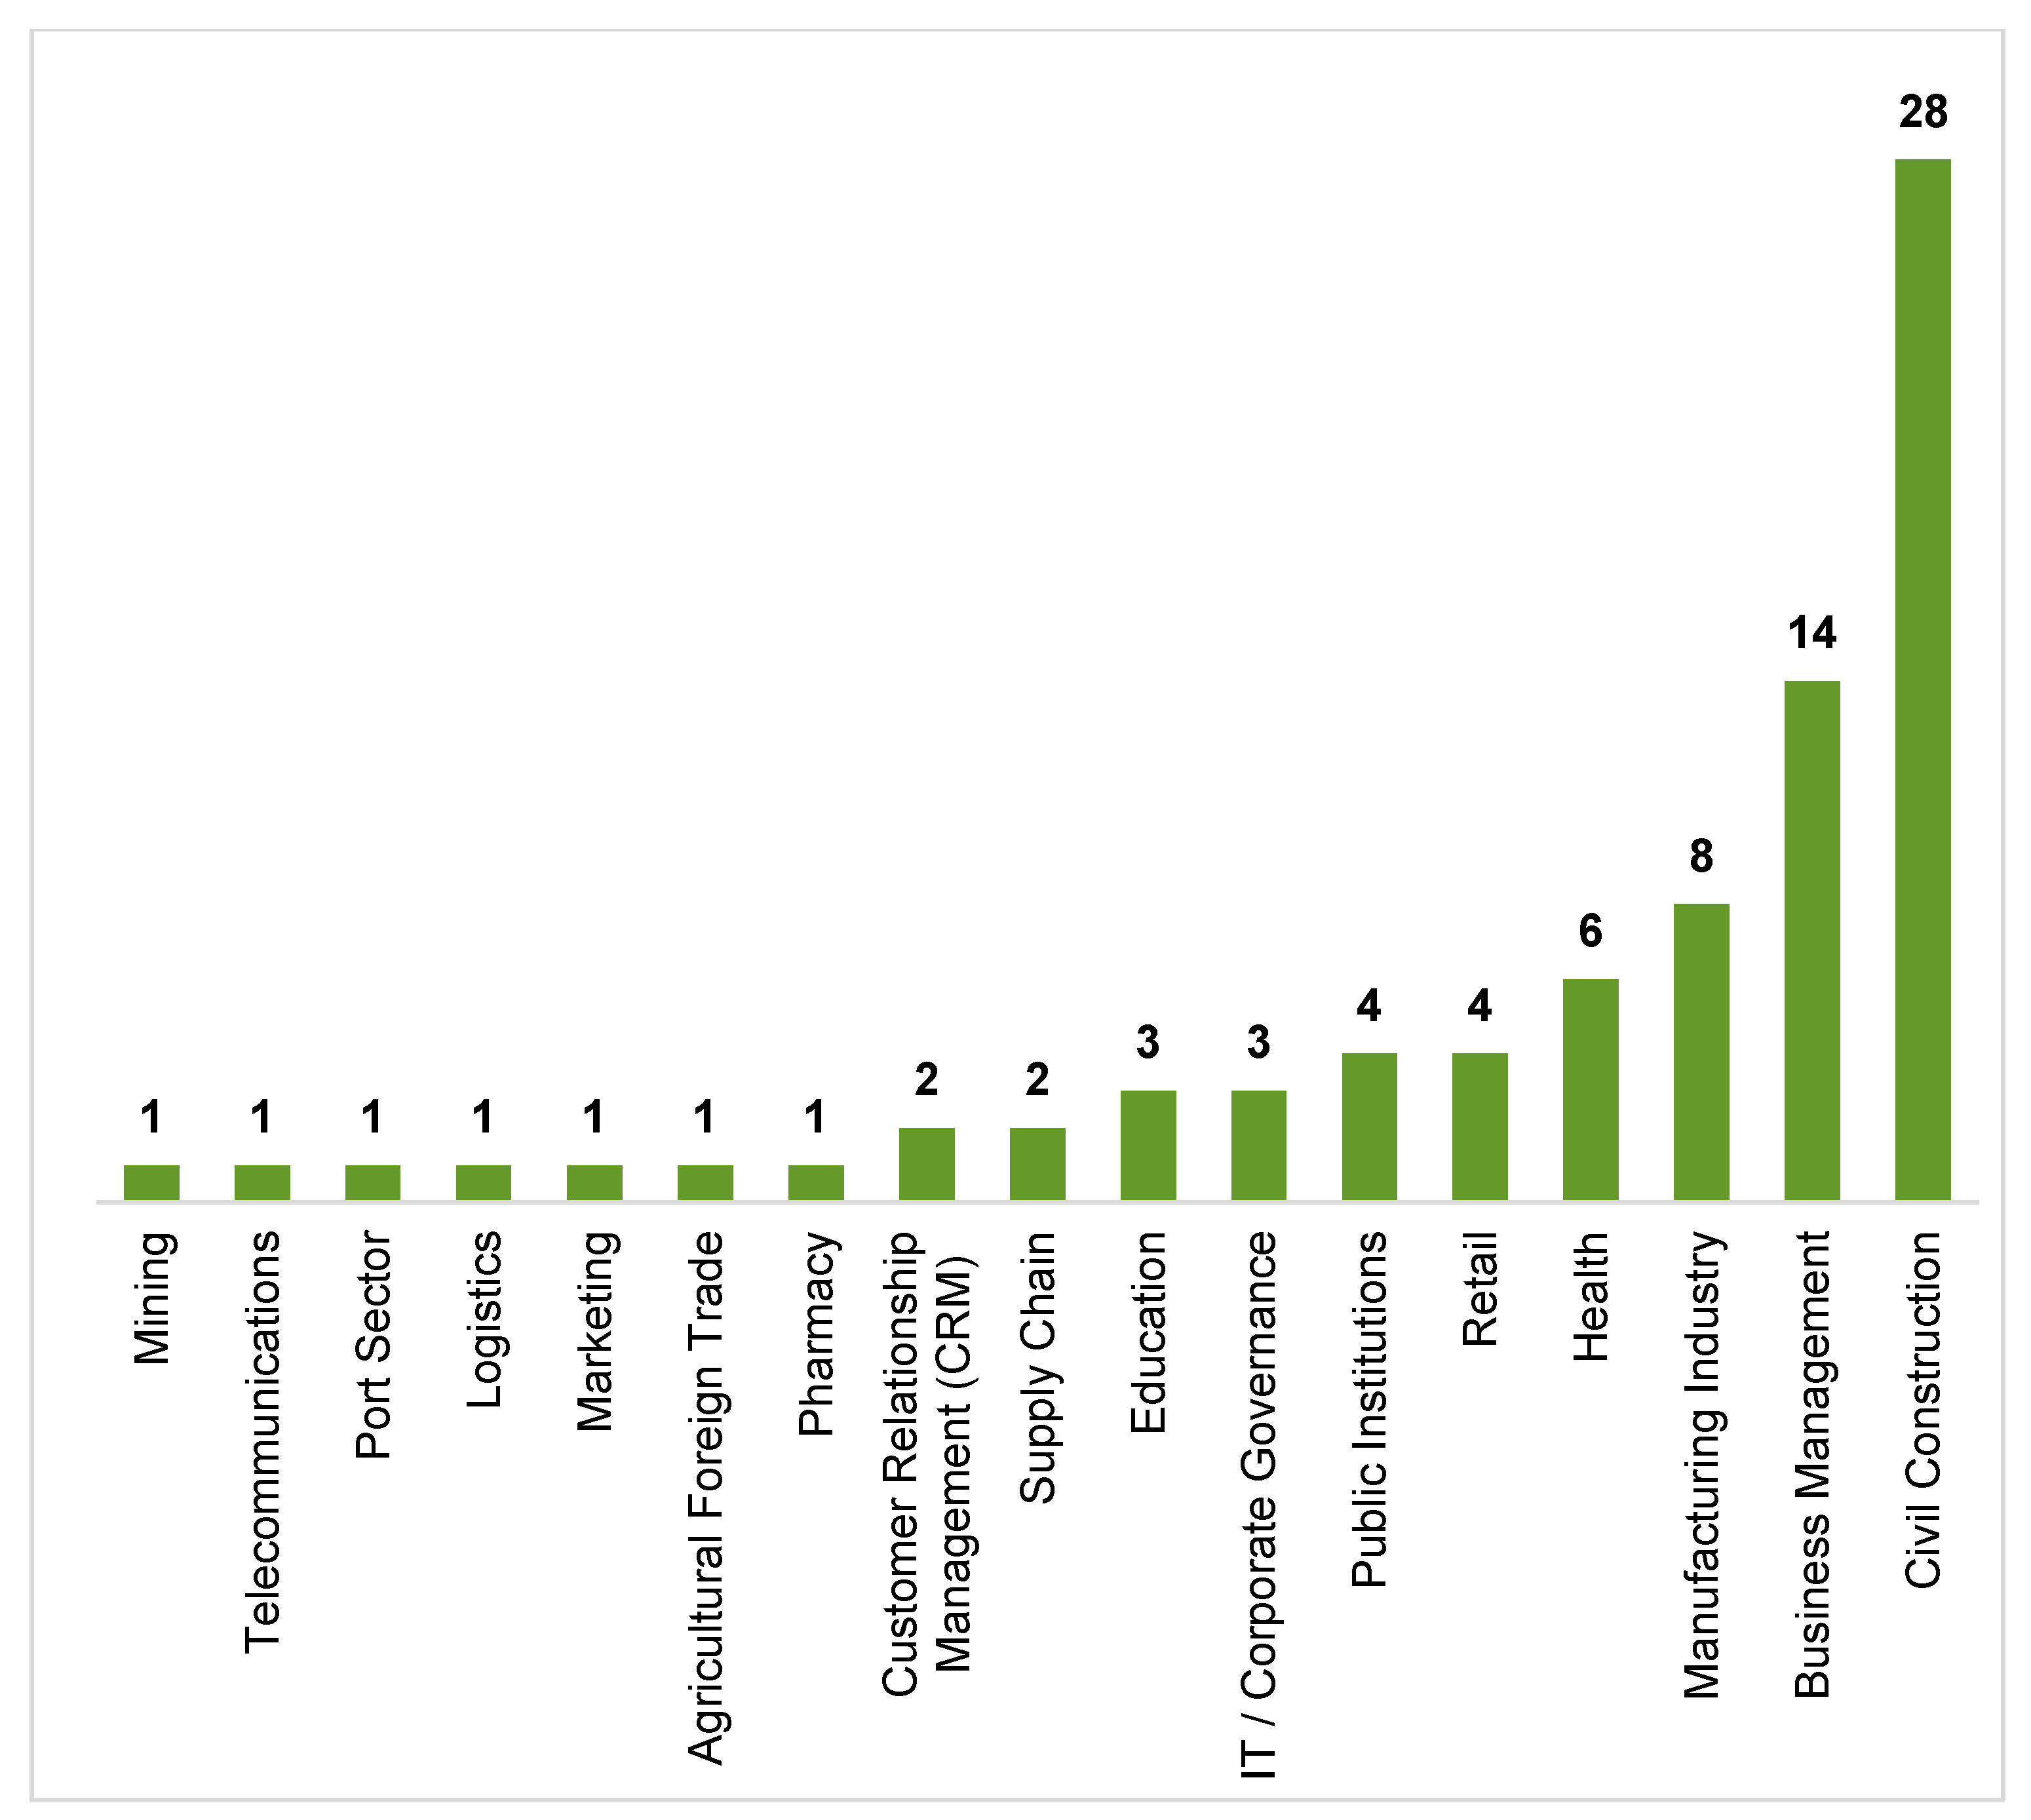
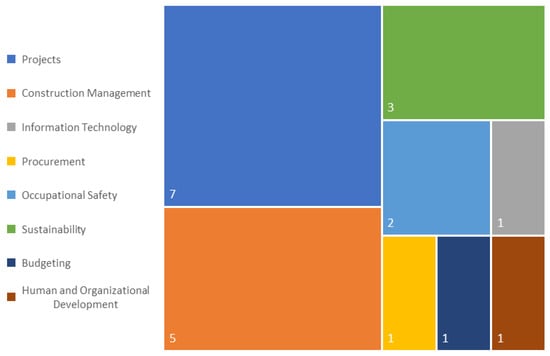
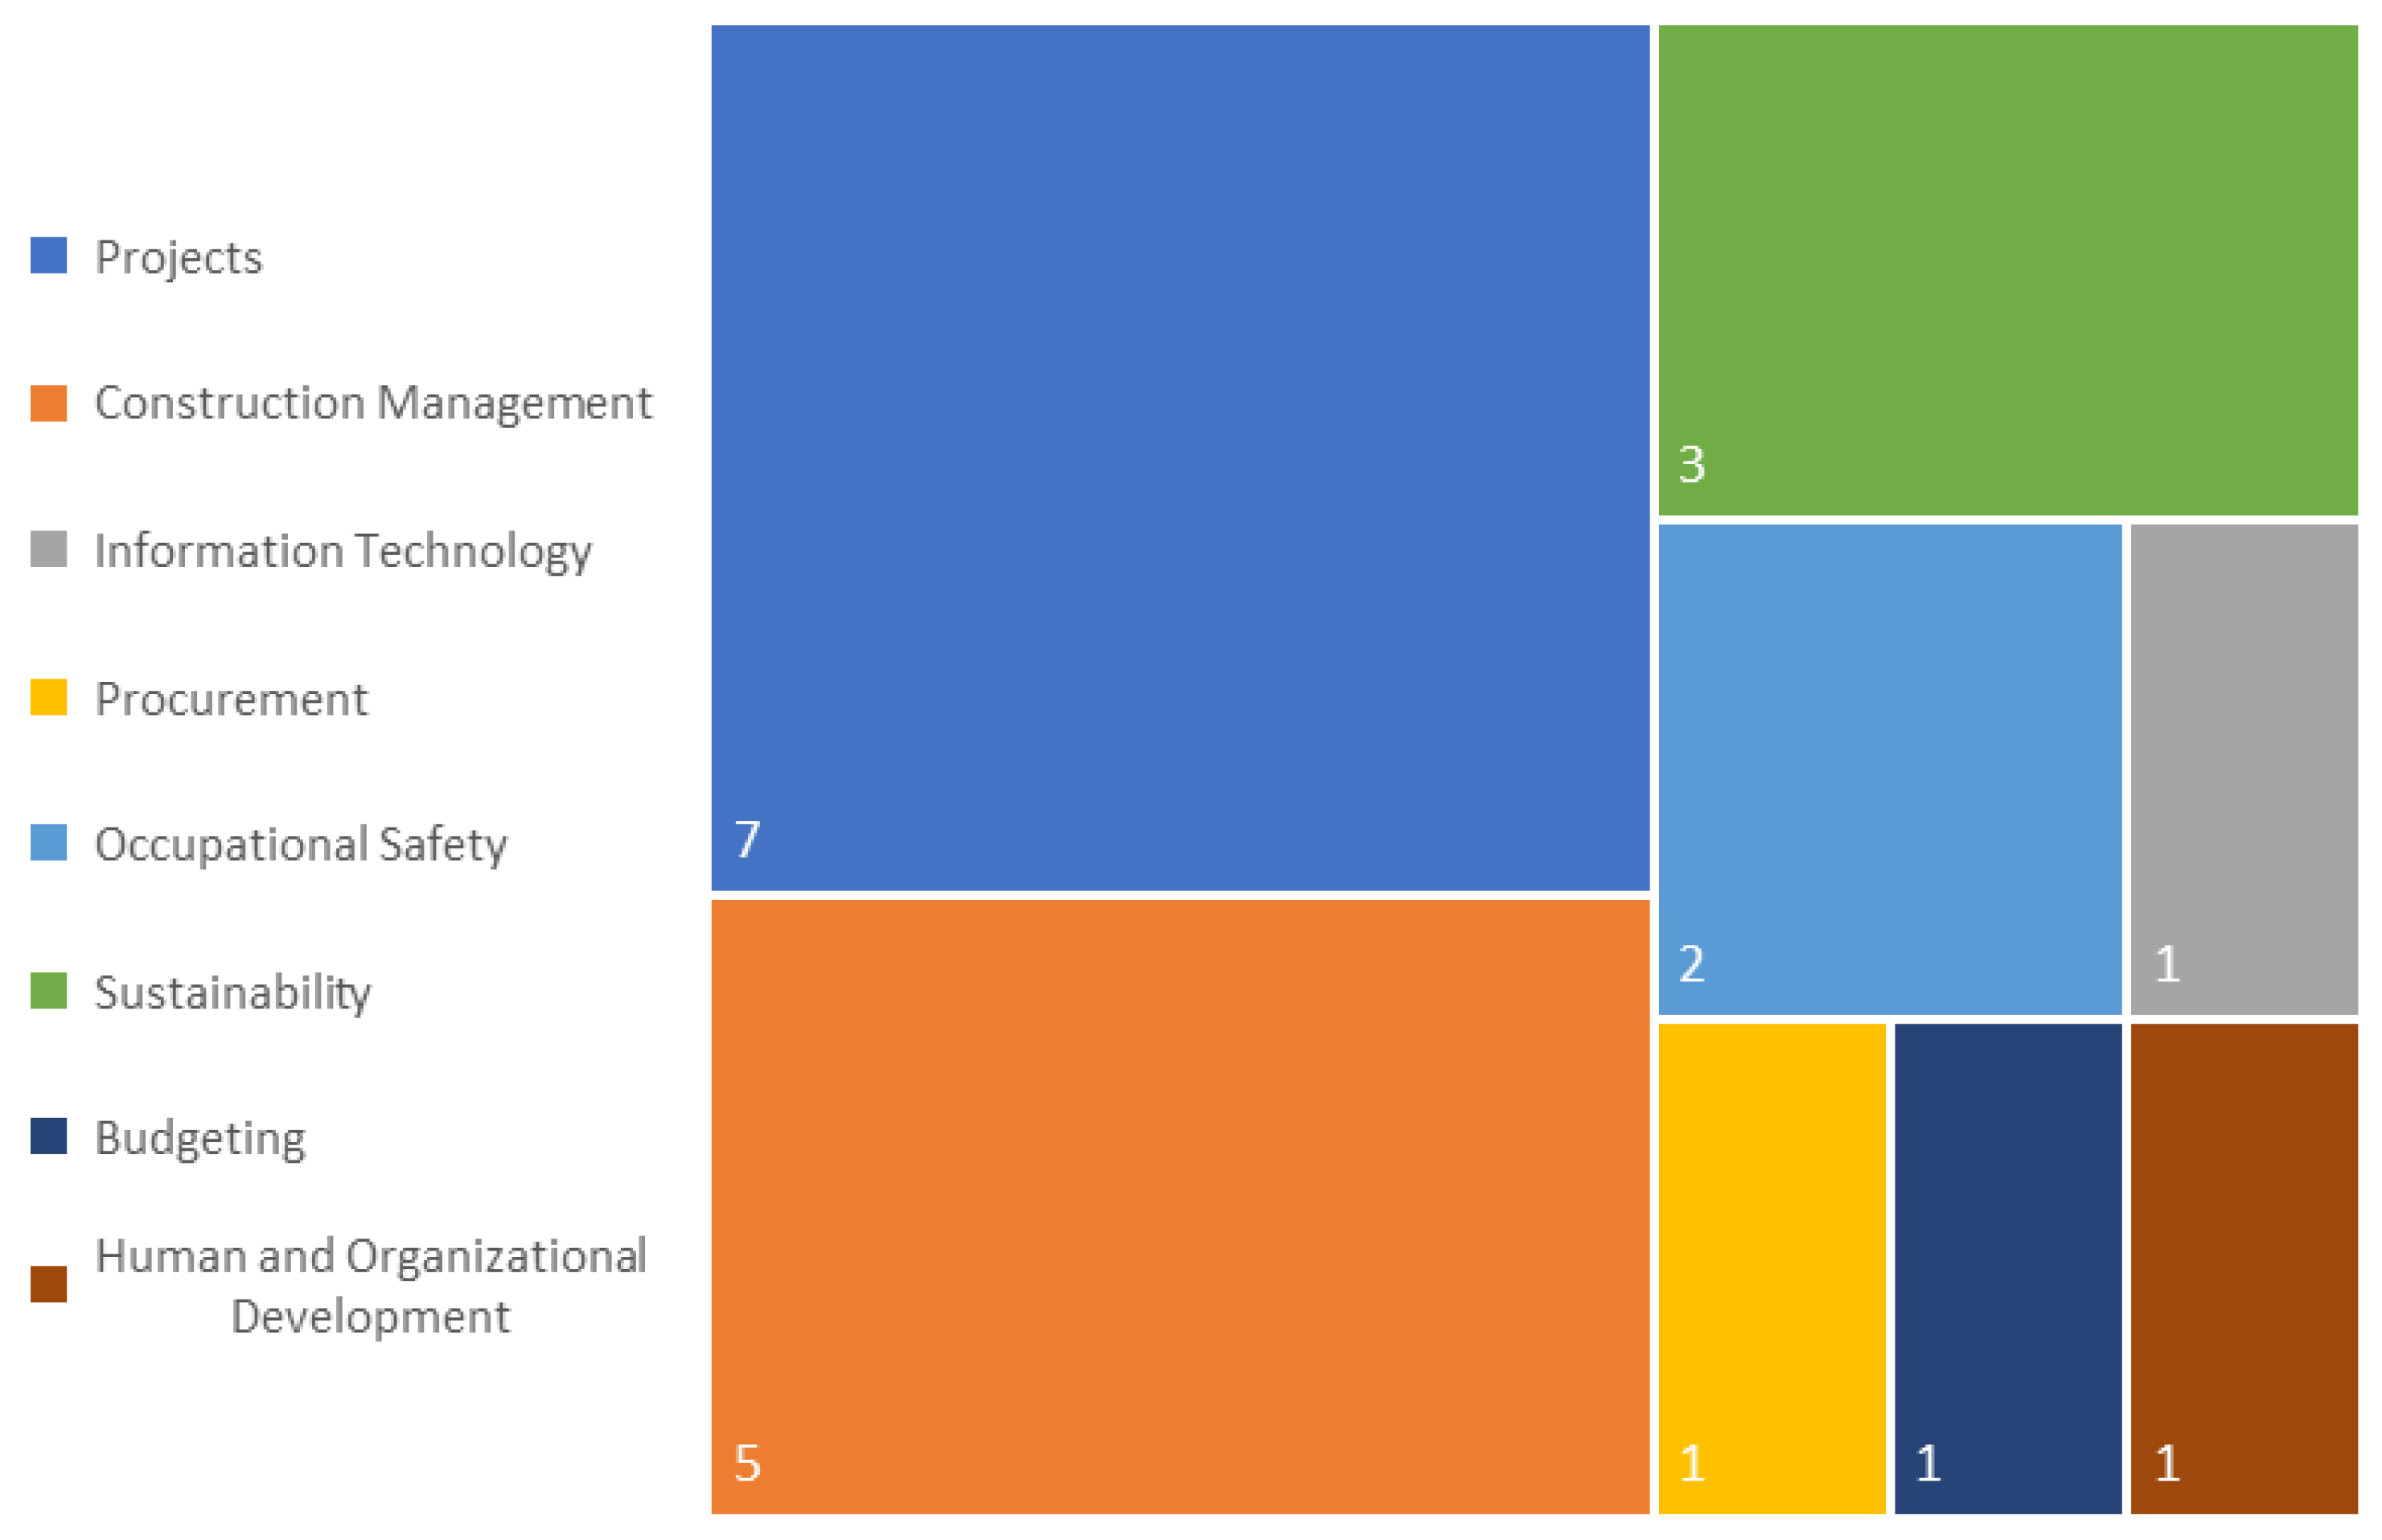
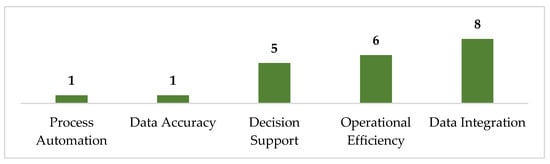
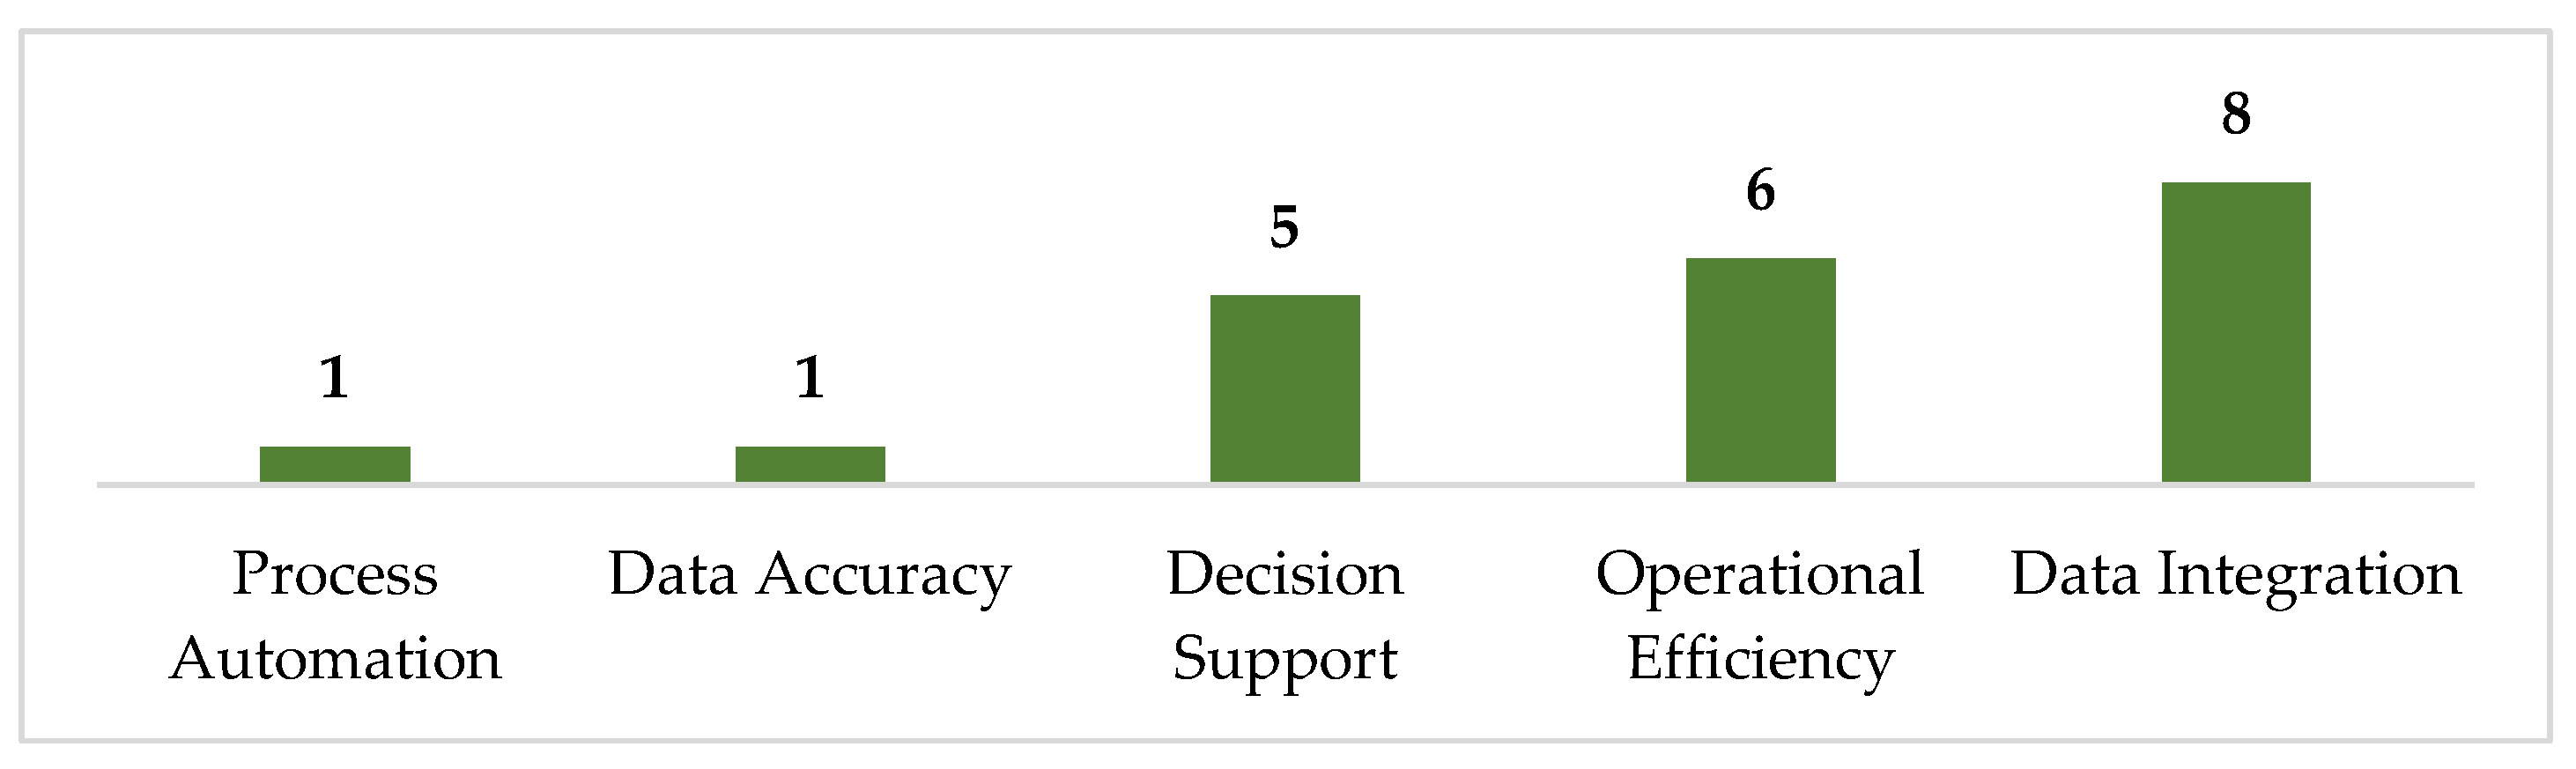
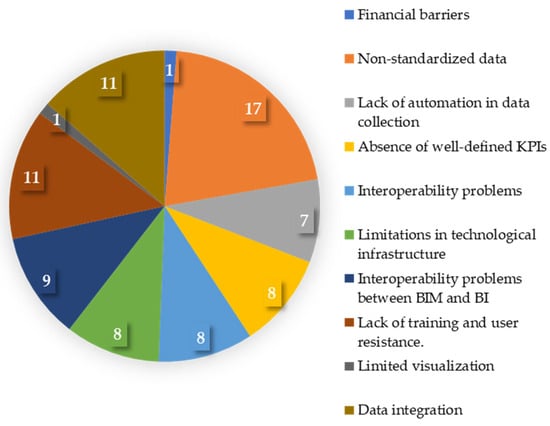
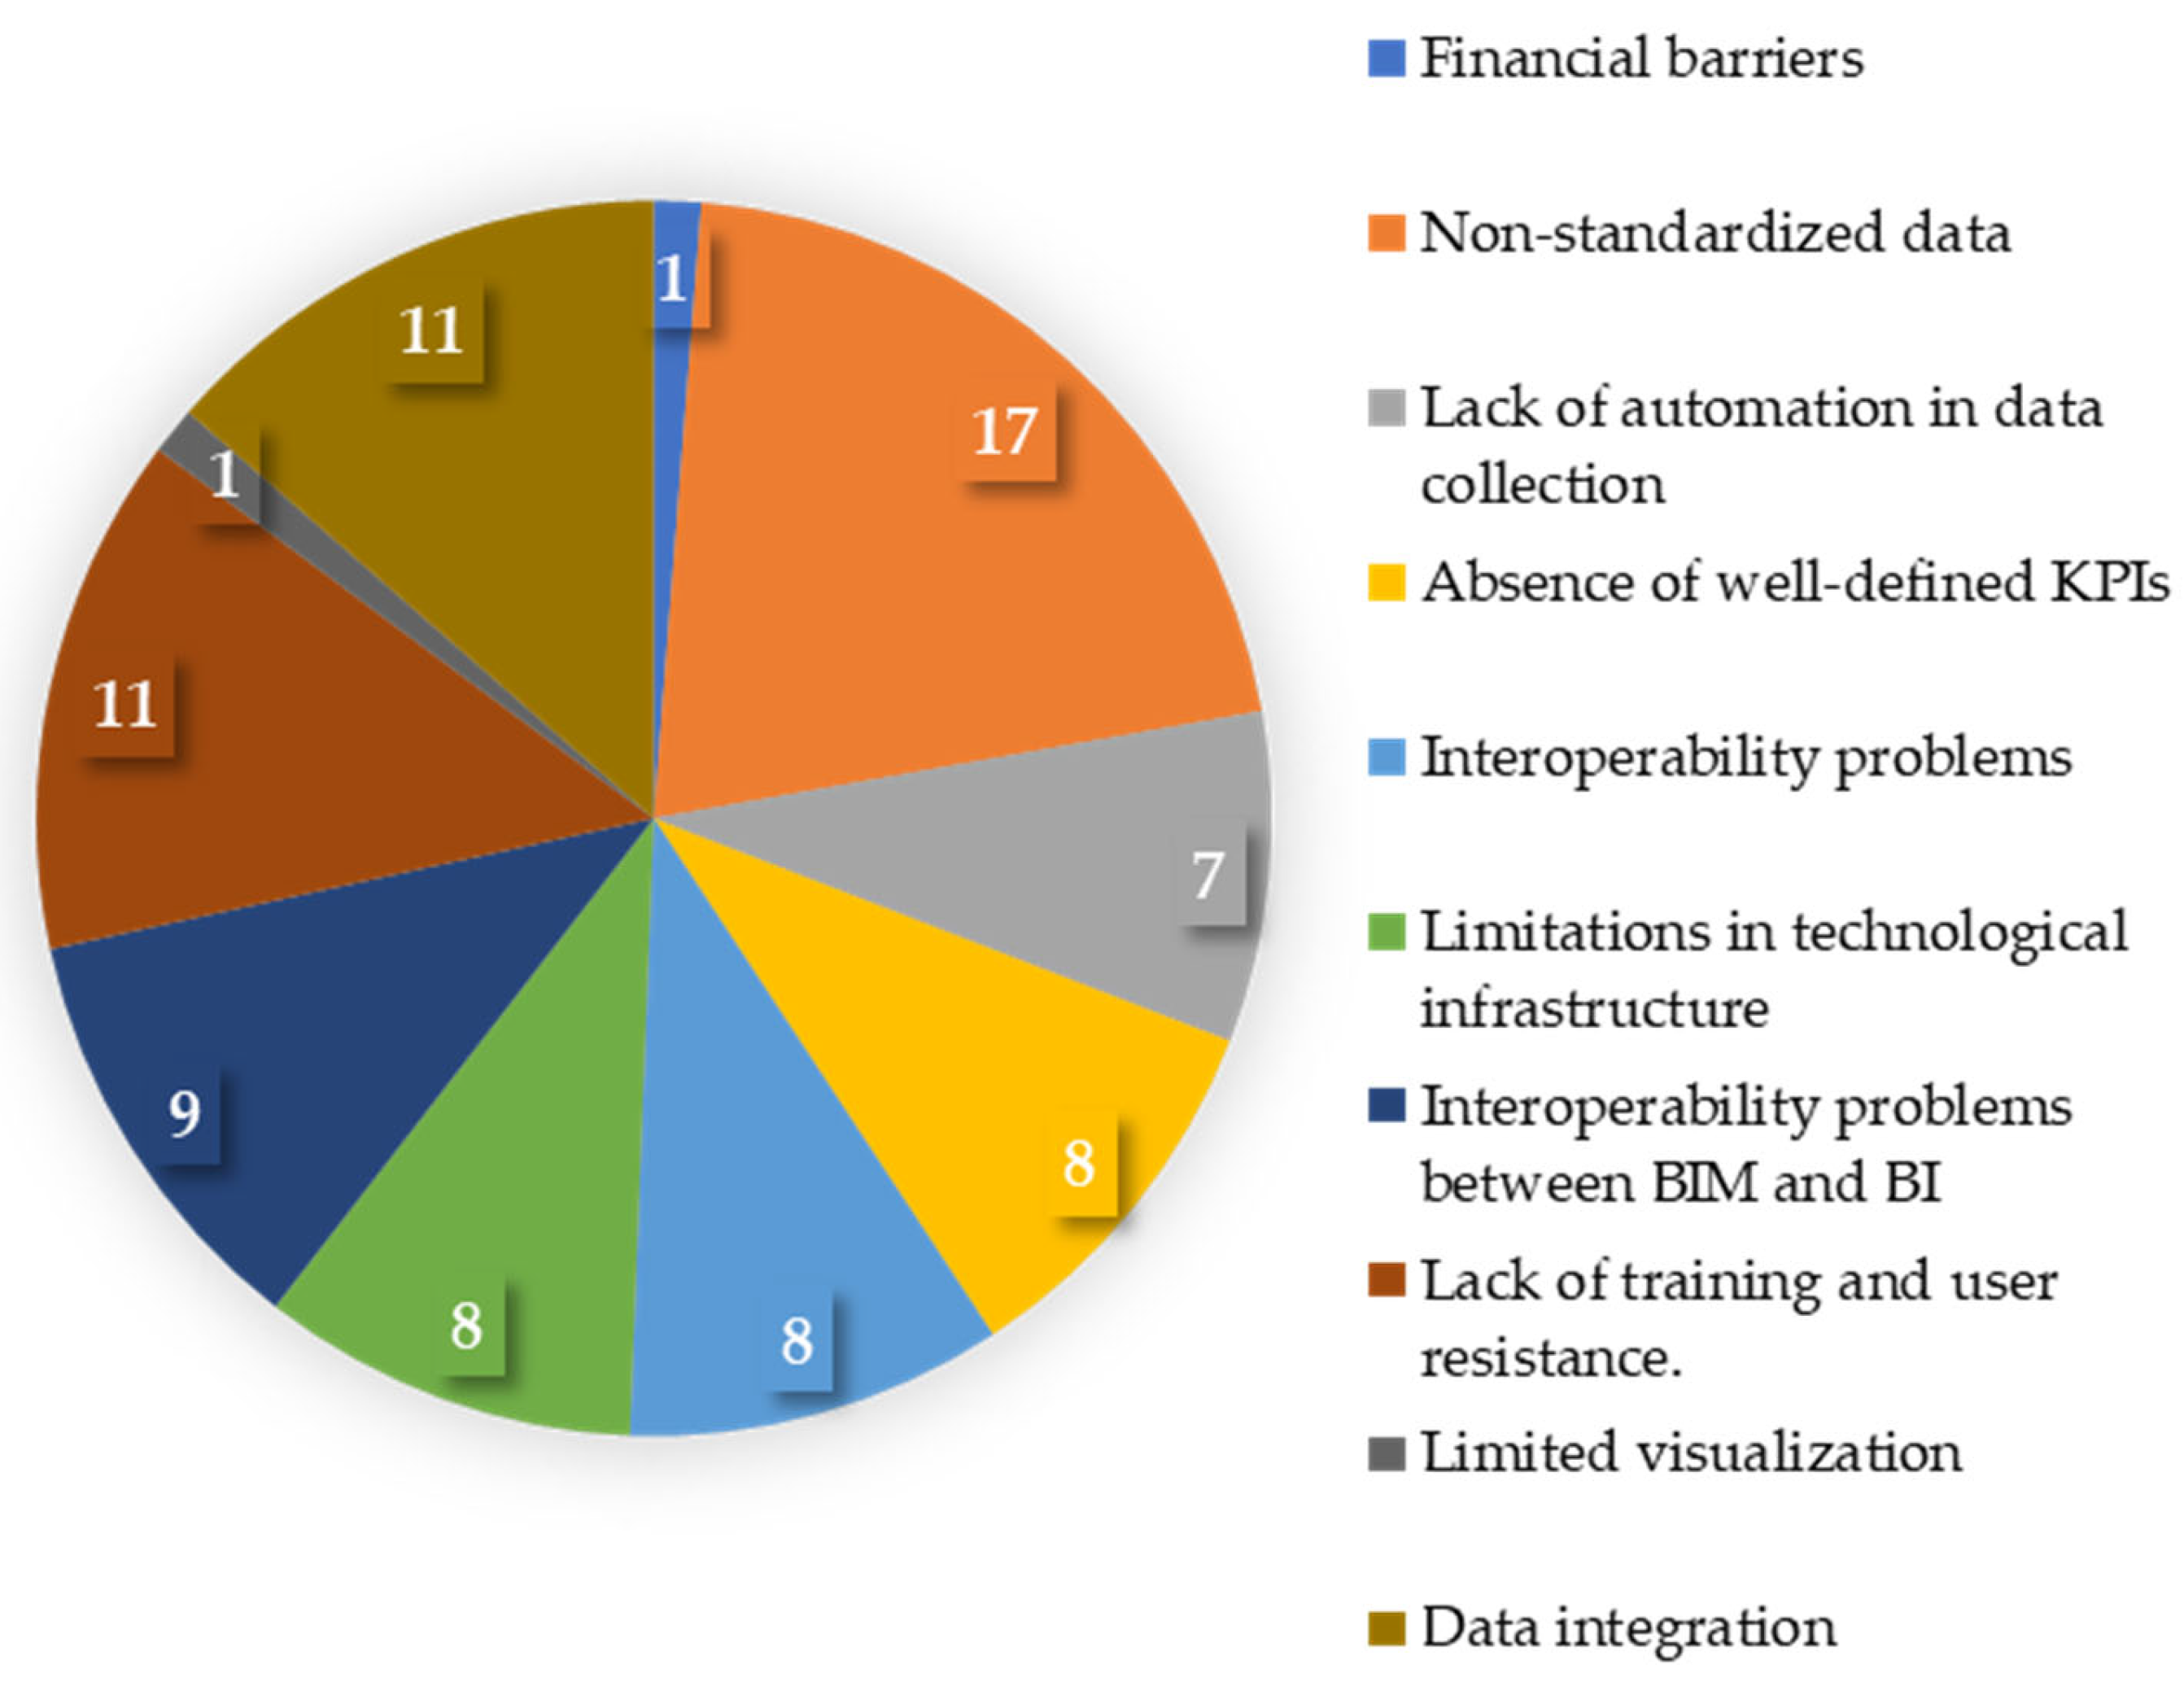
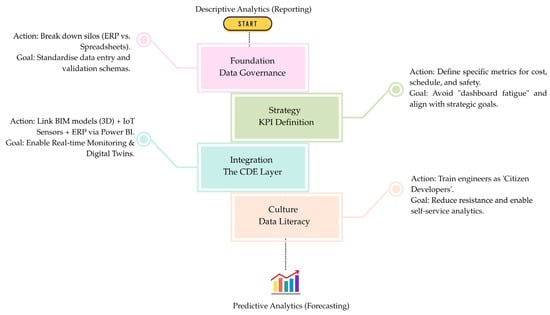
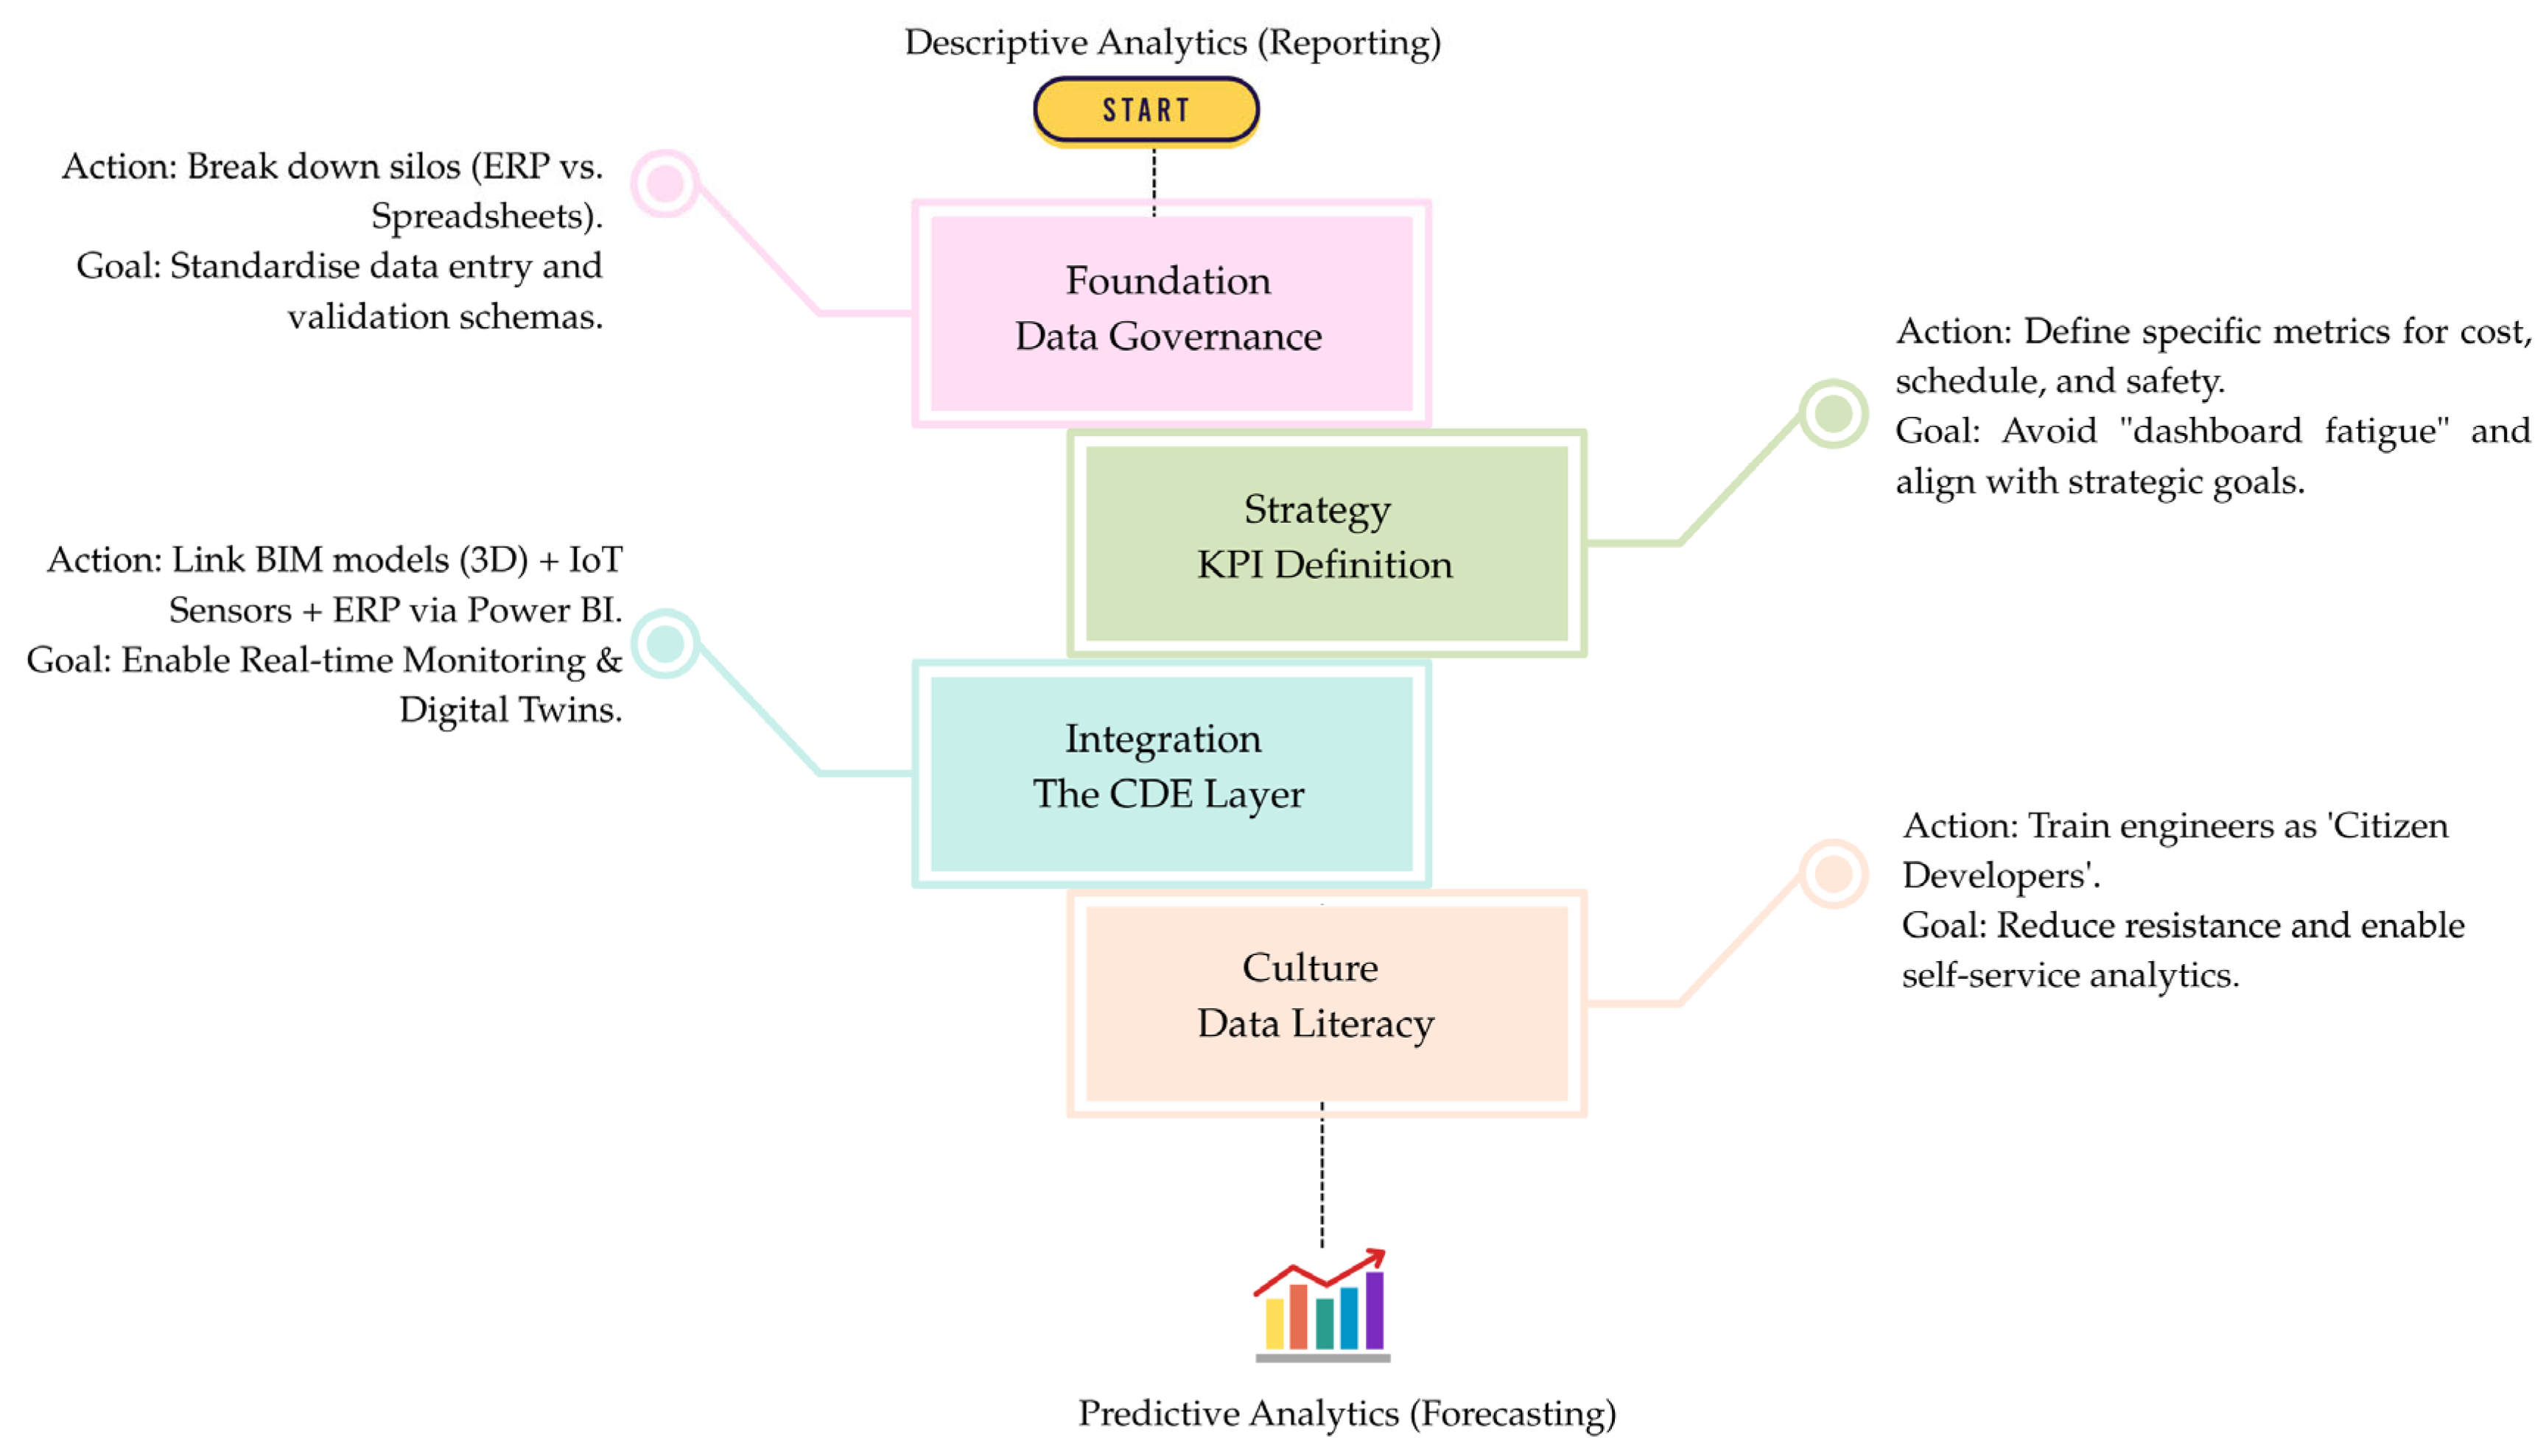

Disclaimer/Publisher’s Note: The statements, opinions and data contained in all publications are solely those of the individual author(s) and contributor(s) and not of MDPI and/or the editor(s). MDPI and/or the editor(s) disclaim responsibility for any injury to people or property resulting from any ideas, methods, instructions or products referred to in the content. |
© 2026 by the authors. Licensee MDPI, Basel, Switzerland. This article is an open access article distributed under the terms and conditions of the Creative Commons Attribution (CC BY) license.