


Abstract
Aluminum alloy tube–concrete composite columns have received increasing attention owing to their high strength-to-weight ratio and superior corrosion resistance compared with conventional steel–concrete composite columns. In this study, a refined finite element model is established to investigate the axial compression behavior of aluminum alloy tube–concrete long columns. The results indicate that the axial bearing capacity and deformation characteristics are strongly governed by the confinement effect provided by the aluminum alloy tube, which varies significantly with different cross-sectional configurations. Circular and square aluminum alloy tubes exhibit distinct confinement mechanisms, leading to different stress distributions and damage evolution patterns in the core concrete. Enhanced confinement effectively improves the utilization of concrete strength and delays local buckling of the aluminum alloy tube, thereby contributing to an increase in axial bearing capacity. Furthermore, parametric analyses clarify the combined influence of material properties and geometric parameters on the confinement efficiency and overall axial compression performance of the composite columns.
1. Introduction
Steel–concrete composite structures have been widely applied in both domestic and international engineering practice due to their excellent load-bearing capacity, structural stability, and ductility [1,2,3,4]. However, in practical applications, conventional steel materials generally exhibit poor corrosion resistance and are prone to rusting in aggressive environments, which can significantly degrade structural performance, pose potential safety risks, and result in increased maintenance costs during service life [5,6]. With the continuous development of construction technologies and materials, aluminum alloys have gradually attracted increasing attention and have become the most widely used metallic materials in the construction industry after steel. Owing to their distinctive material characteristics, aluminum alloys can, to a certain extent, compensate for the inherent deficiencies of traditional steel structures [7,8].
Compared with conventional steel, aluminum alloys offer several notable advantages, including low density, excellent corrosion resistance, favorable low-temperature performance, and ease of fabrication and processing [9,10,11,12]. When exposed to air, a dense and stable oxide film rapidly forms on the surface of the aluminum alloys, providing effective protection against humid and corrosive environments and thereby reducing long-term maintenance requirements. Aluminum alloys are significantly lighter than steel [13,14,15,16], with a density of approximately one-third that of steel, while their mechanical strength is of the same order of magnitude as that of steel [17,18]. Consequently, aluminum alloys exhibit a high specific strength, making them particularly suitable for lightweight and high-performance structural applications. In addition, aluminum alloys possess good plastic deformability and are well suited for extrusion processes, enabling the fabrication of structural members with complex cross-sectional geometries. Unlike steel, which may exhibit low-temperature brittleness, aluminum alloys retain adequate strength and ductility at low temperatures. In recent years, driven by the global emphasis on green, environmentally friendly, and energy-efficient buildings, aluminum alloys have been increasingly recognized as sustainable construction materials due to their recyclability and relatively low recycling energy consumption [19,20,21,22].
Although previous studies have provided valuable insights into the axial compressive behavior of aluminum alloy tube–concrete composite members, existing research has predominantly focused on short columns. Systematic investigations into the axial compressive behavior, failure mechanisms, and load–displacement characteristics of aluminum alloy tube–concrete composite long columns remain limited. In particular, the coupled effects of aluminum alloy properties, cross-sectional configuration, slenderness ratio, and core concrete strength on the axial performance of such long columns have not yet been fully clarified.
To address these research gaps, this study develops a refined finite element model for aluminum alloy tube–concrete composite long columns subjected to axial compression using ABAQUS. Appropriate constitutive models for aluminum alloy and concrete, the concrete plastic damage model, element types and mesh discretization schemes, interface contact relationships, and boundary conditions are systematically selected and validated against existing experimental results reported in the literature. On this basis, the failure modes, load–displacement responses, and key influencing parameters of aluminum alloy tube–concrete composite long columns are comprehensively analyzed. The findings aim to provide a reliable numerical basis and theoretical support for the mechanical understanding and engineering design of aluminum alloy tube–concrete composite members.
2. Finite Element Model of Medium-Length Column of Aluminum Alloy Tube–Concrete
2.1. Material Constitutive Model
2.1.1. Aluminum Alloy Constitutive Model
Current studies have proposed many models to describe the stress–strain relationship of aluminum alloys. Therefore, this article also adopts the Ramberg Osgood model [23], whose expression is shown in Equation (1):
where E is the elastic modulus of the material and n and B are parameters determined by experiments.
In aluminum alloy materials, the nominal yield strength is generally taken as the strain value f0.2 corresponding to a residual strain of 0.002. From the above equation, we can obtain:
Among them, n is a parameter that describes strain hardening. After extensive data analysis [23], the calculation formula is as follows:
When inputting material properties, the elastic modulus of the aluminum alloy is set to 70,000 MPa and the Poisson’s ratio is 0.3. The nominal yield strength f0.2, ultimate strength fu, and ultimate strain ε u values of aluminum alloy are shown in Table 1.
Table 1.
Key parameters of Ramberg Osgood model for aluminum alloy.
2.1.2. The Constitutive Model of Concrete
The essential characteristic of concrete material is the heterogeneity of its composition and the presence of microcracks within it. In aluminum alloy tube–reinforced concrete columns, the aluminum alloy tube exerts a certain degree of confinement on the core concrete, further complicating the working mechanism of the concrete.
The concrete plastic damage model is an advanced constitutive model based on continuum mechanics, specifically designed to describe the complex nonlinear behavior of quasi brittle materials such as concrete under stress. The core theoretical innovation of this model lies in coupling the permanent plastic deformation generated by the material under stress with the damage effects caused by the development of internal micro defects within a unified theoretical framework. It quantifies the progressive degradation process of material stiffness under different stress states of tension and compression by defining independent tensile and compressive damage variables. This degradation is directly reflected in the macroscopic mechanical response of the material, where the stiffness cannot be restored to its initial state during unloading. At the same time, the model adopts a yield surface that can distinguish between different failure characteristics of tension and compression, combined with non-correlated plastic flow rules, so as to simulate the plastic expansion of concrete under compression and the brittle cracking behavior under tension simultaneously. Therefore, this model can fully characterize the entire process of materials from the linear elastic response to yielding, hardening, the strength peak, and then softening and ultimately failure; it is especially adept at representing complex phenomena such as stiffness degradation and energy dissipation under repeated loading.
In engineering practice and scientific research, plastic damage models have become one of the most mainstream tools for the nonlinear analysis of concrete structures using computer simulation. It is widely used to evaluate the seismic performance of buildings and bridges, analyze the dynamic response of structures under impact explosion loads, and simulate the effects of temperature stress and long-term shrinkage deformation during construction. The key to the effective application of the model lies in obtaining a complete set of accurate material parameters, which need to be determined through systematic material testing, including the fundamental elastic constants, plastic parameters that define yield characteristics, and most importantly, damage evolution parameters that control the behavior of the material during the softening stage. Therefore, this article adopts a plastic damage model to simulate the mechanical properties of long columns in aluminum alloy–concrete composite materials during loading. The setting of plastic damage parameters for C30 concrete in the model [17,22] is shown in Table 2:
Table 2.
Concrete plastic damage model parameters.
The symbols in Table 2 are all key parameters in the concrete plastic damage model (CDP): φ represents the dilation angle, which is used to describe the trend of volume expansion of concrete after compression failure; ε is ellipticity, which is used to define the shape of the plastic potential function and affects the development of plastic strain; fb0/fc0 is the ratio of biaxial compressive strength to uniaxial compressive strength, reflecting the degree of strength improvement of concrete under biaxial constraint conditions; K is the ratio of the quadratic invariants of stress in the tensile and compressive directions, used to control the plastic flow rules; and μ is a viscosity parameter used for viscosity regularization in numerical calculations to improve convergence.
In the concrete plastic damage model, damage factors need to be introduced to characterize the stiffness degradation of concrete caused by cracking due to tension or compression.
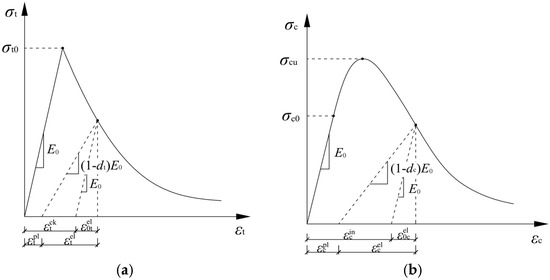
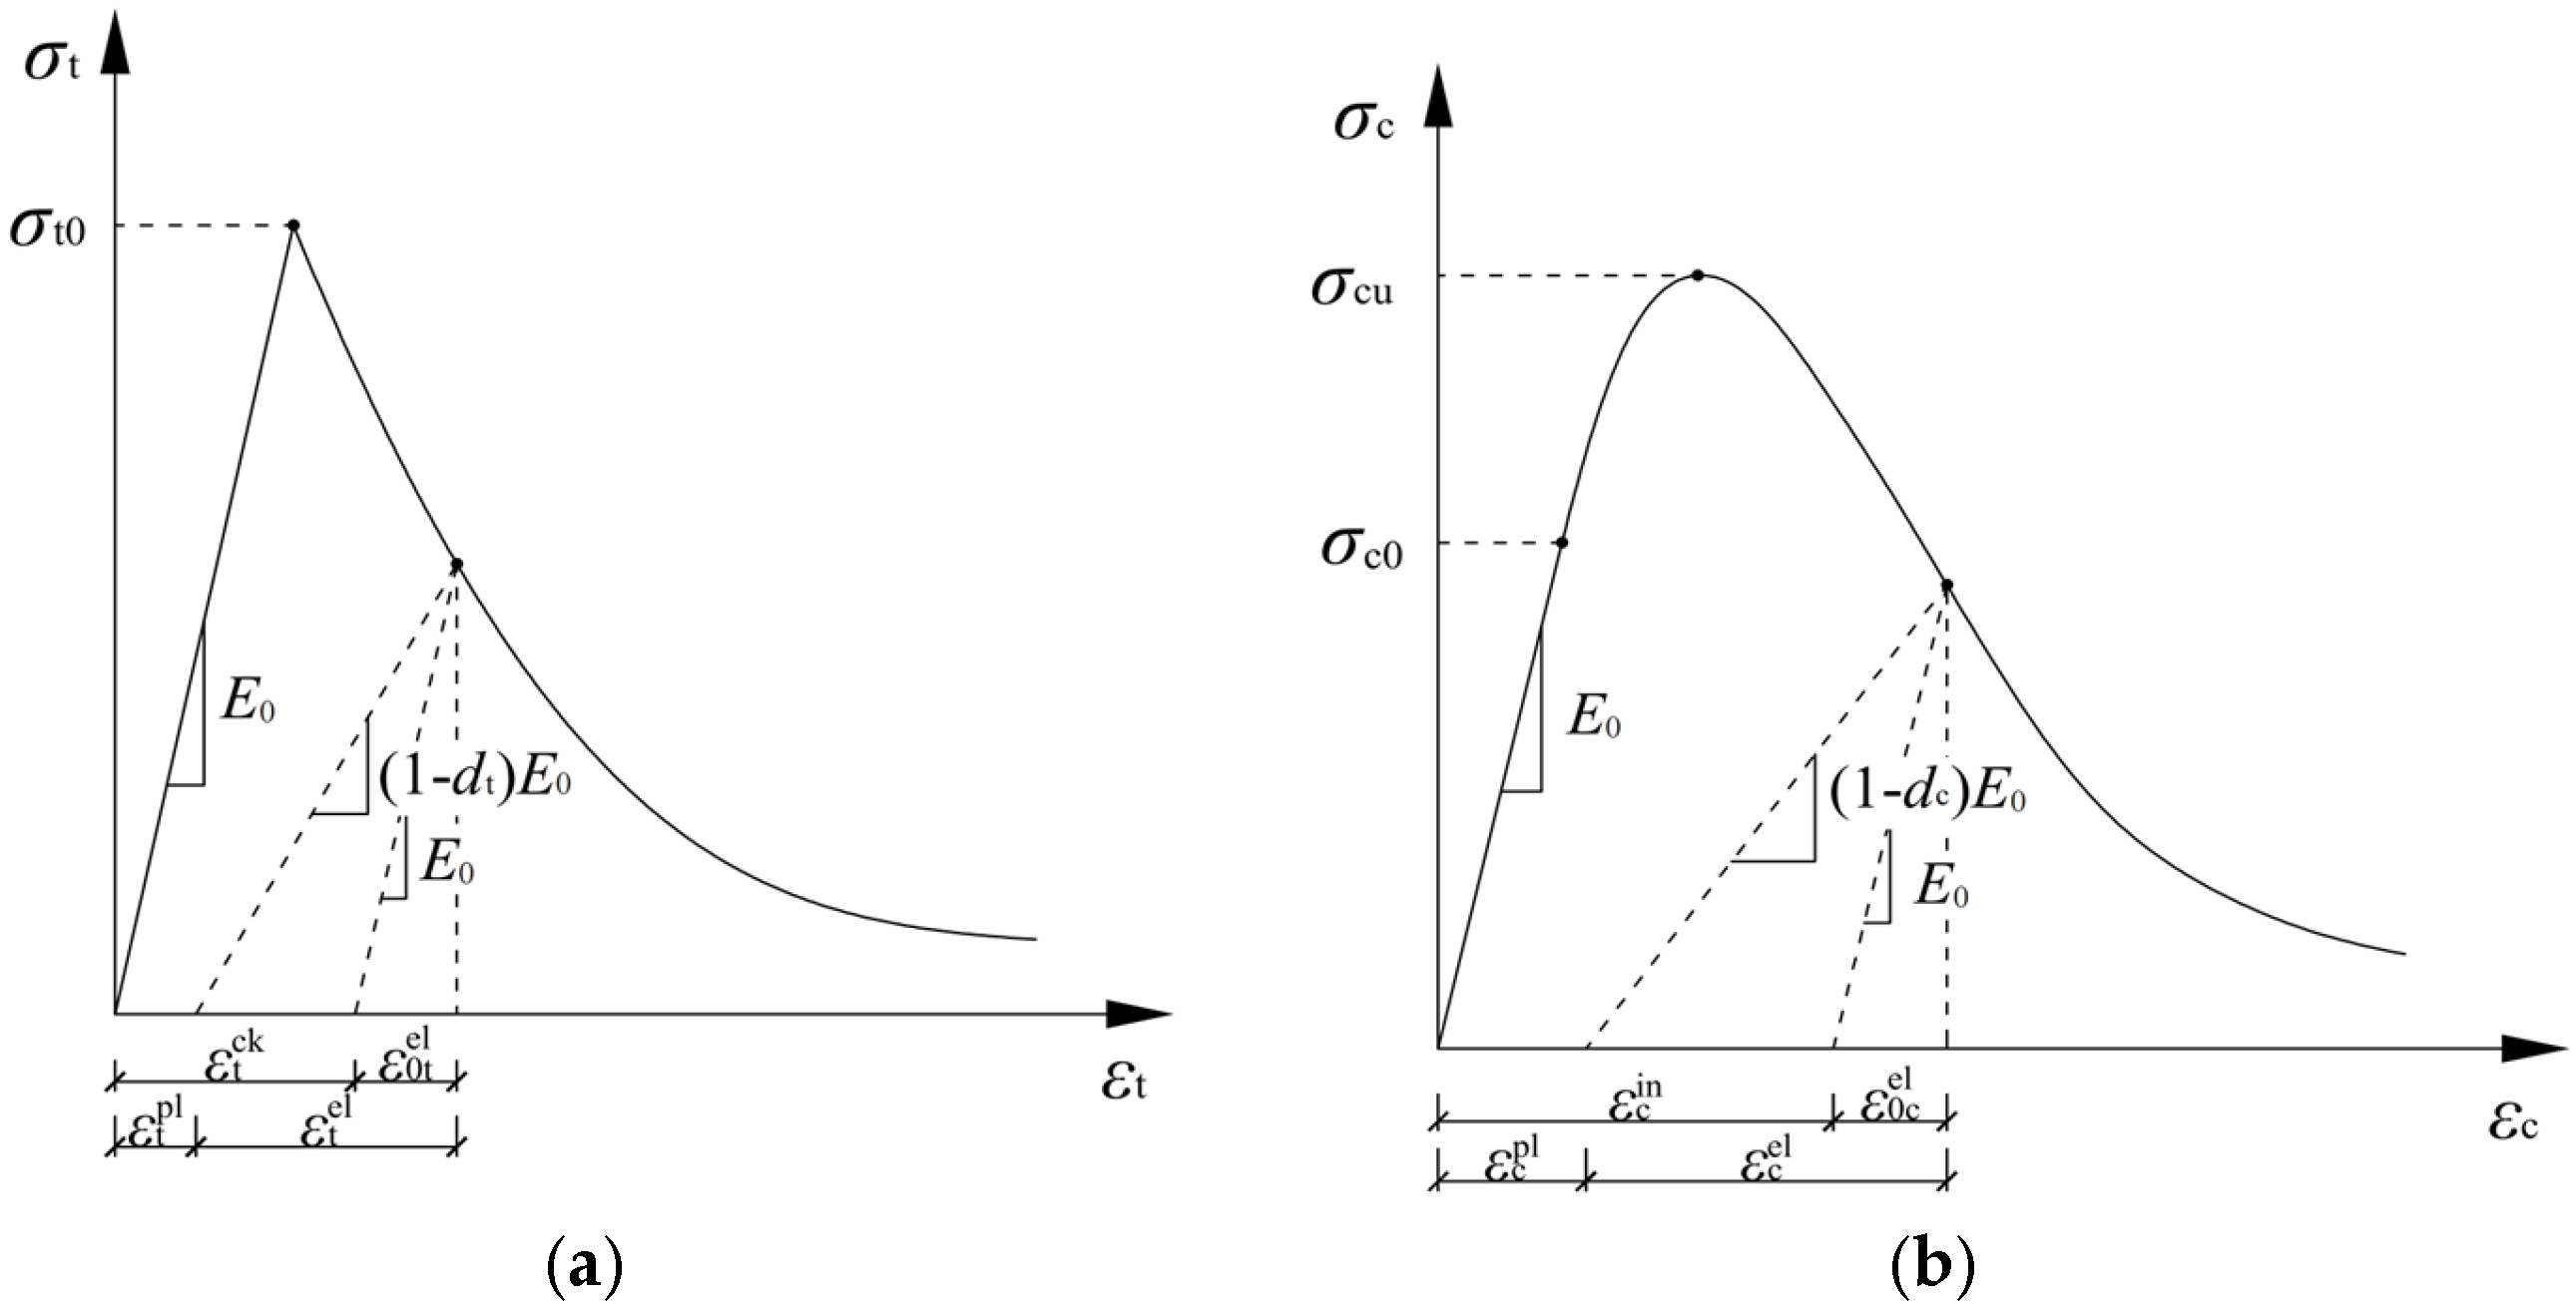
As shown in Figure 1a, when concrete is subjected to uniaxial tension, it undergoes a linear phase before reaching the failure stress σt0 and a softening attenuation phase after the peak. The descending segment is also accompanied by the degradation of stiffness. This process reveals the intrinsic relationship between later-stage failure and cracking strain. When defining the elastic–plastic behavior of a material, the final input tensile or compressive stress data excludes the data from the elastic phase. Therefore, the cracking strain is defined as the total strain minus the elastic strain of the material in the undamaged state, expressed as follows:
Figure 1.
Stress–strain relationship curve of concrete under uniaxial tension and compression: (a) concrete under uniaxial tension; (b) concrete under uniaxial compression.
The equivalent plastic strain under uniaxial tension is
As shown in Figure 1b above, when concrete is subjected to uniaxial compression, it undergoes a linear phase before reaching the initial yield stress σc0, a strengthening phase, and a softening and attenuation phase after the peak stress σcu. The inelastic strain is defined as the total strain minus the elastic strain of the material in the undamaged state, and its expression is as follows:
The equivalent plastic strain under uniaxial compression is
When concrete is subjected to uniaxial tension and uniaxial compression, its stress–strain relationship is as follows:
It can be derived from Equation (11) that
By substituting Equations (5) and (6) into Equation (13), we can obtain the formula for calculating the damage factor of concrete under uniaxial tension:
where .
Similarly, the formula for calculating the damage factor of concrete under uniaxial compression is
where .
In the above formula, both bt and bc are obtained from experimental data. Based on a large number of experimental results, bt should be taken as 0.1 and bc as 0.7.
2.2. Numerical Simulation Modeling
To establish an aluminum alloy tube–concrete column axial compression model, it is necessary to first establish three components in the Part module: the aluminum alloy tube, the core concrete, and the upper and lower end plates. The aluminum alloy tube is selected as a four-node reduced integral shell element (S4R). When assigning interface properties to the aluminum alloy tube, the thickness value t of the tube needs to be offset from the bottom surface. The core concrete and end plate parts were selected with eight-node reduced integral three-dimensional solid elements (C3D8R), which have a fast and accurate calculation speed. During the compression process, aluminum alloy pipes and core concrete are the main load-bearing components, while the end plates do not participate in the force and do not deform. Therefore, the upper and lower end plates are set as completely rigid bodies.
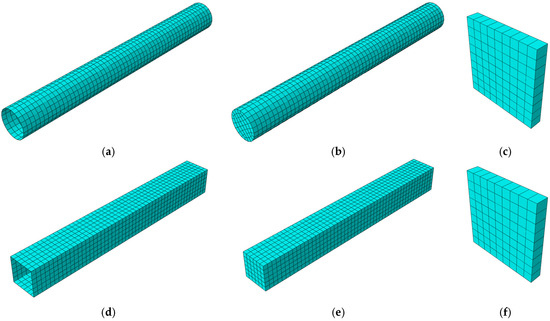
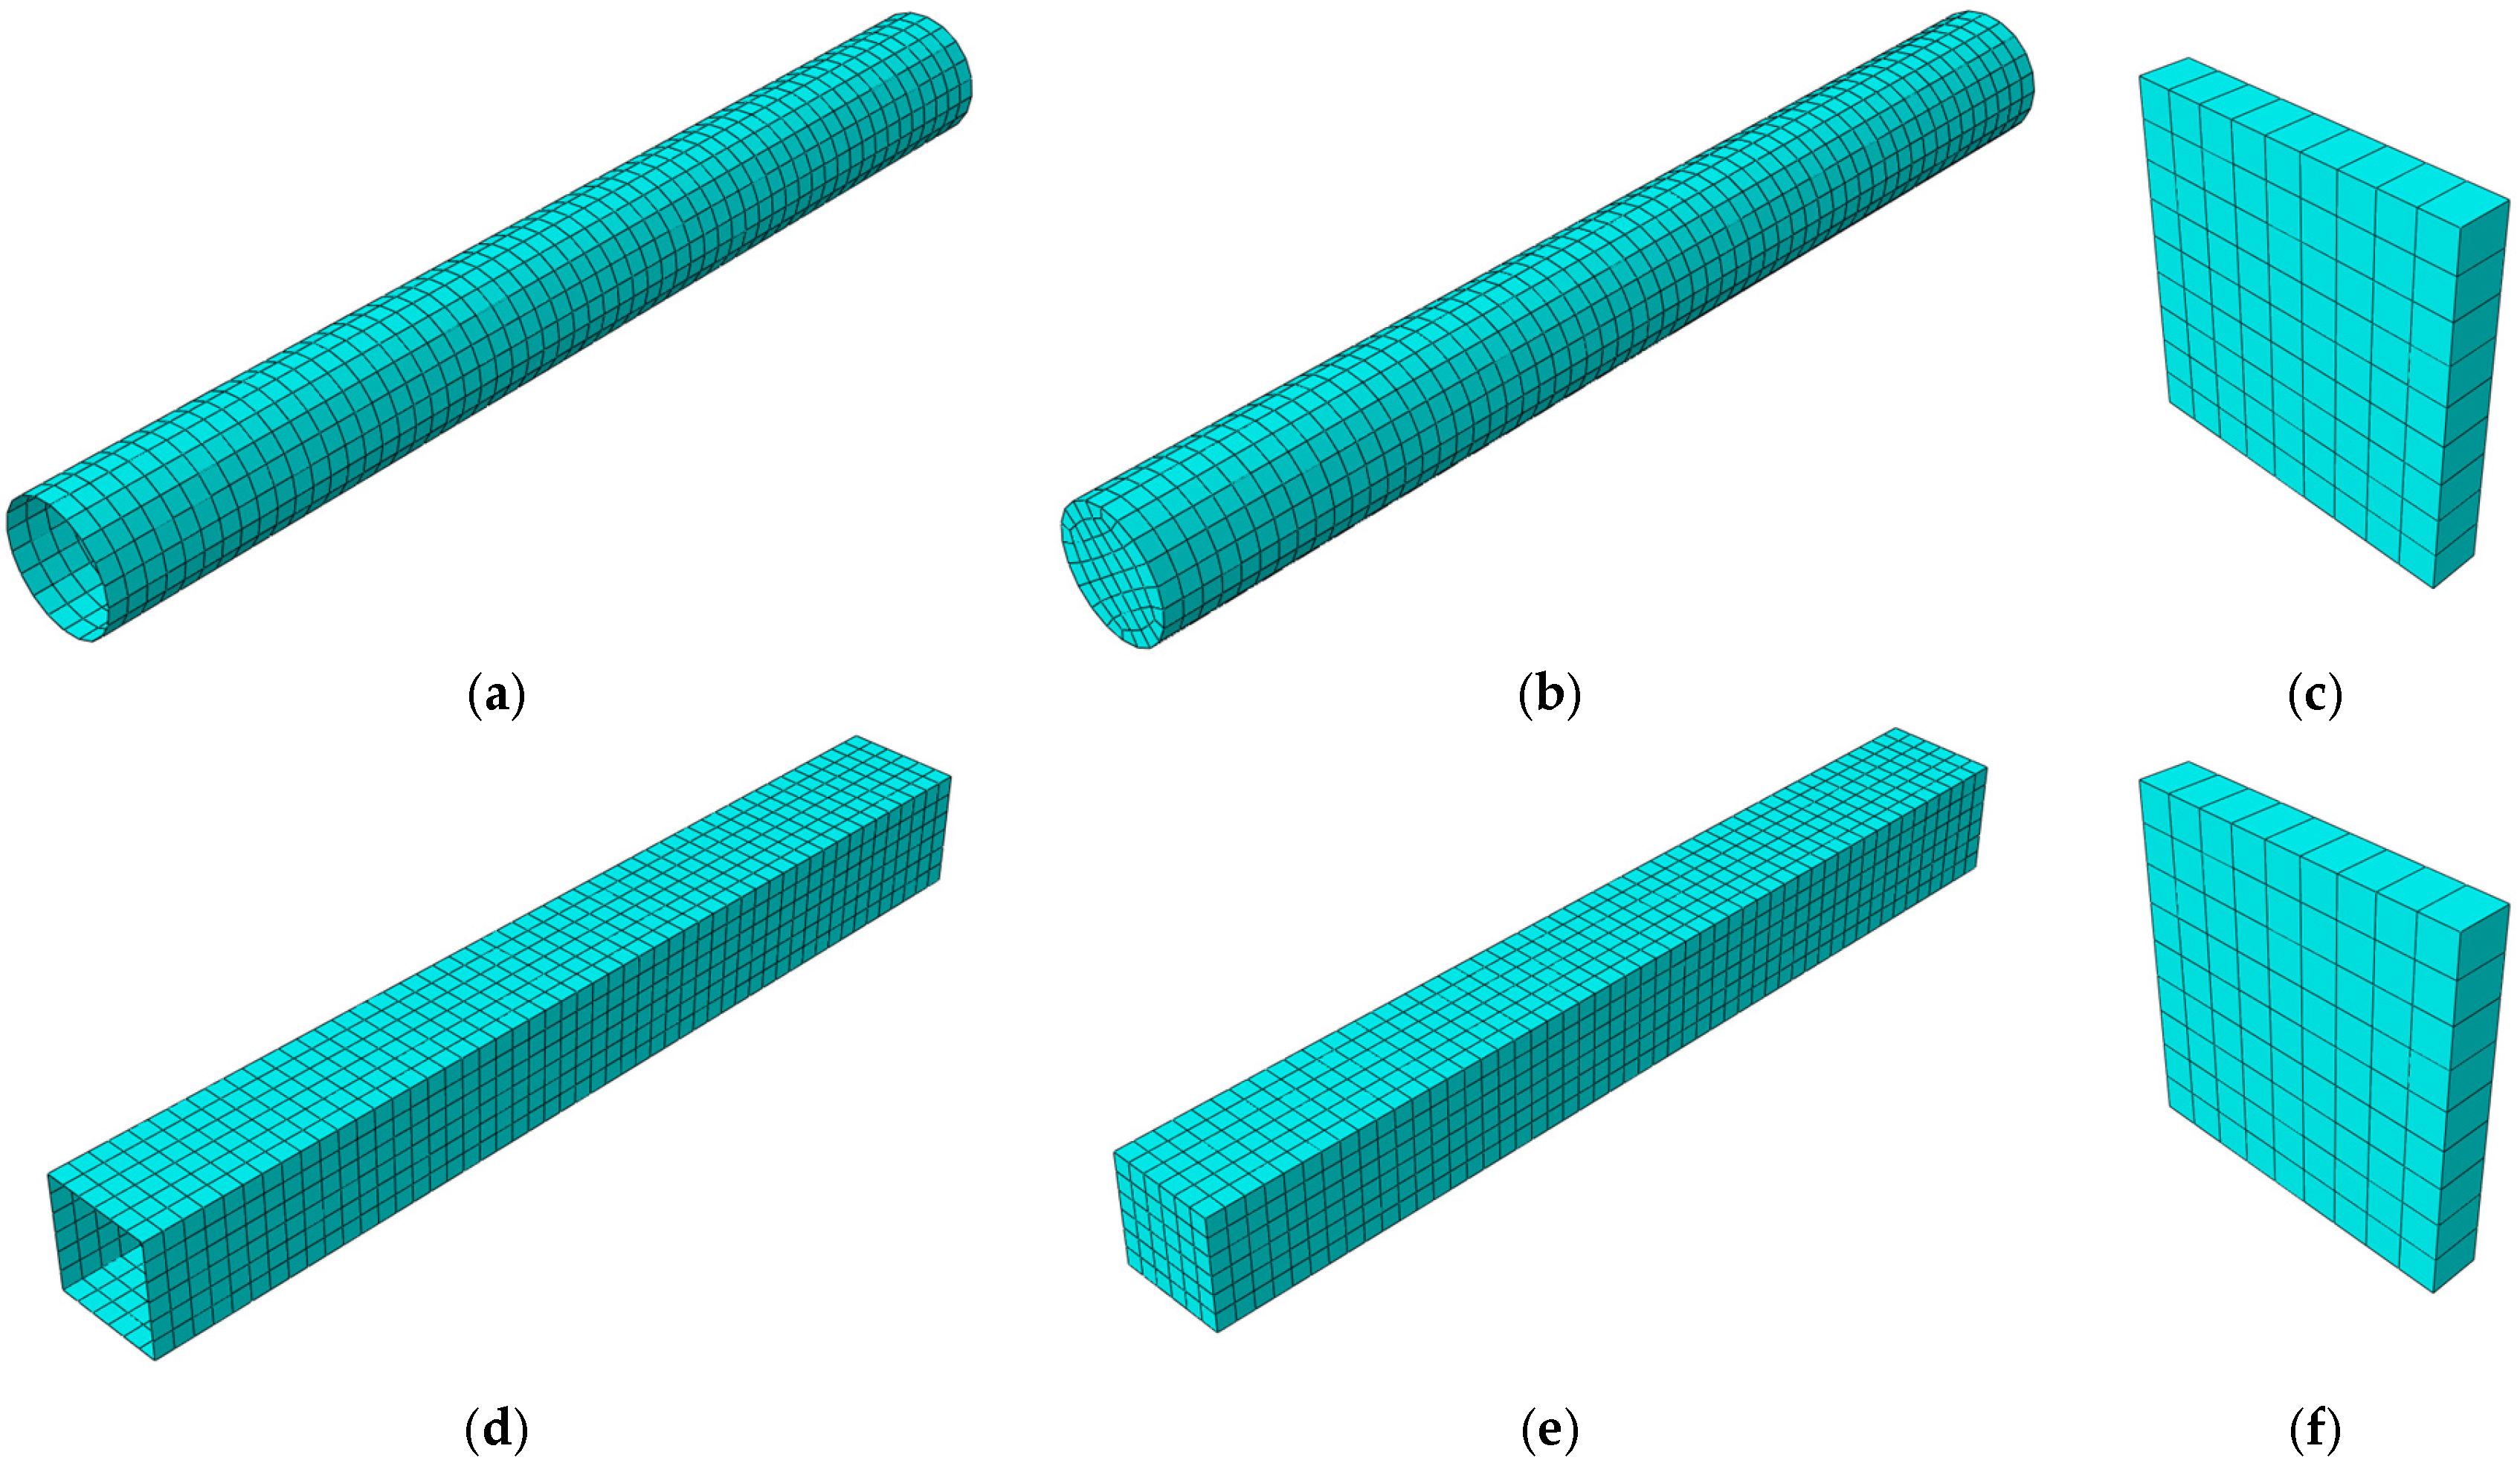
FE mesh partitioning is an important step in ABAQUS modeling. Whether the model is easy to converge, the accuracy of the model calculation results, and the model calculation speed are closely related to it, so it is necessary to select the grid size reasonably. This simulation uses structured grid partitioning technology to divide aluminum alloy pipes, core concrete, and end plates into four regions. The grid density is adjusted according to the specimen parameters to avoid grid distortion during the partitioning process. The mesh division of the long-column model in circular and square aluminum alloy tube–concrete is shown in Figure 2.
Figure 2.
Mesh division of each component of the model: (a) round aluminum alloy tube; (b) core concrete; (c) end plate; (d) square aluminum alloy tube; (e) core concrete; (f) end plate.
2.3. Interface Contact Relationship
Due to the composite structure studied in this paper, where various components interact and deform in coordination under load, the definition of contact between different components and materials directly affects the convergence speed and accuracy of the entire finite element calculation process. The contact element form between the aluminum alloy tube and the core concrete adopts a surface-to-surface (Surface-to-Surface contact) contact. The aluminum alloy shell element with higher stiffness is selected as the primary surface, while the concrete solid element with lower stiffness is selected as the secondary surface. There is mainly normal contact and tangential bond-slip between the two interfaces.
The normal direction between the aluminum alloy tube and the core concrete contact surface is set as hard contact, meaning that when the contact pressure is not zero, the two contact surfaces are considered to be in contact, and the contact compressive stress can be freely transmitted; when the contact pressure drops to zero or a negative value, it is considered as interface separation, and the constraints are released, thereby limiting the penetration behavior of the interface.
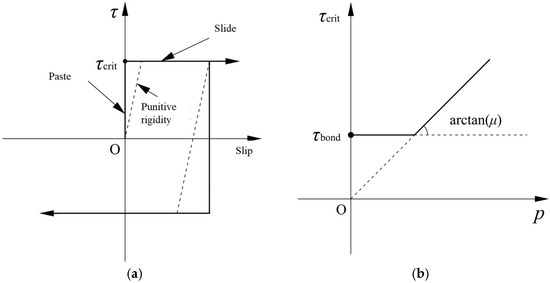
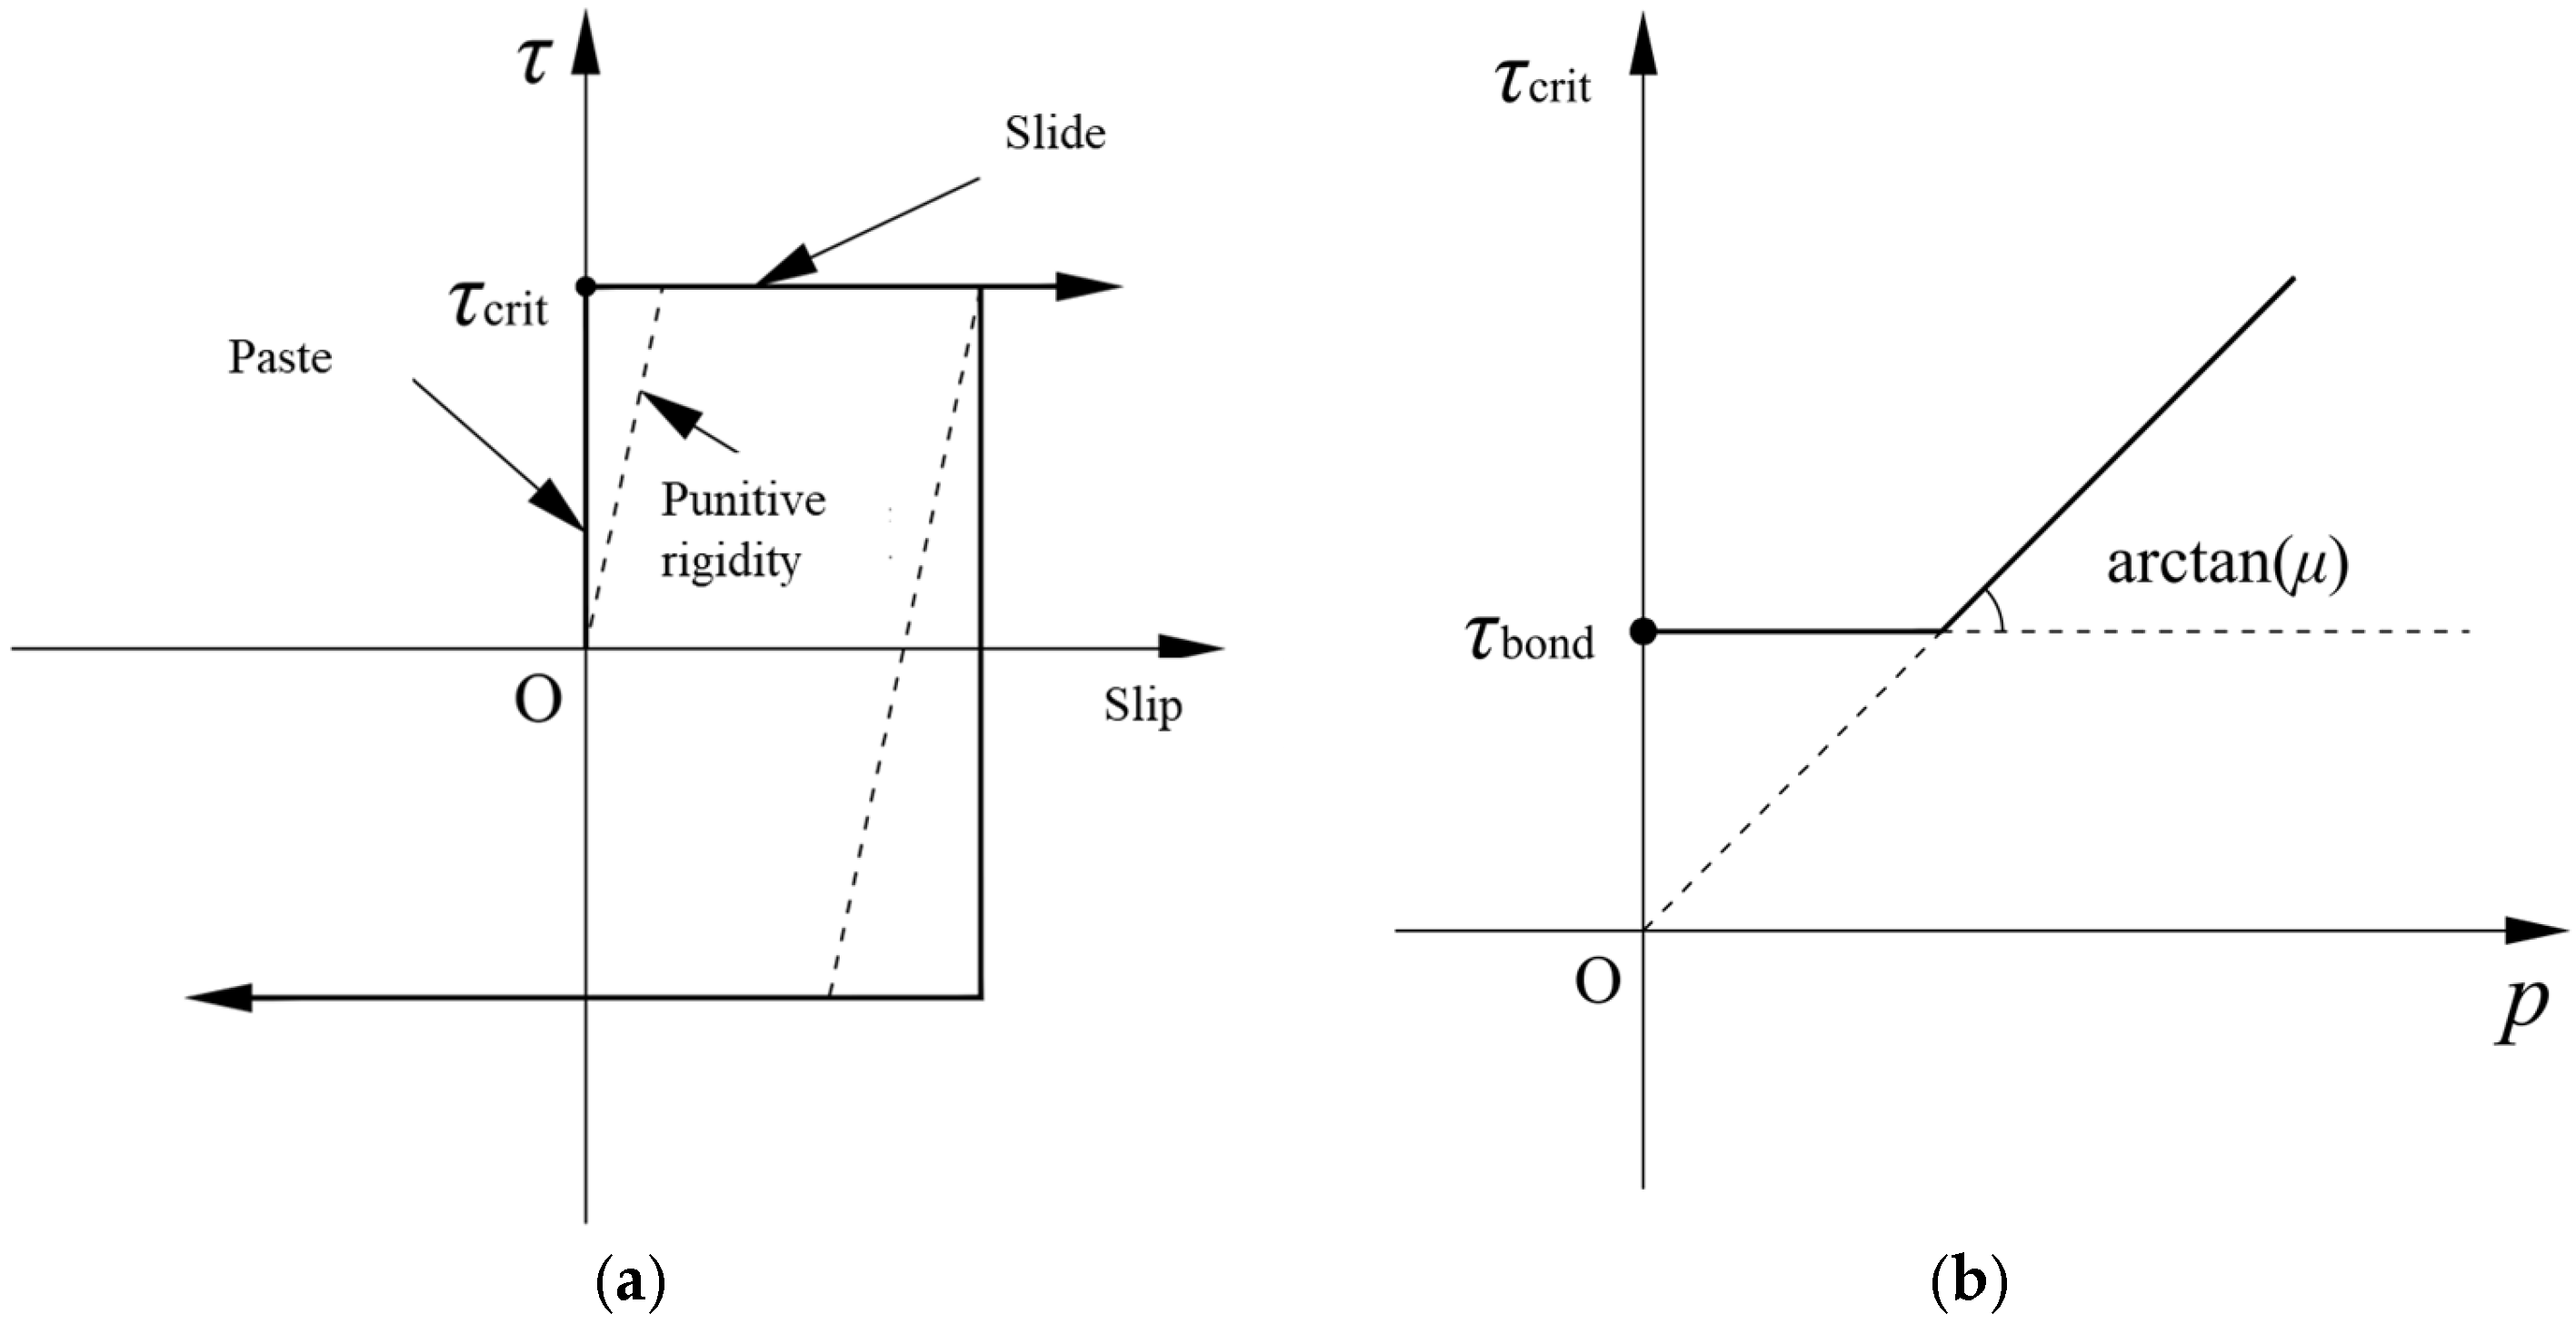
This article employs the “penalty” function Coulomb friction model to characterize the tangential force on the interface, as shown in Figure 3a. The contact interface between the aluminum alloy tube and the core concrete can transmit shear stress. When the shear stress reaches the critical value τcrit, relative slippage will occur between the two. During the slippage process, the interfacial shear stress remains essentially constant, and its value is proportional to the normal contact pressure value and is not less than the average interfacial bond force τbond, as shown in Figure 3b. The expression for the Coulomb friction model is
Figure 3.
Contact interface calculation: (a) shear stress and slip diagram of contact interface; (b) schematic diagram of critical shear stress of contact interface.
In the formula, p represents the interface contact pressure, and μ denotes the interface friction coefficient, which typically ranges from 0.2 to 0.6. The friction coefficient was determined by considering the distinct interface characteristics associated with different cross-sectional geometries, as well as through sensitivity analyses. For circular aluminum alloy tube–concrete specimens, a relatively uniform contact condition exists along the perimeter, and the interface friction coefficient was therefore taken as 0.25 [24,25]. In contrast, square aluminum alloy tube–concrete specimens exhibit non-uniform contact pressure and enhanced mechanical interlock at the corners, leading to increased frictional resistance at the interface. Accordingly, a higher friction coefficient of 0.6 [24,25] was adopted for square sections. Parametric trial calculations indicated that the selected friction coefficients enable the numerical model to reasonably reproduce the experimentally observed load–displacement responses and deformation characteristics, without artificially compensating for stress concentration effects at the corners.
2.4. Boundary Conditions and Loading Method
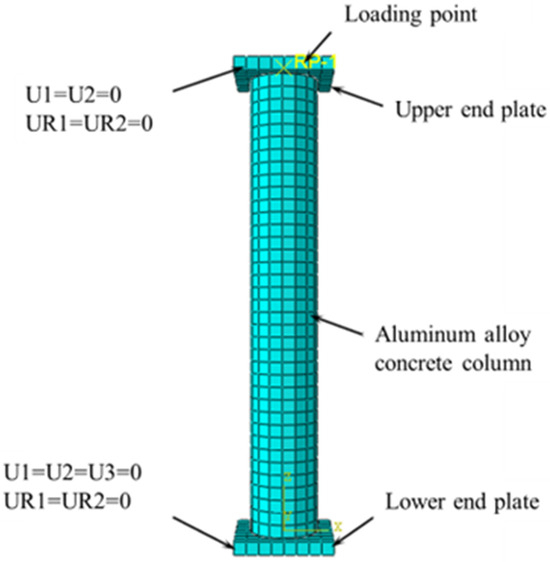
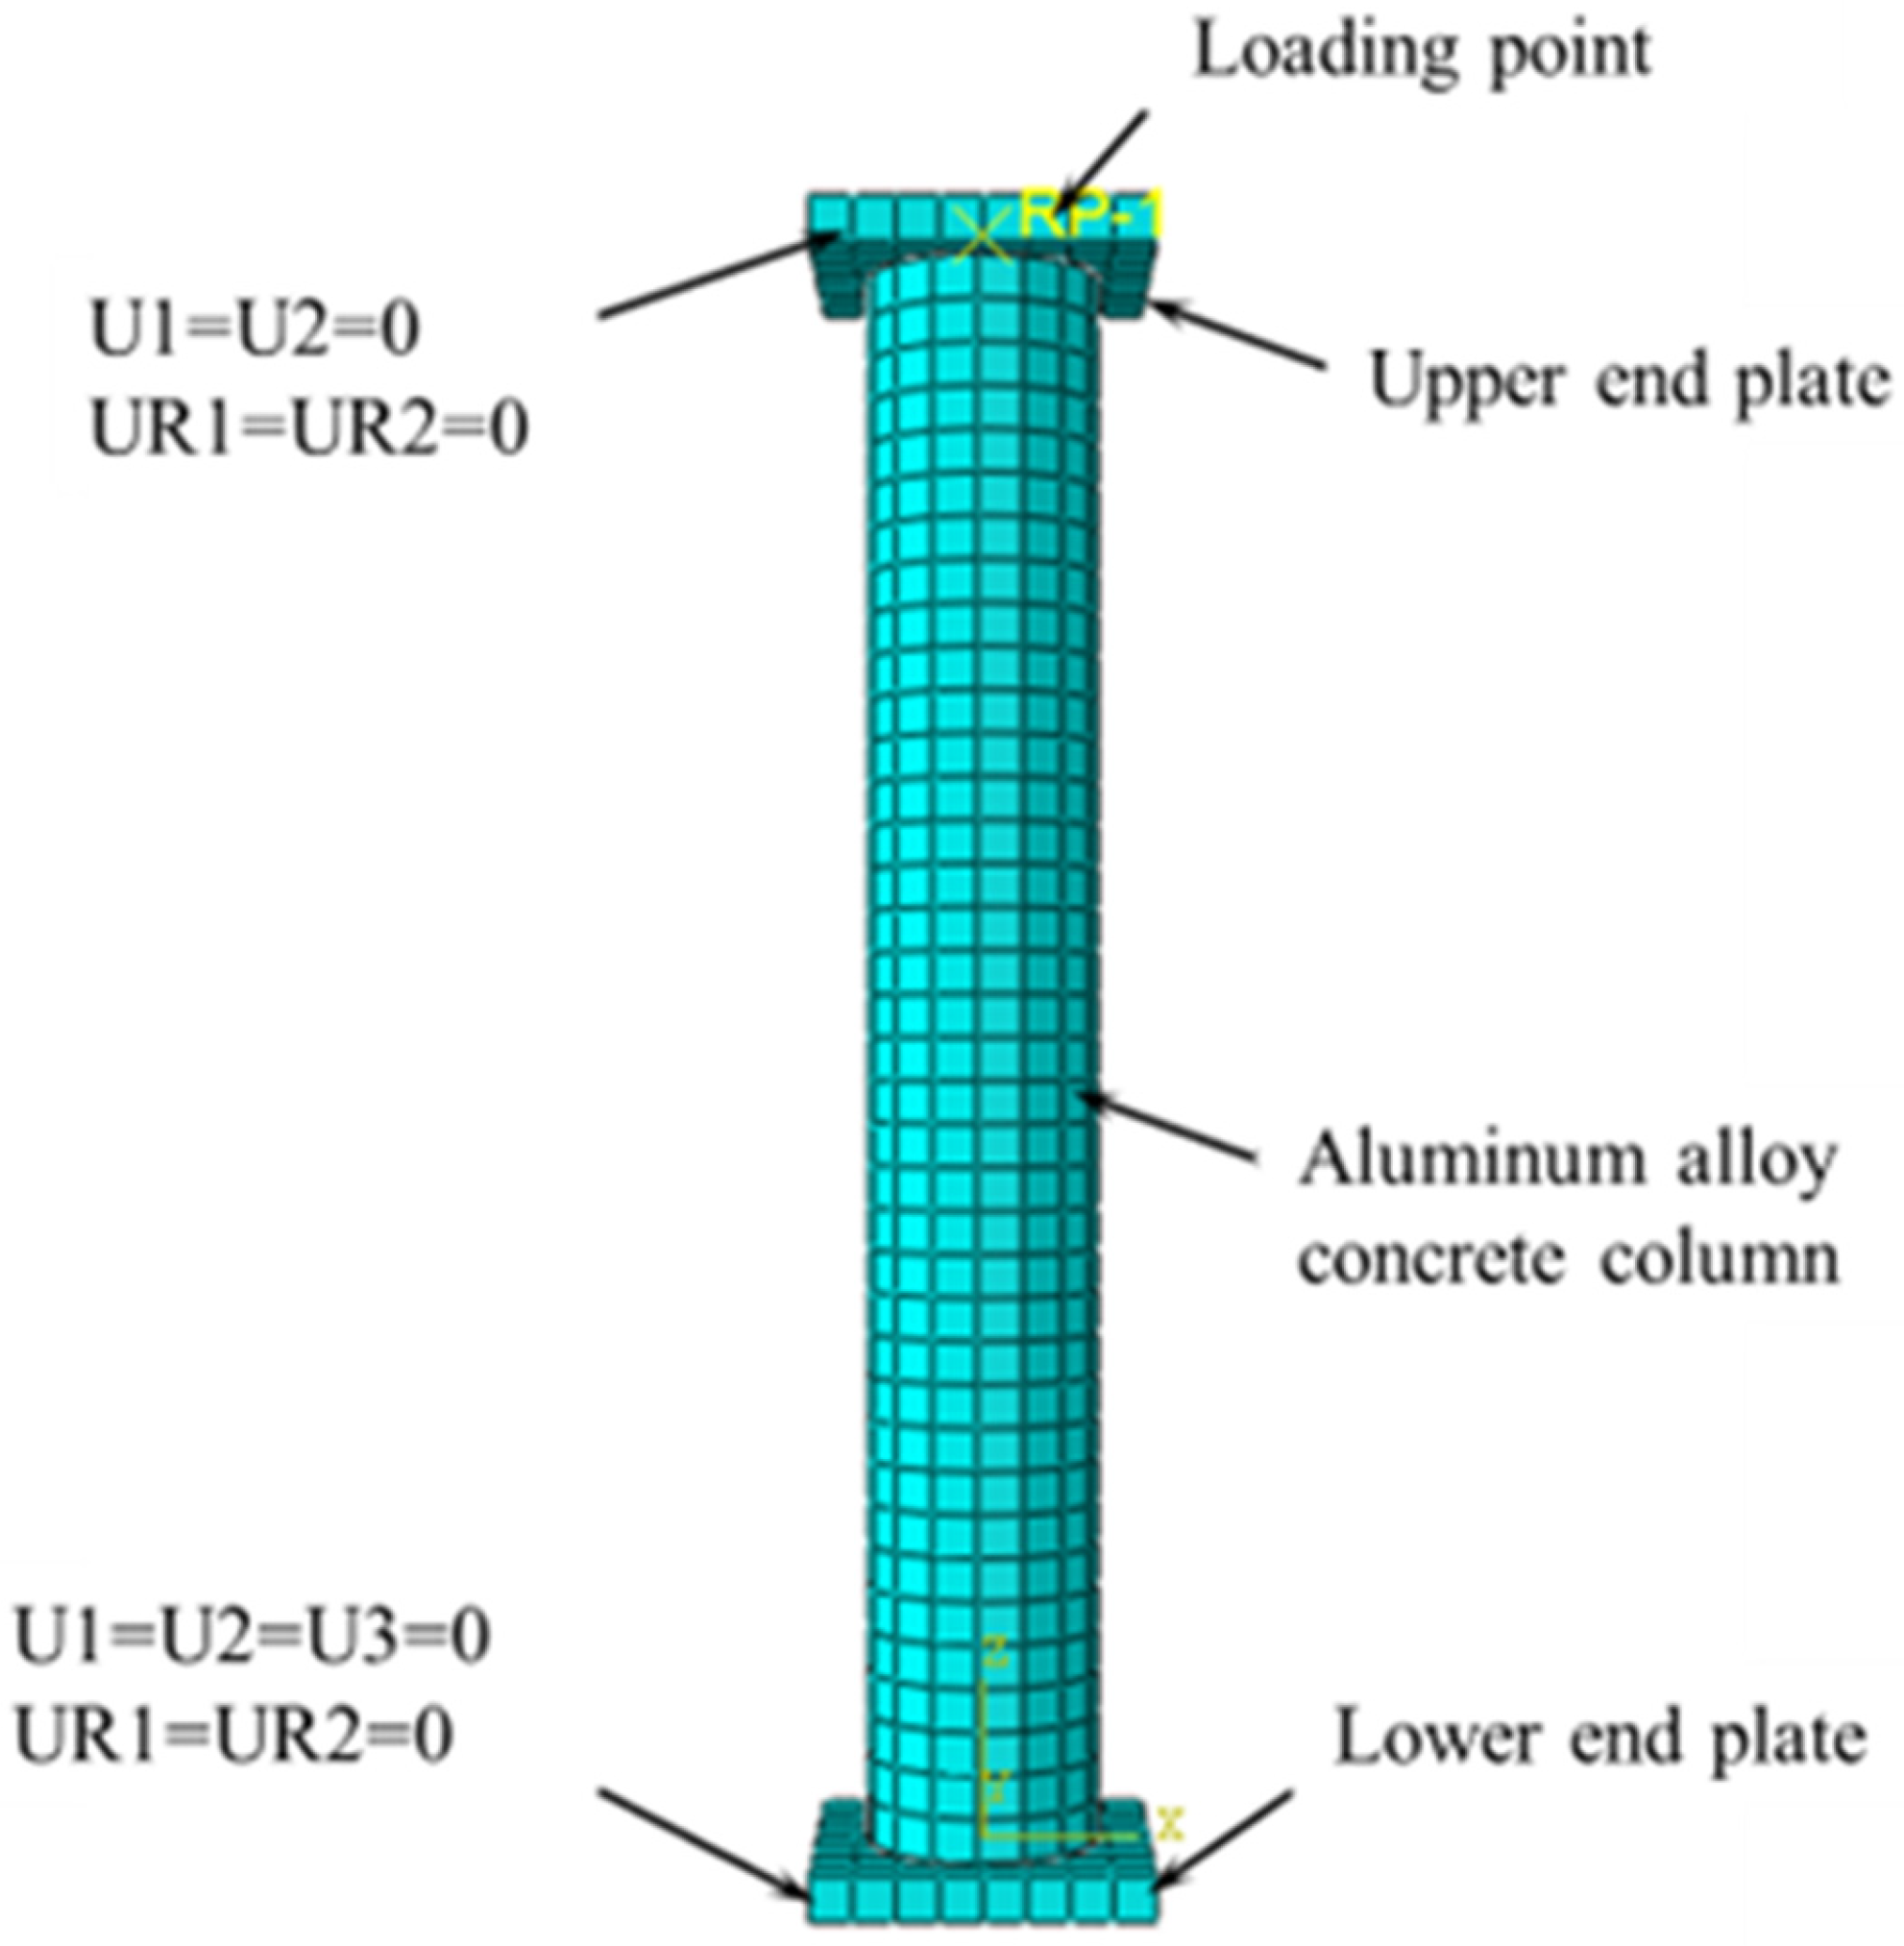
In this study, a displacement-controlled loading scheme was adopted. The top and bottom end plates were respectively coupled to two reference points, RP-1 and RP-2, where the boundary conditions were prescribed. A negative displacement of 15 mm was applied at the reference point along the negative z-axis. For the medium- and long-column specimens, rotation about the x-axis was permitted.
For the top end plate, the translational degree of freedom along the z-axis (U3) and the rotational degree of freedom about the x-axis (UR1) were released, while U1 = U2 = 0 and UR2 = UR3 = 0 were imposed. For the bottom end plate, all translational degrees of freedom were constrained (U1 = U2 = U3 = 0), and the rotational degrees of freedom UR2 and UR3 were restrained.
For the finite element models of medium- and long-column specimens, the influence of initial geometric imperfections was taken into account. Accordingly, an initial eccentricity of L/1000 was introduced in the compressed member during model establishment.
3. Validation of Finite Element Model
To study the axial compression performance of aluminum alloy tube–concrete columns, Chen Ding et al. [24,25] conducted axial compression tests on circular aluminum alloy tube–seawater-sand–concrete columns using the length-to-diameter ratio L/D and diameter-to-thickness ratio D/t as design references. The experiment was loaded on the YES-50000 four-column pressure testing machine, and a knife-edge hinge loading support was used to prevent movement of the loading position during the experiment. The experiment obtained the test data of each measuring point through displacement sensors and strain gauges; extracted the relationship curve between the load, displacement, and strain of the specimen; and calculated the bearing capacity, ductility coefficient, and lateral deformation coefficient of the specimen through the test data.
Based on the experimentally measured loading conditions [24,25], the finite element loading scheme adopted in this study was defined accordingly. The numerical model was designed to closely replicate the experimental loading procedure, thereby ensuring consistency between the simulation and the test process. The applied loading configuration and boundary conditions in the finite element model are schematically illustrated in Figure 4. A displacement-controlled loading strategy was employed to ensure numerical stability during the post-peak response. In accordance with the experimental protocol, the peak axial load obtained from the load–displacement curve was defined as the ultimate load, and the numerical analysis was terminated when the axial load decreased to 80% of the ultimate load, which was taken as the failure criterion.
Figure 4.
Schematic diagram of specimen loading.
This article will use some experimental data from the experiment to verify the effectiveness of the circular aluminum alloy tube–concrete column model. The specific parameters of the specimens are shown in Table 3, where L, D, and t are the height, cross-sectional diameter, and wall thickness of the specimens, fy and fcu (cubic strength) are the yield strength of the aluminum alloy and the strength of the concrete, and Nue is the experimental value.
Table 3.
List of parameters for some test specimens [24,25].
3.1. Verification of Circular Aluminum Alloy Tube–Concrete Column Model
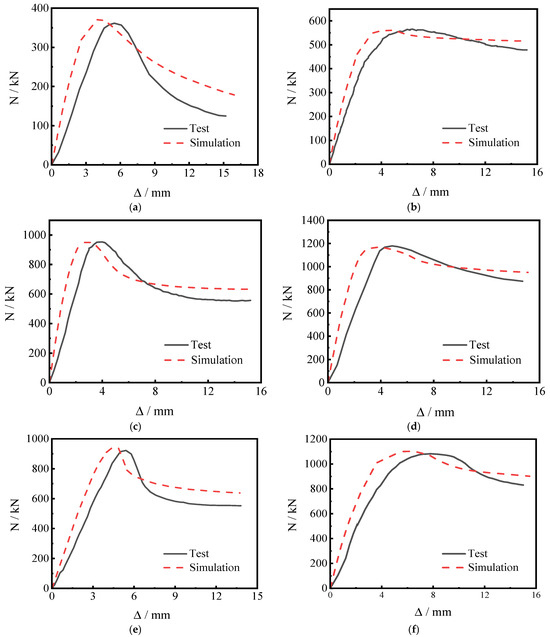
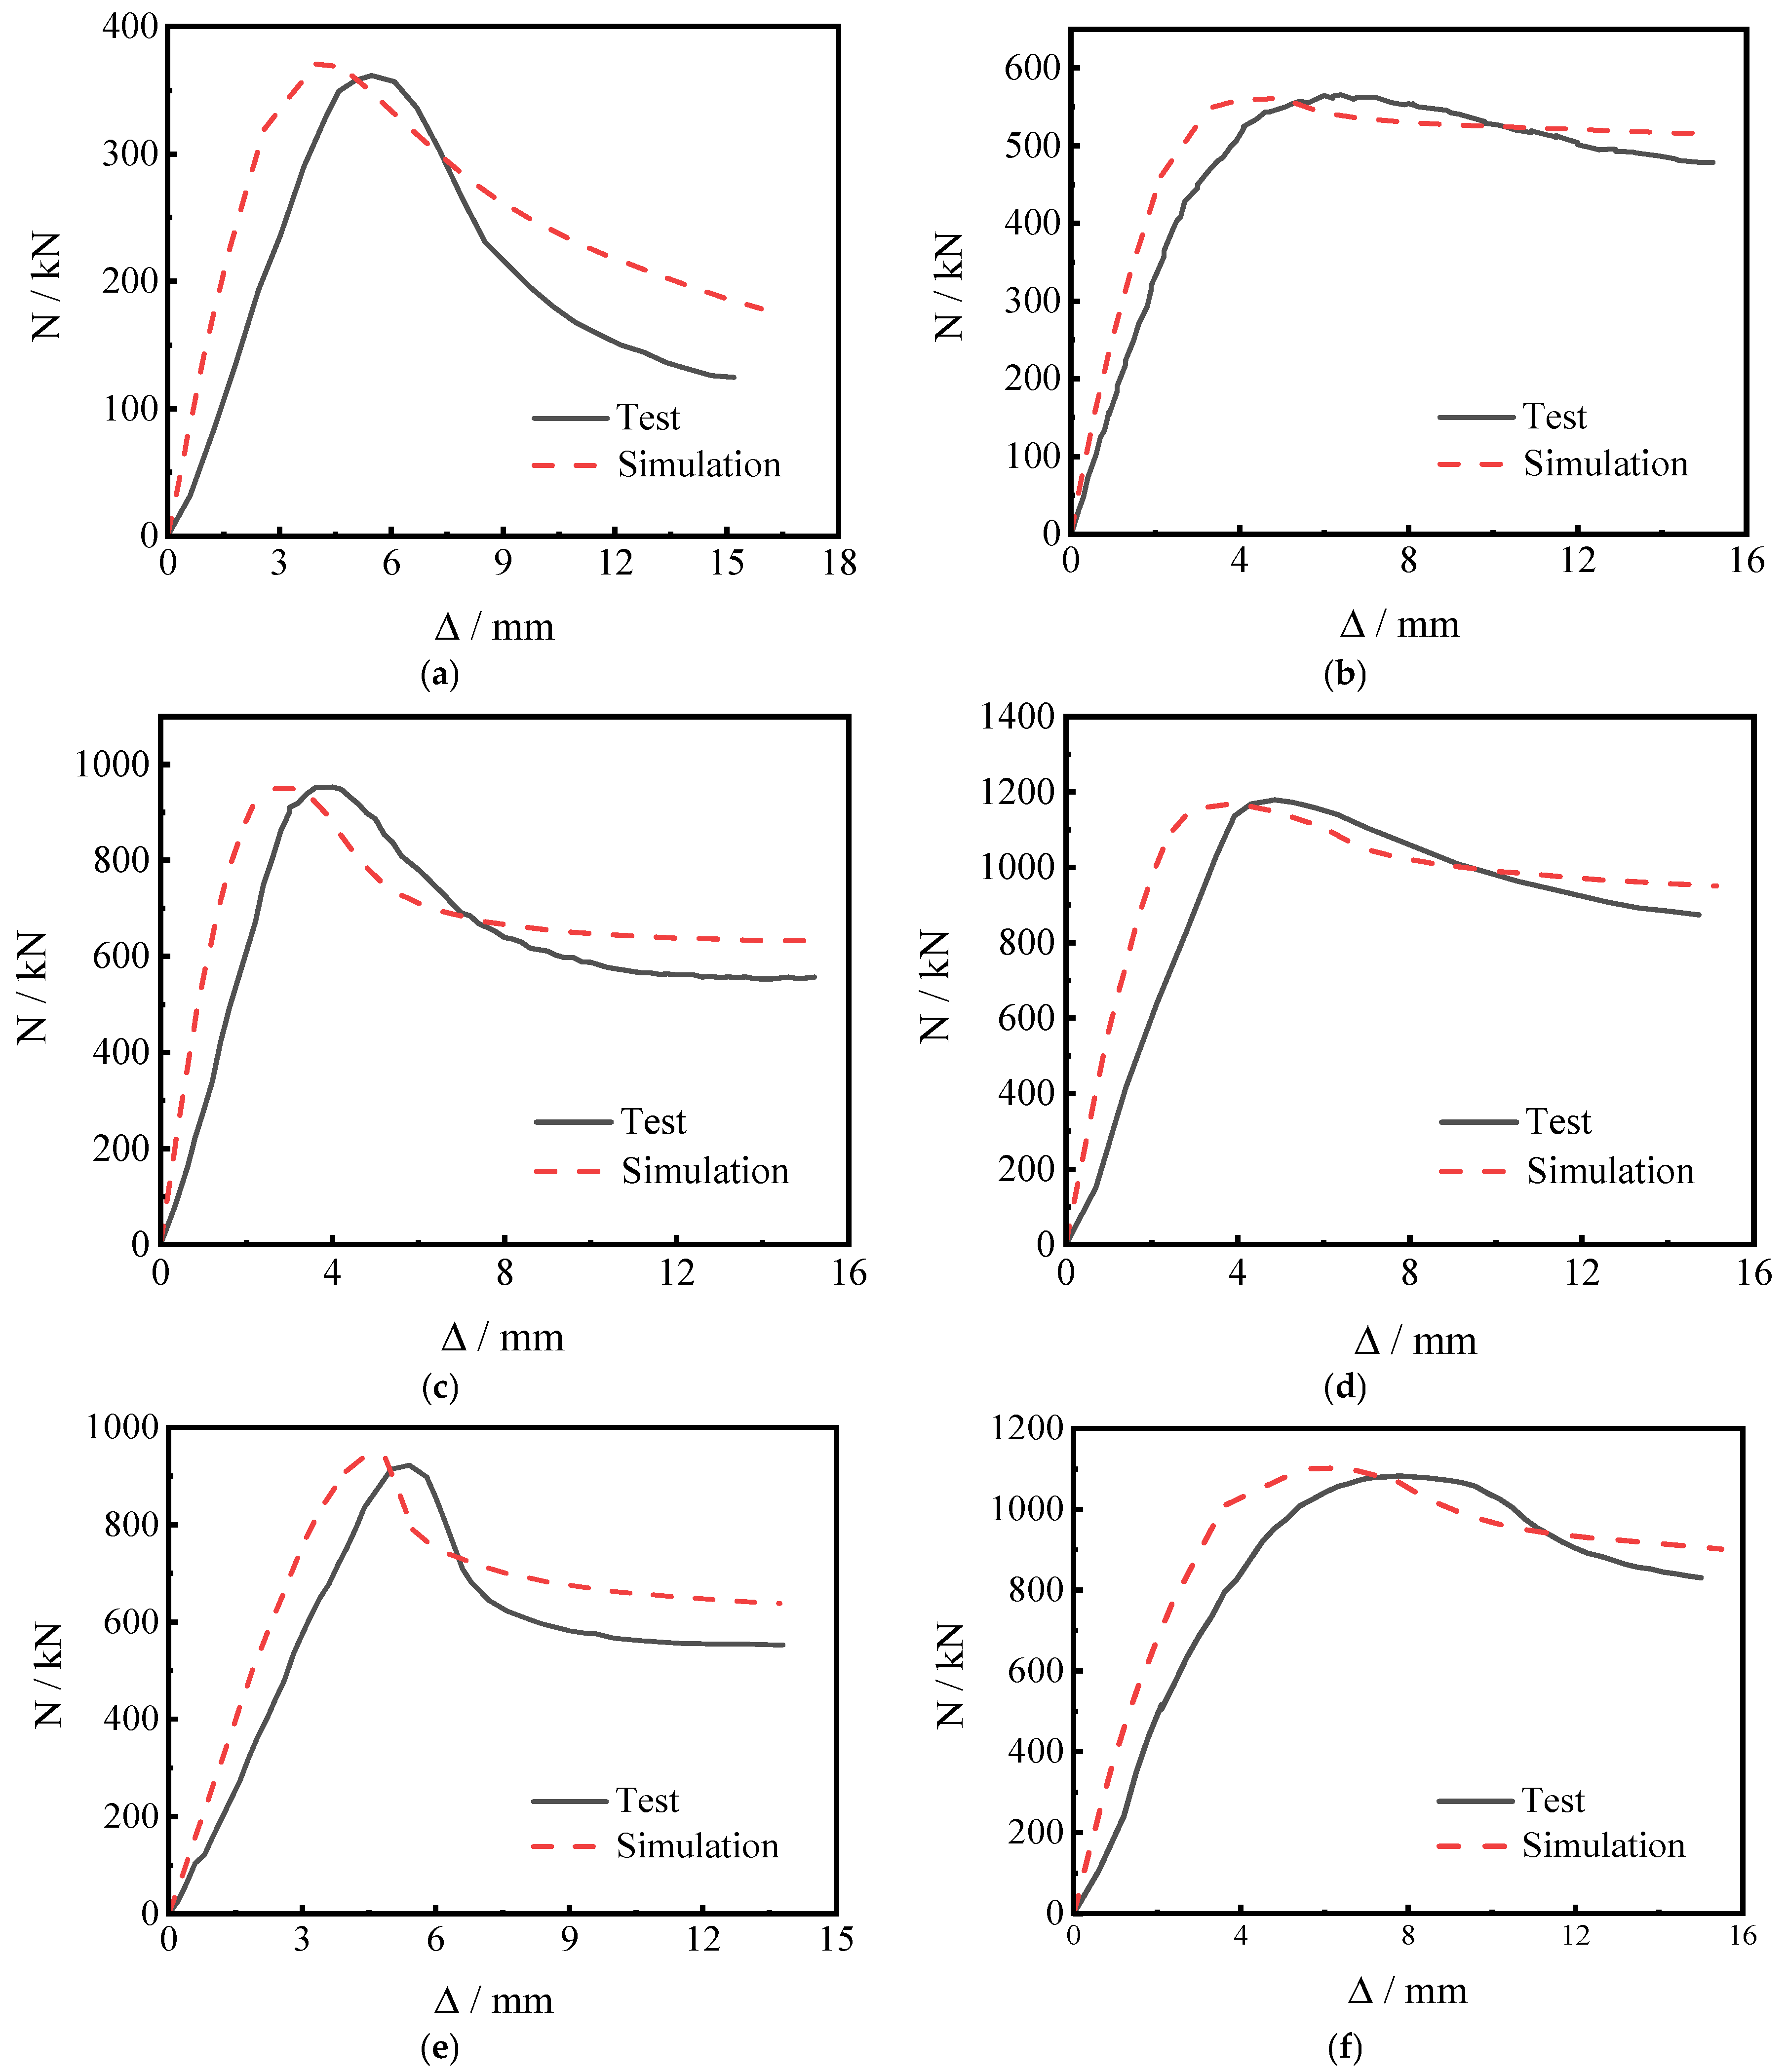
This article uses experimental data to establish a corresponding finite element model of circular aluminum alloy tube–concrete columns. The ultimate bearing capacity and load strain curve obtained from finite element simulation are compared with those obtained from experiments to verify the correctness of the axial compression model of circular aluminum alloy tube–concrete columns in this simulation and the effectiveness of the modeling method. Table 4 shows the comparison results of the bearing capacity test values Nue and simulated values Nus of circular aluminum alloy tube–concrete columns. It can be seen that the average ratio of the two is 0.986, the standard deviation is 0.022, and both the ratios are between 1.02 and 0.95, with an error of about 5%, which meets the requirements of the engineering error range.
Table 4.
Comparison between simulated and experimental values of ultimate bearing capacity of circular aluminum alloy tube–concrete columns.
As shown in Figure 5, compared with the experiment, the initial stiffness of the finite element simulation results is slightly higher, but the simulated value of the ultimate bearing capacity is not significantly different from the experimental value, and both curves show a downward trend in the later stage of loading. It can be seen that the load–displacement curves of the two are basically consistent, which basically verifies the effectiveness of the aluminum alloy tube–concrete column model in this simulation. The main reason for the error is that in finite element software, the constitutive model of the material is idealized, ignoring some factors that may affect the results in practical experiments, such as processing errors in aluminum alloy pipes and the compaction degree of the core concrete.
Figure 5.
Comparison of load–displacement curves for circular aluminum alloy tube–concrete columns: (a) lc03-2; (b) lc05-2; (c) lb53-1; (d) lb55-2; (e) lc53-2; (f) lc55-1.
3.2. Verification of Square Aluminum Alloy Tube–Concrete Column Model
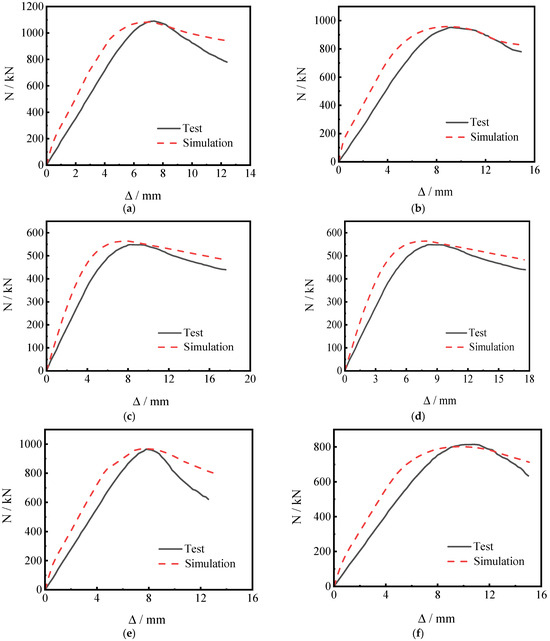
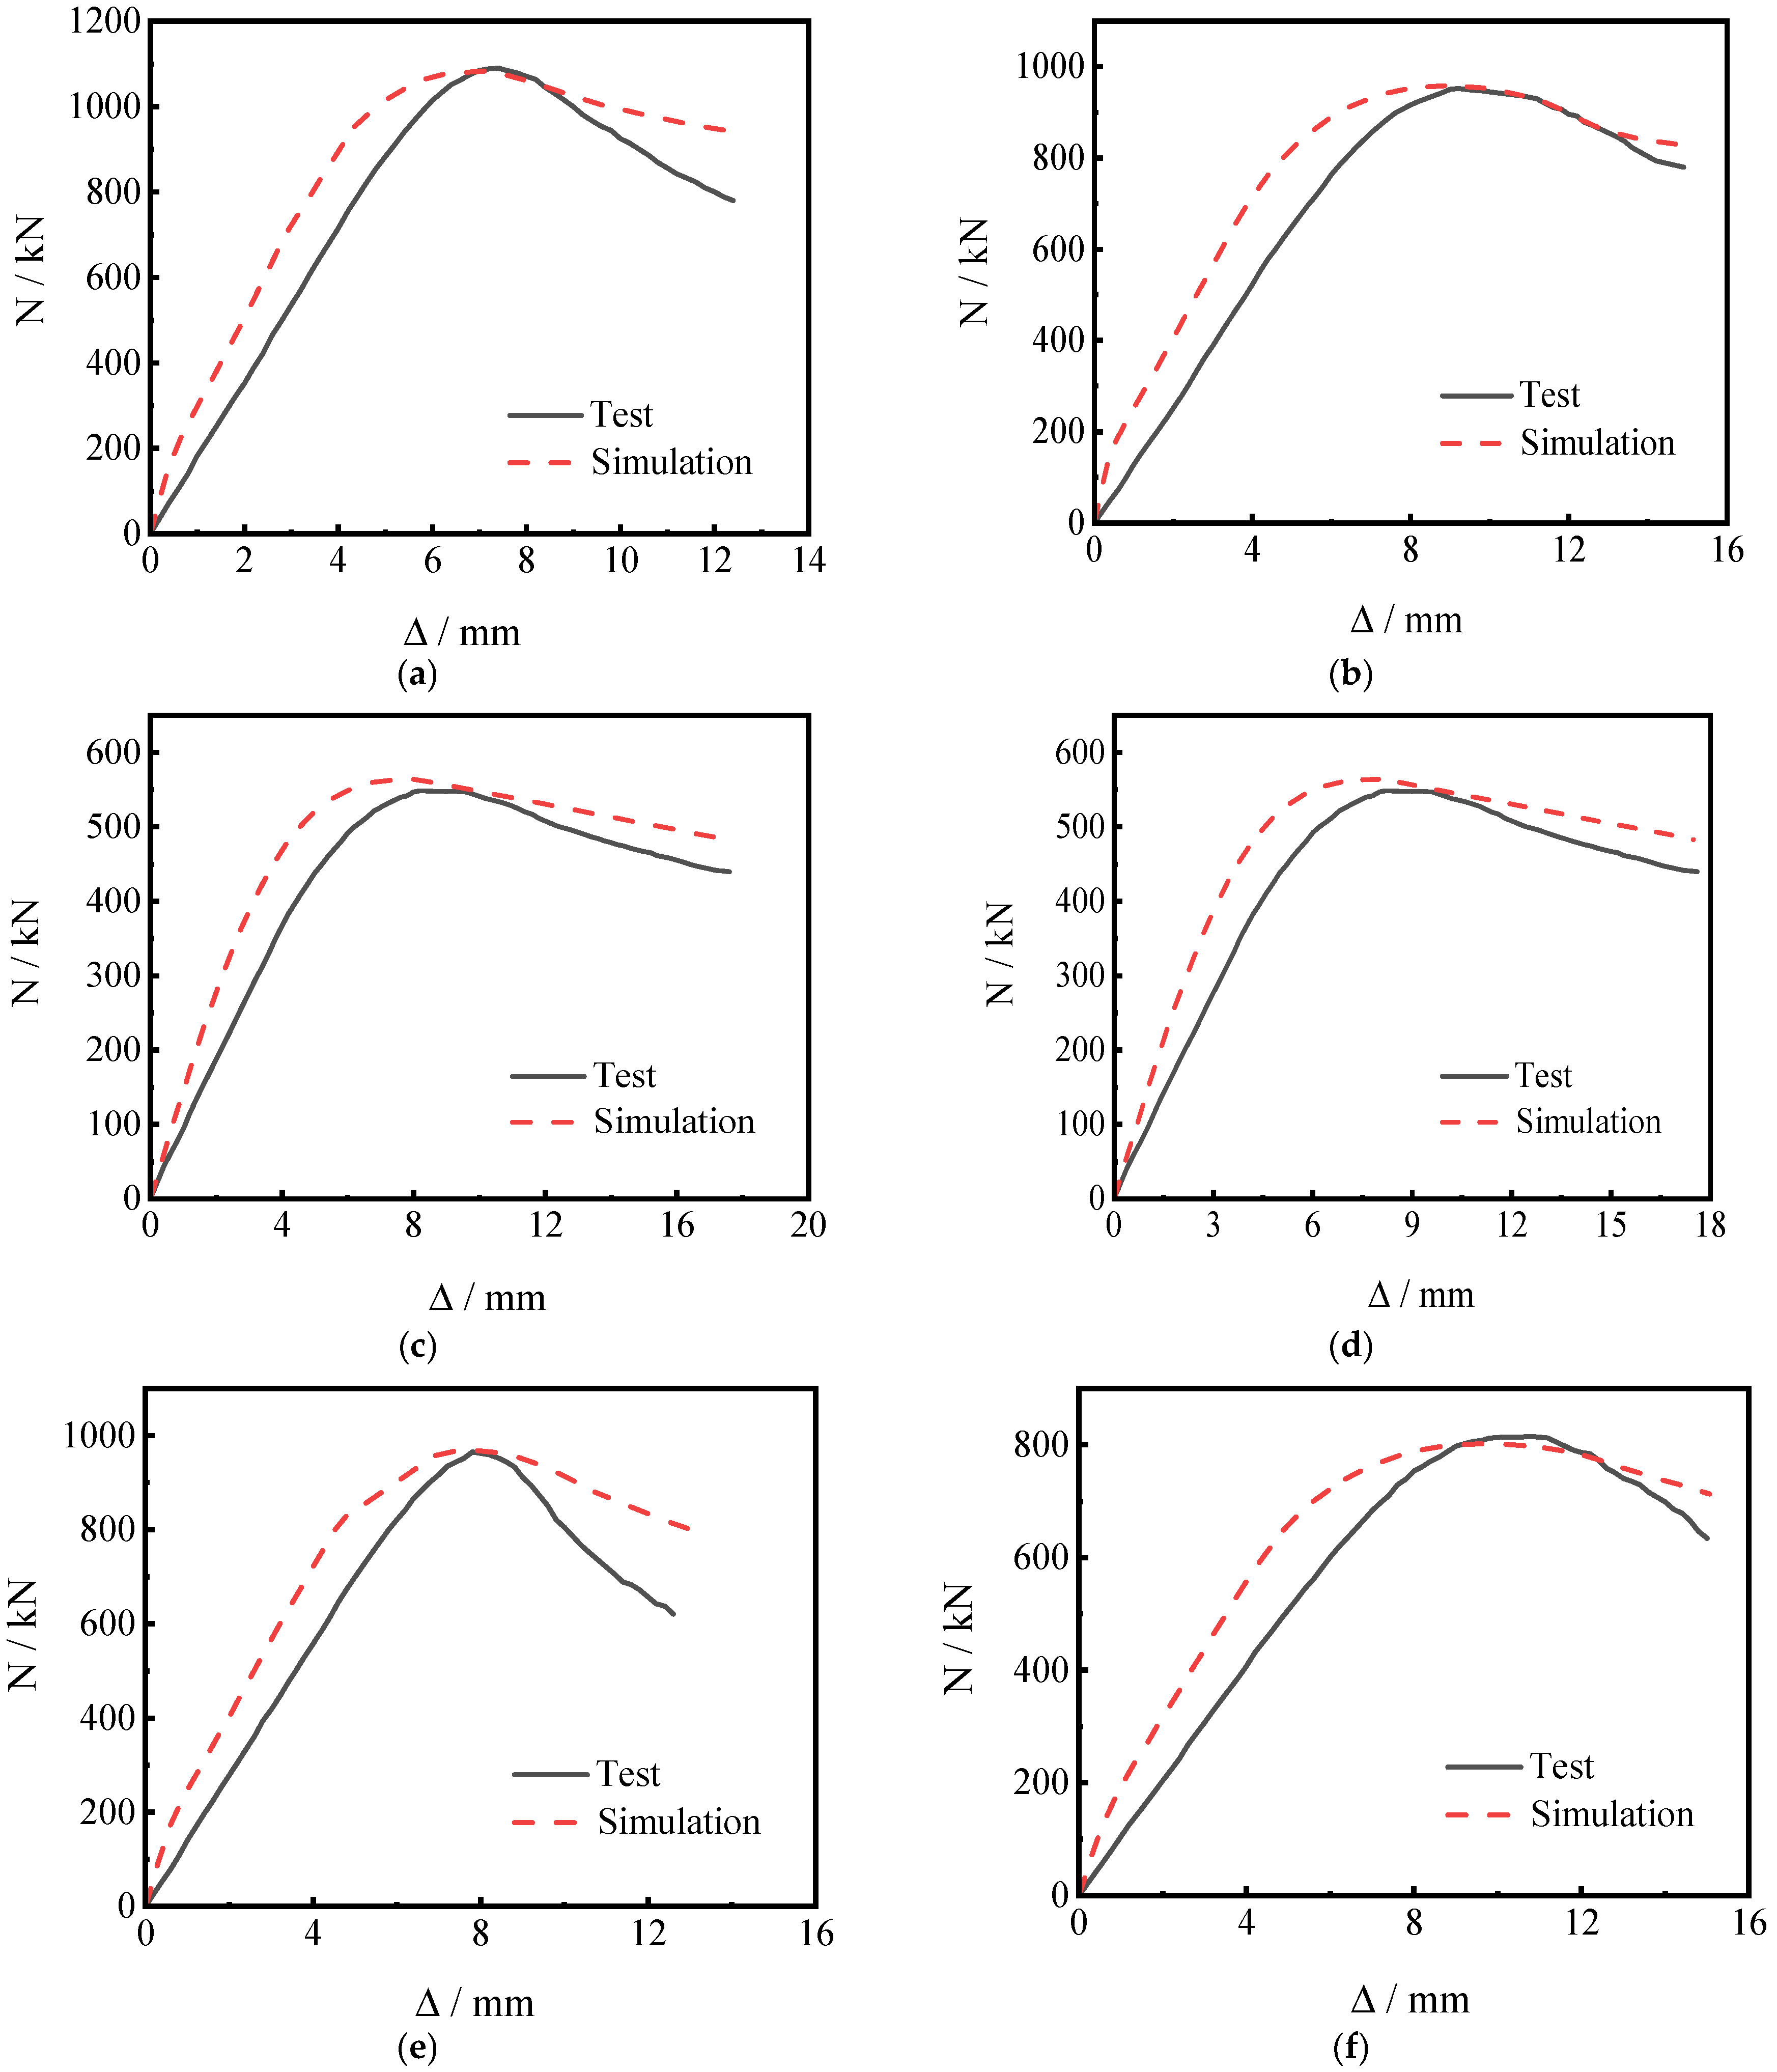
For the model validation of square aluminum alloy tube–concrete columns, a finite element model was established using experimental data, and the simulated ultimate bearing capacity and load–displacement curves were compared with experimental data to verify the effectiveness of the square aluminum alloy tube–concrete column model in this simulation. Table 5 shows the comparison results of the bearing capacity test values Nue and simulated values Nus of square aluminum alloy tube–concrete columns. It can be seen that the average ratio of the two is 0.991, the standard deviation is 0.016, and both ratios are between 1.02 and 0.96, with an error of about 4%, which meets the requirements of the engineering error range.
Table 5.
Comparison between simulated and experimental values of ultimate bearing capacity of square aluminum alloy tube–concrete columns.
The comparison of load–displacement curves obtained from experiments and simulations is shown in Figure 6. At the initial stage of loading, the slope of the load–displacement curve simulated for square aluminum alloy tube–concrete columns is slightly larger, but the difference in ultimate bearing capacity values between the two is not significant. In the later stage of loading, both curves show a downward trend, but the simulated curve has a smaller downward trend. Overall, it can be seen that the load–displacement curve trends of the two are basically consistent. The main reason for the error is that in practice, the concrete at the corners of square specimens is prone to insufficient filling, which limits the bearing capacity and leads to lower overall test results compared to simulation results.
Figure 6.
Comparison of load–displacement curve of square aluminum alloy tube–concrete column: (a) CFAT-S6.3-L8-20; (b) CFAT-S6.3-L8-40; (c) CFAT-S6.3-L8-60; (d) CFAT-S6.3-L12-20; (e) CFAT-S6.3-L12-40; (f) CFAT-S6.3-L12-60.
4. Design of Axial Compression Test Specimens for Medium-Length Columns of Aluminum Alloy–Concrete Composite
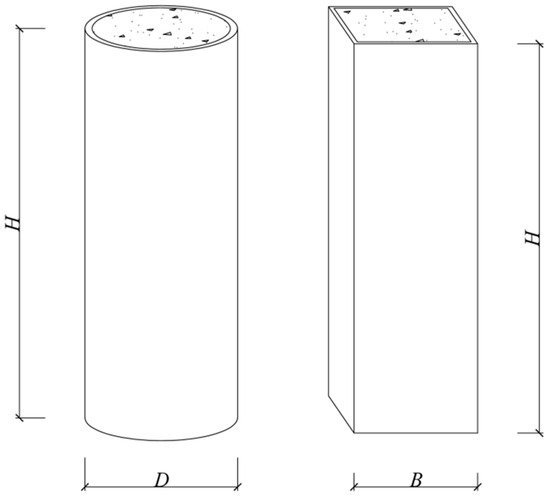
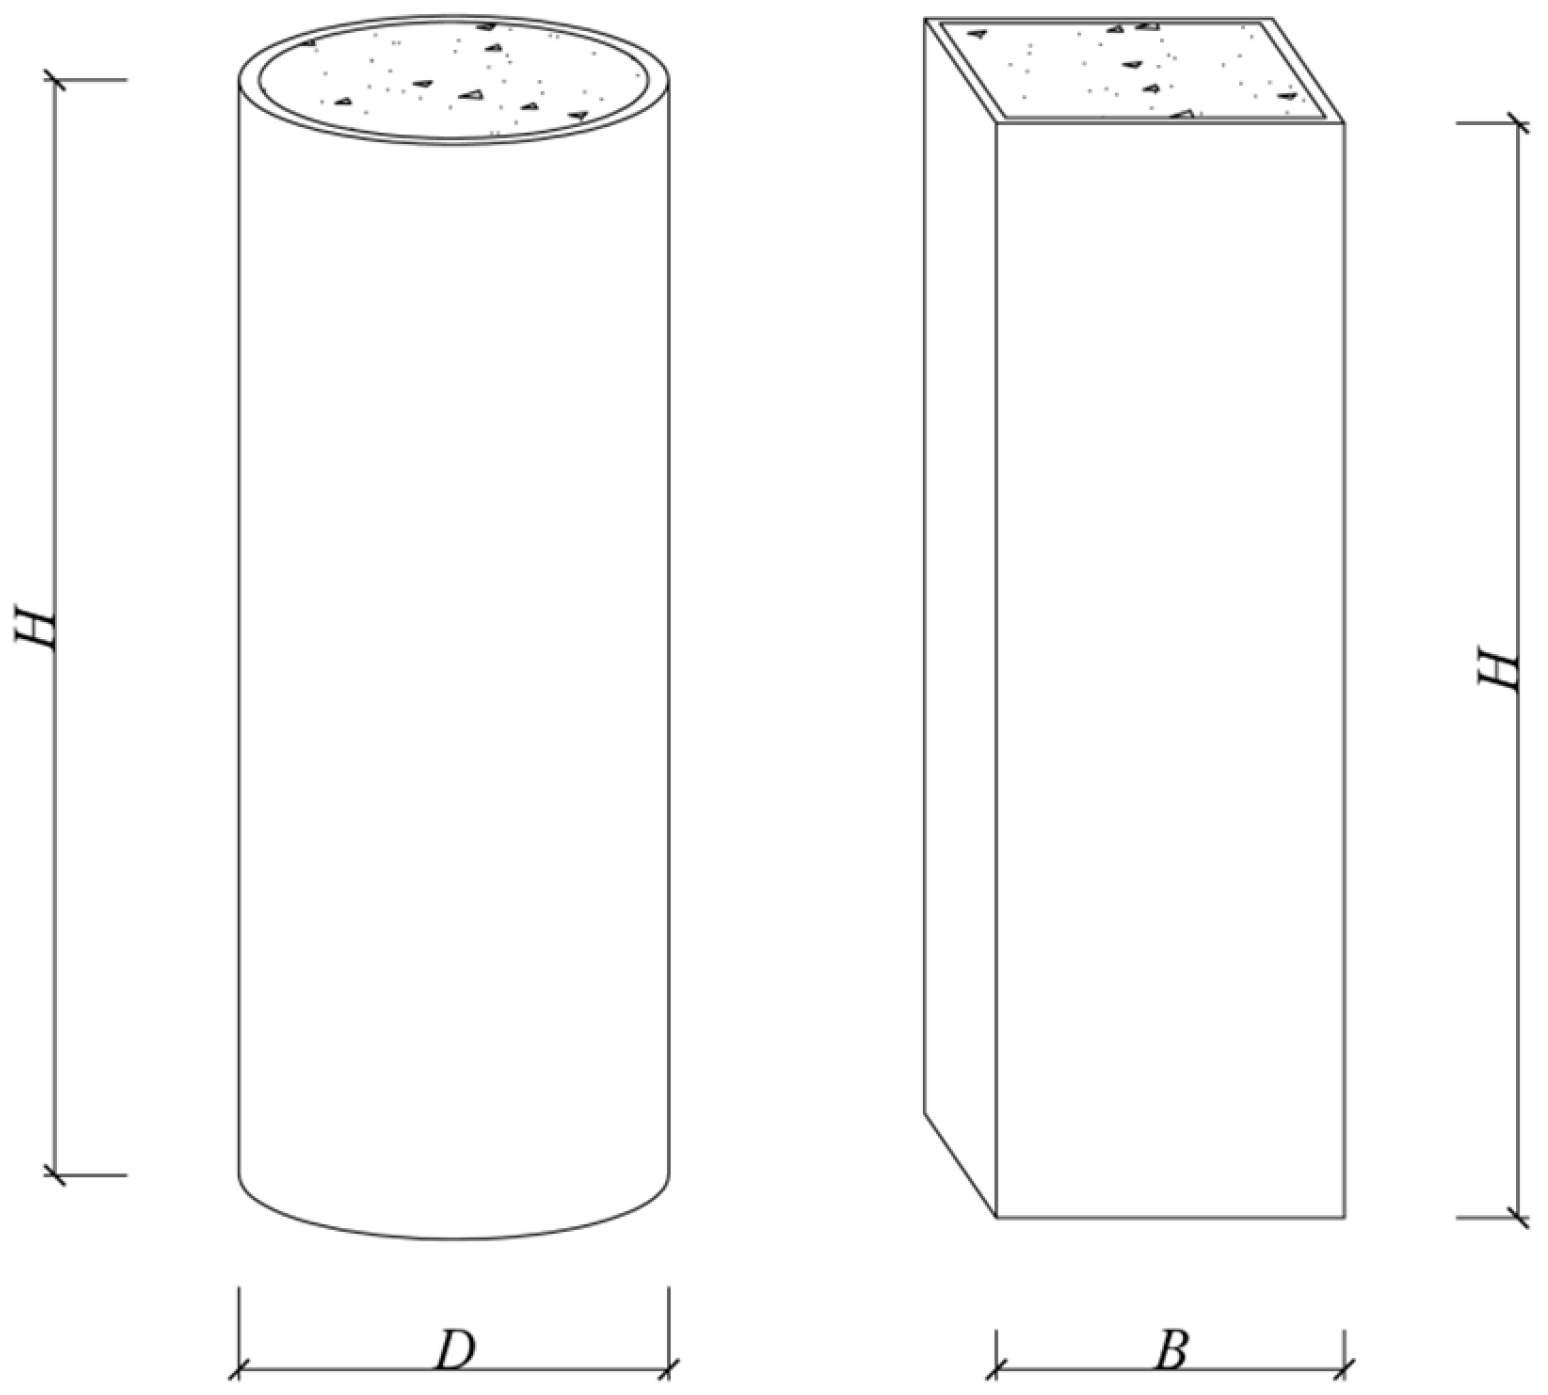
Due to the collaborative work of multiple materials in composite components, the axial compressive ultimate bearing capacity and other mechanical properties of aluminum alloy–reinforced concrete columns are affected by various factors. This article designs 15 circular aluminum alloy tube–concrete specimens and square aluminum alloy tube–concrete column specimens, and studies their axial compressive properties by adopting different core concrete strengths (C30, C35, C40, C45), aluminum alloy yield strengths (160, 250, 300 MPa), aluminum alloy tube wall thicknesses (3, 4, 5, 6 mm), cross-sectional dimensions (100, 130, 150, 170 mm), and aspect ratios (8, 9, 10, 12). The schematic diagram of the specimen dimensions and specific design parameters are shown in Figure 7.
Figure 7.
Schematic diagram of the size of long columns in aluminum alloy tube–concrete.
The specific design parameters of the specimens are shown in Table 6 and Table 7, and circular specimen YZ1 and square specimen FZ1 are selected as the reference specimens.
Table 6.
Circular aluminum alloy tube–concrete column specimen.
Table 7.
Square aluminum alloy tube–concrete column specimen.
4.1. Analysis of Bearing Capacity of Aluminum Alloy Tube–Concrete Column
We introduce the coefficient of increase in bearing capacity SI [26] to characterize the degree of improvement in the bearing capacity performance of composite components under the joint working state of aluminum alloy pipes and concrete, in order to verify whether the bearing capacity of aluminum alloy pipe concrete columns is better than the simple superposition of the two:
In the formula,
Ne—represents the simulated value of the ultimate bearing capacity of the component under axial compression, kN;
N0—nominal bearing capacity value of the component, kN;
fy—yield strength of aluminum alloy tube, MPa;
fc—compressive strength of concrete cylinder (taken as 0.79fcu), MPa;
As, Ac—cross-sectional area of aluminum alloy pipe, cross-sectional area of core concrete, mm2.
Table 8 andTable 9 show the improvement coefficients SI of the bearing capacity of circular and square aluminum alloy tube–concrete columns, respectively. It can be seen that the calculation results of the improvement coefficients SI of the bearing capacity of circular specimens are all above 1.1, while the calculation results of the improvement coefficients SI of the bearing capacity of square specimens are also basically above 1.0, indicating that the bearing capacity of aluminum alloy tube–concrete columns is better than the simple superposition of aluminum alloy tubes and concrete, and the combined effect of the two improves the bearing capacity of the specimens. However, due to the weaker constraint effect of square specimens, their combined effect is slightly inferior compared to circular specimens.
Table 8.
Improvement coefficient SI of bearing capacity of circular aluminum alloy tube–concrete columns.
Table 9.
Improvement coefficient SI of bearing capacity of square aluminum alloy tube–concrete columns.
4.2. Analysis of Parameters Affecting Axial Compression Performance
4.2.1. The Influence of Core Concrete Strength
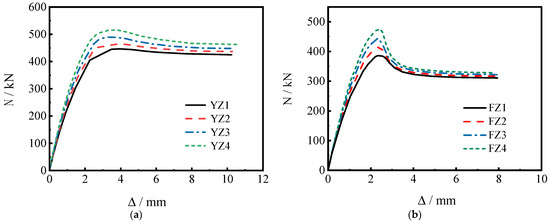
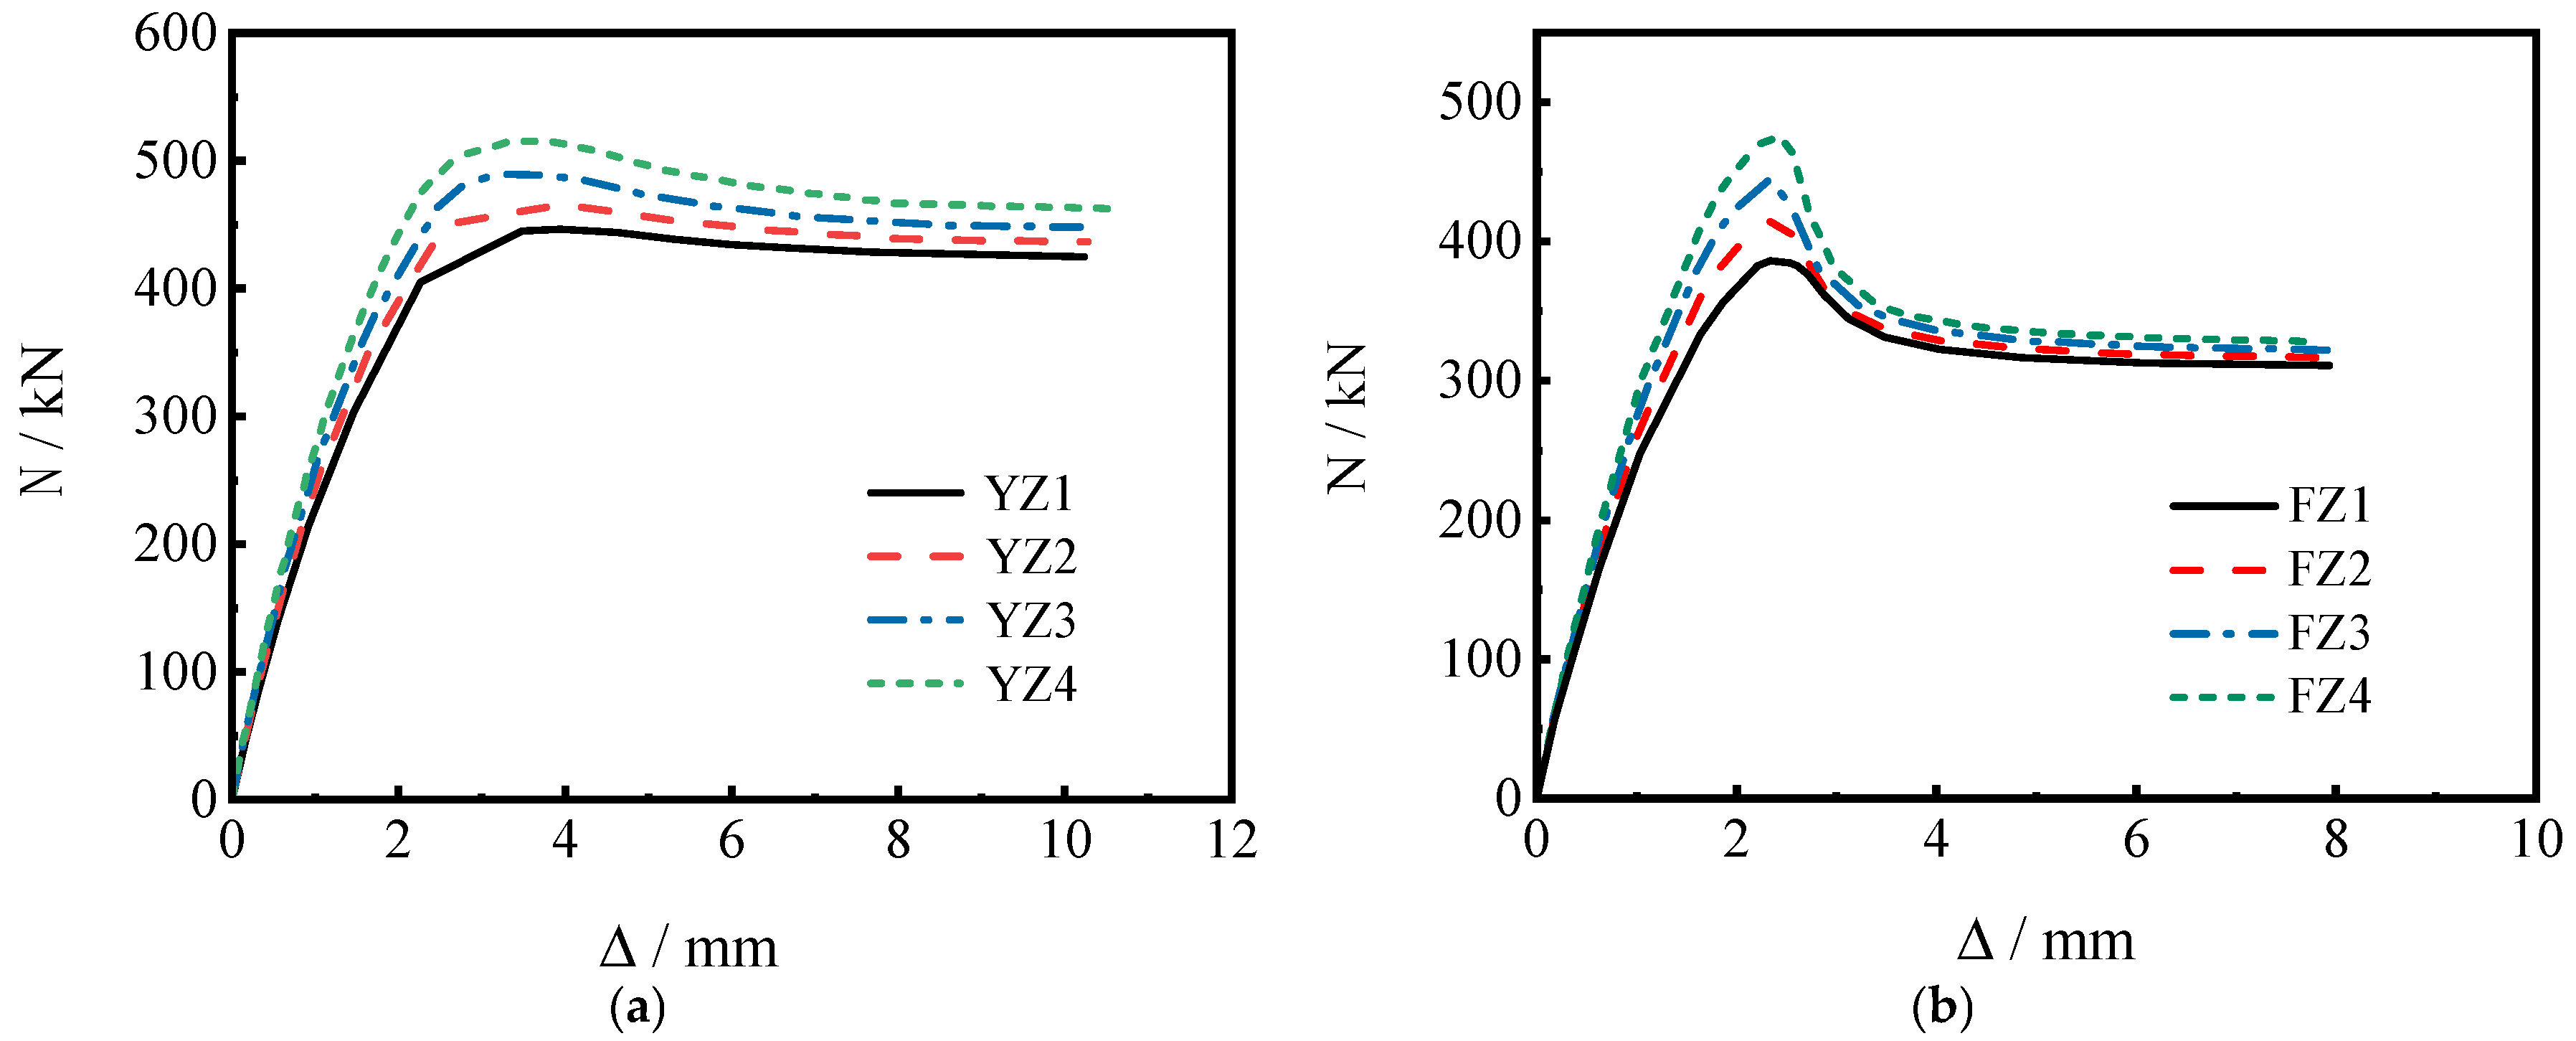
Figure 8 shows the load–displacement curves of specimens under different concrete strengths fcu. From the graph, it can be seen that the higher the concrete strength, the greater the slope of the elastic stage curve, and the initial stiffness of the specimen slightly increases, but the axial displacement corresponding to its peak load remains basically unchanged. After reaching the peak load, the rate of curve descent accelerates with the increase in concrete strength. This is because under other constant conditions, the higher the strength of the core concrete, the smaller the constraint effect coefficient ξ, and the relatively weaker the constraint effect of the aluminum alloy tube on the core concrete, resulting in a decrease in the overall ductility performance of the specimen. The constraint effect of circular specimens is significantly better than that of square specimens, with a smoother descending section.
Figure 8.
Load–displacement curves under different concrete strengths fcu: (a) load–displacement curve of circular aluminum alloy tube–concrete column; (b) load–displacement curve of square aluminum alloy tube–concrete column.
From Table 10, it can be seen that under the same conditions, compared with the circular specimens YZ1, YZ2, YZ3, and YZ4, the ultimate bearing capacity of the square specimens FZ1, FZ2, FZ3, and FZ4 decreased by 13.58%, 10.95%, 9.63%, and 8.09%, respectively, indicating that the bearing capacity of the circular specimens is better than that of the square specimens under the same conditions. But when the core concrete strength fcu increases from 30 MPa to 45 MPa, the increase in ultimate bearing capacity of square specimens is greater than that of circular specimens, and the difference in amplitude between the two gradually decreases. This is mainly because the constraint effect weakens as the core concrete strength fcu increases. For circular specimens, the improvement of their bearing capacity mainly depends on the restraining effect of the aluminum alloy tube and the strength of the material. The constraint effect of square specimens is weaker, and the contribution of the increase in core concrete strength to their bearing capacity is higher. Therefore, the bearing capacity improvement coefficient SI of circular specimens decreases with the increase in concrete strength fcu, while the bearing capacity improvement coefficient SI of square specimens increases with the increase in concrete strength fcu.
Table 10.
Comparison of ultimate bearing capacity of circular and square aluminum alloy tube–concrete column specimens.
4.2.2. The Influence of Yield Strength of Aluminum Alloy
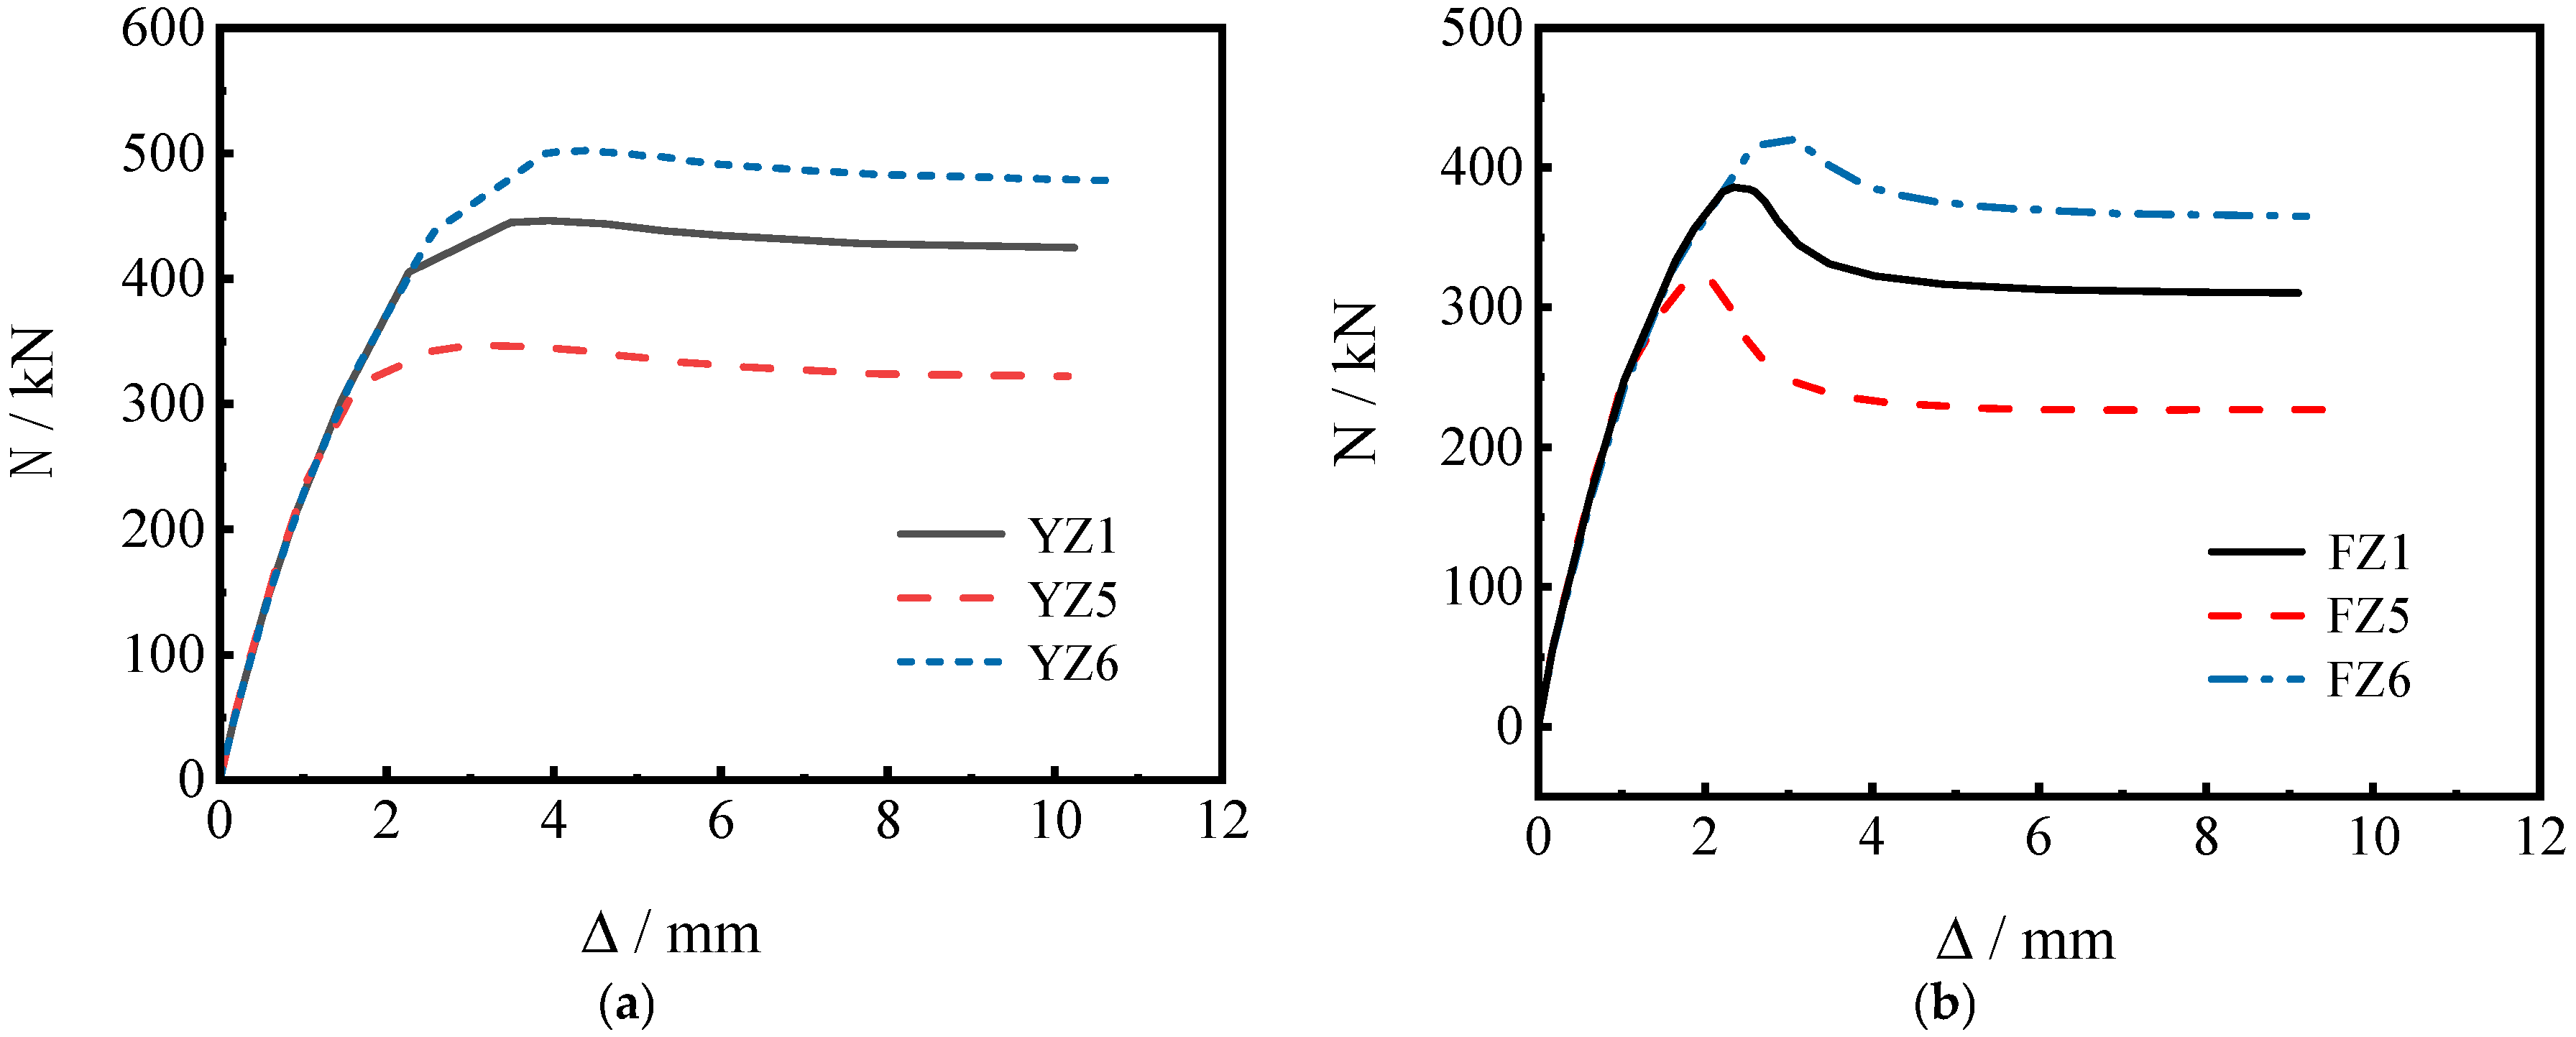
Figure 9 shows the load–displacement curves of specimens under different yield strengths, fy, of aluminum alloys. It can be seen that in the elastic stage, the curves of different specimens basically coincide, and the yield strength fy of aluminum alloy has no significant effect on the initial stiffness of the specimens. In the elastic–plastic stage, as the yield strength fy of the aluminum alloy increases, the bearing capacity of the specimen significantly improves, and the axial displacement corresponding to the peak load also increases, and the curve of the specimen slightly slows down in the descending section. With the increase in the yield strength fy of aluminum alloy, the ultimate bearing capacity of the specimen shows a significant linear growth trend. On the one hand, this is because the higher the yield strength fy of aluminum alloy, the higher its bearing capacity. On the other hand, it is because the constraint effect coefficient increases with the increase in the yield strength fy of the aluminum alloy, which enhances the constraint effect of the specimen, increases the ultimate bearing capacity of the specimen, and improves the ductility performance.
Figure 9.
Load–displacement curves under different yield strengths fy of aluminum alloys: (a) load–displacement curve of circular aluminum alloy tube–concrete column; (b) load–displacement curve of square aluminum alloy tube–concrete column.
Table 11 shows the comparison of ultimate bearing capacity between circular and square specimens. It can be seen that under the same conditions, the ultimate bearing capacity of the square specimens FZ1, FZ5, and FZ6 decreased by 13.58%, 8.29%, and 16.08%, respectively, compared to the circular specimens YZ1, YZ5, and YZ6. The difference in ultimate bearing capacity between the two types of cross-sectional specimens increases with the increase in aluminum alloy yield strength, mainly because the higher the yield strength fy of aluminum alloy, the stronger the constraint effect on the specimen, while the constraint effect of circular specimens is stronger than that of square specimens.
Table 11.
Comparison of ultimate bearing capacity of circular and square aluminum alloy tube–concrete column specimens.
4.2.3. The Influence of Diameter-to-Thickness Ratio
When analyzing the influence of the diameter-to-thickness ratio D/t, two aspects should be considered: changes in cross-sectional dimensions and changes in wall thickness.
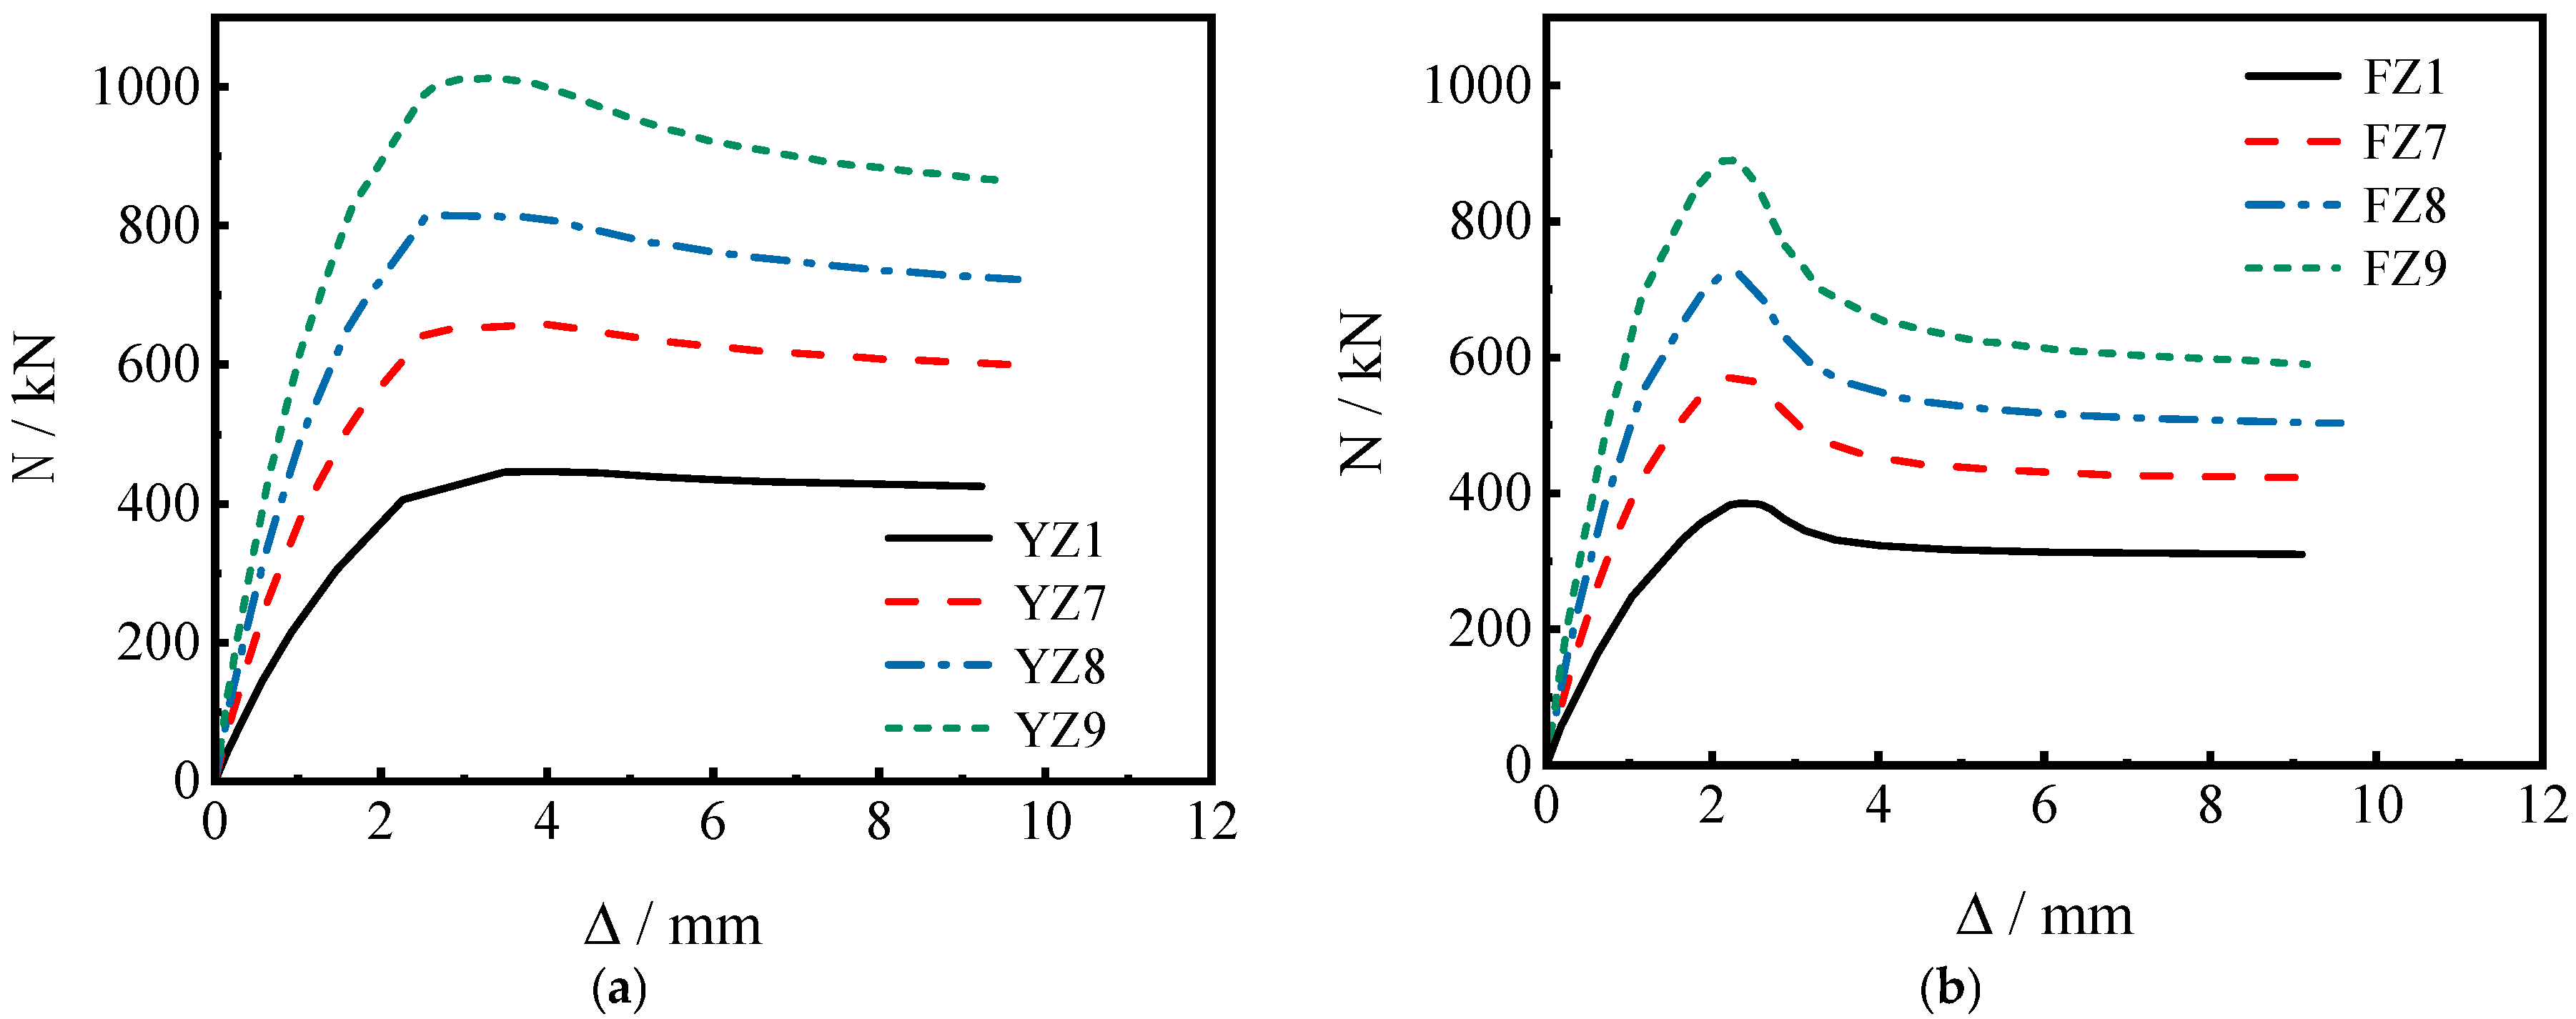
- Firstly, a model is established to analyze the circular specimens YZ1, YZ7, YZ8, YZ9 with cross-sectional diameters D of 100, 130, 150, and 170 mm, as well as the square specimens FZ1, FZ7, FZ8, and FZ9 with cross-sectional diameters D of 89, 115, 133, and 151 mm, respectively, under the condition of the same wall thickness.
From Figure 10, it can be seen that the bearing capacity values of circular and square aluminum alloy tube–concrete columns both increase significantly with the increase in section diameter D. At this time, the diameter thickness ratio D/t is positively correlated with the ultimate bearing capacity of the specimen. Although the constraint effect coefficient ξ of the specimen decreases with the increase in the cross-sectional diameter D, which weakens the constraint effect on the core concrete, the ultimate bearing capacity and initial stiffness of the specimen still increase significantly due to the increase in cross-sectional area. Due to the weakening of the constraint effect, the descending section of the curve gradually becomes steeper, and the ductility performance of the specimen is significantly reduced. From Figure 10, it can be seen that the variation in cross-sectional diameter D has a significant impact on the ultimate bearing capacity of medium-length column specimens.
Figure 10.
Load–displacement curves under different cross-sectional diameters D: (a) load–displacement curve of circular aluminum alloy tube–concrete column; (b) load–displacement curve of square aluminum alloy tube–concrete column.
- 2.
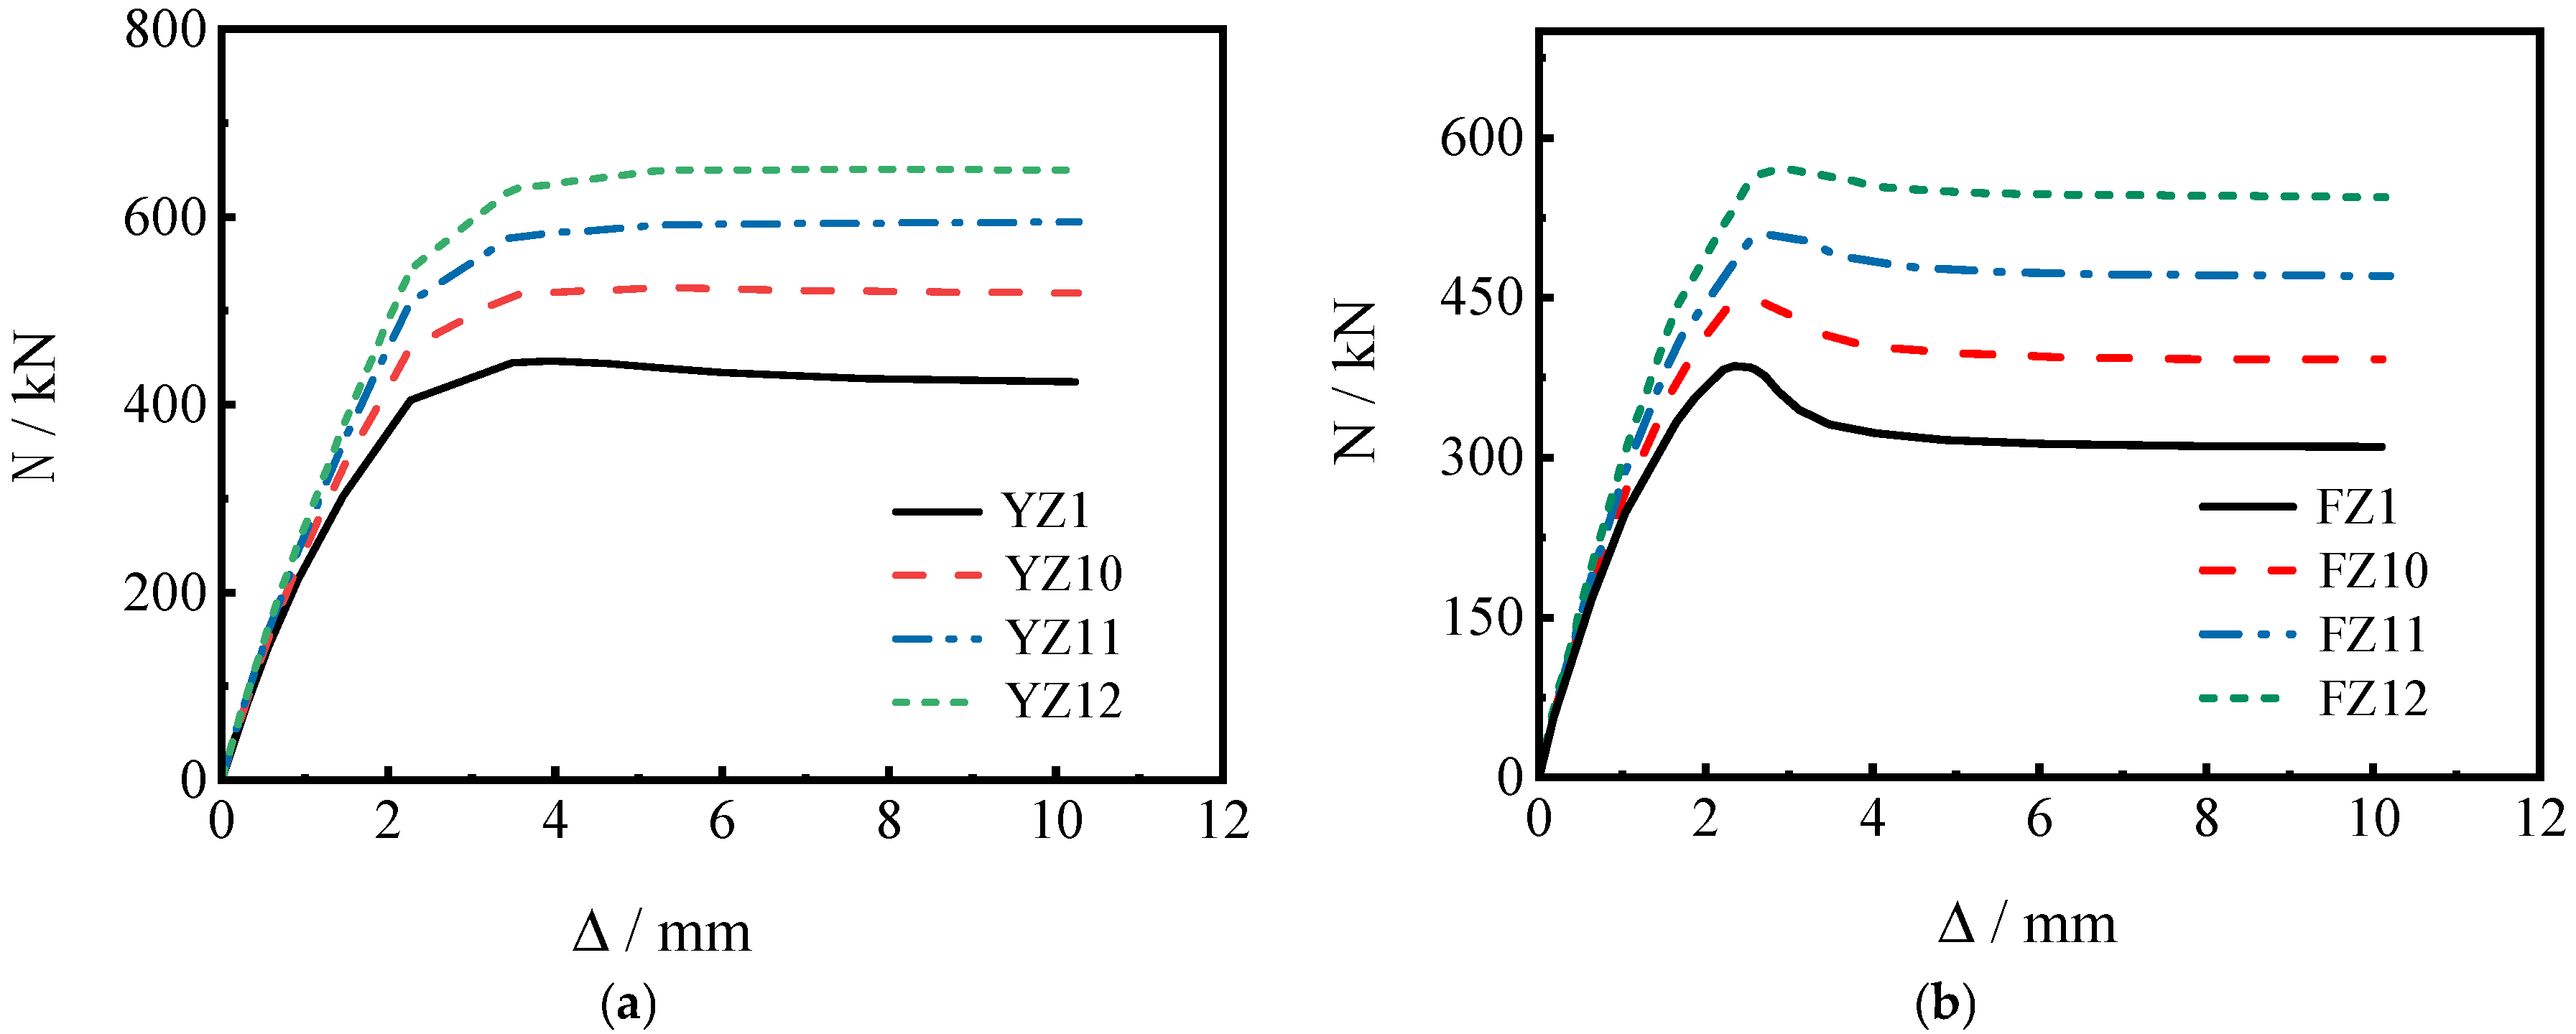
- Under the same cross-sectional dimensions, models were established for the circular specimens YZ1, YZ10, YZ11, YZ12 with wall thicknesses t of 3, 4, 5, and 6 mm, as well as the square specimens FZ1, FZ10, FZ11, and FZ12 with wall thicknesses t of 2.67, 3.34, 4.45, and 5.34 mm, respectively, to analyze the effects of different diameter-to-thickness ratios D/t on the axial compressive ultimate bearing capacity and other mechanical properties of aluminum alloy–reinforced concrete columns.
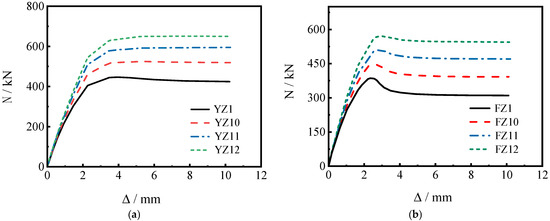
From Figure 11, it can be seen that the bearing capacity values of both circular and square aluminum alloy tube–concrete columns increase with the increase in wall thickness t, indicating a negative correlation between the diameter thickness ratio D/t and the ultimate bearing capacity of the specimens. As the wall thickness t increases, the constraint effect coefficient of the specimen increases, and the constraint effect of the aluminum alloy tube on the core concrete is enhanced, improving its bearing performance. The descending section of the curve gradually slows down with the increase in aluminum alloy pipe wall thickness, and the ductility performance is also greatly improved.
Figure 11.
Load–displacement curves at different wall thicknesses t: (a) load–displacement curve of circular aluminum alloy tube–concrete column; (b) load–displacement curve of square aluminum alloy tube–concrete column.
Table 12 compares the ultimate bearing capacity of circular and square specimens. It can be seen that in the case where only the cross-sectional diameter D changes, the ultimate bearing capacity of the square specimens FZ1, FZ7, FZ8, and FZ9 decreased by 13.58%, 13.11%, 11.15%, and 11.86%, respectively, compared to the circular specimens YZ1, YZ7, YZ8, and YZ9. In the case where only the thickness t of the pipe wall changes, the ultimate bearing capacity of the square specimens FZ1, FZ10, FZ11, and FZ12 decreased by 13.58%, 14.65%, 14.34%, and 13.10%, respectively, compared to the circular specimens YZ1, YZ10, YZ11, and YZ12. Overall, the difference in ultimate bearing capacity between the two cross-sectional forms of specimens decreases as the cross-sectional diameter D or wall thickness t increases.
Table 12.
Comparison of ultimate bearing capacity of circular and square aluminum alloy tube–concrete column specimens.
4.2.4. The Influence of Aspect Ratio
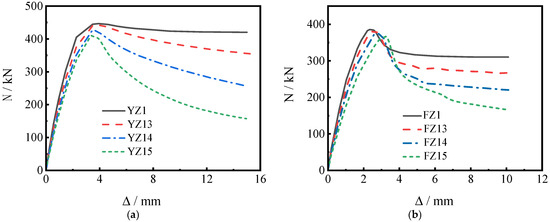
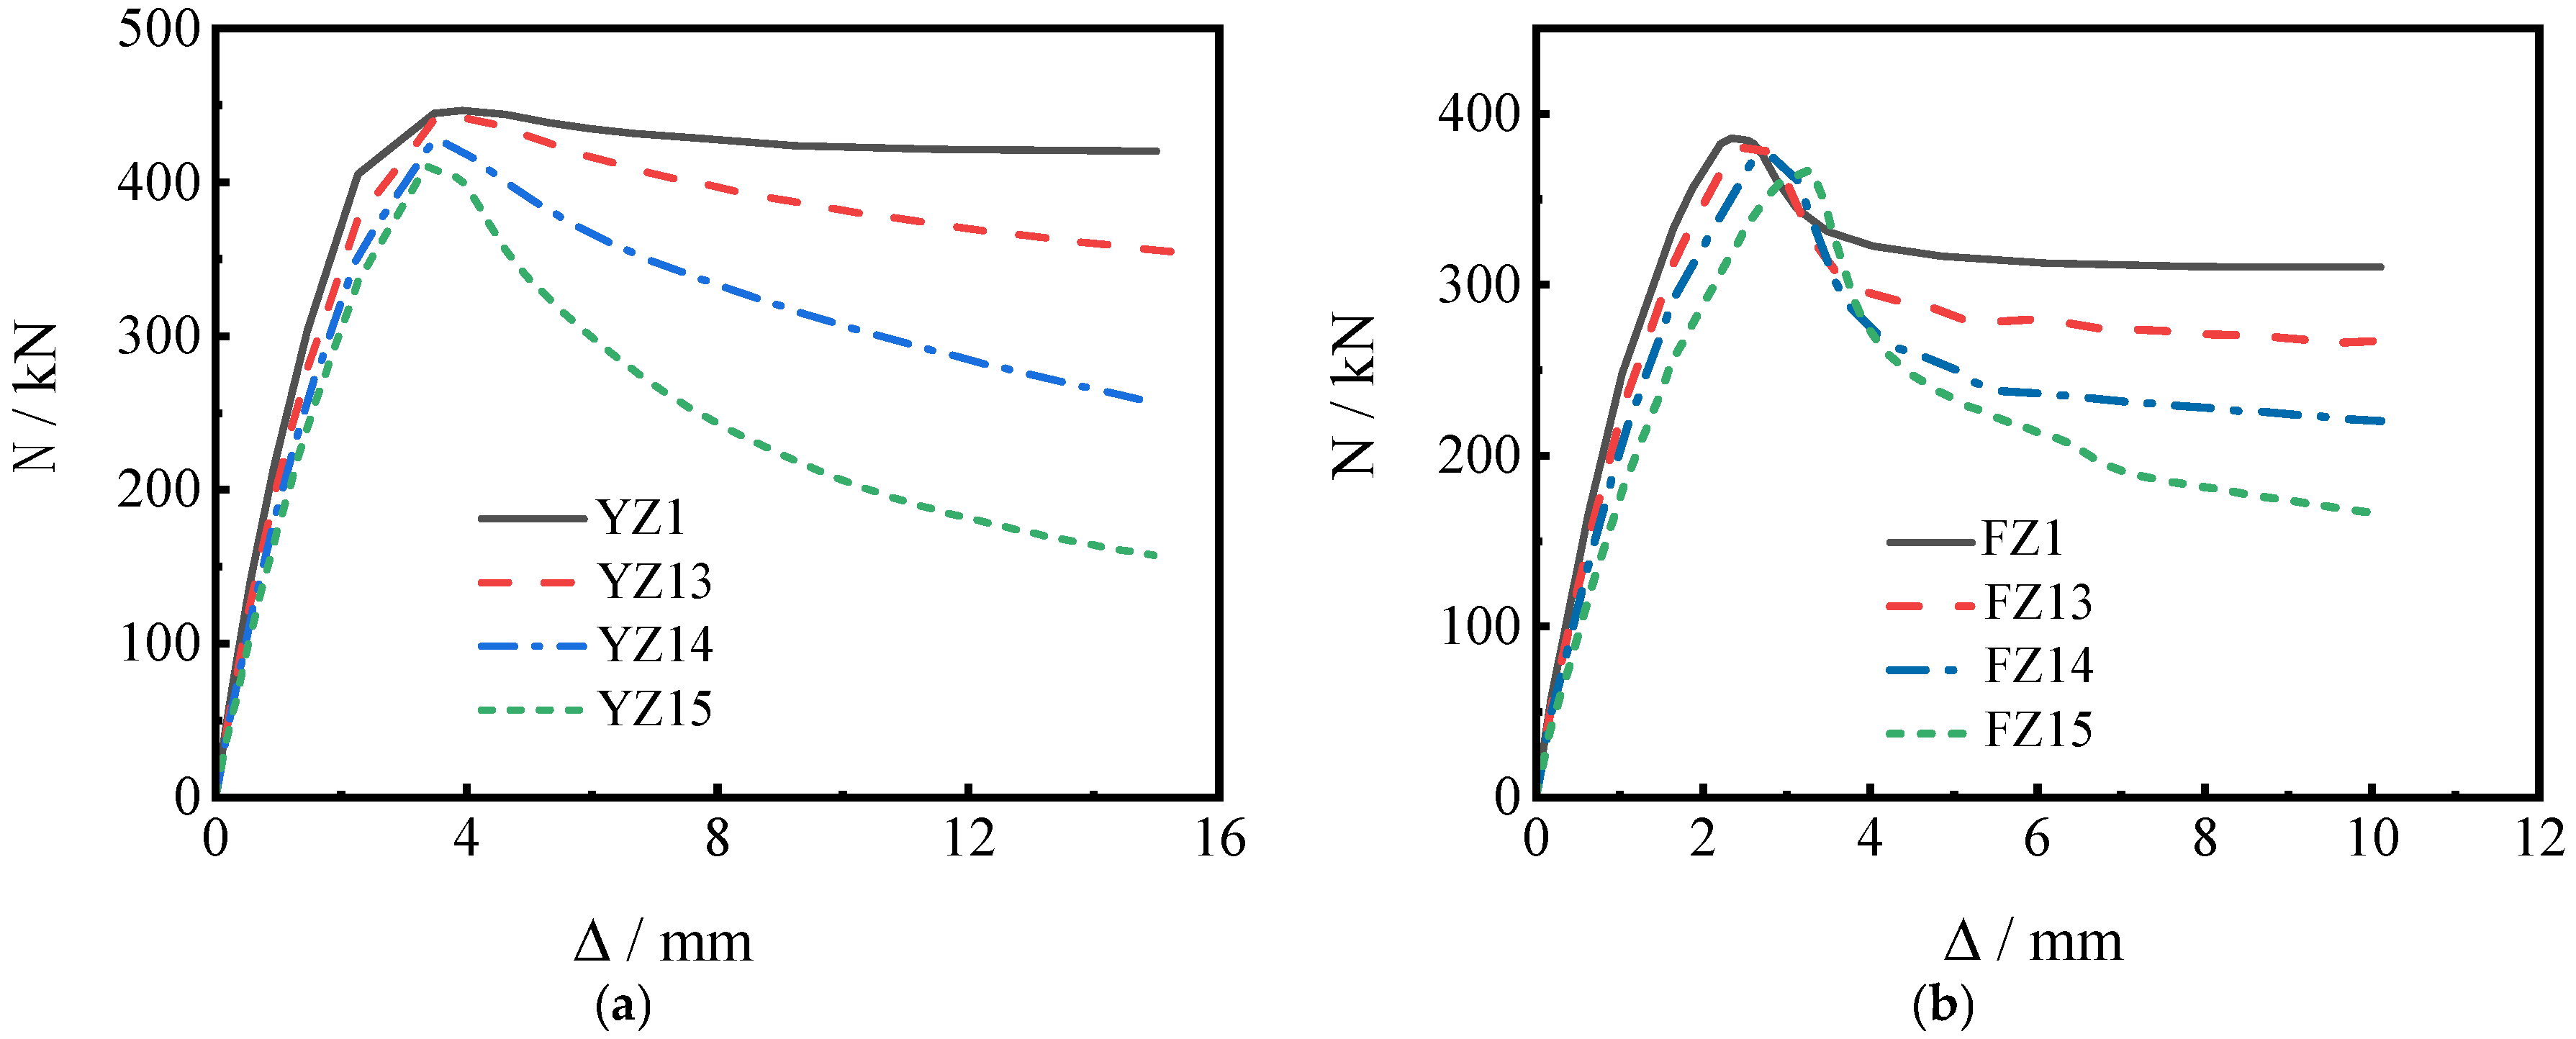
As shown in Figure 12, with the increase in aspect ratio, the initial stiffness of both circular and square specimens decreases. The peak load slightly decreases with the increase in aspect ratio L/D, and the axial displacement corresponding to the peak load increases. The descending section of the curve becomes steeper. The changes in the descending section of circular specimens are more pronounced, mainly because specimens with a larger aspect ratio L/D are more affected by initial defects, making them more prone to instability and failure. From Figure 12, it can be seen that for medium-length columns, the change in aspect ratio has little effect on the ultimate bearing capacity of the specimen, but has a significant impact on the initial stiffness and the descending section.
Figure 12.
Load–displacement curves under different aspect ratios L/D: (a) load–displacement curve of circular aluminum alloy tube–concrete column; (b) load–displacement curve of square aluminum alloy tube–concrete column.
Table 13 shows the comparison of the ultimate bearing capacity between circular and square specimens. It can be seen that under the same conditions, the ultimate bearing capacity of the square specimens FZ1, FZ13, FZ14, and FZ15 decreased by 13.58%, 13.54%, 11.41%, and 9.44%, respectively, compared to the circular specimens YZ1, YZ13, YZ14, and YZ15. Overall, the difference in ultimate bearing capacity between the two cross-sectional forms decreases as the aspect ratio increases.
Table 13.
Comparison of ultimate bearing capacity of circular and square aluminum alloy tube–concrete column specimens.
5. Conclusions
This study establishes a refined finite element analysis model for aluminum alloy tube–concrete composite long columns subjected to axial compression. The modeling framework incorporates appropriate constitutive relationships for aluminum alloy and concrete, the concrete plastic damage model, suitable element types and mesh discretization schemes, interface contact definitions, as well as rational boundary conditions and loading protocols. Numerical simulations were performed on aluminum alloy tube–concrete composite columns reported in the literature, and the predicted responses were systematically compared with the corresponding experimental results. The comparisons indicate good agreement in terms of load–displacement behavior and failure modes, thereby confirming the accuracy, rationality, and effectiveness of the proposed finite element modeling approach. The validated model provides a reliable basis for subsequent parametric investigations and extended numerical studies. The main conclusions can be summarized as follows:
- A comprehensive finite element modeling strategy for aluminum alloy tube–concrete composite slender columns under axial compression was established, including the selection of constitutive models for aluminum alloy and concrete, the adoption of the concrete plastic damage model, and the determination of element types, mesh discretization schemes, interface contact relationships, boundary conditions, and loading schemes. Based on this framework, numerical simulations of composite slender columns reported in the literature were carried out, and the results showed good agreement with experimental observations, thereby verifying the reliability and applicability of the proposed modeling approach for further parametric and extended analyses.
- The failure mechanism of aluminum alloy tube–concrete composite columns under axial compression was systematically studied through finite element analysis. The results indicate that the square cross-section specimen mainly exhibits overall bending instability caused by end buckling, characterized by significant lateral deformation near the column end. In contrast, the specimen with a circular cross-section is controlled by elastic–plastic instability, which is mainly caused by excessive bending deformation in the middle of the column. This failure mode can be demonstrated by the deformation shape profile, stress and plastic strain distribution of the aluminum alloy tube, as well as the gradual development of bending deformation in the middle of the column observed in numerical results.
- A comprehensive parametric study on the axial compression performance was conducted. The results demonstrate that the ultimate bearing capacity increases with increasing core concrete strength, aluminum alloy tube yield strength, and the diameter-to-thickness ratio associated with variations in cross-sectional dimensions. Conversely, the ultimate bearing capacity decreases with increasing diameter-to-thickness ratio related to wall thickness and with increasing slenderness ratio.
Author Contributions
Methodology, W.D.; validation, W.D., M.L., and X.Z.; investigation, X.X.; resources, S.J.; data curation, M.L.; writing—original draft preparation, W.D.; writing—review and editing, S.J.; supervision, S.J. and X.X.; funding acquisition, X.Z. All authors have read and agreed to the published version of the manuscript.
Funding
This research was conducted with financial support from Guizhou Science and Technology Plan Project (Qiankehe Foundation MS (2025) 244).
Institutional Review Board Statement
Not applicable.
Data Availability Statement
The data presented in this study are available on request from the corresponding author.
Conflicts of Interest
The authors declare no conflicts of interest.
References
- Georgantzia, E.; Gkantou, M.; Kamaris, G.S. Aluminium alloys as structural material: A review of research. Eng. Struct. 2021, 227, 111372. [Google Scholar] [CrossRef] [Scilit]
- Holt, M. Tests on built-up columns of structural aluminum alloys. Trans. Am. Soc. Civ. Eng. 1940, 105, 196–217. [Google Scholar] [CrossRef] [Scilit]
- Yan, X.F.; Ahmed, M.; He, M.N. Behavior and design of axially loaded high-strength concrete-filled circular aluminum tubular short columns. Structures 2022, 44, 357–371. [Google Scholar] [CrossRef] [Scilit]
- Kissell, J.R.; Ferry, R.L. Aluminum Structures: A Guide to Their Specifications and Design; John Wiley & Sons: New York, NY, USA, 2002. [Google Scholar]
- Liu, F.-L.; Wang, J.-X.; Shan, G. Study on the bonding behavior of concrete-filled aluminum alloy tube. Sci. Rep. 2025, 15, 8303. [Google Scholar] [CrossRef] [Scilit]
- Hu, T. Experimental study on axial compressive behavior of concrete-filled aluminum alloy tubular columns. J. Build. Struct. 2020, 41, 72–81. [Google Scholar]
- Zhao, L.; Li, H.; Wei, Y.; Xi, F.; Zhao, K. Flexural properties on aluminum alloy–wood plastic composite beam strengthened by concrete. Constr. Build. Mater. 2025, 460, 139792. [Google Scholar] [CrossRef] [Scilit]
- Zhi, X.H.; Wang, Y.Q.; Zhang, Y.; Li, B.; Wang, Z.; Ouyang, Y. Engineering application and research progress of low-rise aluminum alloy frame structures. Eng. Mech. 2023, 40, 46–55. [Google Scholar]
- Wang, J.-X.; Liu, F.-L.; Gao, S. Axial compressive behavior of aluminum alloy thin-walled tube confined concrete. Constr. Build. Mater. 2025, 467, 140350. [Google Scholar] [CrossRef] [Scilit]
- Yan, X.F.; He, M.N.; Hao, J.P.; Lin, S. Theoretical model of circular concrete-filled aluminum alloy tubular short columns under axial compression. Eng. Struct. 2024, 303, 117549. [Google Scholar] [CrossRef] [Scilit]
- Zhou, F.; Young, B. Numerical analysis and design of concrete-filled aluminum circular hollow section columns. Thin-Walled Struct. 2012, 50, 45–55. [Google Scholar] [CrossRef] [Scilit]
- Jiang, M.Y.; Liu, B.; Deng, Z.H. Testing and numerical simulation of concrete-filled 6061-T6 aluminum tubular stub columns. Structures 2024, 60, 105855. [Google Scholar] [CrossRef] [Scilit]
- Li, C.; Lu, Z. Calculation of shear-bearing capacity of aluminum alloy–concrete composite beam. Buildings 2025, 15, 2393. [Google Scholar] [CrossRef] [Scilit]
- Chen, X.; Huang, H.; Hassam, M.; Guo, L. Eccentric compressive behavior of circular concrete-filled aluminum alloy tubular columns. Structures 2025, 82, 110412. [Google Scholar] [CrossRef] [Scilit]
- Bulson, P.S. Aluminium structures—A guide to their specifications and design: J.R. Kissell and R.L. Ferry. Eng. Struct. 1996, 18, 90. [Google Scholar] [CrossRef] [Scilit]
- Park, Y.J.; Ang, A.H.S. Mechanistic seismic damage model for reinforced concrete. J. Struct. Eng. 1985, 111, 722–739. [Google Scholar] [CrossRef] [Scilit]
- He, Z.Y.; Deng, Z.H.; Hu, S.W.; Liu, B. Axial compression performance of coral concrete-filled aluminum alloy tube circular short columns. Eng. Struct. 2024, 303, 117552. [Google Scholar] [CrossRef] [Scilit]
- Yan, X.F.; Lin, S.Q.; Zhao, Y.G. Behavior and confinement mechanism of circular concrete-filled aluminum alloy tubular stub columns under axial compression. Mar. Struct. 2024, 95, 103600. [Google Scholar] [CrossRef] [Scilit]
- Wang, J.; Liu, F.; Wang, W. Study on axial compressive behavior of aluminum alloy tube confined reinforced concrete. J. Build. Struct. 2025, 46, 210–222. [Google Scholar]
- Chen, Z.; Zhou, Z.; Li, J.; Ning, F. Experimental study on flexural behavior of corrosion-resistant aluminum alloy coral sea-sand seawater concrete composite beams. Eng. Struct. 2025, 326, 119555. [Google Scholar] [CrossRef] [Scilit]
- Deng, Z.; Guo, J.; Yu, J.; Liu, B. Axial compression performance of coral concrete-filled aluminium tube square stub columns. Case Stud. Constr. Mater. 2021, 15, E00697. [Google Scholar] [CrossRef] [Scilit]
- Gkantou, M.; Georgantzia, E.; Kadhim, A.; Kamaris, G.S.; Sadique, M. Geopolymer concrete-filled aluminium alloy tubular cross-sections. Structures 2023, 51, 528–543. [Google Scholar] [CrossRef] [Scilit]
- Ramberg, W.; Osgood, W.R. Description of Stress-Strain Curves by Three Parameters; NACA: Washington, DC, USA, 1943. [Google Scholar]
- Chen, D.; Qu, H.; Li, W.; Li, Z.; Wang, Q.F. Axial compressive mechanical properties of circular aluminum alloy tube seawater sand concrete column. J. Yantai Univ. (Nat. Sci. Eng. Ed.) 2022, 35, 467–475. (In Chinese) [Google Scholar]
- Wang, W. Study on the Compressive Properties of Long Columns in Aluminum Tube Concrete. Master’s thesis, China University of Mining and Technology, Xuzhou, China, 2021. (In Chinese) [Google Scholar]
- Chen, J.; Shi, H.; Li, J.; Guo, M.; Ding, F.; Shao, Z.; Xiang, P. Mechanical properties of CFSST with steel reinforcement cage under biaxial eccentric compression. J. Constr. Steel Res. 2023, 204, 107853. [Google Scholar] [CrossRef] [Scilit]

Disclaimer/Publisher’s Note: The statements, opinions and data contained in all publications are solely those of the individual author(s) and contributor(s) and not of MDPI and/or the editor(s). MDPI and/or the editor(s) disclaim responsibility for any injury to people or property resulting from any ideas, methods, instructions or products referred to in the content. |
© 2026 by the authors. Licensee MDPI, Basel, Switzerland. This article is an open access article distributed under the terms and conditions of the Creative Commons Attribution (CC BY) license.