


Abstract
Urban blue spaces, including rivers, lakes, and ponds, are increasingly recognized as nature-based solutions for mitigating the Urban Heat Island (UHI) effect. However, fragmented evidence and inconsistent evaluation frameworks have limited their effective integration into climate-adaptive urban planning. This study conducts a comprehensive bibliometric analysis and systematic review to synthesize current knowledge on the cooling effects of urban blue spaces. A total of 110 peer-reviewed publications published between 2015 and 2025 were retrieved from the Web of Science Core Collection and analyzed using the Bibliometric-Systematic Literature Review (B-SLR) framework. The results reveal a rapidly growing research field characterized by increasing interdisciplinary integration. Evidence consistently indicates that the cooling effects of blue spaces exhibit pronounced diurnal and seasonal variability, highlighting a “diurnal paradox” of daytime cooling versus nighttime warming risks, with stronger impacts in summer than in winter. Cooling performance is governed by non-linear morphological thresholds regarding size, shape, spatial configuration, and upwind location, where aerodynamic ventilation is critical for extending the cooling range. Moreover, the interaction between blue spaces, building morphology (gray infrastructure), and green infrastructure plays a decisive role: specific density thresholds in built environments can constrain cooling diffusion, whereas synergistic blue–green integration significantly enhances thermal regulation through coupled evaporative, shading, and ventilation processes. Overall, this review demonstrates a clear shift from isolated temperature-based assessments toward systemic, planning-oriented approaches emphasizing multi-scale integration and context-sensitive design. The findings provide operational parameters and demand-based strategies for optimizing blue infrastructure in climate-resilient urban planning.
1. Introduction
The accelerated pace of global urbanization is reshaping the Earth’s surface on an unprecedented scale [1]. The widespread replacement of naturally vegetated land with impervious materials, such as reinforced concrete and asphalt, has profoundly altered surface thermal and radiative properties. This transformation, coupled with intensive anthropogenic heat emissions, has led to the emergence of a distinct urban climate phenomenon known as the Urban Heat Island (UHI) effect [2]. The UHI effect is characterized by significantly higher air temperatures in urban areas compared with their surrounding suburban or rural environments [3,4]. It not only intensifies energy consumption and increases urban operational costs [5,6], but also exacerbates heat-related health risks, thereby posing serious challenges to public health and sustainable urban development [7,8].
To mitigate the UHI effect, conventional “gray infrastructure” strategies, such as the application of high-albedo materials and the promotion of energy-efficient buildings, have been widely implemented. However, these approaches often exhibit limited effectiveness, entail high economic costs, and provide relatively narrow ecological co-benefits [9]. Consequently, increasing attention has been directed toward nature-based solutions [10,11], particularly the climate-regulating functions of urban green and blue spaces [12,13]. While urban green spaces, including parks and urban forests, have been extensively studied, urban blue spaces, encompassing both natural and artificial water bodies such as rivers, lakes, canals, reservoirs, and wetlands, represent dynamic and complex urban ecosystems. Despite their recognized potential, the mechanisms and effectiveness of blue spaces in mitigating the UHI effect remain insufficiently synthesized and systematically reviewed [14].
Urban blue spaces primarily regulate the local thermal environment through two key physical processes: evaporative cooling and high thermal inertia [10]. Evaporation from water surfaces absorbs substantial amounts of latent heat, thereby reducing ambient air temperatures. Meanwhile, the high specific heat capacity of water, significantly greater than that of typical urban materials such as asphalt and concrete, results in slower heating and cooling rates. This property enables blue spaces to function as natural thermal buffers, moderating diurnal and seasonal temperature fluctuations in urban environments [15]. In addition, blue spaces can induce local airflow and circulation patterns, such as lake–land or river–land breezes, which transport cooler and more humid air into adjacent built-up areas, extending cooling effects beyond the immediate vicinity of the water body [16].
However, the magnitude of physical cooling, often measured by reductions in air temperature or land surface temperature (LST), does not always directly reflect the actual thermal relief experienced by pedestrians [17]. To bridge the gap between physical microclimate regulation and human physiological response, recent research has increasingly adopted human-centered thermal indices, such as the Physiological Equivalent Temperature (PET) and the Universal Thermal Climate Index (UTCI) [18,19]. These indices provide a more comprehensive evaluation by integrating the synergistic effects of air temperature, humidity, wind speed, and mean radiant temperature, which are all modulated by blue spaces [20]. Incorporating these human-centric metrics is crucial for translating the physical cooling potential of blue infrastructure into actionable urban design strategies that prioritize public health and thermal comfort.
Despite these advantages, the cooling performance of urban blue spaces is neither uniform nor universally beneficial. Their effectiveness is shaped by a complex interplay of multiple factors, including the intrinsic characteristics of the water bodies (e.g., size, shape, and water quality) [21], surrounding urban morphology (e.g., building density, height, and orientation) [22,23], and regional climatic conditions (e.g., wind speed and humidity) [14]. Under certain conditions, such as during cold seasons [24] or at night [25], water bodies may release stored heat, potentially intensifying local warming. Likewise, narrow waterways or blue spaces embedded within high-density urban fabrics may experience constrained ventilation, substantially reducing their cooling efficiency [26]. These spatial, temporal, and contextual complexities underscore the necessity for a comprehensive and systematic synthesis of existing research.
Although a growing body of literature has examined the relationship between urban blue spaces and the UHI effect, current findings remain fragmented and have yet to converge into an integrated analytical framework. To address this gap, the present study adopts a combined methodological approach that integrates bibliometric analysis using VOSviewer version 1.6.20 with a PRISMA-guided systematic review. This framework enables the structured organization, quantitative mapping, and qualitative evaluation of existing studies on the thermal environmental effects of urban blue spaces, thereby providing a more comprehensive understanding of their role in UHI mitigation.
Specifically, this study aims to systematically decode the role of urban blue space in thermal regulation by integrating quantitative bibliometrics with qualitative evidence synthesis. To achieve this, the study addresses the following four core research questions:
- What are the global evolutionary trends, intellectual structures, and emerging research frontiers in the field of urban blue spaces for heat mitigation?
- What are the critical spatiotemporal evidence gaps regarding the diurnal and seasonal cooling impacts of urban blue spaces?
- How do morphological features like size, shape, and location determine the cooling efficiency and effective range of urban blue spaces?
- How do blue-green-gray interactions shape systemic planning implications for optimizing urban cooling efficiency and equity?
Distinct from previous descriptive reviews, the novelty of this study lies in its rigorous adherence to the Bibliometric-Systematic Literature Review (B-SLR) framework [27]. In terms of methodology, this paper rejects the siloed execution of metrics; rather, it treats bibliometric mapping as a strategic filter to delineate thematic clusters, which in turn define the rigorous scope for the qualitative synthesis. Conceptually, we pivot from passive descriptive summaries toward a planning-centric integration that translates climate theory into tangible operational parameters. By anchoring theoretical rigor in practical design constraints, this dual-layered framework moves beyond generic review, offering a data-driven roadmap for optimizing blue space interventions in climate-adaptive urbanism.
2. Research Methodology
This section outlines the research design, detailing the data source, the integrated literature review methodology, and the literature search strategy and selection process.
2.1. Data Source
This study used the Web of Science (WoS) Core Collection as the primary data source. As one of the most authoritative academic databases worldwide, WoS covers a broad range of disciplines, including the natural sciences, social sciences, and arts and humanities. Its advanced search and analytical functionalities facilitate efficient data retrieval and validation, while ensuring high compatibility between bibliographic metadata and widely used scientometric analysis software [28,29]. Moreover, WoS applies rigorous journal selection criteria and a standardized citation indexing system, making it a reliable and frequently adopted data source in bibliometric and systematic reviews related to urban climate and cooling benefits [30,31].
2.2. Integrated B-SLR Methodology: Combining PRISMA and Bibliometric Mapping
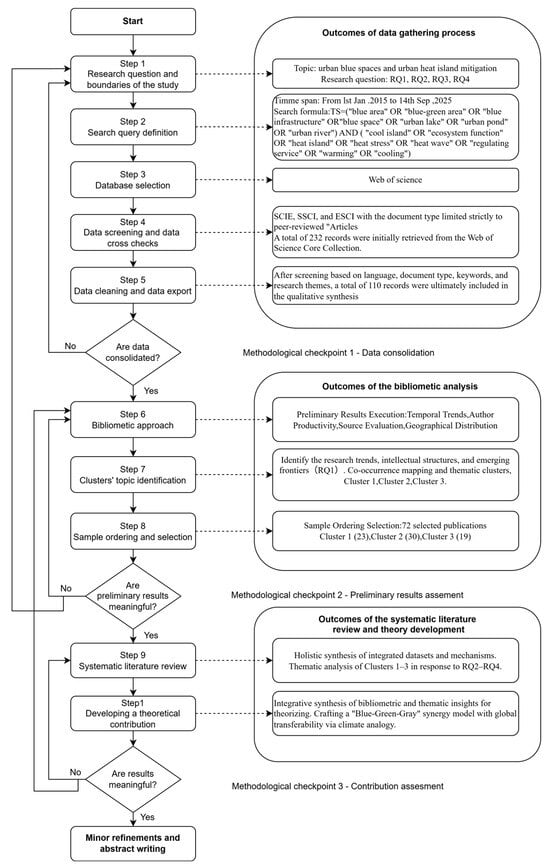
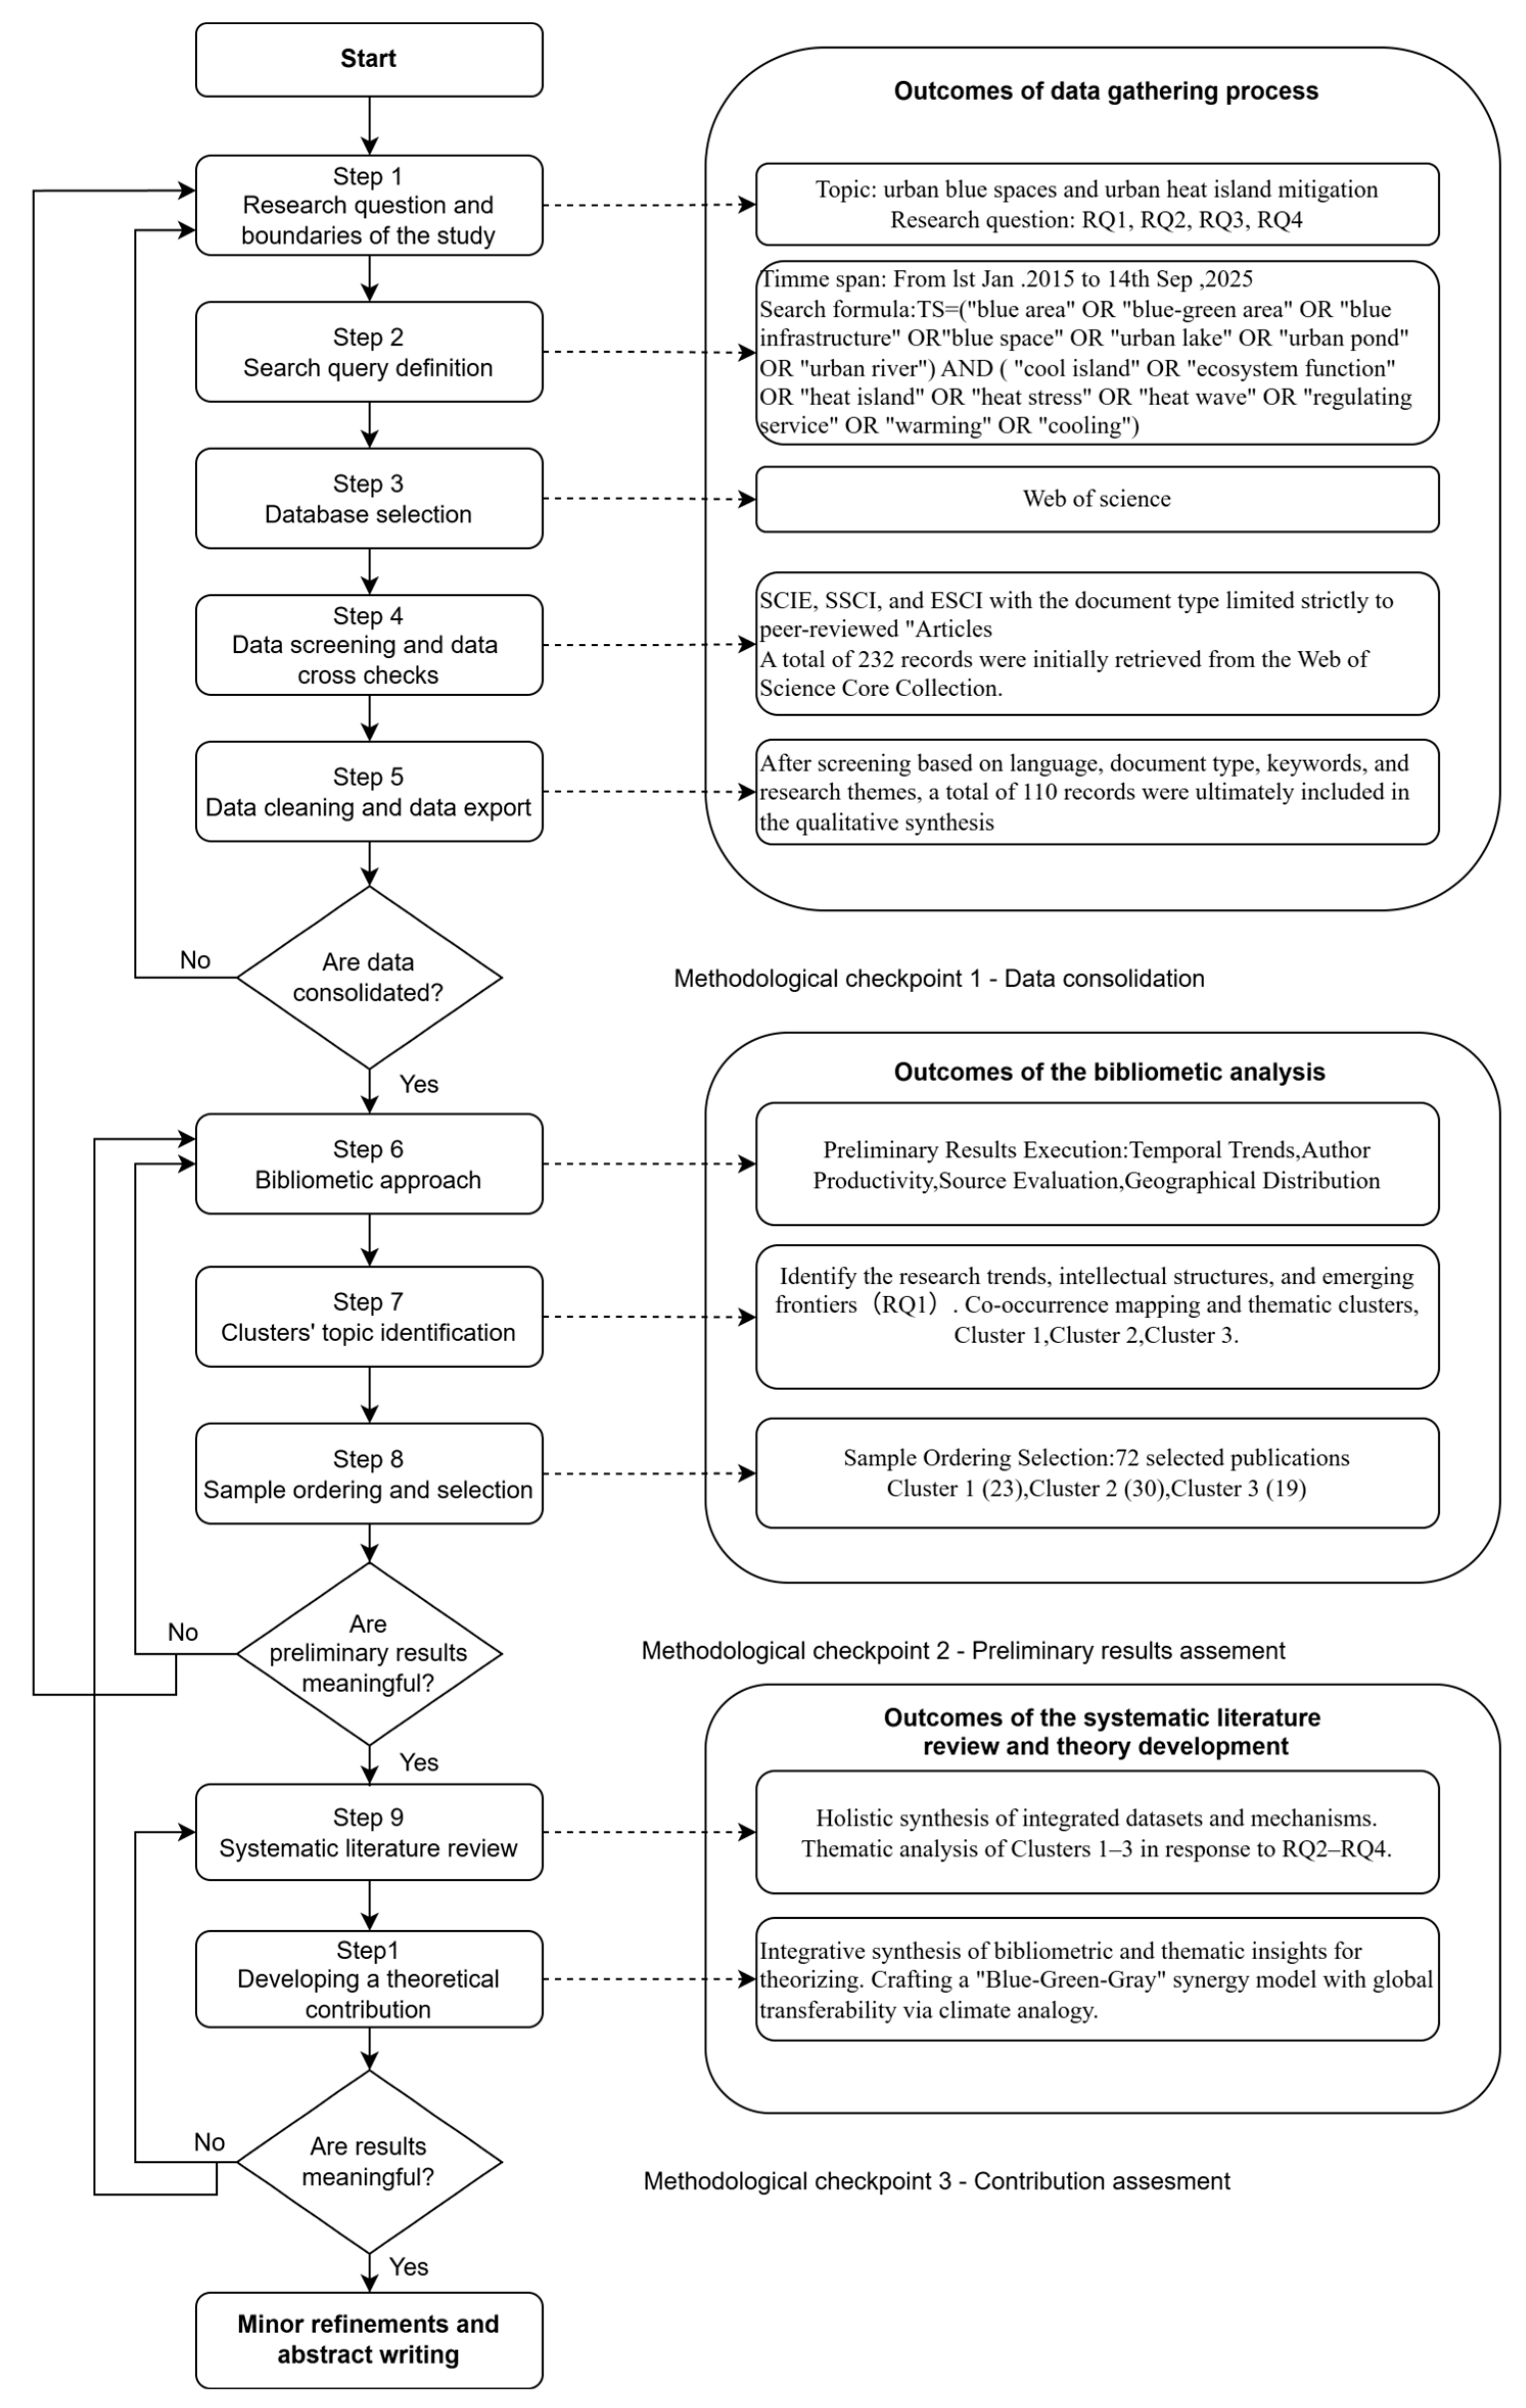
The review process follows the 10-step guidelines for B-SLR (Figure 1) proposed by Marzi et al. [27], which ensures the integration of bibliometric insights into the systematic narrative synthesis. Within this comprehensive framework, the PRISMA protocol [32,33] (can be see PRISMA checklist in Supplementary Materials) was strictly implemented during the data collection and screening phase to ensure transparency and reproducibility. Crucially, the B-SLR approach provides the analytical rigor missing in traditional reviews by using bibliometric clusters as a navigation tool for the subsequent methodological typology and thematic synthesis. This dual-layered strategy transforms the review from a procedural list into a structured analytical synthesis.
Figure 1.
Workflow of the Bibliometric-Systematic Literature.
2.3. Literature Search Strategy and Selection
The literature retrieval and screening process followed the PRISMA framework, as illustrated in Figure 1. To ensure comprehensive coverage of relevant studies, three indices within the WoS Core Collection were selected: Science Citation Index Expanded (SCI-EXPANDED), Social Sciences Citation Index (SSCI), and Emerging Sources Citation Index (ESCI). The final search strategy was defined as follows: TS = (“blue area” OR “blue–green area” OR “blue infrastructure” OR “blue space” OR “urban lake” OR “urban pond” OR “urban river”) AND (“cool island” OR “ecosystem function” OR “heat island” OR “heat stress” OR “heat wave” OR “regulating service” OR “warming” OR “cooling”).
In accordance with the bibliometric-systematic review protocols [27], no initial start date was restricted during the database search to avoid arbitrary selection bias. However, the screening process revealed that the specific nomenclature and conceptual framework regarding urban blue spaces as a primary mitigation strategy for the UHI effect, often integrated with the ‘Nature-based Solutions’ paradigm [34], only gained significant academic presence starting from 2015. As noted in similar recent syntheses [35], the novelty of these definitions inherently limits the relevant literature to the past decade. Therefore, 2015–2025 represents the comprehensive lifecycle of this specialized field. The search covered the period from 1 January 2015 to September 2025, and was conducted on 14 September 2025. Following the removal of duplicate records and a two-stage screening process based on titles/abstracts and full-text eligibility, a total of 110 publications were retained for final bibliometric and systematic analyses.
3. Results
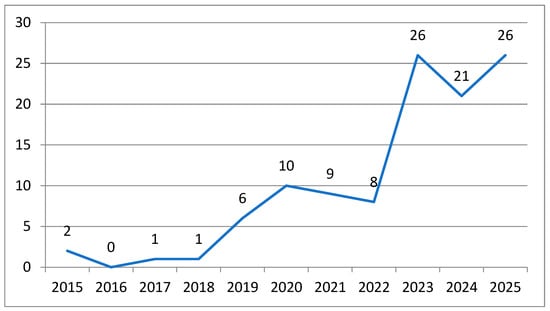
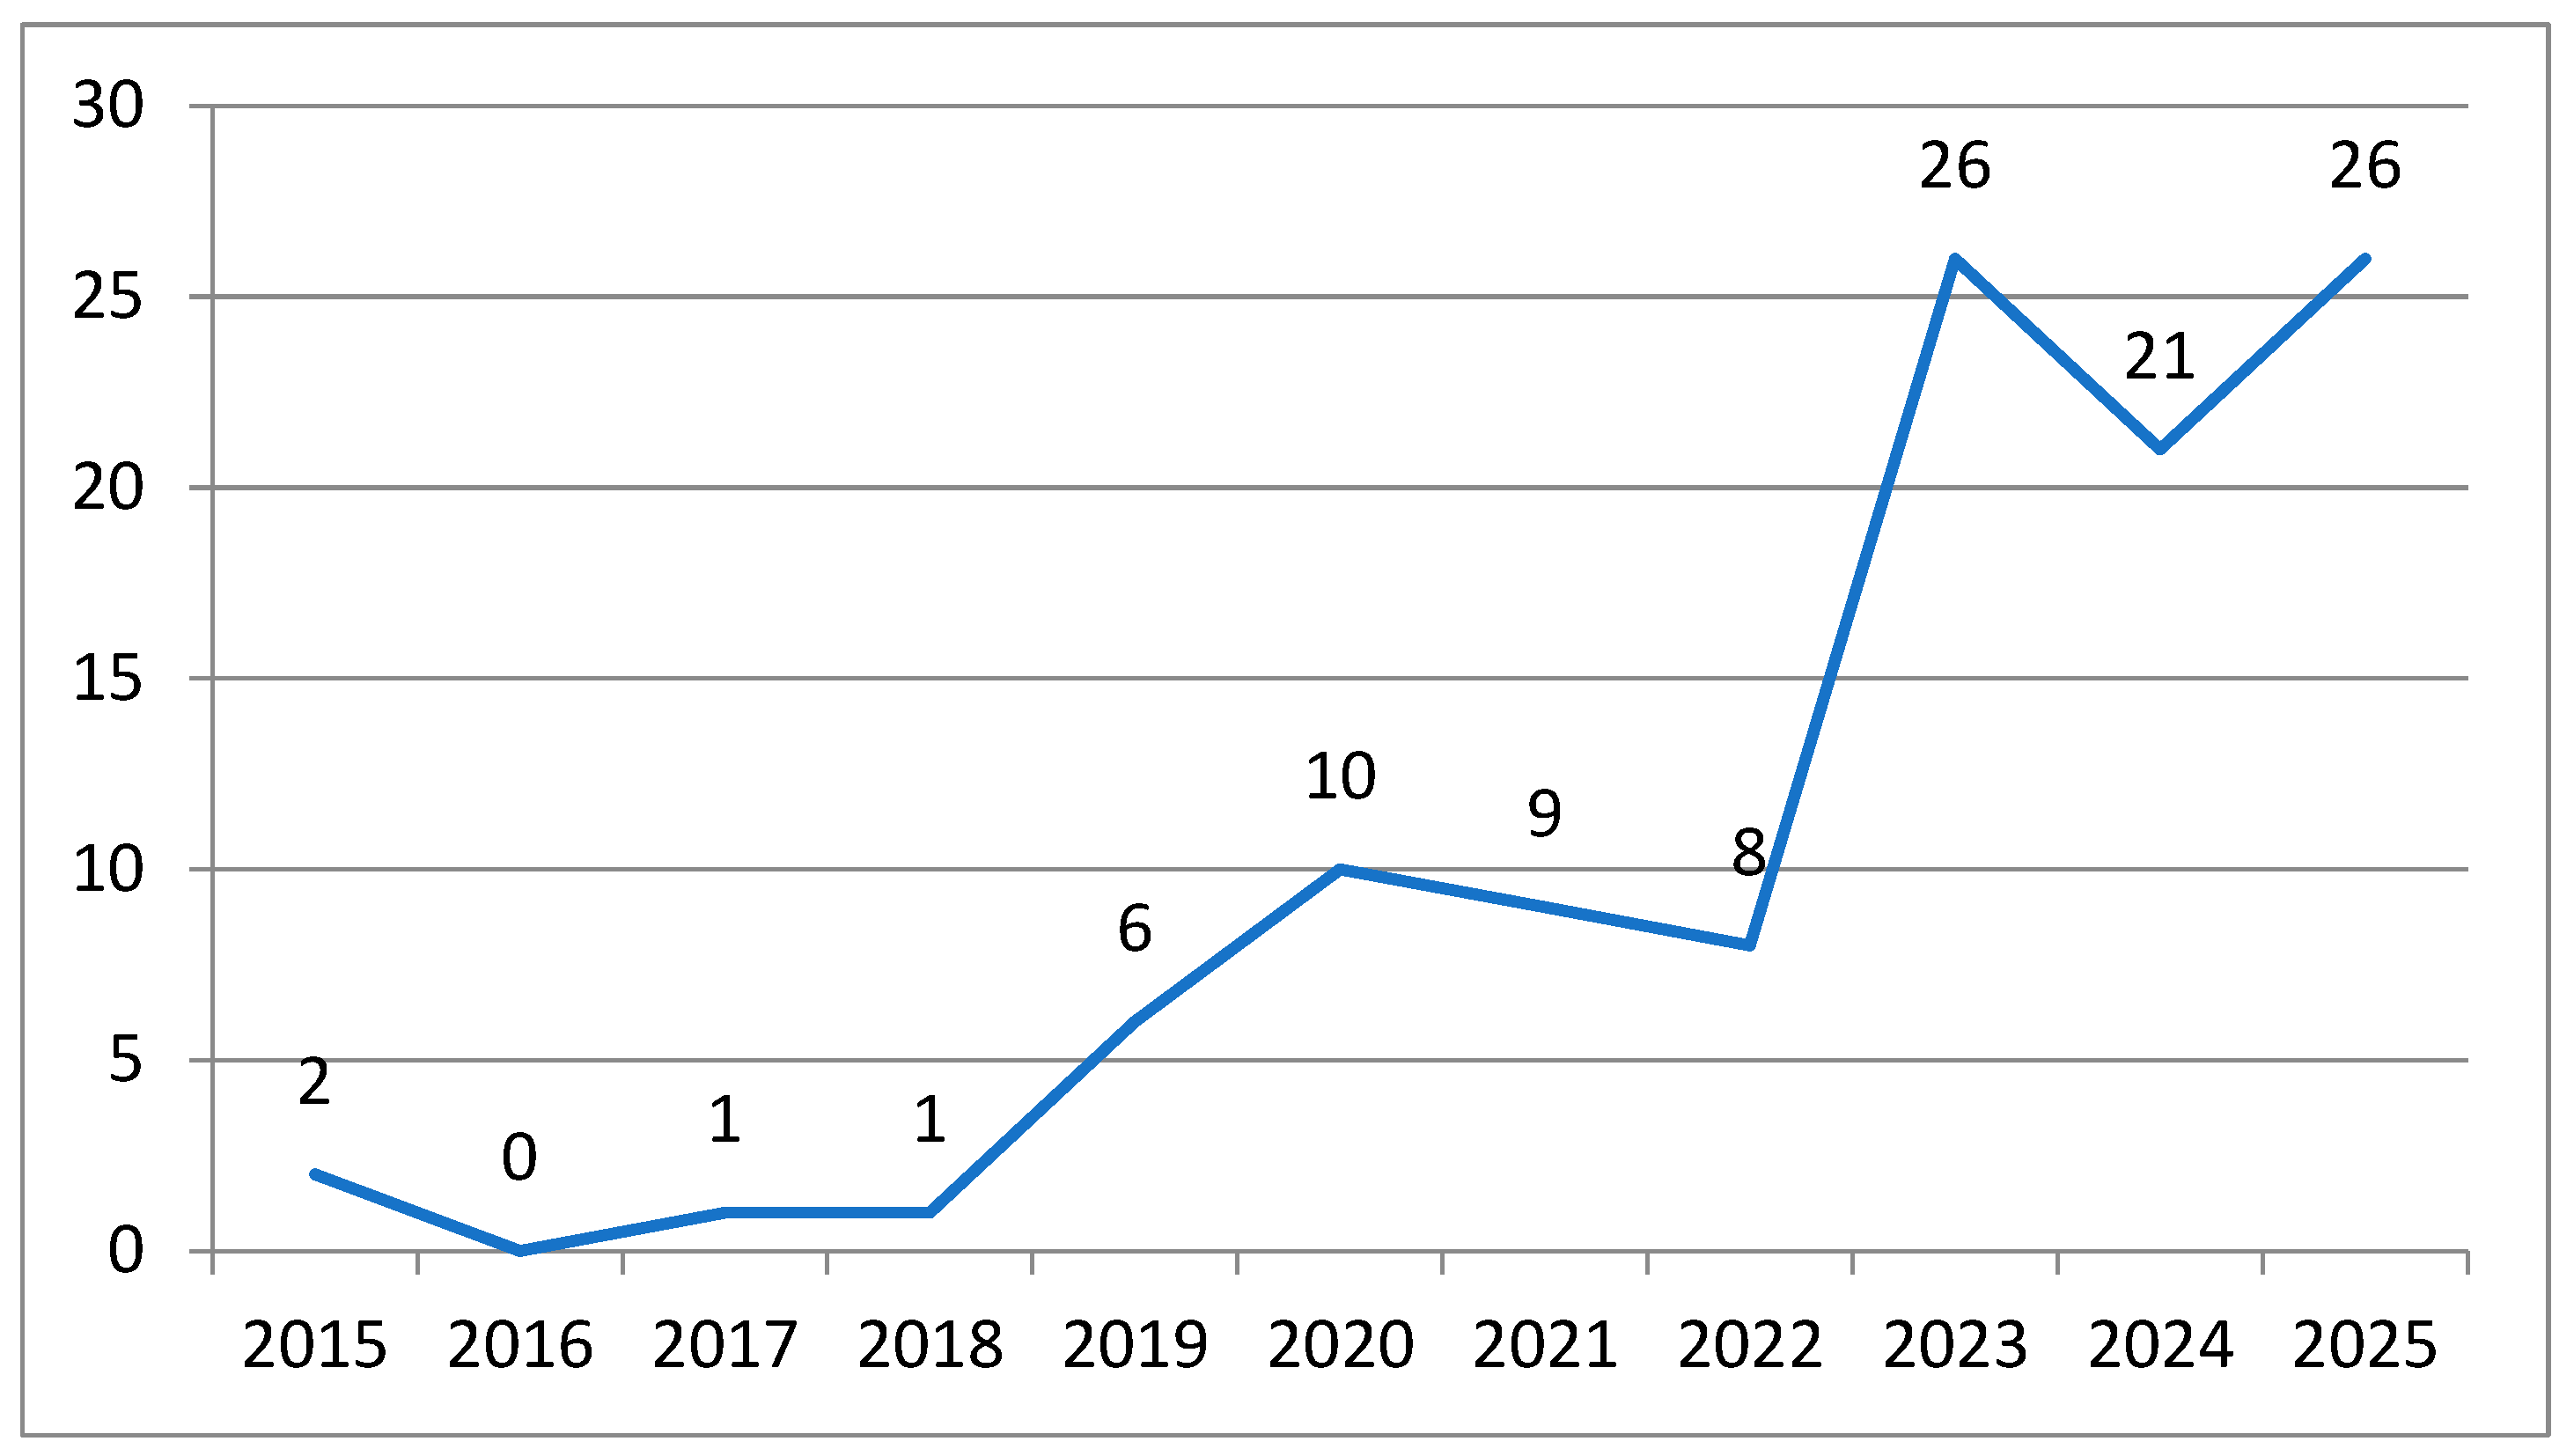
The 110 publications included in this analysis involve 516 authors affiliated with 249 institutions across 43 countries and were published in 47 academic journals. Collectively, these papers cite 5363 references drawn from 516 different journals, reflecting the interdisciplinary nature of research on urban blue infrastructure and the UHI. Figure 2 presents the annual distribution of publications in this field. Overall, the number of studies has exhibited a steady upward trend, with particularly rapid growth observed after 2023. This phenomenon may be attributed to the significant research delays and the resulting backlog caused by the COVID-19 pandemic [36,37]. Between 2023 and 2025, annual publication output consistently exceeded 20 articles, indicating increasing scholarly attention and highlighting this topic as an emerging and expanding research frontier.
Figure 2.
Distribution of publications from 2015 to 2025.
3.1. Descriptive Statistics Analysis
An analysis of authorship patterns provides insights into the core contributors and collaborative structure of this research field. According to Price’s Law [38], approximately half of the publications in a scientific field are produced by a core group of highly productive authors, whose size is roughly equal to the square root of the total number of authors. This relationship can be expressed as:
where n(x) represents the number of authors who have published x papers, I (= nmax) denotes the maximum number of publications by a single author (here, nmax = 4 based on VOSviewer statistics), N is the total number of authors, and m is the minimum number of publications required to define a core author. Following Price’s criterion, m is calculated as m = 0.749 × √(nmax) ≈ 1.498. Accordingly, authors with two or more publications were identified as core contributors.
Based on this threshold, 38 core authors were identified, collectively contributing 90 publications, which account for 81.8% of the total sample—well above the 50% benchmark proposed by Price. These results indicate the formation of a relatively stable and cohesive core author network within the field of urban blue infrastructure and UHI research.
Table 1 lists the most productive authors with more than three publications. Shi, Dachuan ranks first with five publications between 2015 and September 2025, accumulating 163 citations (32.6 citations per paper). Song, Jiyun follows with four publications and 161 total citations, yielding the highest average citation rate (40.25 citations per paper). Wang, Yuncai also contributed four publications, with a total of 79 citations.
Table 1.
Most important authors in the research field.
3.2. Bibliometric Analysis of Journals
An examination of publication venues indicates that research on urban blue infrastructure and the UHI effect is primarily concentrated in journals focusing on urban planning, environmental science, and related interdisciplinary fields. As shown in Table 2, Sustainable Cities and Society and Urban Climate are the most prolific journals, publishing 15 and 8 articles, respectively. Notably, Sustainability and Remote Sensing are open-access journals, suggesting that the increasing adoption of open-access publishing has facilitated broader dissemination and exchange of knowledge in this field.
Table 2.
Top 9 journals in the research field.
Citation performance further reveals qualitative differences among journals. Among those listed in Table 2, Science of the Total Environment exhibits the highest average citation count, with 210.4 citations per article based on five publications. This result reflects the high academic impact and visibility of studies published in leading environmental science journals and underscores their influence on urban climate research.
3.3. Bibliometric Analysis of Countries
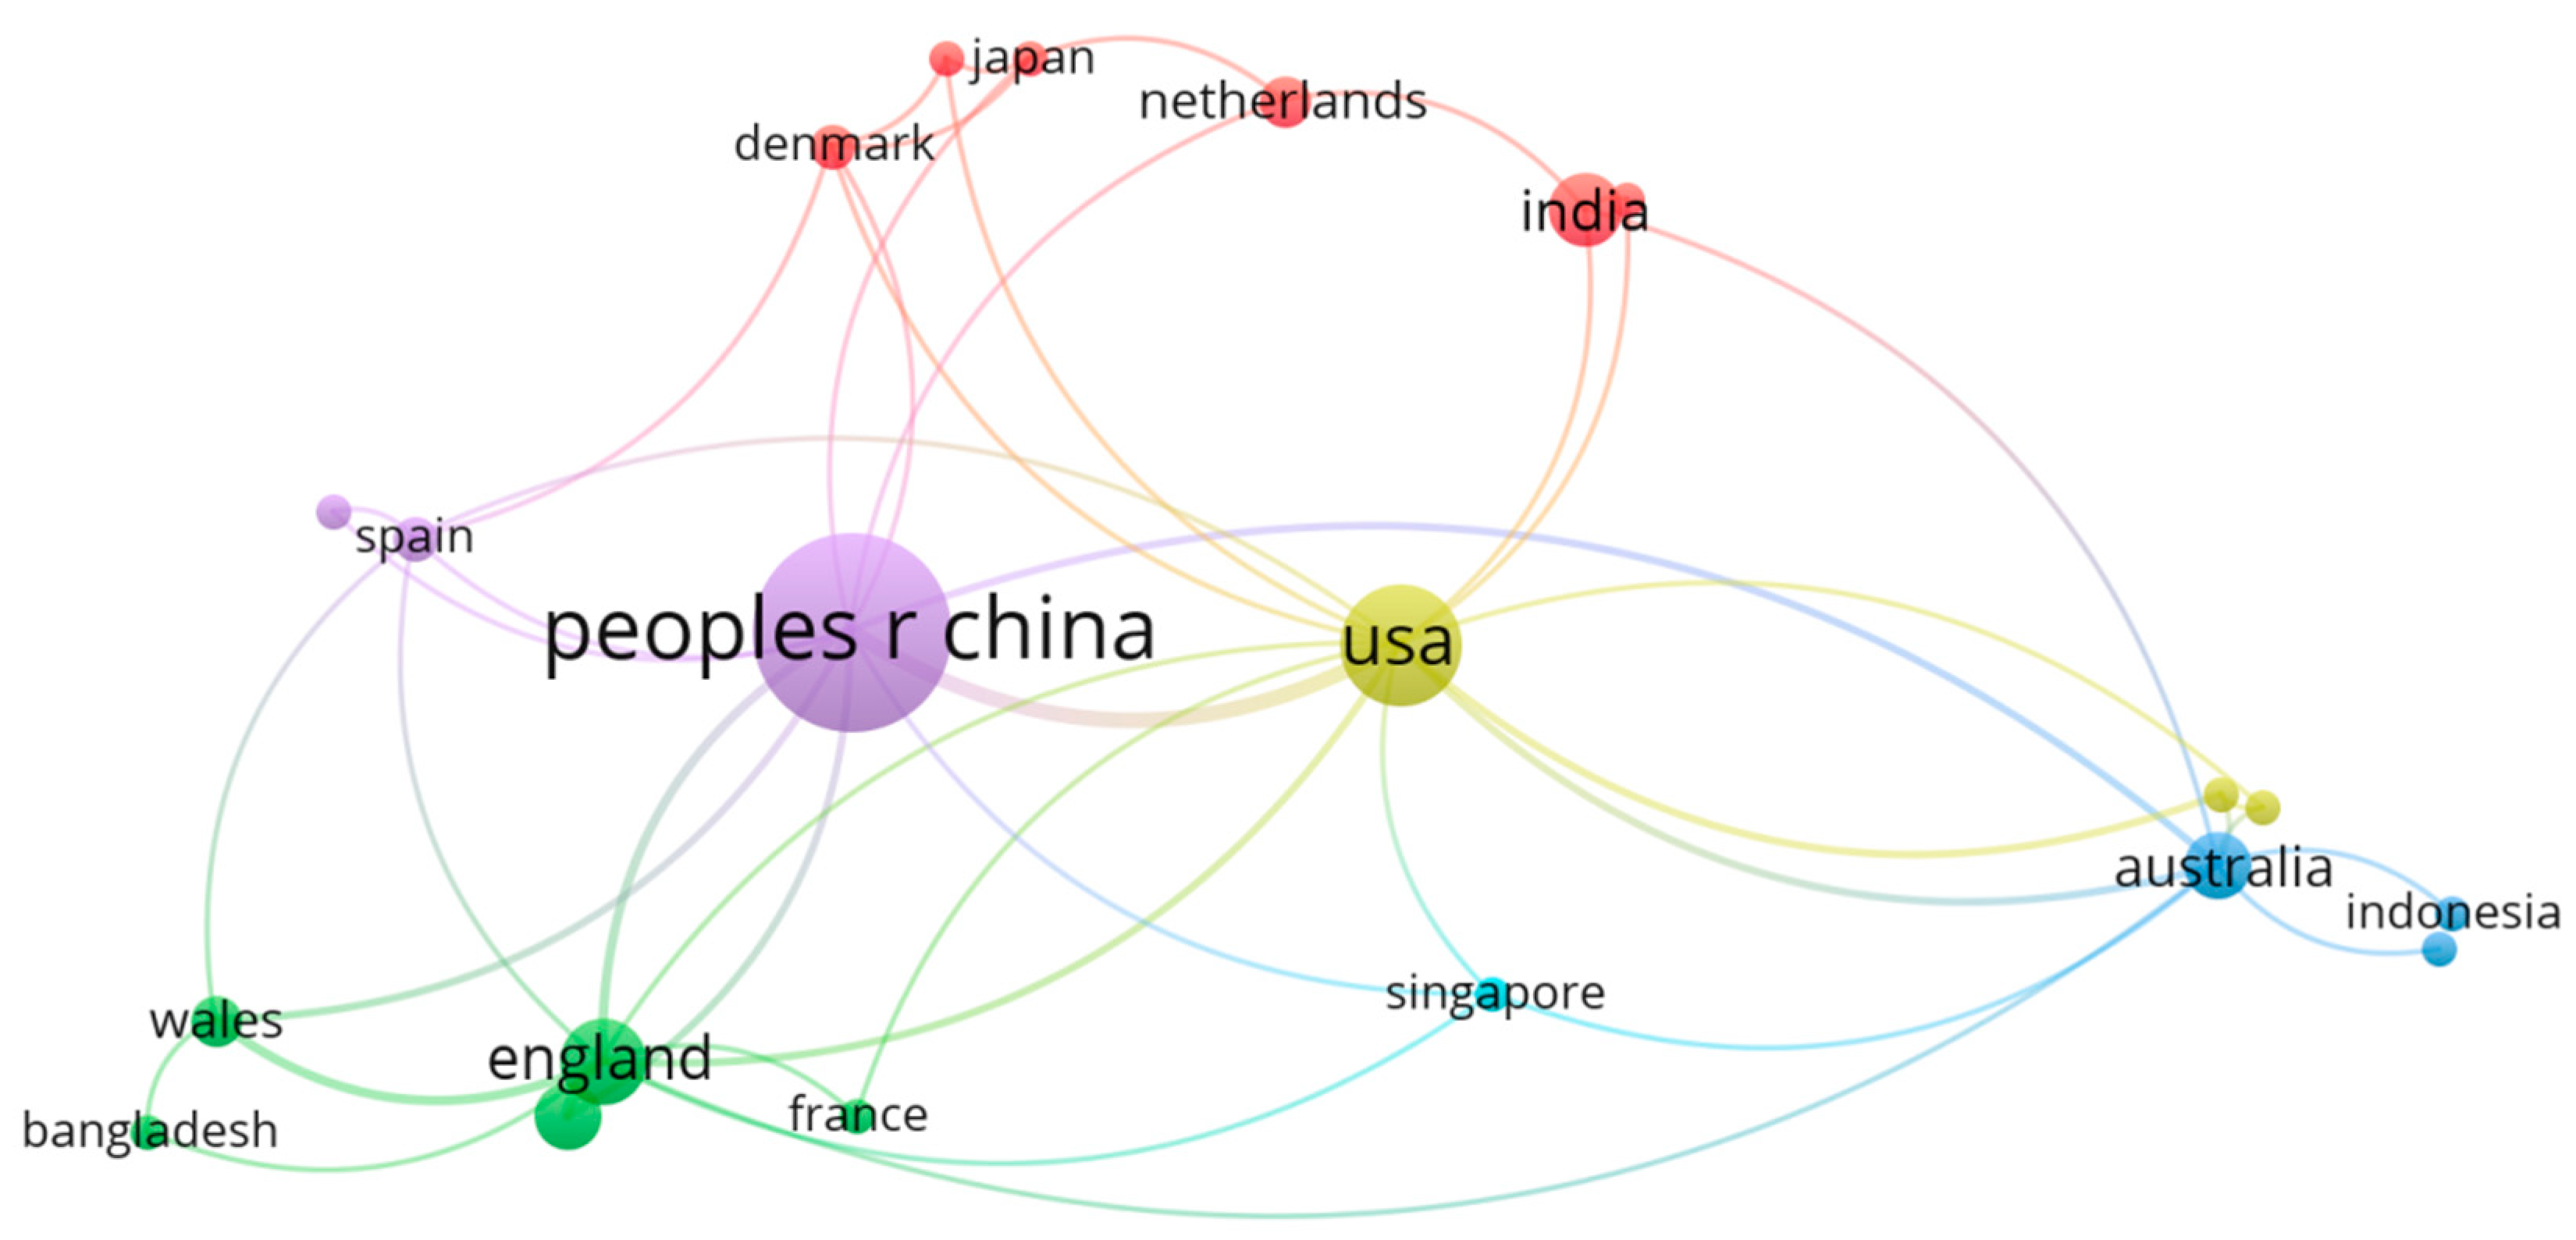
To evaluate national-level research contributions, the geographic distribution of publications was analyzed using VOSviewer. A total of 43 countries with at least two publications were visualized in the international collaboration network (Figure 3). In this network, node size represents publication output, link thickness indicates the strength of international co-authorship, and node color denotes collaborative clusters.
Figure 3.
Co-occurrence of countries.
The results reveal a markedly uneven global distribution of research output, characterized by a pronounced concentration of publications in a small number of leading countries. As shown in Table 3, China ranks first in terms of publication volume, contributing 57 articles (50.89% of the total). However, the average citation rate per Chinese publication is comparatively low. The United States ranks second, with 22 publications and 637 total citations. The United Kingdom demonstrates the highest average citation impact: its 11 publications have received 1098 citations, corresponding to an average of 99.82 citations per paper, indicating strong academic influence despite a smaller publication volume.
Table 3.
Top 6 countries in the research field.
3.4. Co-Occurrence Network Analysis
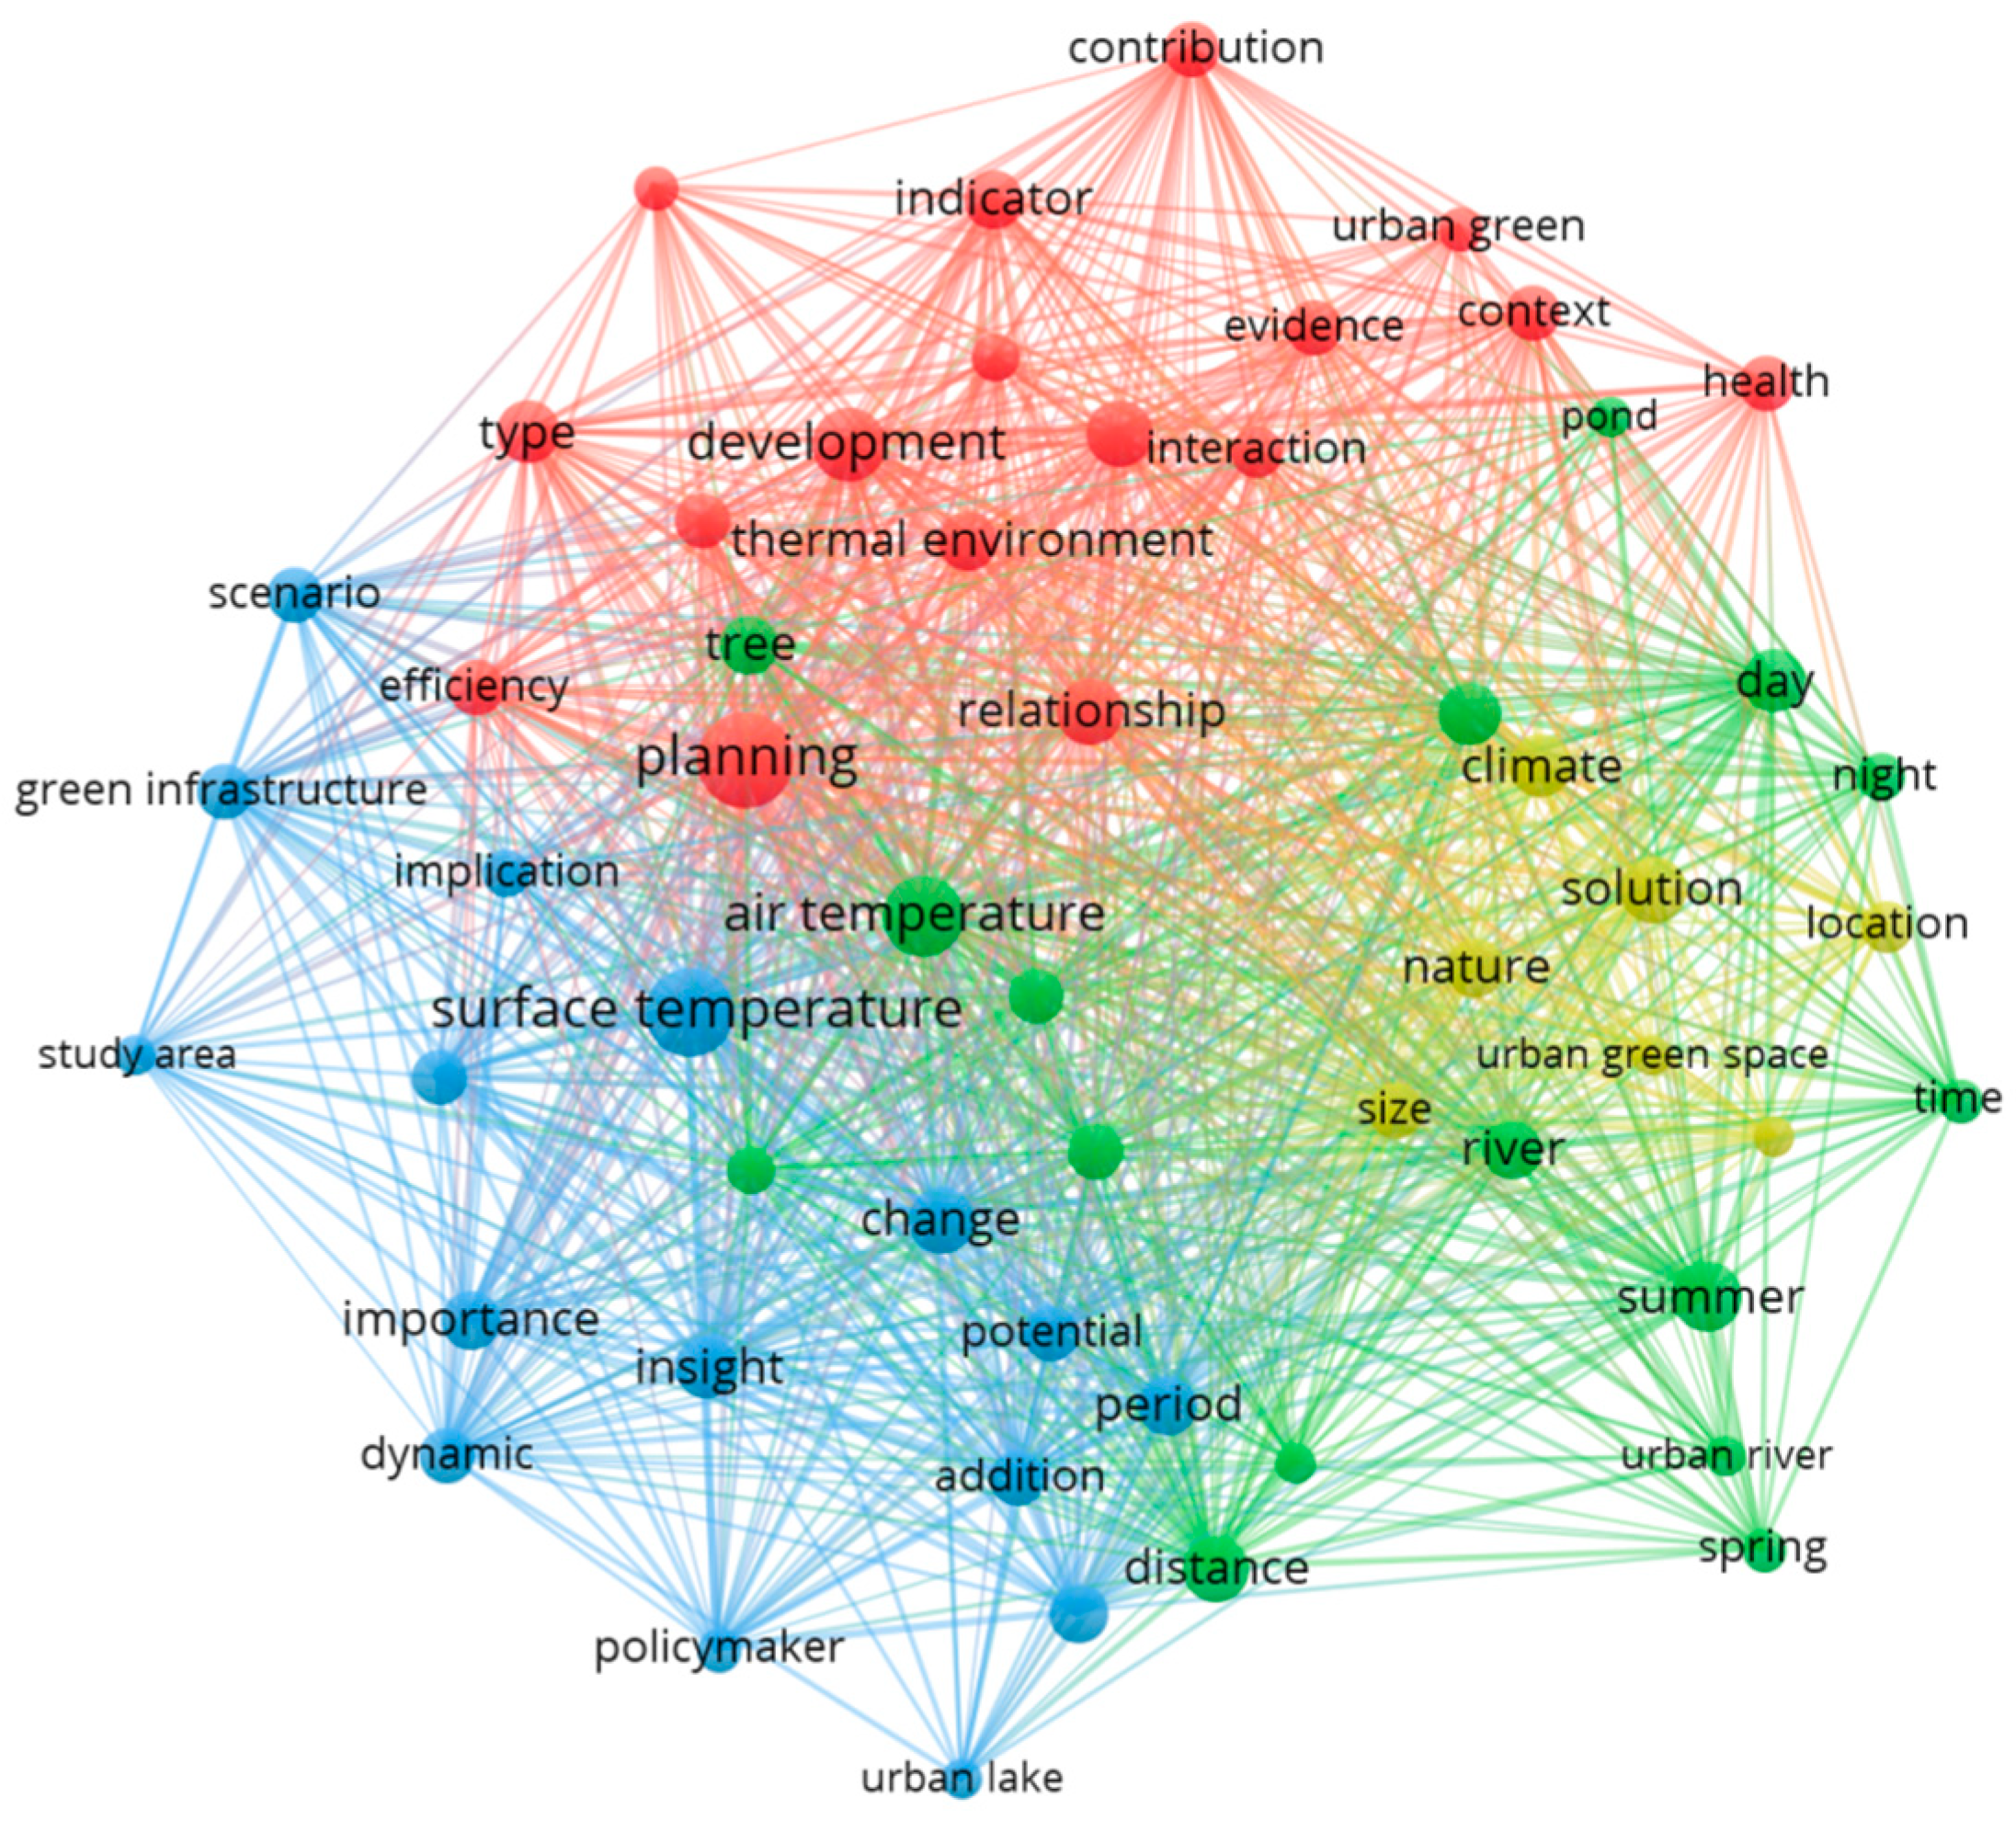
To reveal the intellectual structure and research hotspots in studies of urban blue spaces and the UHI effect, a co-occurrence network analysis was conducted using VOSviewer. Rather than relying solely on author-provided keywords, this study employed text-mining-based co-occurrence analysis of titles and abstracts to achieve a more comprehensive and nuanced representation of thematic relationships [39]. Based on the 110 publications, 56 high-frequency terms (occurring at least seven times) were selected to construct the co-occurrence network shown in Figure 4, with a summary of key terms provided in Table 4.
Figure 4.
Keyword network between 2015 and 2025.
Table 4.
List of High-Frequency Keywords.
In the network visualization, node size corresponds to term frequency, link thickness reflects co-occurrence strength, and node color indicates thematic clusters. The results reveal four major and highly interconnected research dimensions.
3.4.1. Keyword Co-Occurrence and Thematic Clustering Analysis (RQ1)
Through VOSviewer-based keyword co-occurrence analysis, we identified three thematic clusters that define the current research landscape of urban blue space cooling. These clusters do more than map the field; they serve as the structural backbone for the systematic discussion in Section 4.
Cluster 1: Urban Thermal Environment and Spatiotemporal Dynamics
As the structural core of the co-occurrence network, Cluster 1 centers on the physical quantification of cooling and its inherent variability. The dominance of “surface temperature” (35 occurrences) and “air temperature” (30) nodes reflects a dual-track measurement approach, bridging the gap between satellite-derived data and the micro-scale environment. A notable shift in recent scholarship is revealed by the strong links to temporal keywords such as “summer” (21), “day” (17), and “night” (11). This suggests that the field has matured beyond static “snapshots” toward a more nuanced investigation of dynamic thermal regulation. The clustering of “heat stress” (17) and “microclimate” (14) further underscores this focus, highlighting a concerted effort to link blue space performance directly to human-centric thermal relief in the immediate urban atmosphere.
The literature reveals a clear methodological divide in how the thermal environment is assessed. On one hand, remote sensing studies, exemplified by Sökmen and Kutay or Wu et al., rely heavily on LST to chart large-scale spatial patterns [40,41]. On the other hand, fieldwork-driven research shifts the focus to Air Temperature as a more precise gauge of pedestrian-level comfort. This distinction is critical; for instance, Chen et al. and Liu et al. utilize indices like physiological equivalent temperature to show that while blue spaces may effectively lower air temperature, their impact on heat stress is often complicated by humidity, a nuance that LST-based metrics typically fail to capture [19,42].
Regarding temporal behavior, while there is a strong consensus on seasonal efficacy, diurnal patterns remain a point of contention. Literature consistently identifies summer as the “critical window” for cooling, as the thermal gradient between water and impervious surfaces reaches its peak [43,44]. However, a “nocturnal warming” phenomenon complicates the narrative. While flowing rivers may sustain daytime cooling [45], stagnant water bodies like ponds and lakes can paradoxically flip from heat sinks to heat sources after sunset. As Yao et al. and Solcerova et al. demonstrate, the high specific heat capacity of static water often leads to a “thermostatic” effect, where heat stored during the day is released at night [25,46]. Lee et al. reinforce this concern, noting that even small water features can exhibit delayed cooling, potentially exacerbating nocturnal heat stress when relief is most needed [47].
Cluster 2: Blue Space Morphology and Spatial Configuration
This cluster aggregates the physical and spatial attributes of blue spaces, grounding the discussion in the principle that form dictates function. High-frequency nodes like “size,” “location,” “distance,” and “shape” form the structural skeleton of this group. The clustering suggests a clear consensus: cooling magnitude is not a passive byproduct of water presence, but a variable heavily modulated by its morphology.
The literature moves beyond the intuitive bigger is better narrative by establishing specific quantitative thresholds. For instance, Gupta and De provide a necessary corrective for recreational planning, identifying a size range of 1.8–2.3 km2 as the “sweet spot” where cooling efficiency and land-use costs reach an optimal balance [48]. Geometry appears to be a more decisive factor than simple area. Nguyen’s findings highlight this shift, showing that a pond’s perimeter edge has a far stronger influence on surface temperature than its total footprint [49]. This suggests that complex shapes, those with longer, more intricate interfaces, facilitate superior energy exchange. This geometric logic is further refined by Wang et al., who position the landscape shape index as a primary determinant for how cooling effects diffuse through riverside environments [50].
Location functions as a critical regulator of cooling efficiency, though it often presents a trade-off. Cheng et al. observed that downtown lake groups paradoxically exhibit higher cooling intensities than suburban ones, simply because the thermodynamic contrast with the parched urban core is much sharper [51]. However, this intensity comes at a cost; as Lin et al. point out, the same dense urbanization that drives higher intensity often “chokes” the cooling distance [52]. This creates a spatial paradox where the most powerful cooling sources are frequently the most geographically confined.
Cluster 3: Synergistic Infrastructure and Integrated Planning Strategies
This cluster reveals a significant paradigm shift: research has moved beyond isolated landscape elements toward a holistic Blue-Green-Gray (BGI) framework. High-frequency nodes like “synergy,” “integration,” and “policy” form the thematic core, while terms such as “cost-benefit” and “supply-demand” signal a growing focus on the socio-economic feasibility of cooling strategies. The emphasis here is no longer just on whether blue spaces cool, but on how to operationalize these benefits within complex urban design.
The literature makes it clear that cooling efficiency is not an inherent trait of BGI, but a product of its interaction with the “gray” urban matrix. While the “water + green” combination can yield a 3.3 °C temperature drop beyond the sum of their individual effects [53], this biological synergy is precarious. As Fung and Jim warn, unshaded water bodies can paradoxically exacerbate heat stress [54], a nocturnal warming effect that Hu and Li argue can effectively negate the benefits of adjacent green spaces after sunset [10]. Crucially, the “gray” environment, building density and height, functions as the ultimate physical regulator. Pan et al. found that dense, high-rise contexts actually demand more aggressive synergistic interventions, as GBI exhibits higher cooling intensity in these trapped environments compared to open, low-rise zones [55].
This relationship is further complicated by the day-night trade-off. While vegetation leads the cooling effort by day, building morphology (orientation and density) dictates the nocturnal microclimate by regulating ventilation corridors [45]. Poor gray infrastructure layout can effectively “lock in” the moisture and heat released by water bodies. Even verticality has a specific tipping point; Marquez-Torres et al. identified a critical height threshold of 20 m for buildings adjacent to green spaces, beyond which the warming effect on LST tends to plateau [56]. Current research has decisively abandoned “one-size-fits-all” guidelines in favor of context-specific thresholds. For instance, Marquez-Torres et al. provide actionable parameters for city-scale planning, such as the 350-ha park size and its 4-km cooling radius [56]. To address spatial inequities, Wang et al. introduce a “supply-demand” logic that prioritizes interventions in high-vulnerability cores [57]. In high-density historical blocks where land is a luxury, Zhang et al. demonstrate that increasing the complexity and aggregation of BGI patches is far more effective than mere area expansion [58]. This is echoed by Yan et al., who advocate for “precision greening” in metacities, leveraging the 6 °C cooling variability of even small, dispersed spaces when they are surgically integrated into the gray urban fabric [59].
3.4.2. Sample Ordering Selection
Following the B-SLR framework [27], we distilled the initial 110-paper dataset into a core library for qualitative synthesis. This screening process went beyond mere keyword matching; we manually vetted both abstracts and full-text articles to ensure each study offered substantive insights into our three RQs. Our selection criteria prioritized empirical rigor—specifically studies providing quantified morphological metrics and actionable planning logic—while filtering out “noise” documents that lacked deep mechanistic insights despite their thematic overlap. This rigorous pruning resulted in a final set of 72 core papers (Table A1).
This final sample is organized into three strategic clusters that mirror our research objectives. Cluster 1 (23 papers) tracks the spatiotemporal dynamics of urban thermal environments, providing the seasonal and diurnal granularity needed for RQ2. Cluster 2 (30 papers) dives into morphological indicators, offering the hard data on water body thresholds and geometric complexity required by RQ3. Finally, Cluster 3 (19 papers) addresses the synergy between blue, green, and gray infrastructure, focusing on the coupling mechanisms and frameworks that bridge the persistent gap between climate science and urban design (RQ4). Together, this curated body of literature forms a robust, data-driven foundation for a globally applicable blue space planning framework.
4. Discussion
This Discussion synthesizes qualitative evidence from 73 selected studies to answer our research questions. We first examine the spatiotemporal nuances of blue space cooling (Section 4.1), then deconstruct the geometric metrics that govern these thermal benefits (Section 4.2), and ultimately translate these insights into actionable urban design strategies (Section 4.3).
4.1. Spatiotemporal Heterogeneity: From Observation to Mechanism (RQ2)
While blue spaces are widely recognized for their cooling potential, this “service” is highly conditional rather than an inherent property of water. A closer look at the literature suggests that thermal benefits often involve complex trade-offs, where early optimistic assumptions clash with recent evidence regarding causality and seasonal gaps.
4.1.1. The Diurnal Paradox: Nocturnal Warming Risks
The consensus on daytime cooling, primarily driven by evaporation, is well-supported [43,44]. The weak link emerges after sunset. Solcerova et al. and Yao et al. offer a necessary reality check to the cooling narrative: water bodies function as thermal capacitors, absorbing solar radiation by day and discharging it as sensible heat throughout the night [25,60]. This mechanism drives a diurnal paradox where blue spaces transform into urban hot-tubs long after the sun goes down [61].
This nocturnal warming is not merely theoretical; Yao et al. recorded nighttime heat island intensities of 1.2–1.3 °C in subtropical settings [46], a trend echoed by Lee et al. near swimming pools in Hong Kong [47]. The problem is further complicated by moisture. As Chakraborty et al. point out, nocturnal heat is often coupled with moisture advection, spiking physiological heat stress even when air temperature sensors show modest readings [62]. For urban planners, relying on daytime-only data is a gamble that risks “maladaptation”—effectively shifting thermal relief from one part of the day to a potentially more hazardous nocturnal heat stress event [45].
4.1.2. Methodological Precision: Surface vs. Air Temperature
The perceived cooling of blue spaces is often a byproduct of how we measure it. While remote sensing has provided a wealth of data on spatial correlations between water proximity and reduced LST [40,41,63], these satellite-derived snapshots can be deceptive. As Das et al. point out, LST lacks the granularity to reflect the microclimatic reality experienced by pedestrians at street level [64]. The actual causality of air cooling hinges on aerodynamic movement rather than mere proximity. For instance, the cooling “lake-breeze fronts” identified by Wang et al. are not guaranteed; they are easily stifled by rigid urban morphology [65]. Park et al. and Pan et al. further clarify that without a “synergistic” urban form, specifically street widths and building heights that invite ventilation, the cooling effect remains trapped at the water’s edge, failing to penetrate the dense urban fabric [55,66]. Relying solely on LST, therefore, risks an “optimism bias,” overestimating the thermal relief actually delivered to city dwellers.
4.1.3. Contextual Validity: Beyond the Summer Bias
A significant hurdle in generalizing these findings is the prevailing summer bias in current literature. While water’s cooling capacity is well-established for peak summer months [26], this performance often collapses during shoulder seasons [42,67]. A striking example comes from Chongqing, where Cheng et al. identified riverine zones not as refuges, but as high-temperature zones during spring nights [68]. Furthermore, the efficacy of blue space is not static; it is spatially contingent on its surroundings. Yao et al. observed a diminishing return: as urbanization intensifies, the cooling intensity of blue spaces often drops below that of green spaces due to severe landscape fragmentation [69]. These discrepancies suggest that blue space is not a “universal remedy.” Instead, planning frameworks must treat it as a variable outcome of seasonal energy budgets and local landscape configurations [19,24].
4.2. Morphological Determinants: Non-Linear Thresholds and Causal Mechanisms (RQ3)
While the cooling effect of blue space is well-recognized, the relationship is rarely linear. A closer look at the data suggests that “cooling efficiency” is often decoupled from a water body’s mere presence. Instead, it is governed by a complex interplay of scale efficiency, thermodynamic gradients, and 3D geometric resistance that simple scaling laws fail to capture.
4.2.1. Scale Effects: Beyond the Bigger Is Better Fallacy
Early planning often relied on the oversimplified assumption that larger water bodies yield proportionally larger cooling benefits. However, recent evidence points toward a diminishing marginal return. In tropical contexts, for instance, cooling efficiency appears to peak within a specific size range of 1.8–2.3 km2, beyond which land-use costs often eclipse the incremental thermal gains [48]. This threshold effect is even more pronounced in high-density cities like Shanghai, where compact blue-green composites as small as 0.93 ha have been found to offer the most cost-effectiveness [70].
A recurring oversight in current research, particularly remote sensing studies, is the fixation on surface area at the expense of volume. The depth and hydrological mass of a water body are arguably more critical for long-term heat storage than its 2D footprint [71]. Furthermore, size requirements are strictly context-dependent: while regional systems like Poyang Lake require vast acreages (>2500 km2) to influence the regional climate [72], urban fabric efficacy may hinge on maintaining much smaller, strategic patches (e.g., >0.54 ha) [67].
4.2.2. Thermodynamic Contrast and the Aerodynamic Link
The efficacy of blue space is not an intrinsic trait; it is a product of the interaction between the water and its surrounding “urban matrix.” A crucial distinction must be drawn between spatial proximity and actual heat exchange. High-resolution sensing confirms that downtown water bodies often show higher cooling intensity than their suburban counterparts, simply because the sensible heat flux contrast is sharper in hotter urban cores [51]. This leads to a planning paradox: the lakes that work the hardest (highest intensity) often have the shortest reach, as their cooling signals are muffled by dense urbanization [52]. The “bridge” that extends this cooling range is almost exclusively aerodynamic. Upwind water bodies can project thermal relief deep into the built environment, provided the urban morphology (e.g., street orientation and low roughness) acts as a conduit rather than a barrier [73,74,75,76]. Without these ventilation corridors, the cool air remains stagnant at the source [50,75].
4.2.3. Shape and Geometric Complexity: The Interface Trade-Off
The debate over water body shape centers on a fundamental tension between thermodynamic exchange and aerodynamic resistance. While complex, irregular shapes typically characterized by a high Landscape Shape Index maximize the contact interface to boost evaporative cooling [49,77], this spatial complexity comes with a catch. Overly fragmented geometries can heighten aerodynamic roughness, ultimately stifling the coherent “lake-breeze circulations” (LBCs) necessary for macro-scale thermal relief [78]. Evidence suggests that “optimal shape” is a matter of scale rather than a universal rule. Simple, aggregated forms are more effective at sustaining LBCs [73], while linear rivers yield peak benefits only when their orientation aligns with prevailing winds [72]. Consequently, planning must balance these competing geometric demands: prioritizing complex, high-interface forms for localized micro-scale relief [79,80], while reserving regular or linear geometries for regional ventilation corridors [81].
4.2.4. From Surface Metrics to Human Thermal Comfort
A recurring weak link in current literature is the problematic reliance on LST as a direct proxy for human benefit. Although LST maps are adept at identifying surface cooling gradients [82,83], they often fail to capture the nuances of the pedestrian experience. Indeed, field studies warn that blue spaces can create a deceptive cooling effect: lowering surface temperatures while simultaneously spiking humidity levels, which, in poorly ventilated, hot-humid climates, can actually exacerbate physiological heat stress [18]. Furthermore, the influence of “gray” infrastructure frequently eclipses the cooling contribution of water bodies. 3D urban morphology, particularly sky view factor and building height, can overshadow the thermal performance of nearby blue spaces [84,85]. This suggests that planning models optimized solely for LST reduction [51,70] may fall short of protecting public health [85]. Bridging this gap requires a shift toward “synergetic” planning models that integrate 3D morphological resistance [50], hydrological depth [71], and ambient humidity into a cohesive blue-green-gray framework [78,86,87].
4.3. Blue-Green-Gray Interactions and Systemic Planning (RQ4)
While Blue-Green Infrastructure is often marketed as a universal urban remedy, its synergy is never a guaranteed outcome. Rather, it is a conditional state dictated by the surrounding gray urban matrix. Moving beyond normative ideals requires us to pin down the exact morphological thresholds and spatial logic that turn gray infrastructure from a thermal barrier into a cooling regulator.
4.3.1. Morphological Thresholds for Synergy
The fatal flaw in traditional planning is isolating blue-green elements from the 3D urban form. Recent data suggests that gray infrastructure doesn’t just block cooling—it sets the rules for it. In high-density districts (gray coverage > 40%), a critical 30% blue space threshold is necessary to maintain a functional cooling signal; in contrast, scattered, smaller patches are sufficient for low-density zones (<30% coverage) [17]. Verticality is equally decisive: Marquez-Torres et al. [56] found that buildings bordering green spaces should ideally stay below 20 m to prevent air stagnation and allow cooling to diffuse into the neighborhood.
Furthermore, the canyon effect in dense blocks demands specific geometric constraints. Wang et al. [20] quantify that in these high-inertia environments, keeping Green Space Patch Density (PD) below 550 and the Water Landscape Shape Index (LSI) under 4.2 is actually more effective than simply expanding the green area. This shifts the design mandate: in dense urban cores, BGI must be aggregated and regular to “punch through” the heat dome, whereas in suburban areas, complex and fragmented shapes are preferred to maximize cooling exchange at the edges [53,88].
4.3.2. Operationalizing Design: Demand-Based Zoning and Resilience
The chronic mismatch between where cooling is supplied and where it is needed necessitates a shift from opportunistic greening to demand-based zoning. Planning must prioritize “low supply–high demand” quadrants, typically the dense, low-income cores, where the marginal health benefits of a temperature drop are most significant [57,89].
Marquez-Torres et al. [56] propose a clear spatial hierarchy: large “anchor” parks (>350 ha) are essential for city-wide regulation, offering an effective cooling radius of roughly 4 km, while precision interventions (<9 ha) should be surgically deployed in land-scarce cores [59]. In developing outskirts, Zhong et al. [90] advocate for a “horizontal sprawl” model over vertical densification to protect existing lake-breeze pathways.
Ultimately, operational success is defined by more than just total canopy cover. It hinges on the strategic integration of specific variables, such as placing selected tree species along canal-fronts, to achieve measurable physiological outcomes, such as reducing Physiological Equivalent Temperature (PET) by up to 4.7 °C [91]. True systemic resilience requires planning support systems that move beyond summer-only optimization, integrating hydrological depth and humidity metrics to ensure that cooling today doesn’t become a moisture-driven heat stress event tomorrow [57,92].
5. Limitation
Despite the systematic approach adopted in this review, several limitations should be acknowledged. First, a geographical bias exists in the literature base. Although the Web of Science Core Collection provides high-quality and standardized bibliographic data, the studies ultimately included are predominantly from China, with additional contributions from a limited number of European and North American countries. As a result, climatic conditions and urban development patterns characteristic of arid, tropical, and rapidly urbanizing regions in the Global South remain underrepresented. This imbalance may constrain the global generalizability of the synthesized conclusions.
Second, existing empirical evidence relies heavily on LST derived from remote sensing or near-surface air temperature measured at fixed meteorological stations. While these indicators are essential for evaluating urban thermal environments, they provide limited insight into human-perceived heat stress and outdoor thermal comfort. The insufficient incorporation of comprehensive thermal indices, such as those integrating humidity, radiation, wind, and human activity, restricts a more nuanced assessment of the social and health-related benefits of urban blue spaces.
Future research should therefore prioritize empirical studies in underrepresented climatic regions, particularly arid and tropical cities, to test and refine the applicability of current theoretical frameworks. Moreover, to maximize the effectiveness of blue–green infrastructure in climate adaptation, future investigations should move beyond single-temperature metrics and adopt multi-objective, human-centered evaluation approaches that integrate thermal comfort, health outcomes, and social equity considerations.
6. Conclusions
Through a systematic bibliometric analysis and comprehensive literature review, this study elucidates the complex and context-dependent mechanisms through which urban blue spaces contribute to the mitigation of the urban heat island effect. The key findings can be synthesized into three interrelated dimensions.
First, the thermal regulation effects of urban blue spaces exhibit pronounced spatiotemporal dynamics. A consistent pattern of daytime cooling and nighttime warming, coupled with strong summer and weak winter performance, emerges across diverse climatic and urban contexts. During summer daytime, intense evaporative cooling enables blue spaces to function as highly effective natural coolers. In contrast, nocturnal heat release and moisture trapping may locally reduce thermal comfort, particularly under hot and humid conditions, highlighting a critical diurnal paradox. These findings demonstrate that blue spaces are not constant cooling sources and must be evaluated within a dynamic framework that accounts for diurnal and seasonal variability.
Second, the morphological characteristics of blue spaces constitute critical design variables shaping their cooling efficiency. Cooling intensity and spatial influence generally increase with water body size, yet a non-linear threshold effect is evident beyond which marginal benefits diminish. Large water bodies strategically located upwind of urban heat cores, and capable of inducing local circulations such as lake or river breezes, exhibit the most extensive cooling diffusion. In addition, water body shape and shoreline complexity modulate edge effects and airflow organization, producing multi-scale impacts on both near-field cooling and long-distance cooling transport. These morphological attributes are closely intertwined with hydrological conditions, such as depth and water-source sustainability, which together determine the stability and effectiveness of thermal regulation.
Third, the effectiveness of blue spaces is fundamentally conditioned by their interactions with building morphology (gray infrastructure) and green infrastructure. High-density and high-rise built environments can severely obstruct the advective transport of cool, moist air, thereby limiting cooling benefits. Conversely, the integrated planning of blue and green spaces, particularly in combination with tree canopies, enhances latent heat flux through coupled evaporation and transpiration processes, while simultaneously improving shading, ventilation, and microclimatic comfort. Importantly, this synergistic effect exhibits strong context dependence, varying with neighborhood morphology, road networks, and specific density thresholds. These findings underscore the necessity of shifting from an isolated “cooling supply” perspective toward a demand-based planning paradigm that emphasizes precise spatial matching between cooling provision and socio-thermal demand.
While a substantial portion of our dataset is anchored in Chinese case studies, the underlying morphological principles are not geographically trapped. By shifting the focus from location to climatic analogy, these mechanisms offer a scalable framework for global application. In practice, the operational strategies derived from China’s high-density, humid subtropical cities (e.g., the Pearl River Delta) provide a direct blueprint for regions facing similar thermal challenges, such as the Southeastern United States or the Po Valley in Northern Italy. In these contexts, the priority remains the same: maximizing the penetration of water-land breezes through the urban fabric. Similarly, insights from China’s temperate and semi-arid regions can be recalibrated for urban centers across North America and Eurasia. By decoupling physical “location” from “climatic behavior,” these findings serve as a robust foundation for climate-resilient design, enabling practitioners to translate site-specific data into globally informed planning interventions.
In summary, urban blue spaces represent indispensable natural infrastructure for climate-resilient cities. Their effective utilization requires moving beyond the simplistic assumption that “water equals cooling” and embracing a dynamic, systemic, synergistic, and equity-oriented planning philosophy. Only through the scientific optimization of multi-scale blue-space morphology and the integrated design of blue–green–gray infrastructure systems with specific operational parameters can the full cooling potential of urban water environments be realized, thereby fostering healthier, more sustainable, and climate-adaptive urban living environments.
Supplementary Materials
The following supporting information can be downloaded at https://www.mdpi.com/article/10.3390/buildings16040834/s1, The PRISMA 2020 checklist.
Author Contributions
Conceptualization, methodology, investigation, J.L.; conceptualization, methodology, investigation and writing—original draft, J.L. and L.W.; investigation, writing—review and editing, J.L., L.W., X.X. and X.Z. All authors have read and agreed to the published version of the manuscript.
Funding
This project was supported by the Fund of Central South University (Grant No. 502901002).
Data Availability Statement
The data presented in this study are available on request from the corresponding author.
Conflicts of Interest
The authors declare no conflicts of interest.
Correction Statement
This article has been republished with a minor correction to resolve spelling and grammatical errors. This change does not affect the scientific content of the article.
Appendix A
Table A1.
All articles from the systematic review.
References
- Shen, P.; Zhao, S.; Ma, Y.; Liu, S. Urbanization-Induced Earth’s Surface Energy Alteration and Warming: A Global Spatiotemporal Analysis. Remote Sens. Environ. 2023, 284, 113361. [Google Scholar] [CrossRef] [Scilit]
- Oke, T.R. The Energetic Basis of the Urban Heat Island. Q. J. R. Meteorol. Soc. 1982, 108, 1–24. [Google Scholar] [CrossRef] [Scilit]
- Halder, B.; Bandyopadhyay, J.; Banik, P. Monitoring the Effect of Urban Development on Urban Heat Island Based on Remote Sensing and Geo-Spatial Approach in Kolkata and Adjacent Areas, India. Sustain. Cities Soc. 2021, 74, 103186. [Google Scholar] [CrossRef] [Scilit]
- Liu, S.; Wang, Y.; Liu, X.; Yang, L.; Zhang, Y.; He, J. How Does Future Climatic Uncertainty Affect Multi-Objective Building Energy Retrofit Decisions? Evidence from Residential Buildings in Subtropical Hong Kong. Sustain. Cities Soc. 2023, 92, 104482. [Google Scholar] [CrossRef] [Scilit]
- Turhan, C.; Atalay, A.S.; Gokcen Akkurt, G. An Integrated Decision-Making Framework for Mitigating the Impact of Urban Heat Islands on Energy Consumption and Thermal Comfort of Residential Buildings. Sustainability 2023, 15, 9674. [Google Scholar] [CrossRef] [Scilit]
- Ibrahim, A.J.; Zangana, D.D.; Liu, S.; Samuelson, H.; Yang, L. Impacts of Climate Change on Energy-Saving Sensitivity of Residential Building Envelope Design Parameters in Three Hot-Dry Cities. J. Build. Eng. 2025, 99, 111481. [Google Scholar] [CrossRef] [Scilit]
- McIntyre, A.M.; Scammell, M.K.; Botana Martinez, M.P.; Heidari, L.; Negassa, A.; Bongiovanni, R.; Fabian, M.P. Facilitators and Barriers for Keeping Cool in an Urban Heat Island: Perspectives from Residents of an Environmental Justice Community. Environ. Justice 2022, 16, 410–417. [Google Scholar] [CrossRef] [Scilit]
- Sharston, R.; Singh, M. The Role of Passive, Active, and Operational Parameters in the Relationship between Urban Heat Island Effect (UHI) and Building Energy Consumption. Energy Build. 2024, 323, 114720. [Google Scholar] [CrossRef] [Scilit]
- Farina, G.; Neverre, N.; Hérivaux, C.; Barriere, J.; Pinson, S.; Habarou, H.; Pereau, J.-C.; Le Coënt, P. How to Account for Spatial Trade-Offs in Planning for Urban Climate Adaptation? Optimizing Green and Grey Infrastructures. J. Environ. Manag. 2024, 372, 123380. [Google Scholar] [CrossRef] [Scilit]
- Hu, L.; Li, Q. Greenspace, Bluespace, and Their Interactive Influence on Urban Thermal Environments. Environ. Res. Lett. 2020, 15, 034041. [Google Scholar] [CrossRef] [Scilit]
- Marando, F.; Heris, M.P.; Zulian, G.; Udías, A.; Mentaschi, L.; Chrysoulakis, N.; Parastatidis, D.; Maes, J. Urban Heat Island Mitigation by Green Infrastructure in European Functional Urban Areas. Sustain. Cities Soc. 2022, 77, 103564. [Google Scholar] [CrossRef] [Scilit]
- Antoszewski, P.; Świerk, D.; Krzyżaniak, M. Statistical Review of Quality Parameters of Blue-Green Infrastructure Elements Important in Mitigating the Effect of the Urban Heat Island in the Temperate Climate (C) Zone. Int. J. Environ. Res. Public Health 2020, 17, 7093. [Google Scholar] [CrossRef] [Scilit]
- Gupta, K.; Ghale, B.; Sarath, R.; Kaur, R.; Roy, A. Understanding the Role of Blue-Green Infrastructure in Abatement of Urban Heat Island Effect. In Blue-Green Infrastructure for Sustainable Urban Settlements; Joshi, P.K., Rao, K.S., Bhadouria, R., Tripathi, S., Singh, R., Eds.; Springer: Cham, Switzerland, 2024; pp. 83–109. ISBN 978-3-031-62292-2. [Google Scholar]
- Fricke, L.; Legg, R.; Kabisch, N. Impact of Blue Spaces on the Urban Microclimate in Different Climate Zones, Daytimes and Seasons—A Systematic Review. Urban For. Urban Green. 2024, 101, 128528. [Google Scholar] [CrossRef] [Scilit]
- Chen, H.; Jeanne Huang, J.; Li, H.; Wei, Y.; Zhu, X. Revealing the Response of Urban Heat Island Effect to Water Body Evaporation from Main Urban and Suburb Areas. J. Hydrol. 2023, 623, 129687. [Google Scholar] [CrossRef] [Scilit]
- Ampatzidis, P.; Kershaw, T. A Review of the Impact of Blue Space on the Urban Microclimate. Sci. Total Environ. 2020, 730, 139068. [Google Scholar] [CrossRef] [Scilit]
- Zeng, W.; Yang, K.; Zhang, S.; Bi, C.; Liu, J.; Yang, X.; Rao, Y.; Ma, Y. Configuration of Green–Blue–Grey Spaces for Efficient Cooling of Urban Physical and Perceptual Thermal Environments. Land 2025, 14, 645. [Google Scholar] [CrossRef] [Scilit]
- Balany, F.; Muttil, N.; Muthukumaran, S.; Wong, M.S.; Ng, A.W.M. Studying the Effect of Blue-Green Infrastructure on Microclimate and Human Thermal Comfort in Melbourne’s Central Business District. Sustainability 2022, 14, 9057. [Google Scholar] [CrossRef] [Scilit]
- Chen, X.; Wang, H.; Yang, J. Effect of Green Blue Spaces on the Urban Thermal Environment: A Field Study in Hong Kong. Urban Clim. 2024, 55, 101912. [Google Scholar] [CrossRef] [Scilit]
- Wang, M.; Song, H.; Zhu, W.; Wang, Y. The Cooling Effects of Landscape Configurations of Green–Blue Spaces in Urban Waterfront Community. Atmosphere 2023, 14, 833. [Google Scholar] [CrossRef] [Scilit]
- Jacobs, C.; Klok, L.; Bruse, M.; Cortesão, J.; Lenzholzer, S.; Kluck, J. Are Urban Water Bodies Really Cooling? Urban Clim. 2020, 32, 100607. [Google Scholar] [CrossRef] [Scilit]
- Liu, S.; Cai, M.; Ren, C.; Chen, G.; Nielsen, C.P.; Samuelson, H. Urban Heat Island Impacts on Cooling Energy Demand of Residential Buildings at the City Scale: A Case Study of Hong Kong. Energy 2025, 332, 137165. [Google Scholar] [CrossRef] [Scilit]
- Cai, Z.; Han, G.; Chen, M. Do Water Bodies Play an Important Role in the Relationship between Urban Form and Land Surface Temperature? Sustain. Cities Soc. 2018, 39, 487–498. [Google Scholar] [CrossRef] [Scilit]
- Yang, S.J.; Ran, G.P.; Zhang, W.; Wang, Z.H. The cooling effect of an urban lake landscape on the urban heat island: A case study in Jinan, China. Appl. Ecol. Environ. Res. 2020, 18, 2197–2211. [Google Scholar] [CrossRef] [Scilit]
- Solcerova, A. Nighttime Cooling of an Urban Pond. Front. Earth Sci. 2019, 7, 156. [Google Scholar] [CrossRef] [Scilit]
- Zhang, L.; Meng, Q.; Yao, S.; Qian, J.; Gao, J.; Wu, J. How to Optimize Urban Blue Space to Maximize Its Cooling Benefits? A Case Study in Megacity of Beijing. Build. Environ. 2025, 270, 112502. [Google Scholar] [CrossRef] [Scilit]
- Marzi, G.; Balzano, M.; Caputo, A.; Pellegrini, M.M. Guidelines for Bibliometric-Systematic Literature Reviews: 10 Steps to Combine Analysis, Synthesis and Theory Development. Int. J. Manag. Rev. 2025, 27, 81–103. [Google Scholar] [CrossRef] [Scilit]
- Ding, X.; Yang, Z. Knowledge Mapping of Platform Research: A Visual Analysis Using VOSviewer and CiteSpace. Electron. Commer. Res. 2022, 22, 787–809. [Google Scholar] [CrossRef] [Scilit]
- Merigó, J.M.; Yang, J.-B. A Bibliometric Analysis of Operations Research and Management Science. Omega 2017, 73, 37–48. [Google Scholar] [CrossRef] [Scilit]
- Jing, Y.; Wang, C.; Chen, Y.; Wang, H.; Yu, T.; Shadiev, R. Bibliometric Mapping Techniques in Educational Technology Research: A Systematic Literature Review. Educ. Inf. Technol. 2024, 29, 9283–9311. [Google Scholar] [CrossRef] [Scilit]
- Lan, Y.; Liu, Z.; Zheng, J.; Tang, Y. Advances in Research on the Impact of Urban Blue-Green Landscape Patterns on Heat Island Effects: A Systematic Literature Review. Environ. Monit. Assess. 2025, 197, 985. [Google Scholar] [CrossRef] [Scilit] [PubMed]
- Page, M.J.; McKenzie, J.E.; Bossuyt, P.M.; Boutron, I.; Hoffmann, T.C.; Mulrow, C.D.; Shamseer, L.; Tetzlaff, J.M.; Akl, E.A.; Brennan, S.E.; et al. The PRISMA 2020 Statement: An Updated Guideline for Reporting Systematic Reviews. BMJ 2021, 372, n71. [Google Scholar] [CrossRef] [Scilit]
- Page, M.J.; Moher, D.; Bossuyt, P.M.; Boutron, I.; Hoffmann, T.C.; Mulrow, C.D.; Shamseer, L.; Tetzlaff, J.M.; Akl, E.A.; Brennan, S.E.; et al. PRISMA 2020 Explanation and Elaboration: Updated Guidance and Exemplars for Reporting Systematic Reviews. BMJ 2021, 372, n160. [Google Scholar] [CrossRef]
- Eggermont, H.; Balian, E.; Azevedo, J.M.N.; Beumer, V.; Brodin, T.; Claudet, J.; Fady, B.; Grube, M.; Keune, H.; Lamarque, P.; et al. Nature-Based Solutions: New Influence for Environmental Management and Research in Europe. GAIA—Ecol. Perspect. Sci. Soc. 2015, 24, 243–248. [Google Scholar] [CrossRef] [Scilit]
- De Rijke, C.A.; Lim, N.J.; Iqbal, A.; Brandt, S.A.; Sahlin, E.A.U. A Systematic Review of Blue-Green Infrastructure’s Role and Relevance in the Mitigation and Management of Climate-Induced Hazards in x-Minute Cities. Plan. Pract. Res. 2025, 1–29. [Google Scholar] [CrossRef] [Scilit]
- Pyhältö, K.; Tikkanen, L.; Anttila, H. The Influence of the COVID-19 Pandemic on PhD Candidates’ Study Progress and Study Wellbeing. High. Educ. Res. Dev. 2023, 42, 413–426. [Google Scholar] [CrossRef] [Scilit]
- Myers, K.R.; Tham, W.Y.; Yin, Y.; Cohodes, N.; Thursby, J.G.; Thursby, M.C.; Schiffer, P.; Walsh, J.T.; Lakhani, K.R.; Wang, D. Unequal Effects of the COVID-19 Pandemic on Scientists. Nat. Hum. Behav. 2020, 4, 880–883. [Google Scholar] [CrossRef] [Scilit] [PubMed]
- de Solla Price, D.J. Little Science, Big Science; Columbia University Press: New York, NY, USA, 1963. [Google Scholar]
- Zhang, J.; Xie, J.; Hou, W.; Tu, X.; Xu, J.; Song, F.; Wang, Z.; Lu, Z. Mapping the Knowledge Structure of Research on Patient Adherence: Knowledge Domain Visualization Based Co-Word Analysis and Social Network Analysis. PLoS ONE 2012, 7, e34497. [Google Scholar] [CrossRef] [Scilit]
- Sökmen, E.D.; Eminel Kutay, M. Assessing the Cooling Effects of Narrow Urban Rivers: A Spatial Analysis of the Porsuk River. Environ. Monit. Assess. 2025, 197, 800. [Google Scholar] [CrossRef] [Scilit] [PubMed]
- Wu, C.; Li, J.; Wang, C.; Song, C.; Chen, Y.; Finka, M.; La Rosa, D. Understanding the Relationship between Urban Blue Infrastructure and Land Surface Temperature. Sci. Total Environ. 2019, 694, 133742. [Google Scholar] [CrossRef] [Scilit]
- Liu, L.; Xia, B.; Zhang, L. Outdoor Thermal Comfort of Urban River Landscape Belt in China’s Cold Region: A Case Study of Xi’an. Urban Clim. 2023, 48, 101406. [Google Scholar] [CrossRef] [Scilit]
- Yao, R.; Luo, Q.; Luo, Z.; Jiang, L.; Yang, Y. An Integrated Study of Urban Microclimates in Chongqing, China: Historical Weather Data, Transverse Measurement and Numerical Simulation. Sustain. Cities Soc. 2015, 14, 187–199. [Google Scholar] [CrossRef] [Scilit]
- Abd-Elmabod, S.K.; Gui, D.; Liu, Q.; Liu, Y.; Al-Qthanin, R.N.; Jiménez-González, M.A.; Jones, L. Seasonal Environmental Cooling Benefits of Urban Green and Blue Spaces in Arid Regions. Sustain. Cities Soc. 2024, 115, 105805. [Google Scholar] [CrossRef] [Scilit]
- Wang, Y.; Ouyang, W.; Zhan, Q.; Zhang, L. The Cooling Effect of an Urban River and Its Interaction with the Littoral Built Environment in Mitigating Heat Stress: A Mobile Measurement Study. Sustainability 2022, 14, 11700. [Google Scholar] [CrossRef] [Scilit]
- Yao, L.; Sailor, D.J.; Yang, X.; Xu, G.; Zhao, L. Are Water Bodies Effective for Urban Heat Mitigation? Evidence from Field Studies of Urban Lakes in Two Humid Subtropical Cities. Build. Environ. 2023, 245, 110860. [Google Scholar] [CrossRef] [Scilit]
- Lee, L.S.H.; Jim, C.Y. Thermal and Humidification Effects of a Swimming Pool in Hong Kong’s Humid-Subtropical Summer. Sustain. Cities Soc. 2023, 98, 104816. [Google Scholar] [CrossRef] [Scilit]
- Gupta, A.; De, B. Blue Space Resilient Urban Planning to Enhance Severely Distressed Thermal Environment. Phys. Chem. Earth Parts ABC 2025, 137, 103804. [Google Scholar] [CrossRef] [Scilit]
- Nguyen, Q.; Thi, V.H. Influence of Pond System on Surface Temperature and Urban Cooling. Ecohydrology 2025, 18, e2760. [Google Scholar] [CrossRef] [Scilit]
- Wang, Y.; Sheng, S.; Huang, J.; Wang, Y. Effects of 2D/3D Urban Morphology on Cooling Effect Diffusion of Urban Rivers in Summer: A Case Study of Huangpu River in Shanghai. Land 2025, 14, 1498. [Google Scholar] [CrossRef] [Scilit]
- Cheng, Y.; Bartesaghi-Koc, C.; Tian, Y.; Shen, L.; Teng, M.; Liu, H.; Xiao, Z.; Zhang, B.; Wu, C. Where and How to Cool through Blue Infrastructure? Large Lake Groups to Ameliorate Urban Overheating in a Typical Inland Multi-Lake Megacity. Sustain. Cities Soc. 2023, 98, 104869. [Google Scholar] [CrossRef] [Scilit]
- Lin, X.; Cui, Y.; Hao, S.; Hong, H.; Zhang, M.; Zhang, J.; Li, R.; Liu, M. Quantitative Analysis of Lake-Cooling Effect in Hefei City, China, Based on Multispectral Remote Sensing and Its Response to Urban Expansion. Environ. Sci. Pollut. Res. 2022, 30, 12495–12507. [Google Scholar] [CrossRef] [Scilit] [PubMed]
- Shi, D.; Song, J.; Huang, J.; Zhuang, C.; Guo, R.; Gao, Y. Synergistic Cooling Effects (SCEs) of Urban Green-Blue Spaces on Local Thermal Environment: A Case Study in Chongqing, China. Sustain. Cities Soc. 2020, 55, 102065. [Google Scholar] [CrossRef] [Scilit]
- Fung, C.K.W.; Jim, C.Y. Influence of Blue Infrastructure on Lawn Thermal Microclimate in a Subtropical Green Space. Sustain. Cities Soc. 2020, 52, 101858. [Google Scholar] [CrossRef] [Scilit]
- Pan, H.; Luo, Y.; Zeng, L.; Shi, Y.; Hang, J.; Zhang, X.; Hua, J.; Zhao, B.; Gu, Z.; Buccolieri, R. Outdoor Thermal Environment Regulation of Urban Green and Blue Infrastructure on Various Types of Pedestrian Walkways. Atmosphere 2023, 14, 1037. [Google Scholar] [CrossRef] [Scilit]
- Marquez-Torres, A.; Kumar, S.; Aznarez, C.; Jenerette, G.D. Assessing the Cooling Potential of Green and Blue Infrastructure from Twelve US Cities with Contrasting Climate Conditions. Urban For. Urban Green. 2025, 104, 128660. [Google Scholar] [CrossRef] [Scilit]
- Wang, Y.; Ouyang, W.; Zhang, J. Matching Supply and Demand of Cooling Service Provided by Urban Green and Blue Space. Urban For. Urban Green. 2024, 96, 128338. [Google Scholar] [CrossRef] [Scilit]
- Zhang, L.; Shi, X.; Chang, Q. Exploring Adaptive UHI Mitigation Solutions by Spatial Heterogeneity of Land Surface Temperature and Its Relationship to Urban Morphology in Historical Downtown Blocks, Beijing. Land 2022, 11, 544. [Google Scholar] [CrossRef] [Scilit]
- Yan, L.; Jia, W.; Zhao, S. The Cooling Effect of Urban Green Spaces in Metacities: A Case Study of Beijing, China’s Capital. Remote Sens. 2021, 13, 4601. [Google Scholar] [CrossRef] [Scilit]
- Yao, L.; Sailor, D.J.; Zhang, X.; Wang, J.; Zhao, L.; Yang, X. Diurnal Pattern and Driving Mechanisms of the Thermal Effects of an Urban Pond. Sustain. Cities Soc. 2023, 91, 104407. [Google Scholar] [CrossRef] [Scilit]
- Brans, K.I.; Engelen, J.M.T.; Souffreau, C.; De Meester, L. Urban Hot-Tubs: Local Urbanization Has Profound Effects on Average and Extreme Temperatures in Ponds. Landsc. Urban Plan. 2018, 176, 22–29. [Google Scholar] [CrossRef] [Scilit]
- Chakraborty, T.; Wang, J.; Qian, Y.; Pringle, W.; Yang, Z.; Xue, P. Urban Versus Lake Impacts on Heat Stress and Its Disparities in a Shoreline City. GeoHealth 2023, 7, e2023GH000869. [Google Scholar] [CrossRef] [Scilit]
- Zhou, W.; Wu, T.; Tao, X. Exploring the Spatial and Seasonal Heterogeneity of Cooling Effect of an Urban River on a Landscape Scale. Sci. Rep. 2024, 14, 8327. [Google Scholar] [CrossRef] [Scilit]
- Das, M.; Das, A.; Saha, P.; Paul, S. Impact of Spatial Configuration of Urban Blue Spaces in Mitigating Temperature during Summer: A Remote Sensing and Field-Based Observation. Sustain. Cities Soc. 2025, 127, 106418. [Google Scholar] [CrossRef] [Scilit]
- Wang, J.; Qian, Y.; Pringle, W.; Chakraborty, T.C.; Hetland, R.; Yang, Z.; Xue, P. Contrasting Effects of Lake Breeze and Urbanization on Heat Stress in Chicago Metropolitan Area. Urban Clim. 2023, 48, 101429. [Google Scholar] [CrossRef] [Scilit]
- Park, C.Y.; Lee, D.K.; Asawa, T.; Murakami, A.; Kim, H.G.; Lee, M.K.; Lee, H.S. Influence of Urban Form on the Cooling Effect of a Small Urban River. Landsc. Urban Plan. 2019, 183, 26–35. [Google Scholar] [CrossRef] [Scilit]
- Yao, X.; Zhu, Z.; Zeng, X.; Huang, S.; Liu, Q.; Yu, K.; Zhou, X.; Chen, Z.; Liu, J. Linking Maximum-Impact and Cumulative-Impact Indices to Quantify the Cooling Effect of Waterbodies in a Subtropical City: A Seasonal Perspective. Sustain. Cities Soc. 2022, 82, 103902. [Google Scholar] [CrossRef] [Scilit]
- Cheng, L.; Guan, D.; Zhou, L.; Zhao, Z.; Zhou, J. Urban Cooling Island Effect of Main River on a Landscape Scale in Chongqing, China. Sustain. Cities Soc. 2019, 47, 101501. [Google Scholar] [CrossRef] [Scilit]
- Yao, G.; Li, H.; Wang, N.; Du, H.; Zhang, L.; Liu, C.; Chen, Y. Pattern of Cooling Benefits from Ecospaces during Urbanization: A Case Study of the Yangtze River Economic Belt. Sci. Total Environ. 2024, 932, 172974. [Google Scholar] [CrossRef] [Scilit]
- Geng, X.; Zhang, D.; Sun, W.; Yuan, Y.; Li, C.; Yu, Z. Heterogenous Impact of Background Meteorological Factors on the Cooling Effect of Two Types of Typical Urban Parks: Evidence from Shanghai, China. Build. Environ. 2024, 265, 112024. [Google Scholar] [CrossRef] [Scilit]
- Saha, B.; Ghosh, S.; Let, M.; Ghosh, R.; Pal, S.; Singha, P.; Debanshi, S. How Hydrological Components of Urban Blue Space Influence the Thermal Milieu? J. Environ. Manag. 2024, 359, 120959. [Google Scholar] [CrossRef] [Scilit]
- Deng, Z.; Zhao, H.; Li, L.; Liu, G.; Lin, H.; Devlin, A.T. The Climate Adaptive Characteristics of Urban inside/Outside Water Bodies Based on Their Cooling Effect in Poyang and Dongting Lake Regions, China. Heliyon 2023, 9, e15974. [Google Scholar] [CrossRef] [Scilit] [PubMed]
- Cheng, Y.; Zhao, W.; Nie, X.; Zheng, X.; Wu, C.; Ren, B.; Zhou, Y.; Liu, C.; Wang, X.; Yang, C. Enhancing or Restricting Natural Ventilation? An Investigation into the Influence of Urban-Lake Spatial Patterns on the Penetration of Lake Breeze Fronts in a Multi-Lake Megacity Inland Setting. Land 2025, 14, 1211. [Google Scholar] [CrossRef] [Scilit]
- Liu, Y.; Zeng, P.; Shi, D.; Wang, K. Spatiotemporal Effects of Lake-Land Breezes on the Microclimate of Lakefront Trees. Sustain. Cities Soc. 2025, 119, 106127. [Google Scholar] [CrossRef] [Scilit]
- Febrita, Y. Impact of Urban River Dynamics on Microclimate: Climatic Factors Along the Martapura River. Int. J. GEOMATE 2024, 27, 56–68. [Google Scholar] [CrossRef] [Scilit]
- Cheng, Y.; Shen, L.; Teng, M.; Liu, H.; Cheng, W.; Zhang, B.; Wu, C. How to Use Lake Breeze Circulations to Improve Urban Natural Ventilation: A Case Study in a Typical Inland Multi-Lake Megacity. Landsc. Urban Plan. 2023, 230, 104628. [Google Scholar] [CrossRef] [Scilit]
- Hu, Y.; Wang, C.; Li, J. Assessment of Heat Mitigation Services Provided by Blue and Green Spaces: An Application of the InVEST Urban Cooling Model with Scenario Analysis in Wuhan, China. Land 2023, 12, 963. [Google Scholar] [CrossRef] [Scilit]
- Zhang, L.; Wang, S.; Zhai, W.; He, Z.; Shi, W.; Li, Y.; Zhao, C. How Does Blue-Green Infrastructure Affect the Urban Thermal Environment across Various Functional Zones? Urban For. Urban Green. 2025, 105, 128698. [Google Scholar] [CrossRef] [Scilit]
- Xie, Q.; Ren, L.; Yang, C. Regulation of Water Bodies to Urban Thermal Environment: Evidence from Wuhan, China. Front. Ecol. Evol. 2023, 11, 983567. [Google Scholar] [CrossRef] [Scilit]
- Quan, S.; Li, M.; Li, T.; Liu, H.; Cui, Y.; Liu, M. Nonlinear Effects of Blue-Green Space Variables on Urban Cold Islands in Zhengzhou Analyzed with Random Forest Regression. Front. Ecol. Evol. 2023, 11, 1185249. [Google Scholar] [CrossRef] [Scilit]
- Shi, D.; Song, J.; Zhong, Q.; Myint, S.W.; Zeng, P.; Che, Y. Cooling Wisdom of ‘Water Towns’: How Urban River Networks Can Shape City Climate? Remote Sens. Environ. 2024, 300, 113925. [Google Scholar] [CrossRef] [Scilit]
- Cheval, S.; Popa, A.-M.; Șandric, I.; Iojă, I.-C. Exploratory Analysis of Cooling Effect of Urban Lakes on Land Surface Temperature in Bucharest (Romania) Using Landsat Imagery. Urban Clim. 2020, 34, 100696. [Google Scholar] [CrossRef] [Scilit]
- Zheng, Y.; Li, Y.; Hou, H.; Murayama, Y.; Wang, R.; Hu, T. Quantifying the Cooling Effect and Scale of Large Inner-City Lakes Based on Landscape Patterns: A Case Study of Hangzhou and Nanjing. Remote Sens. 2021, 13, 1526. [Google Scholar] [CrossRef] [Scilit]
- Guo, F.; Luo, M.; Zhang, C.; Cai, J.; Zhang, X.; Zhang, H.; Dong, J. The Mechanism of Street Spatial Form on Thermal Comfort from Urban Morphology and Human-Centered Perspectives: A Study Based on Multi-Source Data. Buildings 2024, 14, 3253. [Google Scholar] [CrossRef] [Scilit]
- He, M.; Yuan, C.; Zhang, X.; Wang, P.; Yao, C. Impacts of Green-Blue-Grey Infrastructures on High-Density Urban Thermal Environment at Multiple Spatial Scales: A Case Study in Wuhan. Urban Clim. 2023, 52, 101714. [Google Scholar] [CrossRef] [Scilit]
- Li, Y.; Xia, M.; Ma, Q.; Zhou, R.; Liu, D.; Huang, L. Identifying the Influencing Factors of Cooling Effect of Urban Blue Infrastructure Using the Geodetector Model. Remote Sens. 2022, 14, 5495. [Google Scholar] [CrossRef] [Scilit]
- Shi, D.; Song, J.; Huang, X.; Chan, P.W. Modelling and Optimization of Urban Green-Blue Infrastructure Design for City Cooling. Build. Environ. 2025, 279, 113096. [Google Scholar] [CrossRef] [Scilit]
- Sheng, S.; Wang, Y. Configuration Characteristics of Green-Blue Spaces for Efficient Cooling in Urban Environments. Sustain. Cities Soc. 2024, 100, 105040. [Google Scholar] [CrossRef] [Scilit]
- Pritipadmaja; Garg, R.D.; Sharma, A.K. Assessing the Cooling Effect of Blue-Green Spaces: Implications for Urban Heat Island Mitigation. Water 2023, 15, 2983. [Google Scholar] [CrossRef] [Scilit]
- Zhong, Q.; Song, J.; Wang, X.; Wang, H.; Shi, D.; Li, Y. Modeling of Urban Lake Breeze Circulation: Implications for the Mitigation of Urban Overheating. Urban Clim. 2025, 59, 102295. [Google Scholar] [CrossRef] [Scilit]
- Manavvi, S.; Milosevic, D. Chasing Cool: Unveiling the Influence of Green-Blue Features on Outdoor Thermal Environment in Roorkee (India). Build. Environ. 2025, 267, 112238. [Google Scholar] [CrossRef] [Scilit]
- Voskamp, I.M.; Van De Ven, F.H.M. Planning Support System for Climate Adaptation: Composing Effective Sets of Blue-Green Measures to Reduce Urban Vulnerability to Extreme Weather Events. Build. Environ. 2015, 83, 159–167. [Google Scholar] [CrossRef] [Scilit]

Disclaimer/Publisher’s Note: The statements, opinions and data contained in all publications are solely those of the individual author(s) and contributor(s) and not of MDPI and/or the editor(s). MDPI and/or the editor(s) disclaim responsibility for any injury to people or property resulting from any ideas, methods, instructions or products referred to in the content. |
© 2026 by the authors. Licensee MDPI, Basel, Switzerland. This article is an open access article distributed under the terms and conditions of the Creative Commons Attribution (CC BY) license.