


Abstract
Romania is highly exposed to seismic risk, with significant implications for residential earthquake insurance and risk-transfer mechanisms, due to the Vrancea intermediate-depth seismic source and a vulnerable building stock. This paper presents a harmonised seismic exposure model for the Romanian residential sector, developed to support probabilistic seismic risk assessment and catastrophe modelling for (re)insurance applications. The model integrates official data from the 2021 Population and Housing Census with the nationally adopted RTC-10 structural typology, height classification, seismic code level, and standardised reconstruction cost indicators. The results indicate that nearly 70% of residential dwellings were constructed before 1990 under pre-code or low- to moderate-code seismic design provisions. Although individual houses dominate the dwelling stock, multi-family apartment buildings concentrate approximately 40% of the total residential replacement cost, particularly in urban areas. The total replacement cost of the residential building stock is estimated at approximately EUR 709 billion, exceeding values derived from global exposure models. Comparison with existing insurance coverage highlights a substantial protection gap between potential seismic losses and insured values. The proposed exposure model provides a transparent, nationally calibrated basis for seismic loss estimation, portfolio accumulation analysis, and evidence-based risk management in both engineering and (re)insurance contexts.
1. Introduction
The assessment and modelling of seismic exposure of the residential building stock is a critical issue in Romania, given the high vulnerability of existing structures to intermediate-depth Vrancea earthquakes. Historical events, most notably the 1977 Mw 7.4 earthquake, caused severe human and economic losses, affecting more than 660,000 households [1,2] and generating damage estimated at approximately USD 2.05 billion (1977 value) [3]. A comparable event occurring today would likely result in losses of several tens of billions of euros, due to increased urban density and the aging condition of the building stock.
Beyond the national context, recent catastrophic earthquakes worldwide have demonstrated that seismic risk is not only an engineering problem but also a major driver of global financial instability [4]. Events such as the 2011 Mw 9.0 Tohoku earthquake and the 2010–2011 Christchurch earthquake sequence each produced insured losses exceeding USD 10 billion, according to the CATDAT database [5]. These events exposed the limited preparedness of both public and private risk-transfer systems. Despite high levels of seismic hazard, earthquake insurance penetration remains low in many regions, including Southern Europe, where coverage rates often fall below 10% [6]. At the same time, increasing economic interdependence has amplified the cascading impacts of major earthquakes, extending losses beyond direct structural damage to long-term business interruption and supply-chain disruption. These trends highlight the importance of high-resolution seismic exposure databases, which underpin probabilistic catastrophe (CAT) models and key financial risk metrics such as Expected Annual Loss (EAL) and Probable Maximum Loss (PML).
Exposure modelling represents a core component of seismic risk assessment, providing a quantitative description of the spatial distribution, typological characteristics, and economic value of the built environment potentially affected by earthquakes. Within established risk assessment frameworks, exposure constitutes a distinct modelling layer, defined independently of damage mechanisms, which are subsequently introduced through vulnerability and fragility functions [7,8]. This conceptual separation enhances transparency, reproducibility, and scalability, particularly in large-scale applications where detailed building-level data are unavailable. As a result, exposure models play a critical role not only in engineering-oriented risk analyses but also in insurance, reinsurance, and policy-focused applications.
Several widely used seismic risk assessment frameworks have implemented exposure modelling through standardized taxonomies and structured datasets, such as HAZUS, RISK-UE, and the Global Earthquake Model (GEM) [9,10,11]. However, global or generic exposure models often rely on simplified assumptions and default parameters that may not fully reflect national construction practices, historical building stocks, or local spatial distributions of assets. Recent literature therefore emphasizes the need for nationally calibrated exposure models that remain compatible with global taxonomies while incorporating census-based and locally representative information [7].
In this context, census-based exposure modelling has become a widely adopted approach for developing regional and national-scale exposure datasets. By integrating population and housing census data with geospatial information, such models allow systematic characterization of building stocks in terms of construction period, structural typology, height class, and occupancy, while maintaining consistency and scalability over large territories. On a national scale, exposure is commonly represented through aggregated building areas and average unit reconstruction costs, which provide a transparent and pragmatic basis for seismic risk analysis where detailed inventories are unavailable [12]. These approaches are extensively used in preliminary risk assessment and insurance-oriented studies [7,13].
More recent studies have proposed increasingly detailed, multiscale exposure frameworks that integrate component-level attributes and links to vulnerability and loss modelling, supporting advanced resilience and recovery analyses [14,15]. While methodologically advanced, such approaches typically require extensive building-level surveys and high-resolution data that are rarely available at national scale, limiting their applicability to small regions or specific infrastructure systems. This contrast highlights the persistent need for scalable, nationally consistent exposure models that balance data availability with modelling objectives.
For insurance and disaster risk financing applications, exposure modelling provides the basis for quantifying economic value at risk, assessing insurance penetration, and identifying protection gaps at regional and national scales [16]. At these scales, uncertainty in seismic risk estimates is typically dominated by vulnerability assumptions rather than by exposure definition [17,18,19,20].
In Romania, this need is especially pronounced. According to the 2021 Population and Housing Census [21]. Romania comprises approximately 9.9 million dwellings, nearly 70% of which were constructed before 1990, during periods characterised by limited or outdated seismic design requirements. Vulnerable typologies, particularly unreinforced masonry buildings and reinforced concrete frames designed prior to 1977, account for a substantial share of the residential stock and represent a dominant source of seismic exposure.
At the same time, the national natural disaster insurance system remains insufficient relative to the scale of seismic exposure. At the end of 2024, the Romanian Catastrophe Insurance Pool (PAID) reported approximately 2.34 million active policies [22], corresponding to a national penetration rate of only 24.01%. The aggregated insured replacement cost amounts to EUR 45.74 billion, while the estimated replacement cost of the entire residential building stock exceeds EUR 700 billion, revealing a substantial protection gap. PAID’s reinsurance capacity, approximately EUR 1.37 billion, represents only a small fraction of the losses expected from a major Vrancea earthquake.
Against this background, this study develops a harmonised seismic exposure model for the Romanian residential building stock, explicitly designed to support probabilistic seismic risk assessment and catastrophe modelling for (re)insurance applications. The proposed approach integrates official data from 2021 Population and Housing Census with the nationally adopted RTC-10 structural typology, height classification, seismic code-level proxies, and standardized reconstruction cost indicators. The main contributions of this work are threefold: (i) the development of a nationally calibrated exposure dataset; (ii) the harmonization of census-based information with engineering-relevant structural classifications and insurance-oriented valuation schemes; and (iii) the quantification of national-scale residential exposure and its implications for insurance penetration and protection gaps in Romania.
2. Seismic Exposure Assessment and Insurance Context
Probabilistic seismic risk analysis is commonly expressed as the convolution of hazard, exposure, and vulnerability, which together describe the loss-generation process. Within this framework, exposure characterises the quantity, spatial distribution, and attributes of buildings, population, and economic assets potentially affected by earthquakes. Accurate exposure modelling is therefore a prerequisite for reliable loss estimation and effective risk-mitigation strategies, particularly in regions with large concentrations of vulnerable structures.
The development of seismic exposure modelling has been shaped by a series of international frameworks addressing different geographic scales and methodological objectives. Early initiatives such as ATC-13 (1985) [23] and ATC-40 (1996) [24] provided some of the first structured approaches to linking building inventories with damage and performance assessment, establishing the conceptual basis for integrating exposure and vulnerability in seismic risk analysis. A major advance was achieved with the HAZUS methodology (1997) [9], which introduced a comprehensive GIS-based platform integrating standardised building typologies, exposure datasets, valuation procedures, and census information. Owing to its modular structure and transparency, HAZUS has been widely adapted beyond the United States and remains a key reference framework for exposure-based seismic risk modelling.
In Europe, the European Macroseismic Scale EMS-98 (1998) [25] established a harmonised set of building vulnerability classes that became a common reference for exposure mapping and damage assessment. Building on this foundation, the RISK-UE project (2001–2004) [10] developed a detailed typological matrix tailored to European construction practices and urban contexts, significantly advancing harmonised seismic risk assessment at the city scale. These developments are particularly relevant for countries such as Romania, where building stocks differ substantially from those assumed in U.S.-based models.
Subsequent initiatives focused on operational implementation and methodological extension. The SELENA project (2006–2013) [26] implemented HAZUS and RISK-UE methodologies within an open-source environment supporting scenario-based and probabilistic loss assessment, while the SYNER-G project (2009–2012) [27] further expanded European building taxonomies to include lifelines and critical infrastructure, enabling integrated, multi-asset risk analyses.
At the global scale, the Global Earthquake Model (GEM) initiative [11] established open standards for seismic risk assessment and developed the Global Exposure Database (GED4GEM), providing a unified building taxonomy and globally consistent exposure datasets. Through its implementation in the OpenQuake engine, GEM has become a widely adopted reference platform for probabilistic seismic risk analysis. Complementary systems such as the USGS PAGER system [28] and the CAPRA platform [29] further illustrate the central role of exposure inventories in disaster risk reduction and insurance applications. The principal characteristics of the main exposure frameworks discussed above are summarised in Table 1.
Table 1.
Key frameworks for seismic exposure.
Together, these frameworks form the methodological foundation of modern earthquake catastrophe (CAT) models used by insurers and reinsurers. Such models rely on exposure data to compute key financial risk metrics, including Expected Annual Loss (EAL) and Probable Maximum Loss (PML), which are essential for portfolio management, solvency assessment, and reinsurance design.
3. Methodology
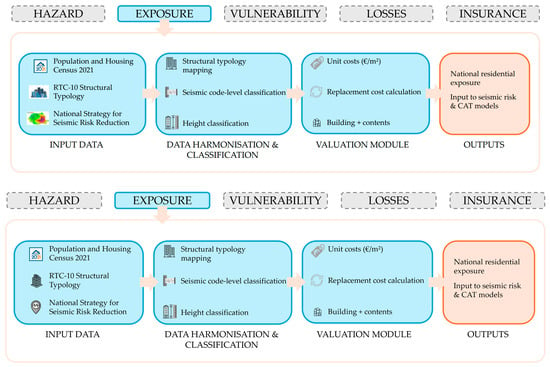
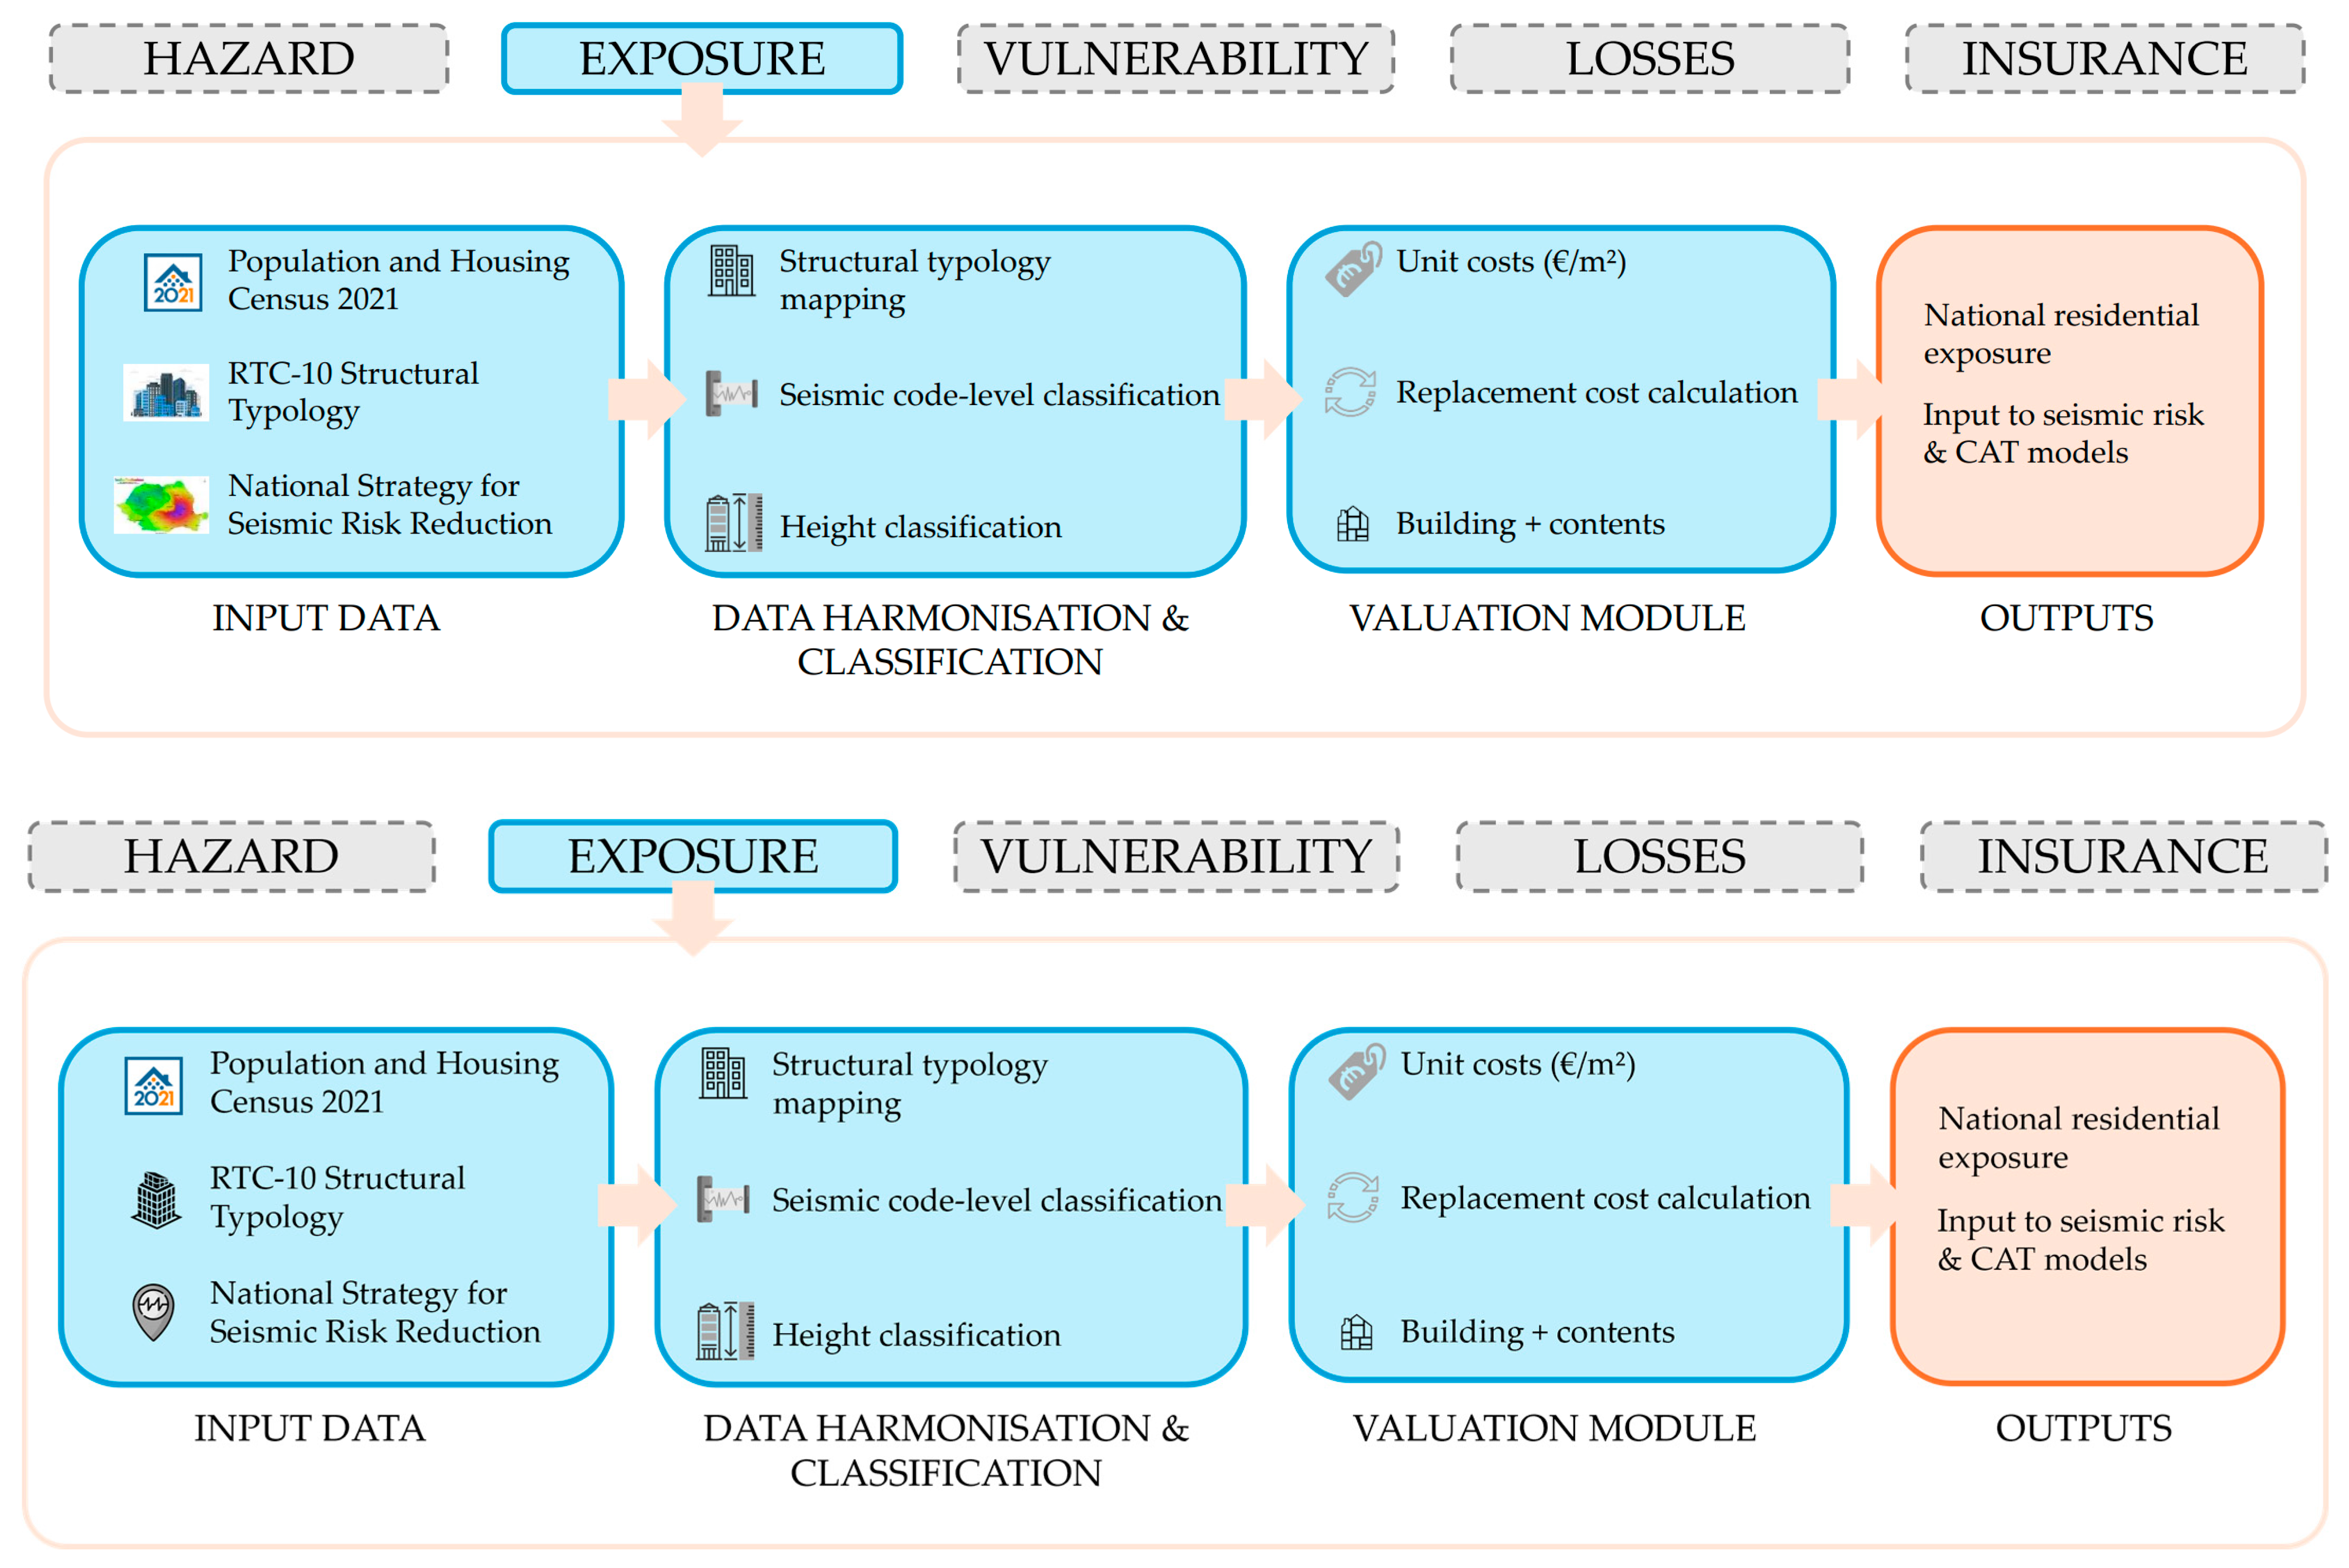
This study develops a harmonised seismic exposure model for the Romanian residential building stock for engineering loss assessment and (re)insurance applications. The methodology integrates official statistical datasets, a nationally adopted structural typology, and a standardised valuation framework. The entire workflow comprises four main stages: (i) data acquisition, (ii) structural classification, (iii) assignment of height and code-level categories, and (iv) computation of exposure metrics. This three-dimensional taxonomy provides a direct mapping between census-based exposure data and vulnerability functions. It also ensures that Romanian datasets remain interoperable with international CAT platforms used in (re)insurance. Figure 1 illustrates the methodological framework:
Figure 1.
Schematic methodological framework of the census-based seismic exposure model.
3.1. Data Sources
The primary dataset used in this study is the 2021 Population and Housing Census (RPL 2021), which provides nationally consistent and comprehensive information on the Romanian residential building stock. The census includes data on the number of residential buildings and dwellings, construction period (used as a proxy for seismic code level), structural material as reported by households, height regime, and dwelling floor area. These variables constitute the core attributes required for large-scale seismic exposure modelling.
To ensure structural and economic consistency with engineering and insurance applications, the census data were complemented with additional national datasets. Structural classification was performed using the RTC-10 Rapid Visual Assessment methodology [30], which provides the officially adopted structural typology for seismic screening in Romania. Economic valuation was based on nationally standardised reconstruction cost indicators, ensuring compatibility with loss estimation and investment planning practices. All monetary values were adjusted using the Harmonised Index of Consumer Prices (HICP) to express results in constant prices.
Unit replacement costs were not assumed but derived from the official reconstruction cost indicators published in the National Strategy for Seismic Risk Reduction [31]. These indicators represent the nationally harmonised reference for estimating residential building replacement costs and provide a transparent and reproducible valuation basis.
The integration of census data with national typology and valuation frameworks ensures full national representativeness while maintaining interoperability with modern probabilistic seismic risk and catastrophe (CAT) modelling platforms.
The resulting exposure dataset comprises approximately 5.5 million residential buildings and 9.9 million dwellings at national scale. For each dwelling class, the dataset includes aggregated information on settlement type (urban/rural), construction period, structural typology, number of storeys, total floor area, and associated replacement costs. A summary of the aggregated exposure data used for valuation is presented in Section 4.
3.2. Structural Typology
Structural typology represents a key component of seismic exposure modelling, as it governs the expected seismic performance of buildings and their associated vulnerability. In this study, the structural typology of residential buildings was assigned using the RTC-10 Rapid Visual Assessment methodology, which constitutes the official taxonomy adopted in Romania for seismic risk screening.
RTC-10 classifies buildings according to structural material, lateral load-resisting system, and construction characteristics, providing a consistent basis for estimating seismic behaviour at large scale. However, the structural categories used in the 2021 census do not fully coincide with the RTC-10 typology. To address this discrepancy, an explicit mapping between census-reported construction materials and RTC-10 structural classes was developed and is presented in Table 2.
Table 2.
Structural typologies adopted in the exposure model.
This harmonisation enables census-based exposure data to be translated into engineering-relevant typologies suitable for vulnerability and fragility modelling. The resulting classification preserves the dominant structural characteristics of the Romanian residential building stock while ensuring compatibility with both national seismic assessment practice and international exposure modelling frameworks used in probabilistic risk and insurance applications. The mapping does not resolve differences in structural detailing or local retrofit interventions, which are not captured in the census data, and therefore remains appropriate for national-scale exposure modelling rather than building-specific assessment.
3.3. Height Classification
In Romania, the height regime of buildings is a key factor in seismic exposure modelling, alongside structural material and construction period. Current methodologies (Hazus, Risk-UE) and seismic codes classify reinforced concrete as low-rise (1–3 storeys), mid-rise (4–7 storeys), and high-rise (≥8 storeys), while masonry and timber structures are considered low-rise (1–2 storeys), and mid-rise (3–5 storeys), as is shown in Table 3.
Table 3.
Building height regime classification in Romania.
This distinction is particularly relevant for the Romanian context. In Bucharest, the long predominant vibration period of the soil (≈1.4–1.6 s) coincides with the natural periods of mid- and high-rise buildings, explaining the severe collapses of 6 to 14 storey RC buildings during the 1940 and 1977 Vrancea earthquakes [32]. Today, nearly half of the city’s population still resides in such structures, many designed before the introduction of modern ductility rules in seismic codes. In contrast, cities like Timișoara or Iași are dominated by low- to mid-rise masonry buildings, often 2–5 storeys, which display different vulnerability patterns.
3.4. Construction Period and Seismic Code Level
The construction period of residential buildings provides an effective proxy for the seismic code level in force at the time of design. In Romania, seismic design regulations have evolved through a sequence of major revisions, each reflecting lessons learned from damaging earthquakes and advances in engineering practice. The evolution of Romanian seismic codes is presented in Table 4.
Table 4.
Evolution of Seismic Code Level in Romania.
To ensure compatibility with vulnerability and fragility modelling, the evolution of Romanian seismic codes was consolidated into five standard compulsory seismic code-level classes as in Table 5:
Table 5.
Harmonised seismic code-level classes adopted for census-based exposure modelling.
The definition of the five seismic code-level classes reflects a necessary harmonisation between the discrete milestones of Romanian seismic regulations and the decadal construction-period categories reported by the Population and Housing Census. As census data are aggregated in 10-year intervals, exact correspondence with the years of code enforcement is not possible. Consequently, the boundaries of the code-level classes were aligned with the closest census intervals to preserve national consistency of exposure reporting. This approximation does not affect the valuation of exposure and introduces only limited uncertainty in subsequent vulnerability-based loss modelling.
Each dwelling in the exposure dataset was assigned a seismic code-level class based on its reported construction period. This classification enables consistent linkage between exposure data and vulnerability or fragility functions commonly used in probabilistic seismic risk assessment and catastrophe modelling.
The 2021 Population and Housing Census includes a limited category of residential buildings for which the construction period could not be reliably identified. This “missing information” category reflects reporting uncertainty rather than incomplete asset definition. For these buildings, key exposure attributes—such as structural material, dwelling count, and floor area—remain fully specified. Consequently, the missing information affects only the assignment of seismic code level and number of storeys, which does not compromise the identification or valuation of exposed assets.
In the proposed exposure model, differences among seismic code-level classes do not affect the assignment of replacement costs. All buildings are valued using standardized reconstruction cost indicators, while seismic code level is retained exclusively as an exposure attribute intended for subsequent vulnerability and loss modelling.
3.5. Integration of Exposure Data for Insurance and Reinsurance Applications
Although primarily developed for engineering seismic risk assessment, the exposure dataset was structured to ensure full compatibility with insurance and reinsurance catastrophe (CAT) modelling frameworks. In probabilistic loss modelling, exposure represents the foundational input layer for computing financial risk metrics and simulating portfolio losses under stochastic hazard scenarios.
To support these applications, each exposure entry in the dataset includes a consistent set of attributes required by CAT models: structural typology, height class, seismic code level, and replacement cost.
The exposure model was designed to be interoperable with existing CAT modelling platforms used by insurers and reinsurers. As a result, it can be directly applied to the calculation of key financial metrics such as Expected Annual Loss (EAL) and Probable Maximum Loss (PML), as well as to portfolio accumulation analysis and reinsurance programme design. Consequently, the proposed exposure model serves not only engineering objectives but also operational financial risk-transfer needs.
The exposure valuation framework distinguishes explicitly between building replacement cost and contents value, as detailed in Section 3.6.
3.6. Replacement Cost of the Residential Building Stock
The economic exposure of the residential building stock is quantified in terms of replacement cost, defined as the cost required to reconstruct damaged buildings to their pre-event condition. Replacement cost is adopted instead of market value, as it provides a consistent and insurance-oriented representation of the economic assets at risk.
The Population and Housing Census provides aggregated information on the floor area of dwellings expressed as “room area”. Since this quantity does not fully represent the total usable or gross floor area required for construction cost estimation, census room area is converted using typology-dependent conversion factors. Specifically, separate conversion factors are adopted for single-family dwellings (individual houses, duplexes, and terraced houses) and for multifamily dwellings (apartment blocks), in order to account for differences in internal layouts and common spaces. The reference floor area used for valuation is therefore computed as:
where is the aggregated census room area for dwelling type and settlement type (urban or rural), is a conversion factor (1.20 for single-family dwellings and 1.15 for multifamily dwellings), and represents the estimated reference floor area used for replacement valuation. The values of are selected in line with common practice in exposure modelling, accounting for differences between reference room area and usable floor area in residential buildings.
Unit reconstruction costs are assigned according to dwelling class and settlement type, following the nationally standardised cost indicators reported in [31]. Both unifamilial dwellings (individual houses, duplexes, and terraced houses) and multifamily dwellings (apartment blocks) are differentiated between rural and urban areas. For apartment blocks, unit costs are further differentiated by height class using the number of storeys reported in Table 6, distinguishing low-to-mid-rise buildings (≤6 storeys) from mid-to-high-rise buildings (>6 storeys). All unit costs reported in [31] are provided excluding VAT and are updated to the reference year using the Harmonised Index of Consumer Prices (HICP) [33]. Subsequently, replacement costs including VAT are computed to reflect the actual expenditure required for post-event reconstruction in insurance-oriented applications.
where denotes the unit reconstruction cost associated with dwelling type , settlement type , and height class .
Table 6.
Unit reconstruction costs by dwelling class, settlement type and height class.
The unit costs are adjusted in the end with the Harmonised Index of Consumer Prices.
In addition to building reconstruction costs, the value of residential contents is also considered. A constant contents-to-building value ratio of α = 0.5 was adopted for all residential dwelling classes, consistent with indications of [31]. The total replacement cost of contents is therefore computed as:
where α denotes the constant contents-to-building ratio.
The total residential exposure is finally obtained as the sum of building and contents replacement costs:
The adopted valuation approach balances transparency, consistency, and scalability, while explicitly accounting for differences in dwelling type, settlement context, and building height. Although simplified with respect to detailed building-by-building appraisals, this methodology is appropriate for national-scale exposure modelling and provides a robust input layer for subsequent vulnerability, loss, and insurance analyses.
All exposure quantities are reported at national scale, aggregated by dwelling class and settlement type, in accordance with the resolution of the census input data. This valuation approach is consistent with the cost indicators adopted in National Strategy for Seismic Risk Reduction in Romania [31].
4. Results and Discussion
The results presented in this section describe the evolution, composition, and economic value of Romania’s residential building stock and discuss their implications for seismic exposure and insurance risk. The analysis is based on successive population and housing censuses and on the harmonised exposure model developed in this study.
4.1. Evolution of the Residential Building Stock
Table 7 summarises the evolution of key housing indicators in Romania between the 1977 and 2021 censuses. Over this period, the total number of residential buildings increased moderately, from approximately 4.7 million to 5.5 million, corresponding to a growth of about 17%. In contrast, the number of dwellings increased much more rapidly, reaching nearly 9.9 million units in 2021, an increase of approximately 55%.
Table 7.
Evolution of the building stock according to census.
An even stronger growth trend is observed in the total number of living rooms and in cumulative residential floor area, both of which more than doubled over the same period. This divergence reflects a structural transformation of the housing stock, characterised by increasing building height, higher dwelling density per building, and progressive urbanisation.
From a seismic exposure perspective, this transformation implies a growing concentration of population and economic value in multi-storey residential buildings. Such concentration increases the potential for correlated losses during strong earthquakes, particularly in urban areas affected by long-period ground motion.
4.2. Structural Composition and Distribution by Seismic Code Level
The structural composition of the residential building stock represents a fundamental component of seismic exposure, as it directly governs expected building performance and associated vulnerability during earthquakes. Based on the 2021 Population and Housing Census, Table 8 summarises the distribution of residential buildings by building type and structural material, providing an overview of the dominant construction practices across Romania. Beyond structural material and building type, the analysis also examines the distribution of residential dwellings across seismic code-level classes, which provides a direct proxy for the expected seismic performance of the building stock and supports subsequent vulnerability and loss modelling.
Table 8.
Residential buildings by building type and structural material.
The results indicate that Romania’s residential building stock is dominated by low-rise individual housing constructed using traditional materials. Timber and adobe structures account for more than one third of all residential buildings, predominantly in rural and peri-urban areas. Unreinforced masonry buildings, with both rigid and flexible floor systems, represent a further substantial share of the stock. Together, these building types form an extensive exposure characterised by dispersed spatial distribution, predominantly low-rise configurations, and comparatively lower unit replacement costs.
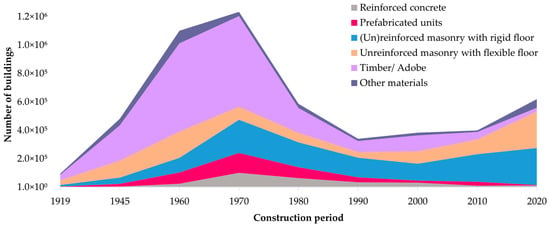
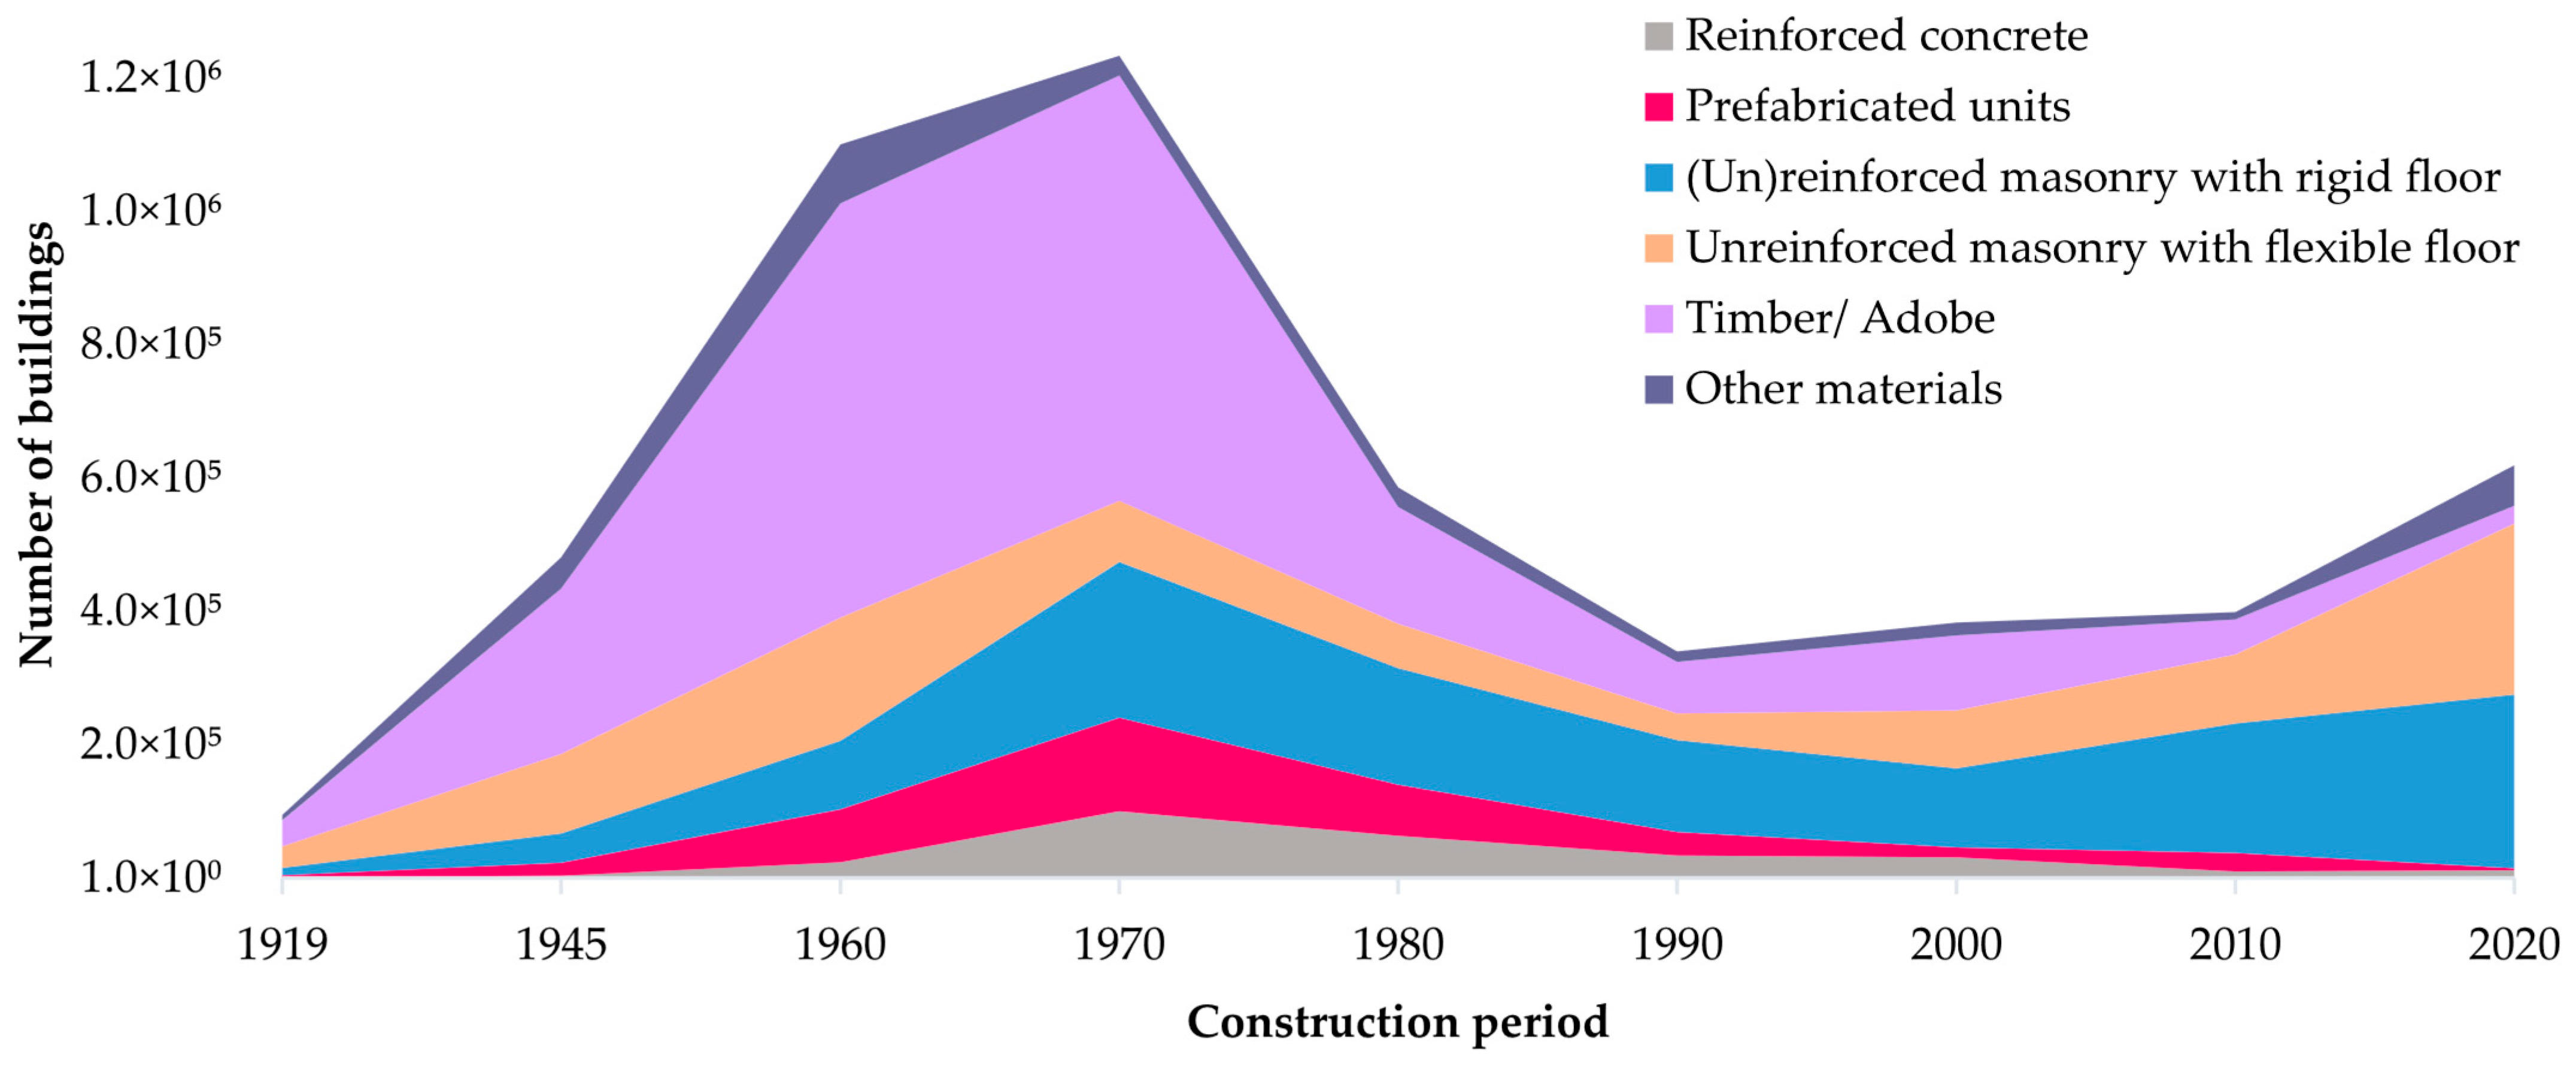
In contrast, reinforced concrete and prefabricated panel buildings constitute a relatively small fraction of the total number of residential buildings but play a disproportionate role in seismic exposure. These structures are primarily associated with apartment blocks located in urban areas and typically accommodate a large number of dwellings within individual buildings. Although dwelling counts are not explicitly quantified in Table 8, the higher occupancy density of apartment blocks substantially amplifies their contribution to potential human and economic losses, making them a dominant driver of seismic risk despite their limited numerical share in the building stock. The temporal evolution of structural materials and building types is illustrated in Figure 2 and Figure 3.
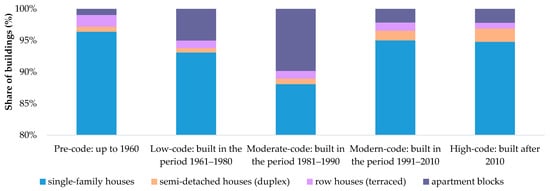
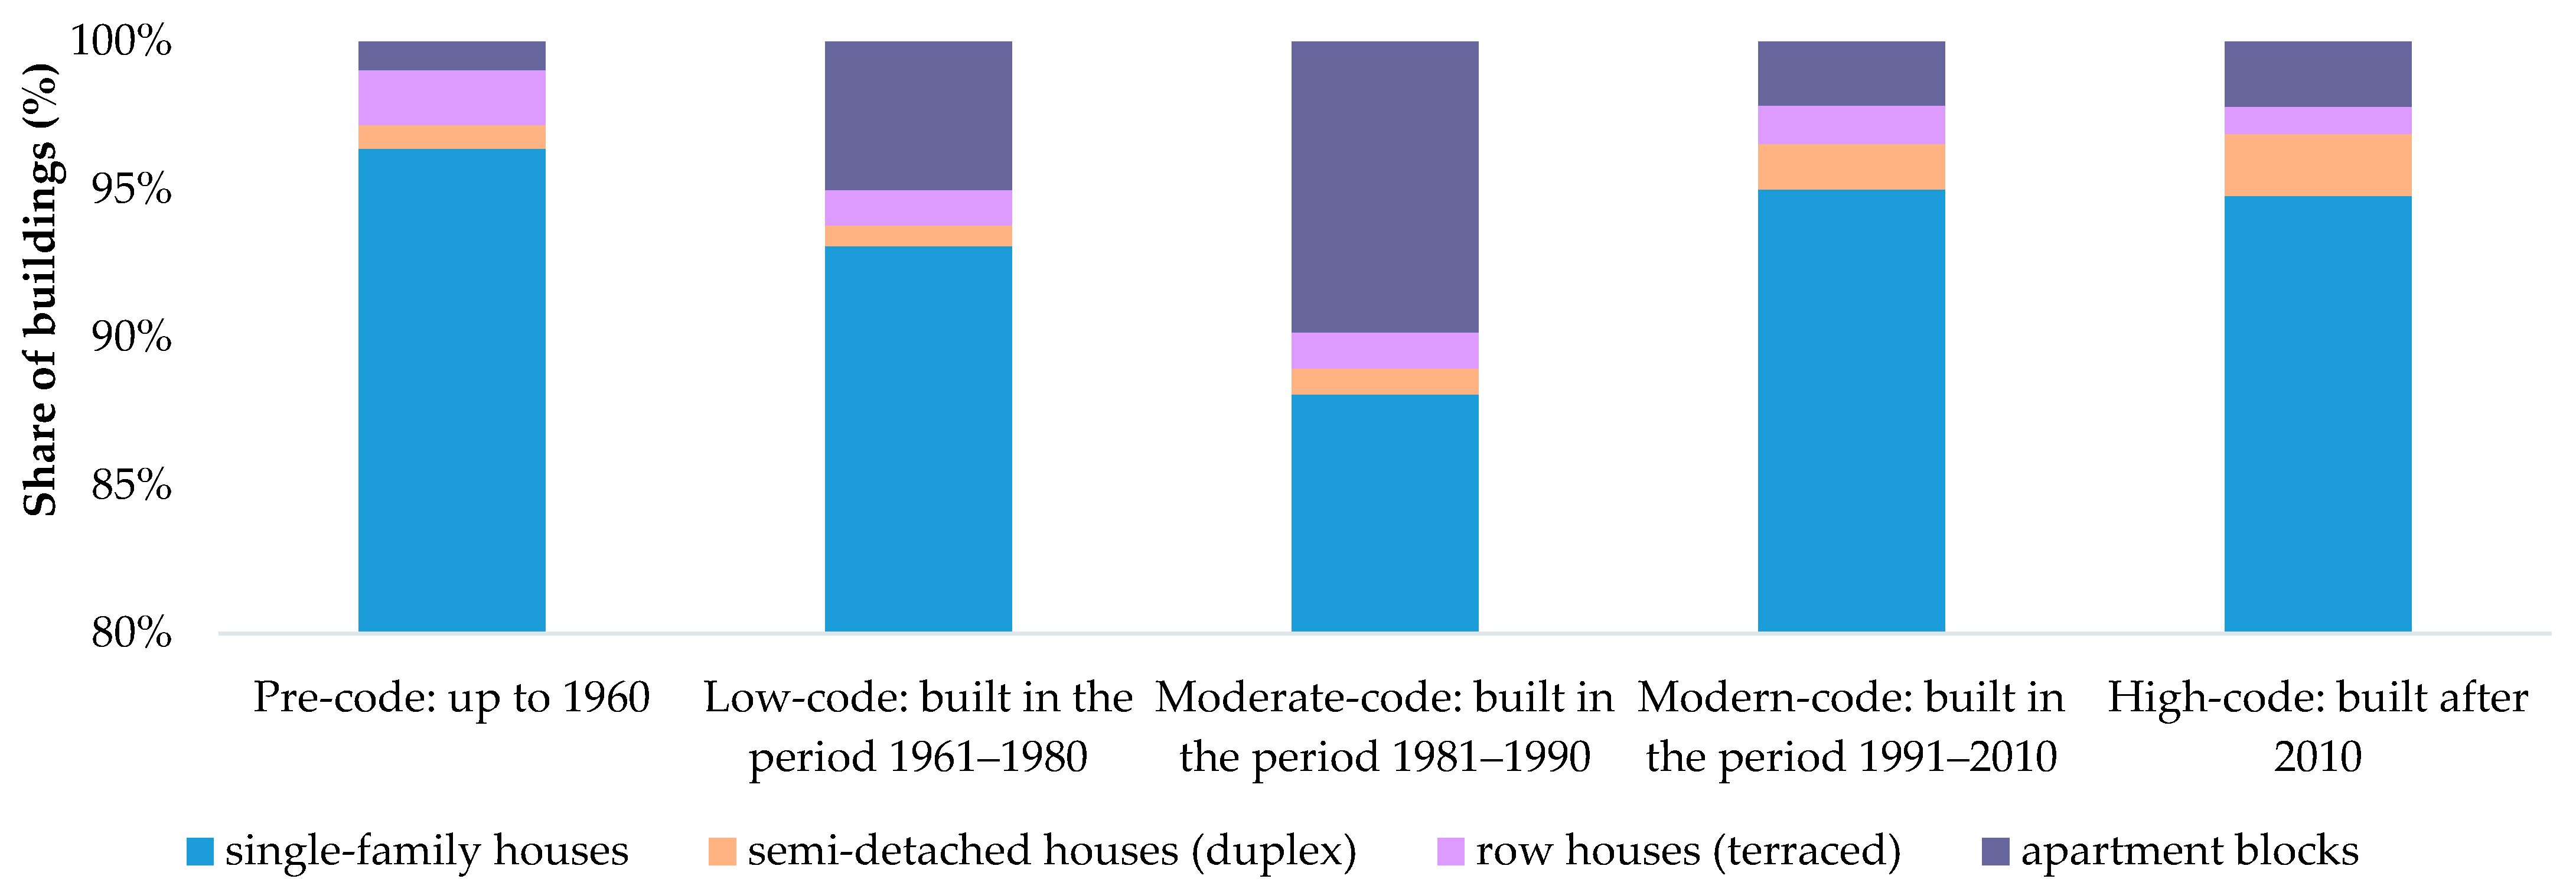
Figure 2.
Distribution of residential buildings by building type and seismic code level.
Figure 3.
Distribution of residential buildings by structural material and seismic code level.
Figure 2 presents the distribution of residential buildings by building type across seismic code-level classes, highlighting the rapid expansion of apartment block construction during the period of intensified urbanisation from the 1960s to the 1980s. Figure 3 shows the corresponding distribution by structural material and seismic code level, illustrating the transition from traditional masonry and timber systems toward prefabricated reinforced concrete technologies during the same period. Post–1990 construction exhibits increased material diversity compared to earlier phases, as reflected in the wider spread of structural systems shown in Figure 2 and Figure 3, although masonry-based solutions remain prevalent in low-rise residential developments.
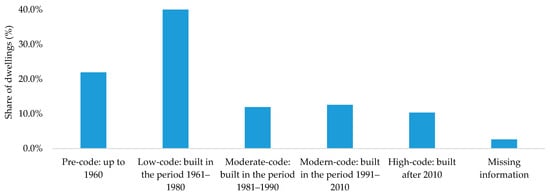
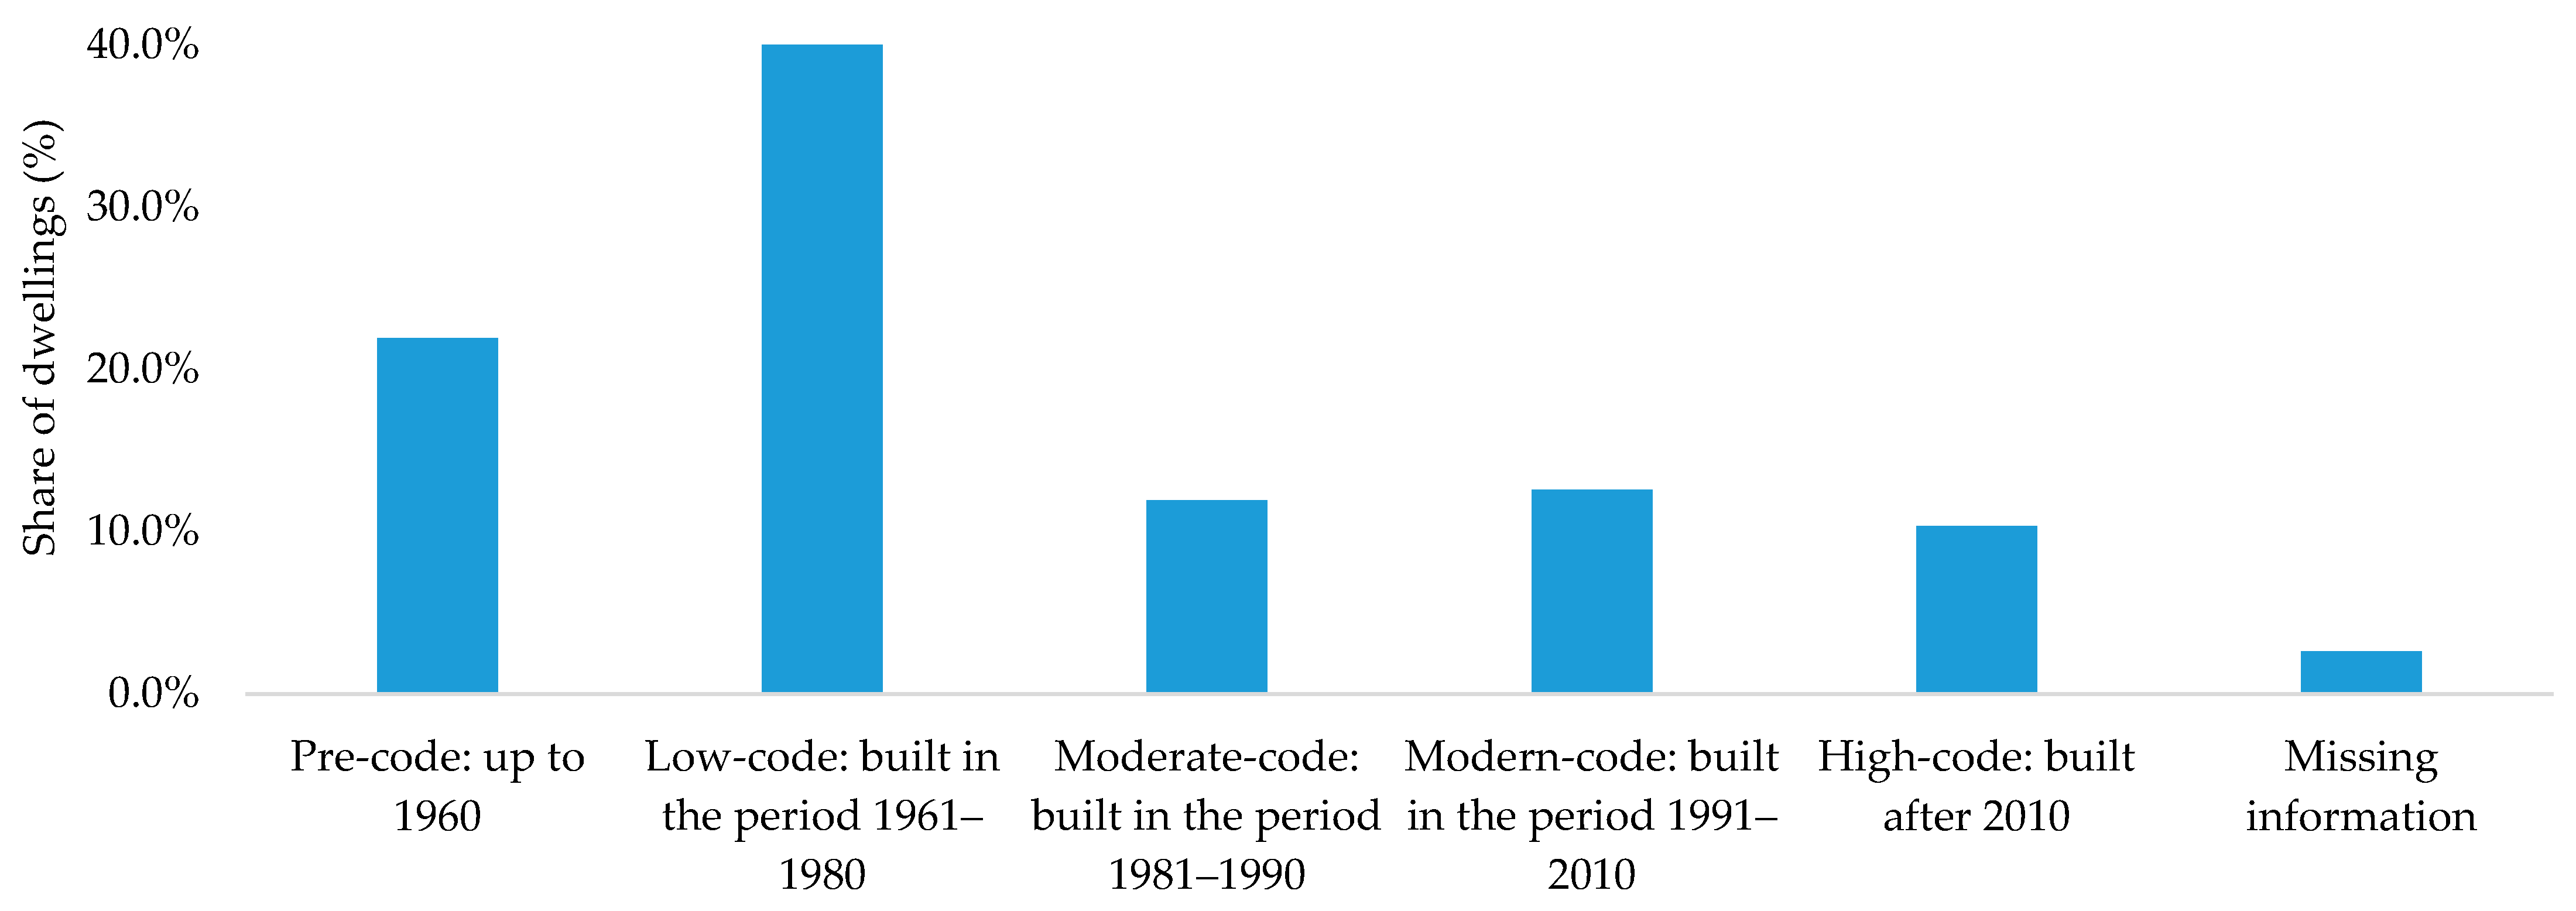
Figure 4 summarises the distribution of residential dwellings in Romania across the harmonised seismic code-level classes defined in Section 3.4. The figure highlights the strong dominance of pre-code and low-code dwellings, reflecting the limited penetration of modern seismic design provisions within the existing residential stock.
Figure 4.
Distribution of residential dwellings in Romania by seismic code level.
The distribution shown in Figure 4 is expressed in terms of dwellings rather than buildings, providing a direct representation of population exposure associated with different seismic code levels. Figure 4 also includes the category labelled “Missing information”, accounting for approximately 2.6% of residential dwellings. This category corresponds to census records for which the construction period could not be reliably identified, and therefore no seismic code-level class could be assigned. Importantly, these dwellings remain fully accounted for in terms of number, floor area, and replacement cost, and their presence does not affect the estimation of total residential exposure. The missing information impacts only the stratification of exposure by seismic code level and is considered acceptable at national scale.
Despite improvements in seismic design provisions following the introduction of modern codes, a significant share of the existing residential building stock still consists of structures designed prior to the enforcement of contemporary ductility and detailing requirements. As a result, reinforced concrete and prefabricated apartment blocks constructed before 1990 represent a critical source of concentrated seismic exposure, particularly in major urban centres affected by long-period ground motion.
From a seismic exposure perspective, this pattern is further amplified by the dominance of pre-code and low- to moderate-code dwellings, particularly in reinforced concrete and prefabricated apartment blocks constructed before 1990. These buildings combine unfavourable structural characteristics with outdated seismic design provisions and therefore represent a critical source of concentrated residential exposure.
4.3. Vertical Distribution of Exposure
The vertical distribution of residential exposure represents a key attribute in seismic risk assessment, particularly in the Romanian context, where long-period ground motions generated by Vrancea earthquakes disproportionately affect mid-rise and high-rise buildings. Understanding how dwellings are distributed across building height classes is therefore essential for evaluating exposure concentration and accumulation effects in urban areas.
The height regime of residential buildings is derived from census-reported information on the vertical position of dwellings and the number of storeys, which is provided by building type (individual houses, duplex houses, terraced houses, and apartment blocks) and settlement type (urban or rural). The census does not explicitly report building height regimes by structural material. To ensure consistency with the height classification defined in Table 3, a harmonised interpretation is adopted at national scale: unifamilial residential buildings (individual, duplex, and terraced houses) are treated as predominantly masonry- and timber-based structures, while multifamilial residential buildings (apartment blocks) are associated primarily with reinforced concrete and prefabricated structural systems. This assumption is consistent with the dominant construction practices identified in Table 8 and is adopted exclusively for large-scale exposure characterisation.
Table 9 summarises the distribution of residential dwellings by height class and residential settlement type, derived from the census-reported vertical position of dwellings within buildings. Height classes follow the thresholds defined in Table 3 and are grouped into low-rise, mid-rise, and high-rise categories. For national-scale exposure modelling, the distribution of dwelling positions is used as a proxy for the overall height characteristics of the residential building stock.
Table 9.
Distribution of residential dwellings by height class and residential settlement (urban/rural), derived from the census-reported vertical position of dwellings within buildings.
For apartment blocks constructed predominantly in reinforced concrete or prefabricated systems, three height classes are distinguished: low-rise buildings with up to three storeys, mid-rise buildings with four to seven storeys, and high-rise buildings with eight storeys and above. In contrast, unifamilial residential buildings—comprising individual houses, duplex houses, and terraced houses and predominantly associated with masonry, timber, and adobe construction—are overwhelmingly concentrated in the low-rise category. Only a very limited share of such buildings reaches mid-rise configurations, and no high-rise unifamilial structures are reported in the 2021 census.
Dwellings for which information on storey position is missing are reported separately and are not assigned to a height class. This category accounts for approximately 236,800 dwellings, corresponding to about 2.6% of the total residential stock, and reflects limitations in census reporting rather than incomplete identification of exposed assets. All remaining exposure attributes for these dwellings, including building type, floor area, and replacement cost, are fully specified. Consequently, the exclusion of these dwellings from height-based classification does not significantly affect the overall exposure patterns discussed herein.
The results reveal a pronounced vertical concentration of exposure within apartment blocks, particularly in urban areas. Although high-rise buildings represent only a small fraction of the total residential building stock, mid-rise and high-rise apartment blocks accommodate a substantial share of urban dwellings. This pattern is of direct relevance for residential insurance portfolios and catastrophe modelling, as it indicates strong spatial and vertical accumulation of exposure within a relatively limited number of multi-storey structures.
In contrast, unifamilial residential buildings exhibit a predominantly low-rise configuration and are mainly located in rural and peri-urban areas, resulting in a more dispersed exposure profile with lower accumulation potential. The observed vertical distribution therefore highlights two distinct exposure regimes within the Romanian residential building stock: a dispersed, low-rise exposure associated with unifamilial housing, and a highly concentrated, multi-storey exposure associated with multifamilial apartment blocks. These contrasting regimes are characterised by different vulnerability mechanisms and loss dynamics and provide essential input for subsequent seismic risk and insurance-oriented loss analyses.
4.4. Residential Exposure Across Settlement Types and Dwelling Classes
The aggregation of census data by settlement type and dwelling class reveals a pronounced asymmetry between the distribution of dwellings and the distribution of economic exposure at national scale. Although residential dwellings are relatively evenly split between urban and rural areas, a significantly larger share of total residential exposure is concentrated in urban environments, reflecting differences in building typology, construction costs, and dwelling density.
According to the 2021 Population and Housing Census, Romania comprises approximately 9.9 million residential dwellings, distributed across four main dwelling classes: individual houses, duplex houses, terraced houses, and apartment blocks. Urban areas host around 5.3 million dwellings, predominantly concentrated in apartment blocks, while rural areas comprise approximately 4.6 million dwellings, largely dominated by individual houses. Apartment blocks represent only a marginal component of the rural housing stock, underscoring the strong structural contrast between urban and rural residential patterns.
The detailed distribution of dwellings and associated exposure values by settlement type and dwelling class is reported in Table 10, which constitutes the basis for the national exposure valuation developed in this study. Building exposure represents the structural replacement cost of residential buildings, while total exposure includes both building replacement cost and residential contents value, computed using a constant contents-to-building ratio. As replacement costs are assigned using standardized national reconstruction cost indicators, differences in seismic code level influence vulnerability and loss modelling but do not affect exposure valuation at this stage.
Table 10.
Aggregate residential exposure by settlement type and dwelling class.
The results indicate that individual houses account for the largest share of dwellings nationwide; however, apartment blocks contribute a comparable or higher share of total residential exposure. In urban areas, apartment blocks alone represent approximately 36% of dwellings but account for more than 38% of national residential exposure, reflecting higher unit reconstruction costs and a strong vertical concentration of dwellings. In contrast, rural individual houses represent over 43% of total dwellings but contribute a smaller share of national exposure, owing to lower unit construction costs and predominantly low-rise configurations.
To further highlight the contrast between settlement types, the exposure results are aggregated at urban and rural level in Table 11. While urban areas contain approximately 54% of residential dwellings, they account for about 63% of total residential exposure. Conversely, rural areas host around 46% of dwellings but contribute only 37% of national exposure. This urban–rural asymmetry underscores the dominant role of urban housing, and particularly apartment blocks, in shaping national-scale seismic exposure and potential loss accumulation.
Table 11.
Distribution of residential dwellings and exposure by settlement type.
Nationally aggregated exposure values by dwelling class are presented in Table 12. Apartment blocks, although representing less than 40% of the dwelling stock, account for roughly 40% of total residential exposure, while individual houses contribute approximately 58%. Duplex and terraced houses represent only a minor fraction of both dwelling counts and exposure values. These results confirm the strong concentration of economic exposure within multi-family residential buildings and highlight their central importance in national-scale seismic risk assessment and insurance-oriented catastrophe modelling.
Table 12.
National residential exposure by dwelling class.
From an insurance perspective, the aggregated exposure values derived in this study highlight a substantial protection gap at national scale. While the total residential replacement cost is estimated at approximately €709 billion, the insured residential exposure remains limited to a small fraction of this value, based on currently active policies. This imbalance underscores the limited capacity of existing insurance coverage to absorb large seismic losses and confirms the relevance of nationally calibrated exposure models for solvency assessment and reinsurance programme design.
4.5. Comparison with Global Exposure Models
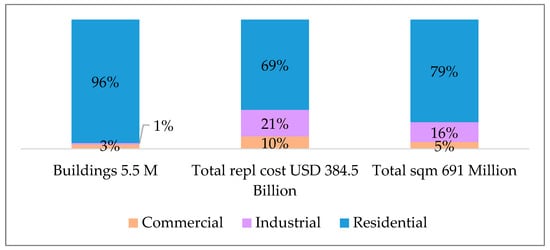
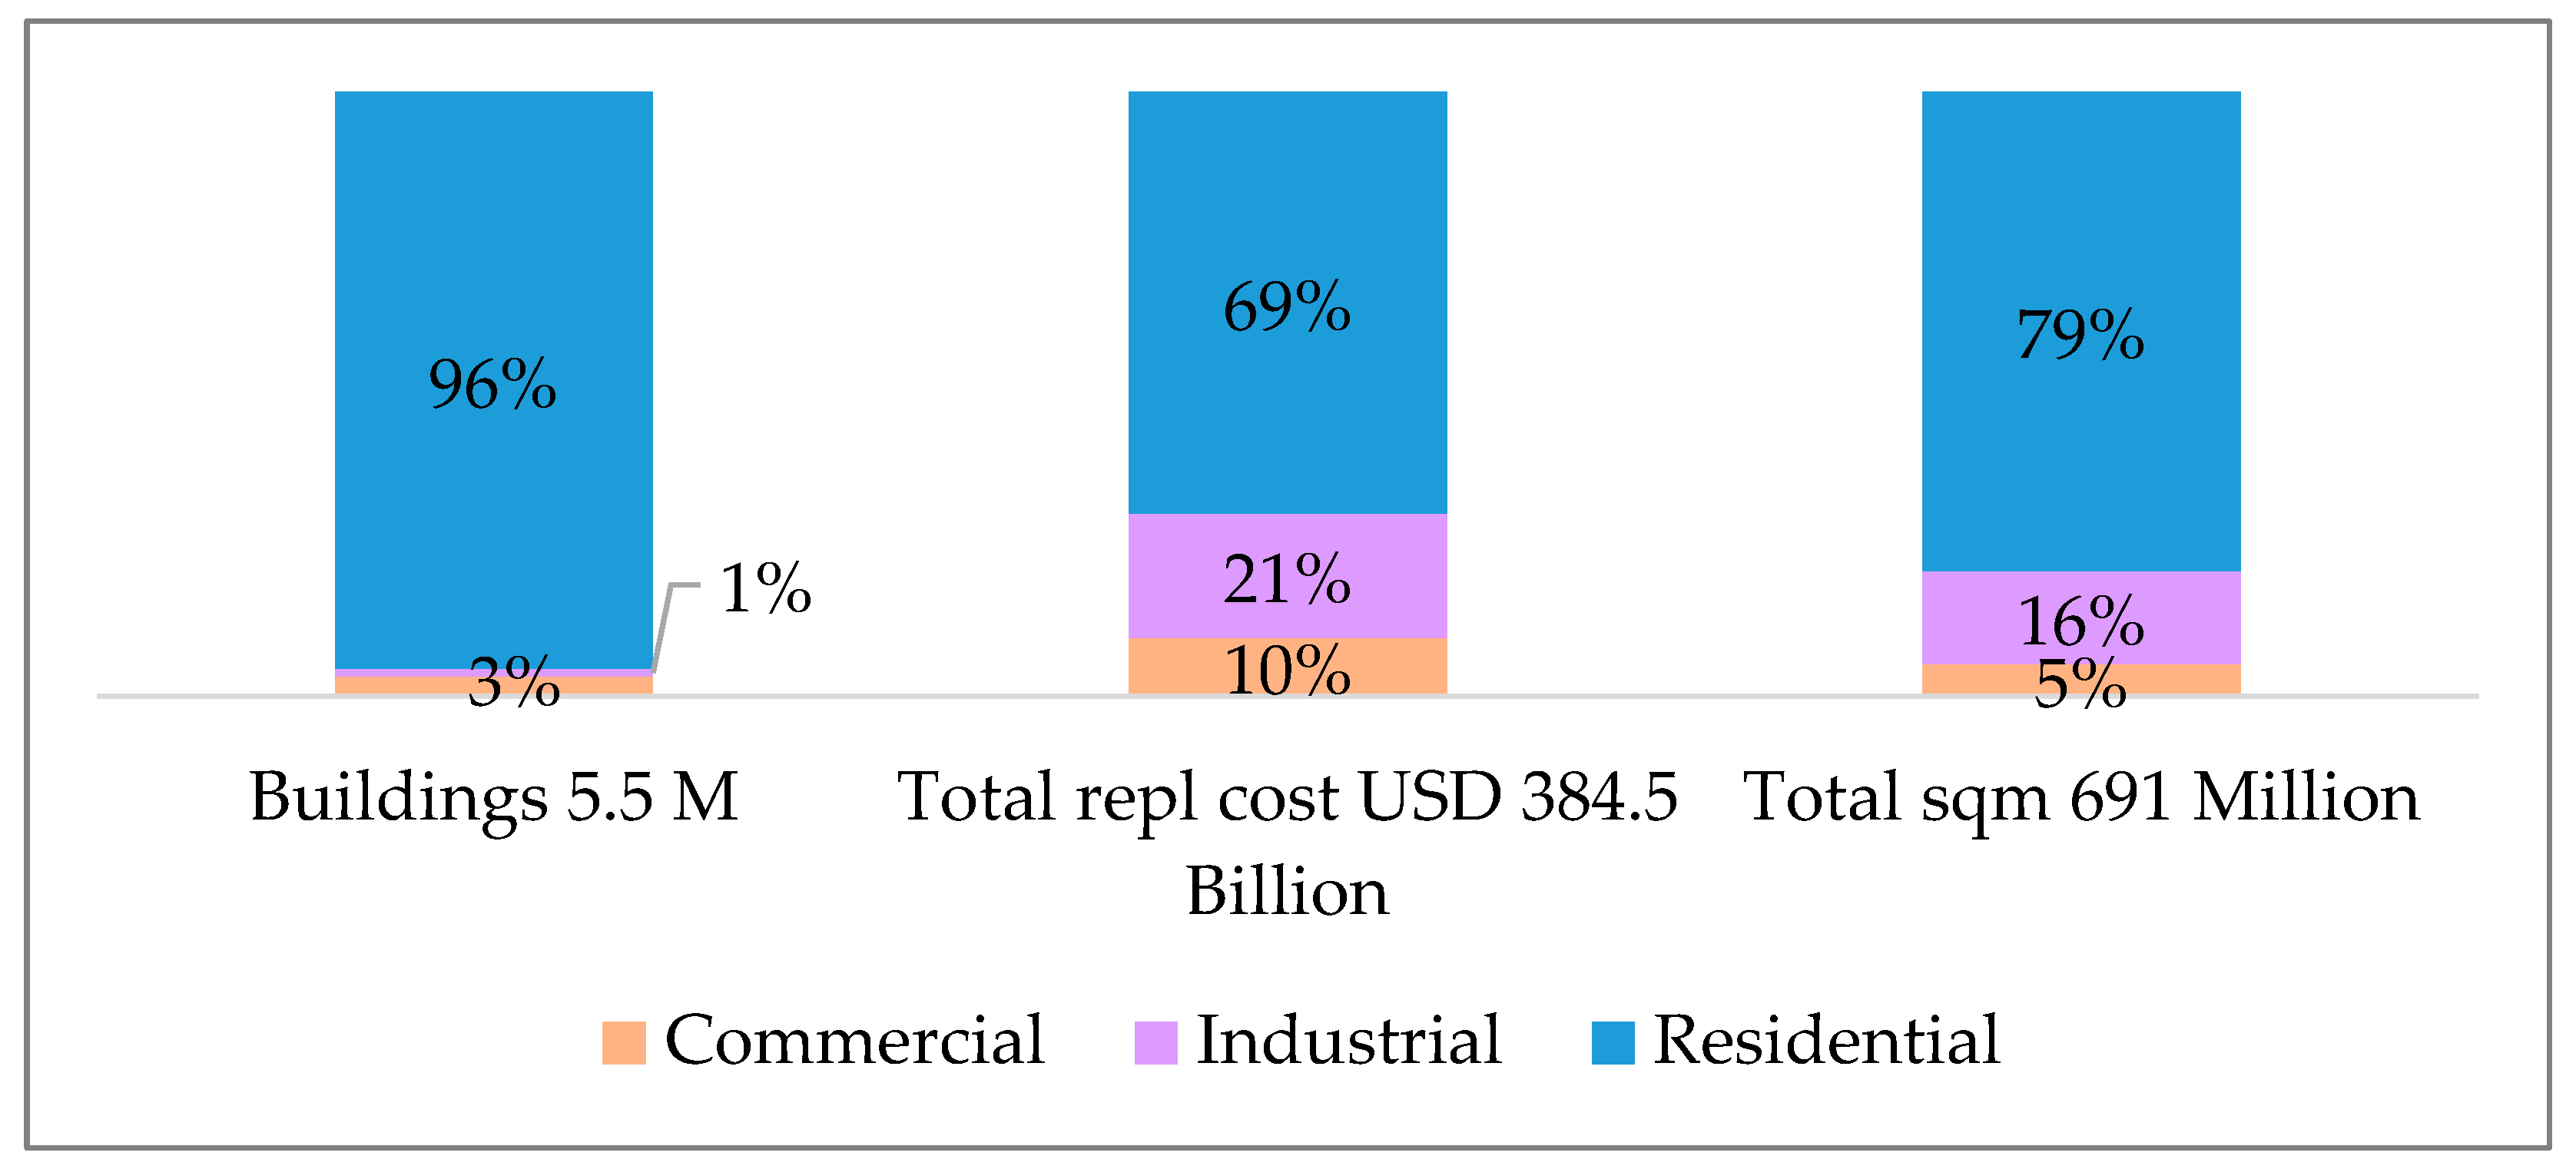
According to the GEM Global Exposure Model country profile for Romania [11], the total replacement cost for residential buildings is estimated at approximately USD 268.4 billion. Considering a conversion in EURO to 2025, Figure 5 indicates a replacement cost of residential building stock to roughly €300.5 billion.
Figure 5.
Exposure distribution in Romania by occupancy type (Residential, Industrial, Commercial) according to the GEM Global Exposure Model. Values are shown in USD as reported by [11], prior to conversion to 2025 EUR values discussed in the text.
By contrast, the present study estimates a national residential replacement cost of about €709 billion, derived from detailed building typologies based on the 2021 National Census, disaggregated by structural material, construction period, and seismic code level.
The resulting difference between the GEM estimate and the national model primarily reflects data resolution and methodological scope. GEM provides a globally consistent framework using harmonized input data across all countries, while the national model benefits from up-to-date census information. As such, the present approach offers improved alignment with national (re)insurance requirements and more realistic quantification of exposure for seismic risk modelling in Romania.
4.6. Contextual Validation Against Published Seismic Loss Assessments
The present study focuses on the development of a harmonised national-scale seismic exposure model rather than on the explicit computation of expected seismic losses. Nevertheless, a contextual validation of the obtained exposure estimates and inferred loss levels can be performed through comparison with published seismic loss assessment studies for Romania.
In the Romanian context, publicly available studies reporting direct economic losses are limited and are primarily scenario-based and conducted at city scale. For example, scenario-based seismic risk assessments for Bucharest report direct residential building losses of several billion euros for major Vrancea earthquake scenarios. Reference [34] estimates mean direct residential building losses in the range of approximately 5 to 13 billion EUR, depending on the considered earthquake scenario.
When related to the national exposure values estimated in the present study, these loss magnitudes correspond to loss ratios of several percent to a few tens of percent, which is consistent with the vulnerability assumptions commonly adopted in Romanian seismic risk studies. Comparable orders of magnitude have also been reported by earlier deterministic loss assessments for Bucharest based on SELENA-type damage [35] and loss models [3].
At national scale, seismic risk studies conducted within the RO-RISK framework have predominantly quantified earthquake impact in terms of damage distributions and annual probabilities of failure rather than explicit economic losses [2,36]. These studies consistently identify residential buildings as the dominant contributor to seismic risk in Romania.
Additional Romanian studies based on vulnerability analysis and near-real-time damage assessment approaches rely on damage ratios and expert judgement to infer losses, further highlighting the scarcity of fully calibrated loss models and the relevance of exposure-focused approaches. Overall, the consistency in order of magnitude between published seismic loss estimates and the exposure-based loss levels inferred in the present study provides an independent contextual validation of the proposed exposure model and supports its applicability for probabilistic seismic risk and (re)insurance applications.
4.7. Scope and Limitations
The exposure model developed in this study is implemented at national scale, with aggregation based on official census statistics. As such, it does not explicitly represent spatial variability within urban areas, including local site effects, soil conditions, or neighbourhood-scale construction heterogeneity. The model is therefore not intended for building-by-building damage assessment or microzonation-based loss analysis.
Instead, it provides a coherent and internally consistent representation of national residential exposure, suitable for country-scale risk metrics, portfolio accumulation analysis, and comparative studies. Ongoing and future work aims to refine the spatial resolution of the exposure model by downscaling census-based data to county-, city-, and grid-level representations, particularly for major urban centres such as Bucharest.
Uncertainty in reconstruction costs, including regional market variability, indirect costs or temporal price fluctuations, is not explicitly modelled in this study and represents a potential source of variability to be explored in future loss-oriented analyses.
Overall, the results presented in this section demonstrate that Romania’s residential seismic exposure is highly concentrated in pre-1990 buildings and in multi-storey apartment blocks located in urban areas. Although individual houses represent the majority of the dwelling stock, apartment blocks account for a comparable share of total residential exposure due to higher reconstruction costs and dwelling density.
The nationally aggregated replacement cost of approximately €709 billion confirms the scale of potential seismic losses and illustrates the limitations of globally derived exposure models when applied to national insurance and risk-financing contexts. These findings provide a robust quantitative basis for subsequent vulnerability modelling, probabilistic loss assessment, and evaluation of insurance penetration and protection gaps on the national scale.
5. Conclusions
This study presents a harmonised seismic exposure model for the Romanian residential building stock, developed using official population and housing census data, the nationally adopted RTC-10 structural typology, and National Strategy for Seismic Risk Reduction. The proposed framework is designed to support both engineering-oriented seismic risk assessment and catastrophe modelling for insurance and reinsurance applications. By consistently integrating structural typology, height regime, seismic code level, and replacement cost, the model provides a transparent and nationally calibrated representation of residential exposure, fully compatible with modern probabilistic risk modelling platforms.
The developed exposure model demonstrates how census-based information can be systematically translated into an insurance-relevant representation of national residential exposure, suitable for portfolio-level risk analysis, accumulation assessment, and evaluation of protection gaps. Rather than providing loss estimates directly, the model establishes a robust and reproducible foundation for subsequent vulnerability modelling and probabilistic loss calculations, enabling consistent comparison between national and global exposure representations.
The main conclusions of this study can be summarised as follows:
- Romania’s residential building stock exhibits a high level of seismic exposure, dominated by buildings constructed before 1990 and corresponding mainly to pre-code, low-code, and moderate-code seismic design levels, which concentrate the majority of dwellings and replacement value.
- Multi-family apartment buildings, while accounting for less than 40% of the total number of dwellings, concentrate approximately 40% of the total residential exposure, due to higher dwelling density and higher unit reconstruction costs.
- Residential exposure is predominantly urban, with urban areas concentrating about 63% of the national residential replacement value, indicating a significant potential for loss accumulation during major seismic events.
- The total replacement cost of the residential building stock is estimated at approximately EUR 709 billion, substantially exceeding values derived from global exposure models and emphasising the need for nationally calibrated, census-based exposure representations.
- The results reveal a substantial protection gap between potential seismic losses and current insurance coverage, highlighting the critical role of harmonised exposure models in probabilistic seismic risk assessment, solvency evaluation, and the design of effective insurance and reinsurance risk-transfer mechanisms.
Author Contributions
Conceptualization, B.G. and R.V.; Methodology, B.G. and R.V.; Validation, B.G. and R.V.; Formal analysis, B.G. and R.V.; Resources, B.G. and R.V.; Data curation, B.G. and R.V.; Writing—original draft, B.G.; Writing—review & editing, R.V.; Visualization, B.G.; Supervision, R.V. All authors have read and agreed to the published version of the manuscript.
Funding
This research was funded by a grant of the Ministry Education and Research, CCCDI—UEFISCDI, project number PN-IV-P6-6.1-CoEx-2024-0102, within PNCDI IV and by the grant of the Ministry of Education and Research, CCCDI—UEFISCDI, project number 60PHE from 1 April 2024 2024–2026. The APC was funded by the Technical University of Civil Engineering of Bucharest (UTCB).
Data Availability Statement
The original contributions presented in this study are included in the article. Further inquiries can be directed to the corresponding author.
Acknowledgments
During the preparation of this manuscript/study, the authors used ChatGPT 5.2 (OpenAI) as an AI-assisted tool for language editing, clarity improvement, and stylistic refinement. The authors have reviewed and edited the output and take full responsibility for the content of this publication.
Conflicts of Interest
The authors declare no conflicts of interest.
References
- Vacareanu, R.; Radoi, R.; Negulescu, C.; Aldea, A. Seismic vulnerability of reinforced concrete buildings in Bucharest, Romania. In Proceedings of the 13th World Conference on Earthquake Engineering, Vancouver, BC, Canada, 1–6 August 2004. [Google Scholar]
- Arion, C.; Pavel, F.; Vacareanu, R.; Neagu, C.; Iancovici, M.; Popa, V.; Damian, I. Seismic risk assessment of Romania. In Seismic Hazard and Risk Assessment; Vacareanu, R., Ionescu, C., Eds.; Springer Natural Hazards: New York, NY, USA; Springer: Cham, Switzerland, 2018; pp. 251–265. [Google Scholar] [CrossRef] [Scilit]
- Lang, D.; Molina-Palacios, S.; Lindholm, C.; Balan, S. Deterministic earthquake damage and loss assessment for the city of Bucharest, Romania. J. Seismol. 2012, 16, 67–88. [Google Scholar] [CrossRef] [Scilit]
- Perazzini, S.; Gnecco, G.; Pammolli, F. A public–private insurance model for disaster risk management: An application to Italy. Ital. Econ. J. 2024, 10, 225–267. [Google Scholar] [CrossRef] [Scilit]
- Daniell, J.E.; Khazai, B.; Wenzel, F.; Vervaeck, A. The CATDAT damaging earthquakes database. Nat. Hazards Earth Syst. Sci. 2011, 11, 2235–2251. [Google Scholar] [CrossRef] [Scilit]
- Goda, K.; Wenzel, F.; Daniell, J.E. Insurance and reinsurance models for earthquake. In Encyclopedia of Earthquake Engineering; Beer, M., Kougioumtzoglou, I., Patelli, E., Au, I.K., Eds.; Springer: Berlin/Heidelberg, Germany, 2014; pp. 1–24. [Google Scholar] [CrossRef] [Scilit]
- Nicodemo, G.; Pittore, M.; Masi, A.; Manfredi, V. Modelling exposure and vulnerability from post-earthquake survey data with risk-oriented taxonomies: AeDES form, GEM taxonomy and EMS-98 typologies. Int. J. Disaster Risk Reduct. 2020, 50, 101894. [Google Scholar] [CrossRef] [Scilit]
- Karafagka, S.; Riga, E.; Tsoumani, P.; Fotopoulou, S.; Karatzetzou, A.; Apostolaki, S.; Pitilakis, K. A risk-based hierarchical framework for seismic upgrading of critical buildings at large scale. Int. J. Disaster Risk Reduct. 2026, 132, 105972. [Google Scholar] [CrossRef] [Scilit]
- FEMA. Hazus®-MH 2.1 Technical Manual. Multi-hazard Loss Estimation Methodology. Washington, D.C. 2012. Available online: https://www.fema.gov (accessed on 1 September 2025).
- Mouroux, P.; Bertrand, E.; Bour, M.; Le Brun, B.; Depinois, S.; Masure, P.; RISK-UE Team. The European RISK-UE project: An advanced approach to earthquake risk scenarios. In Proceedings of the 13th World Conference on Earthquake Engineering, Vancouver, BC, Canada, 1–6 August 2004. [Google Scholar]
- GEM Foundation. Global Exposure Model (GEM): Country Profile—Romania; GEM Foundation: Pavia, Italy, 2019; Available online: https://github.com/gem/global_exposure_model/tree/main/Europe/Romania (accessed on 2 November 2025).
- Hofer, L.; Zanini, M.A.; Faleschini, F.; Pellegrino, C. Expected losses vs earthquake magnitude curves, for seismic risk mitigation and for insurance purposes. Procedia Struct. Integr. 2023, 44, 1824–1831. [Google Scholar] [CrossRef] [Scilit]
- Falcone, G.; Bergantino, A.S.; Intini, M.; Urciuoli, G.; d’Onofrio, A. A large-scale seismic risk approach accounting for local site effects and modelling of building exposure based on open-access datasets. Int. J. Disaster Risk Reduct. 2026, 132, 105936. [Google Scholar] [CrossRef] [Scilit]
- Arré, M.; Muñoz Gálvez, J.P.; Bertin, F.; Monsalve, M.; de la Llera, J.C. Multiscale exposure model of an urgent healthcare network for functionality assessment under seismic conditions: Two case studies in central Chile. Int. J. Disaster Risk Reduct. 2025, 128, 105724. [Google Scholar] [CrossRef] [Scilit]
- Ruggieri, S.; Nettis, A.; Calò, M.; Uva, G. A multidimensional discrete sampling method for deriving regional level seismic fragility and losses of RC existing buildings. Int. J. Disaster Risk Reduct. 2025, 129, 105788. [Google Scholar] [CrossRef] [Scilit]
- Masciotta, M.G.; Mancini, L.; Cianchino, G.; Ferreira, T.M.; Brando, G. Sources of errors and uncertainties in large-scale seismic vulnerability assessment methods. J. Build. Eng. 2025, 111, 113477. [Google Scholar] [CrossRef] [Scilit]
- Goda, K.; Wilhelm, K.; Ren, J. Relationships between earthquake insurance take-up rates and seismic risk indicators for Canadian households. Int. J. Disaster Risk Reduct. 2020, 50, 101754. [Google Scholar] [CrossRef] [Scilit]
- Mera, H.; Ersoy, B.; Dilek, I. Insights into earthquake insurance demand in high-risk regions: A case study of Turkey. Int. J. Disaster Risk Reduct. 2024, 111, 104725. [Google Scholar] [CrossRef] [Scilit]
- Keith, S.; Tubaldi, E.; Gkimprixis, A.; Douglas, J.; Pytharouli, S. Value of information framework for natural hazard insurance. Reliab. Eng. Syst. Saf. 2026, 267, 111816. [Google Scholar] [CrossRef] [Scilit]
- Giuzio, M.; Rousová, L.; Kapadia, S.; Kumar, H.; Mazzotta, L.; Parker, M.; Zafeiris, D. Climate change, catastrophes, insurance and the macroeconomy. Eur. Econ. Rev. 2026, 182, 105210. [Google Scholar] [CrossRef] [Scilit]
- National Institute of Statistics (INSSE). Population and Housing Census 2021 (RPL 2021); INSSE: Bucharest, Romania, 2021; Available online: https://recensamantromania.ro (accessed on 1 September 2025).
- PAID—Pool-ul de Asigurare Împotriva Dezastrelor. Report on Solvency and Financial Position 2024; PAID S.A.: Bucharest, Romania, 2024. [Google Scholar]
- Applied Technology Council (ATC). Earthquake Damage Evaluation Data for California (ATC-13); ATC: Redwood City, CA, USA, 1985. [Google Scholar]
- Applied Technology Council (ATC). Seismic Evaluation and Retrofit of Concrete Buildings (ATC-40); ATC: Redwood City, CA, USA, 1996. [Google Scholar]
- Grünthal, G. (Ed.) European Macroseismic Scale 1998 (EMS-98); European Seismological Commission: Luxembourg, Germany, 1998. [Google Scholar]
- Molina, S.; Lang, D.H.; Lindholm, C.D. SELENA—An open-source tool for seismic risk and loss assessment using a logic tree computation procedure. Comput. Geosci. 2010, 36, 257–269. [Google Scholar] [CrossRef] [Scilit]
- Pitilakis, K.; Crowley, H.; Kaynia, A.M. (Eds.) SYNER-G: Typology Definition and Fragility Functions for Physical Elements at Seismic Risk—Buildings, Lifelines, Transportation Networks and Critical Facilities; Springer: Dordrecht, The Netherlands, 2014. [Google Scholar]
- Wald, D.J.; Jaiswal, K.S.; Marano, K.D.; Garcia, D.; So, E.; Hearne, M. Impact-based earthquake alerts with the U.S. Geological Survey’s PAGER system: What’s next? In Proceedings of the 15th World Conference on Earthquake Engineering (15WCEE), Lisbon, Portugal, 24–28 September 2012. [Google Scholar]
- Marulanda, M.C.; Carreño, M.L.; Cardona, O.D.; Ordaz, M.G.; Barbat, A.H. Probabilistic earthquake risk assessment using CAPRA: Application to the city of Barcelona, Spain. Nat. Hazards 2013, 69, 59–84. [Google Scholar] [CrossRef] [Scilit]
- Ministry of Development, Public Works and Administration (MDLPA). Rapid Visual Assessment Methodology of Buildings—Indicative RTC-10; MDLPA: Bucharest, Romania, 2022. [Google Scholar]
- Ministry of Development, Public Works and Administration (MDLPA). National Strategy for Seismic Risk Reduction, Annex 36; MDLPA: Bucharest, Romania, 2023. Available online: https://sgg.gov.ro/1/wp-content/uploads/2022/11/ANEXA-36.pdf (accessed on 1 September 2025).
- Arion, C.; Neagu, C.; Văcăreanu, R.; Călărașu, E. In situ investigation for microzonation of Bucharest surface geology. In Proceedings of the 15th World Conference on Earthquake Engineering (15WCEE), Lisbon, Portugal, 24–28 September 2012. [Google Scholar]
- Eurostat. Harmonised Index of Consumer Prices (HICP)—All Items, Romania (2015 = 100); Eurostat: Luxembourg, Germany, 2025; Available online: https://fred.stlouisfed.org/data/CP0000ROM086NEST (accessed on 1 September 2025).
- Pavel, F.; Văcăreanu, R.; Douglas, J.; Rădulian, M.; Cioflan, C.; Bârbat, A. An updated probabilistic seismic hazard assessment for Romania and comparison with the approach and outcomes of the SHARE project. Pure Appl. Geophys. 2016, 173, 1881–1905. [Google Scholar] [CrossRef] [Scilit]
- Dragos, T.-D.; Cioflan Ortanza, C.; Balan, Ș.F.; Manea, E.F. Characteristics and results of the near real-time system for estimating the seismic damage in Romania. Math. Model. Civ. Eng. 2015, 11, 11–19. [Google Scholar] [CrossRef] [Scilit]
- Vacareanu, R.; Pavel, F.; Scupin, A. Probabilistic seismic risk assessment for reinforced concrete buildings in Romania. In Proceedings of the 17th World Conference on Earthquake Engineering (17WCEE), Sendai, Japan, 13–18 September 2020. [Google Scholar]



Disclaimer/Publisher’s Note: The statements, opinions and data contained in all publications are solely those of the individual author(s) and contributor(s) and not of MDPI and/or the editor(s). MDPI and/or the editor(s) disclaim responsibility for any injury to people or property resulting from any ideas, methods, instructions or products referred to in the content. |
© 2026 by the authors. Licensee MDPI, Basel, Switzerland. This article is an open access article distributed under the terms and conditions of the Creative Commons Attribution (CC BY) license.