


Abstract
Post-earthquake bridge crack detection is a critical step in assessing structural safety. Traditional manual detection of bridge cracks is time-consuming, labor-intensive, and poses significant risks. This paper focuses on the automatic identification of structural cracks by analyzing their morphology, orientation, and distribution characteristics, and preliminarily distinguishes them from non-structural damages such as surface stains and coating peeling. Therefore, this paper proposes a bridge crack recognition algorithm based on image processing. First, the input crack image undergoes preprocessing to obtain a binary image, reducing measurement errors caused by environmental factors or uneven illumination, using an improved Retinex algorithm to enhance image brightness. Second, an improved wavelet transform method is employed to remove large-area noise. Then, connected component analysis is used to filter out point-like and patch-like noise, resulting in a complete and clear crack skeleton. Finally, the crack length, width, and other characteristic values are obtained using an image pixel coordinate calculation method, achieving non-contact, non-destructive measurement of concrete surface crack characteristics. The algorithm is based on two-dimensional image processing and does not directly measure crack depth, but the extracted parameters such as length, width, and area ratio provide important surface-based evidence for rapid post-earthquake bridge structural safety assessment. Multiple experimental results show that the proposed algorithm has a maximum width measurement relative error of less than 2.3%, a length measurement relative error within 8%, and an average peak signal-to-noise ratio (PSNR) of the denoised image increased to 74.73 dB. This algorithm provides an effective automated detection tool for rapid post-earthquake bridge safety assessment.
1. Introduction
Earthquakes pose a significant threat to the integrity of transportation networks, with bridges being among the most vulnerable components. Seismic events can cause various types of damage to bridge structures, ranging from early-stage surface cracks to catastrophic collapse. Surface cracks in critical structural components (such as piers, girders, and decks) are often the earliest and most common visible indicators of earthquake damage [1,2]. Therefore, their timely detection and precise quantification are crucial for post-earthquake safety assessment, rapid decision-making regarding bridge usability, and prioritizing repairs. Efficient and accurate monitoring technology is a core requirement for ensuring the smooth operation of post-earthquake transportation lifelines and public safety [3]. This study focuses on the automated identification and quantification of surface cracks on key components such as bridge decks and girders, which constitutes a vital part of post-earthquake early damage assessment. It specifically targets the critical task of achieving automatic crack detection and measurement through image processing techniques, aiming to address the urgent need for efficient, non-contact inspection methods in post-earthquake scenarios.
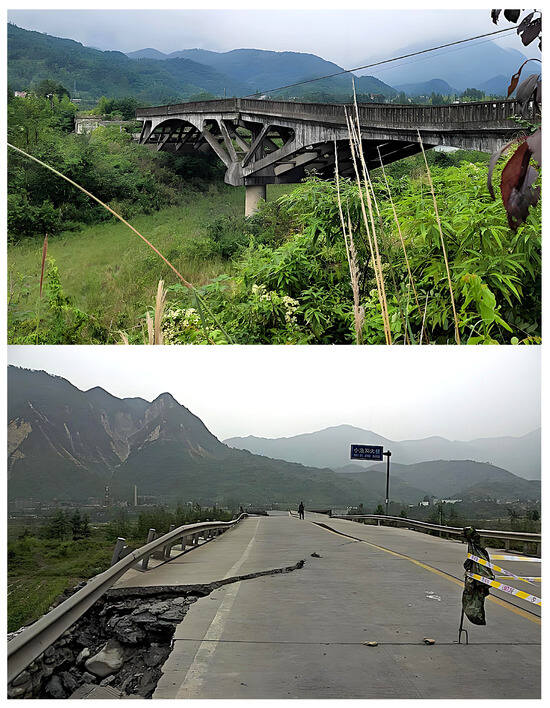
Traditional post-earthquake bridge inspection primarily relies on manual visual assessment and fixed sensor networks. These conventional methods have several well-recognized limitations. Firstly, they are time-consuming and inefficient. Manual inspections often require lane or entire bridge closures, and a detailed assessment can take several days. This inefficiency severely hampers post-disaster emergency response, particularly during the critical “golden 72-h” rescue window. For instance, following the 2023 twin earthquakes in Turkey, severe damage to transportation infrastructure, including bridges, caused significant delays in humanitarian aid delivery, exacerbating the crisis [4]. Secondly, manual inspection poses substantial safety risks to personnel. Inspectors often have to work in hazardous environments characterized by structural instability, potential aftershocks, and limited access. The tragic incident during Japan’s 2016 Kumamoto earthquake, where a damaged bridge collapsed again resulting in the death of an inspector [5], highlights this serious issue. Even more critically, a large number of post-earthquake bridges are often in a “critical damage” state, as illustrated in Figure 1. Taking the severely damaged Xiaoyudong Bridge in Pengzhou, Sichuan, during the 2008 Wenchuan earthquake in China as an example, its piers were tilted and girders displaced, with the structure on the verge of failure yet not completely collapsed. Rapid and safe condition assessment of such “on-the-brink-of-collapse” bridges is crucial for deciding whether emergency passage is possible, whether immediate reinforcement or closure is necessary, and represents the highest-risk and most challenging decision-making aspect of traditional inspection methods. Finally, traditional methods are highly subjective and lack comprehensive coverage. Manual judgments are easily influenced by experience, and it is difficult to thoroughly inspect concealed areas such as bridge undersides and supports, often leading to missed or misjudged damage.
Figure 1.
Severely damaged Xiaoyudong Bridge after the 2008 Wenchuan earthquake. (An example of a “critically damaged” state on the verge of collapse).
In recent years, the deep integration of drone technology and advanced image processing algorithms has been successfully applied to numerous infrastructure condition assessment tasks, such as the rapid identification of post-earthquake building collapses based on satellite imagery [6] and the automated detection of critical defects like steel bridge corrosion [7]. This fully demonstrates its broad potential in enhancing infrastructure resilience and operational efficiency. Within this extensive application context, research on bridge crack detection based on drone imagery and image analysis technology is particularly critical and active. Cracks are the most common early form of damage in bridge structures, so their accurate identification and quantification serve as the first line of defense in preventing catastrophic failures and ensuring the safety of transportation lifelines.
Currently, relevant detection methods can be primarily categorized into two types: classical methods based on traditional image processing, and intelligent methods based on deep learning. Classical image processing methods form the foundation of this study. Their workflow typically includes preprocessing, enhancement, segmentation, and morphological operations to extract crack features. For example, Qian et al. [8] proposed a real-time threshold segmentation algorithm for crack images but faced challenges in handling the spatial distribution characteristics of cracks. Yu et al. [9] developed a lightweight dense network optimized for model terminals, aiming for efficient operation on portable devices. These methods often require careful parameter tuning and may struggle with complex, noisy backgrounds common after disasters. On the other hand, deep learning, particularly convolutional neural networks, has achieved significant success in automatic feature learning and crack detection. Xu et al. [10] proposed a concrete structure crack instance segmentation detection method based on the YOLOv8-seg model, integrating enhancement modules to strengthen feature extraction and incorporating lightweight techniques. This improved computational efficiency by nearly 50% and achieved crack size measurement accuracy exceeding 90%. Xiao et al. [11] proposed an image ROI extraction method based on 3D-to-2D projection combined with a deep learning convolutional neural network, significantly improving crack detection accuracy. Similarly, deep learning methods have been effectively applied to detect cracks in other civil infrastructure, such as using Faster R-CNN for concrete roads [12] and historical masonry structures [13]. However, the limitations of deep learning methods are also evident: first, their training heavily relies on large-scale annotated datasets that are difficult and costly to obtain; second, models face cross-domain generalization issues when dealing with different bridges, lighting conditions, or new crack patterns; finally, their detection sensitivity for subtle or blurred cracks is insufficient, leading to missed detections. The post-earthquake field environment poses severe challenges for image detection. Acquired images are often severely degraded due to uneven illumination, sensor and environmental noise, low contrast, and complex backgrounds, greatly affecting the reliability of existing detection methods. Therefore, developing robust image preprocessing and enhancement techniques is key to achieving accurate, automatic crack detection in such contexts.
In response to the aforementioned challenges, this paper proposes a novel and robust image processing algorithm for post-earthquake bridge crack detection. The core contributions of this work are as follows: First, an improved multi-scale Retinex illumination enhancement algorithm is proposed to more effectively balance illumination, enhance contrast, and preserve edges. Second, a hybrid denoising strategy combining wavelet thresholding and connected component analysis is designed, aiming to suppress diverse noise while preserving crack details. Third, a complete automated quantification framework from images to geometric parameters is constructed, capable of accurately extracting key engineering parameters such as crack length and width. The proposed algorithm was validated on a public bridge crack dataset (DeepCrack). Experimental results show that the algorithm can achieve high recognition and measurement accuracy even in images simulating complex environments (e.g., noise, uneven illumination), preliminarily demonstrating its feasibility as a potential automated solution for rapid and safe screening of post-earthquake bridge damage. This provides reference value for improving the efficiency and safety of post-disaster infrastructure assessment.
2. Overall Scheme and Algorithm Framework
2.1. Analysis of Noise Characteristics in Post-Earthquake Crack Images
The sources and characteristics of noise in post-earthquake bridge images are complex and unique. Accurate analysis forms the foundation for subsequent algorithm design. This study systematically analyzes noise in post-earthquake crack images by integrating noise characteristic analysis and frequency-domain filtering methods for bridge crack images, examining four dimensions: source, frequency-domain characteristics, spatial-domain manifestation, and impact on detection. The specific classification and characteristics are presented in Table 1 [14,15].
Table 1.
Classification and Characteristics of Noise in Post-Earthquake Crack Images.
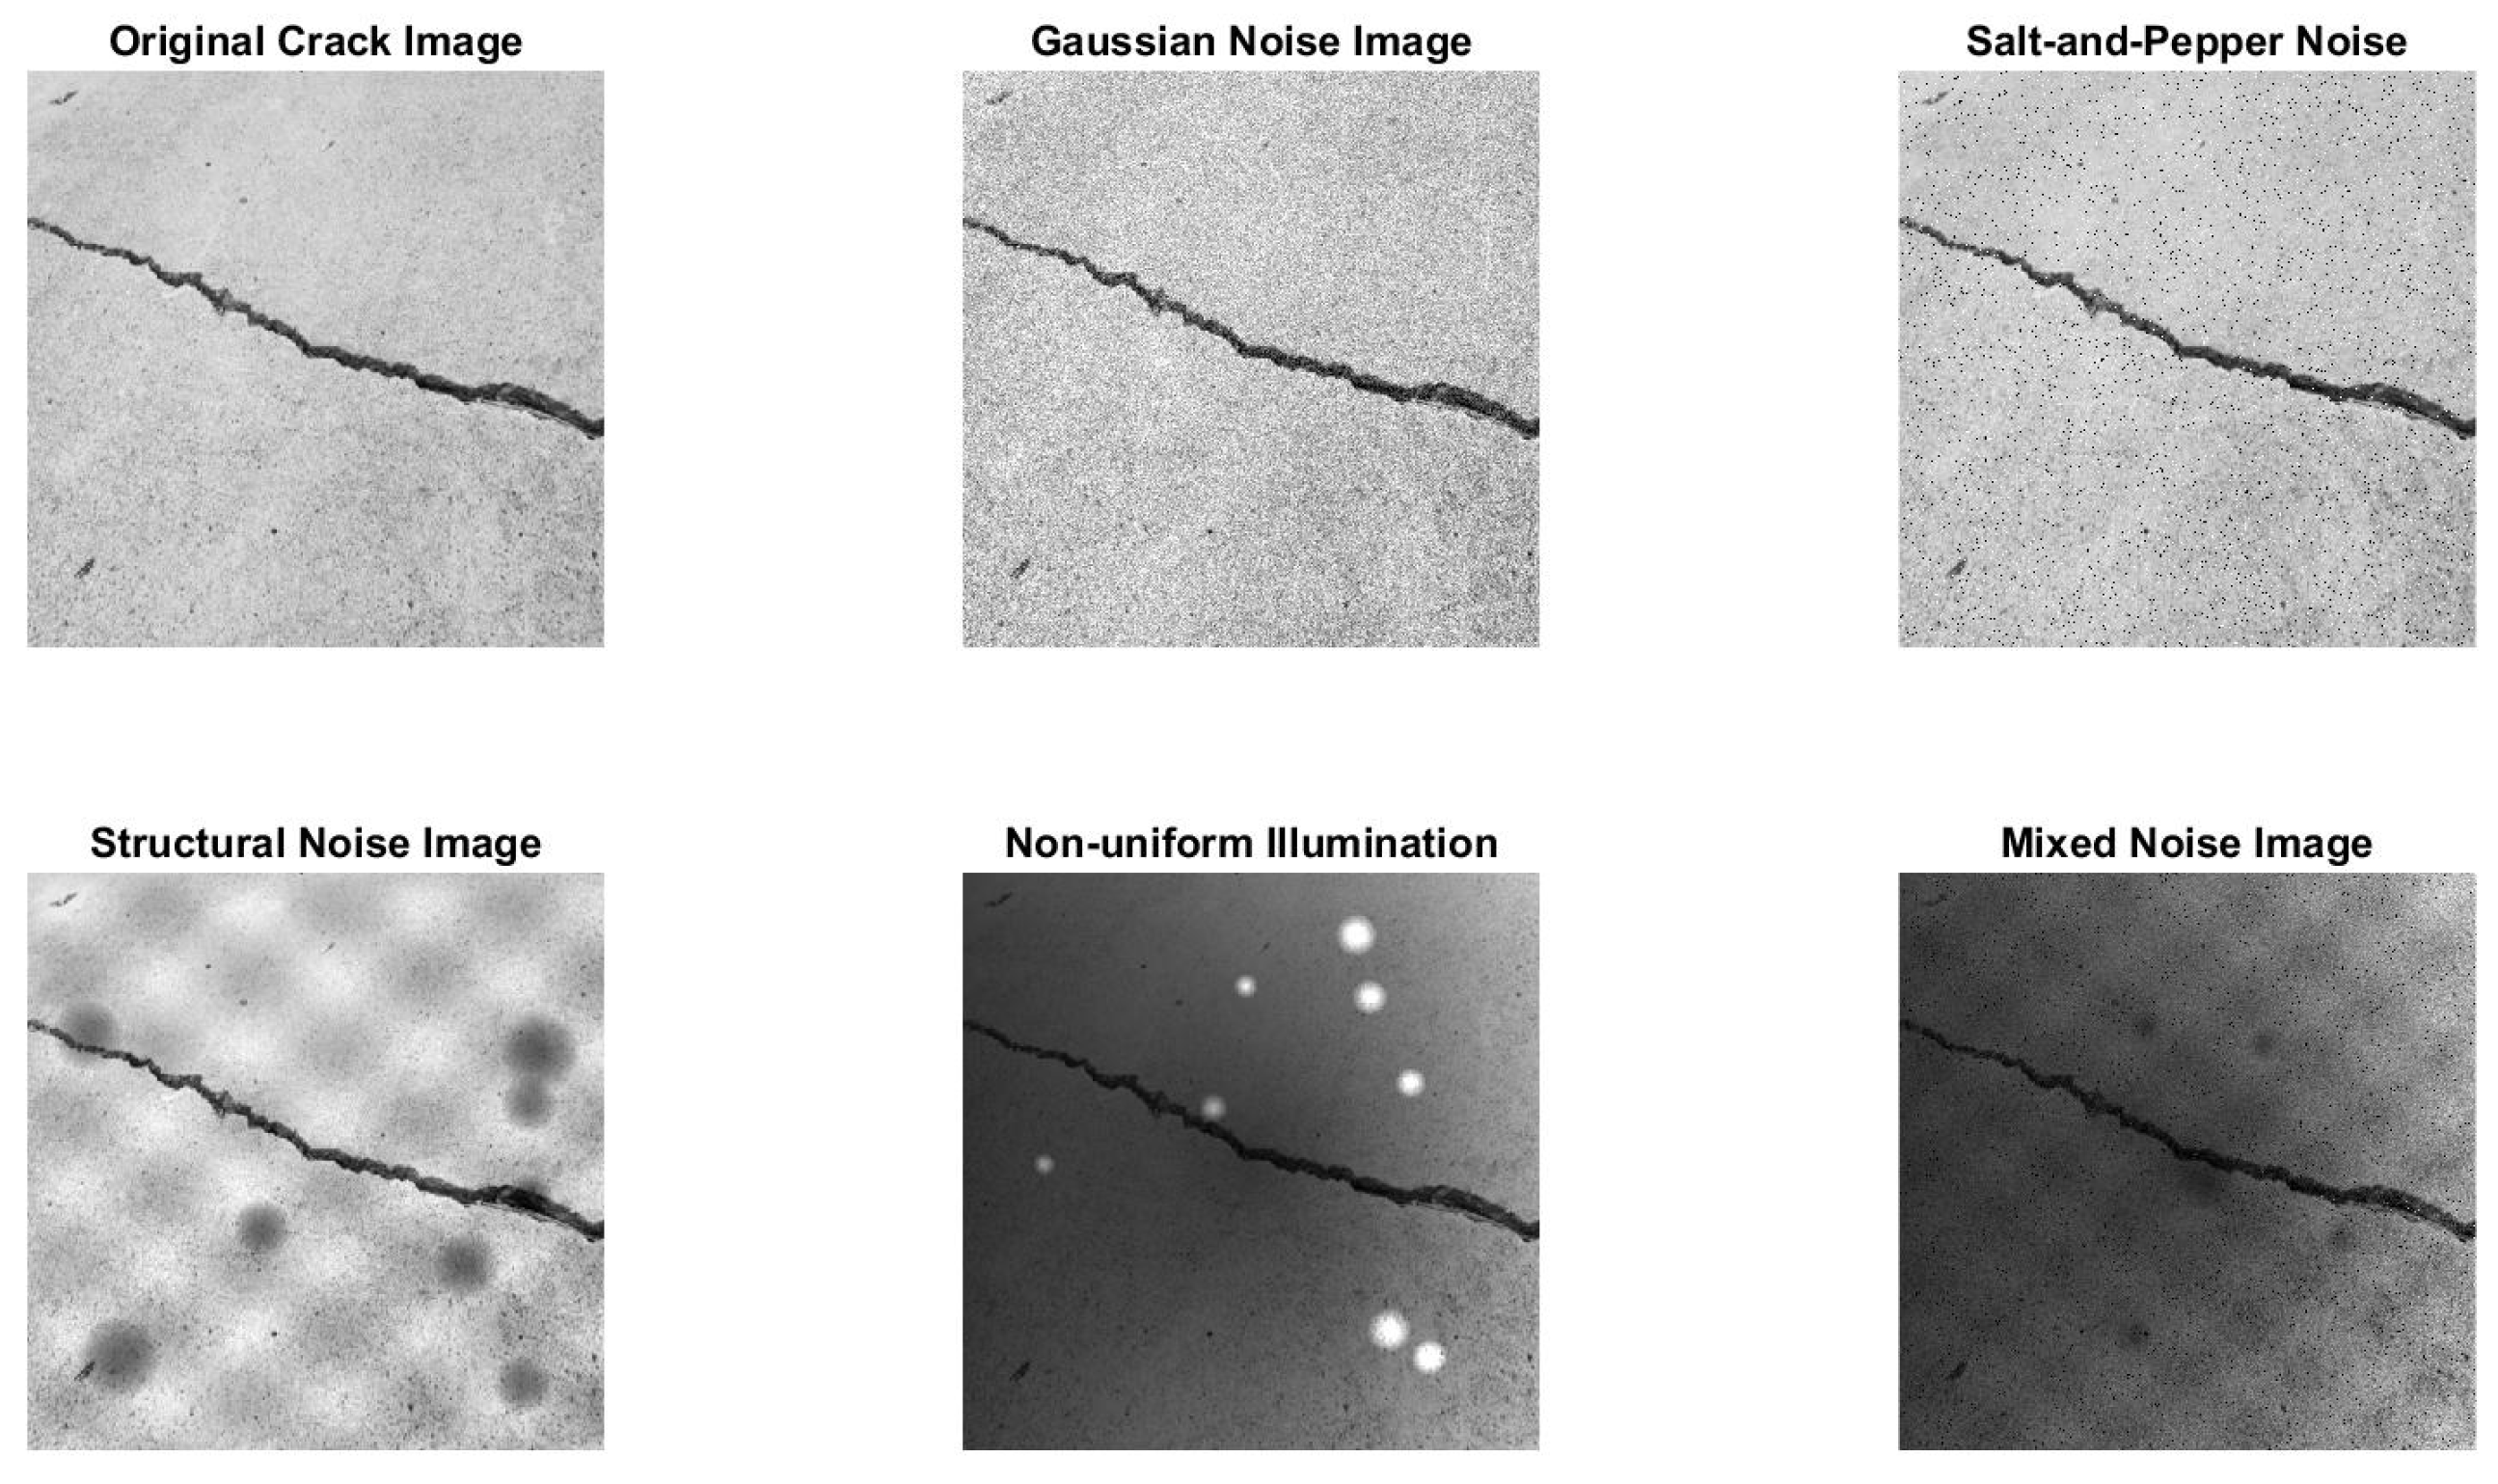
To visually demonstrate noise interference and provide a typical sample for algorithm validation, this paper selects the bridge crack image numbered 11,170 from the DeepCrack sequence as the original image. We artificially simulate the post-earthquake degradation process by sequentially superimposing four types of noise to construct a mixed-noise experimental sample, as shown in Figure 2.
Figure 2.
Mixed noise experimental sample.
These four types of noise are specifically: Gaussian white noise with a mean of 0 and a standard deviation of 25, used to simulate sensor and transmission interference; salt-and-pepper noise with a density of 3%, simulating pixel damage or dust adhesion; a low-frequency sinusoidal texture with an amplitude of 30 and a period of 50 pixels, simulating structural noise such as concrete surface stains or coating peeling; and a mask linearly decreasing brightness by 40% from the top-left to the bottom-right, used to simulate non-uniform illumination or shadow effects. To comprehensively verify the robustness of the proposed algorithm under complex post-earthquake environments, this study selects the mixed-noise image as the processing object. By processing this most challenging input, the algorithm’s module collaboration capabilities can be effectively evaluated, and its applicability in real harsh environments can be demonstrated.
2.2. Overall Algorithm Flow
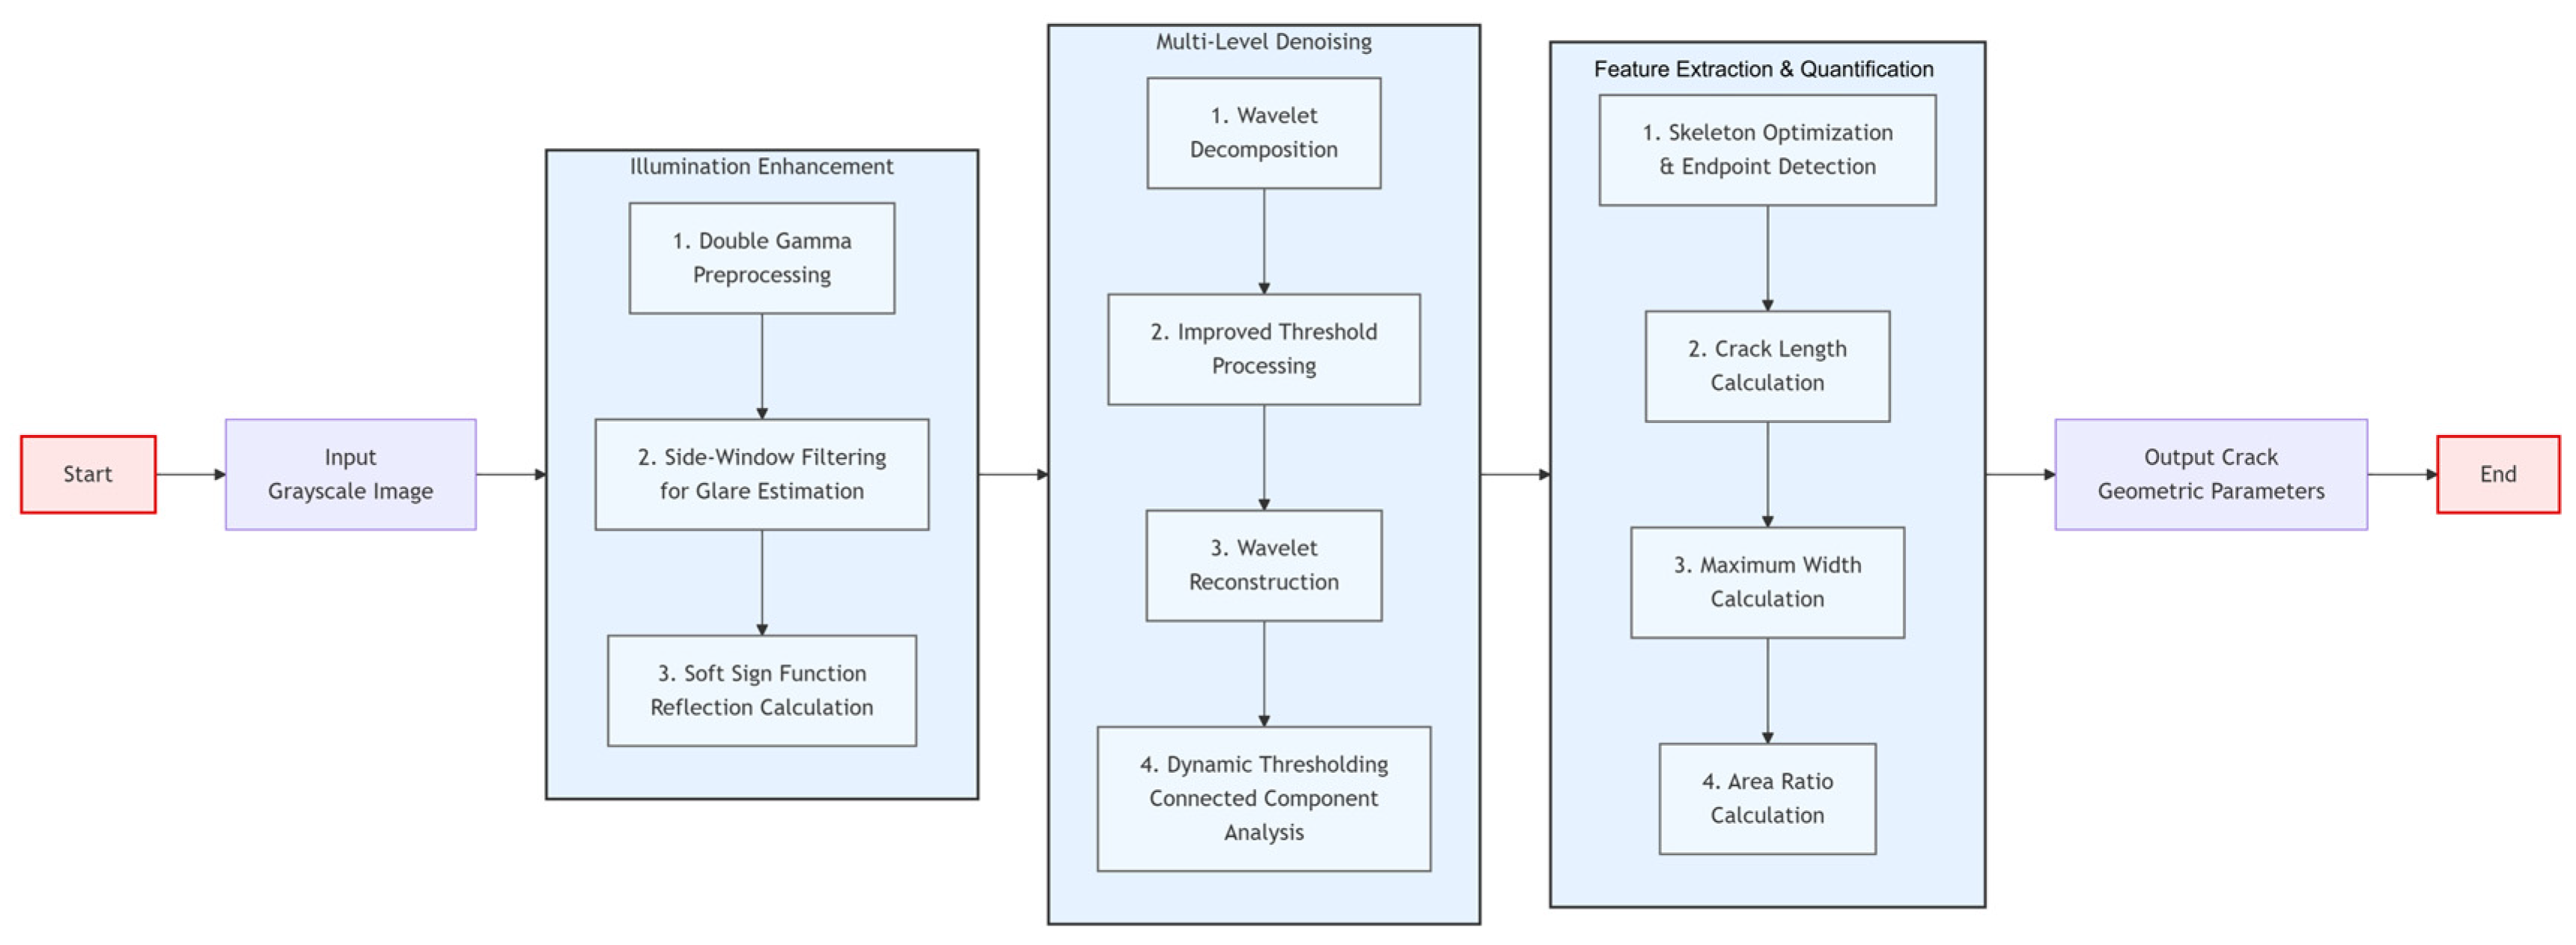
The post-earthquake bridge crack recognition algorithm proposed in this paper adopts a hierarchical and modular processing flow, aiming to achieve robust processing and precise quantification of crack images in complex environments. The hierarchical processing flow proposed in this study is illustrated in Figure 3.
Figure 3.
Overall flow of the proposed algorithm.
The overall algorithm flow is divided into the following four core stages, which sequentially form a complete processing loop:
- (1)
- Image Enhancement and Illumination Correction. Input the original grayscale image, and employ an improved Retinex algorithm based on side-window filtering for illumination equalization and contrast enhancement, outputting an enhanced image with uniform illumination and clear details.
- (2)
- Multi-level Noise Filtering. To address the diverse noise in the enhanced image, an improved wavelet thresholding algorithm combined with dynamic threshold connected component analysis is used to filter out large-area structural noise and scattered noise, outputting a clear binary skeleton image of the cracks.
- (3)
- Crack Feature Extraction and Skeleton Optimization. Morphological thinning and branch pruning are performed on the binary image to extract and optimize a single-pixel-wide crack skeleton, ensuring it accurately reflects the crack’s topological structure.
- (4)
- Precise Quantification of Geometric Parameters. Based on the optimized skeleton and edge information, key engineering parameters such as crack length, maximum width, and area ratio are calculated, achieving automated measurement.
This flow, from raw image input to engineering parameter output, constitutes a complete non-contact automated detection solution, providing efficient and accurate technical support for post-earthquake bridge safety assessment.
2.3. Experimental Setup and Evaluation Metrics
To objectively evaluate the performance of each preprocessing module, the experiments in this chapter are conducted on a PC platform equipped with an 11th Gen Intel® CoreTMi7-1165G7 @2.80GHz processor and 2 GB of RAM, using MATLAB R2025a as the simulation tool. The experimental images are sourced from the DeepCrack training subset (https://github.com/yhlleo/DeepCrack (accessed on 17 January 2026)). All algorithm parameters are optimized and determined on an independent training subset. The evaluation metrics are divided into two major categories, with their definitions, formulas, and functions as shown in Table 2 [16]:
Table 2.
Evaluation Metrics.
3. Crack Image Enhancement Algorithm Based on Side-Window Filtering Retinex
Post-earthquake bridge crack images often suffer from issues such as insufficient brightness, low contrast, and severe noise due to environmental factors like equipment vibration and uneven illumination, which directly affect the accuracy of subsequent feature extraction and parameter calculation. Traditional enhancement methods struggle to effectively retain crack edges while enhancing brightness, and are prone to introducing halos or amplifying noise [17,18]. To address this, this paper proposes an image enhancement algorithm that fuses dual gamma preprocessing with a side-window filter Retinex. The algorithm first adaptively enhances contrast through a dual gamma function, then employs side-window filtering instead of traditional Gaussian filtering for illumination estimation, and introduces a Softsign function to replace logarithmic operations. This effectively suppresses edge blurring and noise amplification while enhancing the contrast between cracks and the background and balancing illumination, providing a high-quality image foundation for subsequent processing.
3.1. Adaptive Gamma Enhancement
To address the common issues of insufficient local contrast and compressed dynamic range in crack images, a dual-gamma function is employed for adaptive correction. This function utilizes two complementary gamma transformations to process regions of different brightness levels separately, enhancing the image’s contrast and suppressing noise to facilitate subsequent detail extraction. Let the input image’s grayscale value be denoted as , and its normalized value as . The dual-gamma function is defined as shown in Equation (1):
is the weight coefficient (taken as in this paper), and are respectively:
In the formula, is the gamma correction parameter. primarily acts on dark regions, stretching the grayscale distribution through power-law transformation to reveal details in dark areas such as cracks; acts on bright regions, preventing information loss caused by excessively bright backgrounds. The weighted fusion of the two achieves adaptive equilibrium of global illumination, effectively enhancing the visual usability of the image. The test results are shown in Figure 4, where represents the dual-gamma weight and is the gamma value.
Figure 4.
Dual-Gamma Correction Diagram.
3.2. Improved Retinex Algorithm Based on Side Window Filtering
Retinex theory posits that an image can be decomposed into the product of an illumination component and a reflectance component , i.e., . The goal of enhancement is to estimate and remove the effects of uneven illumination, thereby recovering a clear reflectance image (i.e., the intrinsic properties of objects). The traditional single-scale Retinex algorithm estimates illumination in the logarithmic domain using Gaussian filtering, with the formula as follows:
where, is the convolution symbol, and the formula for is shown in Equation (5):
The Multi-Scale Retinex (MSR) algorithm combines illumination compensation at multiple different scales, making the results more robust. The formula is shown in (6):
In the formula, represents the weight for each scale, and N denotes the number of scales. Typically, N is set to 3. Based on empirical experience and guidance from literature [19], the weights are set to [0.3, 0.4, 0.3], corresponding to small, medium, and large-scale Gaussian kernels, respectively. This configuration aims to achieve a balanced estimation of the illumination component between local details and global uniformity. and represent the single-scale reflectance and multi-scale reflectance, respectively.
However, the global smoothing nature of Gaussian filtering tends to cause edge blurring and loss of critical structural information when processing images rich in edges and details, such as cracks. To address this issue, this paper proposes the use of Side Window Filtering (SWF) as a replacement for Gaussian filtering in illumination estimation. The core idea of side window filtering is to position the pixel being processed at the edge or corner of the filtering window, rather than at its center. By designing asymmetric windows in eight directions (up, down, left, right, northeast, northwest, southeast, southwest), the filtering output under each window is computed, and the output with the smallest Euclidean distance to the original pixel value is selected as the final result. This mechanism maximizes the avoidance of filtering operations crossing edges, thereby perfectly preserving the sharpness of crack edges while smoothing illumination.
The mathematical expression of side window filtering is as follows. For pixel point , the output of its K-th window is:
Among them, represents the input image, and denotes the filter kernel function (in this paper, the Gaussian kernel form is still adopted, but constrained by the window). The final estimated illumination value is:
Substitute into the Retinex framework, and Formula (6) is improved to:
is the side-window filtering of the pixel, is the reflectance image obtained after side-window filtering to estimate the illumination.
To avoid numerical instability and excessive sensitivity to low grayscale values, the soft sign function is used to replace the logarithmic function in Formula (7), yielding the improved reflection component calculation formula:
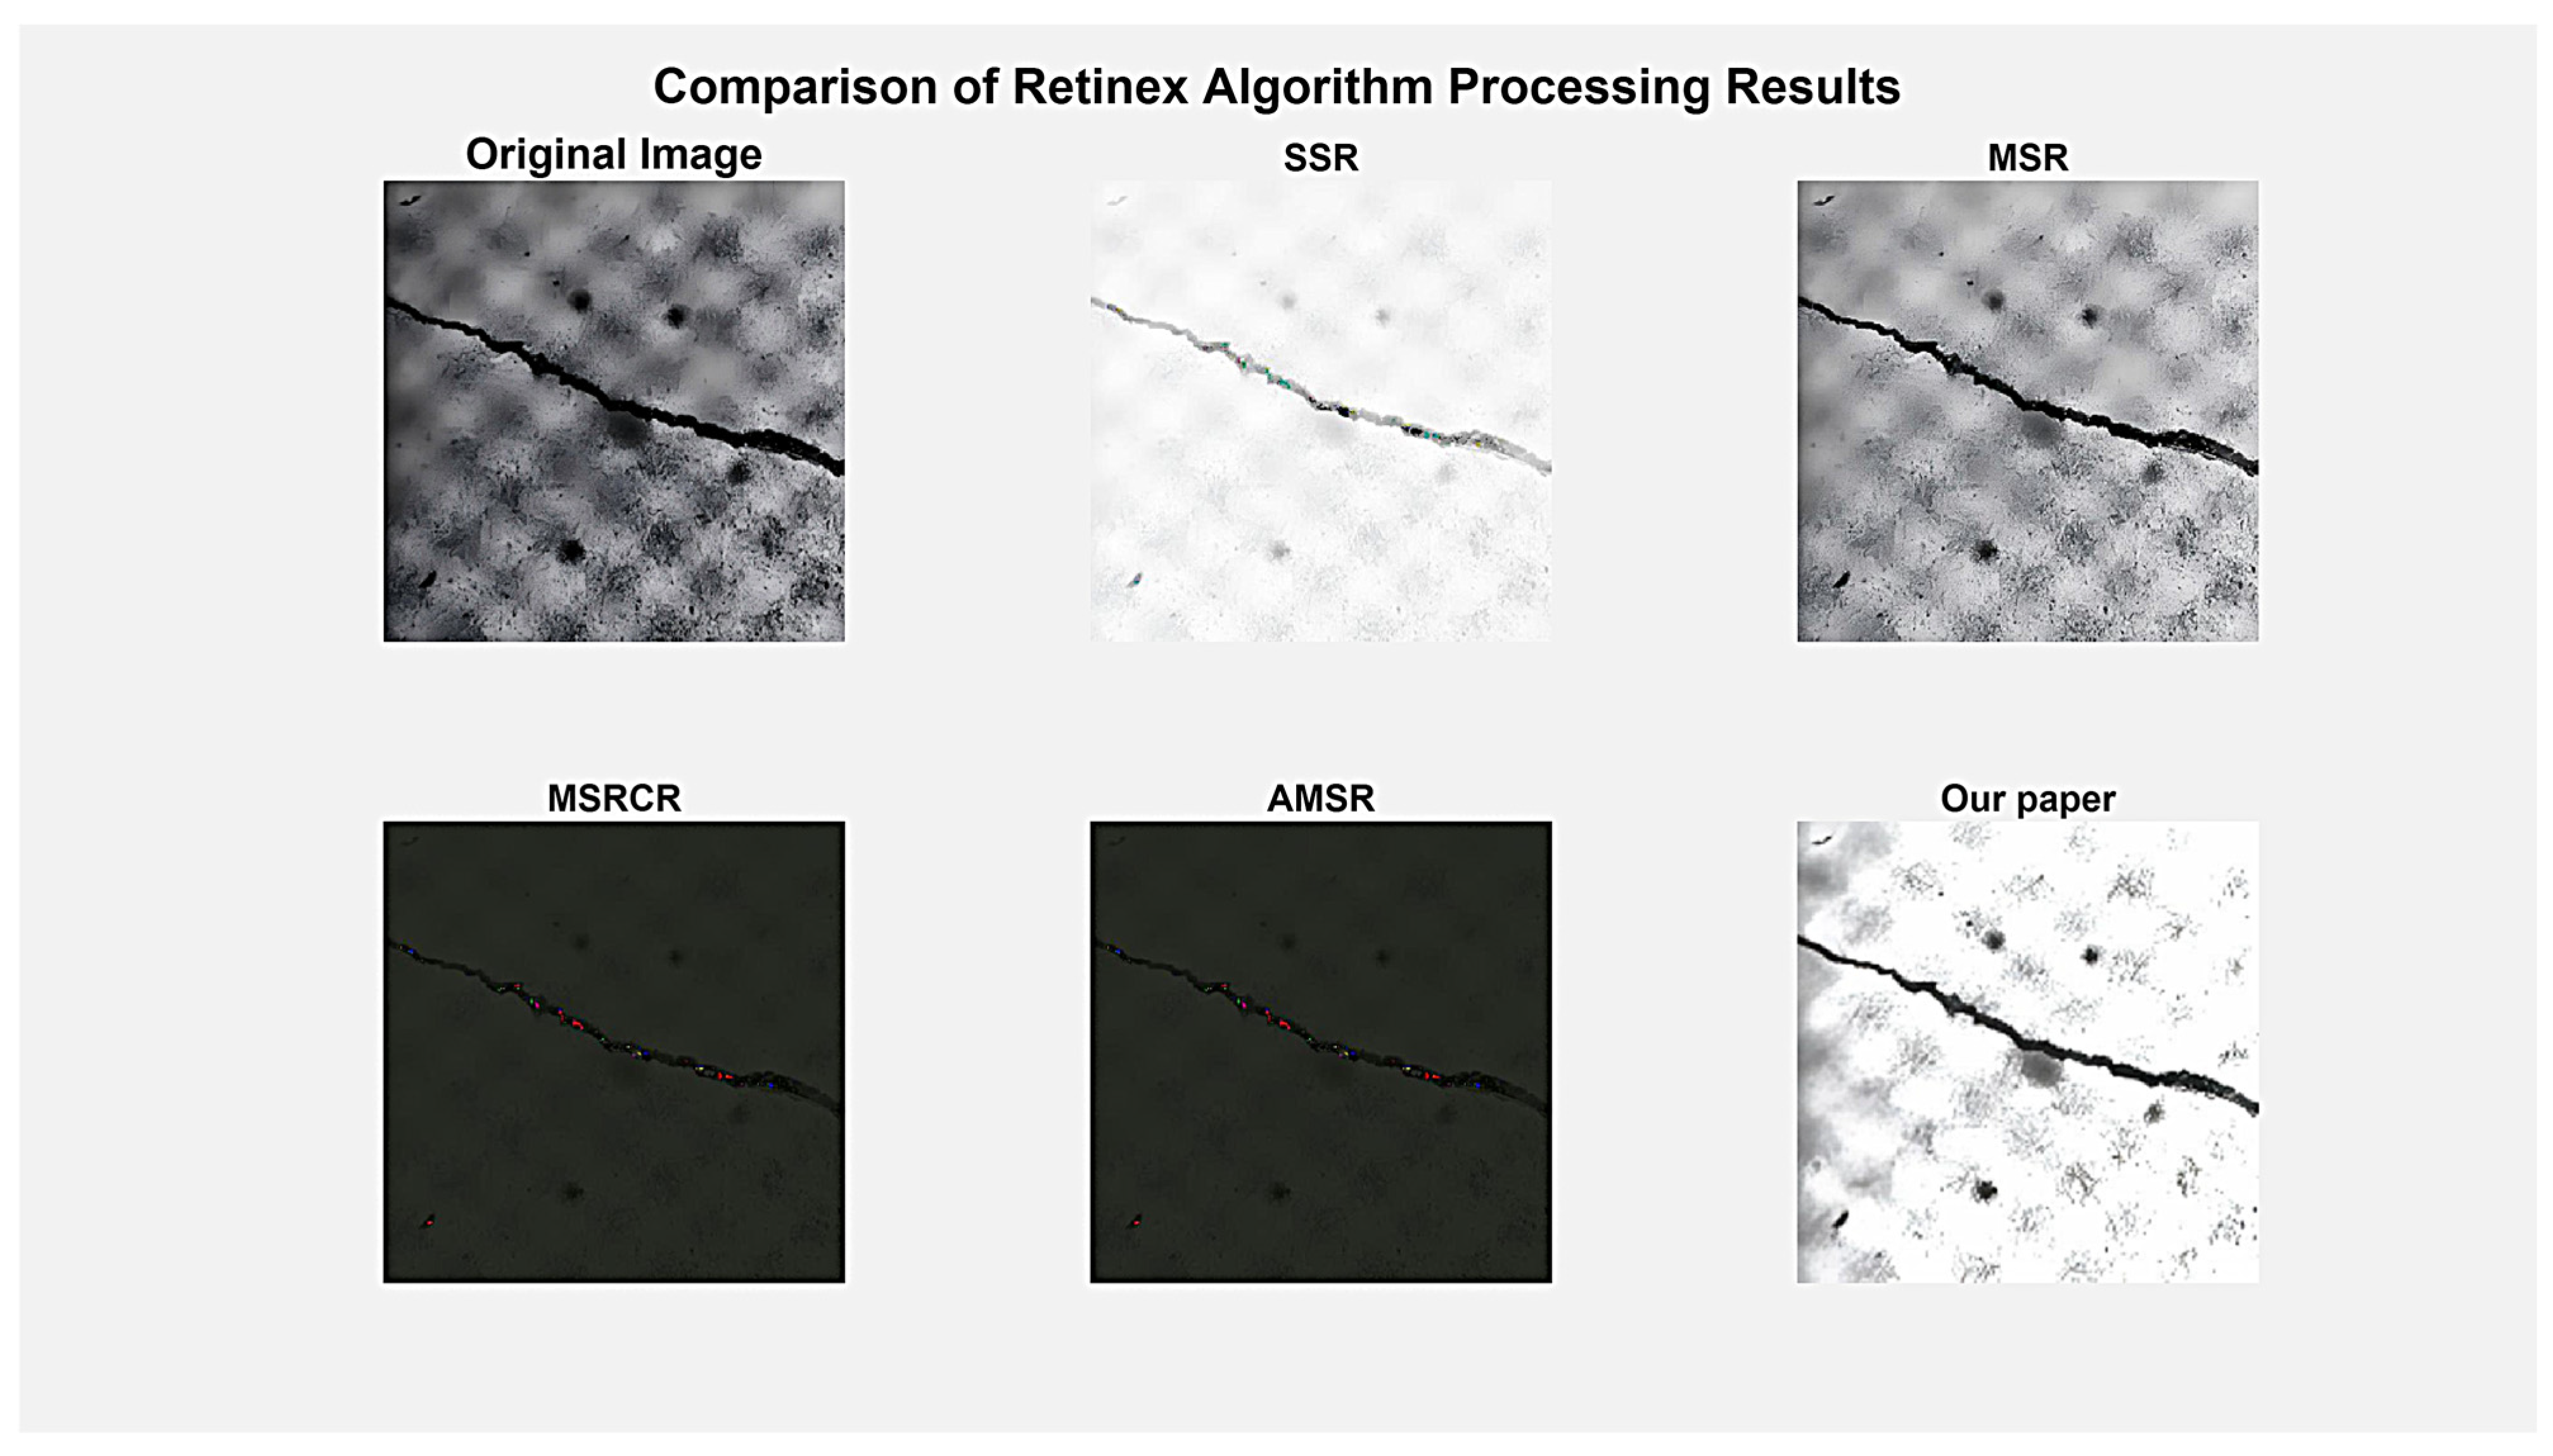
Further processing was performed on the image after handling with the digamma function, with the main parameters set as follows: the side-window filtering kernel size is 15 × 15, and the Gaussian kernel standard deviation is . To demonstrate the superiority of the algorithm proposed in this paper, comparative experiments were conducted with several variant Retinex algorithms. The results are shown in Figure 5.
Figure 5.
Visual comparison of image enhancement results using different Retinex algorithms.
Figure 5 shows the processing results of five Retinex image enhancement algorithms, allowing for an intuitive comparison of their performance differences. The first row, from left to right, displays the original image, the SSR algorithm result, and the MSR algorithm result. The second row shows the MSRCR algorithm result, the adaptive MSR (A) algorithm result, and the result of the improved algorithm proposed in this paper. Visually, the proposed algorithm in this paper outperforms other traditional methods in terms of image detail preservation, illumination uniformity, and naturalness, especially excelling in the recovery of dark area details and overall visual comfort, preliminarily validating the effectiveness of the proposed improvement strategy.
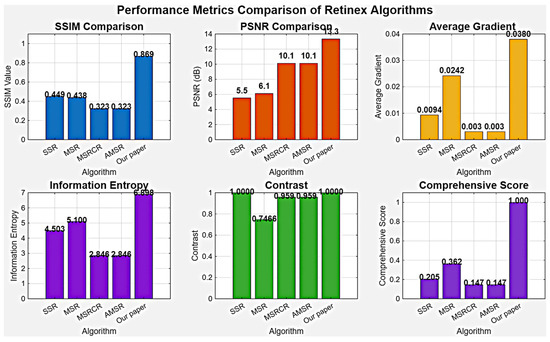
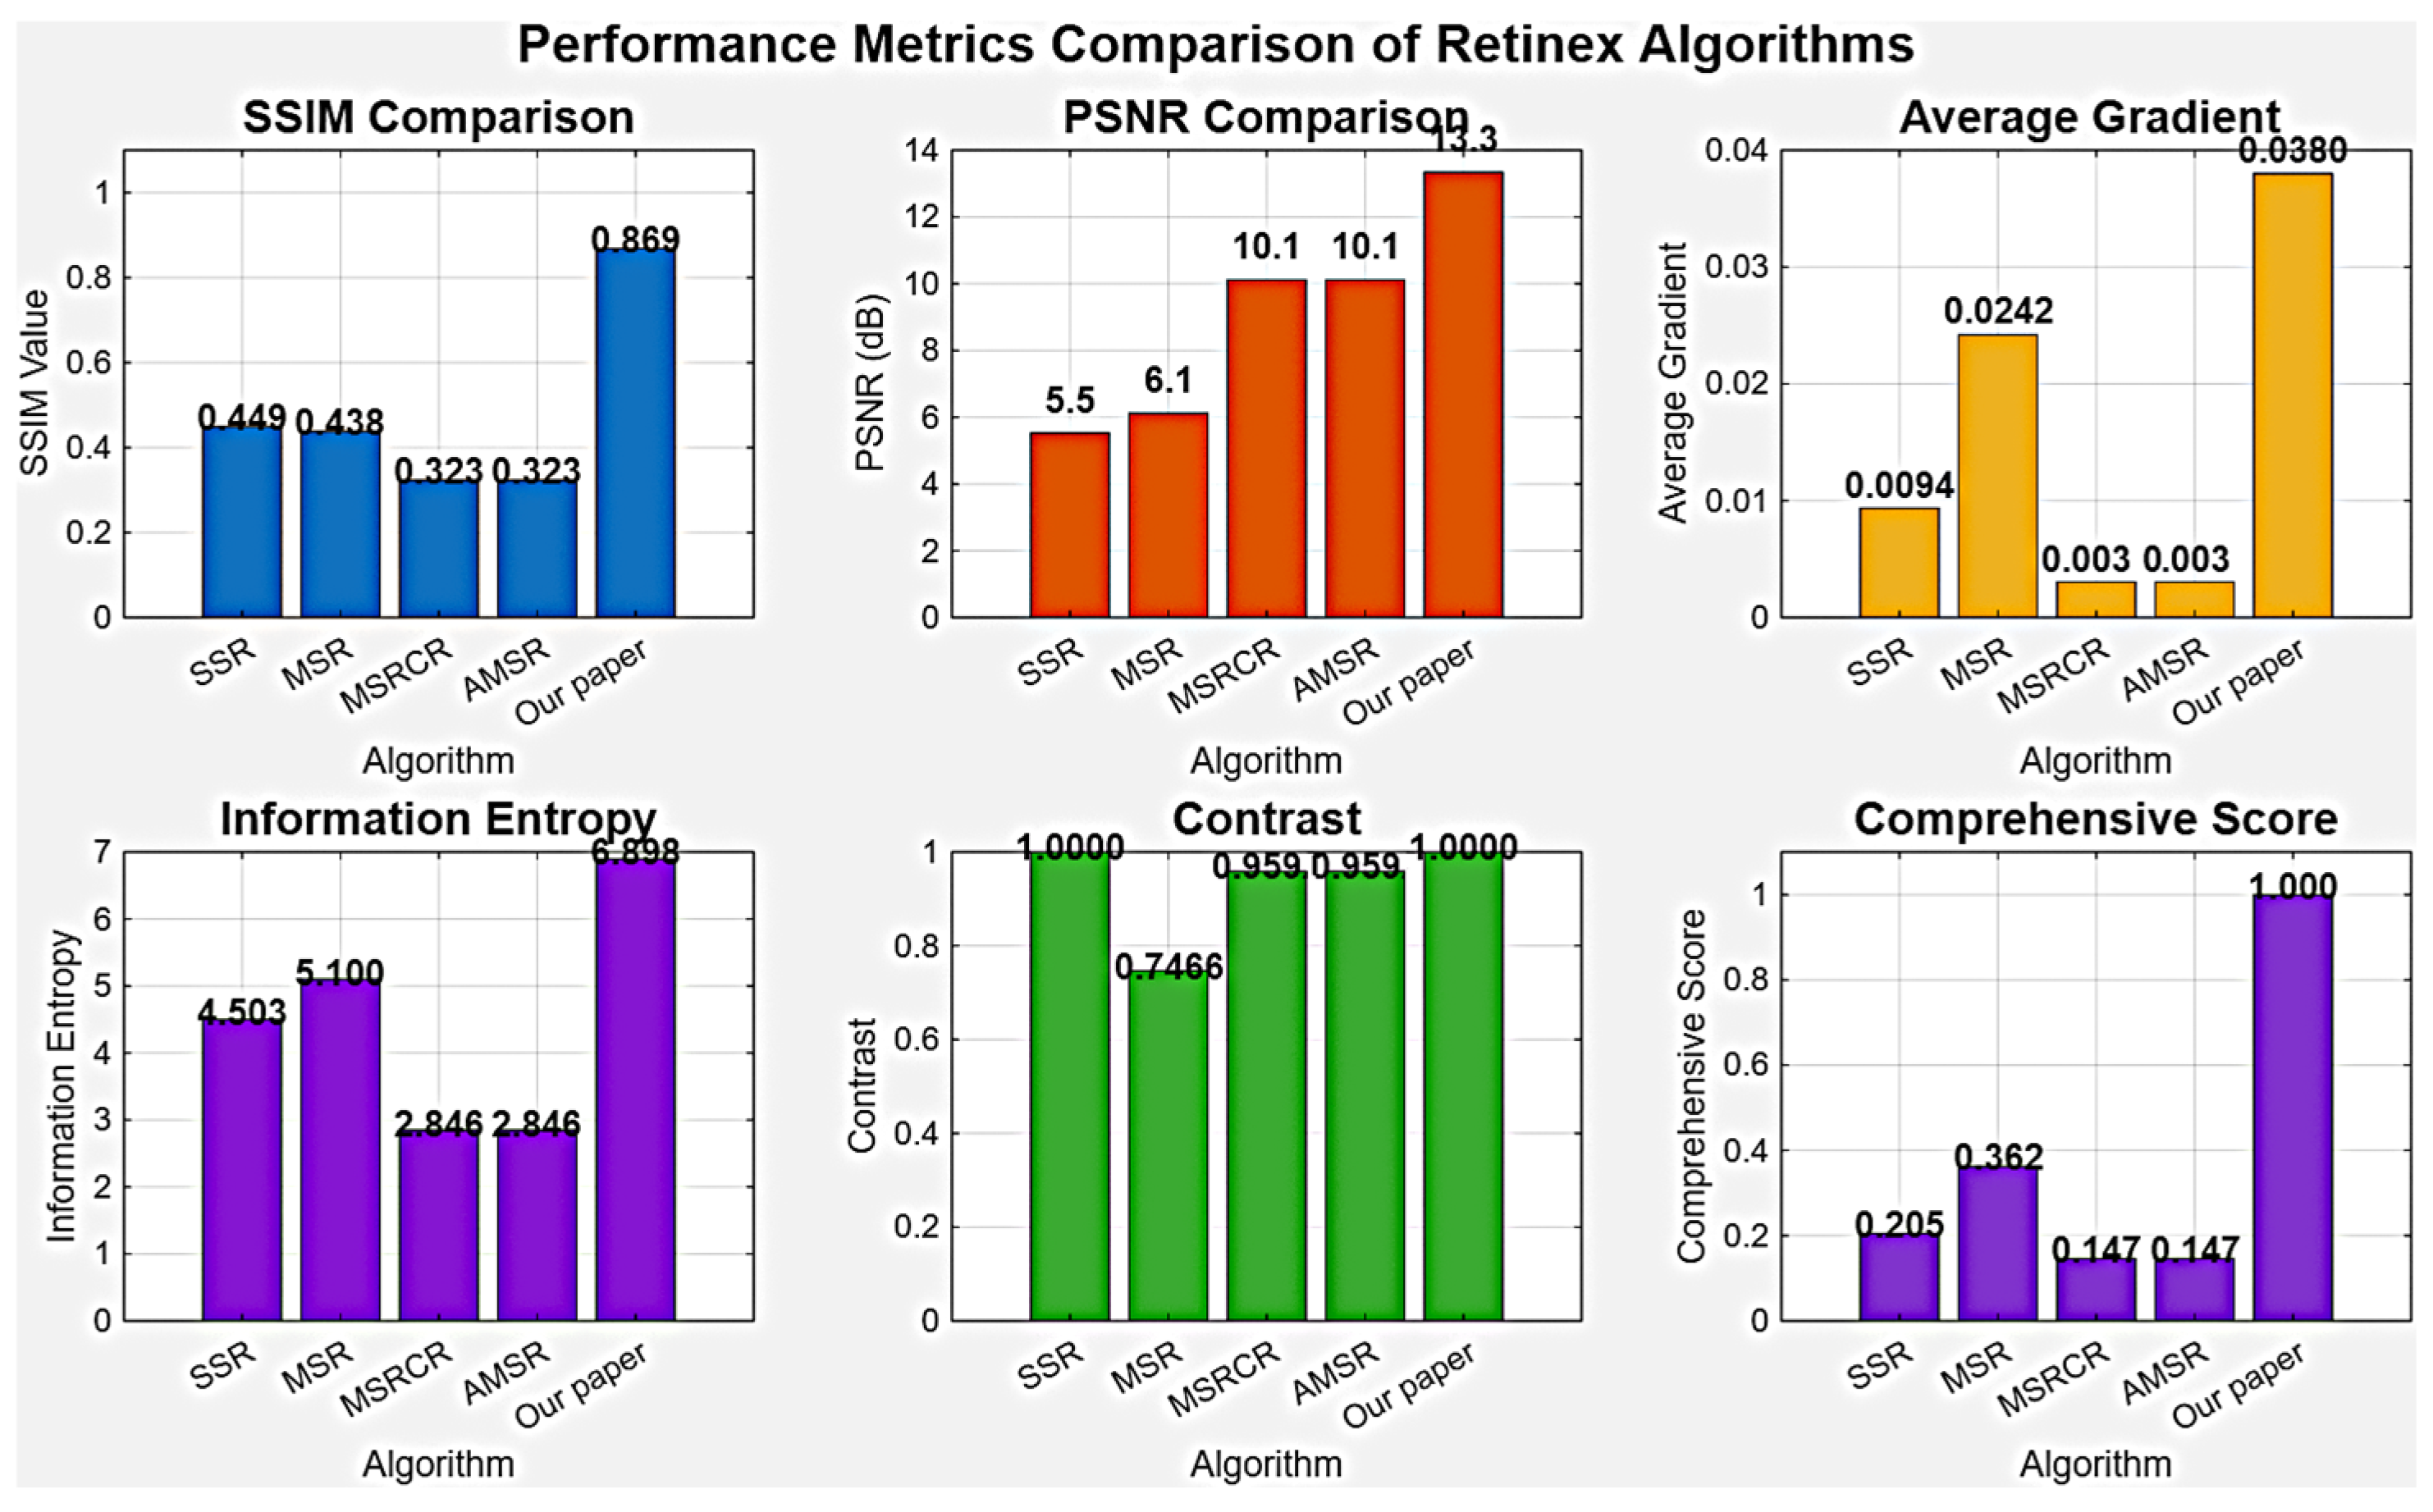
To further objectively evaluate algorithm performance, Figure 6 presents the specific numerical values of each algorithm on five key quantitative metrics. The data shows that the algorithm proposed in this paper achieves the highest values in PSNR (13.3 dB), SSIM (0.869), average gradient (0.038), and information entropy (6.898), comprehensively surpassing traditional Retinex algorithms. Particularly, in terms of average gradient and information entropy, the algorithm proposed in this paper improves by approximately 57% and 35% over MSR, respectively, corroborating its significant advantages in edge enhancement and detail preservation. These quantitative results are highly consistent with the visual observations in Figure 5, jointly validating the comprehensive superiority of the improved algorithm proposed in this paper in enhancing image quality.
Figure 6.
Quantitative performance evaluation of different Retinex algorithms.
4. Hybrid Denoising Framework Integrating Cubic Spline Wavelet Threshold and Dynamic Connected Component Analysis
Although the SWF-Retinex algorithm exhibits superior enhancement effects compared to the classic MSR method, it still suffers from an imbalance between edge detail preservation and noise suppression. To further enhance edge integrity under noisy conditions, this paper proposes a hybrid denoising framework that integrates cubic spline wavelet thresholding with dynamic connected component analysis.
4.1. Improved Wavelet Thresholding Denoising Algorithm
(1) Selection of Wavelet Basis Function and Decomposition Level
The choice of wavelet basis function directly affects the representation capability of image features and the denoising effect. To objectively evaluate the denoising performance of different wavelet basis functions, comparative experiments were conducted on the Daubechies series, Symlets series, and Coiflets series wavelets. The experimental results are shown in Table 3 [20,21].
Table 3.
Performance comparison of different wavelet basis functions in crack image denoising.
Based on the difference between the denoised image and the original noise-free reference image, we adopted PSNR and SSIM as quantitative indicators, and recorded their computation time to comprehensively measure algorithm efficiency. PSNR reflects the pixel-level fidelity of the image; the higher the value, the closer the denoised image is to the ideal noise-free state. SSIM evaluates the visual perception quality of the image from three dimensions: brightness, contrast, and structure; the closer its value is to 1, the more complete the structural information retention. As shown in Table 3, the db4 wavelet performed optimally in both PSNR (74.73 dB) and SSIM (0.928), indicating that it can effectively suppress noise while better preserving the edge and texture details of cracks. Although its computation time (45.6 ms) is slightly higher than that of db2, it achieves the best balance between denoising quality and operational efficiency, and is thus selected as the wavelet basis function for this study.
The number of wavelet decomposition layers is another key parameter affecting denoising performance. Too few layers may lead to insufficient separation of noise and signal frequency bands; too many layers will increase computational complexity and may overly smooth useful high-frequency details. For the image resolution (720 × 724 pixels) and crack feature scale used in this study, experimental verification on the training subset determined that a decomposition level of 3 was selected. This setting achieves a good balance between denoising effect and computational efficiency, effectively suppressing noise across all frequency bands while better preserving crack edge information from coarse to fine.
(2) Cubic Spline Smoothing Threshold Function
Traditional soft and hard threshold functions have inherent drawbacks: the hard threshold function is discontinuous at the threshold point, which can easily cause ringing artifacts in the reconstructed image; the soft threshold function, while continuous, has a constant bias that may weaken edge strength [22,23]. To address this issue, this paper proposes a cubic spline-based smoothing transition threshold function:
where is the wavelet coefficient at position , is the coefficient after thresholding, and are the dual threshold parameters satisfying . is the cubic spline transition function, defined as:
The function satisfies the boundary conditions ensuring that the function values and their first derivatives are continuous at the threshold boundaries, effectively avoiding the abrupt changes at the threshold points inherent in traditional methods.
The threshold parameters and are determined through the BayesShrink adaptive method. For each detail subband, the noise standard deviation is estimated as:
where is the coefficient of the first-level diagonal detail subband. The signal standard deviation is estimated as:
Then the threshold parameters are calculated as:
To verify the superiority of the cubic spline function, comparative experiments were conducted with other smooth functions, such as the sigmoid function and polynomial functions. As shown in Table 4, the cubic spline function performs optimally in both PSNR and SSIM metrics, while also demonstrating a significant advantage in computational efficiency.
Table 4.
Performance Comparison of Different Smooth Transition Functions.
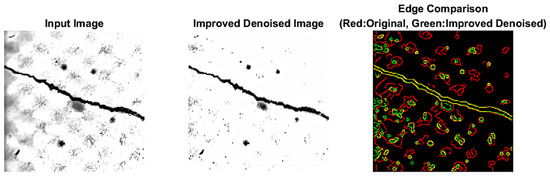
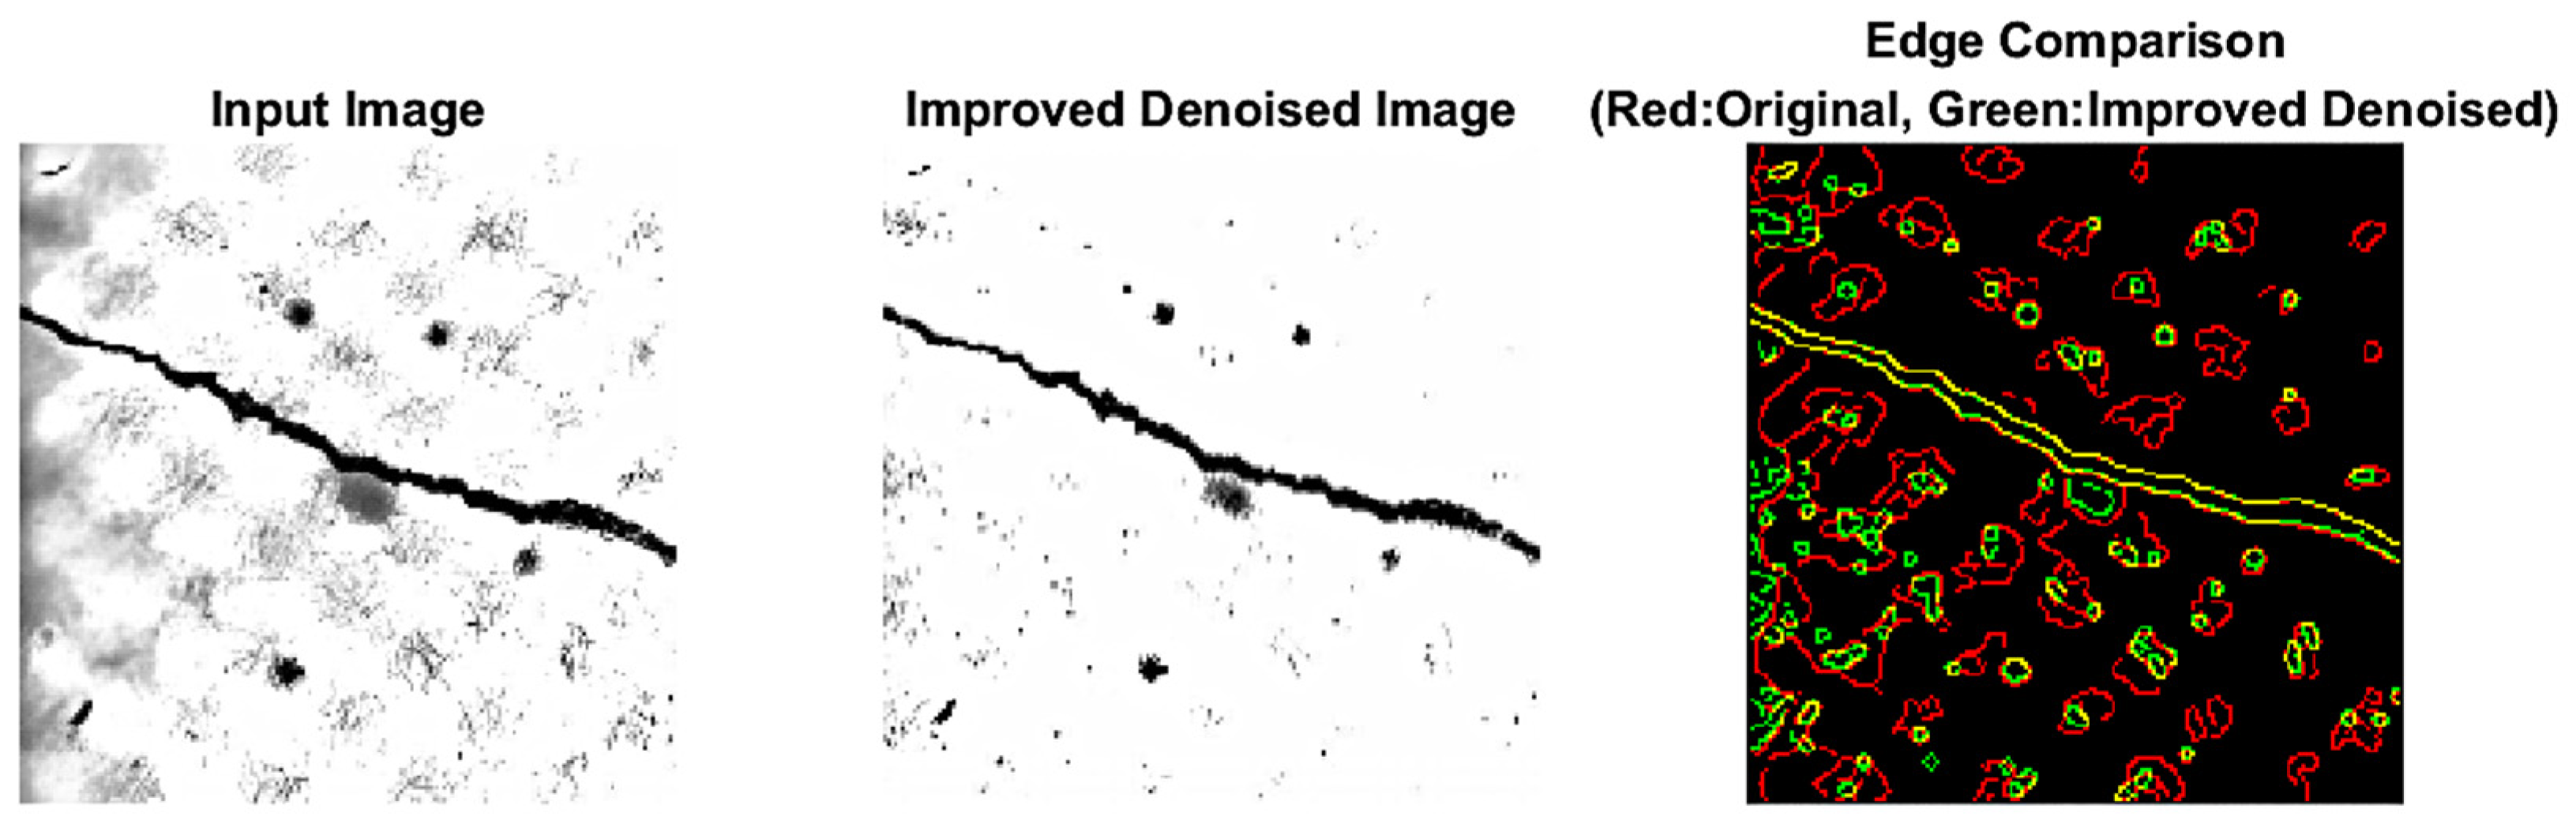
The denoising effect after the improved wavelet processing is shown in Figure 7. Compared to the original noisy image, the processed image achieves high-quality noise suppression, essentially eliminating obvious salt-and-pepper noise and Gaussian noise. While effectively reducing noise, it maximally preserves edge details and texture features, making the image contours clearer and the structure more intact.
Figure 7.
Edge Detection Comparison.
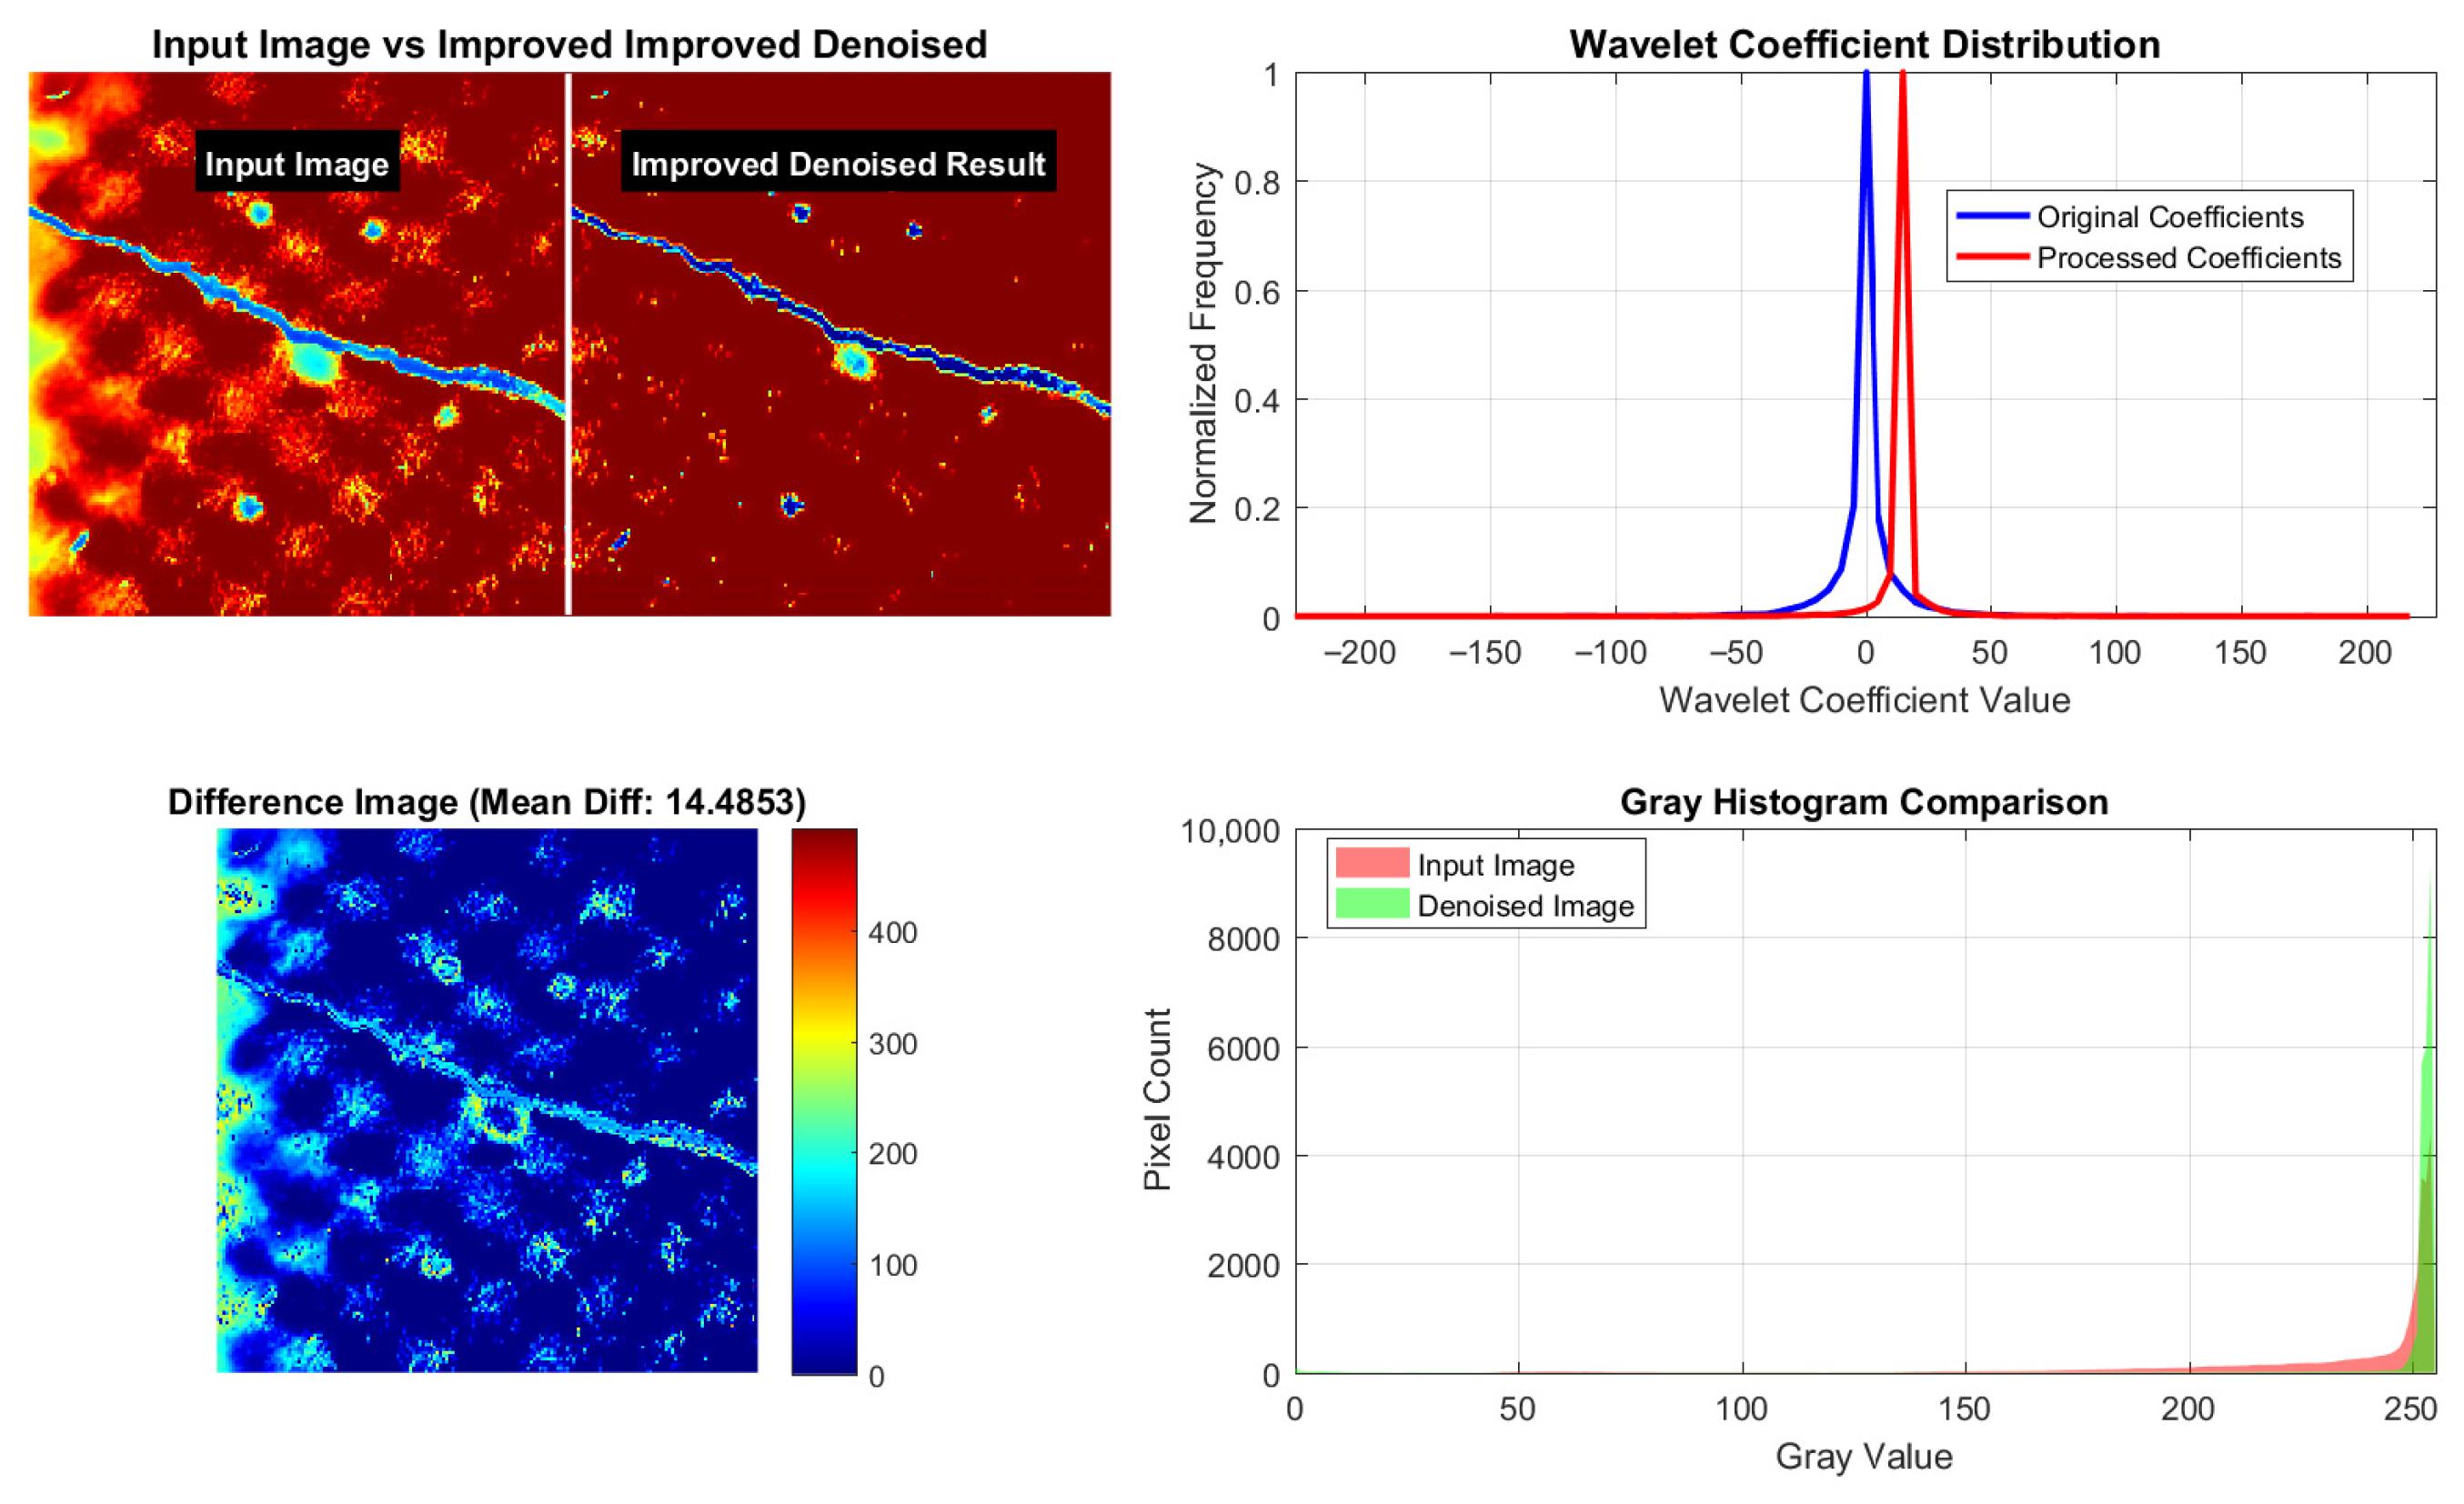
Further analysis of the comparative results, as shown in Figure 8, reveals that in the difference image analysis, the mean difference of 14.4853 is concentrated in the noise regions rather than the edge structures, confirming its selective denoising capability. The wavelet coefficient distribution shows that high-frequency noise coefficients are effectively suppressed while important signal coefficients are well preserved. The grayscale histogram comparison further indicates that the algorithm eliminates statistical anomalies caused by noise while perfectly maintaining the overall contrast and brightness characteristics of the image.
Figure 8.
Comparison of Denoising Effects of the Improved Wavelet Algorithm.
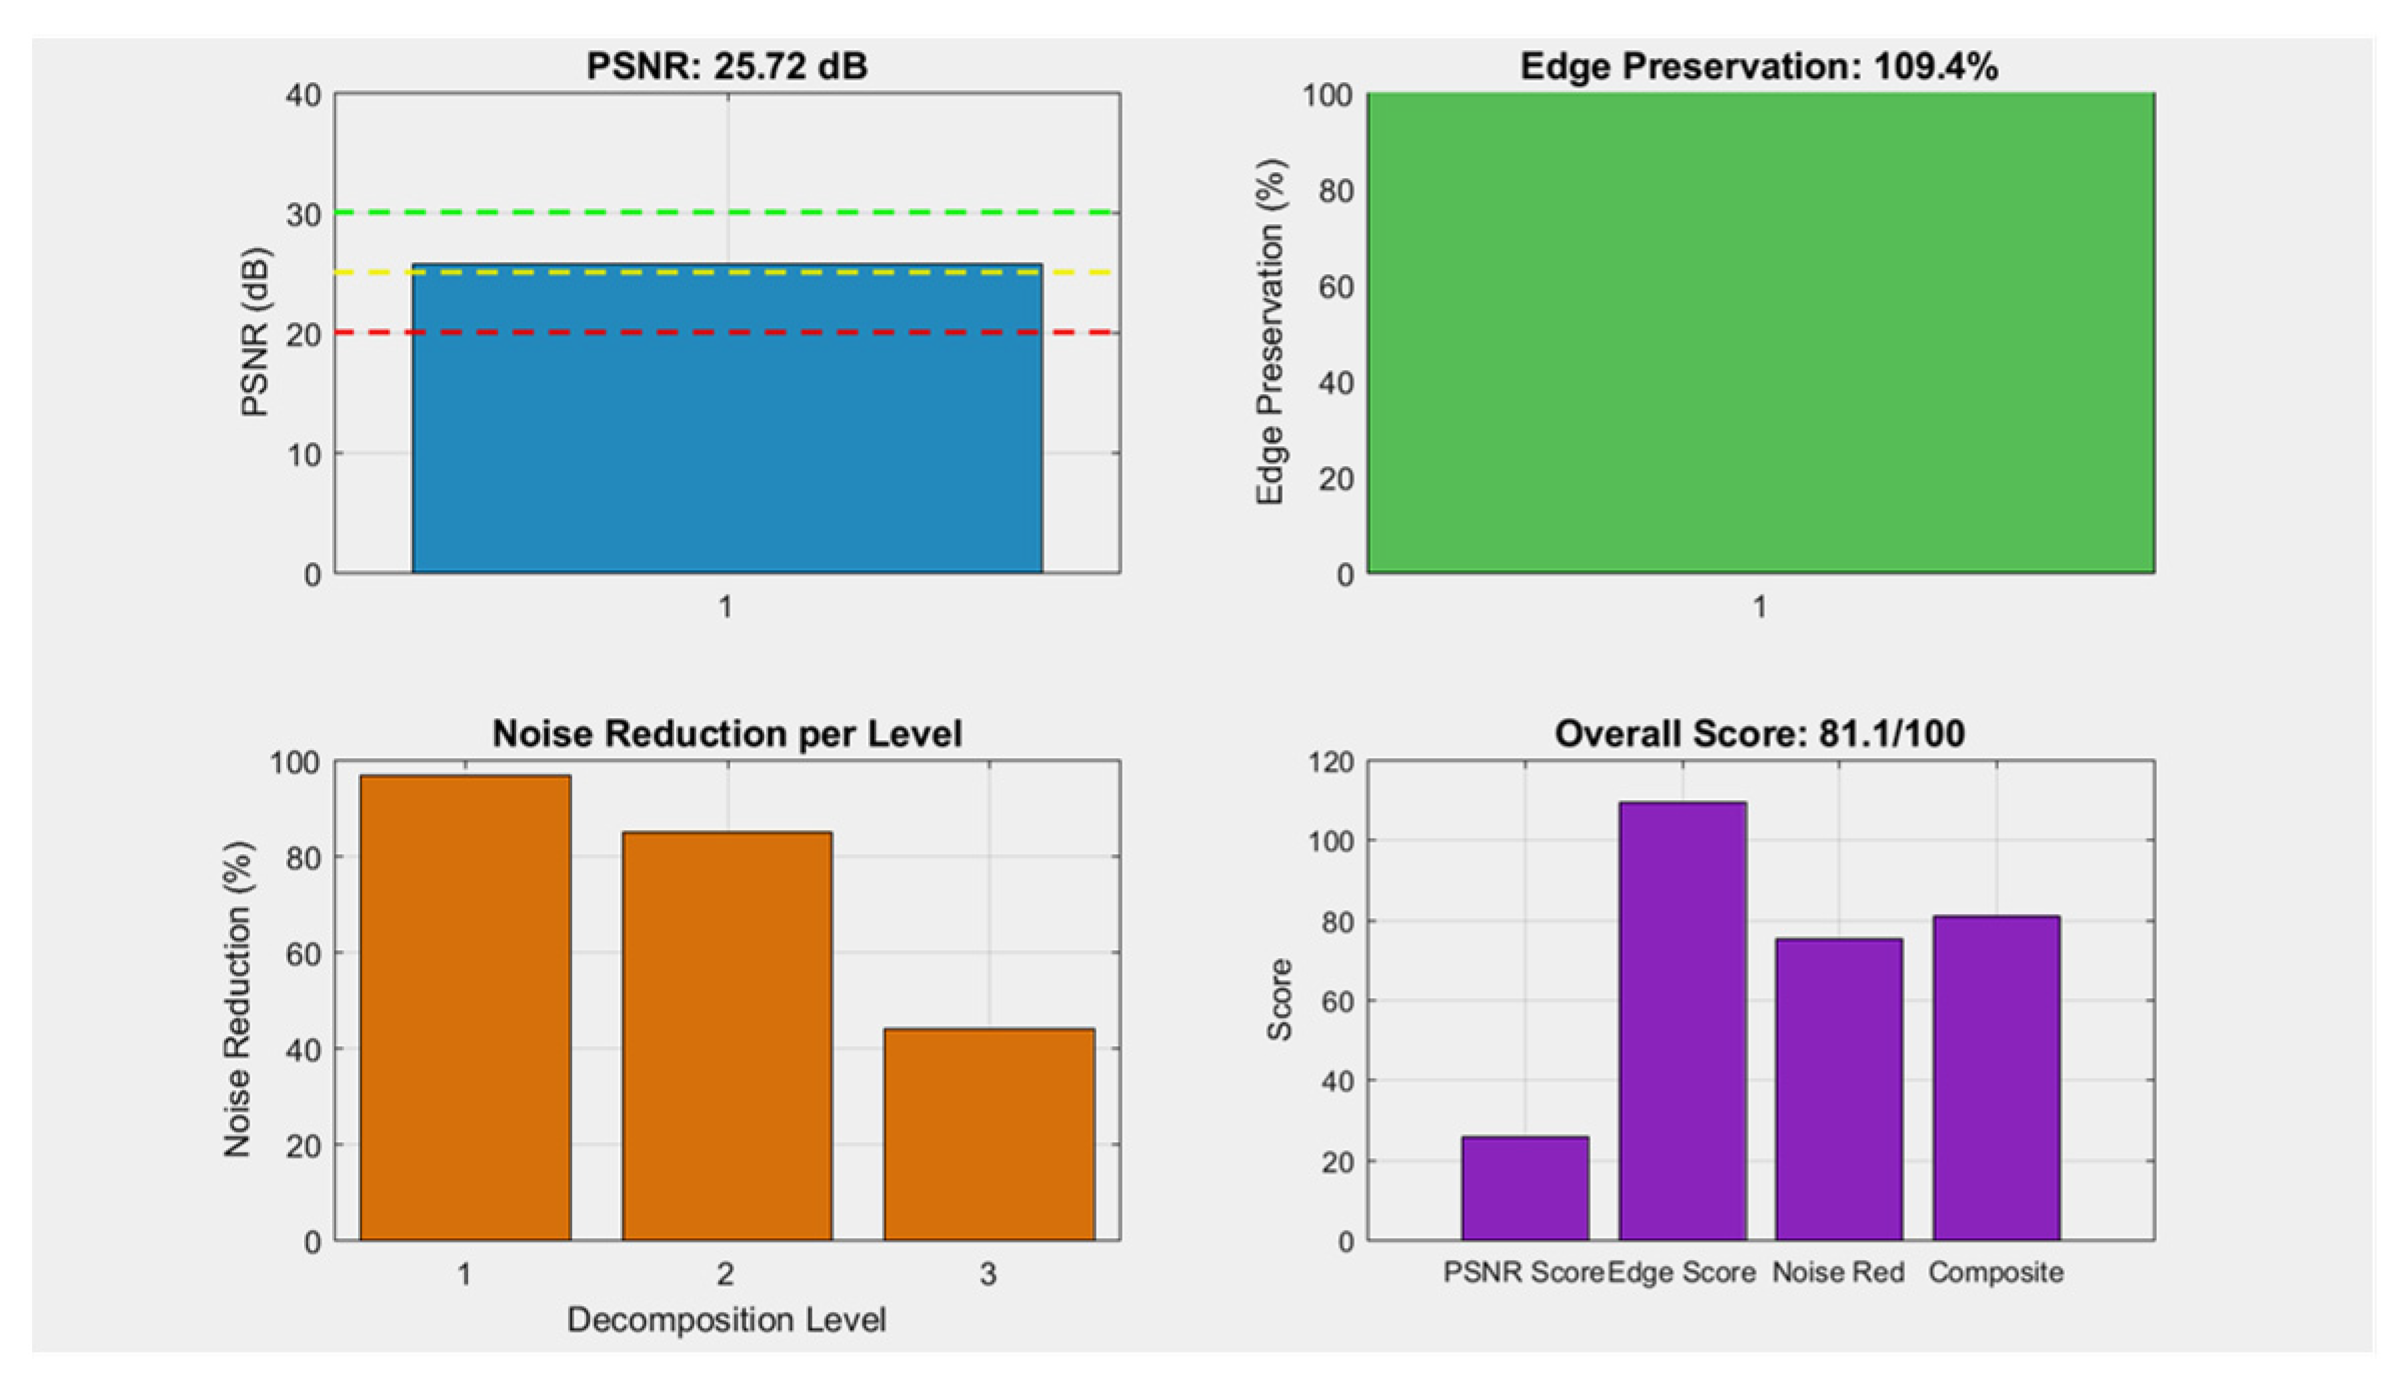
The multi-dimensional performance evaluation and comprehensive score of the improved algorithm are shown in Figure 9. The PSNR test result is 25.72 dB, indicating that the algorithm causes relatively small overall pixel distortion to the image, with an edge preservation rate of 109.4%, which fully retains the original edge structure. The experimental results of the hierarchical denoising rate further demonstrate the algorithm’s performance differences across different decomposition scales: the denoising effect is optimal at Layer 1 (approximately 98%), while it is relatively weaker at Layer 3 (approximately 45%), a phenomenon that is highly consistent with the multi-scale characteristics of wavelet decomposition. Ultimately, the comprehensive score of the algorithm is 81.1/100.
Figure 9.
Multi-dimensional Performance Evaluation and Comprehensive Score of the Improved Algorithm.
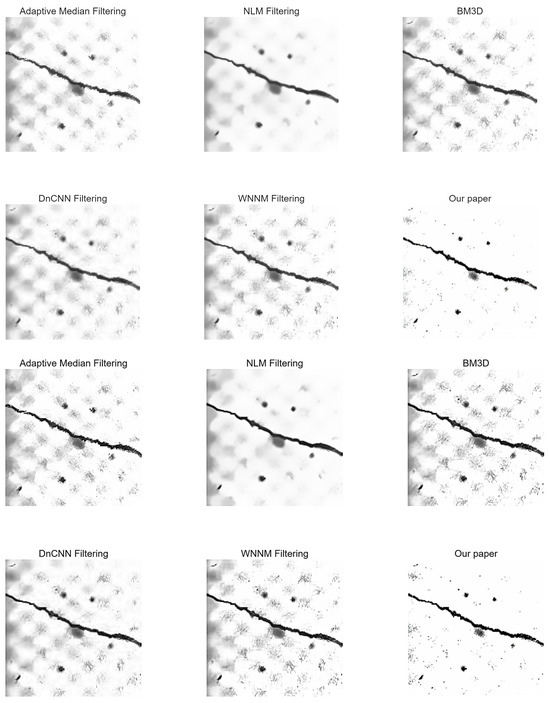
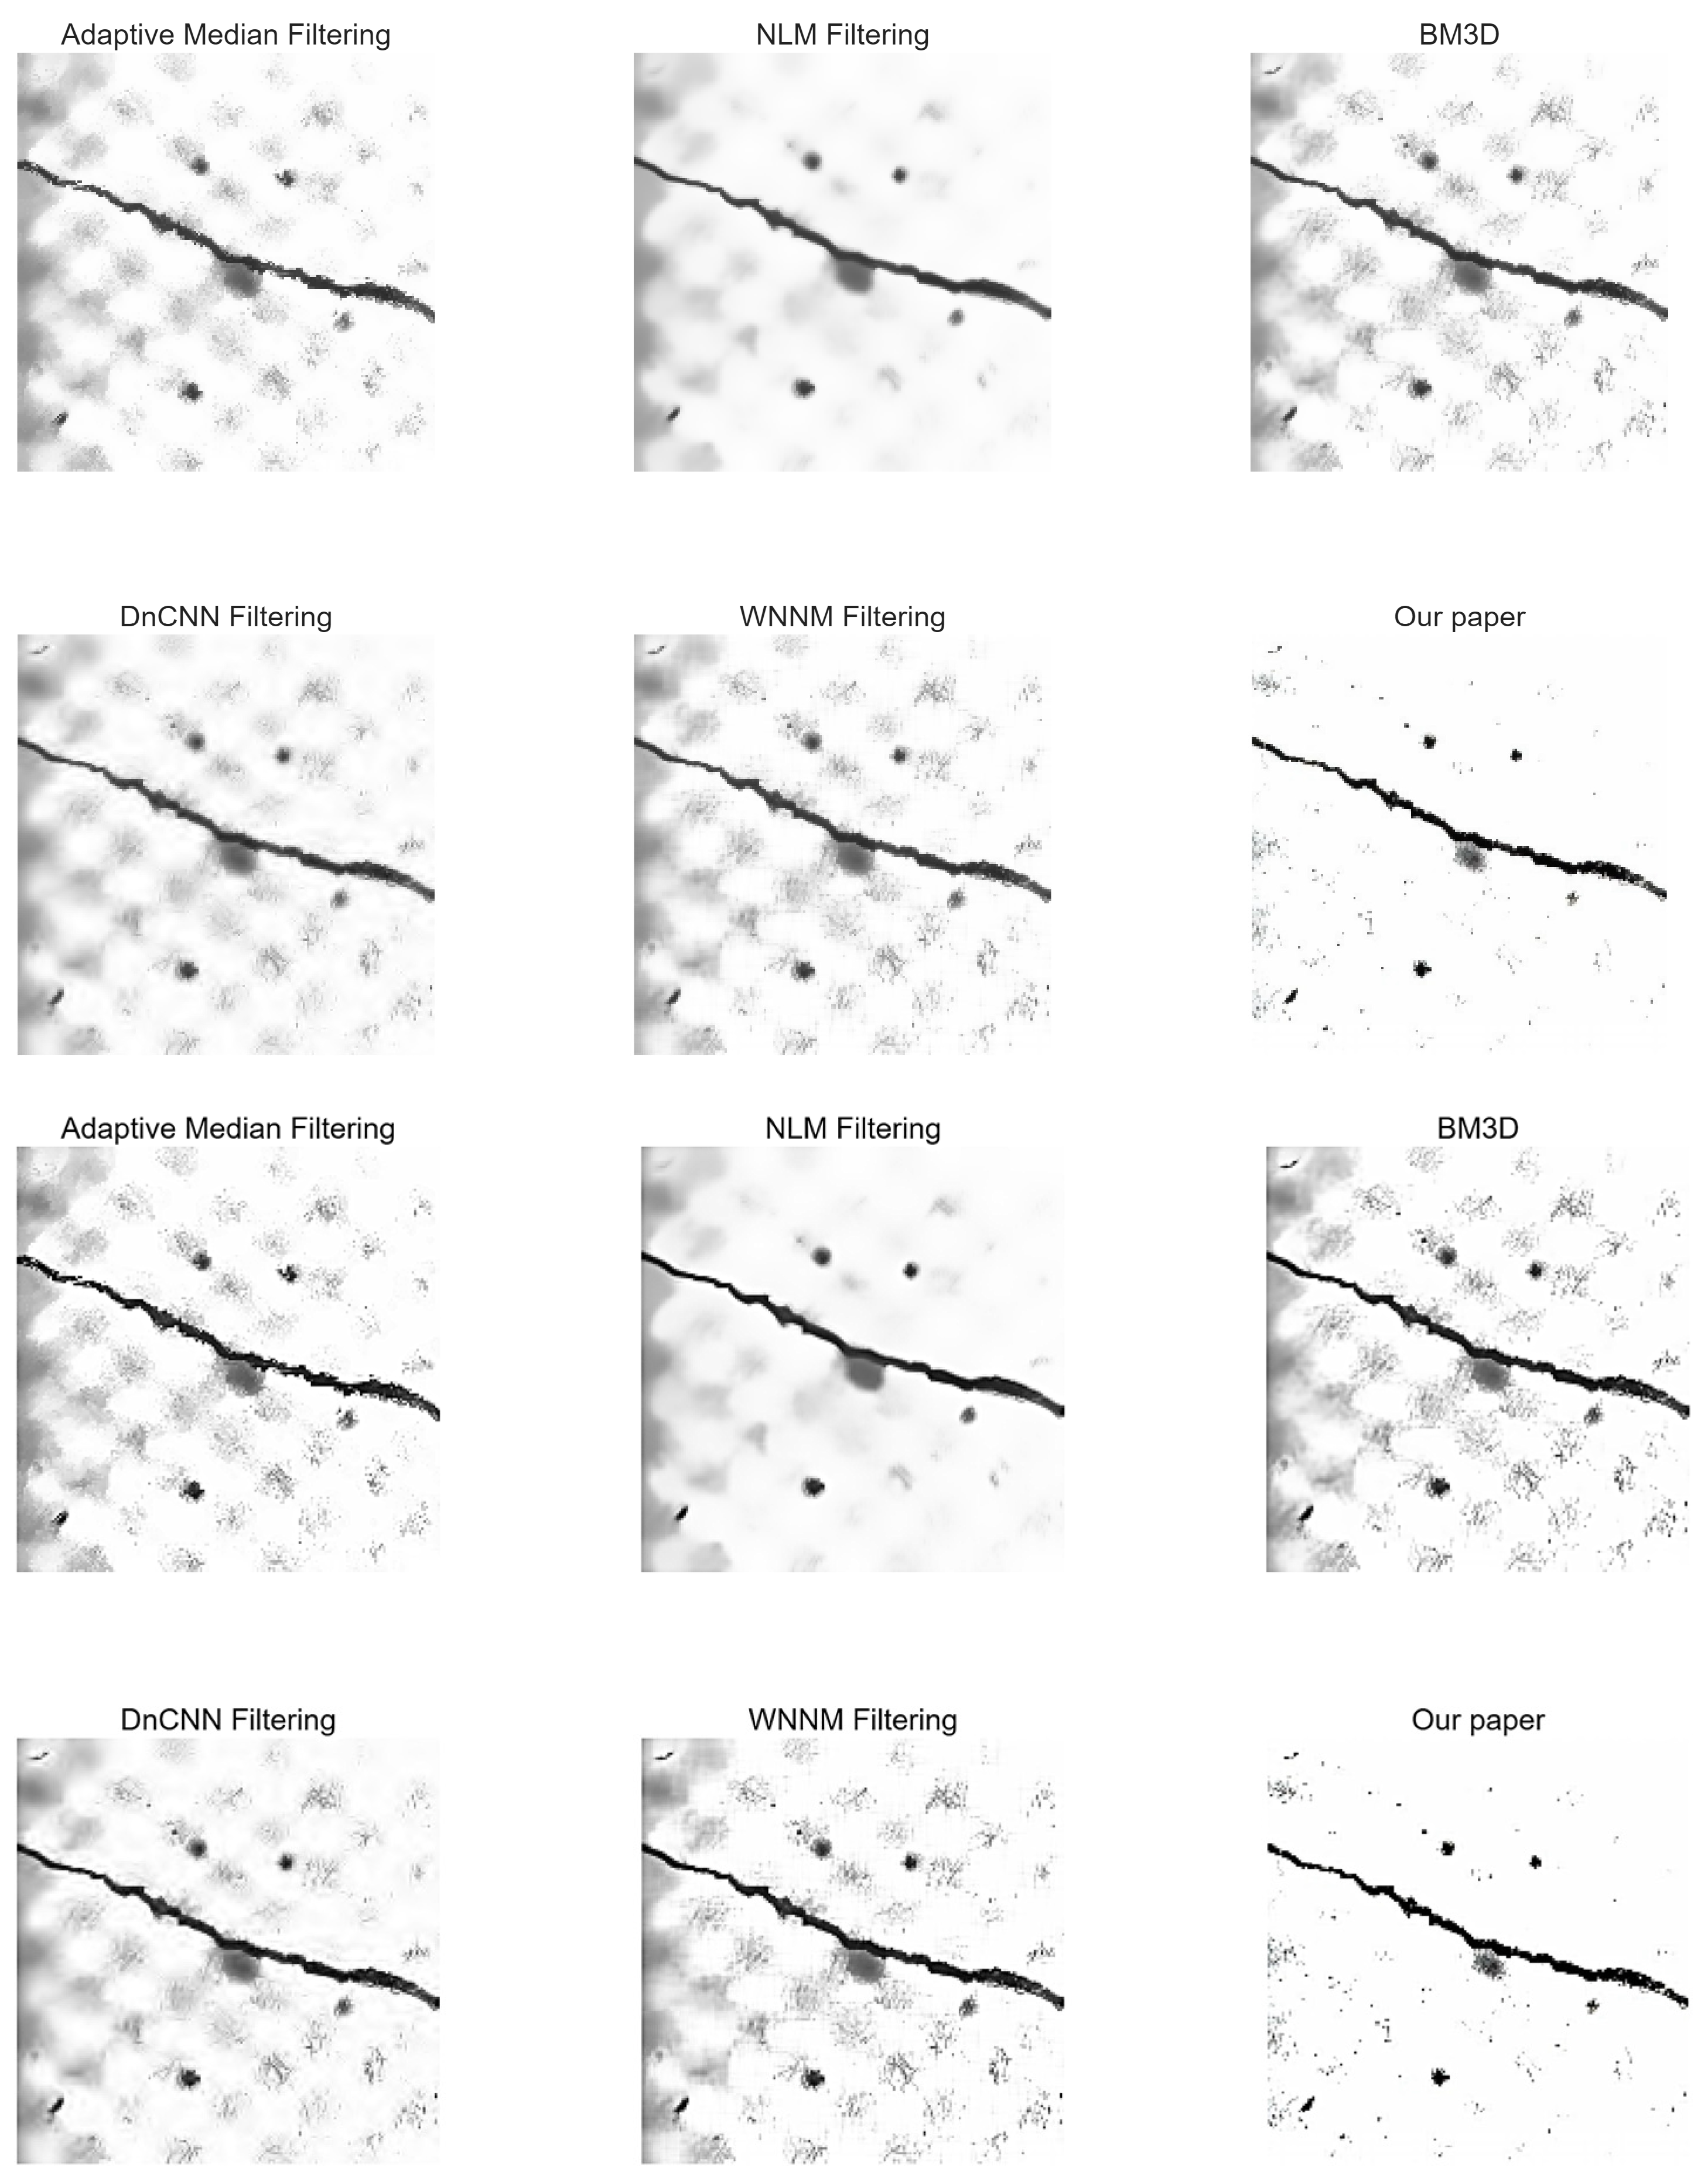
To verify the performance differences of various denoising algorithms in the preprocessing of concrete crack images, this study selects adaptive median filtering, NLM, BM3D, DnCNN, WNNM, and the improved wavelet algorithm proposed in this paper for comparative experiments. As shown in Figure 10, the algorithms are evaluated from two dimensions: visual effects and quantitative metrics, in terms of noise suppression capability, edge preservation accuracy, and computational efficiency.
Figure 10.
Visual Representation Comparison of Concrete Crack Images after Processing by Different Denoising Algorithms.
From the visual representation of the images, the processing effects of different denoising algorithms show significant differences: Adaptive median filtering exhibits the weakest ability to suppress background speckle noise, with the image still containing a large amount of granular noise, blurred crack edges, and severe loss of texture details; NLM filtering significantly reduces background noise but causes obvious smoothing and blurring of crack contours, leading to the loss of fine texture features; BM3D and WNNM filtering can better preserve the continuous edges of cracks, but some granular noise remains in the background, and the overall visual clarity needs improvement; DnCNN filtering has moderate noise suppression and edge preservation effects, without presenting outstanding advantages. In contrast, the improved wavelet algorithm proposed in this paper effectively clears background noise while completely retaining the sharp edges and fine textures of cracks, visually presenting the clearest crack structure and providing high-quality image input for subsequent crack size measurements.
To more objectively evaluate the comprehensive performance of each denoising algorithm, this study quantitatively compares them from three dimensions: noise suppression capability, edge preservation accuracy, and computational efficiency, with results shown in Table 5.
Table 5.
Quantitative Comparison of the Performance of Different Denoising Algorithms.
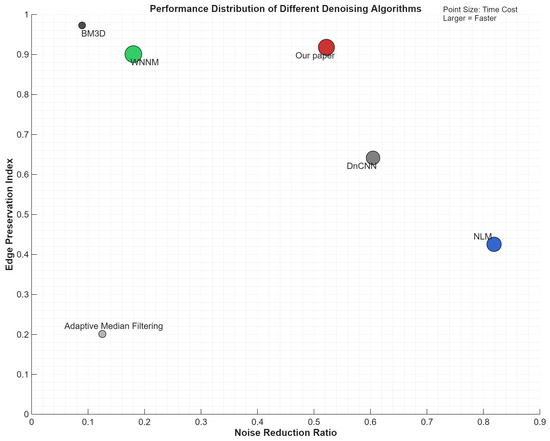
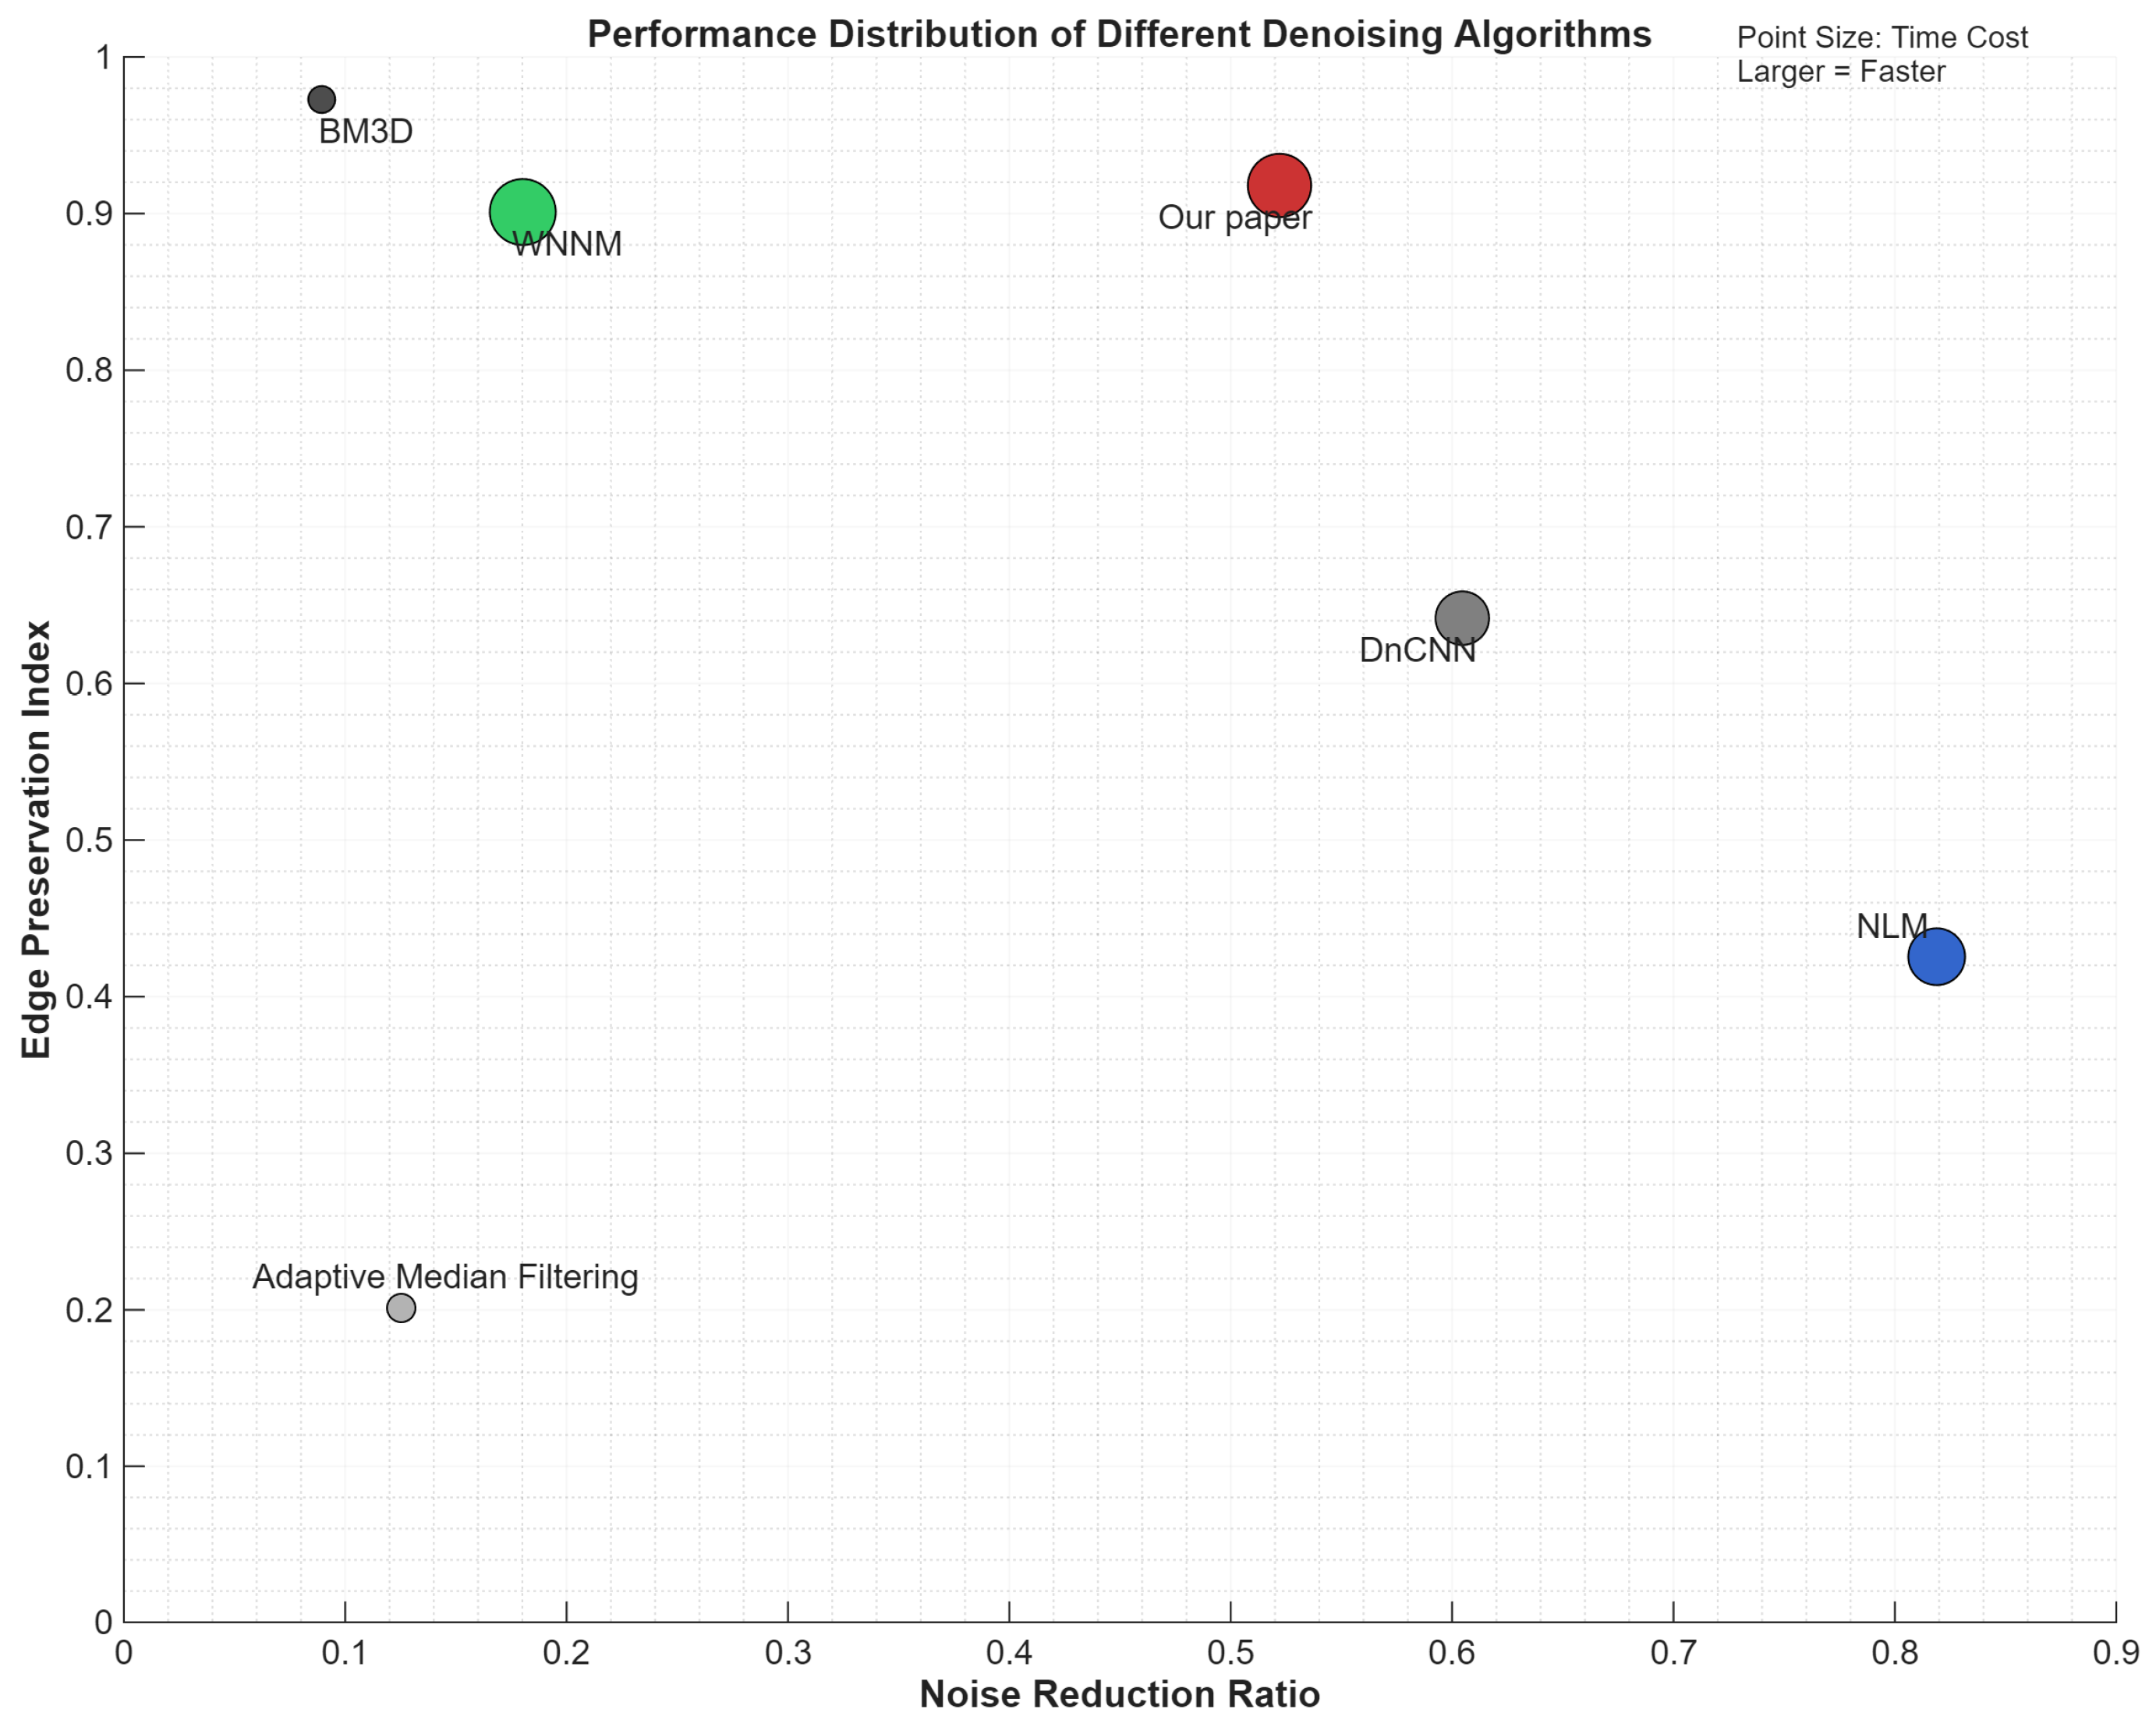
The quantitative results further validate the visual observations: NLM filtering exhibits the strongest noise suppression capability (0.8189) but the worst edge preservation performance (0.4253); BM3D filtering achieves the optimal edge preservation performance (0.9727) but requires a long computation time; the improved wavelet algorithm proposed in this paper achieves the optimal balance among noise suppression (0.5219), edge preservation (0.9180), and computational efficiency (0.1117 s), meeting the real-time detection requirements of engineering scenarios.
To more intuitively present this performance difference and trade-off relationship, we visualize the quantitative results from Table 5 through a scatter plot. As can be clearly seen in Figure 11, the performance point of our proposed algorithm is located in the balanced region of high edge preservation and moderate noise suppression, which is completely consistent with the conclusions of the quantitative analysis in the table and intuitively verifies its optimal balance among noise suppression, edge preservation, and computational efficiency.
Figure 11.
Scatter Plot Comparison of Multi-index Performance Distribution of Denoising Algorithms.
4.2. Noise Post-Processing Based on Dynamic Threshold Connected Component Analysis
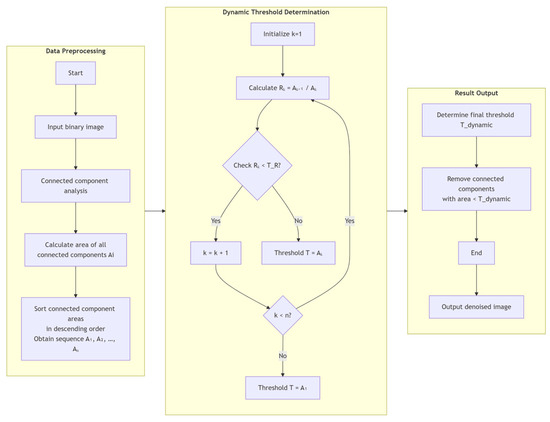
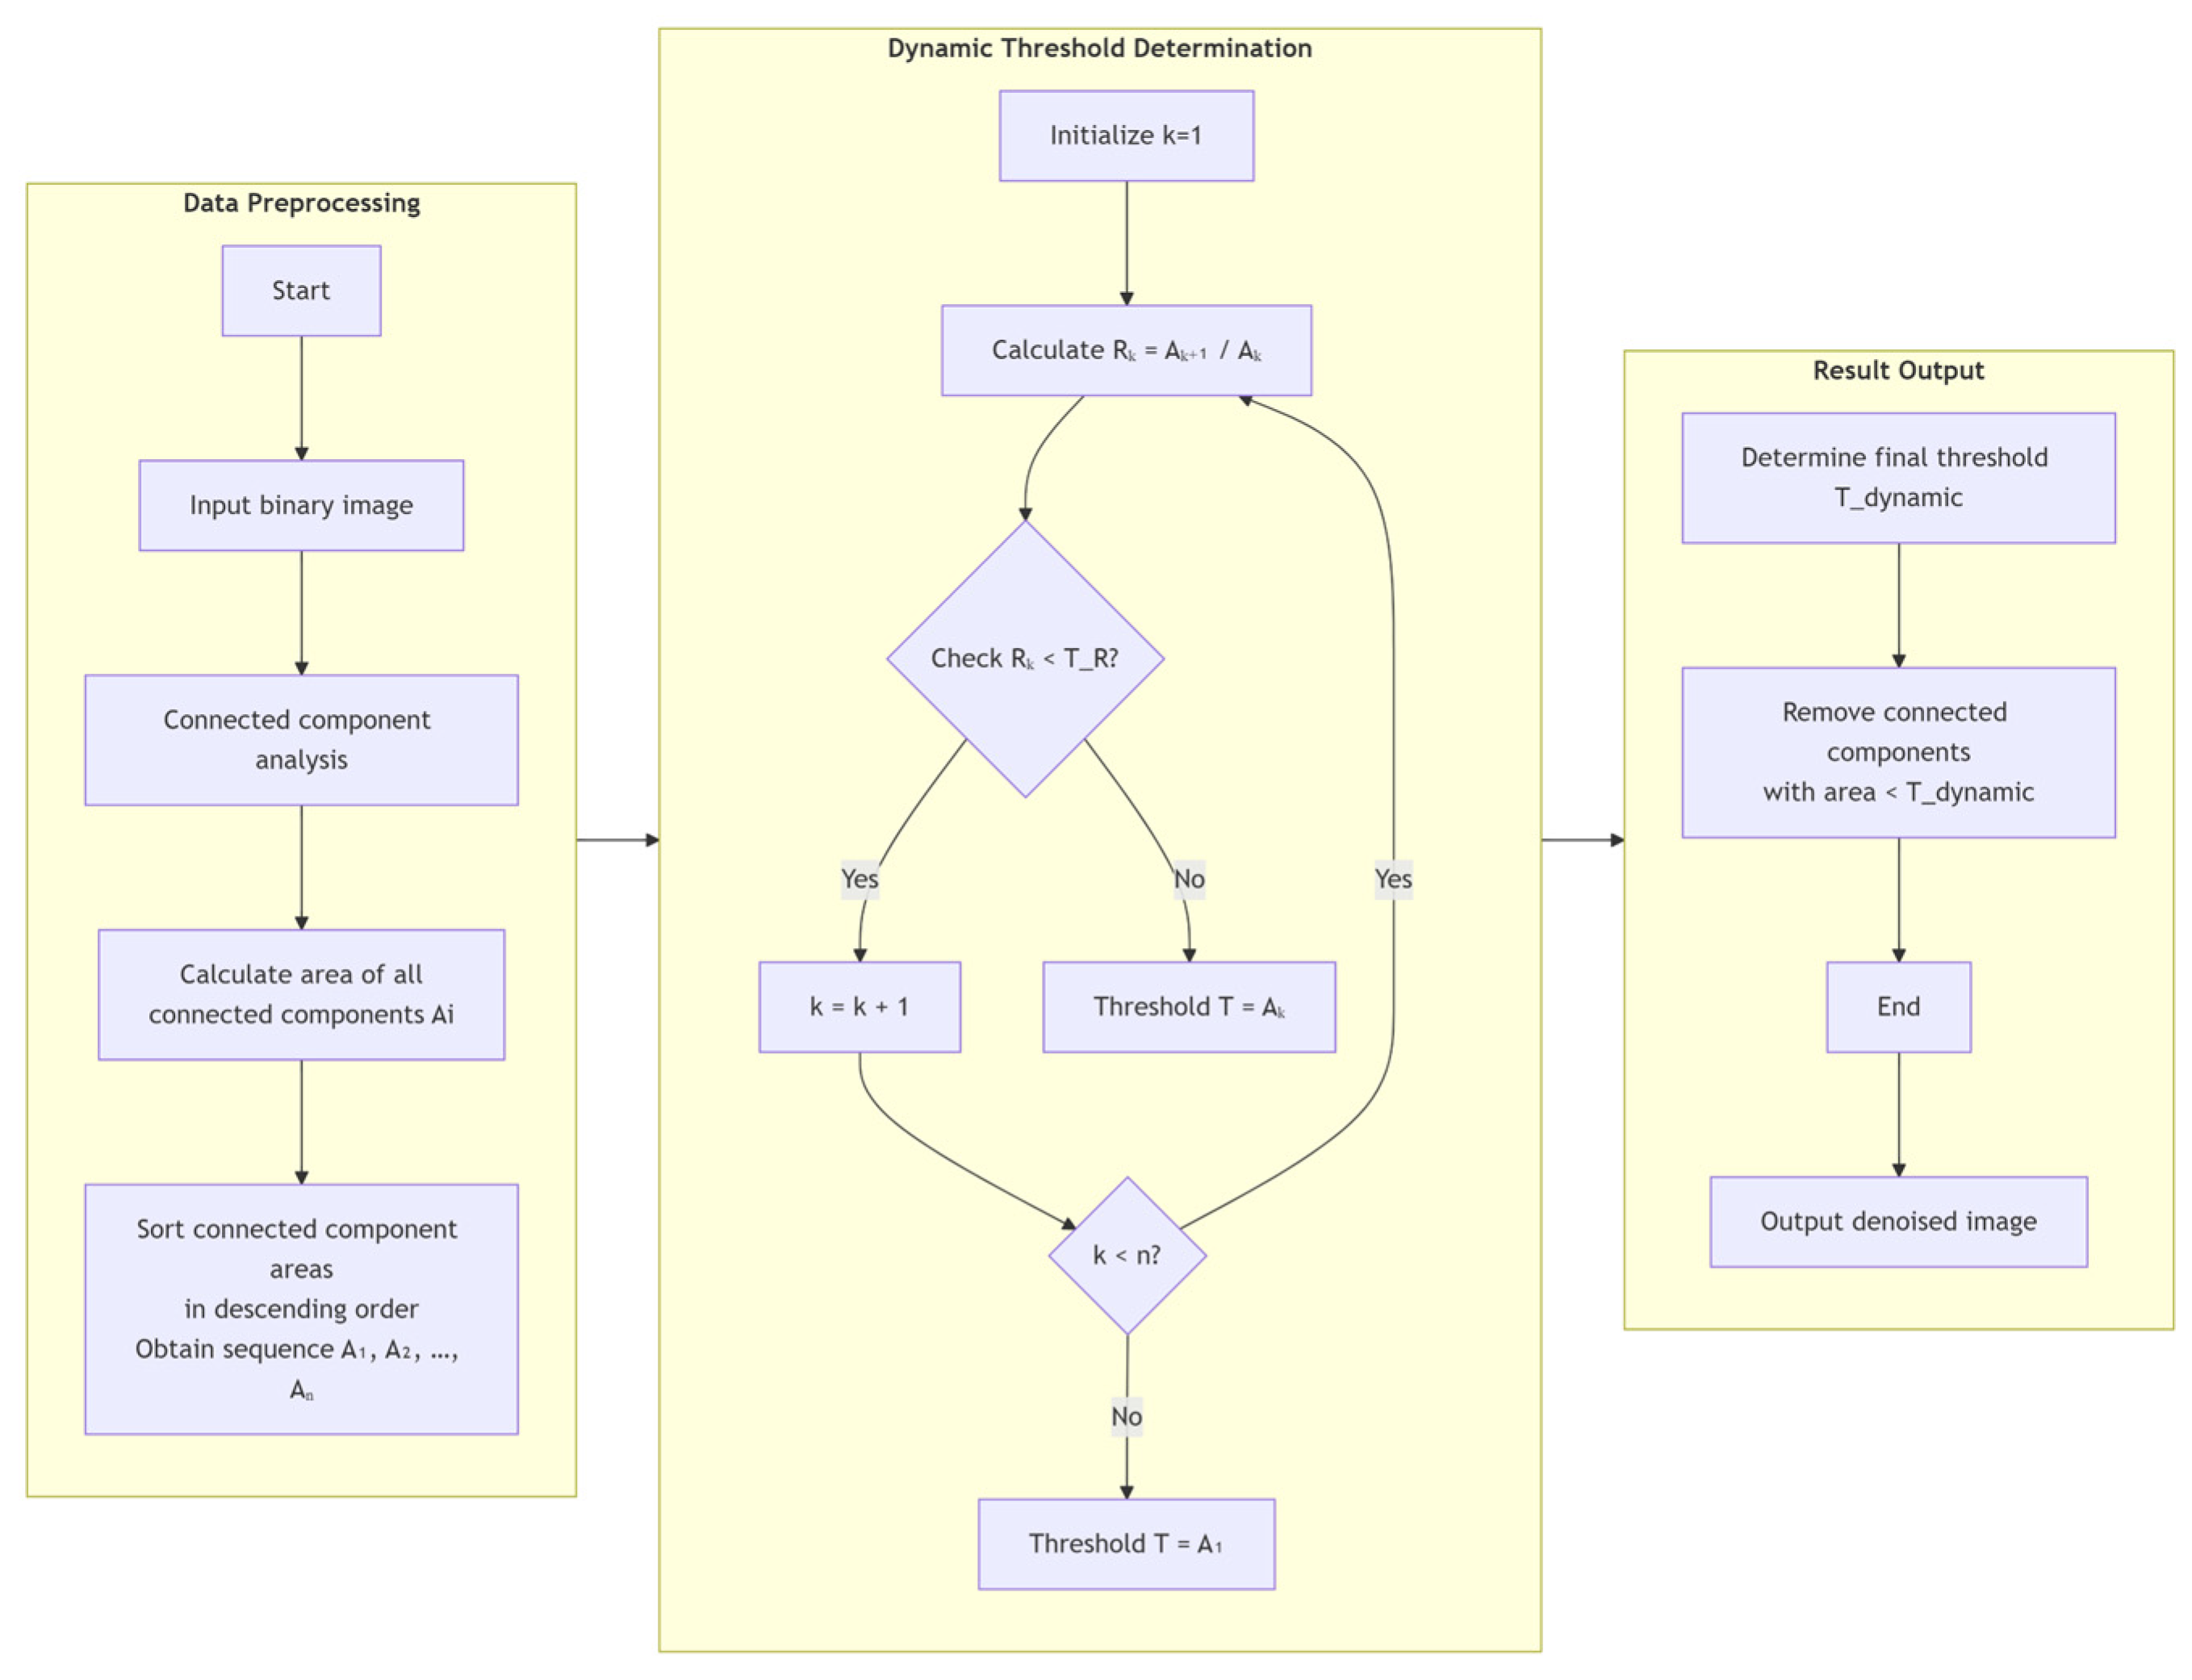
After wavelet denoising, the image still contains discrete point, block-like noise (originating from texture interference, method limitations, and binarization artifacts), which can easily lead to misjudgment in subsequent skeleton extraction and affect parameter accuracy [24,25]. To this end, this study introduces a noise post-processing module based on dynamic threshold connected component filtering. Unlike traditional fixed-threshold methods, this approach adaptively determines the threshold based on the statistical distribution characteristics of the connected component areas. The core principle is: real cracks and noise-connected components differ significantly in area, and in the area descending sequence, a distinct “steep drop” point will emerge, which can achieve effective separation.
Let all connected components in the image be arranged in descending order of area as sequence , where is the area of the largest connected component. Define the adjacent area ratio as:
where represents the area ratio between the -th connected component and the next one.
By analyzing a large number of concrete crack image samples, it is found that when is less than a certain threshold , it typically signifies the transition from primary crack structures to secondary noise. Therefore, the dynamic threshold is defined as:
Based on the above definition, the dynamic threshold selection algorithm flow is shown in Figure 12. The algorithm traverses the sorted connected component area sequence to find the first position where is satisfied, and uses the corresponding area as the dynamic threshold.
Figure 12.
Flowchart of the Dynamic Threshold Selection.
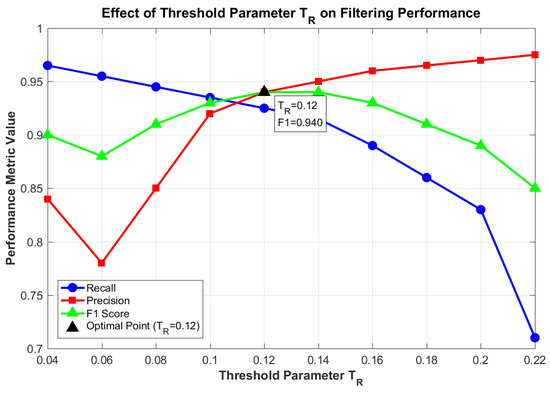
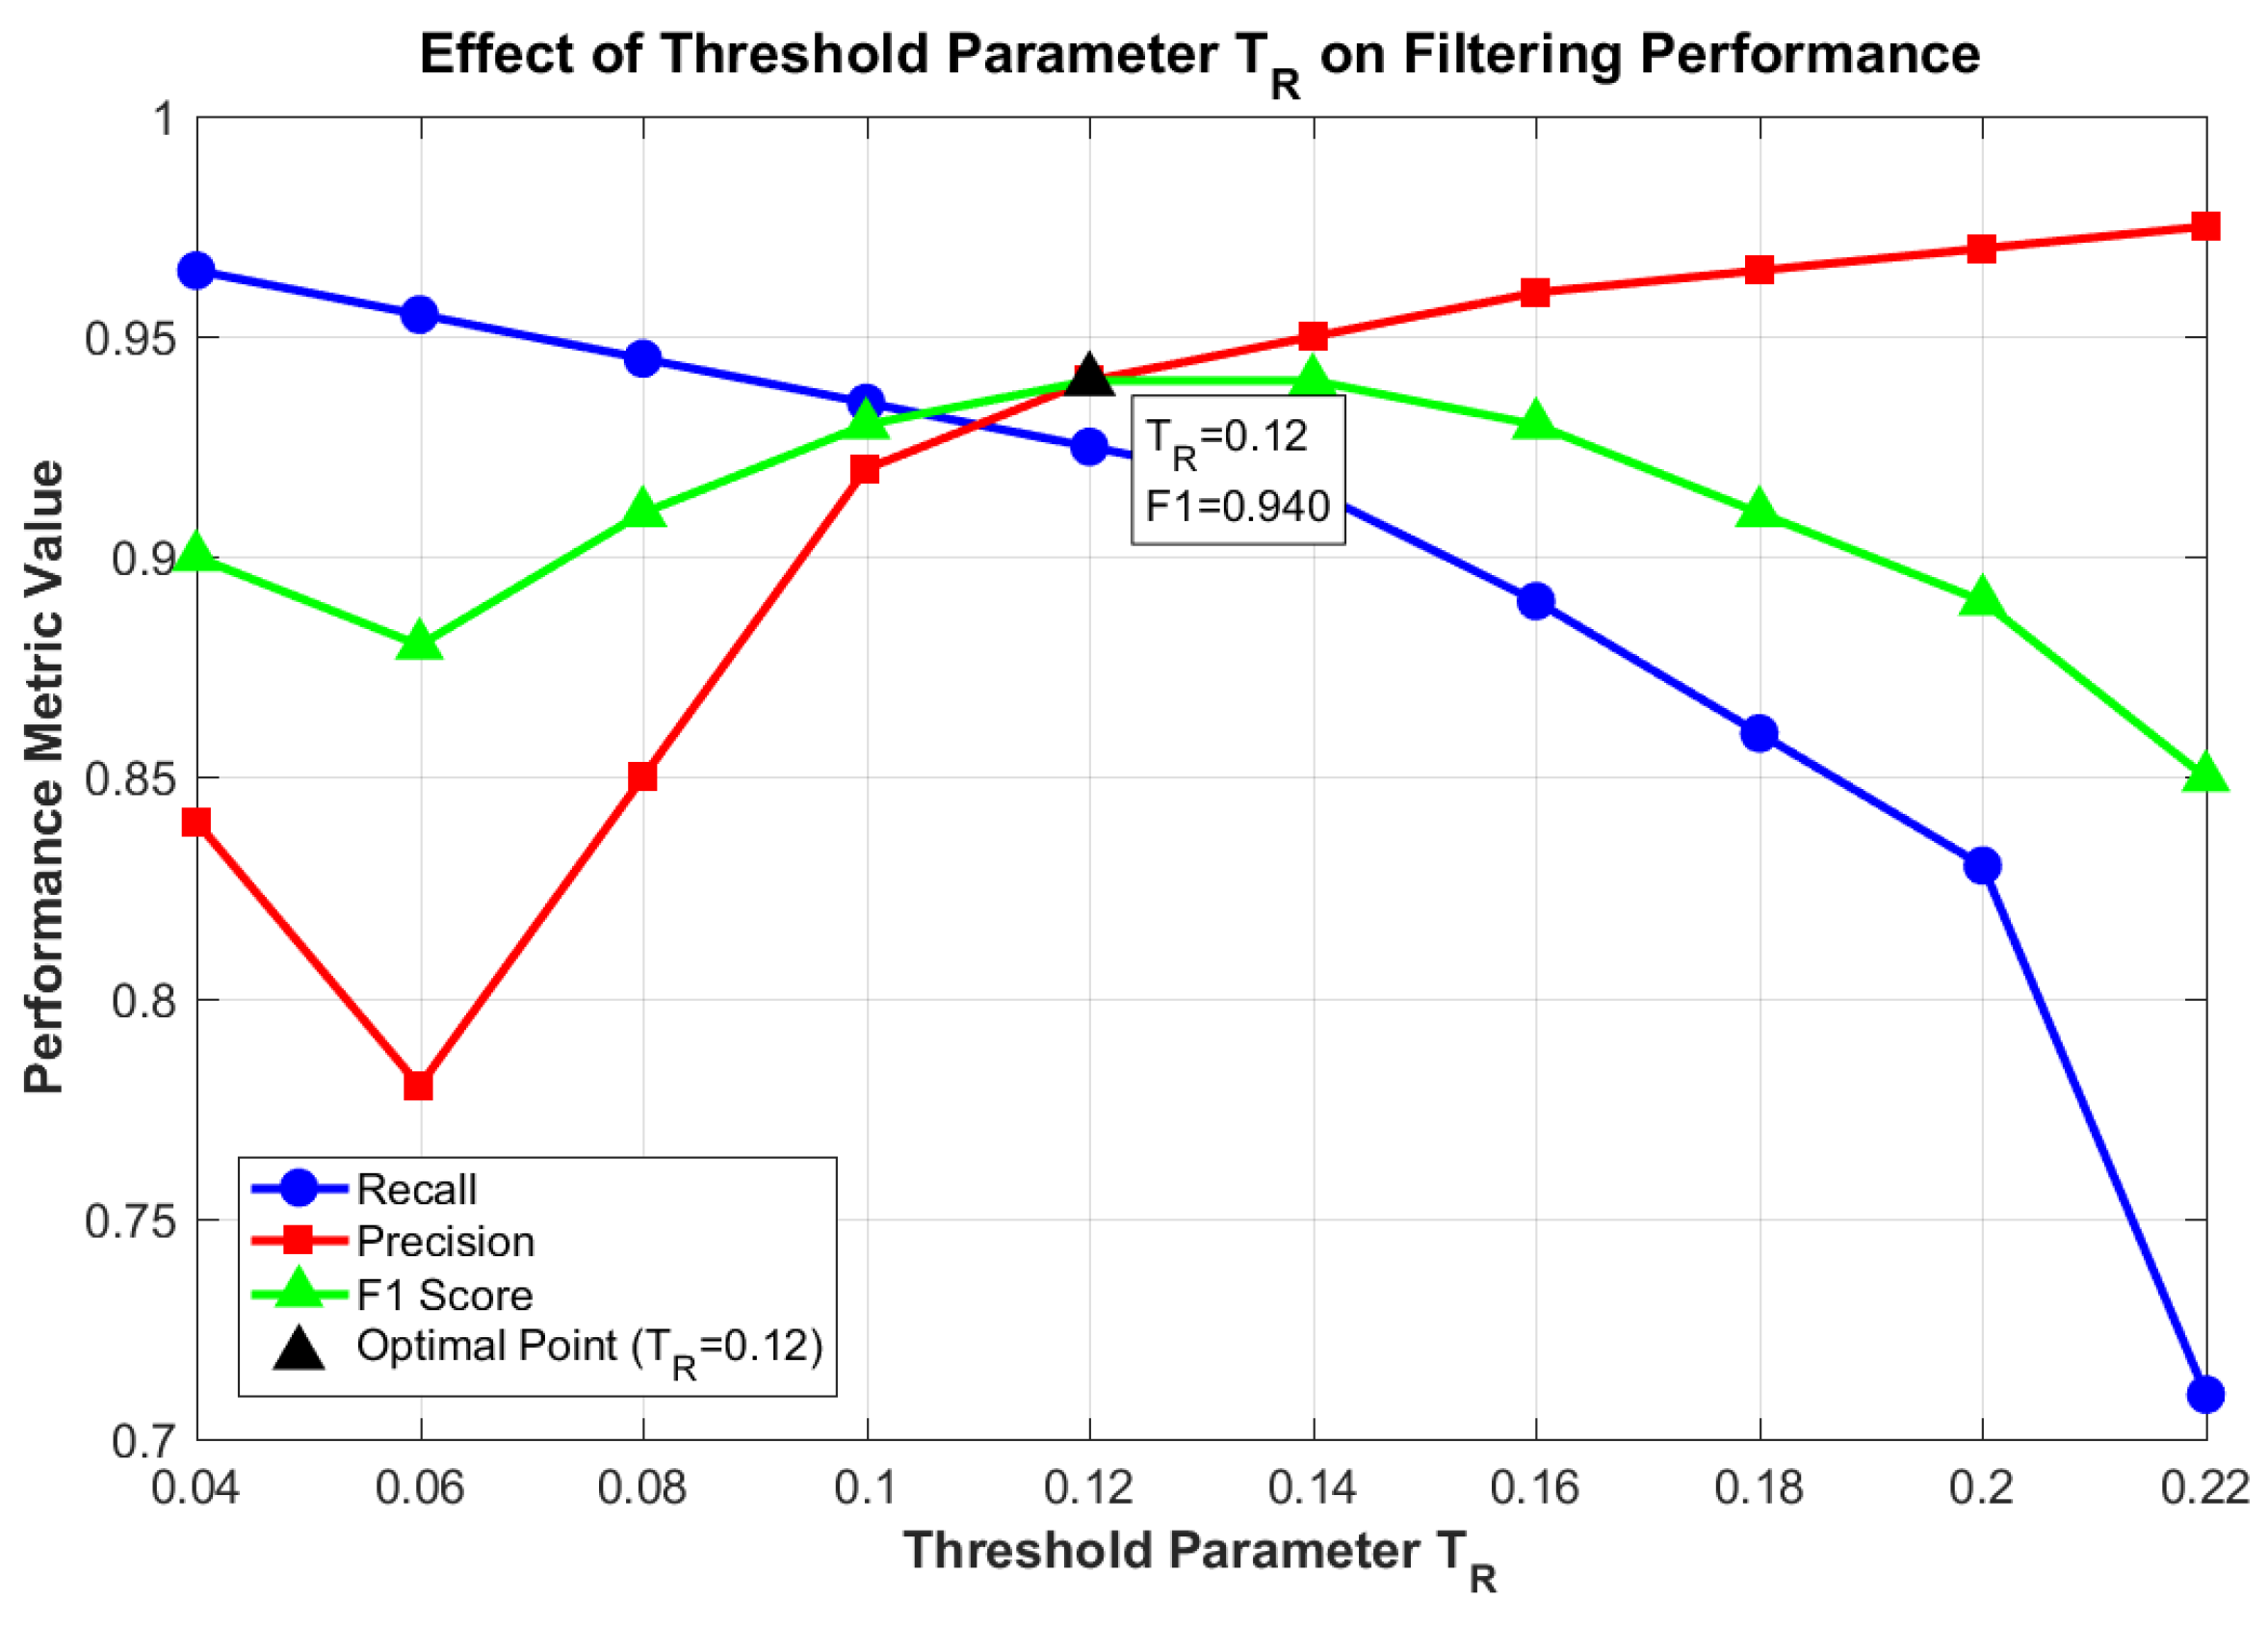
To determine the optimal value, parameter sensitivity analysis was conducted on the 200 crack images from the DeepCrack sequence according to the algorithm. As shown in Figure 13, as increases from 0.05 to 0.20, the recall rate (blue solid line) gradually decreases from 0.98 to 0.72, while the precision rate (red dashed line) monotonically increases from 0.75 to 0.96. This reflects the inherent trade-off between recall and precision. The F1 score (green dotted line), as a comprehensive indicator, reaches its maximum value of 0.94 at , indicating that at this parameter setting, the algorithm achieves the optimal balance between “retaining as many true cracks as possible” and “filtering out as much noise as possible.”
Figure 13.
Impact of Threshold Parameter A on Filtering Performance.
To evaluate the algorithm’s sensitivity to parameter , perturbation tests were conducted in its vicinity around the optimal value . The experiments show that when fluctuates within the range [0.10, 0.14], the decline in the comprehensive evaluation metric, the F1 score, does not exceed 3% (decreasing from a peak of 0.94 to no lower than 0.91). This indicates that the algorithm is not highly sensitive to variations of this key parameter within a certain range and possesses good operational robustness. In practical applications, if the noise and crack area distribution characteristics of the image to be processed are similar to those of the training set, setting within the interval 0.12 ± 0.02 can achieve stable and good performance. All subsequent experiments in this paper use as the decision condition for dynamic threshold selection.
After obtaining the area threshold through the above dynamic threshold selection algorithm (where is determined by the decision of ), a filtering decision is made for each connected component : if its area is less than , all pixel values within that connected component are set to 0 (i.e., considered as noise and removed); otherwise, they are retained. The mathematical expression is as follows:
To prevent extreme cases, based on statistical analysis of noise-connected component areas in the training set images, a lower bound of 4 pixels is set to filter out isolated point noise, and an upper bound of 200 pixels is set to retain the largest possible crack-connected components while preventing area calculation anomalies, i.e., .
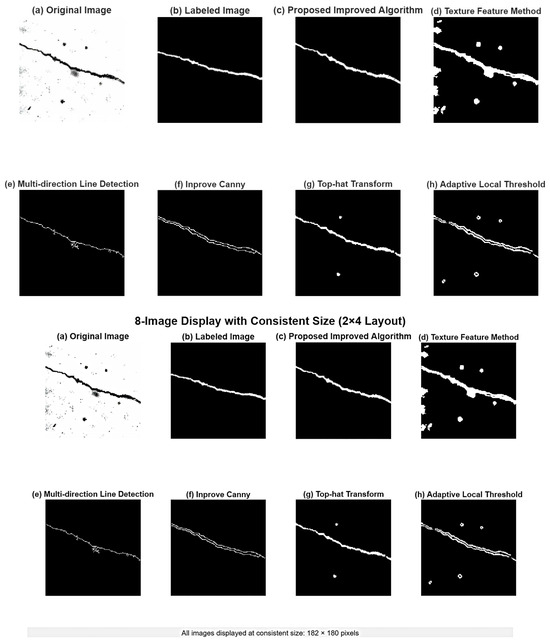
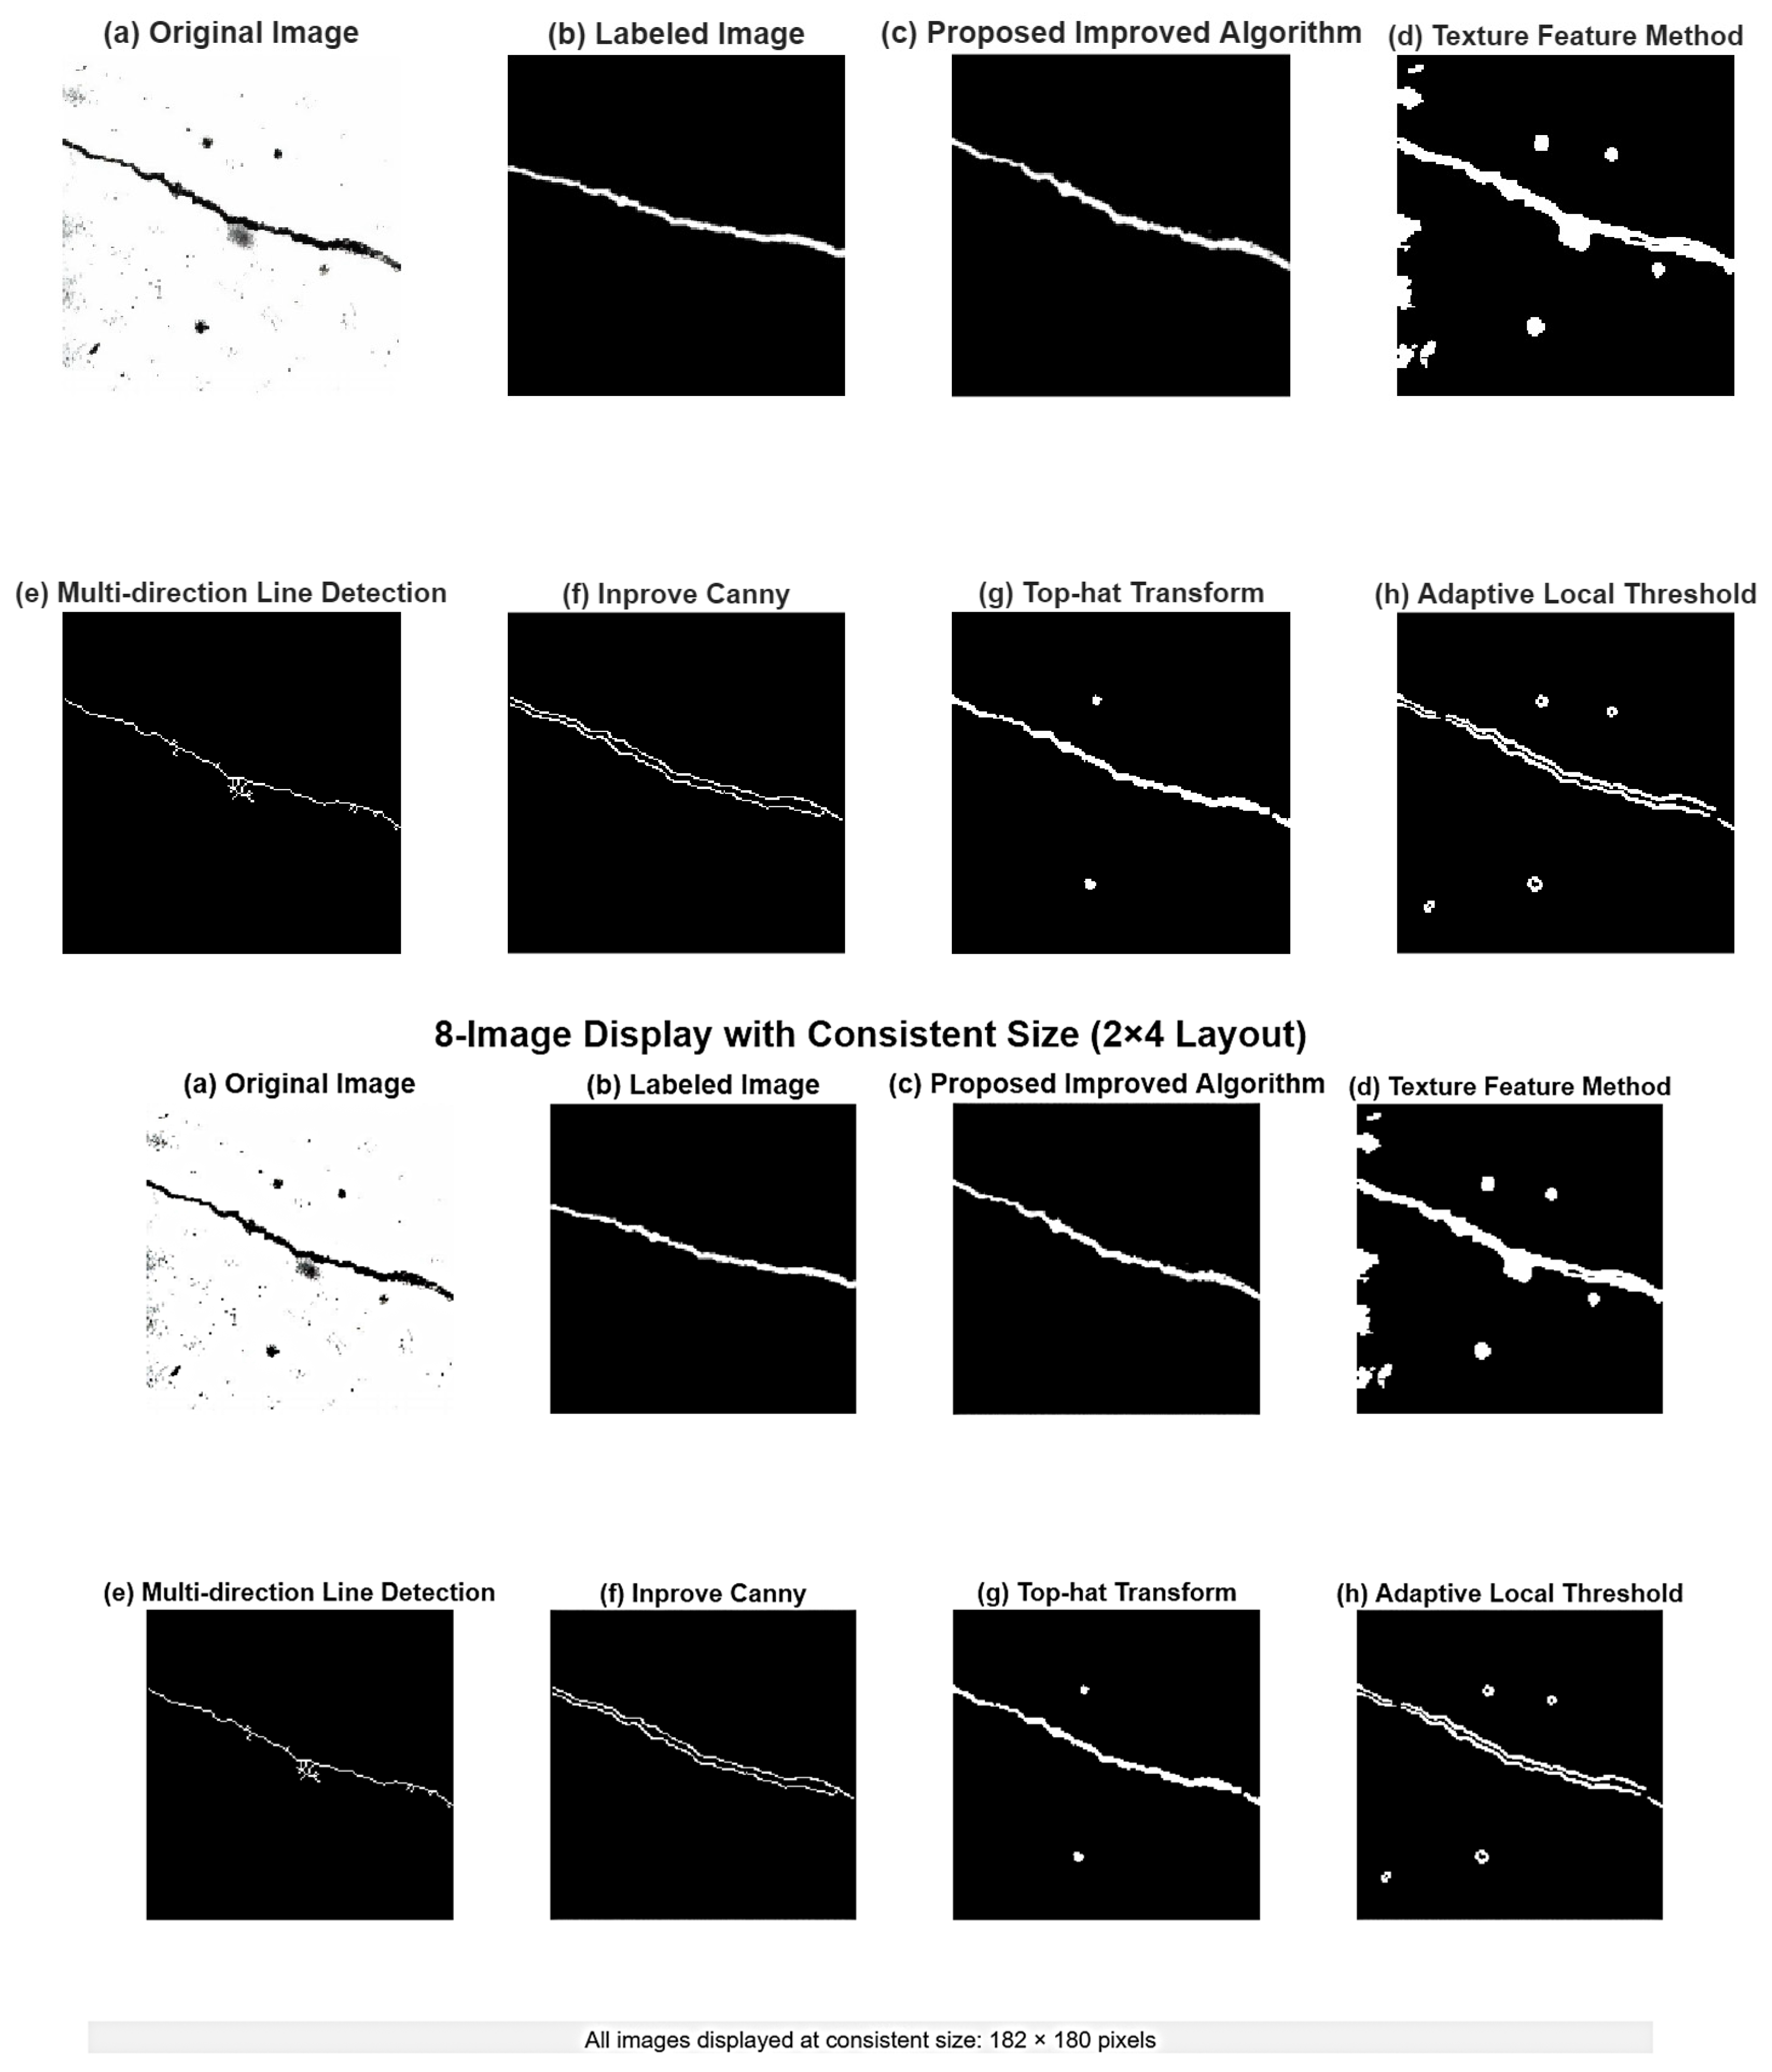
Comparative results of different edge detection and image enhancement algorithms are shown in Figure 14. Among them, (a) is the original image; (b) is the manually annotated true edges; (c) is the detection result of the improved algorithm proposed in this paper; (d) is the edge extracted based on texture features; (e) is the processing effect of the multi-directional line detection method; (f) is the output of the improved Canny algorithm; (g) is the enhancement result based on top-hat transformation; (h) is the binary image after adaptive local threshold segmentation. Visually, the improved algorithm (c) proposed in this paper shows more balanced performance in edge continuity, detail preservation, and noise suppression, and its edge structure is closer to the true annotation (b) than other methods, demonstrating its robustness and accuracy in complex scenes.
Figure 14.
Detection Results of Different Denoising Algorithms.
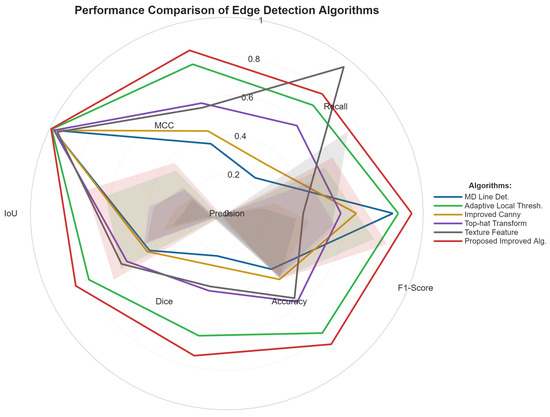
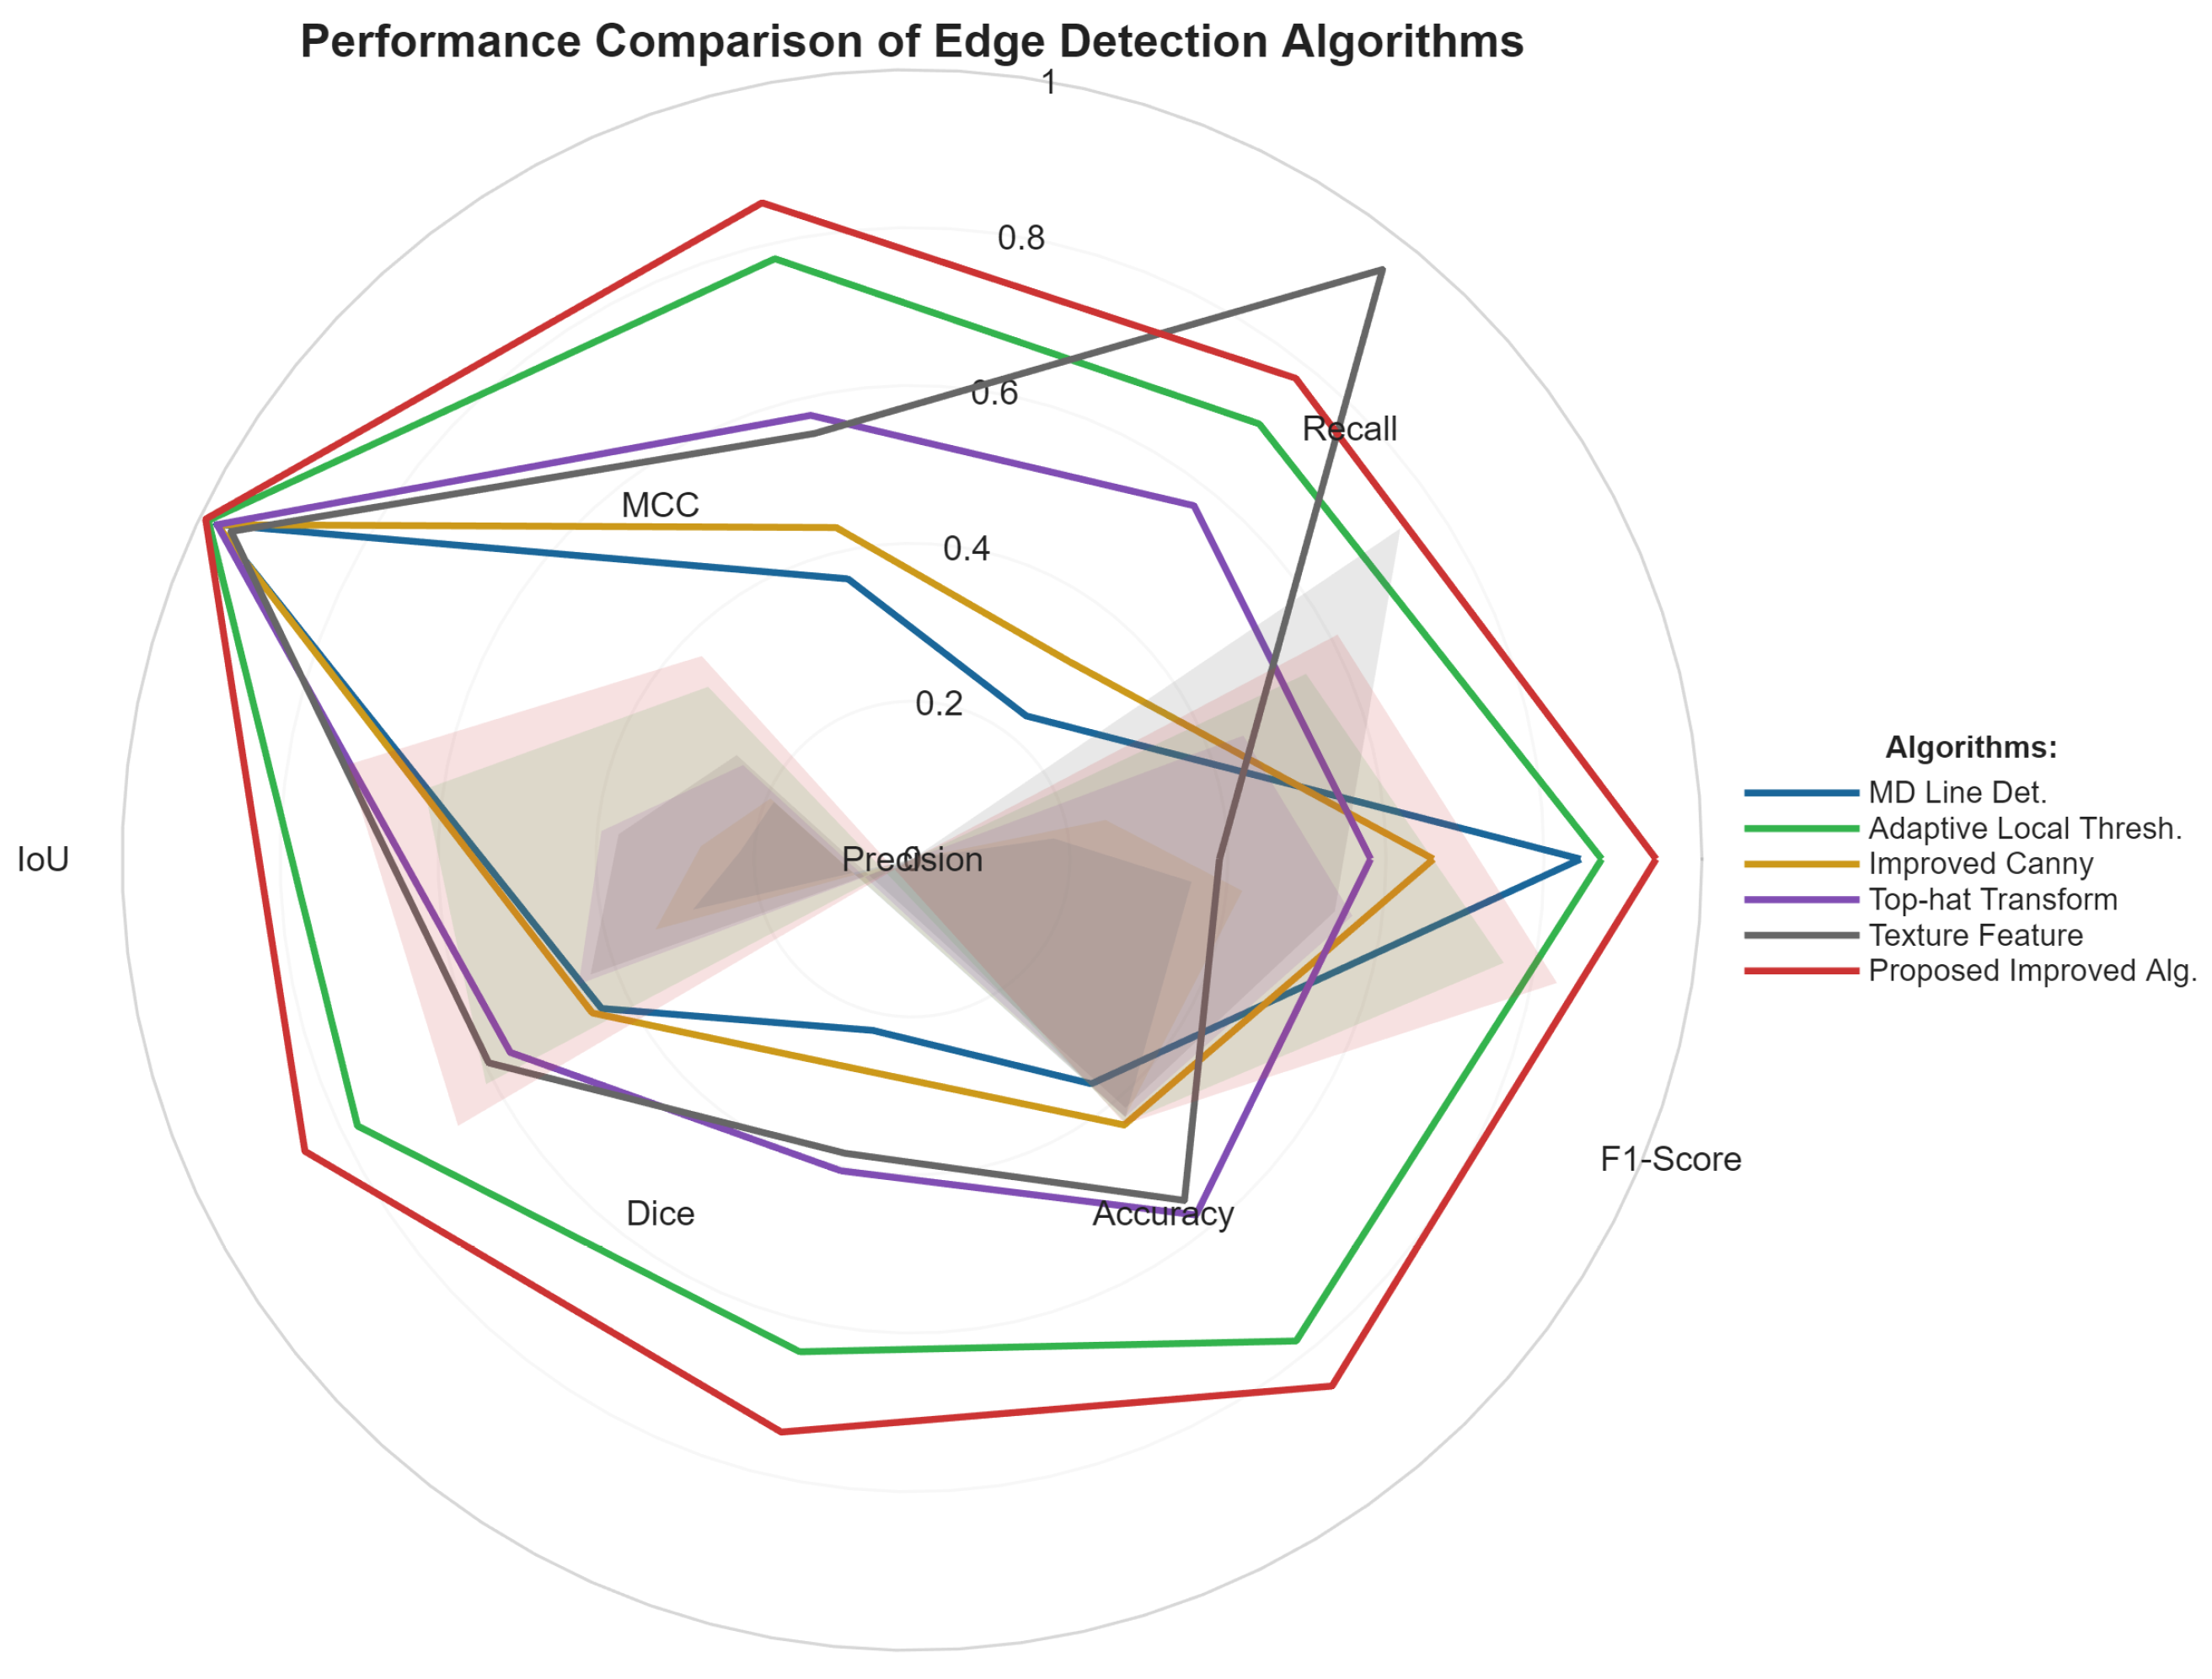
As shown in Table 6, the performance comparison results of the proposed improved algorithm and the other five comparative methods on multiple quantitative metrics are presented. On the comprehensive evaluation metrics F1-Score (0.8528) and MCC (0.8530), the proposed method significantly outperforms the other methods, demonstrating a good balance between precision and recall. Although the texture feature method achieves a high recall rate (0.9553), its precision is low (0.3892), resulting in an F1-Score of only 0.5531. Meanwhile, the multi-directional line detection, improved Canny, and top-hat transformation methods show relatively limited performance across all metrics. Additionally, the proposed method achieves the highest values in accuracy (0.9925) and Dice coefficient (0.8528), and its IoU (0.7434) is significantly superior to other algorithms. In summary, the proposed improved algorithm demonstrates higher comprehensive performance and stability in the edge detection task.
Table 6.
Comparison of Performance Evaluation Results for Different Edge Detection Algorithms.
To more intuitively present the performance differences in Table 6, we visualize the quantitative results of various metrics through a radar chart, as shown in Figure 15. From the chart, it can be clearly seen that the performance profile of the improved algorithm proposed in this paper lies on the outermost periphery in most dimensions, which is completely consistent with the quantitative analysis in the table and further corroborates its comprehensive performance advantage.
Figure 15.
Radar Chart Comparison of Comprehensive Performance for Different Edge Detection Algorithms.
5. Crack Feature Quantification and Overall Algorithm Validation
To achieve non-contact automated measurement, pixel information must be converted into geometric parameters. Considering the high noise levels and complex, tortuous shapes of post-earthquake crack images, this paper evaluated three mainstream quantification methods. The pixel statistics method is susceptible to noise interference, leading to overestimated results; the projection method severely underestimates the length of complex cracks; the skeleton analysis method, by extracting the centerline, accurately reflects the topological structure of cracks and exhibits strong robustness to discontinuities in prior processing. Therefore, this study selects skeleton analysis as the core approach [26,27].
The skeleton analysis method, based on a linear approximation (“straight-line approximation” for “curved lines”), introduces discretization error, whose magnitude is inversely proportional to image resolution and directly proportional to crack curvature. To quantify this error, tests were conducted grouping cracks by morphological complexity (Table 7). The results show that for straight/mildly curved (Groups A and B) cracks, the error is controllable (<4%); for highly tortuous (Group C) cracks, the average error increases to 6.5%, becoming the primary error source. This result also indirectly reflects the effectiveness of the previously mentioned skeleton extraction algorithm: if the skeleton is complete and continuous, the error primarily originates from discretization approximation; if the skeleton fractures at tortuous sections, the error significantly increases. Overall, the method is practically reliable within the engineering tolerance threshold (<10%).
Table 7.
Discretization Error Analysis of Length Calculation.
5.1. Key Parameter Calculation Process
(1) Crack Length
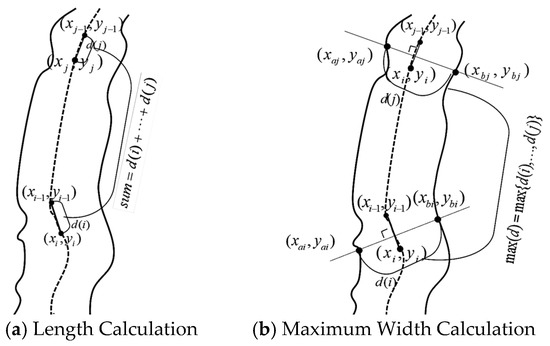
First, extract a single-pixel-wide crack skeleton, then accumulate the Euclidean distances between adjacent skeleton points. The calculation schematic is shown in Figure 16a. The specific steps are as follows:
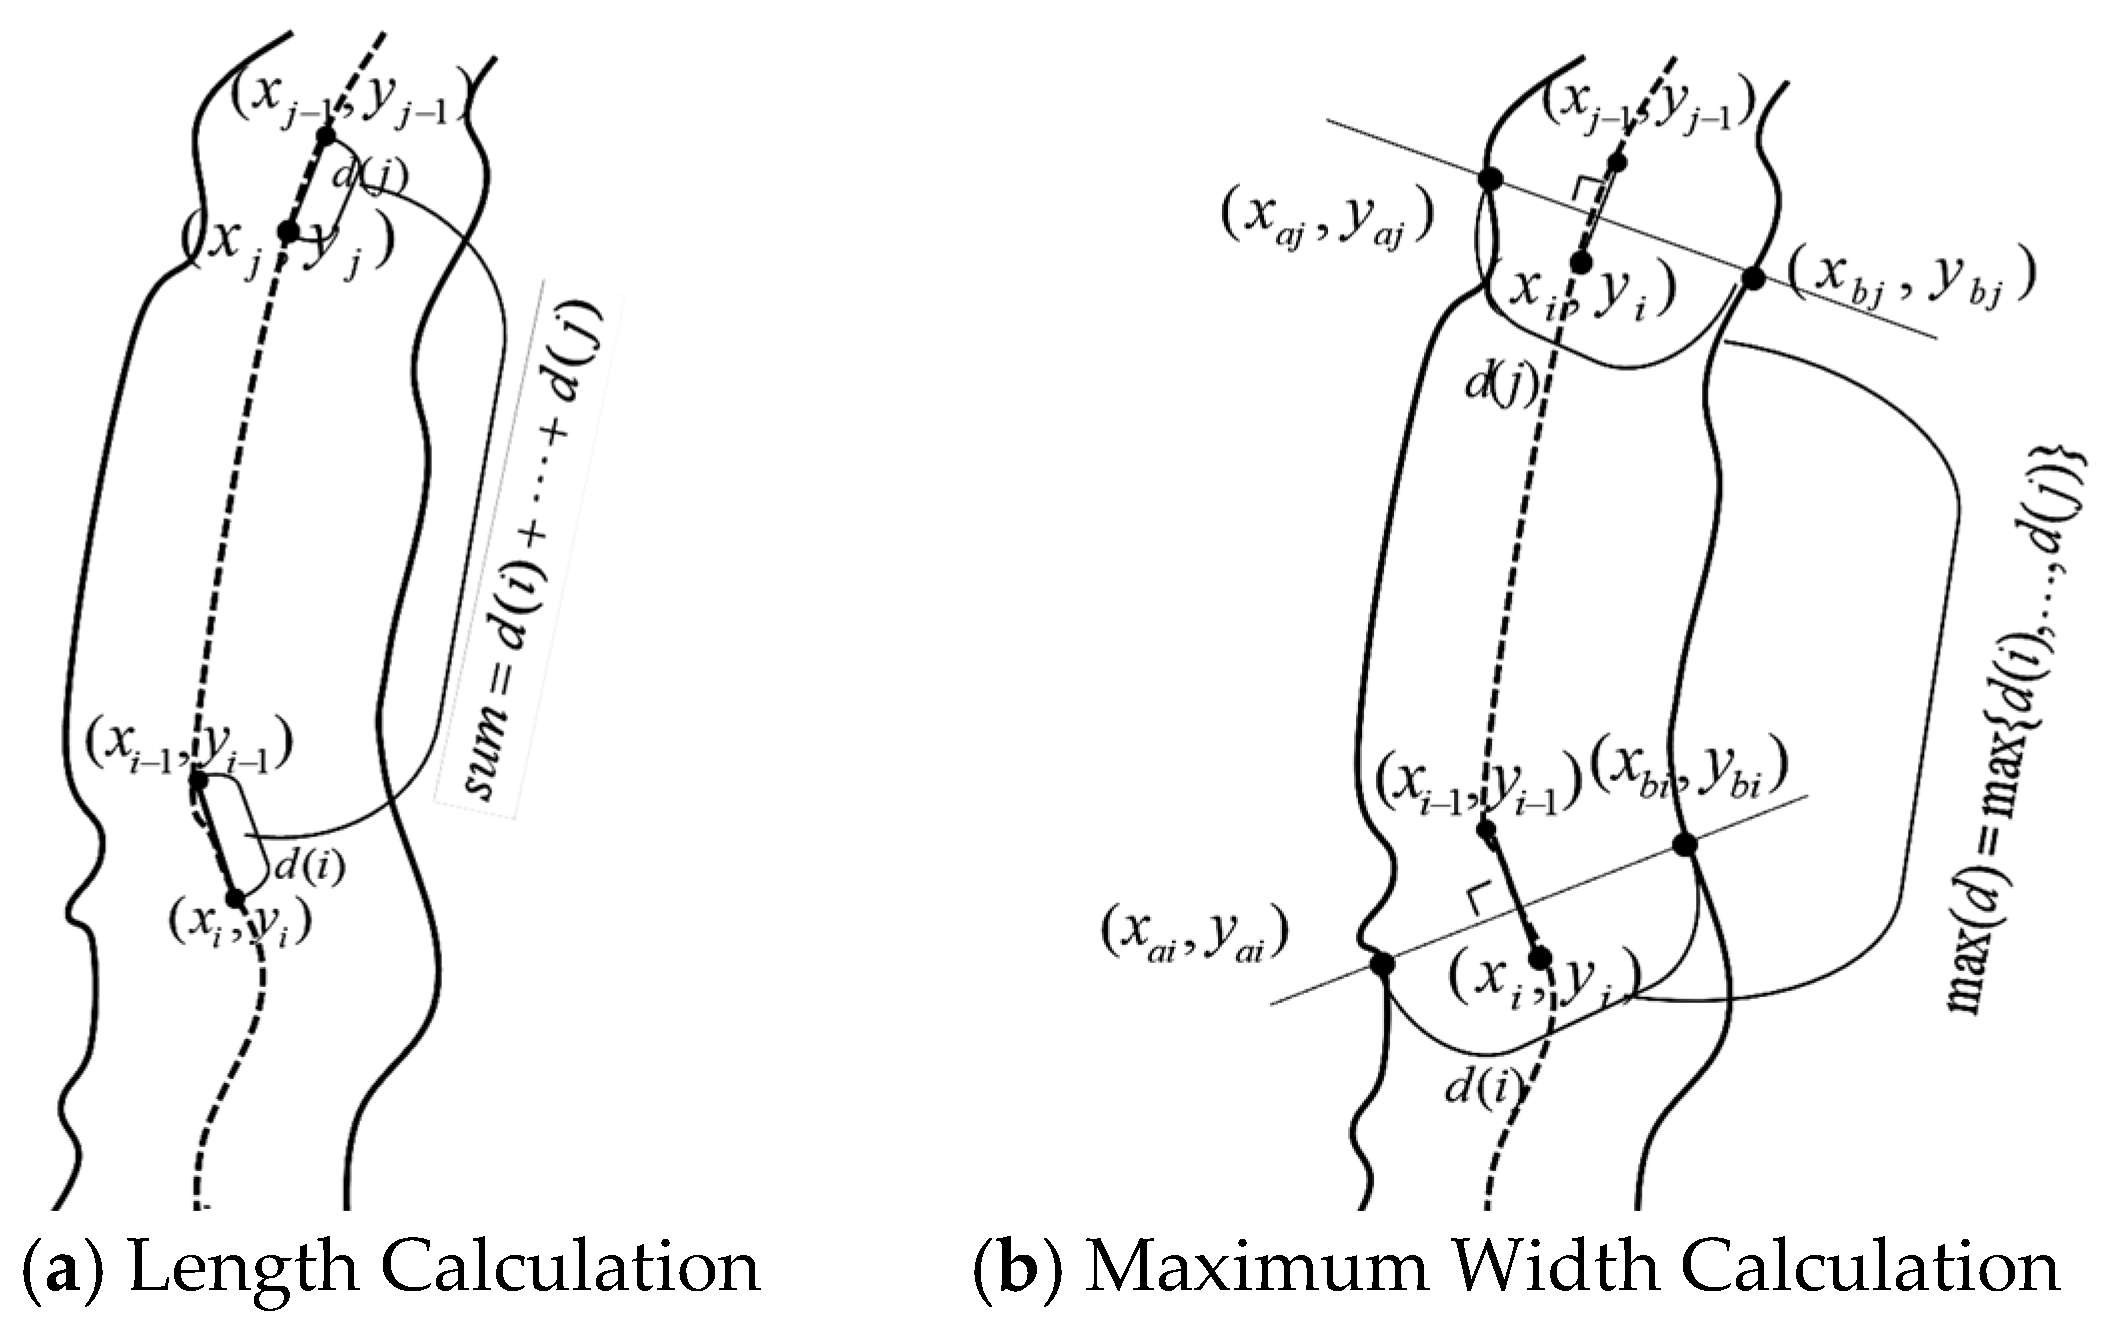
Figure 16.
Crack Feature Calculation.
- (1)
- Input: Refined crack skeleton image ;
- (2)
- Skeleton point extraction: Traverse the pruned skeleton graph to obtain the coordinate sequence of all skeleton points ;
- (3)
- Segment-by-segment distance calculation: Calculate the Euclidean distance between adjacent points, ;
- (4)
- Length accumulation: Total length ;
- (5)
- Scale restoration: According to the camera calibration coefficient , obtain the actual length: .
(2) Maximum Crack Width Calculation
To accurately obtain the maximum width and avoid the errors of projection methods, a measurement method based on the skeleton normal direction is adopted. The calculation schematic is shown in Figure 16b. The algorithm workflow is as follows:
- (1)
- Input: Skeleton graph and corresponding edge map ;
- (2)
- Local normal determination: For a skeleton point , utilize its neighboring points to fit the local orientation; the perpendicular direction is the normal direction;
- (3)
- Edge intersection search: Along the normal direction, search on both sides in the edge map to obtain intersection points ;
- (4)
- Local width calculation: Calculate the Euclidean distance between the intersection points, ;
- (5)
- Maximum width determination: The maximum width is the maximum value among .
(3) Crack Area Ratio
The area ratio reflects the density of cracks and is calculated as follows:
- (1)
- Crack area: , where is the total number of crack pixels;
- (2)
- Density ratio: , where is the area of the minimum bounding rectangle of the crack;
- (3)
- Image coverage: , where is the total image area.
5.2. Overall Algorithm Validation Based on Ground Truth Comparison
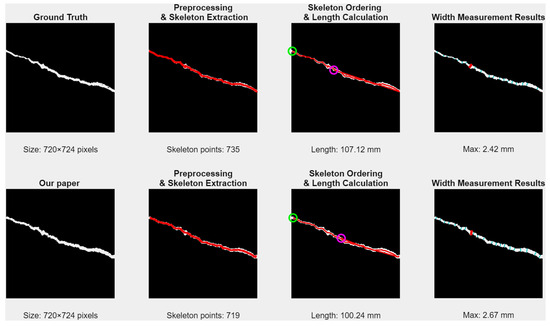
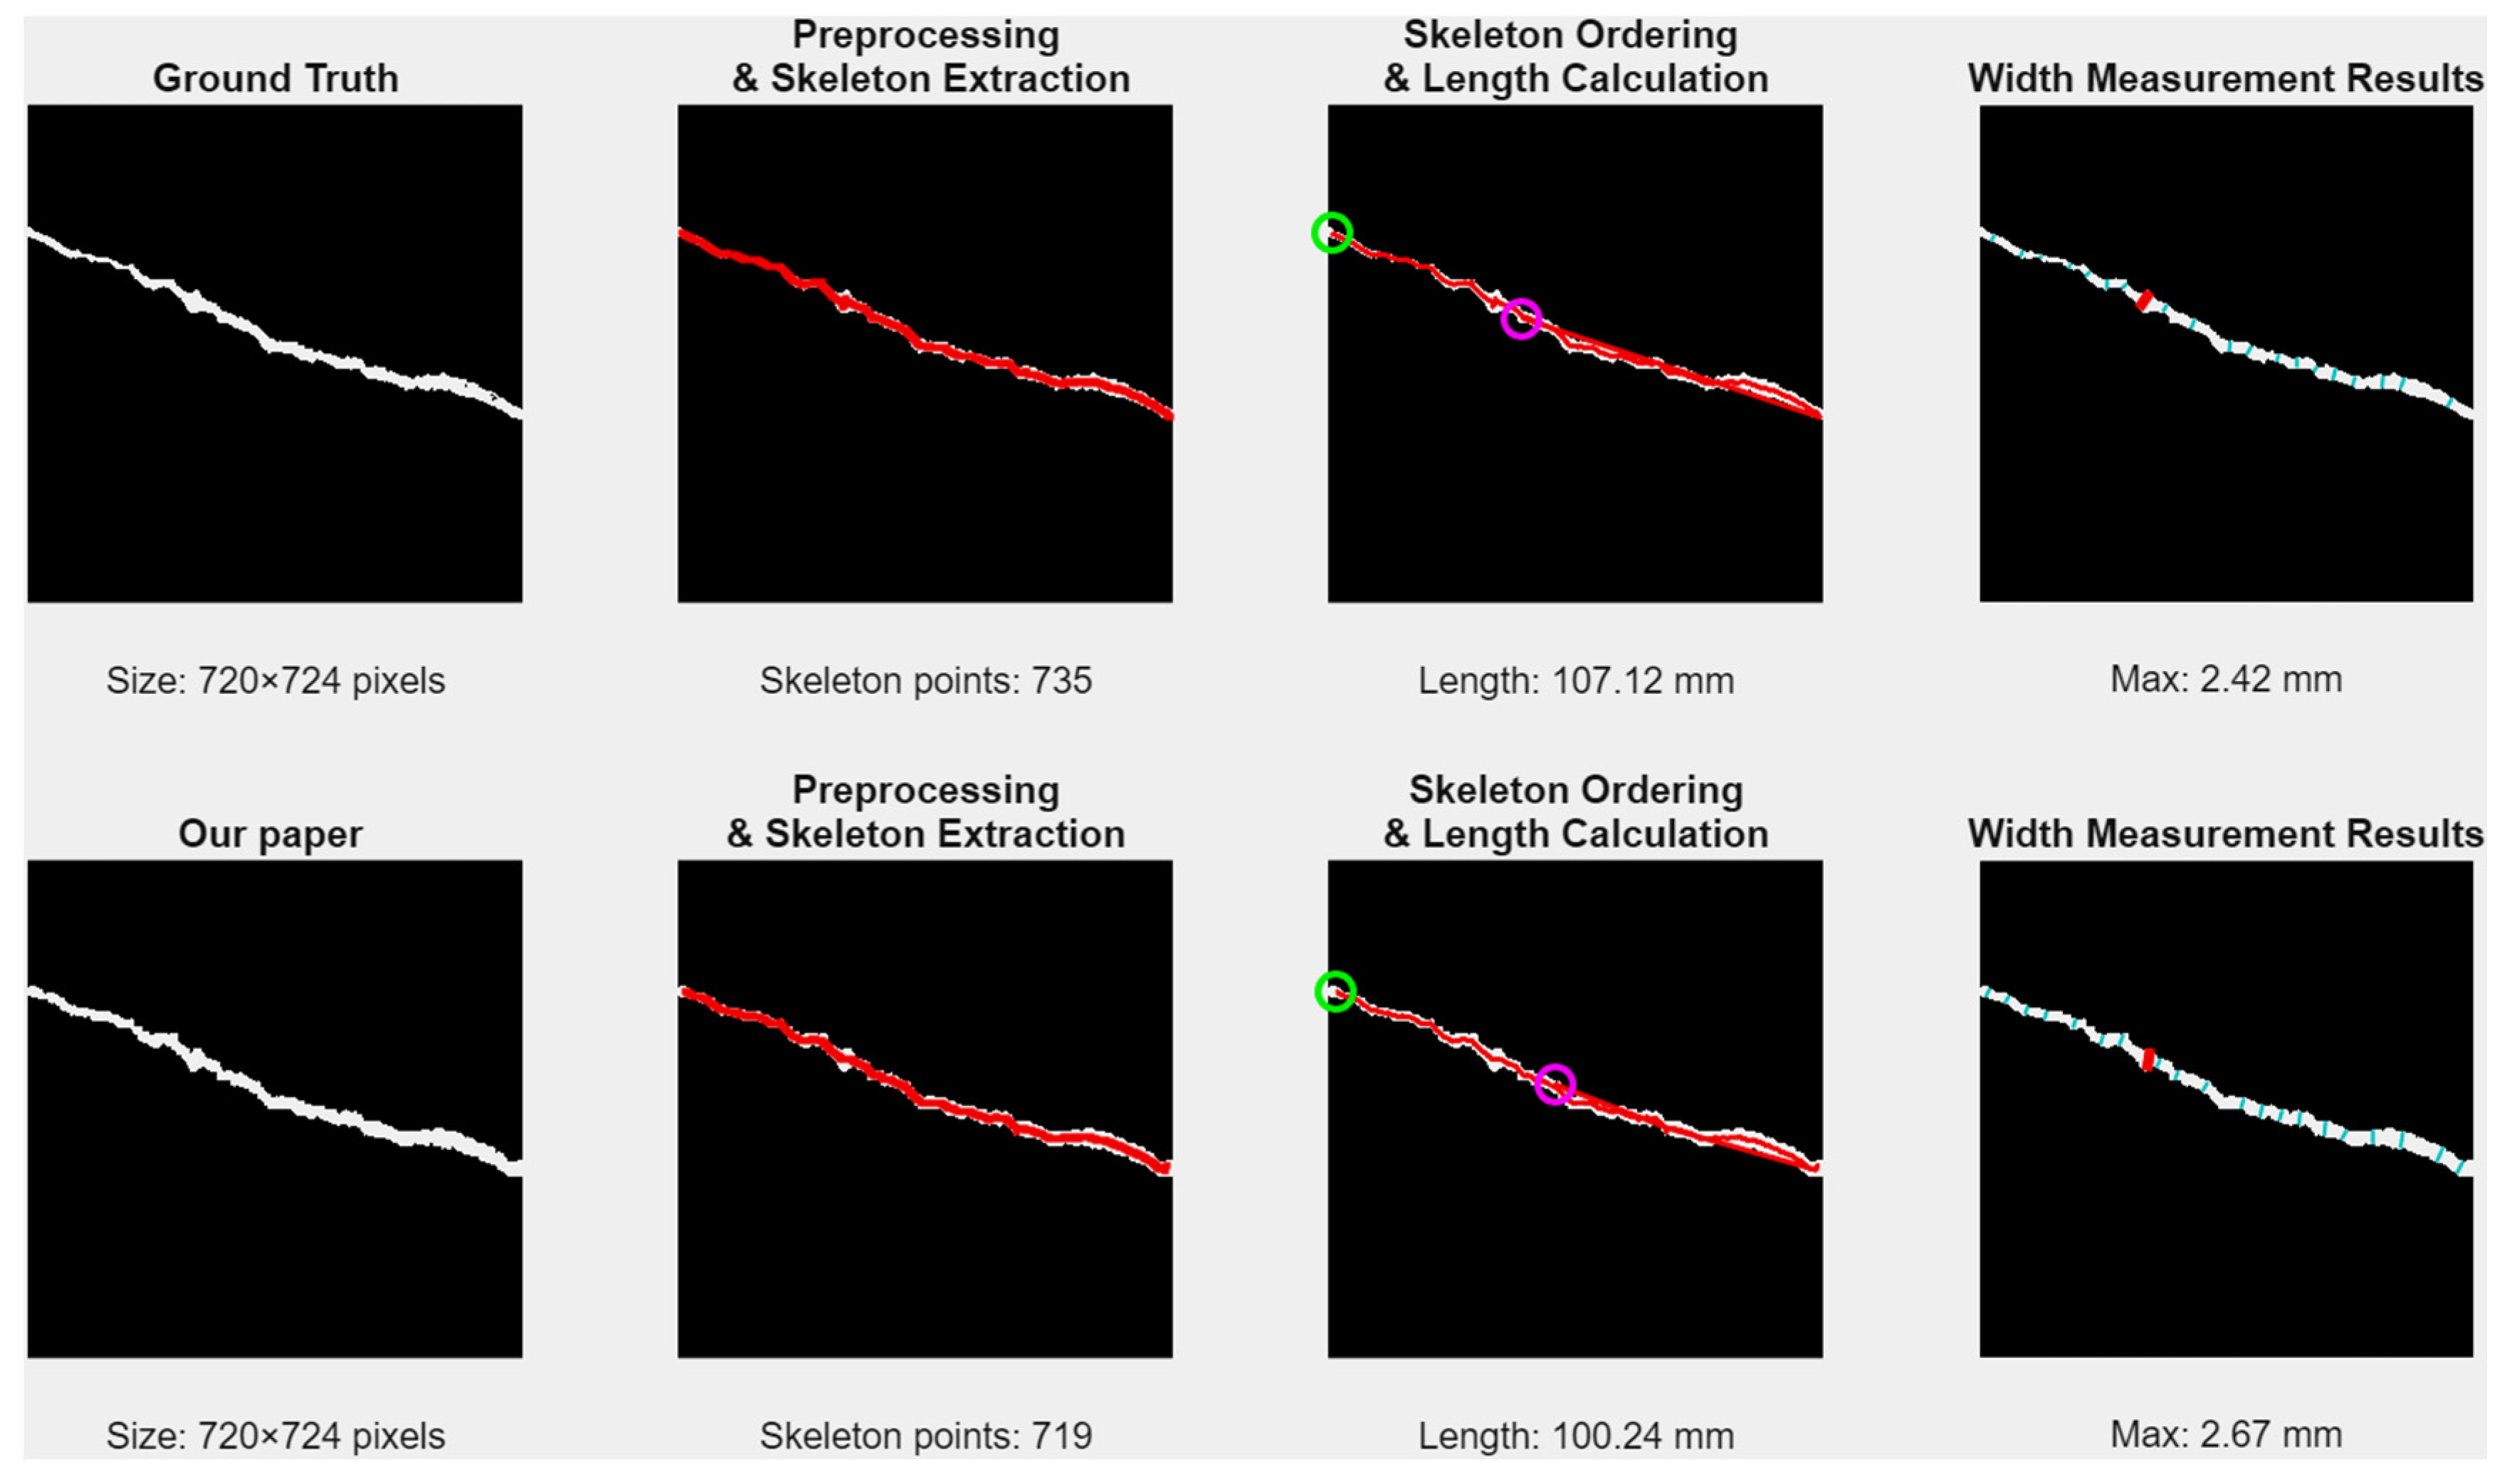
To construct a multi-dimensional and traceable algorithm performance validation system, this section adopts a verification method combining “process visualization comparison” with “result quantitative analysis.” As shown in Figure 17, by parallelly displaying the complete feature calculation processes based on the ground truth (GT) annotations and the outputs of the algorithm proposed in this paper, a visual diagnosis of the algorithm’s intermediate processing states (such as skeleton morphology and edge continuity) is achieved. This figure not only elucidates the generation pathways of geometric parameters but, more importantly, establishes a direct visual association between the final performance gap and the output quality of the front-end image processing modules (Section 2 and Section 3), providing a structured observation window for error tracing.
Figure 17.
Crack Feature Calculation Flowchart.
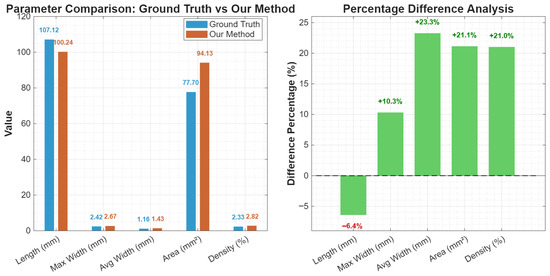
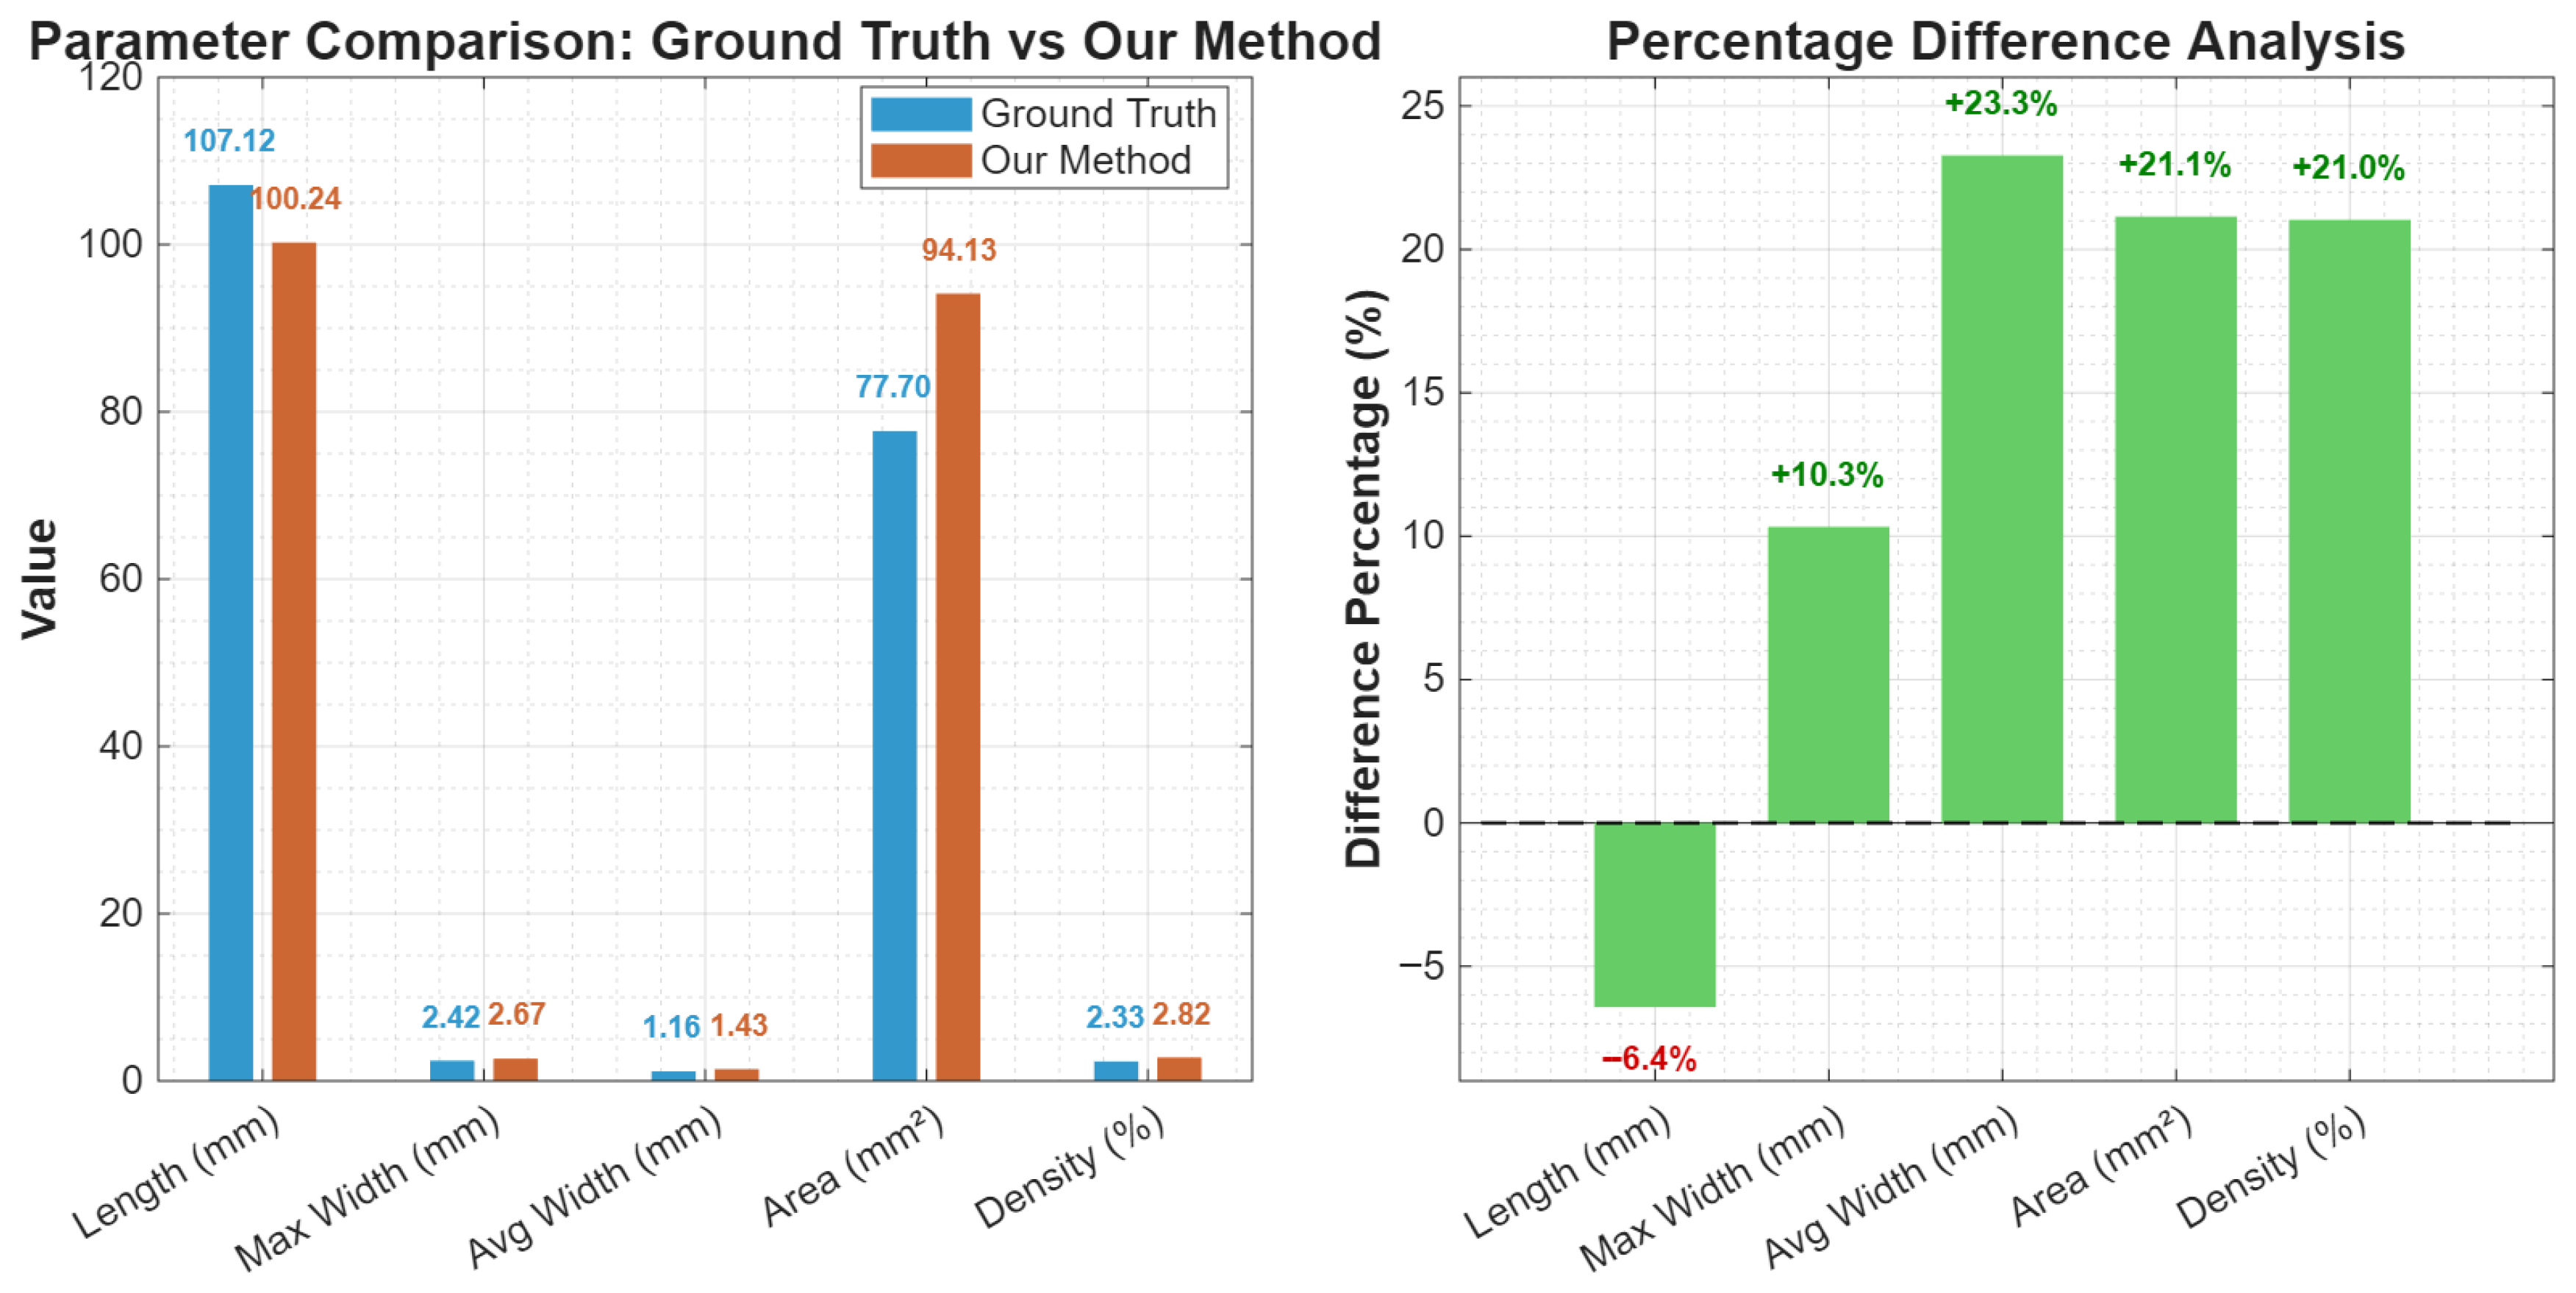
On this basis, Figure 18 further provides precise quantitative evidence. By comparing the specific values and percentage differences of five key parameters, the algorithm performance evaluation is advanced from qualitative observation to quantitative measurement. The data show that, for the width and area parameters, the algorithm proposed in this paper presents consistent positive biases (+10.3% to +23.3%), while for the length parameter, it exhibits a negative bias (−6.4%). This systematic error pattern is not random noise but is highly consistent with the intermediate states revealed in Figure 14 (such as more sensitive edge detection and more conservative skeleton connection), thereby cross-validating the behavioral characteristics of the preceding algorithm modules at a statistical level.
Figure 18.
Algorithm Performance Evaluation.
To comprehensively evaluate the engineering practicality and environmental adaptability of the proposed algorithm [28], one hundred crack images from the DeepCrack training set were selected to systematically conduct tests on computational efficiency and adaptability to complex environments.
In the algorithm performance evaluation presented in Table 8, the method proposed in this paper demonstrates strong robustness under three typical complex environments: strong shadows, severe stains, and low contrast. In strong shadow scenarios, the F1-score is 0.81, with relative errors of 7.3% and 5.1% for length and width, respectively, indicating that the algorithm maintains high detection accuracy and measurement stability even under uneven illumination conditions. Under severe stain interference, the F1-score drops to 0.76, with length and width errors increasing to 9.8% and 6.9%, respectively, suggesting that surface stains have a certain impact on crack feature extraction, but the errors are still within an acceptable range for engineering applications. In low-contrast scenarios, the algorithm performance further declines, with an F1-score of 0.69 and length and width errors reaching 12.5% and 15.4%, respectively, reflecting that insufficient image contrast significantly increases the difficulty of feature extraction and parameter quantification. Overall, the algorithm exhibits good adaptability and reliability under various adverse imaging conditions, performing optimally especially in strong shadow environments, providing data support for subsequent engineering applications. The results show that the average processing time of the algorithm for a single image is approximately 0.319 s. Among the core modules the time consumption ratios of image enhancement wavelet denoising connected component analysis and feature quantification are 40%, 35%, 15% and 10% respectively. This demonstrates favorable computational efficiency meeting the time requirements for rapid inspection.
Table 8.
Algorithm Performance under Different Challenging Scenarios.
6. Conclusions and Future Work
This study proposes a post-earthquake bridge crack image processing algorithm based on improved Retinex and wavelet transform. The main contributions include: (1) Proposing an improved Retinex algorithm combining side-window filtering and dual gamma preprocessing, which effectively balances illumination and enhances crack contrast; (2) Designing an improved wavelet threshold function based on cubic spline smooth transition and a dynamic threshold selection strategy, achieving effective filtering of large-area, point-like, and patchy noise; (3) Realizing automated calculation of crack length, maximum width, and area ratio based on skeletonization and edge images, with experimental errors meeting the requirements of rapid assessment.
The limitations of this study are: the dataset scale is small, not covering all crack types and extreme environments; geometric measurements are based on two-dimensional images, without considering crack depth. In addition, it needs to be noted that this algorithm primarily achieves automatic crack identification and precise extraction of two-dimensional parameters, and cannot directly distinguish whether cracks are caused by earthquakes, fatigue, or environmental factors. Crack cause determination is a comprehensive engineering problem requiring professional judgment combined with seismic damage background, structural analysis, and multi-source information.
Future work: (1) Constructing a larger-scale, more diverse post-earthquake bridge damage image dataset; (2) Exploring fusion of binocular vision or LiDAR point clouds for three-dimensional crack reconstruction and depth estimation; (3) Integrating the algorithm into a drone inspection system for on-site real-time testing, and exploring data fusion with structural health monitoring systems to provide support for the bridge’s entire lifecycle management.
Author Contributions
Conceptualization, C.L.; Methodology, X.Y.; Software, X.Y. and Z.L.; Validation, S.L.; Formal analysis, S.L.; Investigation, X.Y., S.L. and Z.L.; Resources, C.L.; Data curation, X.Y., S.L. and Z.L.; Writing—original draft, X.Y.; Writing—review & editing, C.L.; Visualization, S.L. and Z.L.; Supervision, C.L.; Project administration, C.L.; Funding acquisition, C.L. All authors have read and agreed to the published version of the manuscript.
Funding
This research was funded by Guangzhou Municipal Education Bureau, grant number [2024312467].
Data Availability Statement
The original contributions presented in this study are included in the article. Further inquiries can be directed to the corresponding author.
Conflicts of Interest
The authors declare no conflict of interest.
References
- Jakubowski, J.; Tomczak, K. Deep learning metasensor for crack-width assessment and self-healing evaluation in concrete. Constr. Build. Mater. 2024, 422, 135768. [Google Scholar] [CrossRef] [Scilit]
- Gowtham, K.; Babu, N.R.; Harshavarthini, S.; Raveendran, P. Dual-functional fractal-fractional Sobel operator for efficient image enhancement and edge detection. Pattern Recognit. 2026, 172, 112592. [Google Scholar] [CrossRef] [Scilit]
- Argentino, A.; Radicioni, L.; Bono, F.M.; Bernardini, L.; Benedetti, L.; Cazzulani, G.; Somaschini, C.; Belloli, M. Data normalization for the continuous monitoring of a steel truss bridge: A case study from the Italian railway line. J. Infrastruct. Intell. Resil. 2025, 4, 100171. [Google Scholar] [CrossRef] [Scilit]
- Mertol, H.C.; Tunç, G.; Akış, T.; Kantekin, Y.; Aydın, İ.C. Investigation of RC Buildings after 6 February 2023, Kahramanmaras, Turkiye Earthquakes. Buildings 2023, 13, 1789. [Google Scholar] [CrossRef] [Scilit]
- Zhao, D.P.; Liu, X. Crack mystery of the damaging Kumamoto earthquakes. Sci. Bull. 2016, 61, 868–870. [Google Scholar] [CrossRef] [Scilit]
- Hacıefendioğlu, K.; Başağa, H.B.; Kahya, V.; Özgan, K.; Altunışık, A.C. Automatic Detection of Collapsed Buildings after the 6 February 2023 Türkiye Earthquakes Using Post-Disaster Satellite Images with Deep Learning-Based Semantic Segmentation Models. Buildings 2024, 14, 582. [Google Scholar] [CrossRef] [Scilit]
- Kemal, H.; Ahmet, C.; Tuğba, A. Deep Learning-Based Automated Detection of Cracks in Historical Masonry Structures. Buildings 2023, 13, 3113. [Google Scholar] [CrossRef] [Scilit]
- Qian, H.; Sun, H.; Cai, Z.; Gao, F.; Ni, T.; Yuan, Y. RC Bridge Concrete Surface Cracks and Bug-Holes Detection Using Smartphone Images Based on Flood-Filling Noise Reduction Algorithm. Appl. Sci. 2024, 14, 10014. [Google Scholar] [CrossRef] [Scilit]
- Yu, J.T.; Qian, S.R.; Chen, C. Lightweight Crack Automatic Detection Algorithm Based on TF-MobileNet. Appl. Sci. 2024, 14, 9004. [Google Scholar] [CrossRef] [Scilit]
- Xu, J.B.; Wang, S.W.; Han, R.; Wu, X. Crack segmentation and quantification in concrete structures using a lightweight YOLO model based on pruning and knowledge distillation. Expert Syst. Appl. 2024, 14, 3928. [Google Scholar] [CrossRef] [Scilit]
- Xiao, J.L.; Fan, J.S.; Liu, Y.-F.; Li, B.-L. Region of interest (ROI) extraction and crack detection for UAV-based bridge inspection using point cloud segmentation and 3D-to-2D projection. Autom. Constr. 2025, 283, 127834. [Google Scholar] [CrossRef] [Scilit]
- Hacıefendioğlu, K.; Özgan, K.; Mostofi, S.; Altunışık, A.C. Rapid Detection of Corrosion on Steel Bridges Using a Deep Learning Method. Appl. Sci. 2025, 15, 11929. [Google Scholar] [CrossRef] [Scilit]
- Kemal, H.; Hasan, B. Concrete Road Crack Detection Using Deep Learning-Based Faster R-CNN Method. Iran. J. Sci. Technol. Trans. Civ. Eng. 2022, 46, 1621–1633. [Google Scholar]
- Mayya, A.; Alkayem, N.F.; Shen, L.; Zhang, X.; Fu, R.; Wang, Q.; Cao, M. Efficient hybrid ensembles of CNNs and transfer learning models for bridge deck image-based crack detection. Structures 2024, 64, 106538. [Google Scholar] [CrossRef] [Scilit]
- Xia, H.B.; Li, Q.; Qin, X.; Zhuang, W. Bridge crack detection algorithm designed based on YOLOv8. Appl. Soft Comput. 2025, 171, 112831. [Google Scholar] [CrossRef] [Scilit]
- He, H.; Wang, Y.; Chen, W.; Li, Z. Large-scale generative dataset, benchmark, and edge-empowered transformer for crack detection. Inf. Sci. 2026, 735, 123054. [Google Scholar] [CrossRef] [Scilit]
- Hsieh, P.-W.; Yang, S.-Y. Anisotropic pth-order TV-based Retinex decomposition with adaptive reflectance regularizer for low-light image enhancement. Pattern Recognit. 2026, 172, 112468. [Google Scholar] [CrossRef] [Scilit]
- Yan, C.Z.; Huang, P.L.; Zhou, J.; Ye, F.; Lin, L.B. Wall grooving robot target detection and positioning based on improved multi-scale retinex. Sci. Technol. Eng. 2023, 23, 15530–15537. [Google Scholar]
- Chen, H.J.; Zhang, J.X.; Yu, T.Z.; Zeng, Y.Z.; Zeng, H. RetinexWT: Retinex-Based Low-Light Enhancement Method Combining Wavelet Transform. Digit. Signal Process. 2026, in press. [Google Scholar] [CrossRef] [Scilit]
- Vidal, M.; Aguilera, A.M. Wavelet thresholding on independent subspace factorizations of spatially indexed wide functional data for robust estimation of cortical activity. Math. Comput. Simul. 2025, 232, 346–361. [Google Scholar] [CrossRef] [Scilit]
- Do, T.U.; Ta, V.C. Tackling under-reaching issue in Beta-Wavelet filters with mixup augmentation for graph anomaly detection. Expert Syst. Appl. 2025, 275, 127033. [Google Scholar] [CrossRef] [Scilit]
- Zhang, J.H.; Chen, W.; Zhang, J. UAV-based quantitative crack measurement for bridges integrating four-point laser metric calibration and mamba segmentation. Autom. Constr. 2026, 182, 106774. [Google Scholar] [CrossRef] [Scilit]
- Li, L.; Peng, W.H.; Duan, Z.P.; Pu, S.S. Adaptive illumination estimation for low-light image enhancement. Eng. Lett. 2024, 32, 531–540. [Google Scholar]
- Bui, T.-A.; Lee, P.-J.; Liang, C.-S.; Hsu, P.-H.; Shiu, S.-H.; Tsai, C.-K. Edge-Computing-Enabled deep learning approach for low-light satellite image enhancement. IEEE J. Sel. Top. Appl. Earth Obs. Remote Sens. 2024, 17, 4071–4083. [Google Scholar] [CrossRef] [Scilit]
- Li, G.; Liu, Y.Y.; Shen, D.; Wang, B. Automatic pixel-level bridge crack detection using learning context flux field with convolutional feature fusion. Civ. Struct. Health Monit. 2024, 14, 1155–1171. [Google Scholar] [CrossRef] [Scilit]
- Liu, M.-G.; Thomas, C.; Li, W.; Wang, X.-Q. Analyzing architectural diversity in maize plants using the skeleton-image-based method. J. Integr. Agric. 2023, 22, 3804–3809. [Google Scholar] [CrossRef] [Scilit]
- Yiğit, A.Y.; Uysal, M. Virtual reality visualisation of automatic crack detection for bridge inspection from 3D digital twin generated by UAV photogrammetry. Measurement 2025, 242, 115931. [Google Scholar] [CrossRef] [Scilit]
- Belloni, V.; Sjölander, A.; Ravanelli, R.; Crespi, M.; Nascetti, A. Crack Monitoring from Motion (CMfM): Crack detection and measurement using cameras with non-fixed positions. Autom. Constr. 2023, 156, 105072. [Google Scholar] [CrossRef] [Scilit]



Disclaimer/Publisher’s Note: The statements, opinions and data contained in all publications are solely those of the individual author(s) and contributor(s) and not of MDPI and/or the editor(s). MDPI and/or the editor(s) disclaim responsibility for any injury to people or property resulting from any ideas, methods, instructions or products referred to in the content. |
© 2026 by the authors. Licensee MDPI, Basel, Switzerland. This article is an open access article distributed under the terms and conditions of the Creative Commons Attribution (CC BY) license.