


Abstract
The construction of mass concrete foundations for nuclear power plants faces significant challenges in controlling hydration heat and preventing early-age thermal cracking. This study develops an integrated framework combining high-fidelity thermal–mechanical simulation, real-time temperature monitoring, and construction process optimization to address these issues. Focusing on the VVER-1200 reactor raft foundation in the Xudapu NPP Phase II Project, an innovative center-to-periphery synchronous pouring method is proposed, departing from conventional inclined or layered pouring by strategically utilizing stage time lags to moderate the radial temperature gradient. Numerical simulations demonstrate that this method significantly reduces the peak temperature and thermal stress. Field validation shows that the maximum core-to-surface temperature difference is controlled within 19.8 °C, well below the critical threshold of 25 °C, and the peak concrete temperature remains at 66.7 °C, safely below the risk level for delayed ettringite formation (82–85 °C). The cracking risk coefficient K remains below 0.65, indicating a low probability of thermal cracking. Post-construction inspection confirms the absence of thermal cracks in the 5240 m3 monolithic pour. The proposed methodology offers a reliable, science-based approach for thermal crack mitigation and serves as a valuable reference for similar large-scale mass concrete structures in nuclear and other critical infrastructure projects.
1. Introduction
As a clean and efficient energy source, nuclear power plays an increasingly vital role in global energy supply [1]. The structural integrity of nuclear power plants (NPPs) under extreme conditions is paramount to national safety, environmental protection, and public confidence [2]. Among critical NPP structures, the reactor containment building (RCB) serves as the final barrier against radioactive release [3]. The raft foundation of the nuclear island forms the base of the RCB, bearing core functions such as supporting key equipment and resisting extreme loads including seismic events and thermo-mechanical coupling effects [4,5,6].
To enhance safety margins, nuclear island raft foundation design has become more conservative in the post-Fukushima era. The concrete used typically has high design strength grades, often C35 or above. For instance, the HPR1000 (Hualong One) uses C40 concrete, the VVER-1200 specifies B40 (≈C40 per GOST 26633:2015 [7]), and the EPR reaches C50 (per EN 206:2013+A2:2021 [8])—all corresponding to 28-day compressive strengths of 40 MPa or 50 MPa. Moreover, concrete volumes have increased significantly: 5050 m3 for AP1000, 9266 m3 for EPR, 11,441 m3 for HTGR, 15,210 m3 for CAP1400, 16,366 m3 for VVER-1200, and 26,057 m3 for HPR1000.
These large-volume, high-strength placements constitute mass concrete, where significant hydration heat is generated. In mass concrete, two primary risks exist: (1) core temperature exceeding 82–85 °C (≈180–185 °F) due to high cementitious content, potentially leading to delayed ettringite formation (DEF) and durability concerns; and (2) excessive temperature difference between core and surface. In this project, the control limit was set at >25 °C, according to the Chinese code for mass concrete (GB 50496-2018). This differs from some international guidelines, such as those from the American Concrete Institute (ACI), which often recommend a limit of 35 °F. Such a critical gradient, often manifesting as a critical gradient between the center and periphery of thick, circular raft foundations, leading to tensile thermal stresses and cracking [9,10,11,12,13,14,15,16,17,18]. The appearance of such cracks in the nuclear island raft foundation may result in serious consequences, including the following: (1) Risk of radioactive leakage: Cracks can provide pathways for the release of radioactive substances, endangering the environment and public health. (2) Reduction in structural load-bearing capacity: Cracks may diminish the compressive and shear strength of the concrete, compromising the stability of the foundation. Under extreme conditions such as earthquakes, this could potentially initiate progressive failure [19]. (3) Impairment of long-term durability: As NPPs are often built in coastal areas, they are exposed to offshore environmental conditions. Seawater infiltration and chloride ion intrusion through cracks can accelerate reinforcement corrosion, reducing durability and shortening the service life of the structure [20,21,22,23]. Moreover, the raft foundation’s deep embedment (elev. −10.850 m in this case) enhances geological stability and mitigates surface environmental impacts, thereby improving long-term durability in coastal harsh environments.
Factors governing temperature rise in mass concrete include binder content, type and proportion of supplementary cementitious materials (SCMs), concrete block dimensions, ambient conditions, and placement temperature [12,24,25,26]. These factors collectively govern the heat generation, accumulation, and dissipation within the concrete mass: the total binder content is the primary heat source, with higher cementitious material content linearly increasing the total hydration heat released, while SCMs like fly ash or slag typically reduce the peak heat rate and total heat; the element’s size and shape, particularly a large volume-to-surface area ratio, critically impede heat loss, leading to higher core temperatures and steeper internal gradients; ambient conditions and placement temperature set the thermal boundary and initial state, where lower ambient temperatures and higher wind speeds can increase surface cooling and differentials, and a higher placement temperature accelerates early-age hydration, elevating the subsequent temperature peak. Traditional thermal control strategies include using SCMs (e.g., fly ash, slag) to reduce heat of hydration, embedded active cooling systems (e.g., water-circulating pipes), and optimized insulation. However, these established strategies and their supporting tools (e.g., empirical methods like the Schmidt Method [27,28,29] or simplified software) often struggle to fully capture the complex 3D geometry, transient early-age material properties, and real-time construction dynamics of modern nuclear foundations.
The research gap addressed here is the lack of an integrated framework combining high-fidelity thermo-mechanical simulation, real-time monitoring, and construction process optimization for such complex nuclear structures. For safety-critical nuclear applications, this gap is particularly pronounced. This study aims to bridge this gap by developing and validating a simulation-based optimization framework tailored for mass concrete in NPP construction. The framework is built around an innovative center-to-periphery synchronous pouring method, which is designed to strategically utilize construction stage time lags to intrinsically moderate the central–peripheral temperature gradient. Validated through a VVER-1200 case study via combined simulation and field monitoring, this research provides a holistic, scientifically grounded methodology for thermal crack control, contributing to enhanced safety and durability of critical nuclear infrastructure.
2. Related Studies on Heat Control in Mass Concrete
Thermal cracking control in mass concrete constitutes a well-established research domain within civil engineering, encompassing numerical, experimental, and field-based investigations. Early approaches predominantly relied on empirical formulations and simplified analytical models to estimate temperature distributions and associated thermal stresses. With the evolution of computational capabilities, finite element analysis (FEA) has emerged as a mainstream methodology for simulating the coupled thermo-mechanical behavior of mass concrete. Widely adopted general-purpose software (e.g., DIANA FEA v.10.2, ABAQUS 6.14, MIDAS 3.7.0) and specialized tools (e.g., B4Cast, Concreteworks) enable the prediction of transient temperature fields and the adjustment of key parameters such as heat of hydration [17,30,31,32,33,34,35,36,37,38,39,40,41,42,43,44,45]. However, when applying current finite-element tools to structures such as nuclear power plant raft foundations—characterized by complex geometries, stringent quality requirements, and dynamic construction processes—significant limitations are revealed. These methods face challenges in accurately modeling dynamic construction sequences, real-time varying boundary conditions, and soil–structure interactions, often leading to deviations in predictions of peak temperatures and thermal gradients.
To overcome these limitations and improve model fidelity, recent research emphasizes the integration of field monitoring with numerical simulation. A key focus is the accurate identification of early-age concrete thermal properties using advanced numerical techniques. Inverse heat transfer problem (IHTP) methods, for instance, are widely used to reconstruct heat flux and identify parameters from in situ temperature data [46,47]. Complementary approaches, such as evolutionary algorithms, have been developed to reliably determine the thermophysical parameters of hardening concrete, avoiding local optimization pitfalls [48,49].
Beyond utilizing monitoring data for calibrating and validating numerical models, researchers have also explored proactive control of the construction process. The optimization of cooling systems and curing methodologies represents another focal area of research. Lu et al. [50] introduced an innovative hydraulic cooling technique for mass concrete, demonstrating its efficacy in controlling the maximum temperature rise and core-to-surface temperature differential. This technology can buffer 94.3% (only 0.5 °C) of the temperature drop in the concrete surface layer when the ambient temperature sharply decreases by 8.8 °C, and actively creates a progressive temperature gradient of 3–4 °C between cross-sections. Compared with traditional approaches, it represents a paradigm shift from passive defense to active intervention, and from single-factor control to multi-field coupled optimization. Zhang et al. [24] systematically analyzed factors influencing the temperature field during cement hydration, highlighting the significance of placement temperature and ambient conditions. The gray correlation analysis indicates that the correlation degrees of the initial temperature of concrete after pouring and the ambient temperature are 0.73 and 0.66, respectively.
In recent years, artificial intelligence (AI) and machine learning (ML) have emerged as promising tools for predicting concrete properties and optimizing thermal management strategies. Oyebisi and Alomayri [51] utilized deep neural networks to predict the compressive strength of slag-ash-based geopolymer concrete, illustrating the potential of AI in performance prediction. For predicting the split tensile strength of concrete, a very high correlation (>97%) was observed between the predicted and experimental values. Do and Le [52] applied machine learning models—SVM, XGB, ANN, and GP—to forecast early-age thermal cracking susceptibility in bridge piers, offering a data-driven framework for risk assessment. ML models performed accurately in predicting cracking potential () and timing (t), with R2 scores above 0.96, MAE from 0.0305 to 0.0312 for , and 2.4626 to 2.7684 h for ; RMSE values ranged from 0.0381 to 0.0455 for and 3.2554 to 3.6065 for . Furthermore, Qian et al. [53] optimized cooling system parameters via temperature field simulation, thereby enhancing the thermal regulation efficiency in mass concrete structures.
In addition to data-driven prediction and control optimization, material modification offers a direct approach to mitigating heat of hydration. Material modifications, including the incorporation of temperature-rise inhibitors and supplementary cementitious materials, have also been explored for crack mitigation. Chen et al. [54] examined the influence of temperature-rise inhibitors on the thermal and mechanical properties of mass concrete, confirming their role in reducing peak temperatures and enhancing crack resistance.
The long-term durability of mass concrete and its correlation with thermal history have been addressed in several studies. El-Mir et al. [55] established correlations between strength, durability, and time–temperature profiles, emphasizing the importance of controlled thermal regimes for ensuring structural longevity. Shen et al. [56,57] investigated the coupled thermal–hygral–mechanical behavior of mass concrete under active temperature control, providing insights into the multi-physical nature of thermal stress development.
Notwithstanding these developments, a systematic integration of numerical simulation, real-time monitoring, and intelligent control within a unified framework remains lacking, particularly for complex structural systems such as nuclear island raft foundations.
3. Methodology
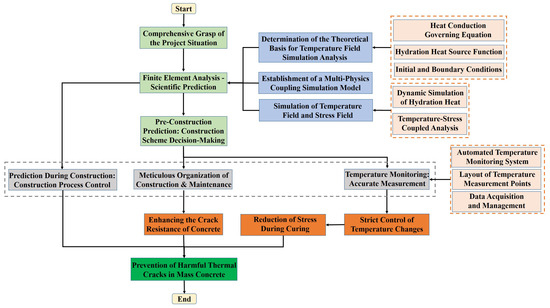
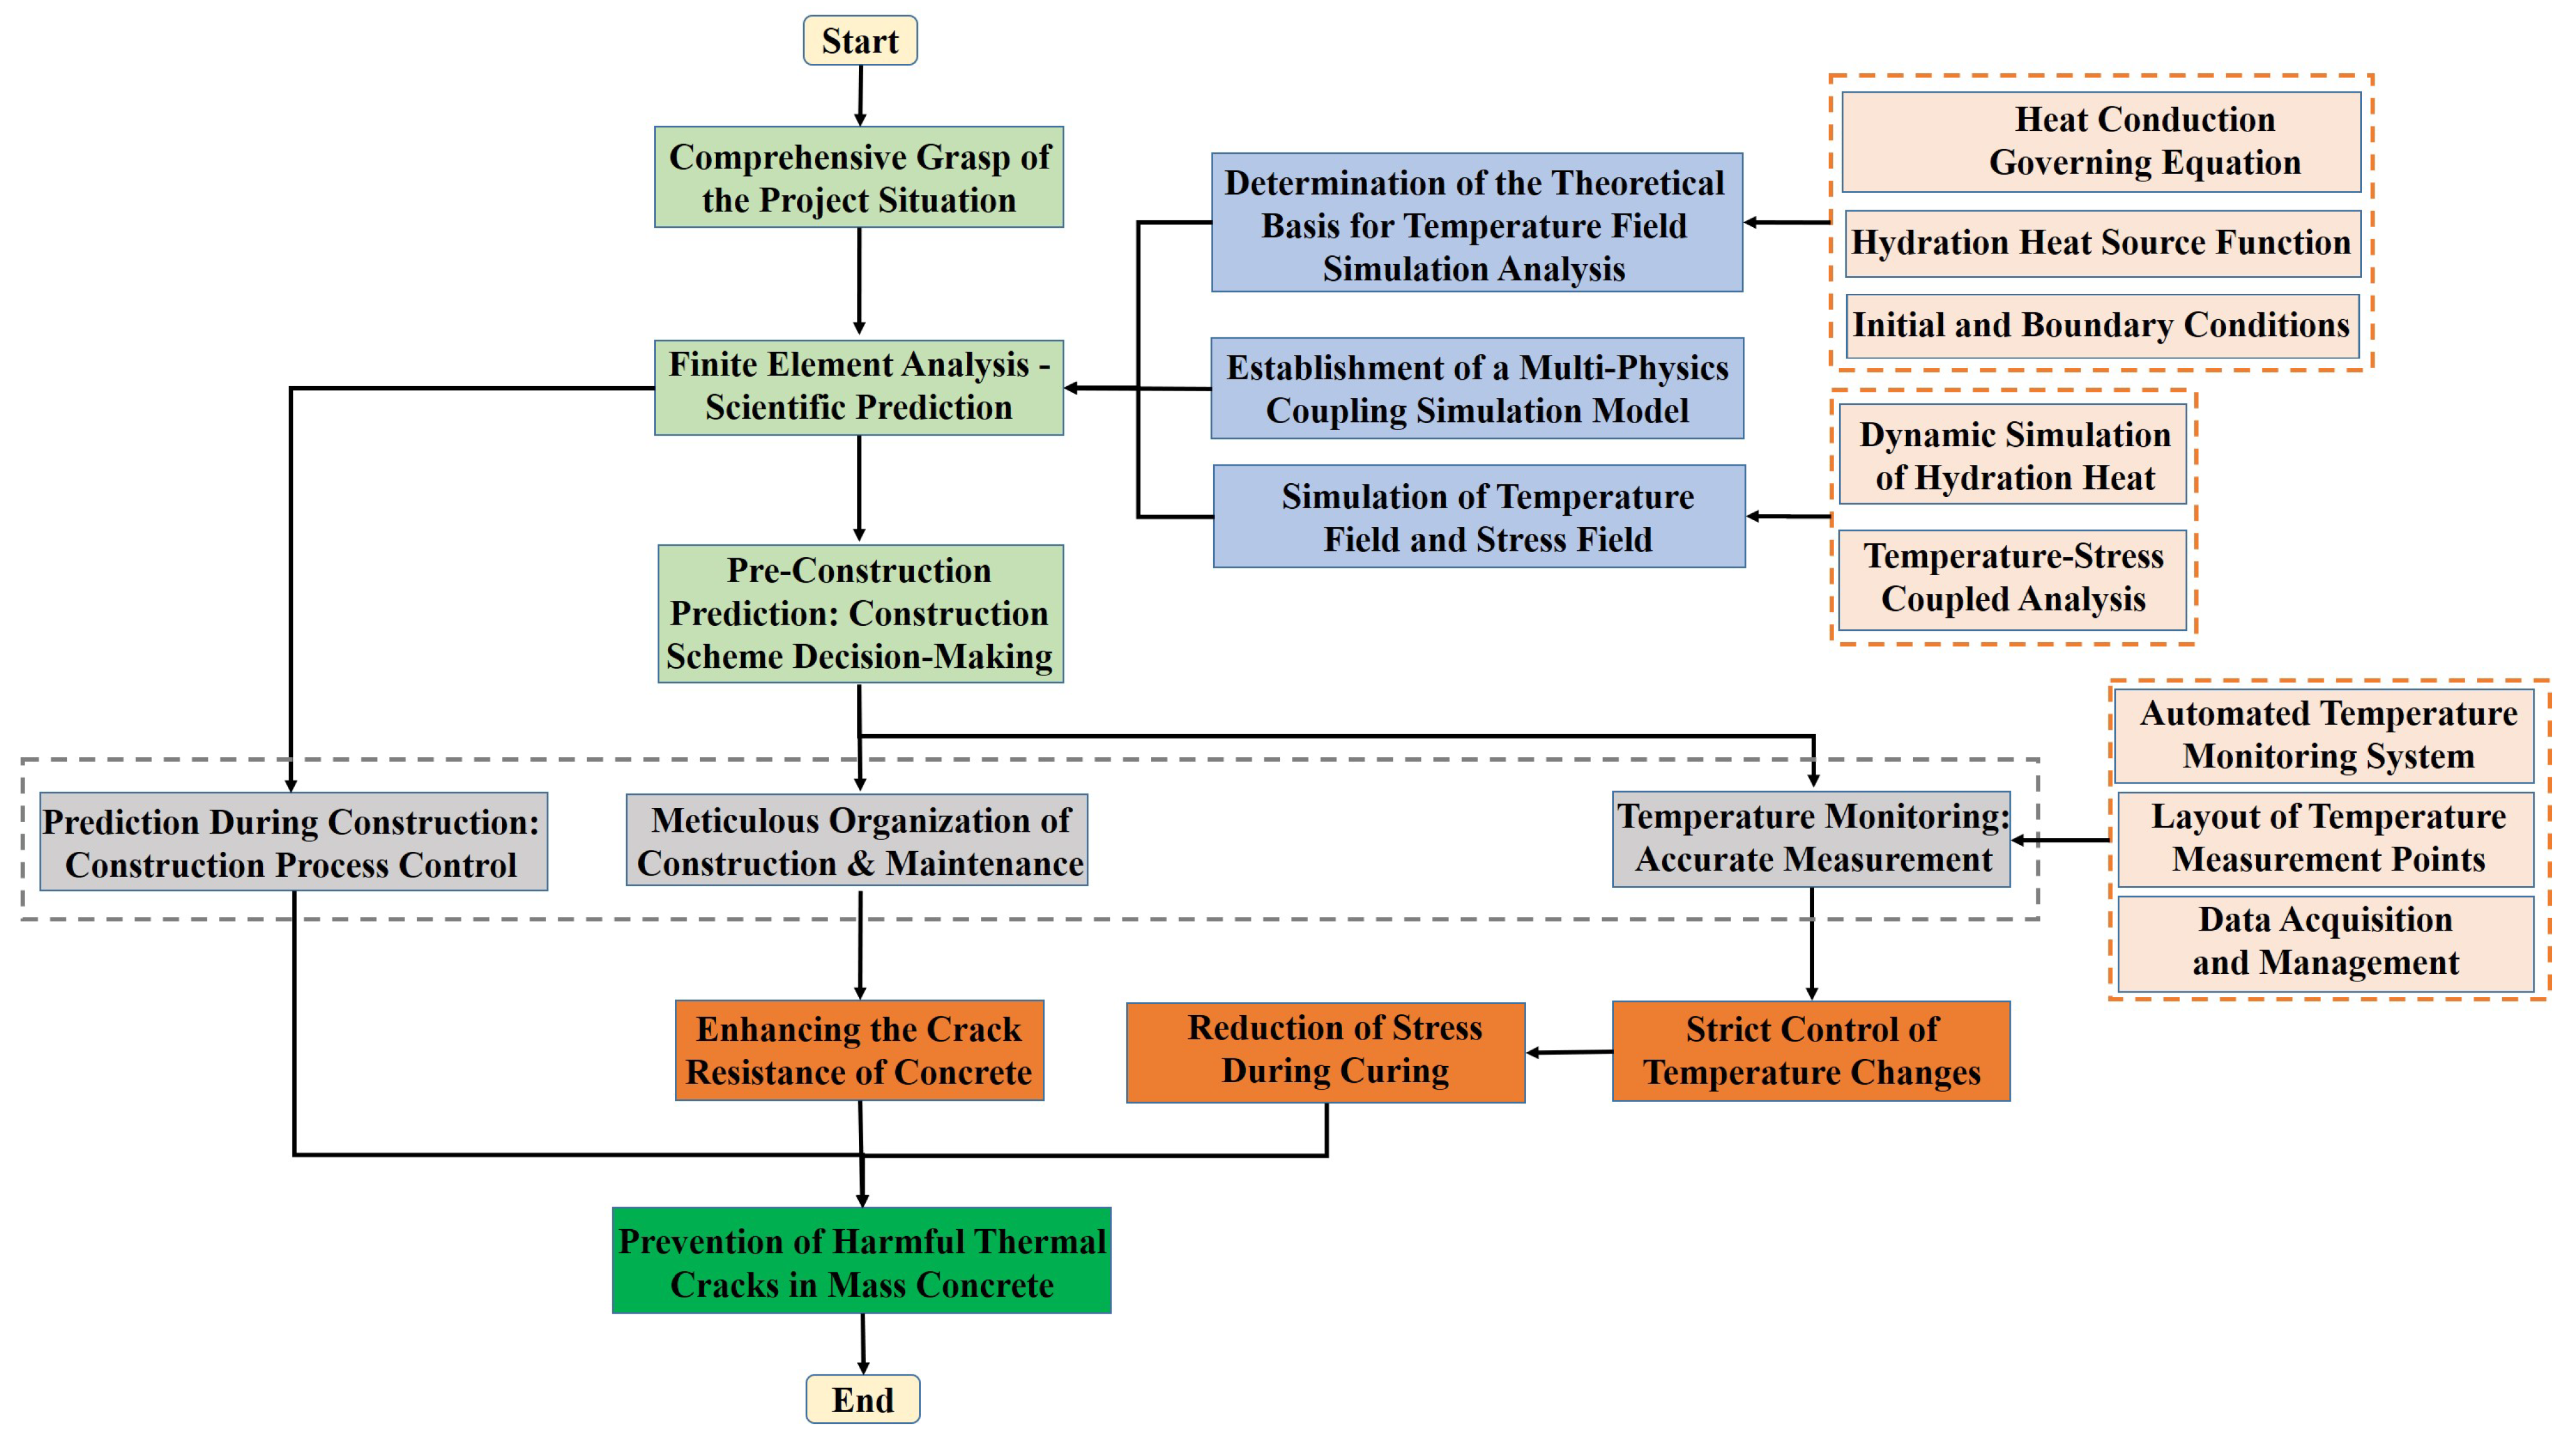
This study establishes a systematic methodology that integrates numerical simulation, on-site monitoring, and construction process optimization to develop a scientifically informed and effective quality control framework for mass concrete construction in nuclear island raft foundations. The overall workflow is illustrated in Figure 1. This integrated approach enables a comprehensive understanding of the evolution of the temperature field and the characteristics of stress distribution during the construction of mass concrete. On this basis, scientifically grounded temperature control measures and curing regimes are formulated to ensure that the construction quality meets the stringent requirements of nuclear power engineering.
Figure 1.
Flowchart of the proposed integrated quality control framework for mass concrete construction in nuclear island raft foundations.
The methodology comprises three core components: (i) Dynamic simulation of hydration heat and coupled thermal-stress analysis for mass concrete. (ii) Real-time temperature monitoring and control during construction. (iii) Optimization of construction processes and techniques.
3.1. Finite Element Analysis—Scientific Prediction
To transition from empirical estimation to physics-based prediction, a high-fidelity, multi-physics finite element model was developed. Its primary objective was to resolve the fully coupled thermo-mechanical response of the mass concrete, simulating not only the transient temperature field driven by hydration heat but also the resulting evolution of thermal stresses and deformation. This required the precise definition of time-dependent material properties, thermodynamic boundary conditions, and construction sequence logic to capture the complex interplay between heat generation, diffusion, and structural restraint.
3.1.1. Theoretical Foundation for Temperature Field Simulation
(1) Heat Conduction Governing Equation (a special case of Kirchhoff’s heat flow equation [58,59])
Assuming the concrete to be homogeneous, continuous, and isotropic, the heat conduction in the cylindrical coordinate system is governed by the following differential equation:
where is the instantaneous temperature (°C), is time (h), is the thermal conductivity (kJ/(m·h·°C)), is the specific heat capacity (kJ/(kg·°C)), is the density (kg/m3), and is the rate of heat generation per unit volume due to cement hydration (kJ/(h·m3)).
The rate of temperature rise under adiabatic conditions, due to hydration heat, is as follows [58,59]:
where is the adiabatic temperature rise (°C), is the binder content per cubic meter of concrete (kg/m3), and is the total hydration heat of the binder(kJ/kg).
Thus, the heat conduction equation [58,59] can be rewritten as
(2) Hydration Heat Source Function
The hydration heat of cementitious materials significantly influences the transient temperature field. An exponential expression [58,59] is adopted to model the heat generation rate per unit volume:
where is a constant related to cement type, dosage, and concrete placement temperature.
(3) Initial and Boundary Conditions
To solve the temperature distribution problem, the following definite conditions are applied:
(i) Dirichlet condition (constant temperature) [58,59]:
The bottom surface in contact with bedrock is assumed to maintain a constant temperature based on prior project experience (set to 18 °C in this study).
(ii) Robin condition (convective heat transfer) [58,59]:
Surfaces exposed to air (through insulation or formwork) follow:
where is the surface normal, is the surface heat transfer coefficient (kJ/(m2·h·°C)), and is the ambient temperature (°C).
(iii) Interface continuity condition [58,59]:
At the concrete-bedrock interface, temperature, and heat flux are continuous:
3.1.2. Development of the Multi-Physics Coupling Simulation Model
A detailed finite element model was developed based on a real nuclear power project, incorporating concrete mix proportions, thermophysical properties (specific heat, adiabatic temperature rise, thermal conductivity, diffusivity), mechanical properties (elastic modulus, shrinkage, creep, Poisson’s ratio), environmental conditions (ambient temperature, wind speed), and construction details (pouring sequence, layer thickness). This model simulates the coupled temperature–stress–deformation history of the raft foundation.
(1) Hydration Heat Dynamic Simulation:
An unsteady-state finite element model simulates the spatiotemporal release of hydration heat, predicting the evolution of the temperature field . Key outputs include the maximum internal temperature rise, the core-to-surface temperature difference, and the temperature distribution over time and space, providing direct input for thermal stress analysis.
(2) Thermal-Stress Coupled Analysis
Thermal stress arises from constrained thermal deformation. The coupling between the temperature and stress fields is achieved through the following relations:
(i) Thermal strain equation [60,61]:
where is the thermal strain, is the linear expansion coefficient (1/°C), is the temperature difference relative to the placement reference temperature .
(ii) Thermo-mechanical constitutive equation:
Considering the time-dependent development of concrete properties, an age-dependent linear elastic constitutive model [62,63] is used:
where is the stress tensor, is the total strain, is the drying shrinkage strain (neglected in pure hydration analysis), and is the age-dependent elastic stiffness matrix. For an isotropic material, is defined by the age-varying elastic modulus and Poisson’s ratio ν(t) [62,63]:
The elastic modulus development is modeled as follows [62,63]:
where is the 28-day elastic modulus; and are fitting parameters.
(iii) Cracking Risk Assessment:
A cracking risk coefficient is employed for quantitative evaluation [64,65]:
where is the maximum tensile stress at age ; is the corresponding axial tensile strength, modeled as follows [64,65]:
where is the 28-day tensile strength; and are fitting parameters.
A value of indicates a low cracking risk (95% confidence), suggests potential risk requiring curing optimization, and indicates a high risk of cracking.
3.1.3. Pre-Construction Prediction for Scheme Decision-Making
The model served a proactive decision-support role in the planning phase. By visualizing predicted high-risk zones for thermal cracking (areas of high tensile stress relative to early-age strength), it informed critical pre-construction choices regarding pour sequencing, segment division, and insulation strategy. Furthermore, these predictions directly guided the optimized placement of temperature sensors, ensuring that monitoring resources were focused on validating the model in the most critical regions.
After construction commences, the finite element model is dynamically calibrated by comparing its predictions with real-time temperature data from the site. The calibration procedure involves the following: (1) Acquire data: Collecting temperature data from embedded sensors at 10 min intervals. (2) Adjust parameter: Iteratively adjusting heat source parameters (, ) and boundary conditions to minimize root mean square error (RMSE) between simulated and measured values. (3) Validate model: Comparing calibrated model predictions with subsequent monitoring data. (4) Implement feedback: Using updated model to forecast future trends and optimize curing measures. Model parameters are iteratively adjusted to improve accuracy, and the updated model is used to forecast future temperature and stress trends. This feedback loop allows for real-time optimization of curing measures and temperature control strategies throughout the construction and curing period.
3.2. Temperature Monitoring—Accurate Measurement
While finite element analysis provides a theoretical understanding of the internal temperature and thermal stress development in the nuclear island raft foundation, discrepancies between simulation results and actual field conditions are inevitable. This is primarily due to the inherent difficulty in fully capturing the exact construction dynamics within a computational model. To address this, a comprehensive on-site temperature monitoring regime is essential. This allows for the real-time comparison of measured data with theoretical predictions, enabling continuous calibration of model parameters, refinement of the simulation model, and the timely implementation of corrective temperature control measures. This integrated monitoring-and-calibration approach ensures the reliability of the numerical analysis and, subsequently, enables the optimization of temperature control strategies to guarantee the construction quality of the raft foundation.
3.2.1. Automated Temperature Monitoring System
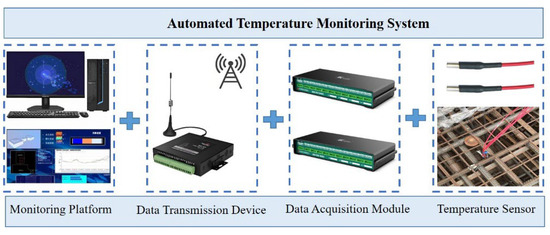
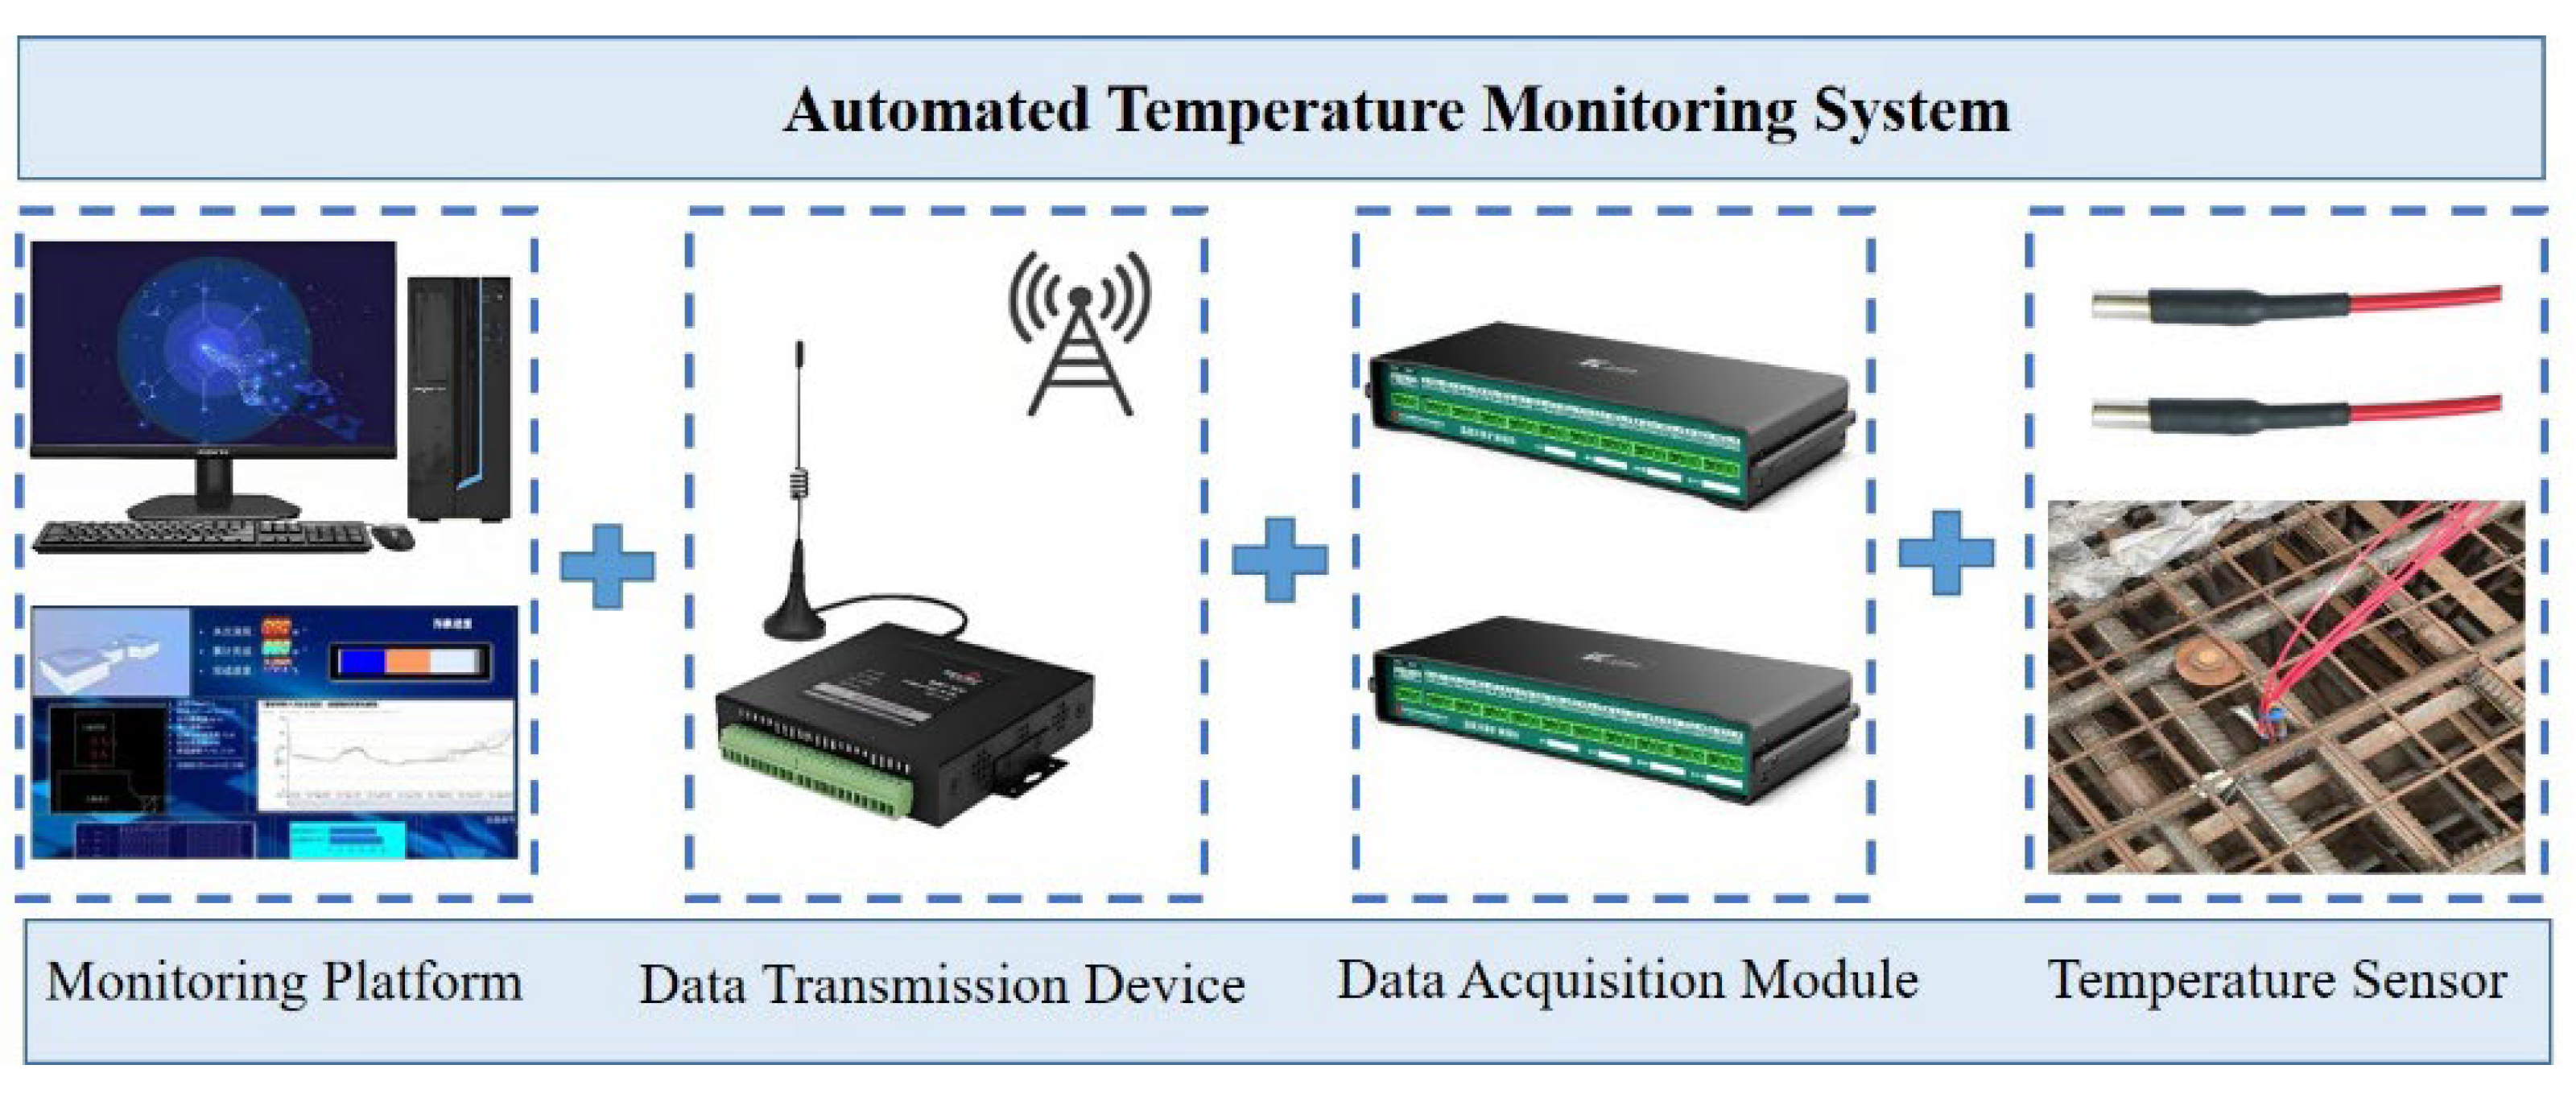
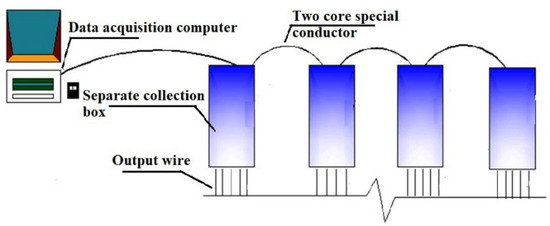
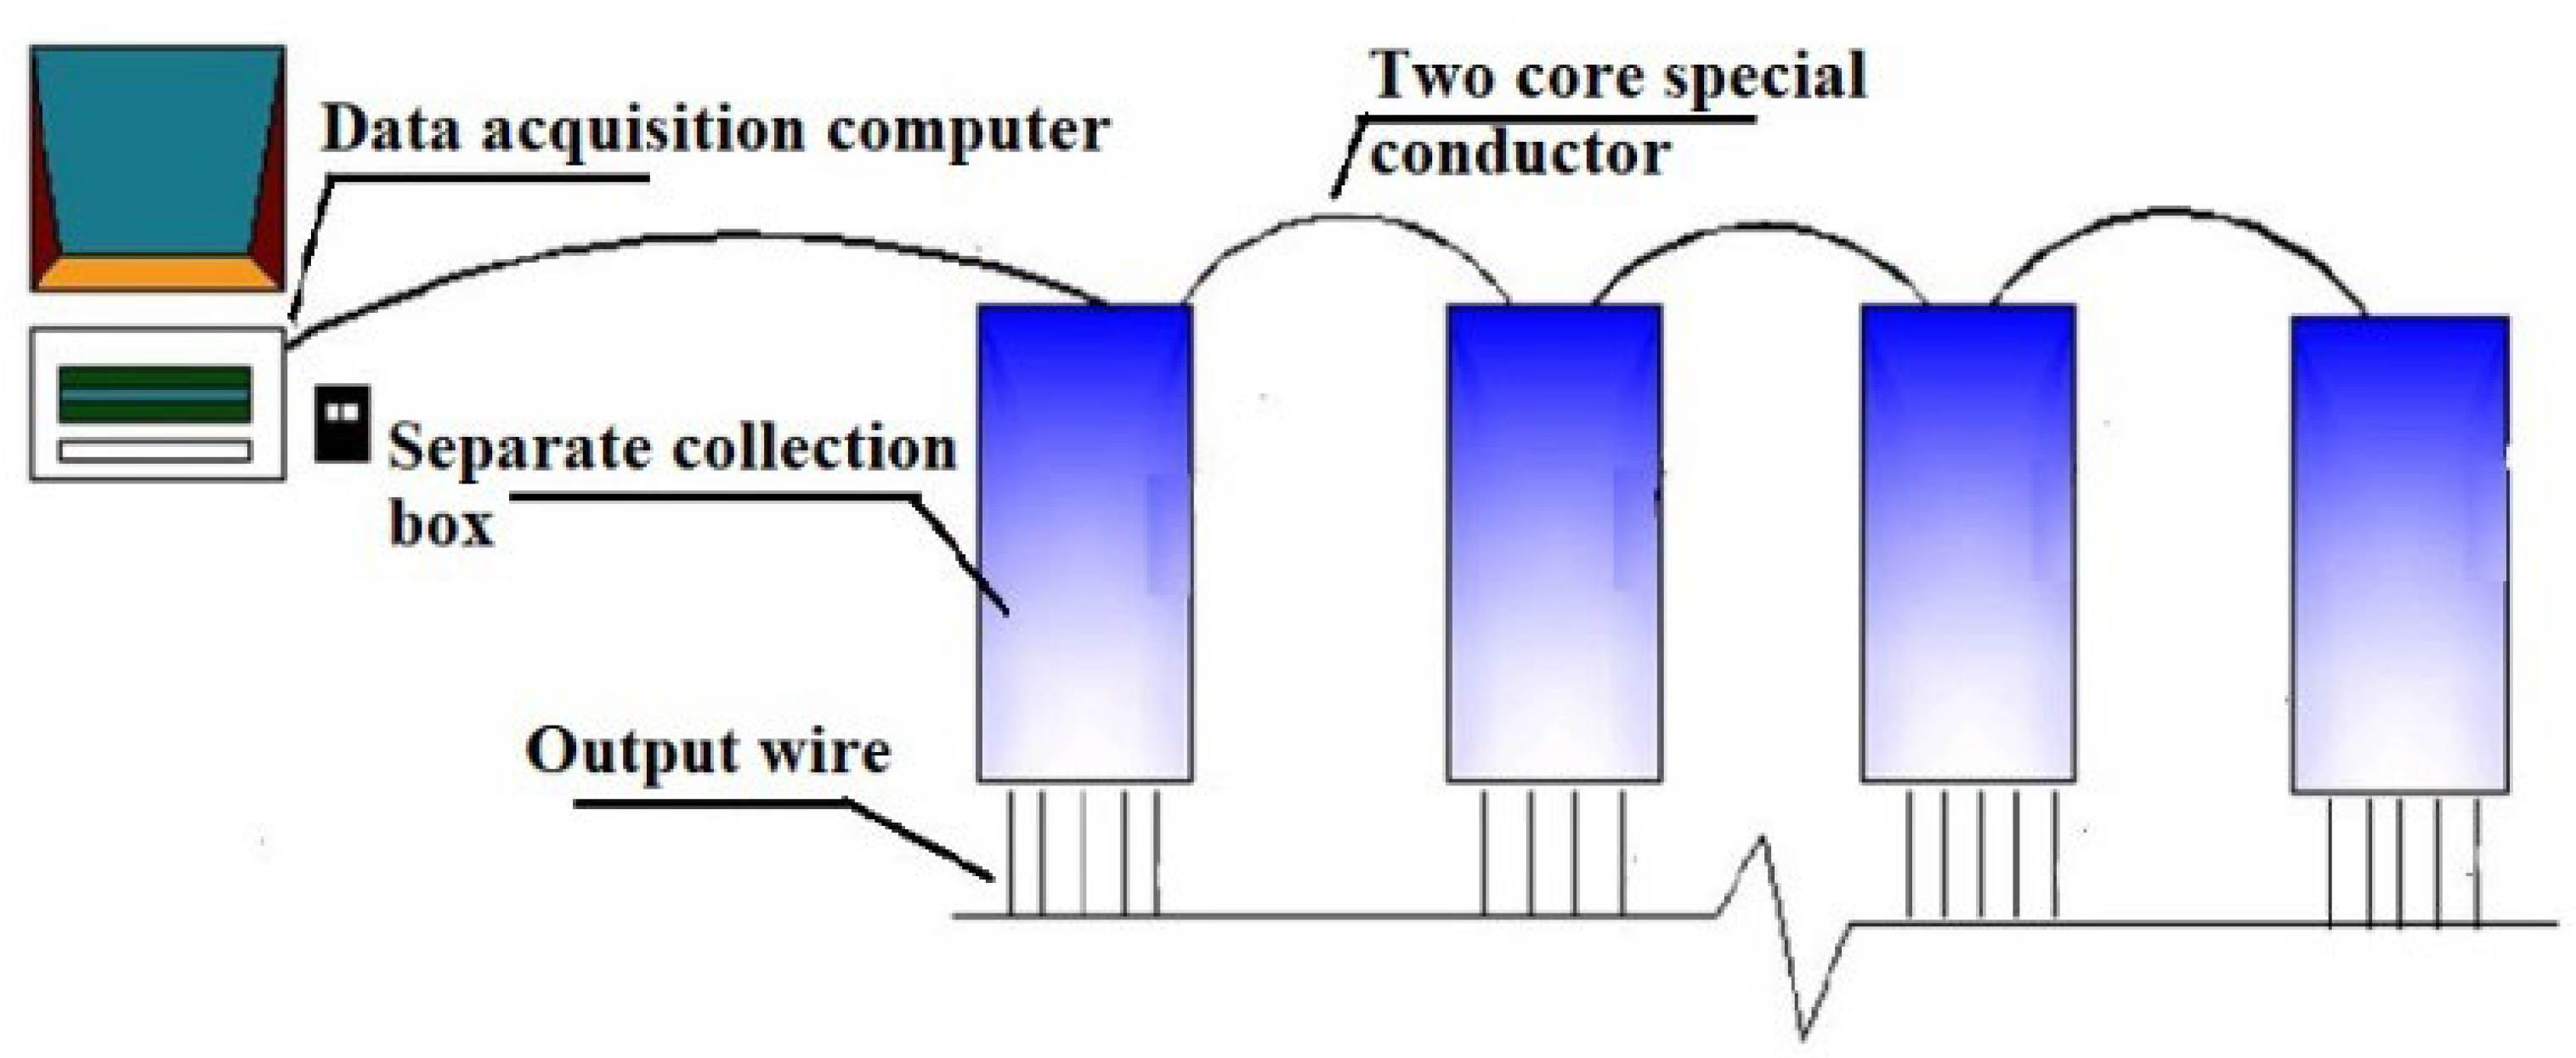
An automated temperature monitoring system was deployed, comprising a central monitoring platform, data transmission units, data acquisition modules, and embedded temperature sensors (Figure 2 and Figure 3). This system was designed to fulfill three core requirements: real-time monitoring, analytical early warning, and full data traceability. Its key functionalities included the following: (i) Real-time Visualization: Display of temperature evolution curves and spatial distribution maps of monitoring points. (ii) Intelligent Early Warning: Customizable alert thresholds (e.g., core–surface temperature difference > 25 °C, cooling rate > 2 °C/day) with push notifications via a mobile application to ensure prompt response.
Figure 2.
Schematic of the automated temperature monitoring system.
Figure 3.
Working principle of the automated temperature monitoring system.
3.2.2. Layout of Temperature Measurement Points
The layout of temperature sensors followed the principle of comprehensive coverage combined with focused monitoring of critical zones. The aim was to accurately capture the maximum temperature rise, internal-to-surface temperature differentials, cooling rates, and ambient temperature within the concrete pour. The monitoring scheme was deployed over one symmetric half of the raft foundation plan. Monitoring points were arranged in a planar grid, and along the thickness direction, sensors were placed at the core, as well as near the top and bottom surfaces (positioned 5–10 cm from the respective concrete faces).
3.2.3. Data Acquisition and Management
A fully automatic data acquisition scheme was implemented with a sampling interval of 10 min. The system was connected to a central computer for automatic data storage and preliminary analysis. All monitoring data were uploaded in real time to a cloud platform, facilitating remote oversight via a mobile application. This setup enabled the timely detection of anomalies and the swift implementation of countermeasures.
3.3. Optimization of Construction Technology—Innovation in Methods
The selection of appropriate construction technology is paramount, as it directly influences both the quality and the efficiency of mass concrete placement. In this study, the optimal construction technique was determined through an iterative process involving numerical simulation and techno-economic comparison.
3.3.1. Optimization via Multi-Physics Field Simulation
A parametric study was conducted by quantifying the influence weights of various factors—including concrete mix proportion, thermal and physical material parameters, environmental conditions, and construction sequencing—on the outcomes of the coupled multi-physics simulation. This analysis established optimization thresholds for key variables. Temperature rise curves under different pouring sequences and layer thicknesses were simulated to identify a balance between construction efficiency and the risk of thermal cracking. Regarding the thermal modeling methodology, the insulation layer was not treated as an independent solid element. Instead, based on the principle of equivalent thermal resistance, its insulating effect was converted into a modification of the equivalent heat transfer coefficient at the concrete surface. This approach accurately reflects the practical impact of insulation measures on boundary heat dissipation conditions. The effectiveness of different thermal insulation covering regimes was modeled to determine the optimal timing and duration for curing interventions.
3.3.2. Selection of Construction Technology
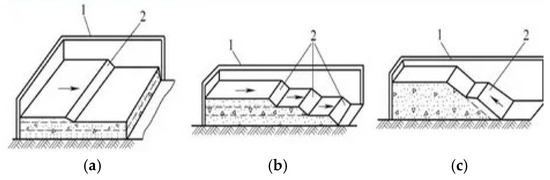
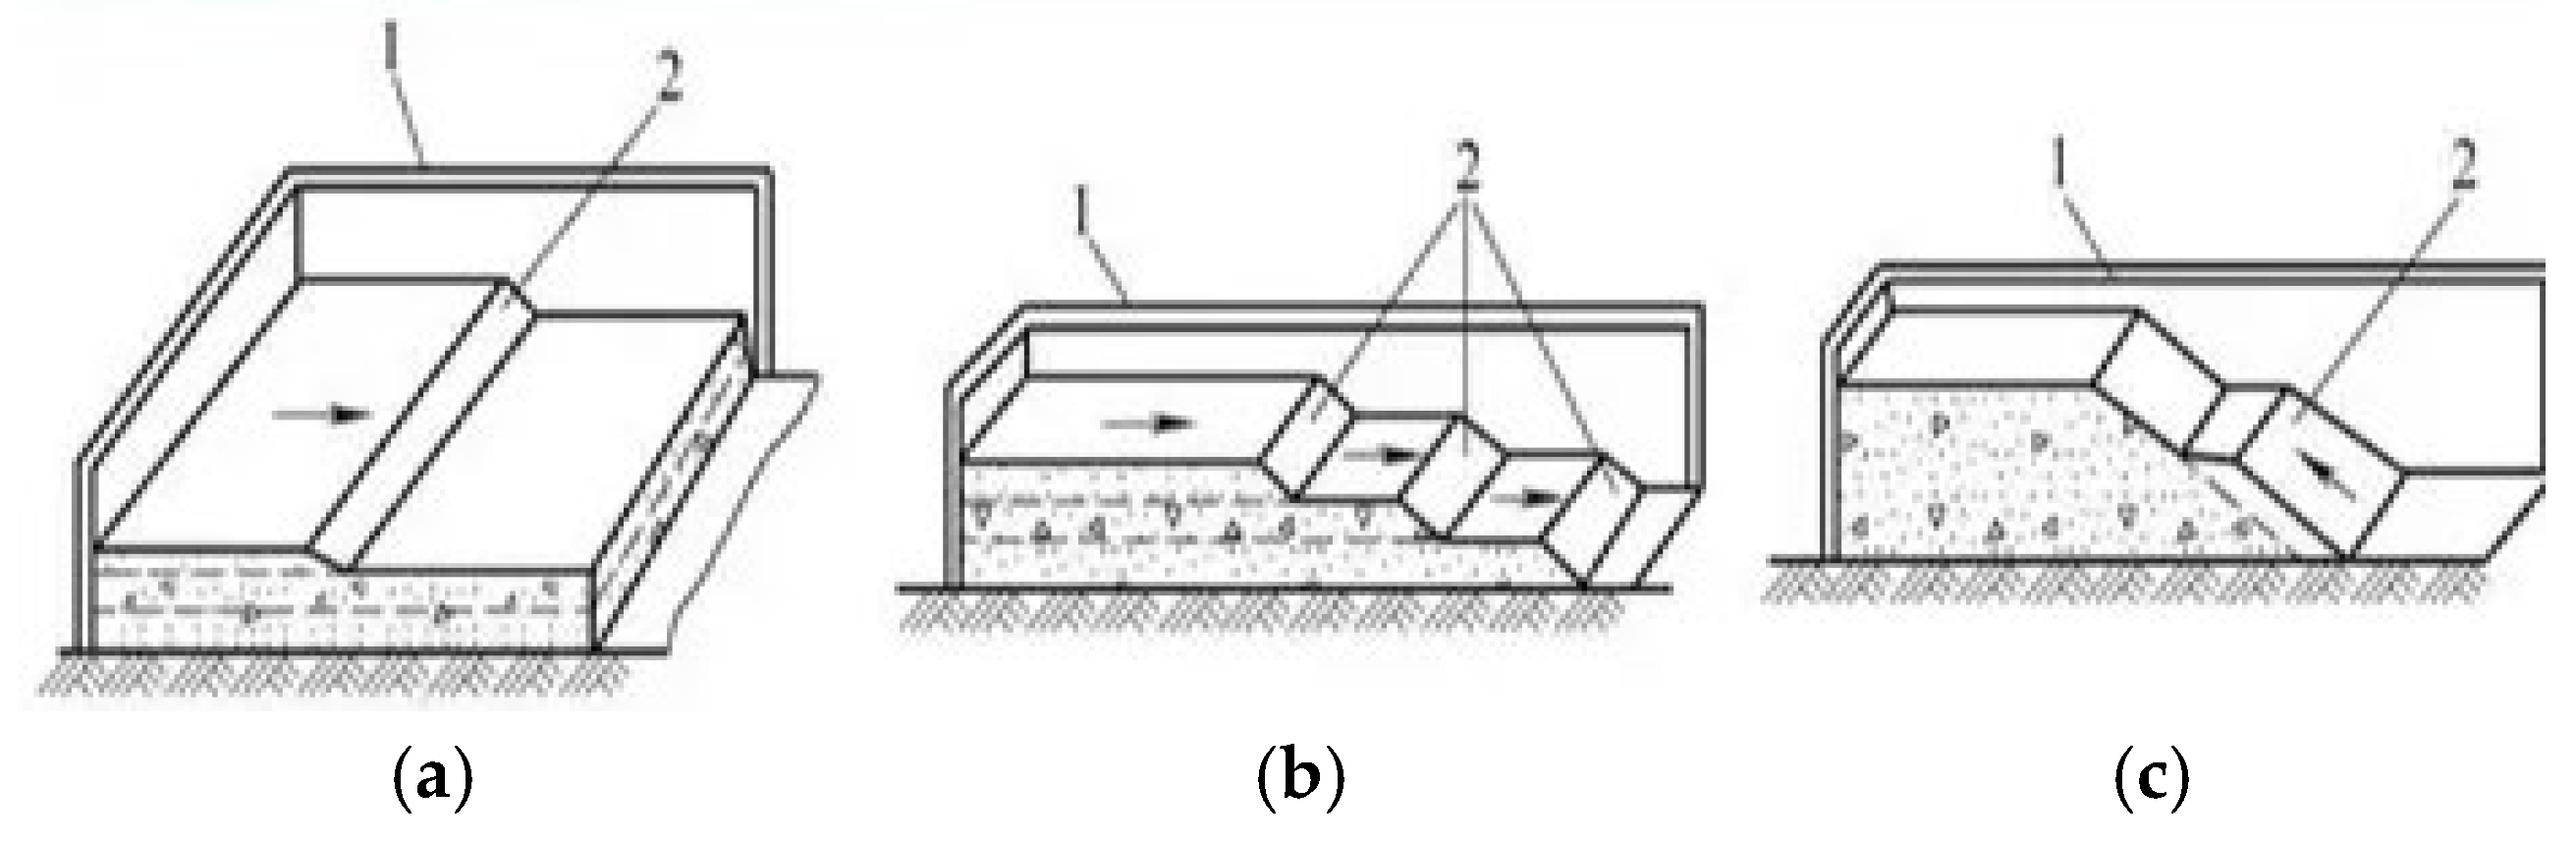
Common placement methods for mass concrete include full-layer pouring, segmental-layer pouring, and inclined-layer pouring (Figure 4). The fundamental differences among these methods lie in the pouring sequence, inter-layer interval time, and heat dissipation paths, leading to significant variations in resulting temperature fields (e.g., peak temperature, temperature distribution) and stress fields (e.g., stress type, magnitude, cracking risk).
Figure 4.
Traditional mass concrete placement methods: (a) full-layer, (b) segmental-layer, (c) inclined-layer (1—formwork; 2—fresh concrete).
Deviating from the traditional inclined-layer method previously used for similar foundations, this project adopted an innovative placement strategy. By analyzing concrete supply capacity, on-site batching plant throughput, and feasible placement intensity, the circular raft foundation was divided into six uniformly sized fan-shaped pouring zones. A hybrid placement method combining inclined-layer and full-layer techniques was employed to execute a synchronous pouring sequence from the center towards the periphery. This optimized scheme was demonstrated through simulation to significantly reduce the peak concrete temperature, thereby effectively mitigating the risk of thermal cracking and ensuring superior construction quality.
4. Case Study
4.1. Case Background
Specification Framework: The construction control and subsequent analysis for this case study are primarily governed by the Chinese GB (National Standard) code system. Consequently, all control criteria (e.g., temperature differential limits), material property evaluations, and analytical benchmarks established in the following sections are based on the relevant GB specifications.
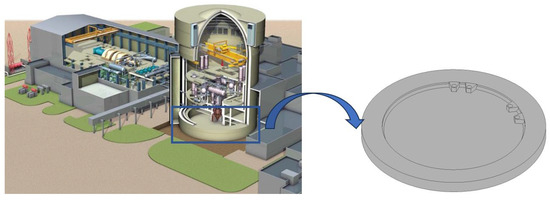
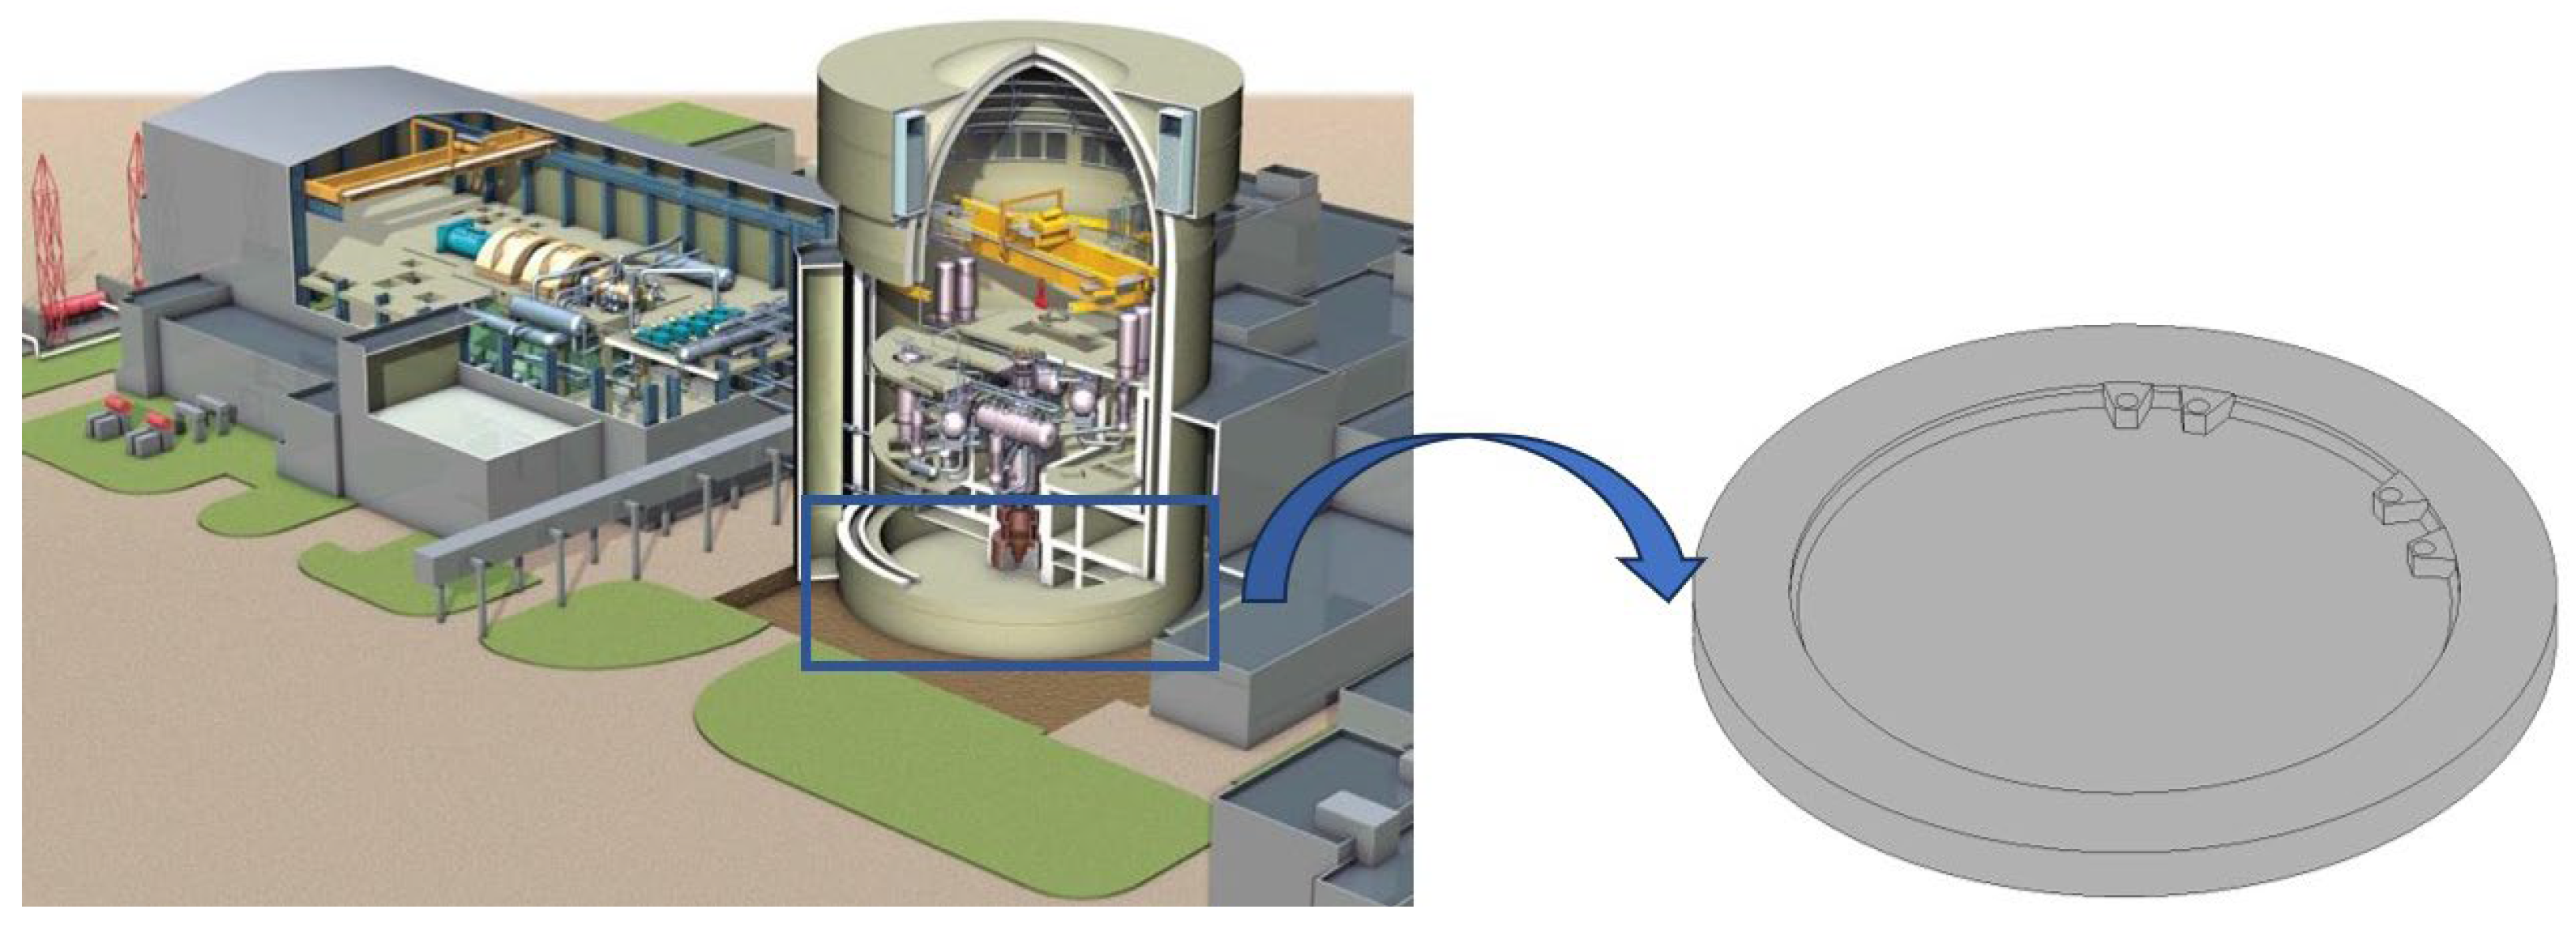
This study focuses on the nuclear island raft foundation constructed for a VVER-1200 reactor within the Phase II Project of the Xudapu NPP in northern China. This cylindrical reinforced concrete raft serves as the base for the reactor containment building (RCB). The foundation, illustrated in Figure 5, Figure 6 and Figure 7, has a diameter of 51.6 m, with a central thickness of 2.114 m increasing to 3.35 m at the periphery. The foundation bottom is situated at an elevation of −10.850 m. The central circular area, with a diameter of 38.7 m, has a top elevation of −8.730 m, and its side walls transition from a truncated conical to a cylindrical surface within the elevation range of −8.730 m to −7.500 m.
Figure 5.
Rendering of the phase II project of the Xudapu NPP in northern China.
Figure 6.
Three-dimensional model of the nuclear island raft foundation for the VVER-1200 reactor type NPP.
Figure 7.
Cross-section of the nuclear island raft foundation.
The substructure consists of moderately to slightly weathered bedrock. Designed with B40-grade concrete, the raft required a one-time monolithic placement of 5240 m3 over approximately 41 h, classifying the work as mass concrete construction. While the raft includes sealed penetrations for sump tanks, their thermal influence is neglected in this analysis for simplification. The concrete mix design is detailed in Table 1, while the relevant properties of cement are presented in Table 2.
Table 1.
Concrete mix proportion for the nuclear island raft foundation.
Table 2.
Key properties of the cement used.
4.2. Innovative Concrete Placement Strategy
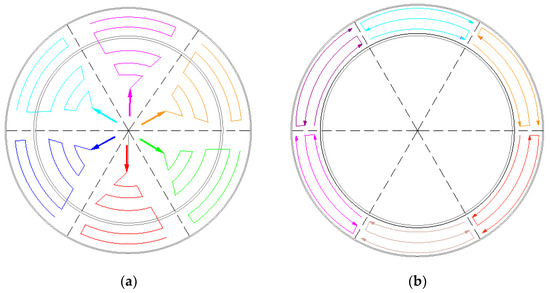
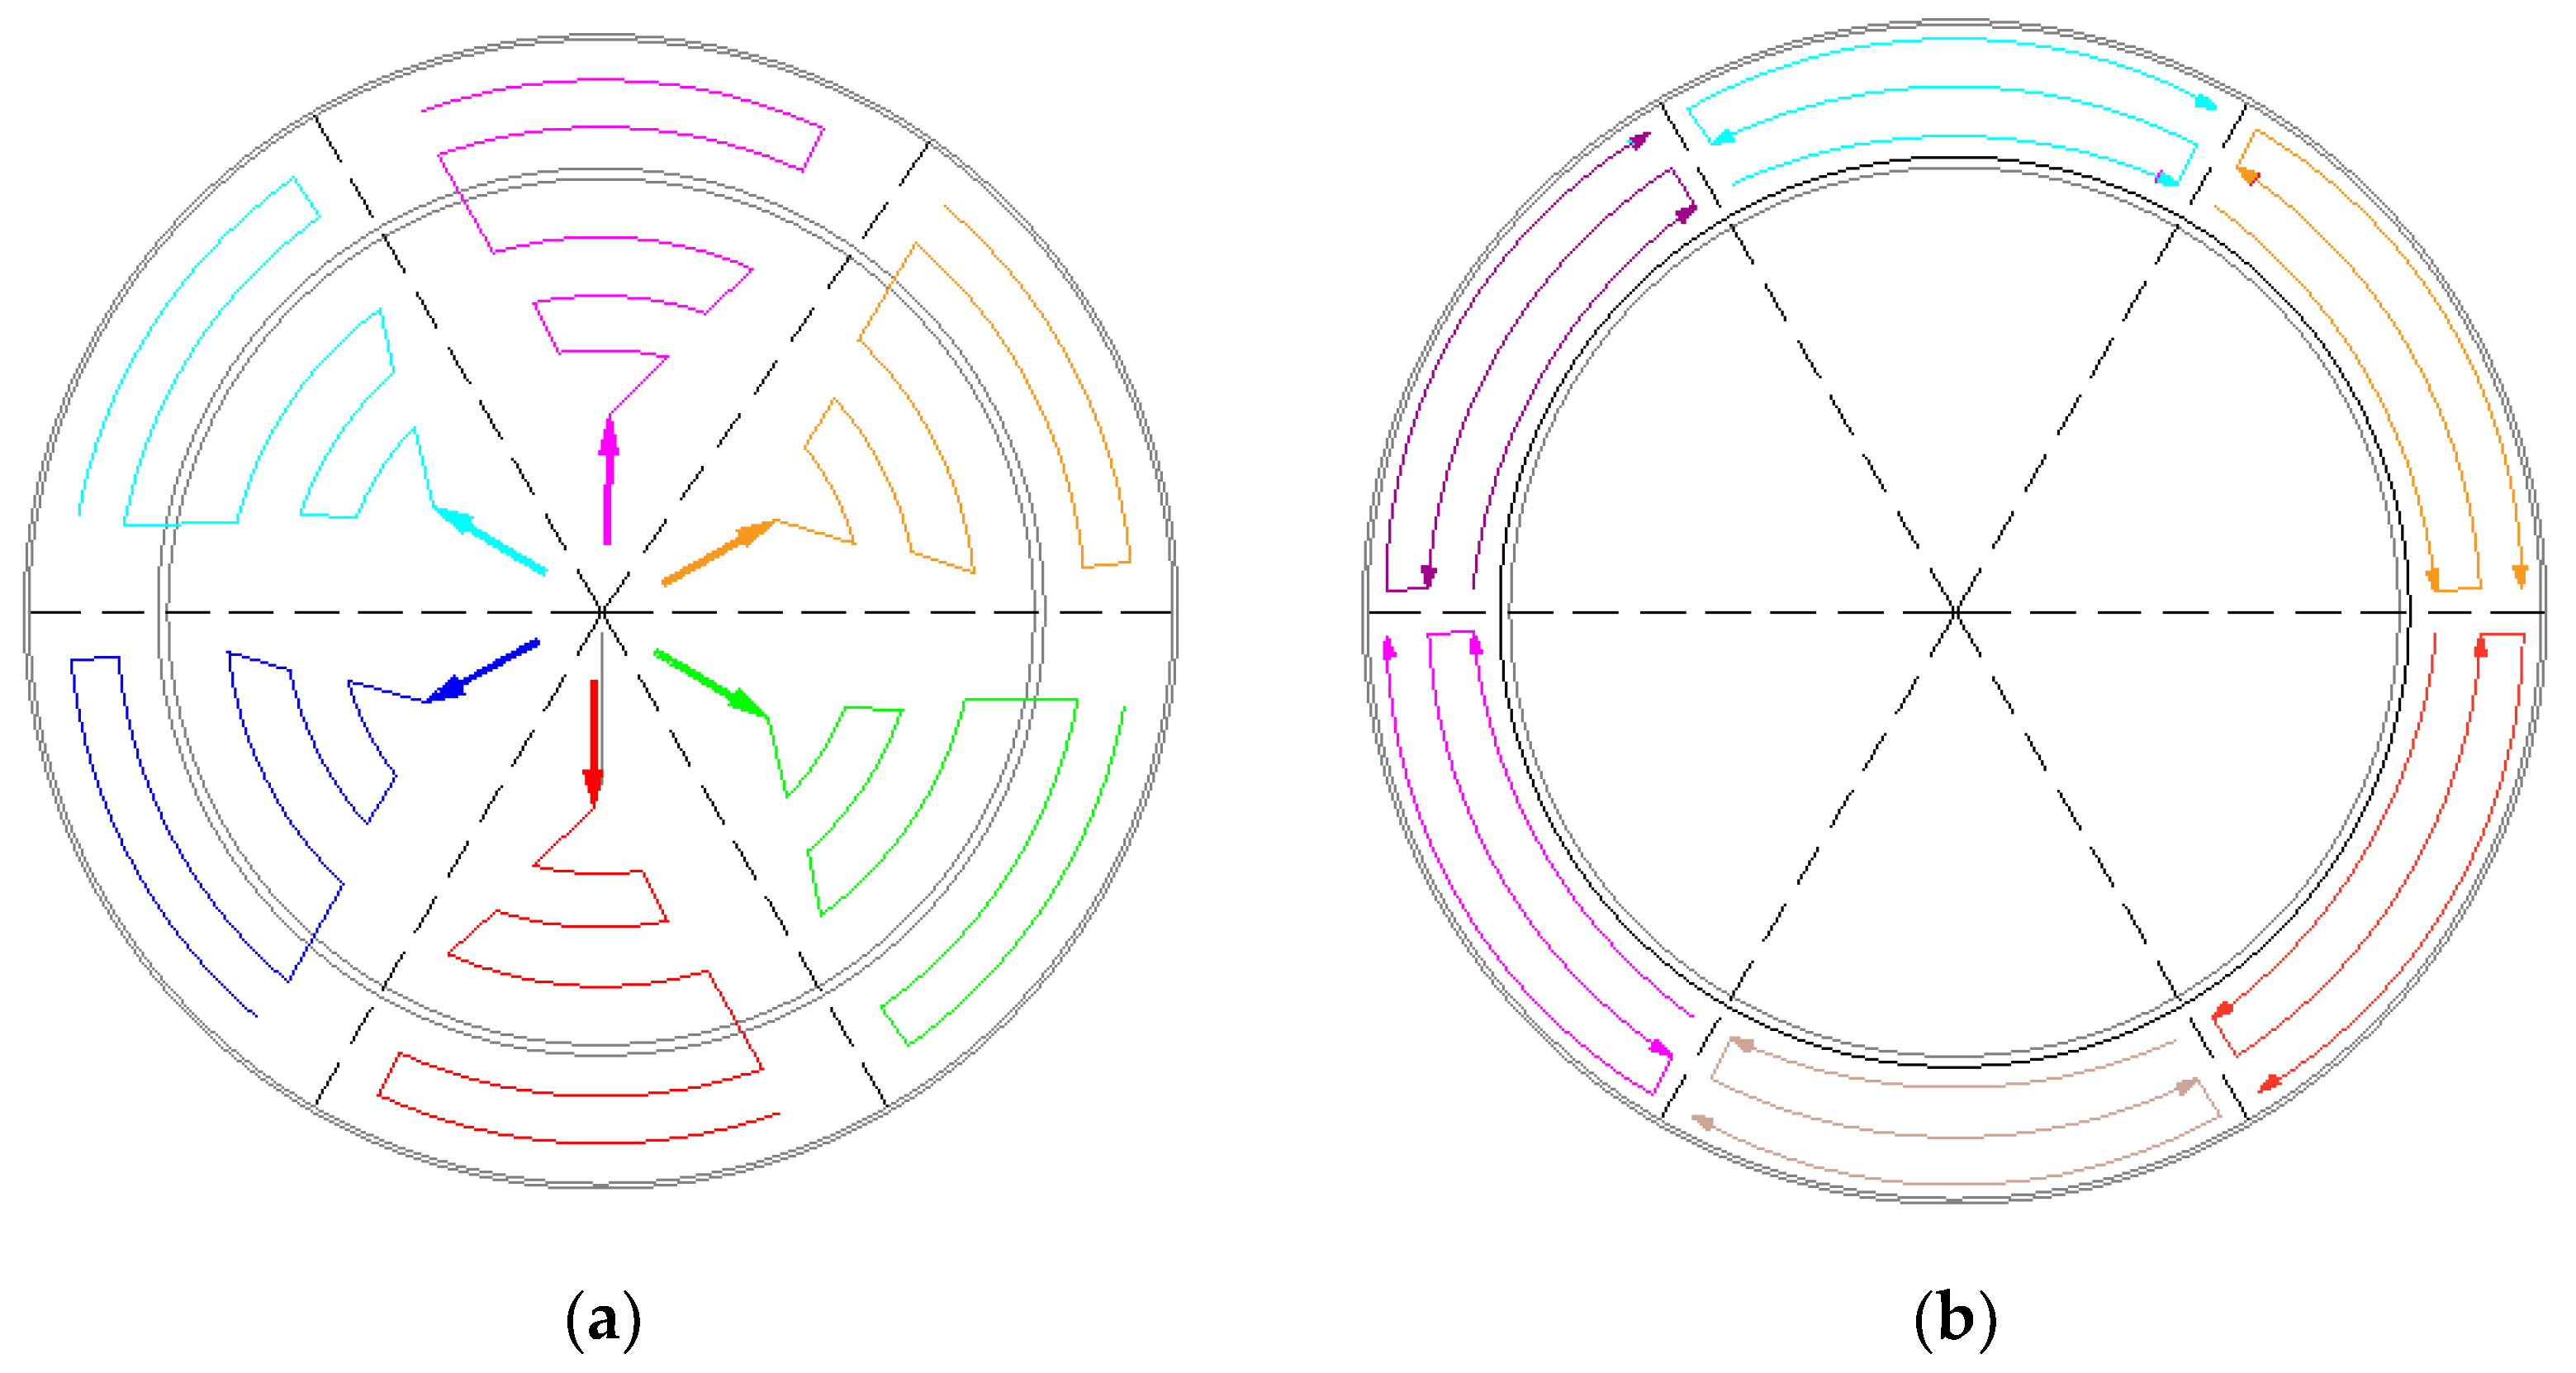
To proactively address the inherent thermal stress caused by the variable thickness, an innovative placement strategy was devised, moving beyond conventional methods. The circular raft was partitioned into six equal fan-shaped sectors to enable controlled, concurrent pouring. A hybrid technique was developed, strategically combining inclined-layer placement in the deeper lower section with full-layer placement in the shallower upper section. The core innovation lies in its synchronous centrifugal pouring sequence (Figure 8), which was engineered to create a beneficial time lag in hydration heat release between the central and peripheral regions.
Figure 8.
Concrete pouring direction of the 1st~23rd layers: (a) the 1st~17th layers; (b) the 18th~23rd layers.
Placement was sequenced into 23 layers: the lower section (−10.850 m to −8.736 m) utilized an inclined-layer technique (17 layers), while the upper section (−8.736 m to −7.500 m) employed horizontal full-layer placement (6 layers). The initial four layers were placed at a 500 mm thickness, with subsequent layers at 250 mm (Figure 9).
Figure 9.
Sequential diagram of layered pouring for the nuclear island raft foundation.
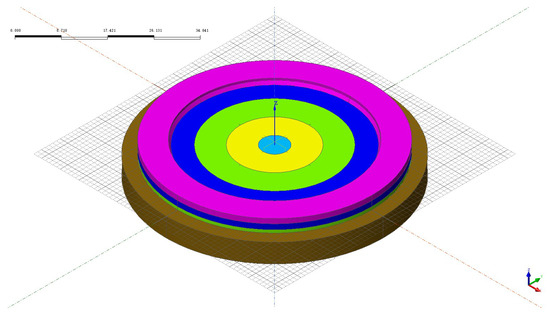
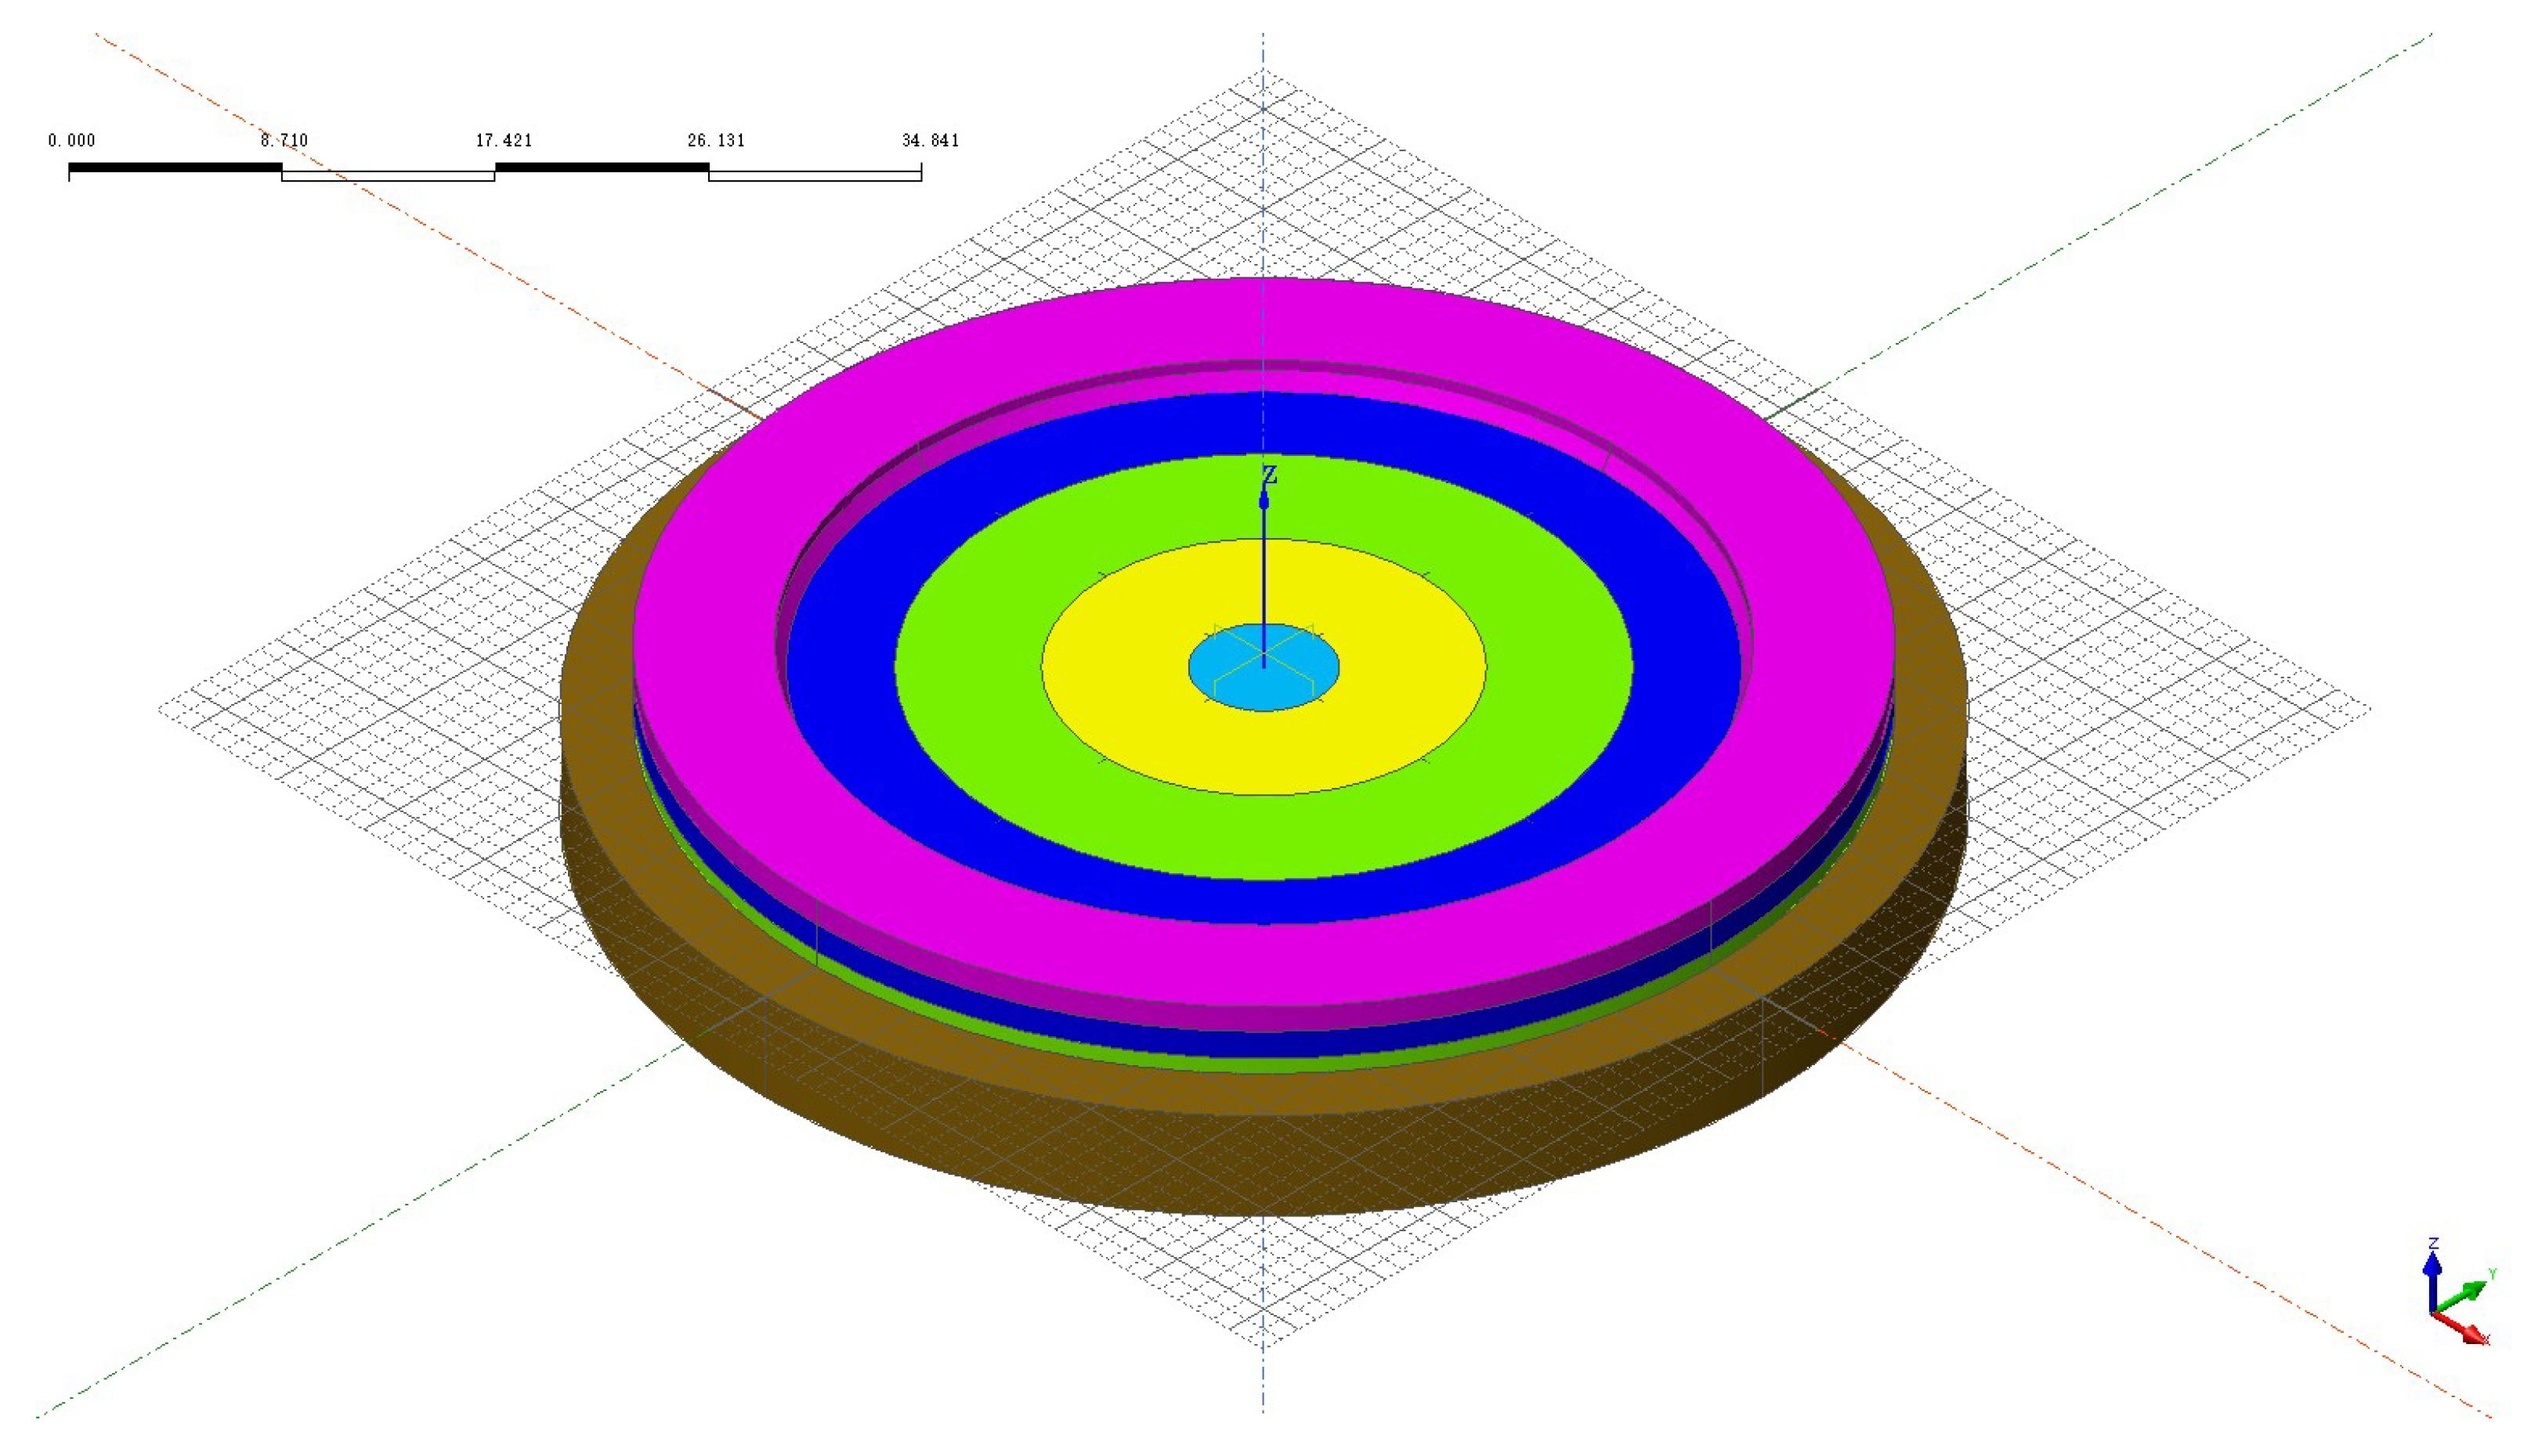
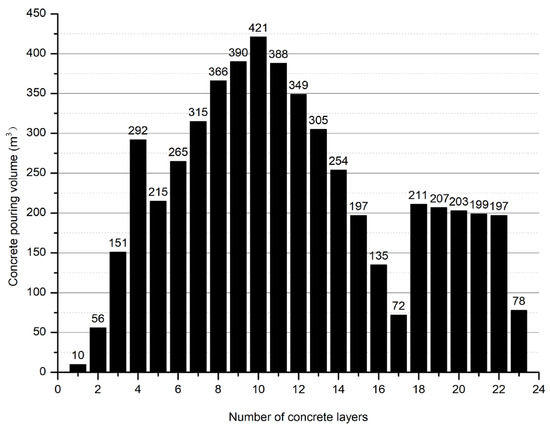
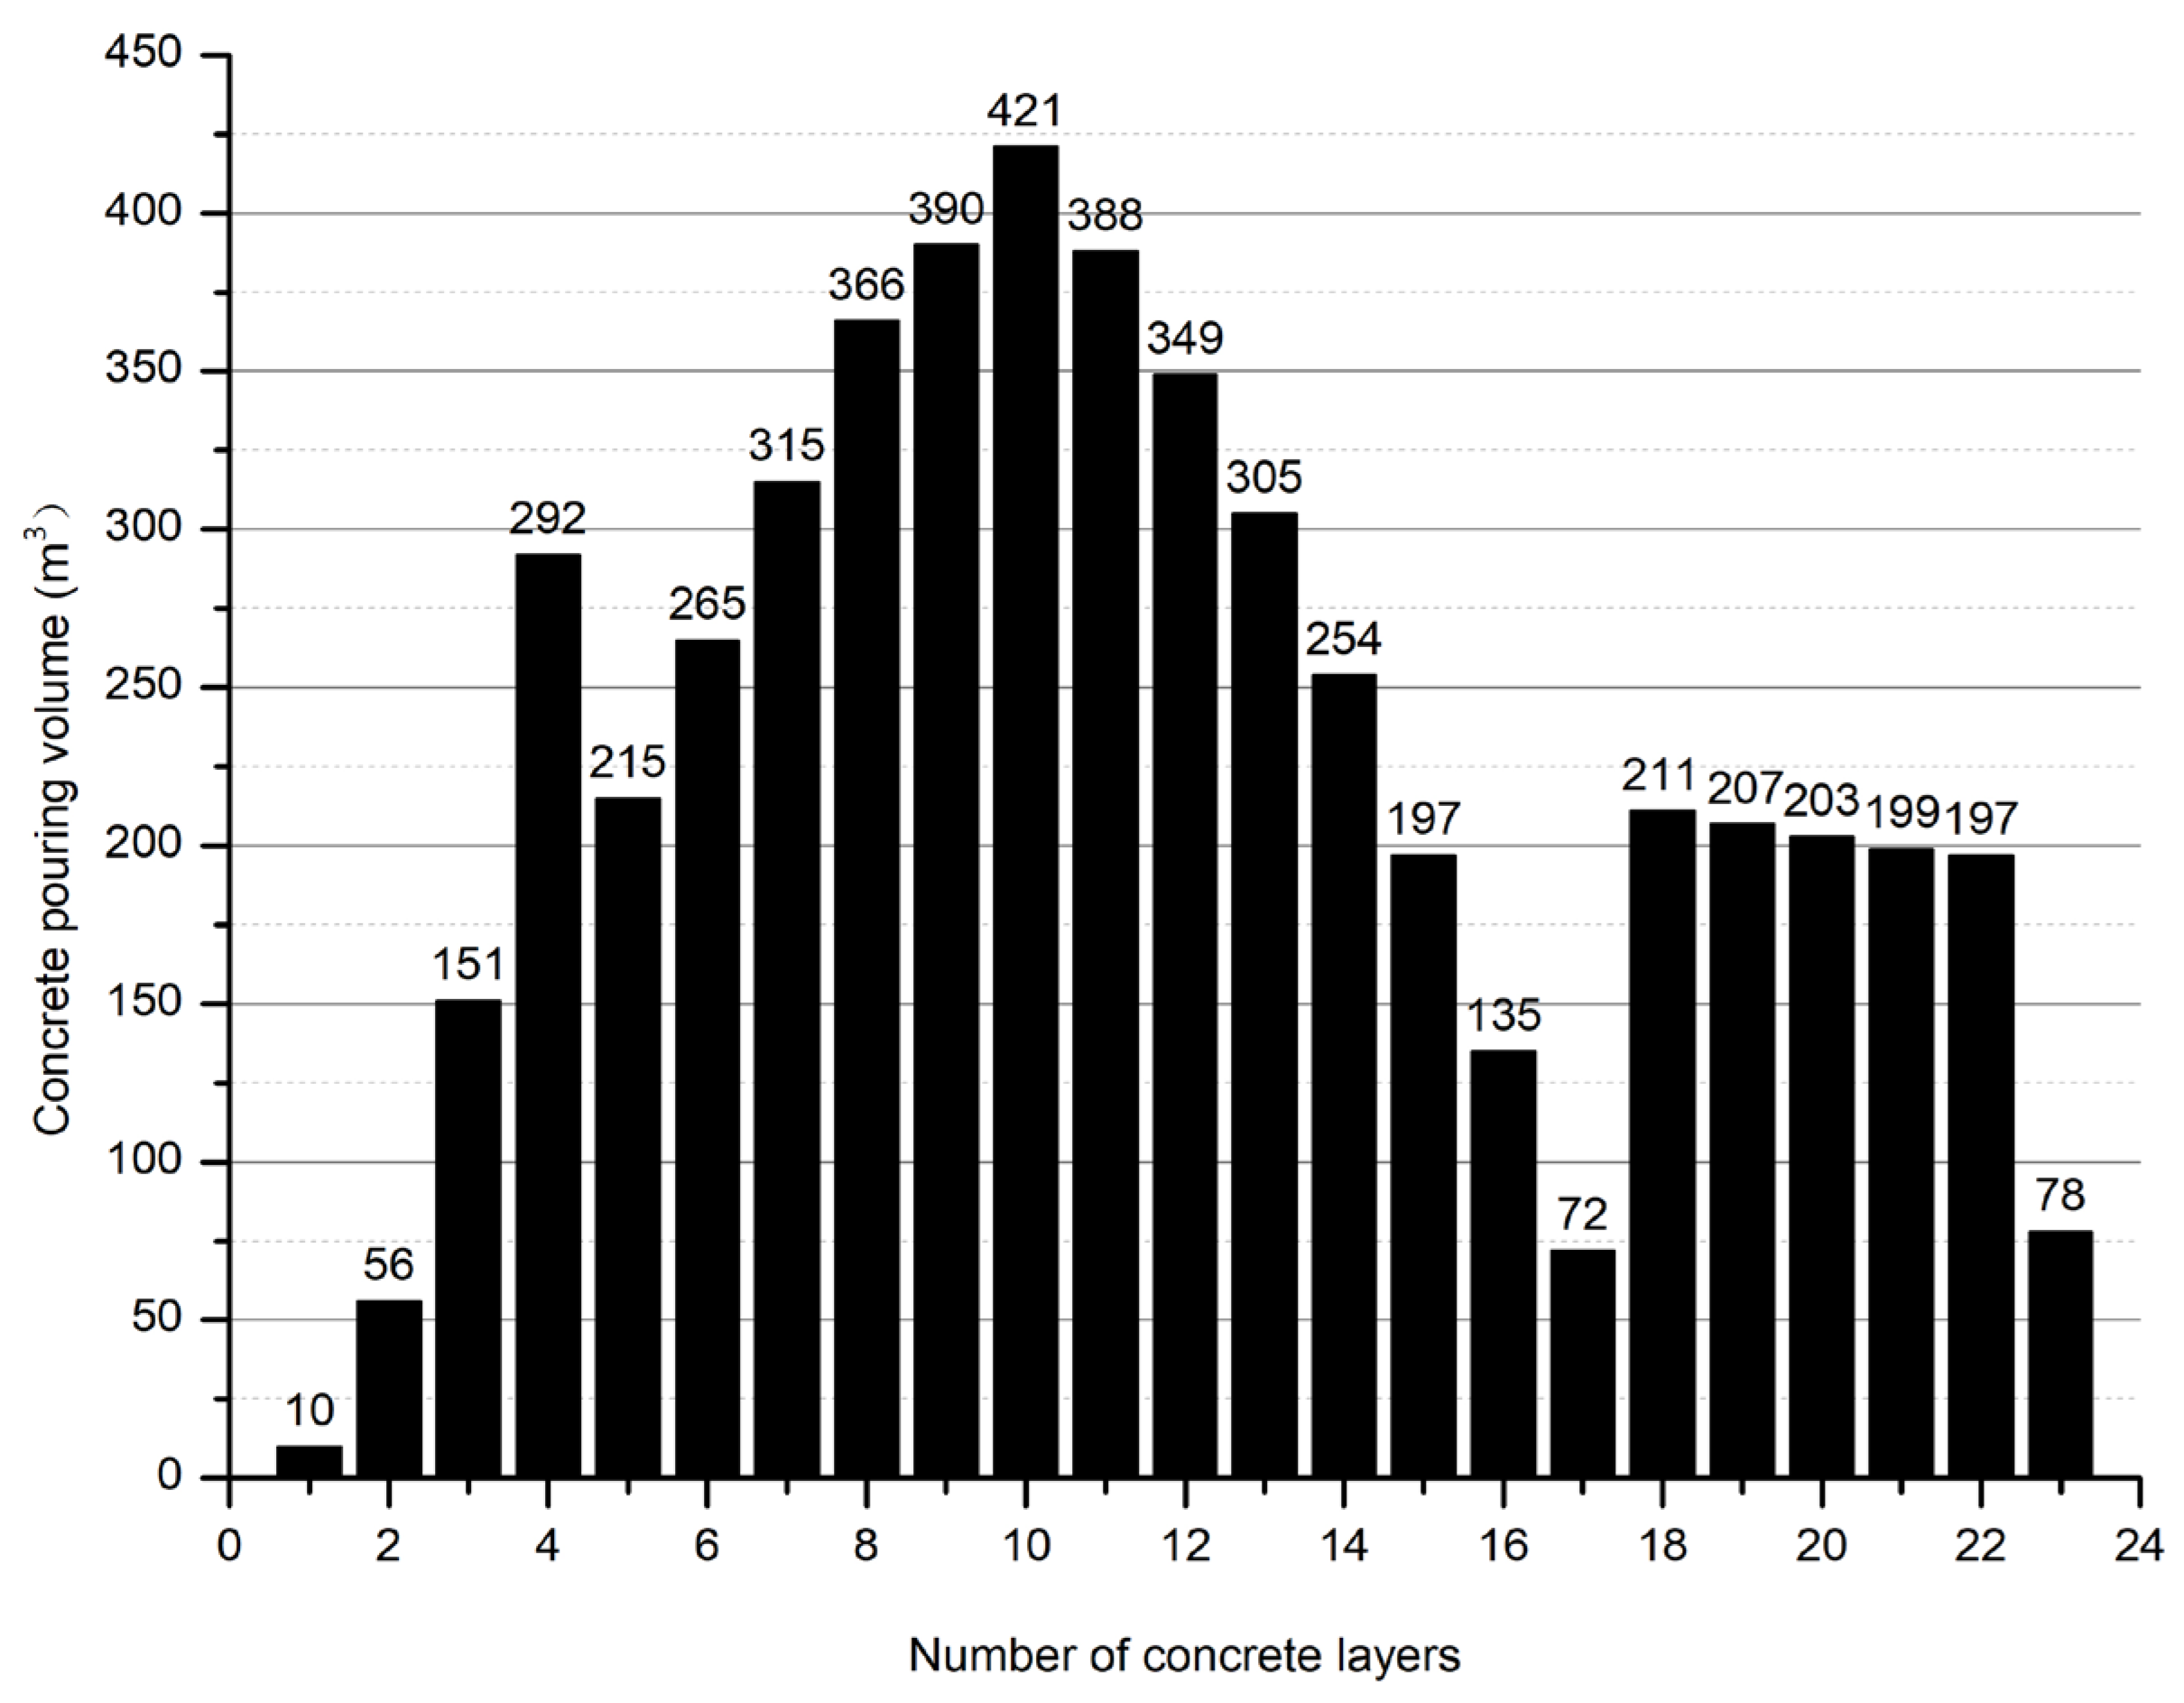
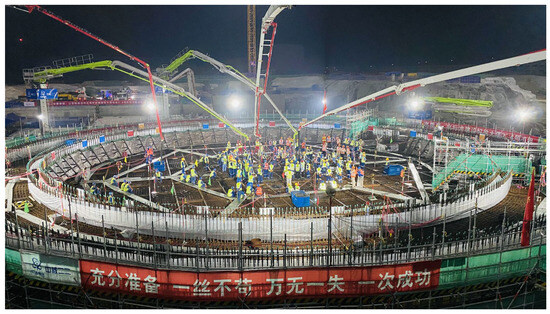
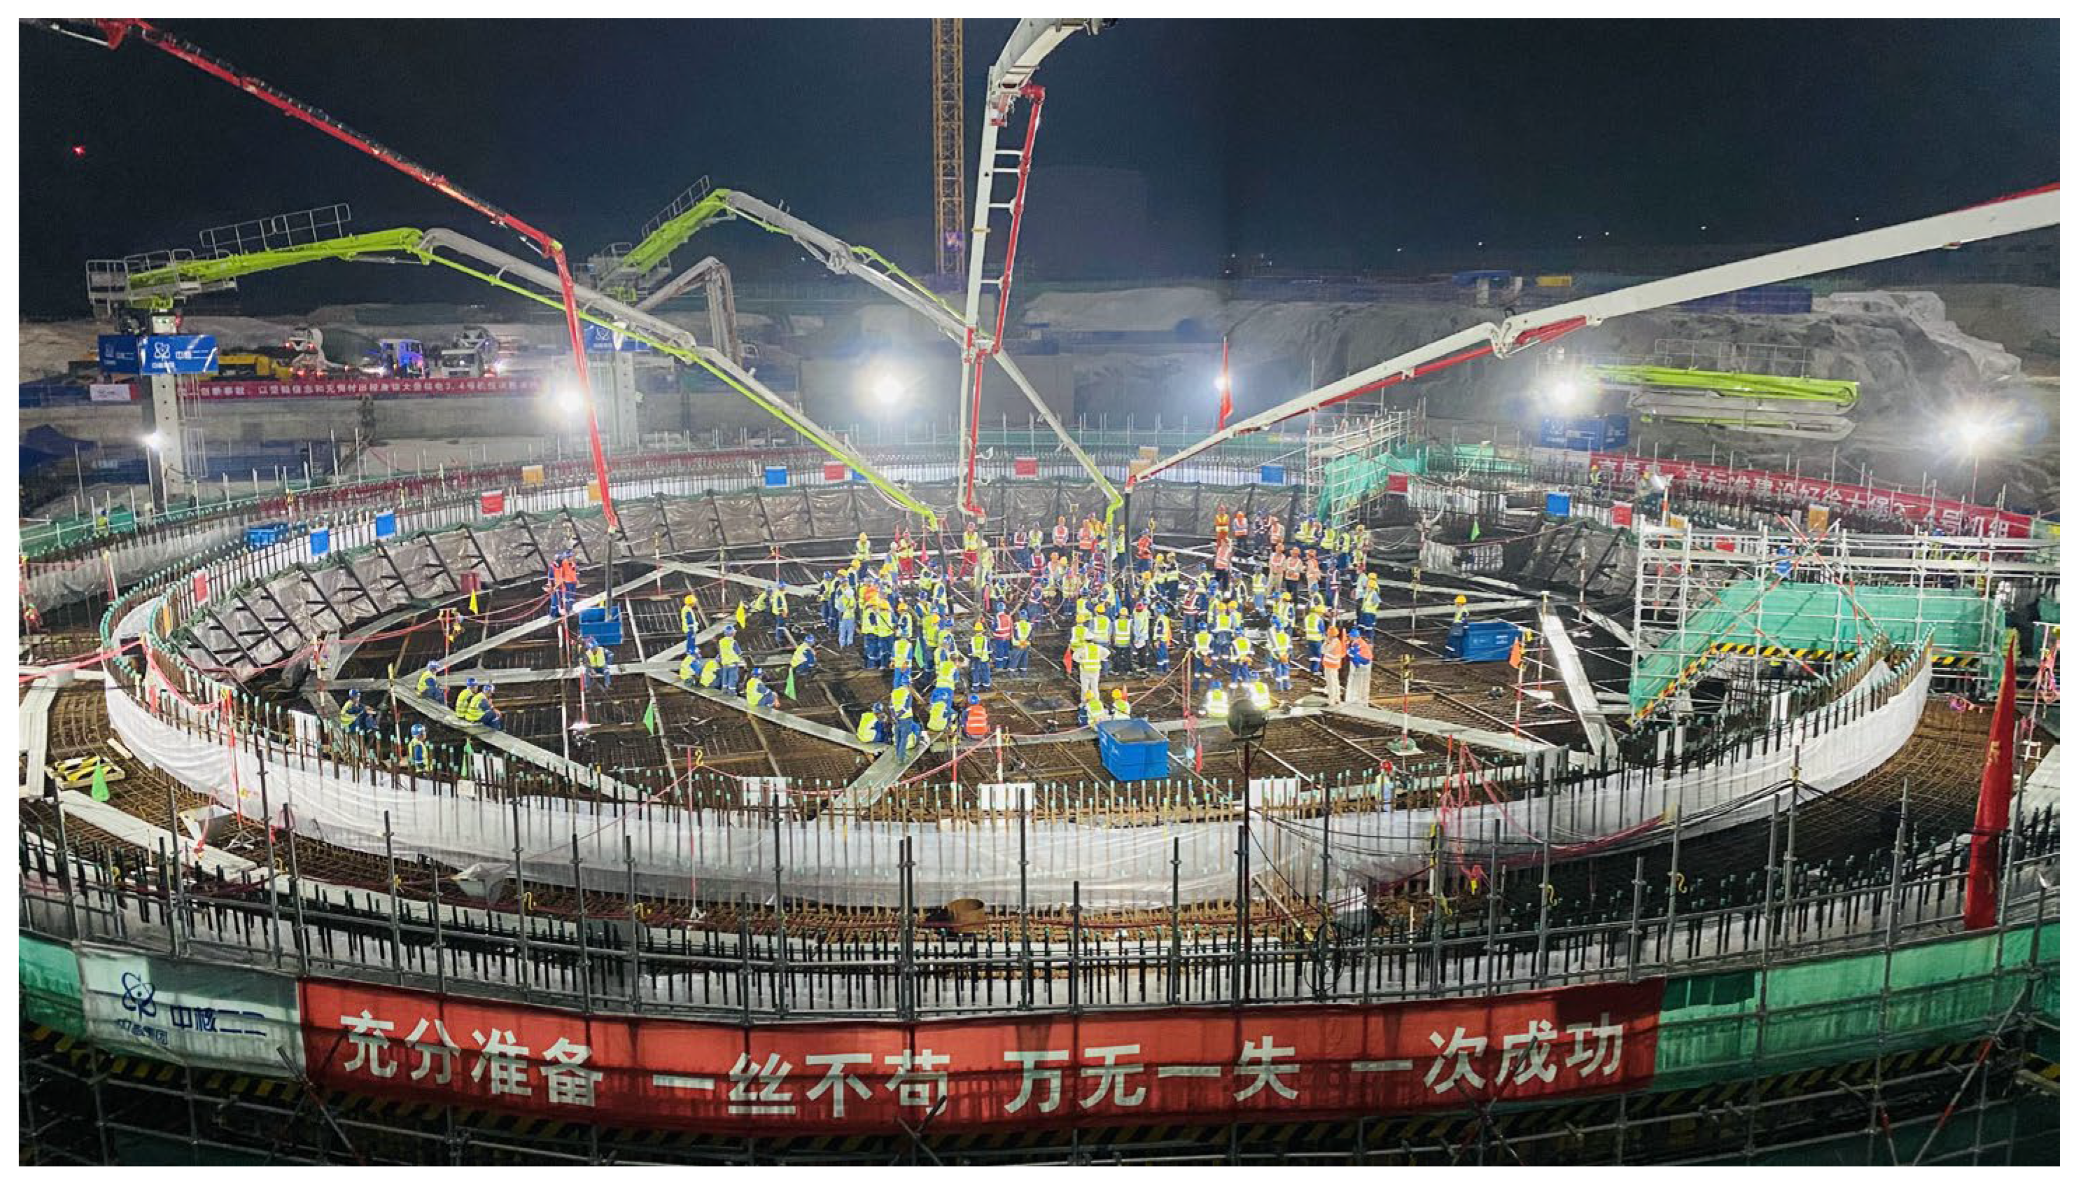
The total placement duration was organized into five sequential 8 h stages (Figure 10 and Figure 11): Stage 1 (Layers 1–6), Stage 2 (Layers 7–9), Stage 3 (Layers 10–12), Stage 4 (Layers 13–17), and Stage 5 (Layers 18–23). The concrete volume per layer is summarized in Figure 12, with the maximum single-layer placement volume of 421 m3 occurring at Layer 10. Detailed construction photographs of the in situ concrete pouring for the nuclear island raft foundation (mass concrete) are provided in Figure 13.
Figure 10.
Phased diagram of layered pouring for the nuclear island raft foundation.
Figure 11.
Three-dimensional diagram of layered pouring phases for the nuclear island raft foundation. Note: The different colors in the raft foundation represent different pouring stages, corresponding to the illustration in Figure 10.
Figure 12.
Statistical chart of layered concrete pouring volume.
Figure 13.
Actual photos of cast-in-place mass concrete for the nuclear island raft foundation.
4.3. Concrete Curing Regime
4.3.1. Curing Enclosure
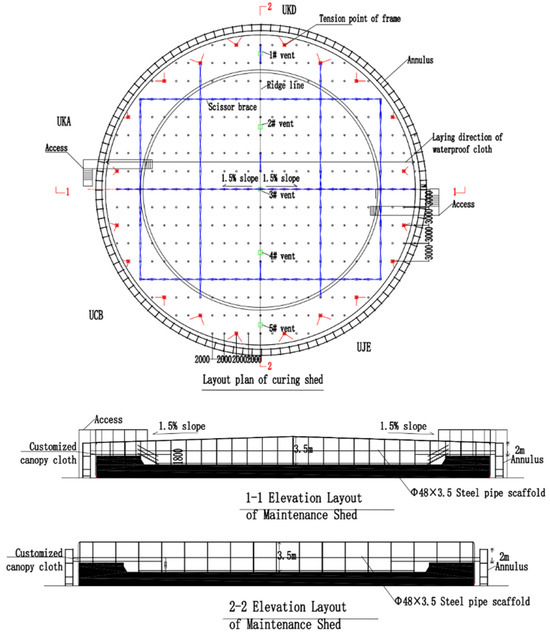
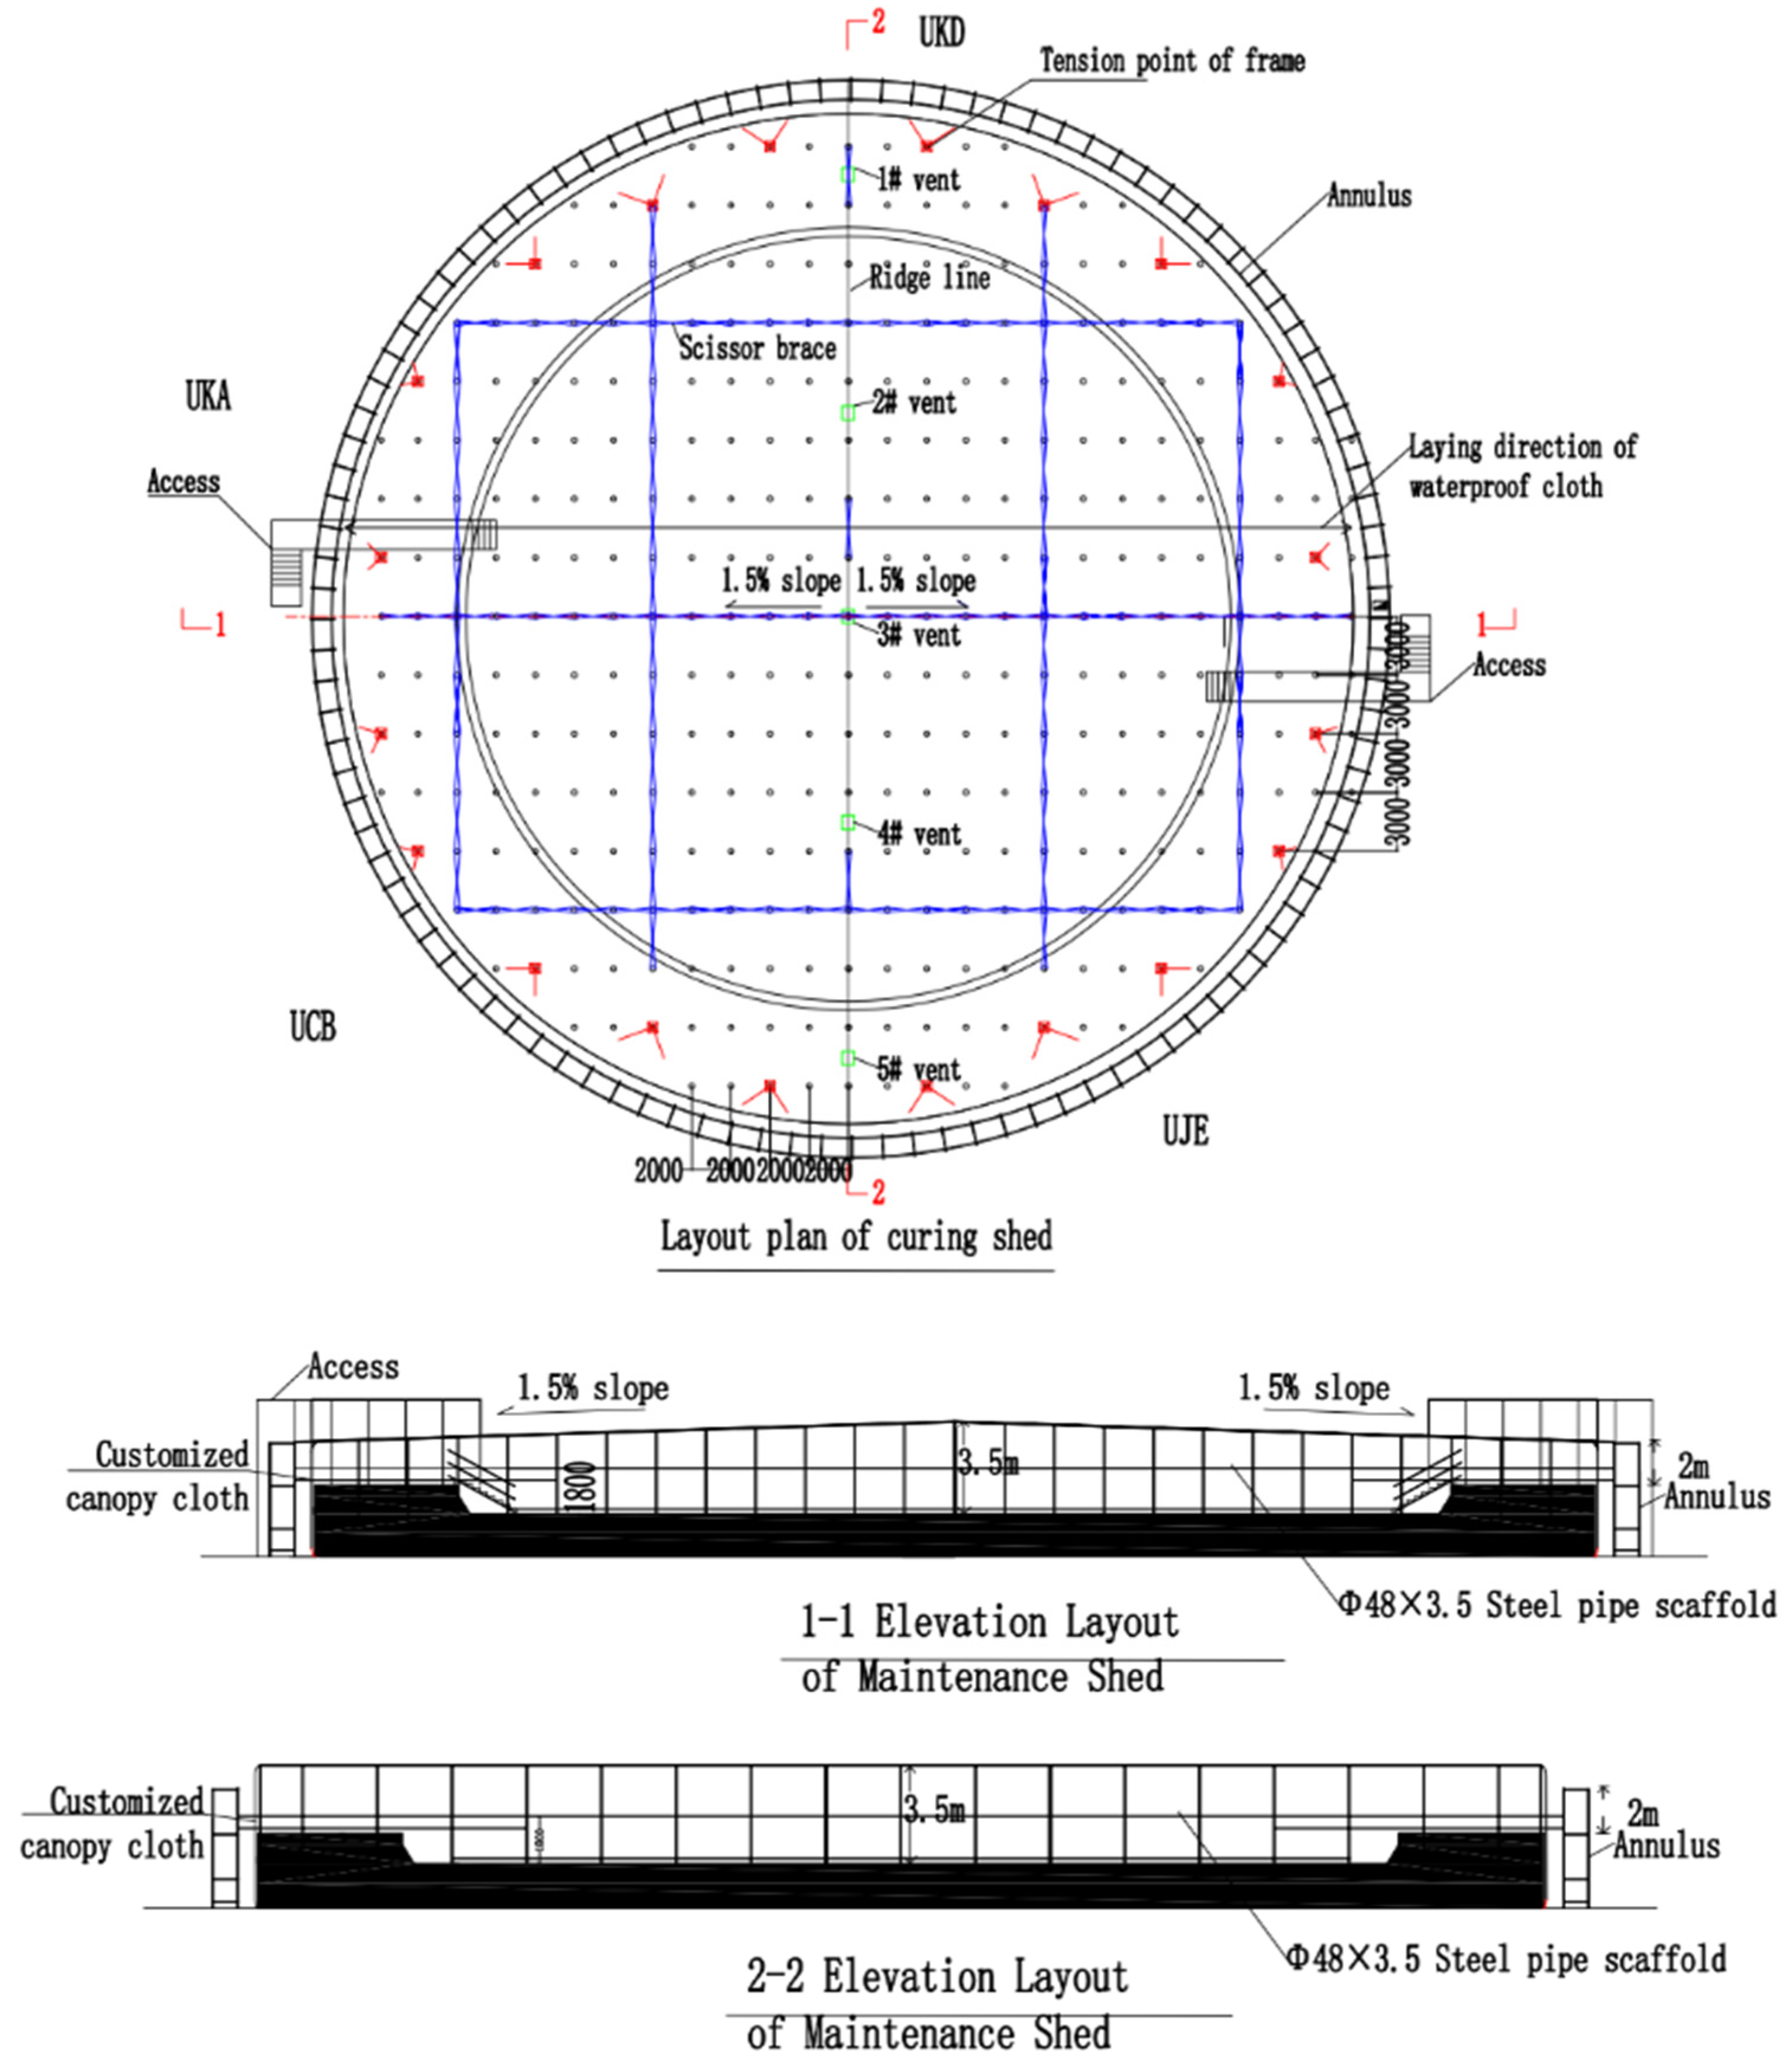
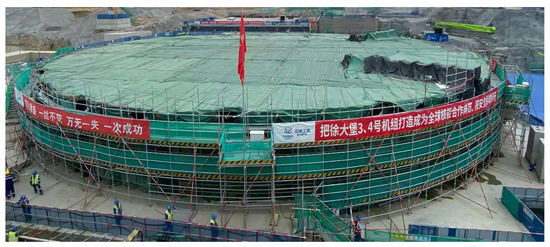
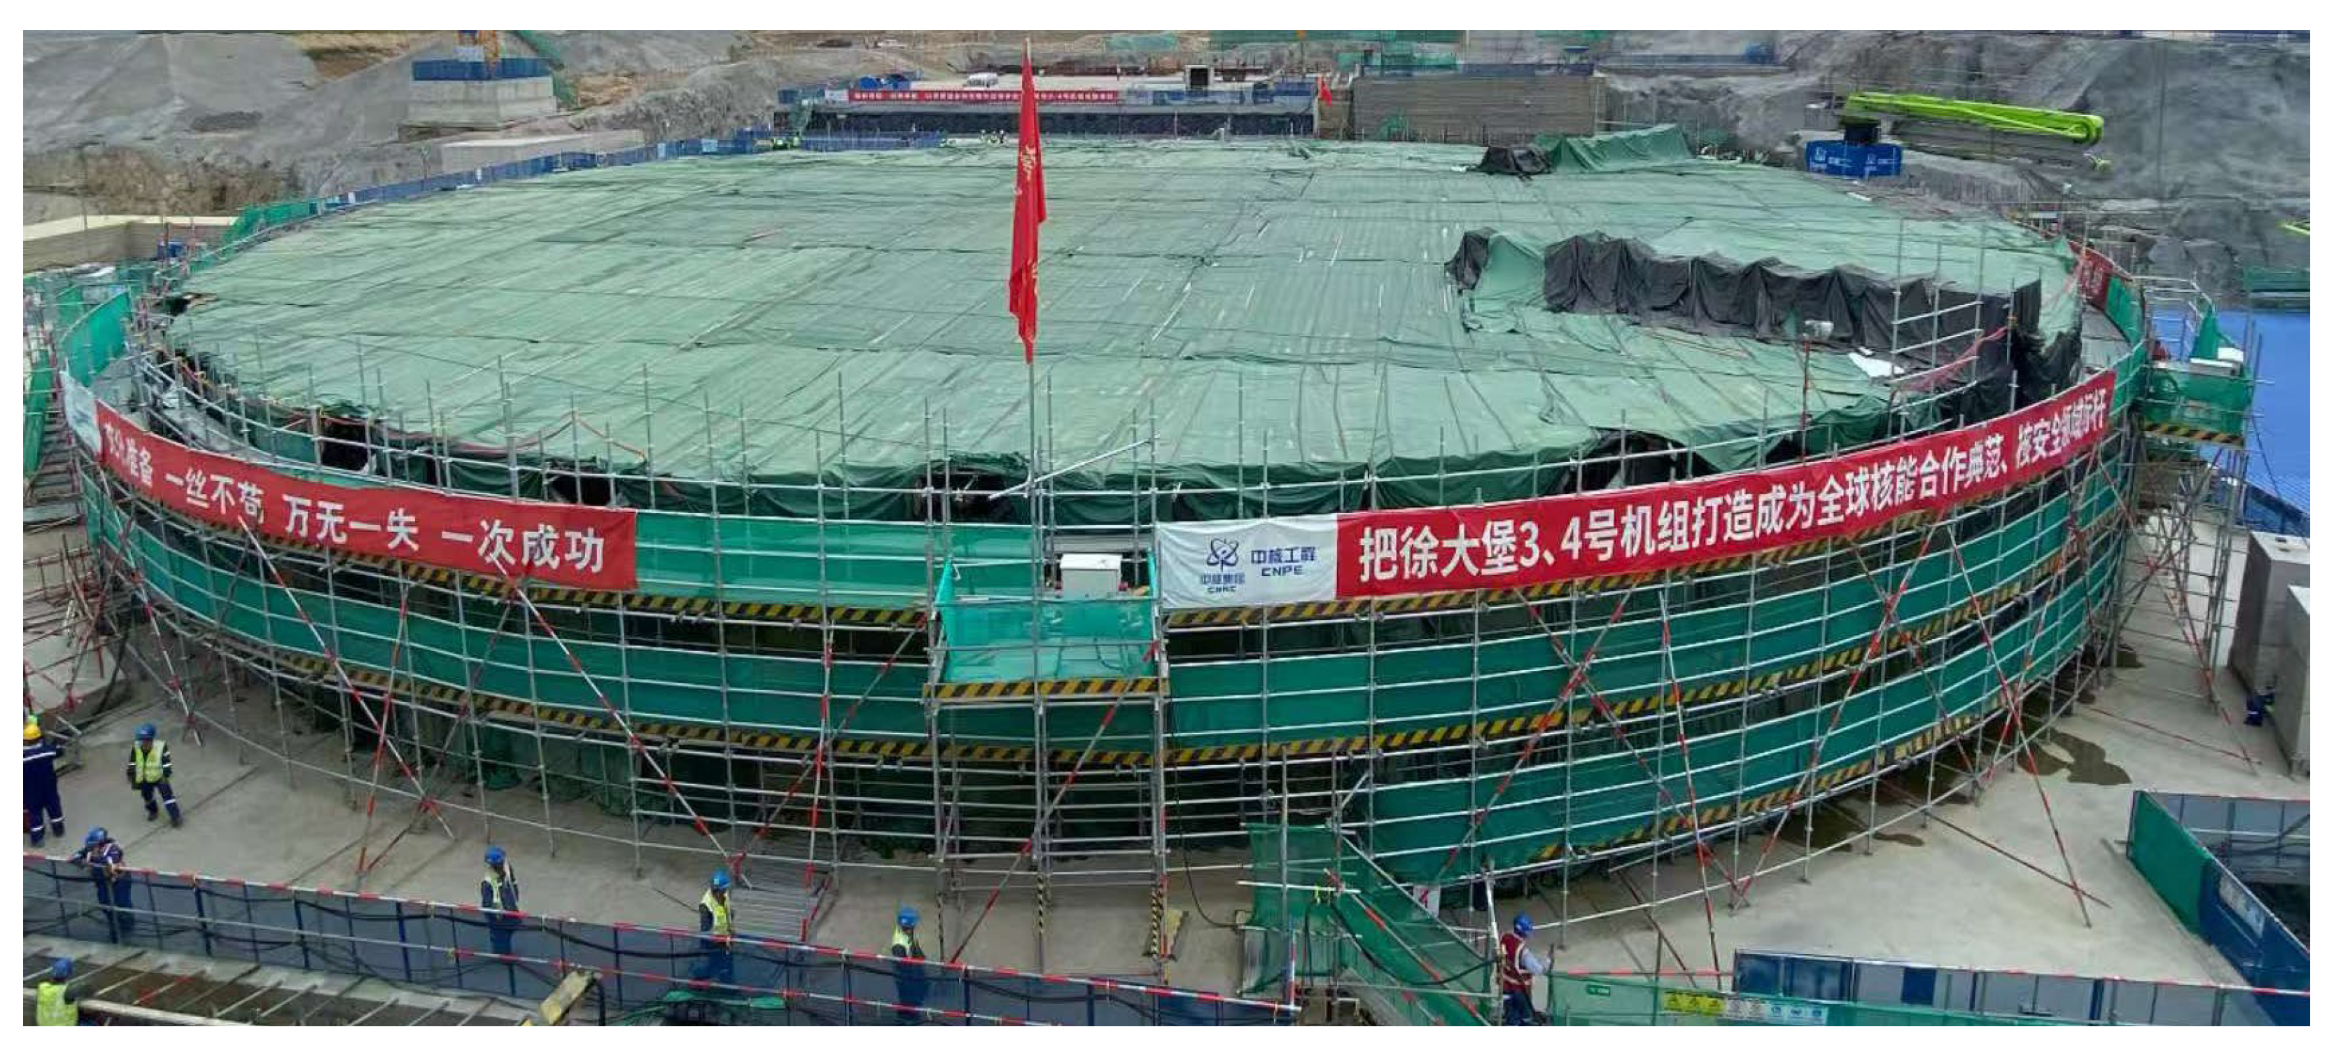
To actively regulate the surface microclimate and decouple the curing environment from external weather fluctuations, a full-coverage, gable-roof curing enclosure was constructed (Figure 14 and Figure 15). Its deployment timing (~8–10 h post-finishing) was strategically aligned with the conclusion of the concrete’s initial setting period and the attainment of a surface strength (~1.2 MPa) sufficient to resist surface damage. The enclosure design transcended mere weather protection: its 1.5% axial slope and integrated roof vents were engineered to manage condensation and facilitate controlled humidity exchange, while the enclosed air space itself functioned as a buffering insulation layer, dramatically reducing surface convective heat loss and creating a stable thermal environment crucial for mitigating early thermal gradients.
Figure 14.
Layout diagram of curing shed erection.
Figure 15.
Actual photo of the curing shed.
4.3.2. Staged Curing Procedure
A 30-day curing period was implemented. Vertical surfaces (external formwork and steel liner) received form-attached curing. For horizontal surfaces, a two-phase staged curing approach was adopted. Heating Phase (Approximately 3 days): Initial curing followed the multi-layer insulation scheme specified in Table 3. Cooling Phase: Insulation (e.g., gunny sacks, thermal quilts) was dynamically applied or removed based on real-time thermal monitoring feedback.
Table 3.
Initial curing conditions for the nuclear island raft foundation.
Insulation was managed proactively: layers were added when the core–surface temperature difference approached 20 °C or the cooling rate exceeded 1.5 °C/day, and reduced when these values were satisfactory. All insulation was removed once the temperature difference between the concrete surface and the ambient air stabilized at or below 20 °C.
4.4. Field Monitoring and Simulation Validation
4.4.1. Temperature Monitoring Scheme
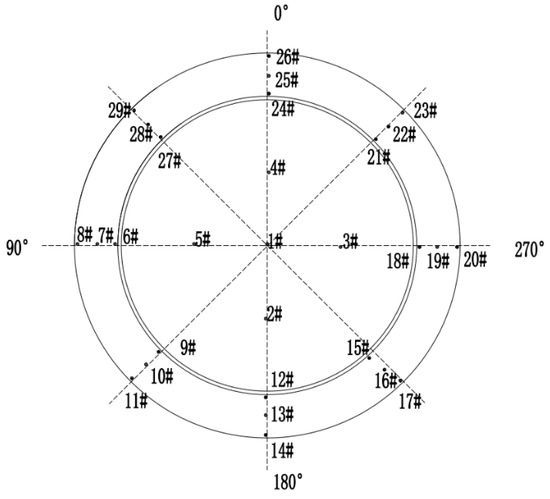
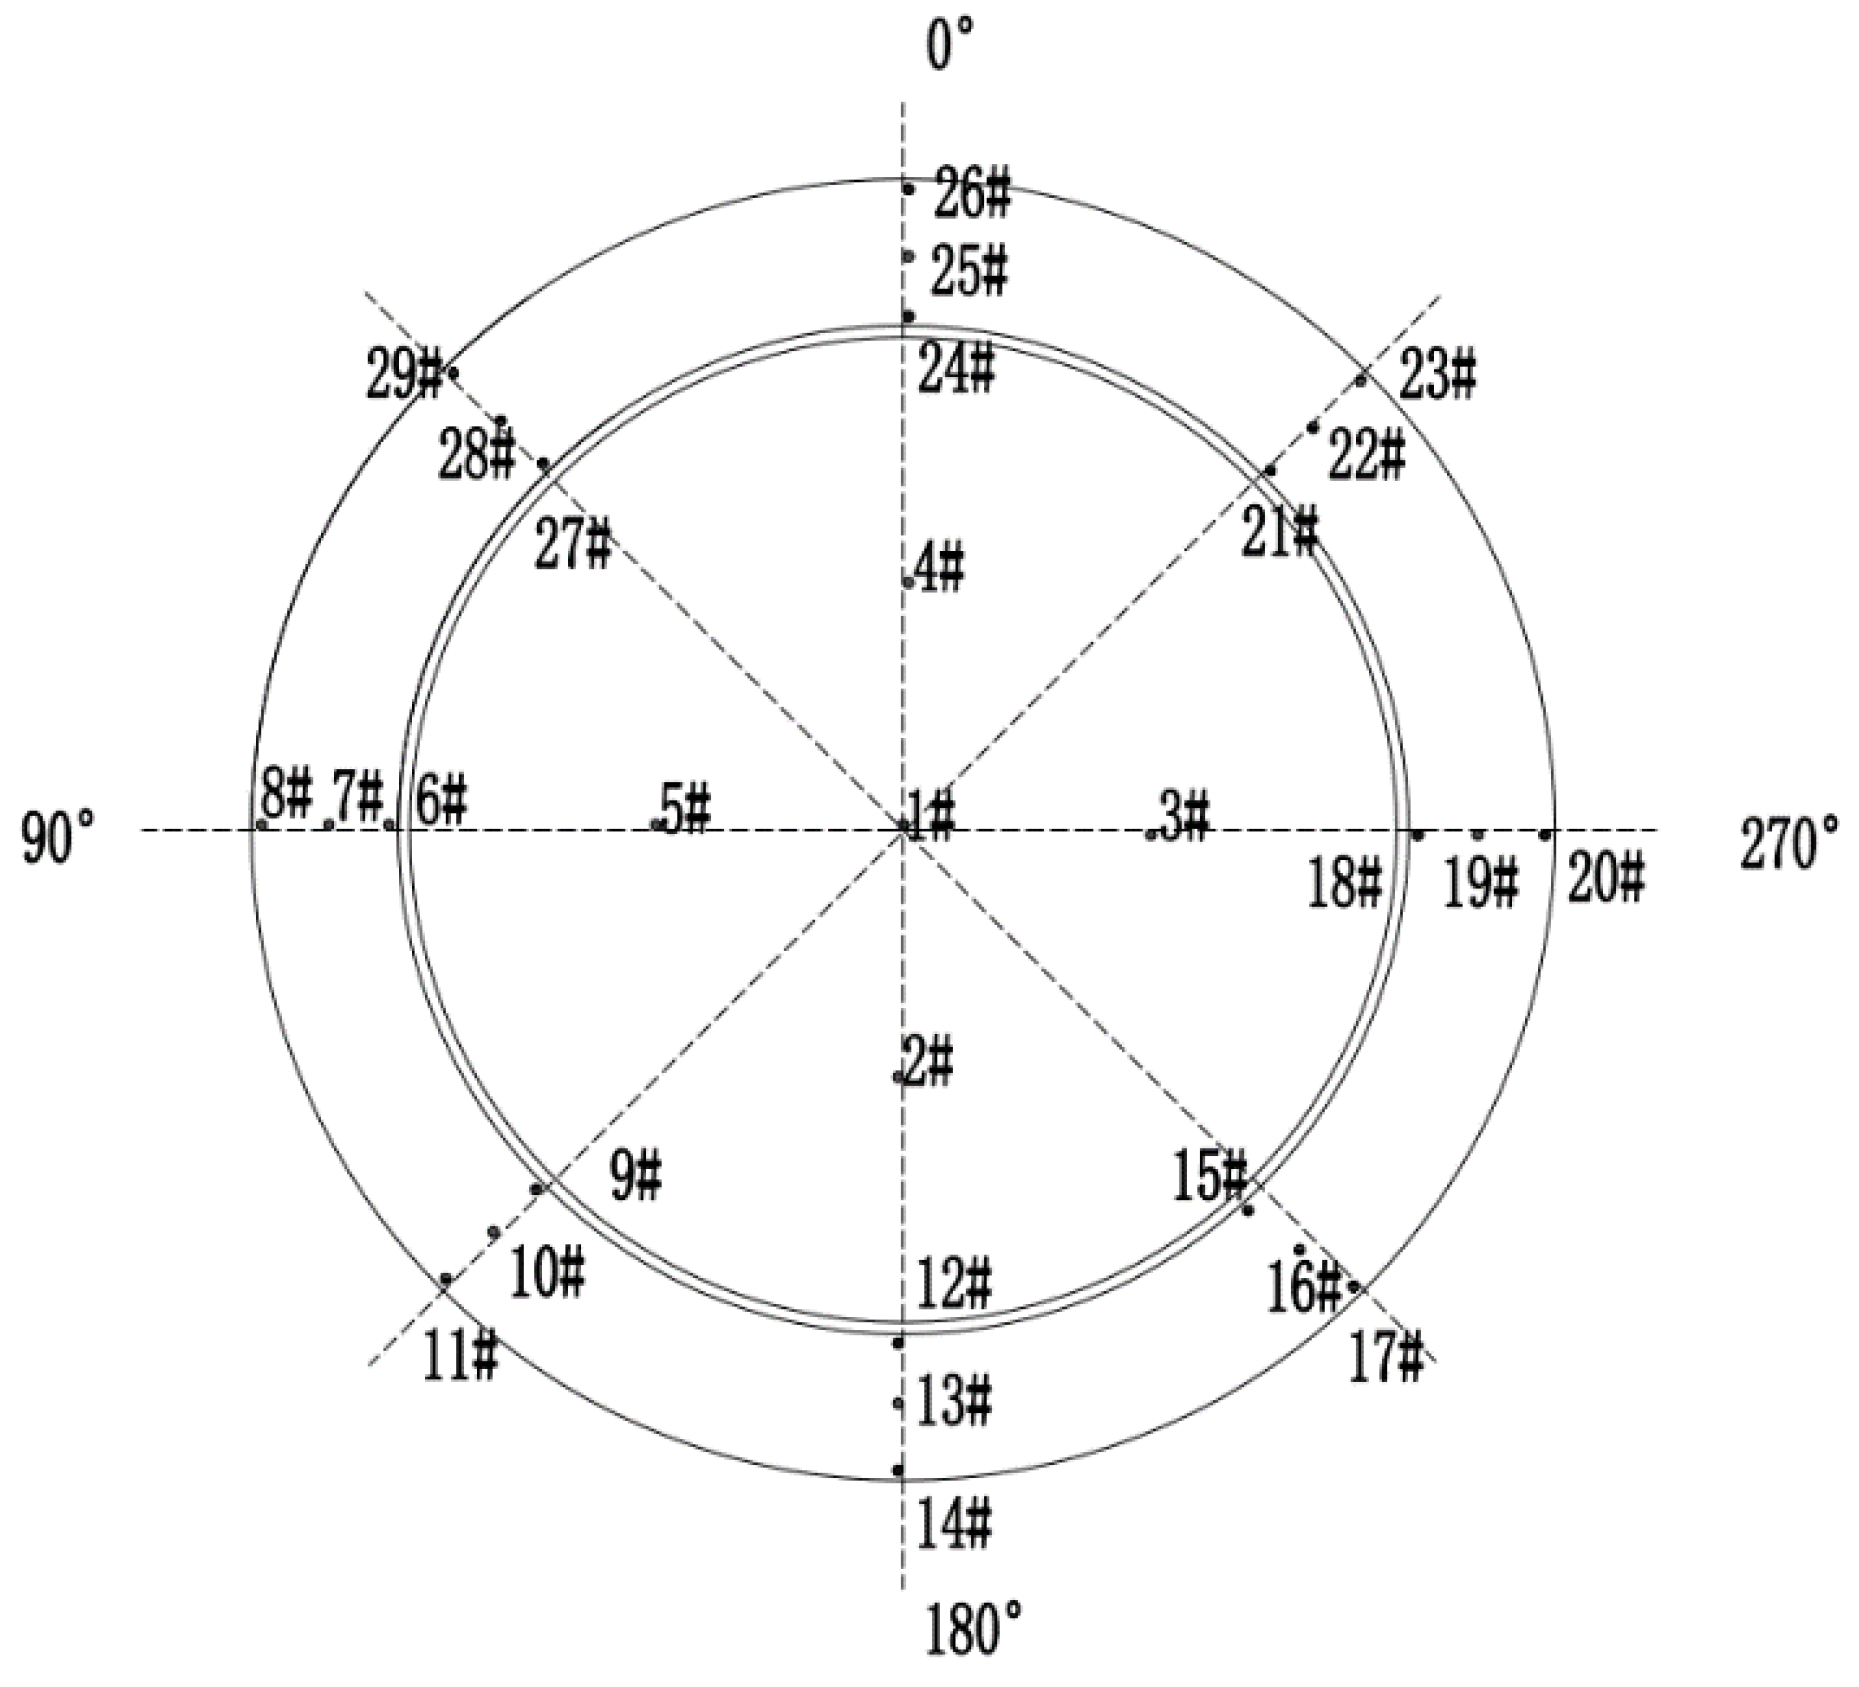
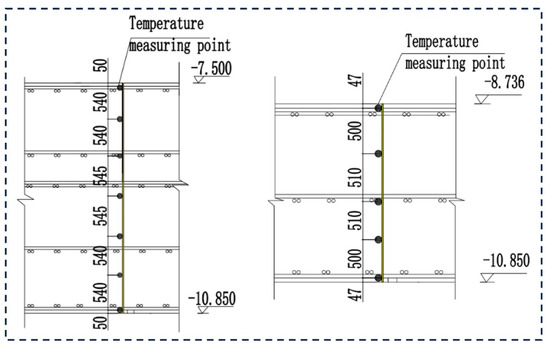
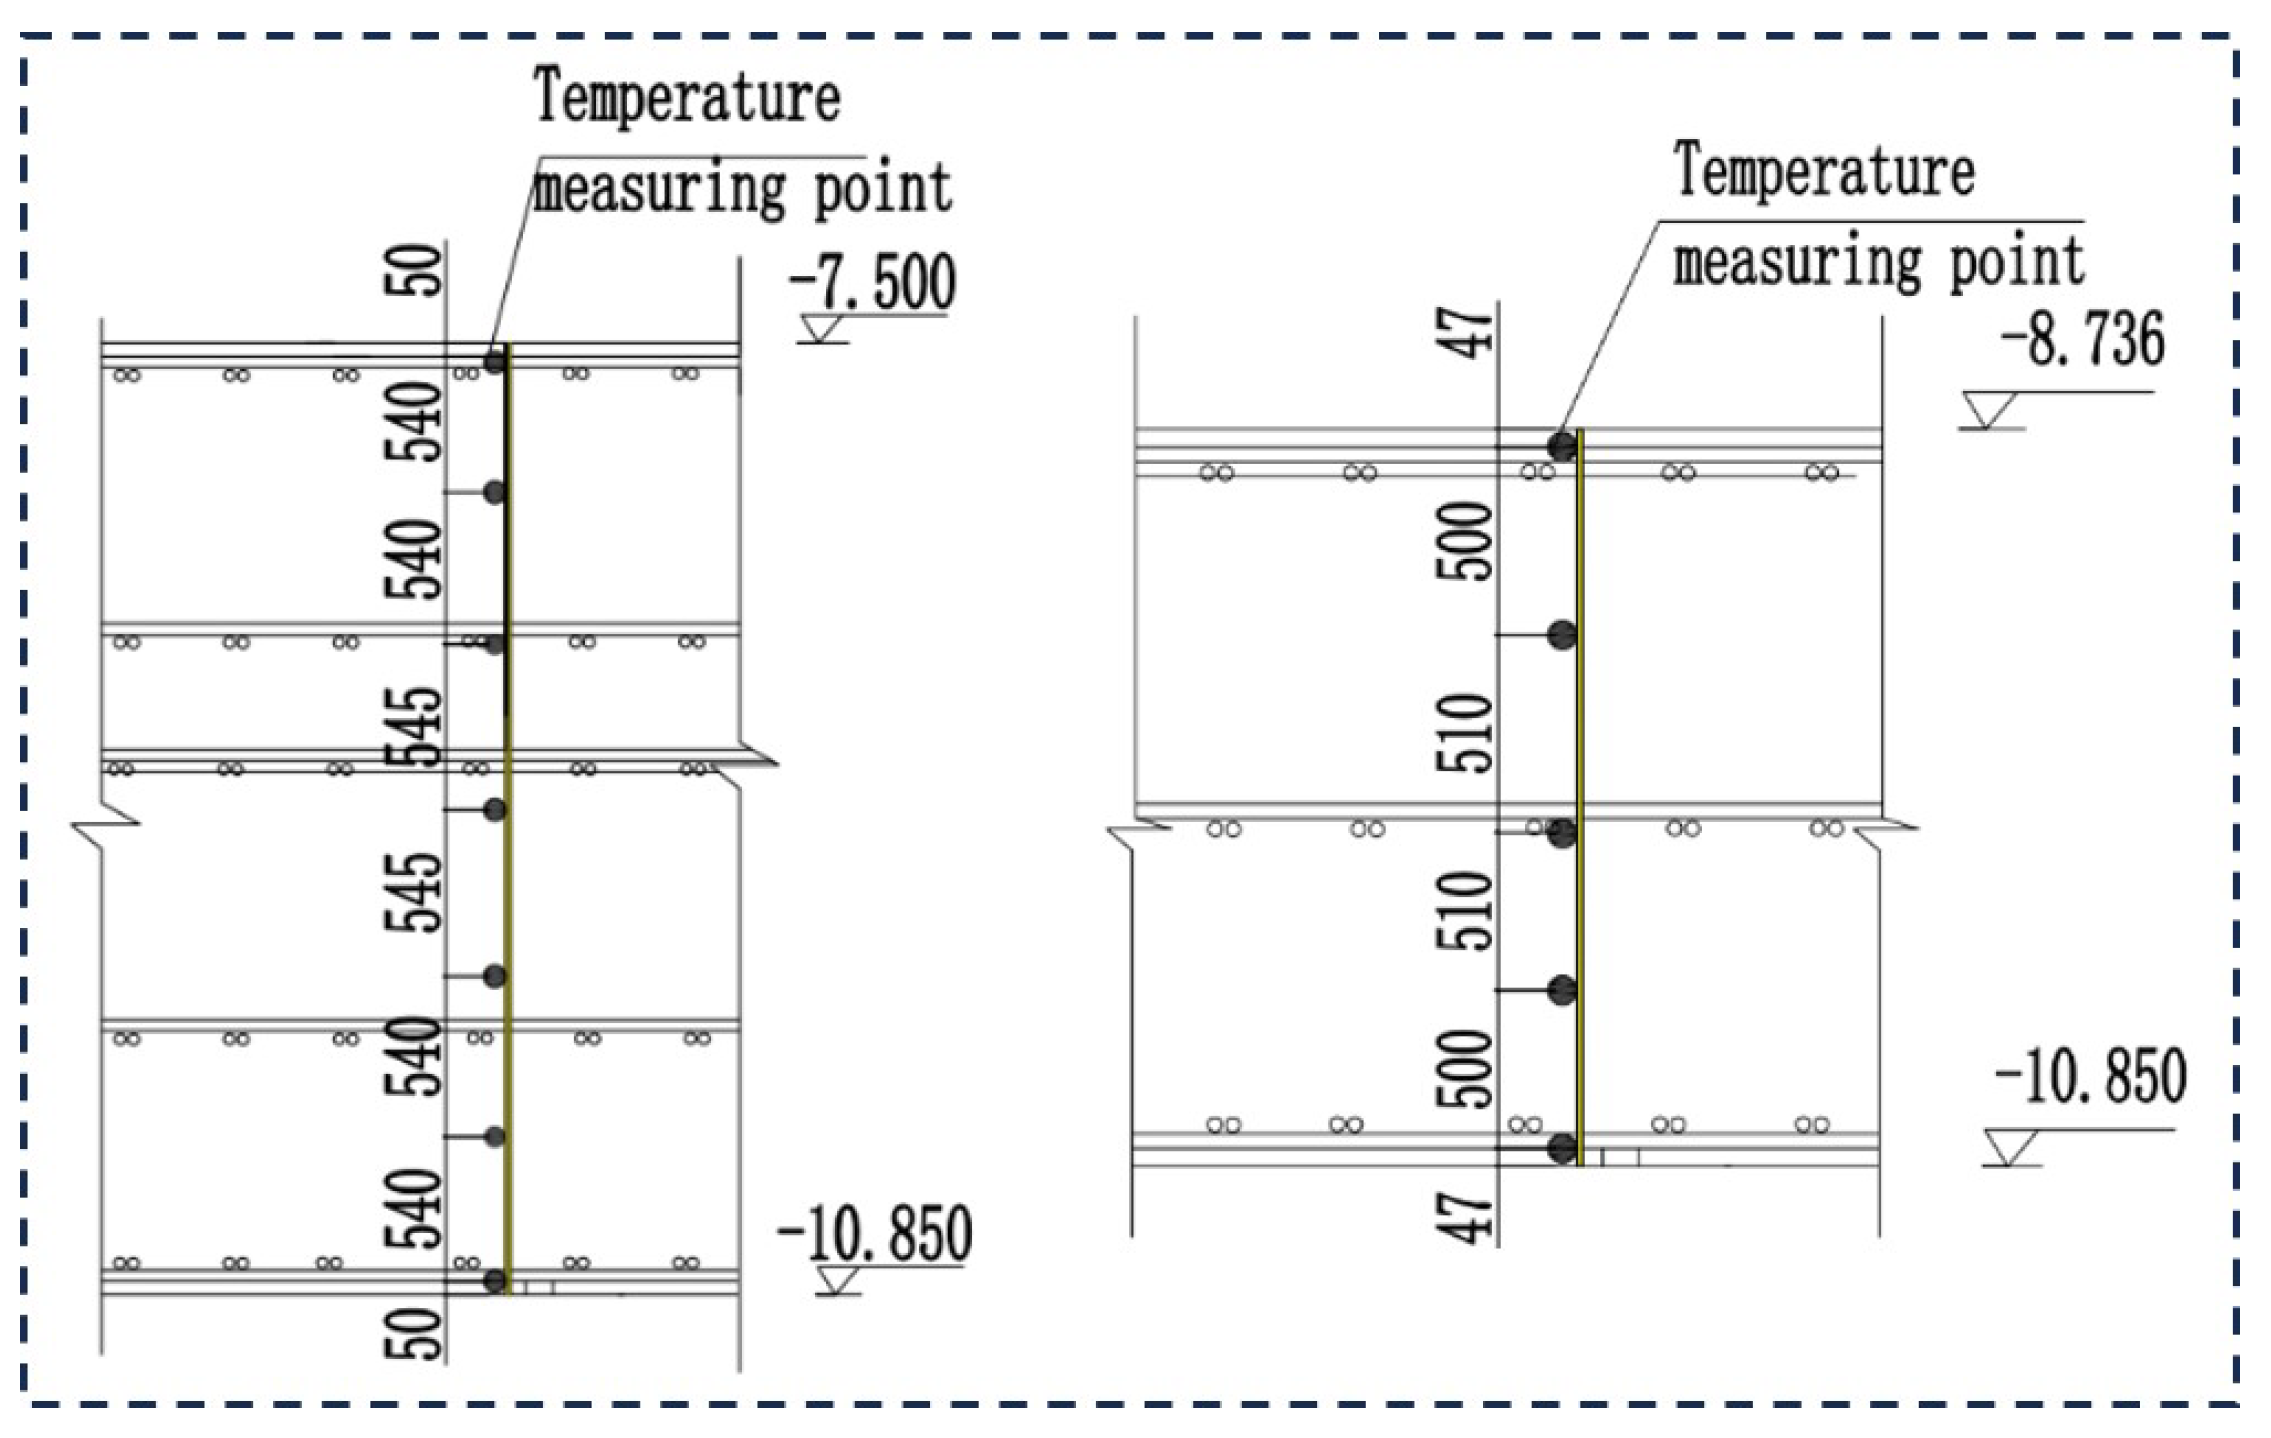
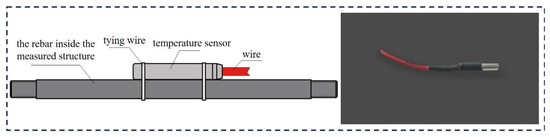
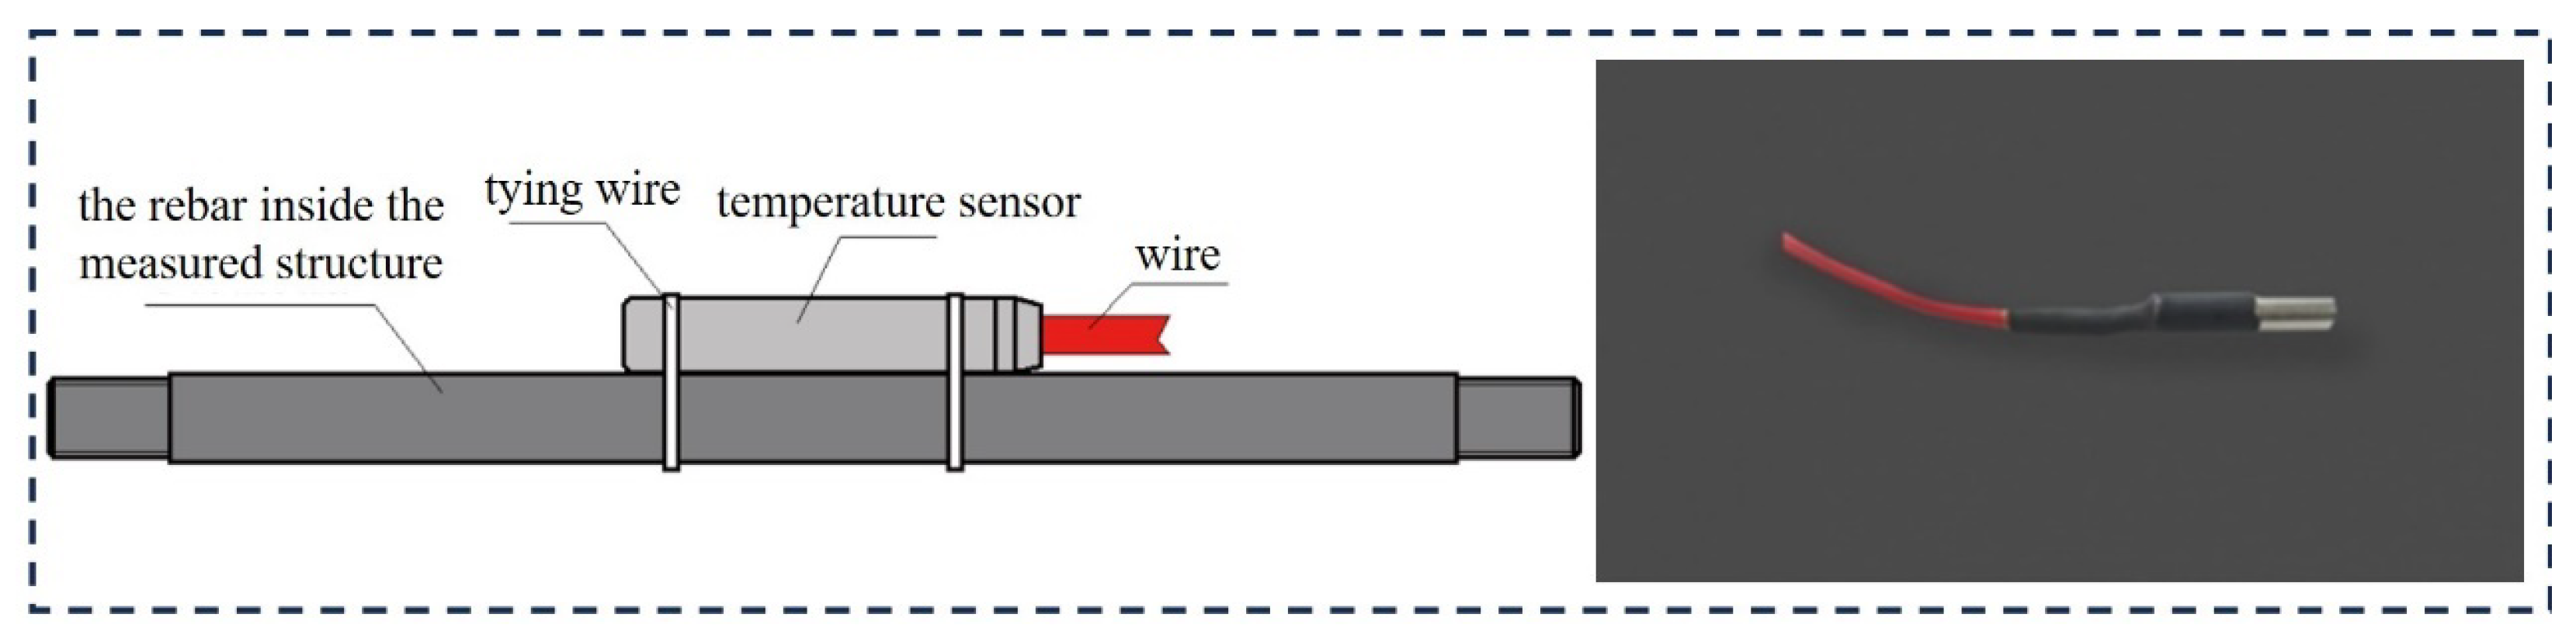
A high-resolution temperature monitoring system was deployed with two interdependent scientific objectives: to empirically capture the full spatiotemporal thermal evolution of the raft for independent analysis, and to provide the necessary ground-truth data for rigorously validating and dynamically calibrating the numerical model. A total of 193 embedded thermistor sensors (JMT-36C type, range: −30 to +120 °C, accuracy: ±0.5 °C) were installed at 29 strategic locations across one symmetric half of the raft (Figure 16 and Figure 17). Two additional ambient monitoring points were installed inside and outside the curing enclosure to quantify the effective boundary conditions for heat exchange.
Figure 16.
Plan view of temperature measuring points layout.
Figure 17.
Cross-section view of temperature measuring points layout.
An automated data acquisition system (details in Figure 18 and Figure 19) collected readings at 10 min intervals initially, transitioning to hourly intervals after 7 days. Monitoring continued for the full 30-day curing period, ceasing only after the temperature differential between concrete and ambient remained consistently below 25 °C for three consecutive days [66].
Figure 18.
Automatic concrete temperature monitoring equipment.
Figure 19.
JMT-36C type temperature sensor.
4.4.2. Numerical Simulation Setup
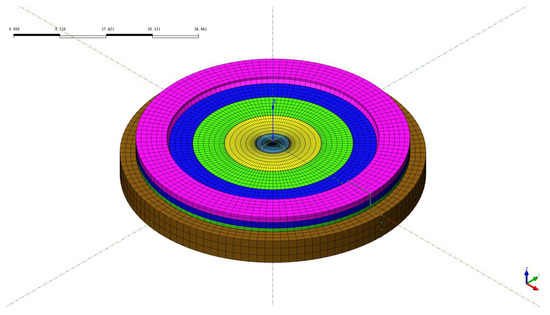
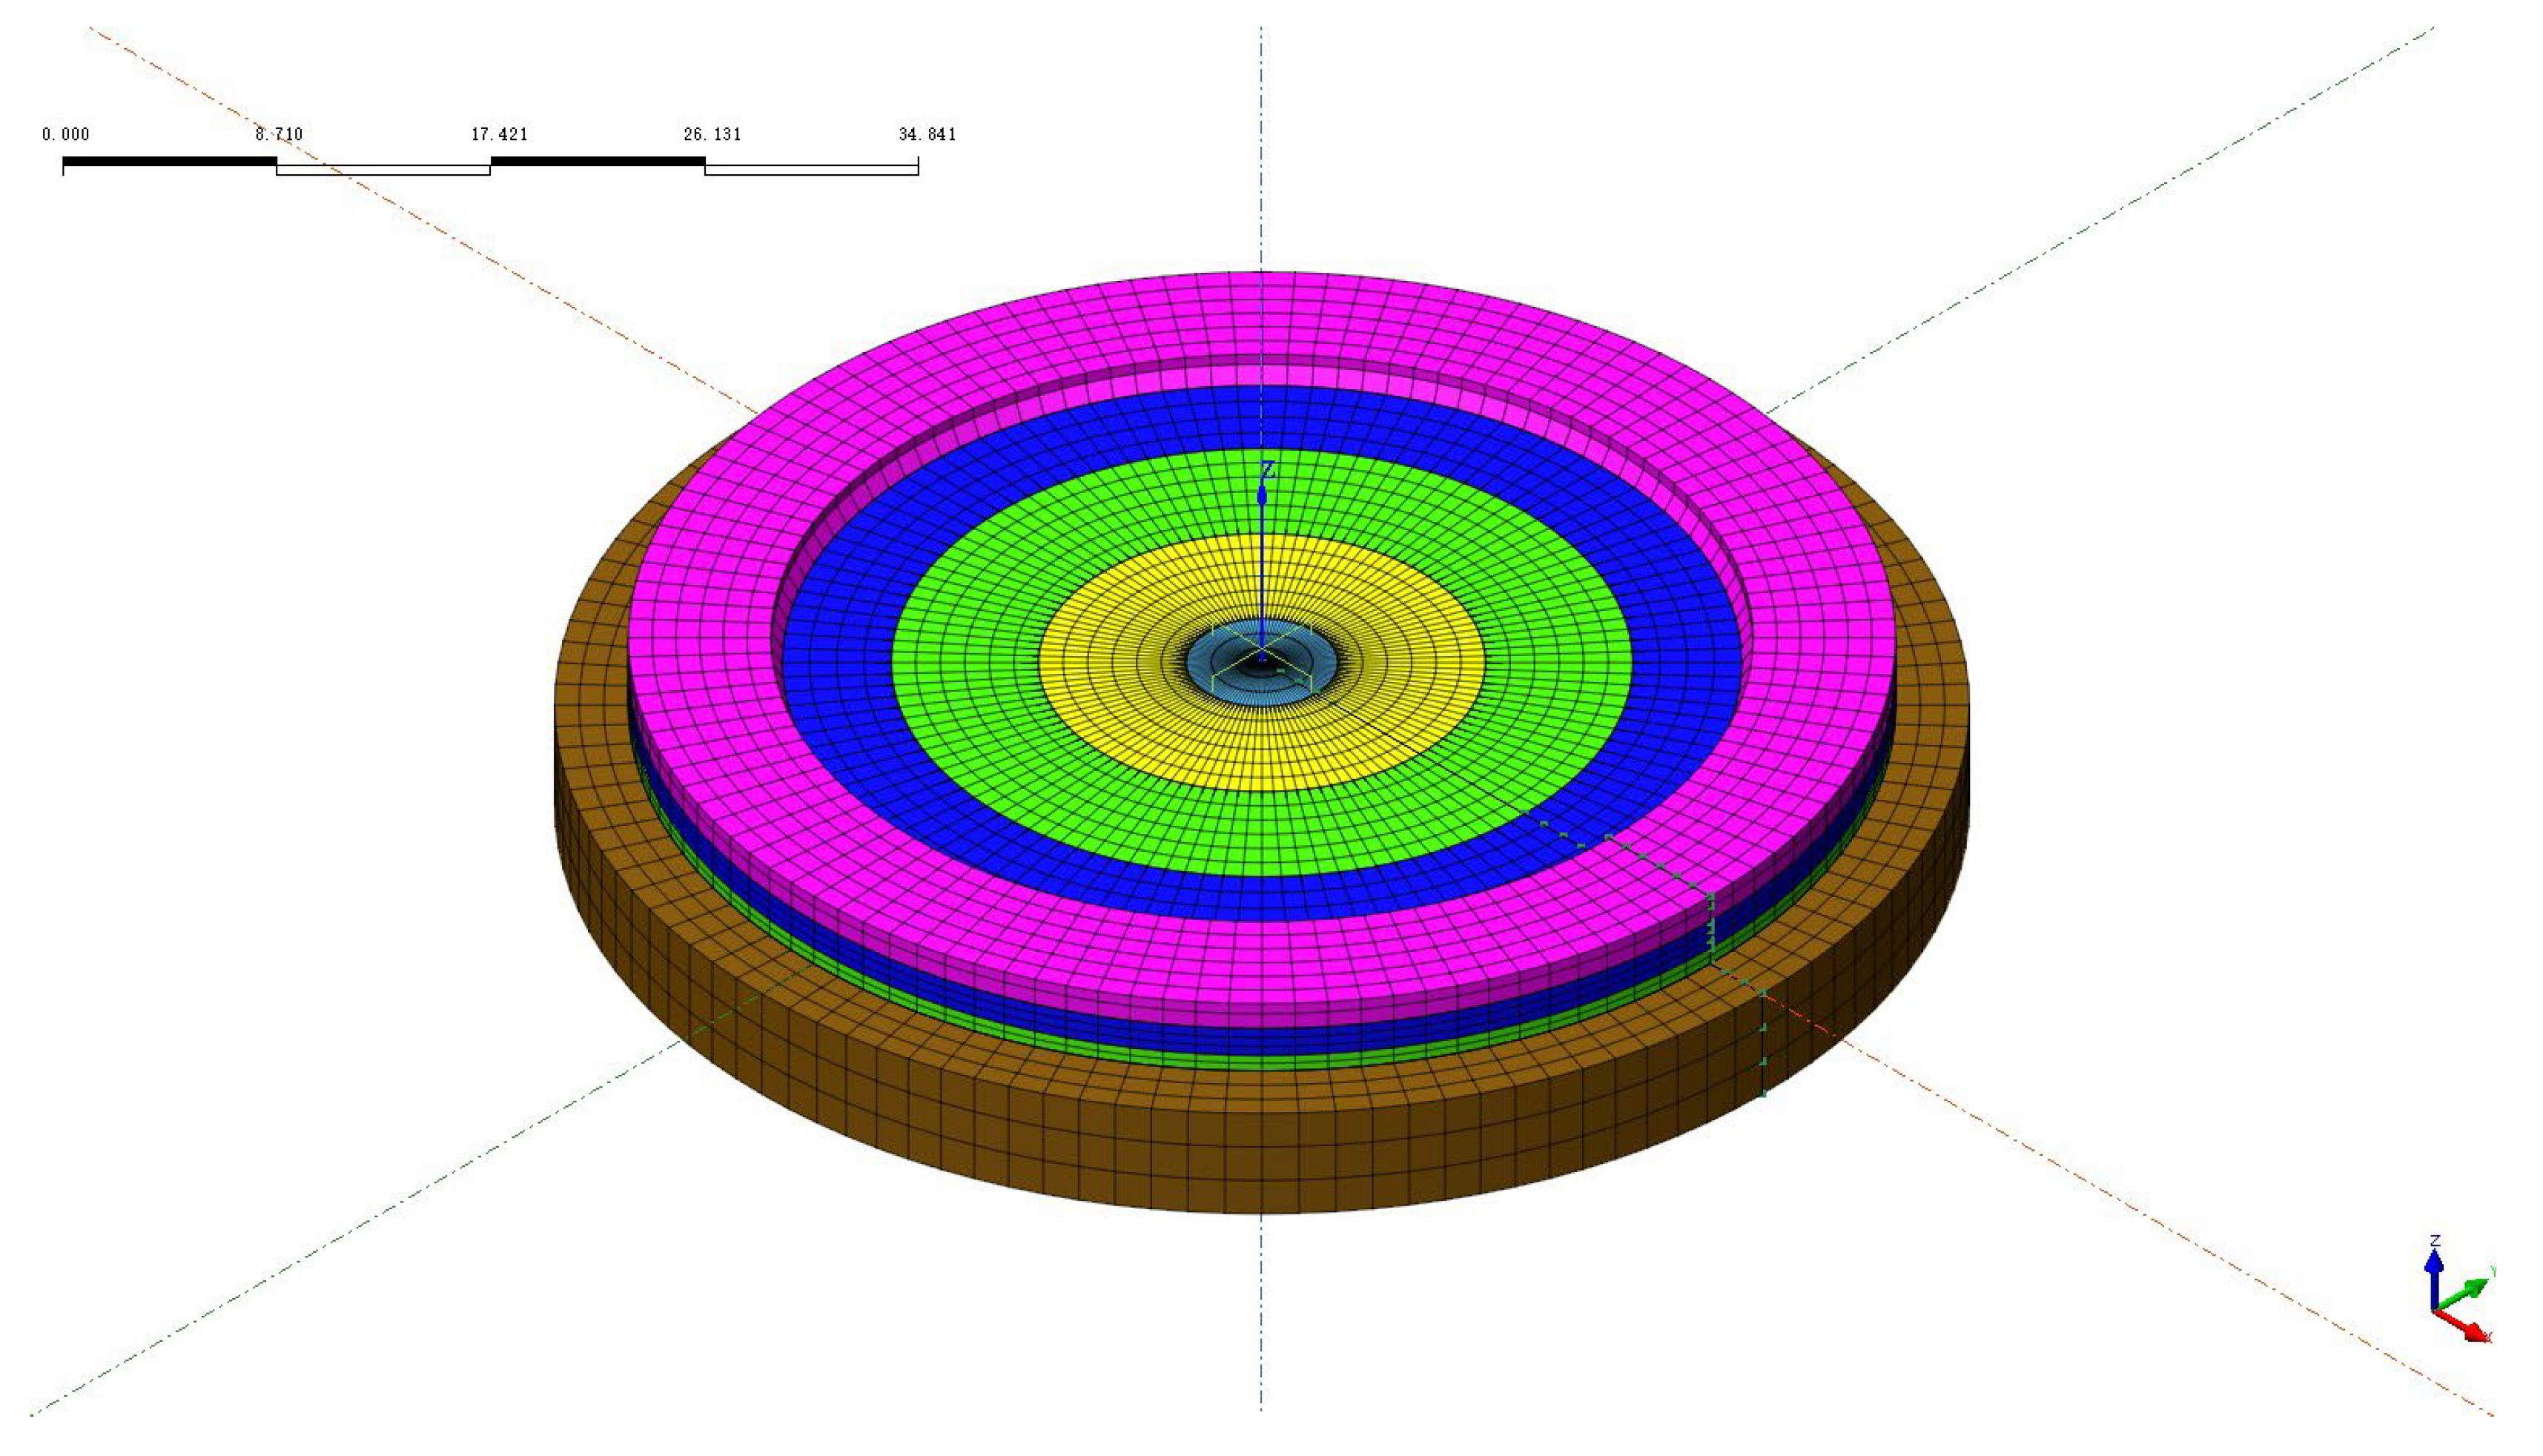
A 3D finite element model was developed using Midas FEA to simulate the transient thermal behavior of the mass concrete raft. The model explicitly accounts for the transfer of concrete hydration heat through the base of the raft into the underlying ground (soil/rock). Therefore, to establish a realistic thermal transfer environment, the model incorporates not only the raft but also a 5 m thick bedrock layer extending 3 m horizontally beyond the raft perimeter (Figure 20). The finite element model employed 3D solid hexahedral elements for both the concrete raft and the bedrock. The geometry was discretized with a refined mesh of approximately 1.0 m in the concrete raft region to accurately resolve temperature gradients, while a gradually coarser mesh was applied to the bedrock to optimize computational efficiency, resulting in a model comprising 29,889 nodes and 31,320 elements.
Furthermore, to accurately reflect the influence of concrete placement timing on the development of the transient temperature field, the simulation explicitly follows the construction stage division defined in Section 4.2, modeling the process according to the five distinct pouring stages. The analysis was conducted in these five consecutive construction stages, simulating a total time of 728 h (approximately 30 days). Boundary conditions were defined as follows: the bottom and side surfaces of the bedrock were assigned a fixed temperature condition (18 °C at the bottom to represent stable geothermal conditions) combined with pinned supports (restraining translation in three orthogonal directions); all other exposed surfaces (concrete top and sides) were subjected to convective heat transfer boundaries. The transient thermal analysis was solved using a multi-frontal sparse Gaussian algorithm.
Critical input parameters included:
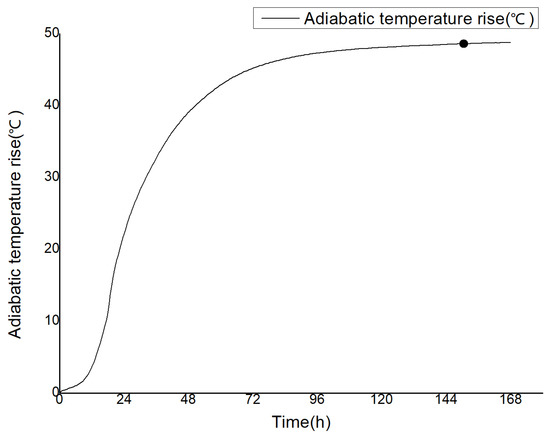
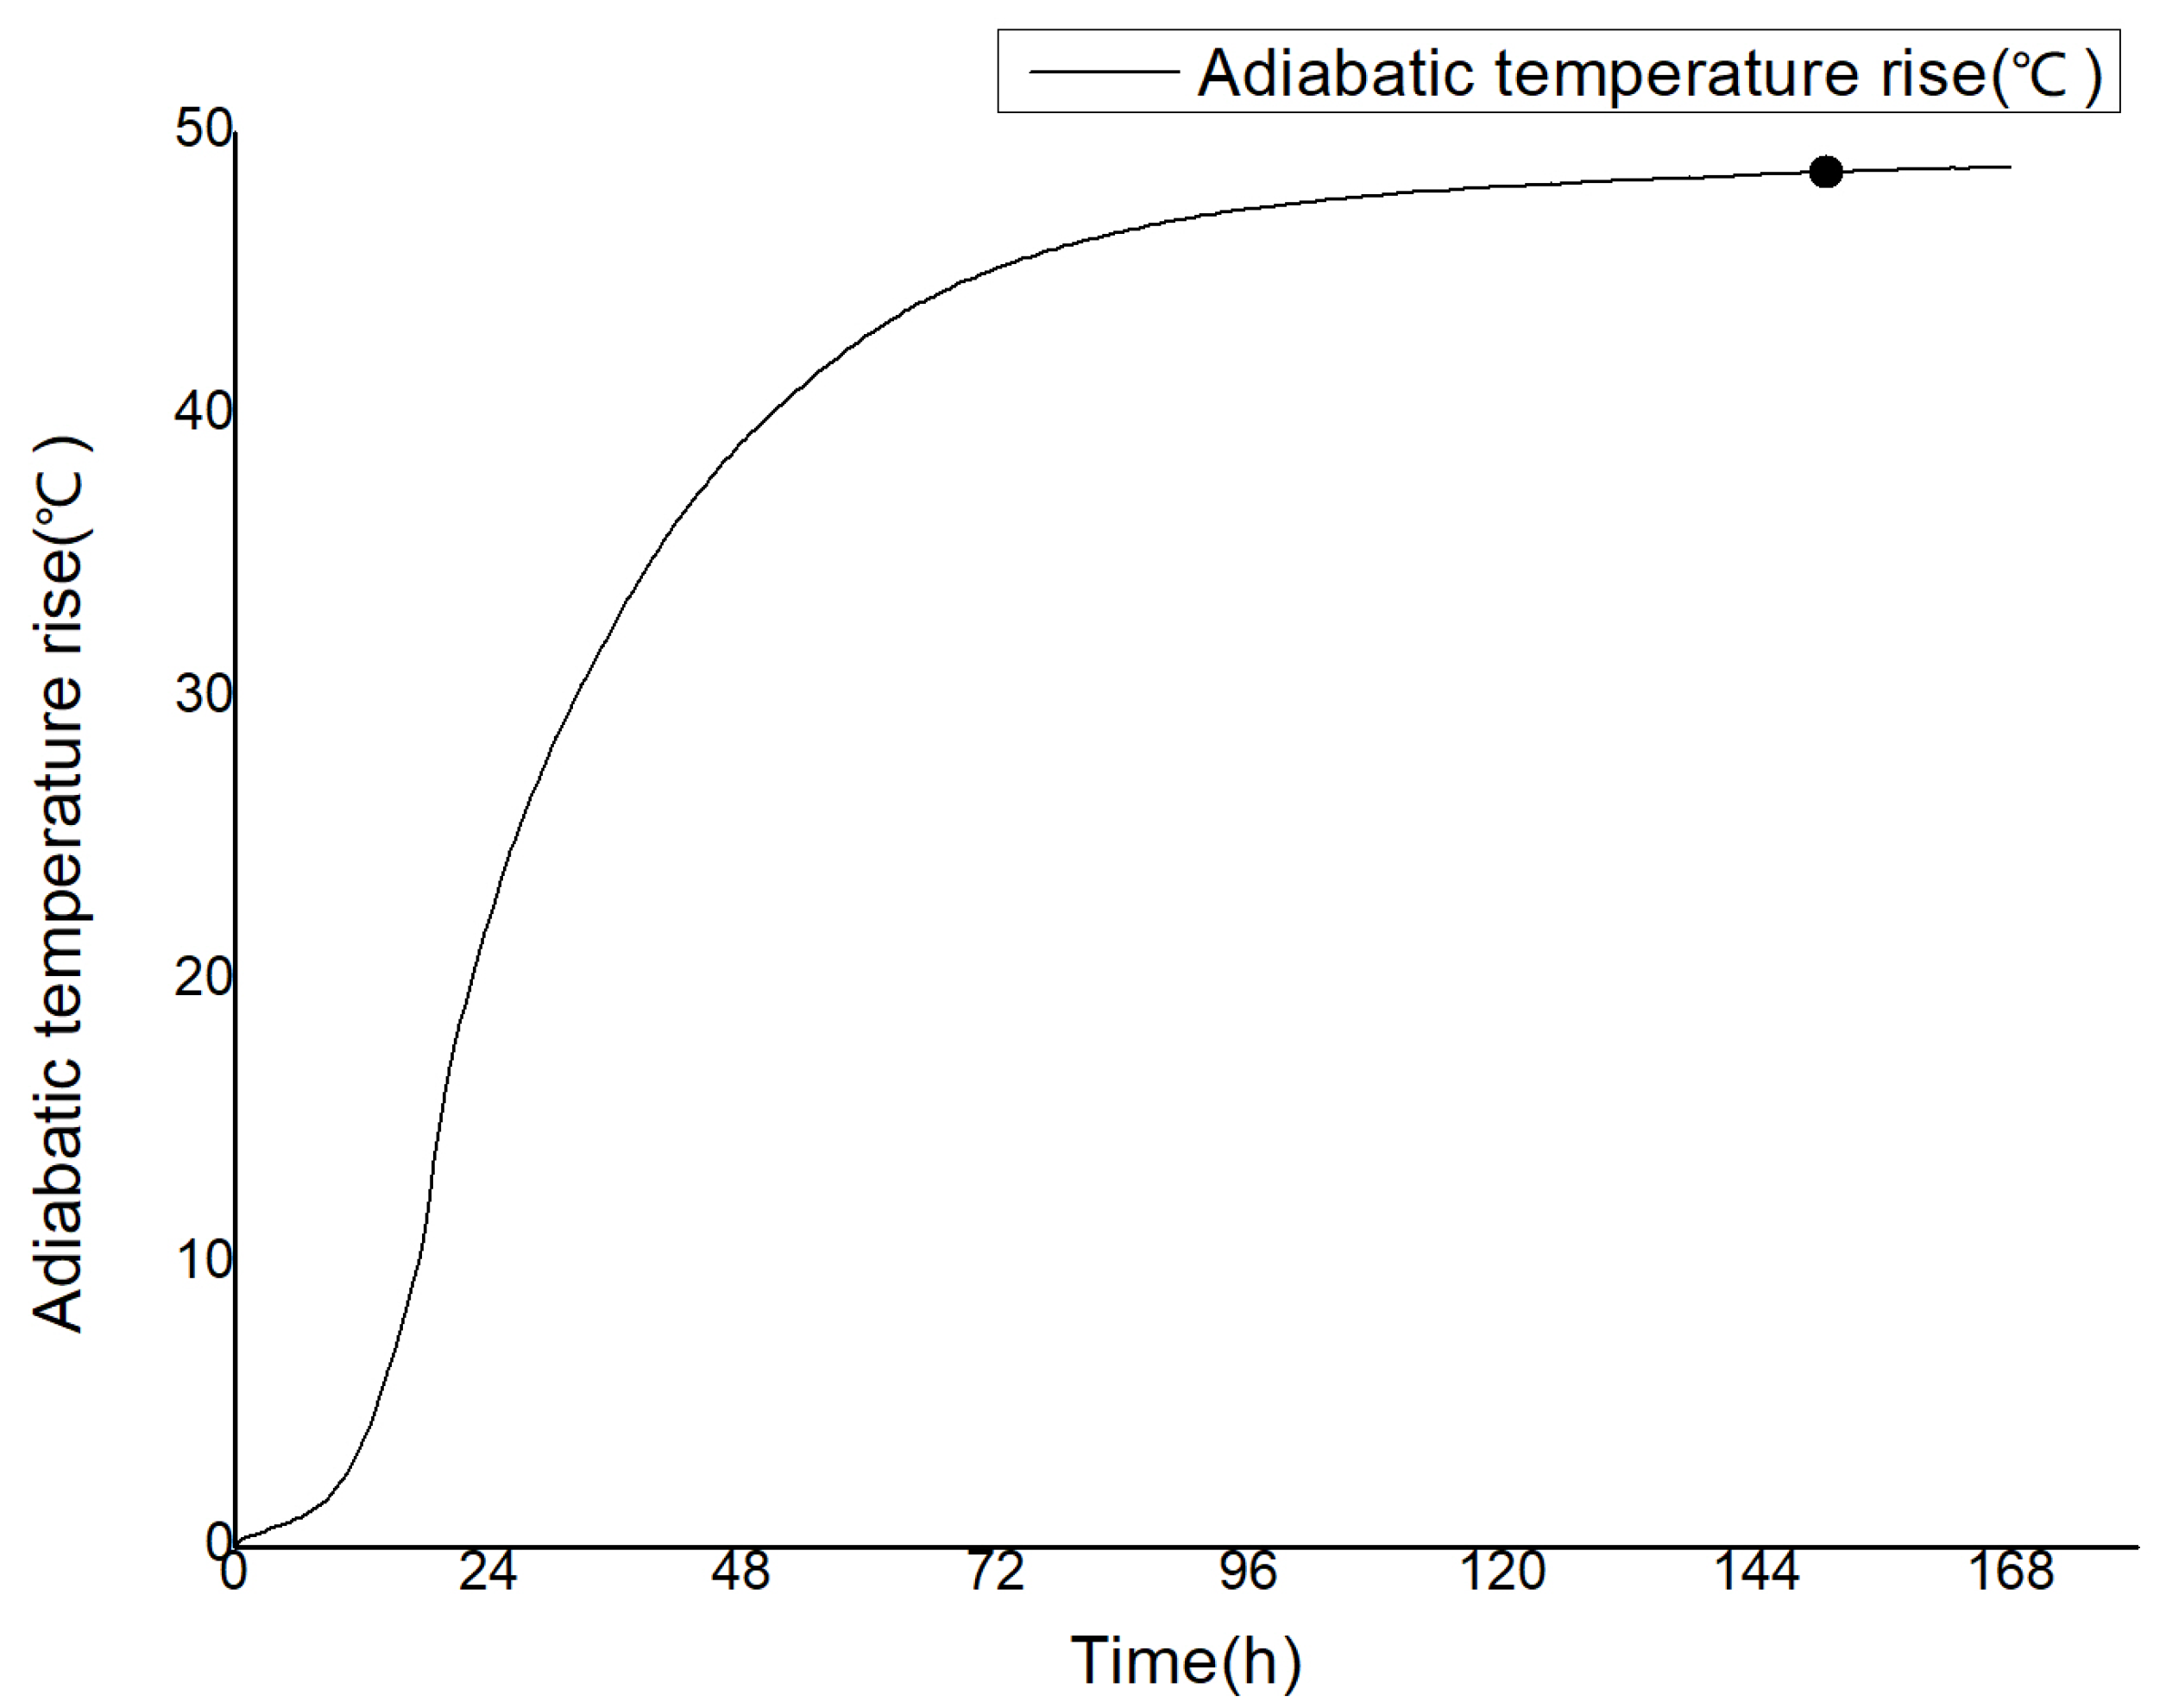
Heat Source Function: The hydration heat release was defined by an adiabatic temperature rise curve obtained from standardized concrete performance tests conducted in accordance with DL/T 5150-2017 [67]. The test involved casting a concrete specimen from the project mix into a sealed, insulated mold equipped with a central temperature sensor and curing it in a specialized adiabatic calorimeter. The apparatus maintained a near-perfect adiabatic environment by dynamically synchronizing the chamber temperature with the specimen’s core temperature, thereby eliminating heat loss. The temperature increase due to cement hydration was recorded continuously until it peaked and stabilized. The resulting adiabatic temperature rise versus time curve, which serves as the essential heat generation characteristic for the simulation, is shown in Figure 21.
Figure 21.
Measured adiabatic temperature rise curve of concrete.
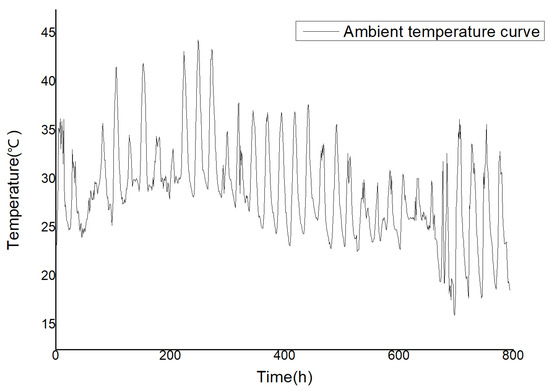
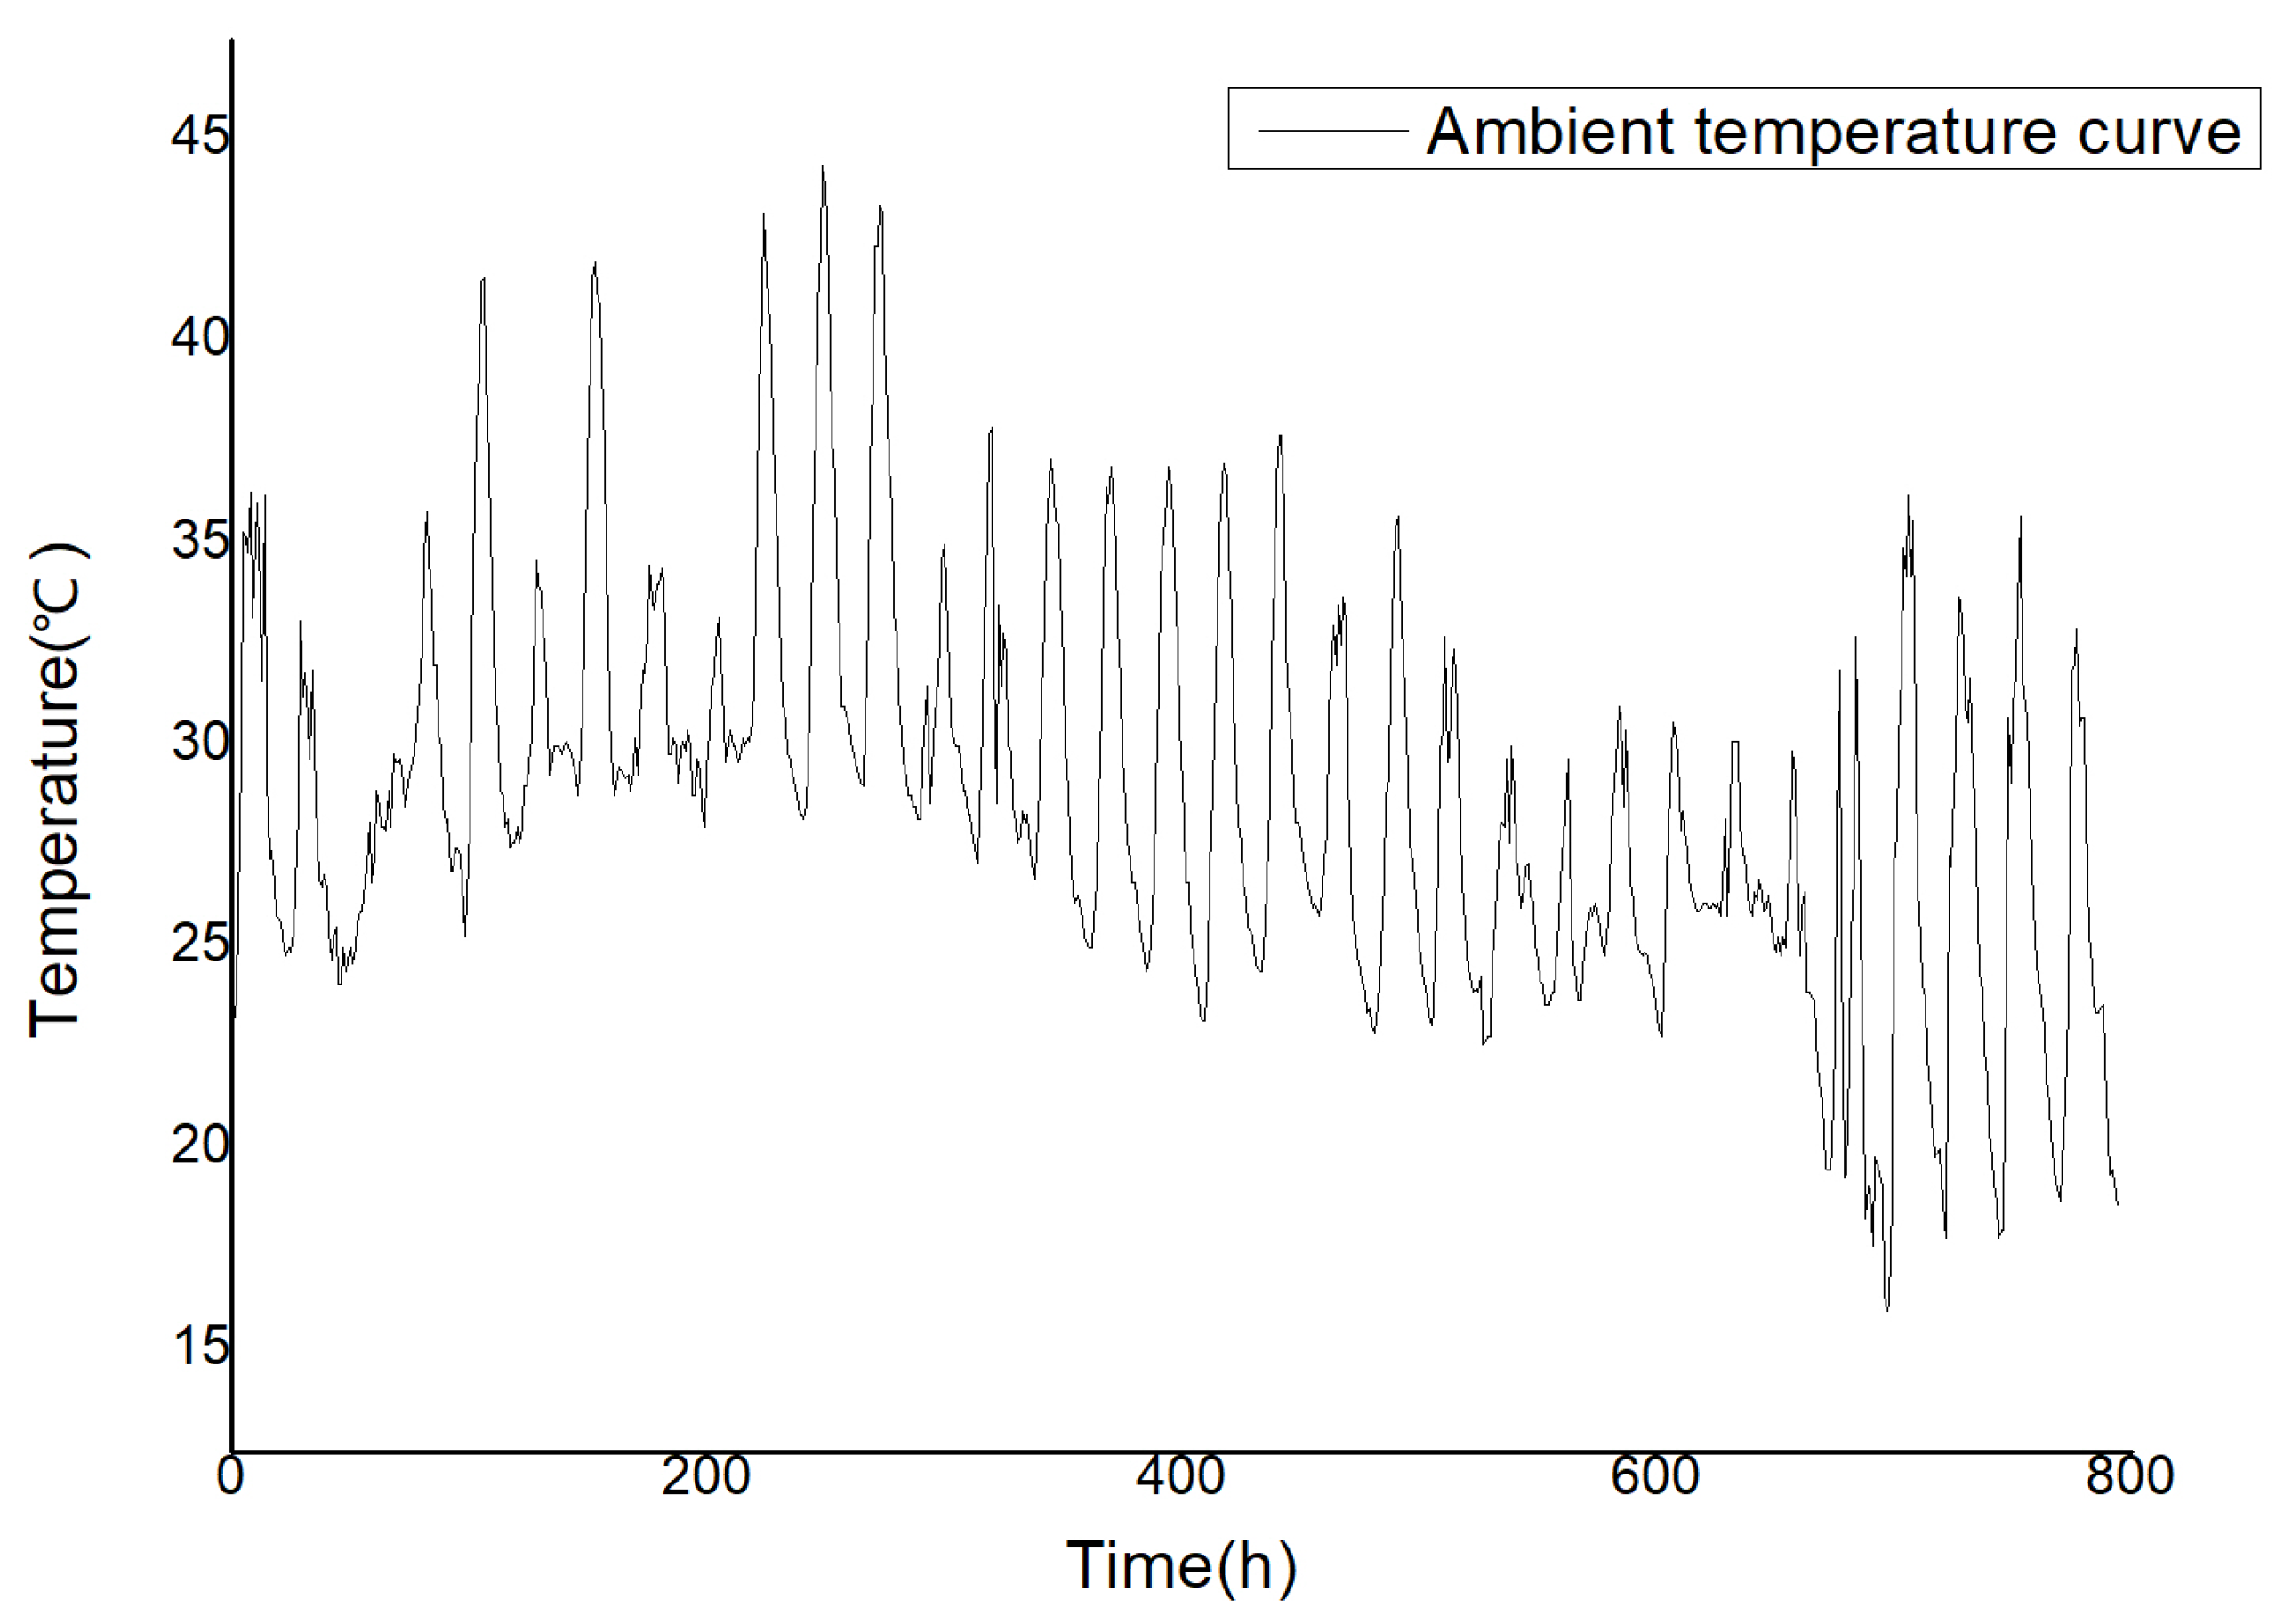
Ambient Temperature Function: Based on measured on-site environmental data (Figure 22).
Figure 22.
Measured ambient temperature curve.
Thermophysical Properties: The key thermodynamic parameters for the raft foundation concrete and the bedrock were derived from dedicated material characterization tests. For the concrete, these properties—including density, specific heat capacity, and thermal conductivity—were determined in laboratory tests performed according to the relevant methods outlined in GB/T 50081-2019 [68]. Specifically, the thermal conductivity and specific heat capacity were measured using a guarded hot plate method and calorimetry, respectively, on specimens cured under conditions representative of the project. The equivalent surface heat transfer coefficients for different concrete surfaces (e.g., formwork, steel liner, exposed surfaces with insulation) were calculated based on the specific curing conditions and insulation schemes employed on site, accounting for layered materials and their respective thermal resistances. The properties for the bedrock were obtained from the project geotechnical investigation report. All thermodynamic parameters are summarized in Table 4.
Table 4.
Thermodynamic parameters of concrete and bedrock.
The equivalent heat transfer coefficient listed in Table 4 can be calculated using the following formula, which accounts for the heat transfer through a multi-layered concrete surface insulation [69]:
where is the total thermal resistance ((m2·°C)/W); is the thickness of insulating material of layer (m); is the thermal conductivity of insulating material of layer (W/(m·°C)); is the convective heat transfer coefficient between the outermost surface and the ambient air (W/(m2·°C)).
4.4.3. Comparison of Measured and Simulated Results
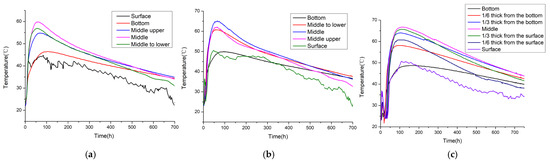
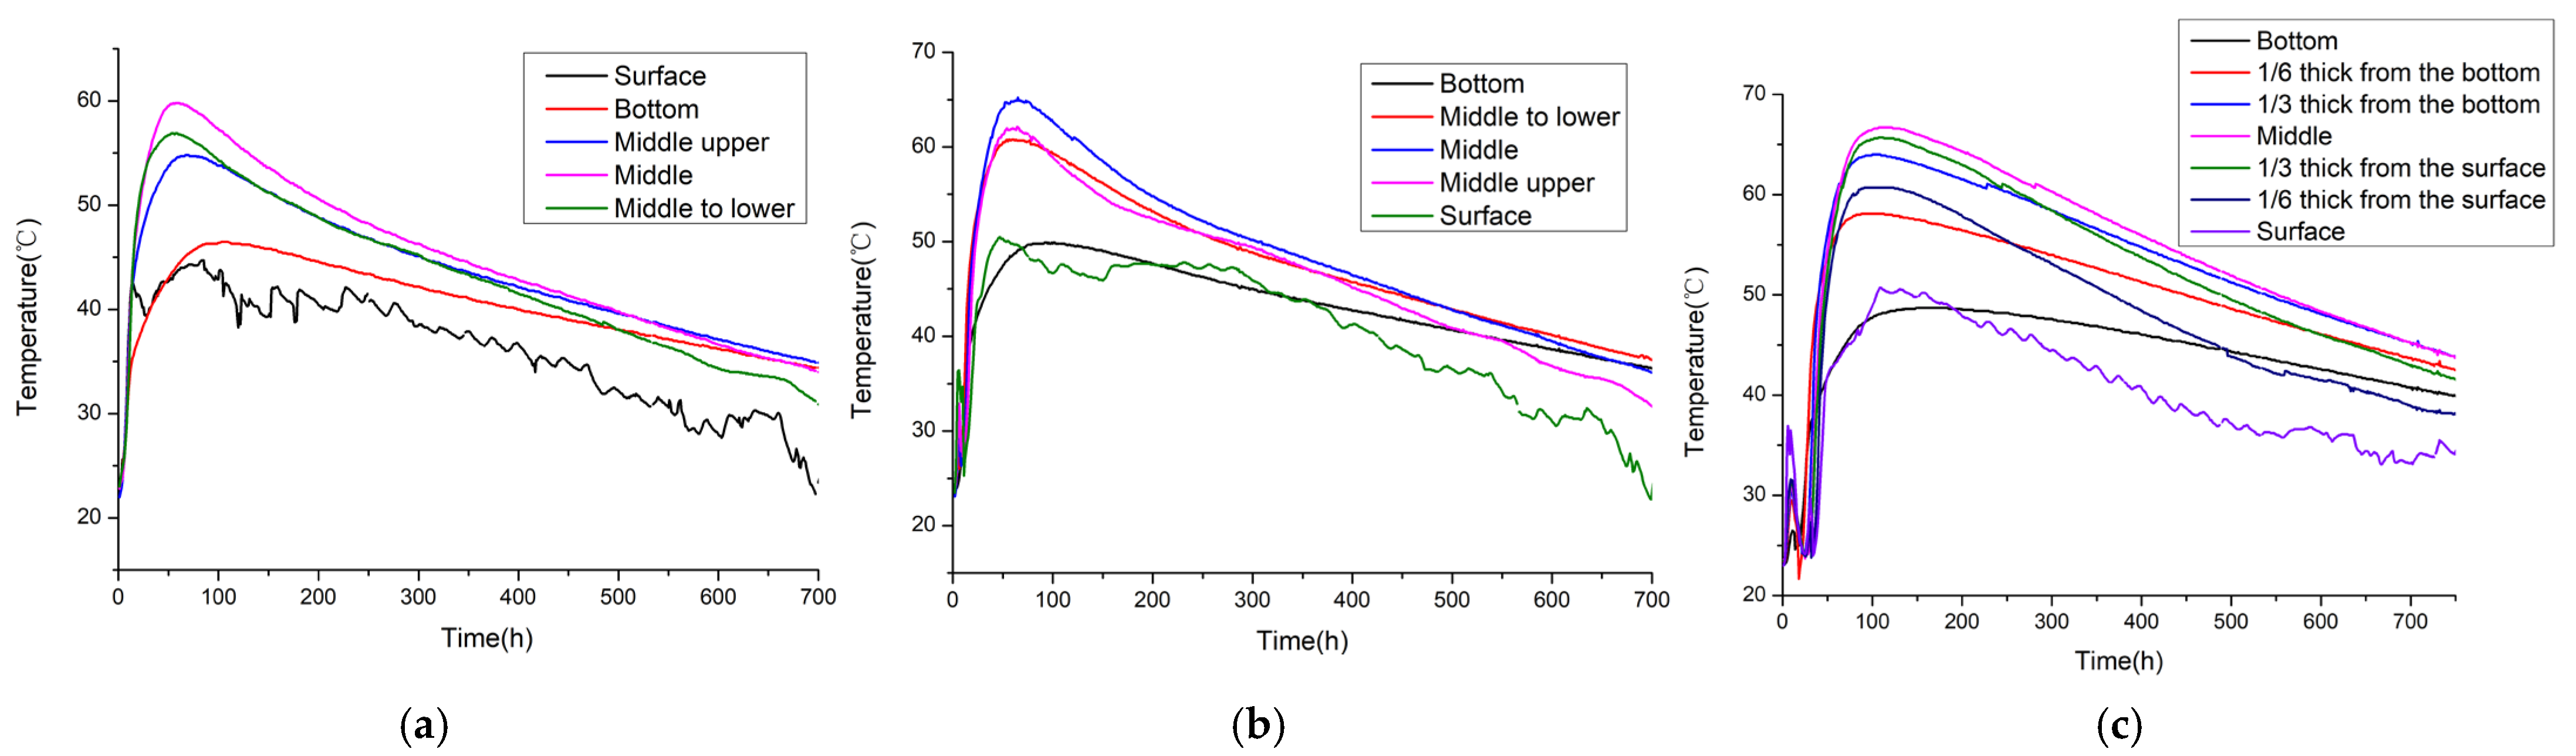
Temperature data from three representative points—Points 1 and 5 in the 2.114 m thick central region, and Point 7 in the 3.35 m thick peripheral region—were selected for detailed analysis (Figure 23). Key measured thermal characteristics are summarized in Table 5.
Figure 23.
Measured temperature time-history curves at different monitoring points: (a) Point 1; (b) Point 5; (c) Point 7.
Table 5.
Summary of measured temperature characteristics at selected points.
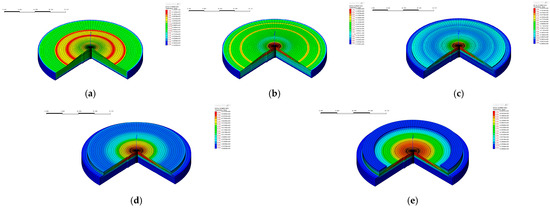
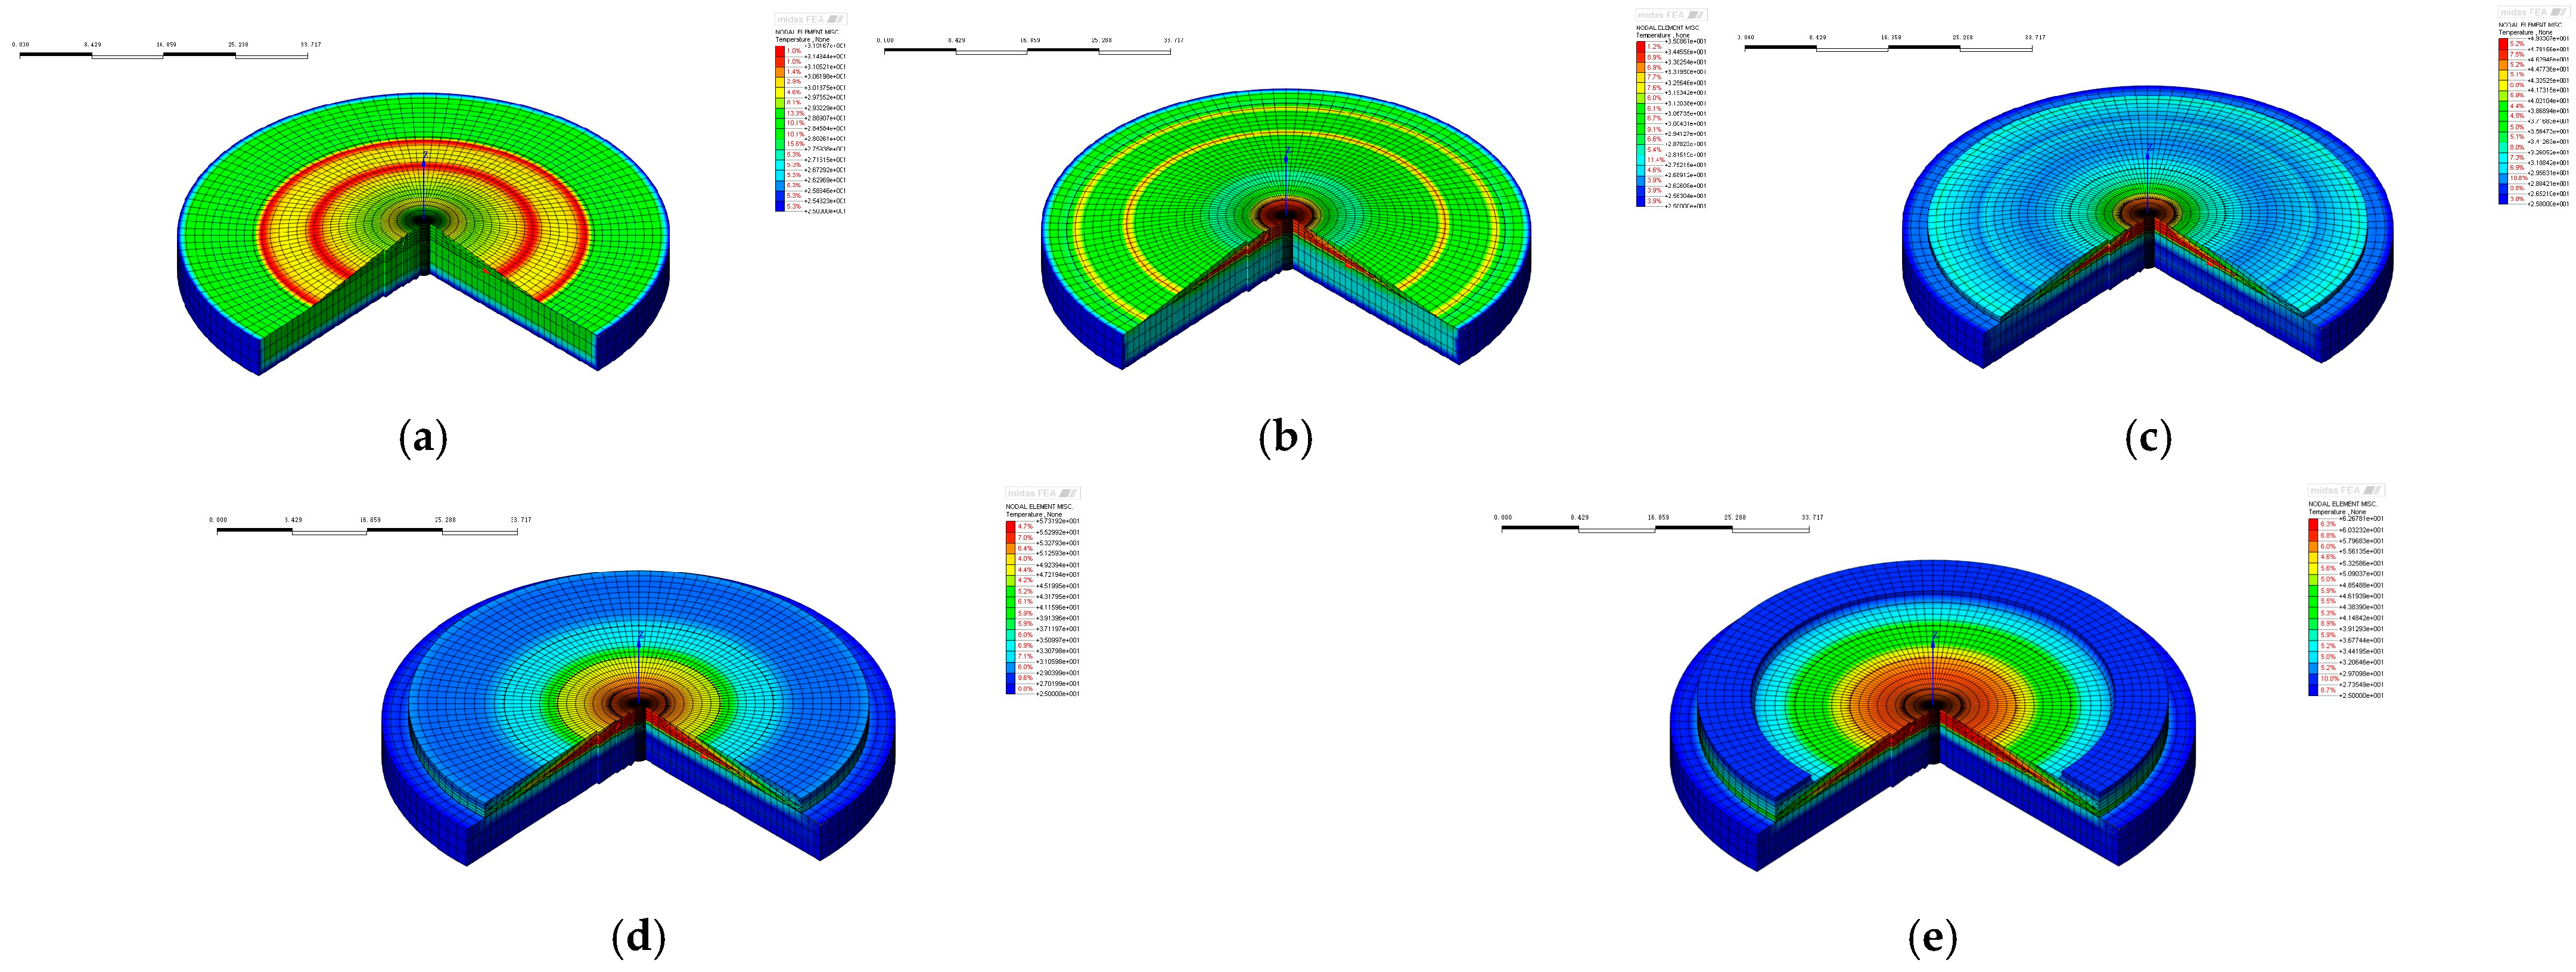
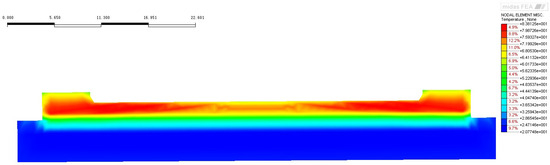
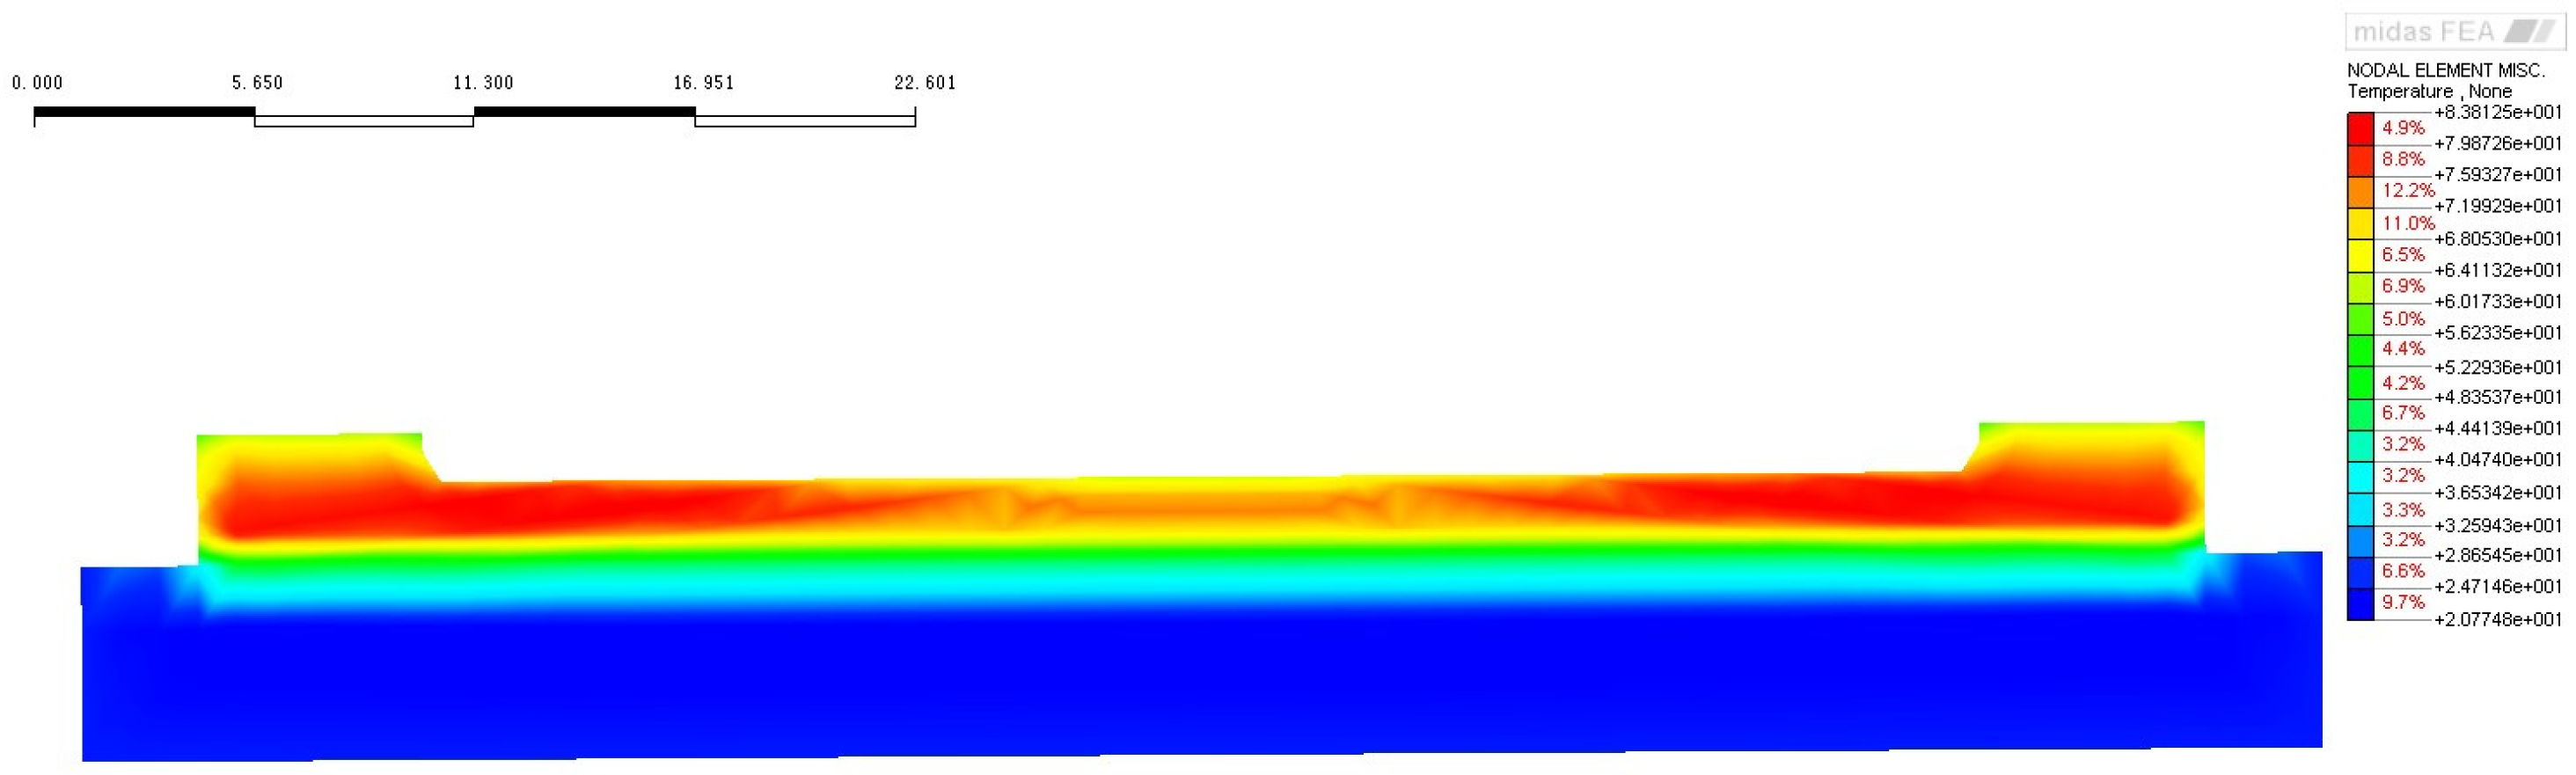
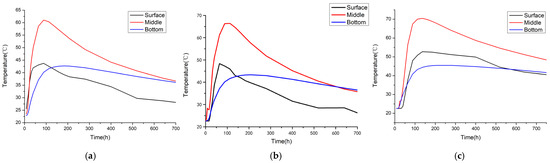
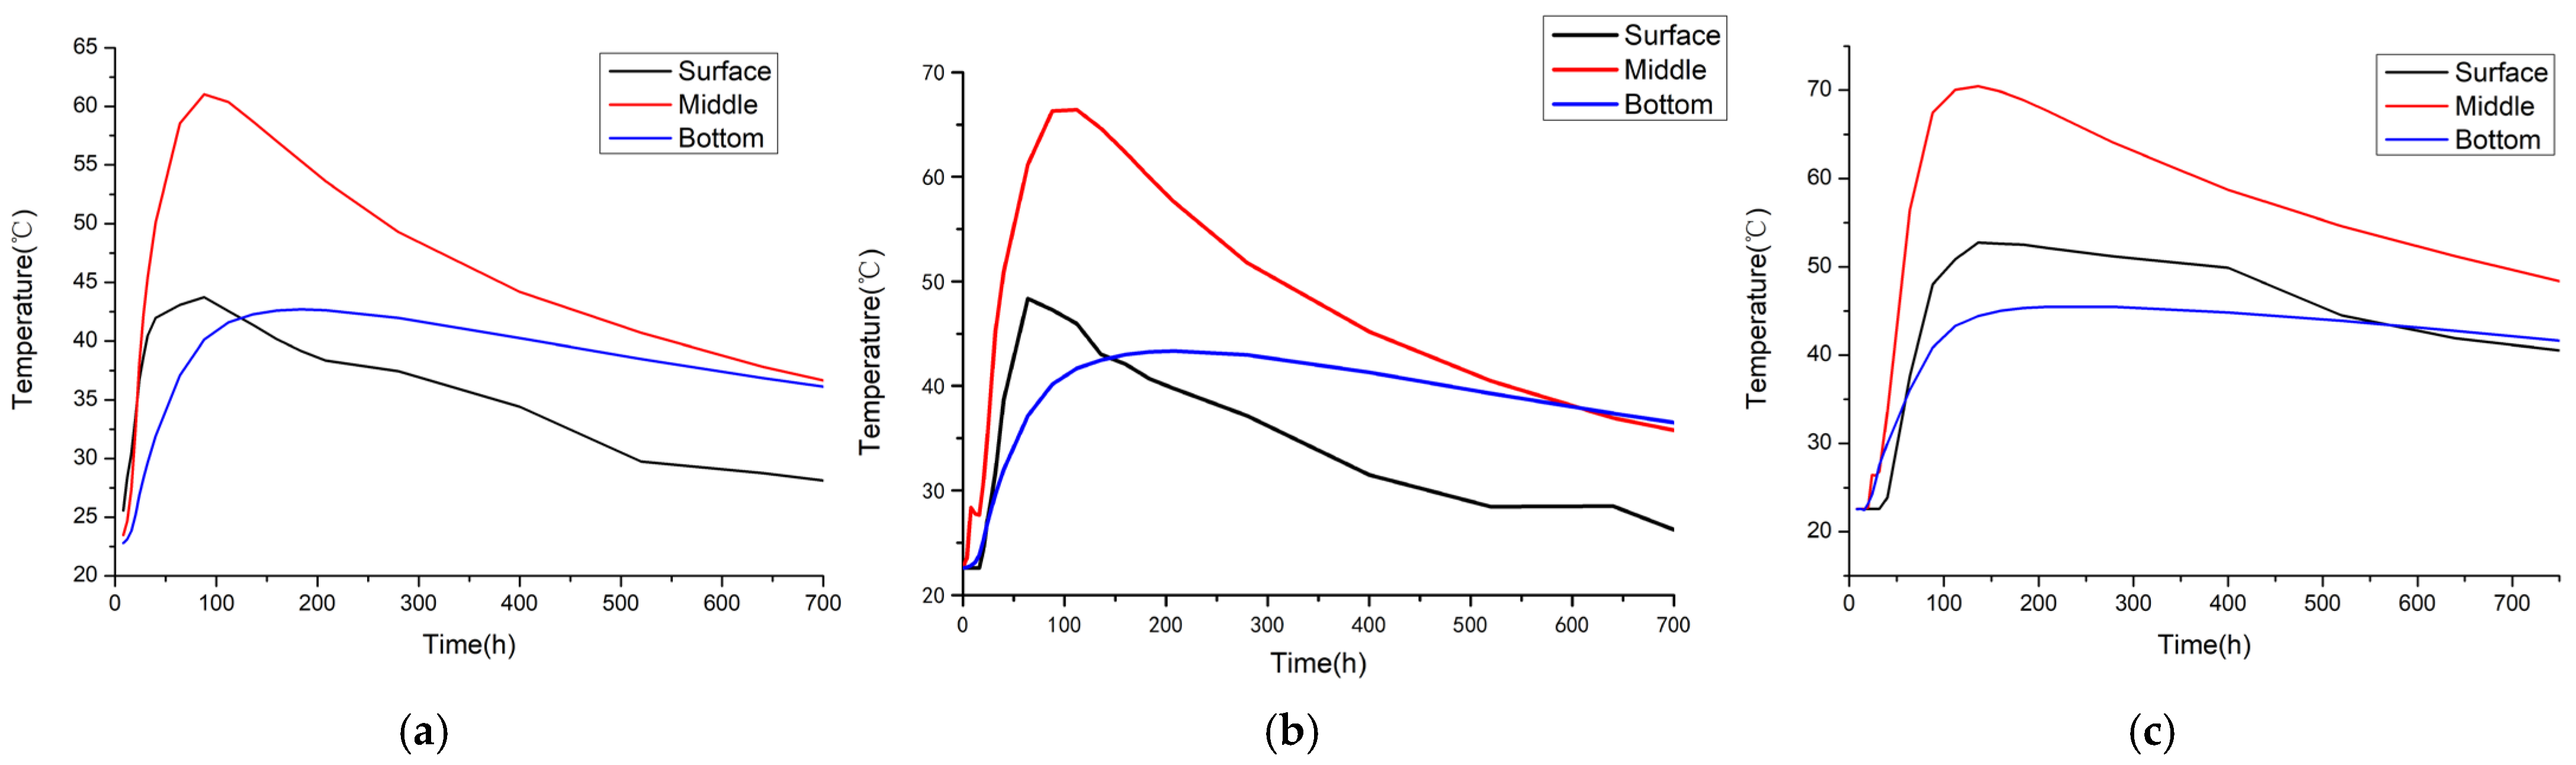
The simulated temperature field evolution at key ages (Figure 24, Figure 25 and Figure 26) and the corresponding time-history curves at the monitored points (Figure 27) demonstrated good agreement with field measurements. The finite element analysis yielded slightly conservative predictions for peak temperatures and core–surface differentials (Table 6), which is favorable for proactive and conservative curing management.
Figure 24.
Temperature field after the completion of each pouring phase: (a) Phase 1; (b) Phase 2; (c) Phase 3; (d) Phase 4; (e) Phase 5.
Figure 25.
Temperature field of the nuclear island raft foundation at different ages after the completion of pouring: (a) 1 day; (b) 3 days; (c) 7 days.
Figure 26.
Temperature distribution diagram of nuclear island raft foundation cross-section.
Figure 27.
Finite element calculated temperature time-history curves at different measuring points: (a) Point 1; (b) Point 5; (c) Point 7. Note: “surface” refers to the top surface exposed to air, while “bottom” refers to the lower surface in contact with bedrock.
Table 6.
Summary of simulated temperature characteristics at selected points.
The simulated peak temperature at Point 7 reached 70.4 °C. Although such elevated temperatures may raise durability concerns—including risks of delayed ettringite formation or compromised long-term strength—the implemented control strategy (optimized pouring, real-time monitoring, and dynamic curing) effectively managed thermal evolution. The actual recorded peak was 66.7 °C, and temperatures remained within safe thresholds, minimizing potential durability impacts.
4.4.4. Analysis of Temperature Results
The field monitoring data presented in Table 5 serve as objective evidence of the final outcomes:
- (1)
- Successful Temperature Differential Control: The measured maximum core-to-surface temperature differentials at the three key monitoring points (P1, P5, P7) were 16.9 °C, 16.5 °C, and 19.8 °C, respectively. All values are significantly lower than the specified control limit of 25 °C. Notably, the differential in the thickest and highest-risk peripheral region (P7) was only 19.8 °C, demonstrating the exceptional effectiveness of the temperature control measures (e.g., the innovative pouring method, curing enclosure, and dynamic insulation).
- (2)
- Safe Peak Temperatures: The highest peak temperature occurred at the peripheral point P7, reaching 66.7 °C. This value is well below the documented risk threshold (82–85 °C) for delayed ettringite formation (DEF), thereby fundamentally avoiding durability issues associated with excessive temperature.
A direct comparison between Table 6 (simulation) and Table 5 (measurement) reveals the performance characteristics of the numerical model:
- (1)
- Accurate Prediction of Trends: The simulation accurately predicted the spatial temperature relationship, characterized by lower temperatures in the thinner central region and higher temperatures in the thicker peripheral region. The simulated peak temperatures (P1: 61.0 °C < P5: 66.4 °C < P7: 70.4 °C) are in complete agreement with the measured trend (59.8 °C, 65.2 °C, 66.7 °C).
- (2)
- Conservative Nature of Predictions: Peak Temperature: The simulated peak temperatures are consistently higher than the measured values (e.g., ~3.7 °C higher for P7). This provides a safety margin for construction management, meaning that contingency plans based on the simulation are more stringent than actually required. Maximum Temperature Differential: For point P5, the simulated maximum differential (21.6 °C) is notably higher than the measured value (16.5 °C). This conservative overestimation is desirable in engineering design, as it ensures a more sensitive early-warning mechanism.
- (3)
- Time Lag Phenomenon: The times to reach peak values in the simulation are generally later than those in the measurements (e.g., 112 h vs. 65 h for the peak at P5). This discrepancy likely stems from the model’s idealized treatment of early-age concrete thermal parameter evolution and boundary conditions (e.g., the microclimate within the curing enclosure). However, this does not compromise the model’s capability to capture the core elements of peak magnitude and distribution patterns.
4.4.5. Thermal Stress and Cracking Risk Analysis
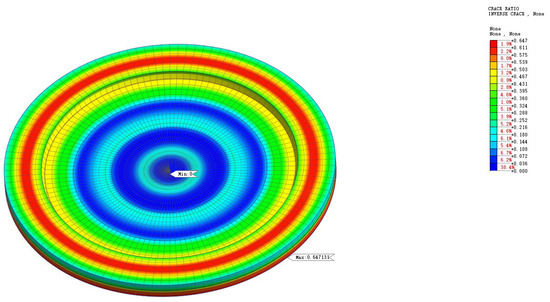
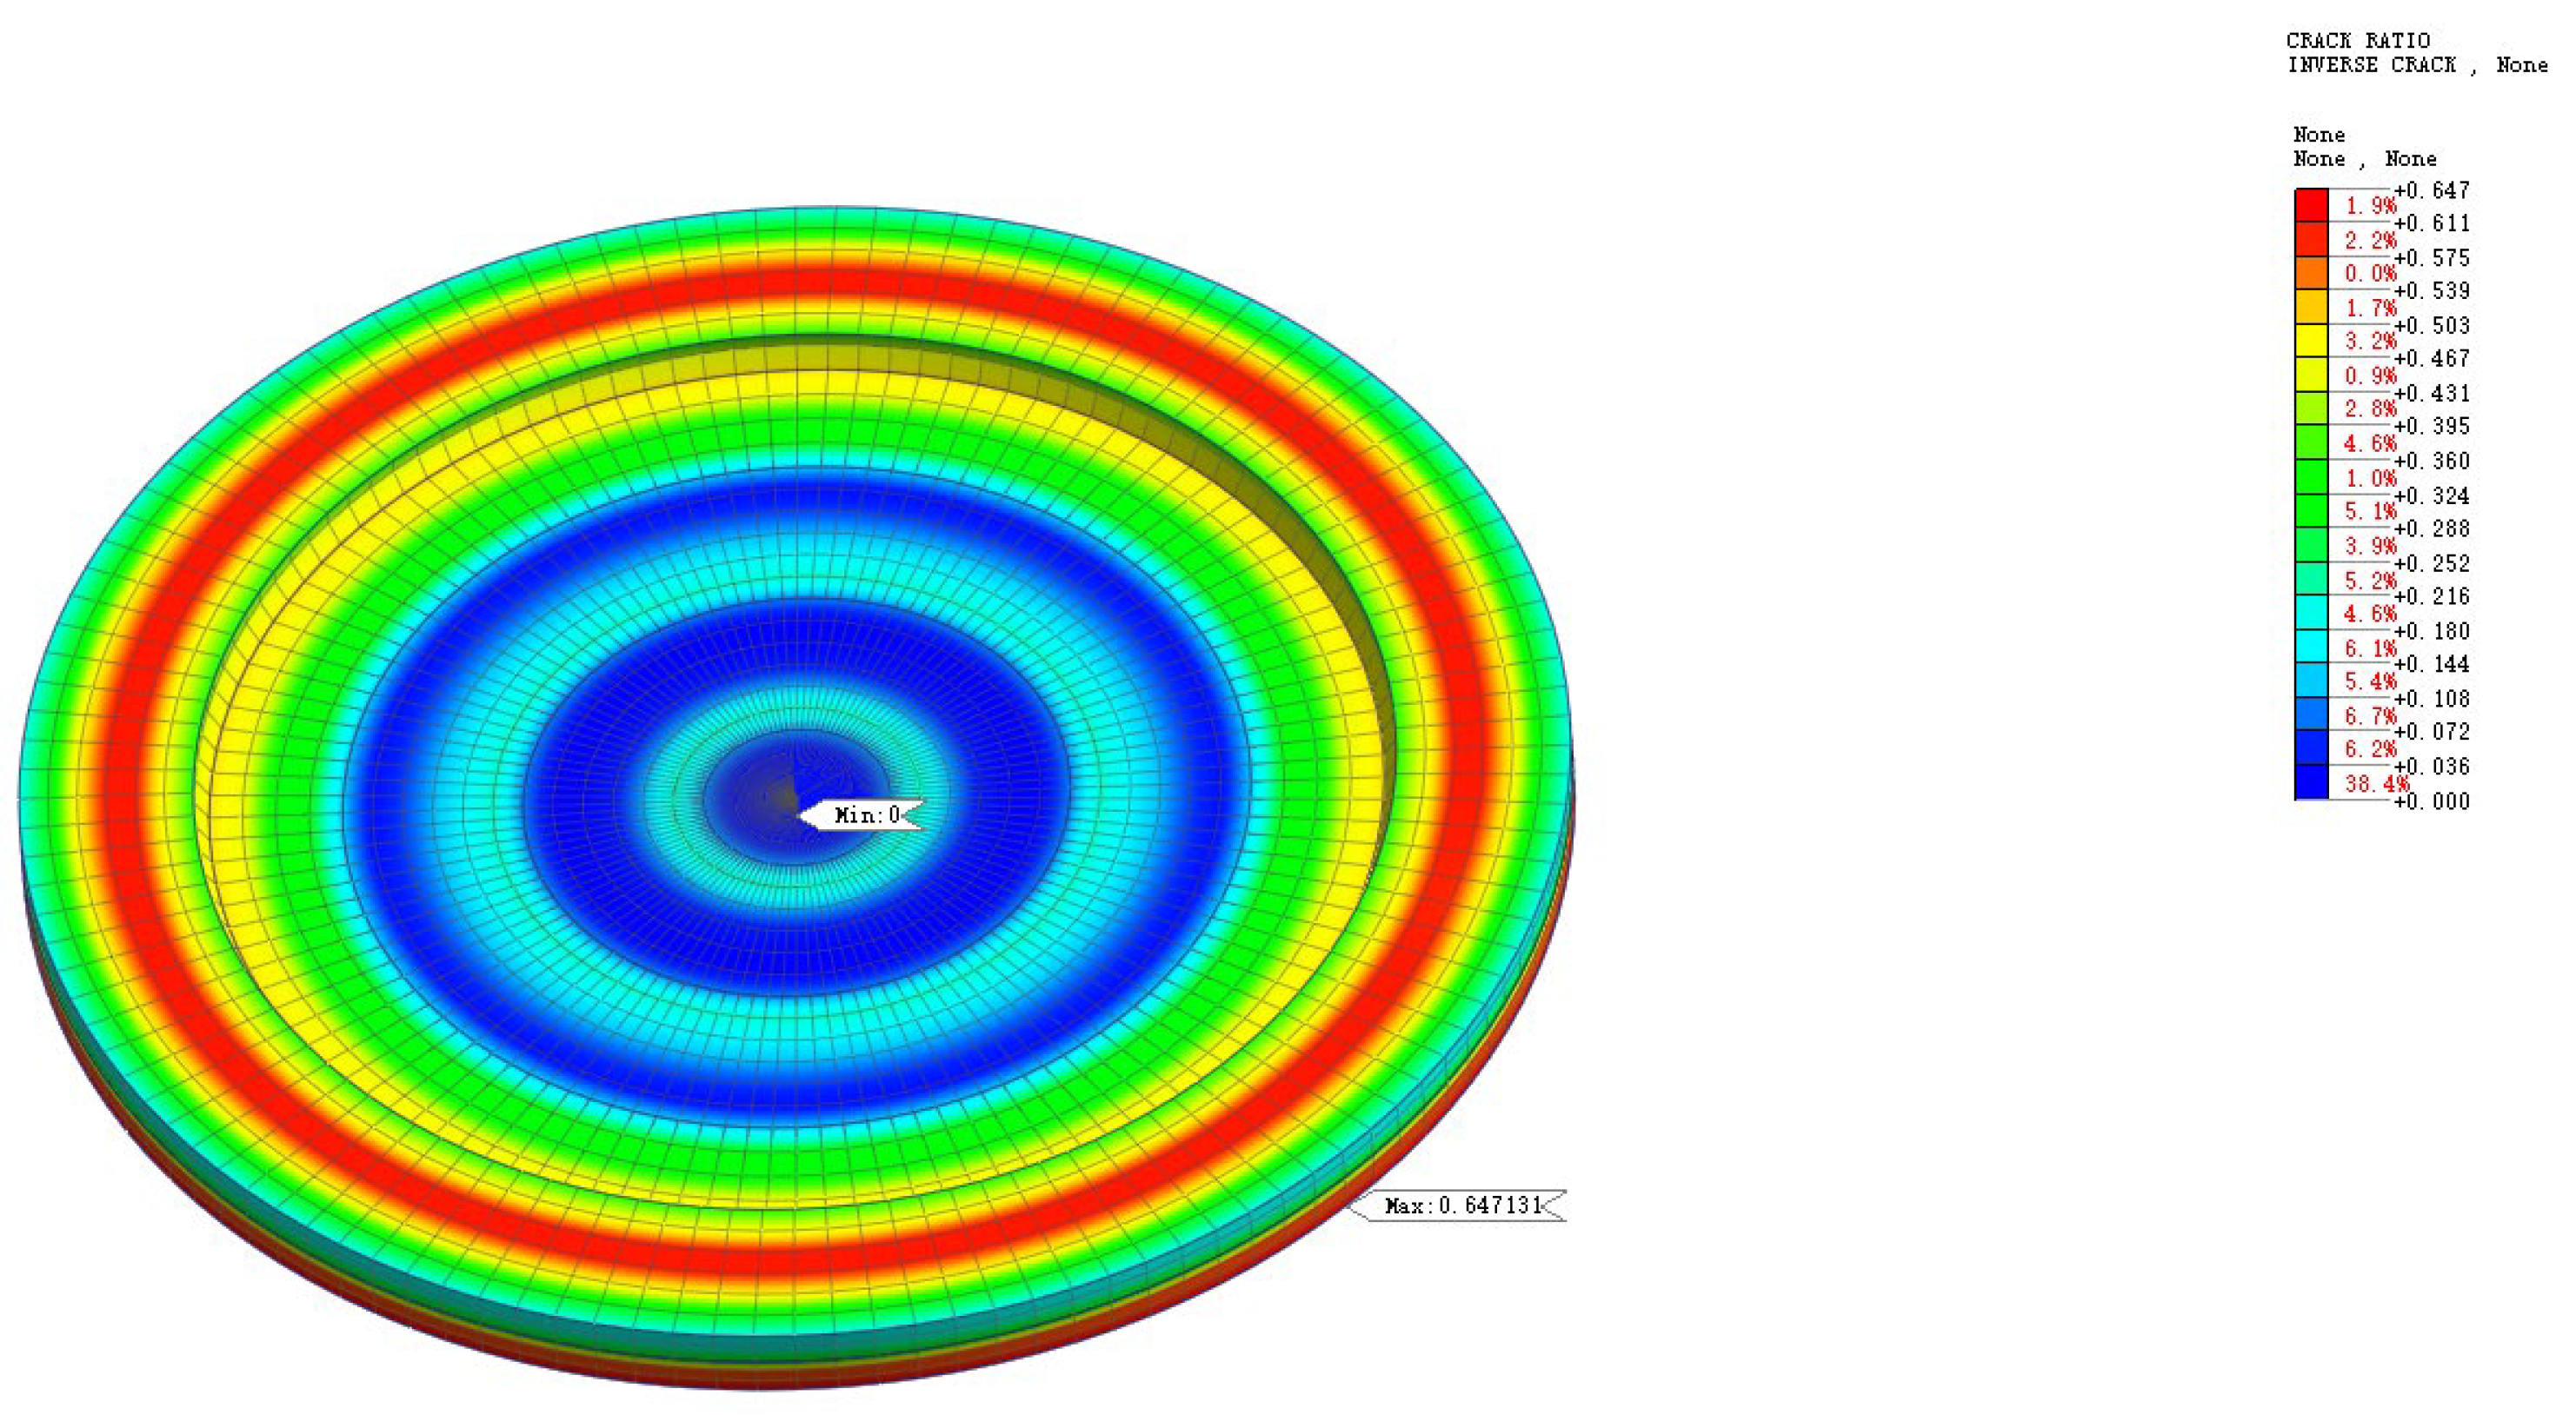
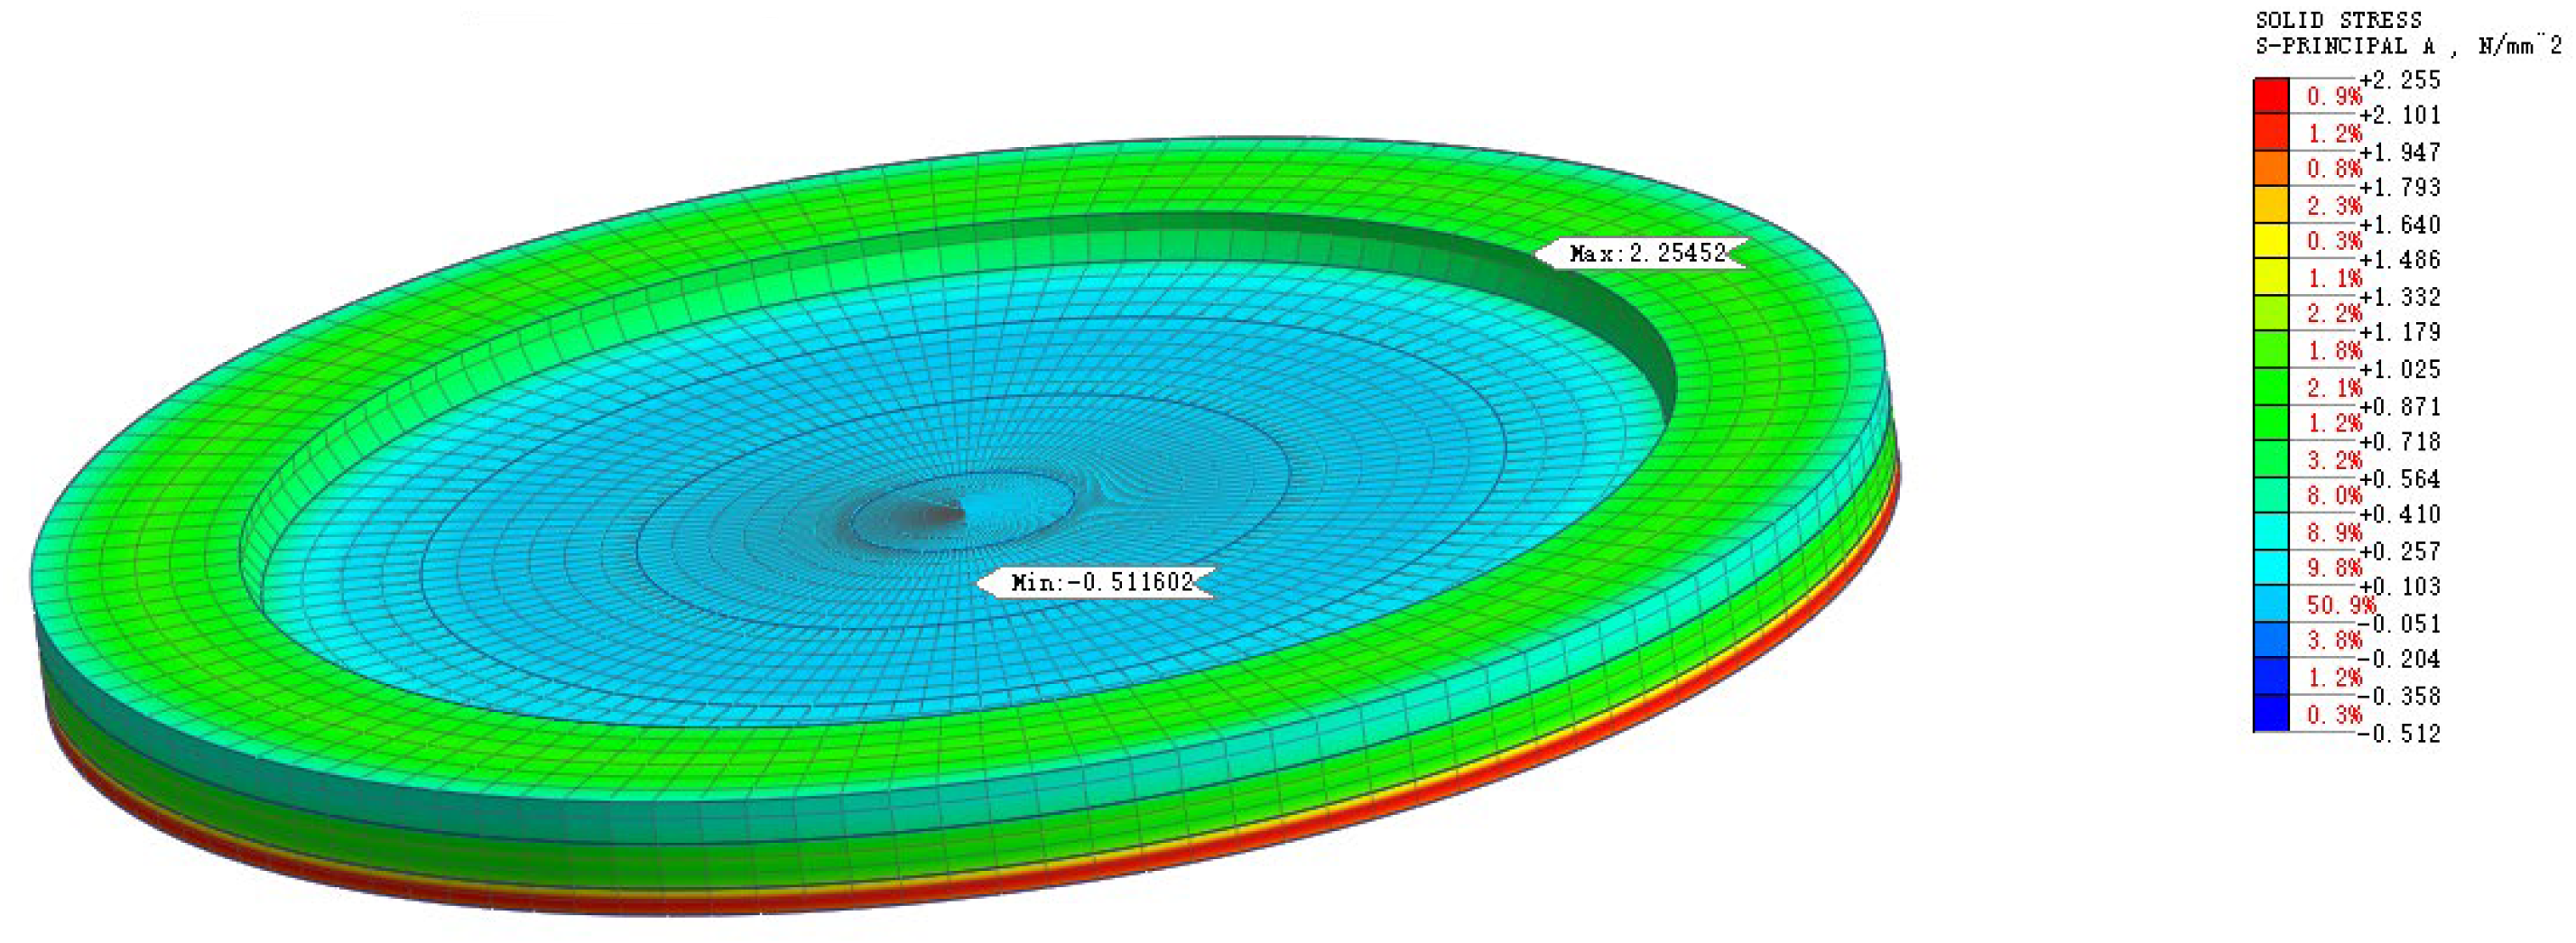
While Section 4.4 focuses on temperature, thermal stress and cracking risk provide critical structural insight. Using Equation (13), the cracking risk coefficient K was calculated throughout the curing period. Results show K remained below 0.7 at all locations, with a maximum value of 0.65 occurring in the peripheral thick region, as shown in Figure 28. As shown in Figure 29, maximum tensile stress reached 2.3 MPa but remained below corresponding tensile strength (3.5 MPa at that age). This confirms the effectiveness of the proposed method in mitigating cracking risk.
Figure 28.
Distribution of the cracking risk coefficient K.
Figure 29.
Thermal stress distribution.
4.4.6. Thermal Analysis of the Novel Placement Method
Building upon the comparative analysis of thermal outcomes in Section 4.4.4, this section provides a mechanistic examination of the novel pouring method, elucidating its underlying thermal principles and consequent mechanical benefits for crack mitigation.
The fundamental thermal principle of the proposed center-to-periphery synchronous pouring strategy is the intentional introduction of a phased time lag in hydration heat release between the central and peripheral structural regions. This engineered asynchrony is quantitatively substantiated by field data (Table 5): the temperature peak in the thinner central zone (Point 1) occurred at approximately 55 h post-casting (59.8 °C), whereas the peak in the thicker peripheral zone (Point 7) was delayed to about 108 h (66.7 °C), representing a differential exceeding 50 h.
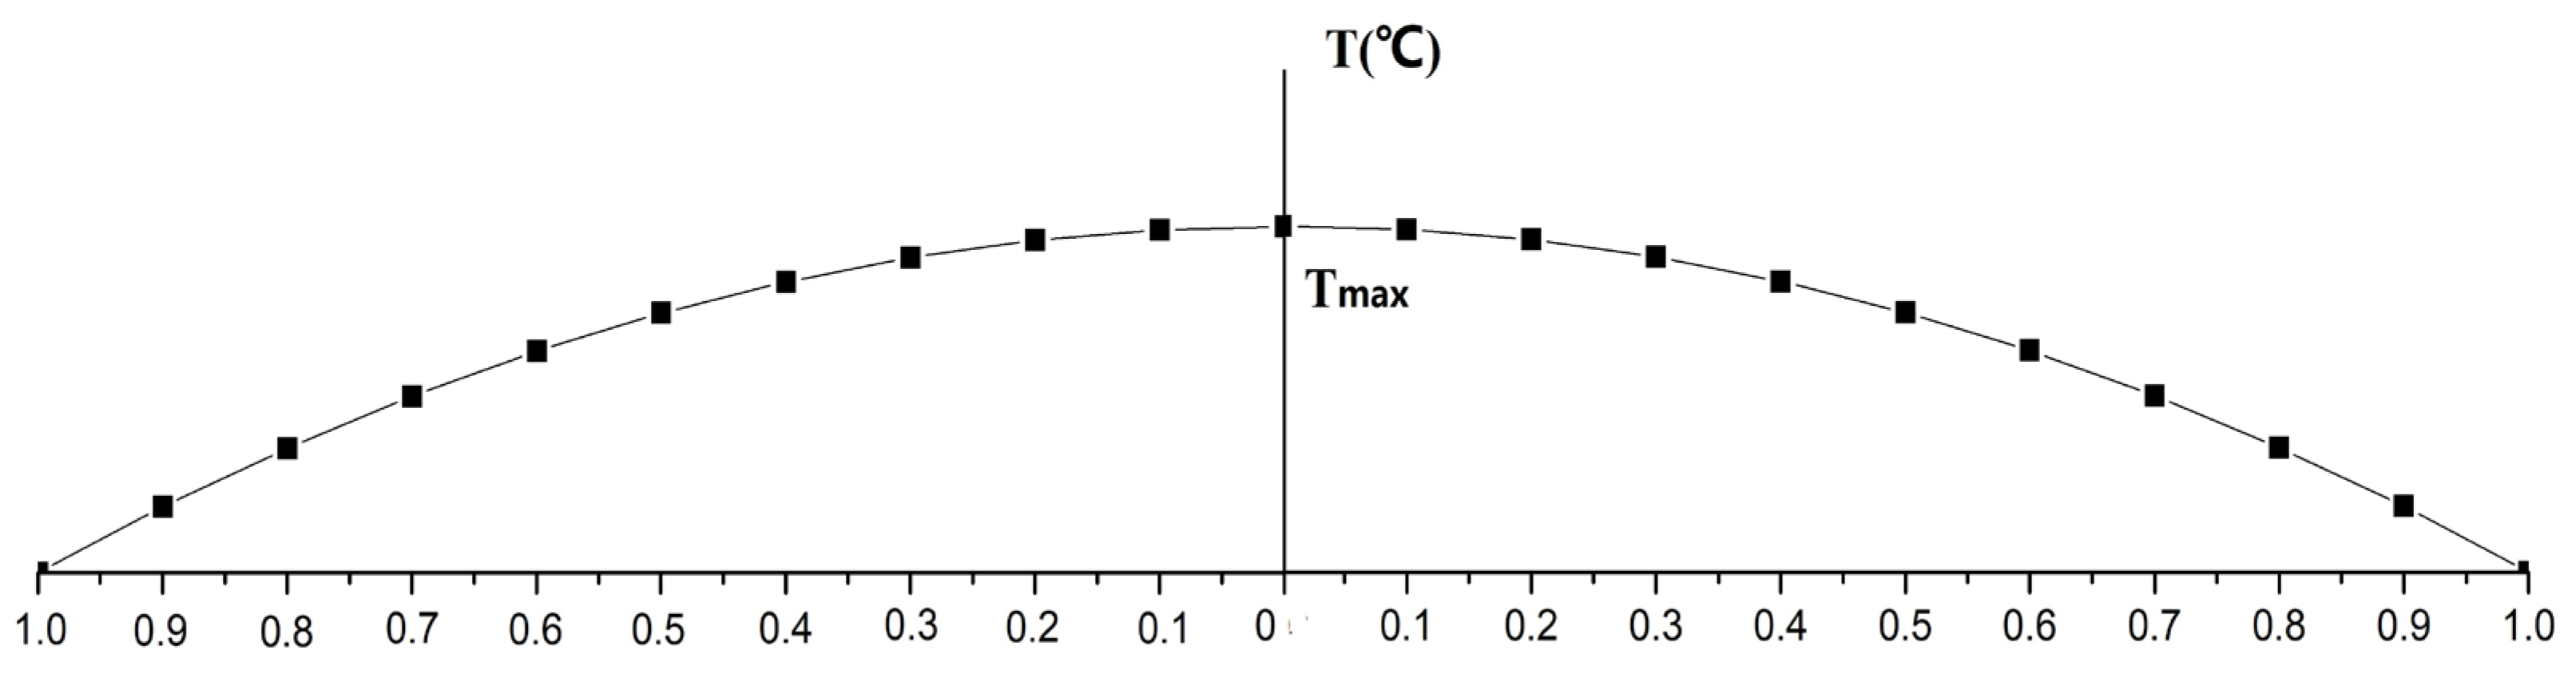
This temporal decoupling critically optimizes the temperature field. For a circular raft foundation, the temperature distribution can be conceptually separated into a linear component and a nonlinear radial component as expressed in Equations (17) and (18) and illustrated in Figure 30 [70]:
Figure 30.
Nonlinear temperature distribution of circular plate.
The nonlinear component is primarily responsible for generating self-equilibrating thermal stresses. Conventional pouring sequences often lead to near-synchronous peaking in central and peripheral zones, producing a pronounced and concurrent radial temperature gradient that induces significant restraint tensile stresses.
The present method strategically alters this dynamic. During the period when the central concrete reaches its peak temperature and initiates cooling contraction, the peripheral concrete remains in its heating expansion phase. This partial counteraction of deformation tendencies effectively diminishes the net restraint force arising from the instantaneous center-edge temperature differential across the structure. Subsequently, as the periphery attains its thermal maximum, the central region has progressed into the cooling phase with enhanced stiffness, and its constraining effect on peripheral expansion is further mitigated by the established time lag. This sequential, non-simultaneous thermal evolution inherently reduces the peak thermal stress experienced by the early-age concrete when its tensile capacity is minimal.
The mechanical efficacy of this approach is reflected in the suppressed cracking risk coefficient (Equation (13)). The operational results noted in Section 4.4.4—a cracking risk coefficient persistently below 0.7 at all monitored locations and the definitive absence of thermal cracking post-construction—provide direct mechanical validation of the method’s success in mitigating early-age cracking driven by the center–periphery temperature difference .
In conclusion, the novel pouring method represents an advanced thermal management protocol rather than a simple procedural modification. It employs a quantifiable construction time lag to temporally redistribute and attenuate the concentrated radial temperature gradient , thereby fundamentally lowering early-age thermal stress. This offers a scientifically grounded and effective strategy for ensuring the structural integrity and long-term durability of mass concrete elements.
5. Conclusions and Future Works
This study presents a comprehensive, simulation-driven framework for mitigating early-age thermal cracking in mass concrete structures, with a focused application on the large-volume cylindrical raft foundation of a VVER-1200 nuclear power plant. The primary innovation is the development and validation of a center-to-periphery synchronous pouring method. This method strategically engineers construction-phase time lags to intrinsically moderate the radial temperature gradient (), which is a principal source of restraint tensile stress in thick, circular foundations.
The quantitative outcomes from the integrated application of this optimized method, high-fidelity thermo-mechanical simulation, and real-time temperature monitoring conclusively demonstrate its efficacy:
- (1)
- Effective Thermal Gradient Control: The proposed pouring sequence successfully maintained all measured core-to-surface temperature differences () below the critical engineering threshold. The maximum recorded was 19.8 °C at the thickest peripheral section, which is 21% lower than the 25 °C control limit. Concurrently, peak concrete temperatures were kept within safe bounds, with the highest recorded value of 66.7 °C, significantly below the 82–85 °C range associated with the risk of delayed ettringite formation (DEF).
- (2)
- Reliable and Conservative Numerical Prediction: The developed finite element model demonstrated high predictive fidelity. It accurately captured the spatial temperature trend (thinner center < thicker periphery) and provided conservative, safety-favorable estimates. For instance, at the critical peripheral point, the model predicted a peak temperature of 70.4 °C and a of 19.4 °C, compared to the measured 66.7 °C and 19.8 °C, respectively. This conservative bias is instrumental for proactive risk management in pre-construction planning.
- (3)
- Elimination of Thermal Cracking Risk: Quantitative structural analysis using the cracking risk coefficient () confirmed the method’s effectiveness. The value of remained below 0.7 at all monitored locations throughout the curing period, with a maximum of 0.65, indicating a low probability of cracking. This was definitively validated by post-construction inspection, which confirmed the complete absence of thermal cracks in the 5240 m3 monolithic pour.
- (4)
- Mechanistic Validation of the Pouring Strategy: Field data provided direct evidence of the intended thermal decoupling mechanism. A pronounced time lag of >50 h was observed between the temperature peaks in the central zone (~55 h) and the peripheral zone (~108 h). This engineered asynchrony reduces the concurrent thermal restraint between regions, thereby attenuating the peak magnitude of self-equilibrating thermal stresses during the most vulnerable early-age period.
In conclusion, this work establishes a robust, scientifically grounded framework that transitions thermal crack control from empirical practice to a physics-informed, simulation-validated, and digitally monitored process. The successfully implemented center-to-periphery pouring method, underpinned by reliable predictive modeling and real-time data fusion, offers a significant advancement for ensuring the structural integrity and durability of mass concrete in nuclear infrastructure and other critical engineering projects. While effective within its scope, this study has limitations that indicate avenues for future research. The current numerical model primarily addresses thermo-mechanical coupling; thus, enhancing it to a higher-fidelity multi-physics framework incorporating humidity and shrinkage effects would provide a more comprehensive understanding of crack evolution. Furthermore, the monitoring and data fusion approach, while successful, could be advanced by integrating emerging sensing technologies like distributed optical fiber sensing for richer, multi-dimensional real-time data acquisition. The present framework focuses on construction-phase crack control; its extension towards a full lifecycle digital twin, integrating IoT, BIM, and real-time simulation for long-term performance management, represents a logical and valuable progression. Lastly, the findings contribute to the knowledge base but highlight the need for broader validation and synthesis to inform the standardization of simulation-driven, intelligent workflows in industry guidelines.
Author Contributions
Conceptualization, J.X. and Z.Y.; methodology, J.X.; software, J.X.; validation, Z.Y.; formal analysis, J.X.; investigation, D.W.; resources, D.W. and L.X.; data curation, J.X. and Z.Y.; writing—original draft preparation, J.X.; writing—review and editing, L.X.; supervision, Z.F.; project administration, D.W., L.X., Z.F. and Z.Y. All authors have read and agreed to the published version of the manuscript.
Funding
This research was funded by the Science and Technology Innovation Project of China Nuclear Industry 22nd Construction Co., Ltd., titled “Research on Temperature Crack Control of Mass Concrete in Nuclear Power Plants Based on AI Deep Learning, Simulation Analysis, and On-site Monitoring” (Project No. KY06002025007).
Data Availability Statement
The original contributions presented in this study are included in the article. Further inquiries can be directed to the corresponding author.
Conflicts of Interest
Authors Jie Xiong, Degui Wang, Liping Xie and Zhu Fan were employed by the company Research and Digitalization Center, China Nuclear Industry 22nd Construction Co., Ltd. Author Zhongli Yao was employed by the company Nuclear Power Engineering Business Division, China Nuclear Industry 22nd Construction Co., Ltd. Authors declare that the research was conducted in the absence of any commercial or financial relationships that could be construed as a potential conflict of interest.
References
- Zhou, L.; Li, X.; Yan, Q.; Li, X. Study on the dynamic response of reinforced concrete nuclear containment under the impact of large aircraft. Nucl. Eng. Des. 2024, 417, 112880. [Google Scholar] [CrossRef] [Scilit]
- Ye, J.; Ahn, H.; Yu, Y.; Cho, J.-Y. Influence of rebar configuration and steel liner detailing on the local impact response of reinforced concrete panels. Int. J. Impact Eng. 2026, 208, 105554. [Google Scholar] [CrossRef] [Scilit]
- An, B.; Cho, P.; Shittu, R.A.; Kim, T.-Y.; Rostron, P.; AlFantazi, A.; Yi, Y. Effect of Temperature Gradient on Chloride Ion Diffusion in Nuclear Reactor Containment Building Concrete. Energies 2022, 15, 5581. [Google Scholar] [CrossRef] [Scilit]
- Thusa, B.; Nguyen, D.-D.; Azad, M.S.; Lee, T.-H. Seismic performance evaluation of reactor containment building considering effects of concrete material models and prestressing forces. Nucl. Eng. Technol. 2023, 55, 1567–1576. [Google Scholar] [CrossRef] [Scilit]
- Li, J.; Hu, Z. Systematic seismic simulation for nuclear island buildings in CPCRF site: Insights into interfacial discontinuity. Soil Dyn. Earthq. Eng. 2025, 191, 109221. [Google Scholar] [CrossRef] [Scilit]
- Feng, D.; Chu, M.; El Naggar, M.H.; Ren, Y.; Gong, W.; Dai, G.; Li, B.; Wang, Y. Seismic response of nuclear power plants on different foundations: Large-scale shake table tests. J. Build. Eng. 2025, 112, 113694. [Google Scholar] [CrossRef] [Scilit]
- GOST 26633:2015; Heavy-Weight and Sand Concretes. Specifications. Standartinform: Moscow, Russia, 2015.
- EN 206:2013+A2:2021; European Committee for Standardization (CEN). Concrete—Specification, Performance, Production and Conformity. CEN: Brussels, Belgium, 2021.
- Ikumi, T.; Cairó, I.; Boix-Cots, D.; Herrera-Mesén, C.; Aguado, A.; de la Fuente, A. Evaluating data transmission performance of a UHF sensor for wireless temperature monitoring in mass concrete. J. Infrastruct. Intell. Resil. 2025, 4, 100172. [Google Scholar] [CrossRef] [Scilit]
- Prasanna, W.G.J.; Subhashini, A.P.; Jayawardhana, A.M.C.C. Cracking due to Temperature Gradient in Concrete. Eng. J. Inst. Eng. Sri Lanka 2016, 43, 43–47. [Google Scholar] [CrossRef] [Scilit]
- Song, Z.; Wang, K. Case study on thermal conductivity-driven cooling optimization for mass concrete raft foundations in loess environments: Experimental and numerical validation. Case Stud. Therm. Eng. 2025, 74, 106938. [Google Scholar] [CrossRef] [Scilit]
- Hu, Y.; Chen, J.; Zou, F.; He, M.; Mao, J.; Liu, X.; Zhou, C.; Yuan, Z. A comparative study of temperature of mass concrete placed in August and November based on on-site measurement. Case Stud. Constr. Mater. 2021, 15, e00694. [Google Scholar] [CrossRef] [Scilit]
- Singh, M.P.; Sen, S.; Pathak, H.; Dogra, A.B. Early age cracking relevant to mass concrete dam structures during the construction schedule. Constr. Build. Mater. 2024, 411, 134739. [Google Scholar] [CrossRef] [Scilit]
- Godart, B.; Divet, L. Recommandations for Preventing Disorders Due to Delayed Ettringite Formation: Technical Guide; ResearchGate: Berlin, Germany, 2018. [Google Scholar]
- Bamforth, P.B. Control of Cracking Caused by Restrained Deformation in Concrete (CIRIA C766); Construction Industry Research and Information Association (CIRIA): London, UK, 2018. [Google Scholar]
- ACI Committee. Cement and Concrete Terminology (ACI 116R-00); American Concrete Institute: Farmington Hills, MI, USA, 2005; p. 73. [Google Scholar]
- Machado, A.M.L.; Babadopulos, L.F.d.A.L.; Cabral, A.E.B. Casting Plan for a Mass Concrete Foundation of a High-Rise Building for Avoiding DEF and Shrinkage Cracking. J. Build. Pathol. Rehabil. 2023, 8, 49. [Google Scholar] [CrossRef] [Scilit]
- Chiniforush, A.A.; Gharehchaei, M.; Nezhad, A.A.; Castel, A.; Moghaddam, F.; Keyte, L.; Hocking, D.; Foster, S. Minimising Risk of Early-Age Thermal Cracking and Delayed Ettringite Formation in Concrete—A Hybrid Numerical Simulation and Genetic Algorithm Mix Optimisation Approach. Constr. Build. Mater. 2021, 299, 124280. [Google Scholar] [CrossRef] [Scilit]
- Lin, F.; Li, H. Safety analysis of nuclear containment vessels subjected to strong earthquakes and subsequent tsunamis. Nucl. Eng. Technol. 2017, 49, 1079–1089. [Google Scholar] [CrossRef] [Scilit]
- Yang, K.-H.; Kwon, S.-J.; Hwang, J.-W.; Yoon, Y.-S. Temperature effect on strength and chloride migration in nuclear power plant concrete. Constr. Build. Mater. 2023, 405, 133345. [Google Scholar] [CrossRef] [Scilit]
- Liu, J.; Ou, G.; Qiu, Q.; Xing, F.; Tang, K.; Zeng, J. Atmospheric chloride deposition in field concrete at coastal region. Constr. Build. Mater. 2018, 190, 1015–1022. [Google Scholar] [CrossRef] [Scilit]
- Gao, Q.; Wang, T.; Zhao, T.; Zhang, Y.; Yue, X.; Guo, T.; Wu, S.; Ma, J. Macro-scale analysis of chloride penetration and durability in coastal concrete. J. Build. Eng. 2025, 113, 113953. [Google Scholar] [CrossRef] [Scilit]
- Chen, J.; Zhang, W.; Tang, Z.; Huang, Q. Experimental and numerical investigation of chloride-induced reinforcement corrosion and mortar cover cracking. Cem. Concr. Compos. 2020, 111, 103620. [Google Scholar] [CrossRef] [Scilit]
- Zhang, Y.N.; Wang, S.Q.; He, S.J.; Hao, X.W. Analysis of Factors Influencing the Temperature Field Variation in Mass Concrete During Hydration Heat Release. Case Stud. Therm. Eng. 2023, 52, 103737. [Google Scholar] [CrossRef] [Scilit]
- Tan, Y.W.; Tang, K.K. Modelling In Situ Concrete Temperature Development: The Impact of Ambient Temperature and GGBS Replacement. CivilEng 2024, 5, 694–716. [Google Scholar] [CrossRef] [Scilit]
- Aniskin, N.; Nguyen, T.C. Influence Factors on the Temperature Field in a Mass Concrete. E3S Web Conf. 2019, 97, 05021. [Google Scholar] [CrossRef] [Scilit]
- ACI Committee 207. Mass Concrete (ACI 207.1R-96); American Concrete Institute: Farmington Hills, MI, USA, 1996; pp. 29–37. [Google Scholar]
- ACI Committee 207. Effect of Restraint, Volume Change, and Reinforcement on Cracking in Massive Concrete (ACI 207.2R-95); American Concrete Institute: Farmington Hills, MI, USA, 1995; pp. 3–8. [Google Scholar]
- Riding, K.A.; Poole, J.L.; Schindler, A.K.; Juenger, M.C.G.; Folliard, K.J. Evaluation of Temperature Prediction Methods for Mass Concrete Members. ACI Mater. J. 2006, 103, 357–365. [Google Scholar] [CrossRef] [Scilit] [PubMed]
- Li, Y.; Nie, L.; Wang, B. A numerical simulation of the temperature cracking propagation process when pouring mass concrete. Autom. Constr. 2014, 37, 203–210. [Google Scholar] [CrossRef] [Scilit]
- Sargam, Y.; Faytarouni, M.; Riding, K.; Wang, K.; Jahren, C.; Shen, J. Predicting thermal performance of a mass concrete foundation—A field monitoring case study. Case Stud. Constr. Mater. 2019, 11, e00289. [Google Scholar] [CrossRef] [Scilit]
- Cai, Y.; Wang, F.; Zhao, Z.; Lyu, Z.; Wang, Y.; Zou, P. Early-Hydration Heat and Influencing Factor Analysis of Large-Volume Concrete Box Girder Based on Equivalent Age. Structures 2023, 50, 1699–1713. [Google Scholar] [CrossRef] [Scilit]
- Gawin, D.; Majorana, C.E.; Schrefler, B.A. Numerical Analysis of Hygro-Thermal Behaviour and Damage of Concrete at High Temperature. Mech. Cohesive-Frict. Mater. 1999, 4, 37–74. [Google Scholar] [CrossRef]
- Lawrence, A. A Finite Element Model for the Prediction of Thermal Stresses in Mass Concrete. Ph.D. Thesis, University of Florida, Gainesville, FL, USA, 2009. [Google Scholar]
- MIDAS Information Technology Co., Ltd. Midas Civil On-Line Manual-Civil Structure Design System. Available online: https://manual.midasuser.com/EN_Common/Civil/945/index.htm (accessed on 30 March 2024).
- Seo, Y. Heat of Hydration Analysis. Available online: https://www.midasstructure.com/blog/en/blog/heat-of-hydration-analysis (accessed on 19 April 2024).
- SIMULIA User Assistance. Heat Transfer. 2024. Available online: https://help.3ds.com/2024/English/DSSIMULIA_Established/SIMACAEANLRefMap/simaanl-c-heattransfer.htm?contextscope=all (accessed on 19 April 2024).
- Sheng, X.; Xiao, S.; Zheng, W.; Sun, H.; Yang, Y.; Ma, K. Experimental and Finite Element Investigations on Hydration Heat and Early Cracks in Massive Concrete Piers. Case Stud. Constr. Mater. 2023, 18, e01926. [Google Scholar] [CrossRef] [Scilit]
- De Amorim Coelho, N.; Pedroso, L.J.; Da Silva Rêgo, J.H.; Nepomuceno, A.A. Use of ANSYS for Thermal Analysis in Mass Concrete. J. Civ. Eng. Archit. 2014, 8, 860–868. [Google Scholar] [CrossRef] [Scilit]
- Mardmomen, S.; Chen, H.-L. Prediction of the Early Age Thermal Behavior of Mass Concrete Containing SCMs Using ANSYS. J. Therm. Anal. Calorim. 2023, 148, 7899–7917. [Google Scholar] [CrossRef] [Scilit]
- ConTech Analysis ApS. B4cast Software for Simulation of Temperatures & Stresses in Hardening Concrete; ConTech Analysis ApS: Lillerød, Denmark.
- Kang, Q.; Ding, J.-T.; Bai, Y.; Chen, B. A Simulation Analysis Method for Crack Resistance of Hydraulic Concrete Based on Temperature-Stress Test. Adv. Mater. Res. 2011, 391–392, 100–106. [Google Scholar] [CrossRef] [Scilit]
- Cervenka, V.; Cervenka, J.; Jendele, L.; Smilauer, V. ATENA Simulation of Crack Propagation in CONCRACK Benchmark. Eur. J. Environ. Civ. Eng. 2014, 18, 828–844. [Google Scholar] [CrossRef] [Scilit]
- Cervenka, J.; Cervenka, V.; Smilauer, V. Modelling of Crack Development in Young Concrete; International Association of Fracture Mechanics for Concrete and Concrete Structures: Toledo, Spain, 2013. [Google Scholar]
- Klemczak, B.; Smolana, A.; Jedrzejewska, A. Modeling of Heat and Mass Transfer in Cement-Based Materials during Cement Hydration—A Review. Energies 2024, 17, 2513. [Google Scholar] [CrossRef] [Scilit]
- Li, R.; Huang, Z.; Li, G.; Wu, X.; Yan, P. Study of the Conductive Heat Flux from Concrete to Liquid Nitrogen by Solving an Inverse Heat Conduction Problem. J. Loss Prev. Process Ind. 2017, 48, 48–54. [Google Scholar] [CrossRef] [Scilit]
- Długosz, A.; Pokorska, I.; Glinicki, M.A.; Jaskulski, R. Identification of Thermal Properties of Hardening Concrete by Means of Evolutionary Algorithms. Comput. Assist. Methods Eng. Sci. 2017, 24, 101–111. [Google Scholar] [CrossRef]
- Knor, G.; Jaskulski, R.; Glinicki, M.A.; Holnicki-Szulc, J. Numerical Identification of the Thermal Properties of Early Age Concrete Using Inverse Heat Transfer Problem. Heat Mass Transf. 2019, 55, 1215–1227. [Google Scholar] [CrossRef] [Scilit]
- Długosz, A.; Pokorska, I.; Jaskulski, R.; Glinicki, M.A. Evolutionary Identification Method for Determining Thermophysical Parameters of Hardening Concrete. Arch. Civ. Mech. Eng. 2021, 21, 35. [Google Scholar] [CrossRef] [Scilit]
- Lu, X.; Chen, B.; Tian, B.; Li, Y.; Lv, C.; Xiong, B. A new method for hydraulic mass concrete temperature control: Design and experiment. Constr. Build. Mater. 2021, 302, 124167. [Google Scholar] [CrossRef] [Scilit]
- Oyebisi, S.; Alomayri, T. Artificial intelligence-based prediction of strengths of slag-ash-based geopolymer concrete using deep neural networks. Constr. Build. Mater. 2023, 400, 132606. [Google Scholar] [CrossRef] [Scilit]
- Do, T.A.; Le, B.-A. Machine learning approach for predicting early-age thermal cracking potential in concrete bridge piers. Forces Mech. 2024, 17, 100297. [Google Scholar] [CrossRef] [Scilit]
- Wang, S.; Duan, J.; Zhang, Y.; He, S.; Hao, X. Optimization of Cooling System Parameters with Temperature Field of Mass Concrete During Hydration. Case Stud. Therm. Eng. 2024, 64, 105456. [Google Scholar] [CrossRef] [Scilit]
- Chen, Y.; Zhang, L.; Wang, Z. Influence of temperature rising inhibitor on temperature and cracking resistance of mass concrete. Constr. Build. Mater. 2020, 258, 120152. [Google Scholar] [CrossRef] [Scilit]
- El-Mir, A.; Assaad, J.J.; Nehme, S.G.; El-Hassan, H. Correlating strength and durability to time-temperature profiles of high-performance mass concrete. Case Stud. Constr. Mater. 2022, 16, e01055. [Google Scholar] [CrossRef] [Scilit]
- Cha, S.-L.; Jin, S.-S. Prediction of thermal stresses in mass concrete structures with experimental and analytical results. Constr. Build. Mater. 2020, 258, 120367. [Google Scholar] [CrossRef] [Scilit]
- Shen, D.; Liu, C. Research on thermal-humidity-force coupling characteristics of mass concrete structures under temperature control. Constr. Build. Mater. 2023, 381, 130542. [Google Scholar] [CrossRef] [Scilit]
- Incropera, F.P.; Dewitt, D.P.; Bergman, T.L.; Lavine, A.S. Fundamentals of Heat and Mass Transfer; John Wiley & Sons: Hoboken, NJ, USA, 2007. [Google Scholar]
- Xiong, J.; Cao, L.; Wang, D. VVER-1200 nuclear island raft foundation mass concrete construction and transient temperature field simulation analysis. In ICONE 30, Proceedings of the 30th International Conference on Nuclear Engineering, Kyoto, Japan, 21–26 May 2023; The Japan Society of Mechanical Engineers: Tokyo, Japan, 2023; p. 1902. [Google Scholar] [CrossRef] [Scilit]
- Boley, B.A.; Weiner, J.H. Theory of Thermal Stresses; John Wiley & Sons: Hoboken, NJ, USA, 1960. [Google Scholar]
- Carslaw, H.S.; Jaeger, J.C. Conduction of Heat in Solids, 2nd ed.; Oxford University Press: Oxford, UK, 1959. [Google Scholar]
- International Federation for Structural Concrete (fib). fib Model Code for Concrete Structures 2010; International Federation for Structural Concrete (fib): Lausanne, Switzerland, 2013. [Google Scholar]
- Bažant, Z.P. Mathematical Modeling of Creep and Shrinkage of Concrete; John Wiley & Sons: Hoboken, NJ, USA, 1988. [Google Scholar]
- ACI Committee 209. Prediction of Creep, Shrinkage, and Temperature Effects in Concrete Structures (ACI 209R-92); American Concrete Institute: Farmington Hills, MI, USA, 2008. [Google Scholar]
- Mihashi, H.; Wittmann, F.H. Stochastic Approach to Study the Influence of Rate of Loading on Strength of Concrete; Heron: Delft, The Netherlands, 1980; Volume 25, pp. 1–54. [Google Scholar]
- GB/T 51028-2015; Technical Code for Temperature Monitoring and Control of Mass Concrete. Ministry of Housing and Urban-Rural Development of the People’s Republic of China (MOHURD), China Architecture & Building Press: Beijing, China, 2015.
- DL/T 5150-2017; National Energy Administration. Test Code for Hydraulic Concrete. China Electric Power Press: Beijing, China, 2017.
- GB/T 50081-2019; General Administration of Market Regulation & Standardization Administration of China. Standard for Test Methods of Concrete Physical Properties. China Architecture & Building Press: Beijing, China, 2019.
- GB 50496-2018; Ministry of Housing and Urban-Rural Development of China. Code for Construction of Mass Concrete. China Architecture & Building Press: Beijing, China, 2018.
- Wang, T. Crack Control of Engineering Structures, 2nd ed.; China Architecture & Building Press: Beijing, China, 2017; pp. 104–106. [Google Scholar]













Disclaimer/Publisher’s Note: The statements, opinions and data contained in all publications are solely those of the individual author(s) and contributor(s) and not of MDPI and/or the editor(s). MDPI and/or the editor(s) disclaim responsibility for any injury to people or property resulting from any ideas, methods, instructions or products referred to in the content. |
© 2026 by the authors. Licensee MDPI, Basel, Switzerland. This article is an open access article distributed under the terms and conditions of the Creative Commons Attribution (CC BY) license.