


Abstract
The purpose of this study was to evaluate the potential safety hazards pertaining to the overall inclination of existing masonry structures. Taking a six-story masonry residential building in Tongling as the research subject, we established a systematic safety assessment framework. Through structural entity testing, settlement monitoring, and geological surveys, uneven foundation settlement was identified as the primary cause of the building’s inclination. A finite element model was established via SAP2000 (Version 14) software to examine and verify the bearing capacity and seismic performance of the inclined structure, and a 1:4 scale shaking table test was designed to validate the seismic performance of the structure following inclination correction. The findings indicate that the primary bearing capacity of the building’s superstructure complied with the relevant code provisions. Time–history analysis under rare six-degree earthquake conditions showed that the maximum inter-story drift angle—defined as the ratio of the maximum inter-floor horizontal displacement to the floor height under the action of the standard seismic value—was 1/2018, which is lower than the limit value of 1/900 specified for the “moderate damage” performance level of masonry structures. During the shaking table test, the natural vibration frequency of the structure remained unchanged under earthquake actions ranging from frequent to rare six-degree events, with no visible cracks or significant damage detected. This assessment system provides a technical reference for the safety performance evaluation and subsequent inclination correction of similar inclined masonry structures.
1. Introduction
A large number of the residential buildings in our country have been in use for over 20 years. Due to factors such as uneven foundation settlement, aging building materials, and the increase in seismic standards, structural safety hazards are becoming increasingly prominent. The tilting of buildings is of particular concern, as it not only affects the normal use of the buildings, but in severe cases, it may also lead to structural instability and even collapse. Therefore, the field of engineering has begun to place increasing emphasis on assessing the safety and handling of such buildings.
Uneven foundation settlement is the main cause of the inclination of masonry structures. When the settlement of the foundation exceeds the allowable range specified by the code, it is likely to lead to the redistribution of internal forces in the upper structure, resulting in cracks, deformations, and other signs of wear [1]. Without timely intervention, it will exacerbate the damage. Numerous scholars both at home and abroad have studied this phenomenon: Abascal and Dominguez [2] solved the impedance function of the foundation on layered heterogeneous soil; Hara [3] studied the stress distribution and ultimate strength of reinforced concrete structures under uneven settlement of columns; and Jia Qiang [4] and Du Yongfeng [5] each studied the impact of uneven foundation settlement on the safety and seismic performance of the upper structure.
Engineering practice has shown that some masonry buildings have relatively good overall stability, even though their inclination angles have exceeded the limit values stipulated in the “Code for Design of Foundation of Buildings” (GB 50007-2011) [6], and the upper structures show little to no evidence of cracking. However, traditional evaluations often classify them as grade C (local danger) or grade D (overall danger), which can easily lead to excessive reinforcement or demolition. Therefore, it is important to assess the actual safety status of such buildings through scientific means and restore their functions using corrective technologies to ensure public safety and ensure that existing structures can continue to be used effectively. Internationally, buildings like the Leaning Tower of Pisa and the Trantskon Grain Storage in Canada have been safely restored using corrective technologies [7]. Domestically, corrective technologies have also matured over time. Shandong University of Architecture proposed the excavation and water filling corrective method [8]; Pingyang [9] analyzed the influence laws of multiple factors on the effect of horizontal excavation corrective technology through engineering examples and numerical simulations.
In view of this, this paper takes a tilted masonry residential building in the Tongling area as the research object. The whole building tilts northwards, and the horizontal displacement and inclination rate exceed the limit values specified by the norms. In accordance with the prescribed regulations, the building should be subject to reconstruction or be promptly disposed of via alternative approaches. However, the upper structure is basically undamaged. Traditional assessment methods struggle to determine its safety performance and seismic performance, and a systematic assessment system is sorely needed.
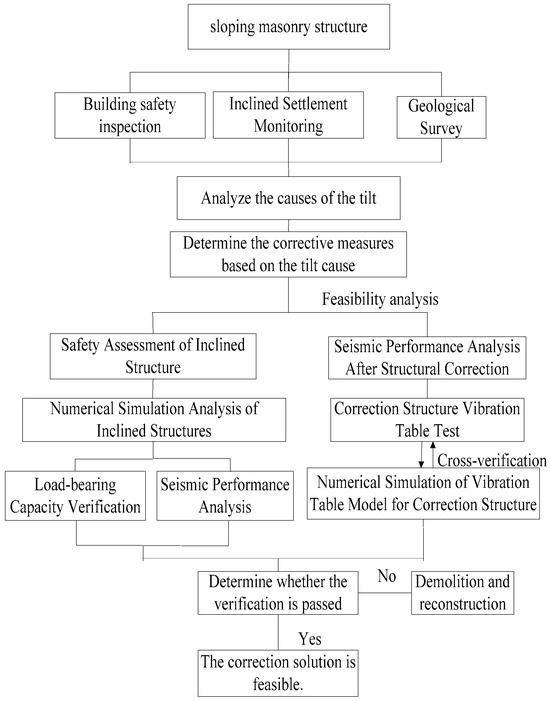
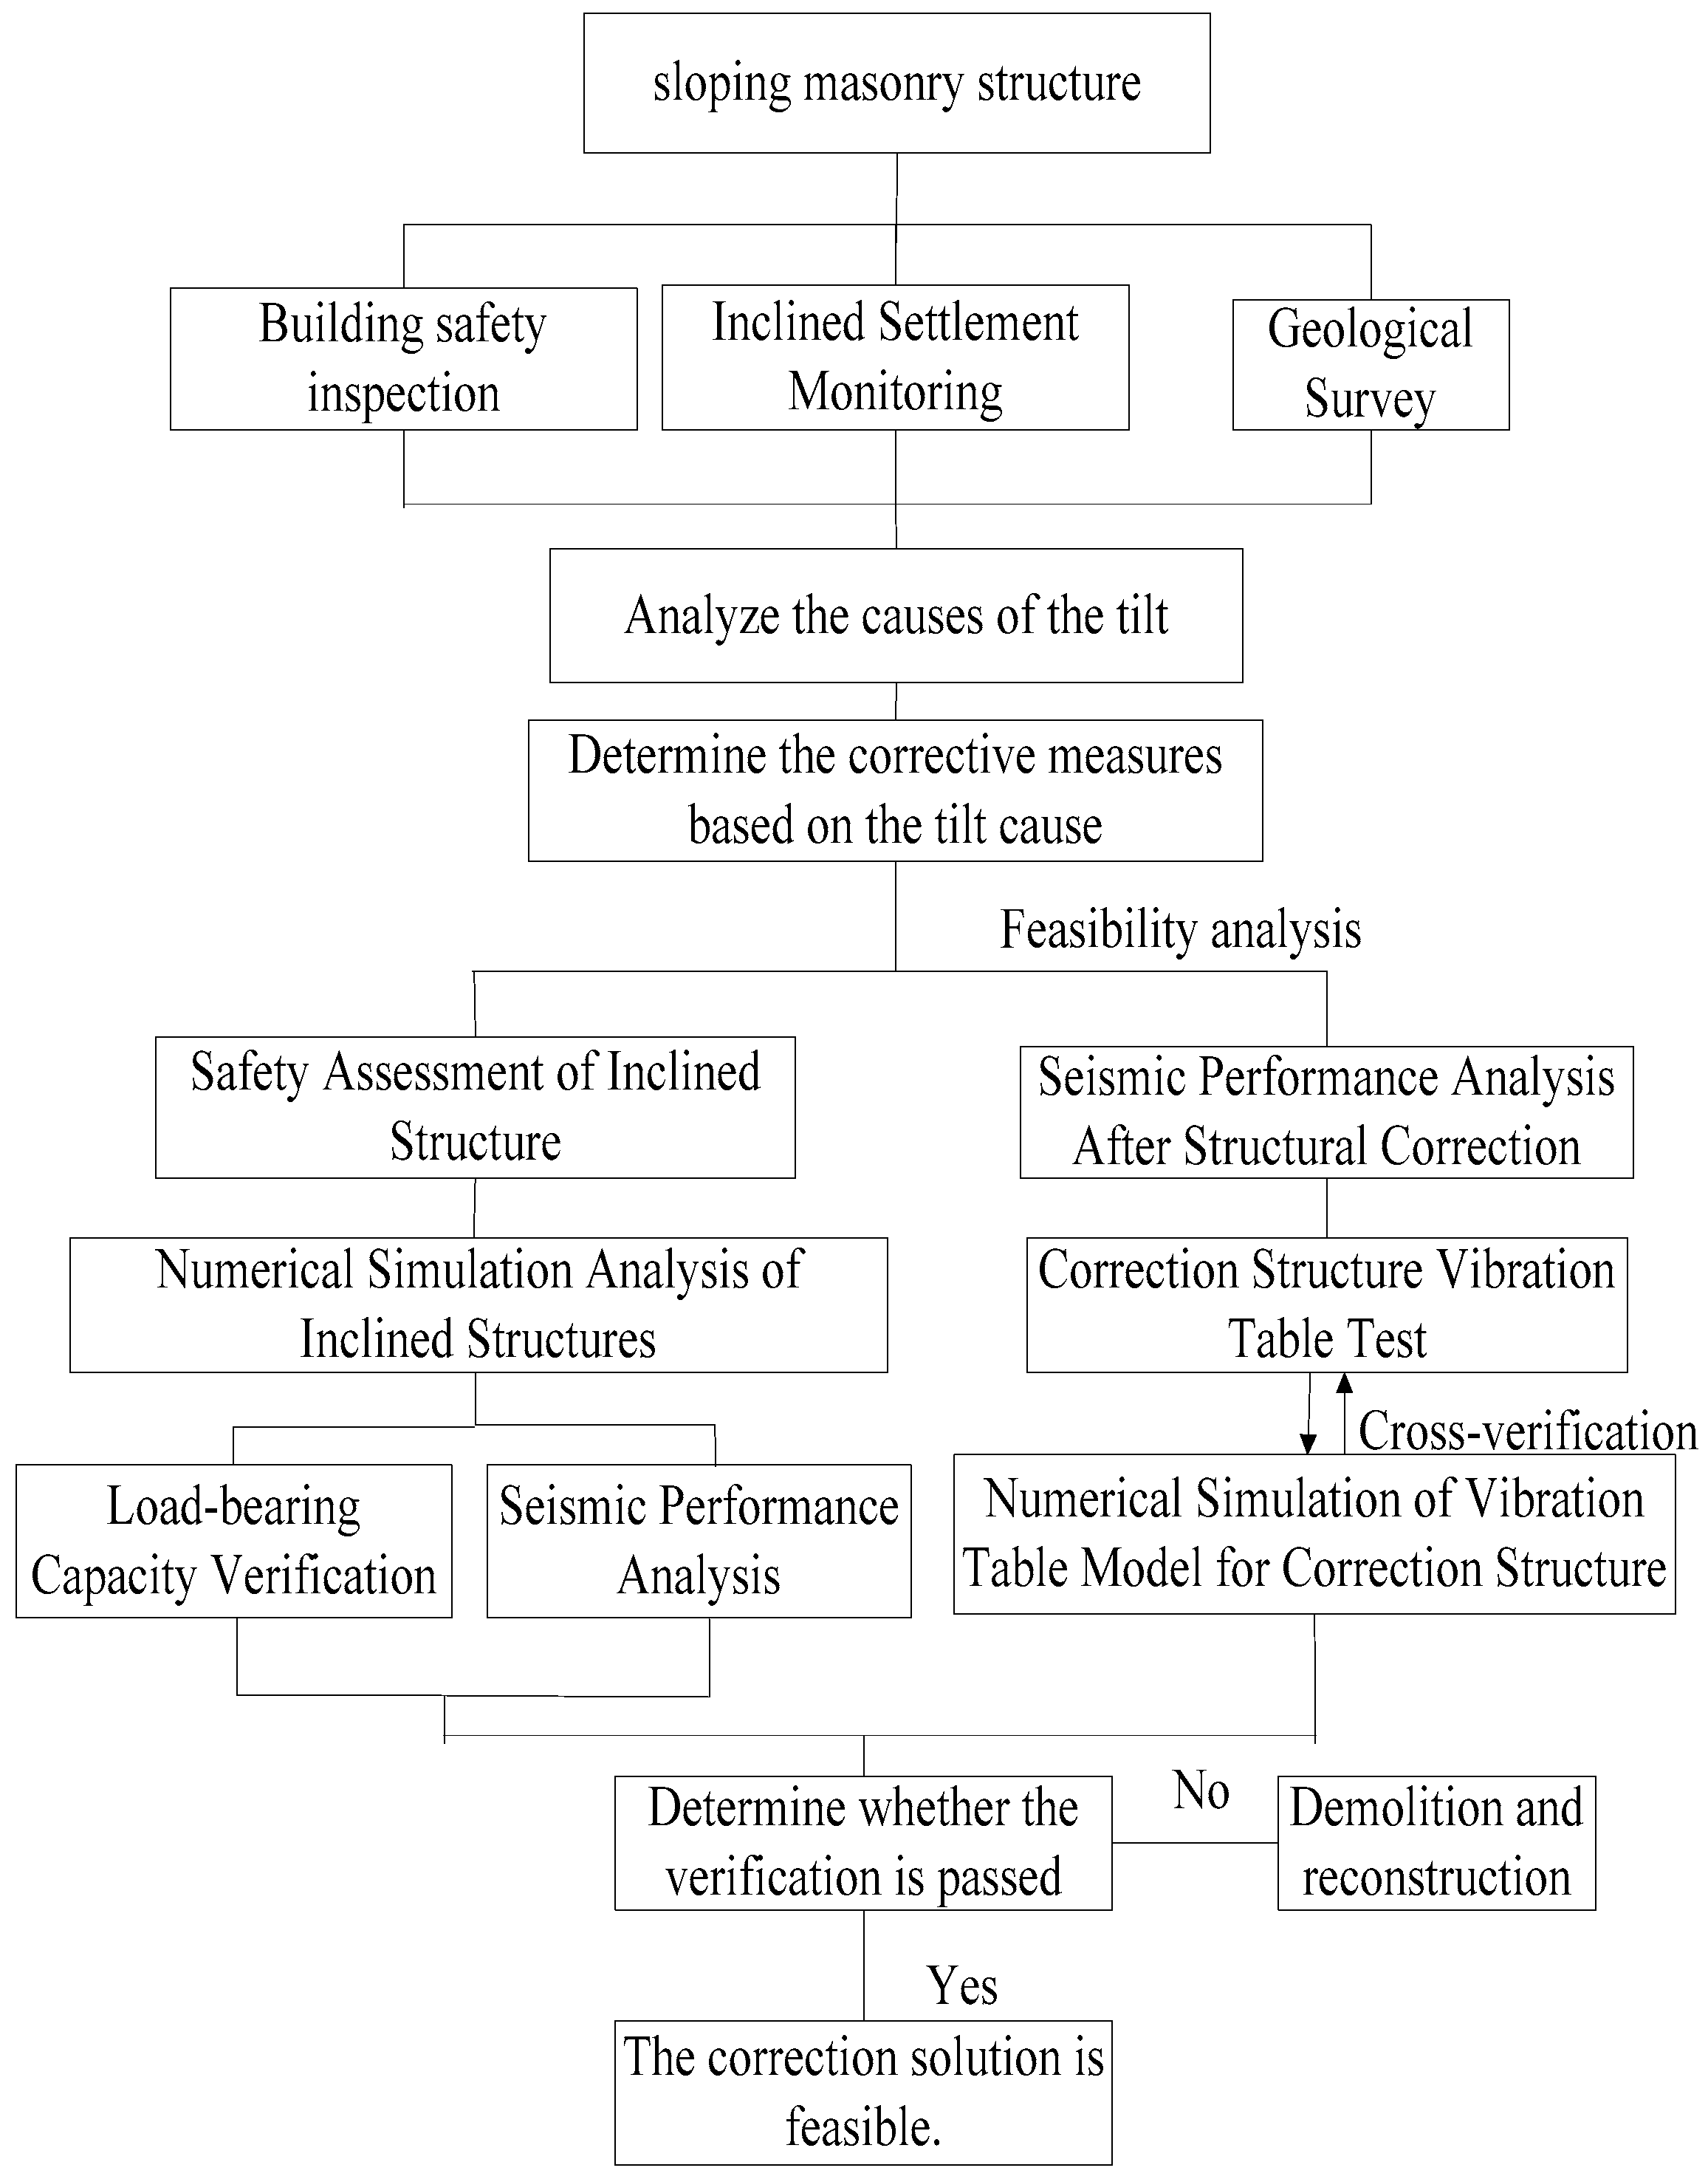
For this building, the cause of its tilting was initially ascertained via on-site geological surveys and structural inspections. On the premise that the primary structure retained sound structural integrity, the subsequent corrective measures were defined. Numerical simulations were performed to assess the load-bearing capacity and seismic performance of the tilted structure, which was subsequently complemented by vibration tests on the revised design to evaluate its seismic resistance capability. A comparison between the finite element analysis (FEA) results of the rectified building and the shaking table test outcomes indirectly verified the accuracy of the numerical analysis methodology. For further details, refer to Figure 1. This study seeks to elaborate on seismic performance evaluation methodologies for tilted buildings, thereby providing theoretical support for their reinforcement and technical references for the safety assessment and restoration of analogous structures.
Figure 1.
Research methodology.
2. Engineering Status
2.1. Engineering Overview
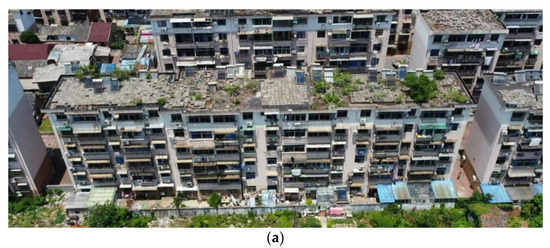
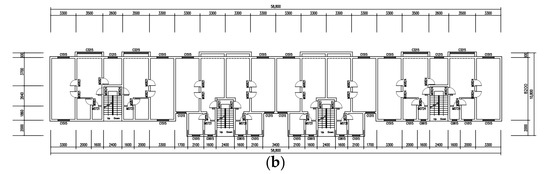
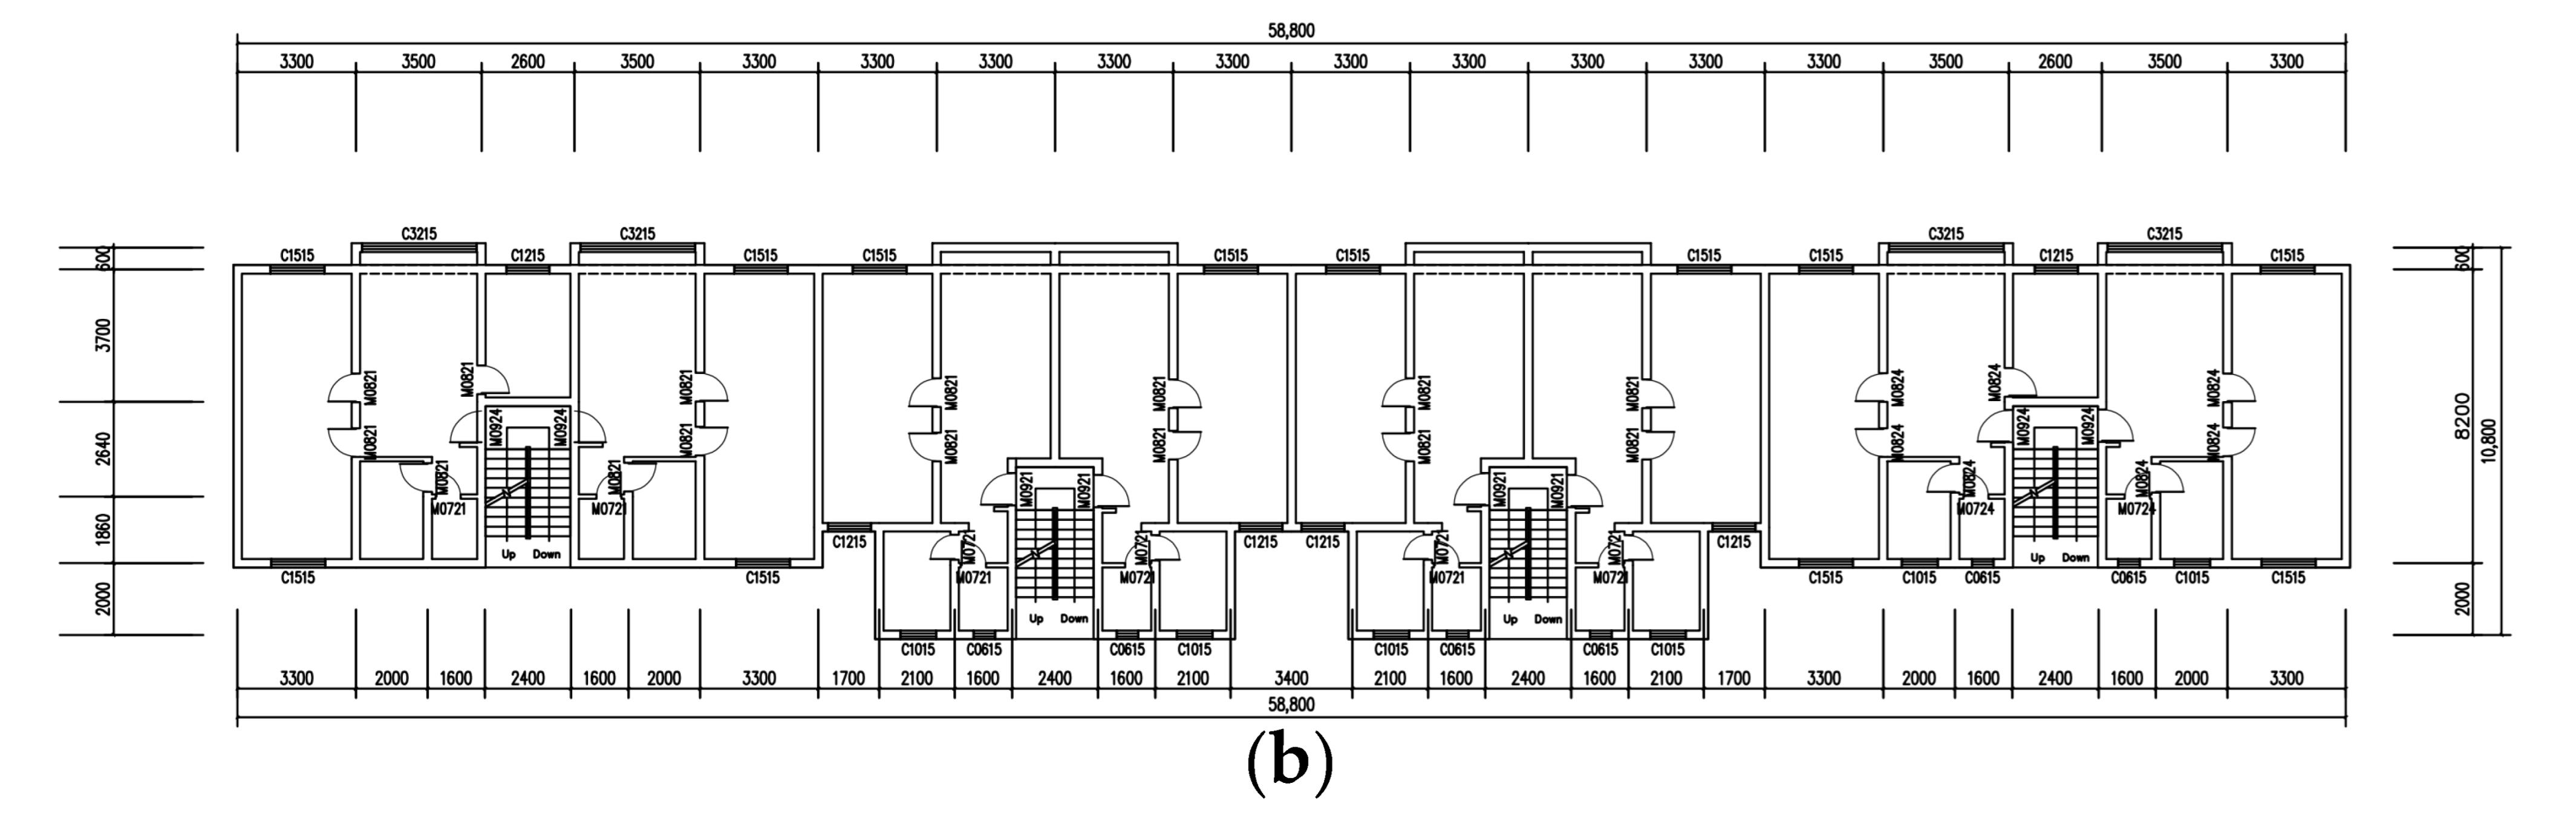
A six-story masonry residential building in Tongling City was constructed in 1998, with plan dimensions of 58.8 m × 10.7 m and a total building height of 16.8 m. Each story has a uniform floor height of 2.8 m, as illustrated in Figure 2. The main load-bearing walls are made of MU10 fired clay bricks. The mortar strength grades are as follows: M7.5 for the first and second stories, M5.0 for the third to fifth stories, and M2.5 for the sixth story. Each story is equipped with closed-ring beams and structural columns. The seismic fortification intensity is 6 degrees, with a basic design ground acceleration of 0.05 g. Currently, the building exhibits an overall northward inclination, with no noticeable tilting observed in the east–west direction.
Figure 2.
Engineering Information. (a) Building aerial view; (b) building floor plan.
2.2. On-Site Inspection and Superstructure Calculation Verification
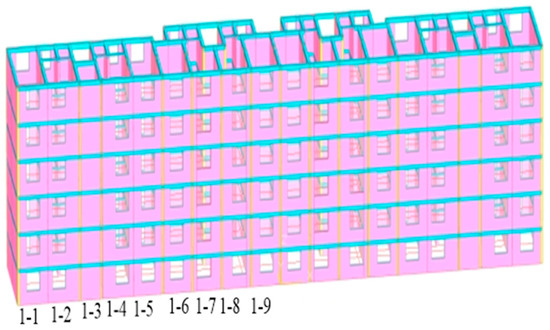
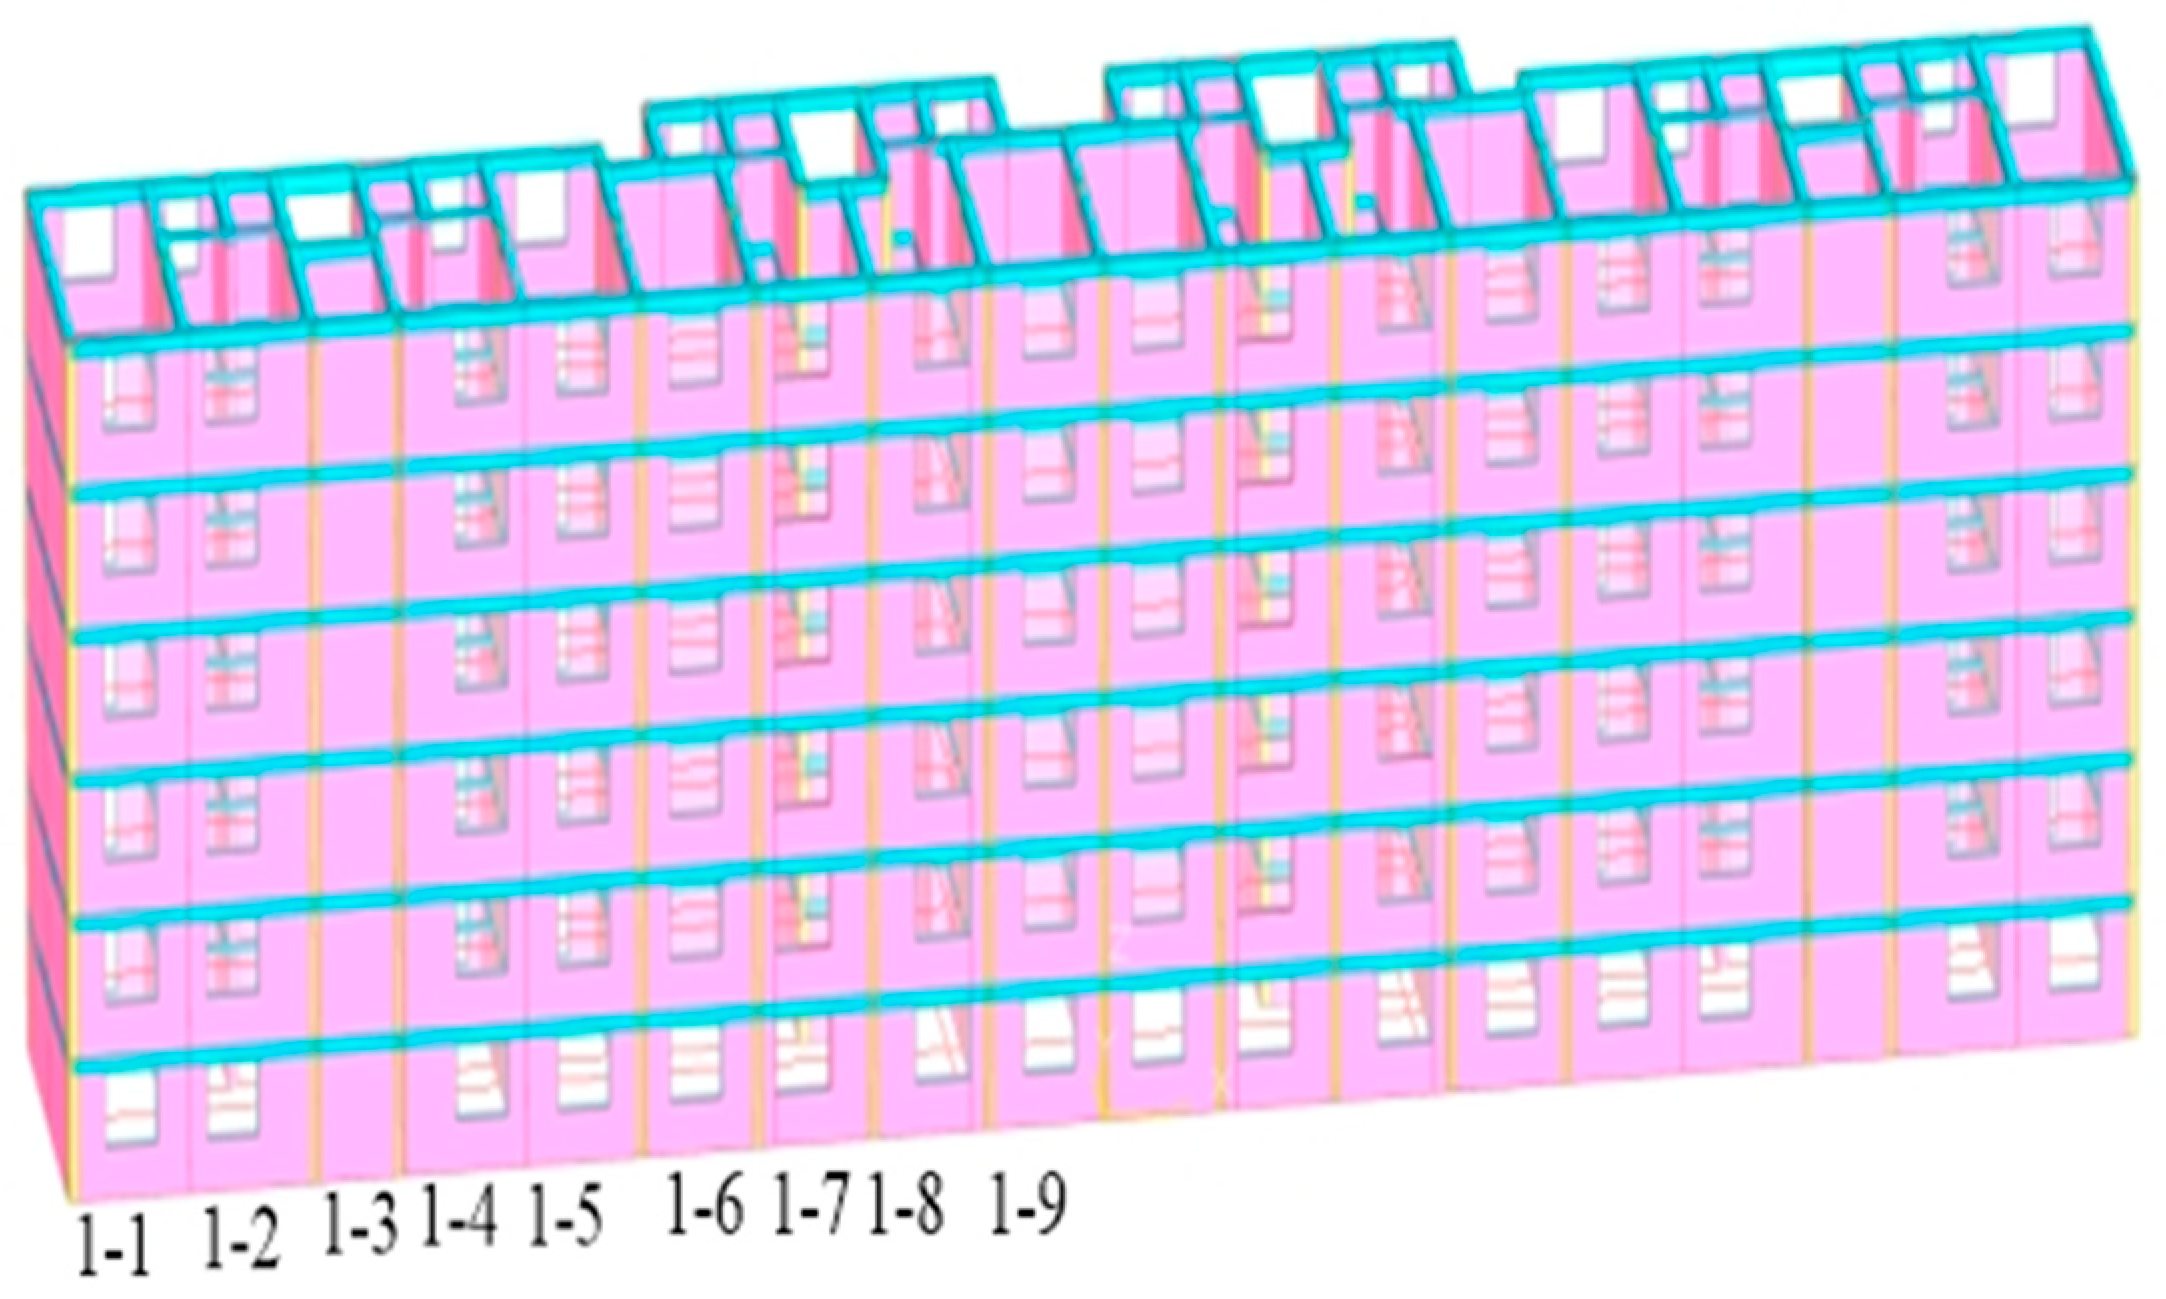
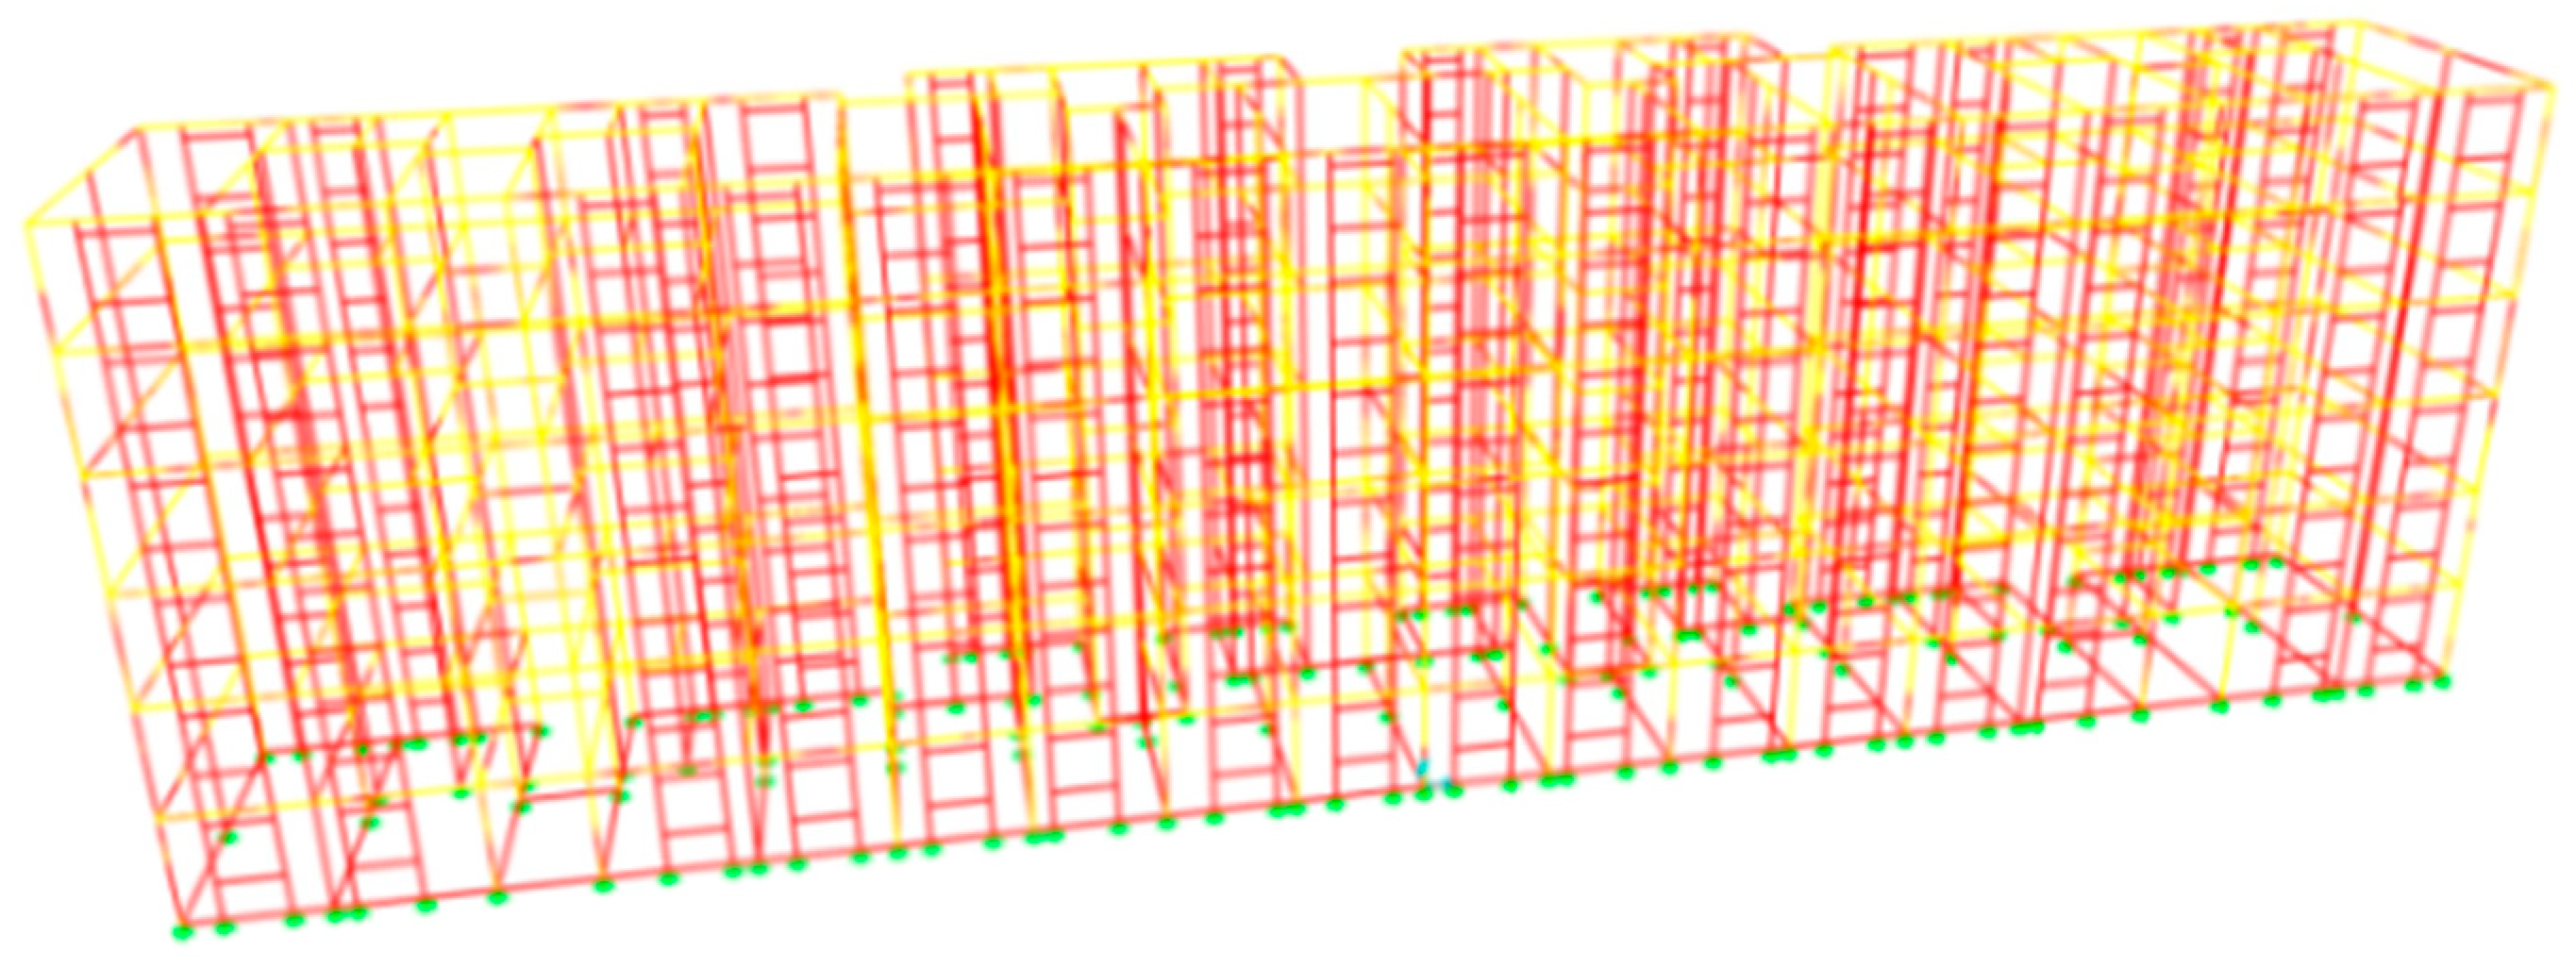
On-site verification indicates that the structural system’s integrity, component connections, detailing, and non-structural elements all comply with code requirements. The damage is limited to surface plaster cracks, with no structural cracks observed. Using YJK (version 6.1) software (3D model shown in Figure 3) and in accordance with the “Load Code for the Design of Building Structures” (GB 50009-2012) [10] and the “Standard for Appraisal of Reliability of Civil Buildings” (GB 50292-2015) [11], the load-bearing capacity of the superstructure was verified. The results confirm that the structure meets the necessary safety requirements.
Figure 3.
A 3D model of residential building in YJK.
Deformation monitoring indicates that the building tilts northward at a rate of approximately 2‰ (exceeding the allowable limit of 0.004 specified in the “Code for Design of Building Foundations” GB 50007-2011 [6]), with a horizontal displacement at the apex of 343.8 mm (exceeding the limits of H/250 or 90 mm set by the “Standard for Appraisal of Reliability of Civil Buildings” GB 50292-2015 [11]). After 12 months of continuous monitoring, the overall settlement was found to be uniform and minimal, with an average settlement rate of 0.0004 mm/day. The lateral displacement variation was also minor, with an average rate of 0.012 mm/day. The structural deformation has stabilized, and there is no risk of abrupt or significant deformation.
A geotechnical investigation revealed a plastic silty clay layer on the south side, which is absent on the north side. Additionally, the slope of the soil layer interface exceeds 10°, revealing that the site has an uneven foundation. According to an analysis of the original concealed works acceptance records, the primary cause of the building’s uneven settlement and tilt is the differential soil layer beneath the northern and southern sides of the foundation. Under equal vertical loading, this disparity led to differential settlement of the foundation, which was deemed to be the cause of the tilt.
In summary, the overall structural integrity of the building is sound, with no significant damage observed in the superstructure, aside from the tilt angle exceeding permissible limits. If the conventional assessment criteria were applied, this structure would be classified as Grade C or D; however, in this instance, opting for demolition and reconstruction would be a significant waste of resources. Therefore, rectification via tilt correction is proposed as an alternative. The subsequent sections will numerically simulate the load-bearing capacity and seismic performance of the tilted structure to validate its safety and seismic resistance in the untreated tilted state. Furthermore, shaking table tests will be designed to verify the seismic performance of the structure post-rectification. The feasibility of the tilt correction treatment will be evaluated through these analyses, providing technical guidance for the subsequent rectification process.
3. Numerical Simulation Analysis
3.1. Modeling Strategy
3.1.1. Modeling Software and Model Parameters
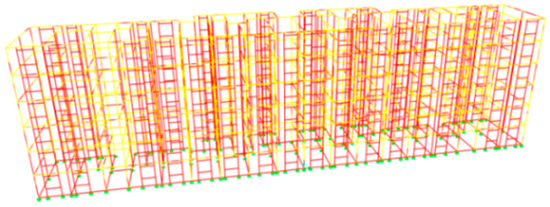
A nonlinear analysis of the tilted structure was performed via the SAP2000 software, with its three-dimensional numerical model presented in Figure 4. Within the SAP2000 environment, four-node thin-shell elements were employed to simulate masonry walls, whereas membrane elements were adopted for the modeling of floor slabs. These elements possess solely in-plane stiffness and are configured to resist membrane forces. Ring beams and structural columns were modeled using frame elements—a linear element type endowed with the capacity to withstand bending, torsion, and axial deformations. The assumption of zero relative slippage between adjacent floors not only eliminates the potential for horizontal displacement at interstory connections but also contributes to the conservation of computational resources [12]. Since masonry structures are discrete two-phase composite materials consisting of inelastic mortar and isotropic elastic blocks, an isotropic homogenized continuum model was adopted for equivalent treatment during modeling. Scholars have verified the feasibility of this method, wherein relevant studies adopting macro-modeling techniques have successfully investigated the seismic responses of various types of brick-stone structures [13,14]. The elastic modulus of the masonry was determined in accordance with the formulas specified in the Code for Design of Masonry Structures (Chinese National Standard GB 50003-2011), as expressed in Equations (1) and (2) [15]. For the value of Poisson’s ratio (υ) for masonry, we referred to multiple experimental and data analysis results published by relevant scholars, leading to the adoption of υ = 0.15 [16,17].
Figure 4.
The finite element model of SAP2000.
In the formula, fm denotes the average compressive strength of the masonry; f1 and f2 represent the average compressive strengths of bricks and masonry mortar, respectively; k1 is a parameter related to the type of masonry block, typically set at 0.78; k2 is the masonry strength correction factor, set at 1; and α is set at 0.5.
3.1.2. Model Accuracy Verification
To verify the reliability of the finite element model, we compared the parameters of the non-tilted SAP2000 model with those of the YJK model. Since the first two vibration modes in the Y-direction (north–south) contributed 94.12% of the total mass participation, only their modal periods were compared. The errors in mass and modal periods are summarized in Table 1. The mass error between the SAP2000 and YJK models was 0.066%, while the errors for the first two modal periods were 4.44% and 9.21%, respectively. All of the values fell within acceptable limits, confirming the accuracy of the SAP2000 model.
Table 1.
Bearing capacity evaluation table of wall along axis A on the first floor.
3.2. Static Load-Bearing Capacity Analysis
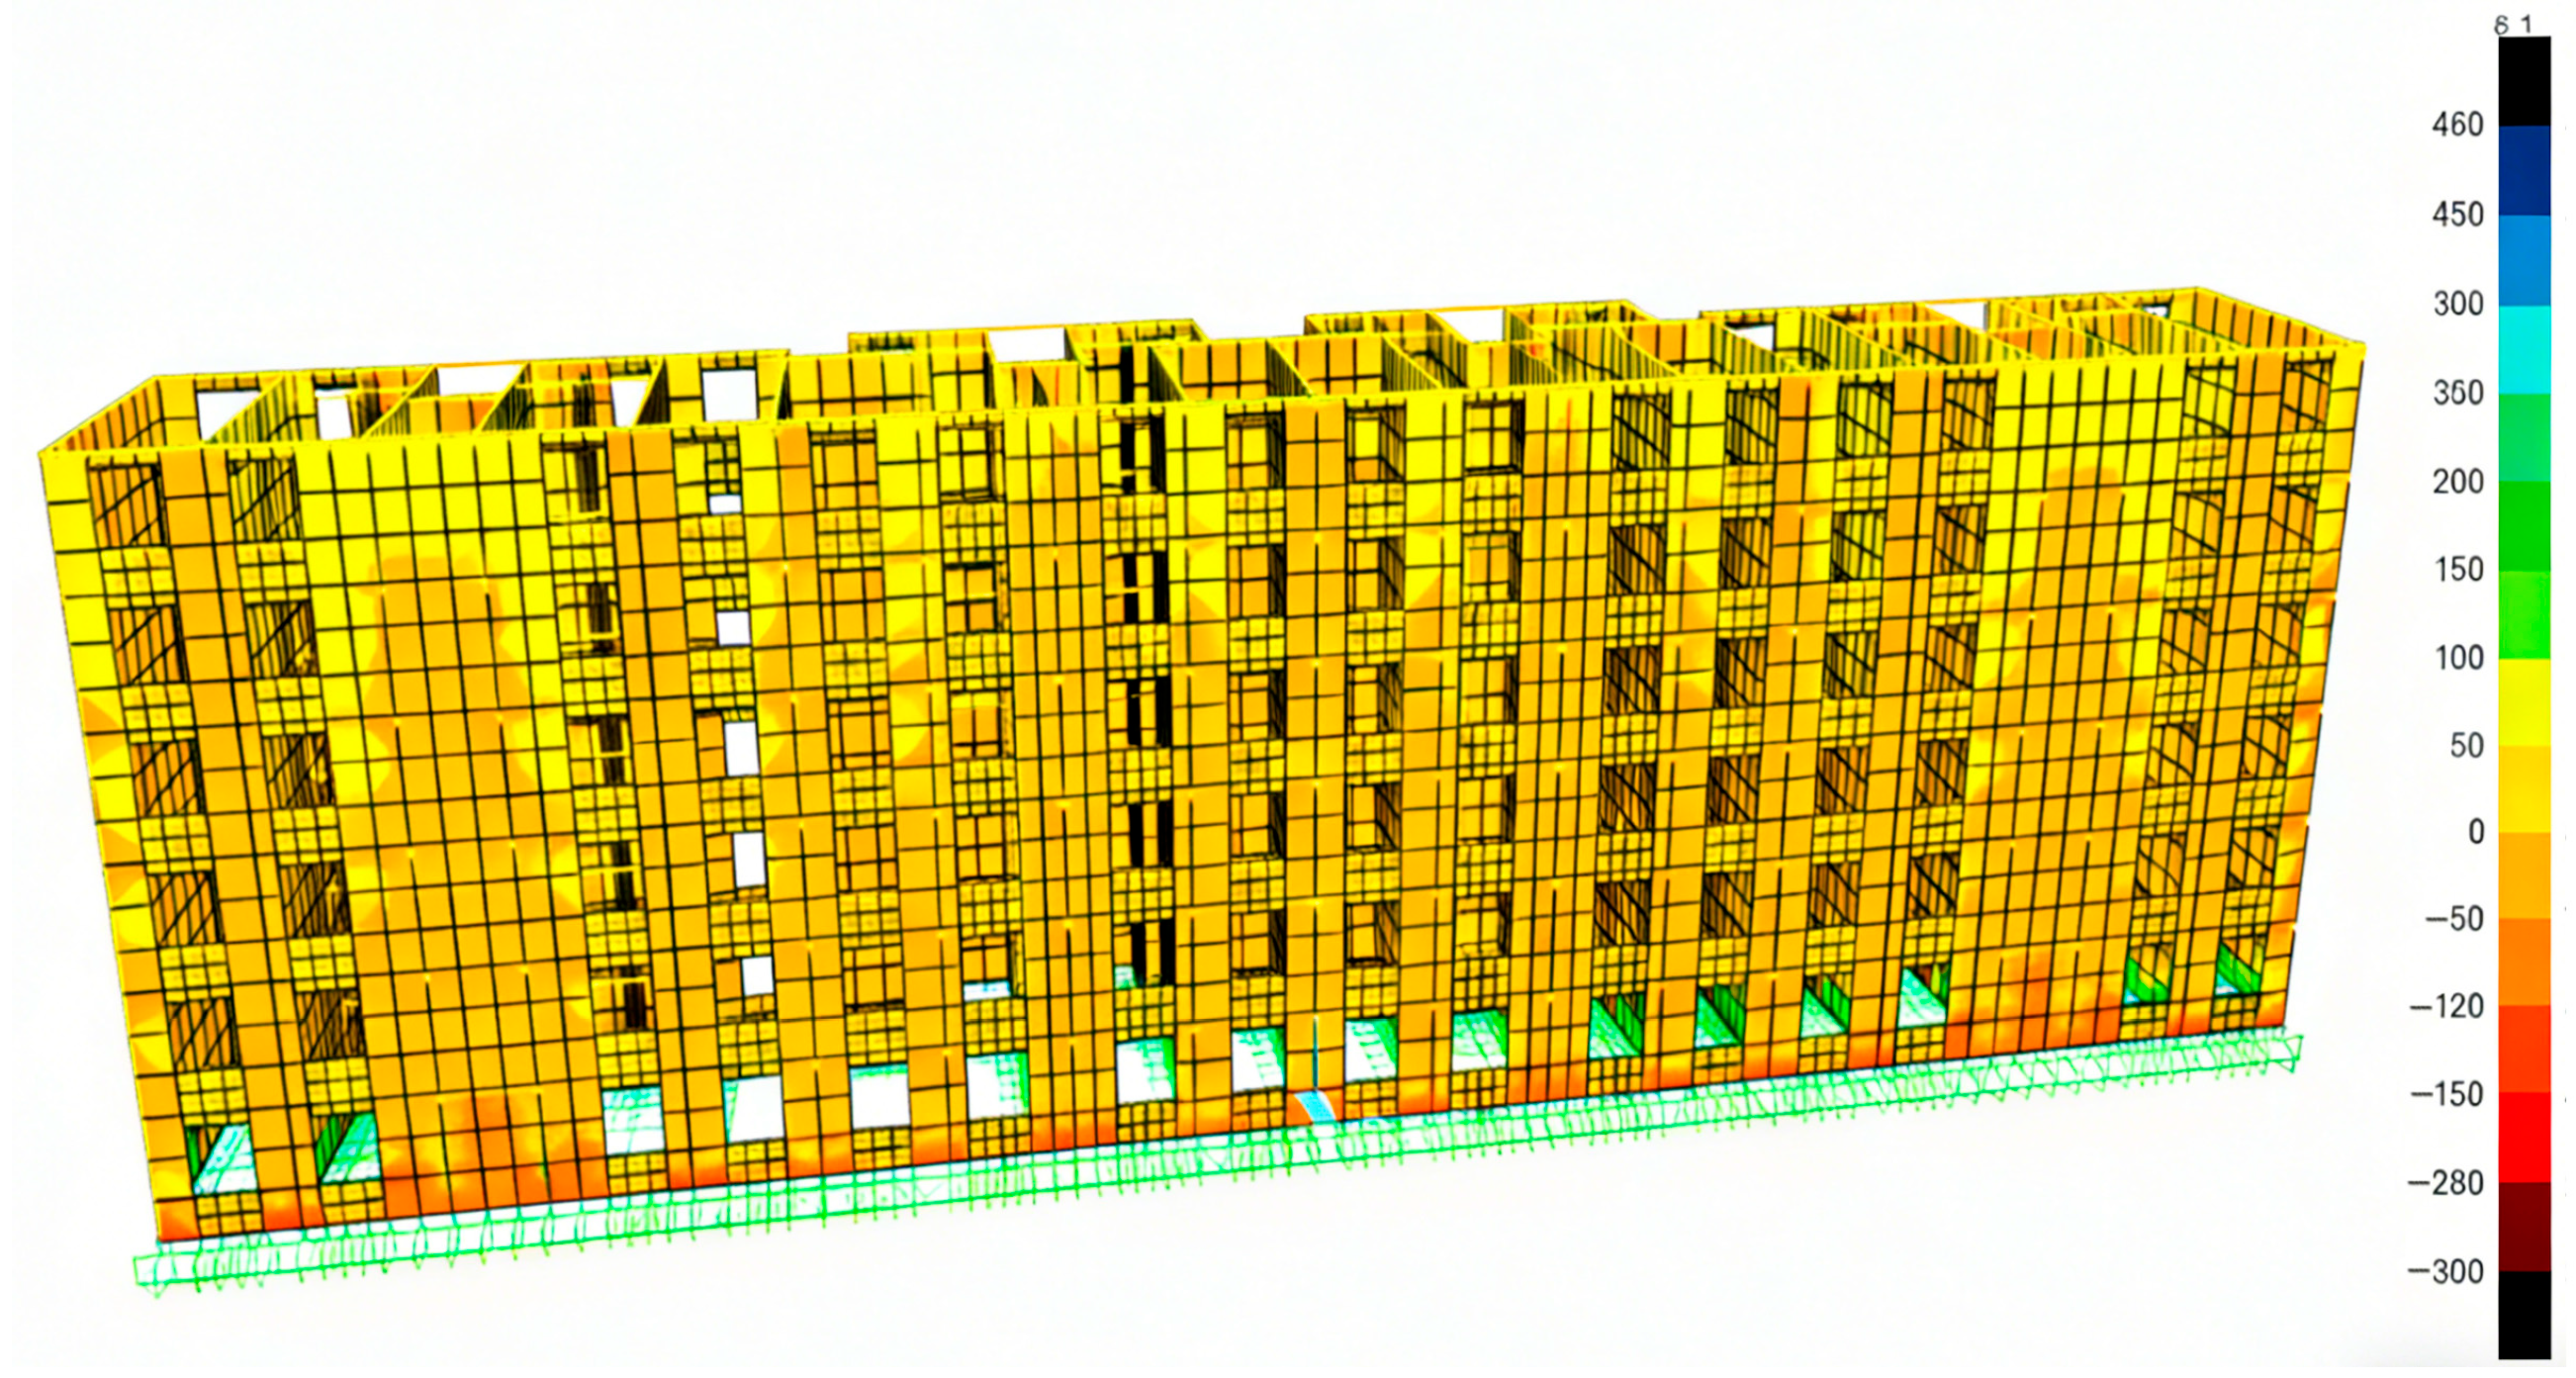
A tilted structural model was established, with the tilt direction oriented from axis A to axis F, resulting in a structural tilt angle of 2% in the Y-direction. Vertical loading was considered to examine the stress on key components and to evaluate and rate the load-bearing capacity of the primary structural members. The structural effects were calculated using the fundamental load combination of the sum of 1.2 times the dead load and 1.4 times the live load. A simplified wall numbering diagram is shown in Figure 3. The overall structural stress contour plot is presented in Figure 5.
Figure 5.
Stress contour of the overall structure (Unit: N/mm2).
As shown in Figure 5, the ground-floor walls had relatively higher stress concentrations than other floors, with high-stress areas concentrated near the base of the first-story wall piers. Due to structural symmetry, half of the structure was selected for analysis. The vertical axial forces in the wall piers were extracted, and the load-bearing capacity was assessed based on the ratio of resistance to effect. Due to space constraints, the evaluation results for the first-story walls along Axis A are presented as an example in Table 1. The load-bearing capacity of all masonry walls meets the AU grade.
In Table 1, Component Numbering corresponds to the numbering scheme adopted for the masonry walls, with the corresponding walls explicitly illustrated in Figure 3. Structural Resistance R (kN) denotes the load-bearing capacity of a structure or its individual components to resist applied actions. Structural Effect S (kN) represents the internal forces induced within a structure or its components by external actions, including mechanical loads and temperature fluctuations. γ0 denotes the structural importance coefficient, which may also be interpreted as a safety factor. Rating Grade refers to the safety classification level assigned to the structure or its individual components. The designation au indicates that the component remains structurally intact, the applied loads are clearly defined, and no safety hazards are present.
3.3. Seismic Performance Analysis
3.3.1. Performance-Level Classification Criteria and Evaluation Indicators for Masonry Structures
Based on the three-level seismic fortification objectives of “no damage under minor earthquakes, repairable under moderate earthquakes, and no collapse under major earthquakes” specified in the Code for Seismic Design of Buildings (GB 50011-2016) [18], and referring to the performance-level classification criteria established by domestic and international institutions [19], the inter-story drift angle thresholds for masonry structures were determined via statistical analysis of experimental data. The overall structural performance was also taken into consideration, and differences in displacement angles between the two types of walls were disregarded. Institutions such as Xi’an University of Architecture and Technology and Southwest Jiaotong University ultimately defined 1/2500, 1/900, and 1/250 as the inter-story drift angles corresponding to normal use, moderate damage, and life safety, respectively, for masonry structures [20].
3.3.2. Selection and Loading of Seismic Waves
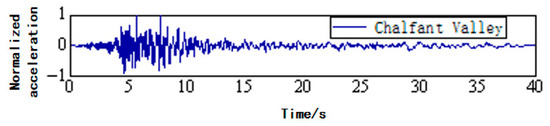
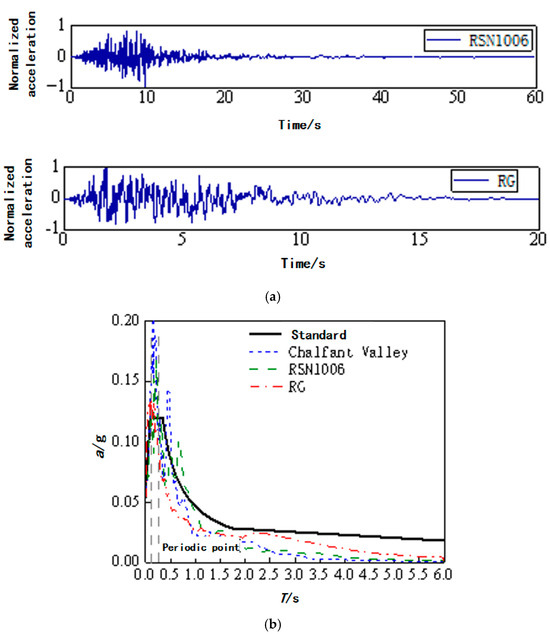
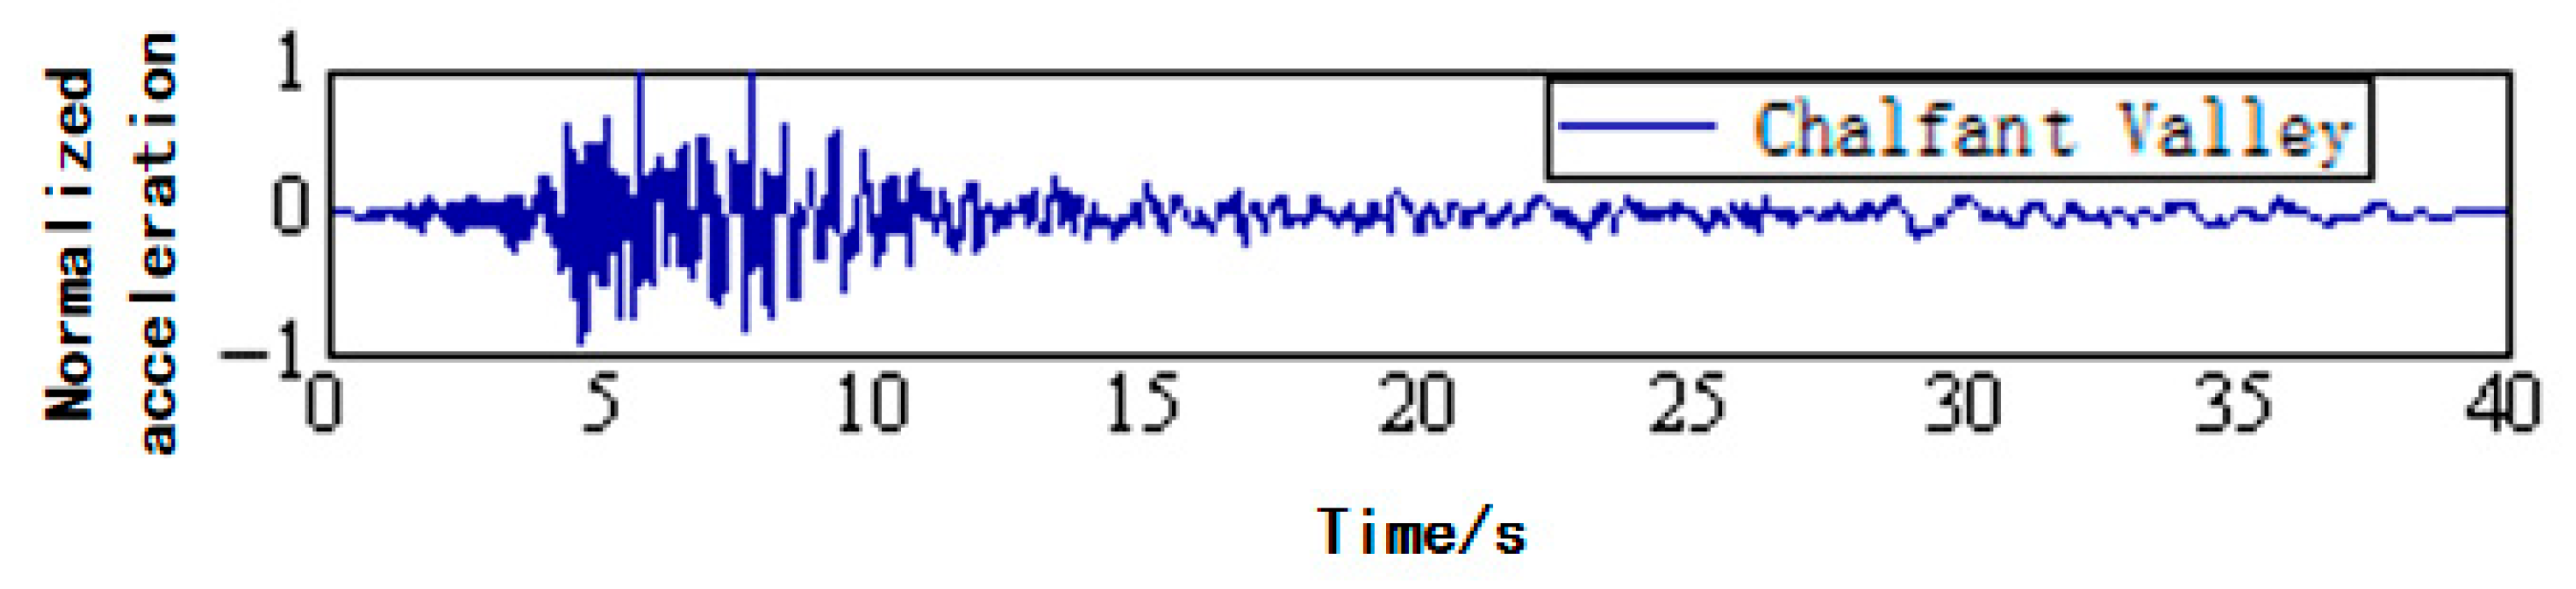
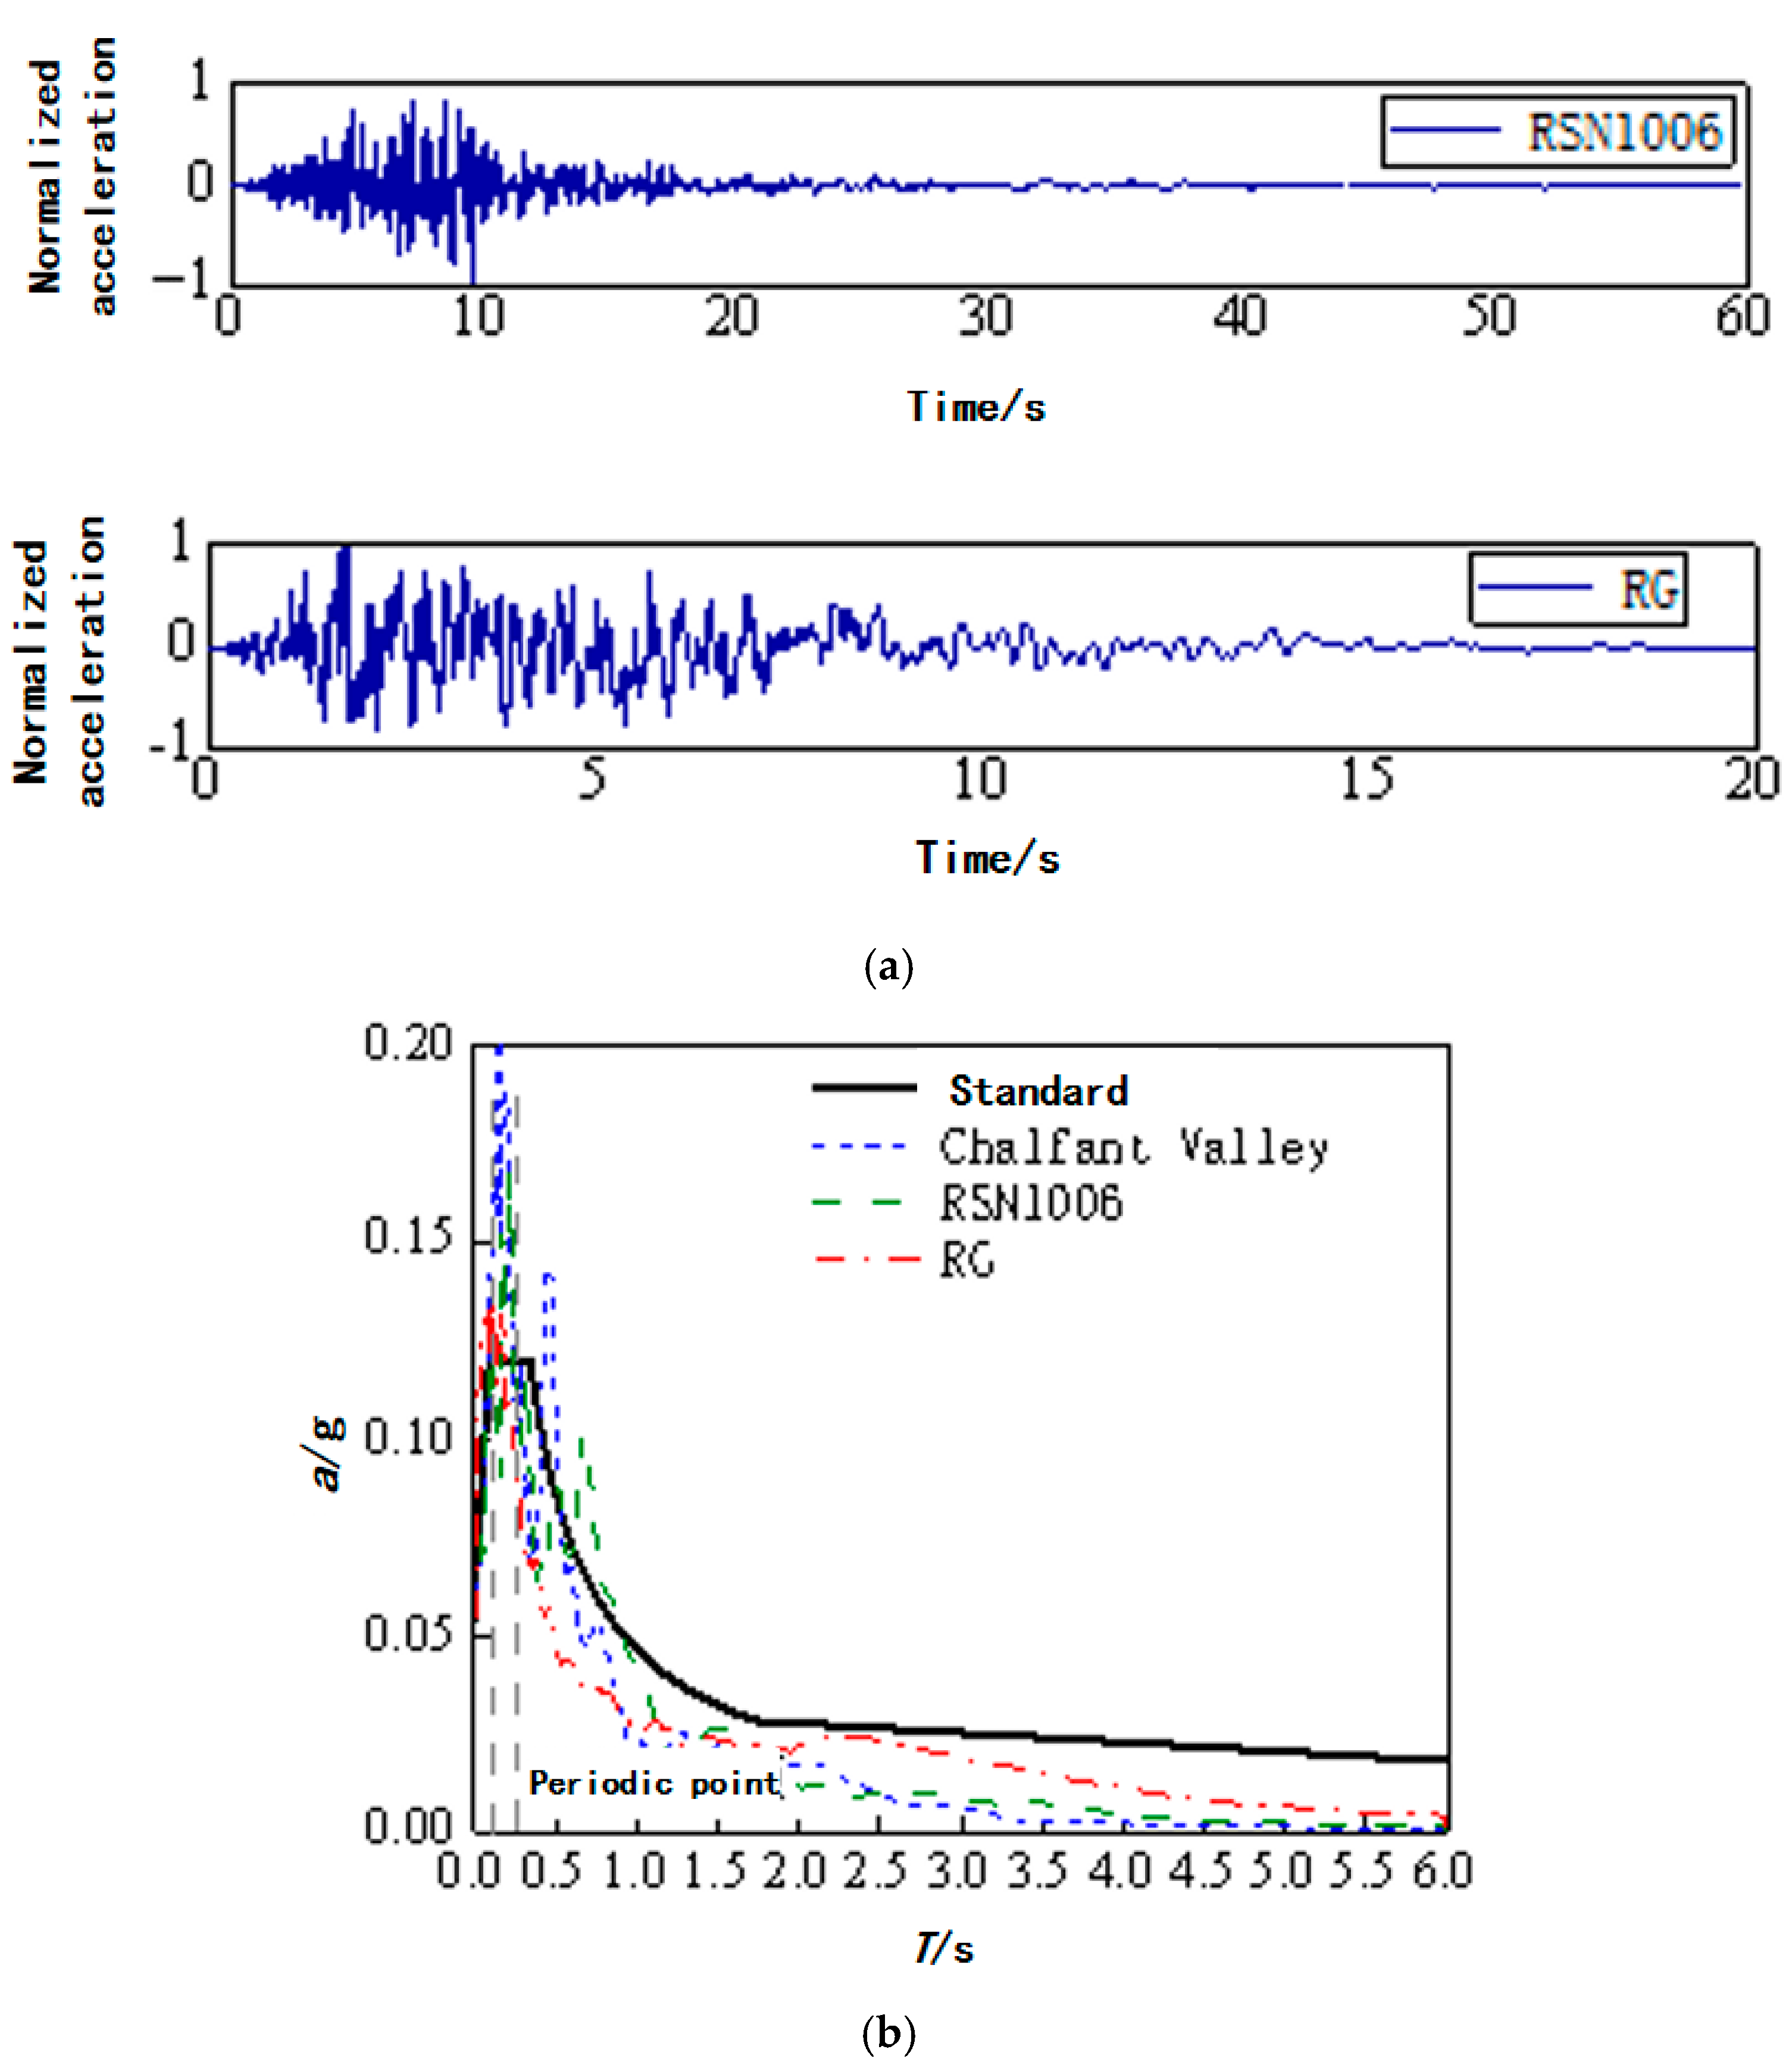
Time–history analysis was conducted using the SAP2000 finite element model, incorporating two actual strong motion records and one artificially simulated acceleration time–history record, with the artificial wave generated by the YJK software, as shown in Figure 6. The three selected time-histories comply with the relevant regulations of the seismic code (“Code for Seismic Design of Buildings” (GB 50011-2016) [18]), ensuring that the average seismic influence coefficient curve of multiple time-histories is statistically aligned with a similar curve adopted in the mode-superposition response spectrum method.
Figure 6.
The information of seismic waves. (a) Seismic time–history curve, (b) seismic response spectrum.
3.3.3. Dynamic Time–History Analysis
The seismic fortification intensity at the building’s site is 6 degrees (0.05 g), corresponding to peak ground accelerations of 18 cm/s2, 50 cm/s2, and 125 cm/s2 for frequent, fortification-level, and rare earthquakes, respectively. Dynamic time–history analysis was conducted by inputting ground motions along the structural Y-direction. The maximum Y-direction inter-story drift angles for each floor were extracted by defining generalized displacements.
As shown in Figure 7, under both the frequent earthquake and fortification-level earthquake scenarios with a seismic intensity of 6 degrees, the maximum inter-story drift angle of the structure occurred at the fourth floor, with values of 1/11,418 and 1/4452, respectively. These values are significantly lower than the inter-story drift angle limit of 1/2500 required for structures to be deemed fit for “normal use”. Under the rare earthquake scenario with a seismic intensity of 6 degrees, the maximum inter-story drift angle was 1/2018—well below the limit of 1/900 for the “moderate damage” performance level. These results indicate that the building meets the seismic fortification requirements.
Figure 7.
Maximum inter-story drift angle of the inclined structure under various earthquake actions of seismic intensity 6. (a) Results for the frequent earthquake scenario; (b) results for design basis earthquakes; (c) results for the rare earthquake scenario.
4. Shaking Table Test Study
4.1. Experimental Program Design
4.1.1. Prototype, Model Design, and Fabrication
Based on conclusions drawn from previous studies, the structure exhibits a satisfactory load-bearing capacity, with only settlement and tilt exceeding permissible limits. Consequently, a rectification method involving tilt correction is proposed for treatment. This study focuses on the post-rectification structure and conducts shaking table tests to verify its seismic performance. The two leftmost bays of the building were selected as the prototype for the test. The prototype test structure consists of three floors, each with a height of 5.6 m, resulting in a total height of 16.8 m. The plan dimensions are 6.9 m × 8.2 m, and there are two windows installed on the south side of each floor. The main structure employs MU10 fired clay bricks, with mortar strengths from bottom to top of M7.5 (first floor), M5.0 (second floor), and M2.5 (third floor). The design was created using YJK software, and the error in the first two periods in the Y-direction compared to the original building was within 5%.
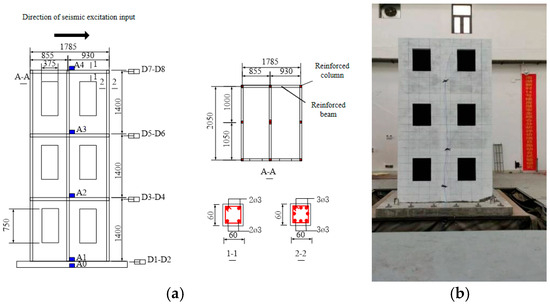
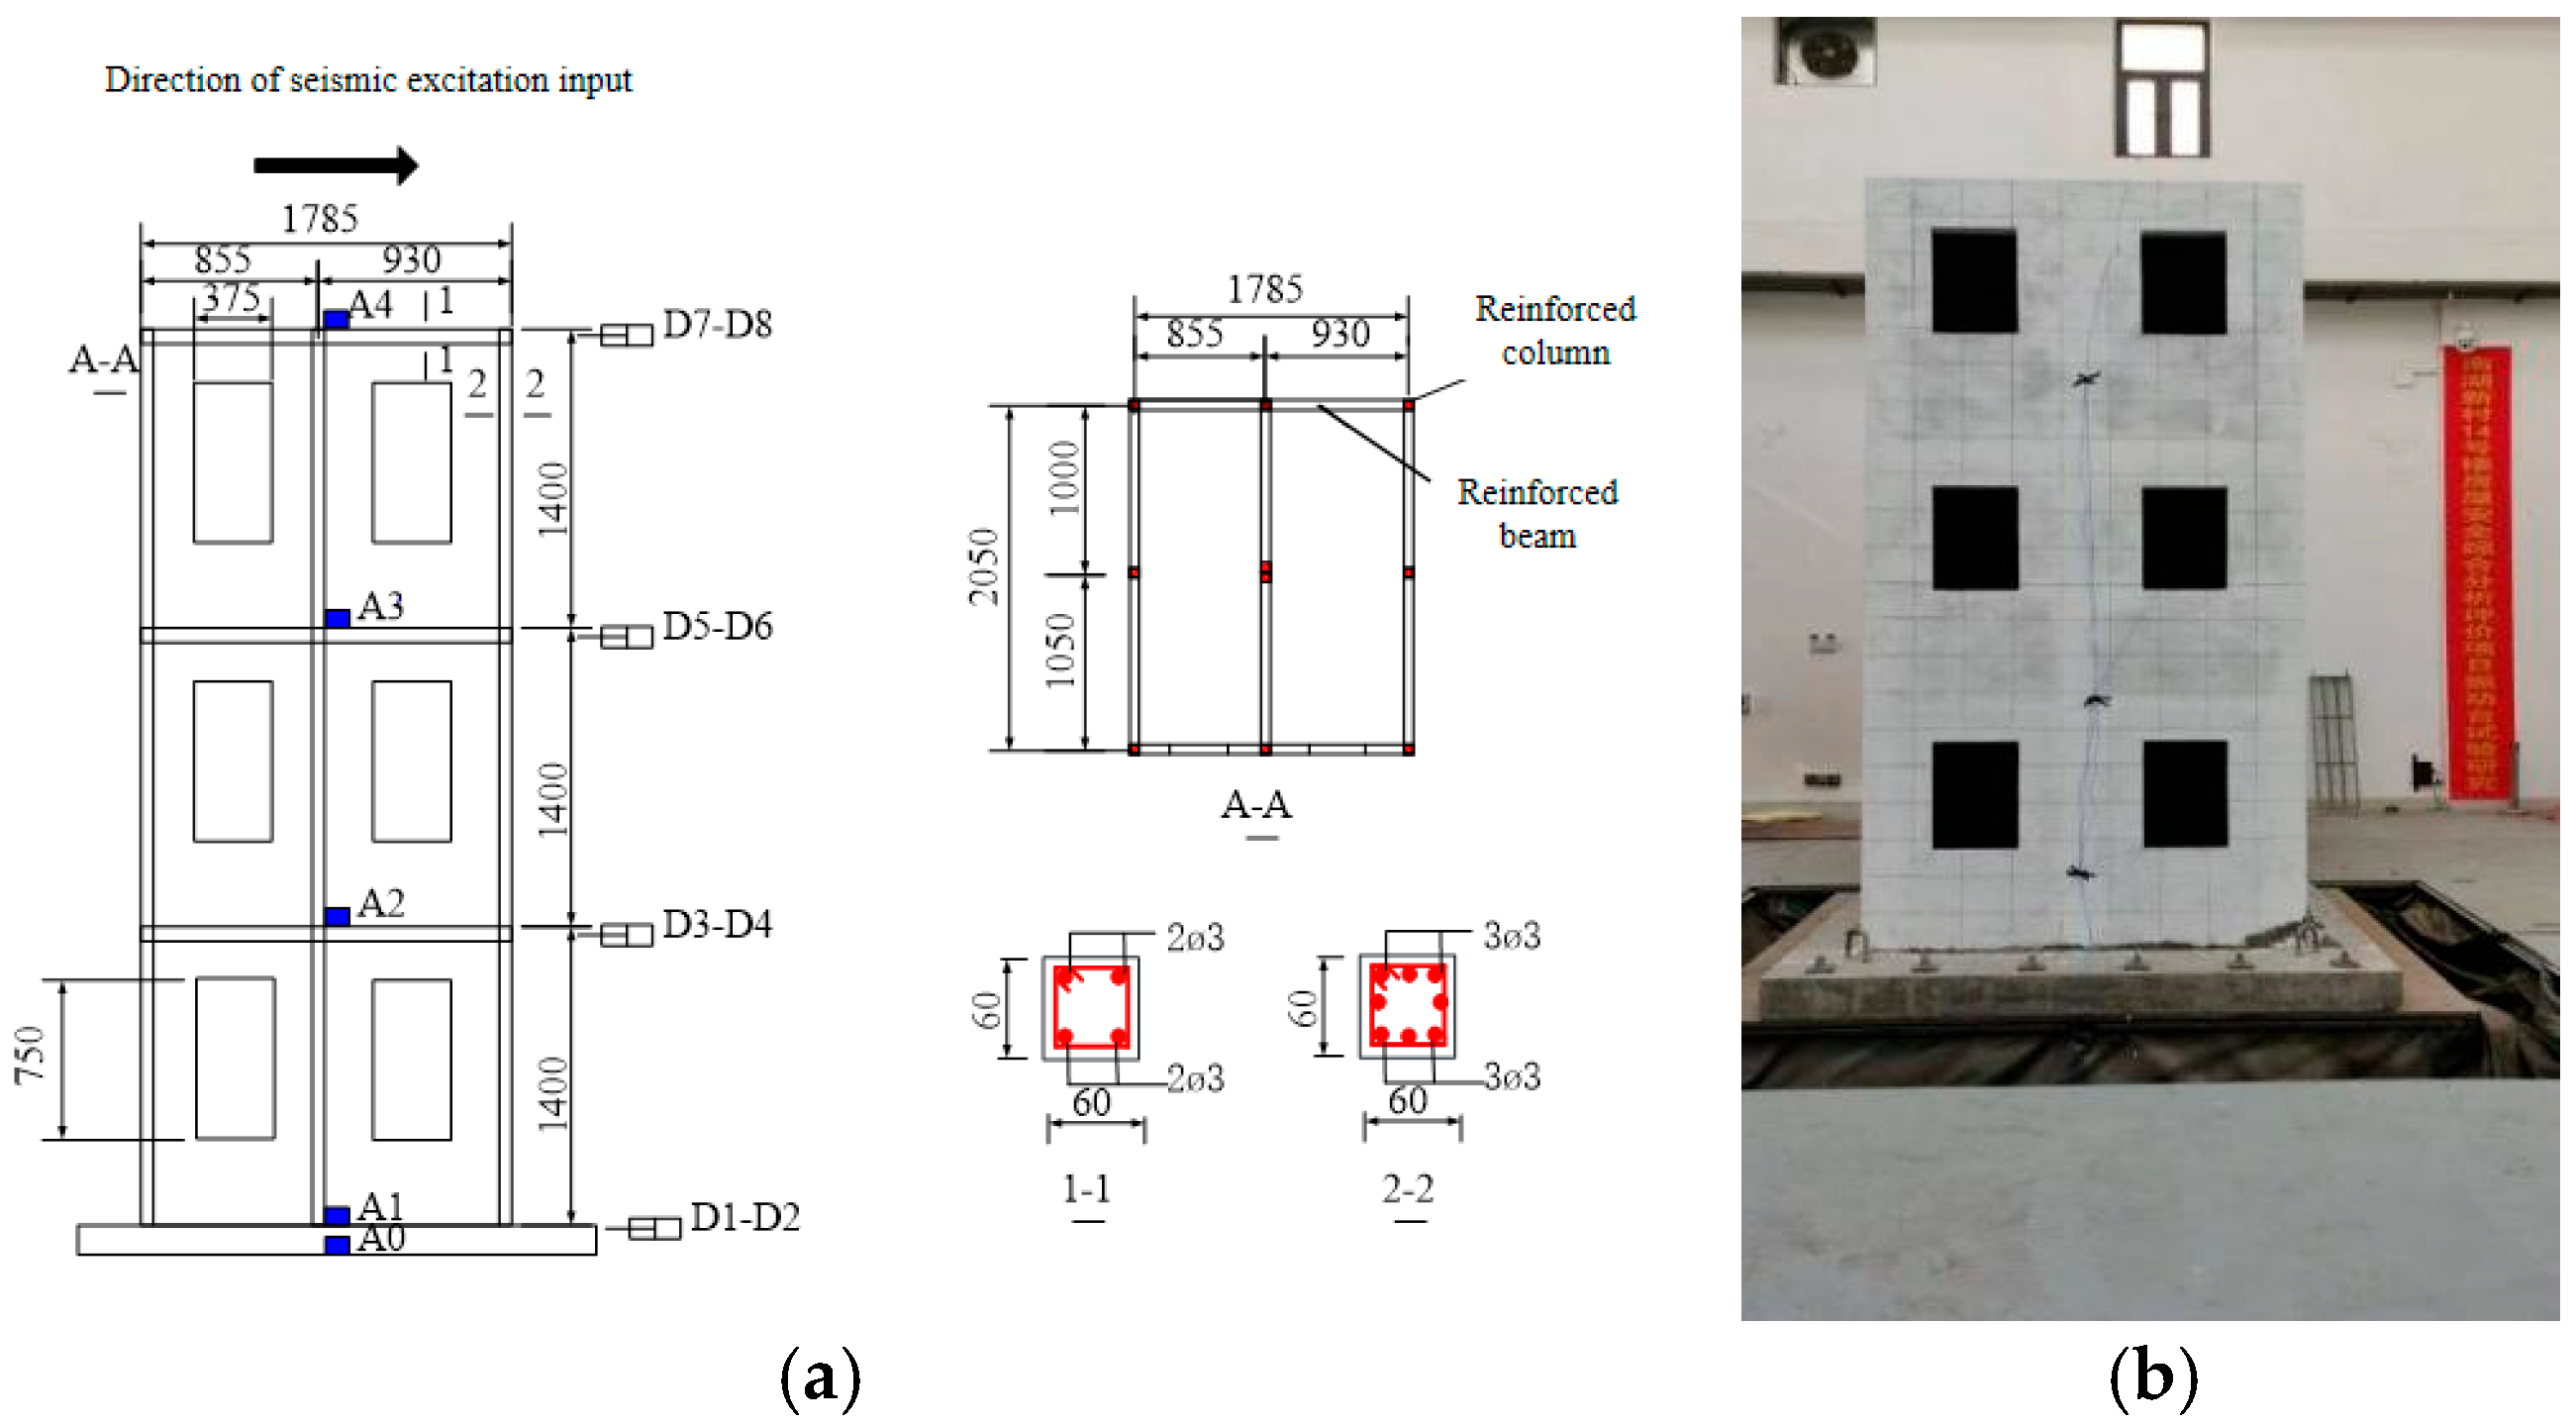
A scaled-down model was designed based on the prototype structure, with a scaling ratio of 1:4 determined in consideration of the shaking table’s dimensions. The model dimensions, as well as the reinforcement details for the ring beams and structural columns, are illustrated in Figure 8a, while a photograph of the physical model is shown in Figure 8b. The identical materials were employed for both the scaled model and the prototype structure, yielding an elastic modulus similarity ratio of 1. In light of the dimensional constraints of the vibration table apparatus, the geometric scale ratio was designated as 1:4; whereas, in consideration of the shaking table’s maximum acceleration capacity and load-bearing limit, an acceleration similarity ratio of 4 was adopted. Upon completion of model fabrication, the measured total mass was recorded as 6.291 tons, in contrast to the theoretical mass of 6.795 tons, with an additional counterweight of 0.5 tons configured to compensate for this discrepancy. Based on the dynamic similarity relationships [21], the similarity ratios corresponding to other physical quantities were subsequently derived; the relevant calculation formulas and specific numerical values are presented in Table 2.
Figure 8.
Details of the model. (a) Model dimensions (unit: mm). A0–A4 represent the installation positions of acceleration sensors, D1-D8 denote the arrangement positions of the displacement sensors. (b) Physical view of the model.
Table 2.
Test similarity constants.
4.1.2. Arrangement of Measurement Points and Test Loading Scheme
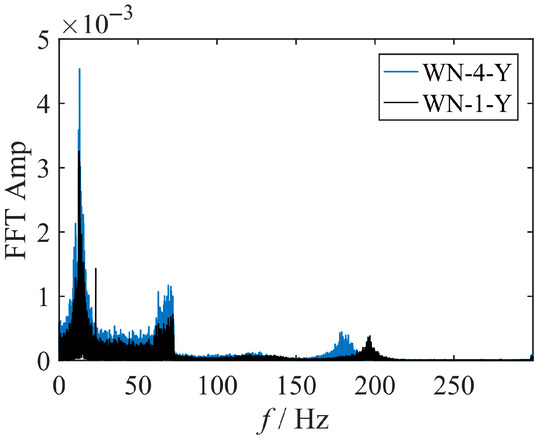
The test utilized the three-directional six-degree-of-freedom shaking table system of the Anhui Provincial Institute of Building Research and Design, with table dimensions of 3 m × 3 m and maximum peak acceleration of 1.5 g horizontally and 1.0 g vertically. Based on similarity relationships, the additional mass for the model was calculated, and counterweight blocks of 0.168 t each were added to the first, second, and third floors. Eight cable-type displacement meters were arranged along the Y-direction, with two installed on the base slab and each of the first to third floor slabs. One accelerometer was placed on the base slab, foundation, and roof of each floor, as illustrated in Figure 9. Three seismic waves consistent with the numerical simulation of the original building were selected. According to the similarity relationship (Sa = 4), the peak ground accelerations for seismic input under frequent earthquakes, fortification-level earthquakes, and rare level 6 earthquakes were determined to be 70 cm/s2, 200 cm/s2, and 500 cm/s2, respectively. To assess the damage to the model structure under different seismic wave excitations, white noise with a peak acceleration of 0.05 g was input into the model structure to measure its dynamic characteristics under various working conditions. The test loading was conducted through unidirectional excitation along the Y-direction; the specific working conditions are listed in Table 3.
Figure 9.
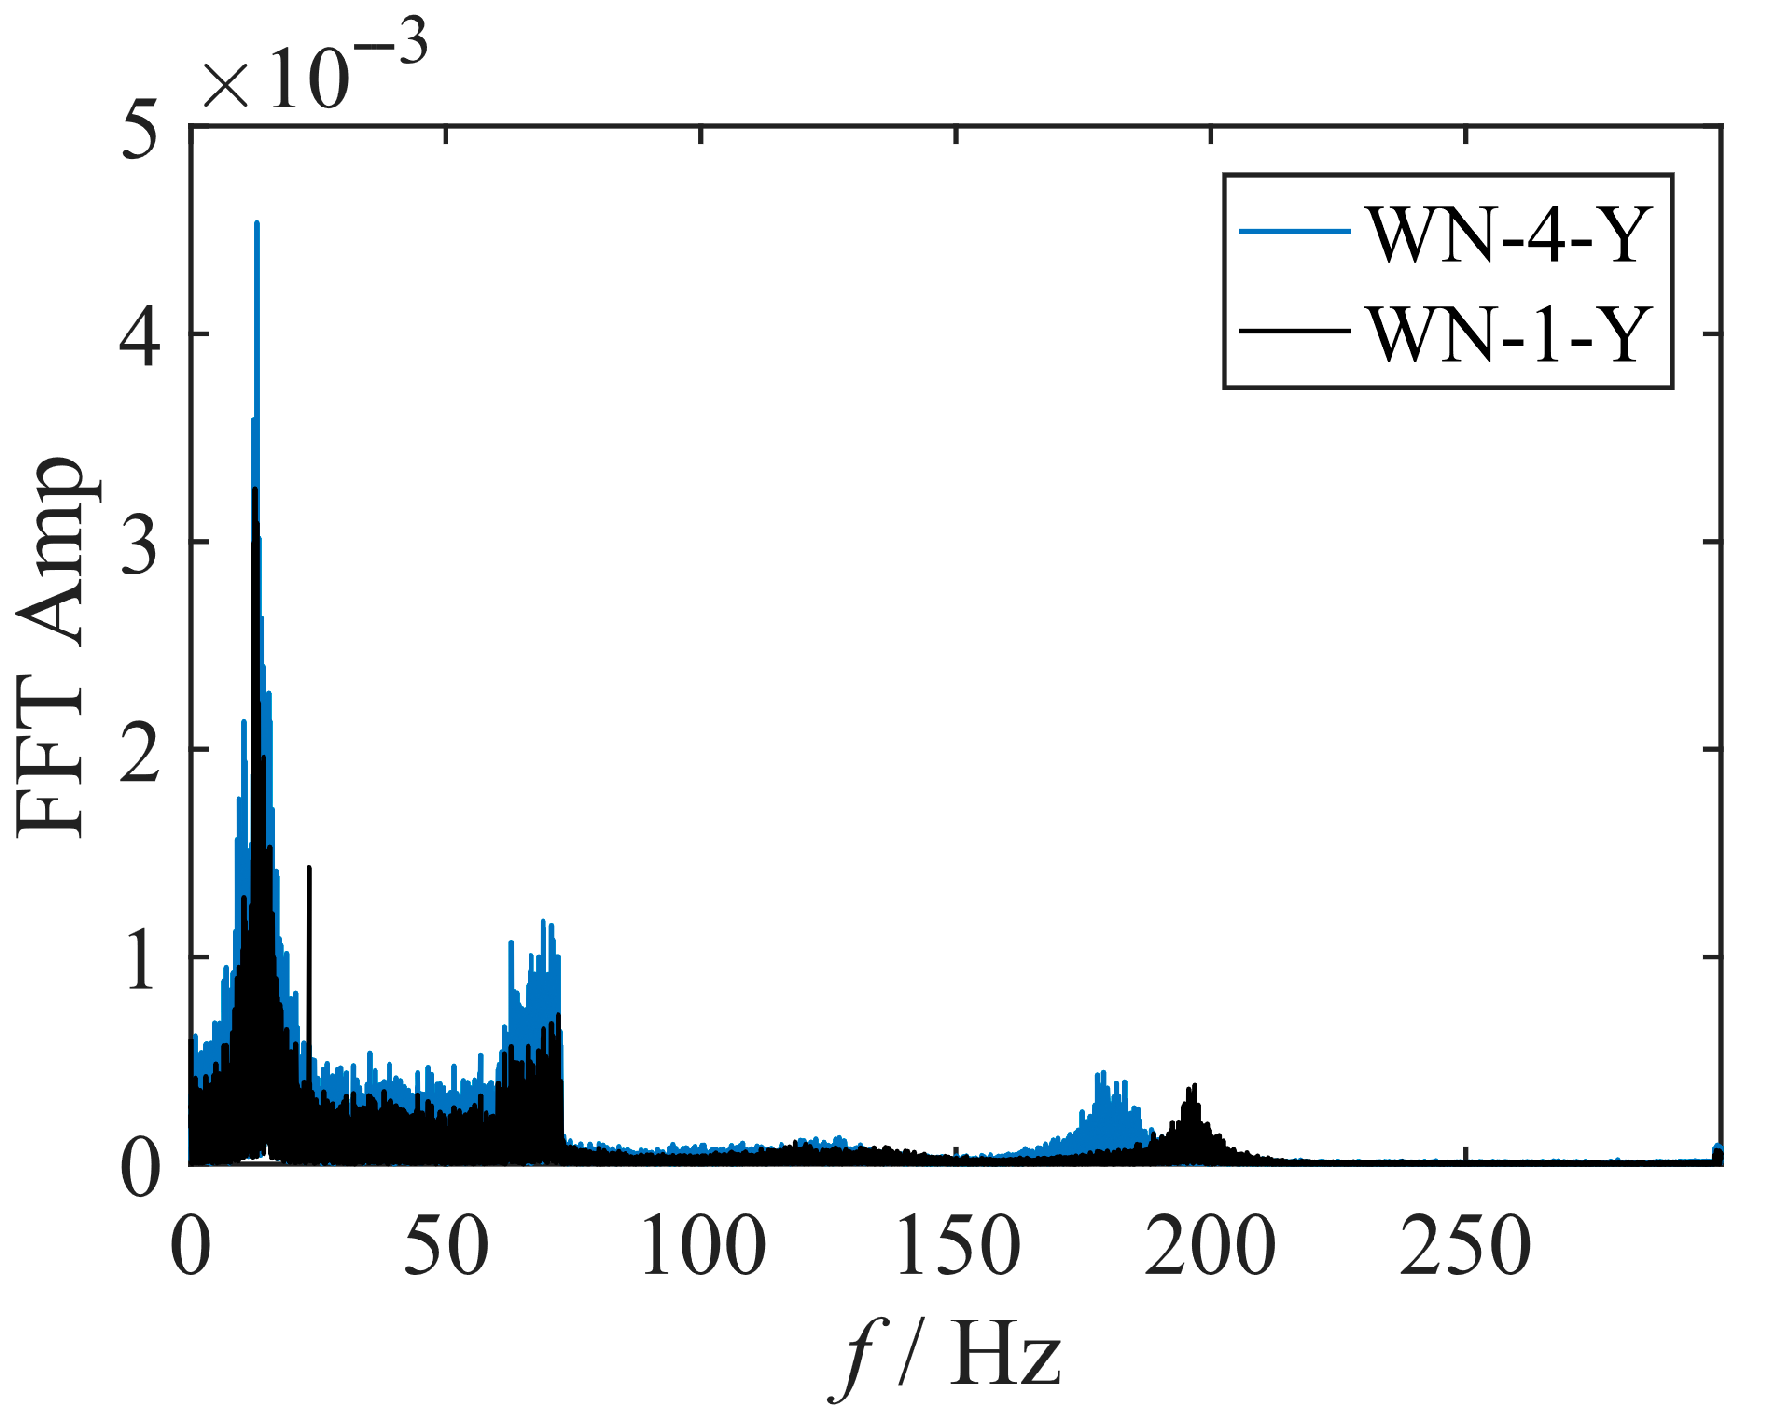
Spectral curves before and after the test.
Table 3.
Test conditions of the model structure.
4.2. Test Results
4.2.1. Test Phenomena
As the input seismic amplitude increased, the intensity of the structural vibration escalated. The following phenomena were observed during the test:
- Under frequent earthquake conditions (0.07 g):
The specimen exhibited only slight shaking, with no abnormal deformation, damage, or other noticeable phenomena observed in the overall test model. No visible cracks were detected at critical stress locations such as door/window joints or column corners.
- 2.
- Under design basis earthquake conditions (0.20 g):
The test model remained in good condition, with a slight increase in vibration amplitude. No significant stress-induced damage was observed, and thorough inspections of vulnerable key locations, such as door/window joints and column corners, revealed no visible cracks.
- 3.
- Under rare earthquake conditions (0.50 g):
Shaking became more pronounced. Comprehensive and detailed inspection of all parts of the model was conducted revealed no significant deformation, damage, or other abnormal phenomena. Critical weak points, such as door/window joints and column corners, remained intact.
4.2.2. Damage Condition of the Model
Before the test, a white noise sweep with a peak acceleration of 0.05 g was applied along the Y-direction of the model. The natural frequency of the structure was determined to be 12.5 Hz, corresponding to a natural period of 0.08 s, through Fourier transform analysis. Frequency sweeps were conducted after excitations corresponding to frequent, fortification-level, and rare earthquakes, respectively. The results are summarized in Table 4. The frequency spectra before and after the tests are compared in Figure 9. The natural frequency and period of the structure remained unchanged, demonstrating that the model’s structural stiffness remained stable without sustaining any damage under seismic actions with an intensity of six at various levels.
Table 4.
Structural natural frequency and natural period.
4.2.3. Deformation of the Model
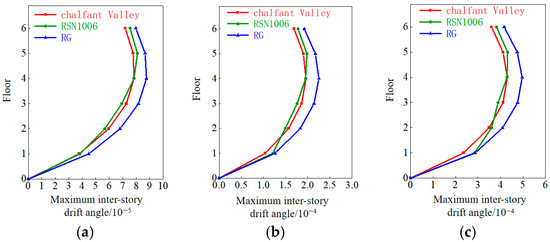
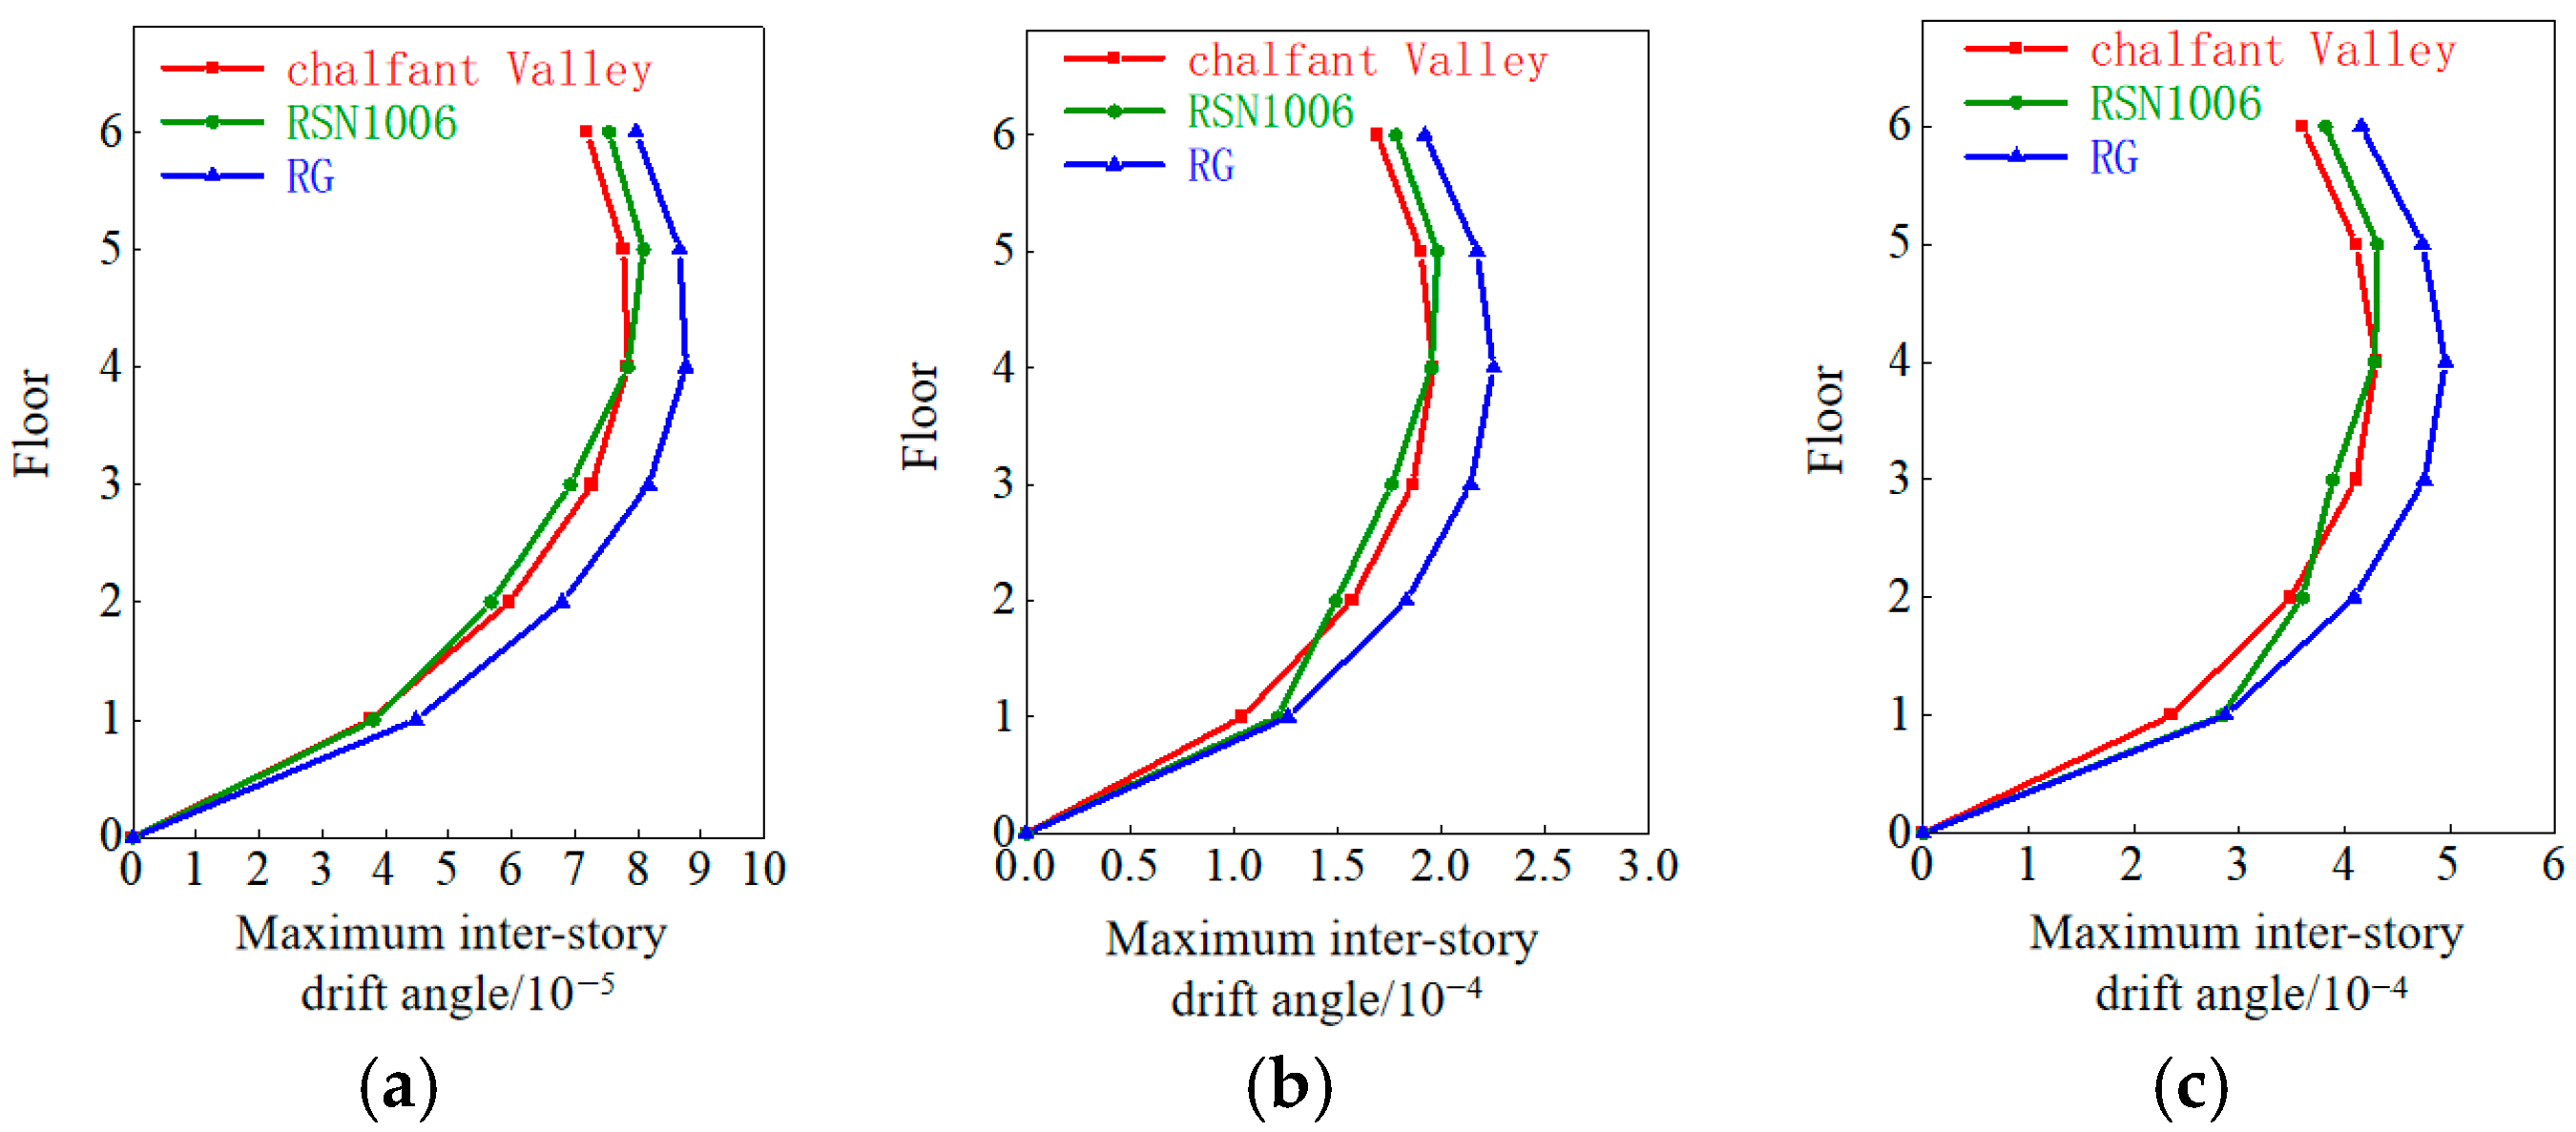
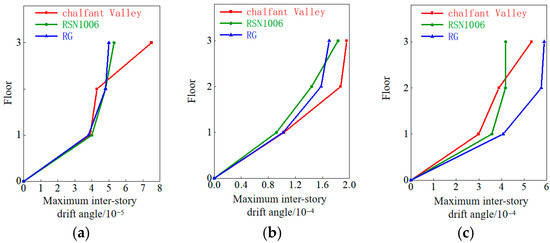
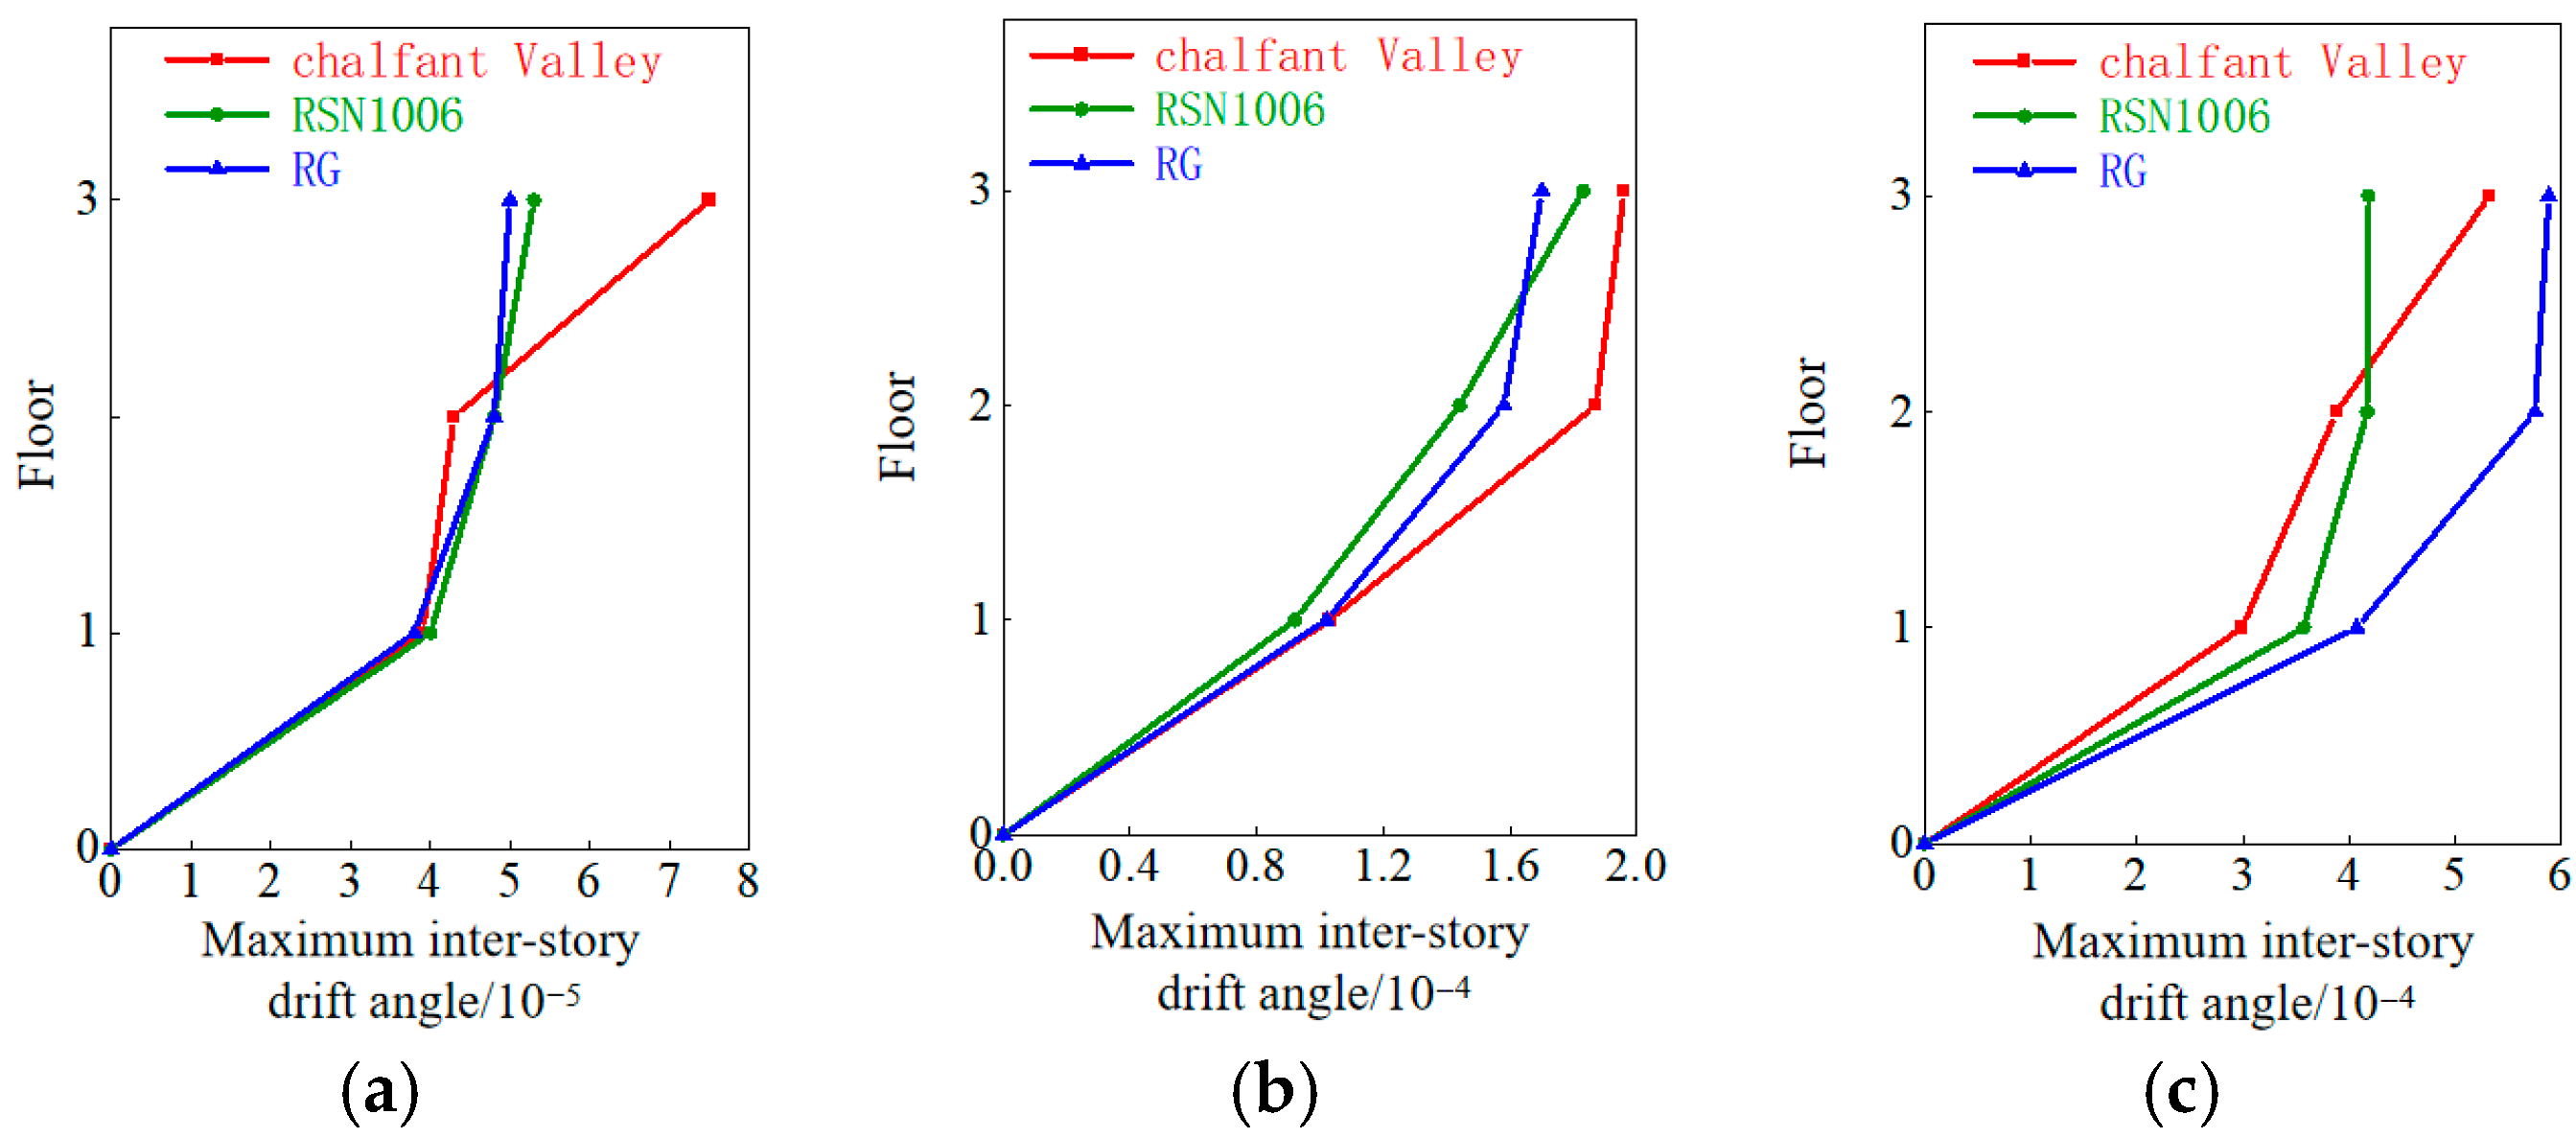
The displacement response was determined using cable-type displacement meters that were installed horizontally at each floor level. The maximum inter-story drift angles of the model structure under different seismic intensity levels are shown in Figure 9.
As shown in Figure 10, when the table acceleration reached 0.7 g, the third floor of the structure exhibited the largest inter-story drift angle under the RG wave, with a value of 1/2040. Although this inter-story drift angle exceeded the previously mentioned limit of 1/2500 required for “normal use”, the structural stiffness did not show significant changes. Therefore, it can be concluded that at this angle, the structure would not exhibit noticeable signs of damage.
Figure 10.
Envelope diagram of inter-story drift angles in response to earthquakes of varying severity: (a) Results for frequent earthquakes; (b) results for the design basis earthquake; (c) results for rare earthquakes.
4.3. Validation of the Numerical Model for the Shaking Table Test Structure
To verify the reliability of the shaking table test results, a finite element model of the experimental model structure was established using SAP2000 software. The three seismic waves used in the test represented frequent earthquakes (intensity 6, 0.07 g), design basis earthquakes (intensity 6, 0.20 g), and rare earthquakes (intensity 6, 0.50 g). The natural period of the numerical simulation for the test model was 0.073 s, showing a minor deviation from the test result of 0.08 s. This validates the reliability of both the test results and the numerical model.
The inter-story drift angles from the numerical simulations under different working conditions, and a comparison with the experimental results, are presented in Table 5. The table shows that under the rare earthquake condition, the maximum inter-story drift angle of the structure occurs on the third floor, with a value of 1/2028. Although there are some discrepancies between the experimental and simulated inter-story drift angles for certain working conditions or floors, the overall errors remain within acceptable limits. This demonstrates that the established numerical model can effectively simulate the behavior of this building.
Table 5.
Comparison of the maximum inter-story drift angle.
5. Conclusions
This study takes an actual engineering structure as the research object and proposes a detailed seismic performance evaluation methodology for tilted structures. Traditional safety assessment protocols primarily monitor interstory drift angles, with structures deemed unfit for occupancy once the drift angle reaches 0.7%. By contrast with conventional assessment methods, the proposed approach conducts a comprehensive evaluation of structural integrity via numerical simulations and shaking table tests, while clarifying the safety status of the structure both prior to and following rectification. This methodology effectively avoids unnecessary demolition or over-reinforcement measures, thereby substantially lowering remediation costs and achieving notable resource conservation benefits.
- (1)
- An on-site inspection revealed that, apart from the overall tilt, no significant structural cracks were observed in the superstructure of the studied residential building in Tongling. The results of the geotechnical indicate that the building’s tilt is attributed to the uneven settlement of the foundation.
- (2)
- Numerical simulations were employed to verify the load-bearing and seismic capacities of the tilted structure. The load-bearing capacity of the masonry walls was found to meet the necessary safety requirements. Under the rare earthquake condition (intensity 6), the maximum inter-story drift angle of the structure remained below the limit (1/900) corresponding to the “moderate damage” performance level for masonry structures, satisfying the seismic fortification requirements. Real-time monitoring can be implemented for tilted structures; once the tilt angle stabilizes, the structure may be deemed temporarily safe.
- (3)
- Shaking table tests of the residential building demonstrated that the structure sustained essentially no damage under the rare earthquake condition (intensity 6). Numerical simulations of the tests yielded results with acceptable error margins, confirming that the established numerical model effectively represents the behavior of the masonry structure.
- (4)
- Although the superstructure exhibits a satisfactory load-bearing capacity, the significant degree of building tilt necessitates prompt implementation of rectification measures. The systematic evaluation framework established in this study for tilted masonry structures can serve as a critical technical reference for assessing the safety of—and subsequently rectifying—similar structures.
Structural tilting arises from multiple contributing factors, and the case study herein was specifically attributed to the uneven settlement of the foundation. Future research will focus on developing targeted evaluation methodologies for structural tilting induced by distinct causal mechanisms, with the dual aims of conserving resources and minimizing remediation costs. Moreover, the insights and methodologies derived from this study can offer valuable references for subsequent researchers in this field.
Author Contributions
Conceptualization, L.M. and D.X.; Methodology, D.X.; Software, Y.G.; Formal analysis, Y.G.; Data curation, Z.J.; Writing—original draft, H.L.; Writing—review and editing, Z.J. and D.X.; Visualization, Z.J.; Project administration, L.M.; Funding acquisition, H.L. All authors have read and agreed to the published version of the manuscript.
Funding
This study was funded by Research Project Approved by Anhui Institute of Building Research & Design (2025JKY-B-04, 2023KY(B1)-03), Science and Technology Plan of the Department of Housing and Urban–Rural Development of Anhui Province (2024-YF075). The findings presented here represent the opinions of the authors and do not necessarily reflect the views of the sponsors.
Data Availability Statement
The original contributions presented in the study are included in the article, further inquiries can be directed to the corresponding author.
Conflicts of Interest
The authors declare no conflict of interest.
References
- Tzounis, L.; Debnath, S.; Rooj, S.; Fischer, D.; Mäder, E.; Das, A.; Stamm, M.; Heinrich, G. High performance natural rubber composites with a hierarchical reinforcement structure of carbonnanotube modified natural fibers. Mater. Des. 2014, 58, 1–11. [Google Scholar] [CrossRef] [Scilit]
- Abscal, R.; Dominguez, J. Vibration of footings on viscoelastic soil. J. Eng. Mech. 1985, 111, 123–141. [Google Scholar]
- Hara, T. Behaviour of R/C cooling tower shell under uneven foundation settlement. J. Int. Assoc. Shell Spat. Struct. 2016, 57, 59–66. [Google Scholar] [CrossRef] [Scilit]
- Jia, Q.; Cheng, L.L.; Zhang, X. Experimental study on the influence of uneven foundation settlement on frame structures. China Civ. Eng. J. 2011, 44, 79–86. (In Chinese) [Google Scholar]
- Du, Y.F.; Ding, Y.J.; Huang, X.N. Influence of uneven foundation settlement on seismic vulnerability of base-isolated structures. Earthq. Resist. Eng. Retrofit. 2017, 39, 79–86. (In Chinese) [Google Scholar]
- GB 50007-2011; Code for Design of Building Foundations. China Architecture & Building Press: Beijing China, 2012. (In Chinese)
- Green, R. Pile design and construction practice. Can. J. Civ. Eng. 2014, 22, 846–847. [Google Scholar] [CrossRef] [Scilit]
- Xu, X.D.; Jia, L.D.; Sun, J.P.; Zhao, K.Z.; Zhang, X.; Li, S.M. Design method and engineering examples of building inclination correction by soil excavation and water injection at the base. J. Build. Struct. 1999, 20, 59–64. (In Chinese) [Google Scholar]
- Ping, Y. Theoretical Analysis and Application Research on Horizontal Soil Excavation Correction Technology for Buildings. Master’s Thesis, Shandong Jianzhu University, Jinan, China, 2011. (In Chinese) [Google Scholar]
- GB 50009-2012; Code for Loads of Building Structures. China Architecture & Building Press: Beijing, China, 2012. (In Chinese)
- GB 50292-2015; Standard for Reliability Assessment of Civil Buildings. China Architecture & Building Press: Beijing, China, 2016. (In Chinese)
- Application of Pushover Analysis in Seismic Design of Construction Engineering; China Architecture & Building Press: Beijing, China, 2010. (In Chinese)
- Valente, M. Seismic behavior and damage assessment of two historical fortified masonry palaces with corner towers. Eng. Fail. Anal. 2022, 134, 106003. [Google Scholar] [CrossRef] [Scilit]
- Valente, M. Earthquake response and damage patterns assessment of two historical masonry churches with bell tower. Eng. Fail. Anal. 2023, 151, 107418. [Google Scholar] [CrossRef] [Scilit]
- GB 50003-2011; Code for Design of Masonry Structures. China Architecture & Building Press: Beijing, China, 2011. (In Chinese)
- Wang, H.G. Finite element analysis on seismic performance of hollow brick wall masonry structures in low-rise residential buildings. China Constr. Met. Struct. 2024, 23, 37–39. (In Chinese) [Google Scholar]
- Jia, X.; Weng, W.S. Seismic performance analysis of direct light steel storey-adding on top of a brick-concrete structure. J. Hebei Univ. Archit. Civ. Eng. 2016, 34, 4. (In Chinese) [Google Scholar]
- GB 50011-2016; Code for Seismic Design of Buildings. China Architecture & Building Press: Beijing, China, 2016. (In Chinese)
- Xin, G.W. Seismic Performance Evaluation of Masonry Structure Primary and Secondary School Buildings Based on Pushover Method. Master’s Thesis, Xi’an University of Architecture and Technology, Xi’an, China, 2009. (In Chinese) [Google Scholar]
- Wang, M.Z. Research on Seismic Strengthening Performance of Existing Masonry Structure Buildings in Primary and Secondary Schools. Master’s Thesis, Inner Mongolia University of Science and Technology, Baotou, China, 2014. (In Chinese) [Google Scholar]
- Zhou, Y.; Lü, X.L. Shaking Table Model Test Methods and Technologies for Building Structures; Science Press: Beijing, China, 2016; pp. 25–49. (In Chinese) [Google Scholar]


Disclaimer/Publisher’s Note: The statements, opinions and data contained in all publications are solely those of the individual author(s) and contributor(s) and not of MDPI and/or the editor(s). MDPI and/or the editor(s) disclaim responsibility for any injury to people or property resulting from any ideas, methods, instructions or products referred to in the content. |
© 2026 by the authors. Licensee MDPI, Basel, Switzerland. This article is an open access article distributed under the terms and conditions of the Creative Commons Attribution (CC BY) license.