


Abstract
Existing reinforced concrete frames with inadequate seismic resistance require effective retrofit strategies that control structural deformation while minimizing interference with occupied interior spaces. Motivated by this need, this study investigates the seismic performance of a six-story reinforced concrete frame retrofitted with externally mounted rhombic perforated fractal buckling-restrained braces (RP-FD-BRBs). Nonlinear dynamic time-history analyses were conducted using ABAQUS. The results demonstrate that the external bracing system significantly mitigates tensile and compressive damage to the concrete at the ground story, alleviates stress concentrations, and substantially reduces interstory drift and roof acceleration. By enhancing the structural system’s stiffness and providing stable plastic hysteretic behavior, the brace effectively dissipates seismic energy and protects the primary load-bearing structure. Furthermore, a comparative optimization of different external brace span widths indicates that the 0.9 m span configuration (RP-WZ-0.9) achieves the most favorable interaction between lateral stiffness enhancement and seismic energy dissipation. This configuration produces the greatest reduction in peak roof acceleration and was the best-performing configuration among the three span widths investigated.
1. Introduction
A substantial proportion of existing reinforced concrete frame (RCF) structures exhibit deficiencies such as inadequate seismic detailing, rendering them highly vulnerable under strong earthquake excitation and creating an urgent need for seismic retrofitting [1]. Steel bracing systems have been investigated as a means of improving the seismic response of existing RC frames. Valente [2] numerically investigated a dissipative system combining concentric X-braces with a ductile shear panel, in which the panel provides energy dissipation through yielding while the braces are intended to remain elastic. The analyses indicated that this arrangement could reduce damage to the primary frame under severe seismic excitation. In a related study, Valente [3] compared concrete shear-wall and eccentric steel-bracing interventions for a non-ductile four-story RC frame using nonlinear static and dynamic analyses. The steel-bracing intervention was investigated as a strategy for limiting displacement demand and increasing energy dissipation. To enhance the seismic performance of such structures, dual structural systems combining buckling-restrained braces (BRBs) with moment-resisting frames have attracted considerable attention. Barbagallo et al. investigated the seismic design and performance of a dual system comprising BRBs and moment-resisting frames with semi-rigid connections [4].
Case studies have examined how steel bracing layout and energy dissipation devices affect the retrofit of existing RC buildings. Stepinac et al. [5] evaluated several strengthening options for an existing RC public building in Croatia, including additional steel tube braces and new braced steel frames. Their comparison considered structural response, construction cost, and the availability of the building during the intervention. Colajanni et al. [6] used a four-story RC frame to compare three design procedures for dissipative bracing systems, examining how the design assumptions affect brace sizing and the predicted seismic response. At the building level, Nascimbene et al. [7] compared three dissipative bracing configurations for an existing RC hospital, including a system designed to activate at low deformation demands. Their nonlinear static analyses evaluated changes in lateral capacity and displacement demand. Together, these studies illustrate the importance of evaluating both the brace characteristics and the response of the existing building when selecting a steel bracing retrofit.
Castaldo et al. evaluated the seismic performance of existing reinforced concrete structures retrofitted with BRBs, demonstrating that this retrofit technique can effectively improve structural seismic resistance [8]. Andrews et al. assessed the reliability of BRB frame systems using experimental limit-state models and stochastic dynamic analyses [9]. Nakashima reviewed the development of BRBs from their initial conception to technological maturity, noting that they have become important energy-dissipation devices in earthquake engineering [10].
Conventional steel braces are prone to global buckling under cyclic axial compression and therefore possess limited energy-dissipation capacity. Buckling-restrained braces (BRBs) employ an external restraining unit to prevent global buckling of the steel core, enabling it to yield and dissipate energy under both tension and compression without buckling and thereby exhibiting full and stable hysteretic behavior. Extensive experimental studies have been conducted worldwide on the seismic retrofitting of reinforced concrete frames using BRBs. Avci-Karas et al. developed a refined hysteretic model for BRBs based on full-scale experimental data, providing a reliable basis for simulating their hysteretic response [11].
Di Sarno and Manfredi performed comparative pushover and cyclic loading tests on full-scale models of unretrofitted and BRB-retrofitted reinforced concrete frames, confirming that BRB retrofitting improves the seismic performance of such frames [12]. Almeida et al. investigated the feasibility of retrofitting existing reinforced concrete buildings with BRBs and demonstrated that BRBs can be effectively applied to the seismic strengthening of these structures [13]. Wang et al. experimentally investigated reinforced concrete frame structures equipped with all-steel prefabricated BRBs fabricated from Q195 low-yield-point steel, verifying their favorable hysteretic performance and strengthening effectiveness [14]. Li et al. conducted low-cycle reversed loading tests and numerical analyses on a two-story, three-bay reinforced concrete frame incorporating K-configured BRBs, demonstrating that this configuration enhances both the load-carrying and energy-dissipation capacities of the frame [15]. Rafi et al. examined the dynamic behavior of BRB-retrofitted reinforced concrete frames through dynamic testing, providing a basis for evaluating their seismic performance [16]. In addition, Ferraioli et al. investigated the seismic performance of reinforced concrete buildings retrofitted with self-centering shape-memory-alloy braces, offering a self-centering solution for energy-dissipation-based seismic retrofitting [17].
Regarding numerical simulation and design, Farouk and El-Kady developed a mathematical model for analyzing the P–δ effect in braced columns, providing a reference for evaluating second-order effects in braced frames [18]. Ferraioli et al. investigated the seismic performance of existing reinforced concrete buildings retrofitted with BRBs [19]. Through experimental testing and numerical analysis, Sutcu et al. examined a retrofit scheme combining BRBs with elastic steel frames for nonconforming reinforced concrete frames. Their results showed that the system could enhance structural strength, ductility, and damping, thereby ensuring an adequate level of seismic safety [20]. Wang et al. employed substructure testing to investigate the effects of different gusset-plate connection configurations on the mechanical behavior of the joint regions in BRB-retrofitted reinforced concrete frames [21]. Wang and Tong experimentally investigated prefabricated low-yield-point steel BRBs and confirmed their favorable hysteretic performance [22].
Based on fractal theory and the design principle of rhombic perforations, Ma et al. developed a fractal-dimension BRB (FD-BRB) core unit. They subsequently conducted numerical simulations in ABAQUS and SAP2000 on multistory frames retrofitted with externally mounted FD-BRBs, verifying the effectiveness of the proposed system in improving ductility and energy-dissipation capacity and controlling interstory drift [23]. Wu et al. experimentally investigated the seismic performance of BRBs with different lengths to determine the influence of member length on brace behavior [24]. Ye et al. analyzed the key performance parameters of prefabricated aluminum-alloy BRBs, providing a reference for their design and practical application [25]. Al-Sadoon et al. employed nonlinear analysis to investigate the effectiveness of a novel BRB system in enhancing the seismic resilience of nonductile reinforced concrete frames [26]. İnam and Dindar evaluated the seismic performance of mid-rise moment-resisting reinforced concrete frames retrofitted with BRBs under sequential earthquake excitations [27]. Qing et al. performed nonlinear modeling and time-history analyses of structural systems combining dry-assembled precast concrete frames with BRBs [28].
At the design and detailing level, Bai et al. proposed a stiffness-ratio-based seismic design method for reinforced concrete frames equipped with BRBs [29], while Huang et al. investigated the seismic performance and design methodology of structural systems combining fully prefabricated precast concrete frames with BRBs [30]. Li et al. systematically reviewed seismic strengthening techniques for reinforced concrete frame buildings [31], and Bohara and Saha reviewed research conducted between 1990 and 2023 on the seismic performance of reinforced concrete frames with concentric steel bracing [32]. Al-Sadoon et al. proposed a performance-based seismic retrofit scheme using knee-type BRBs for aging reinforced concrete frames [33]. Maulana examined the effects of different BRB characteristics on the seismic performance of reinforced concrete frames [34]. Nie et al. investigated the seismic performance of concrete-encased steel frames with steel-tube confinement and replaceable BRBs [35]. Shedge et al. presented a comprehensive review of the historical development, applications, and design of BRBs [36].
To address the excessive self-weight and end-region stress concentrations associated with conventional BRBs, Ma et al. and Ren et al. proposed a rhombically perforated fractal core unit based on fractal theory and the design principle of rhombic perforations. This concept is intended to promote the progressive development of plastic deformation while reducing member self-weight and improving end-region stability and load-transfer paths [37]. Previous studies have demonstrated that externally mounted fractal-dimension BRBs can effectively enhance the ductility and energy-dissipation capacity of frame structures. However, existing research has focused primarily on the effects of brace-specific parameters, such as member length and cross-sectional properties, on structural response. The present study focuses on the seismic response of an externally mounted straight-line retrofit configuration incorporating RP-FD-BRBs. Particular attention is given to the response of the RC frame and to the comparison of configurations in which the external span width and brace dimensions vary together while prescribed geometric ratios are maintained.
Building on the previously developed RP-FD-BRB core unit, this study investigates its application in an externally mounted straight-line retrofit system for a six-story reinforced concrete frame prototype. The objective is to evaluate the seismic response of the original and retrofitted configurations and to examine the response differences among selected external span–brace combinations. Three-dimensional finite element models are established in ABAQUS, and nonlinear dynamic time-history analyses are conducted using the El Centro, Taft, and artificial ground motions at frequent and rare earthquake intensity levels.
The contributions of this study comprise three aspects. First, it examines the application of the existing perforated fractal brace concept within an external retrofit arrangement comprising the RC frame, braces, and strongback. Second, it combines local response indicators, including concrete damage and reinforcement stress, with global response measures, including interstory drift, roof acceleration, and base shear, to assess retrofit effectiveness under the investigated earthquake inputs. Third, it compares external span widths of 0.6, 0.9, and 1.2 m with corresponding brace dimensions selected to maintain a length-to-width ratio of 6 and a width-to-thickness ratio of 10, thereby documenting the structural response of three geometrically related retrofit configurations.
The parameter comparison concerns coupled changes in span width and brace geometry, since these geometric constraints do not maintain constant brace stiffness, yield force, or steel volume. Accordingly, the findings identify relative performance among the investigated configurations for the specified prototype and seismic inputs; they do not establish an independent span-width effect or a generally optimal design.
2. Project Overview and Retrofitting Scheme
2.1. Prototype Structure
Numerous studies have demonstrated that, compared with conventional buckling-restrained braces, fractal buckling-restrained braces exhibit significant advantages in terms of energy-dissipation capacity, mechanical behavior, and seismic effectiveness. Developed further from this concept, the rhombically perforated fractal buckling-restrained brace achieves superior overall performance relative to conventional fractal buckling-restrained braces by optimizing local stress distribution and deformation mechanisms. Fractal theory introduces a novel conceptual framework for engineering practice, opens up broad avenues for research, and plays an important role in advancing various disciplines.
Drawing on fractal theory and incorporating readily manufacturable rhombic perforations, researchers developed a fractal buckling-restrained brace (BRB) core unit characterized by a regular geometric pattern and inherent chaotic features. Proposed by Ma, Luo, and Ren, the unit employs rhombic perforations as its fundamental geometric configuration, as illustrated in Figure 1, and has been applied in structural retrofitting projects [23]. In the RCF retrofit system, the energy-dissipating core unit of the fractal buckling-restrained brace (FD-BRB) is fabricated from Q235 steel, while the external restraining unit is made of Q345 steel, together forming a fully restrained fractal buckling-restrained brace. The core unit consists of a flat steel plate with serrated edges on both sides, measuring 50 mm in width and 10 mm in thickness. Rhombic perforations are symmetrically arranged beginning 35 mm from each end of the unit. The perforations have side lengths of 10, 15, and 20 mm, with a clear spacing of 10 mm between adjacent perforations.
Figure 1.
Configuration and principal components of the rhombic perforated fractal buckling-restrained brace (RP-FD-BRB): (a) schematic arrangement showing the perforated core, external restraining components, end connection details, rubber filling, and limiting devices; ① Core Unit ② Upper External Restraint Pad ③ Lower External Restraint Pad ④ Left External Restraint Steel Plate ⑤ Right External Restraint Steel Plate ⑥ Stiffening Rib Steel Plate ⑦ Connection Section Steel Plate ⑧ Transition Section Steel Plate ⑨ Rubber Filling Between Inner and Outer Units ⑩ Bolt Hole with M6 Thread ⑪ Bolt Hole with M10 Thread ⑫ Limiting Device (similar to a spring) ⑬ Diamond-Shaped Perforations. (b) Photograph of the upper and lower restraining components; (c) photograph of the core unit with rhombic perforations and end connection regions. Component ① is the axial load-carrying core intended to dissipate energy through inelastic deformation, while components ②–⑤ form the external restraint intended to suppress core buckling. The rhombic perforations are identified by ⑬. The remaining numbered components are defined in the accompanying legend.
An unperforated fractal buckling-restrained brace (FD-BRB) was reproduced to scale, preserving the geometric proportions of the original brace. As shown in Figure 2, its steel core has serrated edges and contains no openings in the yielding region. The unperforated FD-BRB serves as the reference configuration for comparison with the rhombically perforated fractal buckling-restrained brace (RP-FD-BRB) shown in Figure 1. This comparison is used to examine the effect of the rhombic openings on the cyclic axial response.
Figure 2.
Scale model of the unperforated fractal buckling-restrained brace (FD-BRB).
The RP-FD-BRB specimen was tested in a SYJD-2000 universal testing machine under displacement-controlled, reversed axial tension–compression loading. A low-amplitude preload was applied to take up slack in the test fixture and check the instrumentation. The prescribed displacement amplitudes were L/800, L/600, L/300, L/200, L/150, L/100, L/80, and L/50, where L is the core length. One complete tension–compression cycle was specified at each amplitude. The axial force and axial deformation were recorded during loading. Figure 3 shows the specimen photographs and the prescribed loading history.
Figure 3.
Fabricated brace specimens, test setup, and displacement-controlled cyclic loading history.
Figure 4 compares the measured axial force–displacement hysteresis loops of the unperforated FD-BRB and the rhombically perforated RP-FD-BRB. Within the displacement range common to both specimens, several loops of the RP-FD-BRB appear fuller than those of the unperforated brace. The unperforated FD-BRB reached a higher peak tensile force of approximately 190 kN, compared with approximately 155 kN for the RP-FD-BRB. The peak compressive force magnitudes of the two specimens were closer, at approximately 150–160 kN. As a result, the maximum tensile and compressive force magnitudes were more nearly balanced for the perforated specimen. The RP-FD-BRB also reached larger axial displacement excursions in both loading directions. Because the maximum displacement amplitudes differed between the two tests, the energy dissipated per cycle should be compared using the enclosed loop areas at matched displacement amplitudes. Based on the fuller hysteresis loops observed in the cyclic tests, the rhombically perforated FD-BRB was selected for the subsequent finite element analyses of the RC frame retrofit.
Figure 4.
Experimental axial force–displacement hysteresis curves of the unperforated and rhombically perforated FD-BRBs.
Following the component-level cyclic comparison, the rhombically perforated fractal buckling-restrained brace (RP-FD-BRB) was selected for the numerical investigation of the external retrofit of the six-story reinforced concrete (RC) frame. Figure 5 shows the structural floor plan and the arrangement of the external braces. The frame has four 6000 mm bays in the X direction and three 4000 mm bays in the Y direction, giving overall plan dimensions of 24,000 mm × 12,000 mm. The external braces are shown in red along Axis 5 and connect the exterior RC frame to the steel strong backs. The blue dashed outline marks the provisional single-bay region along Grid B between Axes 4 and 5, including the adjacent retrofit assembly.
Figure 5.
Structural floor plan of the six-story reinforced concrete frame building (all dimensions in mm).
Figure 6 shows the corresponding elevation of the retrofitted RC frame. The first story is 3600 mm high, and each of the five upper stories is 3000 mm high, giving a total frame height of 18,600 mm. At each floor level, an RP-FD-BRB extends horizontally from the exterior RC column at Axis 5 to the external steel strongback. The dimension Lb denotes the external span width. The blue dashed outline shows the provisional analysis region in elevation, encompassing the bay between Axes 4 and 5 and the adjacent retrofit assembly.
Figure 6.
Elevation of the reinforced concrete frame retrofitted with external RP-FD-BRBs (dimensions are in millimeters and level elevations are in meters).
2.2. Retrofitting Scheme
The buckling-restrained braces are installed externally in a straight-line configuration, with the span width Lb defined as the horizontal length. The lateral stiffness of the retrofitted frame, Ktotal, is then calculated. The rhombically perforated fractal buckling-restrained braces are selected and arranged according to the lateral-stiffness ratio while satisfying the prescribed slenderness-ratio limit, as expressed in Equation (1).
where Ktotal denotes the initial lateral stiffness of the retrofitted frame; Kframe denotes the initial lateral stiffness of the unretrofitted RC frame in the direction considered, evaluated with respect to the same lateral displacement coordinate and boundary conditions; E is the elastic modulus of the load-carrying steel core; and Abr denotes the sum of the net cross-sectional areas of components 2, 3, and 4 shown in Figure 1a. Lb denotes the external span width, adopted as the effective axial length in this simplified stiffness representation.
As illustrated in Figure 7, Equation (1) assumes that the RC frame and the equivalent BRB contribution undergo the same lateral displacement and that their restoring forces are additive. The expression is an initial elastic idealization in which connection and strongback flexibility are not explicitly represented.
Figure 7.
Idealized parallel stiffness representation of the RC frame and BRB contribution corresponding to Equation (1).
As the primary lateral-force-resisting component, a buckling-restrained brace provides the structure with additional lateral stiffness through its axial stiffness. Under seismic excitation, frame structures may develop substantial horizontal shear forces, resulting in considerable global lateral displacement. Therefore, the number and arrangement of braces are critical design considerations. Common retrofit configurations include internal single-diagonal, inverted-V, and K-shaped bracing. For external retrofit systems, the force-transfer and deformation behavior of the connections must be carefully considered to ensure adequate load-bearing capacity of both the braces and their connections under axial loading. Accordingly, an externally mounted straight-line bracing configuration is adopted in this study.
A novel buckling-restrained brace is installed on the right side of the structure, with its two ends connected to the frame and a strongback column, respectively. A high-stiffness H-section steel member is used as the strongback column. It has a total length of 20 m, a flange thickness of 15 mm, a web thickness of 10 mm, and overall cross-sectional dimensions of 400 mm × 400 mm, thereby providing sufficient stiffness. Based on the prototype structure, a single-bay substructural frame is designed. The exterior column of the substructure is connected to the H-section steel strongback column by the novel buckling-restrained braces, with stiffener plates welded at the connections. A schematic illustration of the retrofitted substructure is presented in Figure 8.
Figure 8.
Schematic elevation of the external RP-FD-BRB retrofit showing the measurement of the external span width, Lb. The investigated values were 600, 900, and 1200 mm. The schematic is not to scale.
The external span width, Lb, is defined as the horizontal distance between the brace connection face on the exterior RC column and the corresponding connection face on the external steel strongback column, as indicated in Figure 8. The values of Lb for configurations RP-WZ-0.6, RP-WZ-0.9, and RP-WZ-1.2 are 0.6, 0.9, and 1.2 m, respectively. The corresponding brace dimensions are given in Section 6.1.
The present investigation focuses on the in-plane seismic response of the selected RC frame in the X direction, along which the external straight-line RP-FD-BRB configuration was arranged and evaluated. The selection of this direction does not imply that it is the weaker direction of the building or that it should be strengthened preferentially over the Y direction. The analyses are intended to assess the response of the investigated retrofit configuration in the selected direction, rather than to establish a complete building-level retrofit scheme. Accordingly, the reported retrofit benefits are restricted to the analyzed X-direction frame and loading conditions; the effectiveness of Y-direction retrofitting and the bidirectional seismic performance of the building remain outside the scope of this study.
3. Development of the Finite Element Model
3.1. Material Constitutive Models
ABAQUS was employed to simulate the reinforced concrete frame structure. For the three-dimensional solid model, the concrete damage plasticity (CDP) constitutive model was adopted, as illustrated in Figure 9, while a bilinear constitutive model was used for the reinforcing steel, as shown in Figure 10. The expressions used to convert the material data for input into ABAQUS are given in Equations (2) and (3).
where d is the damage variable, σ is the true stress of concrete, ε is the true strain of concrete, and E0 is the initial elastic modulus of concrete.
where εpl is the plastic strain, εt is the total strain, εel is the elastic strain, σ is the true stress, and E is the elastic modulus.
Figure 9.
Concrete Constitutive Model.
Figure 10.
Steel Reinforcement Constitutive Model.
According to the Code for Design of Concrete Structures (GB 50010-2010, 2015 edition; MOHURD, 2015) [38], in finite element modeling, the confined Mander model—which considers the confinement effect of stirrups—was utilized for concrete, whereas a standard stress–strain model was employed for steel reinforcement (see Figure 11a,b). The Mander model is defined by Equations (4)–(8):
Figure 11.
Constitutive stress–strain models for (a) confined concrete in compression (Mander model) and (b) steel (three-stage model).
In the formulas:
fc represents the compressive stress of concrete;
f’cc denotes the peak compressive strength of confined concrete;
εcc is the compressive strain corresponding to the peak stress of confined concrete;
εc refers to the compressive strain of concrete;
Ec and Esec represent the elastic modulus and secant modulus of concrete, respectively;
f’co represents the peak compressive strength of unconfined concrete.
The stress–strain curve of the steel is expressed by Equation (9), and the specific model is illustrated in Figure 11b.
In the formulas:
Es represents the elastic modulus of steel;
fy and εy denote the yield strength and yield strain, respectively;
k1 is defined as the ratio of initial hardening strain to yield strain;
k2 indicates the ratio of peak strain to yield strain;
k3 stands for the ratio of peak stress to yield.
Concrete was represented using the concrete damaged plasticity (CDP) formulation in ABAQUS. The constitutive definition comprised linear isotropic elasticity and tabulated uniaxial compressive and tensile behavior. The concrete elastic modulus, Poisson’s ratio, and density were 30,000 MPa, 0.16, and 2400 kg/m3, respectively. The CDP parameters were a dilation angle of 30°, a flow potential eccentricity of 0.1, an initial equibiaxial-to-uniaxial compressive yield stress ratio of 1.16, a yield-surface parameter Kc of 0.667, and a viscosity parameter of 0.005 s. These properties are summarized in Table 1.
Table 1.
Concrete properties and CDP parameters.
The compressive constitutive input was specified as compressive stress versus inelastic strain. The inelastic strain was calculated by subtracting the elastic strain associated with the initial elastic modulus from the total compressive strain. The compressive response began at 25.0928 MPa at zero inelastic strain, reached a maximum stress of 29.7137 MPa at an inelastic strain of 0.000814, and subsequently decreased to 12.4309 MPa at an inelastic strain of 0.00451.
The tensile constitutive input was specified as tensile stress versus cracking strain. The first stress was 1.42134 MPa at zero cracking strain. The stress increased to 2.0 MPa at a cracking strain of 0.0000283333 and then decreased to 0.849706 MPa at a cracking strain of 0.000256676. Thus, the tensile input included a short rising branch followed by a descending branch.
Table 2 summarizes the elastic properties and plastic hardening parameters of the reinforcing and structural steels. The initial yield stresses of HRB400, HRB335, Q345, and Q235 were 400, 335, 345, and 235 MPa, respectively. All four materials were represented using linear isotropic elasticity and isotropic hardening plasticity. The plastic response was specified by the initial yield stress at zero equivalent plastic strain and a second stress–plastic strain point, with linear interpolation between the two points. The plastic hardening modulus, H, was calculated as the stress increment divided by the corresponding equivalent plastic strain increment and should be distinguished from the tangent modulus of the total stress–strain response.
Table 2.
Properties and plastic hardening parameters of reinforcing and structural steels.
3.2. Element Selection, Boundary Conditions, and Loading
In the straight-line retrofit configuration, the novel buckling-restrained braces primarily resist axial forces, whereas the frame and strongback column are subjected to combined axial compression, bending, and shear. To investigate the mechanical behavior of the frame retrofitted with externally mounted RP-FD-BRBs, C3D8R elements were used to model the concrete members, buckling-restrained braces, and strongback column, while T3D2 elements were adopted for the reinforcing bars. C3D8R is an eight-node linear hexahedral solid element with reduced integration and hourglass control. This formulation was selected to limit the computational cost of the three-dimensional nonlinear time-history analyses while alleviating the artificial bending stiffness associated with shear locking in first-order, fully integrated solid elements. Reduced integration decreases the number of constitutive evaluations, which is beneficial when concrete damage and steel plasticity are considered over multiple earthquake records and retrofit configurations. However, first-order reduced-integration elements can exhibit nonphysical zero-energy deformation modes, commonly referred to as hourglass modes. The C3D8R formulation incorporates hourglass control to suppress these modes, but its accuracy remains dependent on mesh resolution and element quality, particularly in regions governed by bending or localized deformation. The adopted mesh sizes are reported in Section 3.3.
The reinforcement within the concrete beams, columns, and floor slabs was coupled to the surrounding concrete using the Embedded Region constraint to ensure composite action. Tie constraints were applied to the beam-to-beam, beam-to-column, and beam/column-to-slab interfaces to maintain structural continuity.
Finite-sliding surface-to-surface contact was defined between the RP-FD-BRB core and its external restraining components. Hard contact was used in the normal direction, with separation permitted, and the tangential behavior was frictionless. No separate initial clearance was prescribed for these contact pairs, and automatic adjustment of the contacting surfaces was disabled. The initial geometric clearance is therefore described by the assembled component geometry. The selected brace end faces were tied to the corresponding interface surfaces of the RC frame and the steel strongback. The tie constraints represent bonded load transfer at these interfaces, while the core–restraint contact allows relative sliding and separation.
The finite element models used for the El Centro case with a PGA of 35 cm/s2 included multiple bays of the reinforced concrete frame. The support degrees of freedom were restrained during gravity initialization. In the subsequent dynamic step, the ground acceleration was prescribed in the global X direction, while the other support restraints were maintained. In the retrofitted model, the same acceleration history was also prescribed at the bases of the external steel strongback columns. No ZSYMM boundary condition was applied in these two analyses.
The mass in the two models was derived from the densities assigned to the concrete and reinforcement, which were 2400 and 7850 kg/m3, respectively. The material definitions used for the external braces and steel strongback columns in the retrofitted job did not include density, so their mass was omitted. Self-weight was applied in an initial 1 s static step using a gravitational acceleration of 9.8 m/s2 in the negative global Z direction and was retained during the dynamic analysis. Material-level Rayleigh damping was assigned using mass- and stiffness-proportional coefficients of 0.079259 s−1 and 0.00504673 s for the concrete, and 0.198147 s−1 and 0.0126168 s for the reinforcement, respectively.
The El Centro acceleration record was tabulated at 0.02 s intervals over 20 s and scaled to a peak ground acceleration of 35 cm/s2. The dynamic step lasted 30 s and was solved using implicit Hilber–Hughes–Taylor integration with automatic time incrementation. The initial and minimum allowable increments were 0.01 s and 10−6 s, respectively. The unretrofitted and retrofitted jobs used the transient-fidelity and moderate-dissipation settings, with maximum allowable increments of 0.30 s and 3.00 s, respectively. Geometric nonlinearity was disabled during both the gravity and dynamic steps, so P–Δ effects were omitted. The concrete models before and after retrofitting are shown in Figure 12.
Figure 12.
Finite element model of the reinforced concrete building before and after retrofitting.
In the retrofitted substructure, the RP-FD-BRBs connect the exterior RC column to the steel strongback. The brace forces are transferred through the end connections to the RC frame and the strongback, and then to their respective supports. The fixed column-base conditions and the symmetry constraints at the truncated beam and slab boundaries define the restraints adopted in the numerical model. The predicted response of the substructure is therefore interpreted under these idealized support and boundary conditions. The brace stability checks presented in Section 6.1 address the brace members. Assessment of the stability of the assembled retrofit system also requires evaluation of the strongback, its connections, and the foundation anchorage.
3.3. Mesh Discretization and Reinforcement-Cage Modeling
During mesh discretization, the mesh sizes were appropriately determined according to the actual dimensions of the structural components to balance computational accuracy and efficiency. A mesh size of 100 mm was adopted for the frame beams and columns, while a mesh size of 20 mm was used for the floor slabs. The principal mesh-generation procedure is illustrated in Figure 13.
Figure 13.
Mesh generation before and after retrofitting.
When establishing the finite element model of the reinforcement cage, all reinforcing-bar components were assigned truss elements. Assembly operations—including coordinate transformation, array replication, and midpoint and coordinate alignment—were then performed to integrate the individual reinforcing-bar components into a complete reinforcement cage. The models before and after retrofitting are shown in Figure 14. During mesh discretization, a global seed size of 100 mm was uniformly assigned to the reinforcement cages in the slabs, columns, and beams. By contrast, the seed sizes for the strongback column and the rhombically perforated fractal buckling-restrained brace were refined to 50 mm and 2 mm, respectively.
Figure 14.
Reinforcement cage model before and after retrofitting.
3.4. Modal Properties Before and After Retrofitting
To examine how the external RP-FD-BRB retrofit changes the dynamic properties of the six-story reinforced concrete frame, eigenvalue analyses were performed for the unretrofitted and retrofitted finite element models. Table 3 summarizes the natural frequencies and corresponding periods of the first two vibration modes for each model. The modal periods provide a basis for interpreting the ground-motion response spectra discussed in Section 4.
Table 3.
Natural frequencies and periods of the first two vibration modes before and after retrofitting.
As shown in Table 3, the periods of the first two modes were 0.9735 and 0.9637 s before retrofitting and fell within the range of 0.5843–0.5896 s after retrofitting. Both periods were approximately 40% shorter after retrofitting, a change consistent with an increase in the effective stiffness of the retrofitted system. The shorter periods shift the modal response to different regions of the ground-motion response spectra, where the spectral acceleration may be higher or lower depending on the record. This period shift may help explain why the reduced interstory drifts were accompanied by different changes in peak base-shear demand across the ground motions in Figure 26.
4. Selection of Ground-Motion Records
In accordance with Article 5.1.2 of the Code for Seismic Design of Buildings (GB 50011–2010, 2016 edition) [38], ground-motion records should be selected by comprehensively considering factors such as the site classification and design earthquake group of the structure. In this study, the El Centro and Taft records, together with an artificial ground motion generated to match the code-specified target response spectrum, were selected. Their acceleration time histories are presented in Figure 15, and all three records satisfy the relevant code requirements. The acceleration amplitudes of the ground motions were scaled according to Table 4, after which dynamic time-history simulations were performed for the structure under frequent and rare earthquake intensity levels.
Figure 15.
Ground motion waveforms.
Table 4.
Peak acceleration values of selected ground motions (cm/s2).
The frequency characteristics of the three ground motions were examined using the Fourier amplitude spectra shown in Figure 16 and the 5%-damped elastic absolute acceleration response spectra shown in Figure 17. Each acceleration record was normalized by its own peak ground acceleration (PGA) to compare spectral shapes independently of amplitude scaling. All three records have a duration of 20 s and a sampling interval of 0.02 s. As shown in Figure 16, the dominant Fourier frequencies of the El Centro, Taft, and artificial motions are approximately 1.149, 1.399, and 1.099 Hz, respectively. Figure 17 shows that their maximum normalized acceleration spectral ordinates, Sa/PGA, are approximately 2.661, 3.850, and 3.503, occurring at oscillator periods of 0.255, 0.355, and 0.550 s, respectively. Although the dominant Fourier frequencies are relatively close, the response spectra exhibit different peak locations and amplification levels, indicating differences in the period-dependent acceleration demands imposed by the three motions. These spectral characteristics describe the input motions; their relationship to the dynamic properties of the original and retrofitted structures requires comparison with the corresponding modal periods.
Figure 16.
Fourier amplitude spectra of the ground-motion accelerations normalized by their respective PGAs: (a) El Centro; (b) Taft; (c) artificial motion.
Figure 17.
PGA-normalized elastic absolute acceleration response spectra of the three ground motions at a damping ratio of 5%.
The PGA normalization in Figure 17 is used to compare spectral shapes. Assessment of compatibility with the target spectrum requires comparison of the spectra of the scaled input motions with the corresponding target spectrum over a specified period range.
5. Comparative Analysis of Structural Seismic Performance Before and After Retrofitting
Finite element simulations were conducted for the six-story RCF structure, designed for a design seismic intensity of 7, both before and after retrofitting. In accordance with the relevant provisions of the Code for Seismic Design of Buildings (GB 50011–2010, 2016 edition) [38], the El Centro, Taft, and artificial ground-motion records were selected as seismic inputs. Their peak ground accelerations were scaled to 35 cm/s2 and 220 cm/s2, corresponding, respectively, to frequent and rare earthquake levels for a region with a design seismic intensity of 7.
The original frame described in Section 2.1 had beam cross-sections of 300 × 600 mm and column cross-sections of 350 × 350 mm. For the rare-earthquake analyses, these dimensions were reduced to 300 × 500 mm and 300 × 300 mm, respectively. Thus, the beam width remained unchanged, whereas its depth decreased from 600 to 500 mm; both column cross-sectional dimensions decreased from 350 to 300 mm. The reduced-section frame was treated as a separate numerical case with lower lateral stiffness, rather than as a representation of earthquake-induced deterioration of the original frame. Both the unretrofitted and retrofitted models in this case adopted the same reduced beam and column cross-sections. Their RC frame geometry, reinforcement detailing, material properties, gravity loading, boundary conditions, damping assumptions, and ground-motion input were identical; the intended difference was the addition of the external retrofit system. This consistency permits a paired assessment of retrofit effectiveness for the reduced-section frame.
The ground motions were applied in the global X direction only. The vertical component of ground motion was not included because the analyses were designed to compare the lateral seismic response of the unretrofitted and retrofitted frames under a common horizontal input. Gravity loading was applied separately during the initial static step and maintained during the dynamic step. The reported retrofit effects therefore apply to the horizontal excitation cases examined. The influence of simultaneous horizontal and vertical excitation remains outside the scope of this comparison.
5.1. Comparison of Concrete Damage
The tensile and compressive damage to the concrete in the RCF structure before and after retrofitting was evaluated. In the concrete damaged plasticity (CDP) model, DAMAGET denotes the dimensionless tensile damage variable dt. Its theoretical range is from 0 to 1, where 0 indicates no tensile stiffness degradation and 1 represents the limiting case of complete loss of tensile stiffness. Higher DAMAGET values in the contours indicate more severe local degradation of the concrete tensile stiffness.
Figure 18 presents pushover curves for the six-story reinforced concrete frame before and after retrofitting in the X and Y directions. The horizontal and vertical axes represent the normalized roof displacement and normalized base shear, respectively. In both directions, the retrofitted curves have a steeper initial slope and a higher peak base shear than the unretrofitted curves, illustrating greater initial lateral stiffness and peak lateral resistance. The increase in peak base shear shown in the Y direction is slightly smaller than that shown in the X direction.
Figure 18.
Pushover curves of the six-story reinforced concrete frame before and after retrofitting with external RP-FD-BRBs. (a) X-direction. (b) Y-direction. The IO*, LS*, and CP* markers illustrate the Immediate Occupancy, Life Safety, and Collapse Prevention performance levels.
As the roof displacement increases, the slope of each curve decreases before the curve reaches its peak. Beyond the peak, the descending branches illustrate a gradual loss of lateral resistance with increasing displacement. At a given displacement along the descending branch, the retrofitted curve remains above the corresponding unretrofitted curve in each panel. The IO*, LS*, and CP* markers show illustrative positions for the Immediate Occupancy, Life Safety, and Collapse Prevention performance levels along the retrofitted curves.
5.2. Comparison of Reinforcement Stress and Displacement
The stress distributions in the reinforcement cages of the frame structure before and after retrofitting are shown in Figure 19. As illustrated in Figure 19a, the reinforcement stress in the unretrofitted frame gradually decreases with increasing story height. The maximum stress occurs at the base of the structure and is particularly pronounced in the interior columns. Relatively low stress levels are observed in the central regions of the second through fourth stories, while the stress spreads from the interior columns toward the exterior columns and gradually decreases. Under the same loading conditions, the stress contour plot of the retrofitted structure in Figure 19b shows that the stress state of the reinforcement in the ground story is substantially improved, with reduced stress in the interior columns and a more uniform overall stress distribution.
Figure 19.
Stress contours of the reinforcement bars before and after retrofitting (in MPa).
The reinforcement displacement distributions in the frame structure before and after retrofitting are shown in Figure 20. As illustrated in Figure 20a, the central region of each floor in the unretrofitted frame undergoes relatively large displacements, particularly near the interior columns. The displacement and deformation at the center of each floor slab are greater than those around its perimeter. This may be attributed to cyclic tension and compression induced by concentrated loading in the central slab region, whereas loads near the slab edges are transferred to the columns and beam ends. At the global structural level, reinforcement displacement increases progressively with story height.
Figure 20.
Displacement contours of the reinforced concrete frame before and after retrofitting (in mm).
Following retrofitting, the reinforcement displacement contour plot under the same loading conditions, presented in Figure 20b, shows a marked reduction in reinforcement displacement in the ground story. The overall structural displacement is also substantially lower than that of the unretrofitted frame. Therefore, retrofitting the frame with RP-FD-BRBs effectively reduces its displacement response and improves its seismic performance.
5.3. Comparison of Global Displacement and Acceleration Responses
The global displacement contour plots of the structure before and after retrofitting are presented in Figure 21. The comparison shows that the unretrofitted structure undergoes relatively large global displacement, with pronounced deformation in the central regions of the floor slabs. After retrofitting, the global displacement response is effectively controlled, with the most substantial reduction occurring in the lower stories. The displacement at every story is lower than that of the unretrofitted structure.
Figure 21.
Overall displacement contours of the structure before and after retrofitting (in mm).
The acceleration contour plots of the structure before and after retrofitting are presented in Figure 22. Under seismic excitation, the acceleration distributions on the two sides of the structure are consistent and approximately symmetric. Within each story, however, the acceleration is nonuniform and progressively increases from one end toward the exterior. Along the building height, the acceleration response accumulates and amplifies with increasing story level, showing pronounced acceleration amplification toward the roof retrofitting with the novel buckling-restrained braces, the overall structural acceleration decreases. The acceleration contours show the differences in floor response between the unretrofitted and retrofitted frames for the case shown. These contours provide a comparison of structural acceleration, while the onset of brace yielding requires examination of the brace response during the analysis.
Figure 22.
Overall acceleration contours of the structure before and after retrofitting (in mm/s2).
5.4. Comparison of Interstory Displacement and Interstory Drift Ratio
Figure 23 and Figure 24 compare the peak interstory displacement and interstory drift ratio (IDR) profiles of the six-story frame before and after retrofitting. The profiles are presented for the El Centro, Taft, and artificial ground motions at both the frequent and rare earthquake levels. For each analysis, the interstory displacement was calculated at every time step as the difference between the simultaneous horizontal displacements at the upper and lower levels of each story in the direction of excitation. The peak interstory displacement was then taken as the maximum absolute value of this difference over the entire response history. The peak IDR was obtained by dividing this value by the corresponding story height, following the drift-ratio definition in FEMA P-58-1 [39].
Figure 23.
Maximum interstory displacement before and after retrofitting (mm).
Figure 24.
Interstory drift ratio before and after retrofitting (dimensionless).
Each point in the profiles represents the peak response of an individual story, and the peaks at different stories may occur at different times. Figure 23 shows the absolute relative movement between adjacent levels in millimeters, while Figure 24 accounts for differences in story height and allows comparison of deformation demands across stories. Comparing the unretrofitted and retrofitted profiles under the same ground motion and earthquake level shows how the retrofit affects the magnitude and vertical distribution of peak deformation demands. The dashed lines provide reference values for evaluating these demands at each story.
Figure 24 uses the drift-ratio limits tabulated for reinforced concrete frames in GB 50011–2010 (2016 edition) [38] as reference values. The elastic limit is 1/550 for frequent earthquakes (Table 5.5.1). For rare earthquakes, the tabulated inelastic limit of 1/50 for weak stories (Table 5.5.5) is shown as a common reference across the story profiles. Thus, Figure 24 shows one vertical reference line per earthquake intensity level.
Table 5.
Frame member dimensions and brace dimensions adopted for the three retrofit configurations.
In Figure 23, the corresponding displacement limit at each story was obtained by multiplying the drift-ratio limit by the story height, in accordance with Equations (5.5.1) and (5.5.5) of GB 50011–2010 [38]. Story 1 is 3.6 m high, whereas Stories 2–6 are each 3.0 m high. The resulting displacement limits are 6.55 mm for Story 1 and 5.45 mm for Stories 2–6 under frequent earthquakes, and 72 mm for Story 1 and 60 mm for Stories 2–6 under rare earthquakes. The step in the dashed line in Figure 23 therefore reflects the change in story height between Stories 1 and 2.
Figure 23a,b show the interstory displacement profiles under the El Centro ground motion at the frequent- and rare-earthquake intensity levels, respectively. The corresponding drift ratio profiles are shown in Figure 24a,b. Before retrofitting, the maximum interstory displacements were 5.82 mm and 86.5 mm for the frequent and rare earthquakes, respectively. The corresponding maximum drift ratios were 0.00182 and 0.0285. The frequent-earthquake value was approximately equal to the elastic drift ratio limit of 1/550 at the reported precision. Under the rare earthquake, the maximum drift ratio of the unretrofitted reduced-section frame exceeded the limit of 1/50. After retrofitting, the peak interstory displacement decreased markedly under the frequent earthquake. Under the rare earthquake, both peak interstory displacement and peak drift ratio decreased, with reductions of approximately 50% in the drift ratios of the intermediate stories.
Figure 23c,d show the displacement profiles under the Taft ground motion. Retrofitting reduced the peak interstory displacements at both intensity levels. The reductions at the intermediate stories were somewhat smaller than those observed under the El Centro record. Figure 24c,d present the corresponding drift ratio profiles. Under the rare-earthquake Taft excitation, retrofitting also reduced the drift ratios.
Figure 23e,f show the displacement profiles under the artificial ground motion, and Figure 24e,f show the corresponding drift ratio profiles. Both response measures decreased after retrofitting. The maximum drift ratio decreased from 0.00183 to 0.00074 under the frequent earthquake and from 0.0300 to 0.0164 under the rare earthquake. The retrofitted frame remained below the applicable drift ratio limit at both intensity levels.
5.5. Comparison of Roof Acceleration
The roof acceleration time-history curves before and after retrofitting under the three selected ground-motion records were compared and analyzed, as shown in Figure 25.
Figure 25.
Roof acceleration time-history curves before and after retrofitting.
As shown in Figure 25a, under the El Centro ground motion at the frequent-earthquake intensity level, the maximum roof acceleration of the unretrofitted frame reaches 62.7 cm/s2. After external retrofitting with RP-FD-BRBs, the maximum roof acceleration decreases to 29.2 cm/s2, representing a reduction of 53.4%. As shown in Figure 25b, under the El Centro ground motion at the rare-earthquake intensity level, the unretrofitted frame exhibits a large roof-acceleration response, with a peak value of 577.65 cm/s2. Following retrofitting with the buckling-restrained braces, the peak roof acceleration decreases to 287.6 cm/s2, corresponding to a reduction of 50.2%. Moreover, after the seismic excitation ends, the acceleration amplitude of the retrofitted frame system gradually decays, whereas the unretrofitted frame continues to exhibit pronounced oscillations.
As shown in Figure 25c, under the Taft ground motion at the frequent-earthquake intensity level, the maximum roof acceleration decreases from 56.2 cm/s2 before retrofitting to 29.1 cm/s2 after retrofitting, representing a reduction of 48.2% and demonstrating the effectiveness of the retrofit. Under the rare-earthquake condition shown in Figure 25d, the maximum roof acceleration is reduced by 46.5% after retrofitting. Under the Taft ground motion, the retrofitted frame exhibited a lower peak roof acceleration than the unretrofitted frame.
As shown in Figure 25e, under the artificial ground motion at the frequent-earthquake intensity level, the unretrofitted frame exhibits a relatively large peak roof acceleration of 52.4 cm/s2. The acceleration time-history suggesting that the unretrofitted primary frame undergoes a stronger dynamic response structure. Under the artificial ground motion at the frequent-earthquake intensity level, the peak roof acceleration decreased from 52.4 cm/s2 before retrofitting to 26.5 cm/s2 after retrofitting, a reduction of 49.4%.
Figure 25f shows that, under the rare-earthquake condition, the roof-acceleration amplitude of the unretrofitted frame increases further, and its time-history curve continues to exhibit pronounced fluctuations. Under the same rare-earthquake excitation, the peak roof acceleration of the retrofitted frame was 44.8% lower than that of the unretrofitted frame.
5.6. Comparison of Base Shear
Figure 26 compares the base-shear time histories of the unretrofitted and retrofitted frames under the El Centro, Taft, and artificial ground motions at the frequent- and rare-earthquake intensity levels. The effect of retrofitting on base shear varies with the ground-motion record, intensity level, and stage of the response. For example, under the frequent-earthquake artificial motion in Figure 26e, the retrofitted frame exhibits a larger positive shear excursion at approximately 7 s. At other times, the retrofitted response can be smaller. These comparisons show that retrofitting did not consistently reduce the base-shear demand. The peak demand for each case should be evaluated as the maximum absolute base shear over the entire time history, because the governing peaks of the two models may occur at different times and have opposite signs.
Figure 26.
Base shear time-history curves before and after retrofitting.
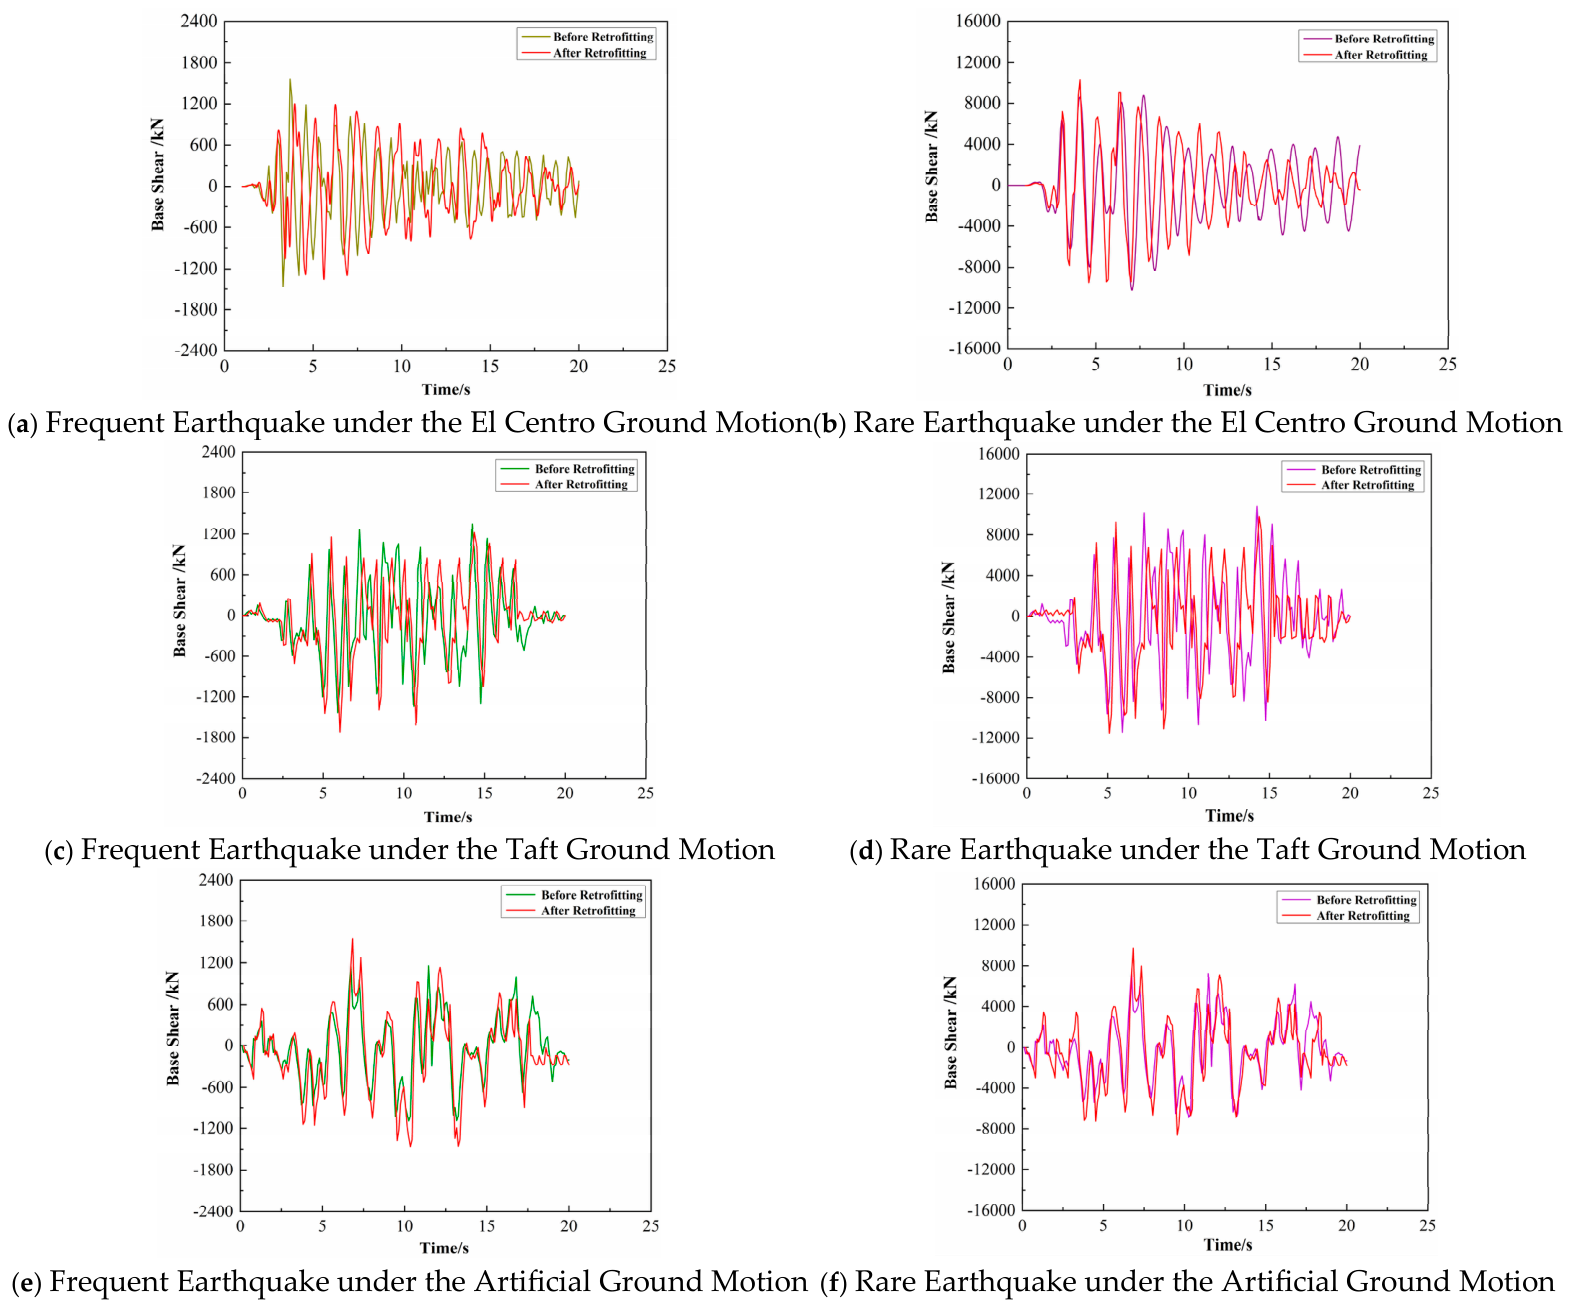
The decrease in interstory deformation reported in Section 5.4 can coexist with a higher base-shear demand. The external bracing changes the lateral stiffness and the load path of the retrofitted system. Changes in stiffness can alter the vibration periods and modal response, so the resulting inertia forces depend on the frequency content of the input motion. Consequently, the reduction in interstory displacement does not imply a corresponding reduction in the total horizontal reaction at the supports. The time histories in Figure 26 establish the variation in shear demand, while determining the contribution of brace yielding would require direct examination of the brace force–deformation response. The results therefore indicate that improved deformation control can be accompanied by increased force demands in some cases, which should be considered when assessing the brace connections, strongback supports, and foundations.
It is important to note that the external retrofitting strategy does not consistently reduce the peak base shear, and in some instances (e.g., Figure 26b,d), it even amplifies the maximum absolute shear compared to the unretrofitted frame. This phenomenon is not a failure of the retrofit scheme, but rather an inherent dynamic trade-off dictated by structural dynamics. First, the addition of external braces significantly increases the lateral stiffness, which shortens the fundamental period of the structure. According to typical response spectra, a stiffer system often attracts larger seismic inertia forces, directly resulting in a higher total horizontal reaction at the supports. Second, the modified stiffness alters the modal response and phase characteristics of the system. As observed in Figure 26, the governing peaks of the retrofitted and unretrofitted frames occur at different times, and the response is highly sensitive to the frequency content of the specific ground motion. Finally, while the peak shear demand is not reduced, the yielding of the braces provides crucial hysteretic damping that dissipates seismic energy. This energy dissipation is precisely what protects the primary frame and results in the reduced interstory drift. Therefore, the base shear comparisons in Figure 26 demonstrate that improved deformation control is achieved through a stiffness-based mechanism that inevitably increases force demands on the foundation, emphasizing the necessity of strengthening the connections, strongback supports, and foundations to accommodate these amplified peak forces.
6. Comparison of External Retrofit Configurations with Fixed Brace Geometric Ratios
Following the comparison between the unretrofitted and retrofitted frames, this section examines three external RP-FD-BRB retrofit configurations with different combinations of external span width and brace dimensions. The external span width, Lb, denotes the horizontal distance between the brace centerline and the adjacent frame column, as defined in Section 2. Three values, 0.6, 0.9, and 1.2 m, were considered, and the corresponding configurations were designated RP-WZ-0.6, RP-WZ-0.9, and RP-WZ-1.2, respectively.
The brace dimensions were selected under two geometric constraints: a length-to-width ratio of 6 and a width-to-thickness ratio of 10. Maintaining these ratios required the brace width and thickness to increase with brace length. Consequently, each configuration combines a specified external span width with a corresponding set of brace dimensions. The comparison was intended to examine the seismic responses of these proportionally dimensioned retrofit configurations, rather than to isolate external span width as an independent variable.
The configurations were compared in terms of interstory displacement, interstory drift ratio, roof acceleration, absolute floor acceleration, and base shear. The assessment focuses on the relative response-control performance of the three configurations for the adopted frame and seismic inputs. Because external span width and brace dimensions vary together, the results are interpreted as configuration-level differences. They do not establish an independently optimal external span width or a general design recommendation.
6.1. Model Overview and Member Verification
Three ABAQUS models were established for the externally retrofitted six-story RC frame. The frame member dimensions were identical across the three configurations: the beams had cross-sectional dimensions of 300 × 500 mm, the columns had cross-sectional dimensions of 300 × 300 mm, and the floor slabs were 100 mm thick. These dimensions apply to the configuration comparison presented in this section. The external span widths and corresponding brace dimensions are summarized in Table 5.
For clarity, Lbr, bbr, and tbr denote the brace length, width, and thickness, respectively. The adopted geometric constraints were Lbr/bbr = 6 and bbr/tbr = 10. The brace dimensions were therefore 600 × 100 × 10 mm for RP-WZ-0.6, 900 × 150 × 15 mm for RP-WZ-0.9, and 1200 × 200 × 20 mm for RP-WZ-1.2. All dimensions are expressed as length × width × thickness. This selection maintains the same length-to-width and width-to-thickness ratios while changing the dimensional scale of the brace.
These geometric constraints should be distinguished from constraints on mechanical properties. Maintaining the two ratios does not maintain constant brace axial stiffness, yield force, or steel volume. Moreover, the length-to-width ratio is distinct from the member slenderness ratio, which depends on effective length, radius of gyration, and restraint conditions. The three configurations should therefore not be interpreted as mechanically equivalent braces installed at different external span widths.
Accordingly, the comparison considers external span width and brace dimensions as coupled configuration parameters. The existing numerical results are used to compare the responses of these three configurations without separating the individual contributions of span width and brace size. Any configuration identified as better-performing is restricted to the response measures and analysis conditions considered in this study.
Brace dimensions are given as length × width × thickness. The brace length-to-width ratio and width-to-thickness ratio are 6 and 10, respectively, for all three configurations. The configuration labels denote external span widths of 0.6, 0.9, and 1.2 m; the associated brace dimensions also vary, as shown in the table.
The frame considered in this section has a first-story height of 3.6 m and typical-story heights of 3.0 m. The adopted seismic design parameters are a design intensity of 7, Site Class II, and Design Earthquake Group III. The damping ratio is 0.05, and the characteristic site period is 0.45 s.
The detailed configuration comparisons presented in Section 6.2, Section 6.3 and Section 6.4 are based on the El Centro excitation. Accordingly, the relative performance reported in these subsections is specific to the selected record and the corresponding analysis conditions. These results are not taken as evidence that the same ranking necessarily applies to the Taft and artificial records, other ground motions, or different earthquake intensity levels.
Before selecting the buckling-restrained braces, the proposed brace cross sections must be verified. In accordance with the provisions for axially loaded members in the Standard for Design of Steel Structures (GB 50017–2017) [40], the cross-sectional strength and overall stability of the externally mounted straight-line braces are checked.
(1) Cross-sectional strength verification of the brace: This check ensures that the brace cross section does not fail in tension or compression under the applied axial force, as expressed in Equation (10).
where N is the axial compressive or tensile force, Acor is the net cross-sectional area of the buckling-restrained brace, and f is the specified yield strength of the steel.
(2) Overall stability verification: This check is performed to prevent global flexural buckling of the brace under axial compression, as expressed in Equation (11).
where φ is the stability coefficient of the axially compressed member, determined by the member slenderness ratio and steel strength, and A is the gross cross-sectional area.
(3) Local Stability Verification: This check is performed to prevent local buckling of the member under compression, as expressed in Equations (12) and (13).
where λ is the larger slenderness ratio of the member about its two principal axes, h is the effective depth of the member web, and tw is the web thickness.
The strength and stability checks in this section apply to the brace members. Verification of the connections requires comparison of the force and moment demands at the brace ends and strongback base with the corresponding resistances of the connection plates, bolts, welds, and anchorage. The tied interfaces in the finite element model represent idealized load transfer. The capacities of the actual connection and anchorage details require separate assessment.
6.2. Comparison of Interstory Displacements
The interstory displacement time-history curves of the intermediate stories for the structures retrofitted with different external span widths are shown in Figure 27. Compared with the unretrofitted structure, the structures retrofitted with externally mounted RP-FD-BRBs exhibit significantly lower interstory displacements, vibration amplitudes, and peak displacements. The peak displacements of the RP-WZ-0.6, RP-WZ-0.9, and RP-WZ-1.2 configurations are reduced by 51.2%, 58.6%, and 55.8%, respectively.
Figure 27.
Interstory displacement time-history curves for different span widths.
The RP-WZ-0.9 configuration produces the smallest variation in interstory displacement at all floor levels. Its displacement time-history curves are also smoother, with the response becoming essentially stable after 22 s and exhibiting only minor subsequent fluctuations. The RP-WZ-1.2 configuration provides the second-best performance, with its displacement response becoming generally stable after 24 s. By contrast, the RP-WZ-0.6 configuration exhibits the largest interstory displacement variation. Although its displacement response shows only moderate fluctuations, residual deformation remains after the ground motion ends, possibly because the braces yielded prematurely or exhibited insufficient deformation compatibility.
To provide a more intuitive comparison of the effectiveness of the retrofit schemes with different external span widths, the maximum interstory displacement profiles of the six-story frame retrofitted using the three configurations are presented in Figure 28. The corresponding interstory drift ratios are shown in Figure 29.
Figure 28.
Maximum interstory displacement for different external span widths.
Figure 29.
Interstory drift ratio for external span widths.
As shown in Figure 28 and Figure 29, all three retrofit schemes significantly reduce the maximum interstory displacement and the corresponding interstory drift ratio. The maximum interstory displacements of the three retrofitted structures are 2.42, 2.12, and 2.23 mm, respectively, with corresponding maximum interstory drift ratios of 0.000807, 0.000707, and 0.000743. These results demonstrate that all three configurations effectively suppress the lateral deformation of the structure and substantially enhance the lateral stiffness of the frame.
The RP-WZ-0.9 retrofit scheme achieves the greatest reduction in maximum interstory displacement and outperforms the other two configurations. For RP-WZ-0.6, the relatively small external span width results in an excessively low structural length-to-width ratio, leading to premature instability of the brace members. Local disruption of the force-transfer path between the braces and the primary structure also produces a relatively large difference between the drift ratios of the ground and top stories, indicating poor deformation compatibility. For RP-WZ-1.2, the excessively large external span width results in overly high brace stiffness, thereby reducing the energy-dissipation capacity.
Therefore, at an external span width of 0.9 m, the retrofit system exhibits the most favorable composite action with the primary structure and effectively suppresses nonuniform structural deformation. Accordingly, under seismic excitation, novel buckling-restrained braces with an external span width of approximately 0.9 m can more effectively protect the primary structure through yielding and energy dissipation, thereby improving the safety and overall stability of the frame structure.
Following the retrofit, an external span width of approximately 0.9 m enables the buckling-restrained braces to fully mobilize their energy-dissipation capacity, reduce the interstory displacement response, and enhance structural stability. These findings further confirm the reliability of the novel buckling-restrained brace system for retrofitting frame structures.
The displacement histories are used to compare the peak deformation demands of the investigated configurations. The final displacement of a time-history analysis can represent residual deformation only when the excitation has ceased and the transient response has sufficiently decayed. Because a stabilized post-excitation response was not verified for the cases compared here, residual displacements are not reported.
6.3. Comparison of Roof Acceleration and Absolute Floor Acceleration
External span width is a key factor influencing the dynamic response of frame structures retrofitted with RP-FD-BRBs. Figure 30 presents the roof acceleration time-history curves for the structures with three different external span widths. The results show that variations in external span width significantly affect the energy-dissipation behavior of the retrofit system, thereby directly altering the amplitude of the roof acceleration response.
Figure 30.
Roof acceleration time-history curves for different external span widths.
Figure 30 presents the horizontal acceleration time histories at the roof, whereas Figure 31 summarizes the peak absolute horizontal accelerations at individual floor levels. The term roof acceleration identifies the location of the response. The term absolute acceleration identifies the reference frame and refers to acceleration measured with respect to an inertial frame. For uniform horizontal ground motion, the absolute floor acceleration is the sum of the acceleration relative to the moving base and the ground acceleration at the same instant, as given by Equation (14).
Figure 31.
Absolute floor acceleration for different external span widths.
Here, aabs,i(t) is the absolute acceleration of floor i, arel,i(t) is its acceleration relative to the moving base, and ag(t) is the input ground acceleration. The peak absolute floor acceleration is obtained by taking the maximum magnitude of the absolute acceleration time history over the analysis duration.
As shown in Figure 30, RP-WZ-0.9 had a lower peak roof acceleration than both RP-WZ-0.6 and RP-WZ-1.2, with a peak value of 21.1 cm/s2. Comparison of the acceleration time histories shows that RP-WZ-0.9 produces the smoothest response curve. During the later stage of excitation, its acceleration amplitude approaches zero, with no appreciable post-shaking oscillations. This indicates that, at this external span width, the retrofit system can fully mobilize its energy-dissipation capacity, rapidly dissipate seismic energy, and prevent energy accumulation at the roof level.
The acceleration curve of RP-WZ-0.6 exhibits the most pronounced fluctuations, and its peak occurs relatively early, indicating that an excessively small external span width causes the brace to enter the inelastic range prematurely, resulting in insufficient energy-dissipation capacity. The response amplitude of RP-WZ-1.2 is slightly greater than that of RP-WZ-0.9. Moreover, after the seismic excitation ends, the RP-WZ-1.2-retrofitted frame exhibits slightly greater post-shaking oscillations fluctuations than the RP-WZ-0.9 configuration. This is attributed to the reduced deformation compatibility between the buckling-restrained braces and the primary structure during the later stage of excitation, resulting in slightly lower energy-dissipation effectiveness for RP-WZ-1.2 than for RP-WZ-0.9.
To further investigate the influence of external span width on the absolute acceleration response at each story, the absolute floor-acceleration profiles of the three configurations are plotted in Figure 31.
As shown in Figure 31, the peak absolute floor accelerations were lower at all six stories after retrofitting for each of the three RP-WZ configurations. RP-WZ-0.9 exhibited the lowest peak acceleration at each story among the configurations investigated. From the first to the sixth story, its peak absolute accelerations were 10.7, 12.6, 13.2, 13.6, 11.9, and 21.1 cm/s2, respectively. Based on the values plotted in Figure 31, the corresponding reductions relative to the unretrofitted frame were 42.7%, 46.1%, 55.2%, 59.3%, 63.9%, and 51.2%. The largest percentage reduction occurred at the fifth story, while the highest acceleration in the retrofitted frame occurred at the roof.
As shown in Figure 31, RP-WZ-1.2 exhibited higher peak absolute floor accelerations than RP-WZ-0.9 at all six stories. Its peak absolute roof acceleration was 25.87 cm/s2, which was 22.6% higher than the 21.1 cm/s2 recorded for RP-WZ-0.9. RP-WZ-0.6 also exhibited higher peak floor accelerations than RP-WZ-0.9. At Stories 4, 5, and 6, the differences were 32.9%, 43.0%, and 40.8%, respectively, relative to the corresponding RP-WZ-0.9 values. Among the three retrofit configurations investigated, RP-WZ-0.9 provided the best control of peak absolute floor acceleration under the ground-motion excitation considered.
6.4. Comparison of Base Shear
To compare the base-shear and story-shear responses of the structures retrofitted with different external span widths, the ground-story shear time-history curves were plotted, as shown in Figure 32.
Figure 32.
Base-shear time-history curves for different external span widths.
As shown in Figure 32, the RP-WZ-0.9-retrofitted frame exhibits a peak base shear of 1211 kN. Its base-shear response initially increases and subsequently decreases, indicating that the braces provide additional stiffness during the early stage of seismic excitation and then yield to dissipate energy during the later stage, thereby enhancing the energy-dissipation capacity of the frame structure. RP-WZ-0.6 exhibits the lowest peak base shear, suggesting that it begins dissipating energy during the initial loading stage but has insufficient energy-dissipation capacity during the later stage. The early-stage response of RP-WZ-1.2 is similar to that of RP-WZ-0.9; however, it maintains a relatively high shear level during the later stage of seismic excitation. This indicates that an excessively large external span width causes force concentration in the braces and reduces force-transfer efficiency, preventing the braces from effectively sharing the lateral load carried by the primary structure.
7. Conclusions
This study investigated the application of rhombically perforated fractal buckling-restrained braces (RP-FD-BRBs) in an external straight-line retrofit system for a six-story reinforced concrete frame prototype. The nonlinear time-history analyses examined both local responses, including concrete damage and reinforcement stress, and global responses, including interstory drift, roof acceleration, and base shear. A separate comparison examined how three external span–brace configurations with the same prescribed geometric ratios performed under the investigated seismic inputs. The principal findings are summarized below.
7.1. Mitigation of Concrete Damage
Retrofitting with RP-FD-BRBs effectively mitigates concrete damage. Before retrofitting, damage to the RCF structure under both frequent and rare earthquakes is concentrated primarily in the lower stories, with pronounced tensile damage at the beam ends of beam–column joints and accompanying compressive damage at exterior beam–column joints. After retrofitting with RP-FD-BRBs, both the tensile and compressive damage to the concrete are significantly reduced. The buckling-restrained braces modify the stress-transfer paths within the structure and enhance its damage resistance by sharing the forces carried by the critical regions of the beams and columns.
7.2. Improvement in Reinforcement Stress and Deformation Responses
The stress state and deformation response of the reinforcement are substantially improved after retrofitting. Before retrofitting, the reinforcement stress is unevenly distributed, with pronounced stress concentrations in the ground-story interior columns and at the beam ends. The global displacement response is characterized by substantial deformation in the upper stories and relatively small displacement in the lower stories, resulting in increased interstory displacement across the frame.
After retrofitting, the stress amplitude of the ground-story reinforcement decreases significantly, and the stress distribution becomes more uniform. Both the global structural displacement and the displacement at each story are markedly reduced, with the most pronounced reduction occurring in the ground story. These improvements enhance the load-carrying capacity and stability of the reinforcement cage.
7.3. Control of Interstory Displacement, Roof Acceleration, and Base Shear
Interstory displacement and roof acceleration are significantly reduced after retrofitting, while the base shear exhibits an initial increase followed by a decrease. Dynamic time-history analyses under the three ground-motion records show that the unretrofitted RCF structure develops large interstory displacements under both frequent and rare earthquakes. Some corresponding interstory drift ratios exceed the code-specified limits, and appreciable residual deformation occurs.
After retrofitting, the maximum interstory displacements under both seismic hazard levels decrease substantially, and the drift ratios at all stories satisfy the code requirements. The greatest reductions occur in the intermediate stories. For example, under the artificial ground motion, the maximum interstory drift ratio decreases from 0.00183 to 0.00074 for the frequent earthquake and from 0.030 to 0.0164 for the rare earthquake.
Under El Centro excitation at the rare-earthquake intensity level, the retrofitted model exhibited a 50.2% reduction in peak roof acceleration relative to the corresponding unretrofitted model. Together with the reductions in peak interstory drift, this result shows that the external retrofit reduced both lateral deformation demand and roof acceleration demand in the cases examined. The base-shear histories provide a separate measure of how the retrofit affected the forces transmitted to the supports.
7.4. Seismic Response of the Investigated External Span–Brace Configurations
For the six-story RC frame prototype examined in this study, three external span–brace configurations were compared under the X-direction El Centro excitation at the intensity level specified in Section 6.1. The external spans were 0.6, 0.9, and 1.2 m, with corresponding brace dimensions of 600 × 100 × 10, 900 × 150 × 15, and 1200 × 200 × 20 mm, respectively. The brace length-to-width and width-to-thickness ratios were held at 6 and 10, respectively, while the span and brace dimensions varied together.
Among the three configurations, RP-WZ-0.9 exhibited the lowest maximum interstory displacement, at 2.12 mm, compared with 2.42 mm for RP-WZ-0.6 and 2.23 mm for RP-WZ-1.2. The corresponding maximum interstory drift ratios were 0.000707, 0.000807, and 0.000743, respectively. Thus, RP-WZ-0.9 provided the most effective control of these deformation measures among the investigated configurations. It also exhibited the lowest reported acceleration peaks in both the roof acceleration time-history comparison and the absolute floor-acceleration comparison presented in Section 6.3. Its favorable ranking is therefore supported by the reported displacement and acceleration measures, although this ranking does not establish superiority for every structural performance criterion.
These findings represent a comparison of coupled span–brace configurations under fixed geometric-ratio constraints. Because external span width and brace dimensions were varied simultaneously, the individual contributions of span width, brace axial stiffness, yield force, and steel volume cannot be separated using the present results. RP-WZ-0.9 is consequently identified as the best-performing among the investigated configurations for the specified displacement and acceleration measures, rather than as an independently optimal external span width. This conclusion is limited to the six-story frame, brace dimensions, and El Centro loading conditions adopted in the configuration comparison. Further controlled-property comparisons and assessment using additional ground motions are required before a general span-width recommendation can be established.
8. Limitations and Future Research Directions
The numerical analyses illustrate the potential of externally mounted RP-FD-BRBs to reduce selected seismic responses of a six-story reinforced concrete frame. The findings apply to the structural prototype, retrofit arrangements, and excitation conditions investigated. Extending these findings to other buildings requires consideration of the behavior of the perforated brace core, the load path through the external retrofit system, and the interaction of that system with the existing frame and foundation. These aspects are discussed below in terms of experimental validation, parameter selection, post-earthquake recovery, and engineering implementation.
8.1. Experimental Validation and Connection Behavior
Zhang et al. [41] used reversed cyclic loading tests to compare conventional and friction-damped double-stage yielding buckling-restrained braces in terms of initial axial stiffness, hysteretic response, and cumulative energy dissipation. Their test procedure provides a reference for the component-level evaluation proposed here for RP-FD-BRBs. The present assessment is based on finite element simulations. Reversed cyclic loading tests on RP-FD-BRB specimens would provide measurements of initial axial stiffness, yield force, force–deformation response, and cumulative energy dissipation. Local strain measurements around the rhombic perforations and transition regions would help determine where yielding initiates and how plastic deformation develops under repeated loading. Tests at different deformation amplitudes would also help assess the effects of strain concentration, local instability, and low-cycle fatigue on the deformation capacity of the core. The measured responses could be used to calibrate the steel constitutive model and the representation of interactions between the core and its restraining components.
The behavior of the assembled retrofit depends on the load path from the existing frame through the connections and braces to the strongback and its foundation. Connection slip, deformation of the connection plates, and rotation at the strongback base may alter the proportion of interstory movement transferred to the brace core. These effects could influence brace engagement and the distribution of forces between the retrofit and the existing frame. Tests on representative brace-to-frame connections and anchorage assemblies should therefore measure slip, stiffness degradation, and local damage. Cyclic or shaking-table tests on retrofitted RC substructures would provide a further basis for assessing whether the component-level response is reproduced when the brace interacts with the frame. Comparison with a full-building model would also help establish how the boundary conditions of the modeled substructure influence the predicted response.
A system-level stability assessment should evaluate the in-plane and out-of-plane behavior of the retrofitted substructure under the combined gravity and seismic demands. Particular attention should be given to strongback buckling, second-order effects, connection deformation, and the ability of the anchors and foundation to provide the restraint assumed in the model. A geometrically nonlinear analysis incorporating representative initial imperfections and realistic support stiffness would help establish the stability limits of the assembled system.
8.2. Parametric Optimization and Seismic Applicability
The parametric comparison considered three external span widths of 0.6, 0.9, and 1.2 m. The brace dimensions were varied with the external span width to maintain a length-to-width ratio of 6 and a width-to-thickness ratio of 10. Consequently, the configurations differed in both the external layout and the properties of the brace. RP-WZ-0.9 performed best among the investigated configurations for the displacement and acceleration measures reported in the span comparison. This ranking applies to the combinations examined for the selected prototype and seismic inputs. A controlled comparison that holds a specified brace property constant, or a factorial design that varies span width and brace geometry independently, would help identify the influence of each variable and their interaction.
Further parametric studies could examine the effects of core perforation ratio, rhombic perforation dimensions, steel yield strength, strongback stiffness, and brace layout. Evaluating several response measures together would help identify trade-offs between interstory drift, floor acceleration, base shear, and connection forces. Where brace force–deformation histories are available, cumulative hysteretic energy and plastic deformation demand could also be included in the evaluation. These results would provide a basis for comparing configurations against project-specific performance and cost objectives.
The analyses covered the X direction of one six-story RC frame prototype using three ground motions. The reported reductions in displacement, interstory drift, and acceleration therefore apply to the analyzed direction and excitation conditions. Extending the assessment to the Y direction requires consideration of its stiffness, strength, modal properties, and deformation demands. Simultaneous horizontal excitation would also allow possible torsional effects to be examined. Analyses of other frame geometries and stiffness distributions using a larger ground-motion set would help assess the sensitivity of the results to record characteristics. Such studies could include near-fault pulse-like records, long-period motions, and vertical components where relevant to the structure and site.
To establish a baseline for the proposed Y-direction retrofit, a preliminary linear-elastic comparison was performed for the unretrofitted six-story building in both principal directions. The simplified model used the frame grid shown in Figure 5, fixed column bases, rigid in-plane floor diaphragms, and gross beam and column section properties. In each direction, a total lateral force of 1000 kN was distributed in proportion to floor elevation. The equivalent lateral stiffness was calculated as the total lateral force divided by the roof displacement.
For the original beam and column sections, the equivalent stiffnesses were 43.79 MN/m in the X direction and 46.17 MN/m in the Y direction. For the reduced sections described in Section 5, the corresponding values were 24.24 and 25.66 MN/m. Under the assumed load pattern, the Y-direction stiffness was approximately 5–6% higher in both models. This comparison provides a baseline for selecting and evaluating the proposed Y-direction brace layout. The assessment of its effectiveness under earthquake loading requires paired nonlinear response-history analyses of the unretrofitted and retrofitted frames under Y-direction excitation.
For future retrofitting in the Y direction, a candidate layout would place two external RP-FD-BRB assemblies along the perimeter frames parallel to the global Y axis, one at each end of the building in the X direction. The two assemblies would be arranged symmetrically in plan to limit the torsional effects associated with an eccentric brace layout. At each story, the braces would connect the existing RC frame at the beam–column joints to external steel strongbacks through steel connectors. The strongbacks would be anchored to the foundation to provide a continuous load path for the forces transferred from the frame.
The external span and brace core dimensions would be selected based on the Y-direction drift and force demands. The proposed layout would be evaluated by comparing three models under the same Y-direction ground motions and intensity levels: the unretrofitted frame, the frame with the existing X-direction retrofit, and the frame with retrofits in both directions. This comparison would isolate the contribution of the proposed Y-direction assemblies. The assessment would consider peak interstory drift ratios, floor accelerations, base shear, and the forces in the brace connections and foundation anchors. Analyses with simultaneous X- and Y-direction excitation would then be used to examine the torsional response of the combined layout.
8.3. Life-Cycle Performance and Post-Earthquake Recoverability
Post-earthquake recovery depends on residual frame deformation, cumulative damage in the brace core, and the condition of the connections and anchorage. Future studies should quantify residual interstory drift and examine whether damaged braces can be inspected and replaced while maintaining the stability of the remaining structure. The accessibility of the connections, the time required for replacement, and any repairs needed in the adjacent RC members would affect the time required to restore building function [42].
Repeated loading under mainshock–aftershock sequences may also increase the accumulated plastic deformation of the brace and the demand on its connections. Incremental dynamic analysis and seismic fragility assessment could be used to examine how these demands vary with excitation intensity and to relate them to damage states established from tests. For an externally installed system, long-term assessment should also consider the condition of exposed steelwork and connections, inspection and maintenance requirements, and the effects of component replacement on life-cycle cost and carbon emissions.
Future analyses will include a zero-acceleration interval after the end of the ground-motion record and compare the stabilized roof displacements relative to the base before and after retrofitting.
8.4. Design Methods and Engineering Implementation
The feasibility of the external arrangement depends on the clearance available along the façade, the space available for the strongback and its foundation, and access for construction and future maintenance. The locations of openings, services, and existing reinforcement may constrain where connections can be installed. A project-specific assessment should establish how the brace forces are transferred into the existing RC members and whether the members, connections, anchors, and foundations can accommodate the resulting demands. The stiffness and rotation of the strongback support should also be considered when determining how much deformation is delivered to the brace core.
Future design procedures should link the selection of brace stiffness, yield force, and external span width to checks on connection forces, strongback deformation, and foundation response. Construction tolerances, installation sequence, inspection access, and the space needed to remove a damaged brace should be considered during detailing. These assessments would help determine the conditions under which an external RP-FD-BRB system can be installed, maintained, and repaired in an existing building.
Author Contributions
Conceptualization, K.L.; methodology, K.L.; software, K.L. and L.M.; formal analysis, X.L., K.L. and Y.R.; investigation, H.H. and N.Z.; data curation, X.L., K.L., L.M. and N.Z.; writing—original draft preparation, K.L., X.L. and L.M.; writing—review and editing, K.L. and X.L. All authors have read and agreed to the published version of the manuscript.
Funding
This research was funded by the Qinghai University Research Ability Enhancement Project (Project No. 2026KTSTO6; Research Team: Innovation Team for Disaster Simulation and Intelligent Computing-Based Prevention and Control of Climate Warming and Humidification along Major Engineering Corridors of the Qinghai-Tibet Plateau).
Data Availability Statement
The data supporting the findings of this study are available from the corresponding author, Xiaobo Luo, upon reasonable request.
Conflicts of Interest
The authors declare no conflicts of interest.
References
- Al-Sadoon, Z.A.; Saatcioglu, M.; Palermo, D. New buckling-restrained brace for seismically deficient reinforced concrete frames. J. Struct. Eng. 2020, 146, 04020082. [Google Scholar] [CrossRef] [Scilit]
- Valente, M. Seismic protection of R/C structures by a new dissipative bracing system. Procedia Eng. 2013, 54, 785–794. [Google Scholar] [CrossRef] [Scilit]
- Valente, M. Seismic strengthening of non-ductile R/C structures using infill wall or ductile steel bracing. Adv. Mater. Res. 2013, 602, 1583–1587. [Google Scholar] [CrossRef] [Scilit]
- Barbagallo, F.; Bosco, M.; Marino, E.M.; Rossi, P.P. Seismic design and performance of dual structures with BRBs and semi-rigid connections. J. Constr. Steel Res. 2019, 158, 306–316. [Google Scholar] [CrossRef] [Scilit]
- Stepinac, M.; Skokandić, D.; Ožić, K.; Zidar, M.; Vajdić, M. Condition assessment and seismic upgrading strategy of RC structures—A case study of a public institution in Croatia. Buildings 2022, 12, 1489. [Google Scholar] [CrossRef] [Scilit]
- Colajanni, P.; Ahmed, M.; D’Anna, J. Comparison between design methods for seismic retrofit of reinforced concrete frames using dissipative bracing systems. Buildings 2024, 14, 3256. [Google Scholar] [CrossRef] [Scilit]
- Nascimbene, R.; Bianchi, F.; Brunesi, E.; Bellotti, D. A global performance-based seismic assessment of a retrofitted hospital building equipped with dissipative bracing systems. Buildings 2025, 15, 4022. [Google Scholar] [CrossRef] [Scilit]
- Castaldo, P.; Tubaldi, E.; Selvi, F.; Gioiella, L. Seismic performance of an existing RC structure retrofitted with buckling restrained braces. J. Build. Eng. 2021, 33, 101688. [Google Scholar] [CrossRef] [Scilit]
- Andrews, B.M.; Song, J.; Fahnestock, L.A. Assessment of buckling-restrained braced frame reliability using an experimental limit-state model and stochastic dynamic analysis. Earthq. Eng. Eng. Vib. 2009, 8, 373–385. [Google Scholar] [CrossRef] [Scilit]
- Nakashima, A. From infancy to maturity of buckling restrained braces research. In Proceedings of the Thirteenth World Conference on Earthquake Engineering, Vancouver, BC, Canada, 1–6 August 2004; pp. 1–6. [Google Scholar]
- Avci-Karatas, C.; Celik, O.C.; Eruslu, S.O. Modeling of buckling restrained braces (BRBs) using full-scale experimental data. KSCE J. Civ. Eng. 2019, 23, 4431–4444. [Google Scholar] [CrossRef] [Scilit]
- Di Sarno, L.; Manfredi, G. Experimental tests on full-scale RC unretrofitted frame and retrofitted with buckling-restrained braces. Earthq. Eng. Struct. Dyn. 2012, 41, 315–333. [Google Scholar] [CrossRef] [Scilit]
- Almeida, A.; Ferreira, R.; Proença, J.M.; Gago, A.S. Seismic retrofit of RC building structures with Buckling Restrained Braces. Eng. Struct. 2017, 130, 14–22. [Google Scholar] [CrossRef] [Scilit]
- Wang, F.; Shi, Q.X.; Wang, P. Seismic behaviour of reinforced concrete frame structures with all steel assembled Q195 low yield buckling restrained braces. Structures 2021, 30, 756–773. [Google Scholar] [CrossRef] [Scilit]
- Li, G.; Li, J.; Fang, C.; Yang, Z. Seismic performance of two-story three-bay reinforced concrete frame equipped with K-configured buckling restrained braces. J. Build. Eng. 2023, 74, 106904. [Google Scholar] [CrossRef] [Scilit]
- Rafi, M.M.; Lodi, S.H.; Al-Sadoon, Z.A.; Saatcioglu, M.; Palermo, D. Experimental investigation of dynamic behavior of RC frame strengthened with buckling-restrained bracing. J. Struct. Eng. 2022, 148, 04022076. [Google Scholar] [CrossRef] [Scilit]
- Ferraioli, M.; Concilio, A.; Molitierno, C. Seismic performance of a reinforced concrete building retrofitted with self-centering shape memory alloy braces. Earthq. Eng. Eng. Vib. 2022, 21, 785–809. [Google Scholar] [CrossRef] [Scilit]
- Farouk, M.A.; El-Kady, M.S. Mathematical model of analyzing P–δ effect in braced columns. Innov. Infrastruct. Solut. 2018, 3, 41. [Google Scholar] [CrossRef] [Scilit]
- Ferraioli, M.; Lavino, A.; Molitierno, C.; Di Lauro, G. Seismic retrofit of an existing reinforced concrete building with buckling restrained braces. Open J. Civ. Eng. 2021, 15, 203–225. [Google Scholar] [CrossRef] [Scilit]
- Sutcu, F.; Bal, A.; Fujishita, K.; Matsui, R.; Celik, O.C.; Takeuchi, T. Experimental and analytical studies of sub-standard RC frames retrofitted with buckling-restrained braces and steel frames. Bull. Earthq. Eng. 2020, 18, 2389–2410. [Google Scholar] [CrossRef] [Scilit]
- Wang, J.; Lu, F.; Li, B. Subassemblage tests and analysis of buckling-restrained braced reinforced concrete frames with various gusset connections. Structures 2022, 39, 39–56. [Google Scholar] [CrossRef] [Scilit]
- Wang, M.; Tong, Y. Experimental study on seismic performance of assembled buckling-restrained brace with low yield point steel. Thin-Walled Struct. 2024, 205, 112474. [Google Scholar] [CrossRef] [Scilit]
- Ma, L.; Luo, X.; Ren, Y. Seismic performance analysis of reinforced multi-story frames with external fractal dimension-buckling restrained braces. J. Asian Archit. Build. Eng. 2026, 25, 4845–4861. [Google Scholar] [CrossRef] [Scilit]
- Wu, K.; Wei, G.; Lin, C.; Zhang, L.; Yu, W.; Lan, X. Experimental study on the seismic performance of buckling-restrained braces with different lengths. Buildings 2025, 15, 154. [Google Scholar] [CrossRef] [Scilit]
- Ye, T.; Zheng, S.; Zhou, Z.; Yuan, B.; Wei, Y. Analysis of key parameters influencing performance for assembled aluminum alloy buckling-restrained braces. Sci. Rep. 2025, 15, 31498. [Google Scholar] [CrossRef] [Scilit] [PubMed]
- Al-Sadoon, Z.A.; Saatcioglu, M.; Palermo, D. Enhancing seismic resilience of non-ductile RC frames with a novel buckling restrained brace system: A nonlinear analysis approach. Structures 2024, 68, 107089. [Google Scholar] [CrossRef] [Scilit]
- İnam, İ.E.; Dindar, A.A. Seismic performance of mid-rise moment-resisting RC frames with buckling-restrained braces under sequential earthquakes. Bull. Earthq. Eng. 2026, 24, 3069–3103. [Google Scholar] [CrossRef] [Scilit]
- Qing, Y.; Meng, S.; Zeng, B.; Wang, C.L. Nonlinear modeling and time-history analysis of dry-assembled precast concrete frames with buckling-restrained braces. J. Build. Eng. 2024, 95, 110370. [Google Scholar] [CrossRef] [Scilit]
- Bai, J.; Li, W.; Chen, H.; Feng, M.; Wang, Y.H. A stiffness ratio-based seismic design for reinforced concrete frames with buckling-restrained braces. Int. J. Struct. Stab. Dyn. 2022, 22, 2240005. [Google Scholar] [CrossRef] [Scilit]
- Huang, Y.; Wu, Q.; Tang, T. Seismic performance and design of the fully assembled precast concrete frame with buckling-restrained braces. Buildings 2022, 12, 1818. [Google Scholar] [CrossRef] [Scilit]
- Li, J.; Fomin, N.I.; Xiao, S.; Yang, K.; Zhao, S.; Yang, H. Seismic enhancement techniques for reinforced concrete frame buildings: A contemporary review. Buildings 2025, 15, 984. [Google Scholar] [CrossRef] [Scilit]
- Bohara, B.K.; Saha, P. Seismic Behaviour of Reinforced Concrete Frames with Concentric Steel Bracing: A Review of Research from 1990 to 2023. Momentum Int. J. Civ. Eng. MIJCE 2026, 2, 95–107. [Google Scholar] [CrossRef] [Scilit]
- Al-Sadoon, Z.A.; Shrif, M.; Habib, A. Performance-Based Retrofitting of Aging RC Frames Using Innovative Knee-Braced Buckling-Restrained Braces for Enhanced Seismic Resilience. In EPJ Web of Conferences; EDP Sciences: Les Ulis, France, 2025; Volume 343, p. 03005. [Google Scholar]
- Maulana, T.I. Investigation on earthquake performance of reinforced concrete frames strengthened with different buckling-restrained braces properties. Bull. Civ. Eng. 2025, 5, 15–22. [Google Scholar] [CrossRef] [Scilit]
- Nie, W.; Cheng, G.; Shi, X.; Yang, Y.; Zhang, H.; Chen, Y.F. Seismic performance of steel tube confined steel reinforced concrete frame with replaceable buckling restrained braces. J. Constr. Steel Res. 2025, 235, 109823. [Google Scholar] [CrossRef] [Scilit]
- Shedge, H.; Patil, N.K.; Tapase, A.; Kadam, D.; Shelar, A.; Bobade, S. A State of the Art Review of Buckling Restrained Brace: History, Application, and Design. In Civil Infrastructures Confronting Severe Weathers and Climate Changes Conference; Springer: Cham, Switzerland, 2021; pp. 43–52. [Google Scholar]
- Ren, Y.; Luo, X.; Ma, L. Research on the seismic performance of frame structures with external fractal dimension-buckling restrained braces. Građevinar 2025, 77, 845–858. [Google Scholar] [CrossRef] [Scilit]
- Ministry of Housing and Urban-Rural Development of the People’s Republic of China. GB 50011–2010; Code for Seismic Design of Buildings. China Architecture & Building Press: Beijing, China, 2016.
- Applied Technology Council. Seismic Performance Assessment of Buildings, 2nd ed.; Federal Emergency Management Agency: Washington, DC, USA, 2018; Volume 1, Methodology; FEMA P-58-1. [Google Scholar]
- Ministry of Housing and Urban-Rural Development of the People’s Republic of China. GB 50017–2017; Standard for Design of Steel Structures. China Architecture & Building Press: Beijing, China, 2017.
- Zhang, Y.; Cheng, R.; Shi, W. Experimental Study on Mechanical Properties of Double-Stage Yield Buckling Restrained Braces. Buildings 2026, 16, 1106. [Google Scholar] [CrossRef] [Scilit]
- Rahgozar, N.; Pouraminian, M.; Rahgozar, N. Reliability-based seismic assessment of controlled rocking steel cores. J. Build. Eng. 2021, 44, 102623. [Google Scholar] [CrossRef] [Scilit]
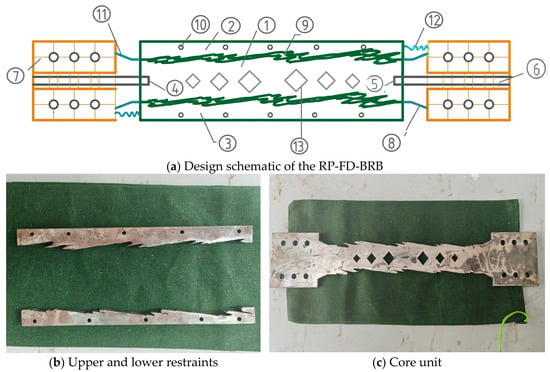
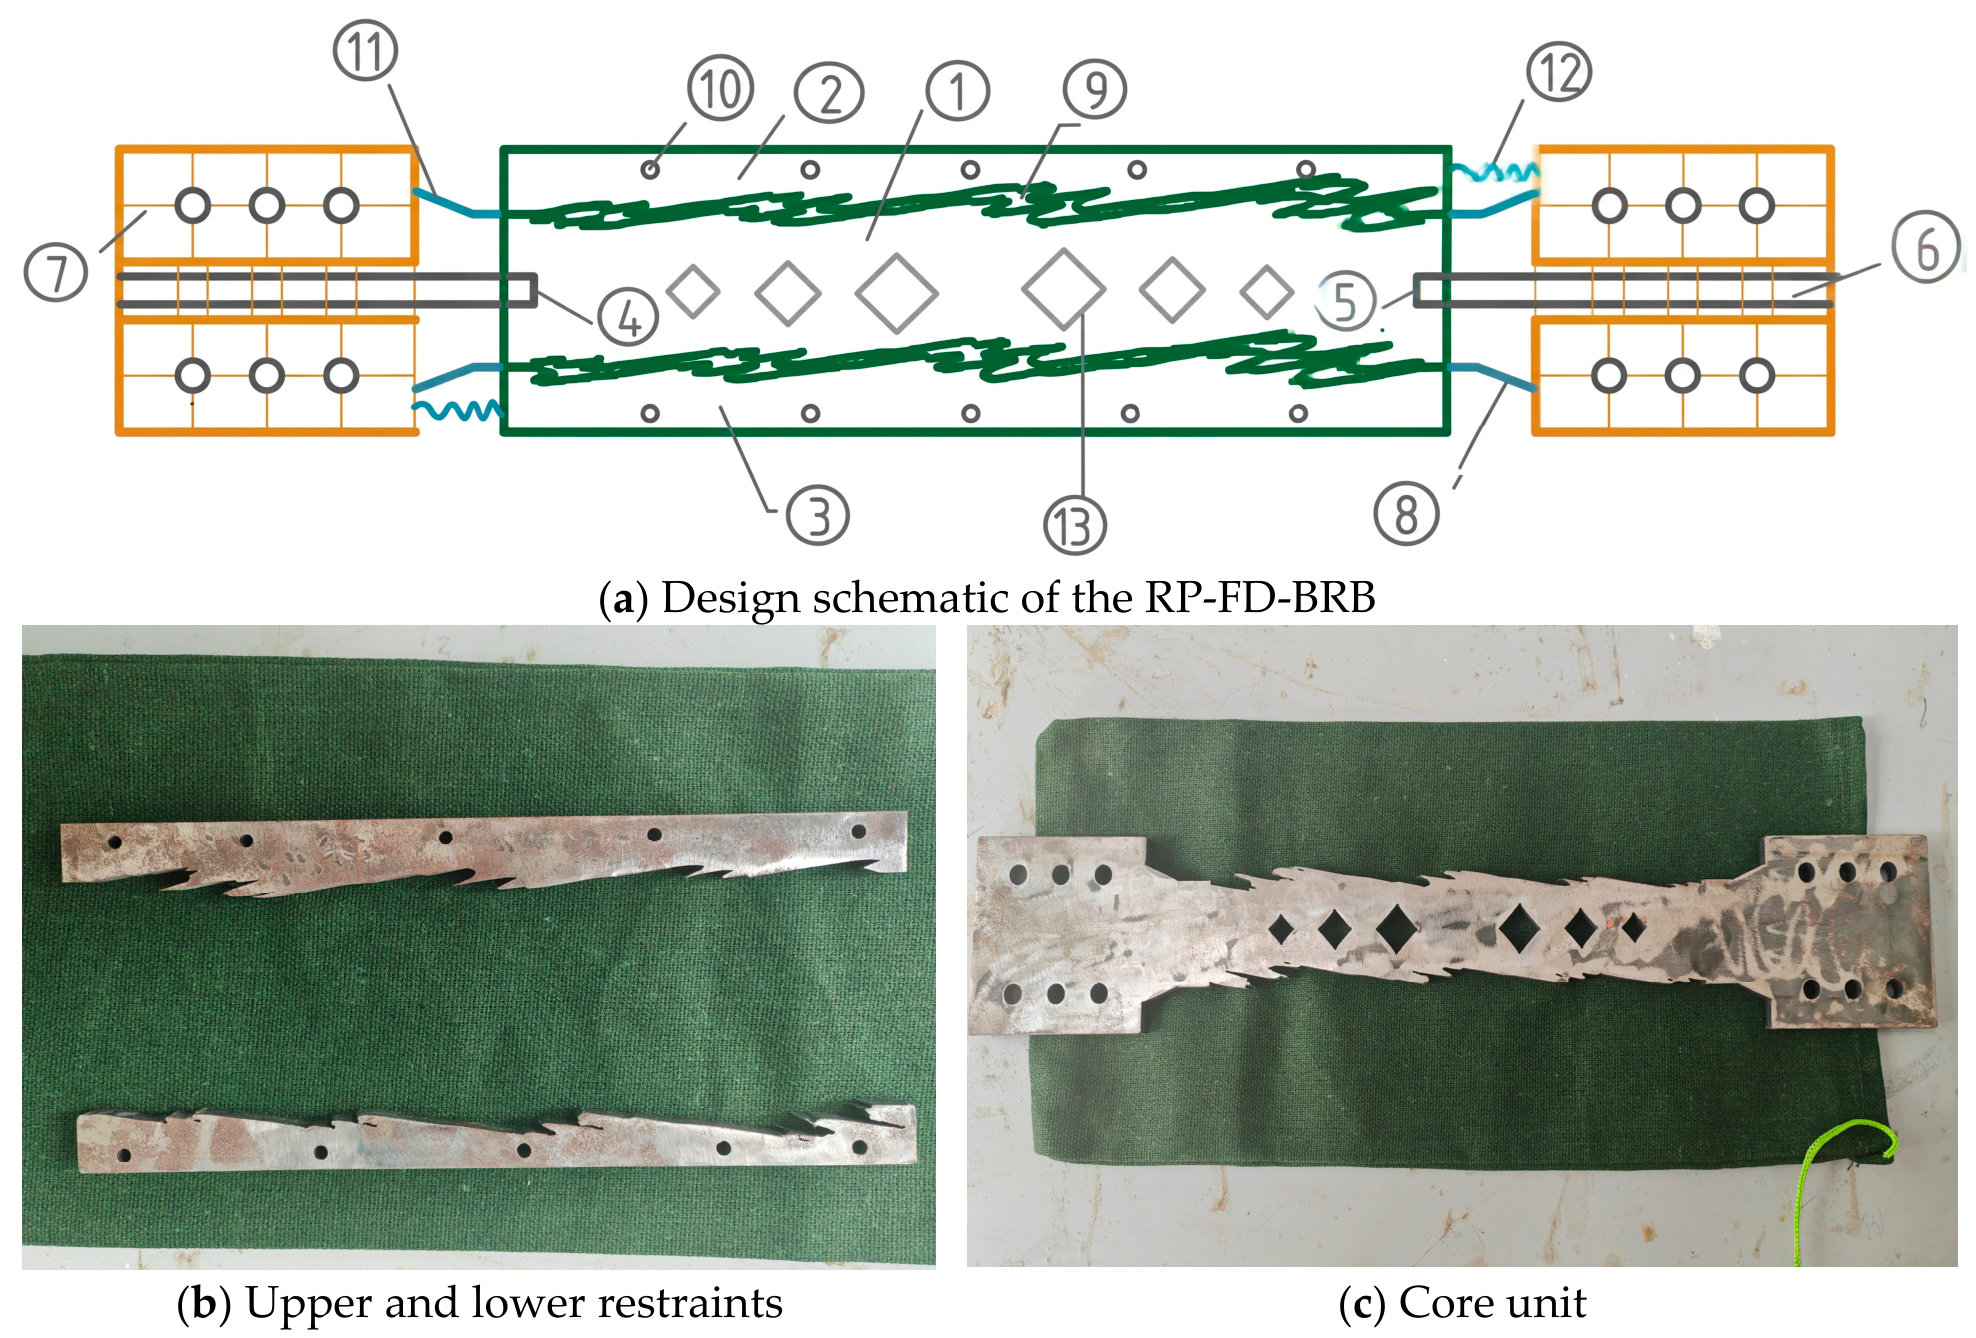
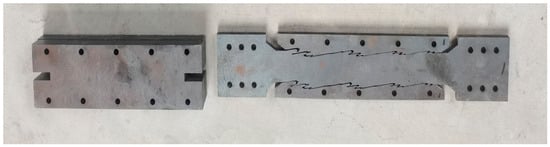
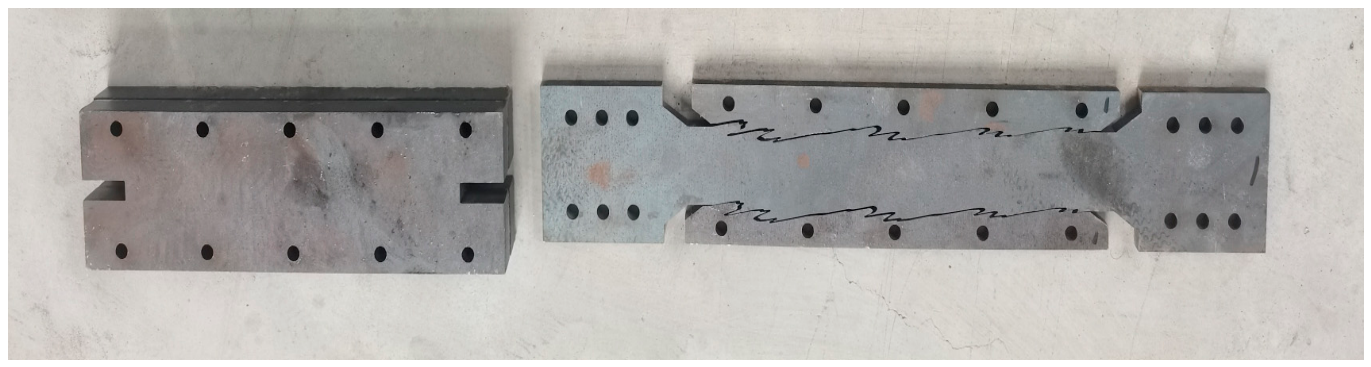
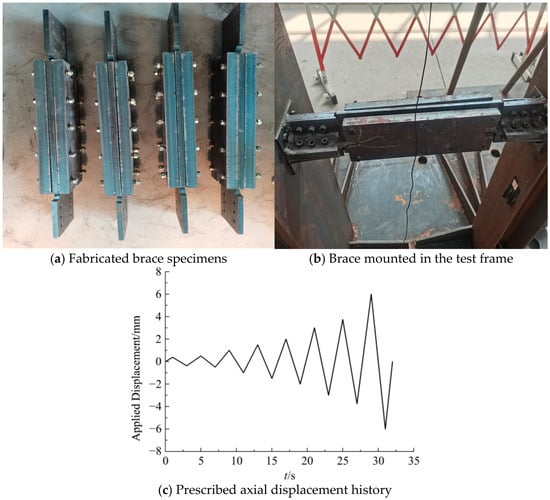
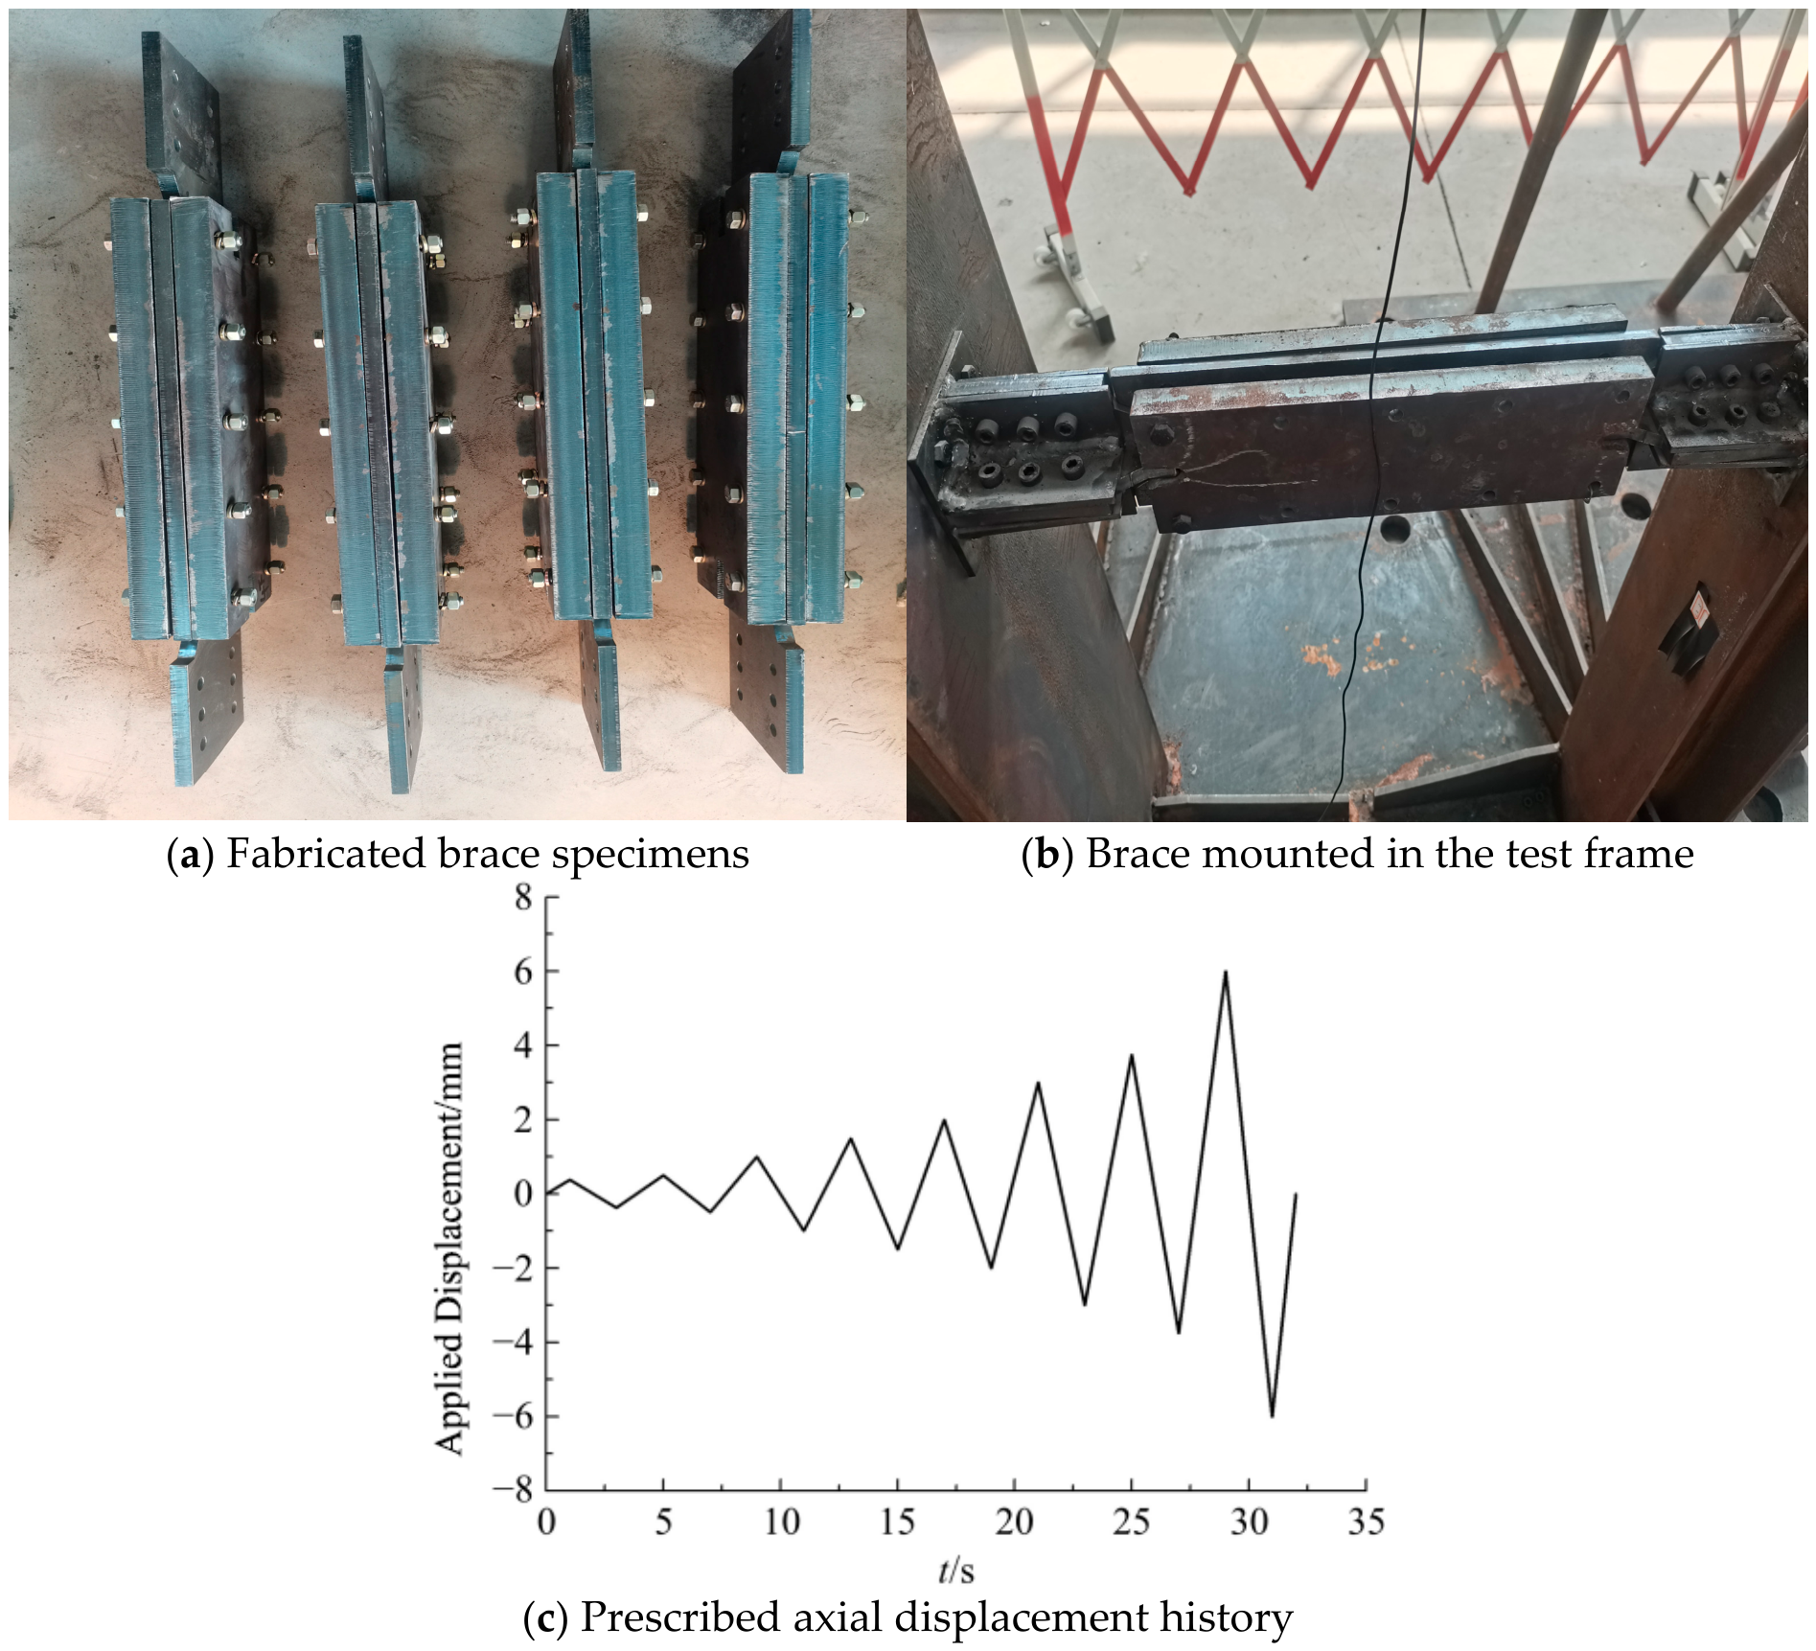
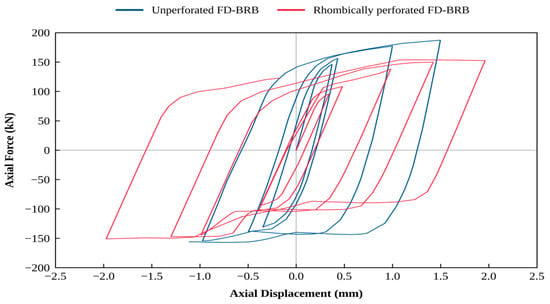
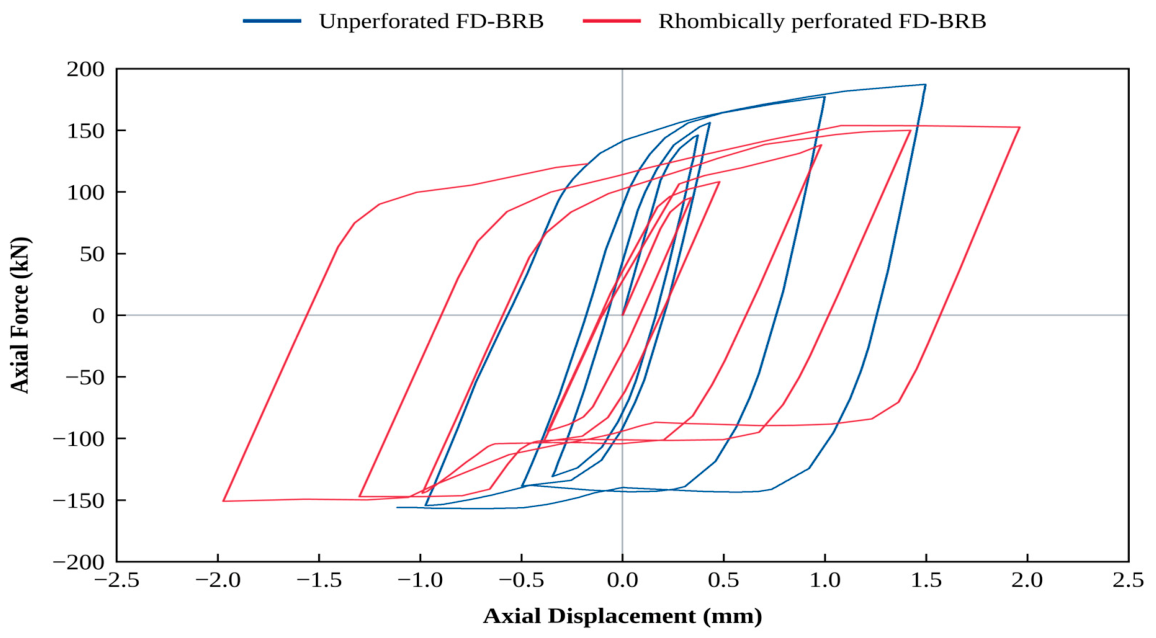
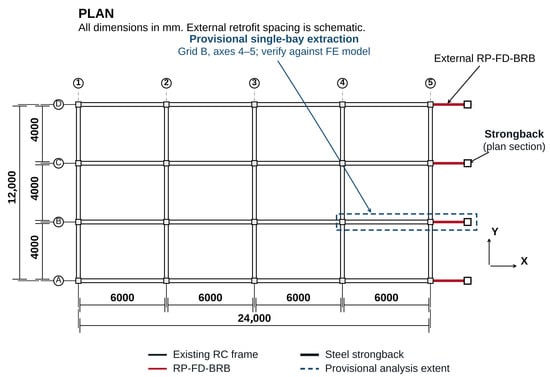
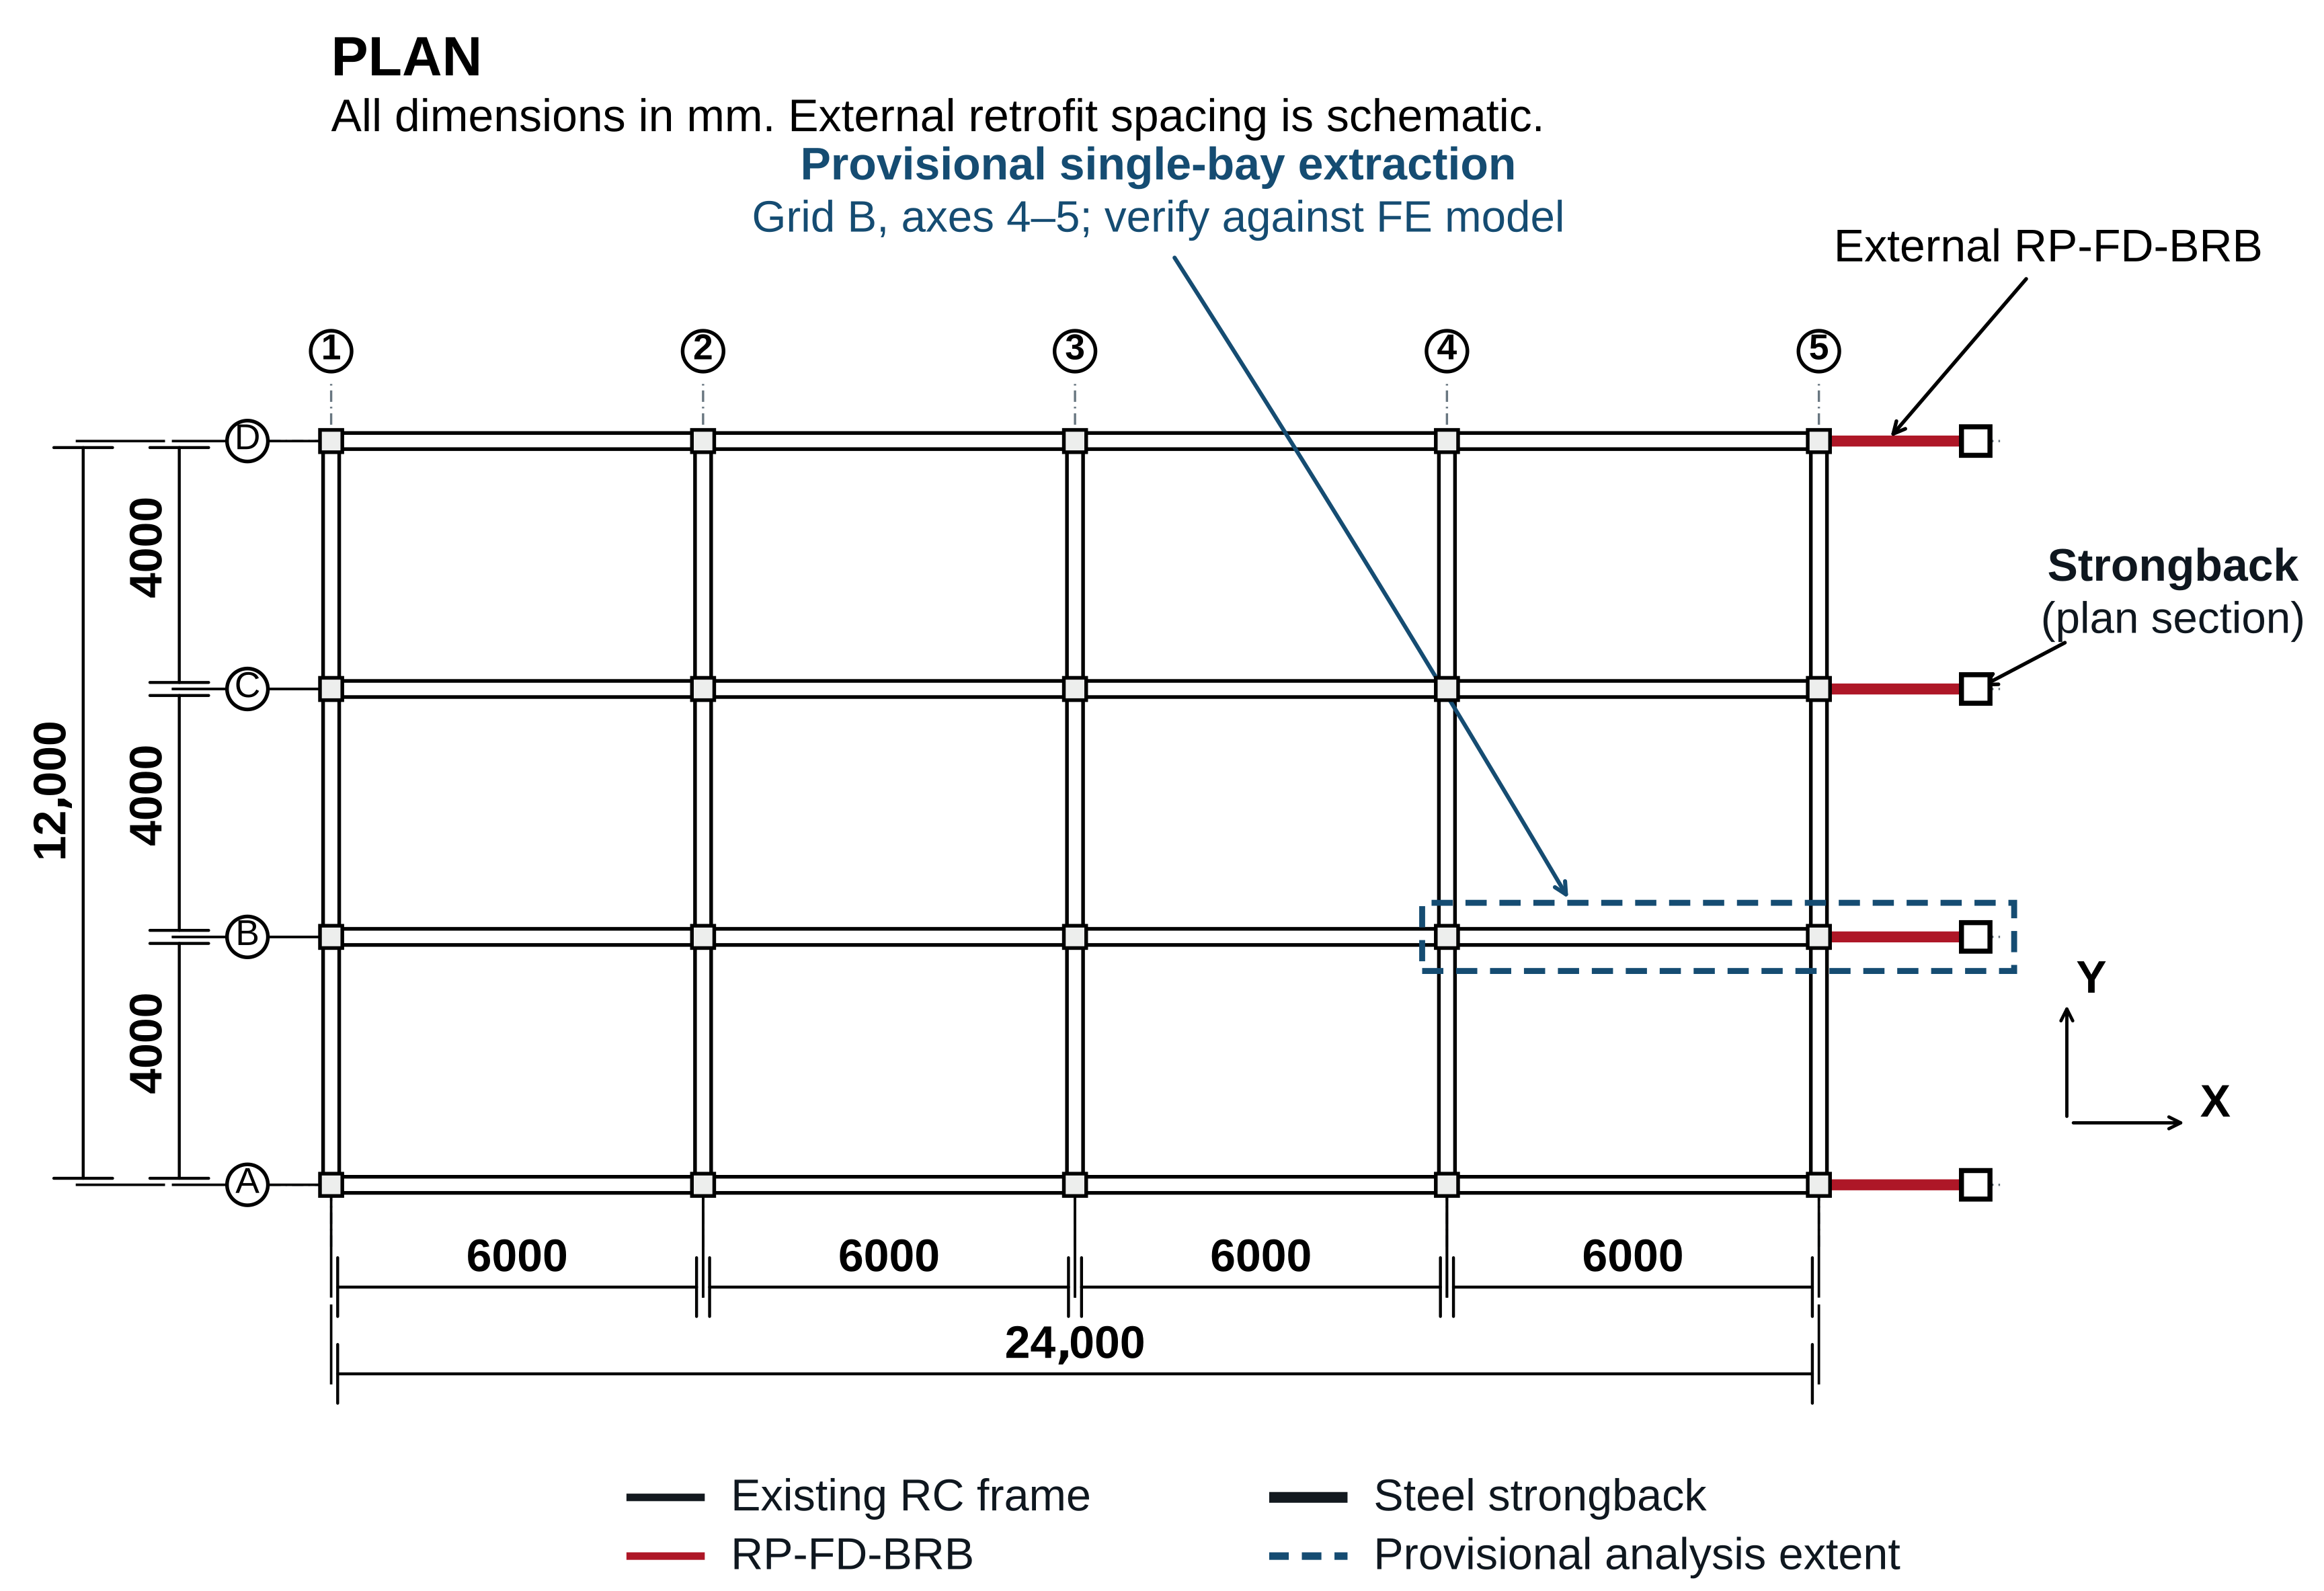
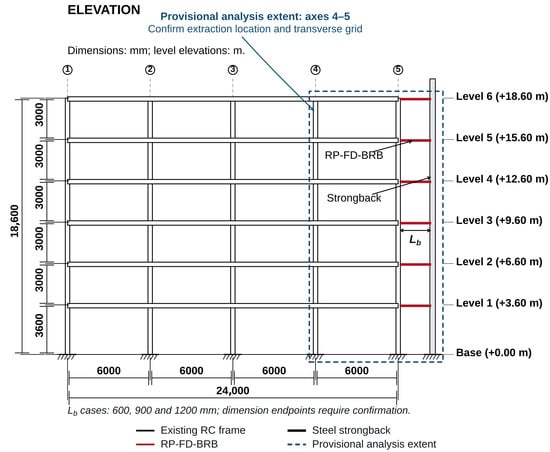
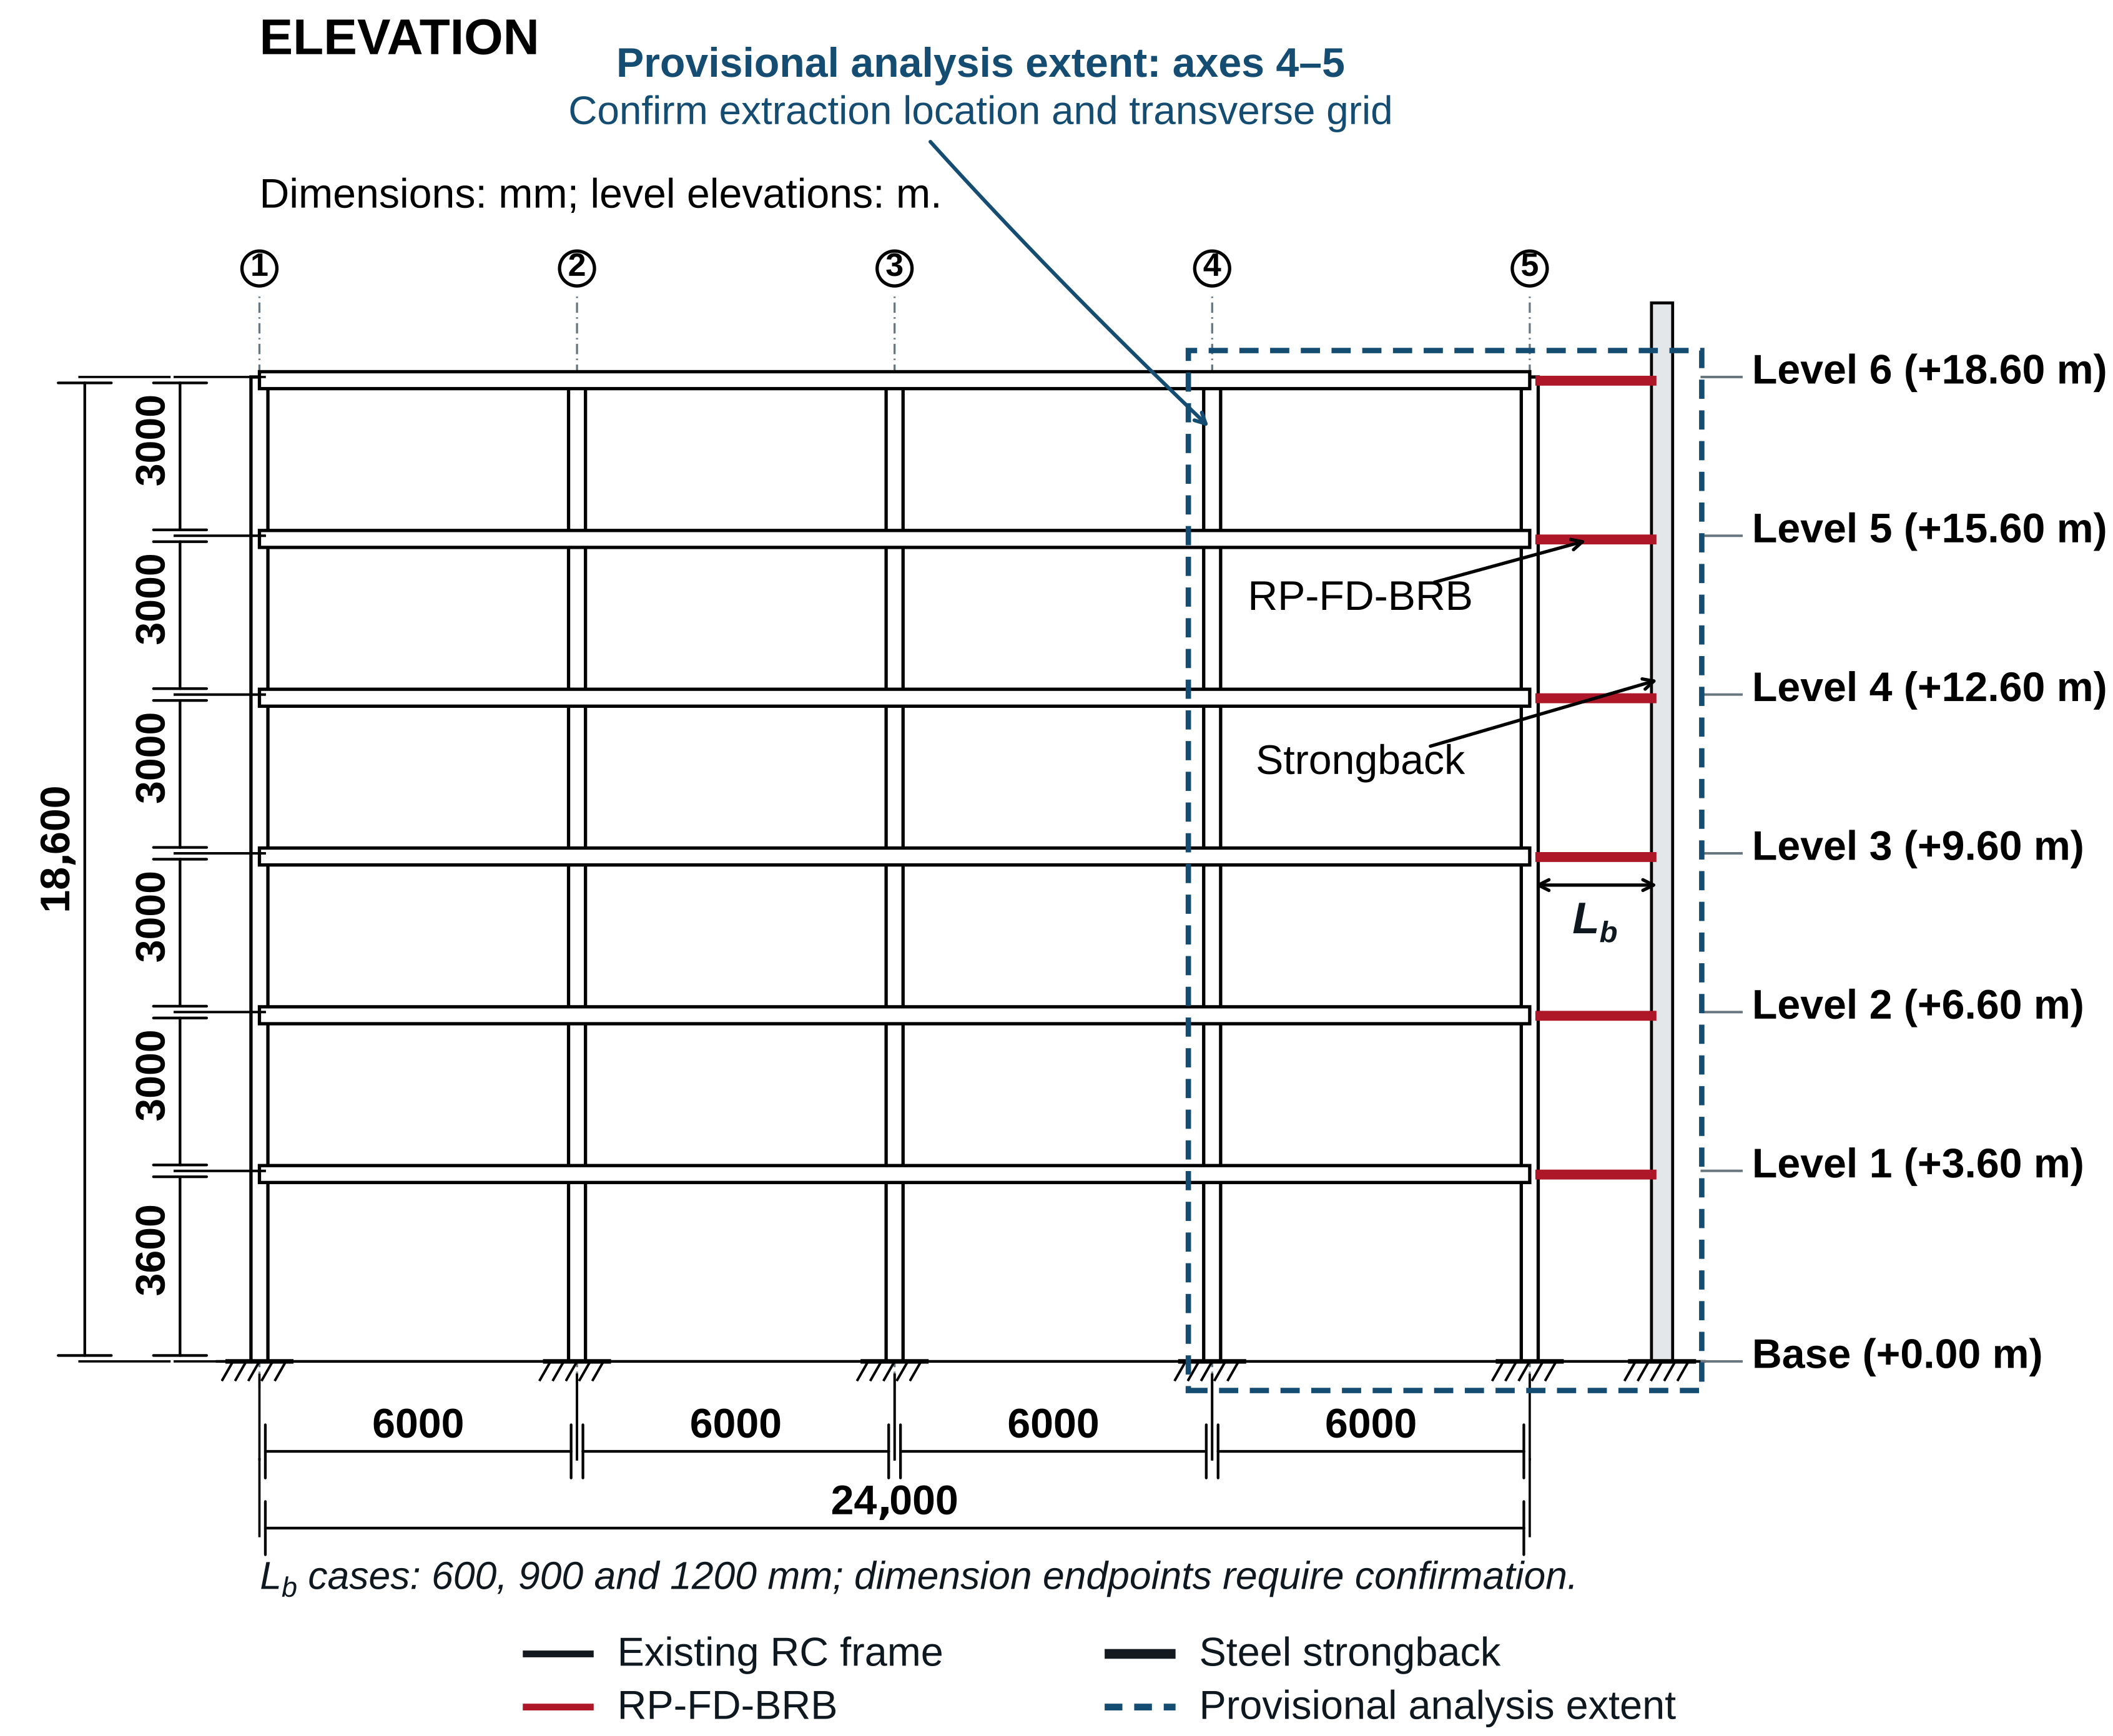
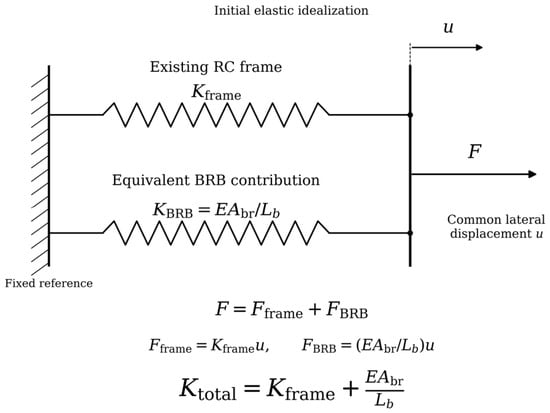
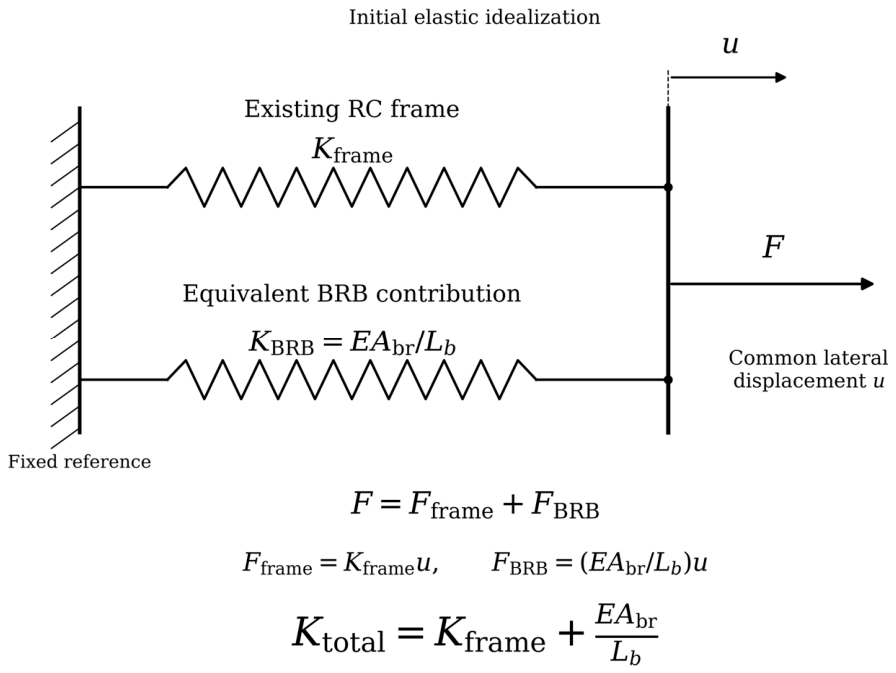
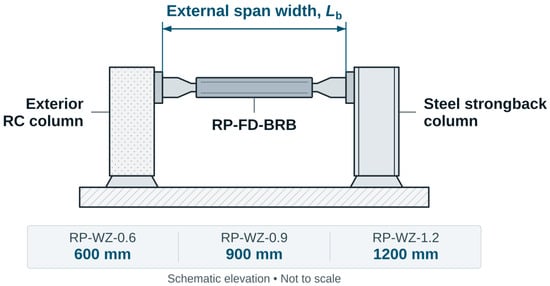
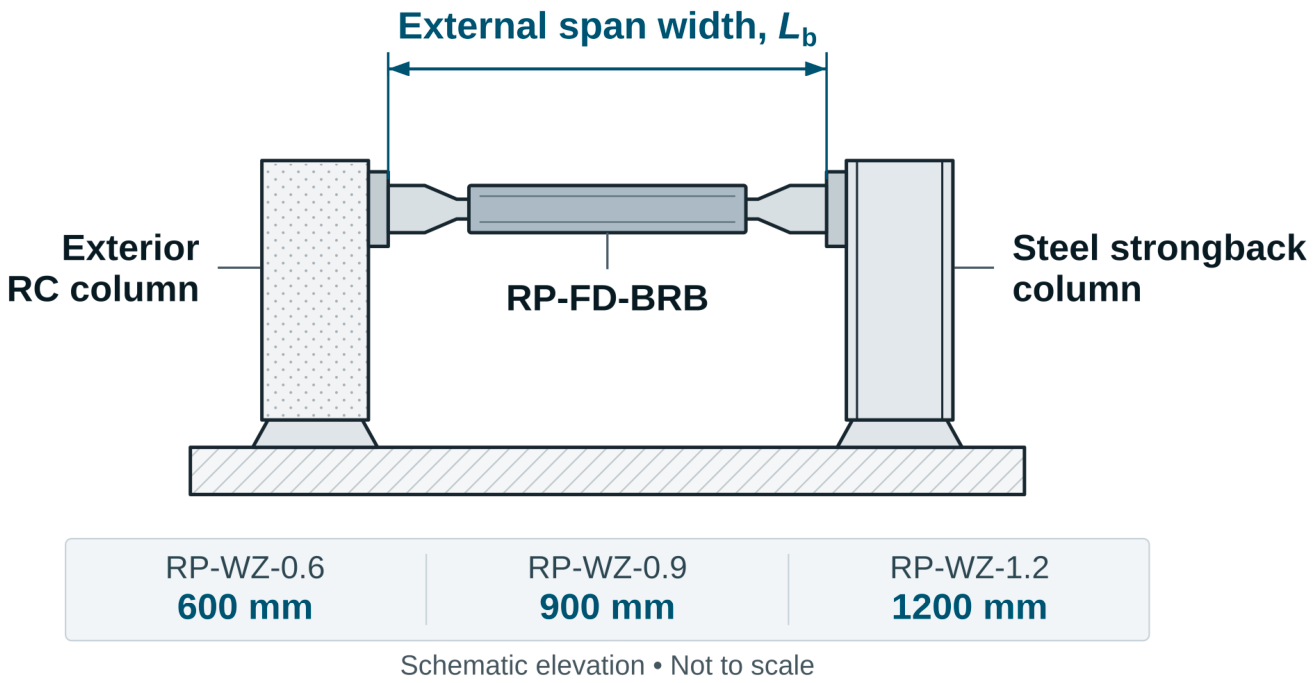
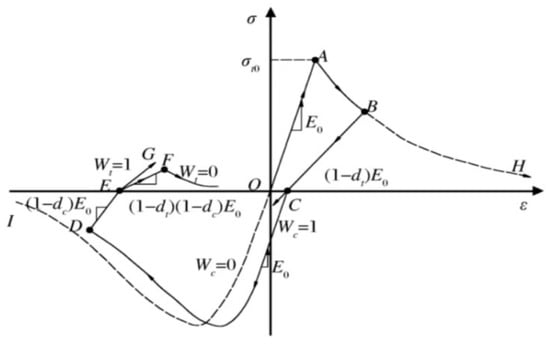
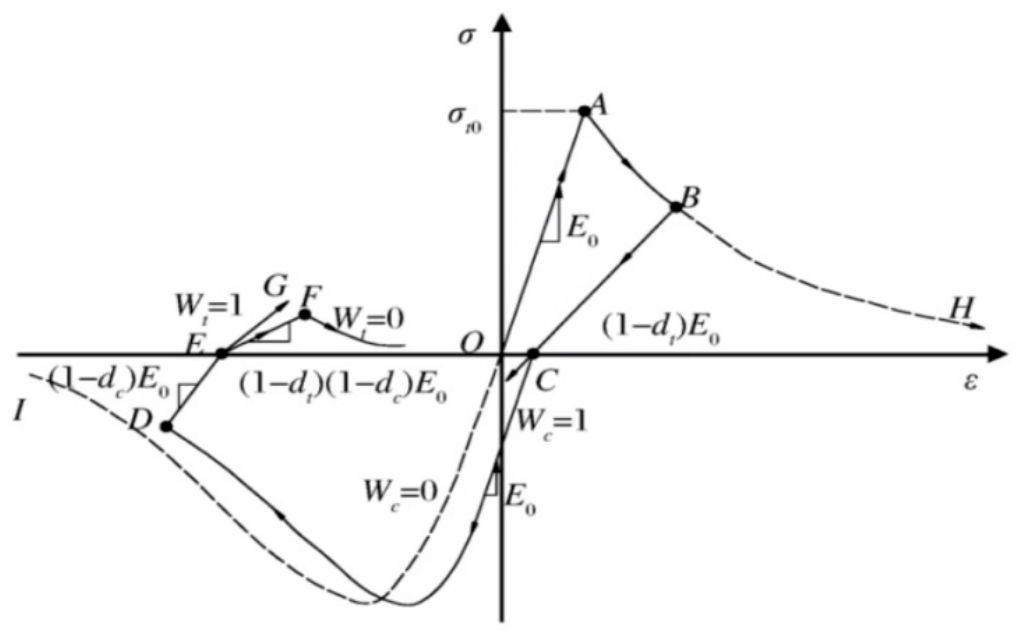
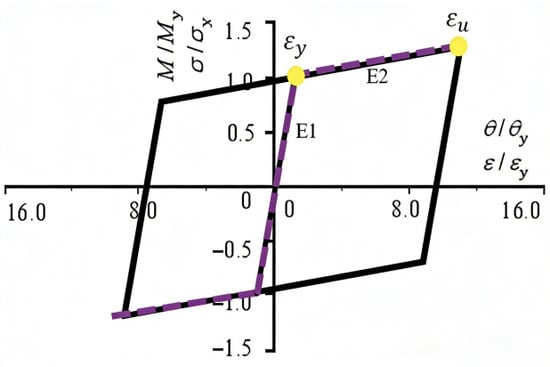
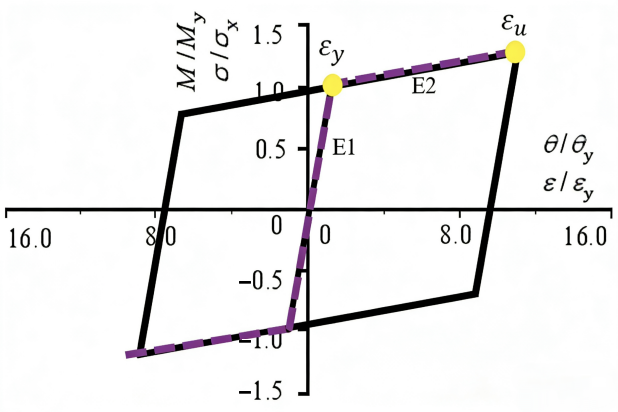
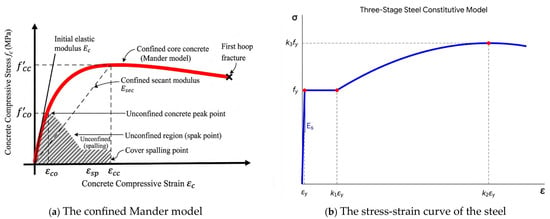
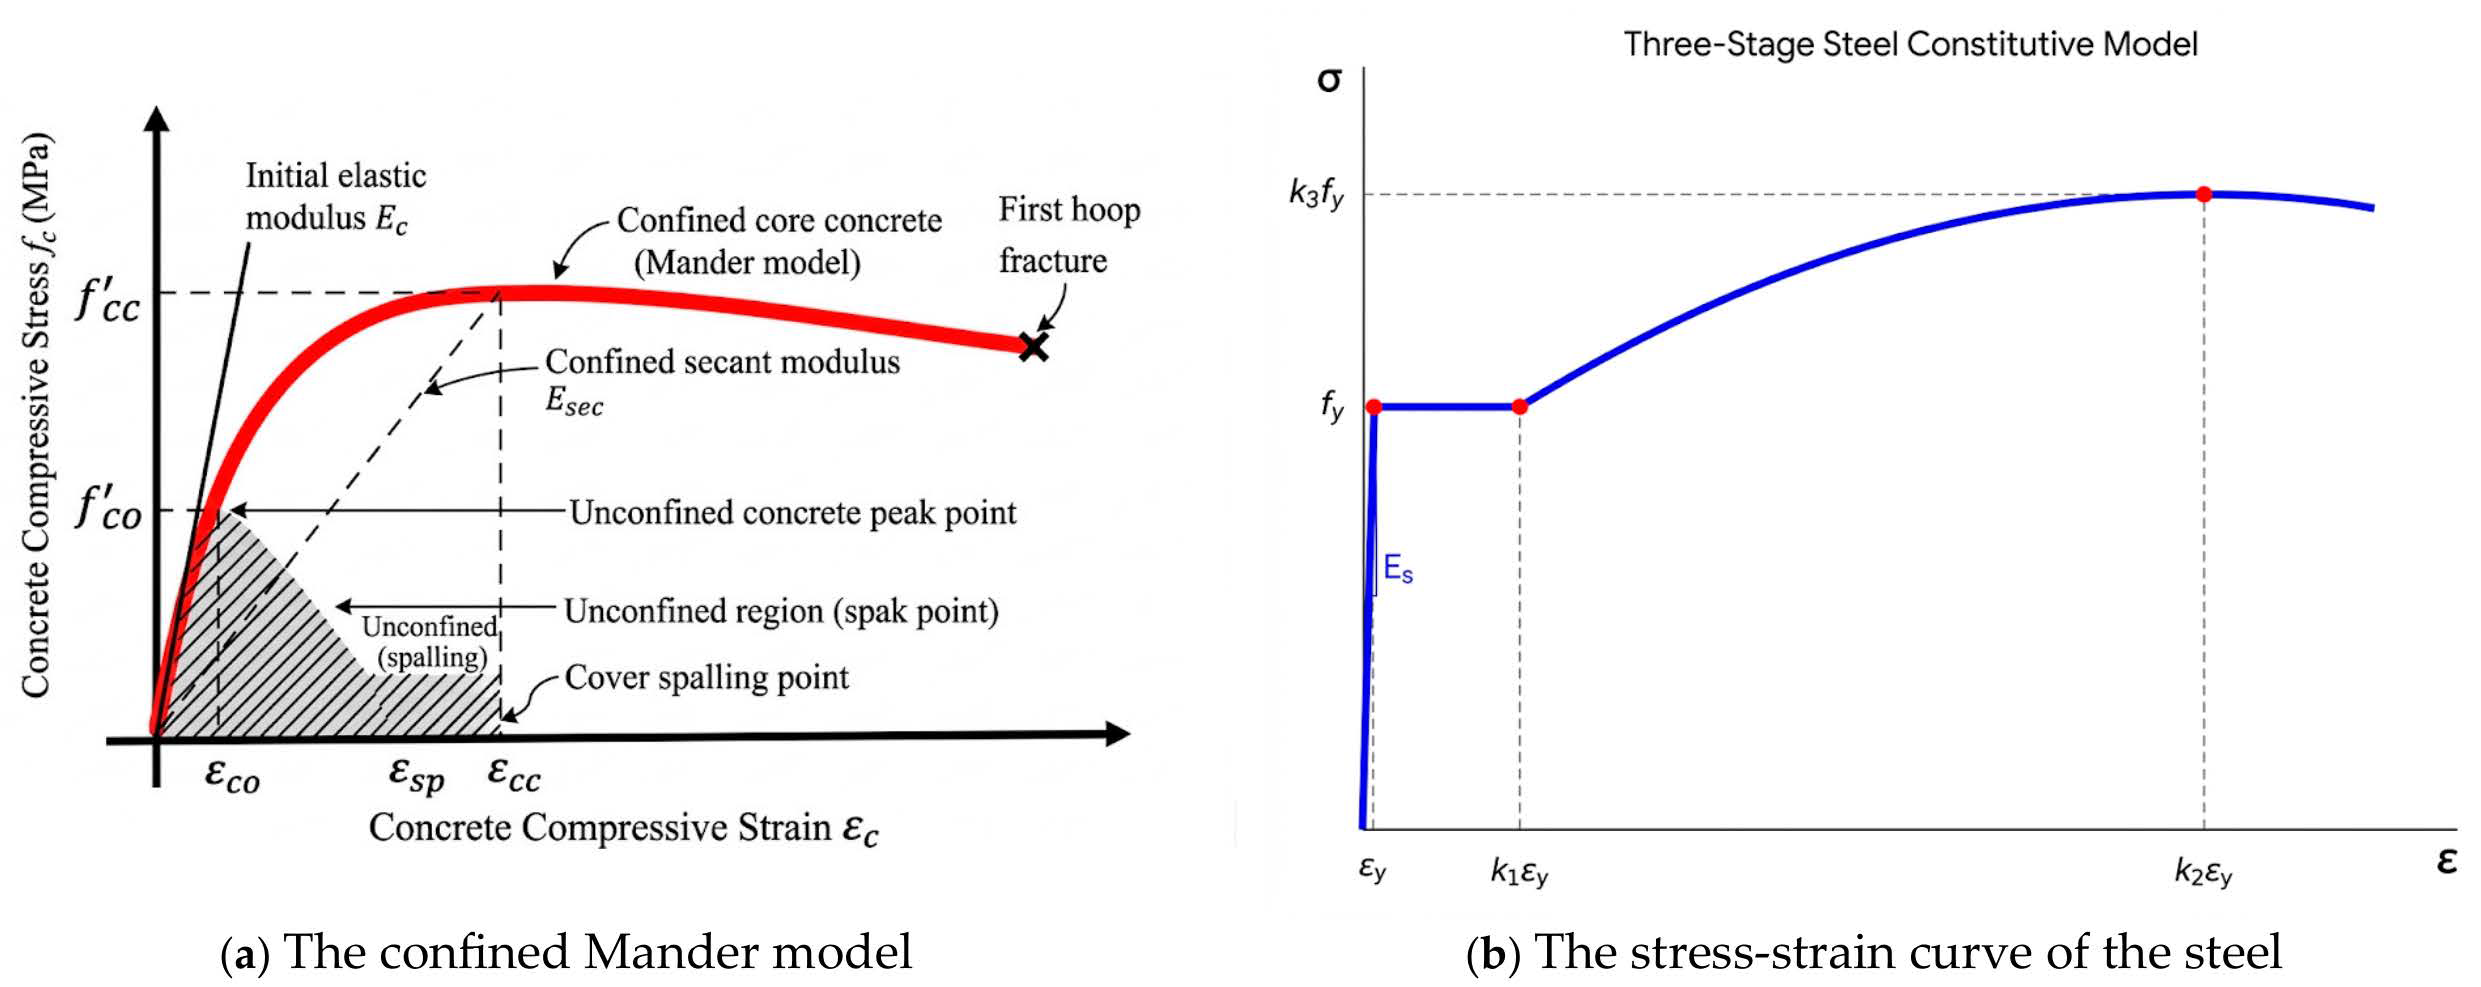
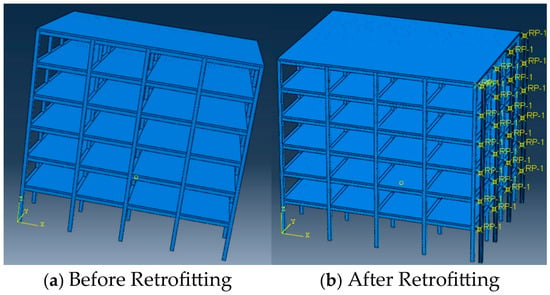
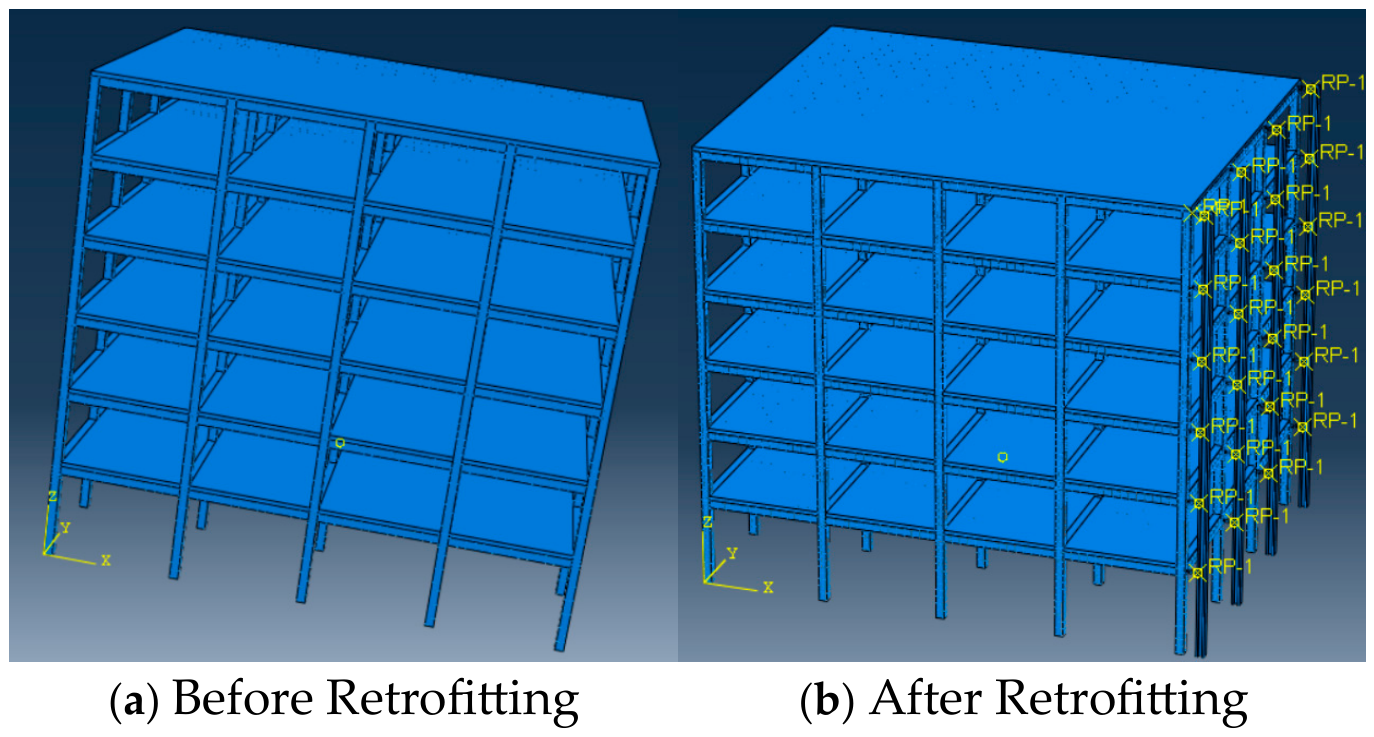
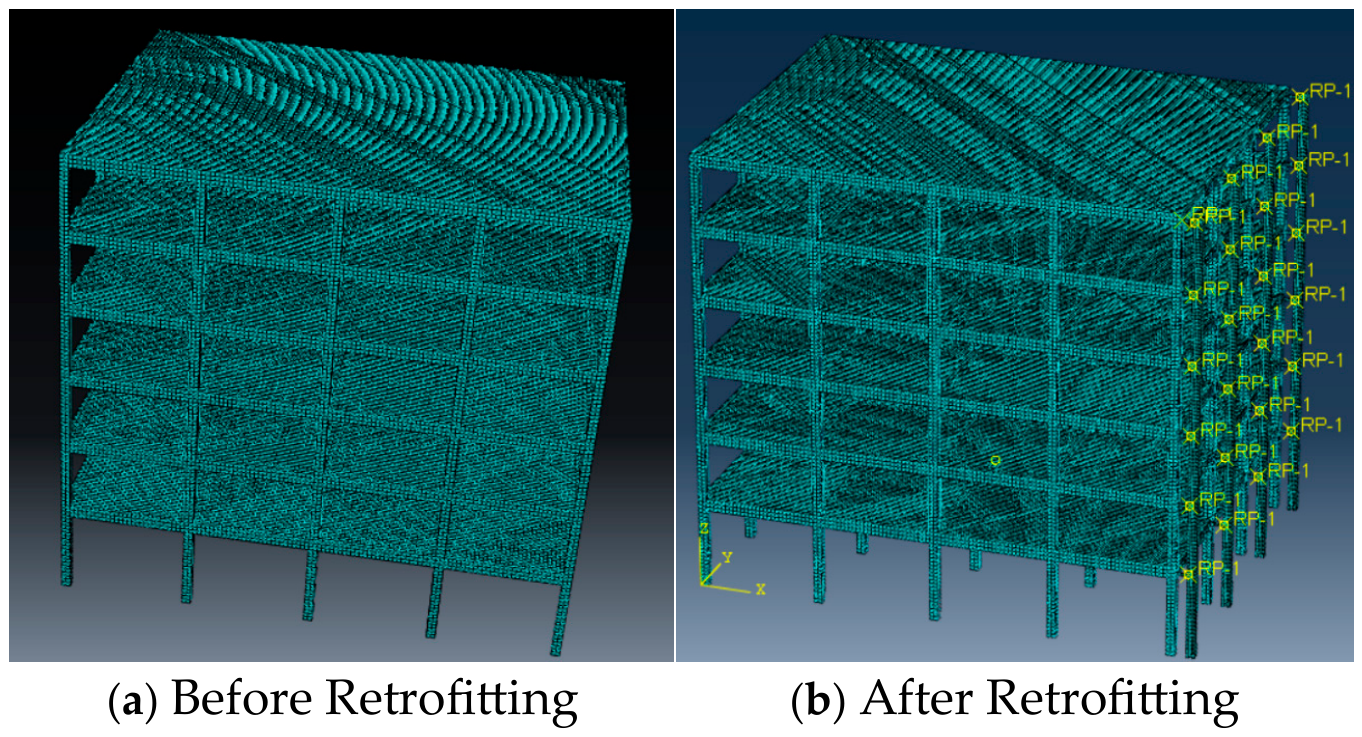
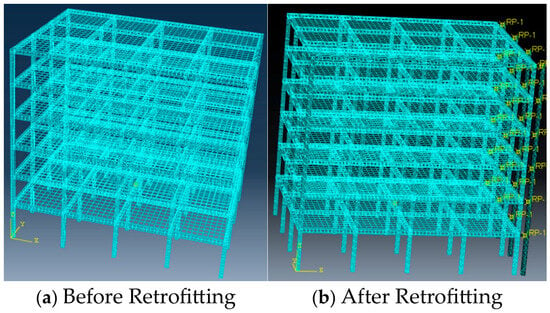
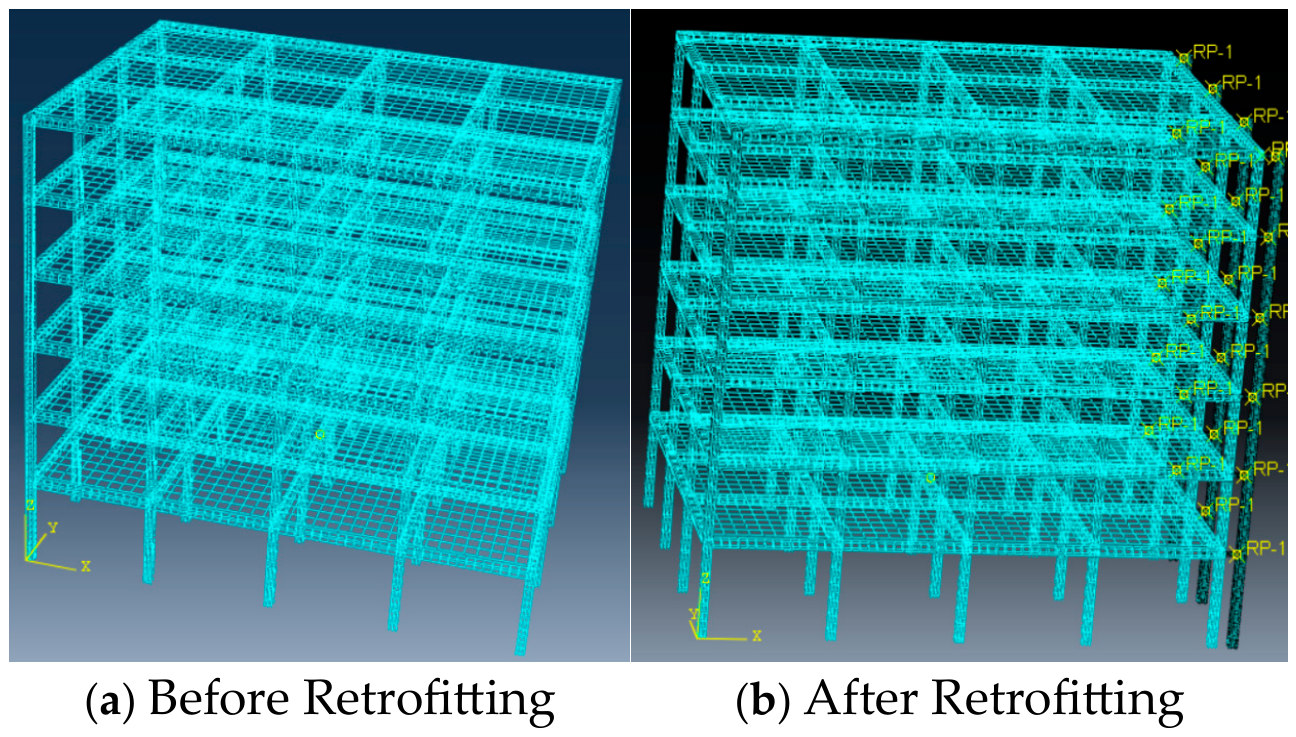
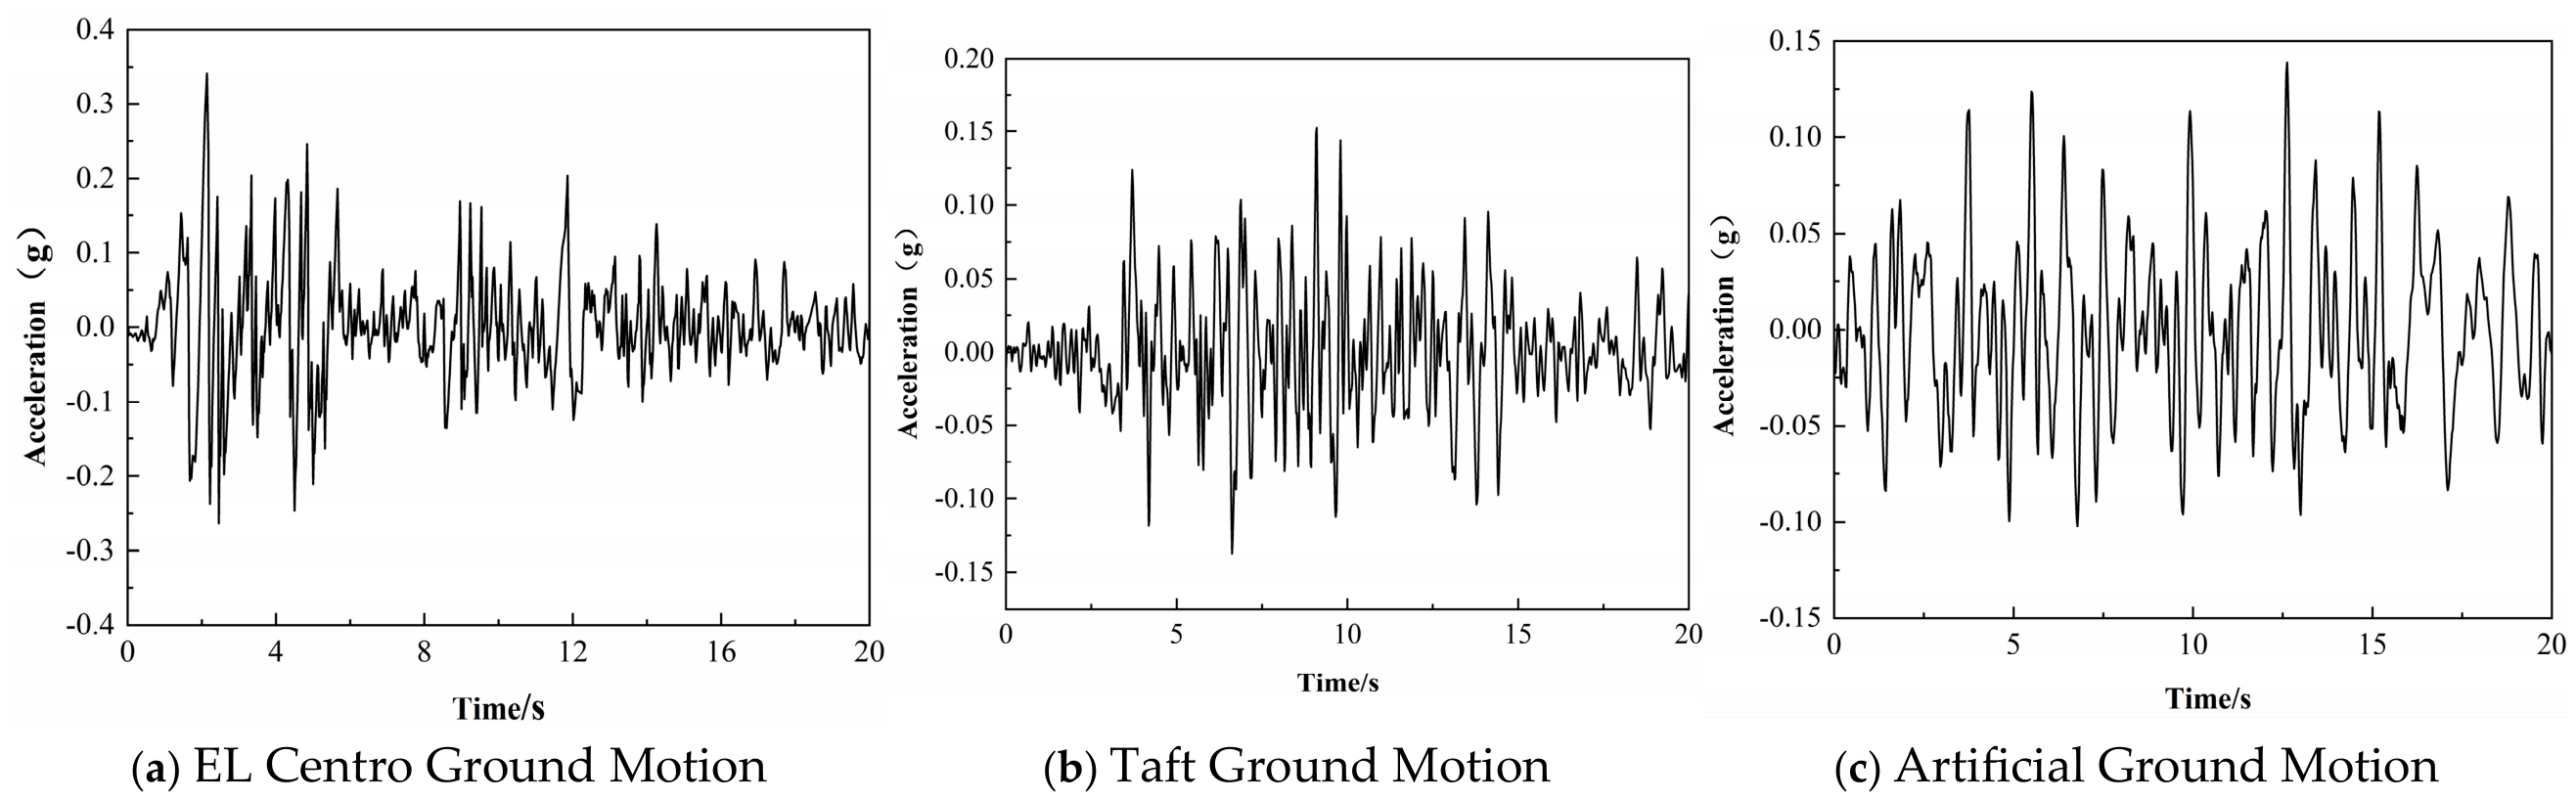
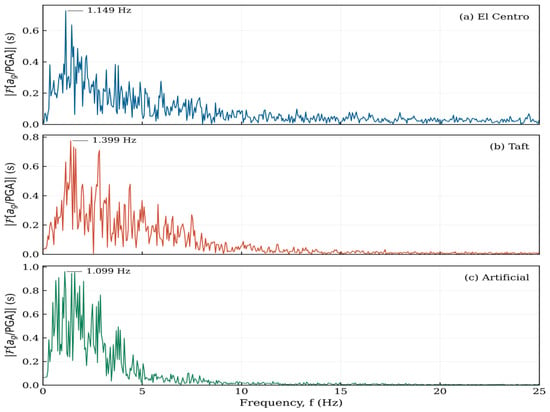
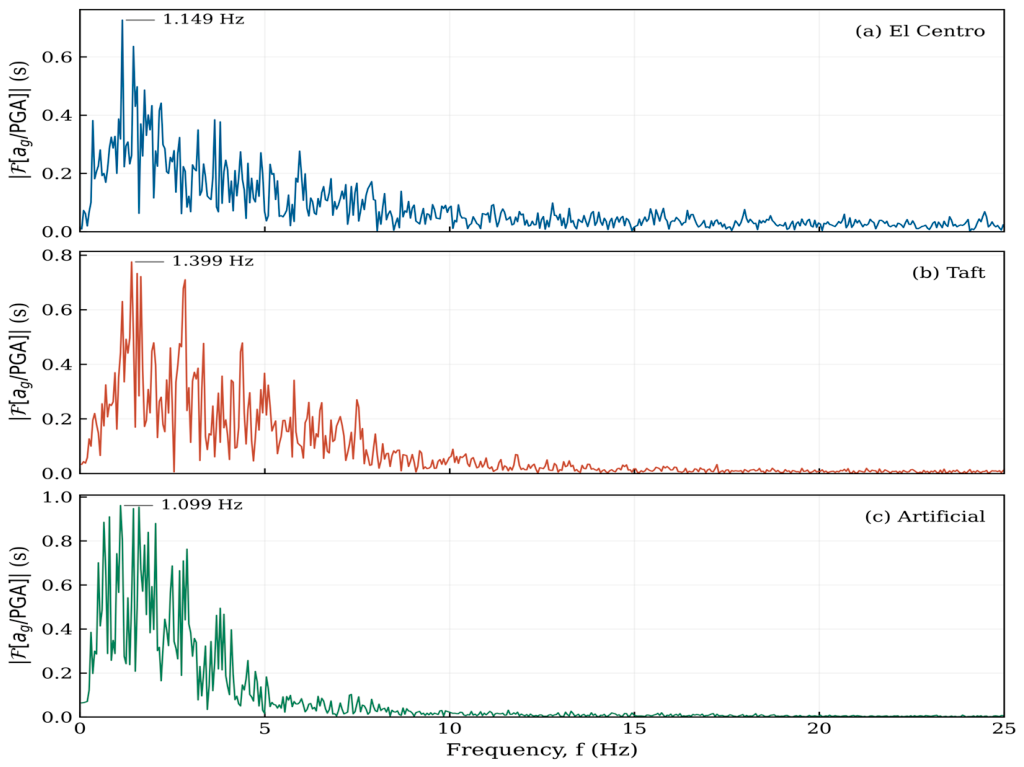
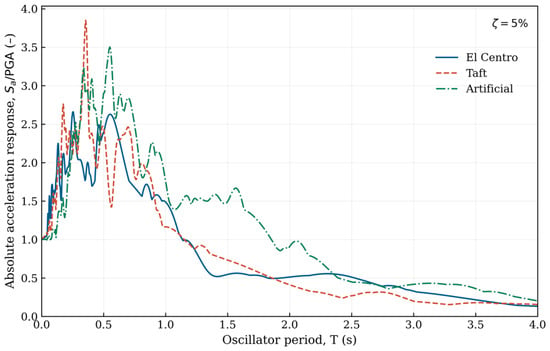
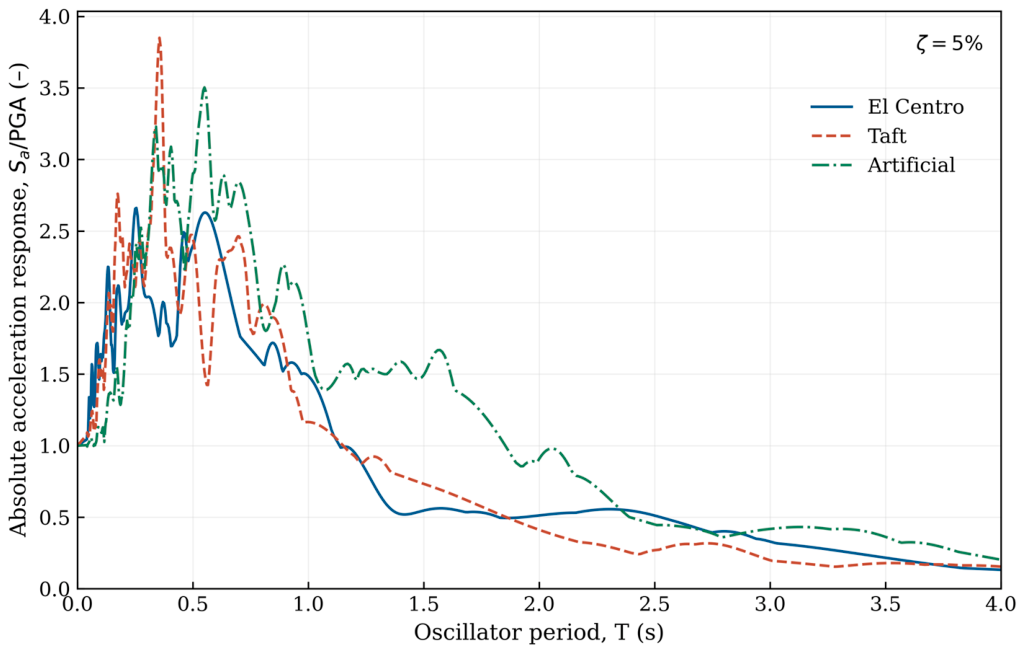
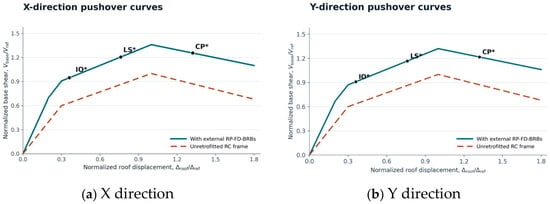
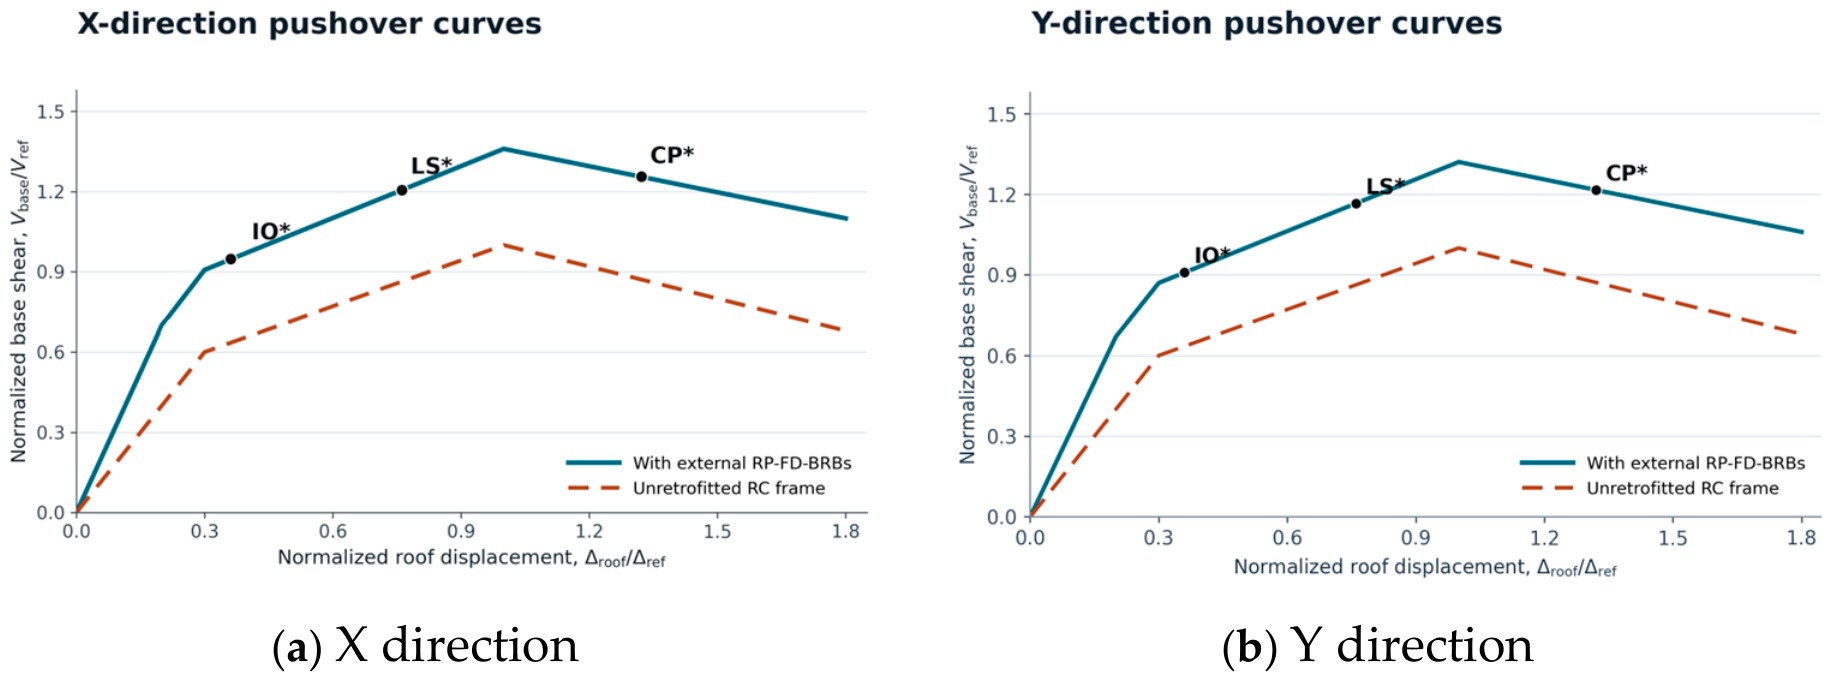
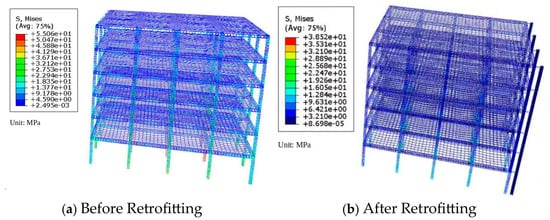
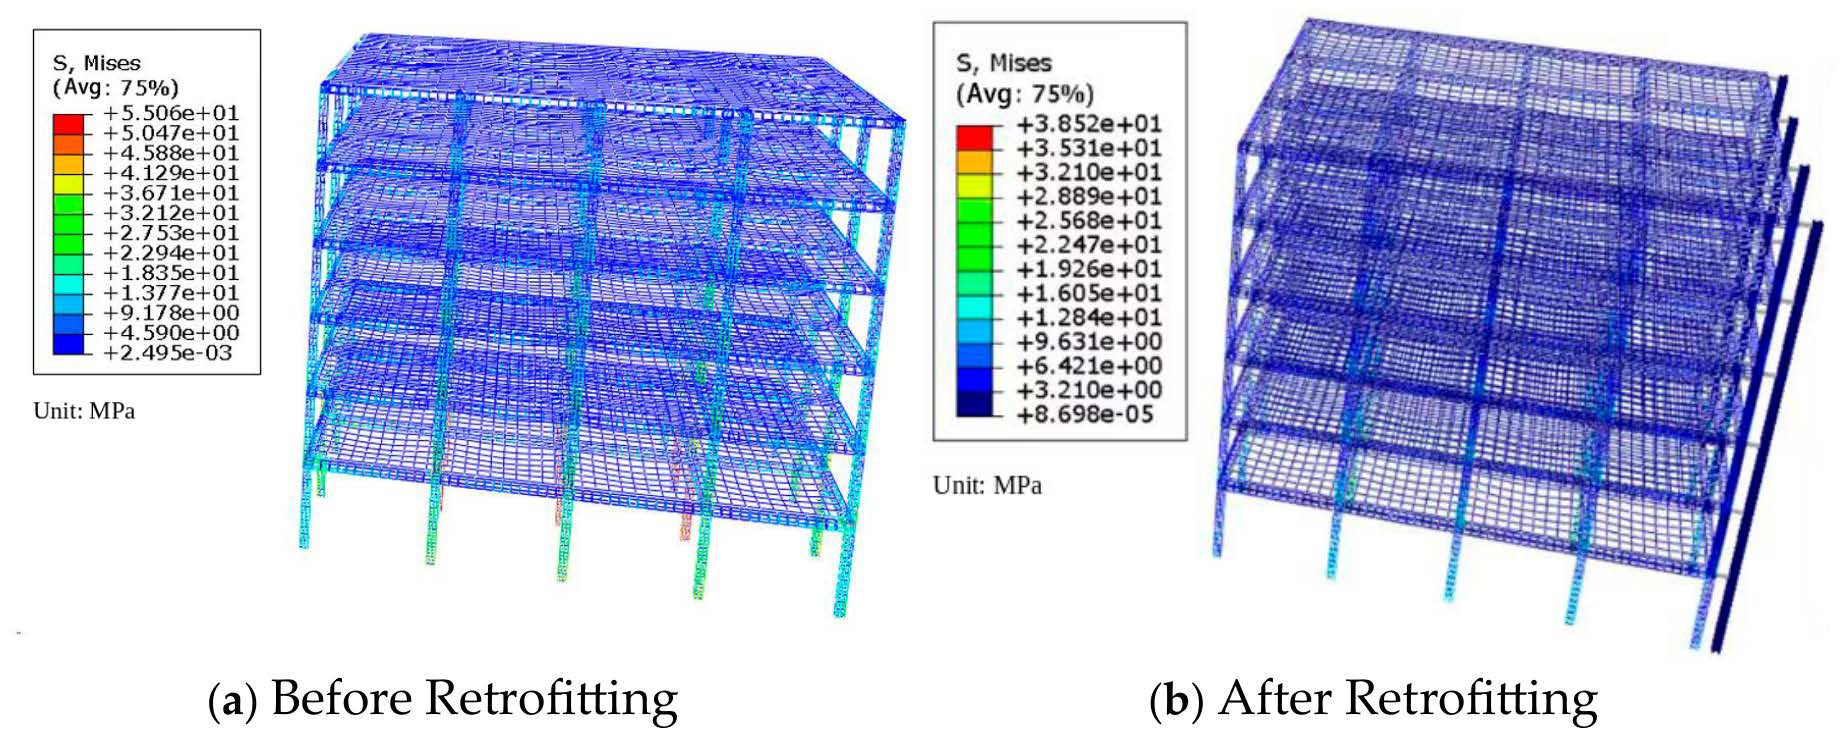
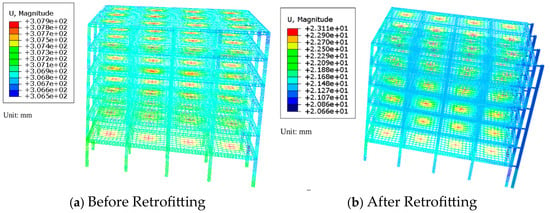
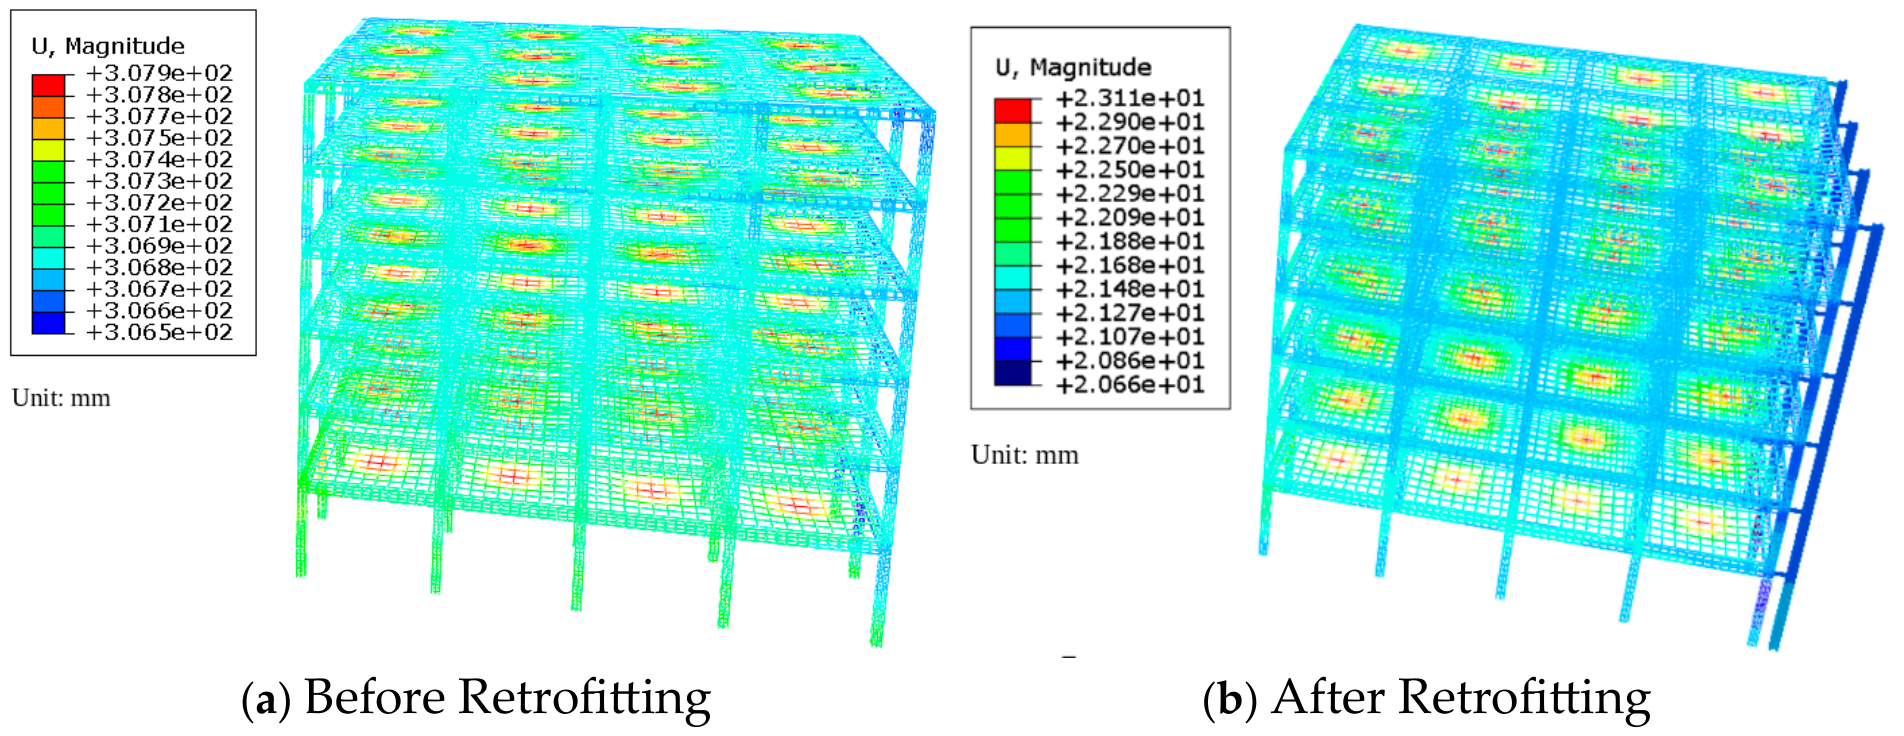
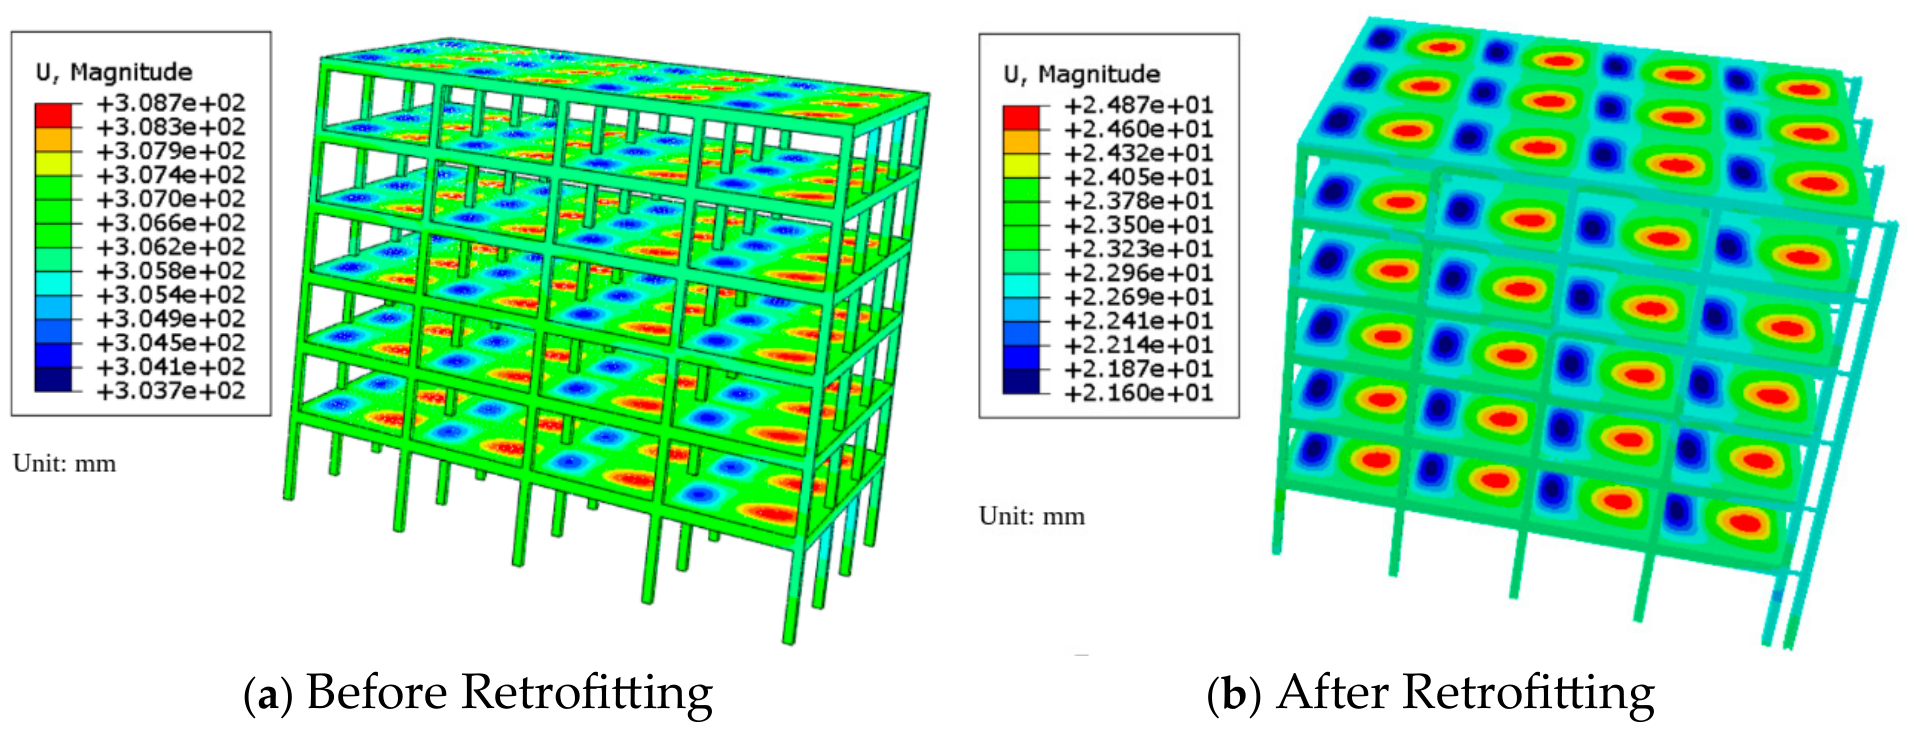
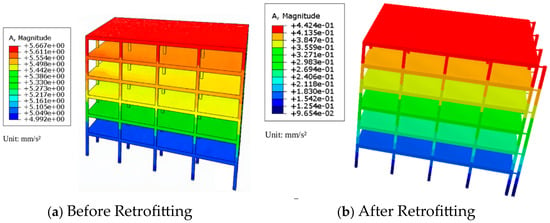
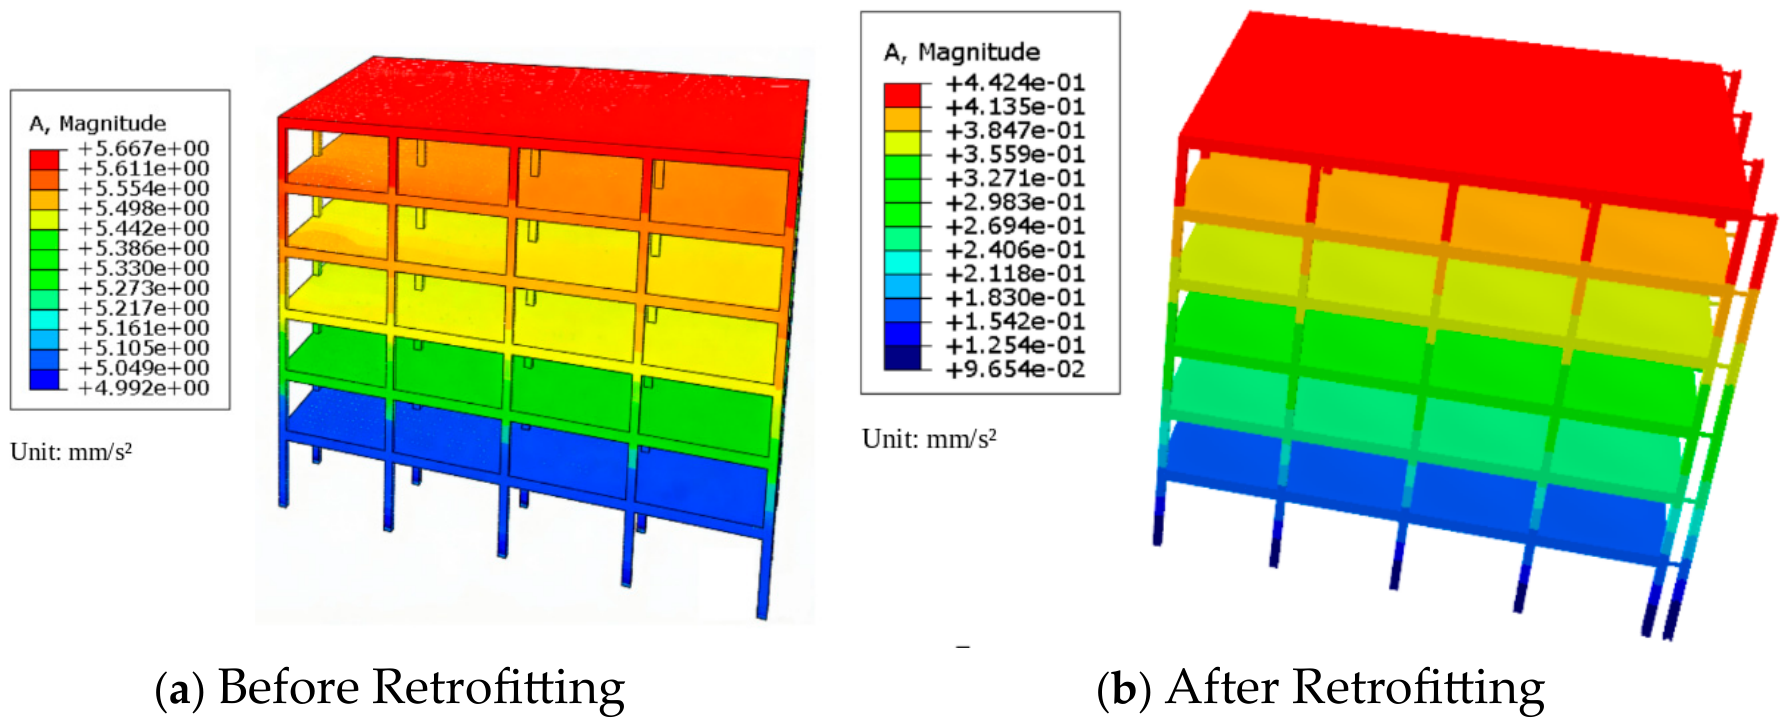
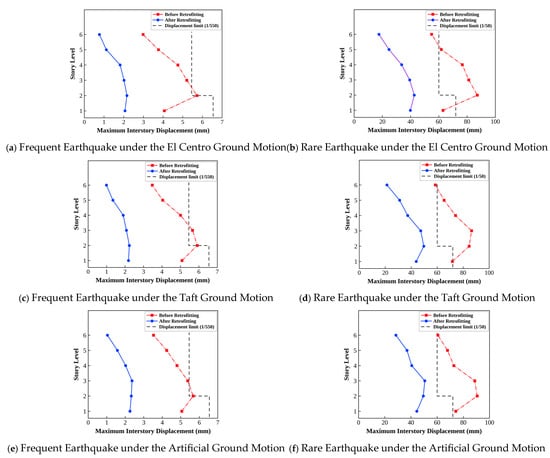
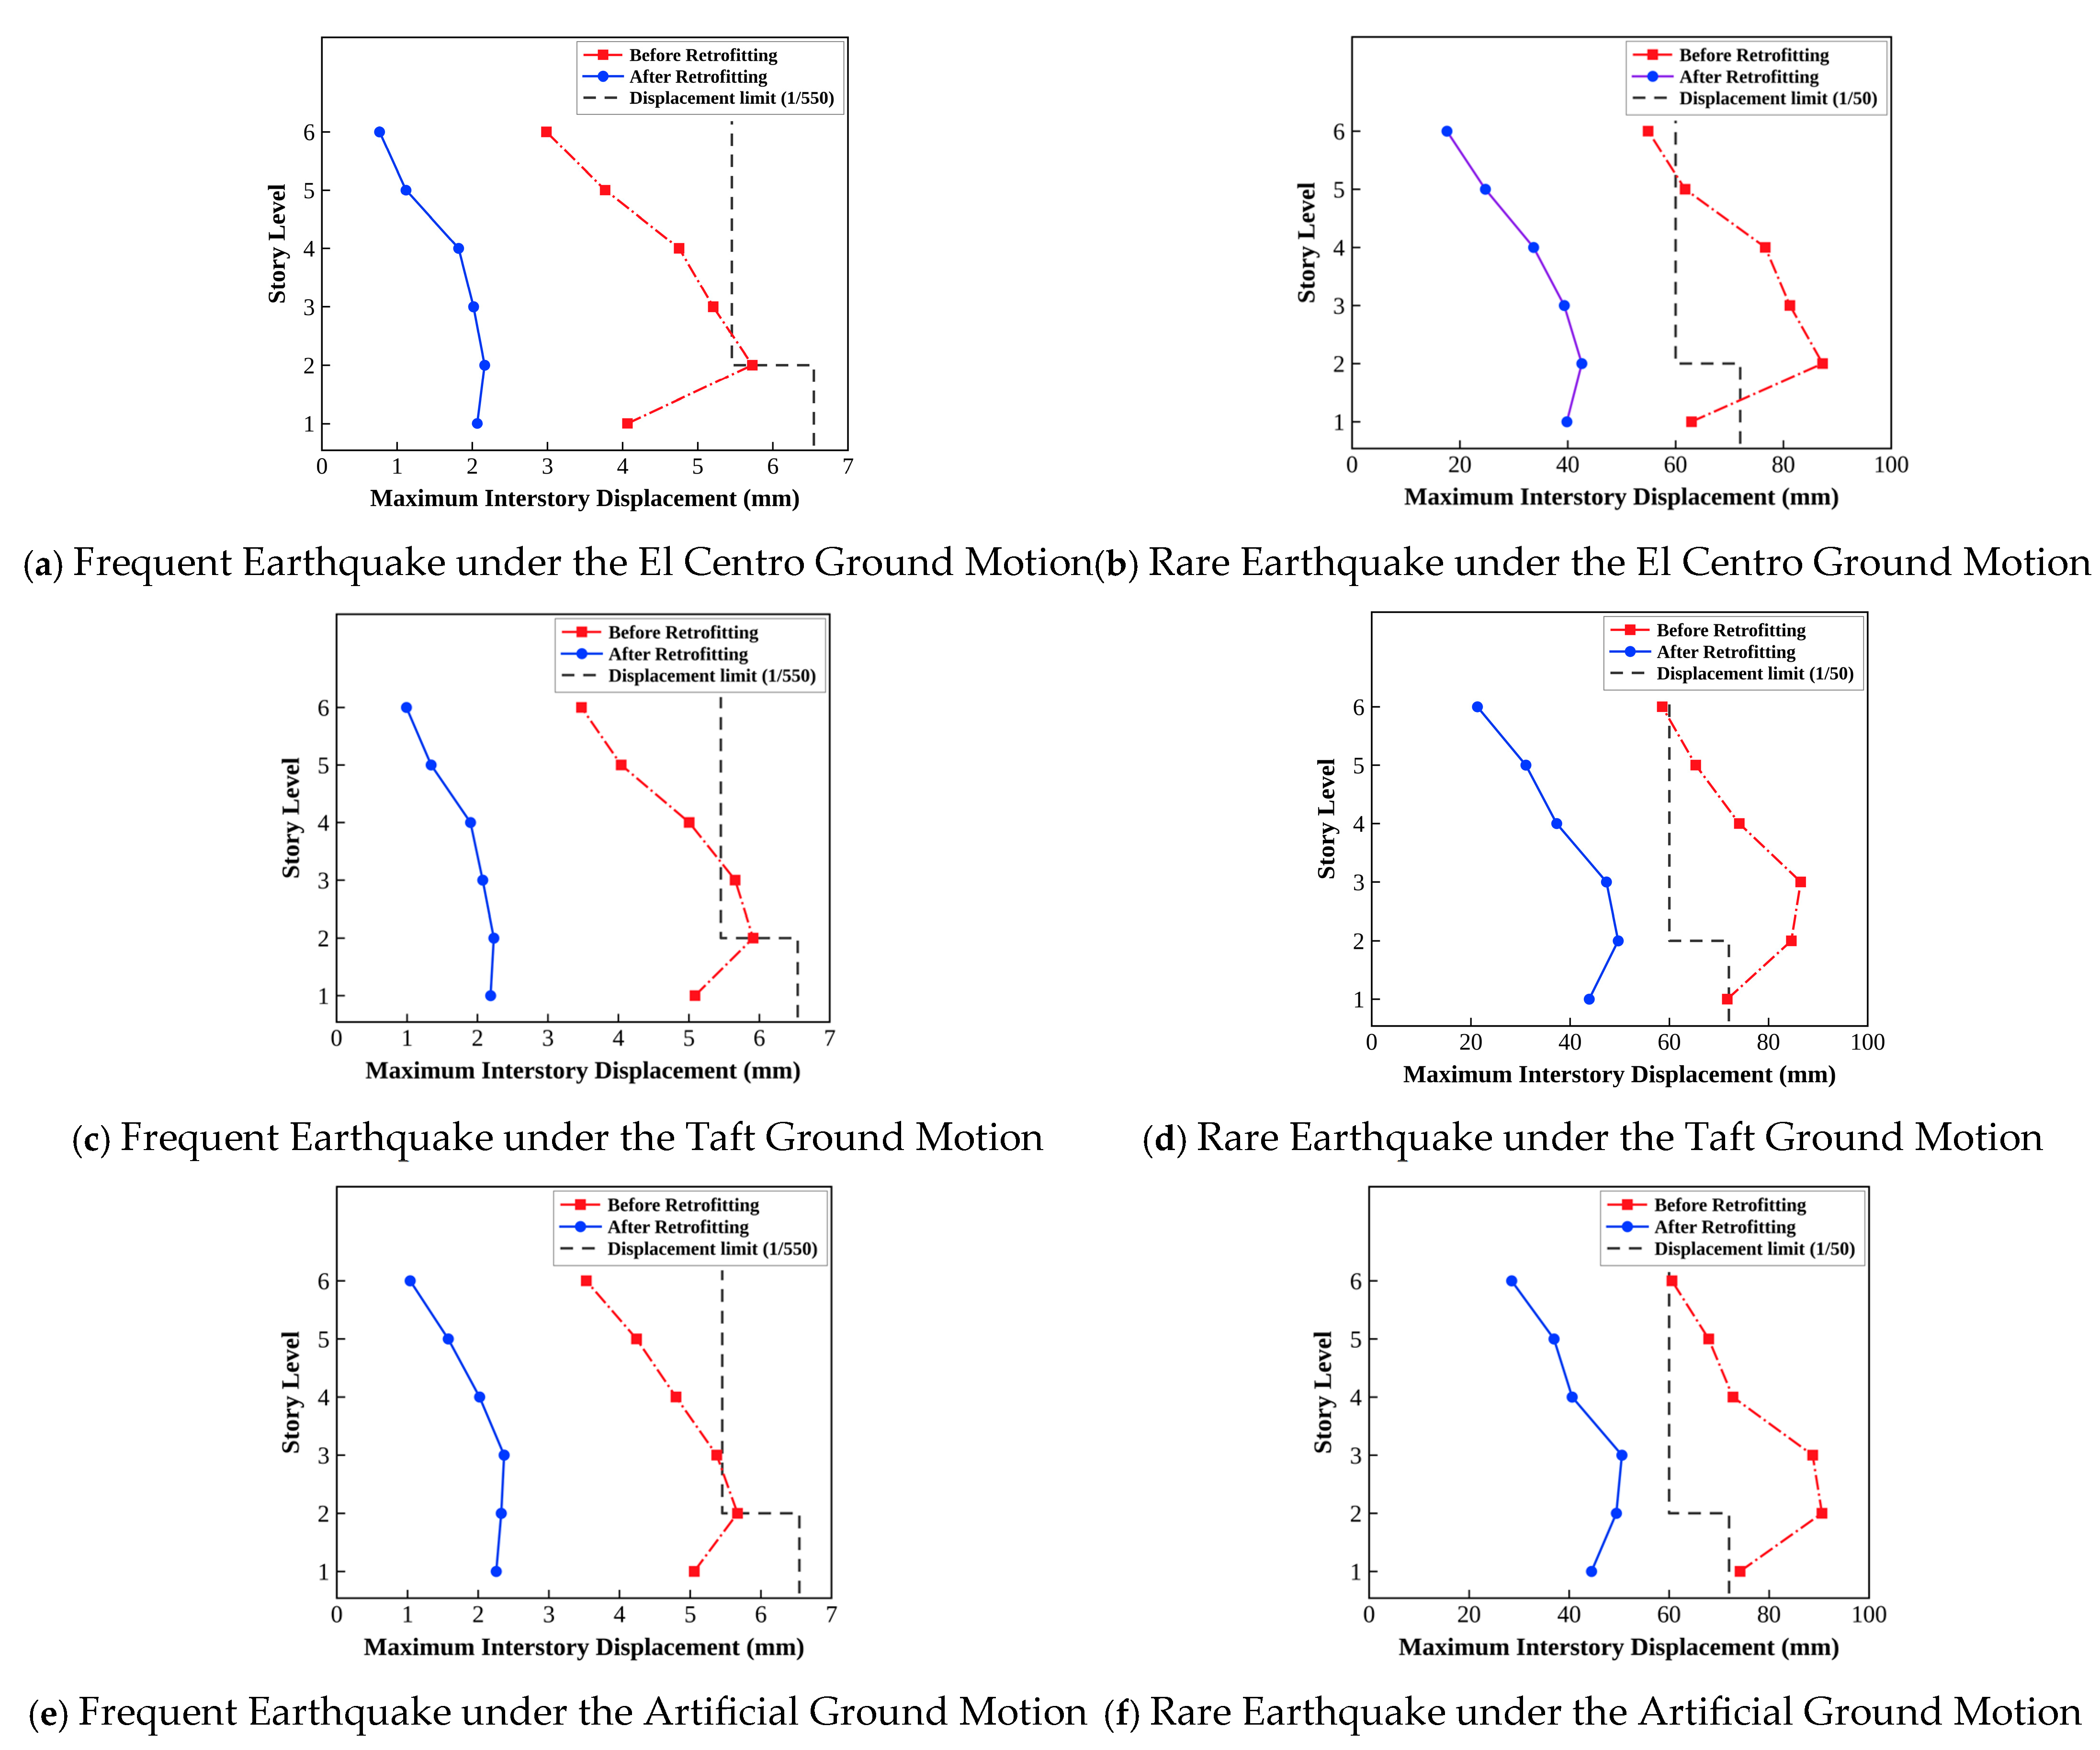
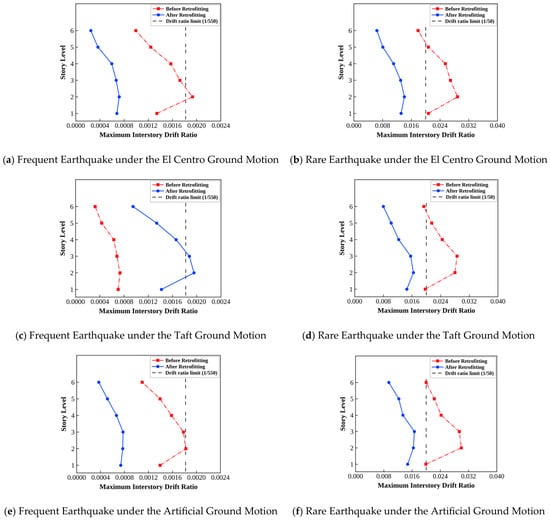
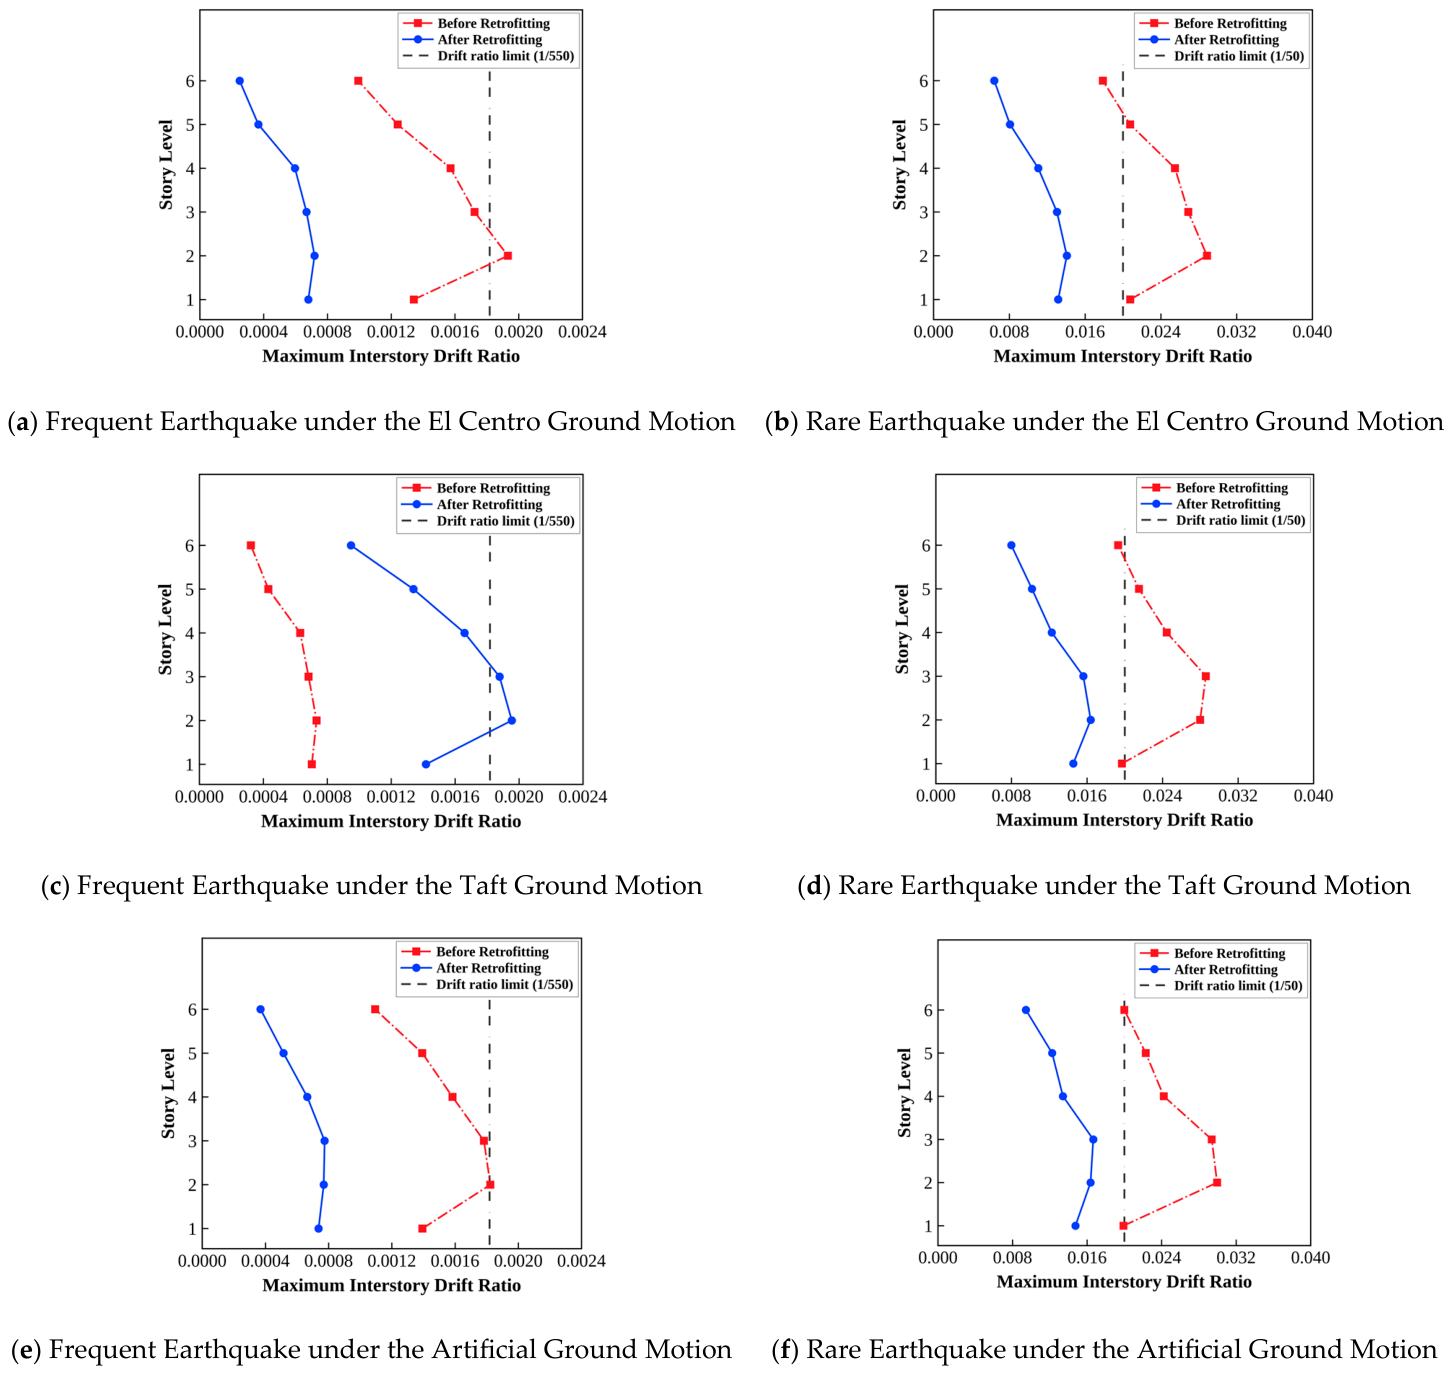
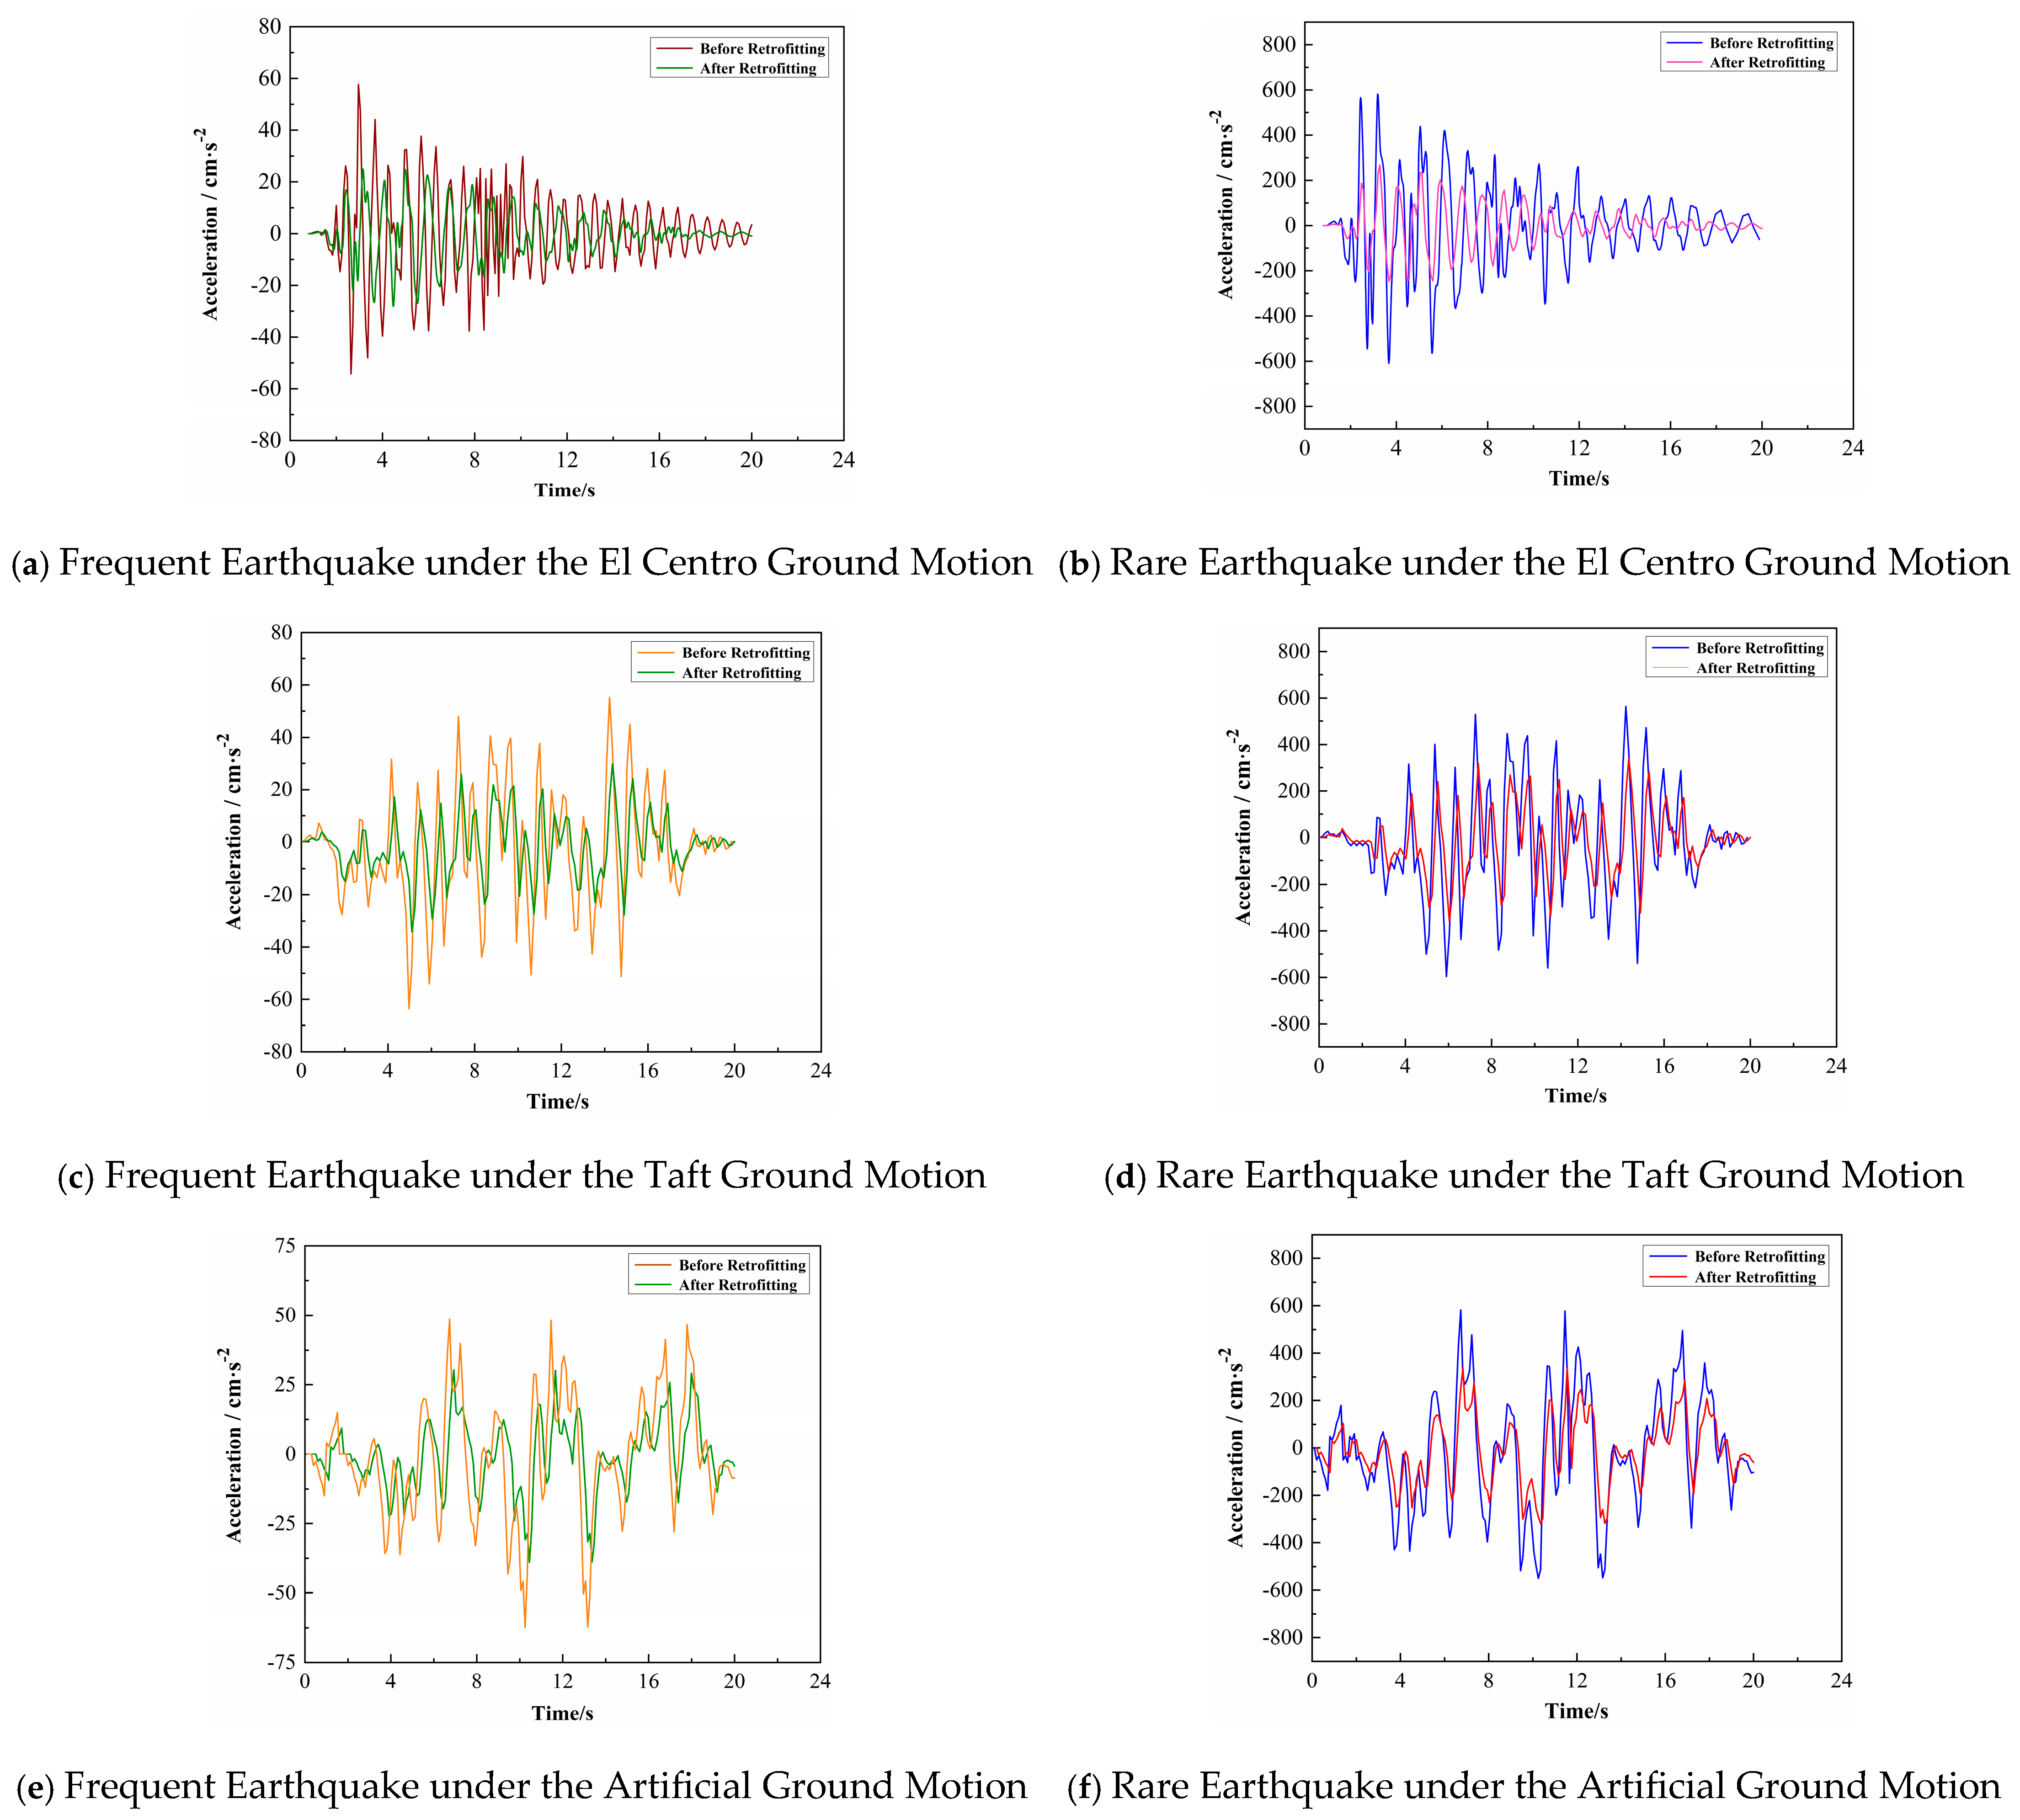
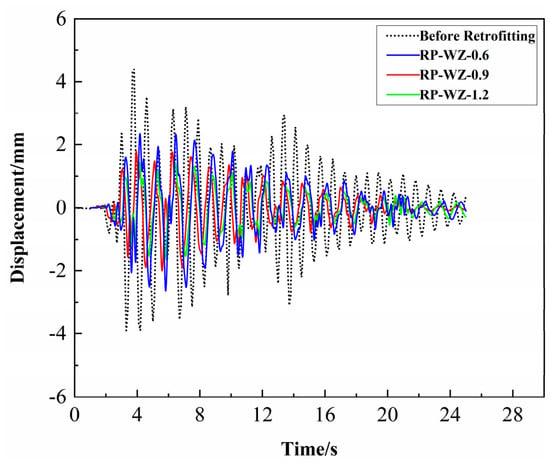
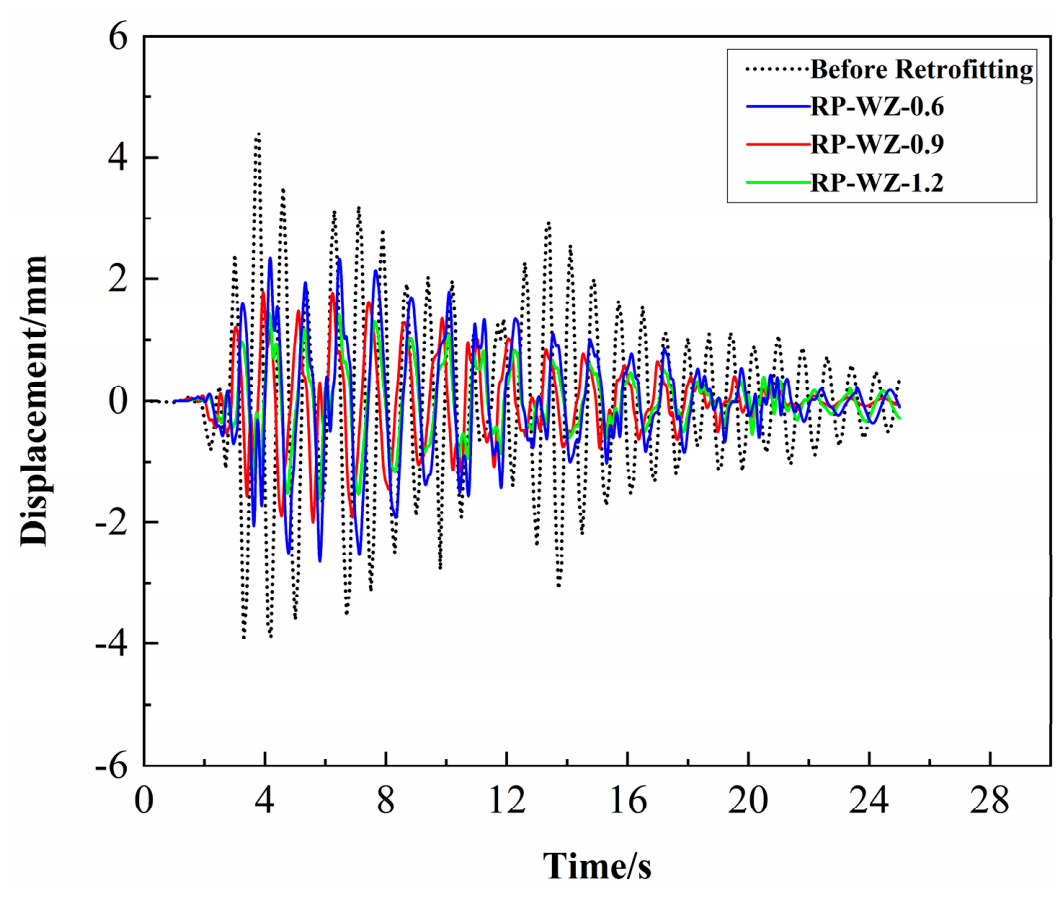
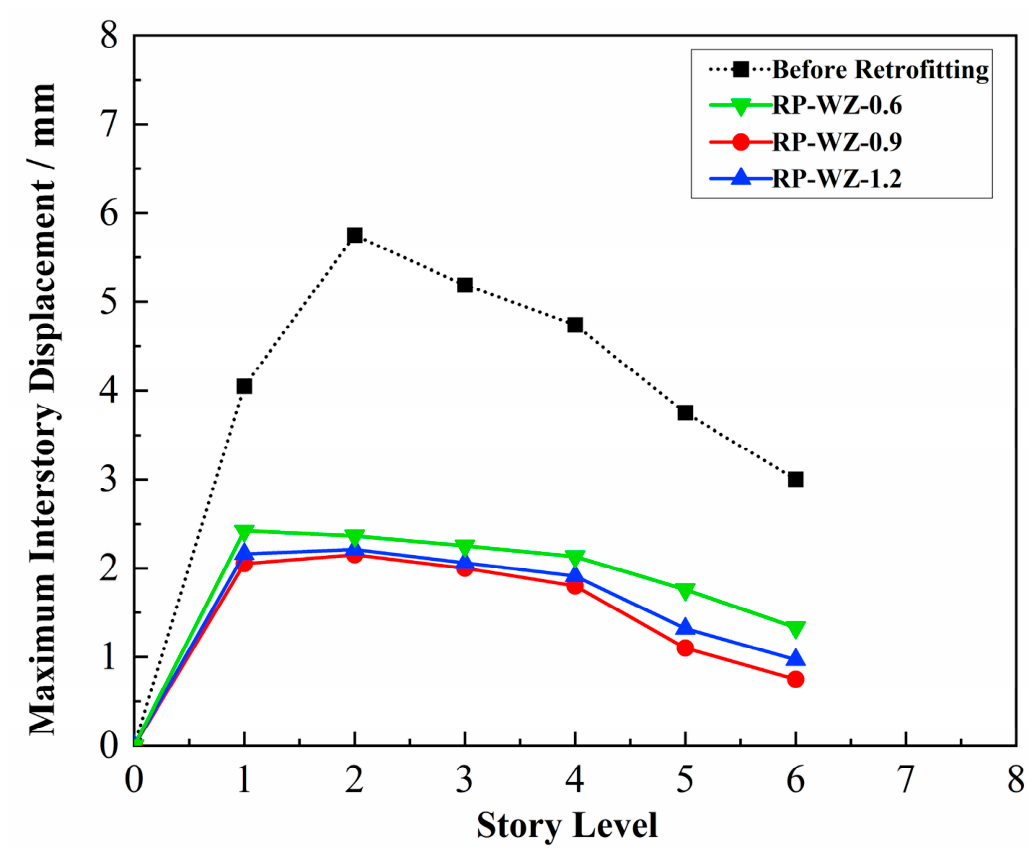
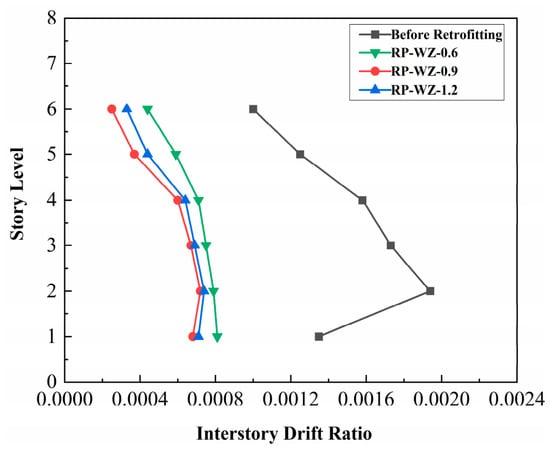
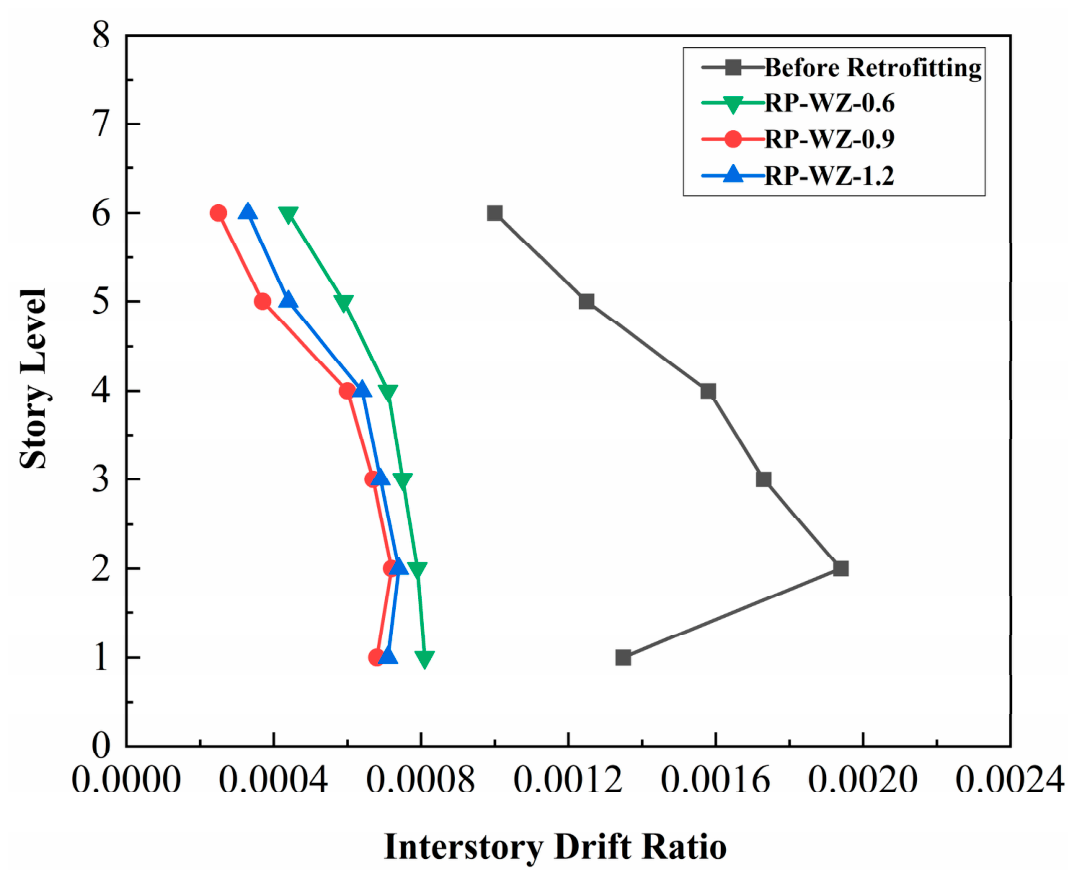
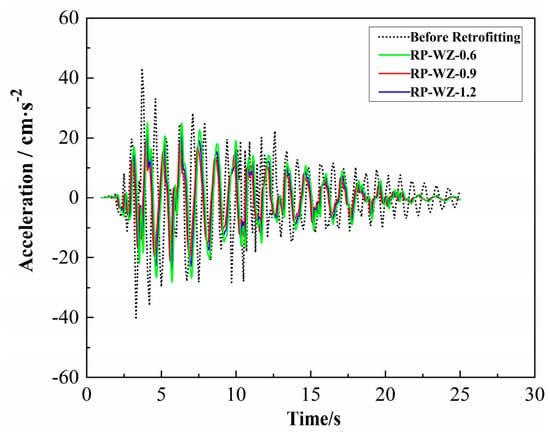
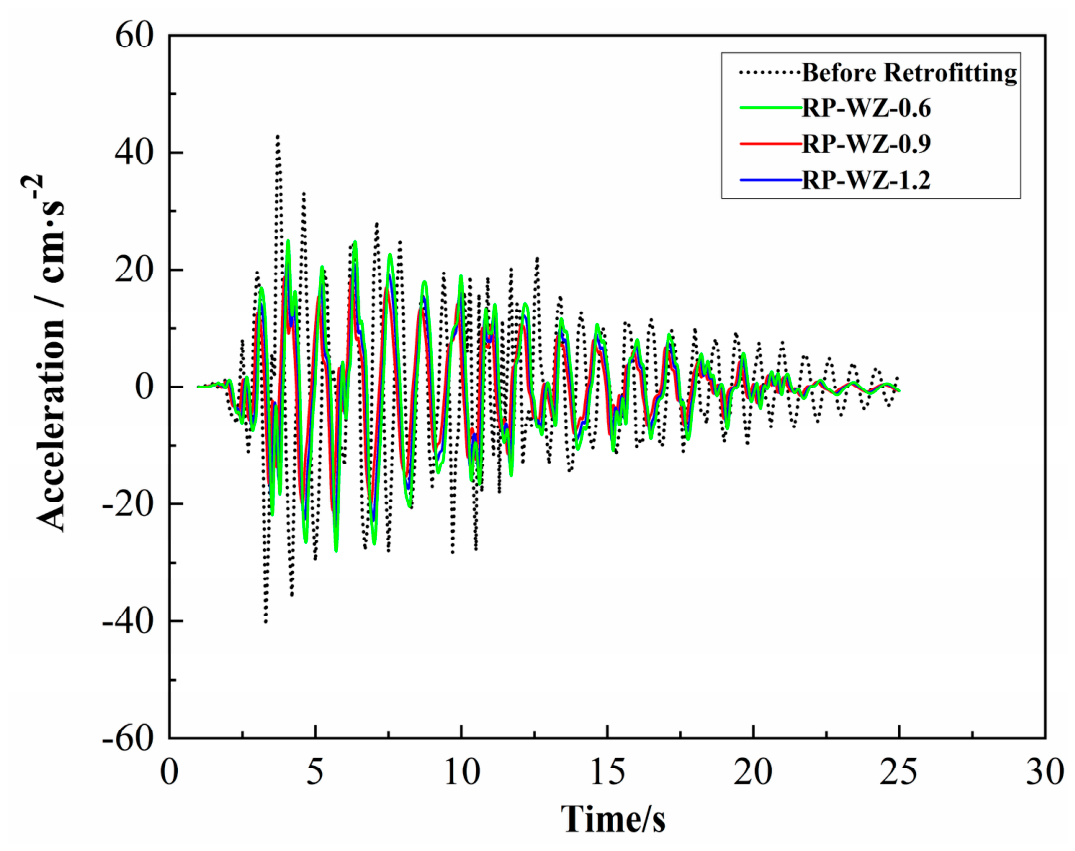
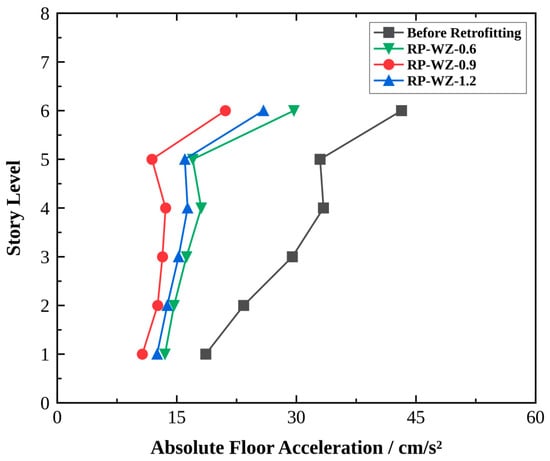
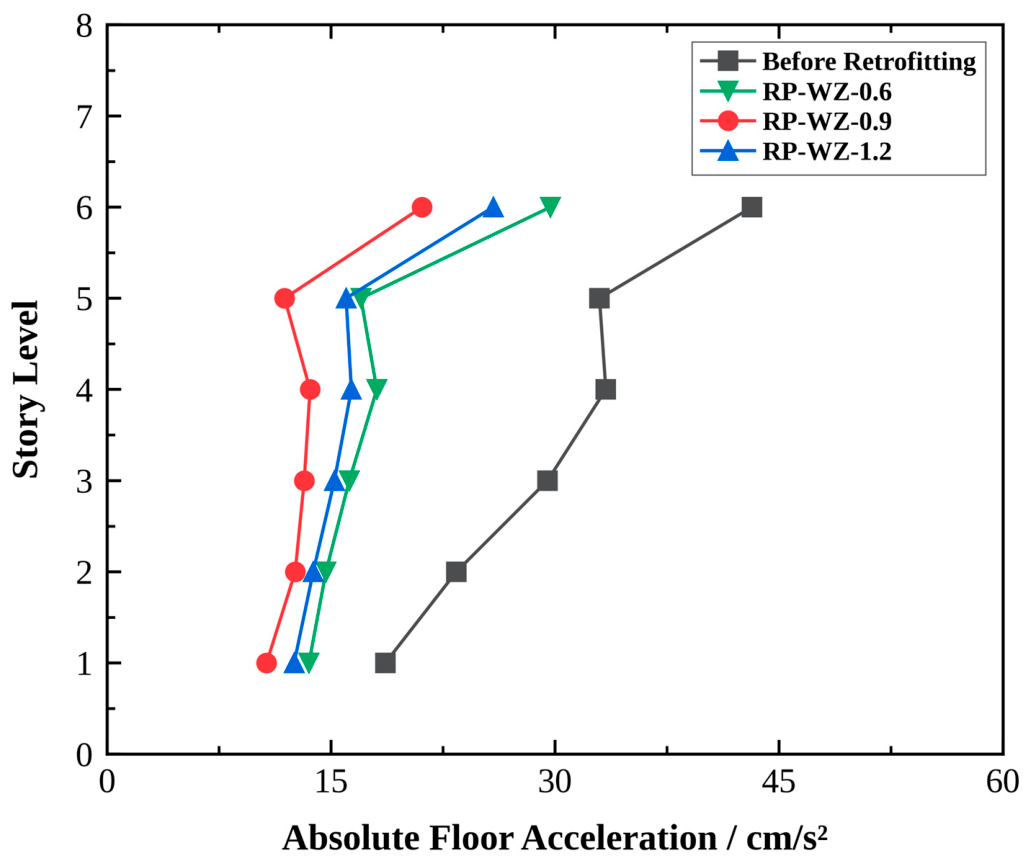
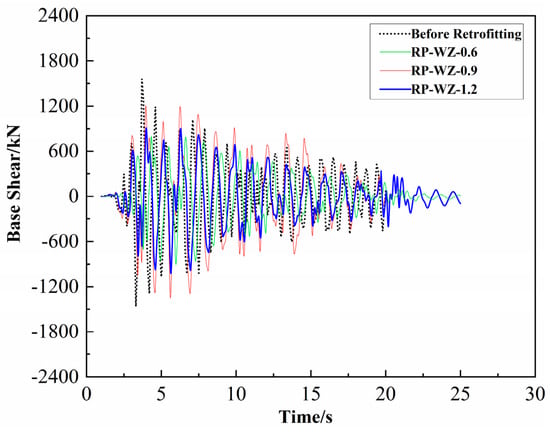
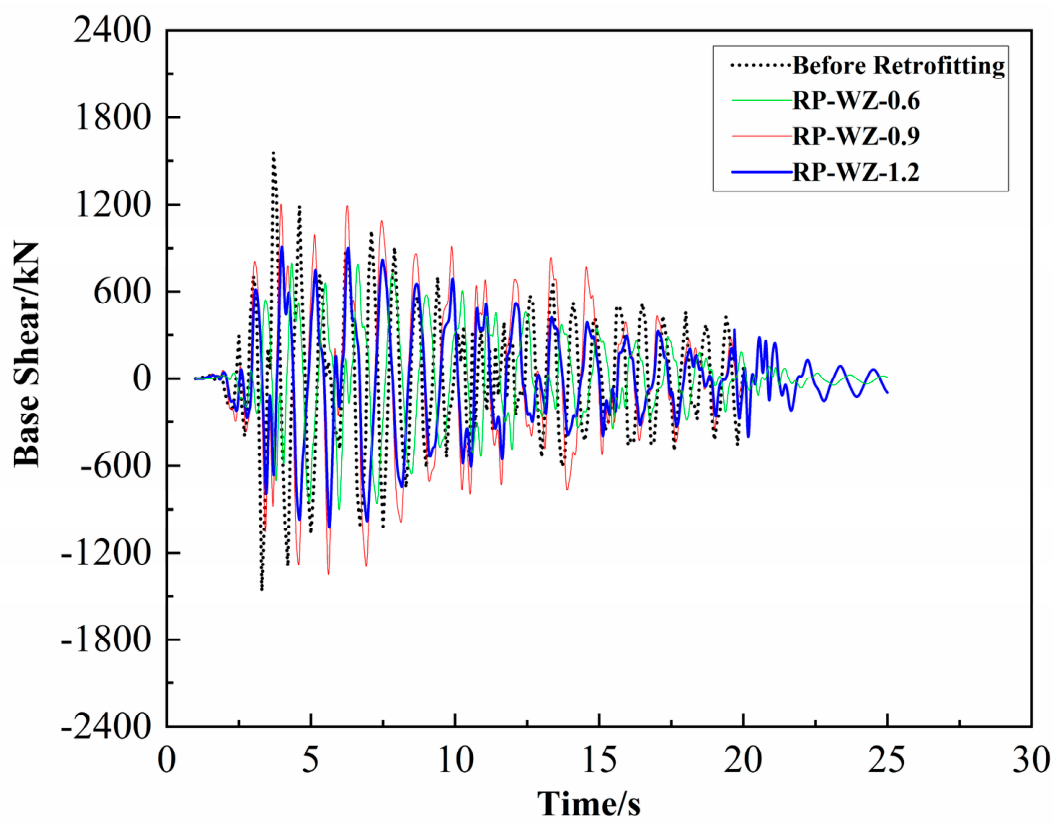

Disclaimer/Publisher’s Note: The statements, opinions and data contained in all publications are solely those of the individual author(s) and contributor(s) and not of MDPI and/or the editor(s). MDPI and/or the editor(s) disclaim responsibility for any injury to people or property resulting from any ideas, methods, instructions or products referred to in the content. |
© 2026 by the authors. Licensee MDPI, Basel, Switzerland. This article is an open access article distributed under the terms and conditions of the Creative Commons Attribution (CC BY) license.