


Featured Application
The proposed construction route and safety control system can be applied to the erection of large-span steel sky corridors that must cross operating substations, urban trunk roads and other sensitive facilities, where heavy cranes are excluded by the limited bearing capacity of the basement roof.
Abstract
Steel sky corridors often span operating facilities and roads, while hoisting equipment is confined to a basement roof, making integral hoisting impracticable. Using the Nanjing Jinling Zhonghuan project as a case study, an integrated construction-control framework was developed for high-altitude piece-by-piece assembly. Four hoisting schemes were compared, and a staged finite-element model was used to compare temporary-support removal sequences. A load-transfer system with 24 support points and 48 jacks was designed. The selected scheme, an 80 t crane advancing from the fixed end and closing at the cantilever end, reduced the heaviest hoisting unit from 108 t to about 10 t, avoiding basement-roof strengthening. Removing the cantilever-end support first caused an abrupt 45.25 mm deflection, whereas removing the roof supports first limited the mid-span increment to 25.61 mm. Jacks preloaded to 80% of the computed reaction limited the maximum temporary-support reaction to 398.0 kN at roof level and 493.9 kN at ground level. Laser scanning of 140 nodes resulted in a maximum final-position deviation ratio of 2.94‰, close to the project-specific 3‰ control value. The reported structural and construction checks met the adopted criteria, supporting the feasibility of the proposed method.
1. Introduction
1.1. Research Background and Significance
With the acceleration of urbanisation and the improvement in economic levels, the demand for super-high-rise, large-span and integrated building structural systems has grown rapidly, and steel sky corridors, which connect multiple high-rise buildings and satisfy both aerial circulation and architectural expression, are being used with increasing frequency. Such projects, however, are usually located in high-density central urban areas, where they must cross busy roads and stand close to existing buildings, so that conventional integral hoisting or ground-level assembly schemes become difficult to implement.
In road-crossing and central urban locations, the ground space is extremely restricted and neither a large assembly platform nor integral hoisting can be provided; at the same time, the presence of existing buildings makes temporary supports difficult to erect, and the influence on surrounding traffic and on existing structures must be strictly avoided. High-altitude piece-by-piece assembly involves a large workload, with positioning and welding concentrated at height, so controlling welding deformation and member misalignment at height while guaranteeing the safety of personnel and equipment has become an urgent problem for such projects.
Against this background, research on high-altitude piece-by-piece assembly technology for large-span steel sky corridors in complex environments has considerable theoretical value and practical significance, the essence of which is to achieve a multi-dimensional balance between safety, economy and efficiency through technological innovation.
1.2. International Research Status
Sky corridors have to cross existing roads, pipelines or operating facilities, and the erection of their steel structures is simultaneously constrained by the site conditions, the state of the existing structures and the safety of the environment below. Research on this problem, both in China and abroad, has concentrated on the four aspects discussed below.
(1) High-altitude piece-by-piece assembly and hoisting technology for large-span steel structures.
Integral hoisting, cumulative sliding and high-altitude assembly have been applied in wide-span steel corridor and airport-roof projects [1,2]. Case studies of long-span steel transfer trusses and construction control of continuous steel truss girders have shown that member segmentation, connection accessibility, temporary support arrangement and staged erection control govern construction feasibility [3,4]. Comparative scheme studies for heavy transfer trusses [5] and temporary works for dismantling cantilever truss bridges [6] further show that method selection depends on equipment availability, site constraints and temporary-support conditions. The bearing capacity of support frames and the need for floor reinforcement in long-span steel truss corridors have also been examined [7]. Most of these studies, however, addressed relatively unrestricted sites or did not integrate the simultaneous constraints of an operating substation, a trunk road and a load-sensitive basement roof.
(2) Construction process simulation and optimisation of the temporary support removal sequence.
The force system of a large-span steel structure changes continuously with the installation and removal of temporary supports during construction, and staged simulation according to construction mechanics is, therefore, required. Nonlinear analysis methods for the construction mechanics of steel structures have been proposed [8], and the consistency between staged simulation results and measured data has been verified by installing stress and deformation measurement points on large-span steel roofs [9]. With respect to the striking sequence, a study of composite beam bridges with corrugated steel webs quantified the influence of the temporary support removal sequence on the internal forces and deformation of the structure [10], and the unloading process of long-span steel roofs together with the design of temporary bracing structures has also been investigated [11]. Existing work has mostly compared the striking sequences of a single structural system, whereas conditions in which load transfer and unloading are coupled, such as a roof support that must be transferred to an existing concrete column through a steel bracket, have not been studied sufficiently [12].
(3) Load transfer of existing structures and the bearing capacity of floor slabs.
When heavy members are added to an existing building, the transfer path of the new load and the bearing capacity reserve of the existing members are the key concerns. The bearing capacity of a temporary support tower used for a large-span steel truss corridor and the corresponding reinforcement of the floor below have been analysed [7], so that concentrated outrigger loads acting on a slab can be checked. Research on temporary shoring has shown that the load applied to a shoring system can be limited by structural fuses [13], and the progressive collapse of system scaffolds after the accidental removal of bracing members has been studied [14]. These results provide a basis for verifying the bearing capacity of the roof and for controlling cracking during support removal, but verification methods that are combined with the support unloading process during construction are still uncommon.
(4) Construction accuracy detection and information-based control.
Three-dimensional laser scanning is non-contact and measures the whole structure at once, and it has gradually been applied to the quality and deformation inspection of steel structure erection. Digital twin models and their establishment methods for steel structure construction processes have been proposed [15], point-cloud-driven methods have been used to create geometric digital twin models of spatial structures [16], and an intelligent BIM-enabled digital twin framework has been developed for real-time structural health monitoring [17]. BIM-FEM information interaction methods based on digital twins have also been reported [18], and the influence of wind load on a high-altitude steel connecting bridge with a small spacing has been analysed and monitored in real time [19]. Overall, however, this research focuses on the detection and monitoring methods themselves, and work that compares the predictions of a construction process simulation with the measured deviations after erection is still scarce [20].
In summary, existing research has established methods for hoisting, construction-stage simulation, existing-structure load transfer and geometry inspection. Less attention has been paid to their integration when a steel sky corridor crosses an operating substation and a trunk road while crane loads are restricted by a basement roof. Taking the Nanjing Jinling Zhonghuan project as a case study, this paper compares hoisting routes, develops a controlled temporary-support load-transfer procedure, and assesses the resulting erection geometry. The temporary support removal sequence is compared and selected rather than presented as a global optimisation.
Accordingly, this study focuses on the methodological integration required by this coupled condition. Its contribution is threefold: (i) constraint-based selection of the assembly and closure route; (ii) controlled load transfer from temporary roof supports to permanent bearings through staged jacking; and (iii) integration of structural, environmental and operational safety controls into one construction workflow. The project-specific geometry and support layout are used to demonstrate the method, while the underlying decision principles are intended to be transferable to other large-span steel corridors with comparable constraints.
1.3. Project Overview
The project considered in this paper is the steel sky corridor of plots A and B of the Nanjing Jinling Zhonghuan project, located in Dongtieguan Lane, Qinhuai District, Nanjing, Jiangsu Province. The corridor is an outdoor steel truss structure connecting plots A and B. Its total length is 81.8 m, and it consists of a central main span of 50.3 m and two cantilever segments of 18 m and 13.5 m at the two ends. The top elevation of the upper chord beam of the corridor is 23.475 m, and the elevation of the lower chord plane varies from 17.975 m at axes 1 to 3 to 16.425 m at axis 4. The relative position of the corridor and a three-dimensional isometric view of the structure are shown in Figure 1 and Figure 2.
Figure 1.
Relative position of the steel sky corridor. The yellow dashed rectangle indicates the planned location of the steel connecting walkway, while the red labels and dimension lines indicate the adjacent roads, plots and distances.
Figure 2.
Three-dimensional isometric view of the steel sky corridor.
The large-span region in the middle of the corridor (axes 2 to 3) crosses an operating 110 kV substation directly, which imposes extremely high requirements on insulation protection, fire prevention and prevention of falling objects during construction. The region between axes 3 and 4 crosses the urban trunk road Fengfu Road, where traffic must be carefully diverted during construction to guarantee the safety of pedestrians and vehicles below, and night-time road closure is usually necessary. The construction site lies in the narrow space between plots A and B, and large hoisting equipment has to travel and stand on the basement roof, so that hoisting of relatively large units is impossible and high-altitude piece-by-piece assembly has to be considered.
The main steel members were fabricated from Q355B low-alloy high-strength steel. The truss and main beams used welded box sections and H-sections, including box sections ranging from 350 × 550 × 25 × 25 mm to 550 × 550 × 30 × 30 mm and HW414 × 405 × 18 × 28 mm H-sections. Secondary beams used H300 × 300 × 8 × 16 and H200 × 100 × 6 × 10 sections, while TM220 × 300 × 11 × 18 sections were used for bracing members. The complete schedule of the 19 member groups, including member marks, functions, cross-sections and material grades, is provided in Supplementary Table S1.
The permanent support system comprised a post-installed rubber bearing at axis 1, a unidirectional sliding hinge bearing at the top of the Y-shaped column at axis 2, and a fixed spherical hinge bearing at the top of the Y-shaped column at axis 3. Axis 4 was a free cantilever end. The corresponding restraint and stiffness assumptions used in the numerical model are described in Section 3.1.
1.4. Coupled Construction Constraints
The combination of a narrow urban site and a load-sensitive basement roof creates four coupled construction constraints. These concern equipment and member division, protection of the operating substation and road, control of accumulated erection deviation, and transfer of temporary-support loads to the permanent structure.
First, the equipment must operate on a narrow strip above the basement roof. Integral or large-panel hoisting would require tandem cranes of 300 or 200 t and extensive roof strengthening. Reducing the lifting unit to individual members allowed for a single 80 t crane to be used, with local loads spread by roadbed boxes, at the cost of more work at height.
Second, the corridor crosses an operating 110 kV substation between axes 2 and 3 and Fengfu Road between axes 3 and 4. Falling objects, welding sparks and crane collisions must be controlled above the substation, while traffic and pedestrians must remain protected during road crossings. These conditions determine the protection-canopy configuration, traffic zoning, road-closure arrangements and night-work procedures.
Third, the 50.3 m main span and the 18 m and 13.5 m cantilever segments make erection deviations sensitive to positioning, welding and temperature effects. Placing the closure at the cantilever end concentrates these deviations at a location where they can be corrected before the final support condition is established.
Fourth, removing the temporary supports changes the force path of the completed steel–concrete system. Roof supports must transfer their loads to existing concrete columns, and different removal orders produce different deformation paths. A controlled unloading procedure and a staged removal sequence were, therefore, required; their comparative assessment is presented in Section 3.
2. High-Altitude Piece-by-Piece Assembly Technology and Overall Deployment
2.1. Comparison and Selection of Construction Schemes
To ensure the safety, quality and schedule of the installation of the steel sky corridor, and taking the site conditions into account, the division of hoisting units, the closure method and the selection of machinery were comprehensively simulated and compared, and four feasible construction schemes were proposed.
2.1.1. Overview of the Hoisting Methods
Scheme 1: integral hoisting of members in divided units (integral hoisting of large-tonnage units). The steel structure in the regions between axes 1 and 2 and between axes 3 and 4 is assembled on the ground into large units, which are installed integrally by tandem lifting with two cranes; in the region between axes 2 and 3, the main truss panels on both sides are hoisted first and the intermediate members are then assembled piece by piece. This scheme is intended to maximise ground-level work and to reduce the amount of work at height. A flow chart of this scheme is shown in Figure 3.
Figure 3.
Flow chart of the integral hoisting of members in divided units (Scheme 1).
Scheme 2: piece-by-piece hoisting of members in divided units (hoisting of relatively heavy panels). The main truss panels between axes 2 and 3 are hoisted first together with temporary support towers, after which the panels between axes 1 and 2 and between axes 3 and 4 are hoisted; the remaining members are installed after the overall frame has been formed. This scheme reduces the weight of a single lift by hoisting in panels. A flow chart of this scheme is shown in Figure 4.
Figure 4.
Flow chart of the piece-by-piece hoisting of members in divided units (Scheme 2).
Scheme 3: piece-by-piece hoisting of individual members (closure at mid-span). All members are broken down into single members or small units and hoisted successively from both sides towards the central span. After the lower chords have been installed, the profiled steel decking is laid first to form a complete working platform, and closure is finally carried out at mid-span. This scheme places the lowest demands on the lifting equipment, but the amount of work at height is large. A flow chart of this scheme is shown in Figure 5.
Figure 5.
Flow chart of piece-by-piece hoisting with the closure segment located in the central span (Scheme 3).
Scheme 4: piece-by-piece hoisting of individual members (closure at the cantilever end). This scheme is similar to Scheme 3 in that individual members are hoisted. The difference is that the existing structure is used as the support point, temporary steel brackets being erected on the concrete columns, and the hoisting sequence advances from the fixed end to the cantilever end so that the erection deviations are concentrated and accommodated at the cantilever end. A flow chart of this scheme is shown in Figure 6.
Figure 6.
Flow chart of the piece-by-piece hoisting advancing towards the cantilever end (Scheme 4).
2.1.2. Analysis of Mobile Crane Selection
The division of the lifting units controlled the required crane capacity and the amount of high-altitude assembly work. Table 1 combines the quantitative lifting parameters with comparative ratings for workspace demand, roof loading, temporary-support complexity, construction duration, relative cost, environmental impact and safety/closure control. Duration and cost are treated as ordinal indicators rather than monetary or calendar forecasts. No composite weighted score was calculated because no project-approved weighting was available. The rating definitions and the basis for each entry are provided in Supplementary Tables S2 and S3. Figure 7, Figure 8, Figure 9 and Figure 10 show the corresponding lifting units.
Table 1.
Comparative assessment of the four construction schemes. Ratings use a 1–5 favourability scale, where 5 is the most favourable. Duration and cost are ordinal relative indicators, not absolute forecasts. Their driver matrices, the required workspace definitions and the rating basis are provided in Supplementary Tables S2–S4.
Figure 7.
Hoisting unit of Scheme 1.
Figure 8.
Hoisting unit of Scheme 2.
Figure 9.
Hoisting unit of Scheme 3.
Figure 10.
Hoisting unit of Scheme 4.
Because complete cost and schedule records were not available on a common basis for all four schemes, construction duration and direct cost were compared using ordinal relative indicators. These indicators are intended for the scheme ranking only and should not be interpreted as absolute schedule or monetary estimates.
2.1.3. Comparative Selection
The four schemes were assessed against lifting demand, required working space, roof loading, temporary-support complexity, relative duration and cost, environmental exposure, and safety and closure control (Table 1). Schemes 1 and 2 reduced the amount of high-altitude work but required heavy tandem lifting, large working space and extensive temporary or roof-strengthening measures. Scheme 3 reduced the crane demand and roof loading but retained a full temporary-support system and required correction at a mid-span closure. Scheme 4 used a single 80 t crane, reduced reliance on temporary towers by transferring roof-level support loads through steel brackets on the existing concrete columns, and concentrated the final correction at the free cantilever end. Because no project-approved criterion weighting was available, no composite score was calculated. Scheme 4 was selected as the preferred scheme among the four investigated options, because it provided the most favourable combination of roof loading, temporary-support demand, environmental impact, safety and closure controllability; its duration and cost entries are ordinal comparative indicators rather than absolute forecasts.
2.2. Configuration of the Temporary Support Towers
2.2.1. Ground-Level Support Towers
In view of the influence of the hoisting operation radius on the overall structure during lifting by the mobile crane, the plan dimensions of the temporary support towers at the cantilever end should not be too large. According to the calculation, lattice-type steel pipe columns of 1.5 m × 1.5 m were selected as the temporary support towers at axes 1, 2, 3 and 4.
The ground-level temporary supports consisted of 1.5 m × 1.5 m lattice towers made of Q235B steel. Each tower used 168 × 8 steel-pipe posts, C12.6 channel ties at 4 m vertical spacing, a 2C30a top cross beam and an HW250 distribution beam. Two 60 t short-stroke jacks were installed at each temporary-support point. The detailed tower drawing is provided in Supplementary Figure S1.
2.2.2. Roof-Level Support Towers
For the original concrete columns, the horizontal distance from the column on axis E to the steel corridor is about 2.45 m and that from the column on axis D is about 1.05 m. Hoop reinforcement made of L100 × 10 angle steel and 100 × 10 batten plates is applied above the concrete columns, and the top end plate is welded to the steel bracket column. Both the steel bracket column and the horizontal cantilever steel beam are HW350 sections (Q355B). The height of the column obtained by setting out is about 0.93 m, and the effective distance from the top of the steel bracket to the lower flange is about 200 mm, which is controlled so that the elevation of the steel structure can be adjusted by the jack.
Stiffening plates 10 mm thick are provided at each support point and at the intersections of the columns and the cross beams. A three-dimensional view of the steel bracket support is shown in Figure 11.
2.3. Site Layout and Hoisting Operation Planning
The internal roads of the existing substation structure are separated from the outside by construction hoarding, and the hoisting operations inside are carried out in a closed manner. The lower chord was installed first to form the lower-chord plane, after which the other members were erected piece by piece until the region above the substation was complete. Representative photographs of the hoisting work are shown in Figure 12 and Figure 13.
Figure 11.
Three-dimensional view of the steel bracket support.
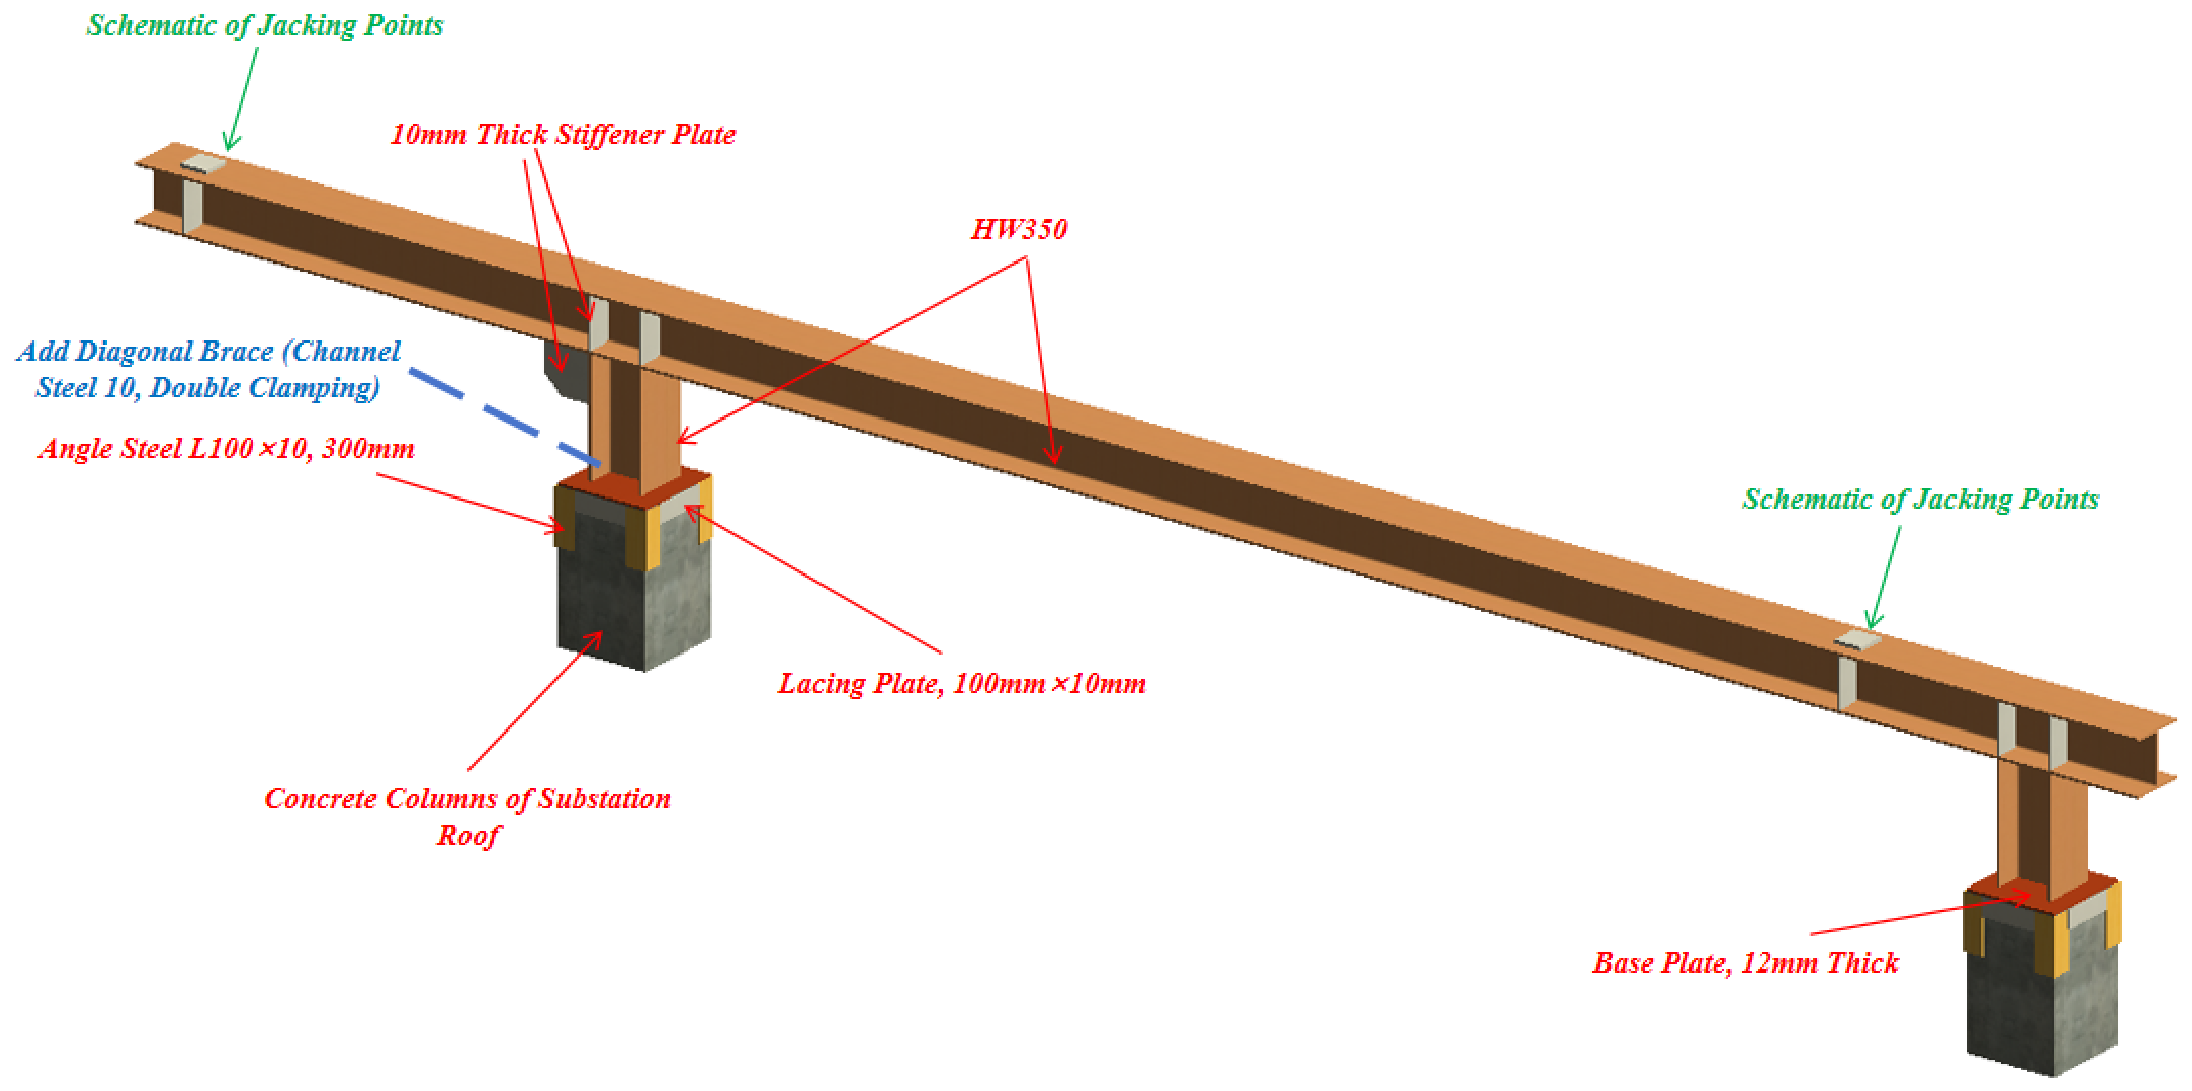
Figure 12.
Photograph 1 of the member hoisting in the region inside the existing substation structure.
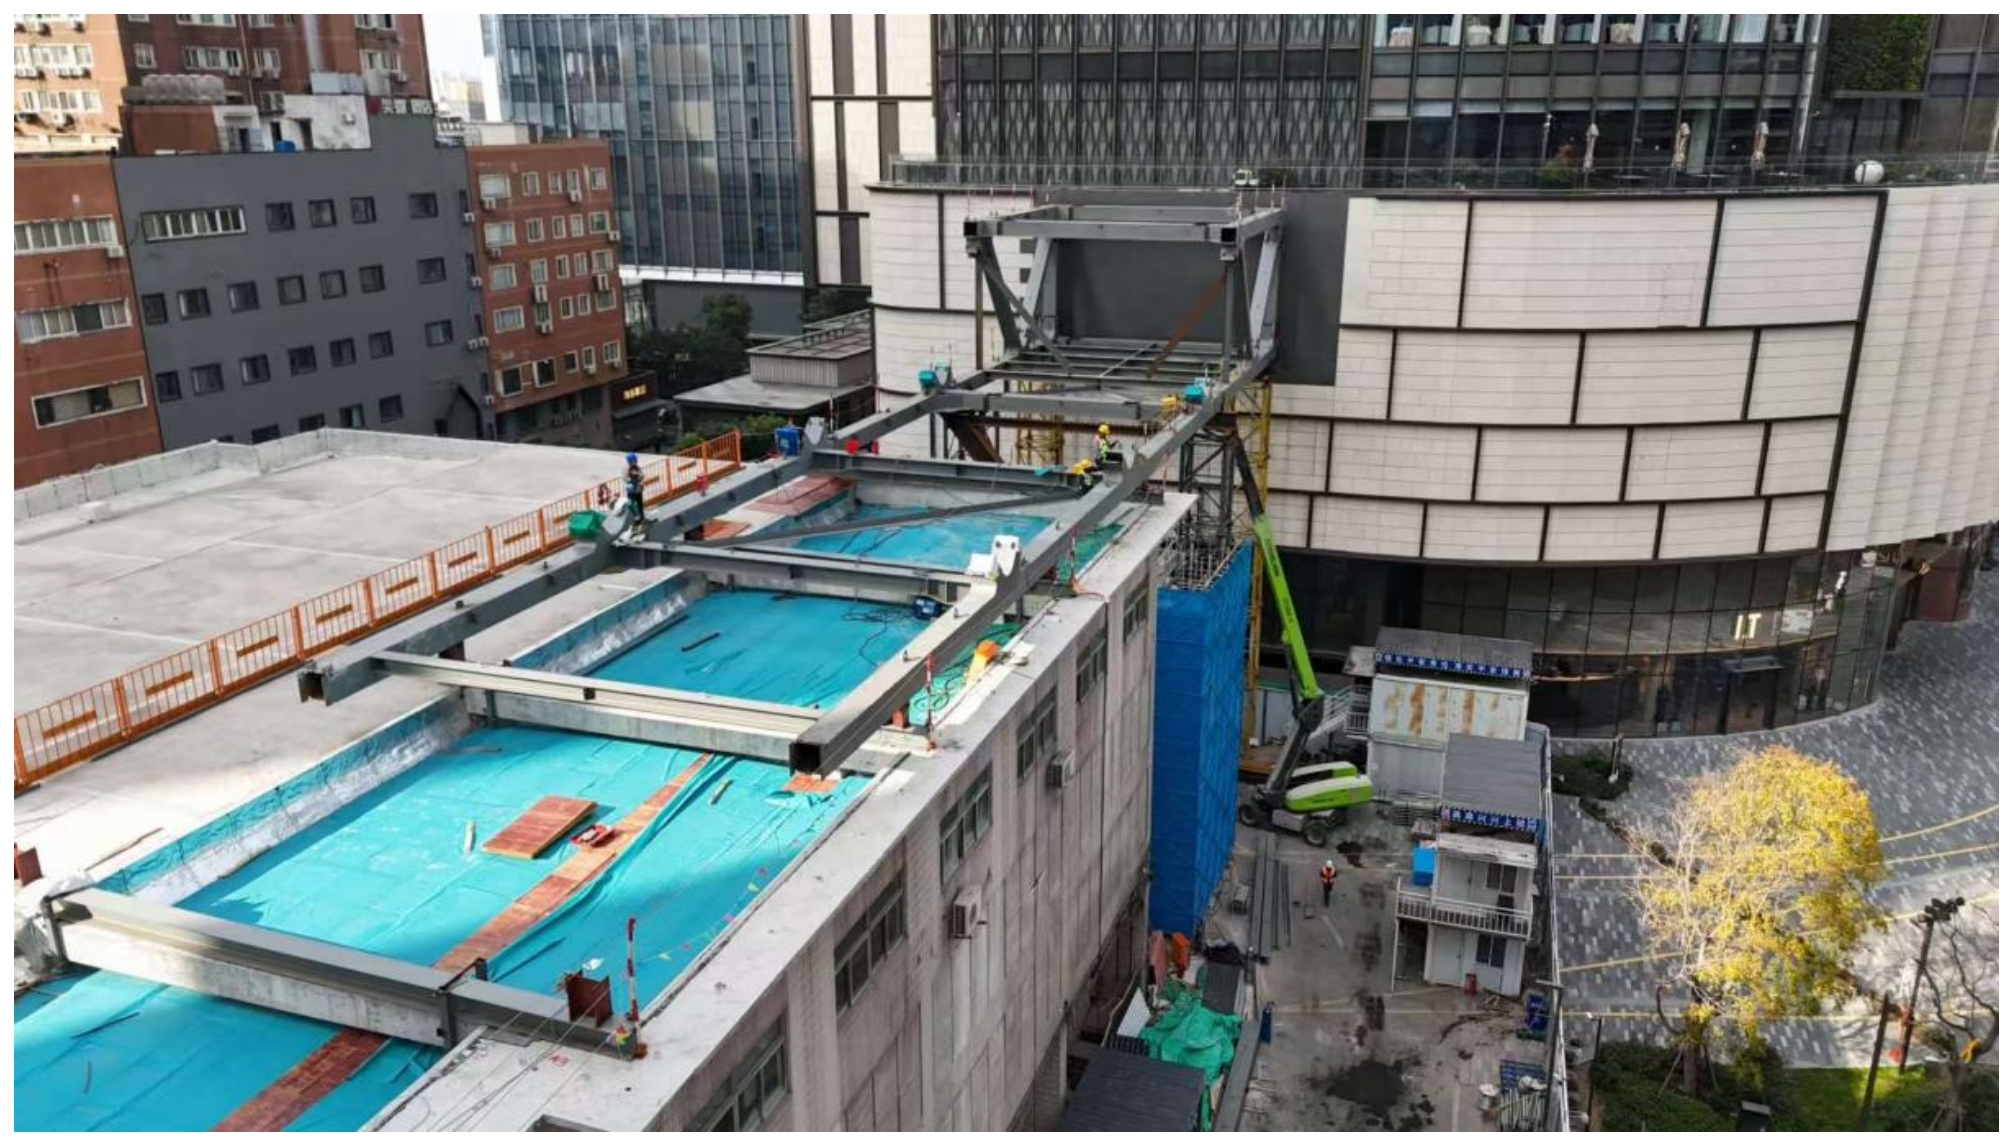
Figure 13.
Photograph 2 of the member hoisting in the region inside the existing substation structure.
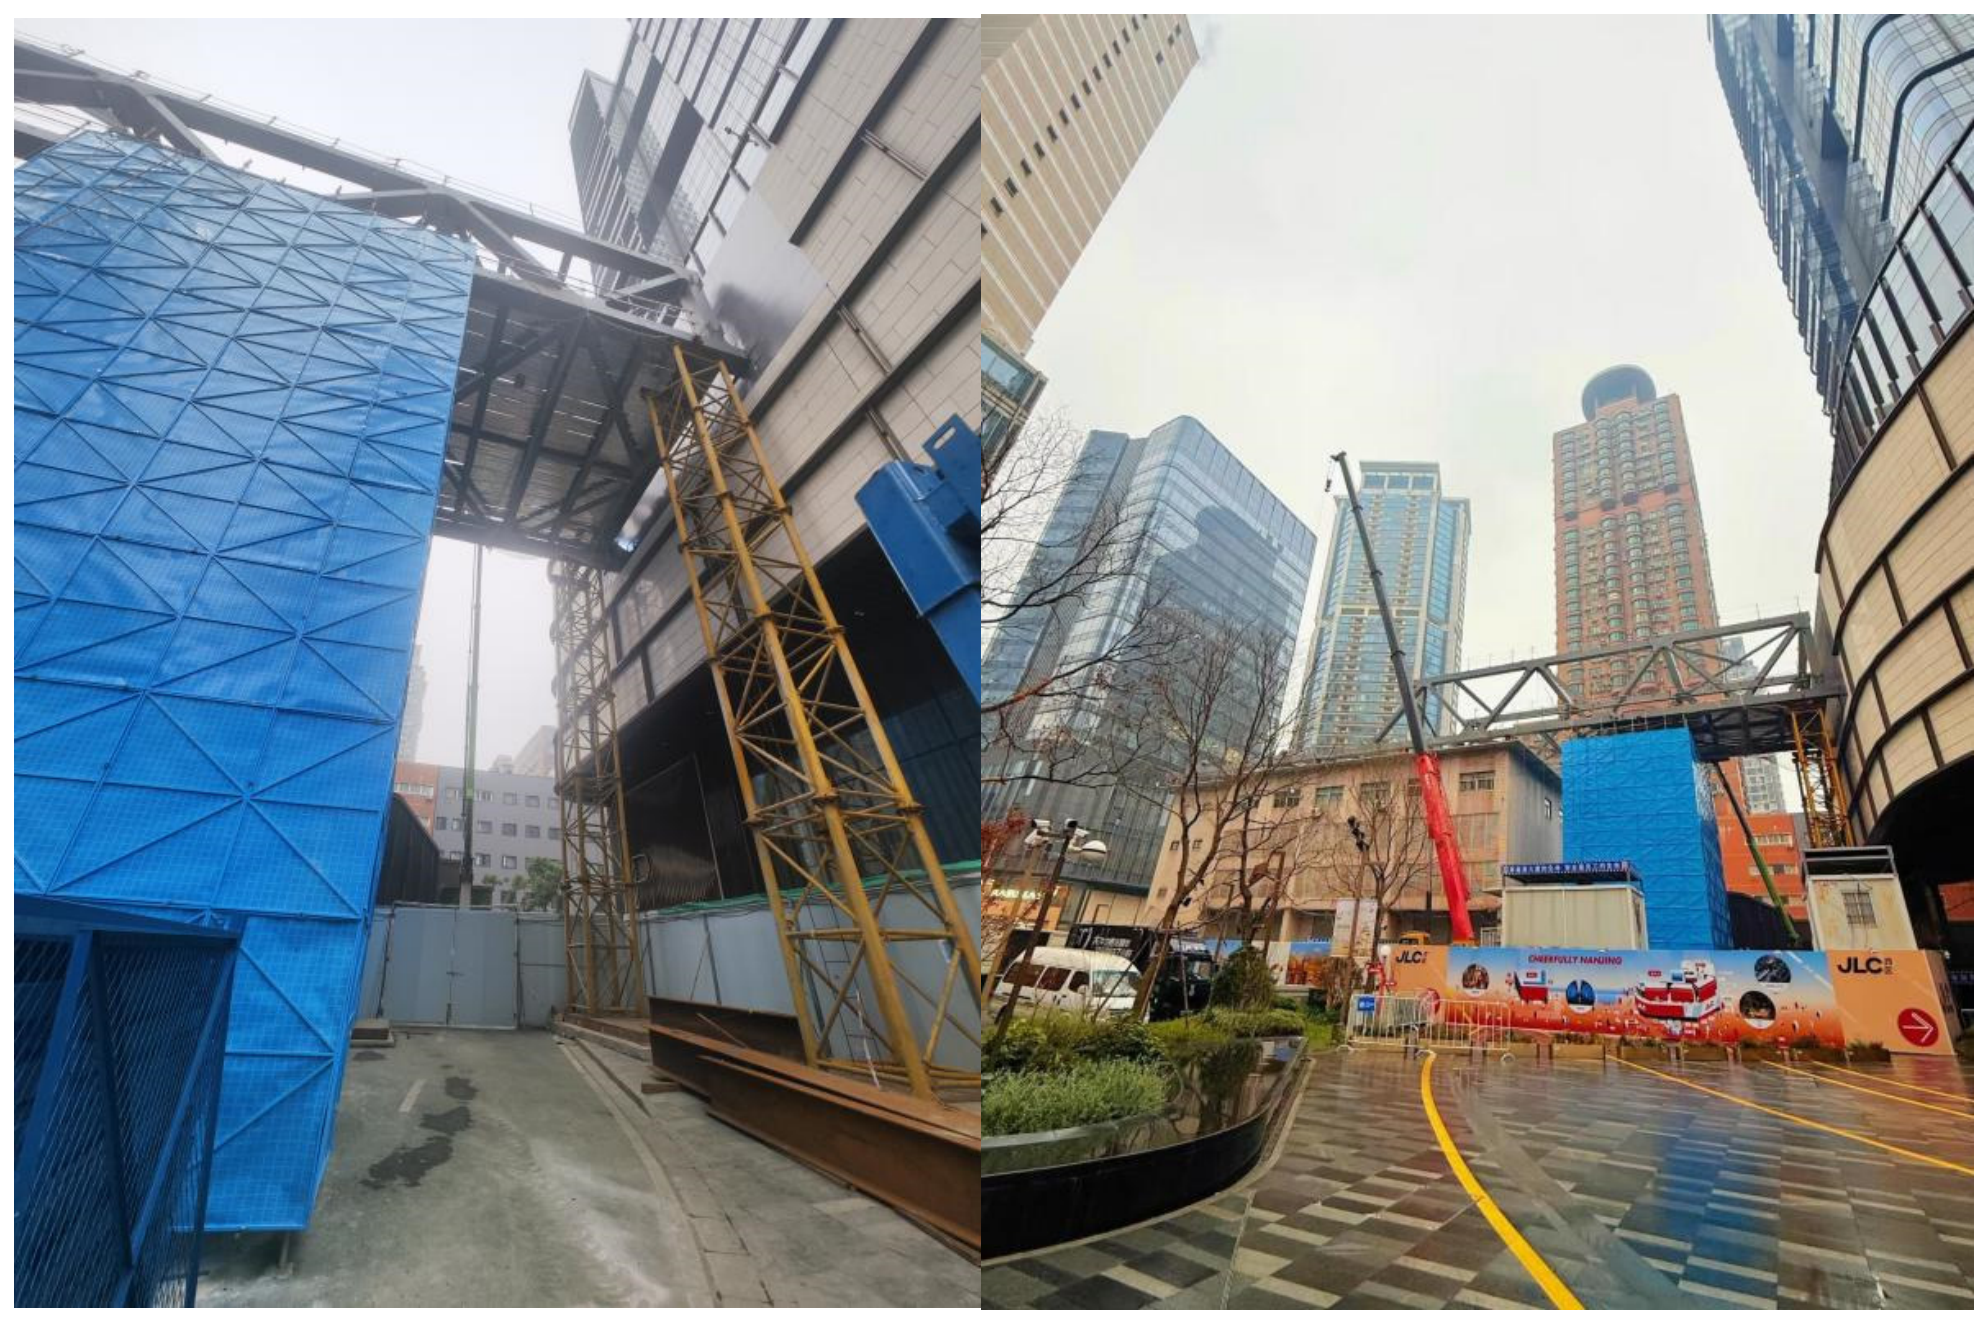
Because the road could not be fully closed, the region between axes 3 and 4 used a combination of daytime piece-by-piece assembly and night-time lifting of small prefabricated panels. The road was divided into pedestrian, hoarding and vehicle zones, as shown in Figure 14, to accommodate the support towers and Y-shaped columns.
Figure 14.
Plan of the road zoning and the associated dimensions.
With the roof temporary supports and the support tower at axis 3, the non-cantilever region was completed first. An additional tower was placed approximately 5 m from the outer face of the Y-shaped column at axis 3 to accommodate the varying lower-chord elevation. The remaining members between axes 3 and 4, except one web member, were installed as small integral units; the final web member was assembled piece by piece. The largest unit weighed about 10.34 t and was lifted by the 80 t mobile crane at a working radius of 8–10.6 m, using two lifting points with a rope angle not exceeding 60 degrees. The unit was assembled within the site using a 25 t crane after the existing hoarding had been extended by about 6 m. The original position and lifting-weight diagrams are provided in Supplementary Figure S2.
3. Construction-Stage Simulation and Controlled Support Unloading
3.1. Finite-Element Model and Installation-Stage Simulation
A three-dimensional staged model of the steel corridor, concrete slab and temporary support system was established in Midas Gen 2026 (v1.1). Steel members, Y-shaped concrete columns, steel brackets and temporary towers were represented by beam elements, while the concrete floor slab was represented by slab elements connected to the beam nodes. The model contained 511 nodes and 1036 beam elements, together with the slab elements. Slab stiffness was inactive during casting and activated only after concrete hardening. Material and element parameters are provided in Table A1.
Steel member-to-member joints were modelled as rigid because the fabricated joints were welded. The steel bracket-to-concrete-column interface was modelled as hinged. A rigid eccentric offset was used only to transfer the bracket reaction to the column axis, while rotation was released at the interface. Temporary-tower bases were assumed fixed because the base plates were welded to the roadbed boxes. This idealisation represents the base-plate/box assembly but does not explicitly resolve slab flexibility. Jack assemblies were represented as vertical-only hinge supports without bending or shear stiffness. The two jacks at each support point were treated as one statically equivalent vertical restraint, and reported values are support-point reactions unless explicitly divided by two.
The permanent bearings were represented according to the bearing design: an equivalent vertical spring at axis 1, a unidirectional sliding spherical hinge at axis 2, a fixed spherical hinge at axis 3, and a free cantilever end at axis 4. The corresponding translational and rotational restraints, together with the capacities given in the bearing drawings, are listed in Table A2. The 8.0 kN/mm spring is an equivalent secant vertical stiffness at the service-load level, representing the combined deformation of the elastomer and local contacts; it is not an elastomer modulus.
Two concrete-loading states were defined before support unloading. In the casting stage, the wet concrete was applied as an equivalent area load, q(wet) = gamma(c)h(c), on the steel decking, while the slab elements were inactive and contributed no stiffness. In the hardening stage, q(wet) was removed before the slab elements were activated. The concrete self-weight was then represented once through the activated slab elements, and other permanent or live loads were applied separately. Thus, q(wet) and q(slab) were never applied simultaneously. For a 120 mm slab with gamma(c) = 24 kN/m3, q(wet) = 2.88 kN/m2. The subsequent unloading stages used the hardened slab. No wind, temperature, shrinkage or creep action was included. The element activation sequence is summarised in Table A3. A linear elastic staged solution was used, so an iterative nonlinear convergence criterion is not applicable. The principal boundary conditions and material assumptions are documented in Table A1 and Table A2, and their limitations are discussed in Section 6.3.
The displacement of the steel structure at the representative erection stages is shown in Figure 15.
Figure 15.
Combined deformation at each stage of the member hoisting process.
3.2. Comparative Selection of Temporary Support Removal Sequences
Figure 16 shows the positions and numbering of the temporary support towers, with ground-level towers being denoted by TJ-X and roof-level towers by WM-Y.
Figure 16.
Positions and numbering of the temporary support towers (ground-level towers are denoted by TJ-X and roof-level towers by WM-Y).
The load parameters and characteristic-value basis are those defined in Section 3.1. Figure 17 summarises the states before support removal and the two candidate removal sequences.
Figure 17.
Schematic representation of the processes before and after support removal.
After the wet-concrete load was applied and subsequently replaced by the activated slab elements, the maximum combined deformation before support removal was calculated for the completed steel–concrete system. The staged displacement before and after support removal is shown in Figure 18. Because the slab stiffness was active during unloading, these results include the contribution of the hardened concrete floor.
Figure 18.
Deformation of the structure before and after support removal.
The difference between removal method 1 and removal method 2 lies mainly in the order in which the roof supports and the support at the cantilever end of axis 4 are removed.
The calculation shows that under removal method 1, after the roof temporary support towers have been removed the deflection at mid-span of the original roof increases from 29.19 mm to 54.80 mm, an increment of 25.61 mm, and after the cantilever end at axis 4 has been removed the deflection at mid-span of the original roof decreases from 54.80 mm to 51.77 mm, a reduction of 3.03 mm.
Under removal method 2, after the cantilever end at axis 4 has been removed the deflection at the cantilever end of axis 4 increases from 4.78 mm to 50.03 mm, an increment of 45.25 mm, and after the roof temporary support towers have been removed the deflection at mid-span of the original roof increases from 27.23 mm to 51.77 mm, an increment of 24.54 mm.
The difference between the two removal methods lies in the trade-off between the mid-span increment and the abrupt increase at the cantilever end. The mid-span deflection increment of method 2 (24.54 mm) is slightly smaller than that of method 1 (25.61 mm), but it causes an abrupt additional deflection of 45.25 mm at the cantilever end of axis 4, a location that has no redundant restraint and is the place where the erection deviations are deliberately concentrated, so that it is more unfavourable to the closure geometry and to the forces in the end joints. Method 1 pays the price of an additional mid-span deflection of about 1.07 mm but avoids the abrupt increase in deflection at the cantilever end, so that the development of the deflection during the transformation of the system is more continuous and more predictable. Method 1 was, therefore, adopted on site, that is, the supports around the Y-shaped columns were removed first, followed by the roof temporary supports, the temporary supports at axis 1 and, finally, the temporary supports at axis 4. Because the construction-stage actions are less severe than the final design condition and both removal sequences converge to the same permanent-support state, the selection is governed by the temporary-support reactions and deformation path rather than by a separate comparison of final member-force states.
Because the concrete slab had reached its design strength before unloading, support removal induced restrained tensile stress in the slab near the Y-shaped columns. The two post-cast strips interrupt the continuous slab at axes 2 and 3 during this stage, allowing the restrained deformation to be released and limiting uncontrolled cracking. The strips are cast after the support-removal deformation has stabilised.
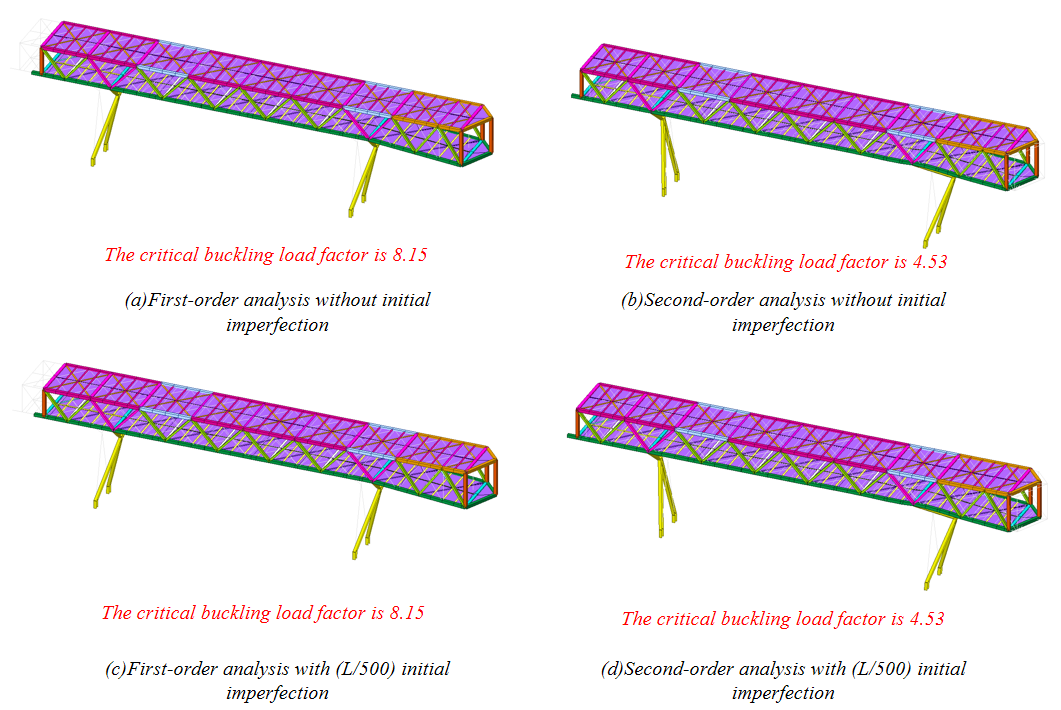
To examine whether geometric nonlinearity affects the comparative unloading analysis, first-order and second-order analyses were performed for the governing unloading state. Four configurations were considered: first- and second-order models without initial imperfections, and the corresponding models with an initial imperfection scaled from the first buckling mode to 0.002 L, that is, L/500. The corresponding buckling modes and critical load factors are shown in Figure 19. The first-order critical load factor was 8.15, and the second-order critical load factor was 4.53. Introducing the L/500 imperfection did not change either factor or cause switching of the controlling buckling mode. Both analyses, therefore, indicate a substantial stability reserve under the construction dead-load condition.
The stability verification yielded a first-order and geometrically nonlinear critical load factors of 8.15 and 4.53, respectively. Introducing an L/500 initial imperfection did not change either factor or induce mode switching. The linear staged model was, therefore, retained for the comparative analysis, with GNA and the initial-imperfection case used as verification. This conclusion applies to the present construction-load condition; it does not imply that geometric nonlinearity is negligible for the completed service state. These analyses confirm that second-order effects are not controlling for the comparative temporary-construction evaluation, although they remain relevant to the final service state.
Figure 19.
First- and second-order buckling analyses of the steel sky corridor with and without an L/500 initial imperfection under the governing unloading condition.
3.3. Controlled Load Transfer and Existing-Structure Response
3.3.1. Load Review
Because of the elevation design of the steel sky corridor, the original substation had its above-ground storeys 5 and 6 removed, and the roof structure was then strengthened and reconstructed, reaching the design strength.
The protection structures imposed an additional load of about 40 t, represented as approximately 2.0 kN/m2 over the 200 m2 lower-chord plane. The calculated reaction at each support point used for the temporary-load transfer is listed in Table 2. The support layout and load application are provided in Supplementary Figure S3.
Table 2.
Current load at each support point (kN).
3.3.2. Unloading and Removal Procedure
The unloading and removal were planned in five steps and four stages.
Before the jacks were installed, the four rubber bearings were welded to the steel truss beams in accordance with the original design requirements to provide lateral stability.
- Jacks were installed on both sides of the permanent bearings of the Y-shaped columns and at the support towers, providing a total of 24 support points with two jacks at each point, that is 48 jacks in all.
- A target preload equal to 80% of the predicted support-point reaction was applied to the jack pair at each support point. This value is a preloading control parameter, not a safety factor against the jack capacity. Its purpose was to establish reliable jack contact before cutting the original bracket beams while retaining a nominal 20% residual force on those brackets, thereby limiting the risk of unintended uplift. The two jacks at each support point are assumed to share the target preload equally under nominal conditions.
- After jack engagement and preload stability had been verified, the original bracket beams were cut and removed. The remaining force on the brackets then transferred to the jack pair, which continued to control the subsequent unloading stages.
- After the original bracket beams were removed, the jacks were synchronously retracted so that the corridor descended slowly and synchronously. As the preload was reduced, the load was transferred progressively to permanent bearings Z-1 to Z-4. The support-point identifiers used in Table 2, Table 3 and Table 4 correspond to two jacks at each point; the complete bearing and jack layout is provided in Supplementary Figure S4.Table 3. Preloading force applied at each support point (kN).Table 4. Reaction at each support point in each stage (kN).
- After the four steps above were completed, the jacks at the support points of the remaining towers were unloaded and retracted synchronously in four stages, as follows:Stage 1: the jacks at the six supports beside the bearings on the L-2 and L-3 axes are unloaded (points 1-1, 1-2, 1-3, 1-4, 1-5 and 1-6);Stage 2: the jacks at the ten supports arranged between the L-2 and L-3 axes on the roof are unloaded (points 2-1, 2-2, 2-3, 2-4, 2-5, 2-6, 2-7, 2-8, 2-9 and 2-10);Stage 3: the jacks at the two supports beside the L-1 axis are unloaded (points 3-1 and 3-2);Stage 4: the jacks at the two supports beside the L-4 axis were unloaded (points 4-1 and 4-2).
3.3.3. Staged Sequential Unloading Simulation
I. Preloading process. The target preload at support point i is Ppre,i = 0.8Ri, where Ri is the calculated reaction of that support point. With two jacks at each point and nominal equal sharing, the target force of each jack is Pjack,i = 0.4Ri. The calculated support reactions and corresponding 80% preloads are listed in Table 3.
In the calculation model, a vertical reaction load is applied at the position of each support point in order to simulate the preloading and jacking-back process. The reaction at each support point in each stage is listed in Table 4.
During the staged unloading process, the maximum vertical reaction force in the roof area was approximately 398.0 kN, while the maximum vertical reaction force at the ground-level temporary support frames was approximately 493.9 kN. The incremental vertical reaction forces at each temporary support location were limited and did not exceed the design load-bearing capacity of the jacks and support frames, indicating that the reaction forces at all temporary supports remained within controllable limits throughout the unloading phase. As the unloading load was progressively transferred from the temporary support locations to the permanent supports of the Y-shaped columns, the reaction forces at these permanent supports (Z-1, Z-2, Z-3, and Z-4) gradually increased, ultimately assuming the primary structural loads. This process ensured a smooth transition from the temporary support system to the permanent support system.
3.3.4. Jack Configuration and Load Control
Two 60 t jacks were installed at each temporary-support point located on the roof or ground-level support frame, while two 100 t jacks were installed at each of the four permanent-bearing points adjacent to the Y-shaped columns. A total of 24 support points were arranged, with two jacks at each point, yielding 48 jacks in total. Steel packing blocks were placed on top of the jacks to prevent local damage to the steel box girder, and a PLC synchronous jacking system coordinated the operation.
Excluding the four Y-shaped-column bearing points, the maximum reaction among the roof-level temporary supports was 398.0 kN (39.8 t) at point 2-2 during Stage 1, and the corresponding maximum preload was 314.08 kN. With two 60 t jacks sharing the load nominally equally, the maximum force per jack was 19.9 t, corresponding to a utilisation of 33.2% and a nominal capacity ratio of 3.02. The maximum reaction among the ground-level temporary supports was 493.9 kN (49.4 t) at point 4-1 in Stage 1, and the corresponding maximum preload was 359.36 kN. Under nominal equal sharing, the maximum force per jack was 24.7 t, corresponding to a utilisation of 41.2% and a nominal capacity ratio of 2.43. Even when a 30% load-sharing imbalance was allowed, with the more heavily loaded jack taking 1.3 times its nominal equal share, the larger load share at the governing ground support was approximately 32.11 t, still below the 60 t nominal capacity of one jack. The four Y-shaped-column permanent-bearing points are excluded from this temporary-support envelope and are treated separately as permanent load-transfer locations.
The load transfer followed the principles of supporting before transferring and propping before cutting. The jacks were confirmed to be carrying load before the original bracket beams were cut, after which synchronous retraction transferred the load progressively to the permanent bearings. The PLC system coordinated the retraction and provided a measurable unloading path rather than a one-off release.
3.3.5. Preload Control Basis
The 80% preload was selected as a construction-control value to establish reliable jack engagement before bracket cutting while limiting unintended uplift. A lower preload may leave a substantial part of the reaction on the original bracket, whereas an excessively high preload may lift the structure and alter the intended support condition. The preload ratio refers to the predicted support reaction, not to jack capacity. Because equivalent jack-stiffness data and matched stage measurements were not available, a complete parametric sensitivity study was not performed; the 80% value is, therefore, presented as the adopted control setting rather than as a numerically optimised value. The 80% value controls only the initial engagement of the jacks; the final load transfer is governed by the subsequent synchronous jacking and unloading operation.
3.3.6. Response of the Existing Substation
On the basis of the design drawings of the substation, a structural model at elevations 18.870 m and 22.270 m was established. The concrete grade is C35 in all cases. The structural model is shown in Figure 20.
Figure 20.
Model of the two storeys removed from the substation.
The substation model used the floor and roof permanent and live loads already defined in Section 3.1. These loads were included in the column-reaction extraction shown in Figure 21.
Figure 21.
Column reactions (unit: t); the maximum design vertical reaction of a column is about 137.6 t.
The existing substation column is a 500 mm × 500 mm reinforced-concrete member with C35 concrete and HRB335 longitudinal reinforcement. The column effective design length is 3400 mm in both horizontal directions. The temporary construction reaction transferred to the column during support unloading was 39.8 t, whereas the original design vertical reaction of the corresponding column was 137.6 t; the temporary reaction is, therefore, about 28.9% of that design action. This construction load was applied only after storeys 5 and 6 had been removed, so it did not act on the originally fully loaded six-storey configuration. The storey loads corresponding to the removed floors were no longer present, while the column section and reinforcement remained unchanged. Under the original approved design use of the substation, the construction stage, therefore, did not create a more severe vertical-load condition than the original design basis. The column design information is summarised in Table A4. Because the operational live load at the time of construction was not independently measured, the comparison is, therefore, a conservative load-envelope screening check rather than a full residual axial-bending capacity design of the operating substation.
4. Key Safety Control Technologies for the Complex Environment
This project is located in the central urban area of Nanjing. The middle of the corridor, between axes 2 and 3, crosses an operating 110 kV substation, and the section between axes 3 and 4 crosses the urban trunk road Fengfu Road, while the construction site is a narrow strip of land between plots A and B where large hoisting equipment has to travel and stand on the basement roof. These three environmental constraints correspond, respectively, to risks of falling-object impact and electrical fire, traffic organisation and night-time operation, and foundation bearing and structural deformation, for which conventional special schemes are difficult to apply directly [21]. A safety control technology system covering the whole construction process was, therefore, constructed following the logic of risk identification, hanging protection, environmental-side operation control and bearing and deformation control, and the configuration parameters, verification results and control indices are provided item by item below.
4.1. Risk Identification
Among the three environmental constraints, crossing the operating substation carries the highest risk level: once a falling object or a welding spark occurs, the consequences are not limited to casualties among the workers but may directly damage the primary equipment of the substation and cause a regional power outage [22,23,24], and the severity is, therefore, significantly higher than that of an ordinary fall accident. Protection was accordingly designed with the goal of zero falling objects. The identified hazards, their consequences, risk levels and the corresponding control measures are summarised in Table 5.
Table 5.
Identification and classification of safety risks in the complex environment.
4.2. Bearing Capacity Control for Hoisting Operations on the Basement Roof
During the hoisting operations of the mobile crane, the forces at the outrigger positions are the main concern.
According to the manual of the 80 t mobile crane, the total mass of the machine is 60,000 kg.
The self-weight of the member is taken as 10 t (8 t for the member and 2 t for the rigging), and the rated capacity of the 80 t mobile crane is 11.3 t when the working radius is 14 m and the boom length is 36 m. The maximum planned lift at the maximum working radius and the most unfavourable load direction towards a single outrigger was, therefore, adopted as the governing load case for the basement-roof verification.
The reaction N1 of each outrigger under the vertical load is N1 = (Gself + G0)/4 = (60 + 10)/4 = 17.5 t.
The bending moment, M, produced by the member is M = 10 × 14 = 140 t m.
According to the manual, the outrigger span is 6.6 m × 7.0 m, and the reaction of the outriggers under the action of the bending moment is
The maximum reaction of the outrigger is, thus,
Na = N1 + N2 = 17.5 + 14.6 = 32.1 t
A roadbed box measuring 1.5 m × 2.4 m × 0.18 m (self-weight about 1.8 t) is placed under each outrigger.
The roadbed box rests on the slab, so that the additional load on the slab is 32.1 + 1.8 = 33.9 t.
4.2.1. Verification of the Compressive Bearing Capacity of the Slab
Appendix C.0.2 of the Load Code for the Design of Building Structures (GB 50009-2012) [25] states that the equivalent uniformly distributed live load of a continuous slab may be calculated as a simply supported single span, although the internal forces should still be determined by treating the slab as continuous. According to Appendices C.0.4 to C.0.6 of GB 50009-2012, the equivalent uniformly distributed live load of a local load (including a concentrated load) on a slab may be calculated as a simply supported single-span beam:
where L is the span of the slab, b is the effective distribution width of the load on the slab, and M is the absolute maximum bending moment of the simply supported slab, determined from the most unfavourable arrangement of the equipment.
The larger support span of 8.3 m was taken as the calculation span of the slab, and a slab thickness of 500 mm was taken into account in the calculation.
According to Clause C.0.5 of Appendix C of GB 50009-2012, the effective distribution width of a local load is used to calculate the effective loaded area by Equation (C.0.5-1). The support span adopted in the calculation is shown in Figure 22.
bty = 1500 mm, btx = 2400 mm;
bcy = bty + 2s + h = 1500 + 500 = 2000 mm;
bcx = btx + 2s + h = 2400 + 500 = 2900 mm.
bcy = bty + 2s + h = 1500 + 500 = 2000 mm;
bcx = btx + 2s + h = 2400 + 500 = 2900 mm.
Figure 22.
Calculation of the support span.
Since bcx is greater than or equal to bcy, bcy is less than 0.6 L, bcx is less than L, and the effective distribution width is taken as
b = bcy + 0.7 L = 2 + 0.7 × 8.3 = 7.95 m.
The most unfavourable working condition, in which the mobile crane travels at the middle of the slab, was used in the calculation. The equivalent uniformly distributed live load is, therefore,
According to the structural design specification, the characteristic value of the uniformly distributed live load of the fire access route is 20.0 kN/m2, and the permissible load is taken as 1.5 × 20 = 30 kN/m2.
No jacking-back support frame is, therefore, required beneath the mobile crane during hoisting.
4.2.2. Verification of the Shear Bearing Capacity of the Slab Under Local Load
The shear bearing capacity of the slab was verified according to Equations 4.5.3-1 and 4.5.3-2 of the Code for the Design of Concrete Structures (GB 50010-2010), as follows:
ft is the tensile strength of the concrete; taking the concrete grade of the roof as C35, ft = 1.57 N/mm2;
βh = 1.0;
- b is the effective width of the rectangular section, taken as 1500 mm, the smaller spreading width of the roadbed box;
- and h0 is the effective height of the rectangular section, equal to 465 mm for a slab 500 mm thick;
VR = 0.7 βhftbh0 = 0.7 × 1.0 × 1.57 × 1500 × 465/1000 = 766k N;
Vs,max = 339 kN;
VR ≥ Vs
The shear bearing capacity of the slab, therefore, satisfies the requirement during the hoisting operation of the mobile crane.
4.2.3. Verification of the Punching Shear Bearing Capacity of the Slab Under Local Load
The punching shear bearing capacity was verified according to Equations 4.7.1-1 and 4.7.1-2 of GB 50010-2010, as follows:
η = 0.4+1.2/βs = 0.4 + 1.2/2 = 1.0;
um = (1500 + 465) × 2 = 3930 mm;
F1R = 0.7 βhftηumh0 = 0.7 × 1.0 × 1.57 × 1.0 × 3930 × 465/1000 = 2008 kN;
F1S = 339 kN;
F1R ≥ F1S
The punching shear bearing capacity of the slab, therefore, satisfies the requirement during the hoisting operation of the mobile crane.
4.3. Hanging Protection Technology for Crossing Roads and Existing Buildings
The elevation of the steel structure and its position relative to the substation are shown in Figure 23; the positions of the temporary support towers are not shown.
Figure 23.
Elevation of the steel structure and its position relative to the substation (the positions of the temporary support towers are not shown).
Safety protection was arranged according to the exposure below: side protection between axes 1 and 3 and full enclosure of both sides and the bottom between axes 3 and 4 where the corridor crosses Fengfu Road.
For the hanging protection, short Q235B square, hollow sections 100 × 3 are welded to the longitudinal beams of the steel structure and cantilever outwards by about 80 cm from the outer side of the steel beam, projecting beyond the planes of the upper and lower chords and being arranged at intervals of 2 m. The vertical posts of the outer facade are about 8.3 m long and are also made of Q235B square, hollow sections 100 × 3; horizontal square, hollow sections 30 × 2.5 are provided at intervals of 1.5 m, type 900 colour-coated steel sheets are used on the outside as the protective mesh panels, the bottom walkway plate is a type YX35-125-750 profiled steel sheet, and two square, hollow sections 50 × 2.5 are laid on the walkway plate.
Figure 24.
Region where protection is provided on both sides only.
Figure 25.
Region where protection is provided on both sides and at the bottom.
In both regions, pedestrians are present at the sides only, and pedestrians are strictly prohibited from entering the bottom region, which serves solely as a closed protection at the bottom. Stacking of materials is strictly prohibited. The loads acting on the protection structure and the corresponding calculation results are shown in Figure 26.
Figure 26.
Loads and calculation results.
The canopy was dismantled from top to bottom and from outside to inside, with the bottom deck retained until the upper members had been removed. Its removal was coordinated with the curtain-wall work so that a continuous protective layer remained above the occupied areas below.
4.4. Pedestrian and Vehicle Safety Control Technology
Fengfu Road has a clear width of about 22 m and was divided into functional zones according to the requirements of the construction operations, namely, a pedestrian passage, hoarding zone 1 (where the temporary support towers are placed), a vehicle passage and hoarding zone 2 (where the Y-shaped columns and temporary support towers are located).
The pedestrian and vehicle passages used Q235/Q355 square, hollow sections, with clear heights of 7.2 m and 5.0 m, respectively. Post spacing, shared supports and scissor or raking bracing were arranged according to the traffic zones. Figure 27 shows the structural arrangement and Figure 28 present the resulting maximum combined stress. The governing load cases, load combinations and applied surface loads are reported in Supplementary Figure S5 and the accompanying Supplementary Materials.
Figure 27.
Main components of the pedestrian passage and the construction hoarding on Fengfu Road.
Figure 28.
Maximum combined stress (MPa), with a maximum value of about 118.68 MPa.
4.5. Night-Time Construction Safety Control Technology
Night-time work was required for hoisting that occupied Fengfu Road [26,27]. Only lifting, member transport and positioning were scheduled at night, and high-altitude welding that required fine alignment was excluded. The night-work plan, road-closure extent, personnel allocation and emergency arrangements were approved in advance. Work stopped in rain, snow, fog or poor visibility and when the wind force exceeded five.
The hoisting face and alignment points were illuminated to at least 50 lx, with separate temporary power and a standby generator. A unified command and a two-channel signal system were used, and loads were not left in unlit or blind areas. The hoisting radius remained between 8 and 10.6 m, and the lowest point of the load was kept at least 7.3 m above the protection canopy. Reflective signage, traffic marshals and controlled worker access completed the traffic-safety arrangement.
5. Final Geometry Measured by Three-Dimensional Laser Scanning
A handheld three-dimensional laser scanner (model Lingguang K1, Qiyu Innovation) was used for the measurement. The device integrates a lidar and a panoramic camera and adopts simultaneous localisation and mapping (SLAM) to scan while walking, and the scanning results were used to reconstruct a three-dimensional coloured point cloud model of the completed structure.
The point cloud model obtained by three-dimensional laser scanning was imported into Rhino 8 software to extract the three-dimensional geometric model of the main trusses of the steel sky corridor in the completed state, which was then compared with the design model on the same coordinate datum in order to check the geometric accuracy after construction. Before the comparison, reference points were selected on the structure in accordance with the design drawings, and the measured model was aligned with the design model so that both were referred to the same coordinate datum. The dimensions of the completed structure reproduced from the point cloud are shown in Figure 29 and the comparison of the two three-dimensional models in Figure 30.
Figure 29.
Dimensions of the completed steel sky corridor reproduced from the three-dimensional laser scanning in Rhino.
Figure 30.
Comparison of the three-dimensional models.
The completed point cloud was cropped to the corridor region, connected to the project coordinate datum and imported into Rhino. The measured truss geometry was reconstructed from fitted member axes and node coordinates. An initial alignment was established using design control points, followed by rigid-body best-fit alignment. The resulting point cloud was then compared with the design model. The processing and alignment uncertainty sources are listed in Appendix C.
For measured node i, the spatial deviation is defined as the Euclidean distance between the measured and design coordinates:
The corresponding deviation ratio, expressed in per mille, is defined as:
Here, Li is the nominal design reference length of the structural segment associated with that node along the corresponding control line.
The coordinates (x, y, z) with subscripts m and d denote the measured and nominal design positions, respectively.
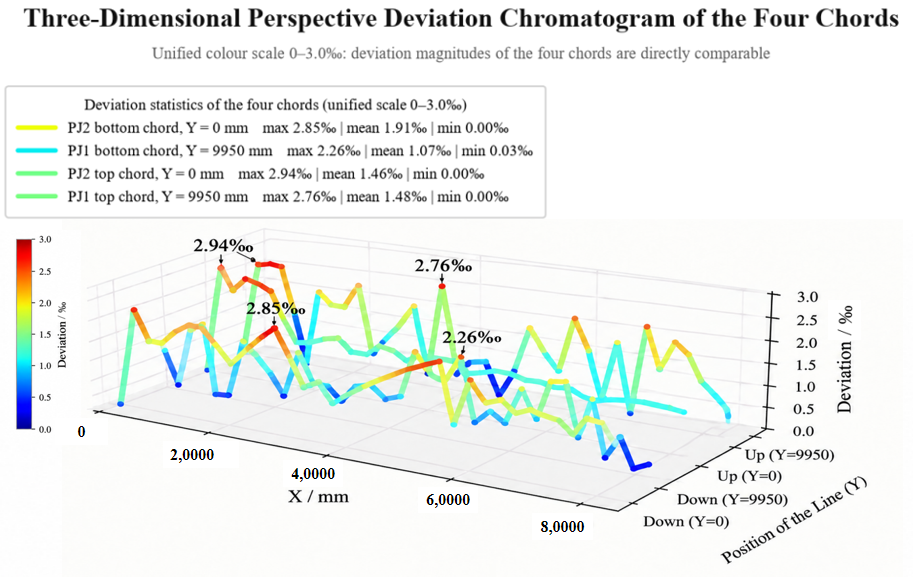
The computed ratios for all 140 nodes were below the project-specific 3‰ control value. The maximum was 2.94‰ on the Y = 0 side of the upper chord of truss PJ2 (node 3), and the average over all measured nodes was 1.48‰. The maxima for the four control lines were 2.76‰ and 2.94‰ for the PJ1 and PJ2 upper chords and 2.26‰ and 2.86‰ for the corresponding lower chords. The 3‰ limit was specified by the project designer and owner as a project-specific final-geometry acceptance criterion; it is not a statutory code limit. Because the maximum measured ratio is only 0.06‰ below this value, the result is reported as close to the control limit rather than as a high-confidence absolute pass. The measured node positions and the corresponding spatial distribution of deviations are shown in Figure 31. The principal measurement and alignment uncertainty sources are discussed in Appendix C.
Figure 31.
Positions of the nodes and the three-dimensional perspective colour map of the deviation.
6. Discussion
6.1. Comparison with Existing Engineering Practice
For the installation of large-span corridors and roof-type steel structures, the mainstream practice is integral lifting, cumulative sliding or integral hoisting of large units, all of which presuppose the availability of lifting equipment of relatively large tonnage and of an assembly and travelling area that satisfies the bearing capacity requirements [1,2,5,28]. The constraints of this project are different: the hoisting equipment has to travel and stand on the basement roof, no support can reach the ground at the roof positions, and the corridor has to cross an operating substation and an urban trunk road. This paper, therefore, chose to trade a larger amount of work at height for lower requirements on equipment tonnage and on the foundation, dividing the heaviest hoisting unit of 108 t into individual members of about 10 t, and used the existing concrete columns to support temporary steel brackets, which solved the problem of the roof supports not being able to reach the ground [6].
Unlike the comparison of striking sequences for a single structural system that predominates in the literature [10], a load-transfer process from the bracket-supported towers to the permanent bearings was superimposed before support removal in this project. The jacks had already taken over the tower loads before support removal, so that the transformation of the force system during support removal became a measurable and controllable step-by-step unloading rather than a one-off release of load. For the existing structure, the load path changed from the concrete columns directly carrying the tower reactions to transmission through the jacks and the permanent bearings to the steel corridor itself, which is the key to reducing the dependence on the existing structure and is also the main difference between the technology presented here and conventional striking technology [11,12].
Compared with the studies reviewed in Section 1, the contribution of the present work does not lie in the isolated use of piece-by-piece erection, temporary supports, jacking or laser scanning. Instead, it lies in integrating three decisions within one construction-control framework: (i) moving the closure to the free cantilever end so that accumulated erection deviations can be corrected before the final support condition is established; (ii) replacing an abrupt release of the temporary supports with a staged and measurable transfer of load from the roof brackets to the permanent bearings; and (iii) using the scanned final geometry as an independent consistency check on the construction outcome. This distinction separates the transferable method from project-specific details, such as member sizes, support locations and jack capacities. The combination of an operating substation below, a road crossing, and a basement roof with limited load capacity is also the condition that motivates this integration.
6.2. Consistency Between Construction-Stage Predictions and Final Geometry
The staged finite-element analysis predicted a maximum combined deformation of about 4.78 mm at the axis 4 cantilever after steel installation and a mid-span deflection increment of 25.61 mm during the selected support-removal sequence. The laser-scanning survey recorded a maximum final-position deviation ratio of 2.94‰ and an average of 1.48‰. These quantities describe different states and are not directly comparable. No stage-specific displacement or reaction measurements were available for matched analysis-measurement comparison, so a direct model validation table cannot be provided.
The comparison is, therefore, limited to a consistency check at the level of the final geometry and deformation magnitude. The absence of a local exceedance in the scanned geometry is consistent with the intended closure strategy and supports the conclusion that accumulated erection deviation was controlled. It does not, however, prove the accuracy of the stage-wise predicted deflections, support reactions or internal forces, and it is not presented as validation of the staged finite-element model.
6.3. Applicability Boundary and Limitations
The finite-element model was not calibrated or validated against stage-specific displacement, strain or reaction measurements. The available laser-scanning data describe only the final geometry; therefore, agreement or disagreement with the construction-stage predictions cannot be evaluated directly. This limitation should be considered when transferring the predicted deformation magnitudes to other projects.
The adopted 80% preload and the principal boundary conditions were not optimised through a complete parametric sensitivity study because matched jack-stiffness and stage-response measurements were unavailable. Their numerical effects on alternative support-removal operations should, therefore, be examined in future work.
The method presented in this paper depends on three conditions. First, the hoisting unit must be divisible into individual members within the capacity of a single crane (about 10 t in this project) and the joints must be weldable at height. Second, there must be existing structures at both ends of the corridor that can serve as support points (the concrete columns of plots A and B in this project), so that temporary steel brackets can be provided. Third, the hoisting equipment must have a feasible travelling and standing surface whose bearing capacity satisfies the verification after the local load has been spread by roadbed boxes. When the span is significantly larger than 50.3 m [29], or when the working height and radius exceed the effective coverage of piece-by-piece hoisting, the amount of work at height and the schedule penalty of the piece-by-piece scheme will rise rapidly, and it must be compared again with schemes such as integral lifting.
The calculation and measurement in this paper do not take account of the temperature action and diurnal temperature difference during construction, the influence of wind load on the closure geometry [30], the shrinkage and creep of concrete, welding residual stresses, or the degradation of stiffness after cracking of the concrete slab. The influence of temperature action on the closure segment deserves particular attention: the existing literature shows that the temperature effect of statically indeterminate steel structures during construction can be corrected by staged temperature measurement and force feedback [8], and in this project the closure operation was arranged within the same temperature period, which in practice reduced the dispersion of the temperature deformation, but the effect of this measure is not represented in the calculation model and can be the subject of subsequent quantitative research.
In addition, the conclusion regarding the support removal sequence in this paper was obtained from a comparison of two schemes, and the space of schemes was not enumerated exhaustively. When the number of support points, the support stiffness or the structural system is more complex, the support removal sequence should be treated as an optimisation variable and systematically optimised with the maximum deformation increment at key positions and the tensile stress in the concrete as constraints, rather than merely selecting the better of two schemes.
6.4. Economic and Schedule Benefits
The benefits of the method presented in this paper are mainly twofold: large-scale strengthening of the basement roof is avoided, and the number and weight of the temporary support towers are reduced. The comparison of schemes already established that integral hoisting of large units would require large-scale strengthening of the roof, whereas the selected scheme satisfies the roof verification simply by spreading the local load with roadbed boxes.
7. Conclusions
Taking the steel sky corridor of plots A and B of the Nanjing Jinling Zhonghuan project as the engineering background, this paper developed an integrated construction and control framework for high-altitude piece-by-piece assembly under coupled site, structural and operational constraints. The framework links closure-location selection, staged support-load transfer and multi-constraint safety control, and is evaluated through the following aspects.
(1) Through a comprehensive comparison of four hoisting schemes, a construction scheme using an 80 t mobile crane for high-altitude piece-by-piece assembly, advancing from the fixed end to the cantilever end and taking the cantilever end as the closure segment, was determined.
This scheme refines the heaviest hoisting unit from 108 t to about 10 t, avoids large-scale strengthening of the basement roof, and uses the existing concrete columns to support temporary steel brackets, thereby reducing the dependence on temporary support towers and achieving a good balance between safety, economy and feasibility.
(2) A finite-element model of the steel corridor, hardened concrete slab and temporary support system was established for the support-removal stages. Wet concrete was first applied as an area load, with the slab elements inactive; after hardening, this load was removed, the slab elements were activated and concrete self-weight was included once.
The maximum combined deformation before support removal was obtained for the completed steel–concrete system. The removal sequence strongly influenced the deformation path: removing the cantilever-end support first produced an abrupt additional deflection of 45.25 mm, whereas removing the roof supports first limited the mid-span increment to 25.61 mm. The sequence of removing the supports around the Y-shaped columns, the roof supports, the supports at axis 1 and, finally, the supports at axis 4 was, therefore, selected among the two investigated schemes. The post-cast strips were arranged at axes 2 and 3 to limit restrained slab cracking during the system transformation.
(3) A support load-transfer and unloading technology based on the principles of supporting before transferring and propping before cutting was proposed.
The temporary supports used two 60 t jacks per point, and the permanent-bearing points adjacent to the Y-shaped columns used two 100 t jacks per point. A total of 24 support points and 48 jacks were arranged. A target preload equal to 80% of the predicted support-point reaction was applied as a control parameter for reliable jack engagement; it was not a safety factor against jack capacity. The maximum temporary-support reaction was 398.0 kN at the roof level and 493.9 kN at ground level. Under nominal equal sharing, the maximum force per 60 t jack was 19.9 t and 24.7 t, respectively, corresponding to utilisations of 33.2% and 41.2%. The original bracket beams were removed only after jack engagement and preload stability had been verified, after which synchronous retraction transferred the load progressively to the permanent bearings.
(4) A safety-control system was developed for the basement roof, the operating substation and the road crossing.
The roof verification resulted in an equivalent uniformly distributed load of about 20.5 kN/m2 during hoisting, below the adopted permissible value of 30 kN/m2, and the maximum combined stress of the protective structure was about 118.7 MPa. For night-time road operations, approved work planning, lighting of at least 50 lx, independent power and backup, unified signalling and traffic control were combined in one operating procedure.
(5) A handheld three-dimensional laser scanner was used to remeasure 140 nodes on four control lines of the upper and lower chords.
The maximum computed final-position deviation ratio was 2.94‰ and the average was 1.48‰. The 3‰ criterion is a project-level geometric control value, not a statutory code limit. Because the maximum ratio is only 0.06‰ below this value, and a quantitative measurement-uncertainty budget was not available, the result is interpreted as close to the project control limit. The scanning data are used as an independent check of final geometry rather than as direct validation of the construction-stage finite-element model.
Project implementation showed that the integrated measures kept deformation and stress within the limits adopted in this study, and no safety accident was reported. Because the conclusions are based on one project, their transferability depends on the support conditions, lifting-unit limits and site bearing capacity, while the modelling limitations identified in Section 6.3 remain to be addressed.
Supplementary Materials
The following supporting information can be downloaded at: https://www.mdpi.com/article/10.3390/buildings16224636/s1, Table S1. Steel-member section schedule. Table S2. Scheme-comparison basis used in main-text Table 1. Table S3. Definitions of the 1–5 comparative ratings. Table S4. Cost- and duration-driver burden ratings. Table S5. Temporary-support reaction and jack-capacity summary. Figure S1. Ground-level temporary-support tower details. Figure S2. Detailed hoisting positions and unit weights in the outer region. Figure S3. Temporary-support layout and additional load application. Figure S4. Permanent bearings, jack numbering and unloading-stage layouts. Figure S5. Load application for the pedestrian and vehicle protection structure.
Author Contributions
Conceptualisation, K.D. and Z.G.; methodology, K.D.; software, K.D. and T.Z.; validation, T.Z. and R.Y.; formal analysis, K.D.; investigation, H.S.; resources, H.S.; data curation, T.Z. and H.W.; writing—original draft preparation, K.D.; writing—review and editing, Z.G. and R.Y.; visualisation, H.W.; supervision, Z.G.; project administration, H.S. All authors have read and agreed to the published version of the manuscript.
Funding
This research received no external funding.
Institutional Review Board Statement
Not applicable.
Informed Consent Statement
Not applicable.
Data Availability Statement
The data presented in this study are available upon request from the corresponding author.
Acknowledgments
The authors gratefully acknowledge the support of the project team of the Nanjing Jinling Zhonghuan project during the site investigation and monitoring work. During the preparation of this manuscript, the authors did not use generative artificial intelligence (GenAI) tools to generate text, data or graphics, or to assist in study design, data collection, analysis or interpretation. The authors take full responsibility for the content of this publication.The authors only used basic spelling and grammar checking functions, which require no declaration under the journal’s policy, and take full responsibility for the content of this publication.
Conflicts of Interest
Author Haibin Sun was employed by the company Jiangsu Yongjia Steel Structure Construction Co., Ltd. The remaining authors declare that the research was conducted in the absence of any commercial or financial relationships that could be construed as a potential conflict of interest.
Abbreviations
The following abbreviations are used in this manuscript:
| BIM | Building Information Modelling |
| FEM | Finite-element method |
| PLC | Programmable logic controller |
| SLAM | Simultaneous localisation and mapping |
| 3D | Three-dimensional |
Appendix A. Finite-Element Model Configuration
Table A1 summarises the element and material inputs used in the beam-element model. Table A2 defines the support constraints and connection idealisations. Table A3 lists the loads and construction stages used for the support-unloading analysis.
Table A1.
Material and element configuration of the finite-element model.
Table A2.
Bearing, connection and support constraints.
Table A3.
Loads, construction stages and solution settings.
Appendix B. Existing Substation Column Design Basis
The existing substation remained in operation during the construction work. The following table summarises the original column design information used for the load-envelope comparison. The longitudinal reinforcement is taken from Section 9-9 of the original structural drawing; the number of bars should be checked against the full reinforcement schedule before typesetting.
Table A4.
Design information and construction load comparison for the existing substation column.
Appendix C. Laser-Scanning Data Processing and Measurement Note
The point cloud was cleaned, cropped to the main truss region, transformed to the project coordinate system and imported into Rhino. The measured truss axes and node coordinates were reconstructed from the point cloud and aligned to the design model by a rigid-body transformation. Registration, alignment and node-extraction errors can each affect the reported deviation ratio.
A complete quantitative uncertainty budget could not be established because the scanner calibration records and SLAM registration report were not available for this study. Accordingly, a combined standard uncertainty uc based on scanner, registration, alignment and node-extraction components was not reported, and an expanded uncertainty U = 2uc could not be calculated. The maximum measured ratio is 2.94‰, leaving only a 0.06‰ margin to the 3.00‰ project control value. Without this uncertainty information, the result should not be interpreted as a high-confidence demonstration of compliance.
References
- Shan, M.D. Management practice for steel structure work of the wide span aerial corridor in tobacco construction project. Appl. Mech. Mater. 2014, 578–579, 723–726. [Google Scholar] [CrossRef] [Scilit]
- Yang, Q.; Yu, S.; Zhang, X.; Wang, Z.; Yan, J.; Chen, X. The Construction Technology of Roof Steel Structure in YanCheng NanYang Airport. Adv. Civ. Eng. 2018, 2018, 6386020. [Google Scholar] [CrossRef] [Scilit]
- Zou, X.-K.; Zhang, Y.; Liu, Y.-P.; Shi, L.-C.; Kan, D. Design and Construction of High-Performance Long-Span Steel Transfer Twin Trusses Applied in One Hospital Building in Hong Kong. Buildings 2023, 13, 751. [Google Scholar] [CrossRef] [Scilit]
- Zhou, J.; Weng, F.; Liang, Y.; Liao, Z.; Zhang, F.; Fu, M. Construction Control of Long-Span Combined Rail-Cum-Road Continuous Steel Truss Girder Bridge of High-Speed Railway. Buildings 2025, 15, 4204. [Google Scholar] [CrossRef] [Scilit]
- Lan, T.; Xing, G.; Qin, G.; Li, Z.; Gao, R. Comparison and selection of multiple construction schemes for the large-span and heavy-load transfer truss. Buildings 2023, 13, 3056. [Google Scholar] [CrossRef] [Scilit]
- Miller, N.; Zylstra, R. Temporary works for dismantling steel cantilever truss bridges in the USA. Proc. Inst. Civ. Eng. Civ. Eng. 2023, 176, 40–47. [Google Scholar] [CrossRef] [Scilit]
- Li, J.; Liang, H.; Huang, P.; Lou, X.; Zhang, S. Analysis of bearing capacity of tire frame in large-span steel truss corridor and floor support reinforcement study. J. Phys. Conf. Ser. 2025, 3068, 012047. [Google Scholar] [CrossRef] [Scilit]
- Yao, G.; Wu, C.; Yang, Y. Scientometric analysis for mechanical performance of broken-line long-span steel structure in construction considering geometric nonlinearity. Symmetry 2021, 13, 1229. [Google Scholar] [CrossRef] [Scilit]
- Hou, R.; Li, H.; Zhang, H.; Wang, H.; Chen, L.; Xian, Q. Integrated construction process monitoring and stability assessment of a geometrically complex large-span spatial tubular truss system. Buildings 2025, 15, 4000. [Google Scholar] [CrossRef] [Scilit]
- Zhang, G.; Zheng, Z.; Shi, H.; Ji, J. Effects of temporary support removal sequence on the mechanical behavior of composite beam bridges with corrugated steel webs in sustainable construction. Adv. Civ. Eng. 2025, 2025, 4211789. [Google Scholar] [CrossRef] [Scilit]
- Shao, J.H.; Wang, Z.H.; Tao, G.Y. Research on the unloading process of long-span steel roof and the design of temporary bracing structure. Adv. Mater. Res. 2010, 163–167, 251–258. [Google Scholar] [CrossRef] [Scilit]
- Wang, L.; Feng, R.; Du, H.; Liu, P.; Lv, H.; Huang, S.; Cui, L. Research and application of a novel rigid-flexible hybrid support system in large-span curtain walls. Structures 2026, 88, 111894. [Google Scholar] [CrossRef] [Scilit]
- Buitrago, M.; Sagaseta, J.; Adam, J.M. Avoiding failures during building construction using structural fuses as load limiters on temporary shoring structures. Eng. Struct. 2020, 204, 109906. [Google Scholar] [CrossRef] [Scilit]
- Chan, J.L.Y.; Chan, S.-L.; Liu, Y.-P.; Liu, S.-W. Progressive collapse of system scaffolds with accidental removal of bracing members. J. Constr. Steel Res. 2024, 218, 108720. [Google Scholar] [CrossRef] [Scilit]
- Liu, Z.; Lin, S. Digital twin model and its establishment method for steel structure construction processes. Buildings 2024, 14, 1043. [Google Scholar] [CrossRef] [Scilit]
- Lin, S.; Duan, L.; Liu, J.; Miao, J.; Li, H.; Zhao, J. Creation and application of a geometric digital twin model for construction of spatial cable structures: A case study. Front. Struct. Civ. Eng. 2026, 20, 992–1010. [Google Scholar] [CrossRef] [Scilit]
- Hu, X.; Olgun, G.; Assaad, R.H. An intelligent BIM-enabled digital twin framework for real-time structural health monitoring using wireless IoT sensing, digital signal processing, and structural analysis. Expert Syst. Appl. 2024, 252, 124204. [Google Scholar] [CrossRef] [Scilit]
- Jia, X.-L.; Deng, Y.; Hu, X.-Y.; Yao, H.; Hu, Z.-H.; Guo, J.-H.; Zhang, D. Research on BIM-FEM information interaction method for underpass based on digital twins. Measurement 2026, 275, 121418. [Google Scholar] [CrossRef] [Scilit]
- Wu, X.; Chen, S.; Hu, Y.; Wang, Z.; Li, Z. Analysis and real-time monitoring of the influence of wind load on a high-altitude steel connecting bridge with small spacing. Buildings 2024, 14, 1755. [Google Scholar] [CrossRef] [Scilit]
- Sacks, R.; Brilakis, I.; Pikas, E.; Xie, H.S.; Girolami, M. Construction with digital twin information systems. Data-Centric Eng. 2020, 1, e14. [Google Scholar] [CrossRef] [Scilit]
- Suddle, S. The risk management of third parties during construction in multifunctional urban locations. Risk Anal. 2009, 29, 1024–1040. [Google Scholar] [CrossRef] [Scilit] [PubMed]
- Luo, Z.; Zeng, L.; Pan, H.; Hu, Q.; Liang, B.; Han, J. Research on construction safety risk assessment of new subway station close-attached undercrossing the existing operating station. Math. Probl. Eng. 2019, 2019, 3215219. [Google Scholar] [CrossRef] [Scilit]
- Lei, M.; Lin, D.; Huang, Q.; Shi, C.; Huang, L. Research on the construction risk control technology of shield tunnel underneath an operational railway in sand pebble formation: A case study. Eur. J. Environ. Civ. Eng. 2020, 24, 1558–1572. [Google Scholar] [CrossRef] [Scilit]
- Ren, B.; Hu, S.; Hu, M.; Chen, Z.; Lin, H. Safety risk assessment of double-line tunnel crossings beneath existing tunnels in complex strata. Buildings 2025, 15, 2103. [Google Scholar] [CrossRef] [Scilit]
- Standard’s GB 50009-2012; Load Code for the Design of Building Structures. China Architecture & Building Press: Beijing, China, 2012.
- Luo, Q.; Sun, C.; Dan, Y.; Zhao, T.; Zhang, G. Unraveling safety risk coupling in prefabricated steel construction via data mining. J. Constr. Eng. Manag. 2026, 152, 04025281. [Google Scholar] [CrossRef] [Scilit]
- Zhansheng, L.; Chengkuan, J.; Qingwen, Z. Intelligent safety control modeling and construction process control of steel mesh frame structures. Structures 2025, 78, 109158. [Google Scholar] [CrossRef] [Scilit]
- Chen, Z.; Ge, H.; Chan, S. Modelling, test and practice of steel structures. Metals 2022, 12, 1212. [Google Scholar] [CrossRef] [Scilit]
- Shao, X.; He, G.; Shen, X.; Zhu, P.; Chen, Y. Conceptual design of 1000 m scale steel-UHPFRC composite truss arch bridge. Eng. Struct. 2021, 226, 111430. [Google Scholar] [CrossRef] [Scilit]
- Yang, H.; Liu, C.; Sun, Y.; Zhang, S. Wind suction effect on long-span stiffened steel truss bridges during erection. J. Constr. Steel Res. 2012, 71, 38–51. [Google Scholar] [CrossRef] [Scilit]
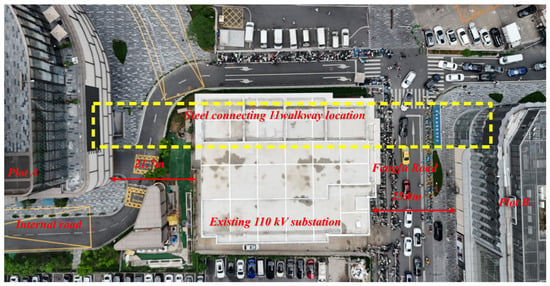
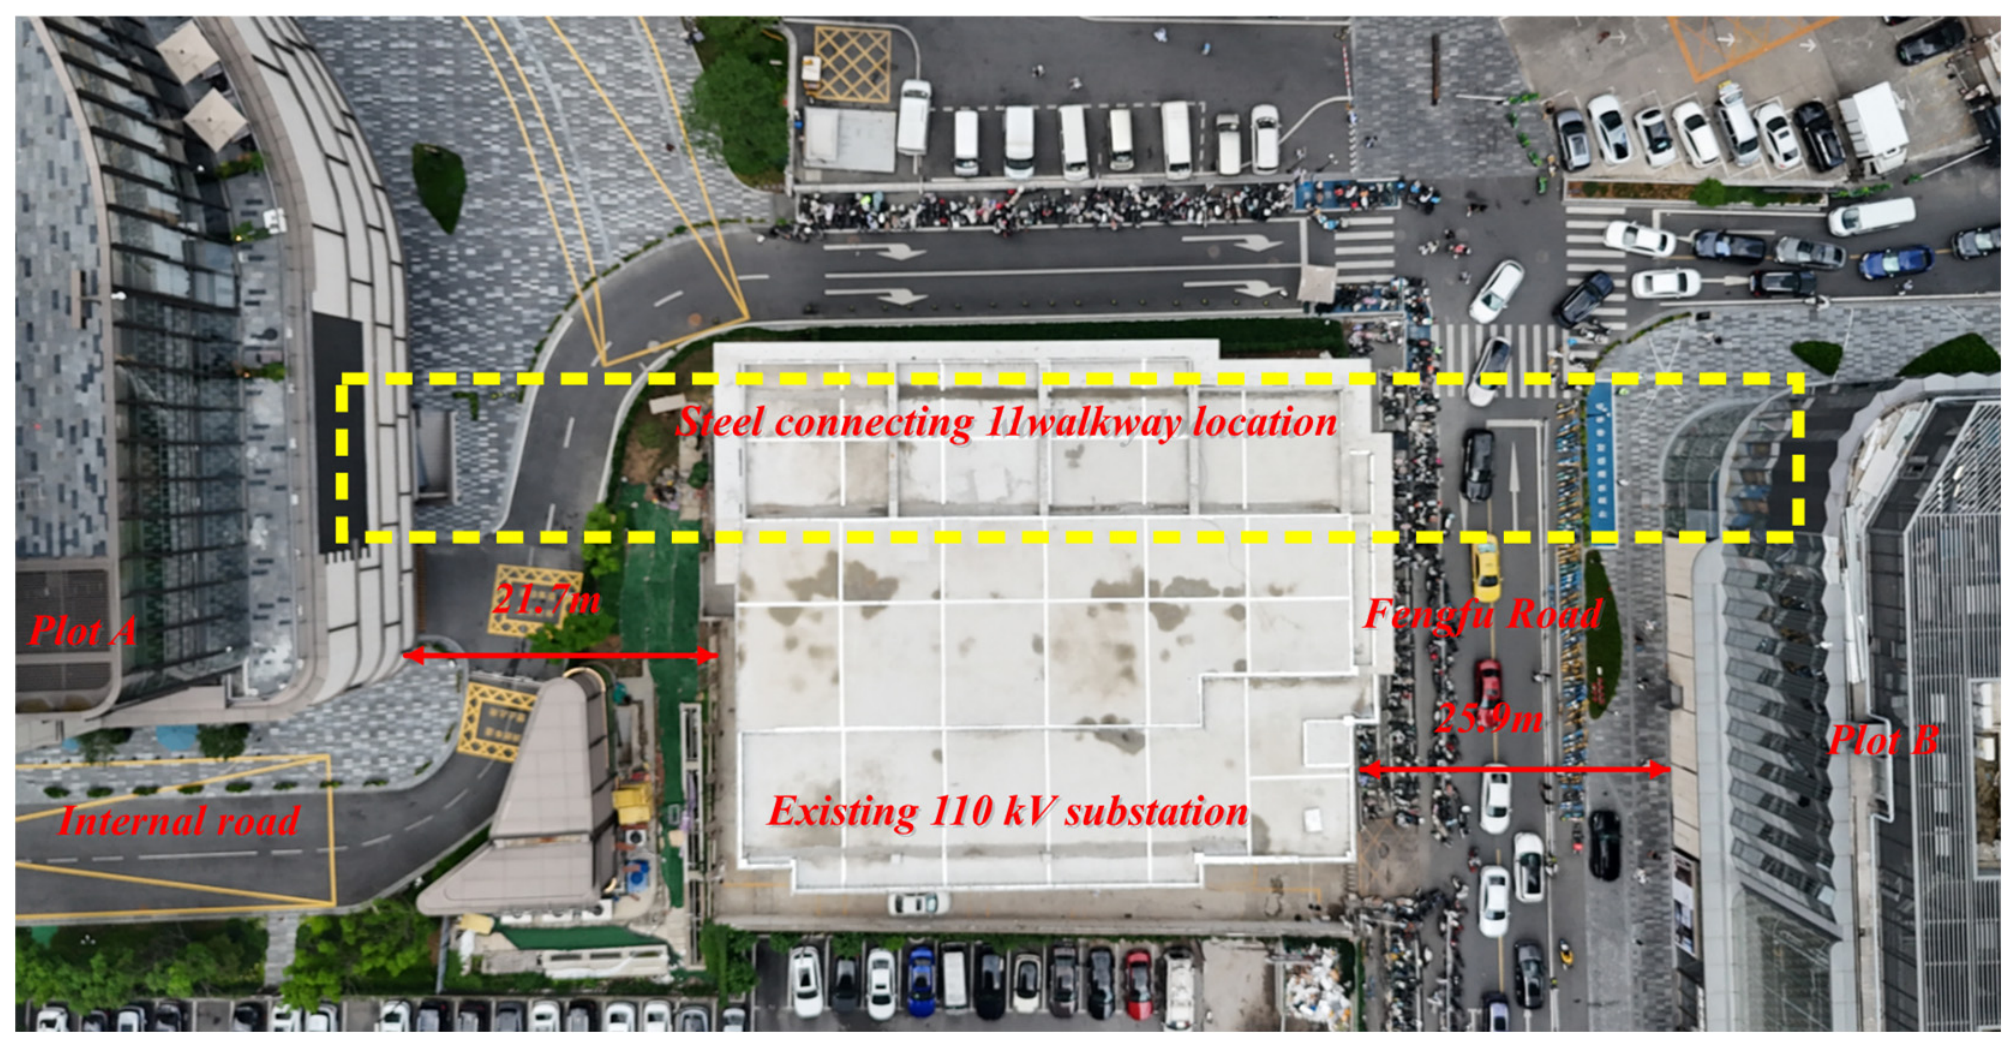
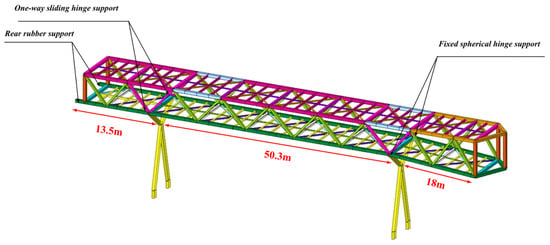
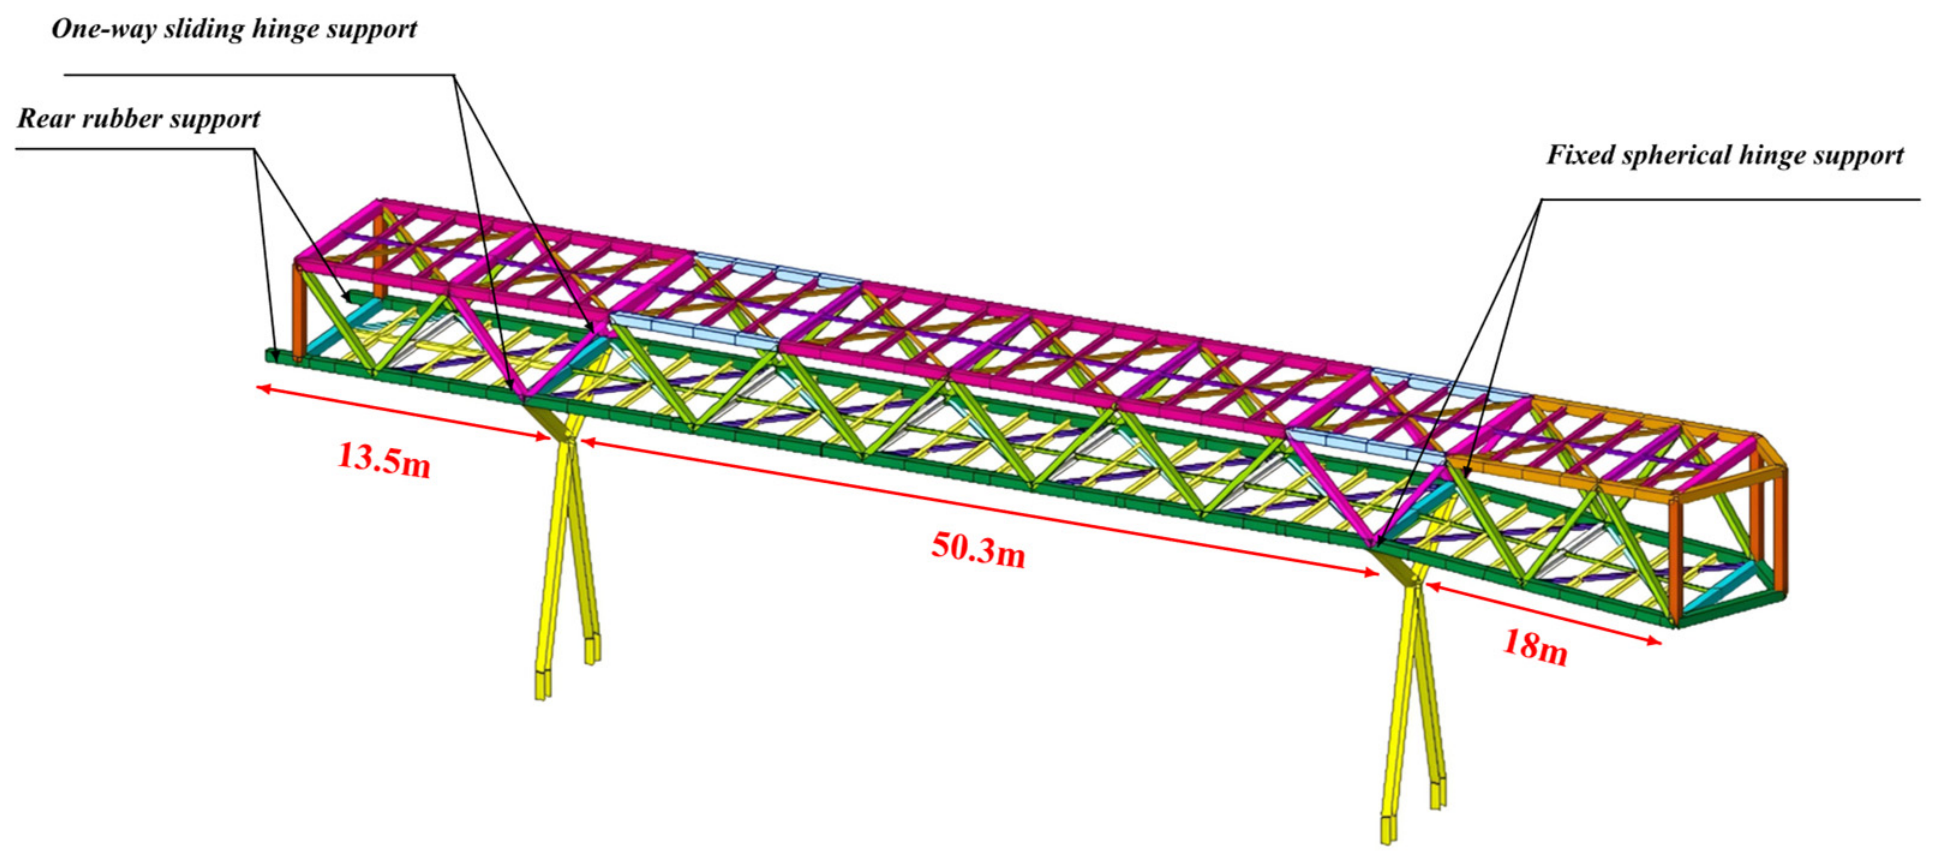
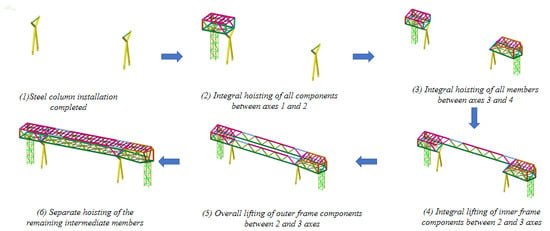
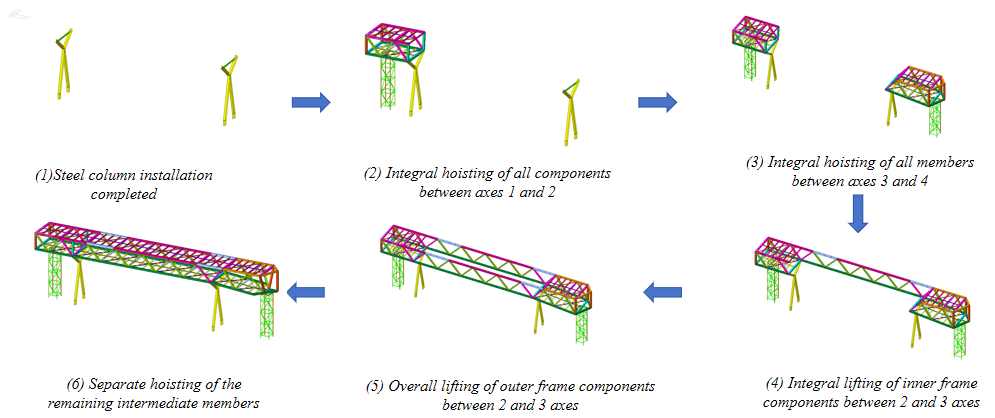
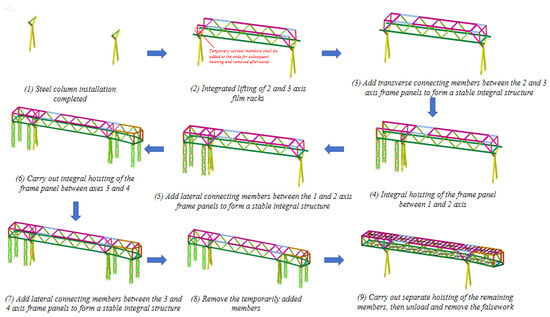
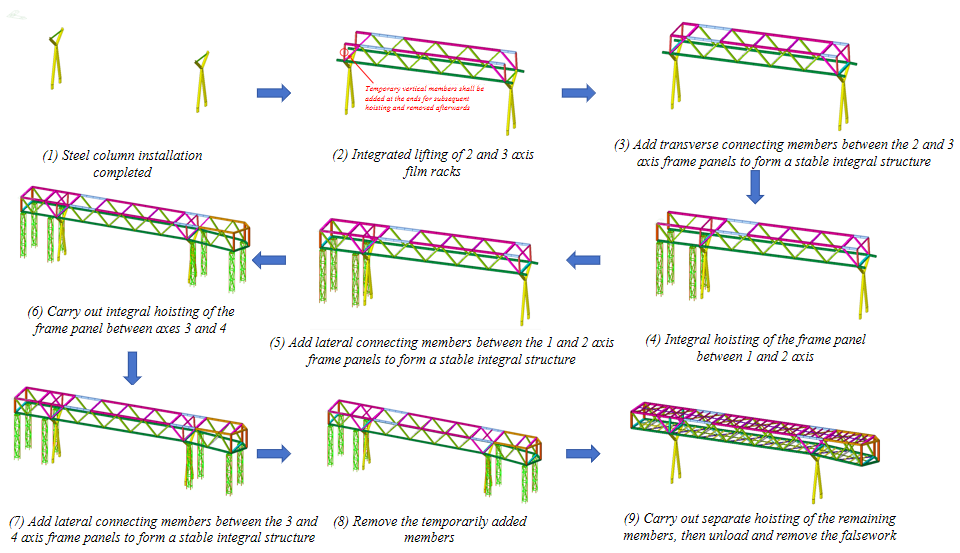
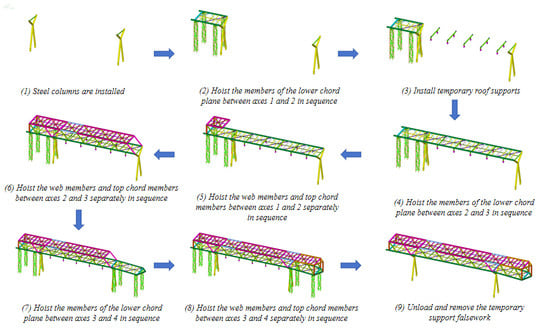
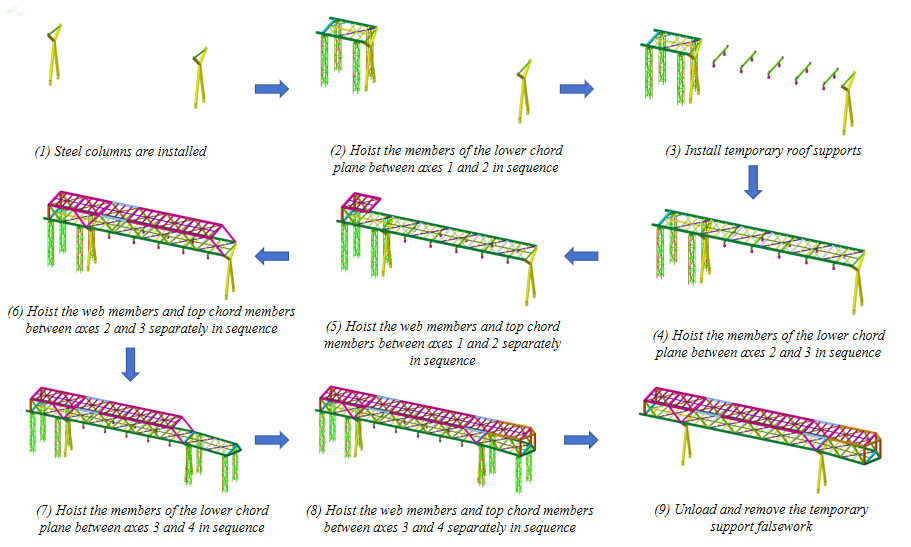
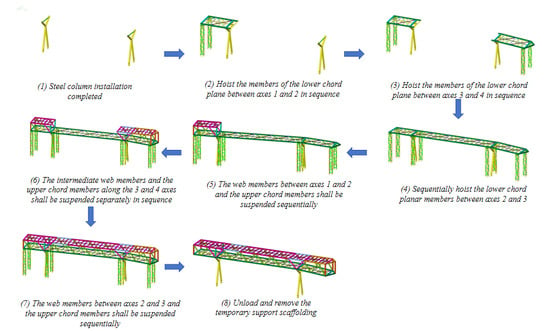
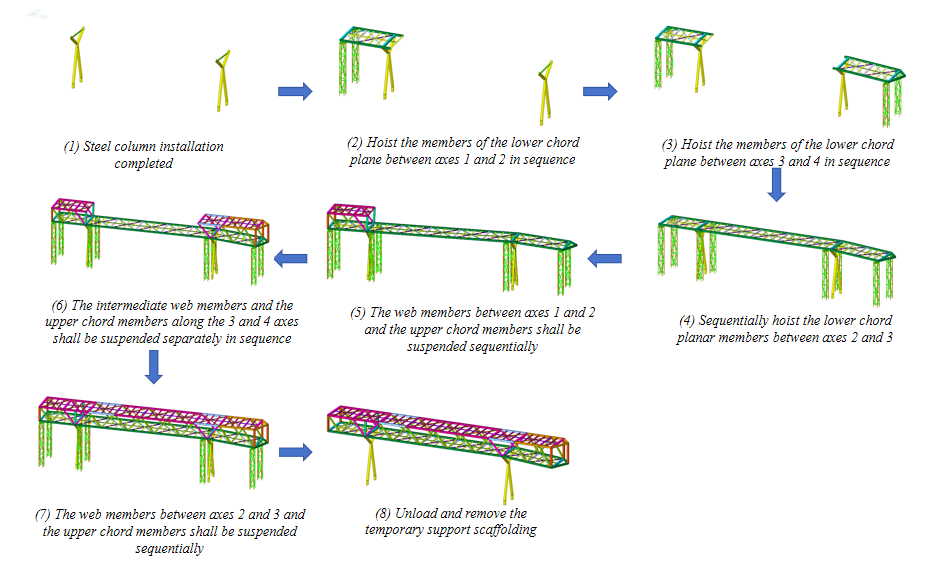
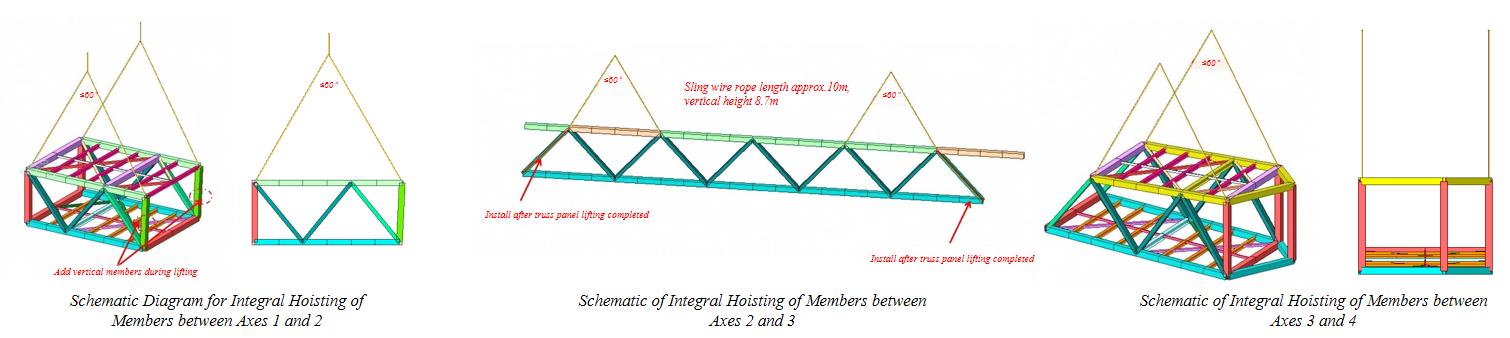
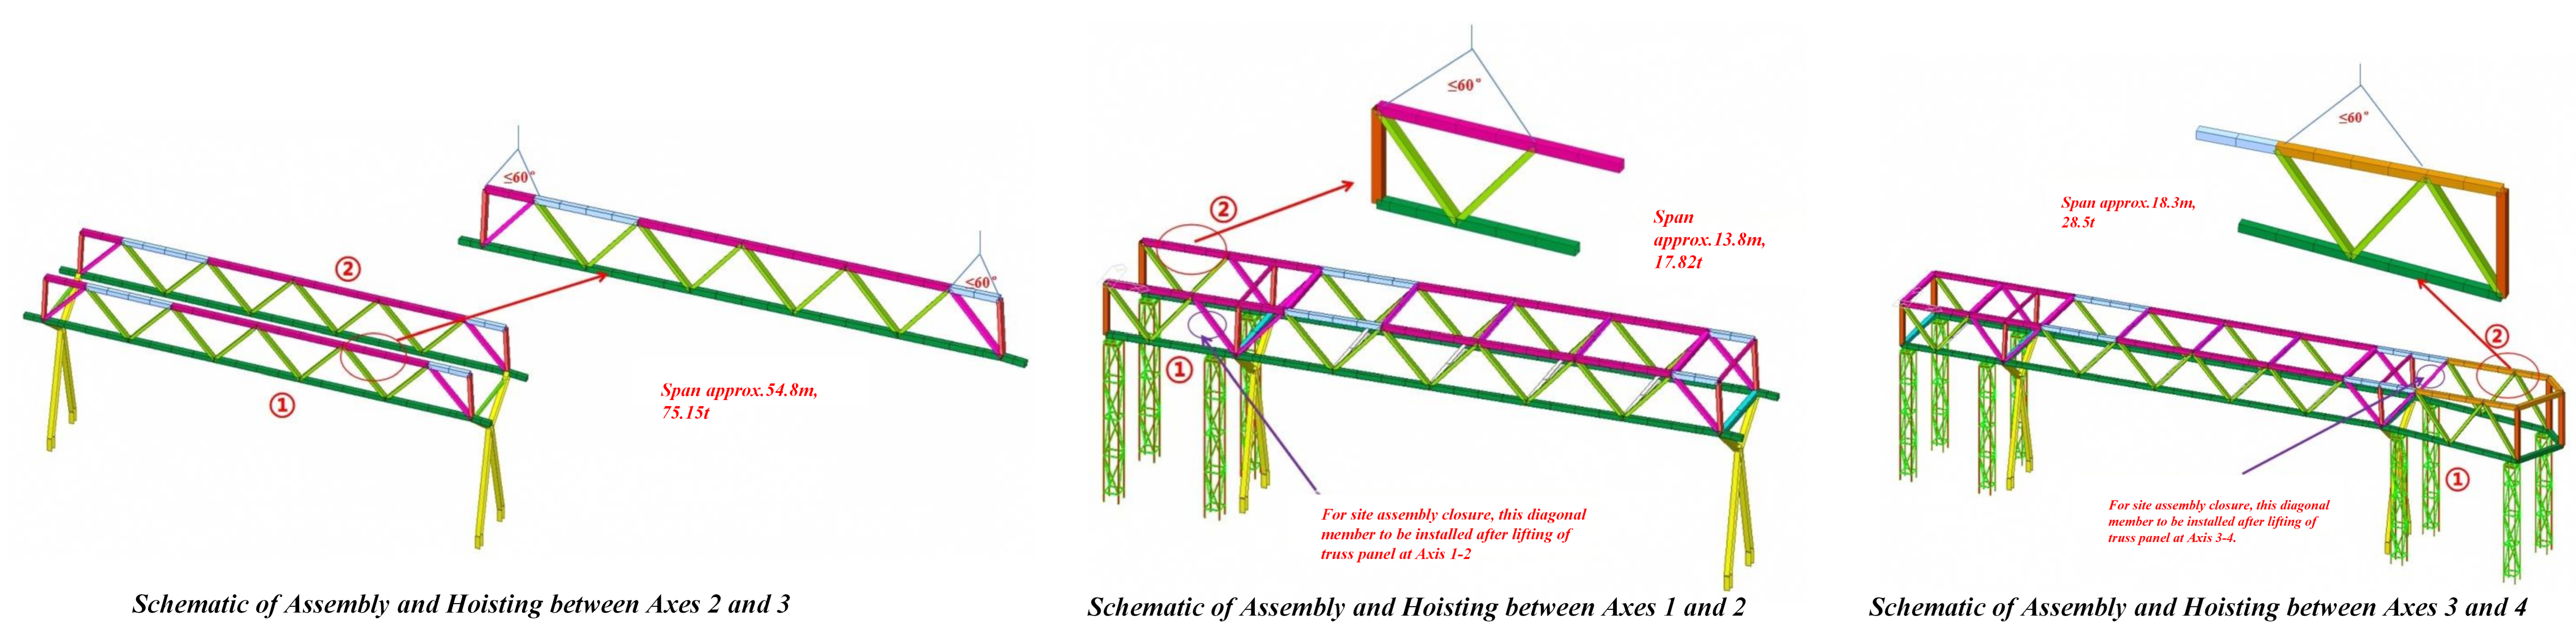


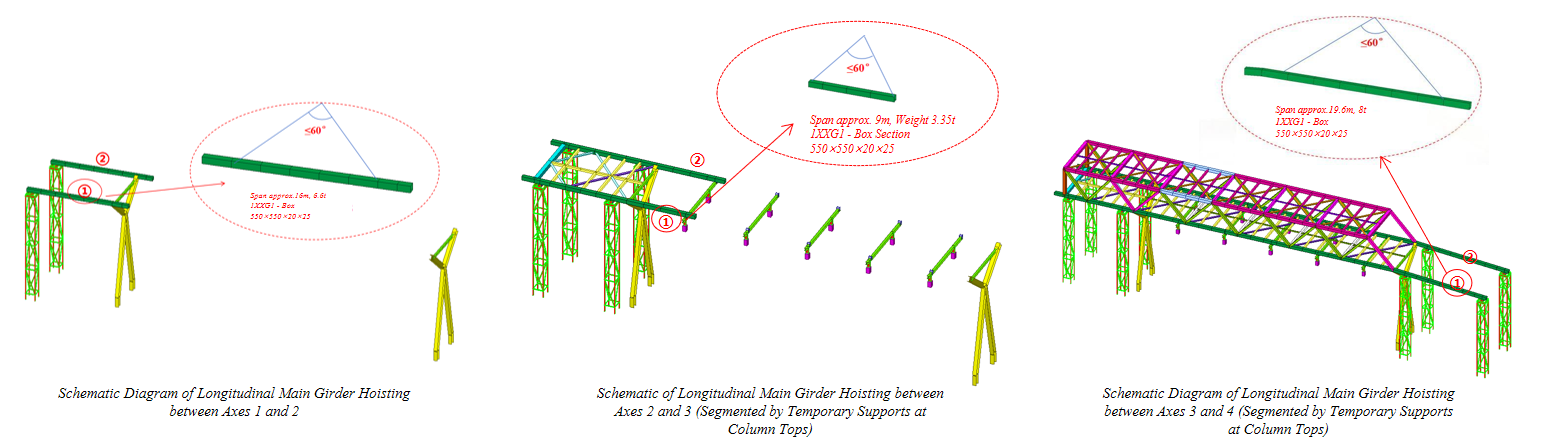
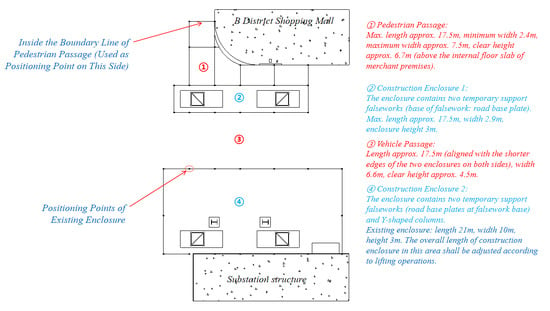
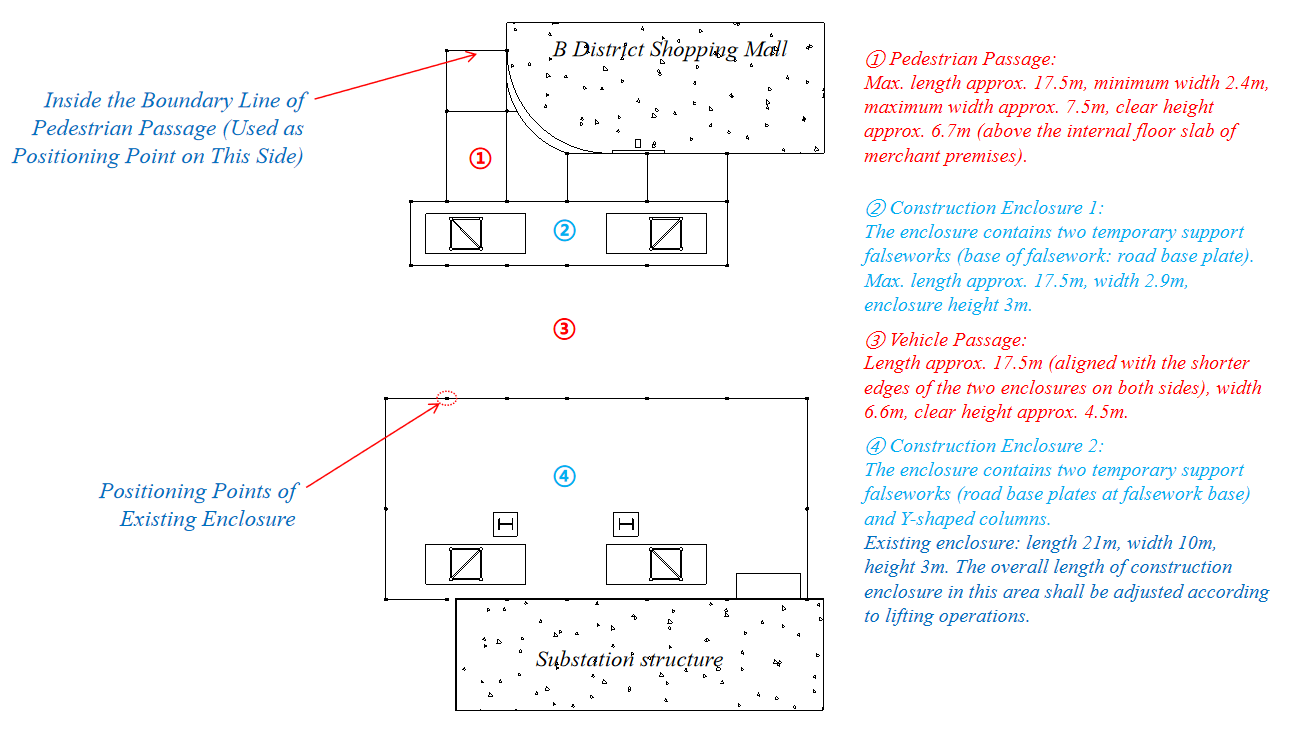
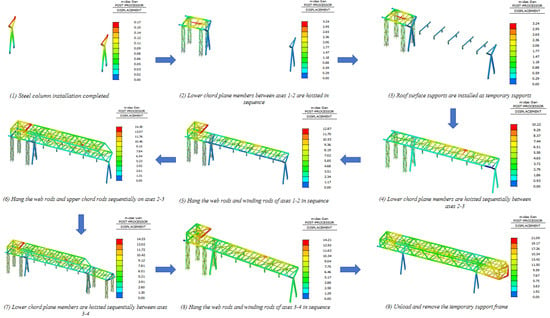
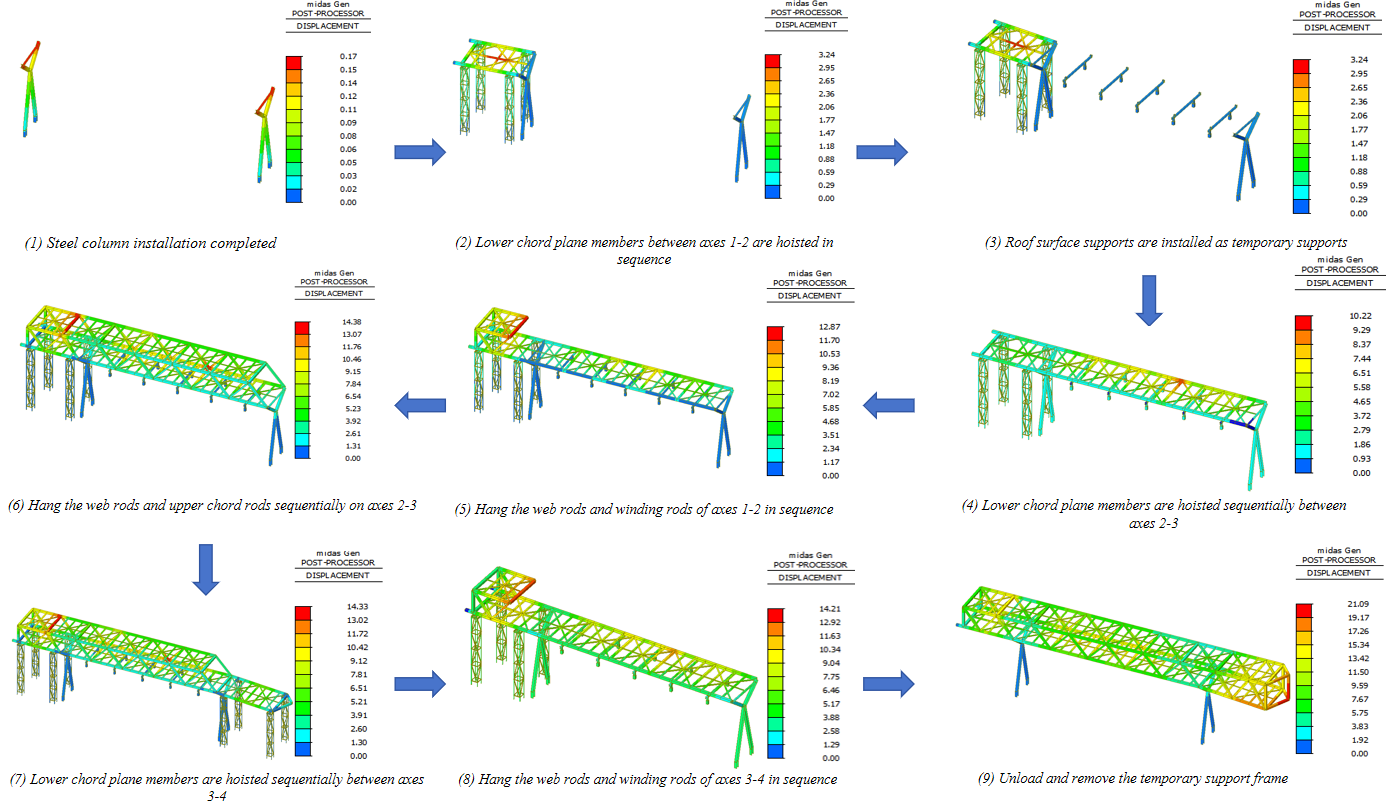
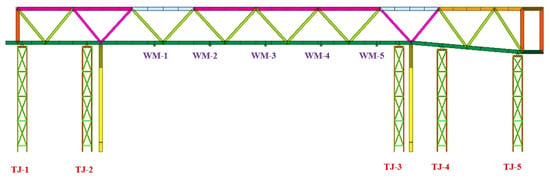
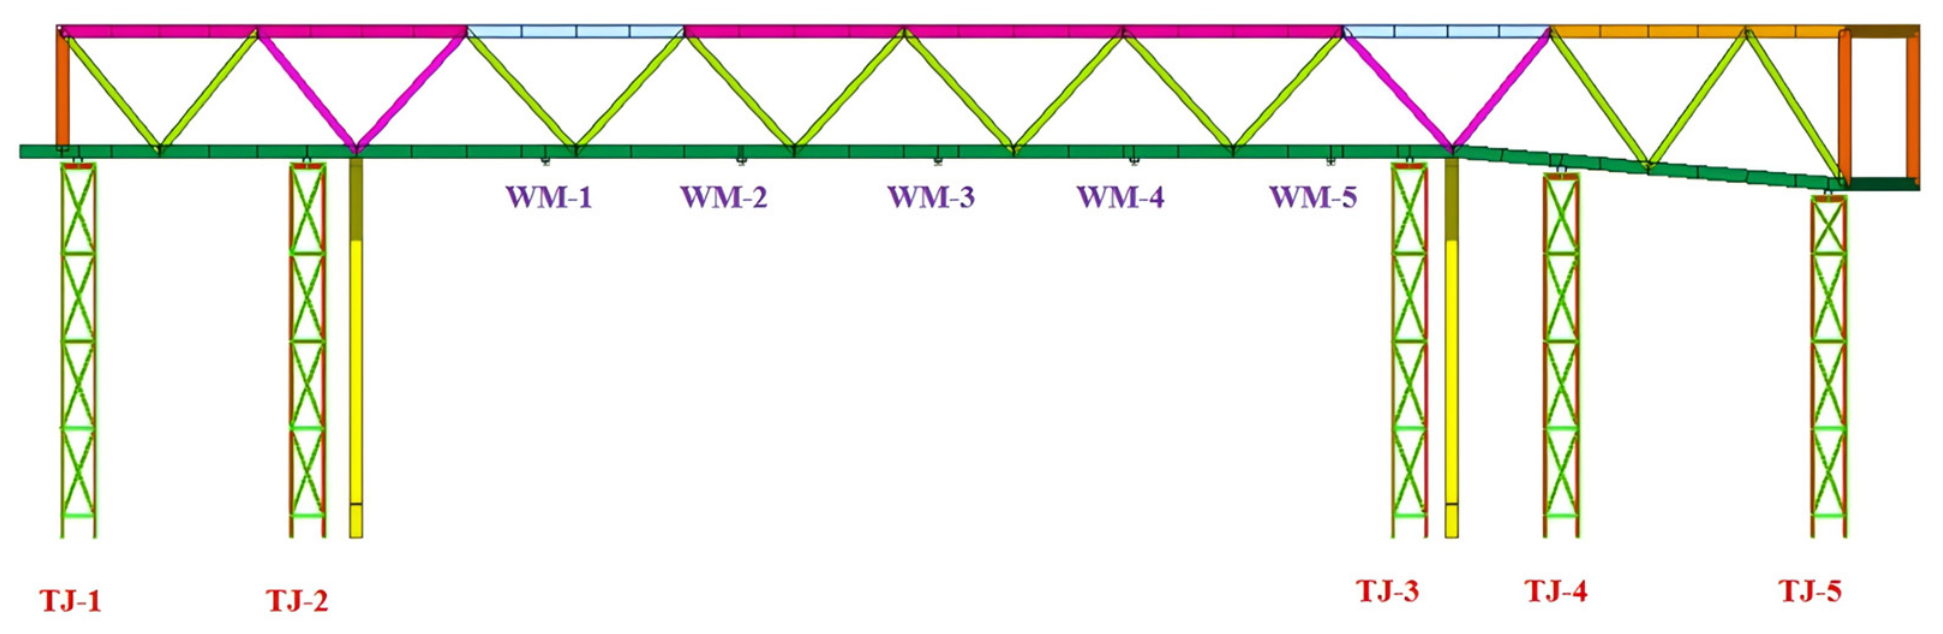
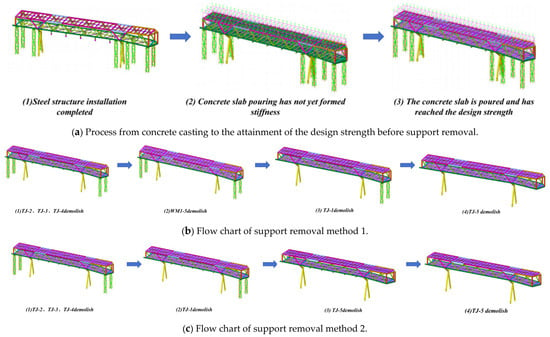
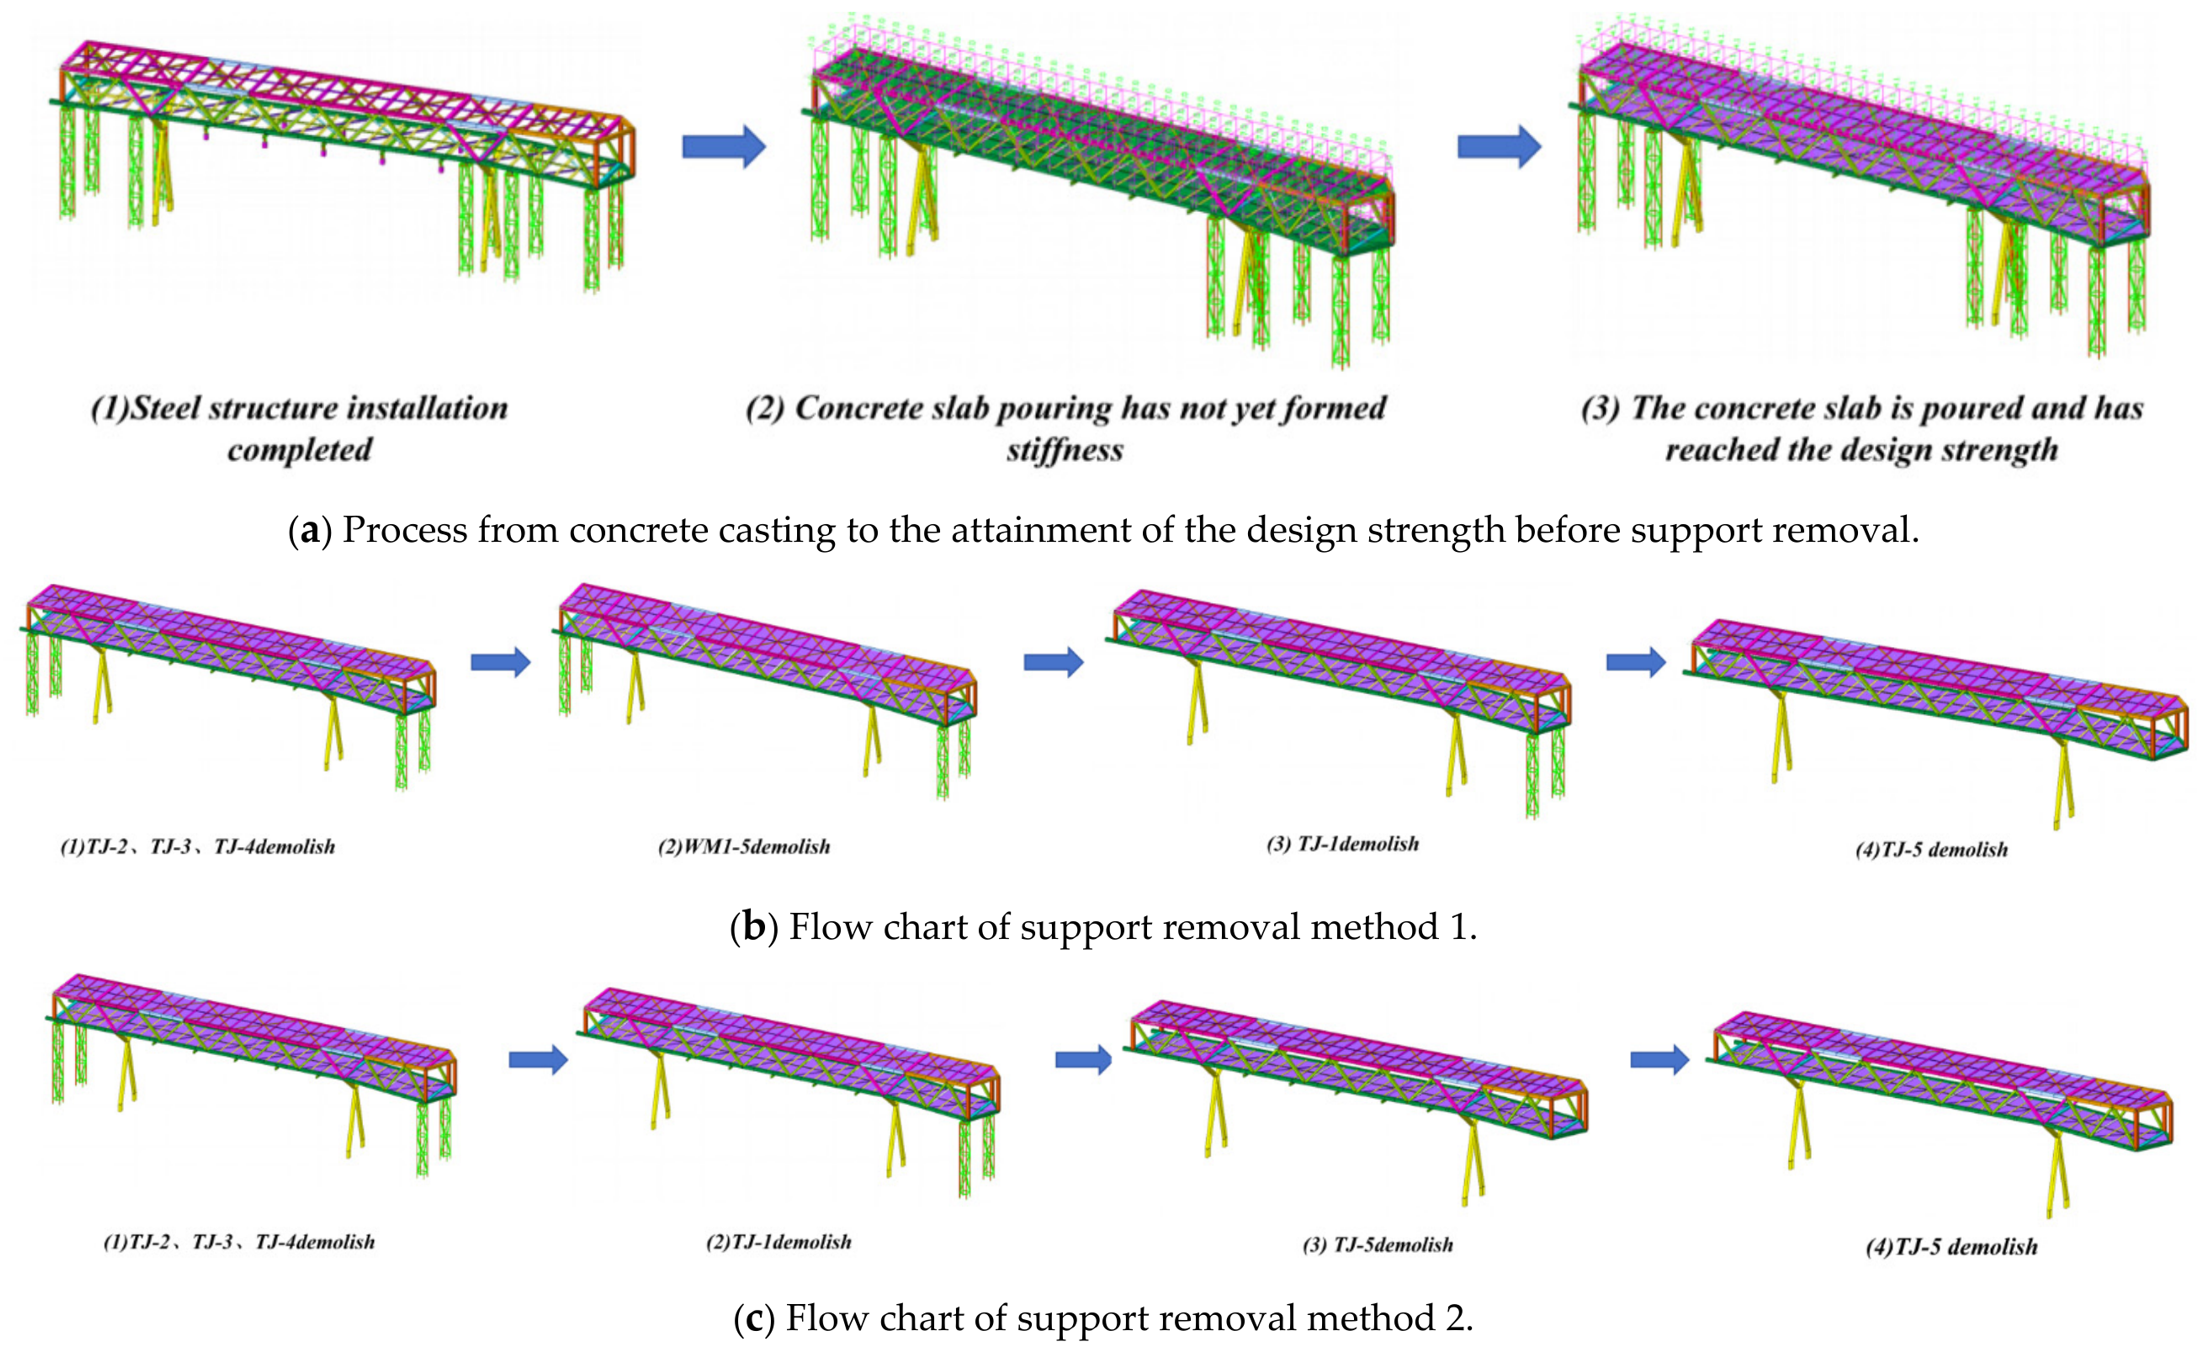






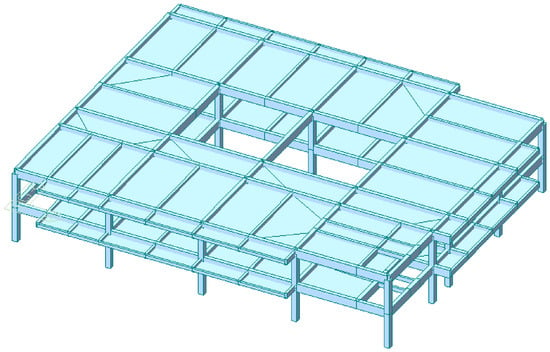
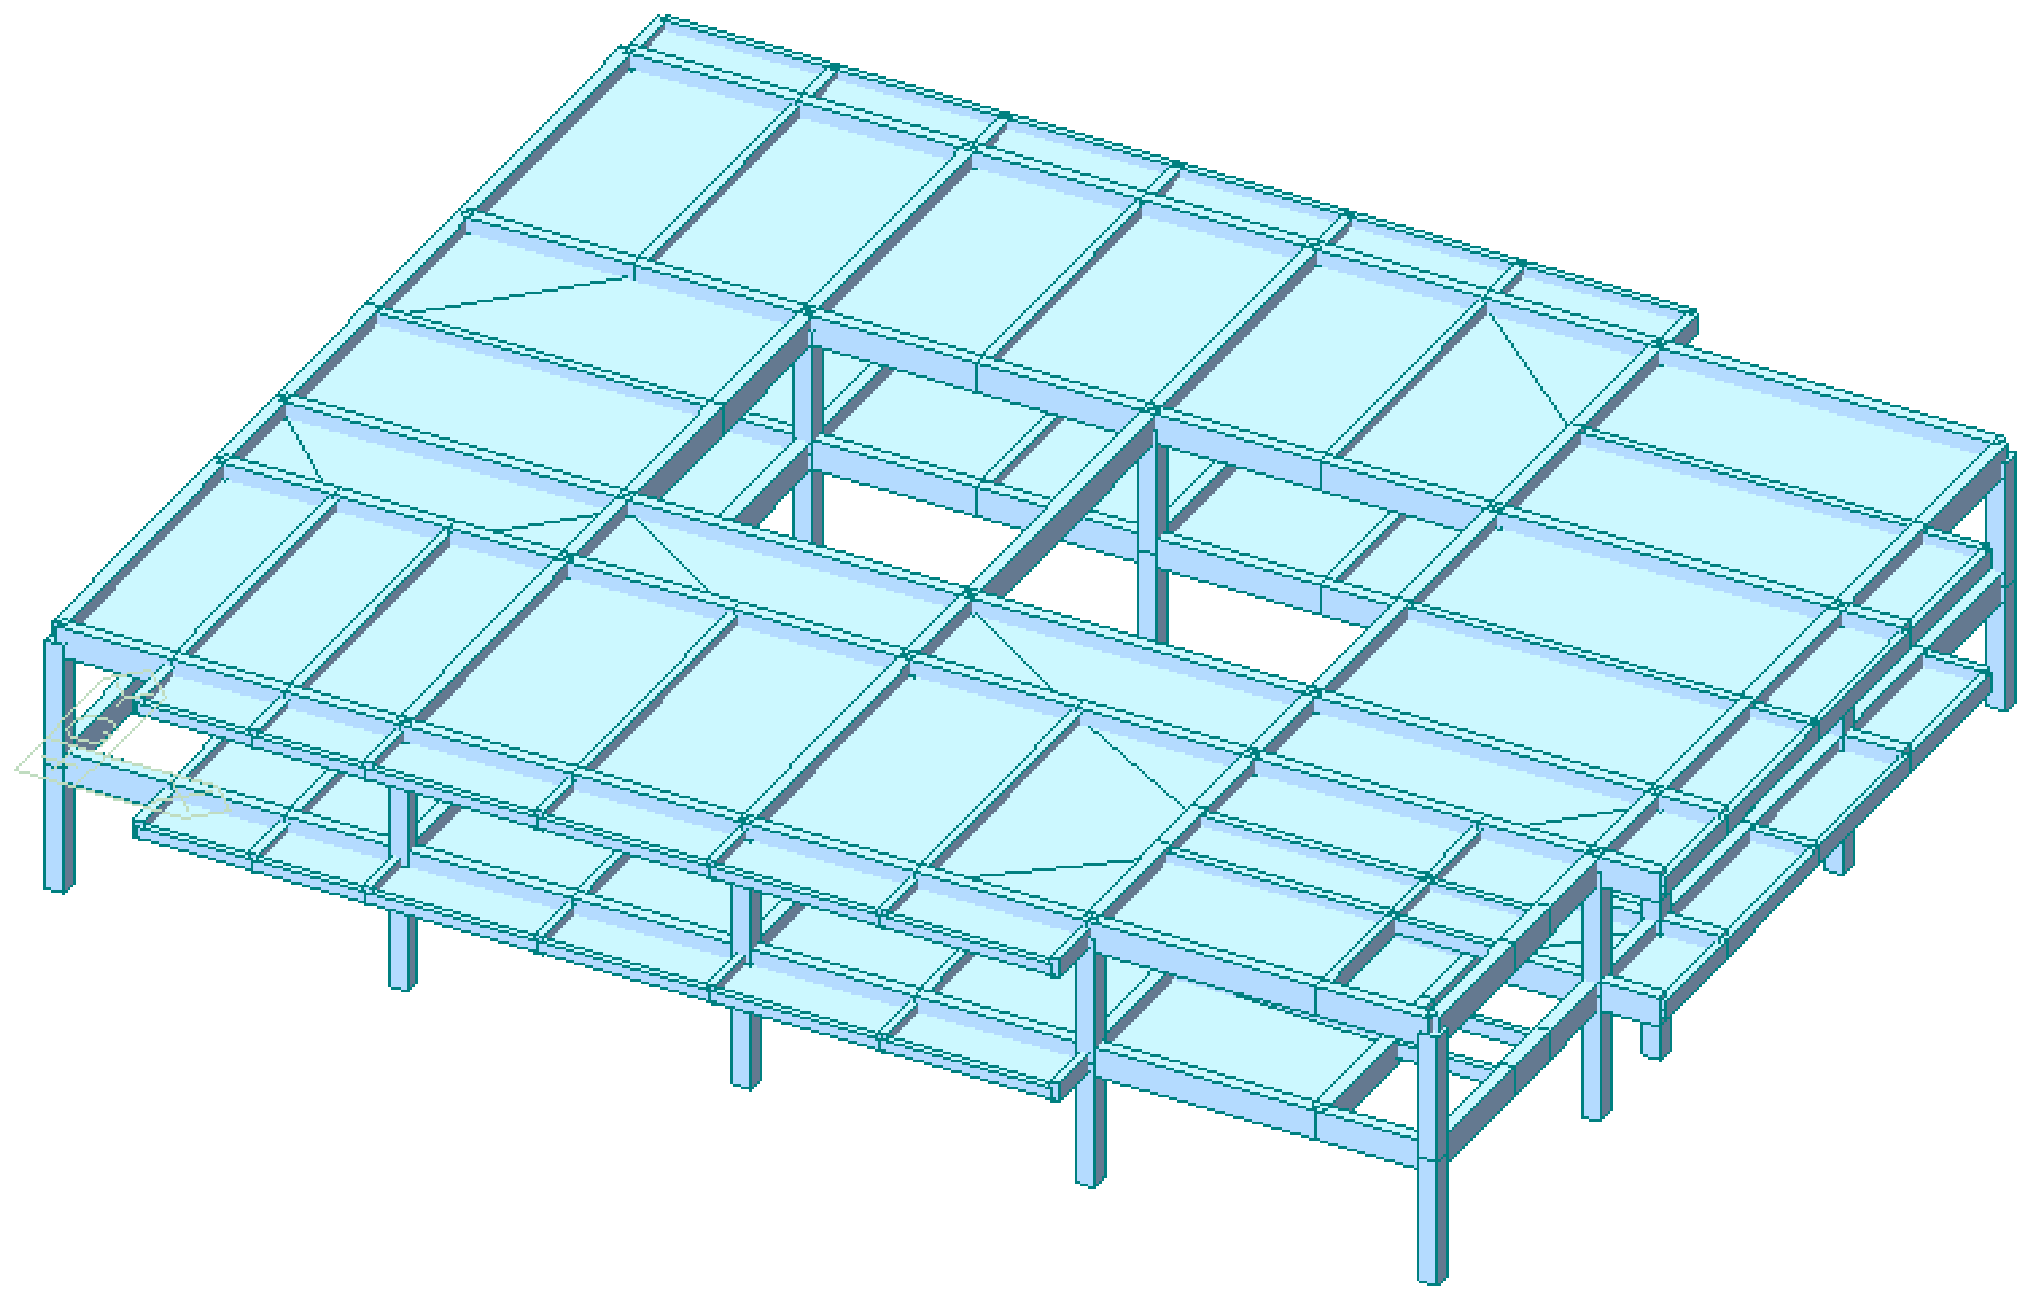
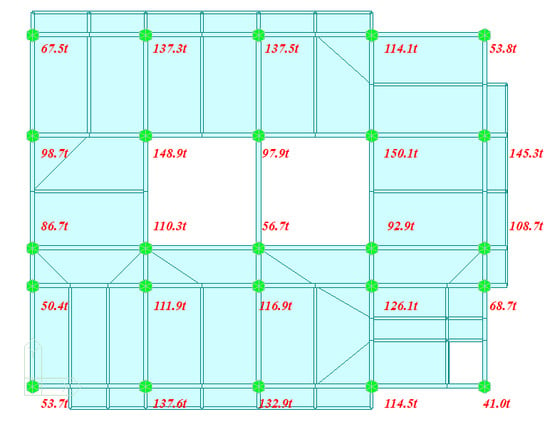
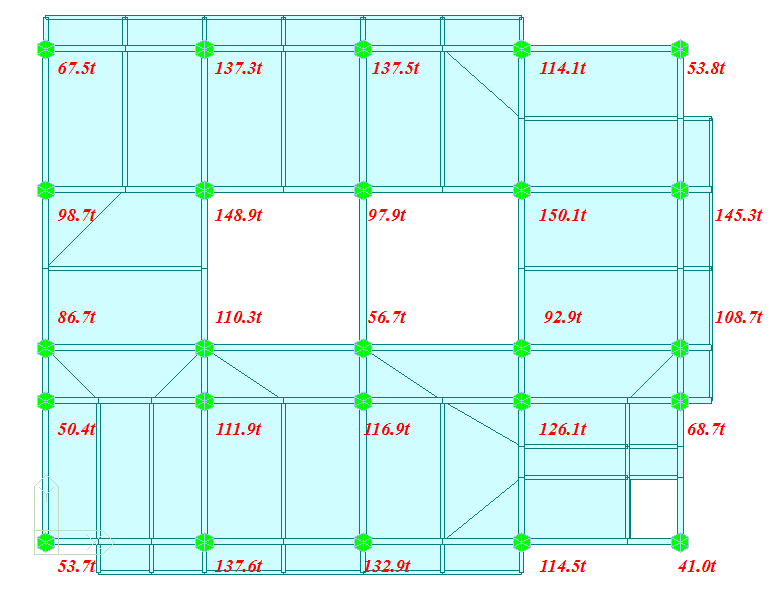
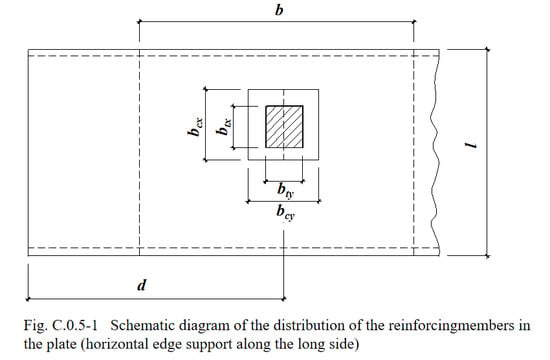
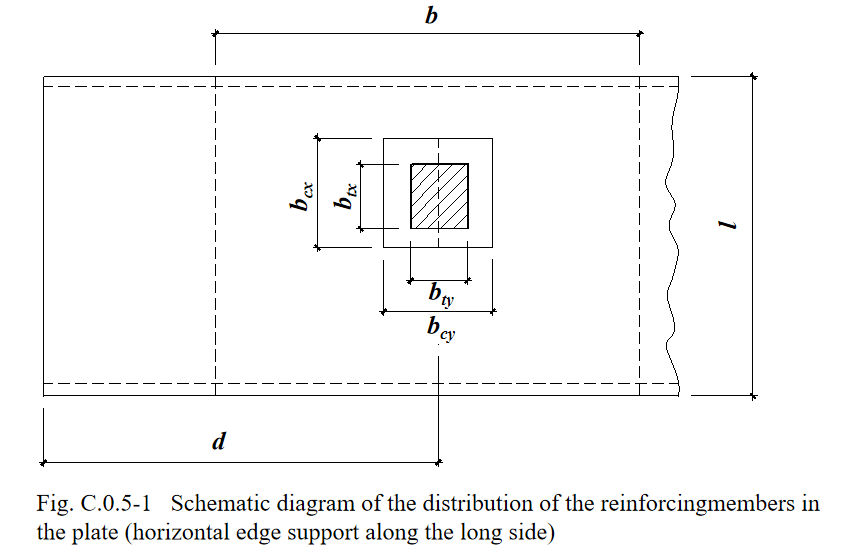
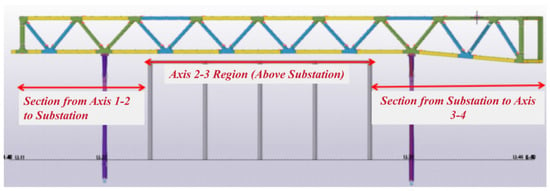
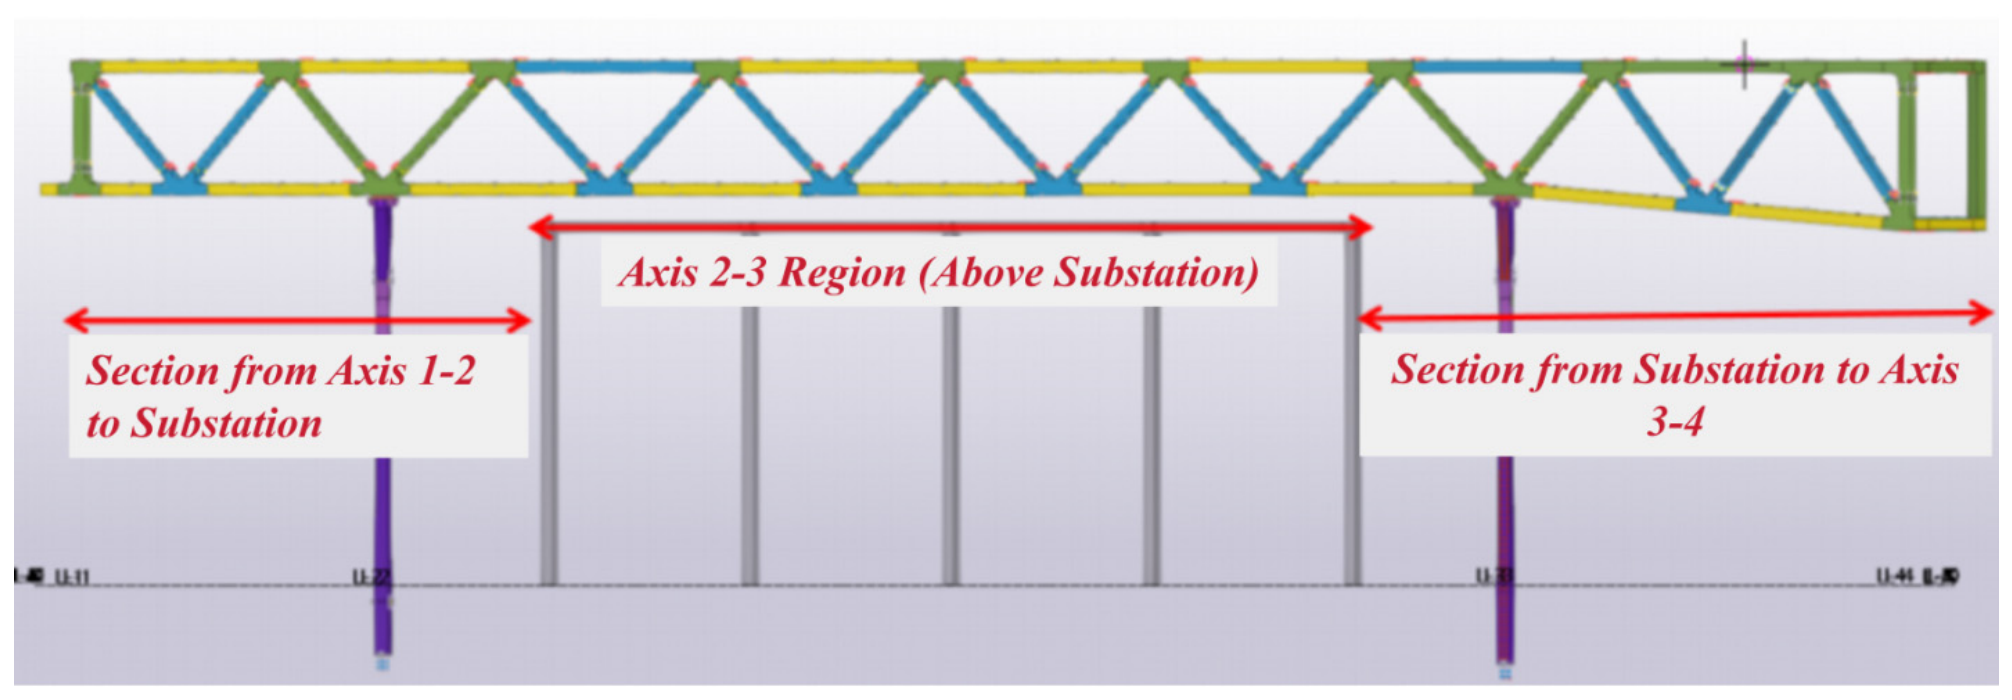
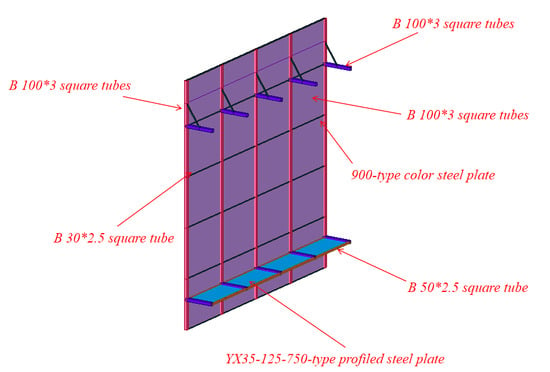
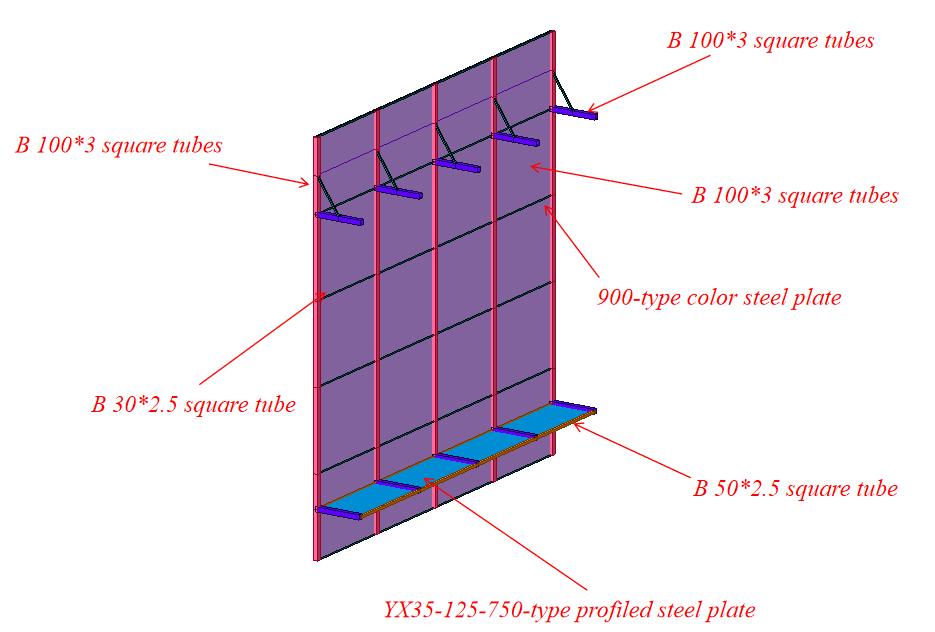
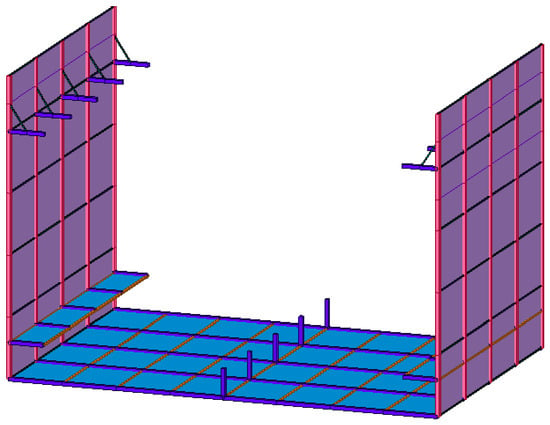
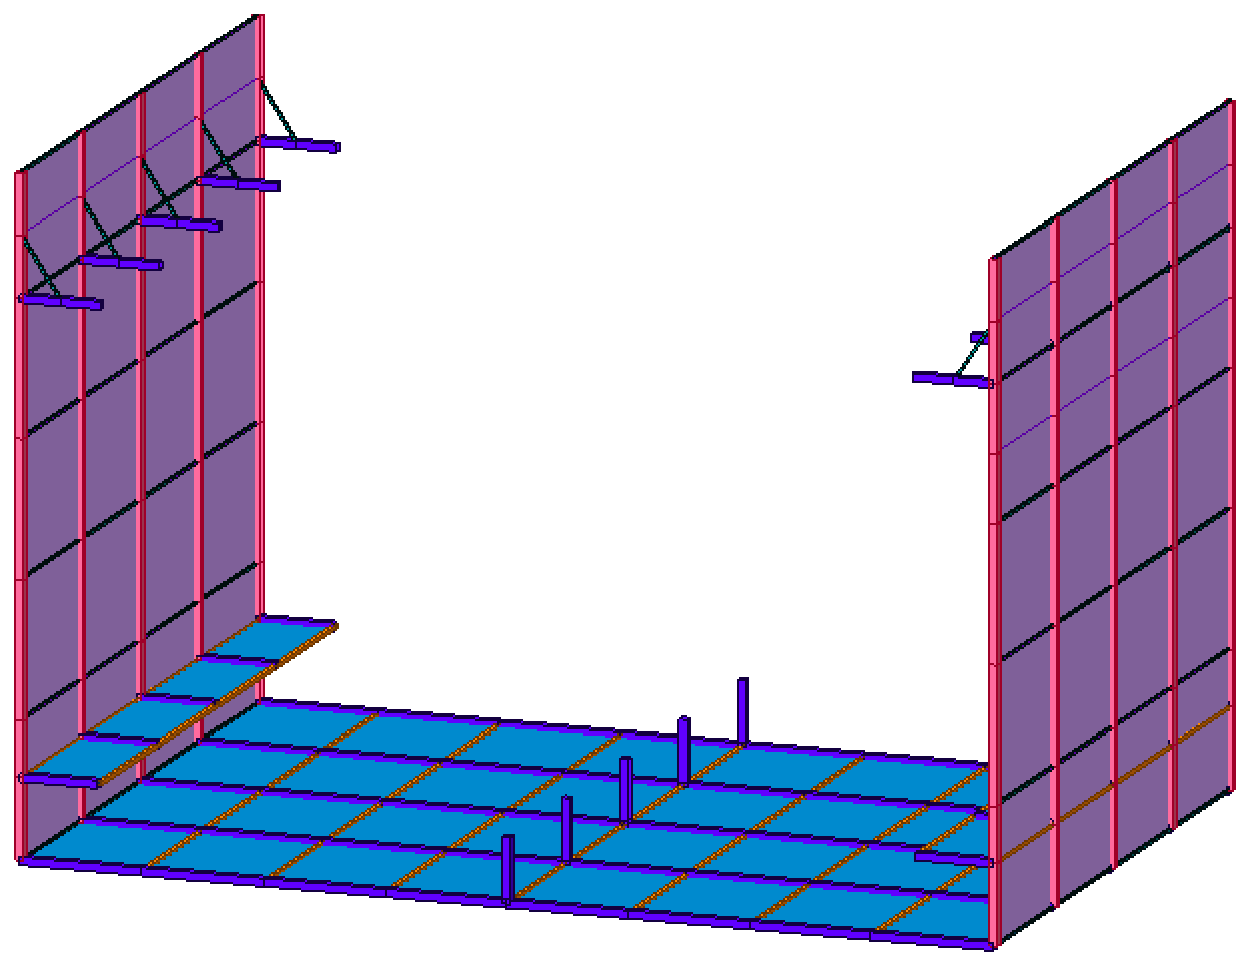
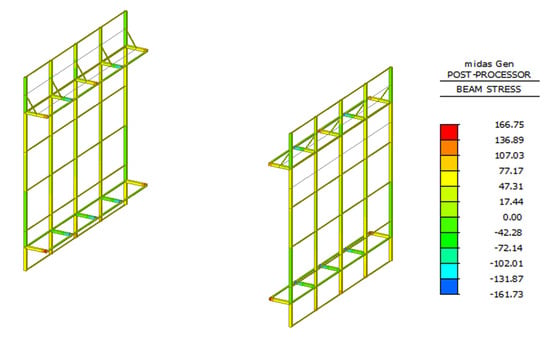
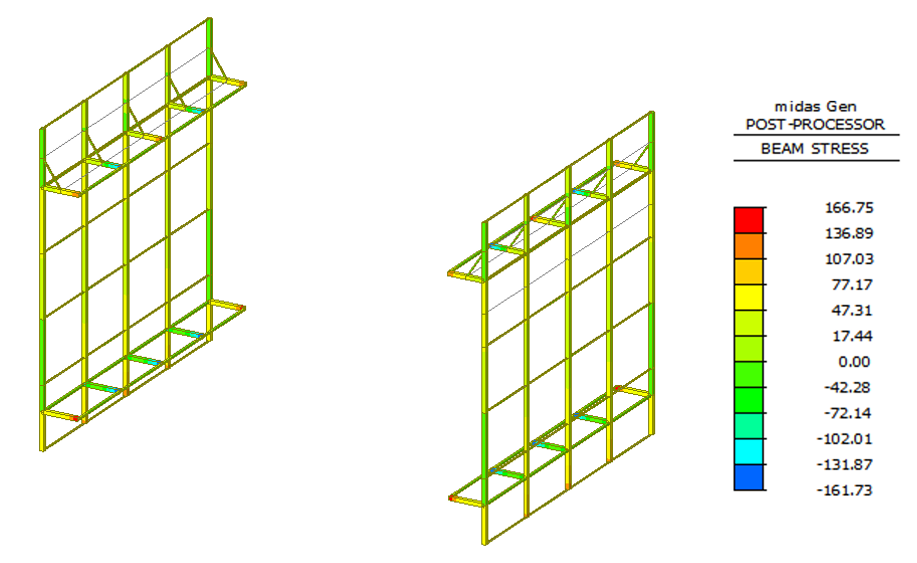
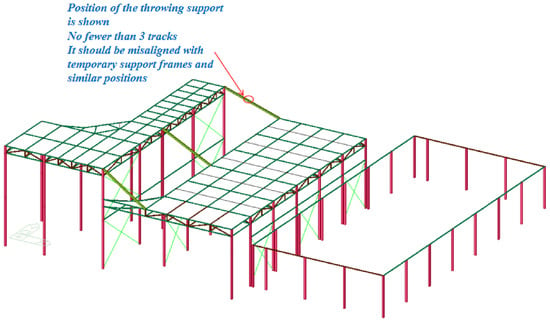
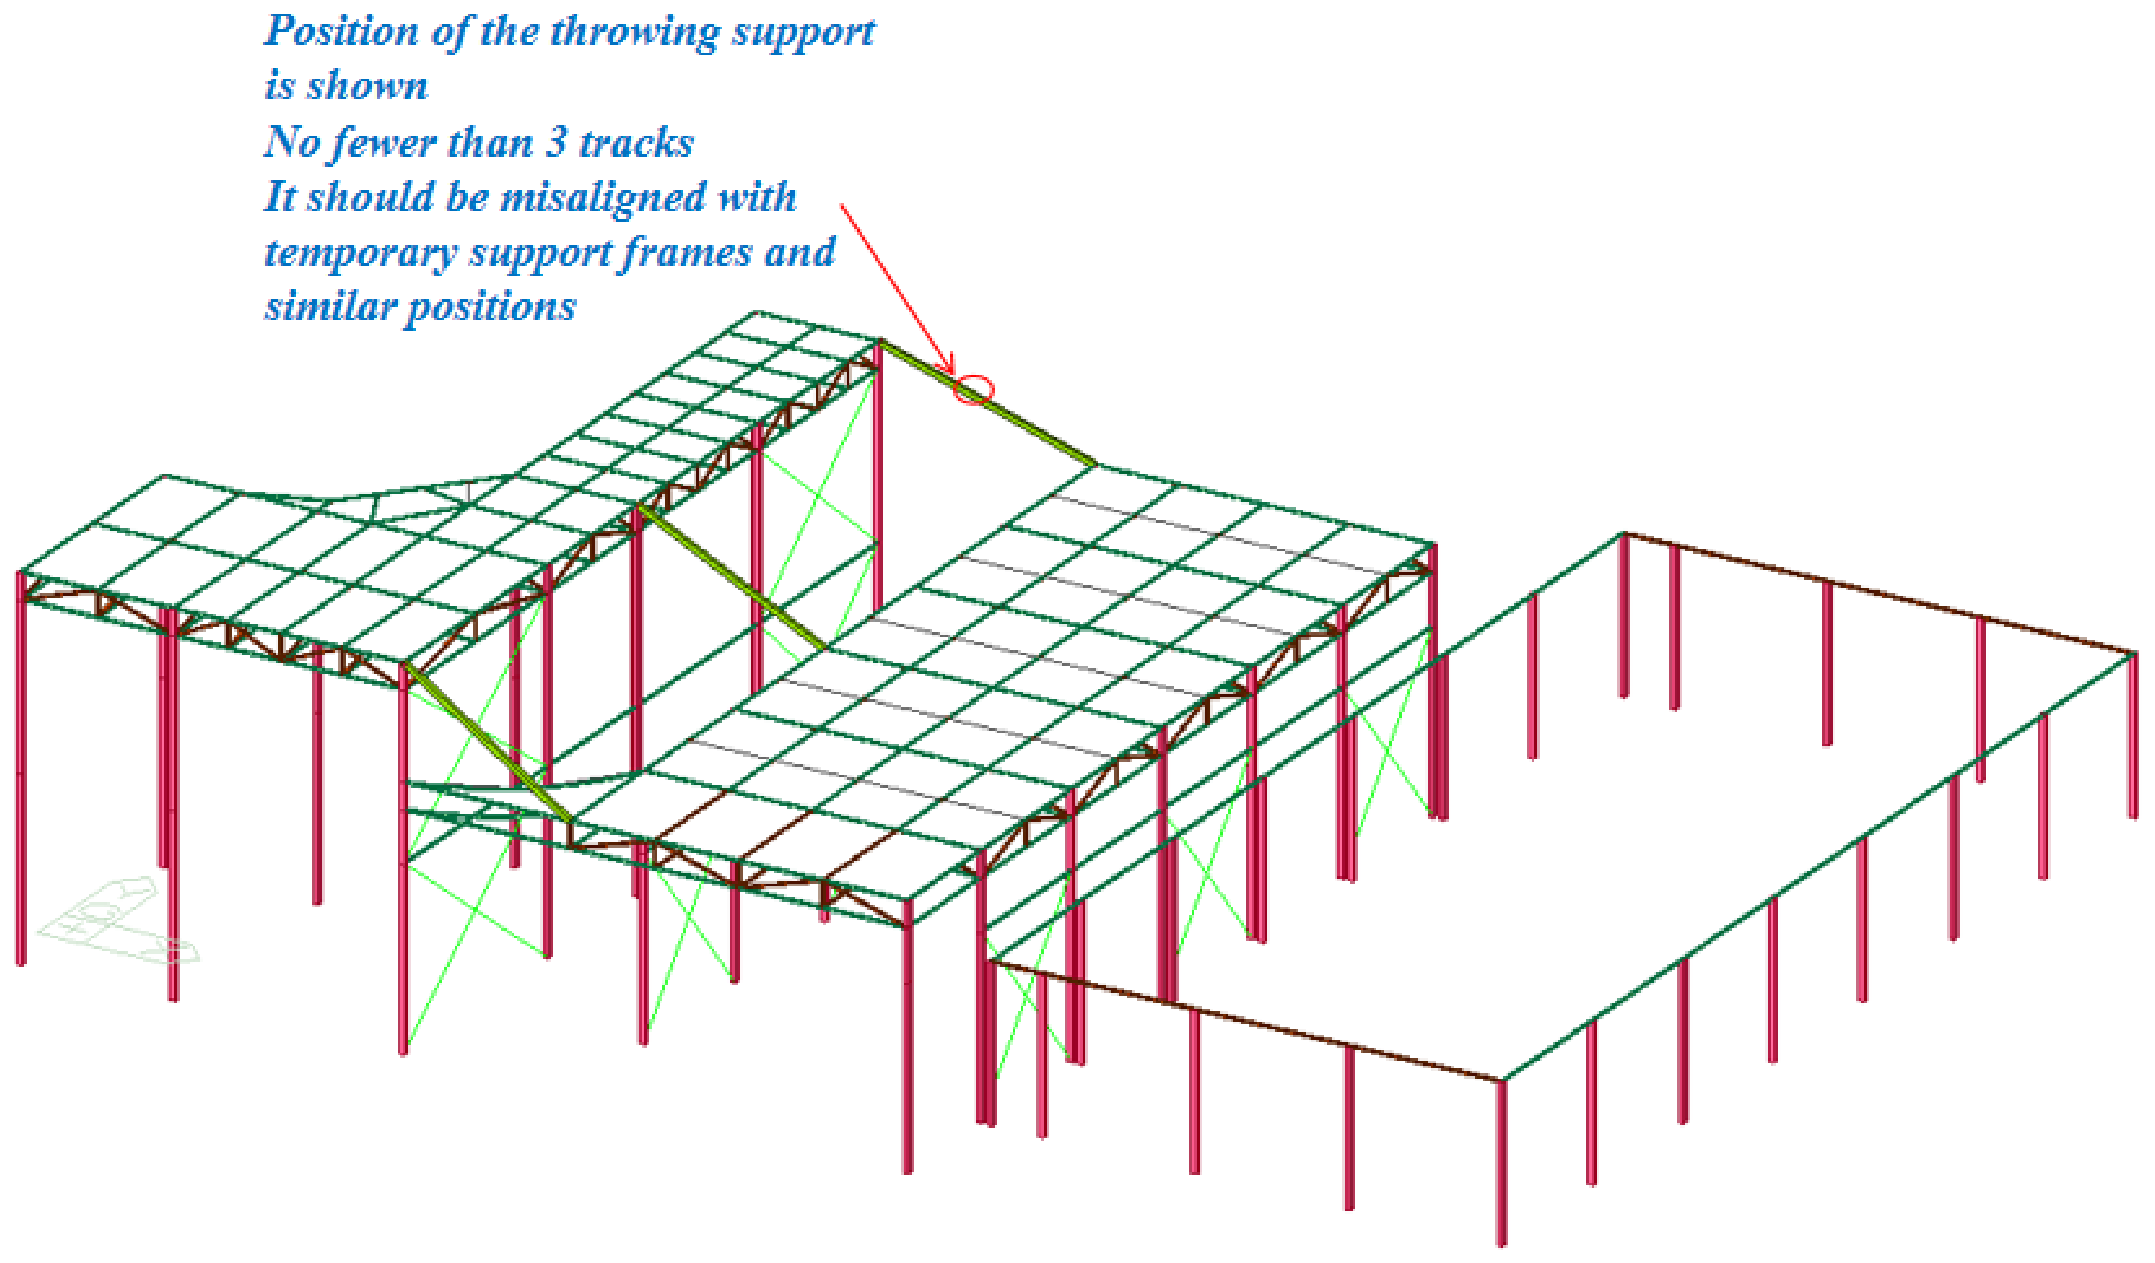
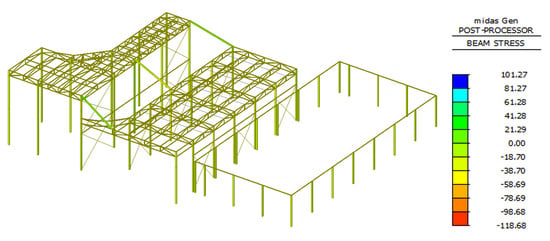
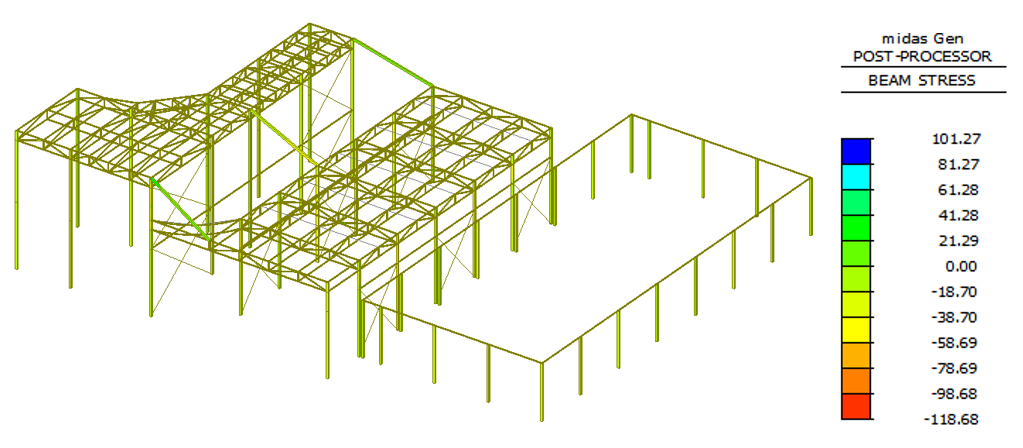
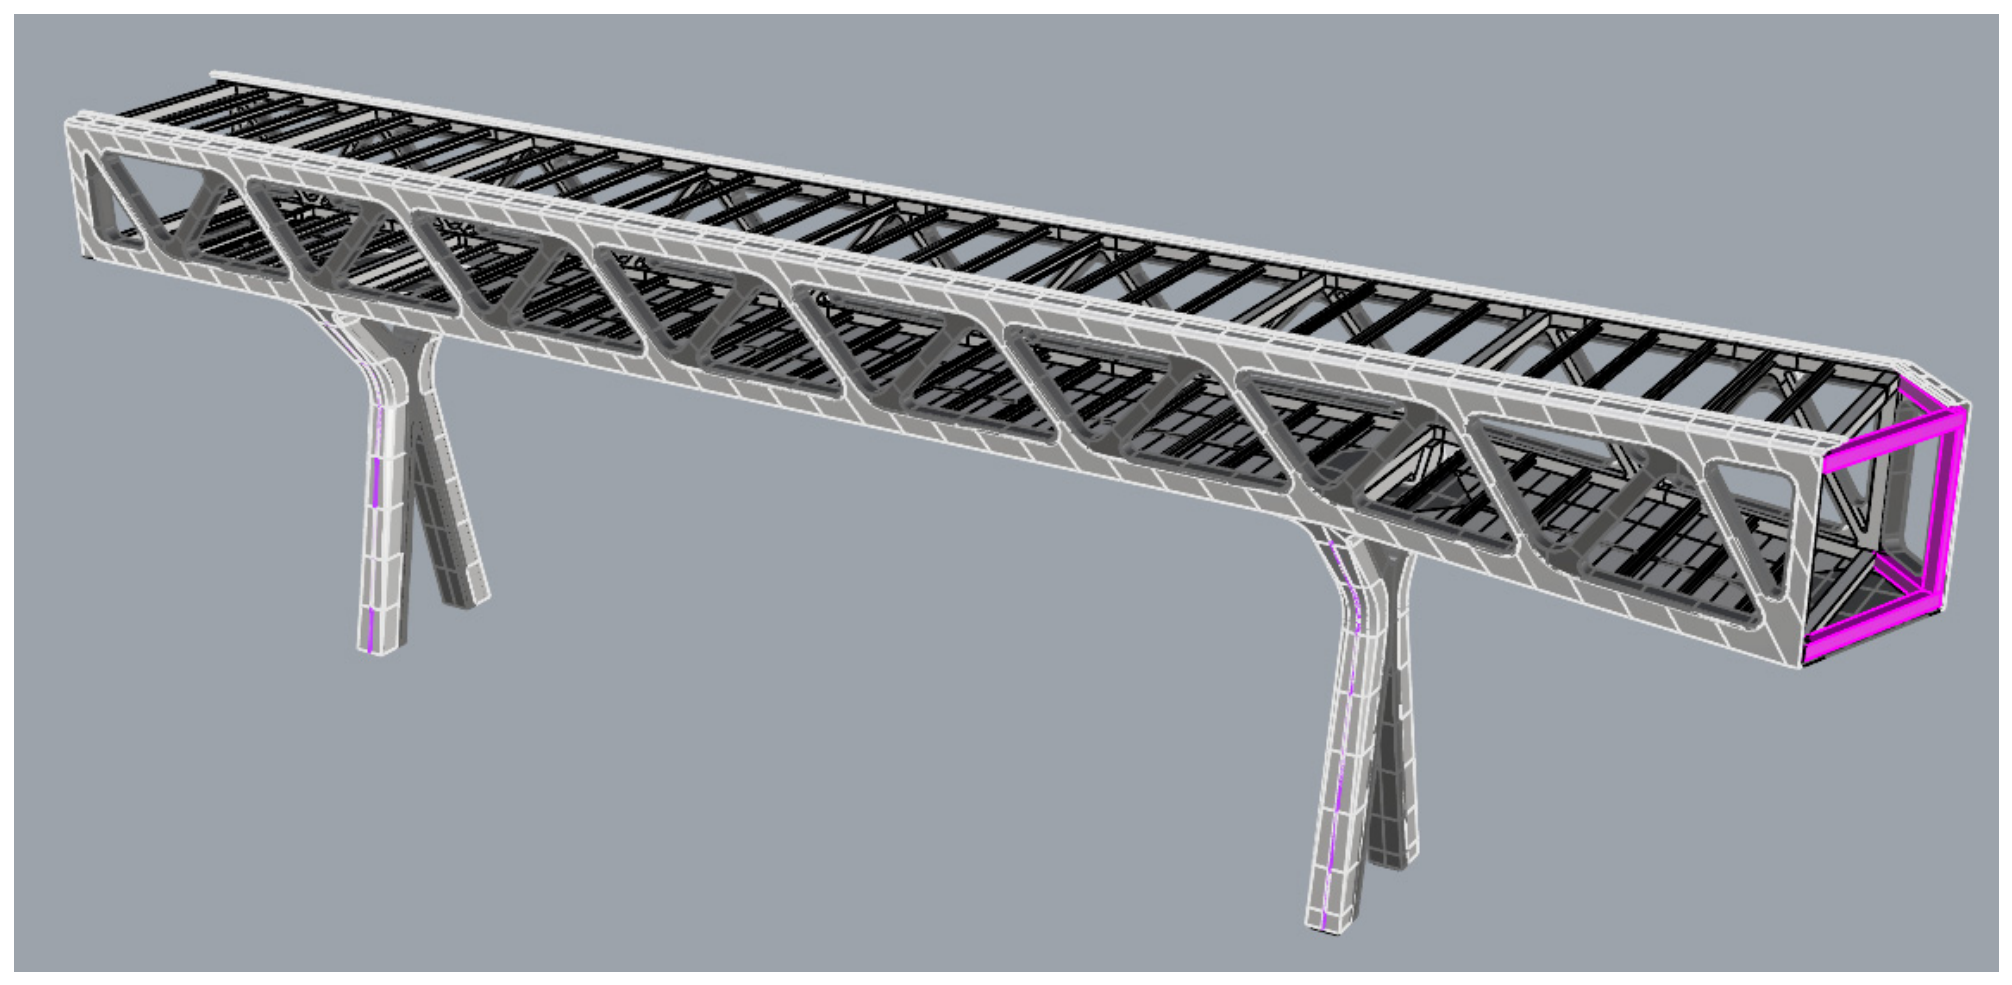
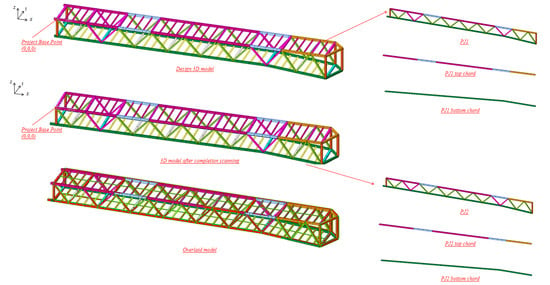
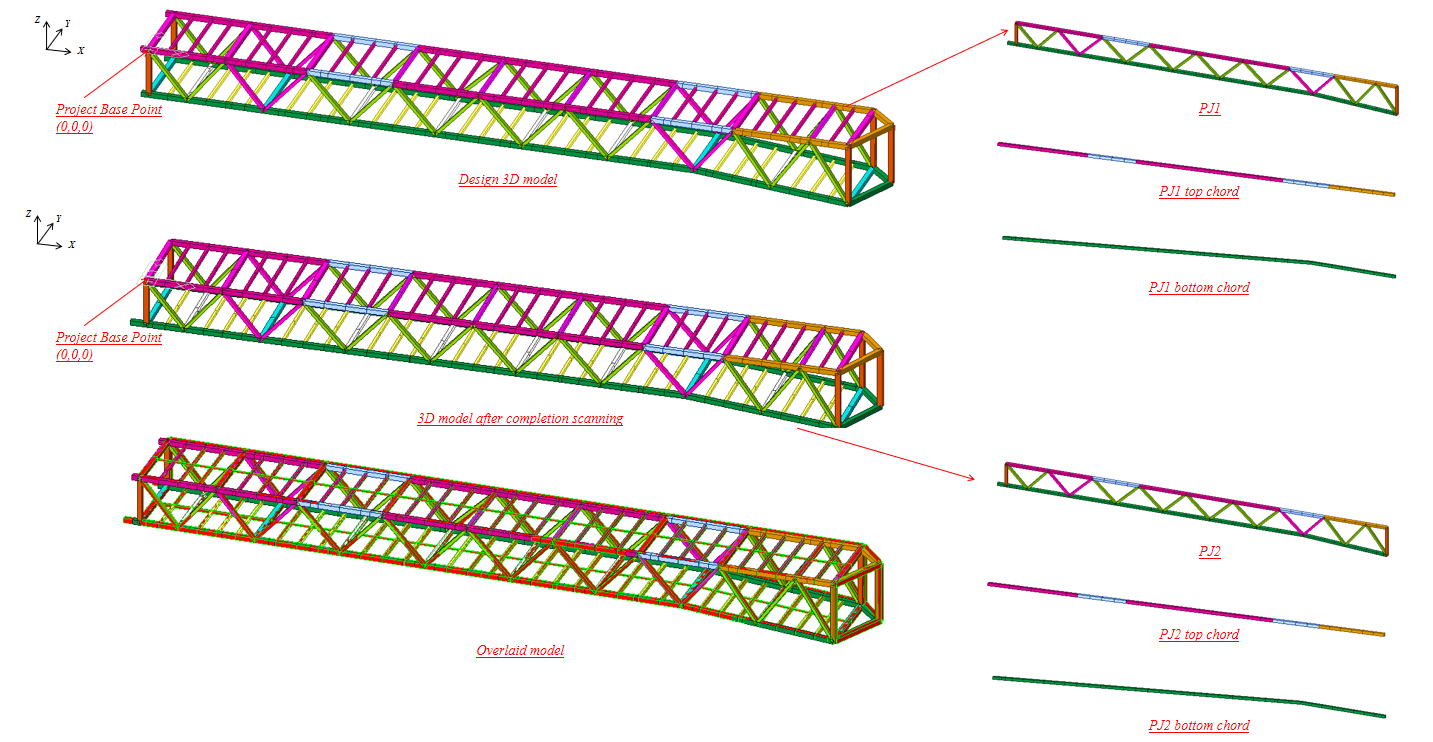

Disclaimer/Publisher’s Note: The statements, opinions and data contained in all publications are solely those of the individual author(s) and contributor(s) and not of MDPI and/or the editor(s). MDPI and/or the editor(s) disclaim responsibility for any injury to people or property resulting from any ideas, methods, instructions or products referred to in the content. |
© 2026 by the authors. Licensee MDPI, Basel, Switzerland. This article is an open access article distributed under the terms and conditions of the Creative Commons Attribution (CC BY) license.