


Abstract
Rapid post-earthquake assessment of reinforced concrete (RC) double-column piers is hindered by incomplete response records and the uncertain relationship between visible damage and global mechanical performance. Using quasi-static tests of two specimens with different transverse reinforcement configurations, hysteretic responses, mechanical degradation, and visible damage were examined. A Physics–Vision Response-Driven Assessment (PV-RDA) framework was proposed to determine performance levels from mechanical responses, constrain plausible performance states using concrete spalling and exposed reinforcement area ratios, and assess cross-evidence compatibility through the minimum performance-level difference. Mechanical degradation and visible damage evolved asynchronously. In specimen P2, which was detailed with spiral reinforcement, normalized secant stiffness decreased to 0.40 before quantifiable spalling or reinforcement exposure was observed. At the final reference points, normalized secant stiffness values were 0.06 and 0.07 for P1 and P2, respectively, despite markedly different spalling area ratios of 37.13% and 12.61%. Across eight representative loading points, all mechanically determined levels fell within the visually supported state sets, yielding zero minimum performance-level differences. However, visual evidence could not uniquely distinguish performance levels. PV-RDA preserves source-specific assessments under incomplete information and enables compatibility checks when both evidence sources are available.
1. Introduction
Bridges are critical infrastructure for post-earthquake emergency response and transportation recovery. Rapid identification of bridge damage and evaluation of residual structural performance are therefore essential for improving post-earthquake resilience [1]. As primary lateral-force-resisting components of bridge structures, RC piers play a critical role in determining post-earthquake bridge serviceability, which is directly affected by the extent of pier damage. Previous performance-based studies have established relationships among pier damage characteristics, deformation demands, and structural performance levels [2]. Compared with single-column piers, the seismic performance of RC double-column piers is influenced by the combined effects of frame action, axial-force redistribution, and coordinated deformation of the columns [3]. In addition, structural details such as transverse connecting beams can affect their seismic performance and vulnerability [4,5]. Therefore, the rapid assessment of RC double-column piers under time constraints and limited information availability remains an important challenge in post-earthquake bridge assessment.
Mechanical response data provide an important basis for assessing post-earthquake damage in bridge piers. Park and Ang [6] developed a seismic damage index for RC members by incorporating maximum deformation and cumulative hysteretic energy dissipation, providing a basis for performance assessment that accounts for deformation demands and accumulated cyclic damage. Goodnight et al. [7] proposed material strain limits based on experimental investigations of RC bridge piers, while Bassam et al. [8] performed quantitative post-earthquake damage assessments using structural deformation histories. Aldabagh et al. [9,10] established and refined drift-ratio limits associated with different damage states of RC bridge piers. These studies have advanced structural performance assessment by incorporating material responses, deformation, and cumulative damage. However, the required indicators depend on experimental or monitoring data, and their applicability may be limited when sensor coverage is insufficient, measurement points are unavailable, or structural response records are incomplete following an earthquake [11]. In contrast, image-based inspection offers advantages such as noncontact data acquisition, ease of deployment, and relatively broad spatial coverage, and has been widely applied to the detection of surface defects in bridges [12]. Cha et al. [13] and Kim et al. [14] applied deep learning to automatic concrete crack detection, while Yan et al. [15] combined unmanned aerial vehicle (UAV) imagery with light detection and ranging (LiDAR) data for crack detection and quantification. Santos et al. [16] further extended vision-based inspection to the identification of exposed reinforcement. In addition, Chen et al. [17] investigated automated detection of multiple damage categories in RC bridges, and Yasmin et al. [18] employed semantic segmentation to identify concrete spalling regions. Bai et al. [19] conducted damage identification and assessment of RC structures using multiscale images, whereas Wang et al. [20] proposed a machine vision-based method for detecting concrete spalling and exposed reinforcement. Collectively, these studies have facilitated the transition from manual qualitative inspection of visible damage to automated detection and quantitative analysis, thereby providing an alternative source of information for rapid post-earthquake assessment.
Visible damage not only reflects localized deterioration of structural components but may also provide information related to structural deformation. Jamshidian and Hamidia [21] estimated the maximum drift ratio of RC columns using crack-image complexity, while Aydin et al. [22] predicted the maximum drift demand of earthquake-damaged RC columns based on residual flexural cracks. Building on these findings, the combined use of visual information and structural analysis has been further explored. Tazarv et al. [23] integrated computer vision-based recognition with seismic analysis and used an experimental database to establish relationships between visible damage and displacement demands for assessing the post-earthquake serviceability of RC bridge piers. Wang et al. [24] combined UAV photogrammetry, three-dimensional reconstruction, and structural analysis to perform rapid seismic risk assessment of bridges. Related research has also highlighted the potential of visual and machine learning-based approaches for assessing earthquake-damaged RC structures [25]. However, visible damage and mechanical performance do not necessarily evolve synchronously, and their relationship is influenced by the stage of damage development, structural detailing, and loading history. Material nonlinearity and stiffness degradation may develop during the early stages of structural damage, before concrete spalling and exposed reinforcement become consistently identifiable. Consequently, local visible damage alone may be insufficient to fully characterize structural performance.
Recent advances in multisource information fusion and physics-informed analysis have provided new opportunities for integrating heterogeneous evidence. Teng et al. [26] investigated structural damage identification through multi-sensor and decision-level fusion, while Hassani et al. [27] systematically reviewed data fusion methods in structural health monitoring. Related studies have further examined fusion strategies for heterogeneous information and the joint use of multimodal sensing data in bridge applications [28,29]. Zhang et al. [30] incorporated physical constraints into seismic response prediction, while Wang et al. [31] employed physics-guided neural networks for structural damage identification. These studies provide methodologies for improving the physical consistency of data-driven analyses. Despite these advances, visual and mechanical evidence differ in observation scale, sensitivity to damage development, and data availability. These differences make it difficult to relate visible damage directly to structural performance, particularly when post-earthquake information is incomplete. A key challenge is therefore to preserve the independent assessment capability of each evidence source while enabling performance-level comparisons and consistency checks.
To address these challenges, a Physics–Vision Response-Driven Assessment (PV-RDA) framework is proposed for the rapid post-earthquake assessment of RC double-column piers. First, the evolution of hysteretic response, mechanical performance degradation, and macroscopic visible damage is examined using quasi-static test data from two RC double-column pier specimens with different transverse reinforcement configurations. The relationships and differences between mechanical and visual evidence across different stages of damage development are then investigated. On this basis, a unified performance-level system is established, in which the structural performance level is determined from mechanical responses, while the range of plausible performance states is constrained by visual evidence of concrete spalling and exposed reinforcement. A cross-evidence consistency check is subsequently performed to examine the compatibility between the two assessment outcomes. Finally, eight representative loading points are selected from the two specimens to examine the assessment outputs and applicability of the proposed framework under different information availability conditions, providing a methodological reference for the post-earthquake performance assessment of RC double-column piers when information is limited.
2. Experimental Program
2.1. Specimens and Loading Protocol
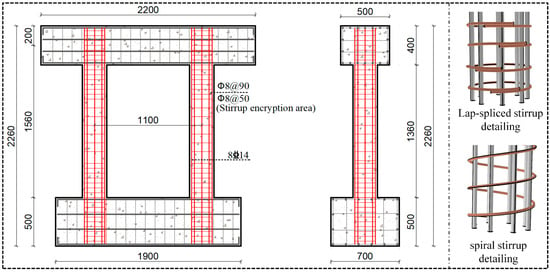
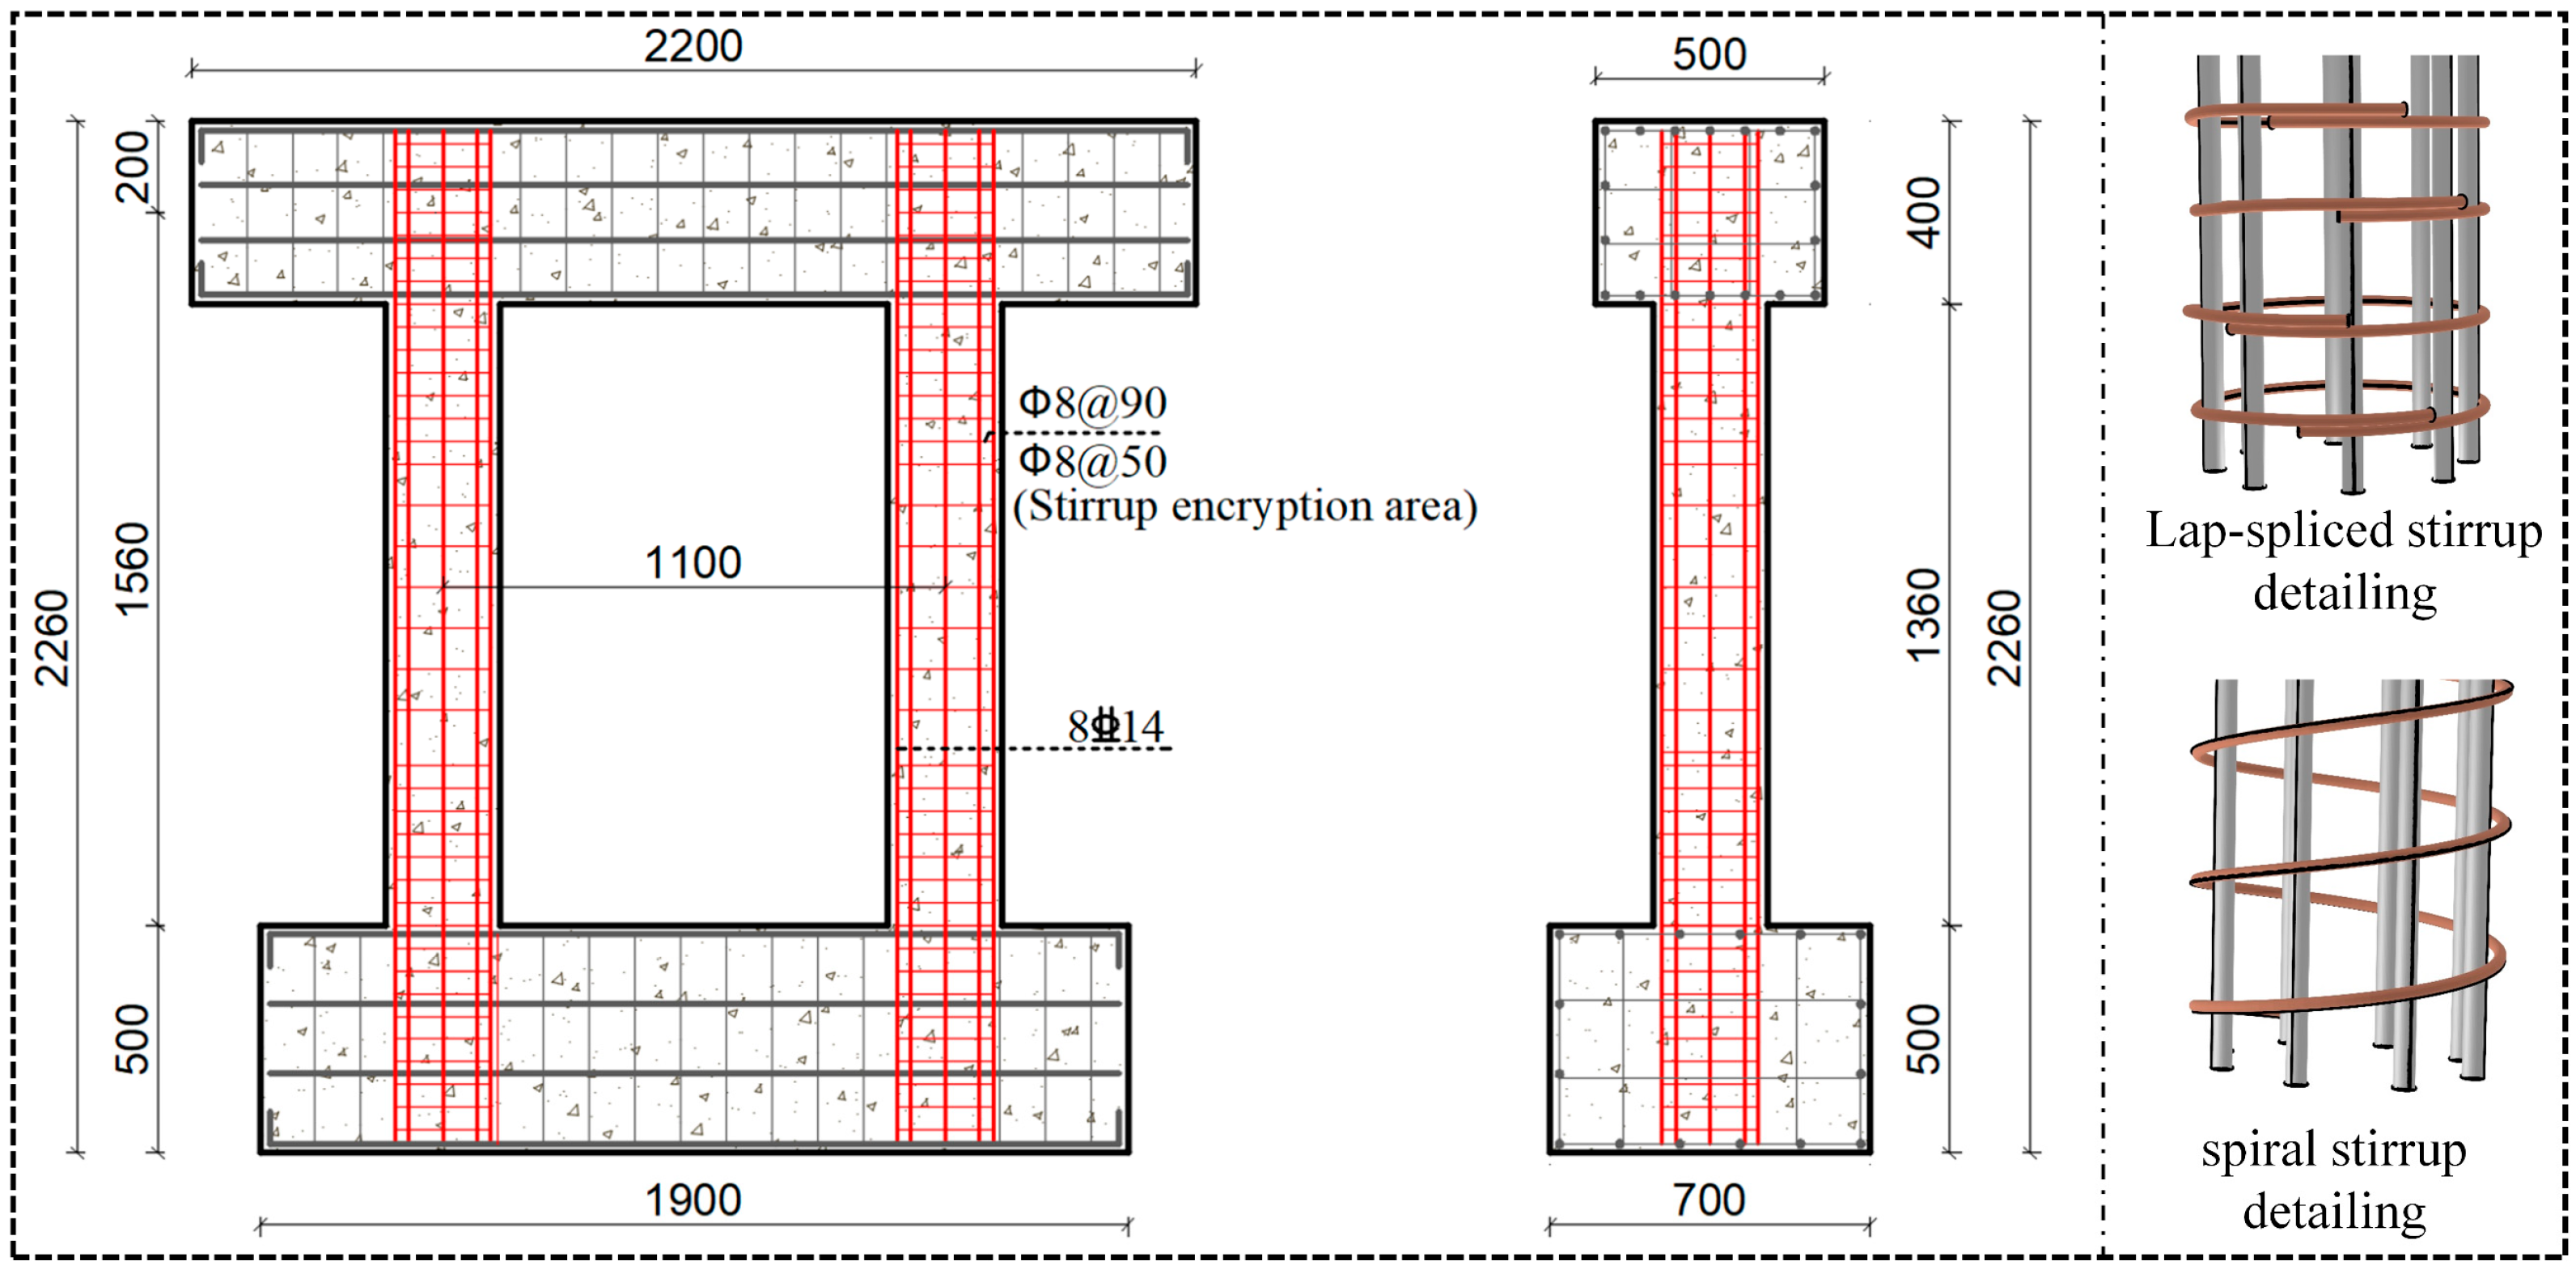
To investigate the mechanical behavior and evolution of visible damage in RC double-column piers under cyclic loading, two specimens with different transverse reinforcement configurations, designated P1 and P2, were selected for analysis. The geometric dimensions and reinforcement details are shown in Figure 1. The specimens had identical geometric dimensions and longitudinal reinforcement details but differed in the transverse reinforcement configurations within their plastic hinge regions. Specimen P1 was detailed with lap-spliced transverse hoops, whereas specimen P2 was detailed with spiral reinforcement.
Figure 1.
Geometric dimensions and reinforcement details of the specimens.
Both specimens had a pier height of 1360 mm and a column diameter of 250 mm. Each column was reinforced with eight HRB400 longitudinal bars, each 14 mm in diameter, corresponding to a longitudinal reinforcement ratio of 2.51%. Transverse reinforcement consisted of 8 mm-diameter HPB300 bars spaced at 90 mm in the noncritical regions. Within the potential plastic hinge regions extending 350 mm from the top and bottom of the columns, the transverse reinforcement spacing was reduced to 50 mm. The two specimens had identical principal structural detailing parameters, allowing the mechanical responses and development of visible damage under different transverse reinforcement confinement configurations to be compared.
A constant vertical load was maintained during lateral low-cycle reversed loading, with a design axial load ratio of 0.15, corresponding to a total vertical load of 140.64 kN applied to the double-column pier specimen. The vertical load was applied through a hydraulic jack and a load-distribution beam positioned above the cap beam, while the lateral load was imposed by a cyclic loading actuator mounted on the reaction wall. The footing was anchored to the laboratory strong floor. Preloading was performed before the formal test to verify the operating condition of the loading system and measurement instruments. Before yielding of the longitudinal reinforcement, force-controlled loading was used, with one cycle applied at each load level. After yielding, displacement-controlled loading was adopted, with the displacement amplitude increased incrementally in multiples of the yield displacement and three cycles applied at each displacement level. The test was terminated when the lateral load-carrying capacity decreased to 85% of its peak value or when the specimen could no longer sustain the prescribed axial load.
During testing, the lateral load, displacements of the cap beam, reinforcement and concrete strains in the plastic hinge regions, and visible damage at each loading stage were recorded. Mechanical response characteristics, including hysteresis loops, backbone curves, stiffness degradation, and cumulative hysteretic energy dissipation, were extracted from the recorded load–displacement data. These characteristics were analyzed together with damage images obtained at the corresponding loading stages to examine the relationship between local damage and changes in global structural performance. Quasi-static loading can characterize damage accumulation and load-carrying capacity degradation under controlled cyclic deformation, but does not directly reproduce the accelerations, inertial effects, or irregular ground-motion histories associated with earthquakes. Accordingly, the tests were used primarily to evaluate the evolution of mechanical and visual damage evidence under cyclic loading.
2.2. Mechanical and Visual Indicators
The performance evolution of RC double-column piers under low-cycle reversed loading is characterized by increasing deformation, degradation of secant stiffness, changes in load-carrying capacity, and accumulation of hysteretic energy dissipation. In the mechanics-based pathway, pier-top drift ratio, a normalized secant stiffness indicator rK, a normalized lateral load-carrying capacity indicator rF, and cumulative hysteretic energy dissipation were used to characterize performance and its evolution with loading history. At the i loading point, the mechanical evidence vector is defined as follows:
Here, δi denotes the pier-top drift ratio; rK,i and rF,I denote the normalized indicators of stiffness degradation and load-carrying capacity, respectively; and Eh,i denotes the cumulative hysteretic energy dissipated up to the current loading level.
The pier-top drift ratio was calculated as the ratio of the lateral displacement at the pier top to the column height. Secant stiffness was calculated from the positive and negative load extrema and their corresponding displacements within the cycles at each loading level. The secant stiffness at the first loading level of each specimen was used as the reference value for normalization. The initial reference secant stiffness values were 27.81 kN/mm for P1 and 26.11 kN/mm for P2, respectively. The lateral load-carrying capacity indicator was obtained using the point-selection procedure adopted for the backbone curve. At each loading level, the mean of the absolute loads at the positive and negative displacement reversal points of the first cycle was taken as the representative lateral load. The normalized load-carrying capacity indicator rF was defined as the ratio of the representative lateral load at the current loading level to the mean of the absolute historical maximum loads at the positive and negative displacement reversal points up to that level. Cumulative hysteretic energy dissipation was taken as the total energy dissipated after completion of all cycles at the target loading level. Together, these indicators characterize structural deformation, stiffness degradation, changes in load-carrying capacity, and the accumulation of cyclic damage.
The concrete spalling area ratio ηs and exposed reinforcement area ratio ηr, established in previous research [32], were adopted as the visual damage indicators. These two indicators characterize the extent of cover concrete spalling and exposed reinforcement within the observed region, respectively. The visual indicator vector is expressed as follows:
The experimental images and mechanical response records were matched according to their corresponding loading stages. Unlike mechanical indicators, which characterize global force resistance and deformation, the visual area ratios describe only the macroscopic damage within the image-covered region and do not directly represent the overall residual load-carrying capacity of the structural component.
2.3. Performance-Level Criteria
To compare mechanical responses and visible damage across different loading stages, four structural performance levels were adopted: Immediate Occupancy (S1), Limited Serviceability (S2), Service Interruption (S3), and Life Safety (S4). These four levels are used to characterize the progression from relatively limited global nonlinear response through the development of plastic deformation to post-peak load-carrying capacity degradation and severe local damage. The corresponding global mechanical response and damage characteristics are summarized in Table 1.
Table 1.
Performance levels and reference criteria for RC double-column piers.
Because the first yielding of local reinforcement does not necessarily coincide with global equivalent yielding of the structure, the boundaries between performance stages were determined from the global load–displacement response. First, the equivalent yield displacement Δy was determined using the equal-energy method, and the peak displacement Δm was obtained from the backbone curve constructed using the peak points of the first cycle at each loading level. The response was classified as S1 before the pier-top displacement reached the global equivalent yield displacement, whereas the interval between equivalent yielding and the backbone-curve peak was classified as S2. The post-peak response was classified as S3 while the normalized load-carrying capacity remained at or above 0.85, and as S4 when rF fell below 0.85. The value of 0.85 was adopted as the post-peak load-carrying capacity degradation threshold in the present tests. Normalized secant stiffness and cumulative hysteretic energy dissipation were used to characterize structural performance degradation and damage accumulation across different loading stages.
3. Experimental Results
3.1. Hysteretic Response and Degradation
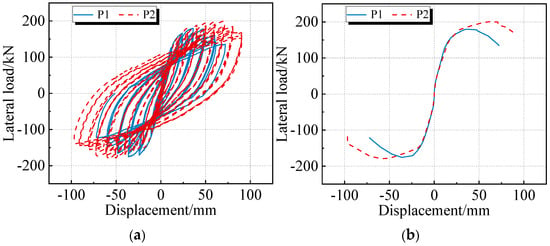
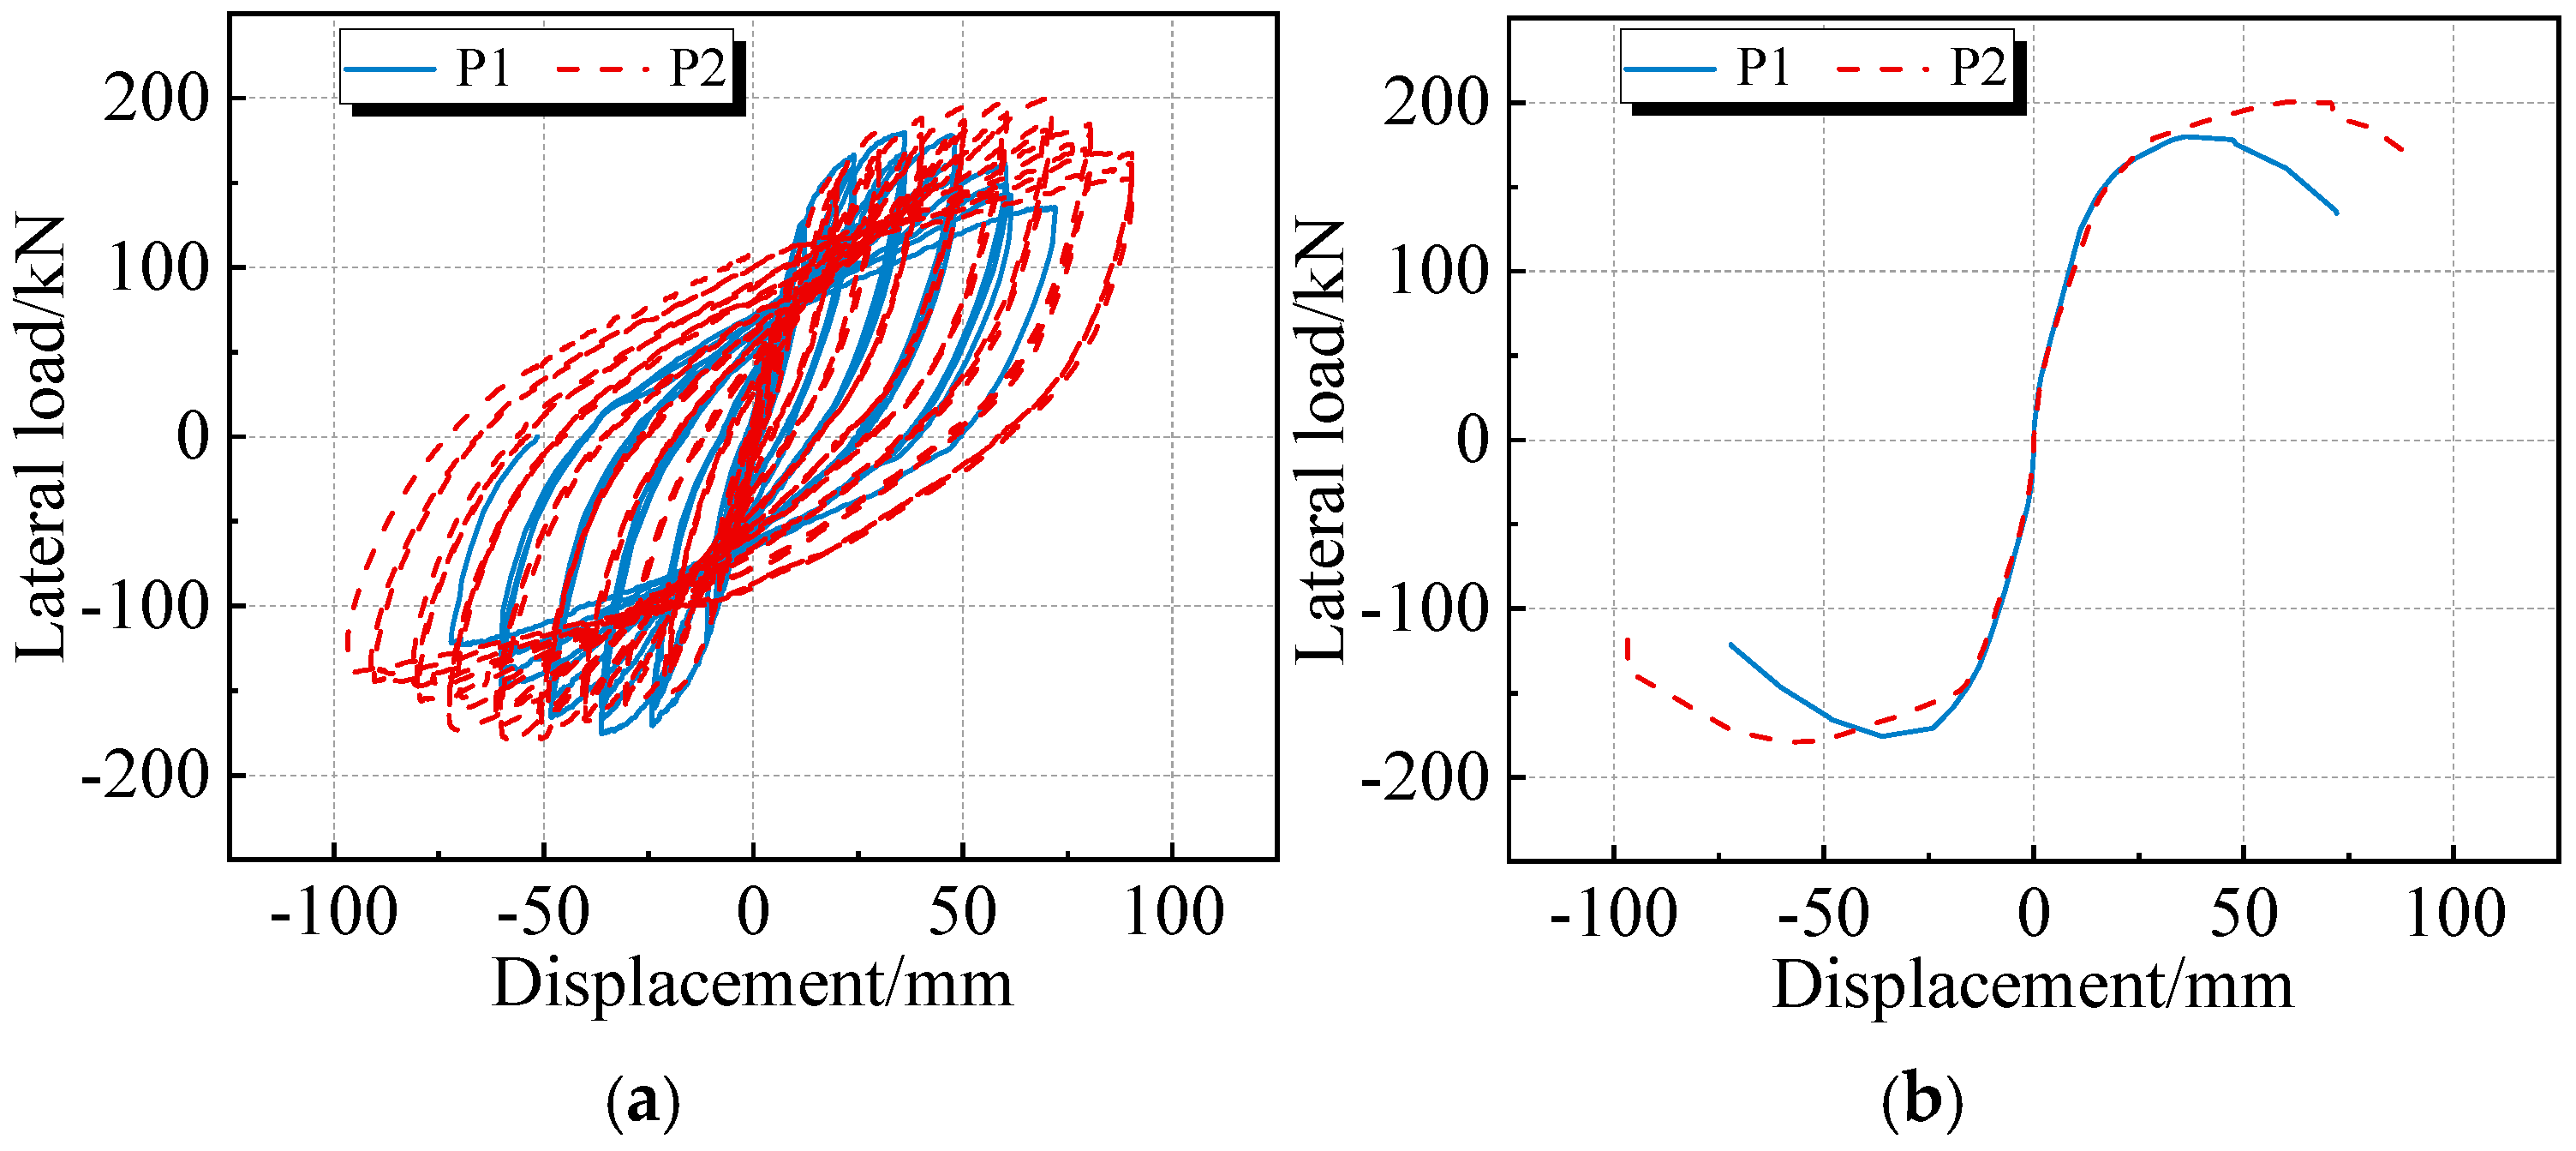
Both specimens P1 and P2 exhibited flexure-dominated behavior under lateral low-cycle reversed loading. As shown in Figure 2a, the load–displacement hysteresis loops of both specimens exhibited relatively full, spindle-shaped profiles with some degree of pinching. During the initial loading stages, the lateral load varied approximately linearly with pier-top displacement, and the hysteresis loops enclosed relatively small areas. As displacement increased, the longitudinal reinforcement progressively yielded, the specimens entered the elastoplastic response stage, and the hysteresis loop areas increased, indicating greater energy dissipation associated with cyclic plastic deformation. At larger displacement amplitudes, both specimens exhibited pronounced stiffness degradation and post-peak reductions in load-carrying capacity, although differences were observed in their deformation capacities during the later loading stages. Figure 2b presents the backbone curves of both specimens, which exhibit an ascending branch, nonlinear development near the peak, and a post-peak descending branch.
Figure 2.
Experimental lateral load–displacement responses of specimens P1 and P2: (a) hysteretic curves; (b) backbone curves. Blue solid lines represent P1, and red dashed lines represent P2.
The backbone curves were constructed using the positive and negative peak loads recorded during the first cycle at each loading level, and the equivalent yield displacements were determined using the equal-energy method. As summarized in Table 2, the mean equivalent yield displacements were 17.50 mm and 24.00 mm, the mean backbone-curve peak displacements were 42.17 mm and 55.84 mm, and the peak loads were 175.20 kN and 177.87 kN for P1 and P2, respectively. Although the two specimens exhibited similar peak load-carrying capacities, both the equivalent yield displacement and backbone-curve peak displacement were greater for P2 than for P1, indicating a greater deformation capacity before reaching the peak load in the specimen with spiral reinforcement.
Table 2.
Characteristic mechanical response parameters of specimens P1 and P2.
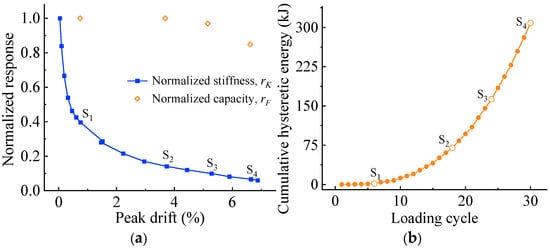
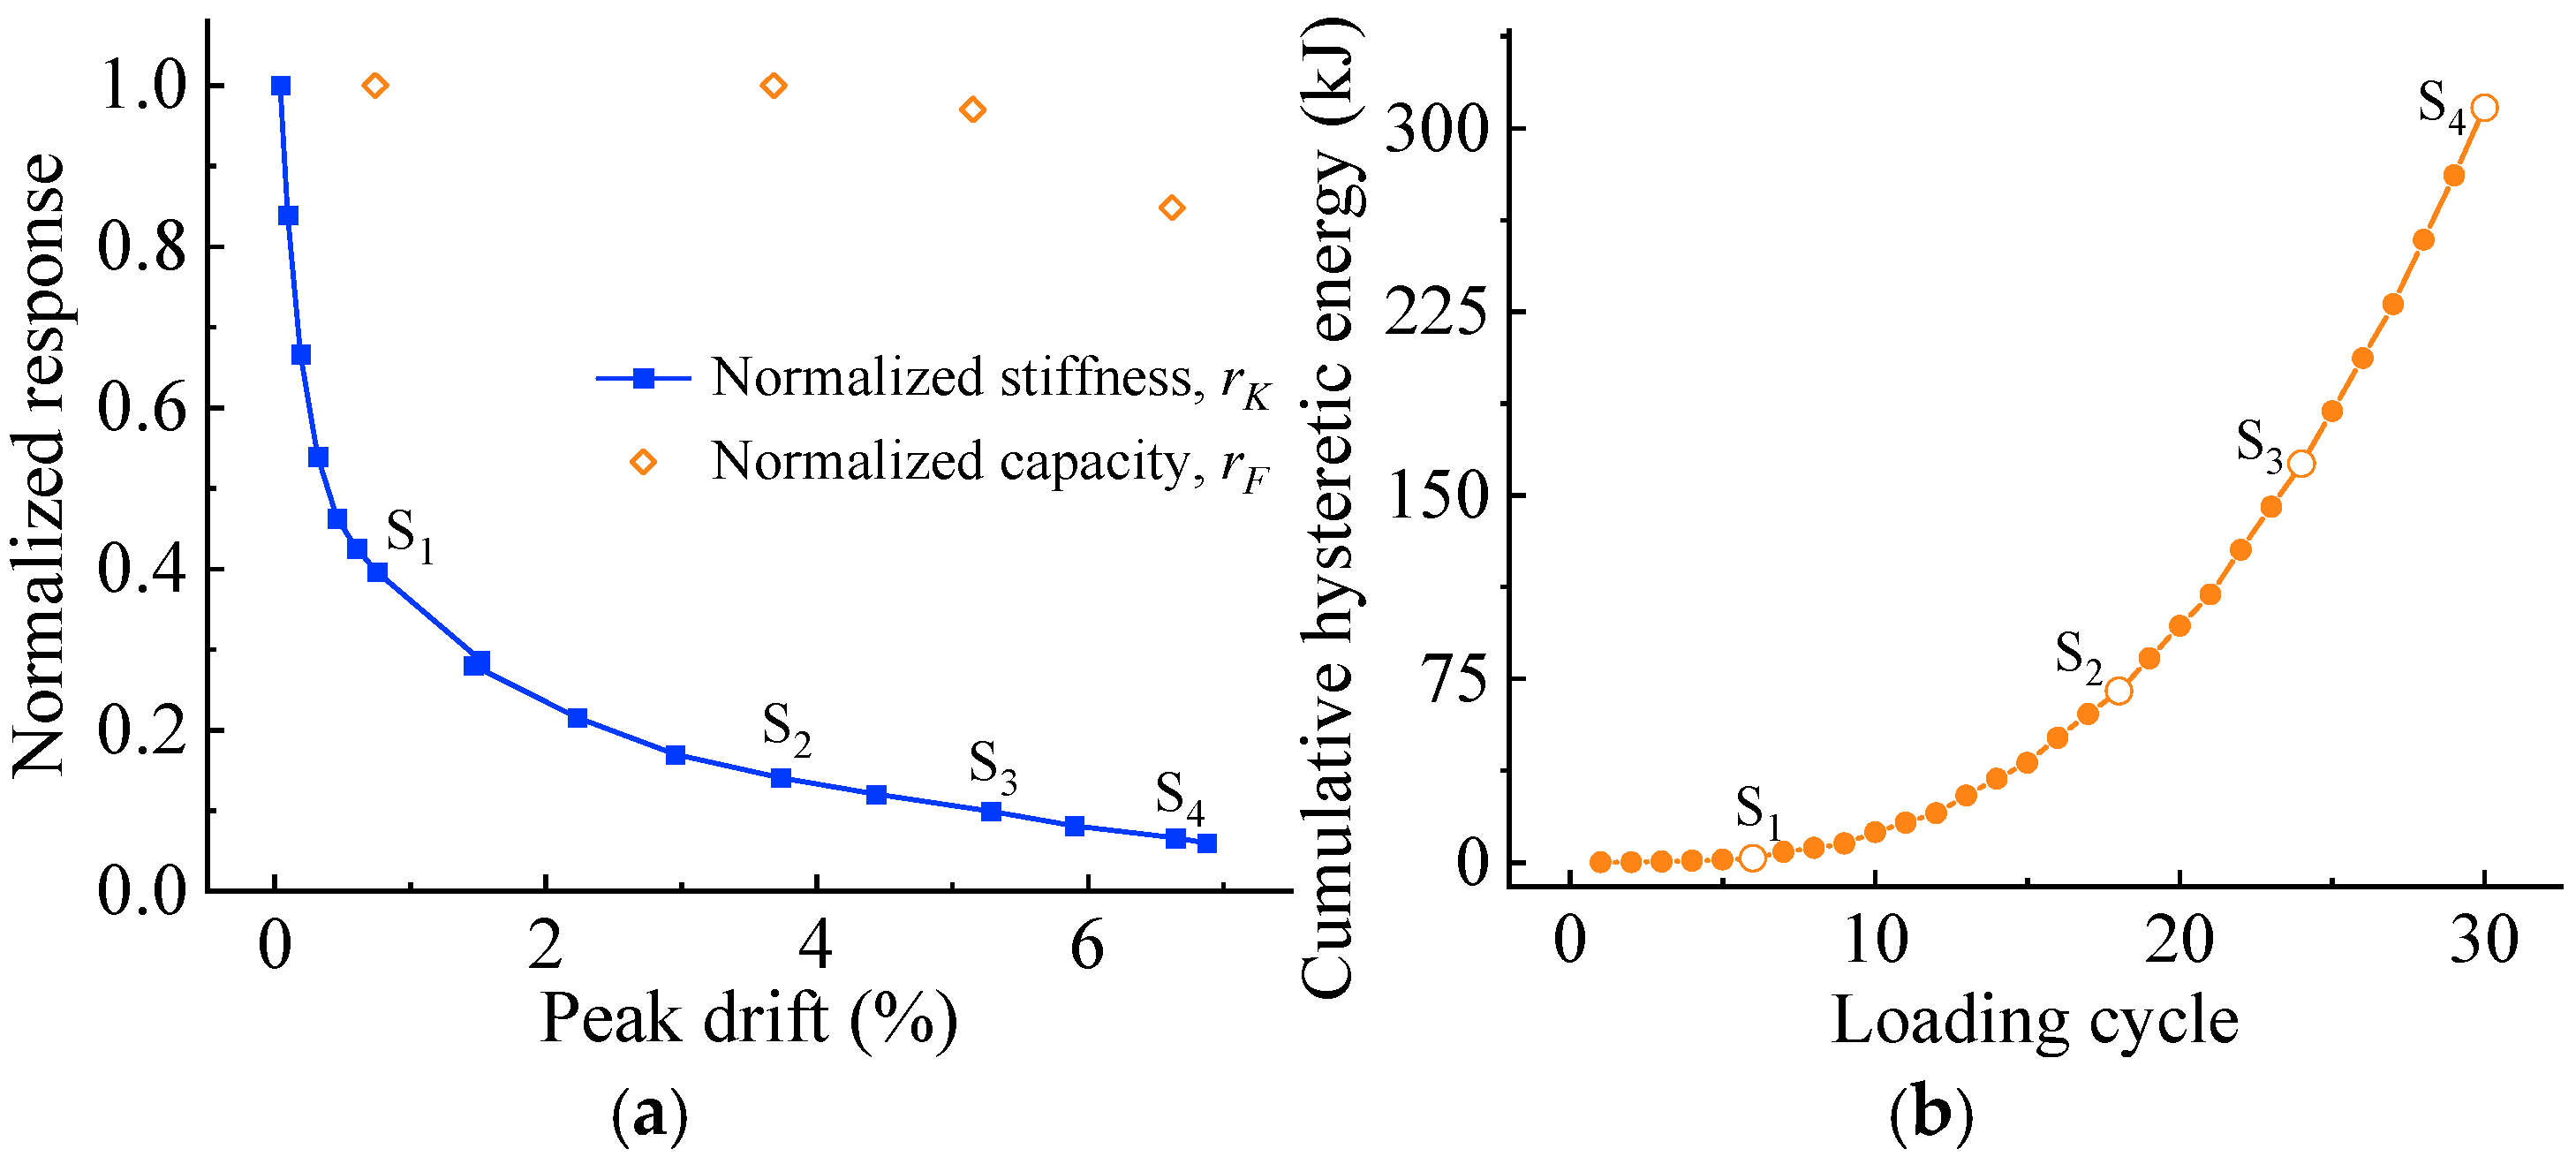
The secant stiffness of both specimens decreased progressively with increasing cyclic displacement amplitudes. The secant stiffness at the first loading level was used as the reference value for each specimen, giving initial reference stiffness values of 27.81 kN/mm for P1 and 26.11 kN/mm for P2. At representative later loading stages, the normalized secant stiffness of both specimens had decreased to approximately 0.10 or less. For specimen P2, as shown in Figure 3a, the normalized secant stiffness decreased continuously with increasing displacement, reaching 0.14, 0.10, and 0.07 at the S2, S3, and S4 reference points, respectively. The corresponding normalized load-carrying capacity indicators were 1.000, 0.970, and 0.848, indicating that substantial stiffness degradation preceded the pronounced reduction in load-carrying capacity. At both the S1 and S2 reference points, the normalized load-carrying capacity indicator was 1.000, indicating that the representative lateral load reached the historical peak level up to the corresponding loading point. Specimen P1 exhibited a similar degradation trend, with normalized load-carrying capacity indicators of 0.849 and 0.730 at the S3 and S4 reference points, respectively. Notably, the value at the S3 reference point was slightly below the adopted post-peak threshold of 0.85.
Figure 3.
Mechanical response evolution of specimen P2 under cyclic loading: (a) normalized secant stiffness evolution and normalized load-carrying capacity at selected loading points; (b) cumulative hysteretic energy dissipation versus loading cycle.
The energy dissipation responses of both specimens provided further information on damage accumulation during cyclic loading. As shown in Figure 3b, the cumulative hysteretic energy dissipation of P2 increased continuously with the number of loading cycles, from 1.66 kJ at the S1 reference point to 308.41 kJ at the S4 reference point. At the end of testing, the final cumulative hysteretic energy dissipation values were 115.25 kJ for P1 and 308.41 kJ for P2. Specimen P2 underwent more loading cycles at larger displacement amplitudes, resulting in a higher final cumulative hysteretic energy dissipation. It should be noted that cumulative hysteretic energy dissipation depends on displacement amplitude, the number of loading cycles, and loading history. Therefore, differences in final cumulative energy dissipation alone cannot be used to directly compare the energy dissipation capacities of the two specimens under identical deformation conditions. In this study, cumulative hysteretic energy dissipation was used primarily to characterize energy dissipation during cyclic loading, complementing the information provided by stiffness degradation and changes in load-carrying capacity.
Overall, P1 and P2 exhibited similar trends in global mechanical response evolution, but differences were observed in equivalent yielding, peak deformation, and post-peak degradation. Secant stiffness degradation reflected the development of structural nonlinearity at relatively early stages, whereas load-carrying capacity degradation primarily characterized post-peak performance deterioration. Cumulative hysteretic energy dissipation provided a record of energy dissipation throughout cyclic loading. These findings indicate that changes in global structural performance are stage-dependent and should be evaluated by considering multiple mechanical indicators together with their loading histories. They also provide a basis for the subsequent comparison between macroscopic visible damage and global mechanical degradation.
3.2. Visible Damage Evolution
Under lateral low-cycle reversed loading, both specimens P1 and P2 exhibited progressive damage characterized by crack initiation and propagation, cover concrete spalling, and reinforcement exposure. During the initial loading stages, fine horizontal cracks first appeared near the tops and bases of the columns. As the imposed displacement increased, existing cracks gradually widened and propagated into adjacent regions, while diagonal cracks developed locally, forming an interconnected crack network. At larger displacement amplitudes, cover concrete spalling began to develop in the plastic hinge regions, followed by progressive exposure of transverse and longitudinal reinforcement and further development of severe local damage. Although the overall damage progression was similar in both specimens, differences in the confinement provided by their transverse reinforcement configurations were associated with variations in the severity and spatial extent of local damage within the plastic hinge regions.
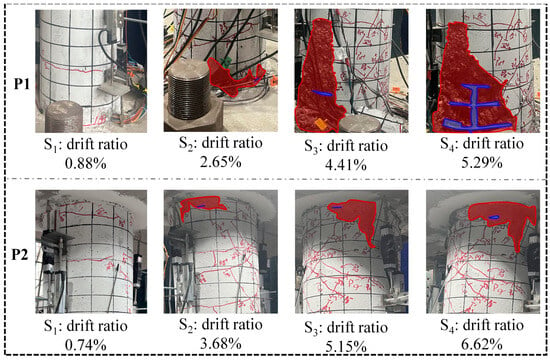
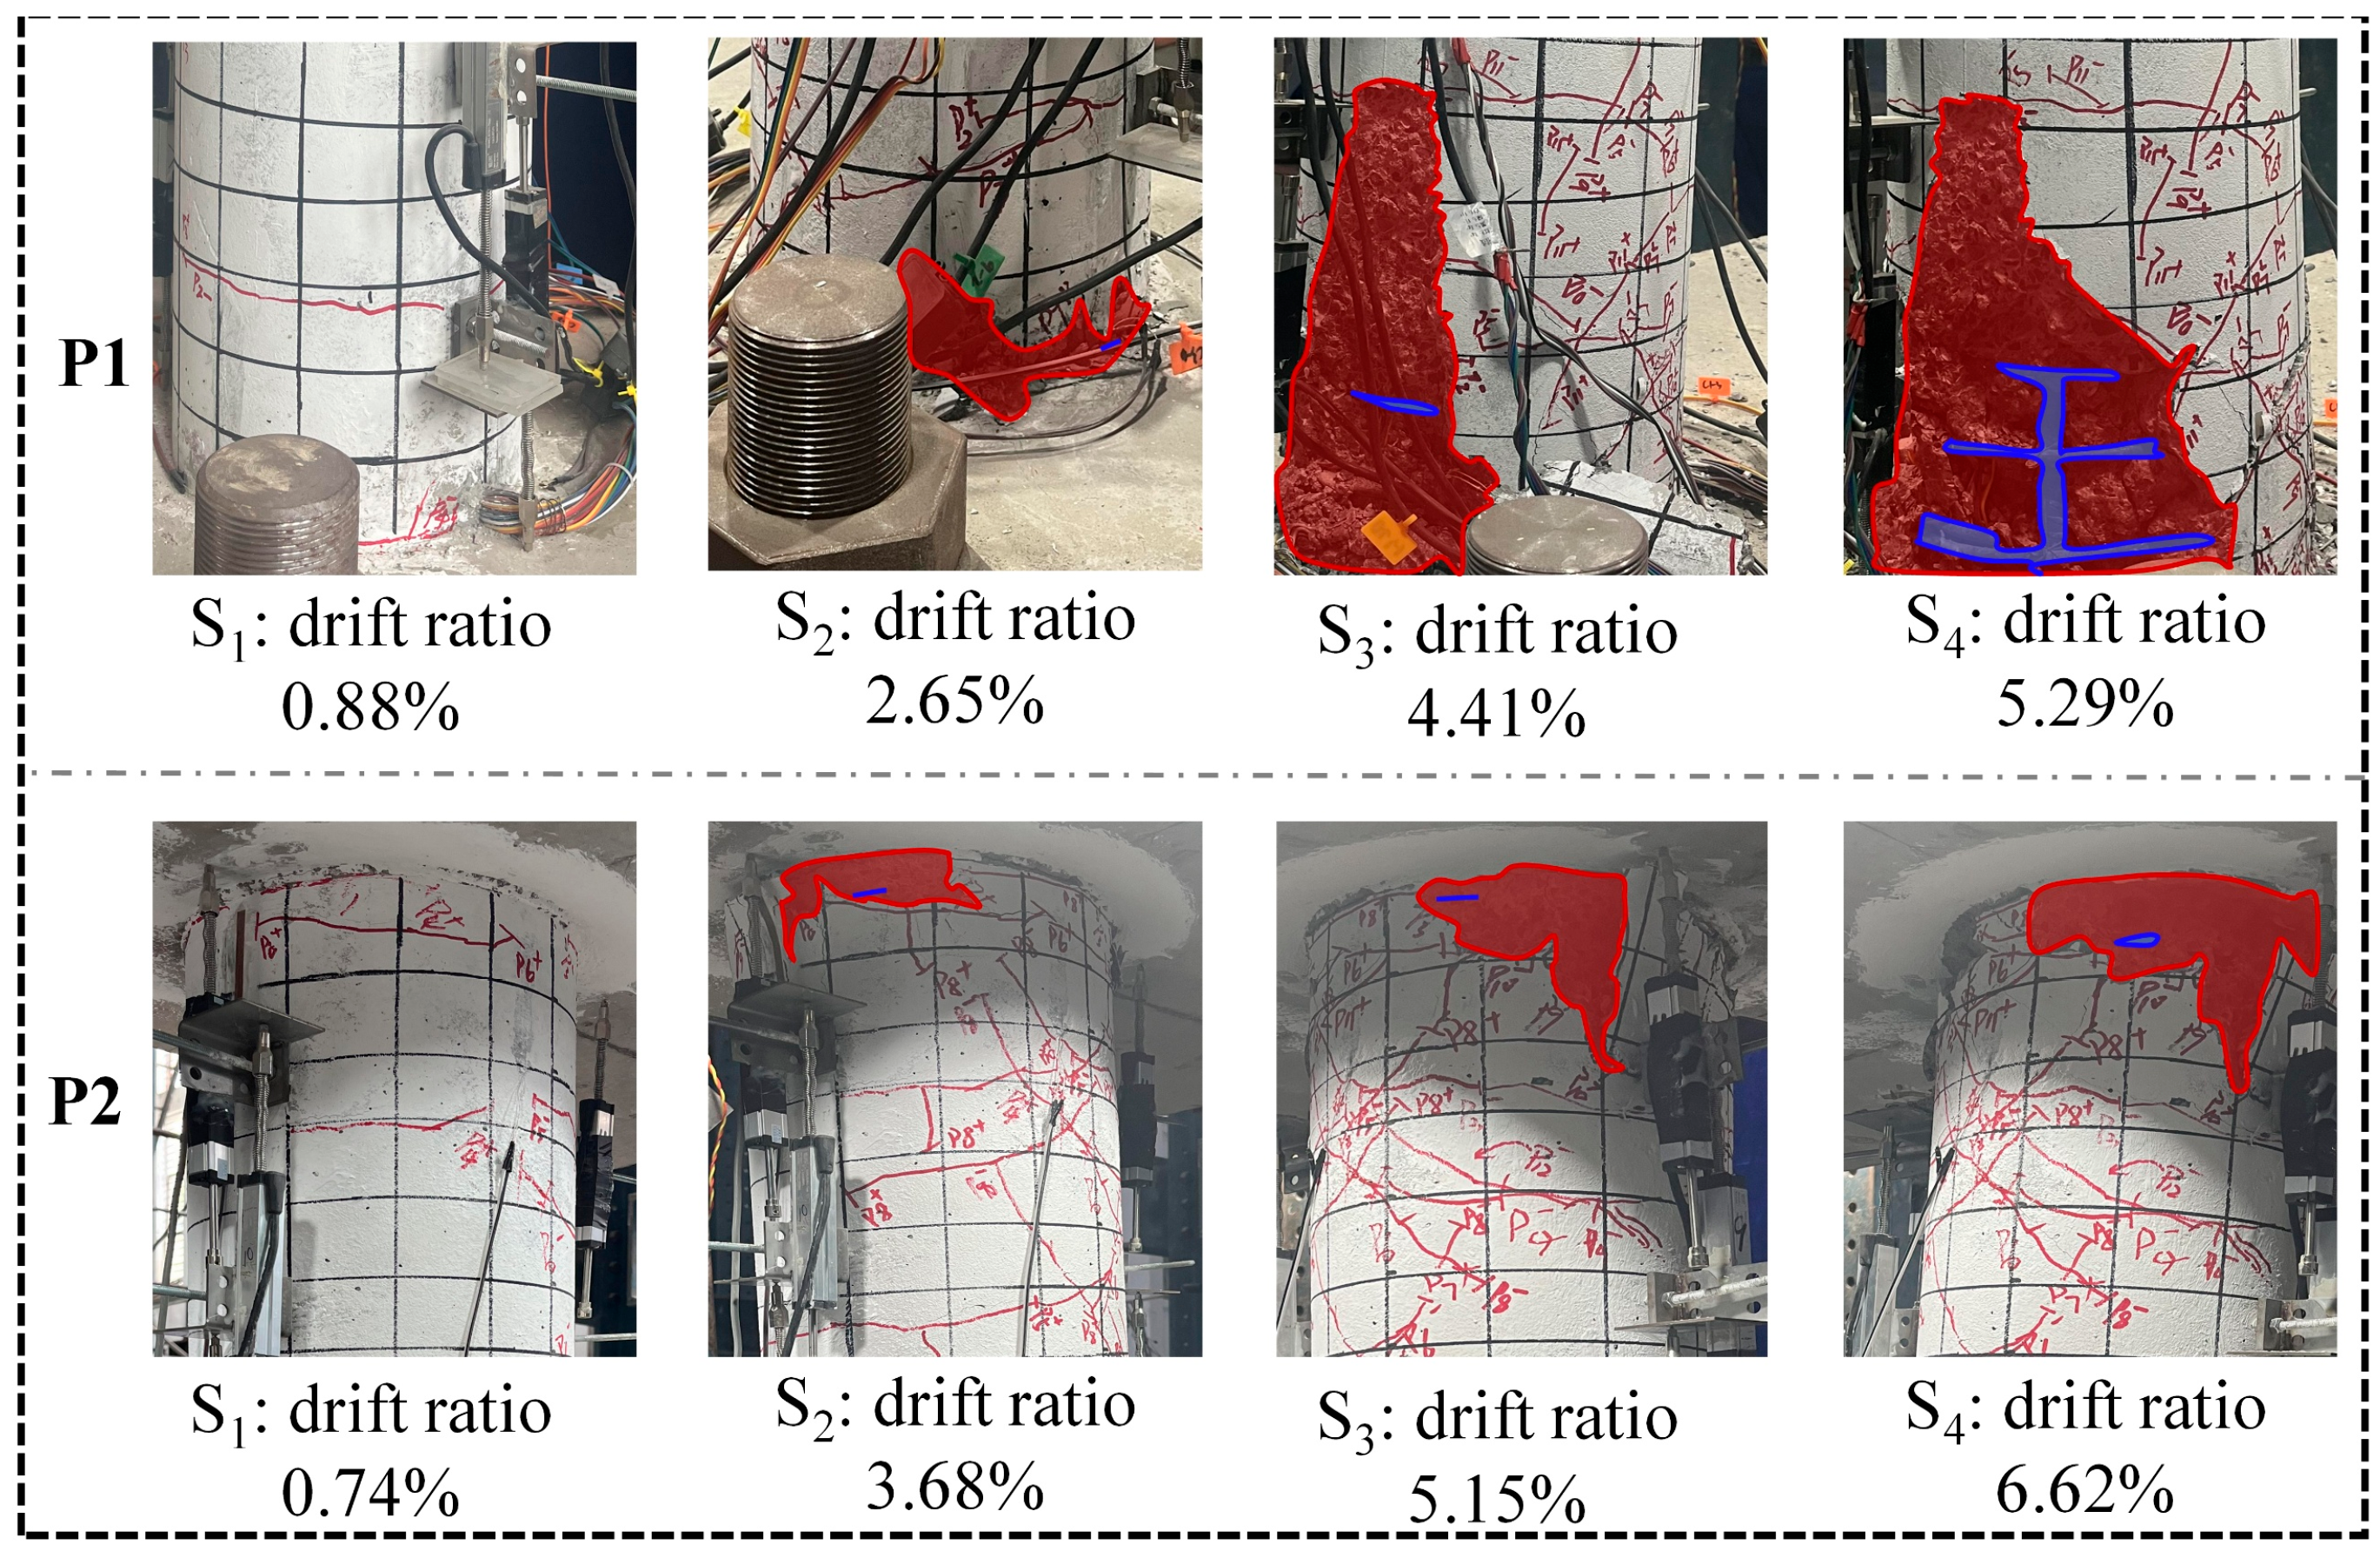
Figure 4 presents the damage images and corresponding identification results for specimens P1 and P2 at four representative loading points. As the imposed displacement increased, the concrete spalling regions expanded progressively in both specimens, although the extent of damage development differed substantially. For specimen P1, no quantifiable concrete spalling or exposed reinforcement was observed at a drift ratio of 0.88%. At 2.65% drift, the concrete spalling and exposed reinforcement area ratios reached 6.59% and 0.05%, respectively. At the subsequent drift ratios of 4.41% and 5.29%, the concrete spalling area ratios increased to 21.76% and 37.13%, while the exposed reinforcement area ratios increased to 1.11% and 4.75%, respectively. These results indicate that cover concrete damage progressed rapidly during the later loading stages of P1, accompanied by a substantial increase in the extent of reinforcement exposure. In contrast, macroscopic visible damage developed more gradually in specimen P2. At a drift ratio of 0.74%, both visual area ratios were zero. When the drift ratio reached 3.68%, the concrete spalling and exposed reinforcement area ratios were 2.86% and 0.08%, respectively. As the drift ratio increased further to 5.15% and 6.62%, the concrete spalling area ratios increased to 9.34% and 12.61%, respectively, while the exposed reinforcement area ratios were 0.21% and 0.25%. Across the selected reference points, the concrete spalling area ratio of P2 increased progressively, but the increase and final spalling area ratio were smaller than those of P1, and reinforcement exposure remained relatively limited.
Figure 4.
Representative damage images of specimens P1 and P2 at the four loading levels.
At their respective final reference points, the concrete spalling area ratios were 37.13% for P1 and 12.61% for P2, while the exposed reinforcement area ratios were 4.75% and 0.25%, respectively. Although the two specimens had identical geometric dimensions and longitudinal reinforcement, the spiral reinforcement used in P2 could provide more continuous lateral confinement, potentially limiting the progression of cover concrete damage in the plastic hinge regions. In contrast, the lap-spliced transverse hoops used in P1 provided relatively less continuous confinement, and more extensive concrete spalling and reinforcement exposure were observed during the later loading stages. It should be noted that the drift ratios at the final reference points differed between the two specimens. Therefore, the observed differences in damage area reflect the outcomes of their respective loading histories and cannot, on their own, be used to quantitatively isolate the effect of transverse reinforcement configuration on damage severity.
Overall, the concrete spalling and exposed reinforcement area ratios can characterize the progression of local macroscopic damage in RC double-column piers. However, these indicators are influenced by transverse confinement detailing, loading history, and the extent of the observed region. Particularly during the early stages of damage development, cracking and local material nonlinearity may already have occurred before concrete spalling and reinforcement exposure become readily observable. Therefore, the local damage severity reflected by visual area ratios cannot be directly equated with the global structural performance state. The relationship between these visual indicators and mechanical responses must instead be examined in the context of the corresponding loading stages.
3.3. Mechanical–Visual Evidence Relationships
To further examine the relationship between global mechanical responses and local visible damage in RC double-column piers, four representative loading points were selected from the loading histories of each specimen, P1 and P2. The corresponding mechanical and visual damage indicators were extracted and are summarized in Table 3. The selected points were labeled S1 through S4 according to the original experimental response characteristics and damage progression, providing corresponding mechanical and visual evidence across different loading stages.
Table 3.
Mechanical response and visible damage indicators at eight selected loading points.
As shown in Table 3, mechanical and visual evidence exhibited different sensitivities during the early stages of damage development. At the first reference point, both the concrete spalling and exposed reinforcement area ratios were zero for P1 and P2. However, their normalized secant stiffness values had already decreased to 0.38 and 0.40, respectively, indicating substantial global stiffness degradation before macroscopic damage became consistently quantifiable using the adopted visual area indicators. As loading progressed, the stiffness of both specimens continued to decrease, accompanied by progressive development of concrete spalling and reinforcement exposure. These observations indicate that macroscopic visual area indicators can characterize certain aspects of local damage progression, but their ability to capture crack initiation, material nonlinearity, and early-stage stiffness degradation remains limited.
During subsequent loading stages, stiffness degradation and reductions in load-carrying capacity did not evolve in a fully synchronized manner. For example, at the S3 reference point of P2, normalized secant stiffness had decreased to 0.10, whereas the backbone curve-based normalized load-carrying capacity indicator remained at 0.97. At the same point, the concrete spalling and exposed reinforcement area ratios were 9.34% and 0.21%, respectively. This observation indicates that substantial global stiffness degradation may occur while relatively high lateral load-carrying capacity is retained. Furthermore, the extent of macroscopic visible damage alone is insufficient to characterize the remaining load-carrying capacity.
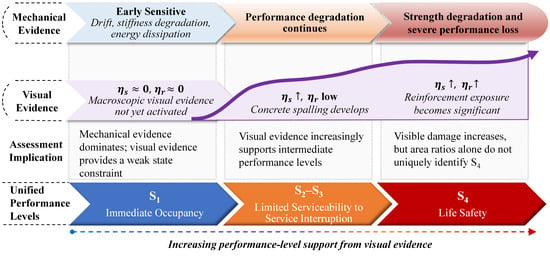
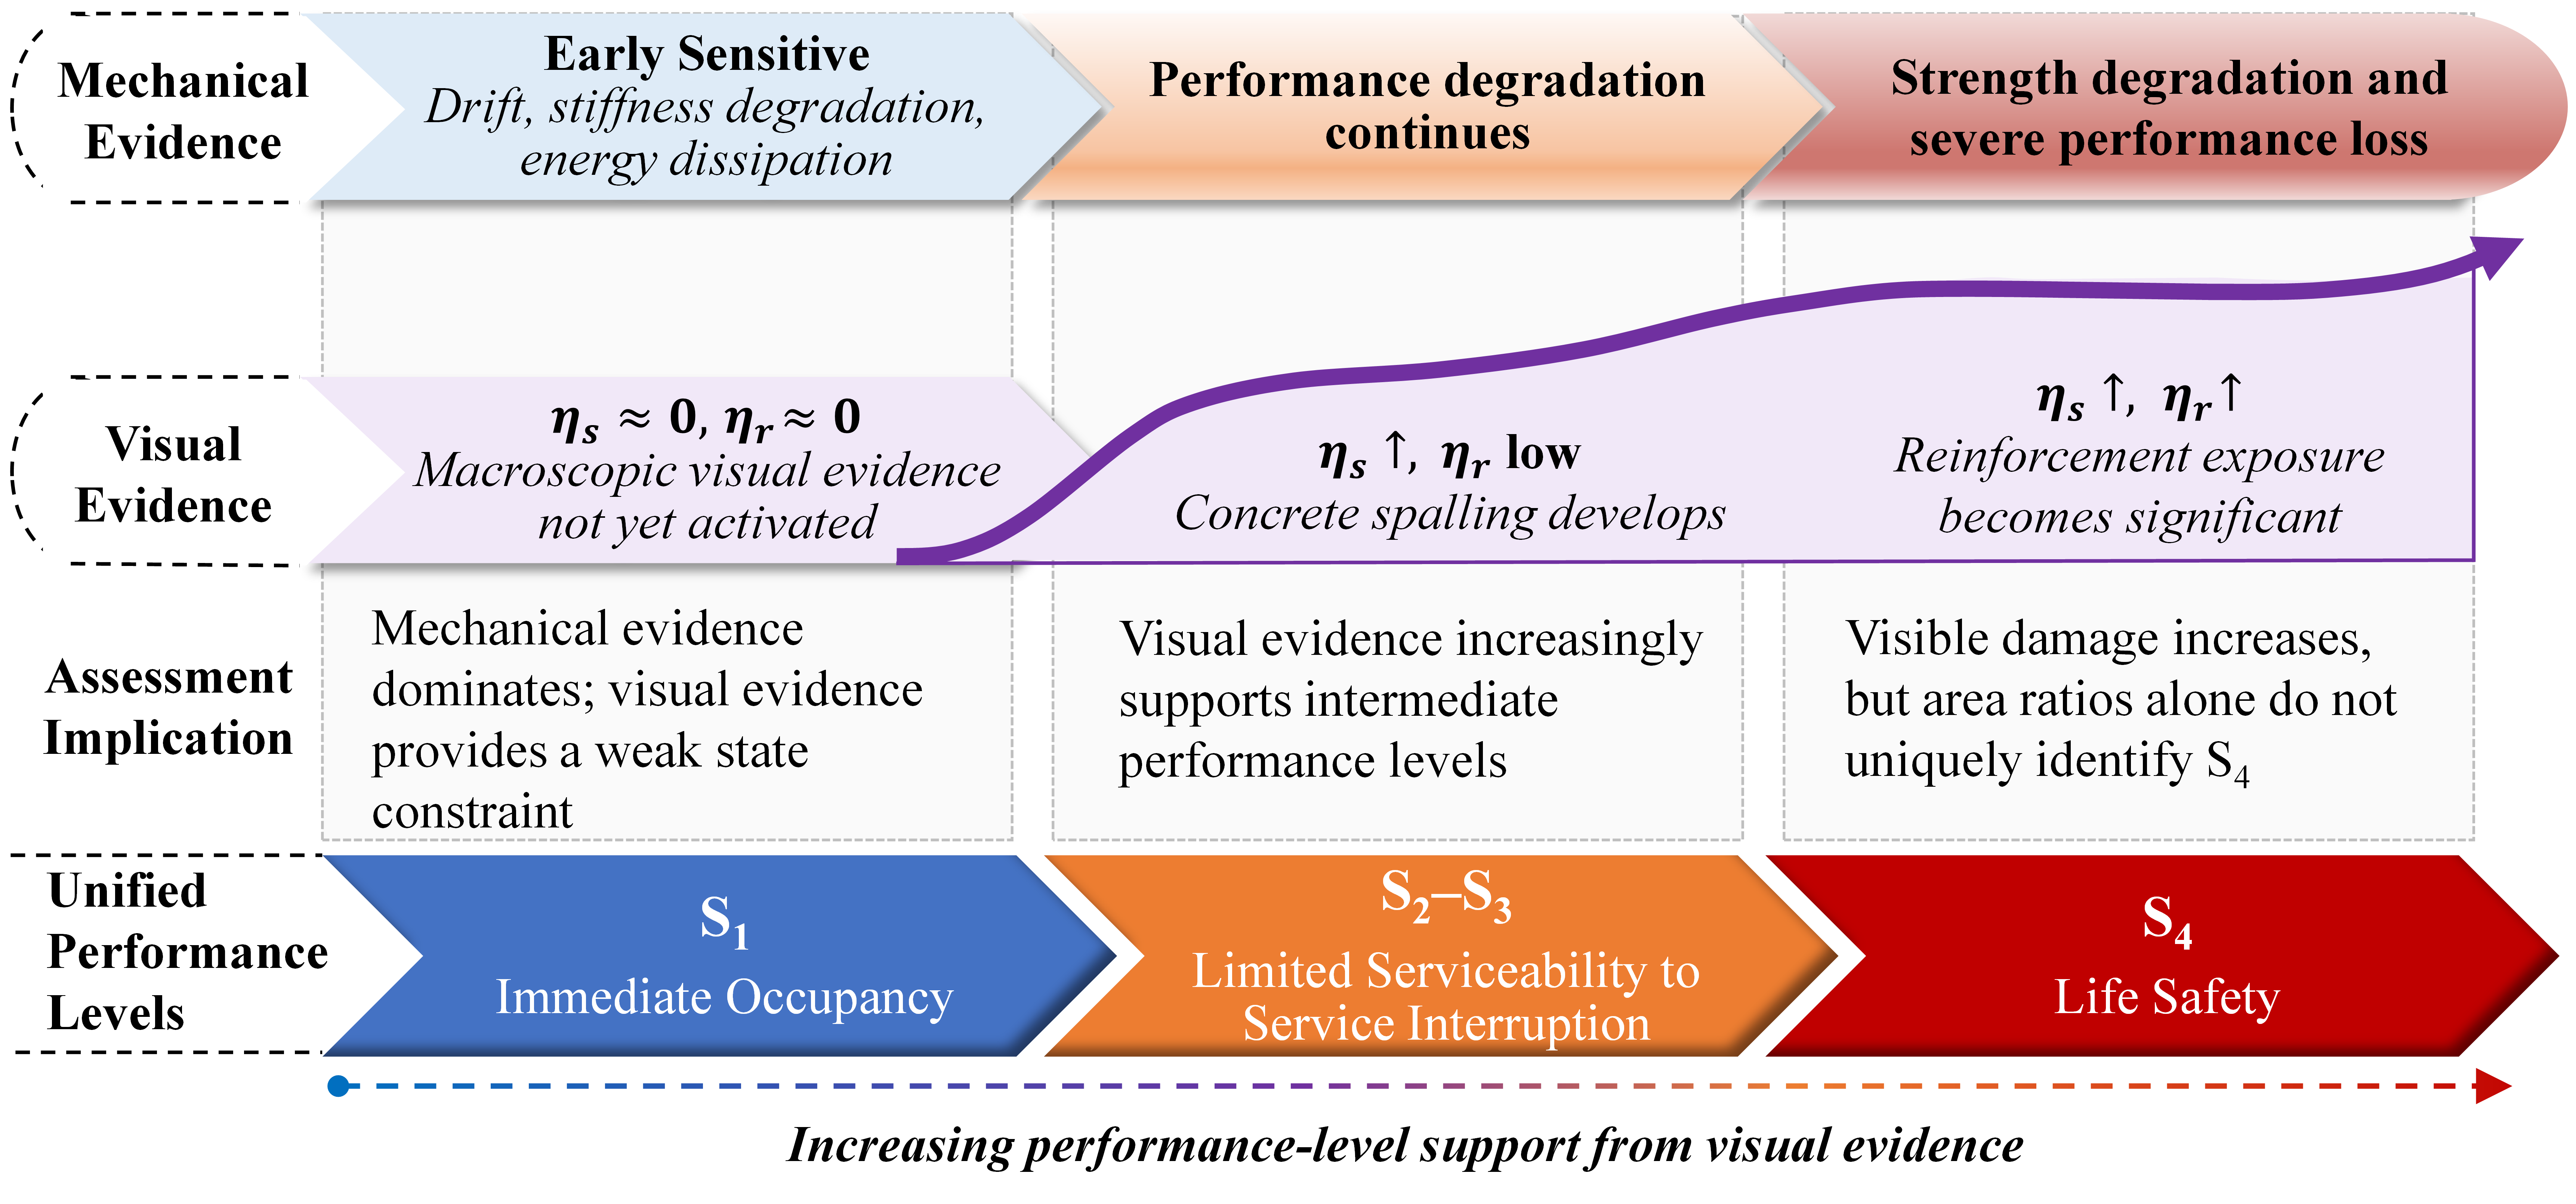
The differences in transverse confinement detailing between the two specimens further illustrate the nonunique relationship between global mechanical responses and local visible damage. At their respective final reference points, the normalized secant stiffness values of P1 and P2 were 0.06 and 0.07, indicating substantial stiffness degradation in both specimens. However, the concrete spalling area ratios were 37.13% and 12.61%, respectively, while the exposed reinforcement area ratios were 4.75% and 0.25%, respectively. These results suggest that similar levels of global stiffness degradation may be associated with substantially different areas of macroscopic visible damage across specimens. In addition, cumulative hysteretic energy dissipation increased with successive loading cycles, reflecting energy dissipation throughout the loading history. Unlike stiffness, load-carrying capacity, or visible damage area evaluated at the current loading point, cumulative energy dissipation also incorporates contributions from preceding loading cycles. These experimental results indicate that global mechanical responses and macroscopic visible damage differ in their sensitivity and descriptive roles across damage stages. Their stage-dependent relationships are illustrated in Figure 5.
Figure 5.
Schematic illustration of the stage-dependent roles of mechanical and visual evidence during damage evolution.
Overall, global mechanical responses and macroscopic visible damage provide information on damage development in RC double-column piers at different observation scales, but differ in damage sensitivity, physical meaning, and evolution patterns. Mechanical indicators help characterize global stiffness, load-carrying capacity, and the accumulation of cyclic damage, whereas visible damage indicators provide direct evidence of local material deterioration. No simple one-to-one correspondence exists between the two types of indicators; reliance on a single source of evidence may be insufficient to fully characterize structural performance. Therefore, the assessment outcomes derived independently from mechanical and visual evidence should be retained, and their compatibility should be examined within a unified performance-level framework, rather than directly equating visible damage area with the global structural performance level.
4. Physics–Vision Assessment
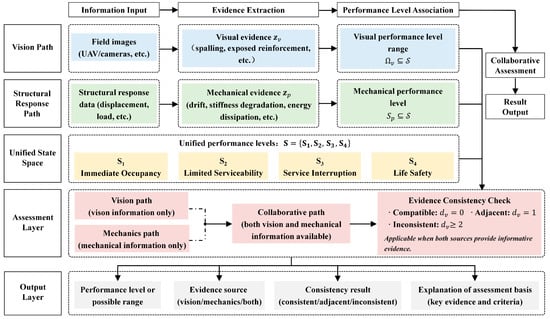
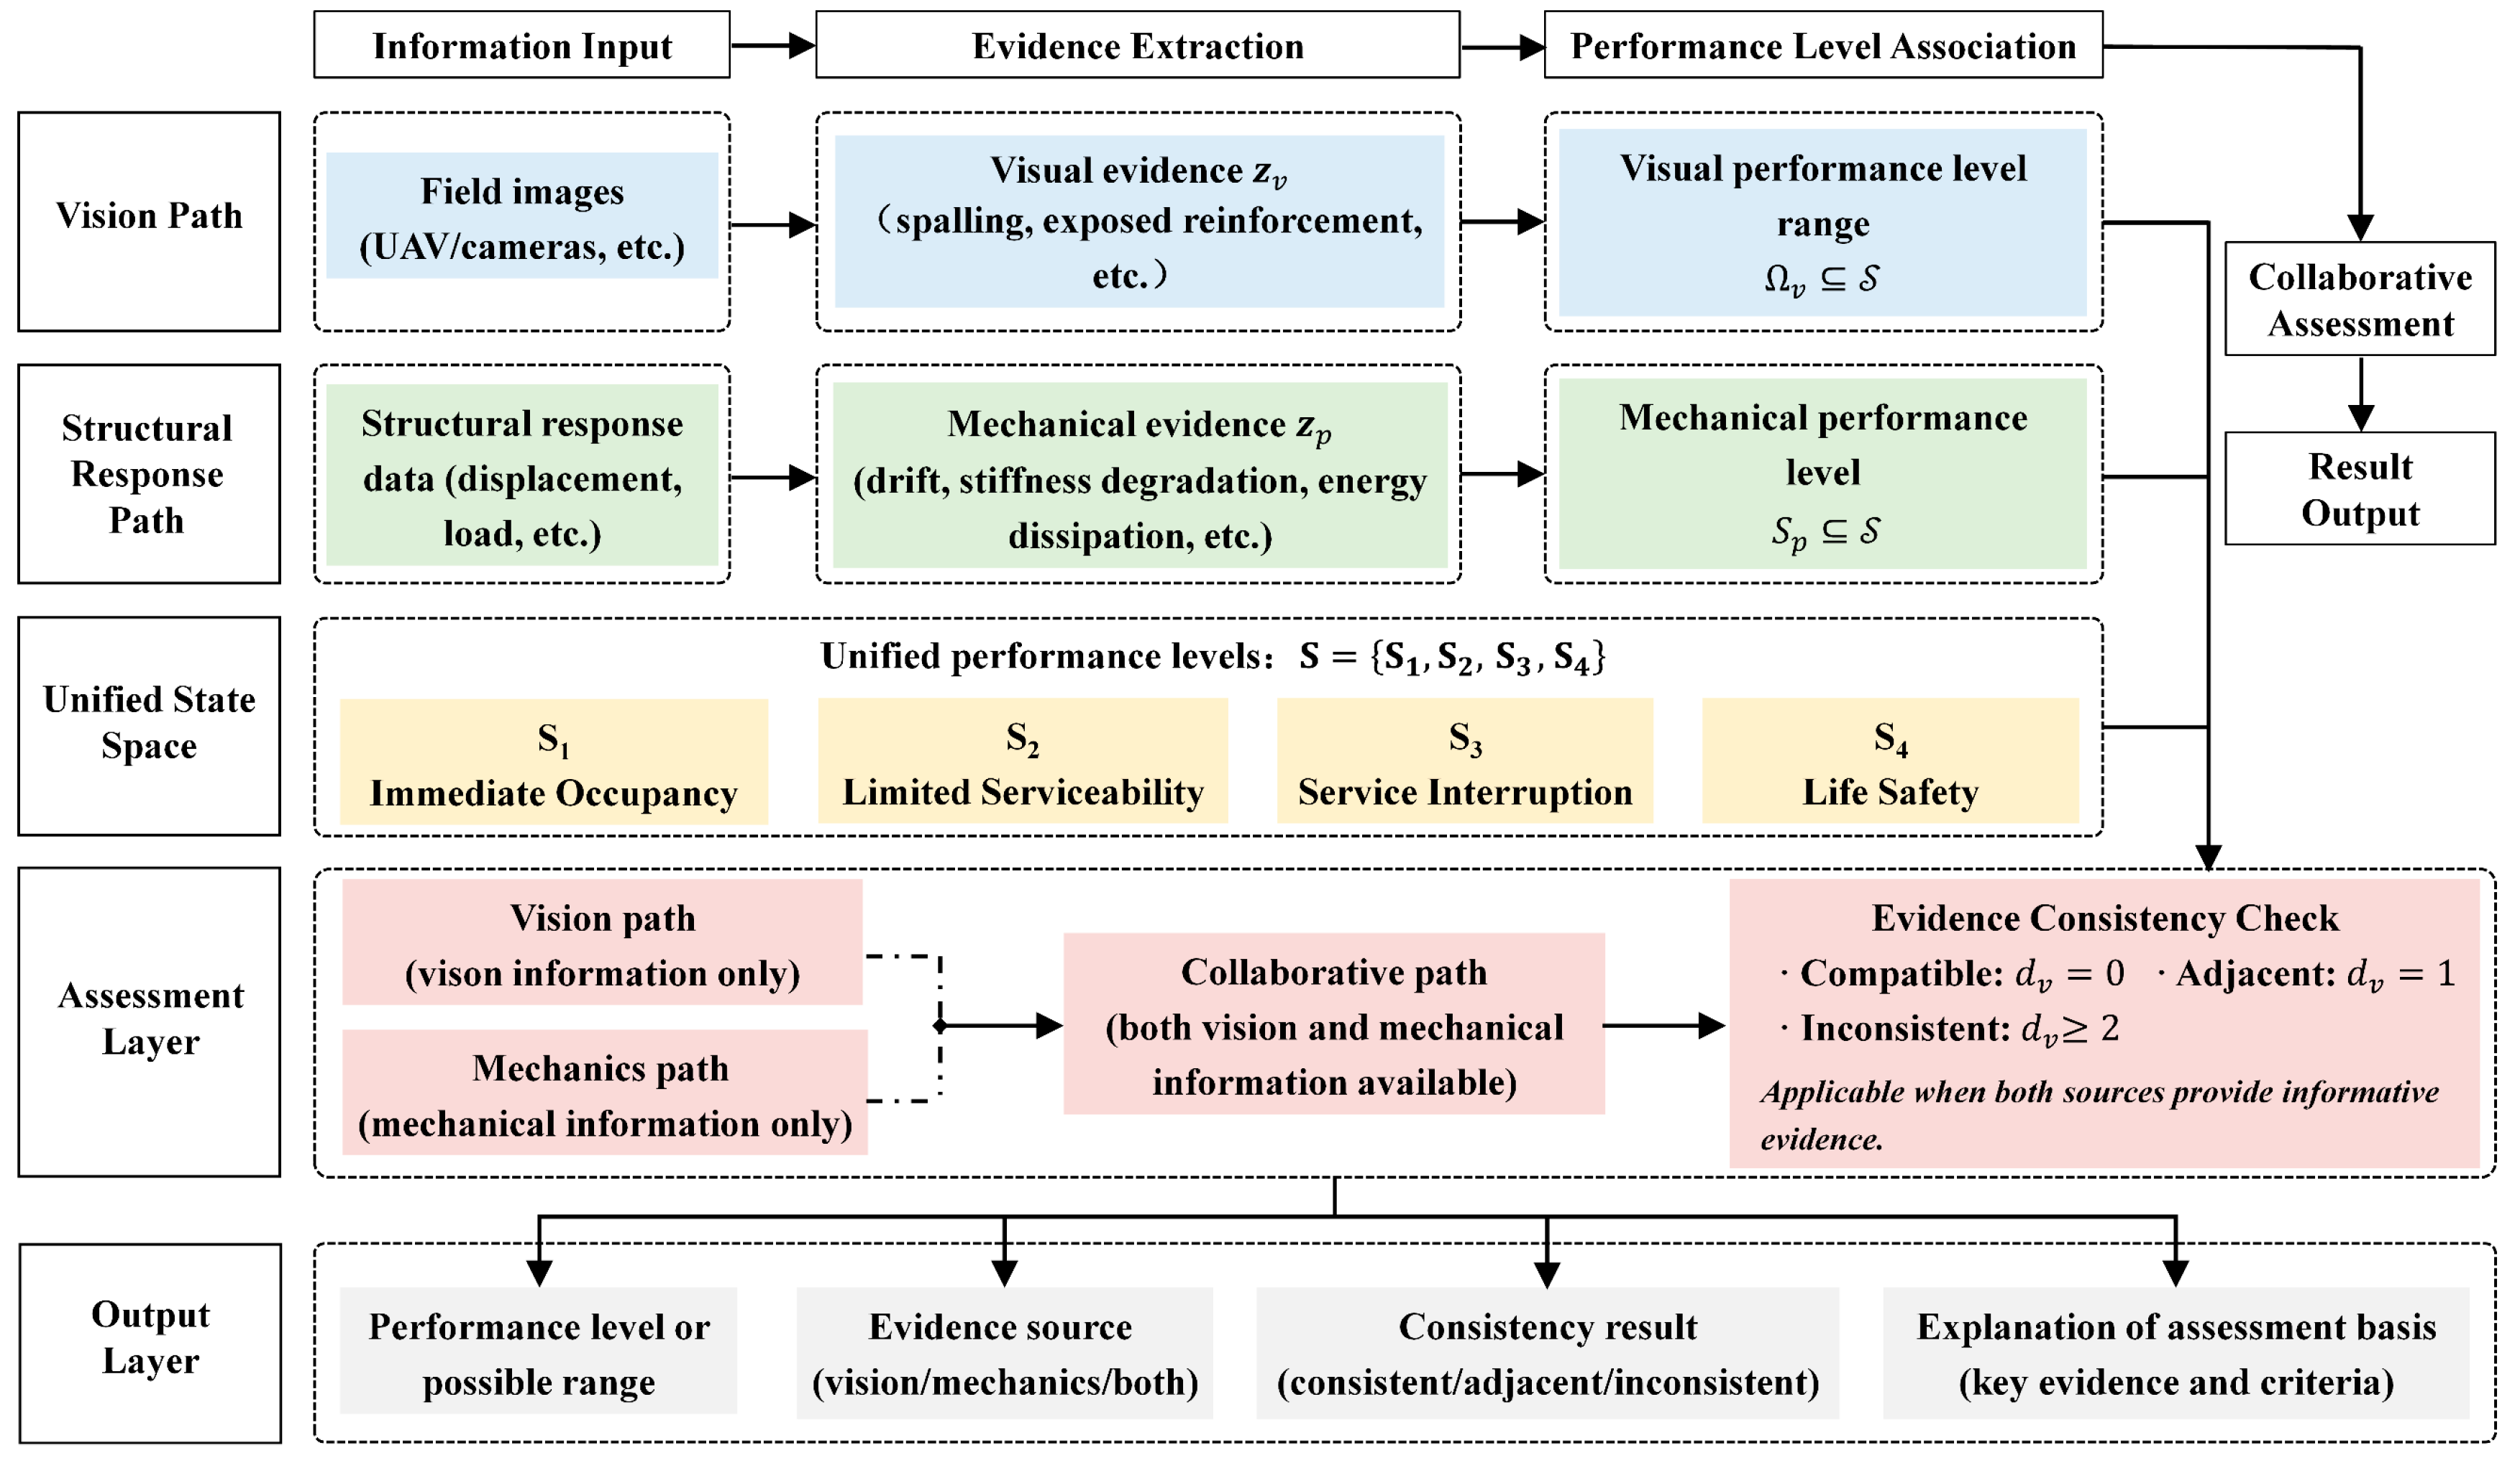
Post-earthquake field images of RC double-column piers can document concrete spalling and exposed reinforcement, whereas structural responses provide information on deformation, stiffness degradation, load-carrying capacity, and energy dissipation. Because these two sources of evidence differ in physical meaning and sensitivity to different stages of damage development, a common set of performance levels is required to enable their comparison. Based on these considerations, the proposed PV-RDA framework is illustrated in Figure 6. The framework consists of five components: information input, evidence extraction, performance level association, collaborative assessment, and result output. Visual information and structural responses are first processed through independent pathways to generate visible damage evidence and mechanical performance evidence, respectively. These two types of evidence are then related within a unified structural performance state space, while material-level information, such as reinforcement and concrete strains, is incorporated as a supplementary reference for local performance when available. When only one source of information is available, the structural state is assessed using the corresponding evidence. When both sources are available, a consistency check is performed by examining the relationship between the vision-based state constraint and the mechanically determined performance state. The resulting structural state assessment retains an explicit evidence basis and an interpretable engineering meaning.
Figure 6.
Overall framework of PV-RDA.
4.1. Performance Mapping and Assessment Paths
The PV-RDA framework adopts the four-level performance classification system established in Section 2.3 to map global mechanical responses and local macroscopic visible damage into a common performance-state space. As demonstrated by the experimental analysis in Section 3, the two evidence sources differ in damage sensitivity and evolution patterns. Accordingly, separate mechanics-based and vision-based assessment pathways are established, and their independent outcomes are retained. In the mechanics-based pathway, pier-top drift ratio, normalized secant stiffness, normalized load-carrying capacity, and cumulative hysteretic energy dissipation are used as structural response evidence. The structural performance level is determined using the equivalent yield displacement, the backbone-curve peak displacement, and the post-peak load-carrying capacity degradation threshold, while secant stiffness and cumulative hysteretic energy dissipation are used to support the interpretation of mechanical degradation at the corresponding stages. The mechanics-based pathway yields a single performance level Sp, which is determined according to the following rules:
In the vision-based pathway, the concrete spalling area ratio ηs and exposed reinforcement area ratio ηr are used as inputs to obtain the visually supported performance-state set . Because macroscopic damage areas cannot fully characterize early-stage cracking, internal material damage, or global load-carrying capacity degradation, a unique performance level is not assigned directly from the magnitudes of the visual area ratios. Instead, a conservative state-constraint rule is adopted:
when both ηs and ηr are zero, damage that is not readily identifiable in macroscopic images cannot be ruled out. Therefore, all four performance states are retained in . When either indicator reveals consistently identifiable macroscopic damage, S1 is excluded under the adopted visual mapping rule, while S2 through S4 are retained. Importantly, the visually supported state set represents the range of performance states consistent with the available observations and should not be interpreted as the actual structural performance level.
Based on these two independent pathways, PV-RDA allows vision-only, mechanics-only, or dual-source assessment to be performed according to information availability. When only field damage images are available, the visually supported state set and the corresponding macroscopic damage evidence are reported. When only valid structural response information is available, the mechanically determined performance level and its supporting response evidence are reported. When both sources are available, the mechanical classification and visually supported state set are retained independently, followed by a cross-evidence consistency check. The assessment pathways and their principal outputs under different information conditions are summarized in Table 4.
Table 4.
Assessment pathways, information inputs, and outputs of PV-RDA.
4.2. Cross-Evidence Consistency
When both structural mechanical response data and macroscopic visible damage information are available, the mechanically determined performance level Sp and the visually supported state set are obtained independently. Their compatibility is then evaluated within the unified performance-level system using the minimum performance-level difference. Let dv denote the minimum performance-level difference between the mechanically determined state and the visually supported state set, defined as follows:
Here, ip denotes the index of the mechanically determined performance state Sp, and j denotes the index of a state belonging to the visually supported set . When dv = 0, the mechanically determined performance level falls within the range supported by visual evidence, indicating no performance-level discrepancy between the two assessments. When dv = 1, the two assessments differ by one performance level. When dv ≥ 2, a discrepancy of two or more performance levels is identified, requiring further examination of the available evidence and its applicability conditions.
Using the two independent assessment pathways established in Section 4.1, mechanics-based assessments, vision-based assessments, and cross-evidence consistency checks were performed at eight selected loading points from specimens P1 and P2. The results are summarized in Table 5. At the first reference point of each specimen, both the concrete spalling and exposed reinforcement area ratios were zero. Accordingly, all four performance states, S1 through S4, were retained in the visually supported state set. As loading progressed, quantifiable macroscopic damage was observed at the remaining loading points, and the visually supported state set was consequently reduced to {S2, S3, S4}.
Table 5.
Mechanics-based and vision-based assessment results and cross-evidence consistency at selected loading points.
The mechanics-based assessments classified the four selected loading points of P1 as S1, S2, S4, and S4, respectively, whereas the corresponding points of P2 were classified as S1, S2, S3, and S4. Although the third reference point of P1 was originally labeled S3 according to the experimental point-selection sequence, its normalized load-carrying capacity indicator was 0.848689, slightly below the adopted post-peak threshold of 0.85. Therefore, this point was classified as S4 by the mechanics-based pathway. This point lies near the classification boundary, and the difference between its reference-point label and mechanically determined performance level reflects the classification of a near-threshold state rather than a discrepancy between the mechanical and visual assessments.
At all eight loading points, the mechanically determined performance levels fell within their corresponding visually supported state sets, yielding a minimum performance-level difference of zero at every point. For the third reference point of P1, the visually supported state set was {S2, S3, S4}, which included the mechanically determined level S4. Thus, the two assessment outcomes remained compatible under the adopted rules. Importantly, dv = 0 indicates only that the mechanically determined performance level lies within the range permitted by visual evidence. It does not imply that the mechanical classification has been independently confirmed by visual information.
4.3. Comparison with Published Experiments
To further examine the relationship between mechanical responses and visible damage beyond the two specimens investigated in this study, observations from two independent experimental studies were selected for comparison with the present results. Chen et al. [33] experimentally investigated two RC bridge pier specimens reinforced with conventional tied and welded reinforcement cages, whereas Lin et al. [34] examined the damage evolution of hollow RC bridge piers under bidirectional cyclic loading. These studies reported representative stages of mechanical response and the associated visible damage observations. The main comparative results are summarized in Table 6.
Table 6.
Comparison of mechanical response stages and visible damage observations with published experiments.
The experimental results reported by Chen et al. showed that both specimens reached their peak lateral load-carrying capacities at a displacement of 30 mm, whereas cover concrete spalling did not begin until the displacement reached 40 mm. The ultimate displacements, defined by a reduction in lateral load-carrying capacity to 85% of the peak value on the descending branch of the backbone curve, were 53.9 mm and 60.8 mm, respectively. Lin et al. documented the progression of damage in specimen B2. Initial cracking was observed at a loading displacement of 4 mm, longitudinal reinforcement yielding occurred at 12 mm, and concrete spalling developed at 31 mm. During the final failure stage, buckling or fracture of the longitudinal reinforcement was observed. These observations suggest that characteristic mechanical responses and macroscopic visible damage may occur at different stages of deformation. Similar differences between global mechanical degradation and the development of visible damage were observed in the specimens investigated in the present study. However, differences in structural detailing, loading conditions, and damage progression among the specimens limit the establishment of a universally applicable mechanical performance threshold based solely on the onset of macroscopic visible damage.
These independent experimental observations provide further support for the need to distinguish mechanical performance assessment from the interpretation of visible damage, which is one of the central considerations underlying the proposed PV-RDA framework. However, the selected studies did not provide all the mechanical response histories and quantitative visual damage indicators required to fully reproduce both assessment pathways. Accordingly, the present comparison is limited to the reported mechanical response stages and damage progression observed in the independent experiments. Further evaluation of the general applicability and assessment reliability of PV-RDA will require independent datasets containing synchronized mechanical measurements and quantitative damage records.
4.4. Applicability and Limitations
In practical post-earthquake bridge assessment, structural response records and damage images may not always be available simultaneously. Therefore, the appropriate assessment pathway must be selected according to the available evidence. When only field images are available, PV-RDA uses the concrete spalling and exposed reinforcement area ratios to establish a visually supported state set, while retaining performance states that cannot be excluded on the basis of the available images. At the S1 reference points examined in this study, both visual area ratios were zero despite substantial reductions in normalized secant stiffness. These observations indicate that the absence of quantifiable damage in the images does not necessarily imply the absence of mechanical degradation. Accordingly, vision-only assessment is primarily suited to screening for macroscopic damage and should not be used alone to determine the global structural performance level or post-earthquake traffic serviceability.
When only reliable structural response data are available, the performance level can be determined through the mechanics-based pathway using equivalent yielding, the backbone-curve peak, and the post-peak load-carrying capacity degradation threshold. Stiffness degradation and cumulative hysteretic energy dissipation are then used to support the interpretation of structural damage progression. However, this pathway does not directly characterize the spatial distribution of local damage, such as cover concrete spalling and exposed reinforcement. Furthermore, some of the mechanical indicators adopted in this study depend on initial reference stiffness, historical peak loads, and complete cyclic loading records. For in-service bridges without pre-earthquake reference information or continuous monitoring data, these indicators may be difficult to obtain directly. In such cases, the corresponding mechanical evidence would need to be established using available monitoring information or other reliable structural analysis methods. When both evidence sources are available, PV-RDA retains their independent assessment outcomes and performs a cross-evidence consistency check, rather than allowing one source to directly override the assessment obtained from the other.
The reliability of vision-based damage assessment is influenced by image quality, camera viewing angle, lighting conditions, occlusion, observation coverage, and the damage identification method employed. The concrete spalling and exposed reinforcement area ratios describe only macroscopic damage within the observable region. The identified damage areas may be underestimated because of occlusion or damage falling outside the image coverage, and may also be affected by nonstructural surface changes and identification errors. In addition, crack width, internal concrete damage, and concealed plastic deformation of reinforcement cannot be fully characterized by the two visual area indicators adopted in this study. Therefore, the visually supported state set represents a constraint derived from the currently available observations, and its discriminatory capability and reliability are limited by observation conditions and the damage identification process. In particular, when visual evidence cannot adequately distinguish among performance levels, the compatibility of a broad visually supported state set with a mechanically determined level should not be interpreted as independent validation of the mechanical assessment.
The framework was evaluated using two RC double-column pier specimens with different transverse reinforcement configurations and eight representative loading points. However, the limited number of specimens and damage modes is insufficient to establish the general applicability of the performance criteria or the assessment accuracy of the framework under actual post-earthquake conditions. Furthermore, lateral low-cycle reversed loading under a constant axial load does not fully reproduce the inertial effects or irregular ground-motion histories associated with actual earthquakes. Accordingly, the adopted mechanical stage boundaries and visual damage rules cannot be directly generalized to shear failure, foundation failure, nonseismic loading conditions, or other structural material systems. Future studies should evaluate the applicability and assessment reliability of PV-RDA using additional independent experiments and field data covering different structural configurations, failure modes, and loading conditions. The uncertainty associated with visual damage identification should also be quantified.
5. Conclusions
Based on quasi-static tests of two reinforced concrete (RC) double-column pier specimens with different transverse reinforcement configurations, the evolution of global mechanical responses and macroscopic visible damage was investigated, and a Physics–Vision Response-Driven Assessment (PV-RDA) framework was proposed. Within the framework, the structural performance level is determined from mechanical responses, while a set of plausible performance states is established from visible damage. The compatibility between the two sources of evidence is then examined using the minimum performance-level difference. The main findings are summarized as follows:
(1) Stiffness degradation, load-carrying capacity reduction, and macroscopic visible damage did not evolve synchronously in the RC double-column pier specimens. In specimen P2, normalized secant stiffness had already decreased to 0.40 before quantifiable concrete spalling or exposed reinforcement was observed. At the S3 reference point, normalized secant stiffness further decreased to 0.10, while the normalized load-carrying capacity indicator remained at 0.970. These observations indicate that stiffness degradation can reflect the development of structural nonlinearity at relatively early stages, whereas pronounced macroscopic visible damage and substantial reductions in load-carrying capacity occur primarily at later loading stages.
(2) Specimens with different transverse reinforcement configurations exhibited substantially different extents of macroscopic visible damage despite similar levels of global stiffness degradation. At their respective final reference points, normalized secant stiffness values were 0.06 and 0.07 for P1 and P2, respectively, whereas the concrete spalling area ratios were 37.13% and 12.61%, and the exposed reinforcement area ratios were 4.75% and 0.25%, respectively. These results indicate that visual area indicators can characterize the progression of local macroscopic damage but are insufficient, on their own, to provide a common basis for performance classification across specimens.
(3) At all eight representative loading points, the mechanically determined performance levels fell within their corresponding visually supported state sets, yielding a minimum performance-level difference of zero at every point. Notably, the S3-labeled reference point of P1 was mechanically classified as S4 because its normalized load-carrying capacity indicator was slightly below 0.85, but the classification remained within the visually supported state set. These findings demonstrate that PV-RDA can retain independent assessment outcomes from the two evidence sources and characterize their compatibility. However, when the visually supported state set is broad, consistency between the two assessments should not be interpreted as independent validation of the mechanical classification.
The present evaluation was limited to two RC double-column pier specimens and the selected loading points. Future studies should further examine the applicability of the performance criteria and the reliability of dual-source assessment using specimens with different structural configurations and failure modes, together with field observations collected after actual earthquakes.
Author Contributions
Conceptualization, H.D. and H.S.; methodology, H.D.; software, H.D.; validation, H.S.; formal analysis, Y.G.; investigation, Y.G.; resources, H.D.; data curation, Y.G.; writing—original draft preparation, H.D.; writing—review and editing, H.S.; visualization, Y.G.; Supervision—S.K. and A.A. All authors have read and agreed to the published version of the manuscript.
Funding
The authors are thankful to the Deanship of Graduate Studies and Scientific Research at Najran University for funding this work under the Consortium Funding Program grant code (NU/CPI/SERC/14/3767-3).
Data Availability Statement
Data will be made available on request.
Conflicts of Interest
The authors declare no conflicts of interest.
References
- Hao, H.; Bi, K.; Chen, W.; Pham, T.M.; Li, J. Towards next generation design of sustainable, durable, multi-hazard resistant, resilient, and smart civil engineering structures. Eng. Struct. 2023, 277, 115477. [Google Scholar] [CrossRef] [Scilit]
- Hose, Y.; Silva, P.; Seible, F. Development of a performance evaluation database for concrete bridge components and systems under simulated seismic loads. Earthq. Spectra 2000, 16, 413–442. [Google Scholar] [CrossRef] [Scilit]
- Dong, H.; Feng, W.; Zheng, Z.; Han, Q.; Du, X. Experimental investigation on failure mechanism and hysteresis behavior of RC single- and double-column piers. J. Bridge Eng. 2024, 29, 04024094. [Google Scholar] [CrossRef] [Scilit]
- Zhang, Y.; Xiao, F.; Badar, J. Influence of straining beams on the seismic fragility of double-column bridge piers. Civ. Eng. J. 2019, 28. [Google Scholar] [CrossRef] [Scilit]
- Xiong, J.; Chen, X. Seismic performance of double-column tall pier bents using fusing connections. Soil Dyn. Earthq. Eng. 2023, 170, 107924. [Google Scholar] [CrossRef] [Scilit]
- Park, Y.J.; Ang, A.H.S. Mechanistic seismic damage model for reinforced concrete. J. Struct. Eng. 1985, 111, 722–739. [Google Scholar] [CrossRef] [Scilit]
- Goodnight, J.C.; Kowalsky, M.J.; Nau, J.M. Strain limit states for circular RC bridge columns. Earthq. Spectra 2016, 32, 1627–1652. [Google Scholar] [CrossRef] [Scilit]
- Bassam, A.; Iranmanesh, A.; Ansari, F. A simple quantitative approach for post earthquake damage assessment of flexure dominant reinforced concrete bridges. Eng. Struct. 2011, 33, 3218–3225. [Google Scholar] [CrossRef] [Scilit]
- Aldabagh, S.; Hossain, F.; Alam, M.S. Simplified predictive expressions of drift limit states for reinforced concrete circular bridge columns. J. Struct. Eng. 2022, 148, 04021285. [Google Scholar] [CrossRef] [Scilit]
- Aldabagh, S.; Hossain, F.; Alam, M.S. Refined deformation limit states for circular reinforced concrete bridge columns. Earthq. Eng. Struct. Dyn. 2024, 53, 348–365. [Google Scholar] [CrossRef] [Scilit]
- Zhang, B.; Ren, Y.; He, S.; Gao, Z.; Li, B.; Song, J. A review of methods and applications in structural health monitoring (SHM) for bridges. Measurement 2025, 245, 116575. [Google Scholar] [CrossRef] [Scilit]
- Dabous, S.A.; Feroz, S. Condition monitoring of bridges with non-contact testing technologies. Autom. Constr. 2020, 116, 103224. [Google Scholar] [CrossRef] [Scilit]
- Cha, Y.J.; Choi, W.; Büyüköztürk, O. Deep learning-based crack damage detection using convolutional neural networks. Comput.-Aided Civ. Infrastruct. Eng. 2017, 32, 361–378. [Google Scholar] [CrossRef] [Scilit]
- Kim, B.; Cho, S. Automated vision-based detection of cracks on concrete surfaces using a deep learning technique. Sensors 2018, 18, 3452. [Google Scholar] [CrossRef] [Scilit] [PubMed]
- Yan, Y.; Mao, Z.; Wu, J.; Padir, T.; Hajjar, J.F. Towards automated detection and quantification of concrete cracks using integrated images and lidar data from unmanned aerial vehicles. Struct. Control Health Monit. 2021, 28, e2757. [Google Scholar] [CrossRef] [Scilit]
- Santos, R.; Ribeiro, D.; Lopes, P.; Cabral, R.; Calçada, R. Detection of exposed steel rebars based on deep-learning techniques and unmanned aerial vehicles. Autom. Constr. 2022, 139, 104324. [Google Scholar] [CrossRef] [Scilit]
- Chen, L.; Chen, W.; Wang, L.; Zhai, C.; Hu, X.; Sun, L.; Tian, Y.; Huang, X.; Jiang, L. Convolutional neural networks (CNNs)-based multi-category damage detection and recognition of high-speed rail (HSR) reinforced concrete (RC) bridges using test images. Eng. Struct. 2023, 276, 115306. [Google Scholar] [CrossRef] [Scilit]
- Yasmin, T.; La, D.; La, K.; Nguyen, M.T.; La, H.M. Concrete spalling detection system based on semantic segmentation using deep architectures. Comput. Struct. 2024, 300, 107398. [Google Scholar] [CrossRef] [Scilit]
- Bai, Z.; Liu, T.; Zou, D.; Zhang, M.; Hu, Q.; Zhou, A.; Li, Y. Multi-scale image-based damage recognition and assessment for reinforced concrete structures in post-earthquake emergency response. Eng. Struct. 2024, 314, 118402. [Google Scholar] [CrossRef] [Scilit]
- Wang, S.; Wan, J.; Zhang, S.; Du, Y. Automatic detection method for concrete spalling and exposed steel bars in reinforced concrete structures based on machine vision. Buildings 2024, 14, 1580. [Google Scholar] [CrossRef] [Scilit]
- Jamshidian, S.; Hamidia, M. Post-earthquake damage assessment for RC columns using crack image complexity measures. Bull. Earthq. Eng. 2023, 21, 6029–6063. [Google Scholar] [CrossRef] [Scilit]
- Aydin, B.B.; Binici, B.; Aktas, S.S.; Hendriks, M.A.N.; Tuncay, K. Maximum drift demands of earthquake damaged reinforced concrete columns based on residual flexure cracks. Bull. Earthq. Eng. 2024, 22, 4055–4081. [Google Scholar] [CrossRef] [Scilit]
- Tazarv, M.; Won, K.; Jang, Y.; Hart, K.; Greeneway, E. Post-earthquake serviceability assessment of standard RC bridge columns using computer vision and seismic analyses. Eng. Struct. 2022, 272, 115002. [Google Scholar] [CrossRef] [Scilit]
- Wang, X.; Demartino, C.; Narazaki, Y.; Monti, G.; Spencer, B.F., Jr. Rapid seismic risk assessment of bridges using UAV aerial photogrammetry. Eng. Struct. 2023, 279, 115589. [Google Scholar] [CrossRef] [Scilit]
- Xu, Y.; Li, Y.; Zheng, X.; Zheng, X.; Zhang, Q. Computer-vision and machine-learning-based seismic damage assessment of reinforced concrete structures. Buildings 2023, 13, 1258. [Google Scholar] [CrossRef] [Scilit]
- Teng, S.; Chen, G.; Liu, Z.; Cheng, L.; Sun, X. Multi-sensor and decision-level fusion-based structural damage detection using a one-dimensional convolutional neural network. Sensors 2021, 21, 3950. [Google Scholar] [CrossRef] [Scilit] [PubMed]
- Hassani, S.; Dackermann, U.; Mousavi, M.; Li, J. A systematic review of data fusion techniques for optimized structural health monitoring. Inf. Fusion 2024, 103, 102136. [Google Scholar] [CrossRef] [Scilit]
- Zhao, F.; Zhang, C.; Geng, B. Deep multimodal data fusion. ACM Comput. Surv. 2024, 56, 216. [Google Scholar] [CrossRef] [Scilit]
- Hai, L.; Wang, B.; Zhang, T.; Guo, W.; Zhang, Q.; Ma, Z. Multi-modal sensing data fusion for bridge displacement estimation: A review. Intell. Transp. Infrastruct. 2025, 4, liaf023. [Google Scholar] [CrossRef] [Scilit]
- Zhang, R.; Liu, Y.; Sun, H. Physics-guided convolutional neural network (PhyCNN) for data-driven seismic response modeling. Eng. Struct. 2020, 215, 110704. [Google Scholar] [CrossRef] [Scilit]
- Wang, R.; Li, J.; Li, L.; An, S.; Ezard, B.; Li, Q.; Hao, H. Structural damage identification by using physics-guided residual neural networks. Eng. Struct. 2024, 318, 118703. [Google Scholar] [CrossRef] [Scilit]
- Deng, H.; Xu, L.; Deng, Z.; Gao, Y.; Zhang, C. Visual damage quantification and its correlation with structural performance for RC double-column piers after earthquake. China J. Highw. Transp. 2026, 39. Available online: https://link.cnki.net/urlid/61.1313.U.20260526.1438.008 (accessed on 16 October 2026). (In Chinese)
- Chen, J.; Chen, B.; Li, G.; Zheng, H.; Liu, J.; Xu, X. Experimental Study on the Seismic Performance of Reinforced Concrete Bridge Piers with Welded Reinforcement Cages. Appl. Sci. 2026, 16, 8137. [Google Scholar] [CrossRef] [Scilit]
- Lin, S.; Xia, Z.; Xia, J. Seismic Damage Model of Bridge Piers Subjected to Biaxial Loading Considering the Impact of Energy Dissipation. Appl. Sci. 2019, 9, 1481. [Google Scholar] [CrossRef] [Scilit]

Disclaimer/Publisher’s Note: The statements, opinions and data contained in all publications are solely those of the individual author(s) and contributor(s) and not of MDPI and/or the editor(s). MDPI and/or the editor(s) disclaim responsibility for any injury to people or property resulting from any ideas, methods, instructions or products referred to in the content. |
© 2026 by the authors. Licensee MDPI, Basel, Switzerland. This article is an open access article distributed under the terms and conditions of the Creative Commons Attribution (CC BY) license.