


Abstract
Machine learning (ML) models trained on pooled experimental and finite element method (FEM) data may achieve high accuracy without reliable generalization to independent experimental studies. This study evaluates the ultimate shear capacity of 498 reinforced concrete deep beams with web openings (201 experimental and 297 FEM specimens) using Monte Carlo validation, SHAP analysis, leave-one-original-study-out (LOSO) validation, and conformal prediction. The baseline models use nine parameters: a/H, ax/a, ay/H, Xo/a, Yo/H, ρsw, ρs, , and fy. The FEM specimens contain square web openings, whereas the experimental dataset includes different opening geometries. Despite high pooled accuracy (R2 ≈ 0.99), substantial differences in geometric scale and response distributions limit its interpretation. In the pooled Random Forest model, the mean absolute SHAP attribution of ρsw was 1234 kN, with opposite mean signed contributions for experimental (−1443 kN) and FEM (+1074 kN) specimens. Sensitivity analyses showed that these attributions depend on model specification and data composition rather than representing direct physical effects. LOSO validation revealed poor cross-study generalization, with median R2 values of −11.503 for Random Forest and −18.233 for tuned XGBoost under pooled training; negative values persisted under experimental-only training. These findings highlight the need for source-specific evaluation, scale-aware modeling, and independent experimental validation before engineering application.
1. Introduction
In modern construction, reinforced concrete deep beams (RCDBs) are widely used in tall buildings, bridges, foundations, and offshore structures due to their high shear capacity and ability to resist significant lateral loads. According to the ACI [1] and ECCP standards [2], a beam is classified as a deep beam when its clear span does not exceed four times its overall depth. In contrast, Eurocode [3] defines a deep beam as one with a clear span not exceeding three times its depth. The behavior of reinforced concrete deep beams is inherently complex due to the nonlinear strain distribution across the section [4]. This behavior becomes even more complicated when web openings are introduced to accommodate service systems such as drainage pipelines, air-conditioning ducts, and electrical installations. The presence of web openings introduces geometric discontinuities within the beam depth, significantly affecting the internal force transfer mechanism. The reduction in shear capacity depends primarily on the extent to which the natural load path—defined as the line connecting the load and support points—is disrupted. This reduction becomes more pronounced when the opening fully interrupts the natural load path [5,6].
Web openings are increasingly utilized in reinforced concrete deep beam construction to accommodate essential building services. Despite their prevalence, major design standards—including ACI 318 and Eurocode 2—lack explicit closed-form expressions for such components, providing instead general provisions for the application of the Strut-and-Tie Model (STM). However, implementation of the STM faces significant challenges due to complex stress redistribution around openings. Furthermore, the selection of appropriate load paths remains highly subjective and computationally tedious.
To bridge this gap, various researchers have proposed alternative models, which can be broadly categorized into analytical and empirical approaches. Among the analytical methods, Kubik [7] developed a model based on block rotation to predict shear strength. However, the validity of this model is contingent upon the opening intersecting the primary load path—defined as the direct trajectory between the loading and support points. Furthermore, it is restricted to rectangular openings under symmetrical loading and tends to overestimate the capacity of beams with insufficient web reinforcement due to the random nature of splitting cracks. Campione and Minafò [8] developed an analytical model to predict the shear strength and load deflection behavior of reinforced concrete deep beams featuring circular openings. While this model effectively accounts for the unique geometry of circular voids, its applicability is primarily restricted to members with an exceptionally low shear span-to-depth ratio of 0.27.
In contrast, several empirical and semi-empirical formulations have been developed to provide simpler design tools. Kong et al. [9] proposed an early semi-empirical equation; however, it is restricted to beams with a shear span-to-depth ratio below 0.4 and concrete strengths under 46 MPa. For high-strength concrete, Yoo et al. [10] derived an empirical formulation, though their study neglected the influence of web reinforcement. More recently, Ibrahim et al. [11] proposed a dimensionless empirical equation based on parametric simulations. Nevertheless, its applicability is limited to a specific ratio of 0.67 and rectangular openings with an area ratio of less than 15%. Collectively, these existing formulas—whether analytical or empirical—suffer from narrow calibration ranges and fail to account for the full spectrum of nonlinear interactions in deep beam behavior.
In recent years, machine learning (ML) has been increasingly applied across various domains, including structural engineering [12,13,14,15,16,17,18,19]. In this context, data-driven ML models are capable of accurately predicting the shear capacity of deep beams by considering a wide range of input variables. This approach has been successfully implemented for solid reinforced concrete (RC) deep beams. Feng et al. [20] employed four representative ensemble learning methods—namely Random Forest (RF), Adaptive Boosting (AdaBoost), Gradient Boosting Regression Tree (GBRT), and Extreme Gradient Boosting (XGBoost)—to predict the shear strength of RC deep beams, both with and without web reinforcement. A database comprising 271 specimens was compiled for the training and testing of these models. The results indicated that while all ensemble techniques demonstrated robust performance, XGBoost emerged as the superior model. Similarly, Le Nguyen et al. [21] conducted a comparative study on the performance of several ML techniques to predict the shear strength of RC deep beams. Their results demonstrated that Gaussian Process Regression (GPR) was the most reliable and accurate model. Furthermore, the study employed the Monte Carlo method to evaluate the robustness of the models and developed a user-friendly interface to facilitate the practical application of the proposed ML framework. Based on a database comprising 840 samples and 14 input features, Megahed [22] evaluated eight prominent machine learning models: symbolic regression (SR), XGBoost, CatBoost, RF, LightGBM, support vector regression (SVR), artificial neural networks (ANNs), and GPR. The study revealed that the CatBoost model emerged as the most reliable and accurate predictive tool among the evaluated algorithms. In the research conducted by Ma et al. [23], the performance of six typical machine learning models—including KNN, DT, RF, GBDT, CatBoost, and XGBoost—was compared based on an experimental database containing 457 RCDBs, focusing on nine critical input parameters. The results show that the XGBoost model demonstrates significant superiority in terms of prediction accuracy and generalization ability. Typically, such studies aim to find the best-performing model for deep beam shear prediction leveraging collected experimental data.
In contrast, the application of machine learning methods to predict the shear strength of deep beams with openings remains relatively limited. In 2023, Saleh et al. [24] applied artificial intelligence (AI) methods to predict the shear strength of reinforced concrete deep beams with openings. SVR, Multi-Layer Perceptron (MLP), Gradient Boosting Regressor (GBR), and ensemble algorithms were evaluated using the ten most influential input parameters. The dataset consisted of a combination of 179 experimental specimens and 5032 simulated samples. Among the investigated models, the Stacking Ensemble demonstrated the best performance, achieving a coefficient of determination R2 of 0.998. Although this research reported a high pooled coefficient of determination using a database dominated by numerical specimens, the corresponding accuracy on experimental observations from independent studies remains uncertain. This limitation highlights the importance of evaluating predictive performance separately for experimental and numerical datasets. Alhayani et al. [25] developed a dataset comprising 210 simulated and 175 experimental results. An ANN model was employed and demonstrated excellent predictive capability. The model achieved correlation coefficients R2 of 0.99 and 0.96 for the training and testing sets, respectively, in predicting shear strength. Ismael et al. [26] employed machine learning techniques to predict the shear strength of deep beams strengthened with Ni–Ti shape memory alloys. Six models were systematically assessed using a dataset of 180 samples generated from Abaqus simulations. Among the examined models, the SVM exhibited the best performance, achieving R2 values of 0.957 and 0.956 for the training and testing sets, respectively. Nevertheless, because the model was trained and evaluated exclusively on numerical simulations, its predictive performance on independent experimental specimens remains unverified.
Despite growing ML application in structural engineering, the specific domain of RC deep beams with web openings has received limited systematic study. Four gaps motivate this work:
(i) The bias caused by merging FEM and experimental data remains unaddressed. While combining simulation results with experimental data is now standard practice, it often introduces confounding bias—especially when certain parameters are kept constant in FEM models. This issue is widespread across structural machine learning research, yet no formal diagnostic has been provided. When these fixed parameters act as group identifiers, they distort feature importance rankings and lead to misleading performance reports.
(ii) Althrough Monte Carlo cross validation (MC-CV) has been widely used for robust model evaluation, to best of our knowledge, it has not been employed to distinguish between apparent predictive performance and genuine experimental generalization in machine learning models for shear strength prediction of reinforced concrete deep beam with web opening.
(iii) Current research lacks rigorous cross-source validation. Although previous studies [20,22,23,27,28,29] reported high predictive accuracy (R2 = 0.91–0.99), these evaluations were primarily based on conventional train–test splits or single-source datasets. Consequently, they do not quantify performance heterogeneity across independent data sources or assess whether the models generalize to specimens from previously unseen laboratories. Leave-one-study-out (LOSO) cross-validation, widely regarded as a robust protocol for evaluating cross-source generalization in medical AI [29], has not yet been applied to machine learning models for deep beam shear strength prediction.
(iv) Uncertainty quantification remains unoptimized for datasets that mix simulation and experimental results. When standard conformal prediction is applied to combined FEM–experimental data, the different error scales of these two sources often lead to distorted results. Specifically, the resulting prediction intervals for experimental data become far too wide for practical engineering use. To date, group-conditional calibration—a technique that adjusts uncertainty for each data source separately—has not been demonstrated for this problem.
The present study focuses on the reliability of experimental-domain predictions rather than on maximizing pooled accuracy alone. Its contributions include (i) evaluation of random-split variability and experimental-group errors; (ii) comparison of pooled and experimental-only training under matched experimental test folds; (iii) SHAP sensitivity analyses involving alternative reference backgrounds, a source indicator, and dimensional inputs; and (iv) original-study-aware validation using study-grouped Monte Carlo splitting and paired leave-one-original-study-out experiments. Together, these analyses assess the sensitivity of model predictions and feature attributions to heterogeneous training data while explicitly recognizing that source, geometric scale, material properties, and study effects cannot be fully disentangled.
2. Data Description
The database contains 498 specimens, comprising 201 experimental and 297 FEM observations. The 297 FEM specimens were obtained from numerical series reported by Saleh et al. [30]. The simulations were performed using Abaqus/Standard with the Concrete Damaged Plasticity (CDP) model, incorporating the Coronado–Lopez compressive law and fracture energy-based tensile softening. The CDP parameters included a dilation angle of 54°, eccentricity of 0.1, fb0/fc0 = 1.15, K = 0.667, and viscosity of 0.001, with mesh sizes ranging from 50 to 70 mm. Validation against four large-scale experimental beams yielded a mean experimental-to-numerical ultimate-load ratio of 0.981 (standard deviation = 0.04). All FEM specimens had a constant width of 300 mm, whereas experimental beam widths varied. The original study did not explicitly specify whether a 2D or 3D finite element formulation was used.
The experimental database compiled by Saleh et al. [24] originally contained 179 records, of which two duplicate records were removed during data cleaning, leaving 177 unique experimental specimens. These 177 specimens were traced to earlier primary studies rather than treated as a single independent experimental program. Across the full experimental subset, 18 reported source series were identified; 2 related Jasim [31] series were grouped under one experimental program, resulting in 17 original-study groups for study-aware validation. The original-study mapping and selected parameter ranges are documented in Supplementary Table S1. This distinction is essential because random specimen-level partitions may place observations from the same experimental program in both training and testing sets.
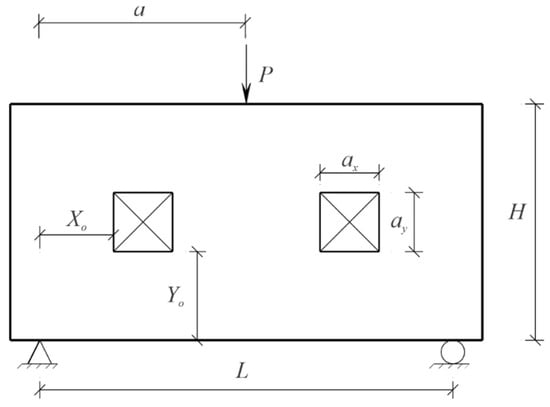
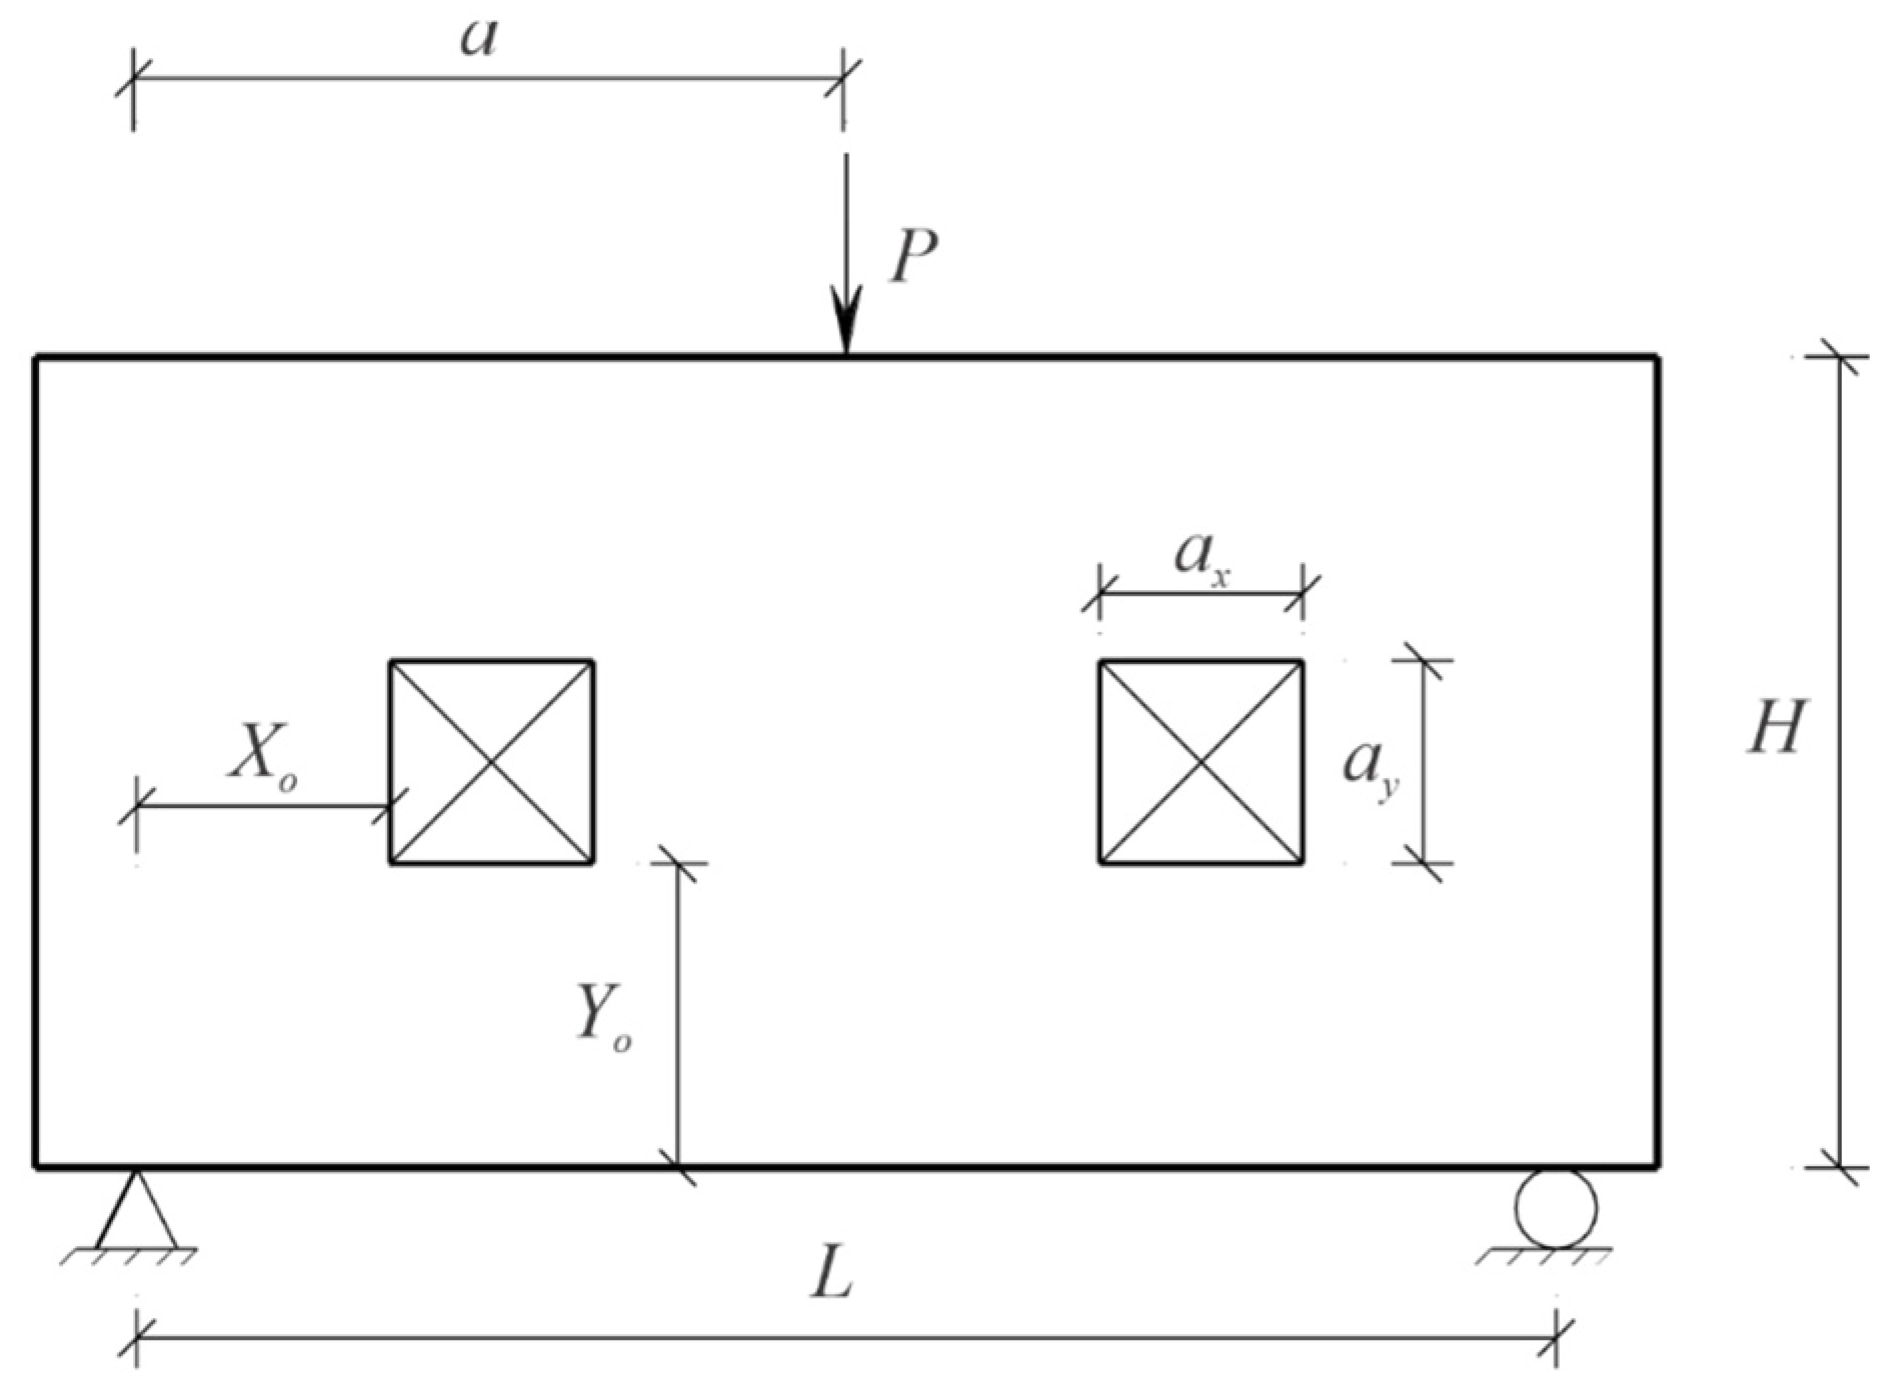
The experimental specimens were collected from five data sources, including the compilation of multiple original studies reported by Saleh et al. [24]. The corresponding numbers of specimens are summarized in Table 1. The geometry of deep beam is shown in Figure 1.
Table 1.
Database summary.
Figure 1.
Geometry of deep beam.
The distributions of absolute beam dimensions differ markedly across data sources. Of the 201 experimental beams, 197 have H = 300–800 mm and four have H = 2000 mm, whereas all 297 FEM specimens have H = 2000 mm and b = 300 mm. FEM concrete compressive strength takes three values (32, 40, and 48 MPa), compared with 19.6–132.1 MPa in the experimental subset. The term ultra-high-performance fiber-reinforced concrete (UHPFRC) is used for the Al-Enezi et al. [6] specimens. Such source-dependent distributions should be considered when interpreting pooled prediction errors and feature importance.
The benchmark model uses nine predictors: the shear-span-to-depth ratio a/H; normalized opening width ax/a and height ay/H; normalized opening coordinates Xo/a and Yo/H; the web and longitudinal reinforcement ratios ρsw and ρs; and concrete compressive strength and reinforcement yield strength fy (MPa). All geometric ratios are dimensionless, whereas reinforcement ratios should be expressed consistently as fractions or percentages throughout. The predicted response is ultimate shear capacity Vu (kN). Absolute beam depth H and width b are absent from this nine-feature benchmark and are introduced only in the geometric-scale sensitivity analysis. Opening area is not used as an independent ML feature. For the FEM subset, (ρsw, fy, and ρs) remain constant across all 297 specimens (ρsw = 0.45, fy = 537.4 MPa, ρs = 0.29), because the parametric study kept reinforcement properties fixed. A detailed comparison of the probability density distributions of the input features and ultimate shear capacity for the experimental and FEM datasets is provided in Supplementary Figure S1.
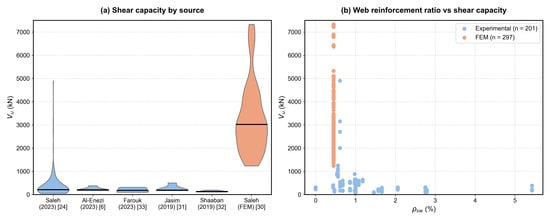
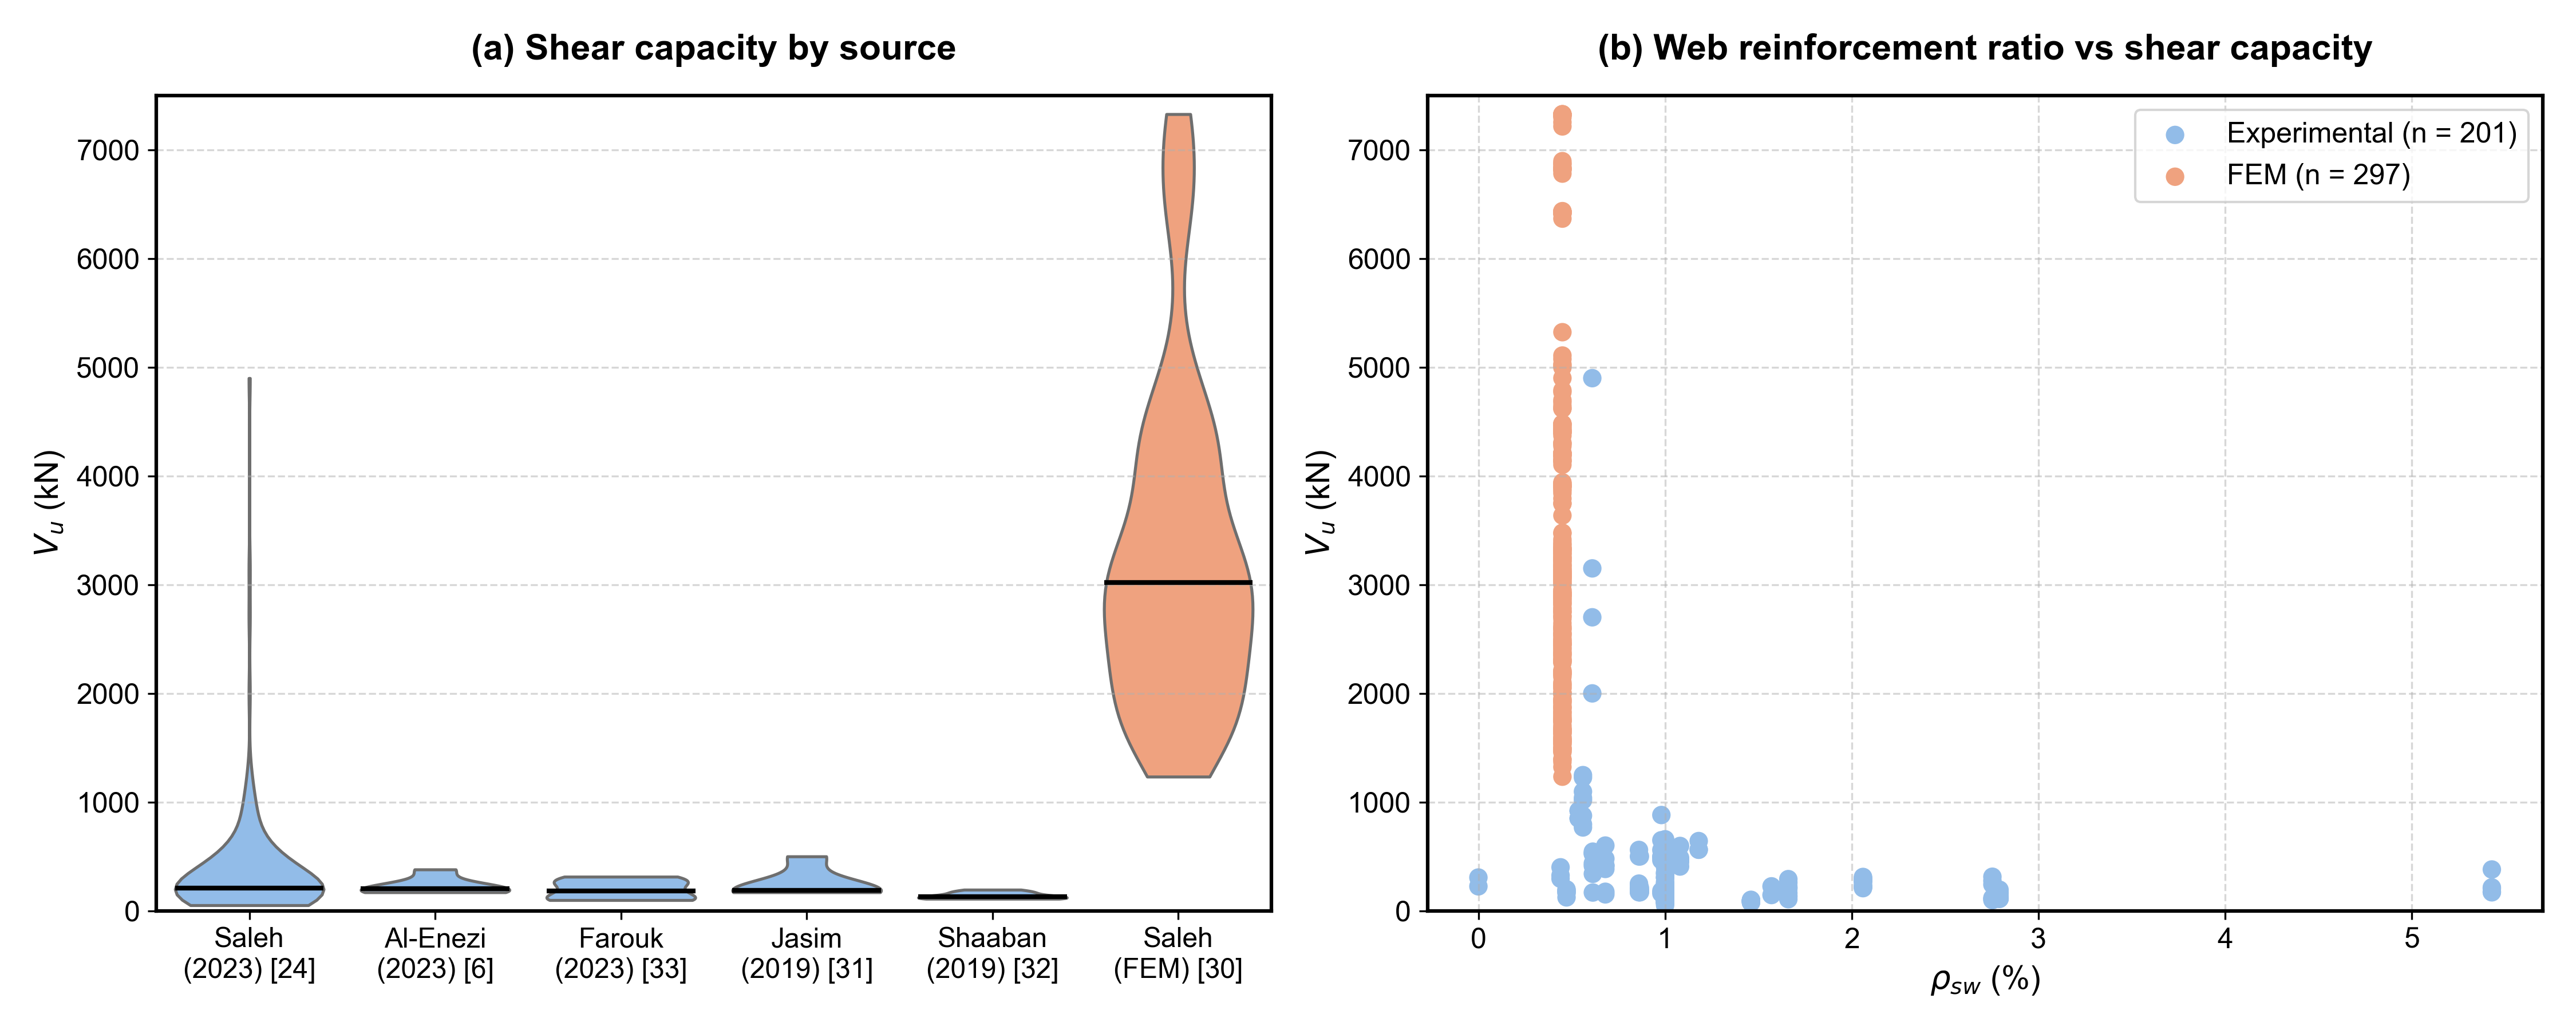
Figure 2 illustrates the structure of the dataset. Figure 2a presents a violin plot of shear capacity grouped by source, while Figure 2b depicts the relationship between web reinforcement ratio and shear capacity. The dataset exhibits a pronounced separation in beam height distributions, with 197 experimental specimens having heights of 300–800 mm, while the remaining four experimental specimens and all 297 FEM specimens have a height of 2000 mm. No specimens have heights between 800 and 2000 mm, indicating a substantial gap in the geometric scale represented by the database. This difference in geometric scale may partly contribute to the distinct distributions of ultimate shear capacity between the experimental and FEM groups, as illustrated Figure 2a.
Figure 2.
Database structure. (a) Violin plot of shear capacity by source [6,24,30,31,32,33]; (b) scatter plot of ρsw (web reinforcement ratio, %) versus Vu (kN).
The FEM subset accounts for 297 of the 498 specimens (59.6%), whereas the Saleh experimental compilation contributes 177 of the 201 experimental records (88.1%). However, these records originate from multiple primary experimental studies. The experimental capacity distribution is highly skewed, with only nine of the 201 specimens exceeding 1000 kN. Additional information on original-study provenance and study-grouped validation results is provided in Supplementary Sections S1–S3. These differences highlight the importance of accounting for data heterogeneity when evaluating model performance and generalization to independent experimental studies.
3. Methodology
3.1. Analysis Pipeline
The analysis follows eight sequential steps: (1) exploratory data analysis, (2) 18-model screening, (3) hyperparameter tuning, (4) SHAP analysis, (5) Monte Carlo cross-validation, (6) feature reduction, (7) leave-one-study-out validation, and (8) conformal prediction.
3.2. Train–Test Split
The primary dataset is split 80/20, yielding 398 training and 100 test specimens. The test set contains 43 experimental (43%) and 57 FEM (57%) specimens. This split is used for point-estimate comparisons, while Monte Carlo cross-validation (Section 3.6) evaluates sensitivity to the split over 300 independent random partitions.
3.3. Model Screening
A total of 18 models from four categories are evaluated using default hyperparameters. These include linear models (LR, Ridge, Lasso, ElasticNet), tree and ensemble-based models (DT, RF, GBR, AdaBoost, Bagging, XGBoost, LightGBM, CatBoost), kernel and distance-based models (SVR, KNN, and GPR with RBF, Matérn, and Rational Quadratic kernels), and a neural network model (MLP). Model performance is assessed using R2, MAE (kN), and MAPE (%). The results are reported for both the pooled dataset (i.e., the full dataset) and for each subgroup separately, namely the experimental and FEM datasets.
3.4. Hyperparameter Tuning Method
Recent applications of machine learning in structural engineering, such as Asgar-khani et al. [34], have highlighted the importance of systematic model development and performance evaluation. Hyperparameter optimization was initially performed for XGBoost and CatBoost using Optuna’s TPE sampler with 20 trials and five-fold cross-validation on the training set, aiming to maximize pooled R2. Additional tuning of Random Forest and LightGBM was conducted for comparison. Model screening and pooled feature reduction employed 10-fold cross-validation, whereas hyperparameter tuning, training-composition comparisons, and experimental-only feature reduction used five-fold cross-validation. The hyperparameter search spaces and tuning results are provided in Supplementary Table S8. Alternative optimization objectives for XGBoost, including source-balanced and experimental-targeted criteria, are examined in Supplementary Table S7. All hyperparameters were selected using training data only, with the hold-out test set reserved for final evaluation.
3.5. SHAP Analysis
SHAP (SHapley Additive exPlanations) values were computed using TreeSHAP for a representative Random Forest (RF) model trained on the nine input features. RF was selected as a well-performing tree-based model in the initial screening (Section 4.1), providing a consistent basis for examining feature attributions. SHAP values quantify model-specific contributions to predicted shear capacity rather than physical or causal effects.
Section 4.1 presents the TreeSHAP results for a single random forest (RF) model trained on the pooled dataset, using the tree path-dependent approach and a common baseline of 2133 kN. SHAP values were summarized separately for the experimental (n = 43) and FEM (n = 57) test specimens. The experimental-only results were obtained using a separately trained RF model with a baseline of 357 kN. To assess the sensitivity of SHAP attributions to the reference distribution and fitted model, additional interventional TreeSHAP analyses were performed on the same 43 experimental specimens (Supplementary Table S6). The dependence plots are provided in Supplementary Figure S2.
3.6. Monte Carlo Cross-Validation
To evaluate robustness, 300 independent 80/20 random splits are generated. For each split, models are retrained from scratch and evaluated, with performance reported separately for experimental and FEM groups.
Results are summarized as the mean ± standard deviation. Monte Carlo analysis is performed for four default models (XGB, CatB, RF, LightGBM) and the tuned XGBoost model.
3.7. Leave-One-Study-Out Validation
To assess transferability across experimental programs, the 201 experimental specimens were classified into 17 groups based on their original study identifiers. Leave-one-original-study-out validation was performed for the 13 groups containing at least five specimens, resulting in 13 test folds. In each fold, the withheld study was used only for testing, and the same experimental test observations were evaluated under two training configurations: (i) a pooled model trained on the remaining experimental specimens plus all 297 FEM observations and (ii) an experimental-only model trained on the remaining experimental specimens without FEM observations. Performance was reported using R2, MAE, and RMSE; R2 was interpreted cautiously for small withheld groups. The complete study-level comparisons are provided in Supplementary Table S3.
3.8. Conformal Prediction
Uncertainty is quantified using split conformal prediction with a 64/16/20 partition (training/calibration/test), corresponding to approximately 319/79/100 specimens. Models are retrained on the 64% training subset. Two approaches are compared: (i) standard conformal prediction: a single global prediction interval; (ii) group-conditional conformal prediction: separate intervals for experimental and FEM data. The target nominal coverage is 90%.
4. Results
4.1. Model Performance
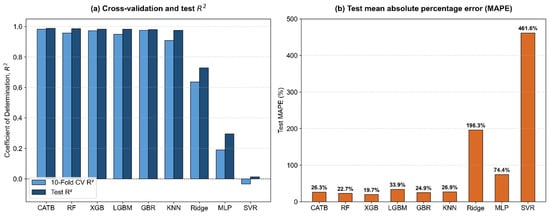
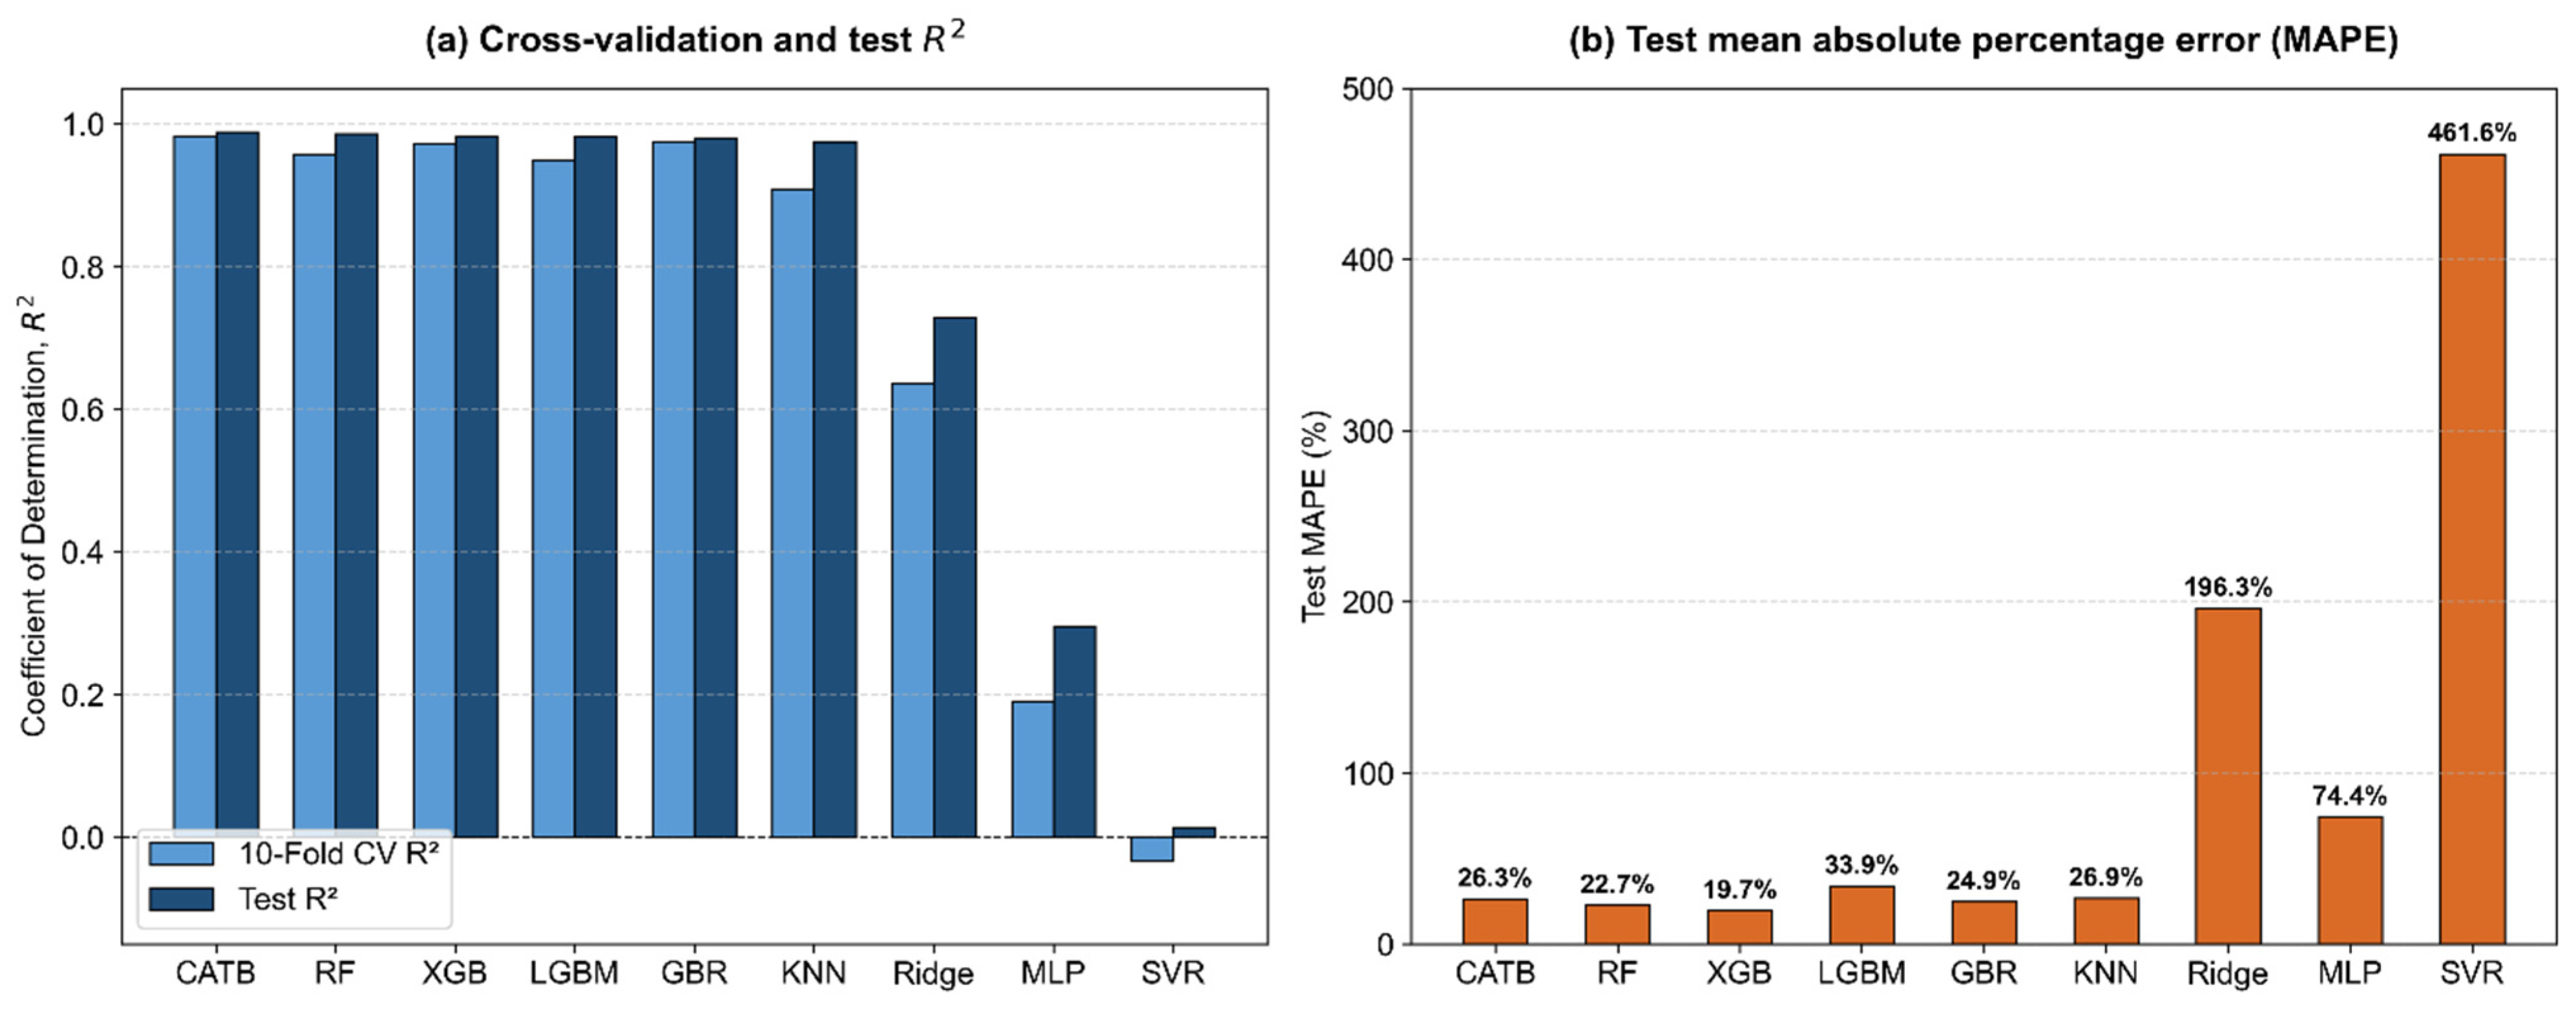
Table 2 and Figure 3 summarize the performance of nine representative models. Figure 3a compares cross validation and test R2 while Figure 3b shows test MAPE. The five tree-based ensembles shown in Table 2 achieve high pooled performance (test R2 ≈ 0.98). In contrast, Ridge, MLP, and SVR exhibit substantially lower performance and much larger MAPE. All models were evaluated using default hyperparameters; therefore, the poor default performance of MLP and SVR should not be interpreted as an inherent limitation of these model families. The lower scores of the evaluated default linear and kernel configurations may reflect nonlinear interactions among opening geometry, reinforcement, and material variables.
Table 2.
Screening results (selected models; sorted by test R2). Pooled metrics (43 exp + 57 FEM test specimens).
Figure 3.
Model screening results for the nine models listed in Table 2. (a) Cross-validation and test R2; (b) test mean absolute percentage error.
However, the pooled R2 values can be misleading, as they may obscure dataset-specific biases and mask differences in model generalization across heterogeneous data sources. Table 3 decomposes model performance by data group and reveals a clear and systematic divergence, based on the four best-performing models identified above, namely CatBoost, RF, XGBoost, and LightGBM. The models perform very well on the FEM dataset (MAPE = 4.1–6.3%), whereas their performance on the experimental dataset is substantially lower (MAPE = 40.3–70.5%). This discrepancy is expected. The FEM data are generated from a single parametric study with a fixed beam height of H = 2000 mm, resulting in a smooth, low-noise, and consistent response surface. As such, the task is essentially an interpolation problem that can be effectively handled by tree-based models. In contrast, the experimental data are collected from different laboratories, with variations in scale, material properties, and testing protocols.
Table 3.
Within-group single-split performance on the primary 80/20 test set (43 experimental + 57 FEM specimens).
4.2. Hyperparameter Tuning
The hyperparameter tuning results obtained using a 20-trial Optuna TPE framework (gbtree booster) are summarized in Table 4. Overall, the impact of tuning varies across data groups, with the most significant improvement observed for the experimental dataset.
Hyperparameter optimization did not consistently improve all evaluation metrics. In the pooled-R2 objective configuration reported in Table 4 and Supplementary Table S7, XGBoost experimental R2 increased from 0.7277 to 0.8960, but experimental MAPE increased from 40.3% to 55.6%; thus, the higher R2 should not be described as a uniform improvement in prediction accuracy. The corresponding XGBoost results are also reported in the four-model hyperparameter tuning comparison presented in Supplementary Table S8B. Under experimental-targeted MAPE optimization in Supplementary Table S7, experimental MAPE decreased from 55.6% to 38.1%, illustrating the importance of matching the tuning objective to the target prediction domain. Performance on the full dataset changes only marginally (: 0.9833 → 0.9878), while FEM performance slightly decreases (: 0.9720 → 0.9715), suggesting that the default model is already well optimized for the synthetic data.
The improved generalization on experimental data can be attributed to the adoption of a shallow tree structure (max_depth = 3) combined with high subsampling ratios. This regularization strategy prevents the model from memorizing source-specific patterns—particularly those associated with dominant datasets—and instead encourages learning of more generalizable relationships governing shear capacity.
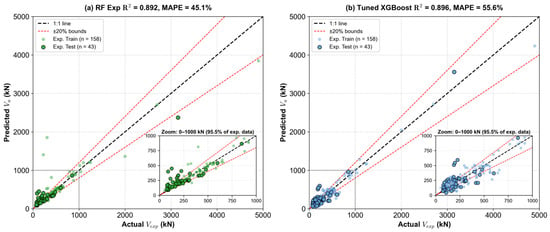
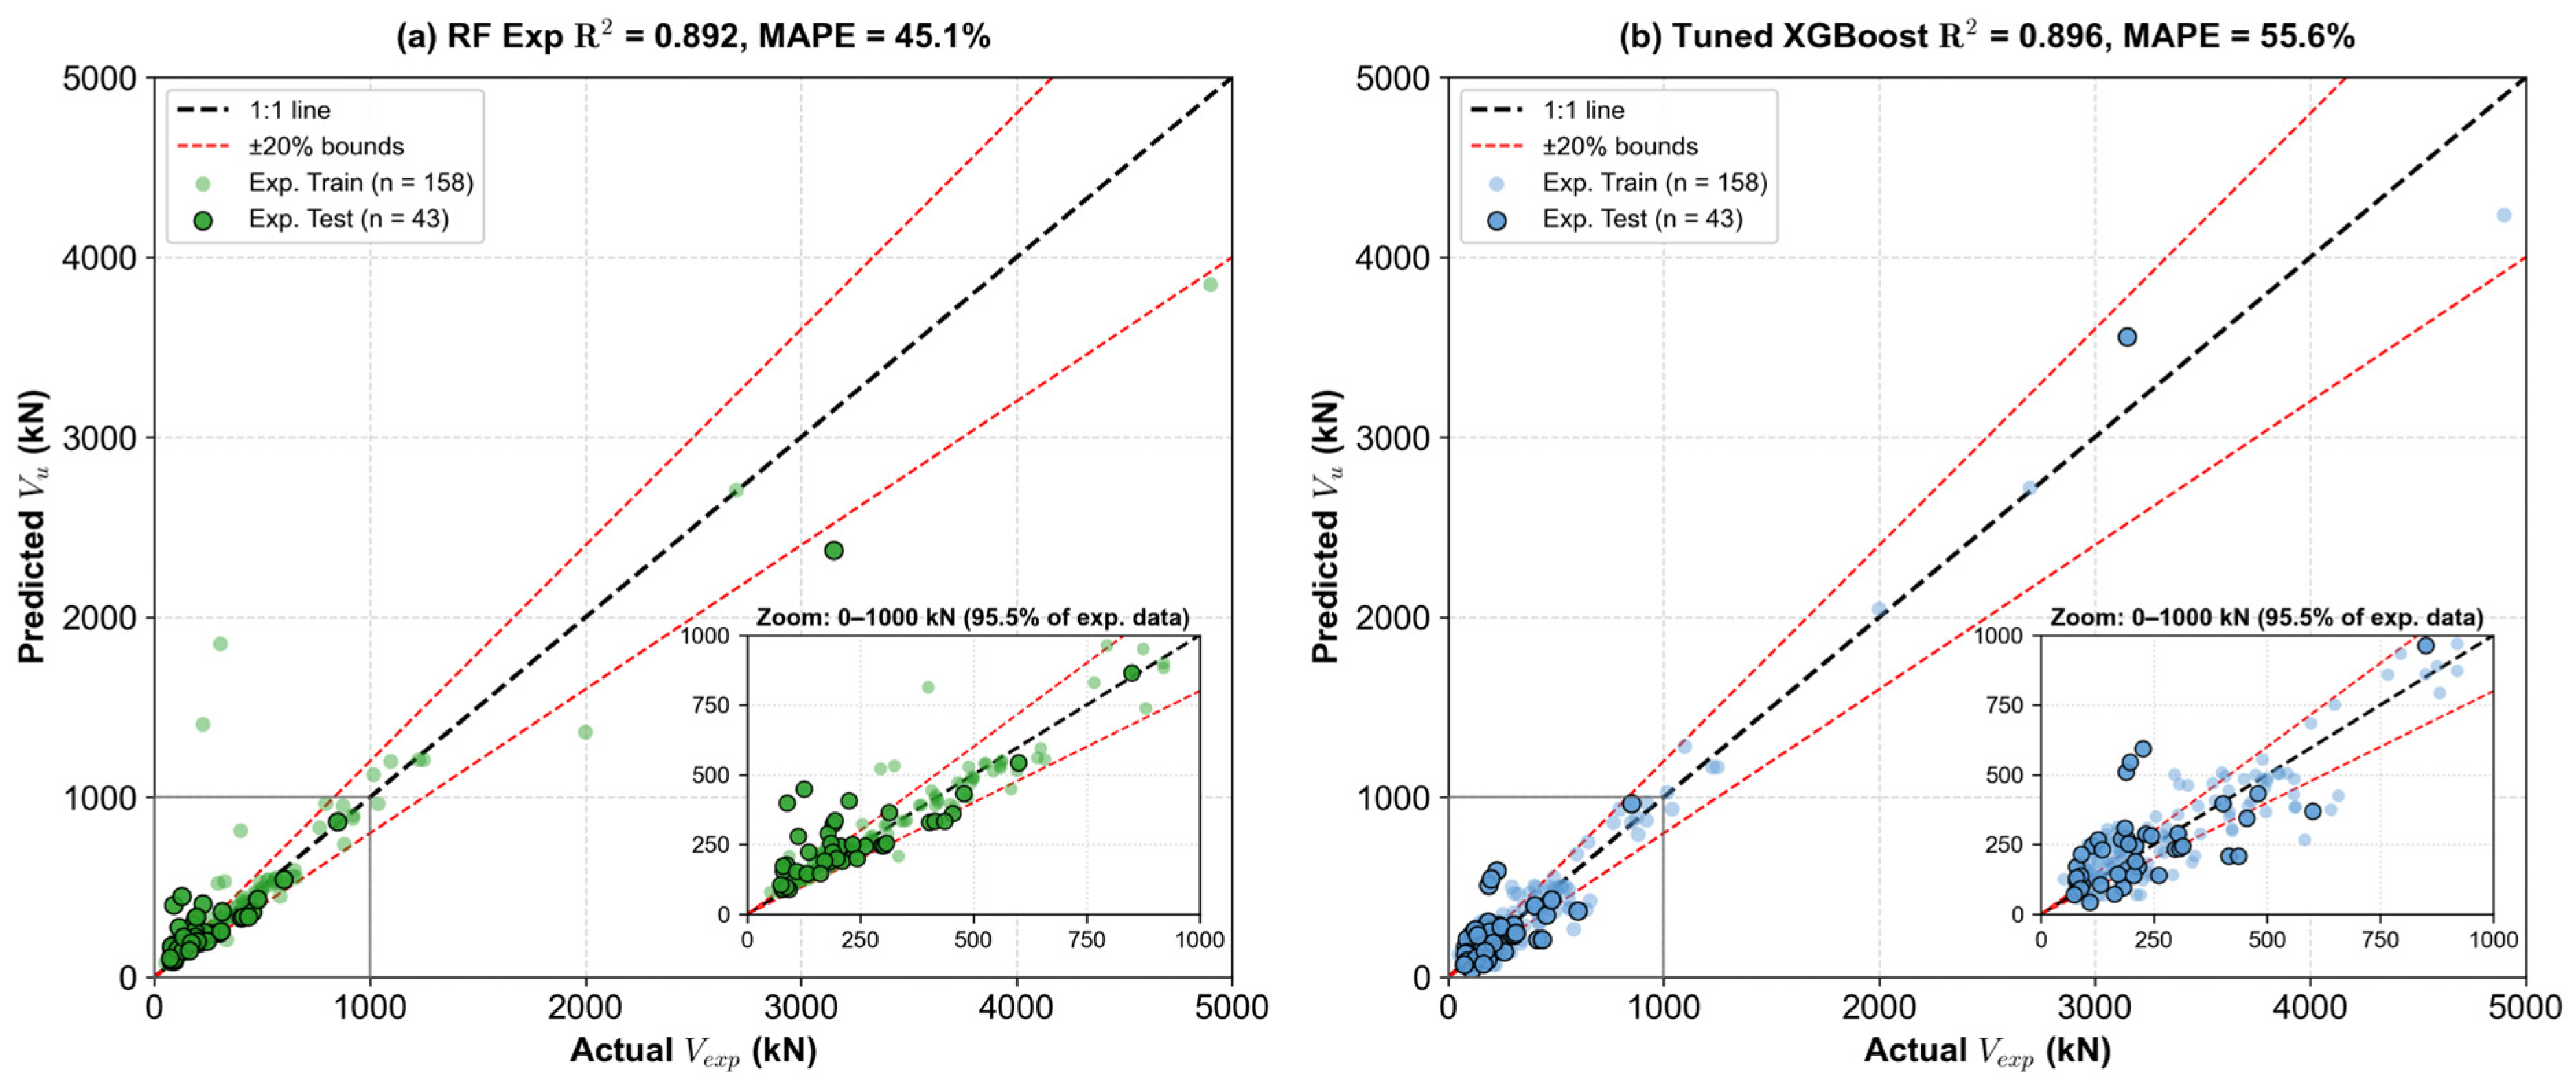
Figure 4 explains why tuning improves R2 but not MAPE. Both RF (Figure 4a) and tuned XGBoost (Figure 4b) are broadly centered on the 1:1 line, indicating no clear systematic bias. Dashed lines indicate ±20% bounds. The main residual spread occurs for low-capacity specimens (Vu < 200 kN), where percentage errors are amplified. Tuned XGBoost tightens the scatter for medium- and high-capacity specimens, but a small number of low-capacity errors keeps MAPE higher than the default XGBoost result in Table 4.
Figure 4.
Predicted versus actual experimental shear capacity for (a) RF and (b) tuned XGBoost.
In contrast, CatBoost does not benefit from hyperparameter tuning under the same optimization configuration. While the predictive performance on the FEM dataset improves slightly (R2: 0.9748 → 0.9765), the overall generalization performance deteriorates, especially on the experimental dataset (R2: 0.9037 → 0.8290; MAPE: 55.5% → 82.5%). This indicates that the default CatBoost configuration is already well matched to the characteristics of the dataset, and additional tuning with only 20 optimization trials may result in over-regularization or convergence to suboptimal hyperparameter settings.
Table 4.
Tuning results (20-trial Optuna TPE, gbtree booster).
The experimental capacity distribution was strongly imbalanced, with only 9 of the 201 experimental specimens exhibiting capacities above 1000 kN. Among the 43 experimental hold-out specimens, only three belonged to this high-capacity range. The corresponding MAE was substantially larger than that of the remaining specimens (283.8 versus 69.9 kN for RF; 270.3 versus 92.2 kN for tuned XGBoost). These results indicate larger absolute prediction errors in the sparsely represented high-capacity range. However, the small number of high-capacity observations and the scale dependence of MAE do not, by themselves, establish worse relative prediction accuracy in this range.
4.3. Between-Group Confounding: The ρsw Direction Reversal
In the FEM dataset, ρsw, fy, and ρs are kept constant across all 297 specimens. As a result, these variables do not act as independent physical predictors in the pooled model, but instead implicitly indicate the data group. This explains why the strong Spearman correlation between ρsw and Vu in the full dataset (ρ = −0.7964) primarily reflects the systematic capacity difference between large-scale FEM beams and smaller experimental beams, rather than a true within-group physical relationship.
RF is used as the reference model for SHAP-based feature importance analysis. This choice is motivated by three considerations: (i) RF is among the top-performing models in the screening stage (Section 4.1, test R2 = 0.9860), making its importance ranking representative of the best-performing tree-ensemble family; (ii) the bootstrap aggregation in RF yields lower-variance SHAP estimates than gradient-boosted alternatives, which is desirable when the focus is on stable feature ranking rather than predictive optimization; and (iii) RF SHAP values are mechanistically interpretable and do not depend on hyperparameter-specific regularization strength, allowing for direct comparison between the pooled and experimental-only models in Table 5.
In the pooled RF model, the web reinforcement ratio ρsw exhibited opposite mean signed SHAP contributions for experimental (−1443 kN) and FEM (+1074 kN) test specimens, while its pooled mean absolute attribution was 1234 kN (Figure 5). This pattern reflects different model-relative contributions across two groups with markedly different predictor distributions. It is consistent with ρsw carrying source-associated information, but it does not establish a causal reinforcement effect, nor can it uniquely distinguish source identity from correlated geometric-scale and material differences. For this reason, the SHAP results are interpreted as predictive diagnostics rather than physical derivatives of shear capacity.
Table 5.
Feature importance: pooled model vs. experimental-only model (RF; mean |SHAP| and signed SHAP in kN).
Figure 5.
SHAP feature importance by data group (all, experimental, FEM).
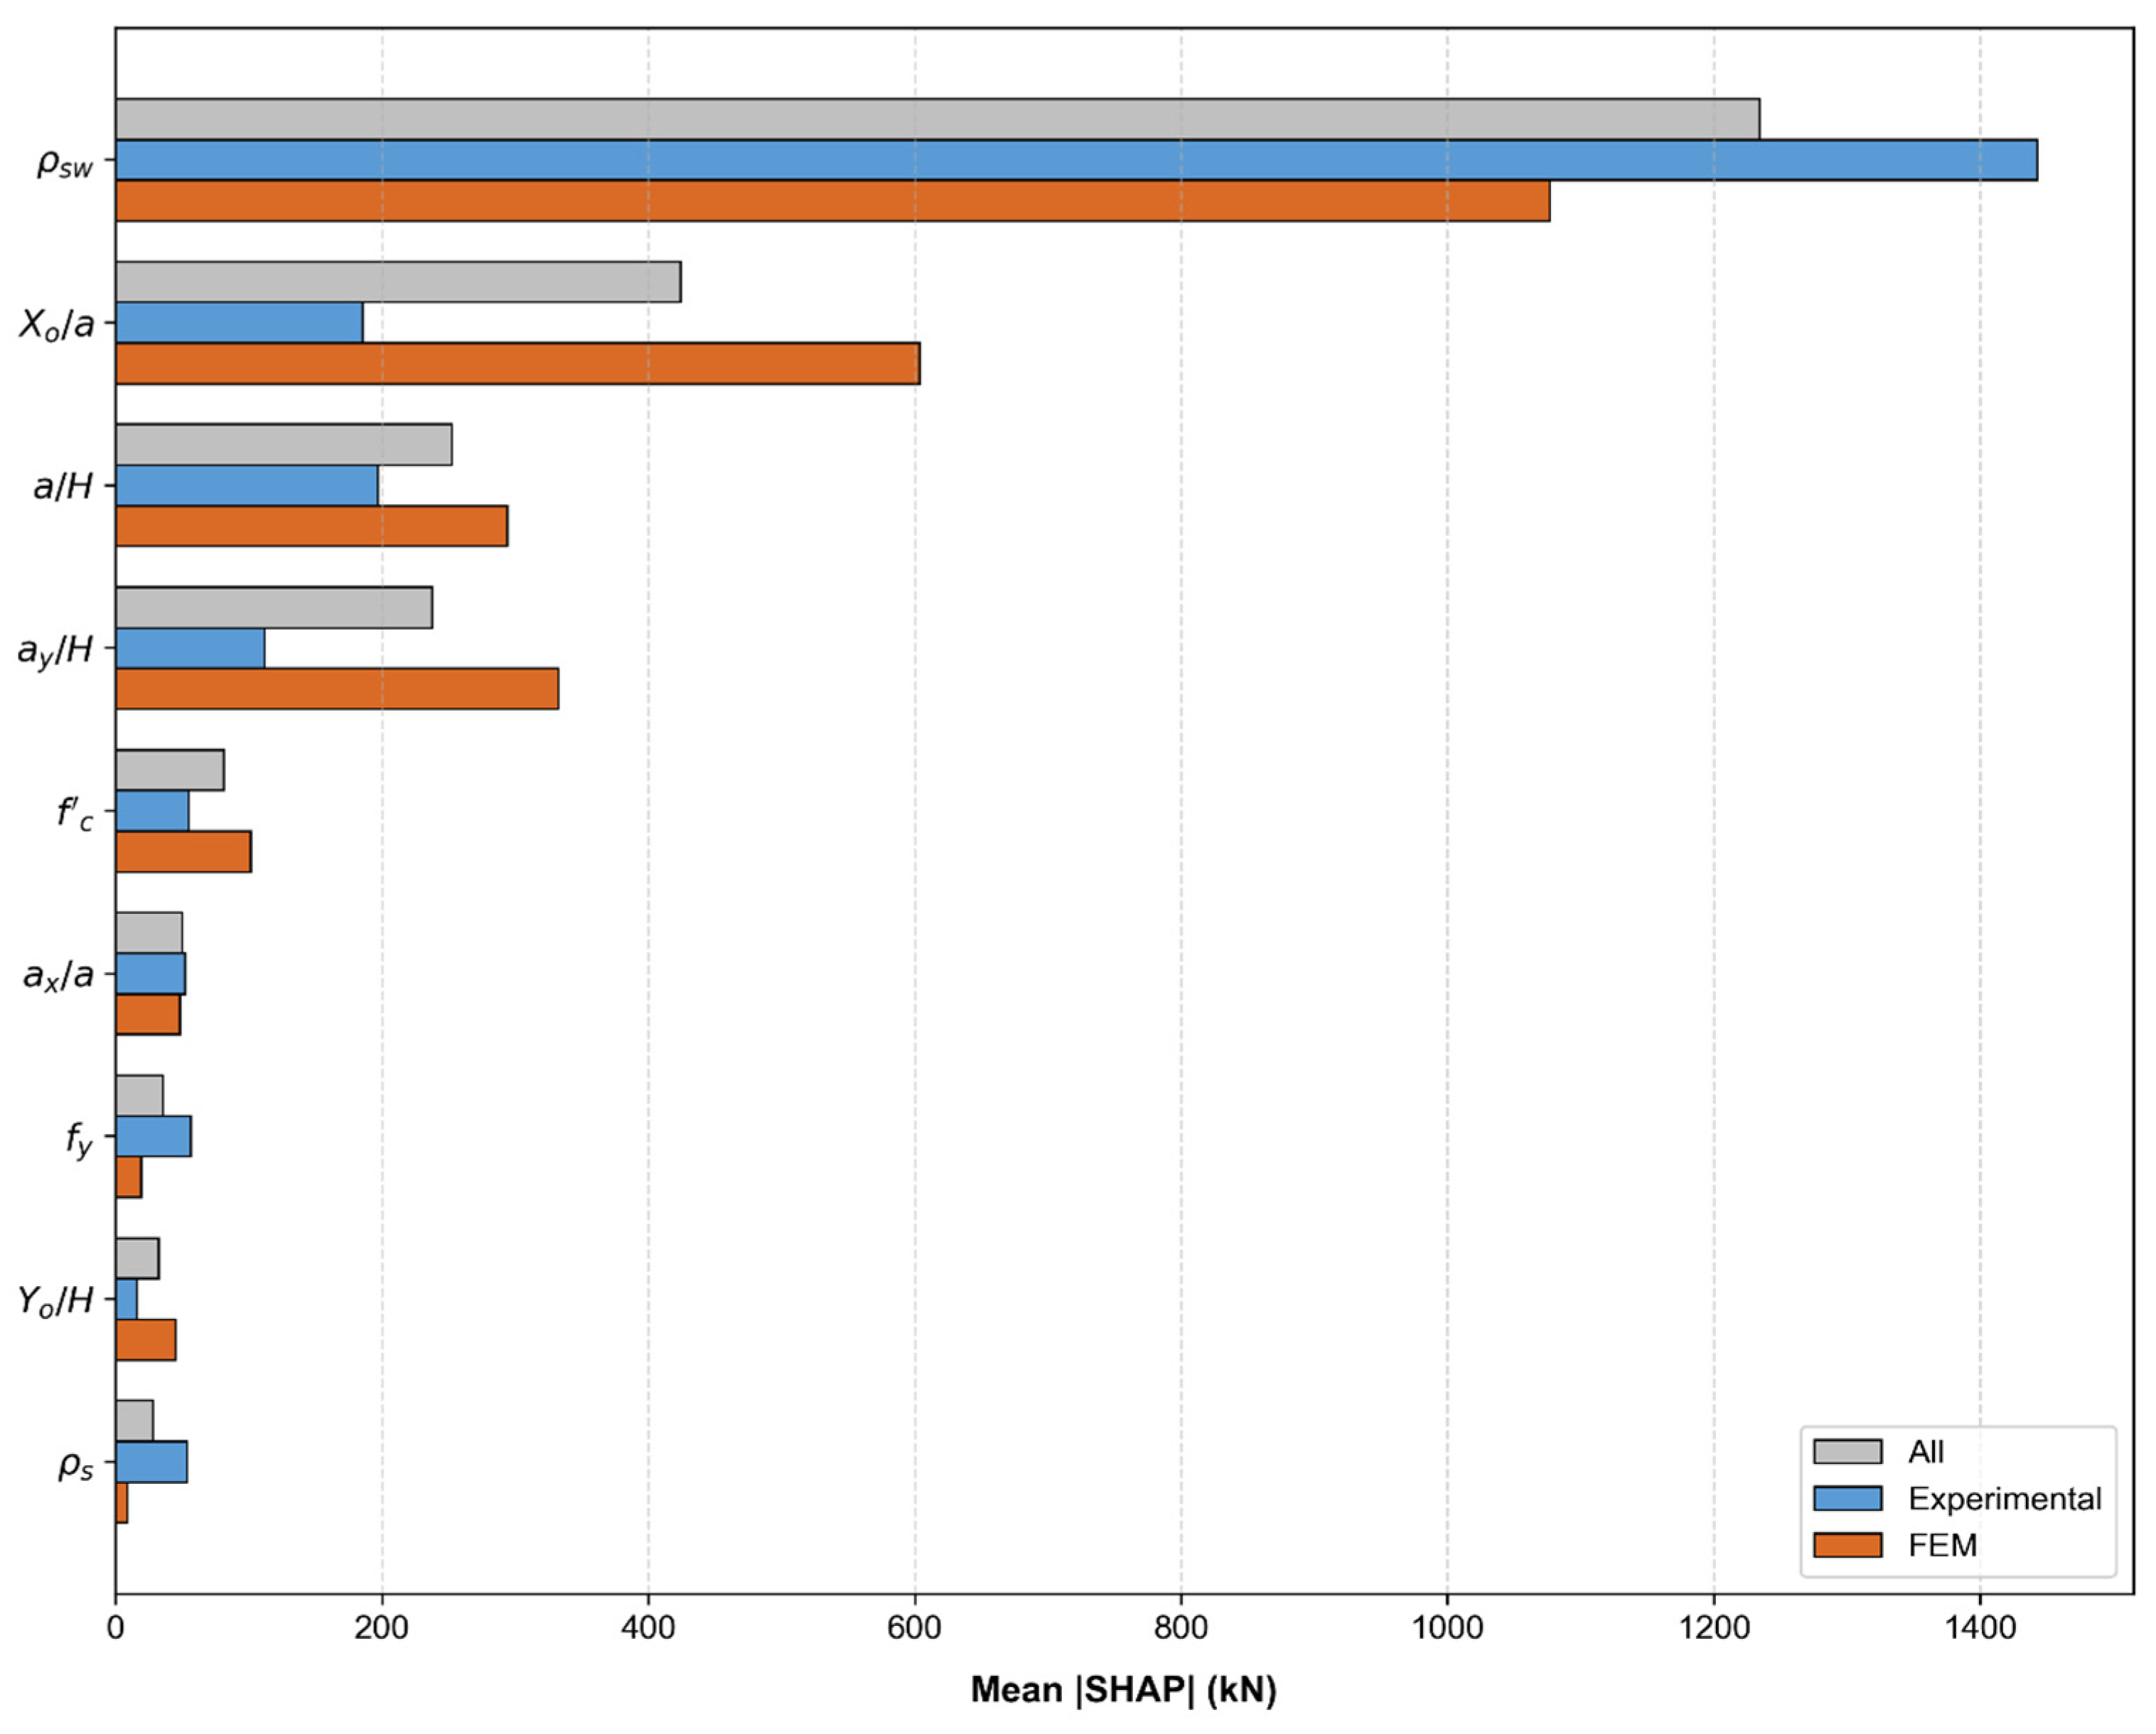
Table 5 further highlights the shift in feature importance when comparing the pooled model with the experimental-only model. In the pooled model, several variables—particularly ρsw, Xo/a, and ay/H—appear highly influential, with large SHAP magnitudes. However, when the model is trained only on experimental data, their importance is substantially reduced and their contributions become more moderate and physically consistent. The pooled model uses a common baseline of 2133.0 kN; the separately trained experimental-only model uses a baseline of 357 kN. The two model-specific baselines should not be treated as interchangeable.
Most notably, the experimental-only model restores ρsw to the physically expected positive direction (+5 kN), while a/H becomes the dominant feature (rank 1), consistent with its role in governing the transition between arch-action and beam-action behavior in deep beams. In contrast, the pooled model assigns ρsw the highest importance (rank 1, |SHAP| = 1234 kN), which is not supported by the experimental-only analysis.
The substantial reduction in ρsw importance (from 1234 to 62 kN) confirms that its dominant role in the pooled model is primarily driven by differences between datasets rather than intrinsic physical influence. Overall, the experimental-only model provides a more reliable representation of the underlying mechanics, while the pooled model tends to overemphasize features that reflect dataset composition.
A controlled interventional TreeSHAP analysis was performed on the same 43 experimental hold-out specimens (Supplementary Table S6). With the fitted pooled RF model held fixed, changing the reference background from the pooled training set to the experimental training subset decreased the mean absolute SHAP attribution of ρsw from 1527 to 92 kN (94.0%). Replacing the fitted model with an experimental-only RF while retaining the same experimental background reduced it further to 60 kN. The background-sensitivity results are not directly interchangeable with the tree-path-dependent benchmark attributions in Table 5. In a complementary pooled-model sensitivity analysis, introducing a binary FEM source indicator decreased the mean absolute ρsw attribution from 1234 to 29 kN (Supplementary Section S5.2).
When the absolute dimensions H and b were added to the baseline RF inputs, the pooled mean absolute SHAP attribution of ρsw decreased from 1234 to 15 kN, whereas b and H became leading contributors with mean absolute attributions of 769 and 613 kN, respectively (Supplementary Table S5). This sensitivity to feature representation supports caution in attributing the original pooled SHAP ranking exclusively to the data source.
Table 6 compares the predictive performance of models trained with and without FEM data on experimental specimens. To ensure a fair comparison, paired five-fold cross-validation was performed using identical experimental test folds for both training configurations. For Random Forest, excluding FEM data increased the global out-of-fold R2 from 0.242 to 0.716 and reduced the MAE from 137.3 to 94.5 kN. For tuned XGBoost, excluding FEM data reduced the MAE from 94.8 to 80.9 kN, although R2 decreased slightly from 0.813 to 0.777. These results suggest that including FEM data does not necessarily improve predictions for experimental specimens. However, the observed differences cannot be attributed solely to data source, as the experimental and FEM datasets also differ substantially in geometric dimensions and material properties.
Table 6.
Effect of FEM data inclusion on experimental prediction accuracy (experimental-set 5-fold CV; n = 201).
4.4. Monte Carlo Cross-Validation
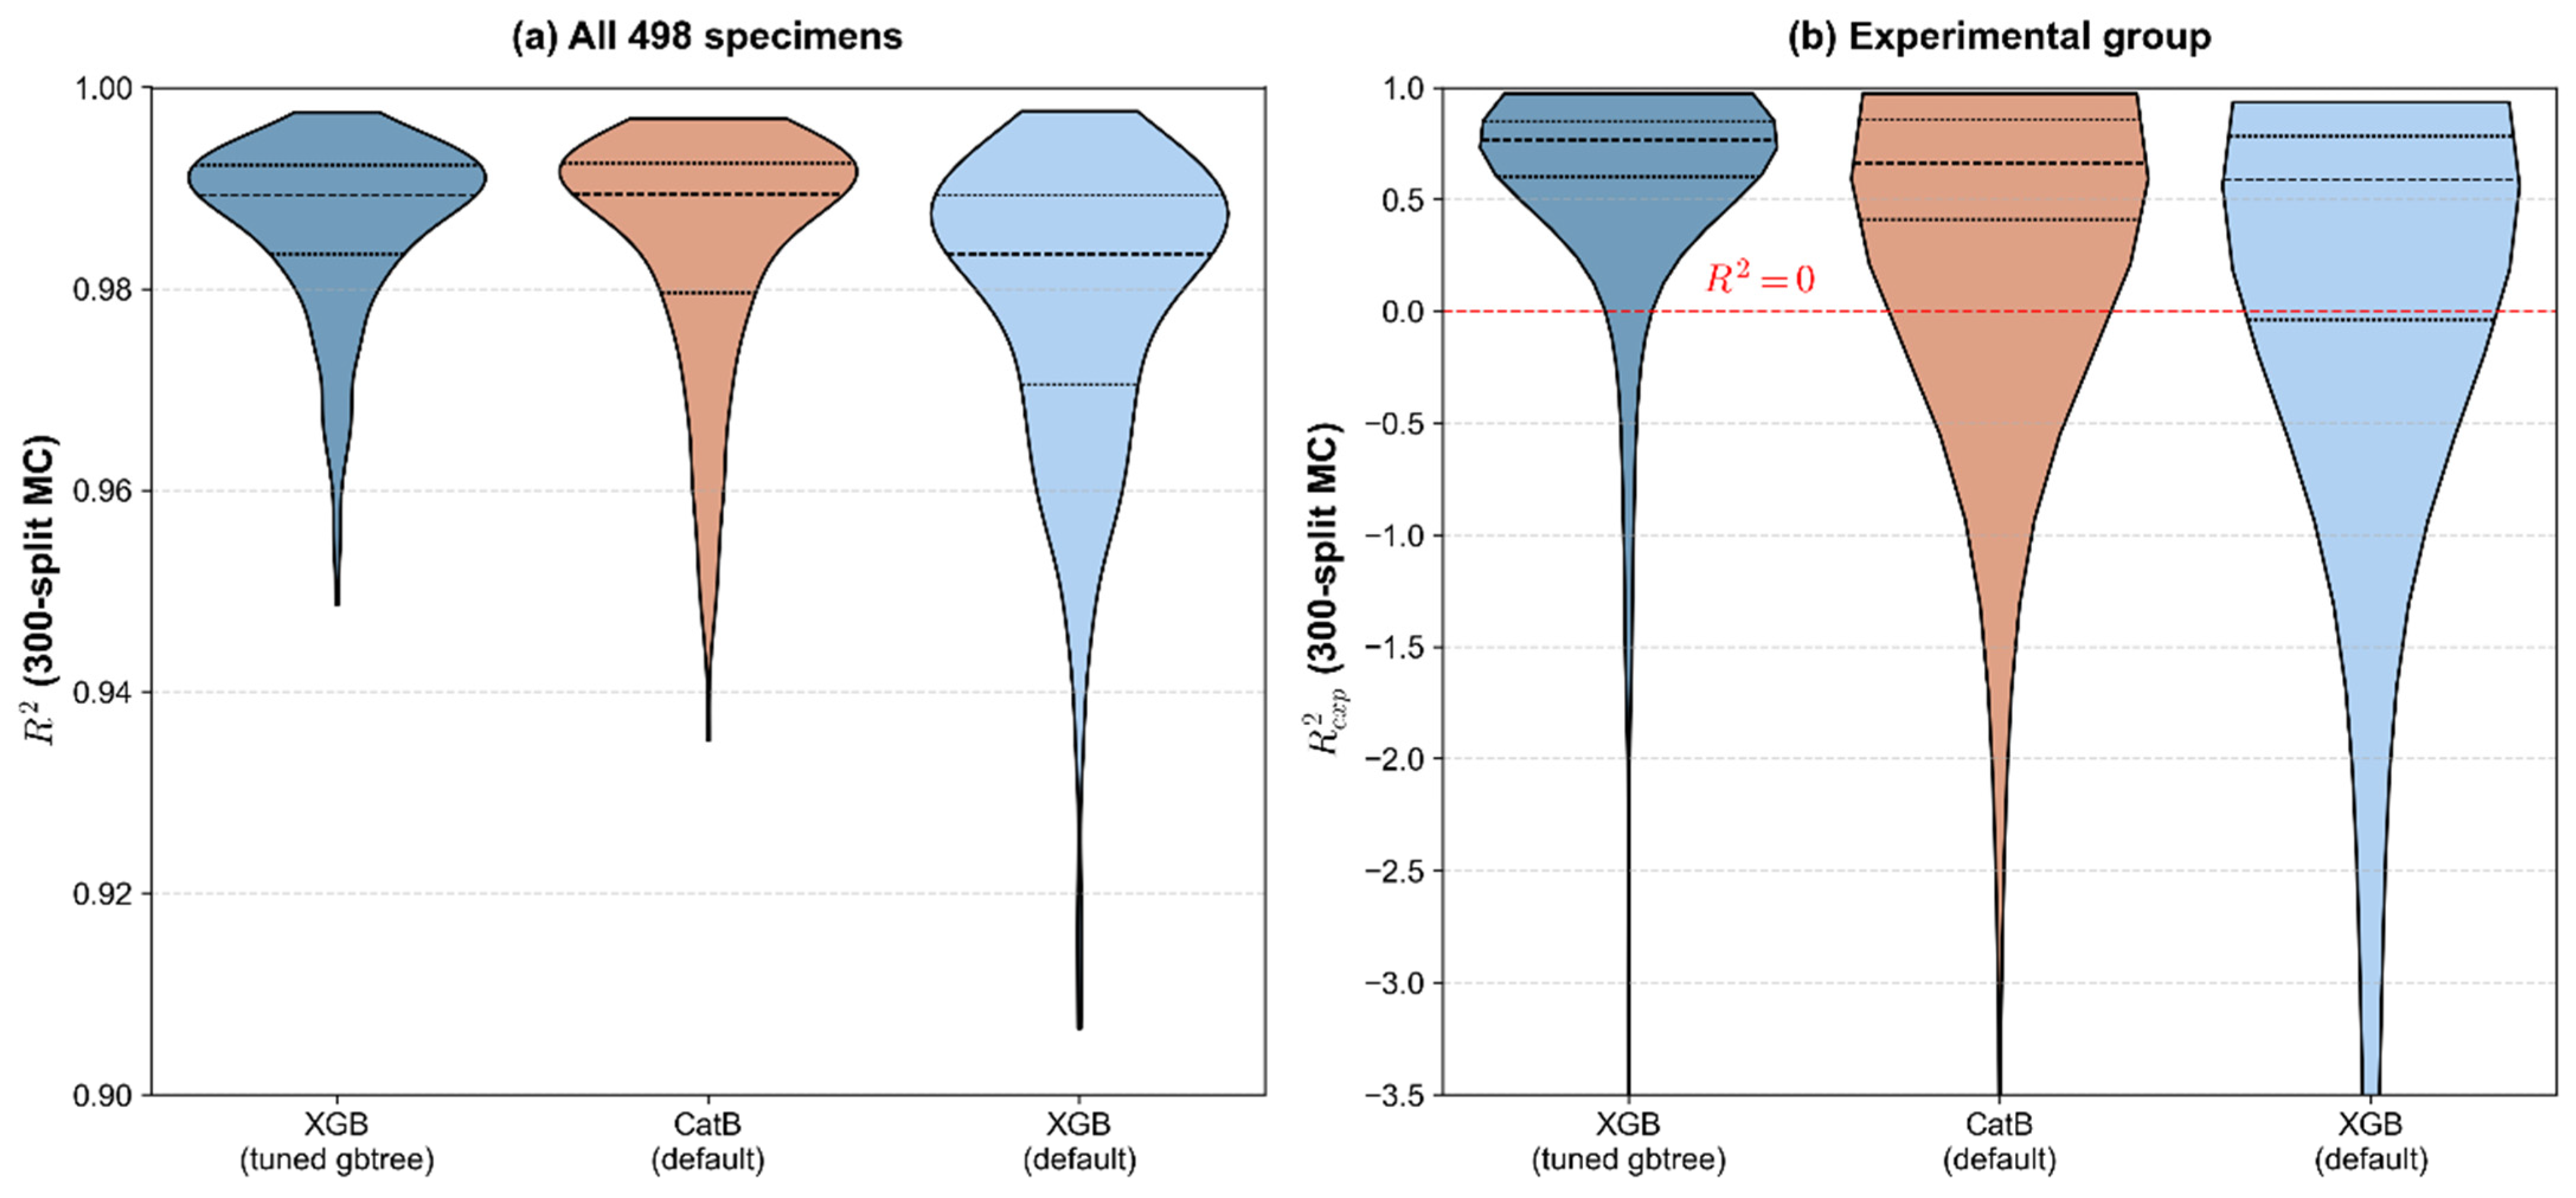
Monte Carlo simulations are employed to obtain a robust and representative estimate of model performance by generating multiple random training–testing splits and evaluating the model on each split. Sensitivity to data partitioning is quantified over 300 independent 80/20 splits, with the results reported in Table 7 and illustrated in Figure 6a for the pooled dataset and Figure 6b for the experimental-only dataset.
Figure 6.
Monte Carlo cross-validation violin plots (300 splits). (a) All 498 specimens. (b) Experimental group.
Importantly, consistently high predictive accuracy is observed on both the pooled dataset and the FEM subset across all models. The MC R2 values remain exceptionally high for the pooled data (≥0.962) and the FEM data (≥0.972), with very low variability, indicating that these models can reliably capture the underlying patterns in numerically generated data. In contrast, the experimental subset exhibits substantially higher variability, with performance strongly influenced by data composition, highlighting the challenges associated with heterogeneous experimental datasets.
Because the distributions of experimental R2 from 300 repeated partitions contained extreme negative values, the median, interquartile range, and proportion of negative-R2 splits are more informative descriptors of typical performance than mean and standard deviation alone. Among the evaluated models, tuned XGBoost provides the most stable experimental Monte Carlo performance (mean R2 = 0.536; only 10% negative-R2 splits). LightGBM is much less stable (mean R2 = −1.246). The original-study group analysis produced negative median experimental R2 for all four models (−0.708 to −2.330; Supplementary Table S2), indicating greater difficulty in transferring predictions to withheld experimental programs.
Table 7.
MC cross-validation statistics (300 splits; default models seed 0–299).
4.5. Feature Reduction
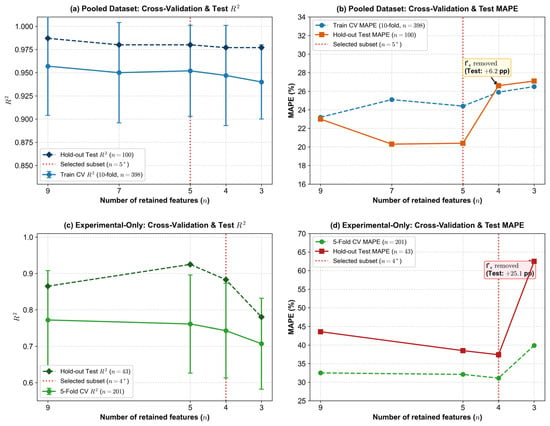
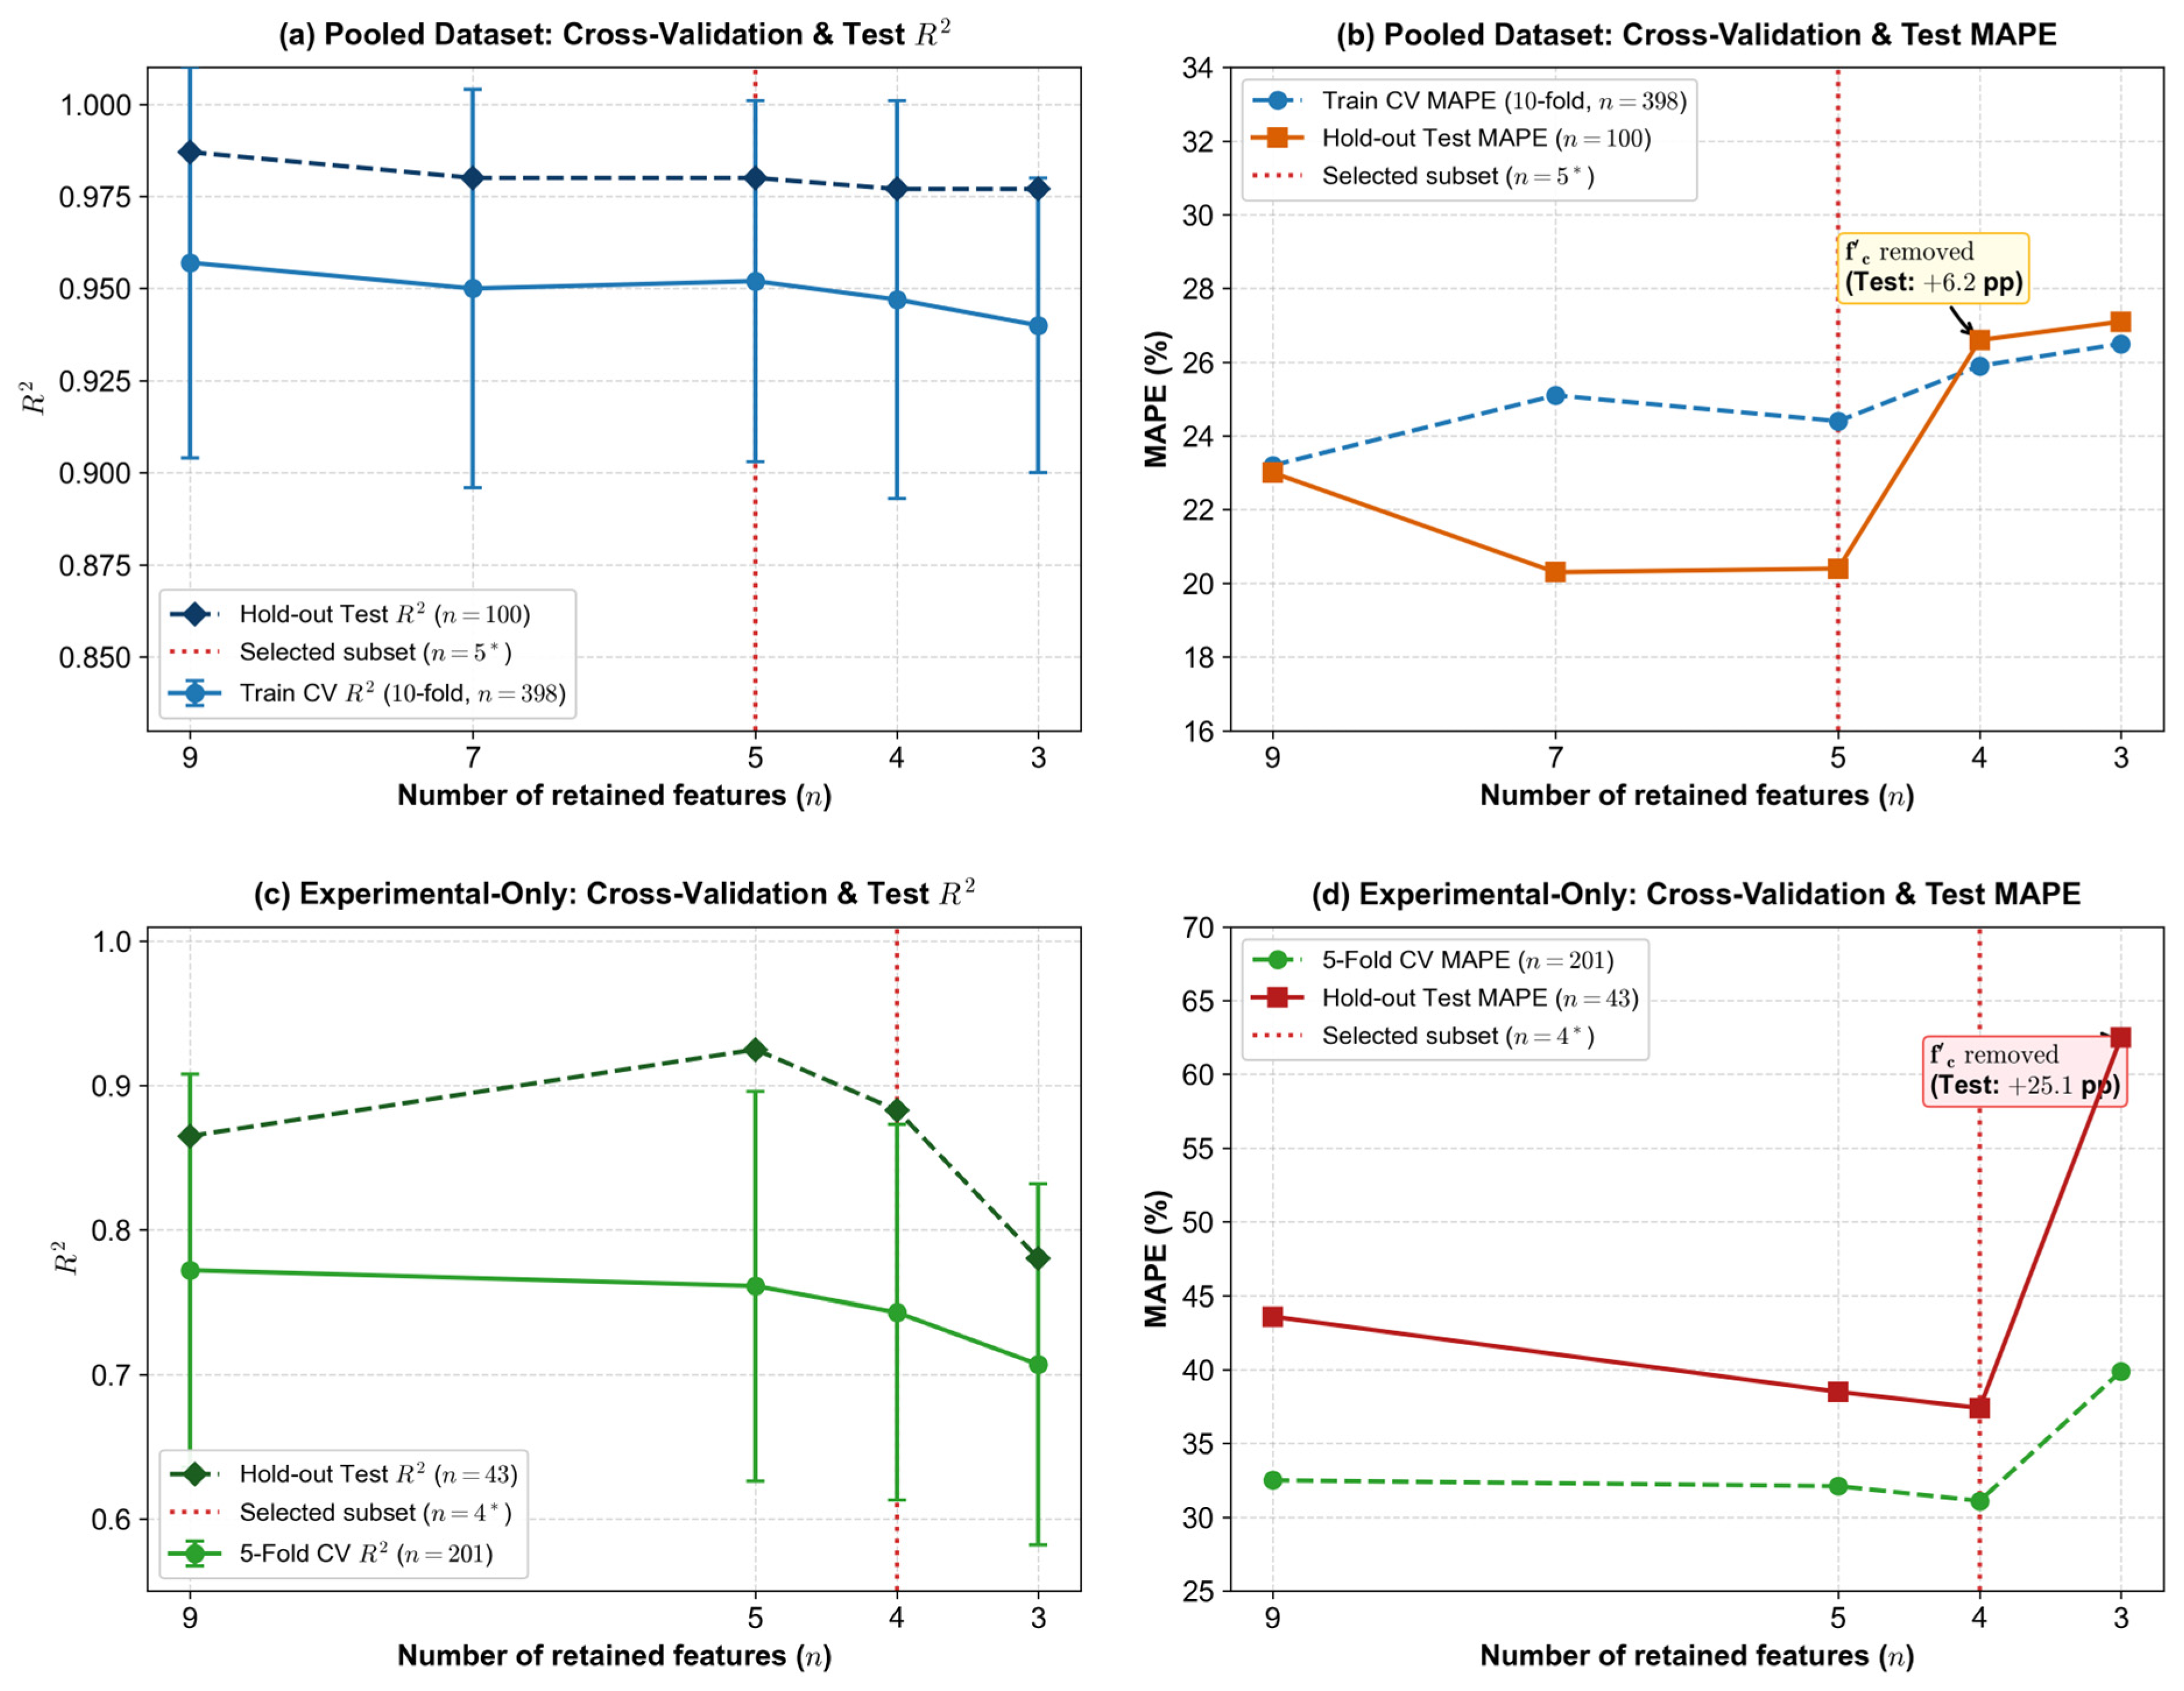
Table 8 and Table 9 present the results of feature reduction for the pooled and experimental-only datasets, respectively, with the corresponding trends illustrated in Figure 7. The fold count follows the dataset size: the pooled reduction uses 10-fold CV, whereas the experimental-only reduction uses 5-fold CV to retain sufficient validation samples per fold. Feature importance rankings and candidate subsets were determined from the training data using internal cross-validation. The fixed hold-out test set was used only to report evaluation metrics after the selection criteria had been established. In Table 8 and Table 9, CV metrics refer to results computed within cross-validation, whereas test MAPE denotes the percentage error measured on the independent hold-out partition. The reported test metrics should be interpreted as unbiased final evaluation only if the hold-out set was not used to select the preferred subset or tune hyperparameters.
Figure 7.
Feature reduction on the pooled and experimental-only dataset. (* indicates the recommended number of features to retain.)
Table 8.
Feature reduction on pooled dataset (RF, 10-fold CV).
Table 9.
Feature reduction on experimental specimens only (RF, 5-fold CV).
For the pooled dataset (Table 8), the training CV R2 remained relatively stable as the number of features decreased from nine to three (0.940–0.957), with no clear elbow point in the feature reduction curve (Figure 7a). In contrast, the training CV MAPE increased from 23.2% to 26.5%, indicating a gradual loss of predictive accuracy as features were removed. The five-feature subset was selected as a compromise between model simplicity and cross-validation performance, achieving a training CV R2 of 0.952 ± 0.049 and MAPE of 24.4%. On the independent hold-out test set, this subset achieved R2 = 0.980 and MAPE = 20.4%. Further reducing the number of features to four and three increased the test MAPE to 26.6% and 27.1%, respectively (Figure 7b). The deterioration observed after removing concrete compressive strength () suggests that this variable provides useful predictive information, although its individual contribution cannot be isolated from the combined effects of feature reduction.
For the experimental-only dataset (Table 9), feature reduction generally led to lower cross-validation performance. As the number of features decreased from nine to three, the training CV R2 declined from 0.718 to 0.673, while the CV MAPE increased from 32.5% to 39.5%. Although the changes were not strictly monotonic, the results indicate that removing input features generally reduced predictive performance. The nine-feature model achieved the best training CV performance, whereas the four-feature subset provided a simpler alternative with a CV R2 of 0.683 ± 0.149 and a MAPE of 36.0%. On the independent hold-out test set, the four-feature subset achieved an R2 of 0.883 and a MAPE of 37.4%. Further reducing the feature set to three variables, which excluded concrete compressive strength (), increased the hold-out test MAPE to 62.5%. This result suggests that provides useful predictive information, although the observed deterioration should not be interpreted as a direct measure of its individual contribution.
Overall, these results indicate that while redundant features may exist in the pooled dataset due to the inclusion of FEM data, the experimental dataset exhibits stronger dependence on a reduced but essential set of physically meaningful features. In particular, , along with geometric parameters such as a/H, X0/a, and ρsw, emerges as a core predictor set. The divergence between CV R2 and MAPE trends further underscores the importance of evaluating both variance-based and error-based metrics to avoid misleading conclusions in feature selection.
4.6. Leave-One-Study-Out Generalization
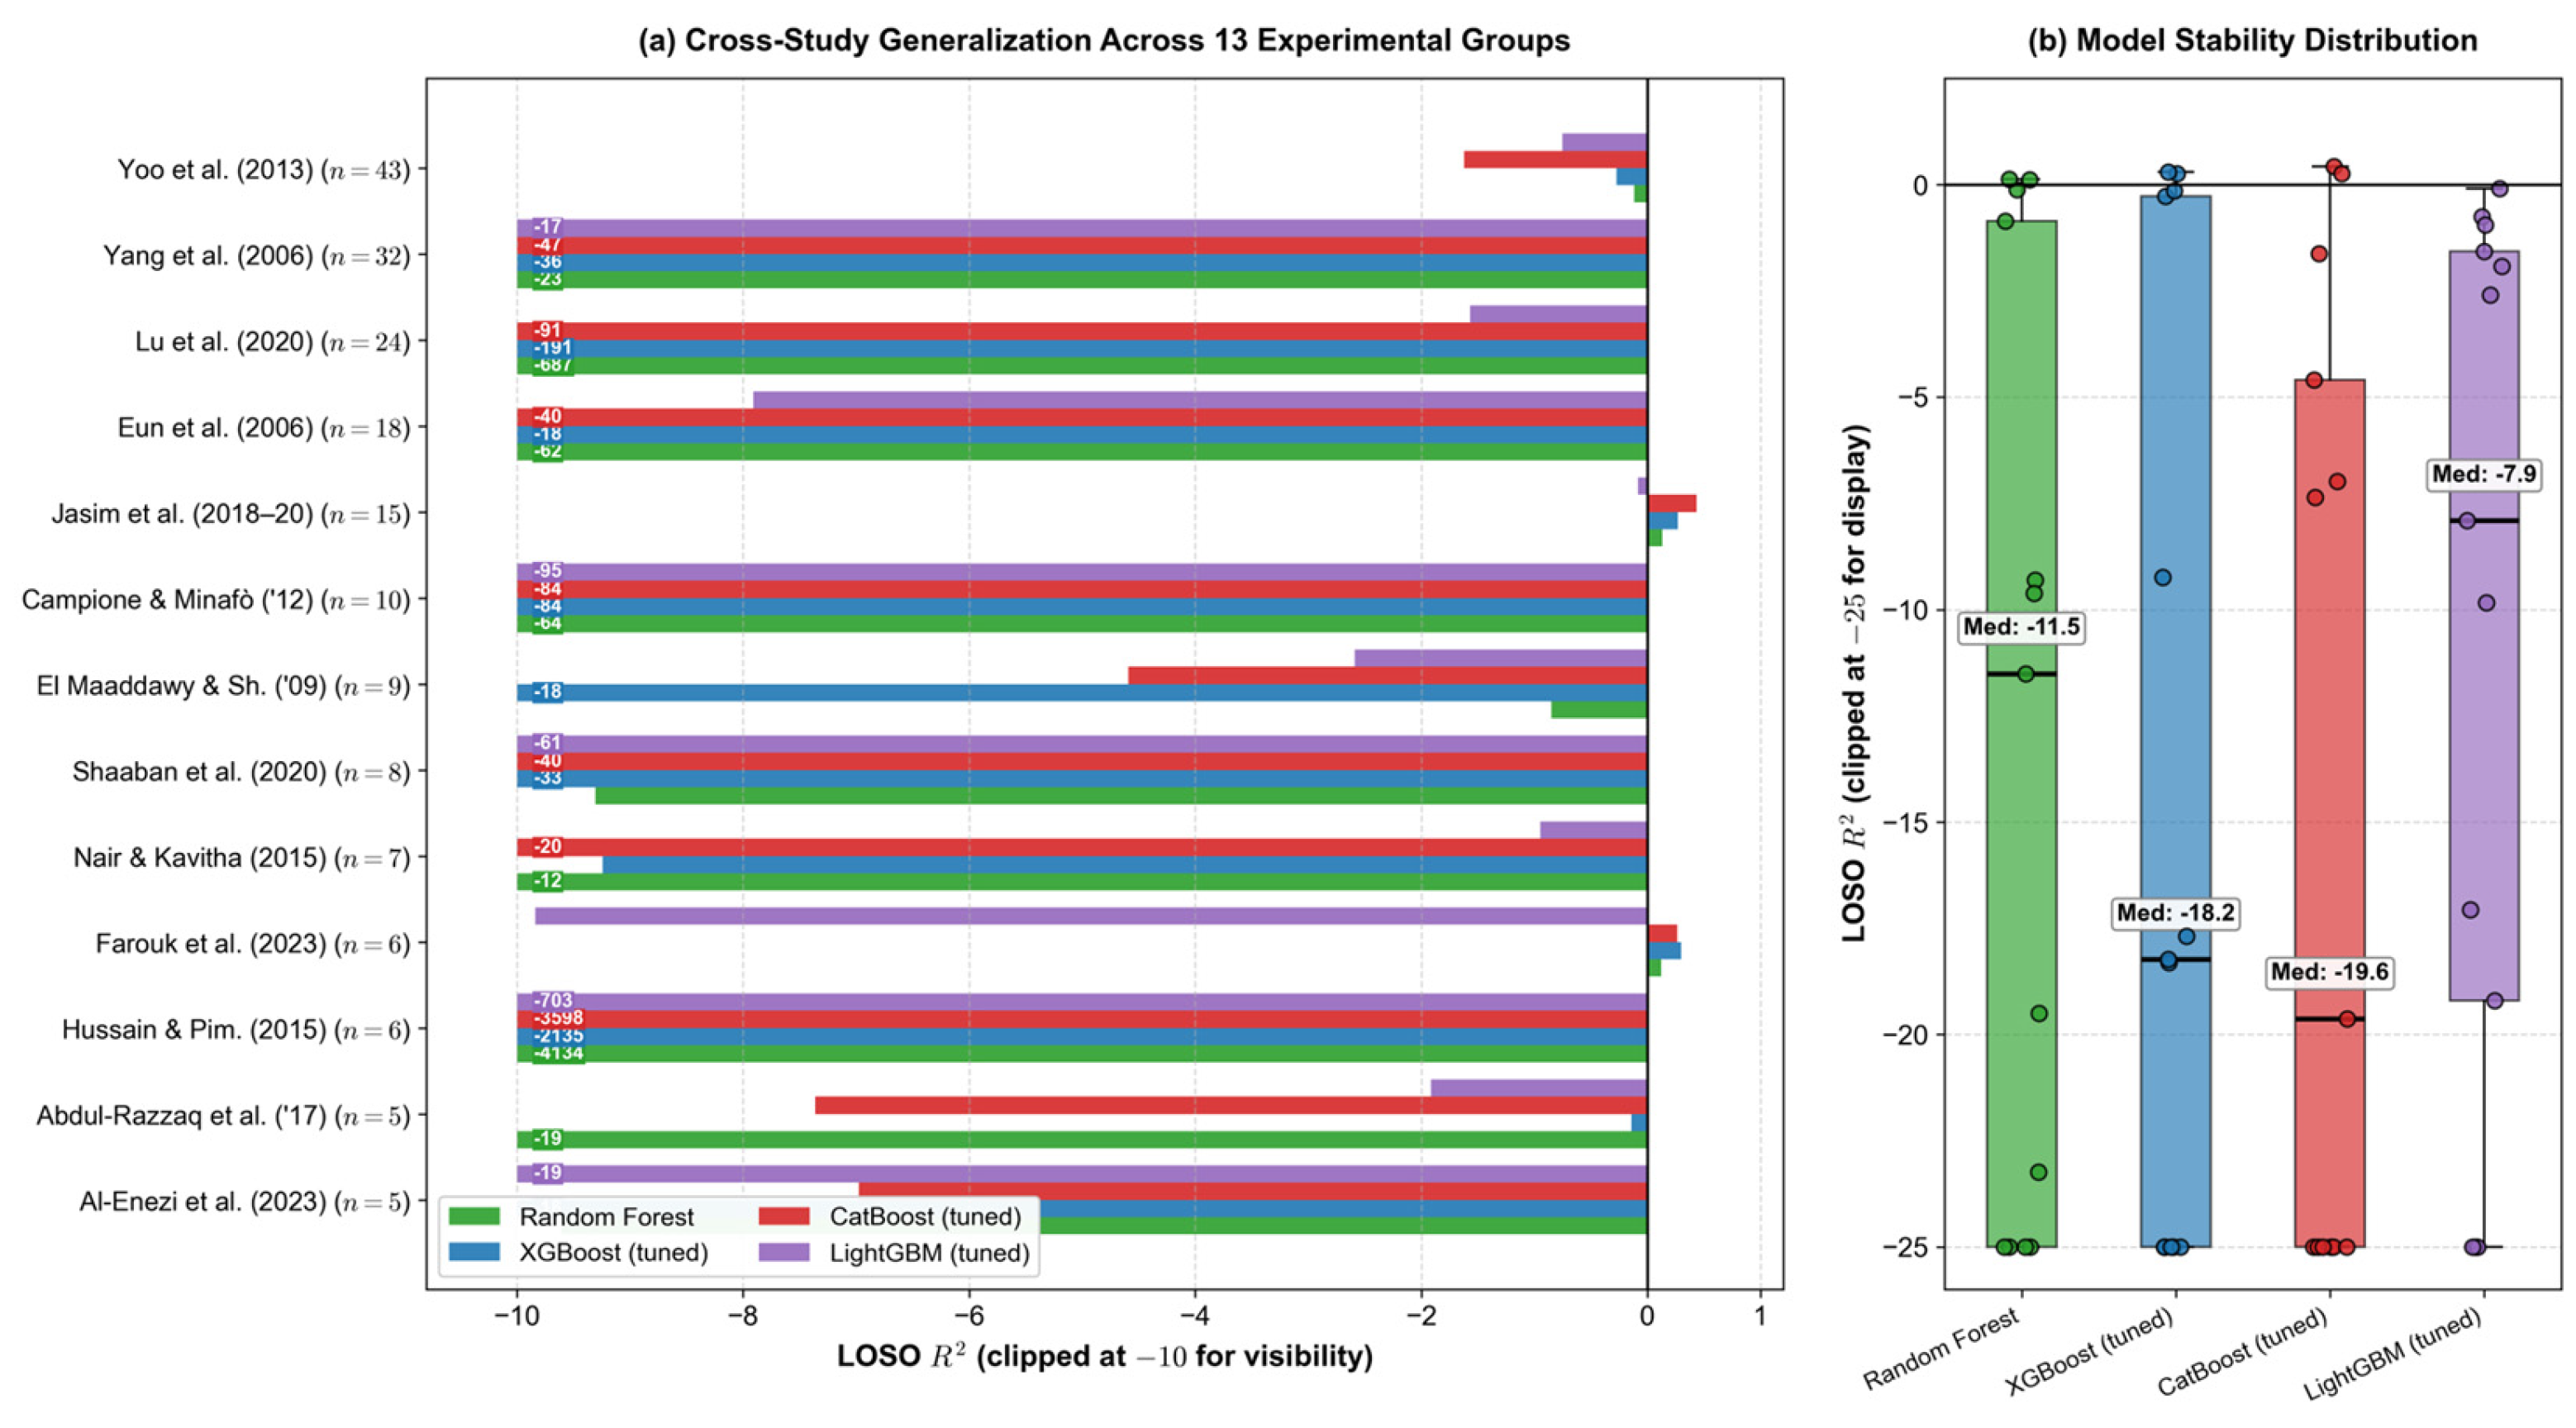
To evaluate transferability to unseen experimental programs, leave-one-original-study-out (LOSO) validation was conducted for 13 study groups containing at least five specimens (188 of 201 experimental specimens). In each fold, one entire study was withheld for testing, and the remaining experimental specimens, including the 13 specimens from four smaller groups, were used for training together with all 297 FEM specimens. Table 10 and Figure 8 summarize the pooled training results for Random Forest (RF), tuned XGBoost, tuned CatBoost, and tuned LightGBM.
Table 10.
LOSO cross-validation by source (FEM specimens included in training for all folds).
Figure 8.
LOSO cross-validation by source for the four tree-ensemble models. Bars clipped at −10 for visibility [6,8,10,31,32,33,35,36,37,38,39,40,41,42,43].
Cross-study performance was generally poor, with negative median LOSO R2 values of −11.503 (RF), −18.233 (XGBoost), −19.626 (CatBoost), and −7.906 (LightGBM). Median R2 is emphasized because the mean is strongly affected by extreme negative values for small held-out studies. For the consolidated Jasim study (n = 15), R2 was only 0.133 for RF and 0.267 for XGBoost, contrasting with the near-perfect results obtained when related Jasim specimens had been split across training and testing.
Some groups, particularly Hussain and Pimanmas [42] and Lu et al. [36], showed exceptionally large errors. The corresponding pooled-versus-experimental-only comparisons in Supplementary Table S3 show that excluding FEM reduced RF MAE for Hussain and Pimanmas from 1525.5 to 327.0 kN and for Eun et al. [37] from 817.0 to 281.4 kN. Nevertheless, experimental-only median LOSO R2 remained negative (−6.166 for RF and −10.182 for XGBoost). These findings point to limited transferability across studies, associated with differences in geometry, materials, and training data composition; they do not isolate a causal effect of FEM origin.
4.7. Uncertainty Quantification
Split conformal prediction was applied to quantify prediction uncertainty at a nominal coverage level of 90%. The dataset was divided into source-stratified training (n = 318), calibration (n = 80), and test (n = 100) subsets. The calibration set contained 32 experimental and 48 FEM specimens, while the test set comprised 40 experimental and 60 FEM specimens. Both pooled and group-conditional calibration were evaluated using absolute prediction residuals.
As shown in Table 11, group-conditional calibration produced narrower experimental prediction intervals in the initial data partition. However, the corresponding experimental coverage was 87.5% for Random Forest (RF) and 80.0% for tuned XGBoost, both below the nominal 90% level. To assess the variability of these results, the analysis was repeated across 100 random partitions. The mean experimental coverage reached 91.7 ± 6.6% for RF and 91.0 ± 6.9% for tuned XGBoost (Supplementary Table S9 and Figure S3a). These results indicate that average coverage was close to the nominal level, although considerable variation remained between partitions.
Table 11.
Group-conditional conformal prediction.
From a structural engineering perspective, overestimating shear capacity may lead to nonconservative predictions. Therefore, the predicted-to-experimental capacity ratio (Vpred/Vexp) was evaluated using out-of-fold predictions for all 201 experimental specimens. As reported in Supplementary Table S10, overestimations exceeding 20% occurred in 38.8% and 33.3% of specimens for pooled and experimental-only RF, respectively, and in 33.3% and 26.9% for the corresponding tuned XGBoost models. These findings highlight the importance of evaluating prediction bias and overestimation risks alongside conventional accuracy metrics (Figure S3b).
Despite the improved average coverage over repeated partitions, conformal prediction relies on exchangeability between calibration and test observations. This assumption may not hold for independent experimental studies with different geometric and material characteristics. Consequently, the reported prediction intervals should not be regarded as validated structural design safety bounds without further study-independent validation and reliability assessment.
5. Discussion
5.1. Why High Pooled R2 Can Be Misleading in Mixed FEM–Experimental Databases
High pooled R2 values may provide an overly optimistic assessment of predictive performance when experimental and FEM data are combined. In the present dataset, the two groups exhibit markedly different distributions of shear capacity, geometric dimensions, and material properties. Consequently, the high pooled R2 (e.g., 0.986 for RF) partly reflects the model’s ability to distinguish between these data domains rather than its ability to accurately predict experimental shear capacity. This is further illustrated by the substantially lower FEM prediction errors (MAPE < 7%) compared with those observed for experimental specimens.
The observed differences cannot, however, be attributed solely to FEM origin, as data source is confounded with geometric scale, material properties, and reinforcement characteristics. In a fixed-partition sensitivity analysis, adding beam depth (H) and width (b) to the original nine-feature RF model increased experimental R2 0.892 to 0.958 and reduced MAE from 84.8 to 66.1 kN. Similarly, predicting the normalized target ) and subsequently reconstructing shear capacity yielded experimental R2 = 0.946, MAE = 67.7 kN, and MAPE = 34.1% (Supplementary Table S4).
These findings indicate that omitted dimensional information contributes to the observed prediction differences, although the independent effects of geometric scale and FEM origin cannot be established. Therefore, pooled performance metrics should be interpreted alongside experimental-specific evaluations, particularly when assessing the potential application of machine learning models to experimental shear capacity prediction.
5.2. Complementary Diagnostics of Model Generalization
The combined Monte Carlo (MC), SHAP, and leave-one-study-out (LOSO) analyses provide complementary insights into the limitations of model generalization. Each method examines a different aspect of predictive reliability.
First, the MC analysis revealed substantial variability in experimental prediction performance across random data partitions. Although hyperparameter tuning improved the stability of some models, negative R2 values remained, indicating that random-split performance was sensitive to data partitioning. Second, SHAP analysis identified source-associated patterns in feature attribution, particularly for the web reinforcement ratio (ρsw). However, these patterns reflect model-dependent predictive associations rather than direct evidence of physical or causal effects. Third, LOSO validation revealed substantial performance degradation when predicting specimens from unseen experimental studies, with negative median R2 values across all evaluated models (Table 10).
Together, these findings demonstrate that high pooled prediction accuracy does not necessarily imply reliable experimental or cross-study generalization. MC analysis assesses sensitivity to data partitioning, SHAP examines model-specific feature attributions, and LOSO evaluates transferability to independent studies. Their combined use provides a more comprehensive assessment of predictive reliability in heterogeneous multi-source datasets.
5.3. Confounding Diagnosis as a Transferable Methodology
The contrasting SHAP attributions of the web reinforcement ratio (ρsw) in pooled and experimental-only models highlight the importance of examining source-associated confounding. However, SHAP values depend on the fitted model and reference distribution and should not be interpreted as direct physical effects. In particular, the mean signed attribution of ρsw in the experimental-only RF model was approximately +5 kN, rather than a measure of the physical contribution of web reinforcement.
The controlled interventional TreeSHAP analysis (Supplementary Table S6) further demonstrated this sensitivity. For the same experimental specimens, changing only the reference background reduced the mean absolute SHAP attribution of ρsw by 94.0%, while changing the fitted model under a fixed experimental background produced a further reduction. Moreover, introducing an explicit FEM source indicator reduced the pooled mean absolute attribution of ρsw from 1234 to 29 kN. These findings indicate that the apparent importance of ρsw is strongly associated with the model configuration and source-dependent feature distributions.
This diagnostic approach may be useful for other multi-source machine learning datasets, particularly when input features are nearly constant within certain groups or when data sources occupy distinct parameter ranges. Nevertheless, SHAP-based analyses alone cannot distinguish the effects of data provenance from correlated differences in geometry, material properties, and experimental conditions. Therefore, controlled attribution analyses should be combined with scale-aware modeling and study-independent validation.
5.4. Context Within Structural ML Literature
Previous studies, such as Saleh et al. [24], reported extremely high pooled accuracy (R2 ≈ 0.998) using a much larger dataset dominated by FEM data. However, these studies did not separate experimental performance, evaluate cross-source generalization, or quantify uncertainty.
More broadly, the structural ML literature typically evaluates models using k-fold cross-validation on single or pooled datasets without testing generalization across sources. As demonstrated in this study, such approaches can produce overly optimistic results. For instance, single-split R2 may differ from its Monte Carlo mean by as much as 1.995, indicating substantial uncertainty.
Therefore, without multi-level validation (MC, SHAP, LOSO), reported model performance remains incomplete and potentially misleading.
5.5. Practical Recommendations
Based on the findings of this study, the following recommendations are proposed for applying machine learning to heterogeneous FEM–experimental datasets:
(1) Assess data heterogeneity before combining sources. Differences in geometric dimensions, material properties, reinforcement characteristics, and response distributions should be examined before pooling experimental and FEM data. Source-specific evaluation and controlled SHAP analyses can help identify potentially confounded feature attributions. However, SHAP values should not be interpreted as direct physical or causal effects.
(2) Evaluate predictive performance separately for experimental specimens. High pooled R2 values may conceal substantial errors in the experimental subset. Therefore, experimental-specific R2, MAE, and MAPE should be reported alongside pooled metrics. Repeated random-split validation is also recommended to assess sensitivity to data partitioning.
(3) Use study-independent validation to assess transferability. The negative median LOSO R2 values across the evaluated models indicate limited generalization to unseen experimental studies. Models should therefore be independently validated and, where appropriate, retrained or recalibrated using representative data from the intended application domain.
(4) Account for prediction uncertainty and nonconservative errors. Prediction intervals should be evaluated in terms of both empirical coverage and interval width. The observed overestimation of experimental shear capacity further highlights the need to assess predicted-to-experimental capacity ratios. The models and conformal intervals developed in this study should not be used directly as validated structural design capacities or safety bounds without further reliability assessment.
Despite the additional validation and sensitivity analyses, several limitations remain.
(1) Dataset heterogeneity and imbalance. The database contains 201 experimental and 297 FEM specimens with markedly different distributions of geometric dimensions, material properties, and shear capacities. Although the 177 experimental specimens compiled by Saleh et al. originate from multiple original studies, the dataset remains unevenly represented across experimental programs.
(2) Limited geometric-scale coverage. Most experimental specimens have beam depths of 300–800 mm, whereas the FEM specimens have a constant depth of 2000 mm. The absence of intermediate beam depths between 800 and 2000 mm limits the assessment of model performance across this geometric range. Although including absolute beam dimensions improved experimental predictions, the independent effects of geometric scale and data source remain unresolved.
(3) Limited cross-study generalization. Repeated random-split validation revealed considerable variability in experimental prediction performance. Study-grouped validation and LOSO analyses further showed poor transferability to unseen experimental programs. Importantly, negative median LOSO R2 values persisted even when FEM specimens were excluded from training, indicating that the observed limitations cannot be attributed solely to FEM inclusion.
(4) Uncertainty and structural safety. Although repeated split-conformal prediction achieved mean experimental coverage close to the nominal 90% level, substantial variability remained across partitions. The exchangeability assumption may also be violated when applying the models to independent studies. Furthermore, nonconservative shear capacity predictions were observed, indicating that the reported prediction intervals and point estimates are not sufficient to establish design-level reliability.
(5) Lack of independent external validation. The available experimental studies remain limited in their coverage of geometries, materials, and reinforcement configurations. Additional feature-compatible experimental datasets, particularly those covering intermediate geometric scales and previously unseen structural configurations, are needed to evaluate broader generalization. Future research should also investigate scale-aware modeling, physics-informed approaches, and uncertainty quantification under study-level distribution shifts.
6. Conclusions
This study critically reassessed the reliability of machine learning models trained on mixed experimental and FEM datasets for predicting the shear capacity of reinforced concrete deep beams with web openings. Although pooled models achieved high predictive accuracy (R2 ≈ 0.99), these results partly reflected substantial differences between experimental and FEM data rather than reliable prediction across experimental conditions. SHAP analysis identified source-associated feature attributions, particularly for the web reinforcement ratio (ρsw), but these patterns cannot be interpreted as direct physical or causal effects. Sensitivity analyses further demonstrated that including beam depth and width, or using a normalized shear capacity formulation, substantially improved experimental predictions, highlighting the importance of accounting for geometric scale.
The combined Monte Carlo (MC), SHAP, and leave-one-original-study-out (LOSO) analyses provided complementary assessments of model stability, source-associated confounding, and cross-study generalization. Despite relatively favorable performance under some random partitions, study-aware validation revealed substantial performance degradation, with negative median LOSO R2 values even when FEM specimens were excluded from training. Repeated split-conformal prediction achieved mean experimental coverage close to the nominal 90% level, but considerable variability and nonconservative capacity overestimations remained. These findings emphasize the need for source-specific evaluation, scale-aware modeling, and independent experimental validation. The proposed diagnostic approach can support more rigorous assessment of multi-source structural machine learning models, although further validation and reliability assessment are required before their application to structural design.
Supplementary Materials
The following supporting information can be downloaded at: https://www.mdpi.com/article/10.3390/buildings16224630/s1, Table S1: Original experimental studies, specimen counts, and parameter ranges. Figure S1: Experimental and FEM distributions of the nine input variables and ultimate shear capacity; dashed lines indicate FEM constants. Table S2. Study-grouped Monte Carlo validation (300 partitions). Table S3. LOSO performance by original study: pooled and experimental-only RF/XGBoost (R2, MAE, RMSE). Table S4. Hold-out predictive performance under dimensional augmentation and target normalization. Table S5. TreeSHAP attributions for pooled RF with nine and eleven input features. Figure S2. TreeSHAP dependence plots forρsw, a/H, Xo/a, and fc’in the nine-feature pooled RF. Table S6. Controlled background/model comparisons and SHAP benchmarks. Table S7. XGBoost tuning objectives and hold-out performance. Table S8A. Hyperparameter search spaces and selected values. Table S8B. Default and tuned model performance on the fixed hold-out test set. Table S9. Repeated split-conformal calibration margins and coverage over 100 partitions. Table S10. Predicted-to-experimental shear-capacity ratio and overestimation frequencies. Figure S3. (a) Coverage across 100 random partitions; (b) empirical cumulative distributions of capacity ratio r, with r = 1.20 marked as an overestimation threshold.
Author Contributions
Conceptualization, Supervision, Project administration, Funding acquisition, Writing—review & editing, H.Q.N.; Data curation, Validation, Writing—review & editing, X.H.N.; Data curation, Resources, Writing—review & editing, D.D.L.; Investigation, Validation, Writing—review & editing, K.L.-N.; Conceptualization, Methodology, Software, Formal analysis, Investigation, Visualization, Writing—original draft, Writing—review & editing, Q.S.N. All authors have read and agreed to the published version of the manuscript.
Funding
This research is funded by the University of Transport and Communications (UTC) under grant number T2025-XD-013TD.
Data Availability Statement
The experimental and FEM specimen data were compiled from published sources cited in Table 1. The analysis pipeline code is available from the corresponding author upon reasonable request.
Conflicts of Interest
The authors declare no conflicts of interest.
References
- ACI 318R-19; Building Code Requirements for Structural Concrete (ACI 318-19) and Commentary. American Concrete Institute: Farmington Hills, MI, USA, 2019.
- ECP 203-2018; Egyptian Code for Design and Construction of Reinforced Concrete Structures. Ministry of Housing, Utilities and Urban Communities: Cairo, Egypt, 2018.
- BS EN 1992-1-1:2004; Eurocode 2: Design of Concrete Structures—Part 1-1: General Rules and Rules for Buildings. British Standards Institution: London, UK, 2004.
- Mohamed, A.R.; Shoukry, M.S.; Saeed, J.M. Prediction of the behavior of reinforced concrete deep beams with web openings using the finite element method. Alex. Eng. J. 2014, 53, 329–339. [Google Scholar] [CrossRef] [Scilit]
- Ashour, A.F.; Rishi, G. Tests of Reinforced Concrete Continuous Deep Beams with Web Openings. ACI Struct. J. 2000, 97, 418–426. [Google Scholar] [CrossRef] [Scilit]
- Al-Enezi, M.S.; Yousef, A.M.; Tahwia, A.M. Shear capacity of UHPFRC deep beams with web openings. Case Stud. Constr. Mater. 2023, 18, e02105. [Google Scholar] [CrossRef] [Scilit]
- Kubik, L. Predicting the strength of reinforeced concrete deep beams with web opening. Proc. Inst. Civ. Eng. 1980, 69, 939. [Google Scholar] [CrossRef] [Scilit]
- Campione, G.; Minafò, G. Behaviour of concrete deep beams with openings and low shear span-to-depth ratio. Eng. Struct. 2012, 41, 294–306. [Google Scholar] [CrossRef] [Scilit]
- Kong, F.K.; Sharp, G.R.; Appleton, S.C.; Beaumont, C.J.; Kubik, L.A. Structural idealization for deep beams with web openings: Further evidence. Mag. Concr. Res. 1978, 30, 89–95. [Google Scholar] [CrossRef] [Scilit]
- Yoo, T.-M.; Doh, J.-H.; Guan, H.; Fragomeni, S. Experimental behaviour of high-strength concrete deep beams with web openings: Shear strength of HSC deep beams with various web openings. Struct. Des. Tall Spec. Build. 2013, 22, 655–676. [Google Scholar] [CrossRef] [Scilit]
- Ibrahim, M.A.; El Thakeb, A.; Mostfa, A.A.; Kottb, H.A. Proposed formula for design of deep beams with shear openings. HBRC J. 2018, 14, 450–465. [Google Scholar] [CrossRef] [Scilit]
- Hou, C.; Zhou, X.-G. Strength prediction of circular CFST columns through advanced machine learning methods. J. Build. Eng. 2022, 51, 104289. [Google Scholar] [CrossRef] [Scilit]
- Le-Nguyen, K.; Minh, Q.C.; Ahmad, A.; Ho, L.S. Development of deep neural network model to predict the compressive strength of FRCM confined columns. Front. Struct. Civ. Eng. 2022, 16, 1213–1232. [Google Scholar] [CrossRef] [Scilit]
- Le Nguyen, K.; Trinh, H.T.; Banihashemi, S.; Pham, T.M. Machine learning approaches for lateral strength estimation in squat shear walls: A comparative study and practical implications. Expert Syst. Appl. 2024, 239, 122458. [Google Scholar] [CrossRef] [Scilit]
- Nguyen, K.L.; Trinh, H.T.; Pham, T.M. Prediction of punching shear strength in flat slabs: Ensemble learning models and practical implementation. Neural Comput. Appl. 2024, 36, 4207–4228. [Google Scholar] [CrossRef] [Scilit]
- Degtyarev, V.V.; Tsavdaridis, K.D. Buckling and ultimate load prediction models for perforated steel beams using machine learning algorithms. J. Build. Eng. 2022, 51, 104316. [Google Scholar] [CrossRef] [Scilit]
- Tran, V.-L.; Kim, S.-E. A practical ANN model for predicting the PSS of two-way reinforced concrete slabs. Eng. Comput. 2021, 37, 2303–2327. [Google Scholar] [CrossRef] [Scilit]
- Nguyen, H.-Q.; Le, B.-A.; Tran, B.-V.; Vu, T.-S.; Bui, T.-L. Deep artificial neural network-powered phase field model for predicting damage characteristic in brittle composite under varying configurations. Mach. Learn. Sci. Technol. 2024, 5, 025062. [Google Scholar] [CrossRef] [Scilit]
- Do, T.A.; Le, B.-A. Machine learning approach for predicting early-age thermal cracking potential in concrete bridge piers. Forces Mech. 2024, 17, 100297. [Google Scholar] [CrossRef] [Scilit]
- Feng, D.-C.; Wang, W.-J.; Mangalathu, S.; Hu, G.; Wu, T. Implementing ensemble learning methods to predict the shear strength of RC deep beams with/without web reinforcements. Eng. Struct. 2021, 235, 111979. [Google Scholar] [CrossRef] [Scilit]
- Le Nguyen, K.; Thi Trinh, H.; Nguyen, T.T.; Nguyen, H.D. Comparative study on the performance of different machine learning techniques to predict the shear strength of RC deep beams: Model selection and industry implications. Expert Syst. Appl. 2023, 230, 120649. [Google Scholar] [CrossRef] [Scilit]
- Megahed, K. Prediction and reliability analysis of shear strength of RC deep beams. Sci. Rep. 2024, 14, 14590. [Google Scholar] [CrossRef] [Scilit]
- Ma, C.; Wang, S.; Zhao, J.; Xiao, X.; Xie, C.; Feng, X. Prediction of shear strength of RC deep beams based on interpretable machine learning. Constr. Build. Mater. 2023, 387, 131640. [Google Scholar] [CrossRef] [Scilit]
- Saleh, M.; AlHamaydeh, M.; Zakaria, M. Shear capacity prediction for reinforced concrete deep beams with web openings using artificial intelligence methods. Eng. Struct. 2023, 280, 115675. [Google Scholar] [CrossRef] [Scilit]
- Alhayani, A.A.; Almssad, A.; Al-Gburi, M. Size and location influence of opening on shear capacity of RC deep beams using ANN. J. Asian Archit. Build. Eng. 2026, 1–13. [Google Scholar] [CrossRef] [Scilit]
- Ismaeel, A.A.; Amin, F.; Husnain, A. Predicting the shear strength of RC deep beams with wide openings using FEM and machine learning-based Ni-Ti SMA retrofitting. Results Eng. 2026, 29, 109320. [Google Scholar] [CrossRef] [Scilit]
- Truong, G.T.; Choi, K.-K.; Nguyen, T.-H.; Kim, C.-S. Prediction of shear strength of RC deep beams using XGBoost regression with Bayesian optimization. Eur. J. Environ. Civ. Eng. 2023, 27, 4046–4066. [Google Scholar] [CrossRef] [Scilit]
- Abbood, I.S.; Rahman, N.A.; Bakar, B.H.A. Shear Strength Prediction for RCDBs Utilizing Data-Driven Machine Learning Approach: Enhanced CatBoost with SHAP and PDPs Analyses. Appl. Syst. Innov. 2025, 8, 96. [Google Scholar] [CrossRef] [Scilit]
- Knight, J.; Taylor, G.W.; Khademi, A. Voxel-Wise Logistic Regression and Leave-One-Source-Out Cross Validation for white matter hyperintensity segmentation. Magn. Reson. Imaging 2018, 54, 119–136. [Google Scholar] [CrossRef] [Scilit]
- Saleh, M.; AlHamaydeh, M.; Zakaria, M. Finite element analysis of reinforced concrete deep beams with square web openings using damage plasticity model. Eng. Struct. 2023, 278, 115496. [Google Scholar] [CrossRef] [Scilit]
- Jasim, W.A.; Allawi, A.A.; Ali Oukaili, N.K. Effect of Size and Location of Square Web Openings on the Entire Behavior of Reinforced Concrete Deep Beams. Civ. Eng. J. 2019, 5 (1), 209–226. [Google Scholar] [CrossRef] [Scilit]
- Shaaban, I.G.; Zaher, A.H.; Said, M.; Montaser, W.; Ramadan, M.; Abd Elhameed, G.N. Effect of partial replacement of coarse aggregate by polystyrene balls on the shear behaviour of deep beams with web openings. Case Stud. Constr. Mater. 2020, 12, e00328. [Google Scholar] [CrossRef] [Scilit]
- Farouk, M.A.; Moubarak, A.M.R.; Ibrahim, A.; Elwardany, H. New alternative techniques for strengthening deep beams with circular and rectangular openings. Case Stud. Constr. Mater. 2023, 19, e02288. [Google Scholar] [CrossRef] [Scilit]
- Asgarkhani, N.; Kazemi, F.; Jankowski, R. Machine-learning based tool for seismic response assessment of steel structures including masonry infill walls and soil-foundation-structure interaction. Comput. Struct. 2025, 317, 107918. [Google Scholar] [CrossRef] [Scilit]
- Yang, K.-H.; Eun, H.-C.; Chung, H.-S. The influence of web openings on the structural behavior of reinforced high-strength concrete deep beams. Eng. Struct. 2006, 28, 1825–1834. [Google Scholar] [CrossRef] [Scilit]
- Lu, W.-Y.; Lin, G.-Z.; Tseng, C.-C.; Lin, S.-J. Shear strength of reinforced concrete deep beams with web openings. J. Chin. Inst. Eng. 2020, 43, 694–705. [Google Scholar] [CrossRef] [Scilit]
- Eun, H.; Lee, Y.; Chung, H.; Yang, K. On the shear strength of reinforced concrete deep beam with web opening. Struct. Des. Tall Spec. Build. 2006, 15, 445–466. [Google Scholar] [CrossRef] [Scilit]
- Jasim, W.A.; Allawi, A.A.; Oukaili, N.K. Strength and serviceability of reinforced concrete deep beams with large web openings created in shear spans. Civ. Eng. J. 2018, 4, 2560–2574. [Google Scholar] [CrossRef] [Scilit]
- Jasim, W.A.; Tahnat, Y.B.A.; Halahla, A.M. Behavior of reinforced concrete deep beam with web openings strengthened with (CFRP) sheet. Structures 2020, 26, 785–800. [Google Scholar] [CrossRef] [Scilit]
- El Maaddawy, T.; Sherif, S. FRP composites for shear strengthening of reinforced concrete deep beams with openings. Compos. Struct. 2009, 89, 60–69. [Google Scholar] [CrossRef] [Scilit]
- Nair, N.; Kavitha, P.E. Effect of openings in deep beams using strut and tie model method. Int. J. Tech. Res. Appl. 2015, 3, 59–62. [Google Scholar]
- Hussain, Q.; Pimanmas, A. Shear strengthening of RC deep beams with openings using sprayed glass fiber reinforced polymer composites (SGFRP): Part 1. Experimental study. KSCE J. Civ. Eng. 2015, 19, 2121–2133. [Google Scholar] [CrossRef] [Scilit]
- Abdul-Razzaq, K.S.; Ali, H.I.; Abdul-Kareem, M.M. A new strengthening technique for deep beam openings using steel plates. Int. J. Appl. Eng. Res. 2017, 12, 15935–15947. [Google Scholar]

Disclaimer/Publisher’s Note: The statements, opinions and data contained in all publications are solely those of the individual author(s) and contributor(s) and not of MDPI and/or the editor(s). MDPI and/or the editor(s) disclaim responsibility for any injury to people or property resulting from any ideas, methods, instructions or products referred to in the content. |
© 2026 by the authors. Licensee MDPI, Basel, Switzerland. This article is an open access article distributed under the terms and conditions of the Creative Commons Attribution (CC BY) license.