


Abstract
Occupants’ personal devices constitute a spatially distributed and occupant-controlled component of energy demand in educational buildings. This study developed a behavior-sensitive framework for predicting occupants’ space selection and personal-device power demand in an academic building and a library. Questionnaire responses from 226 participants were analyzed. Multinomial logistic regression was included as a conventional reference model and compared with Decision Tree, Random Forest, GBDT, and XGBoost across four multiclass prediction tasks. Class imbalance was addressed through random oversampling applied exclusively within the training partitions, and performance was evaluated using stratified five-fold cross-validation repeated three times. Multinomial logistic regression achieved the highest mean accuracies for space-selection prediction in the academic building and library, reaching 0.791 and 0.790, respectively. Random Forest achieved the highest mean accuracies for personal-device power-demand classification in the two buildings, reaching 0.827 and 0.823, respectively. The reported space selections and device-use patterns were combined with duration of stay, visit frequency, and representative device-specific operating-power values to estimate personal-device energy demand across space types. The comparative results demonstrate the complementary strengths of conventional and tree-based classifiers across different behavioral targets, while the questionnaire-based energy analysis illustrates how reported occupant behaviors correspond to spatial differences in estimated personal-device demand.
1. Introduction
According to the International Energy Agency (IEA), the building sector accounts for nearly 30% of global energy consumption and associated carbon emissions [1,2]. Building energy use is affected not only by climatic conditions, building design, materials, and equipment efficiency, but also by the ways in which occupants use spaces and interact with building systems [3,4]. Occupants’ daily routines, space-selection patterns, and use of HVAC systems, lighting, and electrical devices can produce substantial variations in energy demand [5,6]. Consequently, occupant behavior has become an important consideration in data-driven building energy research [7].
Educational buildings present particular challenges for space-level energy management because their occupancy patterns vary with teaching schedules, study activities, and the needs of different user groups. Students, faculty members, and other users may select different spaces, remain for different durations, visit at different frequencies, and carry different combinations of personal devices. These choices affect not only whether a space is occupied but also where and when occupant-related electrical demand occurs [8,9]. Aggregate occupancy counts or schedules may therefore provide an incomplete representation of the spatial distribution of personal-device demand [6,8].
In this study, personal-device energy demand refers specifically to the estimated electricity demand associated with mobile phones, laptops, tablets, and other portable devices used or charged by occupants while they occupy the investigated spaces. The term does not include HVAC systems, lighting, elevators, or other fixed building systems. Previous studies have applied statistical and machine-learning methods to building-load prediction, HVAC forecasting, occupancy estimation, and plug-load prediction [6,8,9,10]. Research on educational buildings has also shown that actual plug-load and lighting profiles may differ from design assumptions and that space-use patterns are associated with variations in energy demand [11,12]. However, building-level load models and aggregate occupancy measures do not necessarily identify how users’ space selections and personal-device combinations jointly redistribute occupant-related demand among individual spaces. This information is relevant to the allocation of charging facilities, the management of spaces, and the coordination of occupant-related electrical loads with other building services. The present study therefore focuses specifically on personal-device energy demand associated with occupants’ space-use and device-use preferences. HVAC and lighting loads were not modeled because they are governed by building-system characteristics, operating schedules, and control strategies that require system-level measurements beyond the scope of the questionnaire-based dataset.
To address this problem, this study develops a behavior-sensitive framework for examining occupants’ space selection, personal-device power demand, and space-specific personal-device energy demand in an academic building and a library. Multinomial logistic regression was included as a conventional reference model and compared with four tree-based machine-learning algorithms, i.e., Decision Tree, Random Forest, GBDT, and XGBoost, to identify the most appropriate model for each behavioral prediction target. The predictive analysis and energy-estimation analysis were treated as complementary components: the former evaluated the predictability of occupants’ space-selection and personal-device power-demand patterns, whereas the latter combined respondents’ reported space selections and device combinations with duration of stay, visit frequency, and representative device-specific operating-power values to estimate personal-device energy demand across space types. This study makes three contributions. First, it integrates occupant, space, and device information that is commonly represented separately in building-energy analyses. Second, it examines whether different behavioral targets require different predictive models rather than assuming that a single algorithm is suitable for all tasks. Third, it provides space-specific information that may complement whole-building energy monitoring and support decisions concerning space management and charging-facility provision.
2. Theoretical Points of Departure
2.1. Machine-Learning Approaches to Building Energy and Occupancy Prediction
Data-driven methods have been increasingly applied to building-energy and occupancy prediction because they can represent relationships among environmental conditions, occupant characteristics, building operation, and energy-related outcomes. Machine-learning approaches encompass several model families, including artificial neural networks [13] and tree-based algorithms. Conventional multiclass models provide an interpretable reference when predictor effects can be represented through an additive functional structure, whereas tree-based classifiers can accommodate nonlinear thresholds and interactions without requiring these relationships to be specified in advance [6,10]. The present questionnaire dataset is modest in size rather than high-dimensional; its analytical challenge arises from the multiclass outcomes, mixed demographic and behavioral predictors, and the possibility that their relationships differ across prediction targets and building contexts.
Tree-based algorithms are widely used in building energy and occupancy-related studies because they can accommodate both categorical and numerical variables [14]. An individual Decision Tree offers a relatively transparent decision structure but may overfit small or complex datasets [15]. Random Forest reduces this limitation by aggregating predictions from multiple trees trained on bootstrapped samples and random subsets of features [16]. Gradient boosting decision trees (GBDT) sequentially construct trees that correct the errors of previous learners, enabling the model to capture complex nonlinear patterns [17]. XGBoost extends gradient boosting through regularization and computational optimization, which can improve model robustness and efficiency [18,19].
Collectively, previous studies demonstrate that tree-based methods can represent nonlinear relationships among occupant characteristics, environmental conditions, space-use behavior, and energy-related outcomes. However, greater model flexibility does not necessarily produce better generalization, particularly in a questionnaire dataset with a relatively modest sample size. Multinomial logistic regression was therefore included as a conventional multiclass reference model, and its performance was compared with Decision Tree, Random Forest, GBDT, and XGBoost under identical predictor definitions and validation folds. This design enabled the value of the tree-based models to be evaluated empirically for each prediction target rather than assumed in advance.
2.2. Occupants’ Space-Use Preferences and Personal-Device Energy Demand
Occupant behavior is an important source of variation in the energy use of educational buildings. Classrooms may be intensively occupied during scheduled teaching periods but remain vacant at other times, whereas libraries and common areas may exhibit longer and more dispersed occupancy patterns. Differences in visit frequency, duration of stay, and interaction with personal devices can therefore produce substantial variations in energy demand across spaces [8,11,12,20].
Educational buildings are also used by groups with different spatial and behavioral requirements. Students, faculty members, and staff may differ in their preferred spaces, periods of use, duration of occupancy, and personal-device power-demand classifications. These behavioral differences affect the operation of building services and the use of personal devices [4,9,21]. Representing occupancy only as an aggregate count or schedule may therefore overlook meaningful differences among users and spaces.
Recent studies have increasingly incorporated occupancy information into machine-learning models. Nevertheless, occupancy is commonly represented through occupancy rates, schedules, or sensor-derived counts, with less attention paid to the relationship between individual space-use preferences and combinations of personal devices. This distinction is important because users occupying the same building may select different spaces, remain for different periods, and carry different combinations of mobile phones, tablets, laptops, and other devices.
Recent plug-load studies have also emphasized the importance of identifying device operating modes and usage patterns for forecasting and energy-management applications [9,22]. Personal-device demand is analytically relevant not because each device necessarily represents a large individual load, but because the demand is directly controlled by occupants and is distributed according to where, when, and for how long devices are used or charged. Users occupying the same building may select different spaces and carry different combinations of mobile phones, laptops, tablets, and other devices. Consequently, the same total number of occupants may produce different spatial and temporal patterns of personal-device demand. Representing these differences requires information that goes beyond aggregate occupancy counts. These findings indicate that space-use behavior and personal-device use are closely related; however, their combined implications for spatially differentiated energy demand remain insufficiently examined, particularly in educational buildings.
2.3. Research Gap and Analytical Perspective
The literature indicates that tree-based machine-learning algorithms can capture nonlinear relationships between occupant characteristics and energy-related outcomes. However, two related gaps remain. First, few studies have compared conventional and tree-based classifiers across both space-selection and personal-device power-demand classification tasks within different educational-building settings. Second, comparative behavioral prediction has rarely been examined alongside a space-specific assessment of personal-device energy demand within the same occupant–space–device framework.
To address these gaps, the present study primarily compares multinomial logistic regression and four tree-based machine-learning algorithms across an academic building and a library to determine the most appropriate model for each space-selection and personal-device power-demand target. The predictive analysis evaluates the comparative performance and target-specific suitability of the five candidate models. As a complementary analysis, respondents’ reported building-specific space selections and device combinations are combined with duration of stay, visit frequency, and representative device-specific operating-power values to estimate personal-device energy demand across space types. The predicted class labels are not used as numerical inputs to the energy-demand equation. This analytical perspective distinguishes both components from measured whole-building energy consumption.
3. Methodology
3.1. Four-Stage Analytical Framework
This study adopted a four-stage analytical framework to examine occupants’ space selection and personal-device energy demand in educational buildings. In the first stage, the original questionnaire responses were screened, the prediction targets were defined, and the personal-device outcomes were converted into low-, medium-, and high-power-demand categories. In the second stage, multinomial logistic regression, Decision Tree, Random Forest, GBDT, and XGBoost models were developed separately for the four prediction targets. Class balancing and hyperparameter optimization were performed exclusively within the model-training partitions. In the third stage, model performance was evaluated using stratified five-fold cross-validation repeated three times, and the best-performing model was selected separately for each target. In the fourth stage, the respondents’ reported space selections and device combinations were combined with duration of stay, visit frequency, and representative device-specific operating-power values to estimate average daily personal-device energy demand across space types.
The four prediction targets were academic-building space selection, academic-building personal-device power demand, library space selection, and library personal-device power demand. Model performance was evaluated separately for each prediction target using accuracy, precision, recall, F1 score, one-vs-rest class-specific receiver operating characteristic (ROC) curves and their corresponding area-under-the-curve (AUC) values, and confusion matrices. The performance metrics were summarized as the mean across the 15 held-out validation folds. The out-of-fold predicted classes and probabilities provided the basis for comparing the candidate models and identifying the model with the highest mean accuracy for each prediction target. These predictions were used for model evaluation and target-specific model selection but were not used as numerical inputs to the personal-device energy-demand equation. The complementary energy-demand estimates were calculated from the building-specific questionnaire responses described in Section 3.9. Figure 1 summarizes the complete analytical procedure, including target definition, model development, training-partition-only class balancing, hyperparameter optimization, model evaluation, target-specific model selection, and energy-demand estimation.
Figure 1.
Four-stage analytical framework and model-evaluation workflow. Stage 4 represents a complementary questionnaire-based analysis using respondents’ reported building-specific behaviors rather than the predicted class labels.
3.2. Study Context and Data Collection
Data were collected through a questionnaire survey conducted at South China Agricultural University. The study focused on an academic building and a library, which represent two common educational environments with different functions, spatial characteristics, and occupancy patterns. A total of 230 valid questionnaire responses were obtained. Following the target-class eligibility screening described in Section 3.4, four respondents associated with the 364-seat tiered lecture-hall category were excluded because this category could not support stratified five-fold evaluation as an independent prediction class. The analytical sample therefore contained 226 respondents. The same 226 respondents were used across the four prediction tasks to maintain a consistent basis for model comparison.
The questionnaire elicited self-reported typical patterns and preferences rather than continuously observed behavior. Participants reported the spaces they usually selected for studying, their usual weekly visit frequency, the typical duration of a visit, their usual periods of use, the personal devices they typically used, and the devices they used in the investigated academic building and library. The distinction between typical device use and building-specific device use was retained during variable construction. Accordingly, the resulting variables represent participants’ self-reported habitual patterns and were not derived from occupancy sensors, access-control systems, Wi-Fi records, or direct observations.
Before predictive modeling, descriptive analyses were conducted using all 230 valid questionnaire responses to characterize relationships among respondent characteristics, habitual and task-specific space choices, visit frequency, duration of stay, and typical personal-device use. Categorical variables were summarized using counts and percentages and examined through cross-tabulations. These comparisons were descriptive and were not interpreted as evidence of statistical significance or causal relationships. The subsequent model-development and validation procedures used the 226-response analytical sample after the target-class eligibility exclusion described in Section 3.4.
3.3. Data Preprocessing and Variable Construction
The survey data were cleaned and transformed before model development. Textual responses and categorical labels were standardized to remove duplicate or inconsistent expressions. The administrative respondent identifier was used only to distinguish individual records and was excluded from all model inputs. Predictor construction and target-variable construction were performed separately to prevent target-defining information from being inadvertently included in the corresponding predictor set. Single-choice categorical predictors were represented using one-hot encoding. Multi-select predictor responses, including usual periods of space use and the personal devices typically used by the respondent, were separated and represented as binary indicators. The general device-use question recorded the personal devices typically used by each respondent and was represented using four binary indicators: mobile phone, laptop, tablet, and other devices. Typical personal-device use was retained as predictor information because it represented a general habitual pattern rather than a building-specific outcome. By contrast, the building-specific device questions recorded the devices that respondents reported using in the investigated academic building and library. These building-specific responses were used exclusively to construct the corresponding personal-device power-demand targets and were excluded from all predictor matrices. Similarly, the building-specific room-type selections used to define the two space-selection targets were not included as predictors. None of the four target variables was used as a predictor for any of the other prediction tasks.
Across the 226-response analytical sample, the exact device combination reported in the typical-use question differed from the building-specific combination for 121 respondents (53.5%) in both the academic-building and library contexts. After conversion to the three power-demand categories, the typical-use and building-specific responses still produced different categories for 92 respondents (40.7%) in the academic-building context and 93 respondents (41.2%) in the library context. These differences confirm that the typical-use variable did not reproduce either building-specific target for personal-device power demand.
Four prediction targets were defined: academic-building space selection, academic-building personal-device power demand, library space selection, and library personal-device power demand. The two space-selection targets were encoded as multiclass categorical variables based on the investigated space types. For the two personal-device targets, the operating-power values of the devices reported by each respondent were summed. Mobile phones, laptops, tablets, and other devices were assigned operating-power values of 5, 40, 10, and 1 W, respectively. The resulting total was classified as low demand (<10 W), medium demand (10–49 W), or high demand (≥50 W) [23,24]. After removal of the administrative identifier and all target-defining variables, 28 original questionnaire predictor variables were retained and subsequently encoded to construct the model-input matrix. The roles and uses of the original predictor and target variables across the four prediction tasks are reported in Section 3.5. All subsequent class balancing and model-validation procedures were conducted within the cross-validation framework described in Section 3.4 and Section 3.8.
3.4. Target-Class Definition and Class-Imbalance Treatment
The original dataset contained 230 valid questionnaire responses. However, only four respondents selected the 364-seat tiered lecture hall in the academic-building space-selection task. Because this class contained fewer observations than the five folds required for stratified cross-validation, it could not be represented in every held-out fold or evaluated reliably as an independent prediction class. This category and its four associated observations were therefore excluded before model development, leaving 226 respondents in the revised analytical sample. To maintain an identical respondent base across the four prediction tasks and enable paired model comparisons, the same 226 respondents were used throughout the revised analysis.
The two space-selection targets were defined according to the physical characteristics of the investigated spaces. After exclusion of the four-observation lecture-hall category, the academic-building target contained five space categories, and the library target contained five categories. The original personal-device-use targets consisted of specific combinations of mobile phones, laptops, tablets, and other devices. However, several combinations were represented by only one to four respondents. These extremely sparse classes could not support reliable stratified evaluation and were susceptible to unstable or artificial classification boundaries if extensively oversampled.
The personal-device outcomes were therefore redefined as three power-demand categories based on the summed operating power of the devices reported for each building context. Mobile phones, laptops, tablets, and other devices were assigned operating-power values of 5, 40, 10, and 1 W, respectively. The summed device power was classified as low demand (<10 W), medium demand (10–49 W), or high demand (≥50 W). This classification preserved differences in the expected electrical demand associated with the reported device combinations while avoiding prediction classes represented by only one or a few respondents.
Class imbalance was addressed separately within the training partition of each cross-validation fold. Random oversampling with replacement was used to increase each minority class to the size of the largest class in the corresponding training partition. The revised procedure did not generate synthetic feature values, interpolate between observations, perturb categorical responses, or create device combinations that were absent from the original data.
All preprocessing and oversampling operations were fitted using the training partition only. The held-out validation partition was never resampled and retained its original class distribution throughout model evaluation. Because the training and validation partitions changed across the repeated cross-validation folds, the number of oversampled training observations also varied across folds. Table 1, Table 2, Table 3 and Table 4 therefore report the original class distributions before model training rather than the distribution from a single cross-validation fold.
Table 1.
Original class distribution for academic-building space-selection prediction.
Table 2.
Original class distribution for academic-building personal-device power-demand classification.
Table 3.
Original class distribution for library space-selection prediction.
Table 4.
Original class distribution for library personal-device power-demand classification.
3.5. Prediction Targets and Model Features
Four multiclass prediction targets were defined: academic-building space selection, academic-building personal-device power demand, library space selection, and library personal-device power demand. Following the exclusion of the four-observation lecture-hall category, the academic-building space-selection target contained five classes. The library space-selection target also contained five classes. The two personal-device power-demand targets each contained three classes: low demand (<10 W), medium demand (10–49 W), and high demand (≥50 W).
Separate models were developed for the four prediction targets using the same set of 28 original questionnaire predictors. These predictors described participant characteristics, general space-use behavior, visit frequency, duration of stay, preferred periods of use, environmental perceptions, and typical personal-device use. General space-use variables, such as the most frequently used study environment and general learning-task space preference, were retained because they described habitual or cross-context behavioral preferences and did not identify the specific room-type category constituting either building-specific space-selection target.
The typical personal-device-use indicators were retained as predictors because they described the devices typically used by each respondent in general rather than the devices reported in a particular investigated building. This general variable did not determine the devices reported for either building-specific context. The building-specific device responses were used exclusively to construct the corresponding personal-device power-demand targets and were excluded from all predictor matrices. Administrative identifiers, building-specific room-type outcomes, building-specific device-use responses, and all four target variables were excluded from every model input. Table 5 reports the role and use of each variable group across the four prediction tasks. The same predictor definitions, cross-validation folds, and evaluation procedures were used when comparing the candidate models within each task.
Table 5.
Definitions, roles, data types, and coding methods of the original predictor and target variables.
3.6. Machine-Learning Algorithms
3.6.1. Multinomial Logistic Regression
Multinomial logistic regression was included as a conventional reference model for the four multiclass prediction tasks. The model estimates the probability of each outcome category relative to a reference category as a function of the predictor variables. Unlike the tree-based models, multinomial logistic regression represents the predictor–outcome relationships through an additive linear structure on the log-odds scale. It was evaluated using the same predictor sets, outer cross-validation folds, training-partition-only class balancing, and performance metrics as the four tree-based models. Its inclusion enabled the study to examine whether the greater flexibility of tree-based algorithms produced an empirical advantage over a conventional multiclass classifier.
3.6.2. Decision Tree
A Decision Tree is a supervised learning algorithm that recursively divides observations according to feature values. Each internal node represents a decision rule, and each terminal node represents a predicted class. Its transparent structure makes it suitable as a baseline classifier, although a deep tree may overfit the training data [25].
In this study, Decision Tree classifiers were developed separately for the four prediction targets. The principal hyperparameters were maximum tree depth and the minimum number of samples required to split an internal node. These hyperparameters were selected through Bayesian optimization. The models learned classification rules from the questionnaire predictors, including visit frequency and general space-use preferences. Node impurity was evaluated using the Gini index, calculated as:
where pi is the proportion of samples belonging to class i, and y is the total number of classes.
The Gini Gain after splitting the dataset based on an attribute A is calculated as:
where Gini(D) represents the Gini index before splitting, ∣Di∣ is the size of subset Di, and k is the number of possible values of an attribute A.
3.6.3. Random Forest
Random Forest is an ensemble method that constructs multiple Decision Trees from bootstrapped samples and random subsets of features. The final predicted class is determined by aggregating the predictions of the component trees. This procedure can reduce the variance and overfitting associated with an individual Decision Tree [16].
Random Forest was applied to the same four prediction targets. The optimized hyperparameters included the number of trees and maximum tree depth.
3.6.4. Gradient Boosting Decision Trees
GBDT constructs trees sequentially, with each new tree trained to reduce the errors produced by the preceding ensemble [17]. This sequential procedure enables the model to capture nonlinear relationships among demographic characteristics, visit patterns, space-use preferences, and personal-device power-demand classifications.
Separate GBDT classifiers were developed for the four target variables. The optimized hyperparameters included the number of boosting iterations and maximum tree depth.
3.6.5. XGBoost
XGBoost is a regularized implementation of gradient boosting that includes procedures for controlling model complexity and improving computational efficiency [18]. Regularization can improve model generalizability when the available variables contain complex or overlapping patterns.
XGBoost was used to predict the same four target variables. The optimized hyperparameters included the number of trees, maximum tree depth, and learning rate. The loss function measures the difference between the predicted and actual values, while the regularization term penalizes model complexity, helping to prevent overfitting:
where N is the number of observations, L is the loss function, Ω(fk) is the regularization term for tree fk, and K is the number of trees.
The regularization term is defined as:
3.7. Bayesian Optimization
Bayesian optimization was used to tune the hyperparameters of the four tree-based classifiers [26]. A Gaussian process with a Matérn 5/2 kernel was used as the surrogate model, and Expected Improvement was used as the acquisition function. For each tree-based model and prediction task, 30 hyperparameter configurations were evaluated.
Hyperparameter optimization was conducted exclusively within the outer training partition. The optimization objective was to maximize mean classification accuracy under stratified five-fold inner cross-validation. Random oversampling was applied only within each inner training partition and was not applied to the corresponding inner validation partition. This procedure prevented validation observations from influencing either class balancing or hyperparameter selection.
The best-so-far objective value was recorded after every optimization iteration for each of the 15 outer folds. At each iteration, the optimization histories were first averaged across the five outer folds within each repetition and then across the three repetitions, which is mathematically equivalent to averaging directly across all 15 outer folds. Figure 2 presents the resulting mean convergence trajectories for the four tree-based models across the four prediction tasks, while Table 6 reports the corresponding mean best-so-far inner-cross-validation accuracies after iterations 5, 15, and 30. Between iterations 5 and 30, the largest improvement was 3.7 percentage points. The fold-averaged trajectory first reached its iteration-30 value after iteration 20 in 10 of the 16 model–task combinations. These results indicate that a five-iteration optimization budget was insufficient for several model–task combinations. The optimization budget was therefore increased to 30 iterations for all tree-based models and prediction tasks. All reported tree-model performance results were obtained using the hyperparameters selected through the complete 30-iteration optimization procedure.
Figure 2.
Mean best-so-far Bayesian-optimization trajectories for the four tree-based classifiers across the four prediction tasks: (a) academic-building space selection; (b) academic-building personal-device power-demand classification; (c) library space selection; and (d) library personal-device power-demand classification.
Table 6.
Mean best-so-far inner-cross-validation accuracy across the 15 outer folds after 5, 15, and 30 Bayesian-optimization iterations.
3.8. Model Validation and Performance Evaluation
Model performance was evaluated using stratified five-fold cross-validation repeated three times with fixed random seeds. This procedure produced 15 held-out evaluations for each prediction task. In each outer fold, approximately 79.6% of the original observations were used for model development, while the remaining 20.4% formed an untouched validation partition. Depending on the fold, the training partition contained 180/181 original observations, and the validation partition contained 45/46 original observations.
All preprocessing and class-balancing procedures were performed exclusively within the training partition of each fold. Random oversampling was applied only after the training and validation partitions had been separated. The held-out validation partition contained only original observations and was not used during preprocessing, oversampling, hyperparameter optimization, or model fitting. Hyperparameter optimization was performed within each outer training partition using stratified five-fold inner cross-validation. Oversampling was conducted separately within each inner training partition so that observations in the inner validation partition did not influence model development. The same outer folds were used for multinomial logistic regression, Decision Tree, Random Forest, GBDT, and XGBoost within each prediction task, enabling direct paired comparisons among the models.
Performance was summarized using the mean across the 15 outer validation folds. The evaluation metrics included accuracy, precision, recall, and F1 score. For the model selected for each prediction target, one-vs-rest class-specific ROC curves, corresponding area-under-the-curve values, and row-normalized confusion matrices were generated from the out-of-fold predictions obtained in the first fixed-seed five-fold repetition [27,28,29]. This procedure ensured that each respondent contributed exactly one held-out prediction to each diagnostic figure. By contrast, the aggregate performance metrics reported in Section 4.2 were calculated across all 15 outer validation folds. Because the held-out observations were never resampled, the reported metrics represent performance for respondents who were not used to train the corresponding model.
Permutation feature importance was calculated for the two space-selection prediction tasks to evaluate the contribution of the environmental, spatial, and behavioral predictors. The analysis was conducted separately for multinomial logistic regression, Decision Tree, Random Forest, GBDT, and XGBoost using the original observations in the held-out outer validation folds. For each fitted model, the values of one predictor were randomly permuted 30 times while all other predictors remained unchanged. Importance was quantified as the mean decrease in validation accuracy relative to the corresponding unpermuted validation data and was averaged across the permutation repetitions and the 15 outer validation folds. Predictors were ranked according to their mean importance across the five candidate models, and the three highest-ranked predictors for each space-selection task are presented in Section 4.3. Permutation importance represents predictive contribution and should not be interpreted as evidence of a causal relationship.
3.9. Estimation of Personal-Device Energy Demand
The machine learning predictions were used to calculate the classification-performance metrics and identify the most appropriate model for each of the four behavioral targets. The predicted class labels were not used as numerical inputs to Equation (5). Instead, the energy-estimation stage used the building-specific space selections, device combinations, duration of stay, and visit frequency reported by the respondents. Representative device-specific operating-power values were assigned to the reported personal devices. Mobile phones, laptops, tablets, and other low-power personal devices were assigned operating-power values of 5, 40, 10, and 1 W, respectively [23]. These values were treated as representative modeling assumptions rather than direct measurements of the devices used by individual respondents.
For each reported device combination, total operating power was calculated additively by summing the power values of the included devices. For example, the operating power assigned to a combination consisting of a mobile phone and a laptop was 45 W. Questionnaire response categories for duration of stay were converted to 0.5, 1.5, 2.5, and 4.0 h per visit, corresponding to less than 1 h, 1–2 h, 2–3 h, and more than 3 h, respectively. The open-ended upper category was represented by a value of 4.0 h. Weekly visit-frequency categories were converted to 0, 1.0, 2.0, and 3.5 visits per week, corresponding to “rarely,” “once per week,” “twice per week,” and “three or more times per week,” respectively. The open-ended upper category was conservatively represented by a value of 3.5 visits per week. These weekly frequencies were subsequently divided by seven to obtain average daily visit frequencies.
For respondent i, estimated average daily personal-device energy demand was calculated as:
where Ei is estimated personal-device energy demand in Wh/person/day, Pi is summed device operating power in W, Ti is duration per visit in h, and Fi is average number of visits per day. The mean energy demand for space type k was calculated by averaging Ei across the respondents who reported using that space.
The resulting values represent questionnaire-based estimates of personal-device energy demand rather than direct device-level or whole-building electricity measurements. They were derived using representative device-power values and numerical conversions of the reported duration and visit-frequency categories. HVAC, lighting, elevators, and other fixed building-system loads were excluded because their energy use depends on building-system characteristics, operating schedules, and control strategies that were not captured by the questionnaire or measured at the system level.
4. Results
4.1. Descriptive Occupant–Space–Device Patterns
Among the 230 respondents, 95 (41.3%) identified the academic building as their most frequently used space, 86 (37.4%) identified the library, and 49 (21.3%) identified other spaces. When respondents were asked where they usually studied when completing a learning task, the distribution shifted toward the library: 116 respondents (50.4%) selected the library, 84 (36.5%) selected the academic building, and 30 (13.0%) selected other spaces. The habitual and task-specific space responses agreed for 152 respondents (66.1%). Among the 95 respondents who most frequently used the academic building, 23 selected the library when completing a study task. Respondents whose most frequently used location was categorized as another space showed a more dispersed task-specific distribution: 18 selected the library, 15 selected the academic building, and 16 continued to select another space. These results indicate that habitual space use and task-specific space selection captured related but non-equivalent dimensions of occupant behavior.
Duration of stay also varied descriptively across the task-specific space groups. Among the 116 respondents selecting the library, 86 (74.1%) reported staying for more than 3 h, while 24 (20.7%) reported staying for less than 2 h. Among the 84 respondents selecting the academic building, the corresponding proportions were 56.0% and 40.5%, respectively. Of the 30 respondents selecting other spaces, 70.0% reported staying for more than 3 h and 26.7% reported staying for less than 2 h. Thus, the library group contained a larger proportion of long-stay users than the academic-building group. Across the full sample, 158 respondents (68.7%) reported visiting public study spaces at least three times per week, and 154 (67.0%) reported a typical stay longer than 3 h.
Gender-stratified comparisons showed broadly similar distributions of most frequently used spaces. Among women, 43.1% most frequently used the academic building, 34.6% used the library, and 22.3% used other spaces; the corresponding proportions among men were 39.0%, 41.0%, and 20.0%, respectively. A more pronounced descriptive difference was observed for laptop use, which was reported by 70.0% of women and 57.0% of men. Mobile-phone and tablet use was more similar between the two groups. These comparisons describe patterns within the present sample and should not be interpreted as statistically significant group differences.
4.2. Comparison of Aggregate Model Performance
Table 7, Table 8, Table 9 and Table 10 compare multinomial logistic regression, Decision Tree, Random Forest, GBDT, and XGBoost across the four prediction tasks and summarize accuracy, precision, recall, and F1 score, respectively. The performance estimates were obtained from out-of-fold predictions for the original, unresampled validation observations.
Table 7.
Accuracy under repeated stratified five-fold cross-validation.
Table 8.
Precision under repeated stratified five-fold cross-validation.
Table 9.
Recall under repeated stratified five-fold cross-validation.
Table 10.
F1 score under repeated stratified five-fold cross-validation.
For academic-building space selection, multinomial logistic regression achieved the highest accuracy of 0.791. Among the tree-based models, XGBoost performed best, with an accuracy of 0.788, followed by Random Forest at 0.777, GBDT at 0.764, and Decision Tree at 0.670. XGBoost produced the highest precision of 0.797, while multinomial logistic regression and XGBoost both achieved an F1 score of 0.783.
For academic-building personal-device power demand, Random Forest achieved the highest accuracy and recall of 0.827, the highest precision of 0.836, and the highest F1 score of 0.824. GBDT ranked second in accuracy at 0.790, followed by multinomial logistic regression and Decision Tree, both at 0.786, and XGBoost at 0.785.
For library space selection, multinomial logistic regression achieved the highest accuracy of 0.790, the highest precision of 0.801, and the highest F1 score of 0.787. Among the tree-based models, GBDT achieved the highest accuracy of 0.761, followed by XGBoost at 0.760, Random Forest at 0.758, and Decision Tree at 0.642.
For library personal-device power demand, Random Forest achieved the highest accuracy and recall of 0.823, the highest precision of 0.834, and the highest F1 score of 0.823. The corresponding accuracies of GBDT, XGBoost, multinomial logistic regression, and Decision Tree were 0.789, 0.780, 0.765, and 0.742, respectively.
Relative to the individual Decision Tree, the strongest tree-based model increased accuracy by 11.8 percentage points for academic-building space selection, from 0.670 to 0.788; by 4.1 percentage points for academic-building personal-device power demand, from 0.786 to 0.827; by 11.9 percentage points for library space selection, from 0.642 to 0.761; and by 8.1 percentage points for library personal-device power demand, from 0.742 to 0.823. The strongest tree-based models for these four tasks were XGBoost, Random Forest, GBDT, and Random Forest, respectively.
Compared with multinomial logistic regression, the strongest tree-based model was 0.3 percentage points less accurate for academic-building space selection and 2.9 percentage points less accurate for library space selection. Conversely, Random Forest exceeded multinomial logistic regression by 4.1 percentage points for academic-building personal-device power demand and by 5.8 percentage points for library personal-device power demand. Thus, the tree ensembles consistently improved upon the individual Decision Tree, although the magnitude of improvement varied across the four tasks. Their numerical advantage over the conventional multiclass reference model remained limited to the two personal-device power-demand tasks.
4.3. Permutation Importance of Space-Selection Predictors
Table 11 and Table 12 present the three highest-ranked predictors for academic-building and library space selection based on their mean permutation importance across the five candidate models. For academic-building space selection, lighting produced the largest mean decrease in validation accuracy across the five models (0.231), followed by air quality (0.162) and acoustics (0.158). Lighting was the highest-ranked predictor for multinomial logistic regression, Random Forest, GBDT, and XGBoost, whereas air quality produced the largest decrease in accuracy for Decision Tree. Despite variation in the magnitude of importance across the models, the three highest-ranked predictors consistently represented aspects of indoor environmental quality.
Table 11.
Permutation importance of predictors for academic-building space selection.
Table 12.
Permutation importance of predictors for library space selection.
For library space selection, privacy produced the largest mean decrease in accuracy across the five models (0.243), followed by distance to amenities (0.228) and natural elements (0.185). Privacy was the highest-ranked predictor for Decision Tree, Random Forest, and multinomial logistic regression, while distance to amenities showed similarly high importance for GBDT and XGBoost.
4.4. Class-Specific ROC Results
Figure 3 presents the one-vs-rest class-specific receiver operating characteristic curves for the model selected for each prediction target. Multinomial logistic regression was used for the two space-selection targets, whereas Random Forest was used for the two personal-device power-demand targets. To ensure that each respondent contributed only one held-out prediction to the graphical analysis, the curves were generated using the out-of-fold predicted probabilities obtained in the first fixed-seed five-fold repetition. The aggregate performance results across all three repetitions are reported separately in Table 7, Table 8, Table 9 and Table 10.
Figure 3.
One-vs-rest class-specific ROC curves for the selected models, calculated using out-of-fold predicted probabilities from the first fixed-seed five-fold repetition: (a) multinomial logistic regression for academic-building space selection; (b) multinomial logistic regression for library space selection; (c) Random Forest for academic-building personal-device power demand; and (d) Random Forest for library personal-device power demand.
For academic-building space selection, the class-specific area under the receiver operating characteristic curve (AUC) values ranged from 0.91 to 0.98. Type 2 produced the highest AUC of 0.98, followed by Type 5 at 0.97, while Types 1, 3, and 4 each produced an AUC of 0.91. For library space selection, the AUC values ranged from 0.92 to 0.99. Types 4 and 5 each achieved an AUC of 0.99, followed by Type 2 at 0.95, Type 3 at 0.94, and Type 1 at 0.92. These results indicate that multinomial logistic regression provided strong class-ranking performance for the two space-selection targets, although the final class assignments should also be examined using the confusion matrices.
For academic-building personal-device power demand, the Random Forest AUC values were 0.87 for the low-demand category, 0.84 for the medium-demand category, and 0.91 for the high-demand category. The corresponding AUC values for library personal-device power demand were 0.81, 0.83, and 0.88. The high-demand category produced the strongest discrimination in both buildings. The medium-demand category produced the lowest AUC in the academic building, whereas the low-demand category produced the lowest AUC in the library.
The relatively high AUC values should not be interpreted as equivalent to high class-specific recall. AUC evaluates the ranking of one class against the remaining classes across all possible probability thresholds, whereas the confusion matrix evaluates the final multiclass assignments. Consequently, a class may have a comparatively high AUC while still exhibiting a lower diagonal classification rate at the selected decision rule.
4.5. Confusion-Matrix Results
Figure 4 presents the row-normalized confusion matrices for the model selected for each prediction target. As with the ROC analysis, the matrices were calculated using the out-of-fold predictions from the first fixed-seed five-fold repetition, so that each respondent contributed one held-out prediction. Each row represents the true class, and the percentages across each row sum to 100%.
Figure 4.
Row-normalized confusion matrices for the selected models, calculated using out-of-fold predictions from the first fixed-seed five-fold repetition: (a) multinomial logistic regression for academic-building space selection; (b) multinomial logistic regression for library space selection; (c) Random Forest for academic-building personal-device power demand; and (d) Random Forest for library personal-device power demand.
For academic-building space selection, multinomial logistic regression correctly classified 33.33% of Type 1, 85.71% of Type 2, 72.34% of Type 3, 68.97% of Type 4, and 93.18% of Type 5 observations. Type 1 was the most difficult class to identify: 50.00% of its observations were classified as Type 4 and 16.67% as Type 2. The low diagonal rate for Type 1 should be interpreted in conjunction with its relatively small original class size. Misclassification was also observed between Types 3 and 4, which may reflect similarities in their flat-floor classroom characteristics.
For library space selection, the diagonal classification rates were 74.42%, 71.43%, 76.27%, 93.33%, and 83.78% for Types 1–5, respectively. Type 4 produced the highest class-specific recall. The largest off-diagonal error occurred for Type 2, of which 19.05% was classified as Type 3. Additional confusion occurred from Type 3 to Type 1 and from Type 5 to Type 1, accounting for 11.86% and 10.81% of their respective observations.
For academic-building personal-device power demand, Random Forest correctly classified 64.29% of the low-demand observations, 86.07% of the medium-demand observations, and 82.89% of the high-demand observations. The low-demand category remained the most difficult to identify, with 32.14% of its observations classified as medium demand. In addition, 15.79% of the high-demand observations were classified as medium demand. Thus, the principal errors involved confusion between adjacent power-demand categories.
For library personal-device power demand, the corresponding diagonal classification rates were 67.86%, 83.33%, and 88.33% for the low-, medium-, and high-demand categories, respectively. The principal errors again involved adjacent demand categories: 25.00% of the low-demand observations were classified as medium demand, 11.59% of the medium-demand observations were classified as high demand, and 11.67% of the high-demand observations were classified as medium demand. Random Forest classified the high- and medium-demand categories more reliably than the low-demand category.
4.6. Target-Specific Model Selection and Questionnaire-Based Energy-Demand Estimation
The model with the highest mean outer-fold accuracy was selected separately for each prediction target. Multinomial logistic regression was selected for academic-building and library space-selection prediction, with accuracies of 0.791 and 0.790, respectively. Random Forest was selected for academic-building and library personal-device power-demand classification, with accuracies of 0.827 and 0.823, respectively. The out-of-fold predictions provided the empirical basis for this target-specific model selection. The energy-demand estimates reported below constitute a complementary questionnaire-based analysis and were calculated from respondents’ reported building-specific behaviors rather than from the predicted class labels.
Table 13 and Table 14 present the estimates of average daily personal-device energy demand across the investigated space types. The mean estimates were 48.5 Wh/person/day for the academic-building spaces and 45.7 Wh/person/day for the library spaces. Within the academic building, the 132-seat tiered multimedia classroom had the highest estimate, at 57.3 Wh/person/day, whereas the 165-seat tiered classroom had the lowest estimate, at 21.9 Wh/person/day. Within the library, Reading Room 5 had the highest estimate, at 56.3 Wh/person/day, whereas Reading Room 3 had the lowest estimate, at 39.4 Wh/person/day. These questionnaire-based values were derived using representative assumptions concerning device power, duration of stay, and visit frequency and should not be interpreted as measured whole-building electricity consumption.
Table 13.
Space categories and estimated average daily personal-device energy demand in the academic building.
Table 14.
Space categories and estimated average daily personal-device energy demand in the library.
5. Discussion
5.1. Principal Findings
The descriptive findings provide an empirical context for the subsequent prediction and energy-estimation analyses. The shift from the academic building as the most frequently used space to the library as the preferred location for study tasks indicates that habitual occupancy and task-specific space choice are not interchangeable. The larger proportion of long stays among library users further demonstrates that identical occupancy counts may be associated with different durations of device use. In addition, the observed variation in device combinations indicates that occupants using the same type of space may produce different personal-device power demands. These patterns support the joint consideration of occupant, space, duration, and device information rather than representing occupant-related demand through occupancy counts alone.
The study produced three principal findings. First, model performance depended on both the prediction target and the modeling approach. Multinomial logistic regression achieved the highest accuracy for space-selection prediction in both the academic building and library, whereas Random Forest performed best for the two personal-device power-demand targets. Thus, the tree-based models did not consistently outperform the conventional multiclass reference model.
Second, the ensemble tree models consistently improved accuracy relative to the individual Decision Tree, with absolute gains ranging from 4.1 to 11.9 percentage points across the four prediction tasks. However, comparison with multinomial logistic regression produced a more qualified result. The strongest tree-based models were 0.3 and 2.9 percentage points less accurate than multinomial logistic regression for academic-building and library space selection, respectively, whereas Random Forest was 4.1 and 5.8 percentage points more accurate for the corresponding personal-device power-demand tasks. The numerical advantage of the tree-based models was therefore target-dependent and was evident for personal-device power-demand classification rather than space-selection prediction.
Third, the questionnaire-reported device combinations, duration of stay, and visit frequency produced different estimates of personal-device energy demand across the investigated spaces. The estimates demonstrate that personal-device demand was not distributed uniformly among the space types, although the values should be interpreted as comparative estimates rather than direct electricity measurements.
5.2. Interpretation of Model Differences
The stronger performance of multinomial logistic regression for the two space-selection tasks suggests that the principal associations between the available predictors and space choice could be represented effectively through an additive multiclass structure. Given the relatively small questionnaire sample, the lower flexibility of the conventional model may also have reduced variance relative to the tree-based alternatives.
By contrast, Random Forest performed best for both personal-device power-demand targets. Personal-device power demand may reflect interactions among typical personal-device use, visit patterns, respondent characteristics, and building context. Random Forest can represent these interactions without imposing a predetermined functional form while reducing the instability associated with an individual Decision Tree.
These results demonstrate why the four behavioral targets should not be assigned a single preferred algorithm in advance. Model suitability was empirical and target-specific rather than an inherent property of either conventional or tree-based classification.
The permutation-importance analysis further indicates that the predictors contributing to space selection differed between the two building contexts. Academic-building space selection relied most strongly on lighting, air quality, and acoustics. These factors describe immediate indoor environmental conditions and may be particularly relevant when occupants choose among spaces with different physical and environmental characteristics.
Library space selection was more strongly associated with privacy, distance to amenities, and natural elements. Compared with classroom selection, library use may involve longer periods of individual study, making privacy and the spatial relationship between seating and supporting facilities more relevant. The prominence of natural elements also suggests that the perceived environmental quality of study spaces contributed to the differentiation among library areas.
These results should be interpreted as patterns of predictive reliance rather than evidence that the identified variables directly caused occupants to select particular spaces. Nevertheless, the contrast between the two settings demonstrates that the information used by the models was context-dependent and provides a more interpretable basis for understanding the space-selection results.
5.3. Comparison with Previous Studies
Previous building-energy and occupancy studies have demonstrated the usefulness of Random Forest and gradient-boosting models for representing nonlinear relationships among occupant, environmental, and operational variables [6,8,10]. The present results provide a more qualified comparison. Tree ensembles consistently outperformed the individual Decision Tree, but they did not outperform multinomial logistic regression for the two space-selection tasks. This finding shows that greater model flexibility does not necessarily produce higher predictive performance in a small questionnaire-based multiclass dataset.
The numerical performance comparisons in the present study were restricted to models evaluated using the same respondents, predictor definitions, outcome classes, and cross-validation folds. Direct numerical comparison of accuracy values with those reported in previous studies would not provide a like-for-like assessment because the studies differ in their prediction targets, class structures, sample characteristics, predictor sets, and validation procedures. The methodological comparison reported here should therefore be interpreted as the within-dataset improvement of the ensemble models over the individual Decision Tree and their target-specific performance relative to multinomial logistic regression, rather than as evidence of numerical superiority over models evaluated using different datasets.
Previous research has also demonstrated that occupant behavior can substantially affect building energy demand and the performance of energy-prediction models [5,8,20]. However, many existing studies represent occupancy through aggregate counts, schedules, or occupancy rates. The present study extends this behavioral perspective by considering both space-selection preferences and personal-device combinations.
The study provides a complementary approach for examining one component of building energy demand: the energy associated with occupants’ personal devices. By linking behavioral classification with space-specific energy estimation, the analysis provides a more differentiated representation of user-related device energy across educational spaces. The exclusion of HVAC and lighting loads was a deliberate modeling decision rather than an indication that these loads are unimportant. Unlike personal-device use, which can be linked to respondents’ reported device choices, occupancy duration, and visit frequency, HVAC and lighting demand depends on building-system characteristics, operating schedules, and control strategies. Reliable estimation of these loads would require building-management-system records, environmental measurements, or submetered electricity data that were not available in the questionnaire-based dataset. The present framework should therefore be understood as examining one occupant-related component of educational-building energy demand and as complementing, rather than replacing, whole-building energy models.
Although the present study focuses on the operational-phase energy demand associated with occupants’ personal devices, the results should also be considered within the broader context of whole-life carbon assessment. Whole-life building emissions include not only operational carbon arising from energy use but also upfront and recurring embodied carbon associated with material production, construction, maintenance, equipment replacement, renovation, and end-of-life processes. Recent research on higher-education campus buildings has demonstrated that retrofit strategies should be evaluated by considering their effects on both operational and embodied carbon, because interventions that reduce operational demand may introduce additional embodied impacts through new materials and equipment [30]. Similarly, an integrated assessment of university buildings has shown the importance of combining operational and embodied emissions when developing long-term campus decarbonization pathways [31]. The personal-device energy demand examined in the present study therefore represents only one component of operational energy demand. It does not provide a whole-life carbon assessment and cannot, by itself, determine whether an educational building or campus achieves net-zero emissions. Future research could integrate occupant-related energy estimates with HVAC and lighting demand, electricity-grid emission factors, material inventories, building-system replacement cycles, and life-cycle assessment methods.
5.4. Practical Implications
The practical value of the framework lies in identifying where occupant-related personal-device demand is more likely to occur rather than in estimating total building consumption. Facility managers could use space-specific information to support the allocation of charging facilities, assess whether high-use study spaces have adequate electrical infrastructure, coordinate space-opening schedules, and identify locations where direct plug-load monitoring may be most valuable. These estimates should be used as preliminary comparative information and should be complemented by measured electricity data before operational or investment decisions are made.
The comparative results demonstrate that different behavioral outcomes may require different predictive approaches. Multinomial logistic regression was most accurate for space-selection prediction, whereas Random Forest was most accurate for personal-device power-demand classification. The main methodological implication is therefore that model suitability should be evaluated separately for each prediction target rather than assuming that one algorithm is appropriate for all behavioral tasks. The complementary energy analysis further illustrates how questionnaire-reported space-use and device-use patterns may correspond to differences in estimated personal-device demand among spaces.
Nevertheless, the estimated values should be interpreted as comparative indicators rather than direct measurements of building performance. They may help identify relative differences among spaces, but they should not be used as substitutes for electricity-meter data when evaluating total building energy consumption.
5.5. Limitations and Future Research
This study has several limitations. First, the dataset was obtained from 226 participants at a single university, and no external validation dataset from another university or institutional context was available. The sample may not capture variations in occupant characteristics, space-use patterns, device-use preferences, building conditions, or climates across different educational institutions. The findings should therefore be interpreted as context-specific and should not be assumed to generalize directly to other educational buildings. In addition, the study did not conduct a whole-life carbon assessment. Upfront embodied carbon from construction materials and building systems, recurring embodied carbon from maintenance and replacement, and end-of-life emissions were outside the study boundary. Consequently, the reported personal-device energy estimates should not be interpreted as measures of the overall carbon performance or net-zero status of the investigated buildings.
Second, the behavioral variables were derived entirely from self-reported questionnaire responses. The questionnaire captured participants’ typical space-use and device-use patterns, including their usual space selections, weekly visit frequency, duration of stay, periods of use, and personal devices typically used. These responses may be affected by recall error, response bias, differences in the interpretation of response categories, or discrepancies between reported habitual patterns and actual behavior. The reported patterns were not independently validated against occupancy sensors, access-control records, Wi-Fi connection data, direct observations, or device-level monitoring. The predictive results should therefore be interpreted as predictions of questionnaire-reported behavioral patterns rather than verified observations of actual occupant behavior. Future studies should combine questionnaire responses with objective measurements to evaluate the agreement between reported and observed behavior and to assess the external validity of the proposed framework.
Third, the target classes were imbalanced, particularly for less common space types and predicted personal-device power-demand categories. Although resampling was used to improve minority-class representation, model performance for infrequently observed classes should be interpreted cautiously. The 364-seat tiered lecture-hall category was excluded because it contained only four respondents and could not support stratified five-fold evaluation as an independent class. This decision avoided extensive replication of an extremely sparse category but means that the reported academic-building findings do not apply to this lecture-hall type. Future work could collect additional observations for rare classes or examine alternative class-balancing methods.
The permutation feature-importance analysis was limited to the two space-selection outcomes because its purpose was to identify the environmental, spatial, and behavioral predictors most relevant to occupants’ space choices. It therefore does not explain the predictor contributions underlying the personal-device power-demand models. In addition, permutation importance measures the reduction in predictive performance after a predictor is disrupted and should not be interpreted as evidence of causality. Correlated predictors may share or redistribute importance, meaning that a relatively small permutation score does not necessarily indicate that a predictor is irrelevant.
Fourth, the original device combinations were aggregated into three power-demand categories. This improved class support and enabled stratified evaluation, but it reduced the granularity of the predicted outcomes. The models distinguish low, medium, and high personal-device power demand rather than predicting every specific device combination. Although random oversampling was confined to the training partitions, duplicating minority-class training observations may still increase sensitivity to the respondents represented in those classes.
Fifth, the energy-estimation stage was intentionally limited to occupants’ personal devices. Major building loads, including HVAC systems, lighting, elevators, and other fixed equipment, were not included because the questionnaire did not capture the system-level operating conditions required to estimate these loads. HVAC and lighting demand may also be influenced by weather, operating schedules, and control strategies. The resulting estimates therefore represent only the personal-device-related component of building energy demand and should not be interpreted as whole-building energy consumption. Future studies could integrate the present behavioral framework with building-management-system records, environmental measurements, and submetered HVAC and lighting data.
Sixth, fixed representative power values and numerical values for categorical questionnaire responses were used in the energy-estimation stage. Actual device power may vary according to device model, battery state, charging protocol, workload, operating mode, and charger efficiency. In addition, the “three or more visits per week” and “more than 3 h” categories were open-ended and were represented by assumed numerical values. These assumptions introduce uncertainty into the absolute energy estimates. The reported values should therefore be interpreted primarily as comparative indicators of differences among spaces. Future studies should use device-level metering and continuously recorded occupancy durations and visit frequencies and should conduct sensitivity analyses using alternative conversion values.
Finally, the models were developed using data from the same institutional context in which they were evaluated. Future studies should conduct external validation using data from other buildings and universities. Longitudinal data would also make it possible to examine whether space-use preferences, personal-device power-demand classifications, and device-related energy demand change over time.
6. Conclusions
This study developed a four-stage analytical framework that primarily compared conventional and tree-based classifiers across four behavioral prediction tasks and complemented this comparison with a questionnaire-based estimation of space-specific personal-device energy demand. The revised analysis used 226 original questionnaire responses and evaluated multinomial logistic regression, Decision Tree, Random Forest, GBDT, and XGBoost through stratified five-fold cross-validation repeated three times. Class balancing and hyperparameter optimization were confined to the training partitions, while all performance estimates were obtained from untouched held-out observations.
Model performance was target-dependent. Multinomial logistic regression achieved the highest accuracy for academic-building and library space selection, reaching 0.791 and 0.790, respectively. Random Forest achieved the highest accuracy for academic-building and library personal-device power demand, reaching 0.827 and 0.823, respectively. Relative to multinomial logistic regression, the strongest tree-based models were 0.3 and 2.9 percentage points less accurate for the two space-selection tasks but 4.1 and 5.8 percentage points more accurate for the two personal-device power-demand tasks, respectively. These findings demonstrate the complementary strengths of conventional and tree-based classifiers and show that greater model flexibility does not guarantee superior performance for every behavioral target.
Based on the questionnaire-reported space selections, device combinations, duration of stay, and visit frequency, the estimated mean personal-device energy demand was 48.5 Wh/person/day across the academic-building spaces and 45.7 Wh/person/day across the library spaces. The estimates also varied among individual space types, indicating that personal-device demand was not distributed uniformly across the investigated educational spaces. These questionnaire-based estimates provide comparative information concerning the spatial distribution of occupant-controlled personal-device demand but should not be interpreted as direct device-level or whole-building electricity measurements.
The framework remains limited to personal-device energy demand and excludes HVAC, lighting, and other fixed building-system loads. External validation across different universities, building types, and geographic regions is particularly necessary before the framework can be generalized to other educational-building contexts. Future research should also integrate occupant-related operational energy demand with HVAC and lighting loads, electricity-grid emission factors, material inventories, maintenance and replacement cycles, and life-cycle assessment methods to evaluate the combined effects of operational and embodied carbon in educational buildings. In addition, questionnaire-reported space-use and device-use patterns should be validated against objective behavioral data obtained from occupancy sensors, access-control systems, Wi-Fi records, direct observations, or device-level monitoring.
Author Contributions
Conceptualization, H.H. and X.C.; methodology, H.H. and X.C.; software, H.H. and J.X.; validation, H.H., J.X., Y.Y., M.Z. and X.C.; formal analysis, H.H.; investigation, H.H., J.X., Y.Y. and M.Z.; resources, X.C.; data curation, H.H., J.X., Y.Y. and M.Z.; writing—original draft preparation, H.H.; writing—review and editing, J.X., Y.Y., M.Z. and X.C.; visualization, H.H.; supervision, X.C.; project administration, H.H. and X.C.; funding acquisition, X.C. All authors have read and agreed to the published version of the manuscript.
Funding
The research described in this paper was conducted with the support of the Guangdong Natural Science Foundation (Grant #2022A1515110888), Guangdong Science and Technology Innovation Program for Water Resources (Grant #2025-02) and Thematic Case Project of the China Academic Degrees and Graduate Education Development Center, Ministry of Education (Grant #ZT-2510564003). The authors appreciate the support.
Institutional Review Board Statement
All subjects gave their informed consent for inclusion before they participated in the study. The study was conducted in accordance with the Declaration of Helsinki, and the protocol was approved by the Institutional Review Board of the College of Water Conservancy and Civil Engineering, South China Agricultural University (Project identification code: SCAU-WCCE [2026] No. 3).
Informed Consent Statement
Informed consent was obtained from all subjects involved in the study.
Data Availability Statement
The data supporting the findings of this study are available from the corresponding author upon reasonable request.
Conflicts of Interest
The authors declare no conflicts of interest. The funders had no role in the design of the study; in the collection, analyses, or interpretation of data; in the writing of the manuscript; or in the decision to publish the results.
Abbreviations
The following abbreviations are used in this manuscript:
| IEA | International Energy Agency |
| GBDT | Gradient boosting decision trees |
| ROC | Receiver operating characteristic |
| AUC | Area under the receiver operating characteristic curve |
References
- International Energy Agency. IEA Tracking Report—Buildings. Available online: https://globalabc.org/index.php/resources/publications/iea-tracking-report-buildings (accessed on 30 April 2026).
- International Energy Agency. Energy Efficiency 2023; IEA: Paris, France, 2023; Available online: https://iea.blob.core.windows.net/assets/dfd9134f-12eb-4045-9789-9d6ab8d9fbf4/EnergyEfficiency2023.pdf (accessed on 30 April 2026).
- Ali-Tagba, A.-R.; Baneto, M.; Lucache, D.D. Factors influencing the energy consumption in a building: Comparative study between two different climates. Energies 2024, 17, 4041. [Google Scholar] [CrossRef] [Scilit]
- Arowoiya, V.A.; Onososen, A.O.; Moehler, R.C.; Fang, Y. Influence of thermal comfort on energy consumption for building occupants: The current state of the art. Buildings 2024, 14, 1310. [Google Scholar] [CrossRef] [Scilit]
- Amasyali, K.; El-Gohary, N.M. Real data-driven occupant-behavior optimization for reduced energy consumption and improved comfort. Appl. Energy 2021, 302, 117276. [Google Scholar] [CrossRef] [Scilit]
- Zhang, W.; Wu, Y.; Calautit, J.K. A review on occupancy prediction through machine learning for enhancing energy efficiency, air quality and thermal comfort in the built environment. Renew. Sustain. Energy Rev. 2022, 167, 112704. [Google Scholar] [CrossRef] [Scilit]
- Yang, J.; Zhang, Q. Effect of the spatial form of outpatient buildings on energy consumption in different climate zones in China. PLoS ONE 2023, 18, e0293982. [Google Scholar] [CrossRef] [Scilit] [PubMed]
- Anand, P.; Deb, C.; Yan, K.; Yang, J.; Cheong, D.; Sekhar, C. Occupancy-based energy consumption modelling using machine learning algorithms for institutional buildings. Energy Build. 2021, 252, 111478. [Google Scholar] [CrossRef] [Scilit]
- Markovic, R.; Azar, E.; Annaqeeb, M.K.; Frisch, J.; van Treeck, C. Day-ahead prediction of plug-in loads using a long short-term memory neural network. Energy Build. 2021, 234, 110667. [Google Scholar] [CrossRef] [Scilit]
- Li, T.; Liu, X.; Li, G.; Wang, X.; Ma, J.; Xu, C.; Mao, Q. A systematic review and comprehensive analysis of building occupancy prediction. Renew. Sustain. Energy Rev. 2024, 193, 114284. [Google Scholar] [CrossRef] [Scilit]
- Alam, M.; Devjani, M.R. Analyzing energy consumption patterns of an educational building through data mining. J. Build. Eng. 2021, 44, 103385. [Google Scholar] [CrossRef] [Scilit]
- Gui, X.; Gou, Z.; Zhang, F. The relationship between energy use and space use of higher educational buildings in subtropical Australia. Energy Build. 2020, 211, 109799. [Google Scholar] [CrossRef] [Scilit]
- Schalkoff, R.J. Artificial Neural Networks; McGraw-Hill: New York, NY, USA, 1997. [Google Scholar]
- Ding, Y.; Fan, L.; Liu, X. Analysis of feature matrix in machine learning algorithms to predict energy consumption of public buildings. Energy Build. 2021, 249, 111208. [Google Scholar] [CrossRef] [Scilit]
- Quinlan, J.R. Induction of decision trees. Mach. Learn. 1986, 1, 81–106. [Google Scholar] [CrossRef] [Scilit]
- Breiman, L. Random forests. Mach. Learn. 2001, 45, 5–32. [Google Scholar] [CrossRef] [Scilit]
- Friedman, J.H. Greedy function approximation: A gradient boosting machine. Ann. Stat. 2001, 29, 1189–1232. [Google Scholar] [CrossRef] [Scilit]
- Chen, T.; Guestrin, C. XGBoost: A scalable tree boosting system. In Proceedings of the 22nd ACM SIGKDD International Conference on Knowledge Discovery and Data Mining, San Francisco, CA, USA, 13–17 August 2016; pp. 785–794. [Google Scholar] [CrossRef] [Scilit]
- Movahedi, A.; Derrible, S. Interrelationships between electricity, gas, and water consumption in large-scale buildings. J. Ind. Ecol. 2021, 25, 932–947. [Google Scholar] [CrossRef] [Scilit]
- Zhao, M.-M.; Lv, Z.-Q. Energy consumption calculation of campus buildings based on the law of personnel flow. Energy Sci. Eng. 2023, 11, 1875–1885. [Google Scholar] [CrossRef] [Scilit]
- Ward, R.; Wong, C.S.Y.; Chong, A.; Choudhary, R.; Ramasamy, S. A study on the transferability of computational models of building electricity load patterns across climatic zones. Energy Build. 2021, 237, 110826. [Google Scholar] [CrossRef] [Scilit]
- Botman, L.; Lago, J.; Fu, X.; Chia, K.; Wolf, J.; Kleissl, J.; De Moor, B. Building plug load mode detection, forecasting and scheduling. Appl. Energy 2024, 364, 123098. [Google Scholar] [CrossRef] [Scilit]
- Hafer, M. Quantity and electricity consumption of plug load equipment on a university campus. Energy Effic. 2017, 10, 1013–1039. [Google Scholar] [CrossRef] [Scilit]
- Buczak, P. Frequency-adjusted borders ordinal forest: A novel tree ensemble method for ordinal prediction. Br. J. Math. Stat. Psychol. 2025, 78, 594–616. [Google Scholar] [CrossRef] [Scilit] [PubMed]
- Loh, W.-Y. Classification and regression trees. WIREs Data Min. Knowl. Discov. 2011, 1, 14–23. [Google Scholar] [CrossRef] [Scilit]
- Snoek, J.; Larochelle, H.; Adams, R.P. Practical Bayesian optimization of machine learning algorithms. In Advances in Neural Information Processing Systems 25; Bartlett, P.L., Pereira, F.C.N., Burges, C.J.C., Bottou, L., Weinberger, K.Q., Eds.; Curran Associates, Inc.: Red Hook, NY, USA, 2012; pp. 2951–2959. [Google Scholar]
- Zeng, G. On the confusion matrix in credit scoring and its analytical properties. Commun. Stat. Theory Methods 2020, 49, 2080–2093. [Google Scholar] [CrossRef] [Scilit]
- Jiang, Y. Receiver operating characteristic (ROC) analysis of image search-and-localize tasks. Acad. Radiol. 2020, 27, 1742–1750. [Google Scholar] [CrossRef] [Scilit] [PubMed]
- Ma, H.; Bandos, A.I.; Gur, D. On the use of partial area under the ROC curve for comparison of two diagnostic tests. Biom. J. 2015, 57, 304–320. [Google Scholar] [CrossRef] [Scilit] [PubMed]
- Steven, R.; Liu, X.; Liu, L.; Short, M.; Gupta, R.; Bros-Williamson, J. A new approach to retrofitting FHE campus buildings using a whole life carbon assessment. Energy 2025, 335, 138101. [Google Scholar] [CrossRef] [Scilit]
- Maçin, K.E.; Özcan, F.K.; Acuner-Türet, E.; Köse-Mutlu, B. Carbon footprint and decarbonization of university buildings: Operational and embodied emissions at Istanbul Technical University. Build. Environ. 2026, 289, 114047. [Google Scholar] [CrossRef] [Scilit]
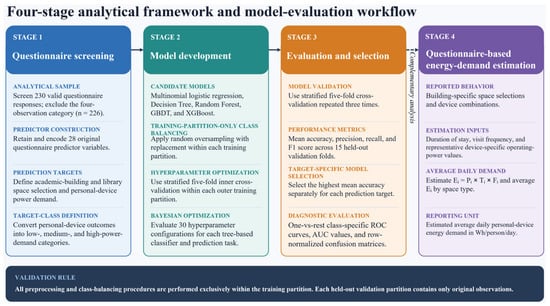
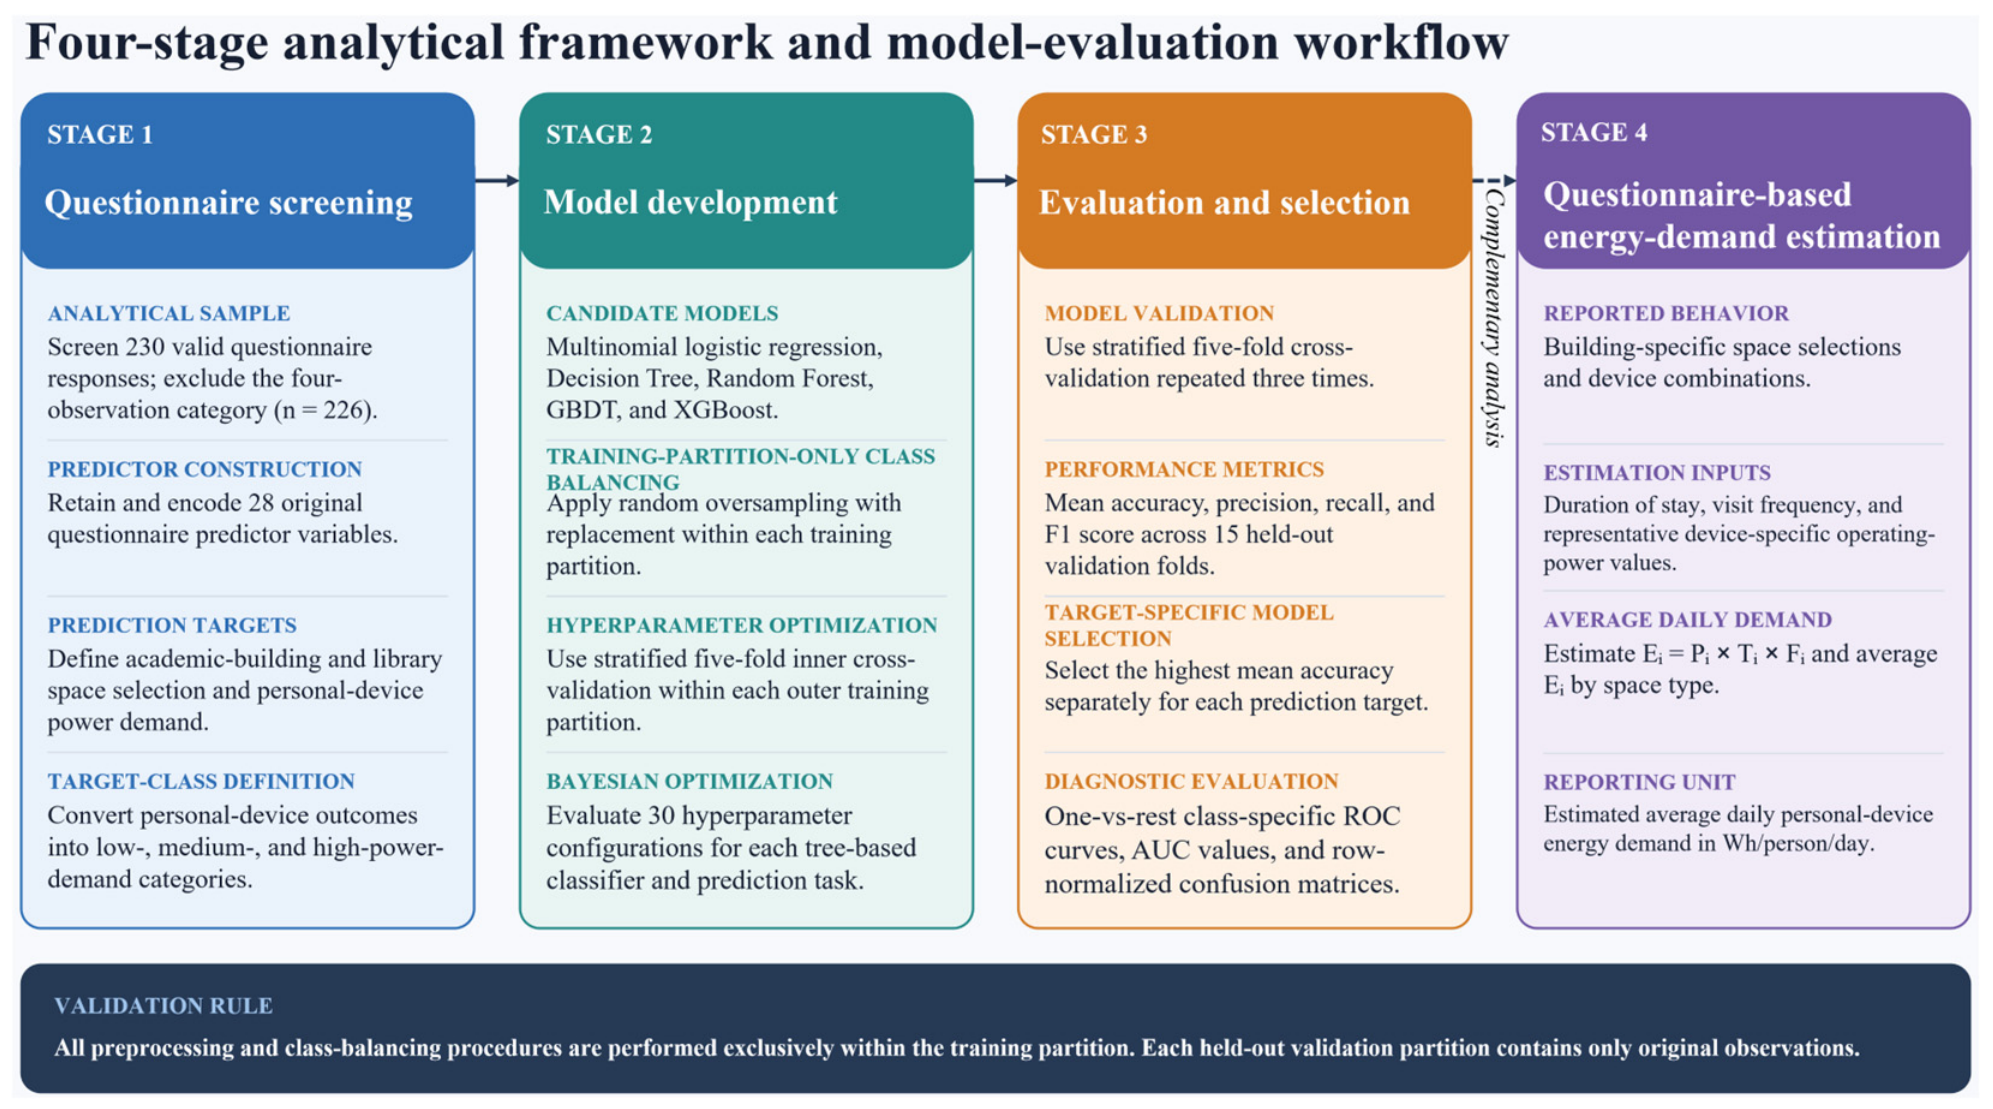
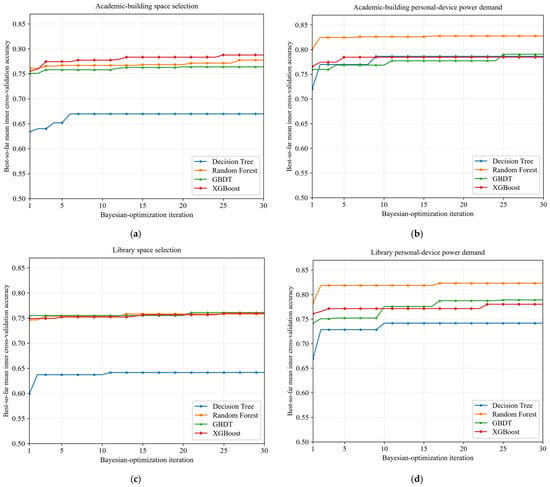
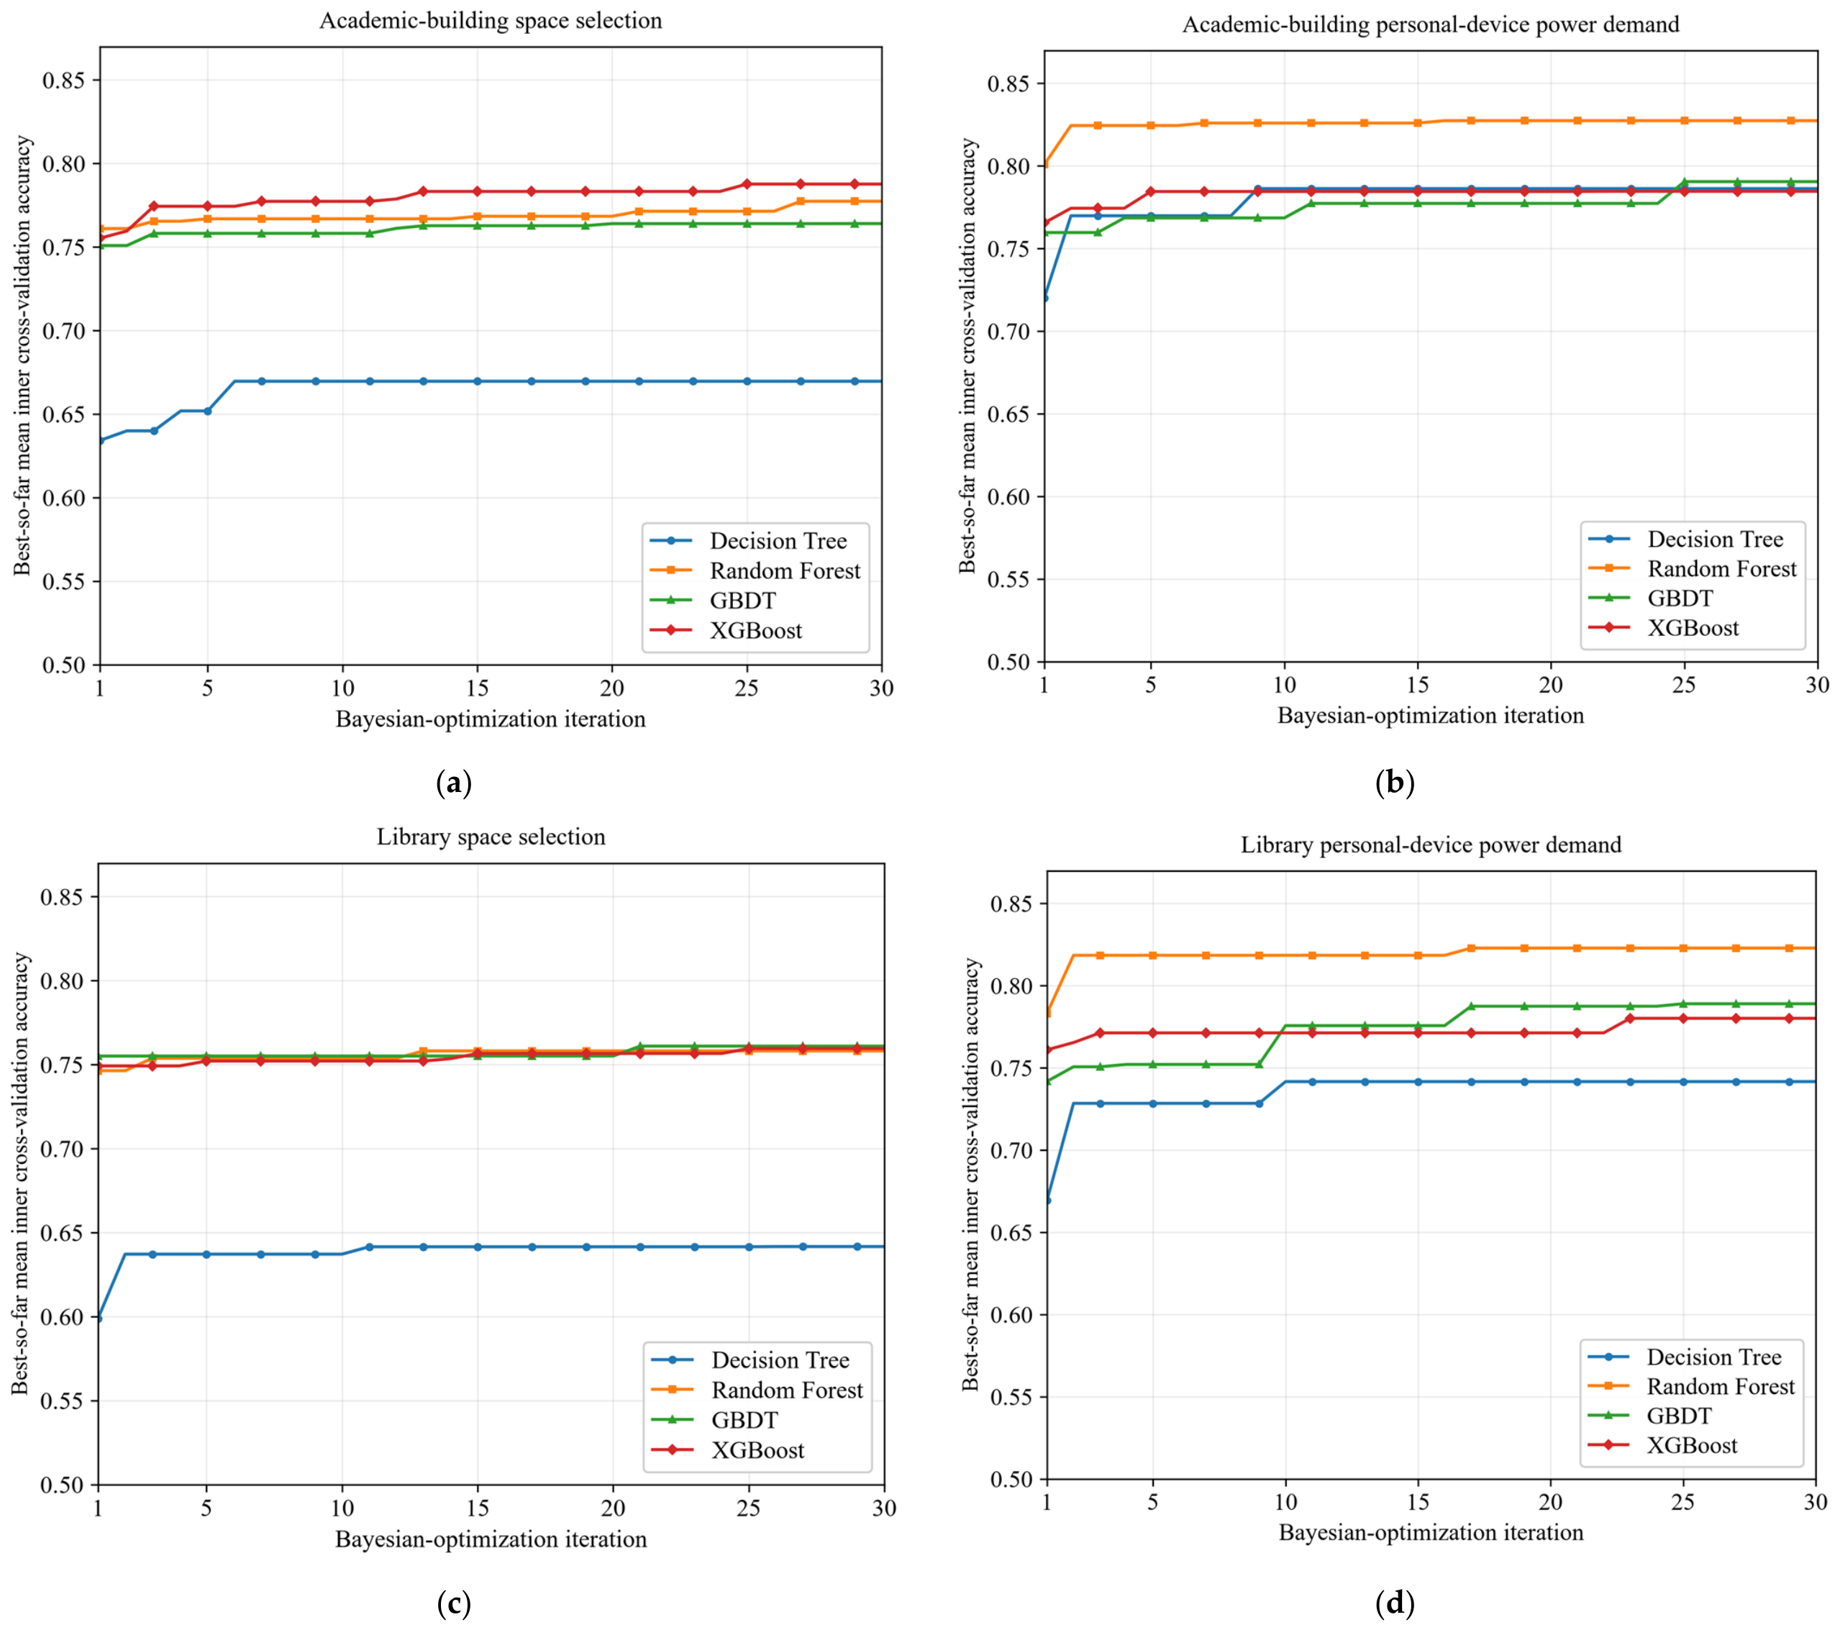
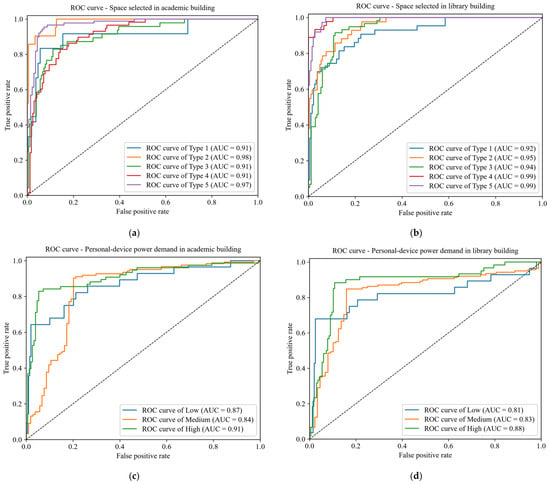
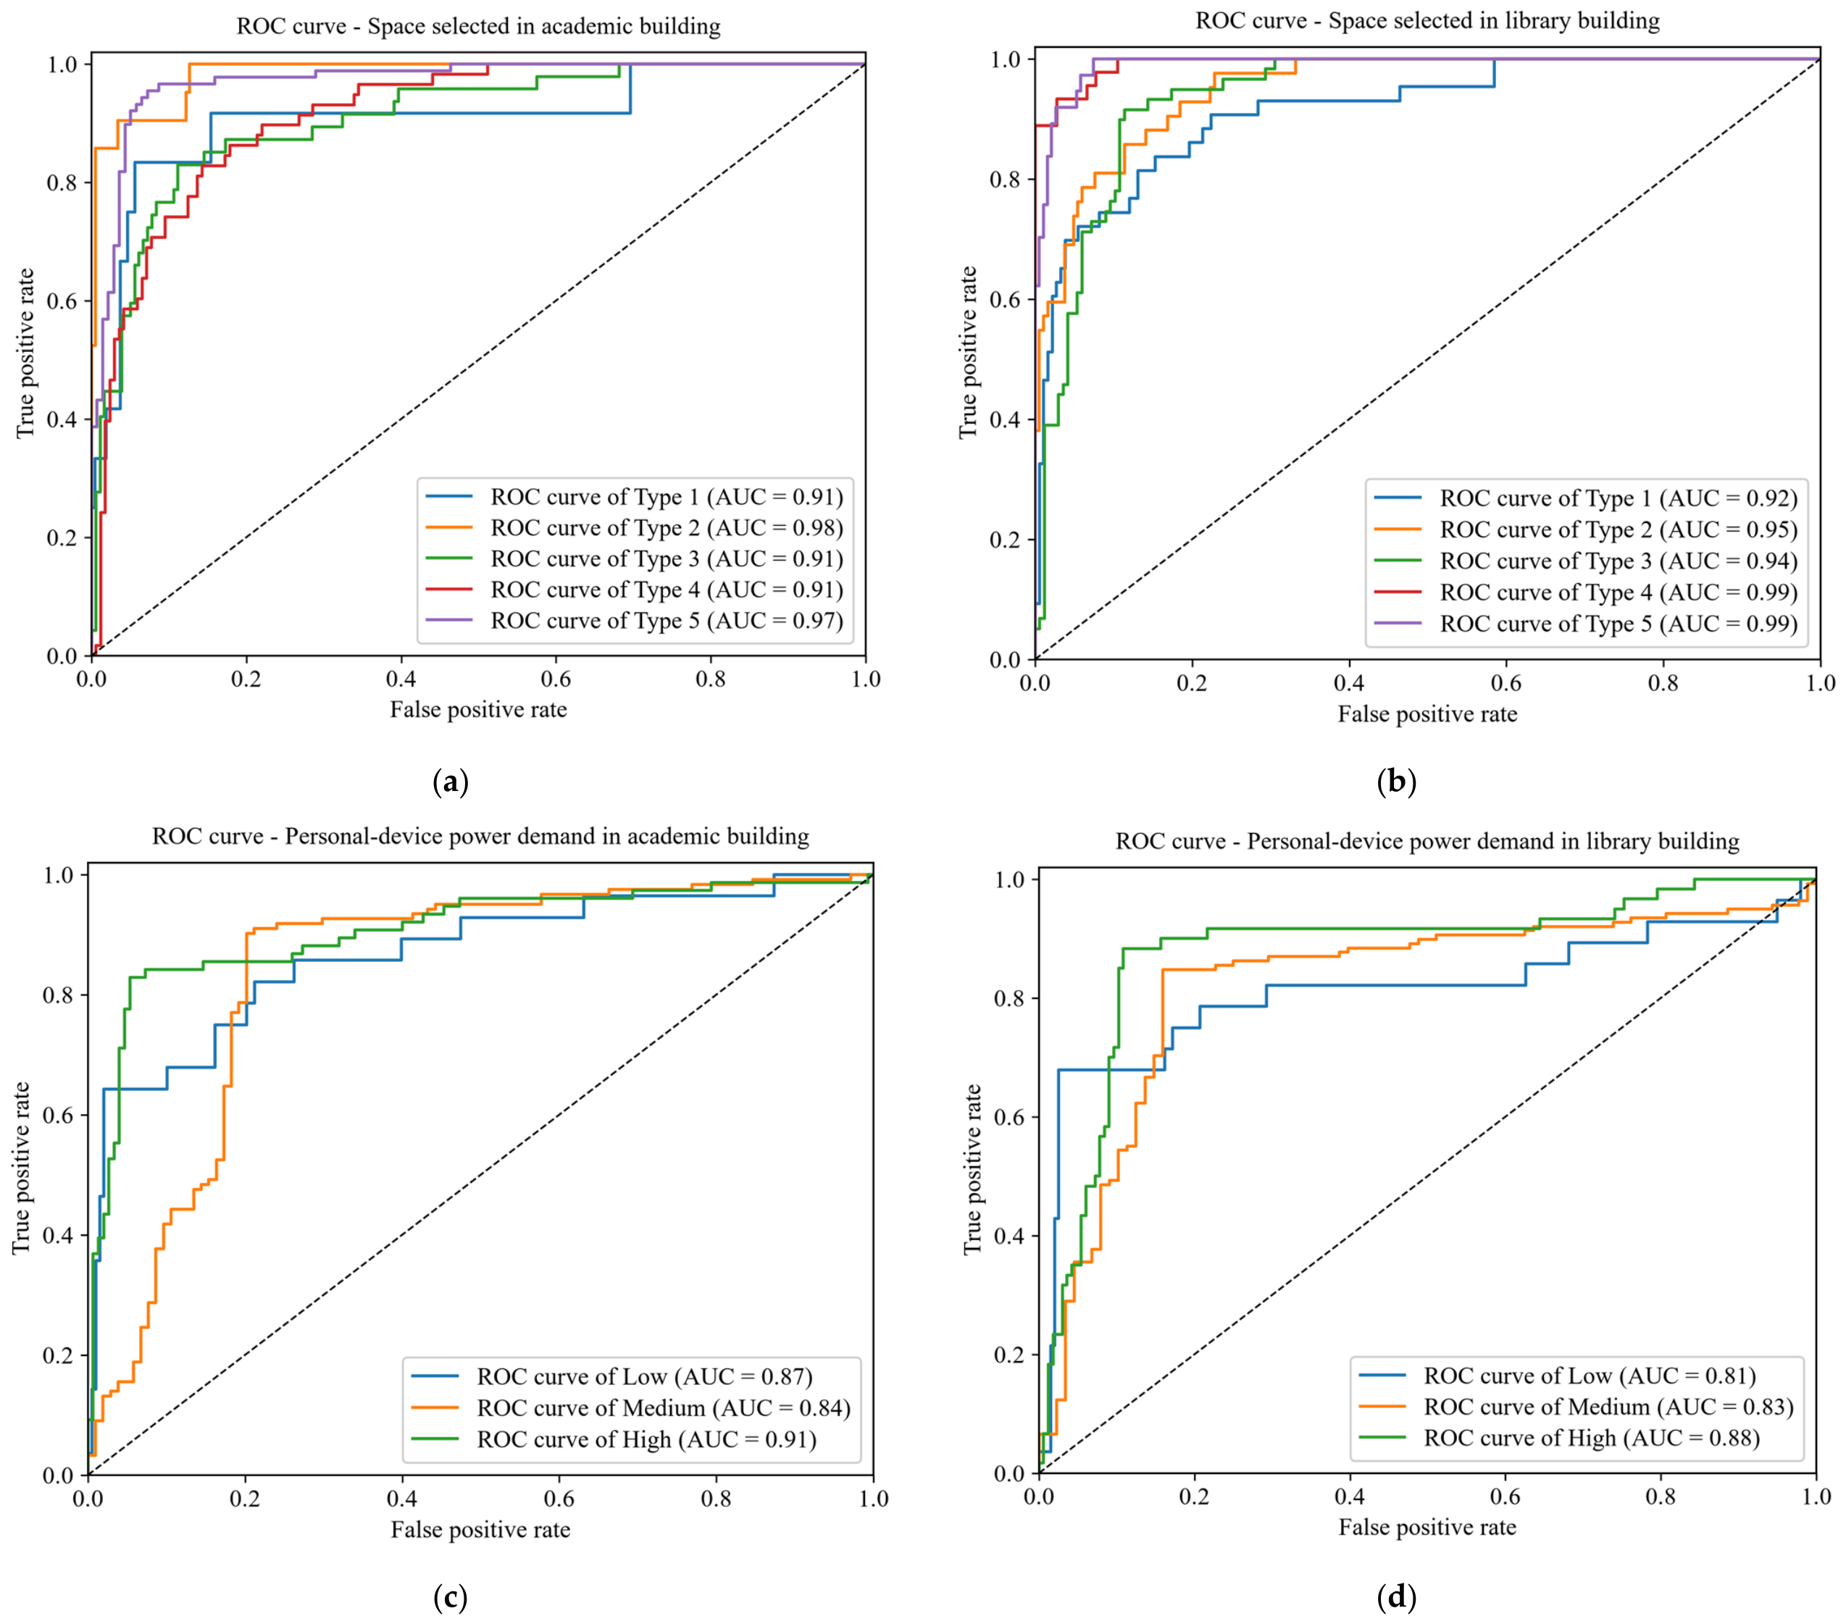
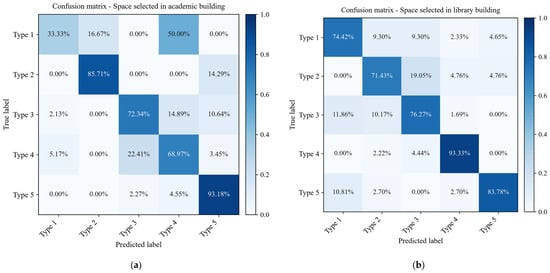
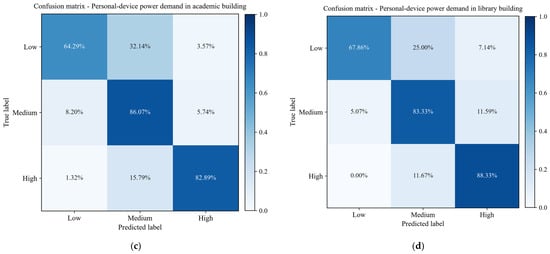
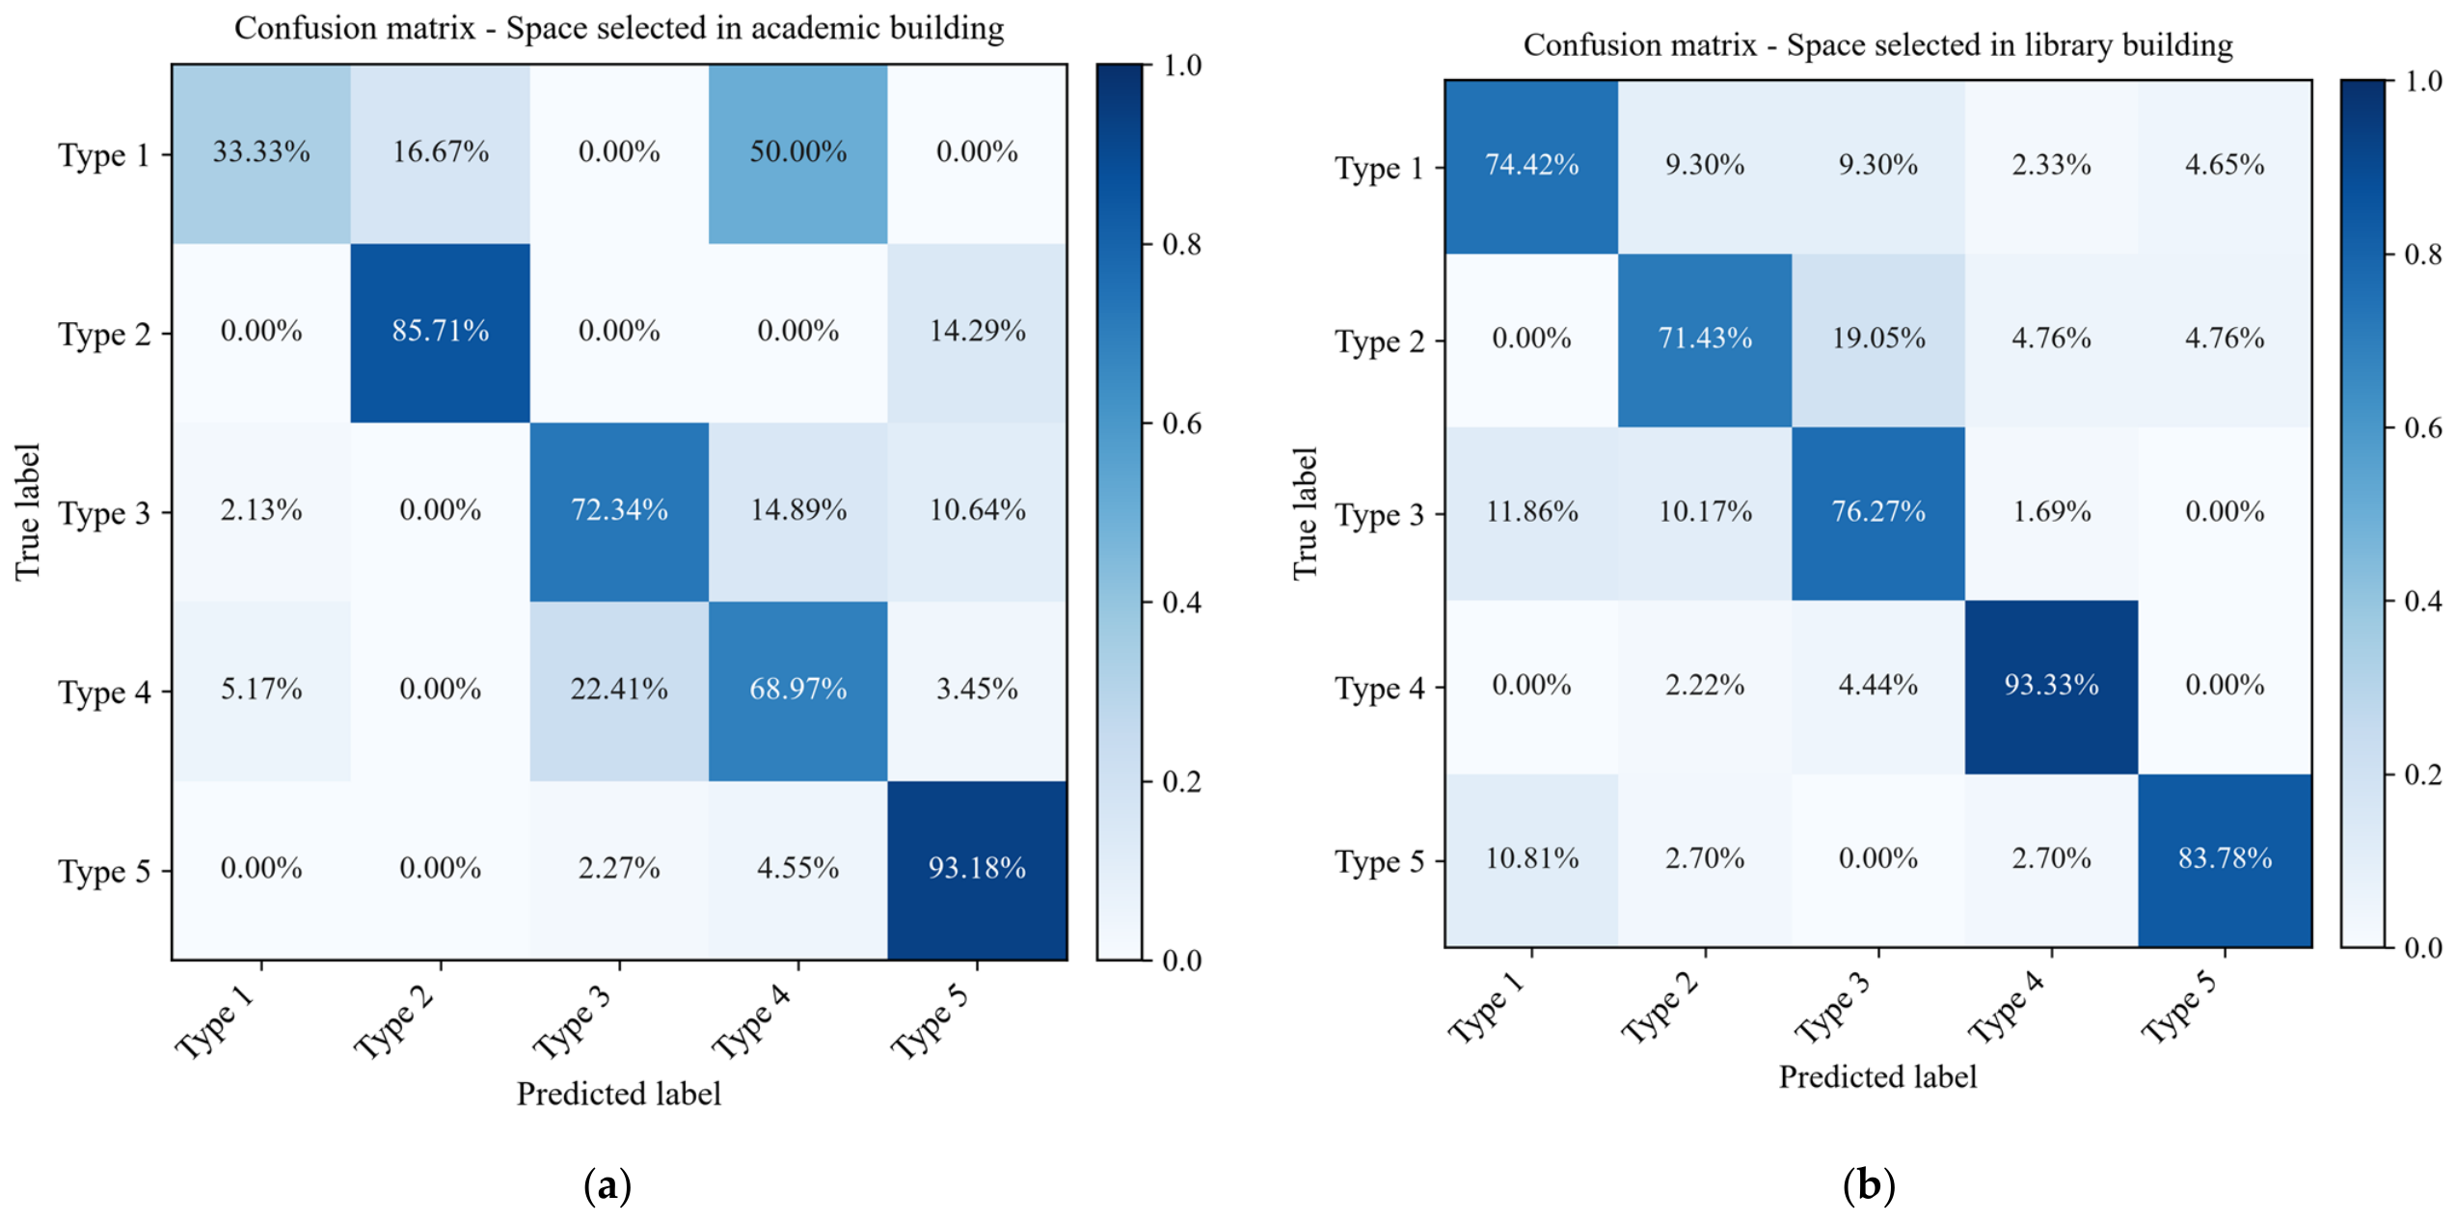
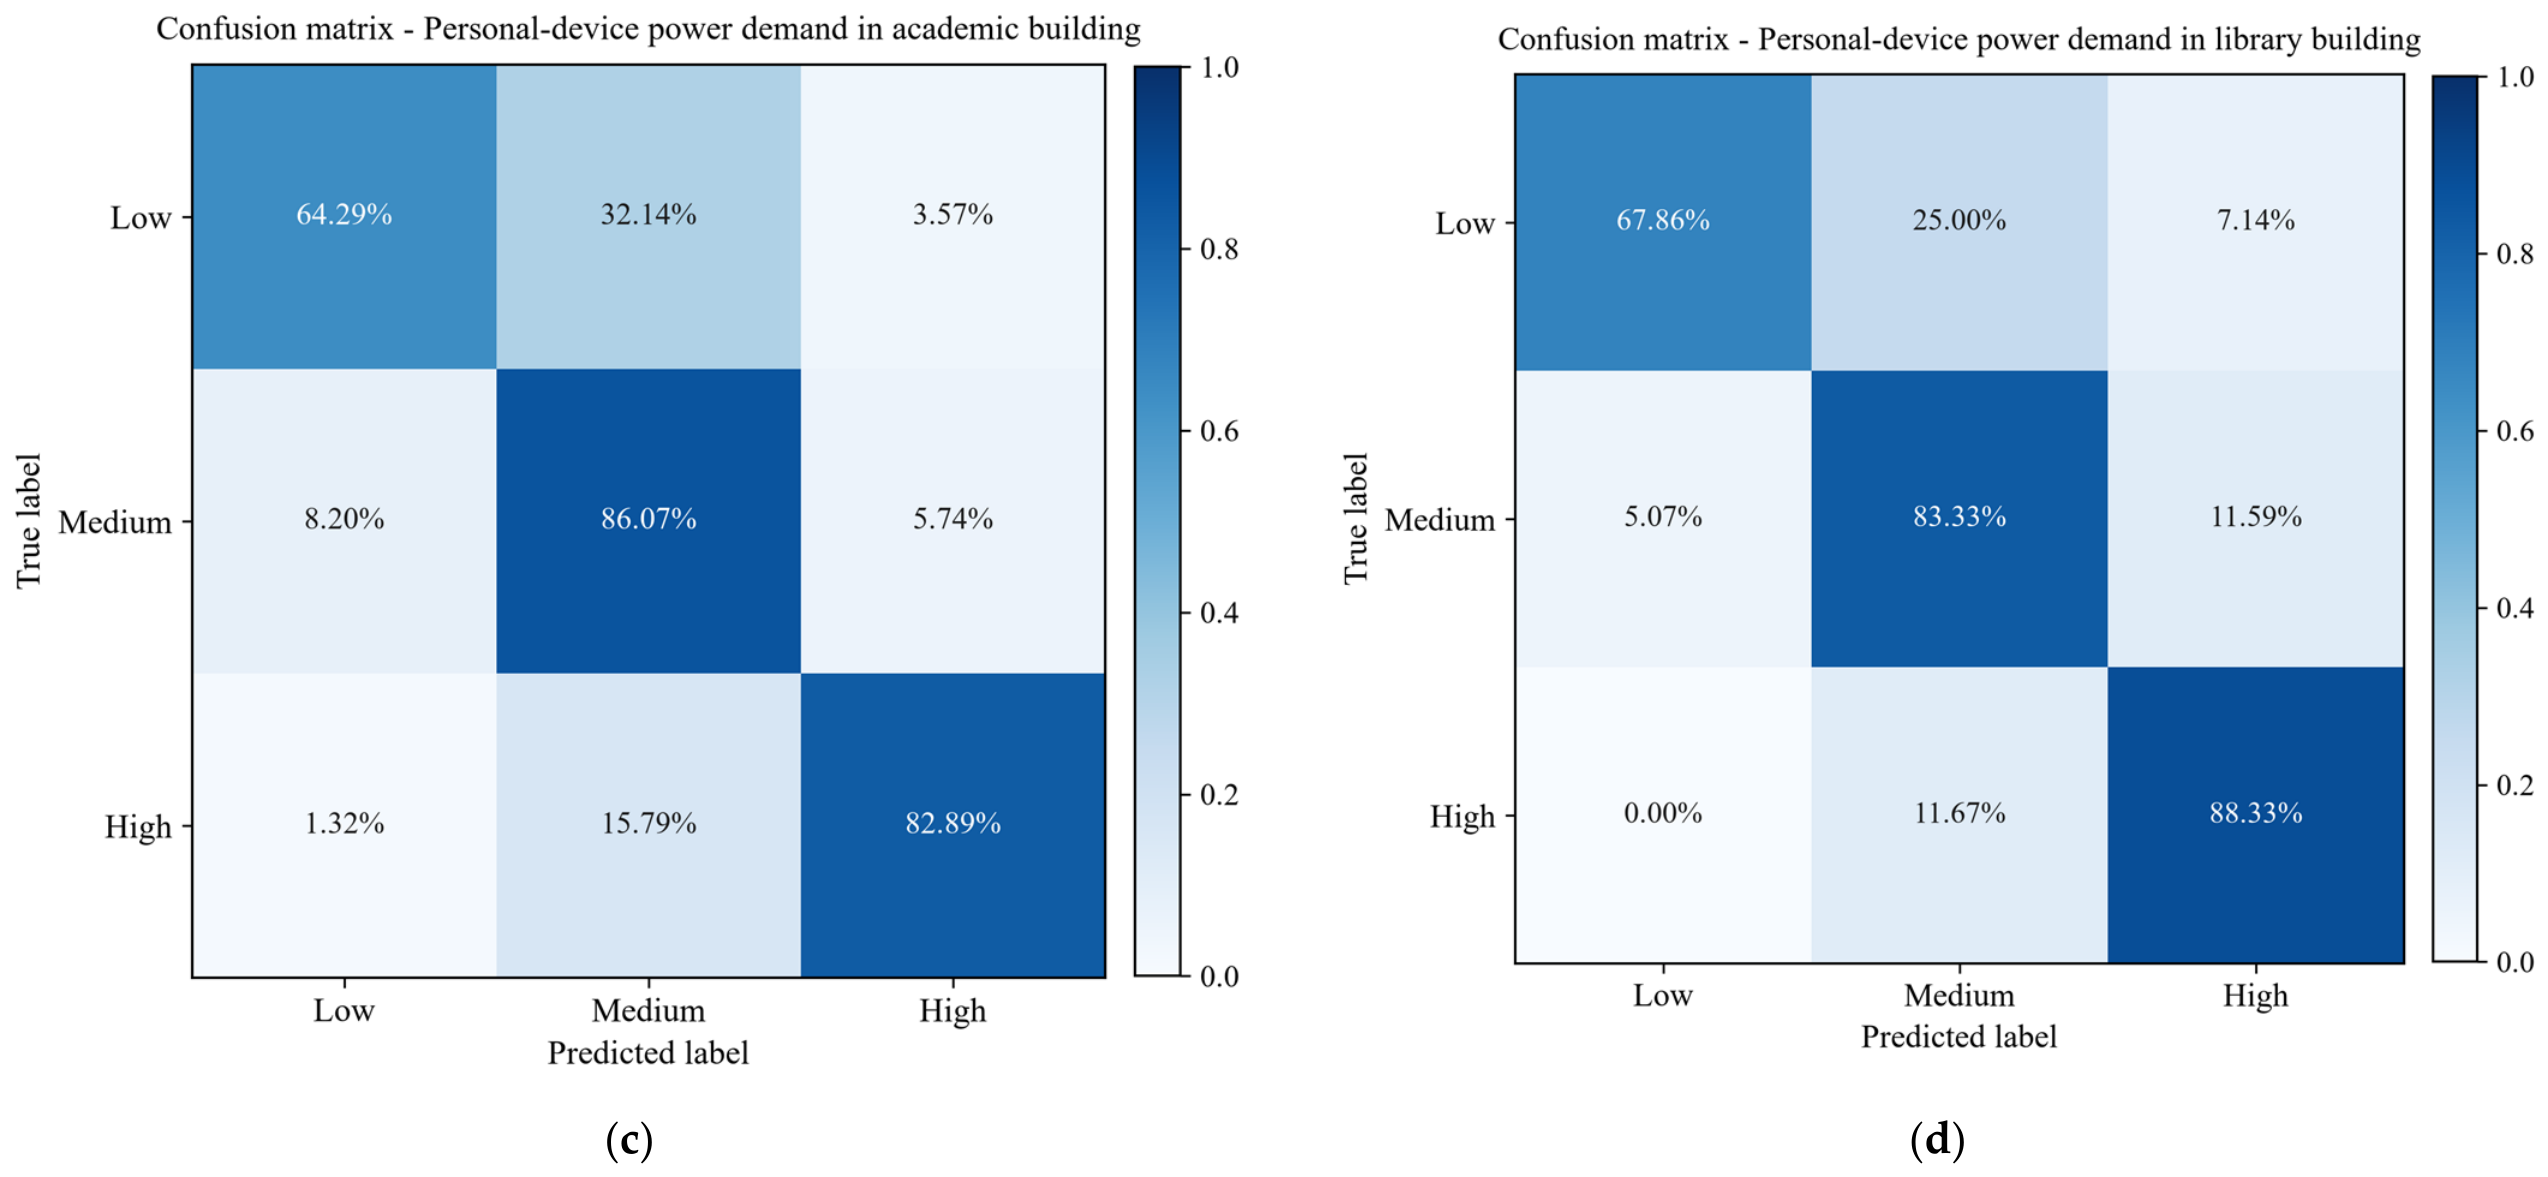

Disclaimer/Publisher’s Note: The statements, opinions and data contained in all publications are solely those of the individual author(s) and contributor(s) and not of MDPI and/or the editor(s). MDPI and/or the editor(s) disclaim responsibility for any injury to people or property resulting from any ideas, methods, instructions or products referred to in the content. |
© 2026 by the authors. Licensee MDPI, Basel, Switzerland. This article is an open access article distributed under the terms and conditions of the Creative Commons Attribution (CC BY) license.