


Abstract
The purpose of this study is to evaluate the vibration control performance of tuned liquid dampers (TLDs) equipped with internal perforated and slat screens. The effect of screen geometry and porosity on nonlinear sloshing and structural response reduction was investigated through a series of shake table tests. Harmonic tests at fixed frequencies and seismic excitations using four scaled earthquake records (El Centro, Kobe, Loma Prieta, and Sakarya) were applied to the test frame. A parametric analysis was performed by varying the water depth (4.5 cm to 6.5 cm) and screen porosity (40%, 50%, 60%). The results indicate that a 40% porosity gave the lowest added damping ratio and response reduction, consistent with overdamping of the sloshing mode, whereas a 60% porosity gave the largest added damping ratio among the screens. At the best tested depth (5.0 cm), screens reduced the peak roof acceleration by up to 27% under the Kobe record, against 17.5% for the plain TLD, but gave no consistent improvement under the other records. The root-mean-square (RMS) roof accelerations, an average measure of the response level over the record, were reduced by up to 49%. The benefit of the screens and the best water depth depend on the input.
1. Introduction
Modern civil engineering structures are increasingly designed to be taller, lighter, and more flexible. While these design trends satisfy architectural demands and structural efficiency, they render high-rise buildings and long-span structures exceptionally vulnerable to dynamic environmental excitations, such as wind turbulence and earthquake ground motions. Because the inherent damping ratio of tall flexible buildings is typically very low (often around 1–2%), dynamic loads can induce excessive structural oscillations that compromise serviceability, occupant comfort, and structural safety. To mitigate these vibrations without requiring external energy supplies, passive dynamic vibration absorbers (DVAs) have been widely adopted in structural engineering.
Tuned liquid dampers (TLDs) have proven to be practical and cost-effective alternatives to conventional tuned mass dampers (TMDs) [1,2,3,4]. A TLD typically comprises a rigid container partially filled with liquid installed on the top story of a building. The TLDs considered in this study are rectangular tanks in which the liquid sloshes freely. They are also termed tuned sloshing dampers (TSDs) and differ from tuned liquid column dampers (TLCDs), in which the liquid oscillates in a U-shaped column. When the primary structure undergoes lateral vibrations under dynamic inputs, sloshing motion is excited within the container. Tuning the fundamental sloshing frequency to the target structural mode causes the hydrodynamic shear forces on the tank boundaries to act out of phase with the structural motion, transferring kinetic energy to the fluid and suppressing the dynamic response. Early studies by Fujino et al. [3] and Modi and Welt [4] highlighted several operational advantages of TLDs, including low maintenance costs, the absence of mechanical moving parts, easy tuning through water depth adjustment, and potential auxiliary use as emergency water storage. Despite these advantages, plain water exhibits an inherently low viscous damping ratio, typically around 0.5%, which is much lower than the optimal range of the damping ratio (5–15%). Consequently, under moderate-to-strong base motions, the vibration mitigation efficiency of an underdamped TLD degrades. To overcome these limitations, internal flow damping devices (FDDs)—such as perforated screens, wire meshes, and slat screens—are commonly installed within the fluid container [1,5]. These screens generate localized hydraulic resistance, vortex shedding, and viscous shear stresses as the fluid passes through the gaps, substantially enhancing energy dissipation per sloshing cycle. Numerical and experimental studies have shown that internal screens can suppress wave breaking and make the fluid response more linear and predictable [1,5,6,7,8,9,10,11,12,13].
Housner [2] established a foundational equivalent mass–spring mechanical model for simplifying complex fluid sloshing problems; however, this model is valid only for small liquid displacements, where linear sloshing is expected. Therefore, accurately quantifying the influence of screen geometry, aperture arrangement, and screen porosity under transient seismic demands continues to rely on rigorous experimental evaluations. Tait et al. [5] developed numerical flow and equivalent TMD models for TLDs outfitted with vertical slat screens and validated their performance under harmonic and random excitations. Tait and Deng [6] evaluated the efficiency, effective damping, and robustness of TLDs across different tank geometries (rectangular, vertical–cylindrical, and horizontal–cylindrical). Halabian and Torki [7] demonstrated the effectiveness of screen-equipped TLDs in reducing the seismic response of tall buildings using an amplitude-dependent TMD analogy. Furthermore, Cassolato et al. [8] examined the impact of screen inclination on adjusting TLD damping ratios, whereas Maravani and Hamed [9] developed a finite-difference volume-of-fluid (VOF) algorithm to resolve nonlinear sloshing through submerged slat screens. To refine the hydraulic head loss formulations of internal damping devices, Faltinsen et al. [10] derived an analytical modal model using screen-averaged pressure-drop conditions, and Crowley and Porter [11] formulated a transfer matrix approach based on linearized water wave theory for arbitrary vertical screen arrangements.
Marivani and Hamed [12] proposed a refined pressure-drop model for slat screens under oscillating flow conditions. By introducing the effective solidity and slat ratios, their formulation captures the localized flow characteristics around individual slats. Recent investigations have further advanced the optimization and structural applications of TLDs. Zhou et al. [14] evaluated the effect of screen solidity on high-rise seismic response through combined computational fluid dynamics (CFD) simulations and shake table tests, identifying an optimal solidity ratio near 0.46. Xiao et al. [15] developed an equivalent non-linear stiffness and damping model (NSD-h) for large-scale TLDs utilizing optical tracking systems, while Sun et al. [16] proposed a modified tank geometry incorporating a sloped bottom and internal damping nets (DNS-TLD) to enhance energy dissipation. Sahaj et al. [13] tested two vertical perforated plates (porosity 15–25%) placed at one-third and two-thirds of the length of a sway-excited rectangular tank, the same arrangement as in the present study, and found that the shallowest of the three fill levels (aspect ratio 0.163) gave the largest energy dissipation. Further experimental studies have examined the design parameters of liquid dampers [17] and the increase in the damping ratio of circular TLDs fitted with internal dampers [18]. Numerical models of screened tanks have also advanced: McNamara et al. [19] represented the screens in an incompressible smoothed particle hydrodynamics model by a drag-type force and validated the model against tests with several tank sizes, fluid depths, and excitation amplitudes, and Ashasi Sorkhabi et al. [20] used real-time hybrid simulation to evaluate large-scale TLDs under earthquake excitation on linear and nonlinear structures. Despite these developments, configuring internal damping devices presents a fundamental design trade-off. An overly dense mesh or low-porosity screen excessively restricts fluid circulation, suppressing the active kinetic energy of the sloshing liquid mass and causing the screen to act as a rigid partition rather than an energy-dissipating interface. Achieving an optimal balance between localized head-loss damping and active liquid momentum remains a central challenge when calibrating equivalent mechanical models for structural vibration control.
Compared with other vibration control strategies, the TLD belongs to the small group of devices that are used in real buildings. Vibration control strategies are classified as passive, active, semi-active and hybrid; despite the large variety of devices and control strategies, only a few have found their way into real engineering applications in high-rise buildings, namely tuned mass dampers, tuned liquid dampers and bracing systems, which are the most used because of their cost-effectiveness and relative ease of maintenance [21]. Active control has been applied to buildings since the Kyobashi Center in 1989, but it requires an energy supply, which makes it costly, and its stability depends on the arrangement of sensors and actuators; semi-active devices reduce the energy demand, but several of them have not yet been used in high-rise buildings [21]. Hybrid systems combine passive and active devices; in the Canton Tower in Guangzhou, for example, two fire-fighting water tanks of about 600 t each serve as the mass of a TMD on which a small active mass damper is mounted [22]. Bracing systems with dampers, such as the viscous brace system of the Prudential Tower in Tokyo, are also used in practice [21], and new brace–damper configurations continue to be developed [23]; these systems are, however, distributed over the height of the structure and integrated into its lateral load-resisting system. Tuned dampers are installed at one location near the top of the building. Among them, TMDs, such as the pendulum TMD of Taipei 101, require a large solid mass, springs and mechanical dampers, whereas TLDs have no moving mechanical parts, are inexpensive to install and maintain, can be installed in new or existing buildings, are tuned by adjusting the water depth, and can also serve as water storage [1,3,4,24,25]. Conversely, water that a building needs anyway can provide the damper mass without additional gravity loads, as the fire-fighting water tanks of the Canton Tower show [22]. TLDs in sloshing or liquid-column configurations have been installed in towers and tall buildings in Japan, such as the Nagasaki Airport Tower, the Yokohama Marine Tower, the Shin Yokohama Prince Hotel and the Tokyo International Airport Tower [21,24,25], and elsewhere, such as the Sky Tower in Auckland, One King West Tower in Toronto, One Rincon Hill Tower in San Francisco and the Comcast Center in Philadelphia [25]. The main drawbacks of the TLD are the low inherent damping of water and the nonlinearity of sloshing at large amplitudes, which makes the response difficult to predict when the waves break [25]. Damping screens address the first drawback with inexpensive passive steel plates and thus retain the practical advantages of the TLD; their design, in particular the screen type and porosity, therefore determines how much of the potential of the device is used, which is the subject of this study.
In the literature, two primary types of rigid flow damping devices have emerged for enhancing energy dissipation in TLDs: perforated or wire screens and slat screens. Although TLDs with flow damping devices have been extensively studied, relatively few studies have addressed slat screens [5,8,9,10,11,12], and even fewer address perforated screens [7,13]. These studies examined one screen type at a time under different tank geometries and excitations, so their results cannot be compared directly. To the best of the authors’ knowledge, direct experimental comparisons between the vibration mitigation efficiency of perforated screens versus slat screens under identical dynamic excitations have not been reported in the literature. In addition, previous studies mostly report the response reduction of individual configurations; how the screen porosity changes the added damping ratio of the frame, and how the damping ratio of the sloshing mode provided by the screens compares with its optimum, has not been quantified experimentally. To address this gap, this study presents a systematic experimental comparison among the plain (unequipped) TLD and TLDs outfitted with perforated and slat screens across various porosity ratios (40%, 50%, and 60%), evaluating their impact on structural response reduction, sloshing linearization, and resonant frequency shifts. The plain TLD was designed using the Housner equivalent mechanical model and H2 norm transfer function optimization, resulting in a design water depth of h = 5.2 cm (h/L = 0.15) for a two-degree-of-freedom (2-DOF) laboratory steel frame. Shake table experiments were carried out under harmonic tests at fixed frequencies and four historical earthquake ground motions (El Centro, Kobe, Loma Prieta, and Sakarya). The primary objective is to evaluate how screen porosity affects acceleration reduction, free-decay damping ratios, and fluid sloshing regimes, establishing practical design criteria for screen-equipped TLDs. The contributions of this study are: (i) a direct comparison of perforated and slat screens of equal porosity (40, 50, and 60%) in the same tank, on the same frame, and under identical harmonic and seismic inputs, together with the plain TLD; (ii) a free-decay identification of the added damping ratio of the frame, which shows that it increases with porosity and is higher for slat than for perforated screens at every porosity; (iii) an interpretation of this trend with the equivalent mechanical model, which indicates that the tested screens overdamp the sloshing mode; and (iv) design recommendations for the water depth and the screen porosity (Section 4).
2. Materials and Methods
2.1. Structural Model and Dynamic Characteristics
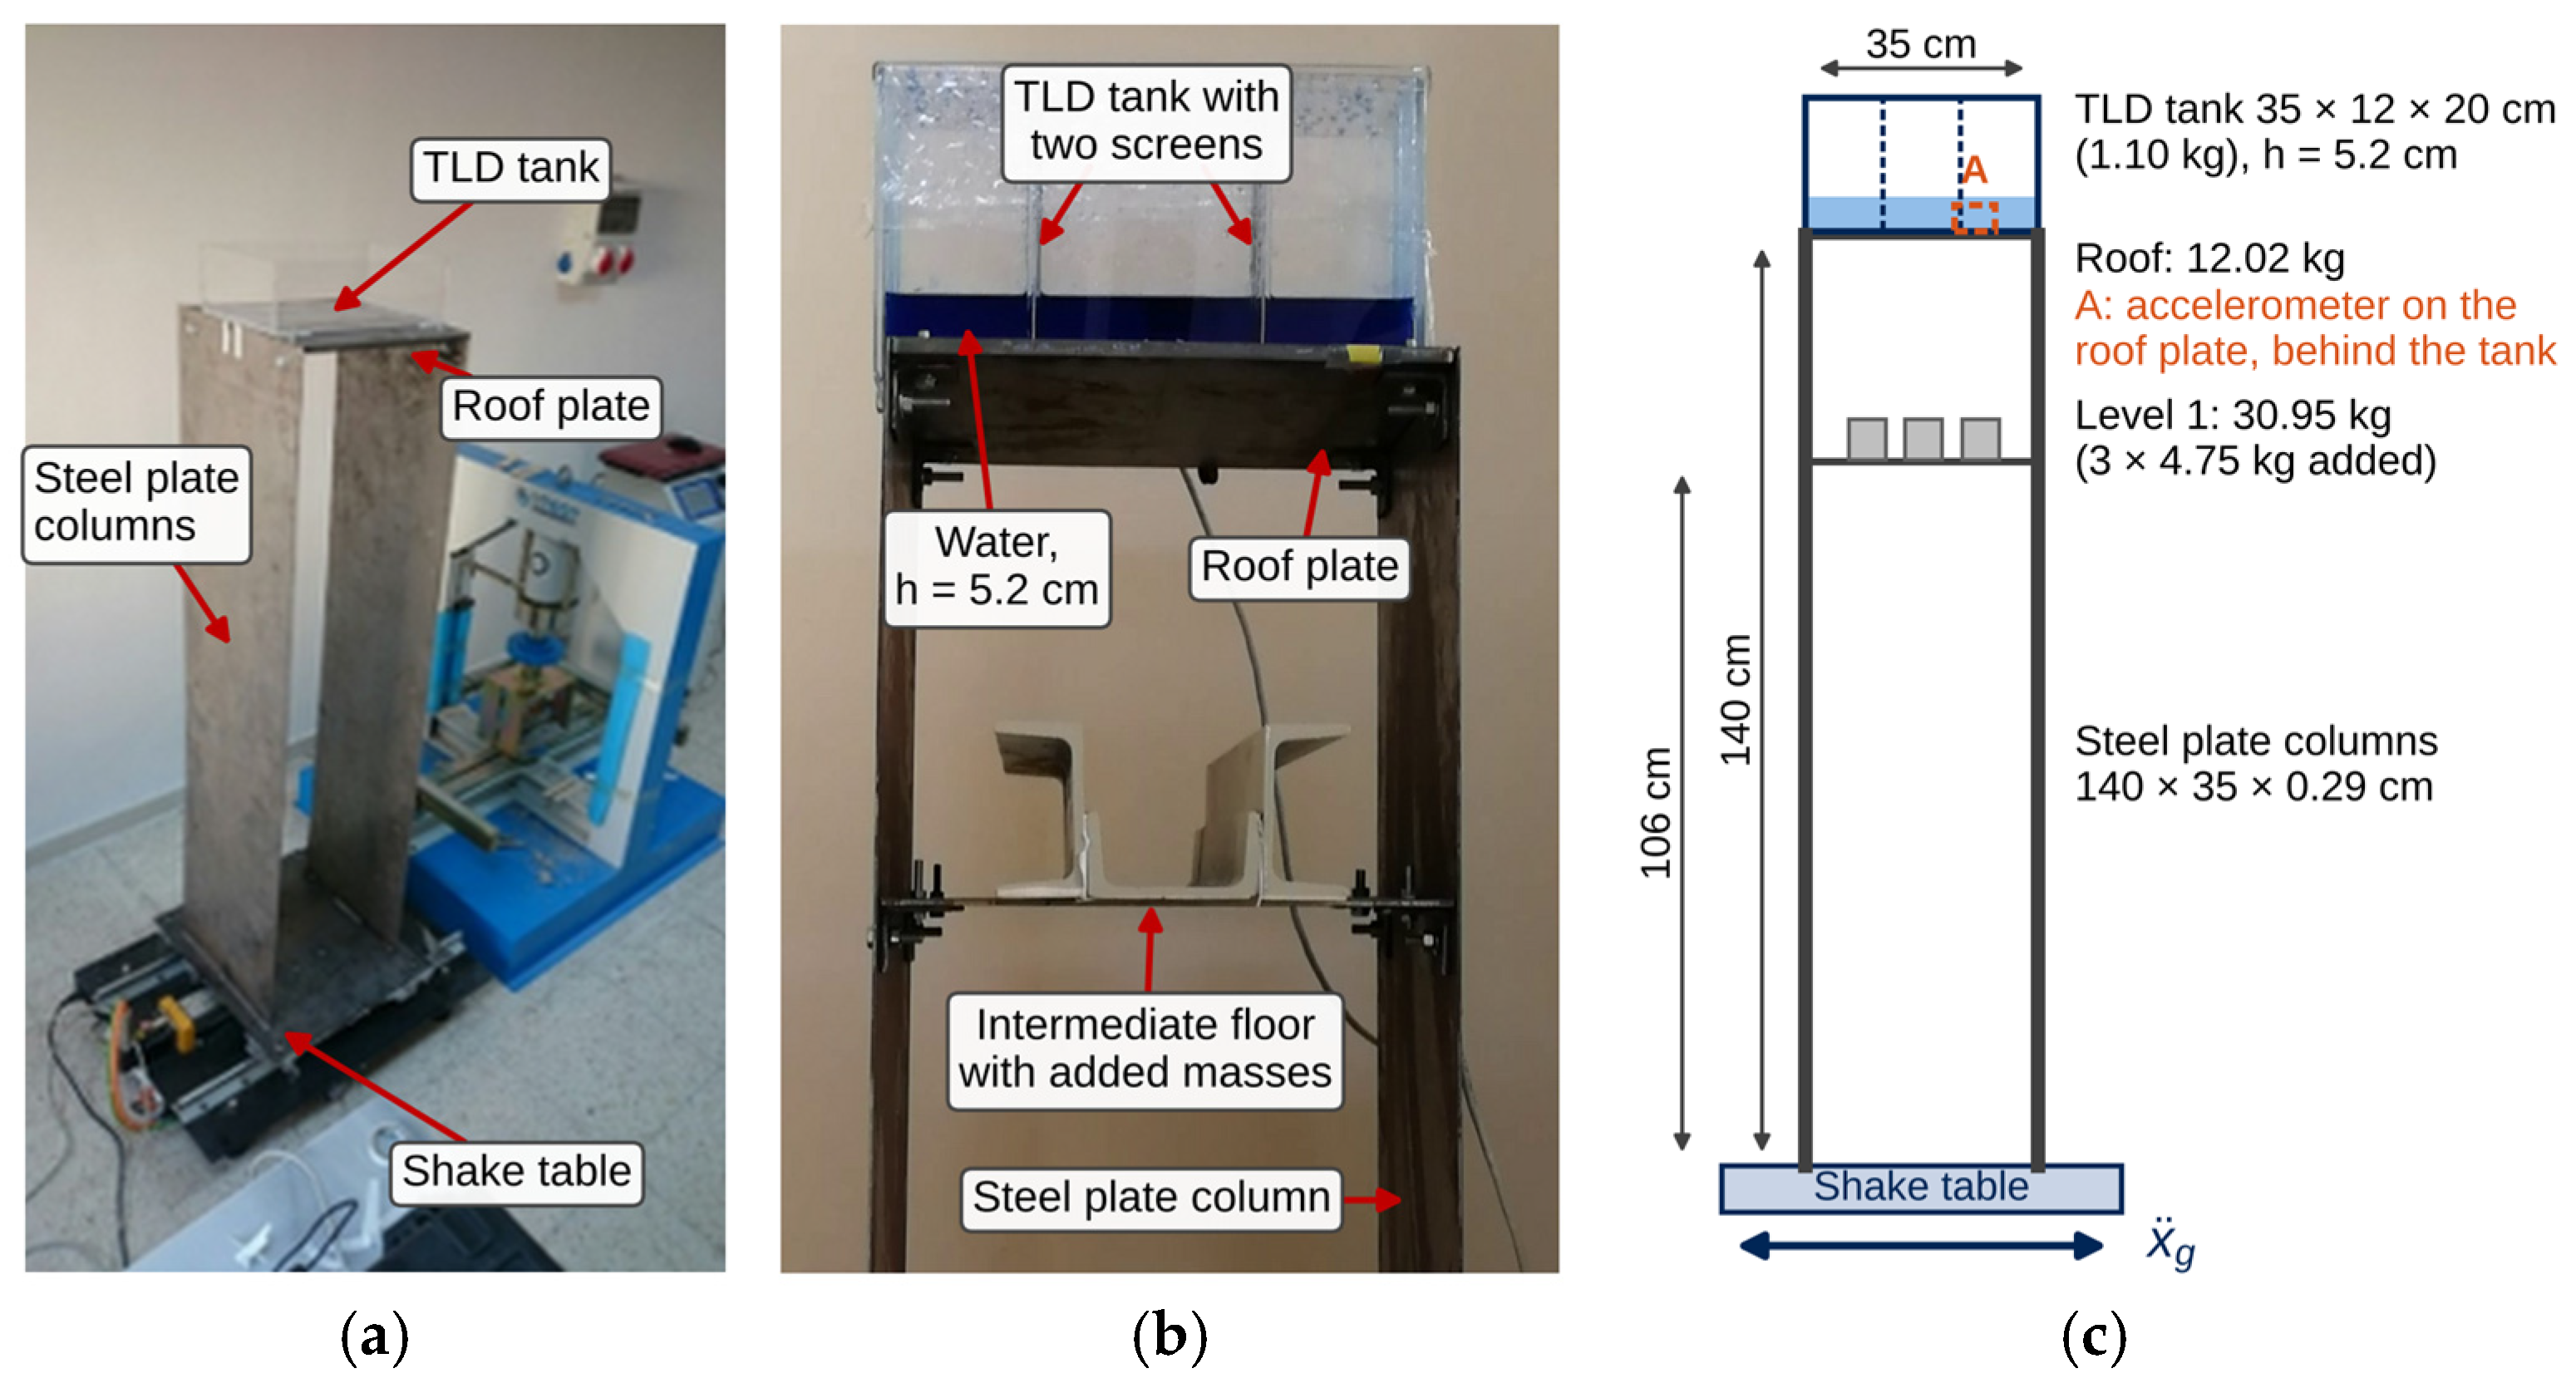
To evaluate the performance of the TLD equipped with damping screens, a two-degree-of-freedom (2-DOF) laboratory steel frame was used. The experimental structure consisted of two flexible steel plates acting as columns and two rigid floor plates, designed to exhibit dominant sway behavior representative of tall, flexible modern buildings (Figure 1). The two column plates were 140 cm high, 35 cm wide, and 0.29 cm thick and bent about their weak axis; in the orthogonal direction, the frame was much stiffer, which prevented torsion and out-of-plane vibration. The intermediate floor plate (35 × 35 × 0.5 cm) was located 106 cm above the base and carried three added masses of 4.75 kg each, and the roof plate measured 35 × 35 × 1.0 cm; the plates were connected at their corners with steel angles. In the numerical model, the lumped masses were 30.95 kg (intermediate floor) and 12.02 kg (roof). The TLD tank (1.10 kg) was fixed to the roof plate with double-sided adhesive tape. In the uncontrolled tests, the empty tank remained on the roof; therefore, the uncontrolled reference was the frame with the empty tank. The frame was not a scaled model of a specific building, and no similitude law was applied.
Figure 1.
Experimental structure: (a) test frame on the shake table; (b) upper part of the frame with the TLD tank (60% slat screens) at the start of a test; (c) elevation with the main dimensions and masses, and the position of the roof accelerometer (A).
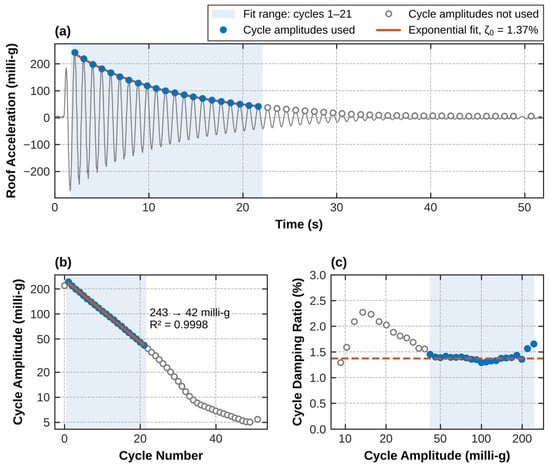
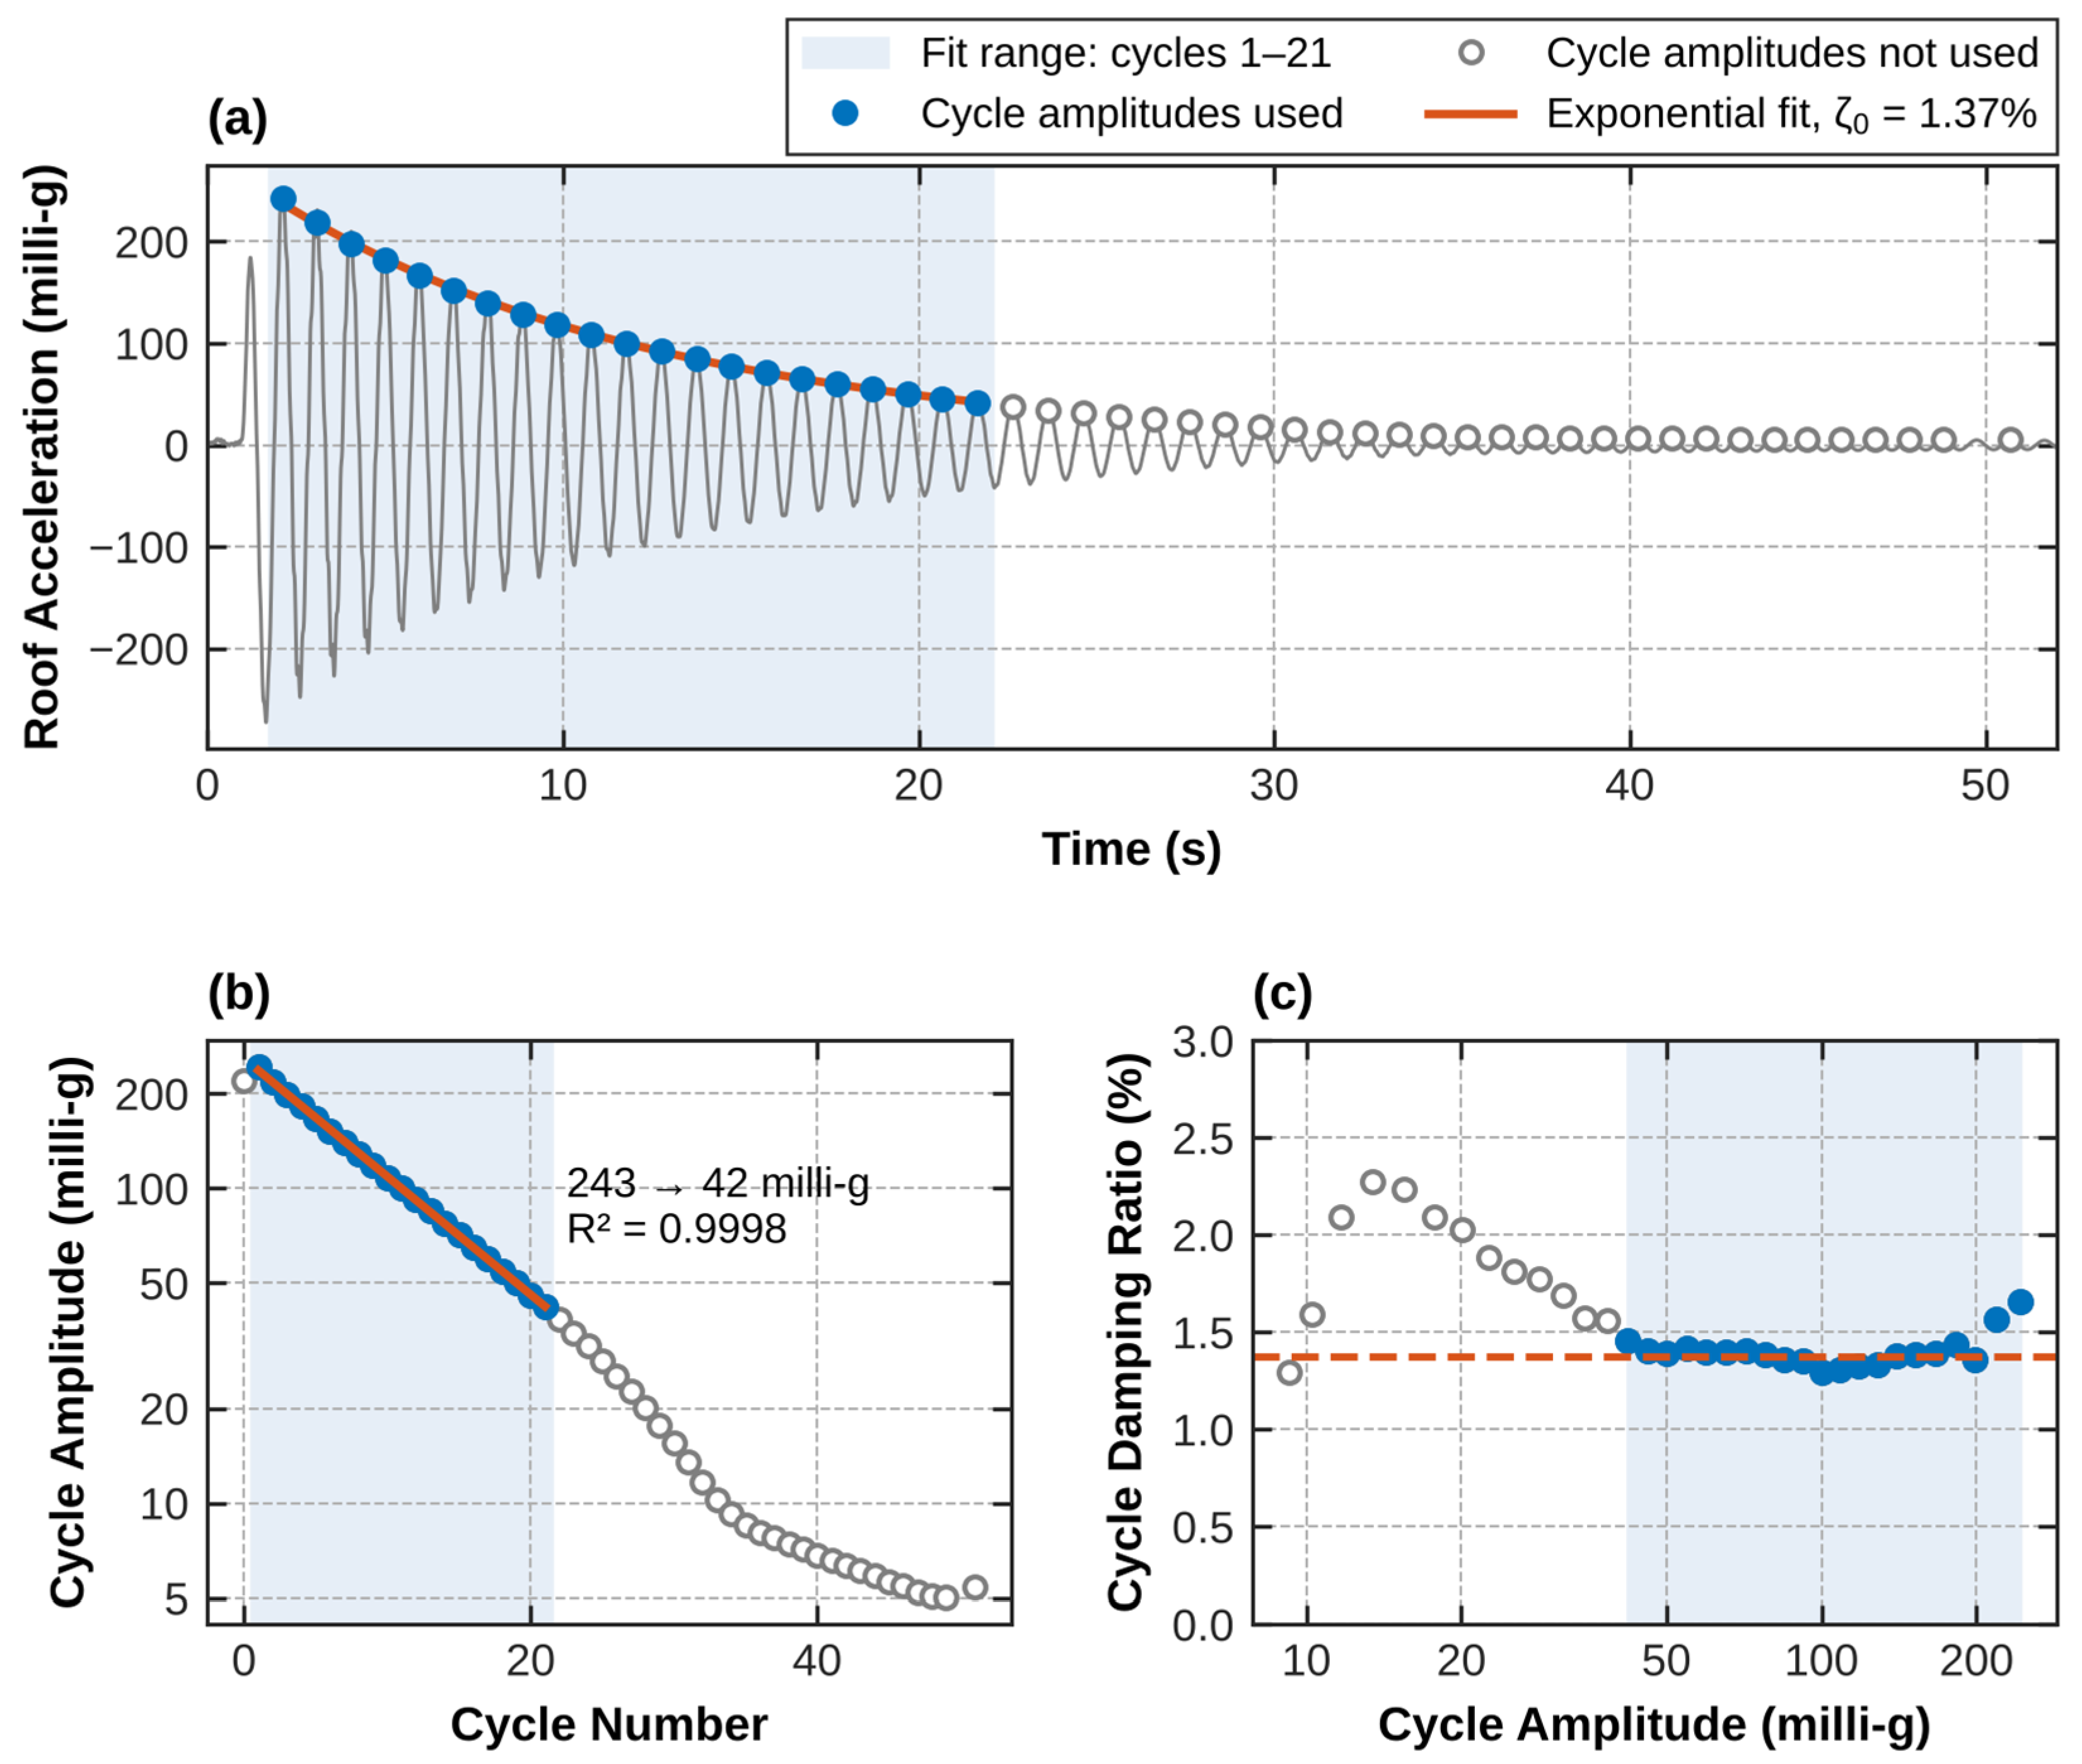
The primary dynamic characteristics of the uncontrolled structural model were identified from free-vibration tests on the uniaxial shake table. The natural period of the frame with an empty tank is T0 = 0.96 s (f0 = 1/T0 = 1.04 Hz), identified from a free-vibration test in which the roof was displaced and released. With the water-filled tank, the added water mass lengthens the period to about 1.0 s. The free-vibration frequency depends weakly on amplitude, decreasing from 1.046 Hz at 243 milli-g to 1.009 Hz at 42 milli-g (Figure 2).
Figure 2.
Free-vibration test of the uncontrolled frame with the empty tank: (a) roof acceleration with the cycle amplitudes used and the fit range; (b) cycle amplitude versus cycle number with the exponential fit; (c) cycle-by-cycle damping ratio versus amplitude.
The damping ratio of the uncontrolled frame was identified from the same free-vibration test (Figure 2). The cycle amplitudes Ak were taken as half the peak-to-peak value of each cycle of the band-pass filtered (0.4–3 Hz) roof acceleration, after removal of the constant sensor offset, and a straight line was fitted to ln Ak by least squares [26]:
where k is the cycle number and −b is the mean logarithmic decrement per cycle. Over cycles 1–21 (243 to 42 milli-g, R2 = 0.9998), this gives ζ0 = 1.37%. Below about 40 milli-g, the cycle-by-cycle damping ratio first rises to about 2.3% and then falls below 1% at about 10 milli-g, although these amplitudes are well above the noise level of the roof acceleration record (about 1.6 milli-g, the 95th percentile of the envelope of the band-pass filtered signal recorded before the tests). The decay is therefore no longer exponential, so these cycles were not used (Figure 2c). In the free decays after the harmonic bursts, the damping ratio of the frame increases with amplitude, from 1.3% at 40–80 milli-g to 2.1% at 400–550 milli-g. The ratio of the sloshing mass to the generalized mass of the first mode is μ = m2/m0* = 4.2%, where m0* = 40.3 kg is the generalized mass of the first mode of the frame with the empty tank, normalized to unit roof displacement (Section 2.2).
2.2. Equivalent Mechanical Model and H2 Norm Optimization of TLD
The solution of the sloshing problem typically requires complex partial differential equations with boundary conditions. However, Housner [2] proposed a practical approximation that offers closed-form solutions for rectangular, circular, and elliptical tanks under horizontal acceleration. Assuming an incompressible fluid with small displacements constrained by rigid membranes, the method models the hydrodynamic pressure via two primary components:
Impulsive Force: An equivalent rigid mass (mi) moves synchronously with the tank walls, representing the fluid forced directly into the tank’s motion.
Oscillating Force: A flexible mass (m2) connected to a restraining spring represents the fundamental sloshing mode excited by the tank movement.
For a rectangular tank of internal length L, width b, and stationary water depth h, the total water mass is M = ρLbh, where ρ is the fluid density. The fundamental sloshing frequency f2 (in Hz) is approximated by linear wave theory as:
where g = 9.81 m/s2 is the gravitational acceleration. For the design depth h = 5.2 cm, Equation (2) gives f2 = 0.986 Hz. At large amplitudes, the sloshing frequency of shallow liquid layers (h/L = 0.15) departs from this estimate. The equivalent impulsive mass mi, fundamental sloshing mass m2, and equivalent spring stiffness k2 of the Housner formulation are expressed as:
Two sloshing damping ratios were considered: ζ2 = 0.5%, the damping ratio of water given in EN 1998-4:2006 [27], clause 2.3.3.2, representing small-amplitude sloshing; and ζ2 = 6%, adopted for the design to represent the larger dissipation of sloshing at the response amplitudes of the tests, where wave breaking occurs. The H2 optimization described below gives a displacement-optimal depth of 4.5 cm for ζ2 = 0.5% and 5.2 cm for ζ2 = 6%.
The optimum liquid depth ratio h/L was determined by minimizing the H2 norm of the transfer function H(iω) from the base acceleration to the roof displacement relative to the base. The frame was modelled with two lumped masses, 30.95 kg at the intermediate level and 12.02 kg at the roof, and the 2 × 2 flexibility matrix of a SAP2000 model of the frame. The stiffness was scaled by 0.944 so that the empty-tank model reproduces the measured natural frequency of 1.042 Hz; the second natural frequency is 10.5 Hz. The tank (1.10 kg) and the impulsive water mass mi were added to the roof mass, and the sloshing mass m2 was attached to the roof through k2 and c2 = 2ζ2m2ω2 as a third degree of freedom (μ = m2/m0* = 4.2%). Rayleigh damping equal to the measured damping ratio of the frame, ζ0 = 1.37% (Section 2.1), was assigned to both modes of the frame with the empty tank. The model matrices are given in Appendix A (Table A1). The equivalent mechanical model is linear: it represents the fundamental sloshing mode by a single mass–spring–dashpot system and was developed for small-amplitude (linear) sloshing [2]. In this study, it was used to select the design depth and, in Section 3.1.3, to interpret the measured damping ratios. It does not represent wave breaking or the amplitude dependence of the screen losses and was not used to predict the measured response amplitudes. The state-space matrix formulation of the coupled structure–TLD system is defined as:
where A, B, and Cy represent the system state, input, and output matrices, respectively, and is the base acceleration. The transfer function matrix from base excitation to structural response is obtained as follows:
H(iω) = Cy(iωI − A)−1B
The H2 norm is defined as the root-mean-square impulse response of the system:
Minimizing the H2 norm of a transfer function minimizes the mean-square response to white-noise base excitation, i.e., the response over the whole frequency range of the structural mode, as in classical TMD design. The design depth was obtained by minimizing the H2 norm of the roof displacement relative to the base. The output y is the roof displacement relative to the base (Cy = [0 1 0 0 0 0]); for the acceleration criterion, it is the absolute roof acceleration (Appendix A). The H2 norm was evaluated on a grid of depths from 1.0 to 20.0 cm (the height of the tank) in steps of 1 mm, and the depth with the smallest norm was selected; no iterative search was involved. The optimal depth is 5.2 cm (f2 = 0.986 Hz, f2/f0 = 0.95), the depth used in the tests (Figure A1). Minimizing the absolute roof acceleration instead leads to a higher optimal sloshing frequency and a depth of 5.4–5.5 cm [28].
For the transparent fiberglass test tank with dimensions L = 35 cm, b = 12 cm, and depth H = 20 cm, the tests were performed at the design depth h = 5.2 cm (h/L = 0.15). The optimized mechanical parameters at this water depth are summarized in Table 1.
Table 1.
Optimized Housner mechanical model parameters for the experimental TLD.
2.3. Damping Screen Design and Porosity Ratios
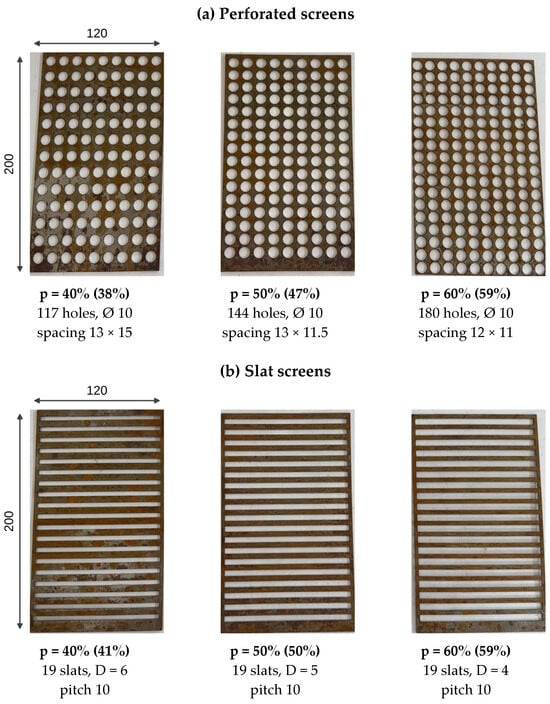
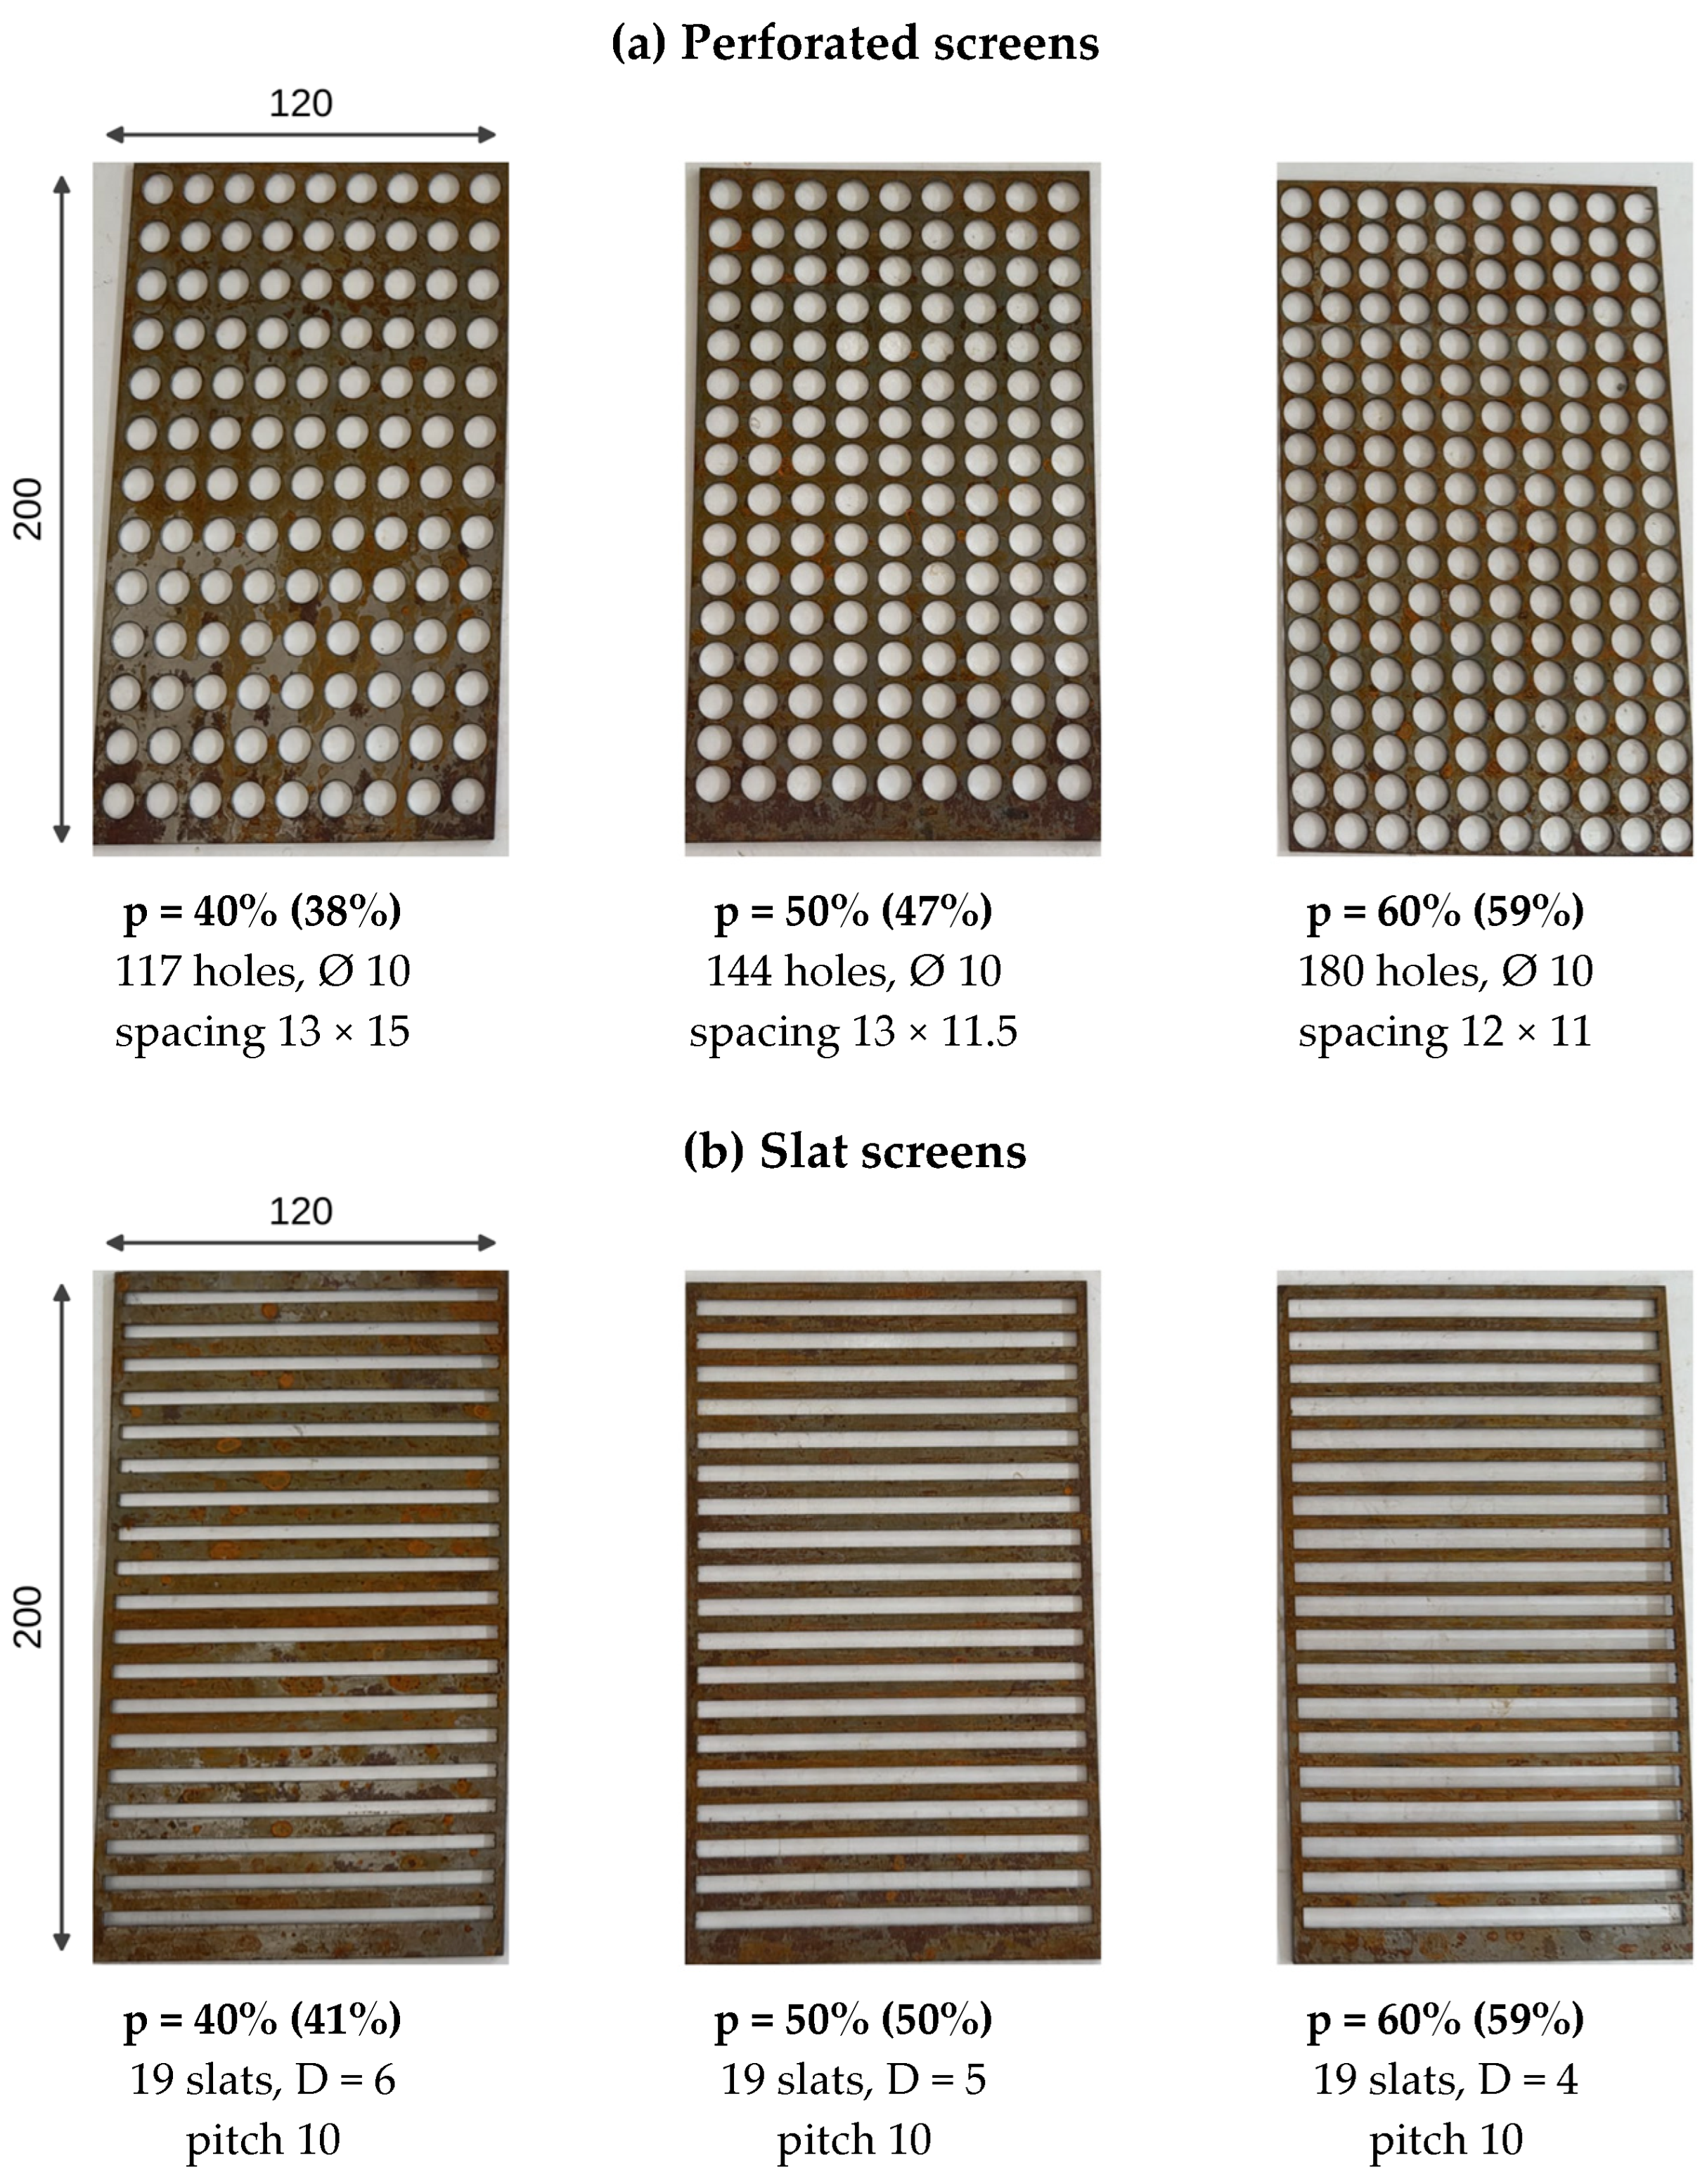
To evaluate the influence of internal obstruction geometry on fluid dissipation and vibration suppression, two distinct types of flow damping screens were fabricated and installed inside the TLD tank: perforated screens (Figure 3a) and slat screens (Figure 3b). Perforated screens were fabricated from rigid plates perforated with arrays of circular apertures with diameter dh = 10 mm. The open porosity ratios (p = 40%, 50%, 60%) were systematically controlled by adjusting the center-to-center aperture spacing. Slat screens were constructed from arrays of uniformly spaced horizontal slats with height D. The porosity ratios (p = 40%, 50%, 60%) were dictated by the number of slats and the individual slat height. The screens spanned the full width and height of the tank (12 × 20 cm). Each slat screen had n = 19 slats with height D = 6, 5, and 4 mm at a pitch of 10 mm, fixed between two vertical side strips of width e = 3 mm, so that p = (1 − 2e/B)(1 − nD/H) = 41%, 50%, and 59%, with B = 12 cm and H = 20 cm. The perforated screens had 117, 144, and 180 holes of diameter 10 mm, which gives p = 38%, 47%, and 59%. The nominal values of 40%, 50%, and 60% are used to designate the screens. The dimensions of all screens are listed in Table A2 (Appendix A).
Figure 3.
Flow damping screens tested in the shake table experiments: (a) perforated screens, (b) slat screens, shown in the installed orientation (long side vertical, slats horizontal). Dimensions in mm; steel plates 1.5 mm thick; slat screens with two 3 mm side strips. p: nominal porosity, with the value computed from the dimensions in parentheses.
The physical porosity ratio (or void ratio) p of a screen is defined as the ratio of the open aperture area Av to the total cross-sectional area At normal to the fluid flow
where S is the physical solidity ratio. Three configurations of each screen type were manufactured with nominal porosity ratios of 40% (S = 0.60), 50% (S = 0.50), and 60% (S = 0.40). Porosity was computed over the full area of the screen; the openings were distributed uniformly over the screen; therefore, the same value applies to its submerged part. In the tank, the long side of the screens was vertical; therefore, the slats were horizontal (Figure 3).
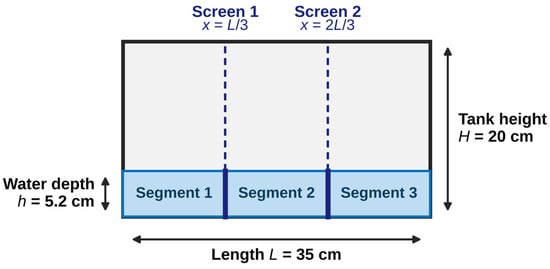
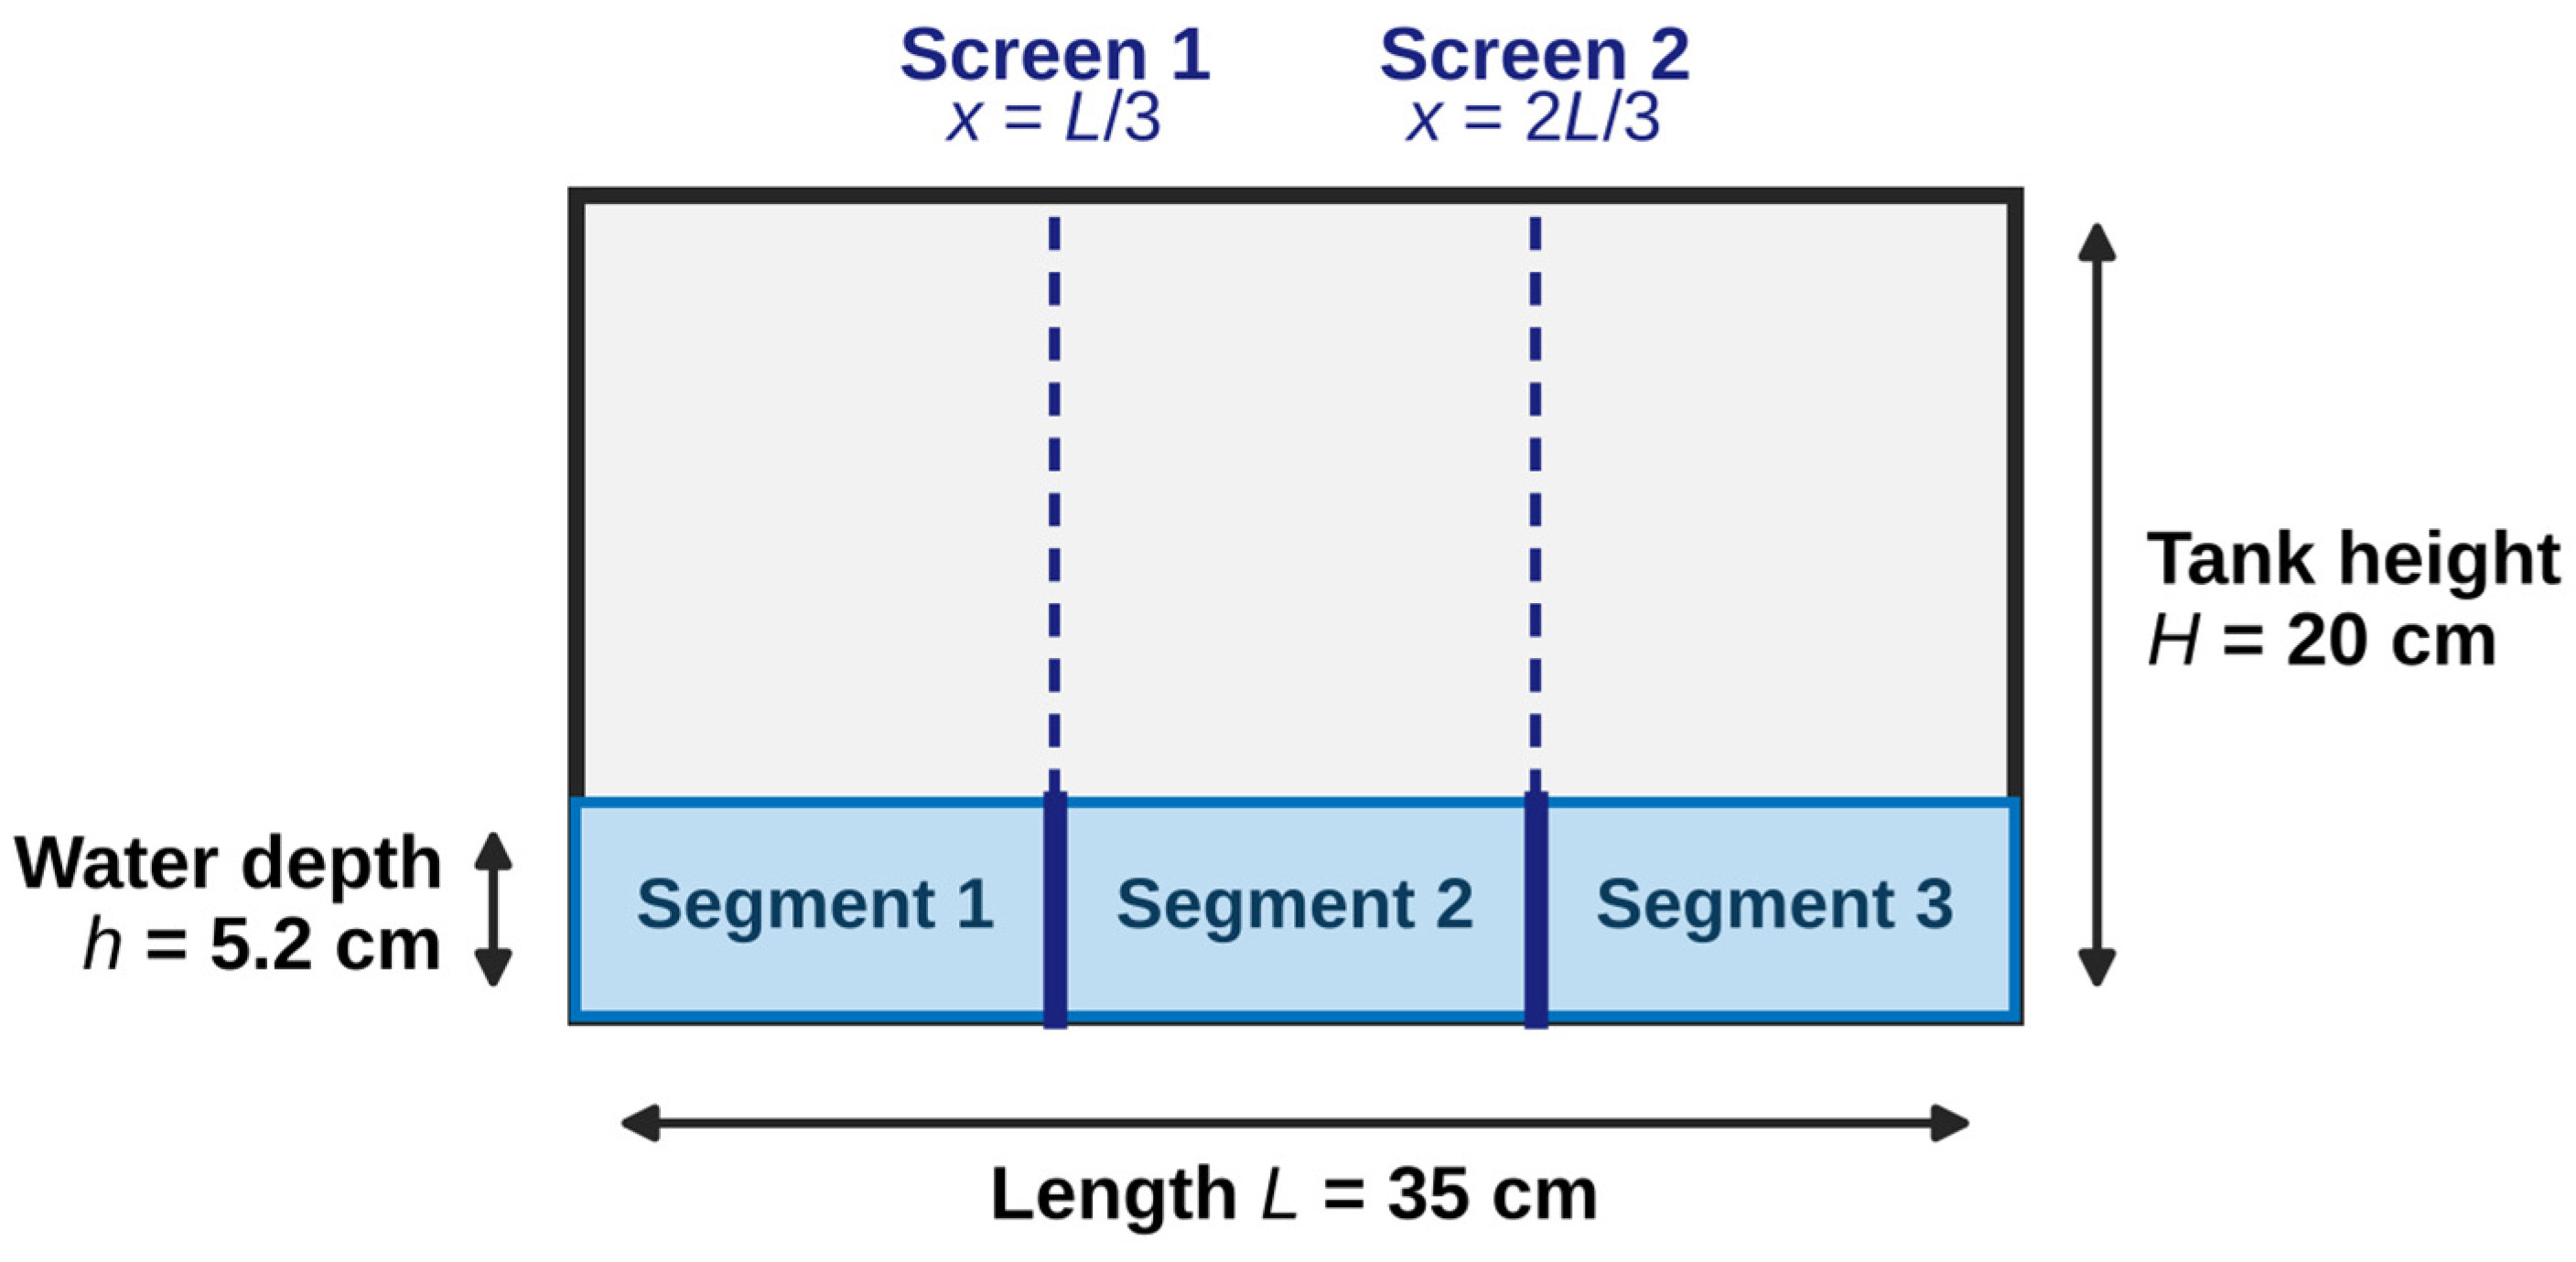
Two identical screens were installed vertically inside the tank at the 1/3 and 2/3 span positions of length L (Figure 4). This dual-screen arrangement partitions the internal fluid volume into three equal segments (Segments 1, 2, and 3), creating dual hydraulic resistance barriers across the primary flow path.
Figure 4.
Geometry of the rectangular TLD tank showing flow damping screens installed.
Figure 4 is a schematic of the tank and of the screen positions, drawn to scale from the measured dimensions of the tank (L = 35 cm, H = 20 cm), the design water depth (h = 5.2 cm) and the screen positions (L/3 and 2L/3). It was drawn with a Python script (Python 3.13, Matplotlib 3.11.2) prepared with the assistance of a generative AI tool (Claude, Opus 5.5, Anthropic), which was used for visualization purposes only.
2.4. Shake Table Testing Setup and Experimental Procedure
The servo-motor-driven small-scale shake table used in this study has a 50 kg work capacity and can produce ±2 g acceleration in one horizontal axis. Its platform measures 50 × 50 cm, and its stroke is ±10 cm. The embedded PID controller makes it possible to simulate sinusoidal motions, real earthquake motions, and user-controlled movements (arbitrary waveforms). The instrumentation system consisted of two high-precision uniaxial accelerometers, one mounted on the shake table surface and the other on the roof plate of the 2-DOF frame to monitor the structural response. Both were TDG SENSEBOX 7001 low-noise MEMS accelerometers (measurement range ±2 g, sensitivity 0.4 V/g, bandwidth DC–1000 Hz, non-linearity 0.1%, dynamic range > 100 dB at 1 Hz), calibrated by the manufacturer. The accelerations were sampled at 200 Hz. The noise level of the recorded roof acceleration, which includes the data acquisition system and ambient vibrations, was about 1.6 milli-g (Section 2.1). The records of the table accelerometer are not available; therefore, only the roof acceleration was used. Each configuration was tested once.
The experimental evaluation was conducted under two main excitation protocols:
- •
- Harmonic Tests at Fixed Frequencies: Harmonic tests consisted of sinusoidal bursts at 17 fixed frequencies between 0.8 fref and 1.2 fref, with fref = 1.042 Hz (the natural frequency of the frame with the empty tank, T0 = 0.96 s) for the uncontrolled tests and fref = 1.0 Hz for all TLD configurations. The latter is the predominant frequency of the frame with the water-filled tank, that is, the frequency at the peak of the 5%-damped response spectrum of a release test (T = 1.0 s). Each burst consisted of 8 cycles of sinusoidal table displacement with an amplitude of 10 mm (table acceleration amplitude 0.026–0.063 g over the tested frequency range; 0.044 g at 1.042 Hz) and was followed by free vibration. The table displacement amplitude was the commanded quantity; the table acceleration records are not available, and the acceleration amplitudes given above are computed from the commanded displacement. The frequencies were applied in increasing order, and each burst started only after the free vibration following the previous burst had decayed. The bursts were shorter than the time needed to reach the steady state (about 35 s); therefore, the measured peaks were transient responses to identical inputs.
- •
- Seismic Time-History Tests: To assess real-world earthquake response mitigation, four historical earthquake acceleration records were executed on the shake table: El Centro (1940), Kobe (1995), Loma Prieta (1989), and Sakarya (1999). The accelerograms were scaled in amplitude to remain within the stroke limit of the shake table (Section 3.2.1); time-scaling was not applied. The records were applied with their original time steps (0.01 s; 0.005 s for Loma Prieta) and were scaled in amplitude only; no baseline correction or filtering was applied. The table controller converts the acceleration record into a displacement command and selects a start position so that the whole displacement history remains within the ±10 cm stroke; the displacement ranges of the scaled records, obtained by double integration, are 12.8–16.7 cm. Because the table acceleration records were not available, the accuracy with which the table reproduced the commanded records could not be verified; all configurations received the same commanded inputs, so the comparisons between configurations were relative. The peak and RMS roof accelerations were recorded for all test cases.
3. Results and Discussion
3.1. Harmonic Tests and Resonant Response
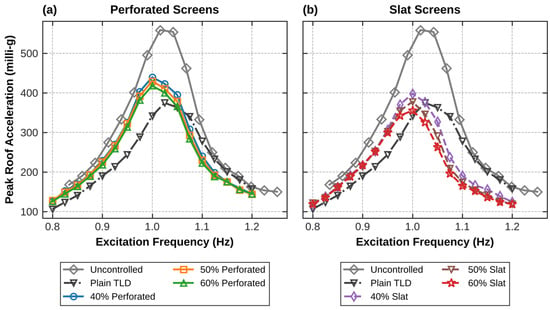
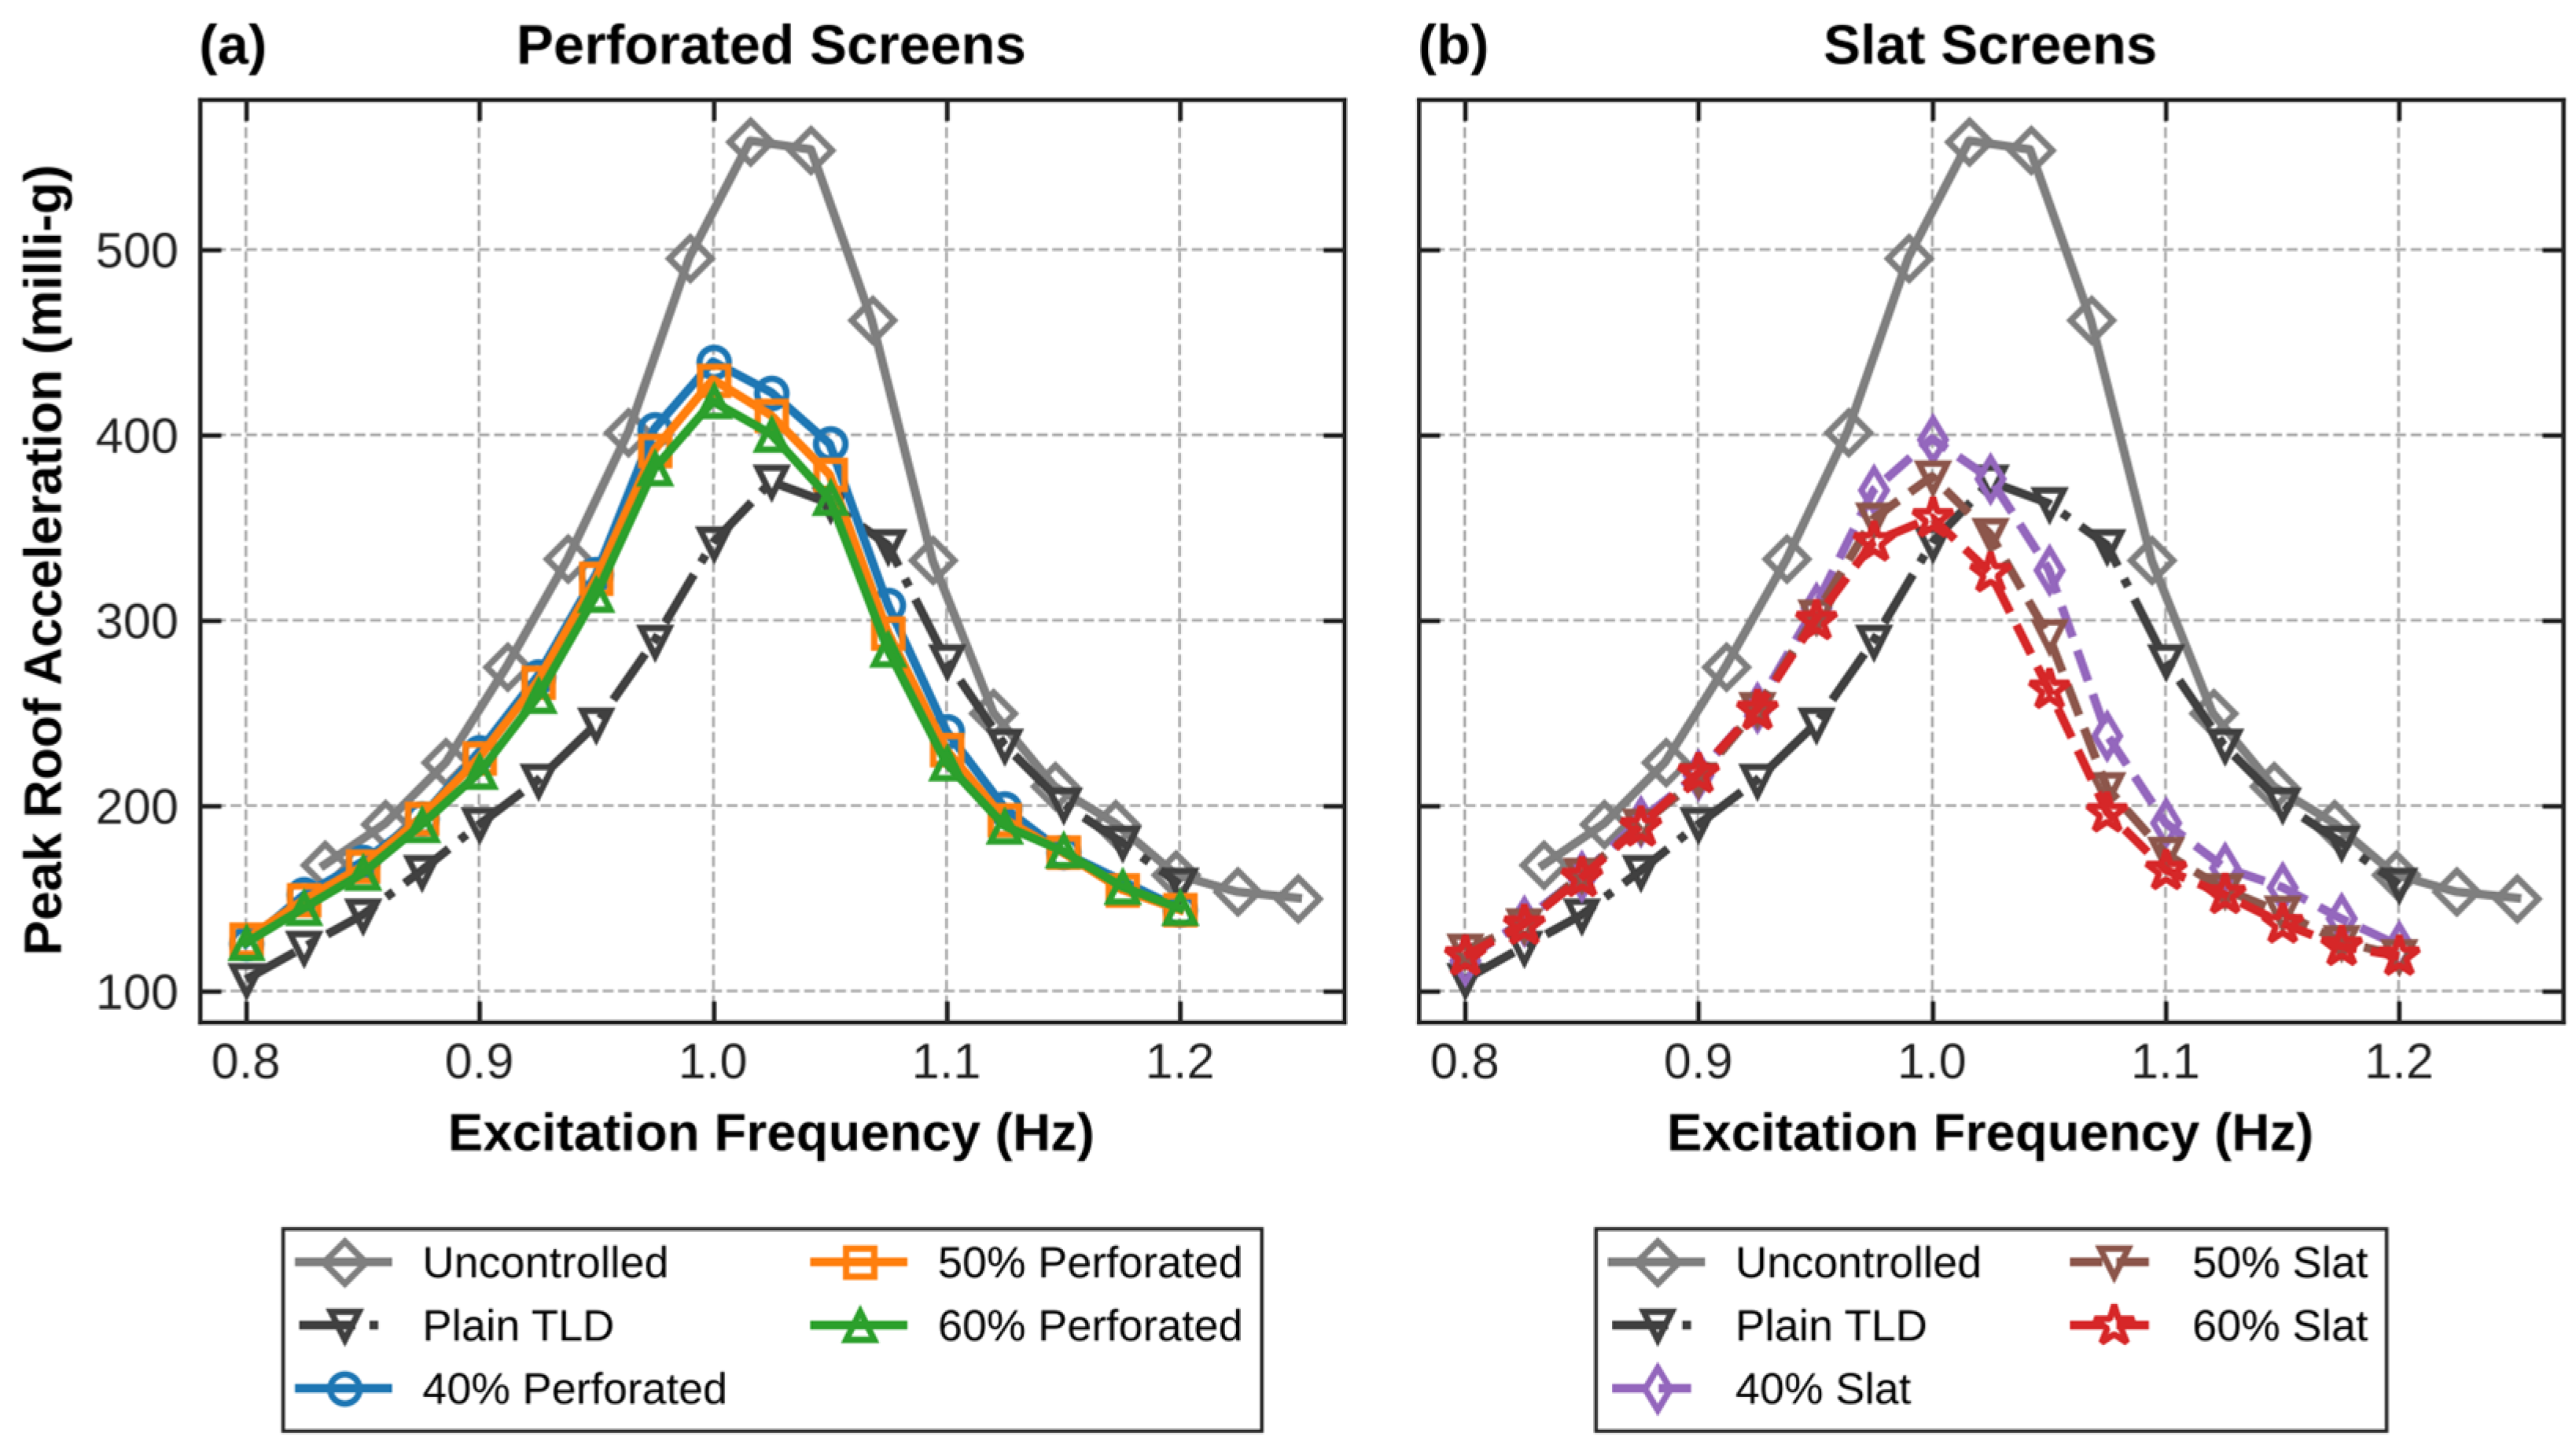
To evaluate the dynamic vibration mitigation efficiency and frequency-response characteristics of the coupled structure–TLD system, single-axis shake table tests were conducted at 17 fixed excitation frequencies, f/fref = 0.80–1.20 in steps of 0.025. For each frequency, the peak roof acceleration was recorded for eight configurations: the uncontrolled benchmark structure, the plain TLD without damping screens, and TLD configurations equipped with perforated and slat screens at porosity ratios of 40%, 50%, and 60%. The measured peak response amplitudes and the corresponding response reduction percentages are summarized in Table 2 and depicted in Figure 5. The excitation frequencies were defined relative to fref = 1.042 Hz (T0 = 0.96 s, frame with the empty tank) for the uncontrolled tests and 1.0 Hz (T = 1.0 s, predominant period of the release test with the water-filled tank) for the TLD tests; therefore, Figure 5 uses absolute frequency. The uncontrolled response is largest at 1.016 and 1.042 Hz (559 and 554 milli-g), consistent with the free-vibration frequency of the frame with the empty tank, 1.04 Hz (Figure 2). All peak values were computed after removal of the constant sensor offset (−0.011 to −0.023 g).
Table 2.
Peak response amplitudes and reduction percentages for various TLD configurations under harmonic excitation (offset-corrected).
Figure 5.
Peak roof acceleration (offset-corrected) versus excitation frequency for all configurations: perforated screens (a) and slat screens (b). The uncontrolled frame and the plain TLD are shown in both panels.
3.1.1. Comparative Performance Analysis
At resonance (1.016 Hz), the uncontrolled structure reached a peak roof acceleration of 558.5 milli-g. Installing the plain TLD (without screens) reduced the peak roof acceleration to 374.6 milli-g, a 32.9% reduction. However, when flow damping screens were implemented, clear performance variations emerged depending on the screen geometry and porosity ratio:
- •
- Slat Screens vs. Perforated Screens: Across all tested porosity ratios (40%, 50%, and 60%), slat screens provided better performance than perforated screens. At a 60% porosity ratio, the slat screen reduced the peak response amplitude to 355.3 milli-g (36.4% reduction), whereas the perforated screen with the same porosity yielded 418.0 milli-g (25.2% reduction). A possible explanation, consistent with pressure-drop models of slat screens [5,12], is that the uniformly spaced horizontal slats produce continuous shear layers and vortex shedding, whereas the circular openings of perforated screens constrict the flow locally and block a larger part of the fluid motion. The flow field was not measured; therefore, this mechanism was not verified directly.
- •
- Influence of Porosity Ratio (p): For both screen types, increasing porosity ratio from 40% to 60% improved vibration mitigation performance. For perforated screens, peak reduction increased from 21.3% (p = 40%) to 23.0% (p = 50%) and 25.2% (p = 60%). For slat screens, peak reduction increased from 28.8% (p = 40%) to 32.4% (p = 50%) and reached a maximum of 36.4% (p = 60%). At lower porosity ratios (40%), screens behave like a physical barrier restricting fluid motion through the openings; the equivalent mechanical model indicates that they overdamp the sloshing mode (Section 3.1.3). Higher porosity ratios (60%) allow more fluid flow and bring the damping ratio of the sloshing mode closer to its optimum. Overall, the TLD with 60% slat screens reached the highest performance (36.4% reduction), higher even than the plain TLD (32.9%). It is the only screen configuration that reduced the resonant peak more than the plain TLD; all perforated screens and the 40% and 50% slat screens gave higher peaks (377.5–439.4 milli-g). Because each configuration was tested once, the difference between the 60% slat screen and the plain TLD (19 milli-g, 5% of the plain-TLD peak) should be confirmed by repeated tests.
3.1.2. Observations of Sloshing Regimes and Screen Interaction
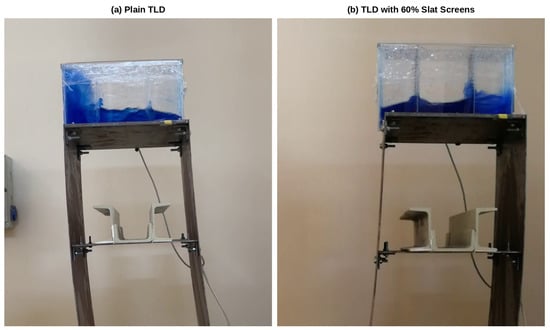
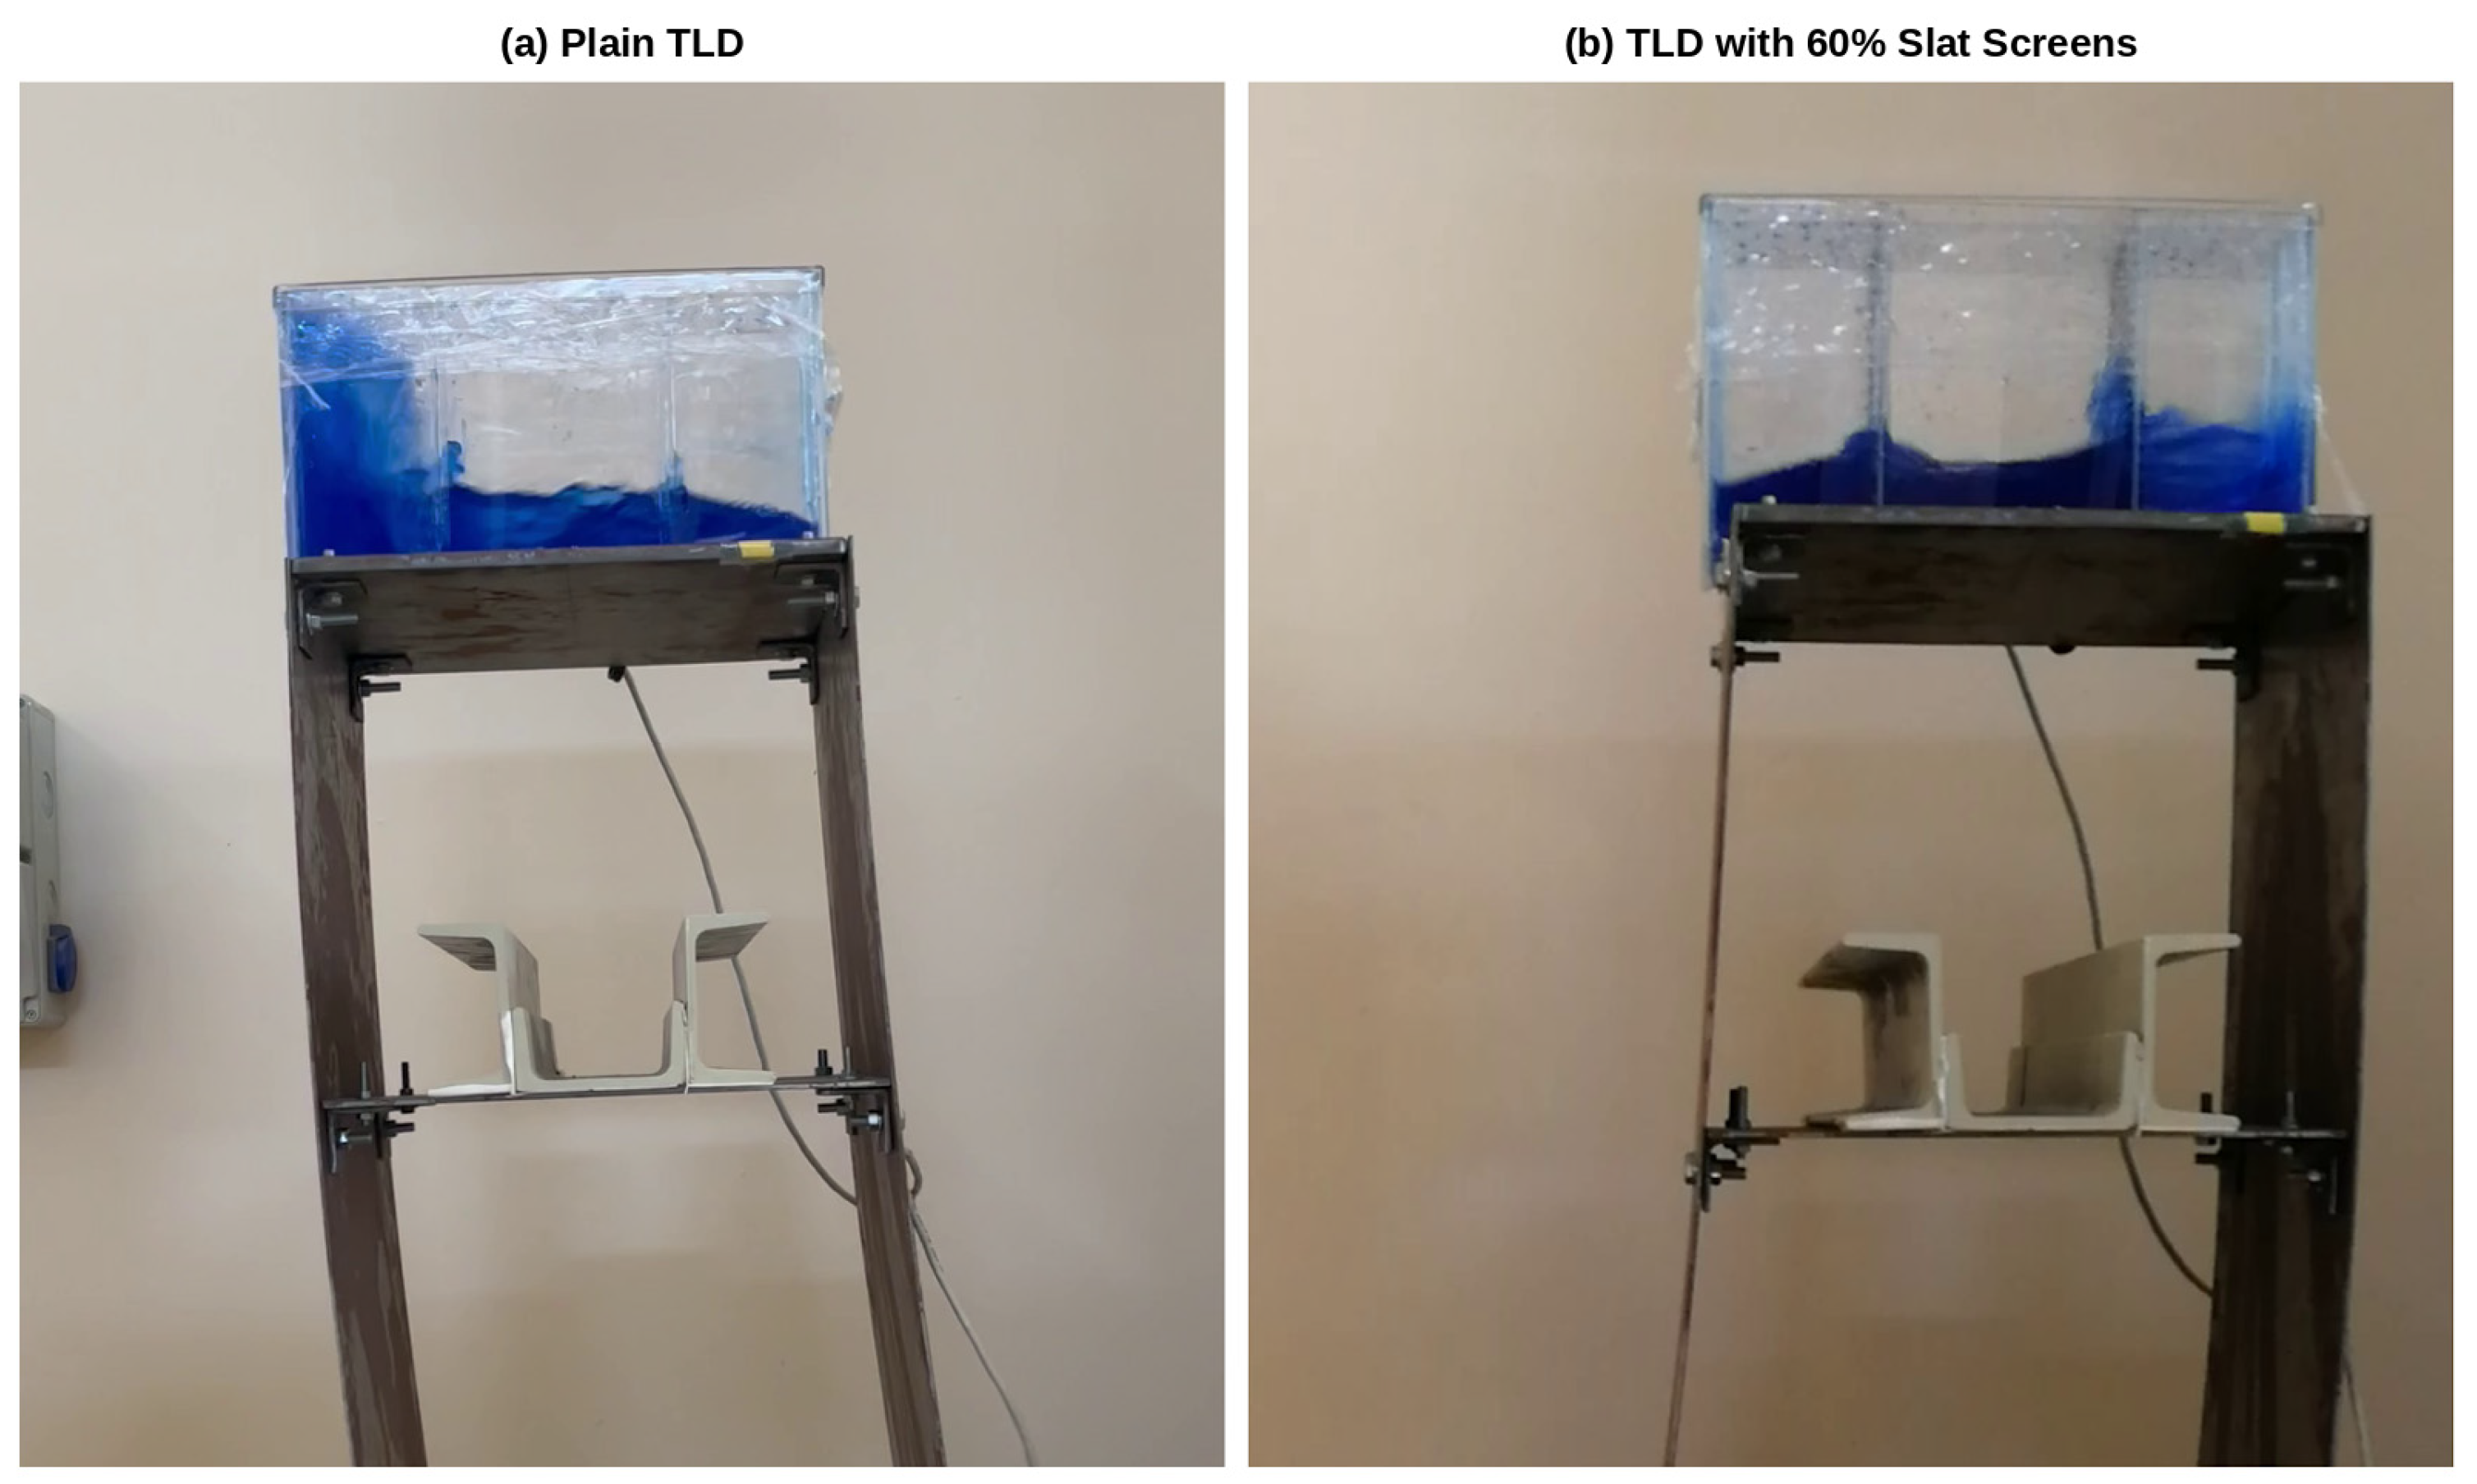
Digital video records obtained during shake table tests revealed different liquid sloshing patterns between plain and screen-equipped TLD tanks. Figure 6 shows a direct visual comparison of the fluid–structure interaction for the plain TLD and the TLD equipped with a 60% porosity slat screen under resonant harmonic excitation. The unequipped plain TLD exhibited a highly nonlinear sloshing regime. Driven by the large-amplitude base excitation, the shallow liquid underwent severe wave breaking, turbulent overturning, hydraulic jumps, and hard fluid impacts against the end walls. This nonlinear fluid–structure interaction was the main energy dissipation mechanism of the plain TLD and also changed its effective sloshing frequency. In contrast, with the screens, the video records showed a smaller and more regular sloshing motion without wave breaking. In absolute frequency, the plain TLD response peaks at 1.025 Hz and all screen-equipped configurations at 1.000 Hz; the uncontrolled frame peaks at 1.016 Hz. The screens appear to break up the standing wave, and no impacts on the end walls were observed; the liquid passed through the openings, dissipating energy, presumably through viscous drag and vortex shedding at the screens. These are qualitative observations: the free-surface elevation and the flow through the screens were not measured, and a response peak at one of the tested frequencies does not by itself establish linear sloshing or exact tuning. The more regular motion is nevertheless closer to the assumptions of the linear wave theory used in the design (Section 2.2).
Figure 6.
Comparison of maximum structural displacement and sloshing regimes at resonance. (a) Plain TLD, (b) TLD equipped with slat screens with porosity ratio of 60%.
3.1.3. Evaluation of Damping Performance
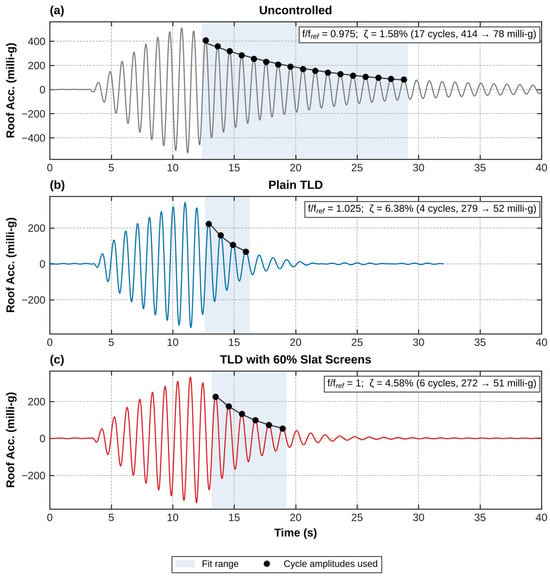
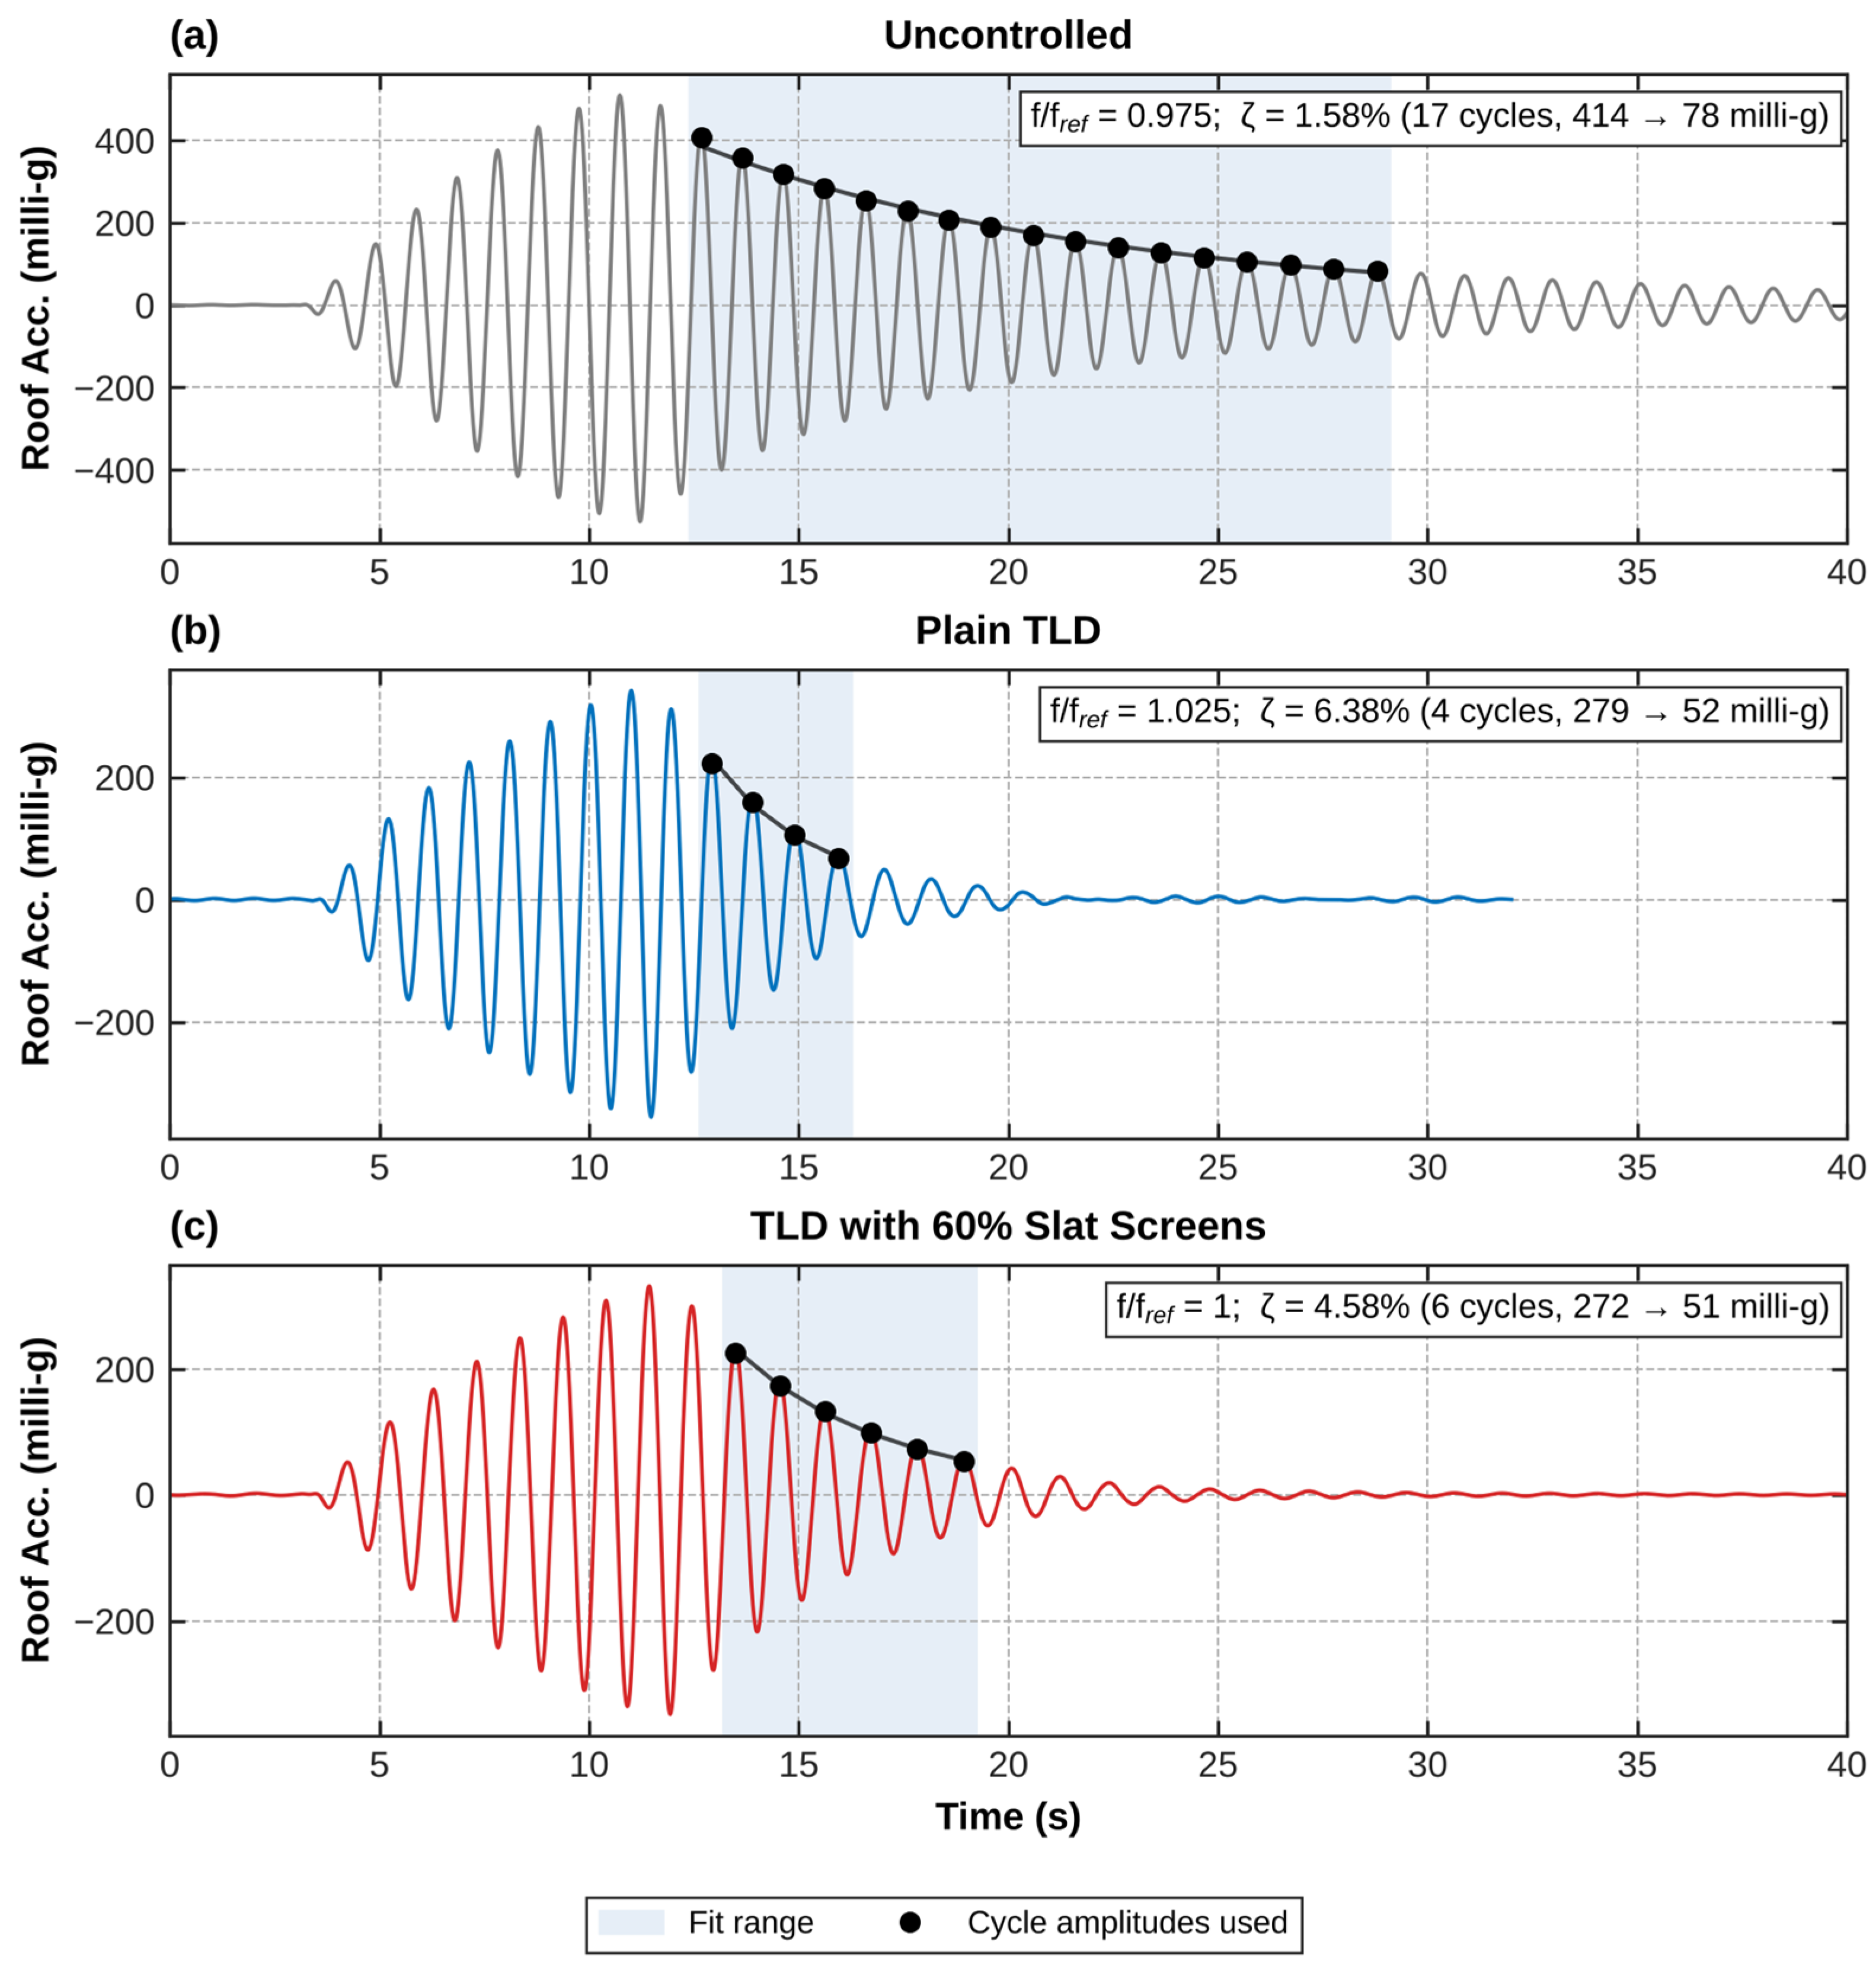
To quantify the energy dissipation of the tested configurations, the damping ratio was identified from the free decay of the roof acceleration after each harmonic burst, using the least-squares fit of Equation (1). The cycle amplitudes were taken as half the peak-to-peak value of each cycle of the band-pass-filtered (0.4–3 Hz) signal, and the fit was applied to the consecutive cycles between 0.8 and 0.15 of the peak cycle amplitude (Figure 7). Because the coupled structure–TLD system decays in two modes, the fitted value is an apparent damping ratio of the roof response and is used to compare configurations.
Figure 7.
Roof acceleration during and after the resonant harmonic burst: (a) uncontrolled frame, (b) the plain TLD, (c) TLD with 60% slat screens. Shading marks the fit range, and dots mark the cycle amplitudes used to identify the damping ratio.
The damping ratios identified at the resonant test and their mean over all 17 excitation frequencies are summarized in Table 3. The added damping ratio, i.e., the increase in the apparent damping ratio of the roof response over that of the frame alone, is a common measure of TLD performance [29]. At the resonant test, the added damping ratio was 1.8–3.0 percentage points for the screen-equipped TLDs and 4.8 percentage points for the plain TLD; therefore, the apparent damping ratio of the system was two to four times that of the frame alone.
Table 3.
Apparent damping ratios of the roof response identified from the free decay after the harmonic bursts. Added damping ratio: difference from the damping ratio of the uncontrolled structure at the resonant test.
The damping ratio increased with porosity for both screen types, and the slat screens exceeded the perforated screens at every porosity: at the resonant test, from 3.41% to 4.25% for perforated screens and from 3.54% to 4.58% for slat screens. Among the screens, the 60% slat screen gave the highest damping ratio, but the plain TLD showed the highest apparent damping ratio (6.38%). Its decay was the fastest, so only four cycles lie within the fit range (Figure 7); below about 10 milli-g, its response changed to a low-amplitude beating, as in the release test described below. These results are consistent with uniformly spaced horizontal slats promoting vortex shedding and shear-layer development without the local flow constriction of perforated screens, although the flow field was not measured.
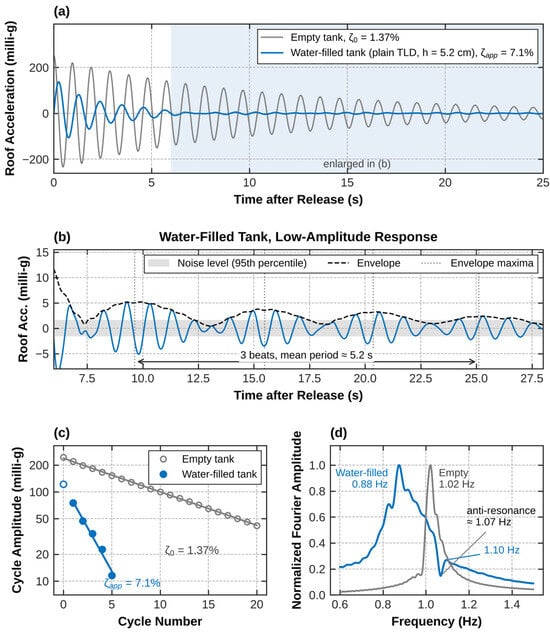
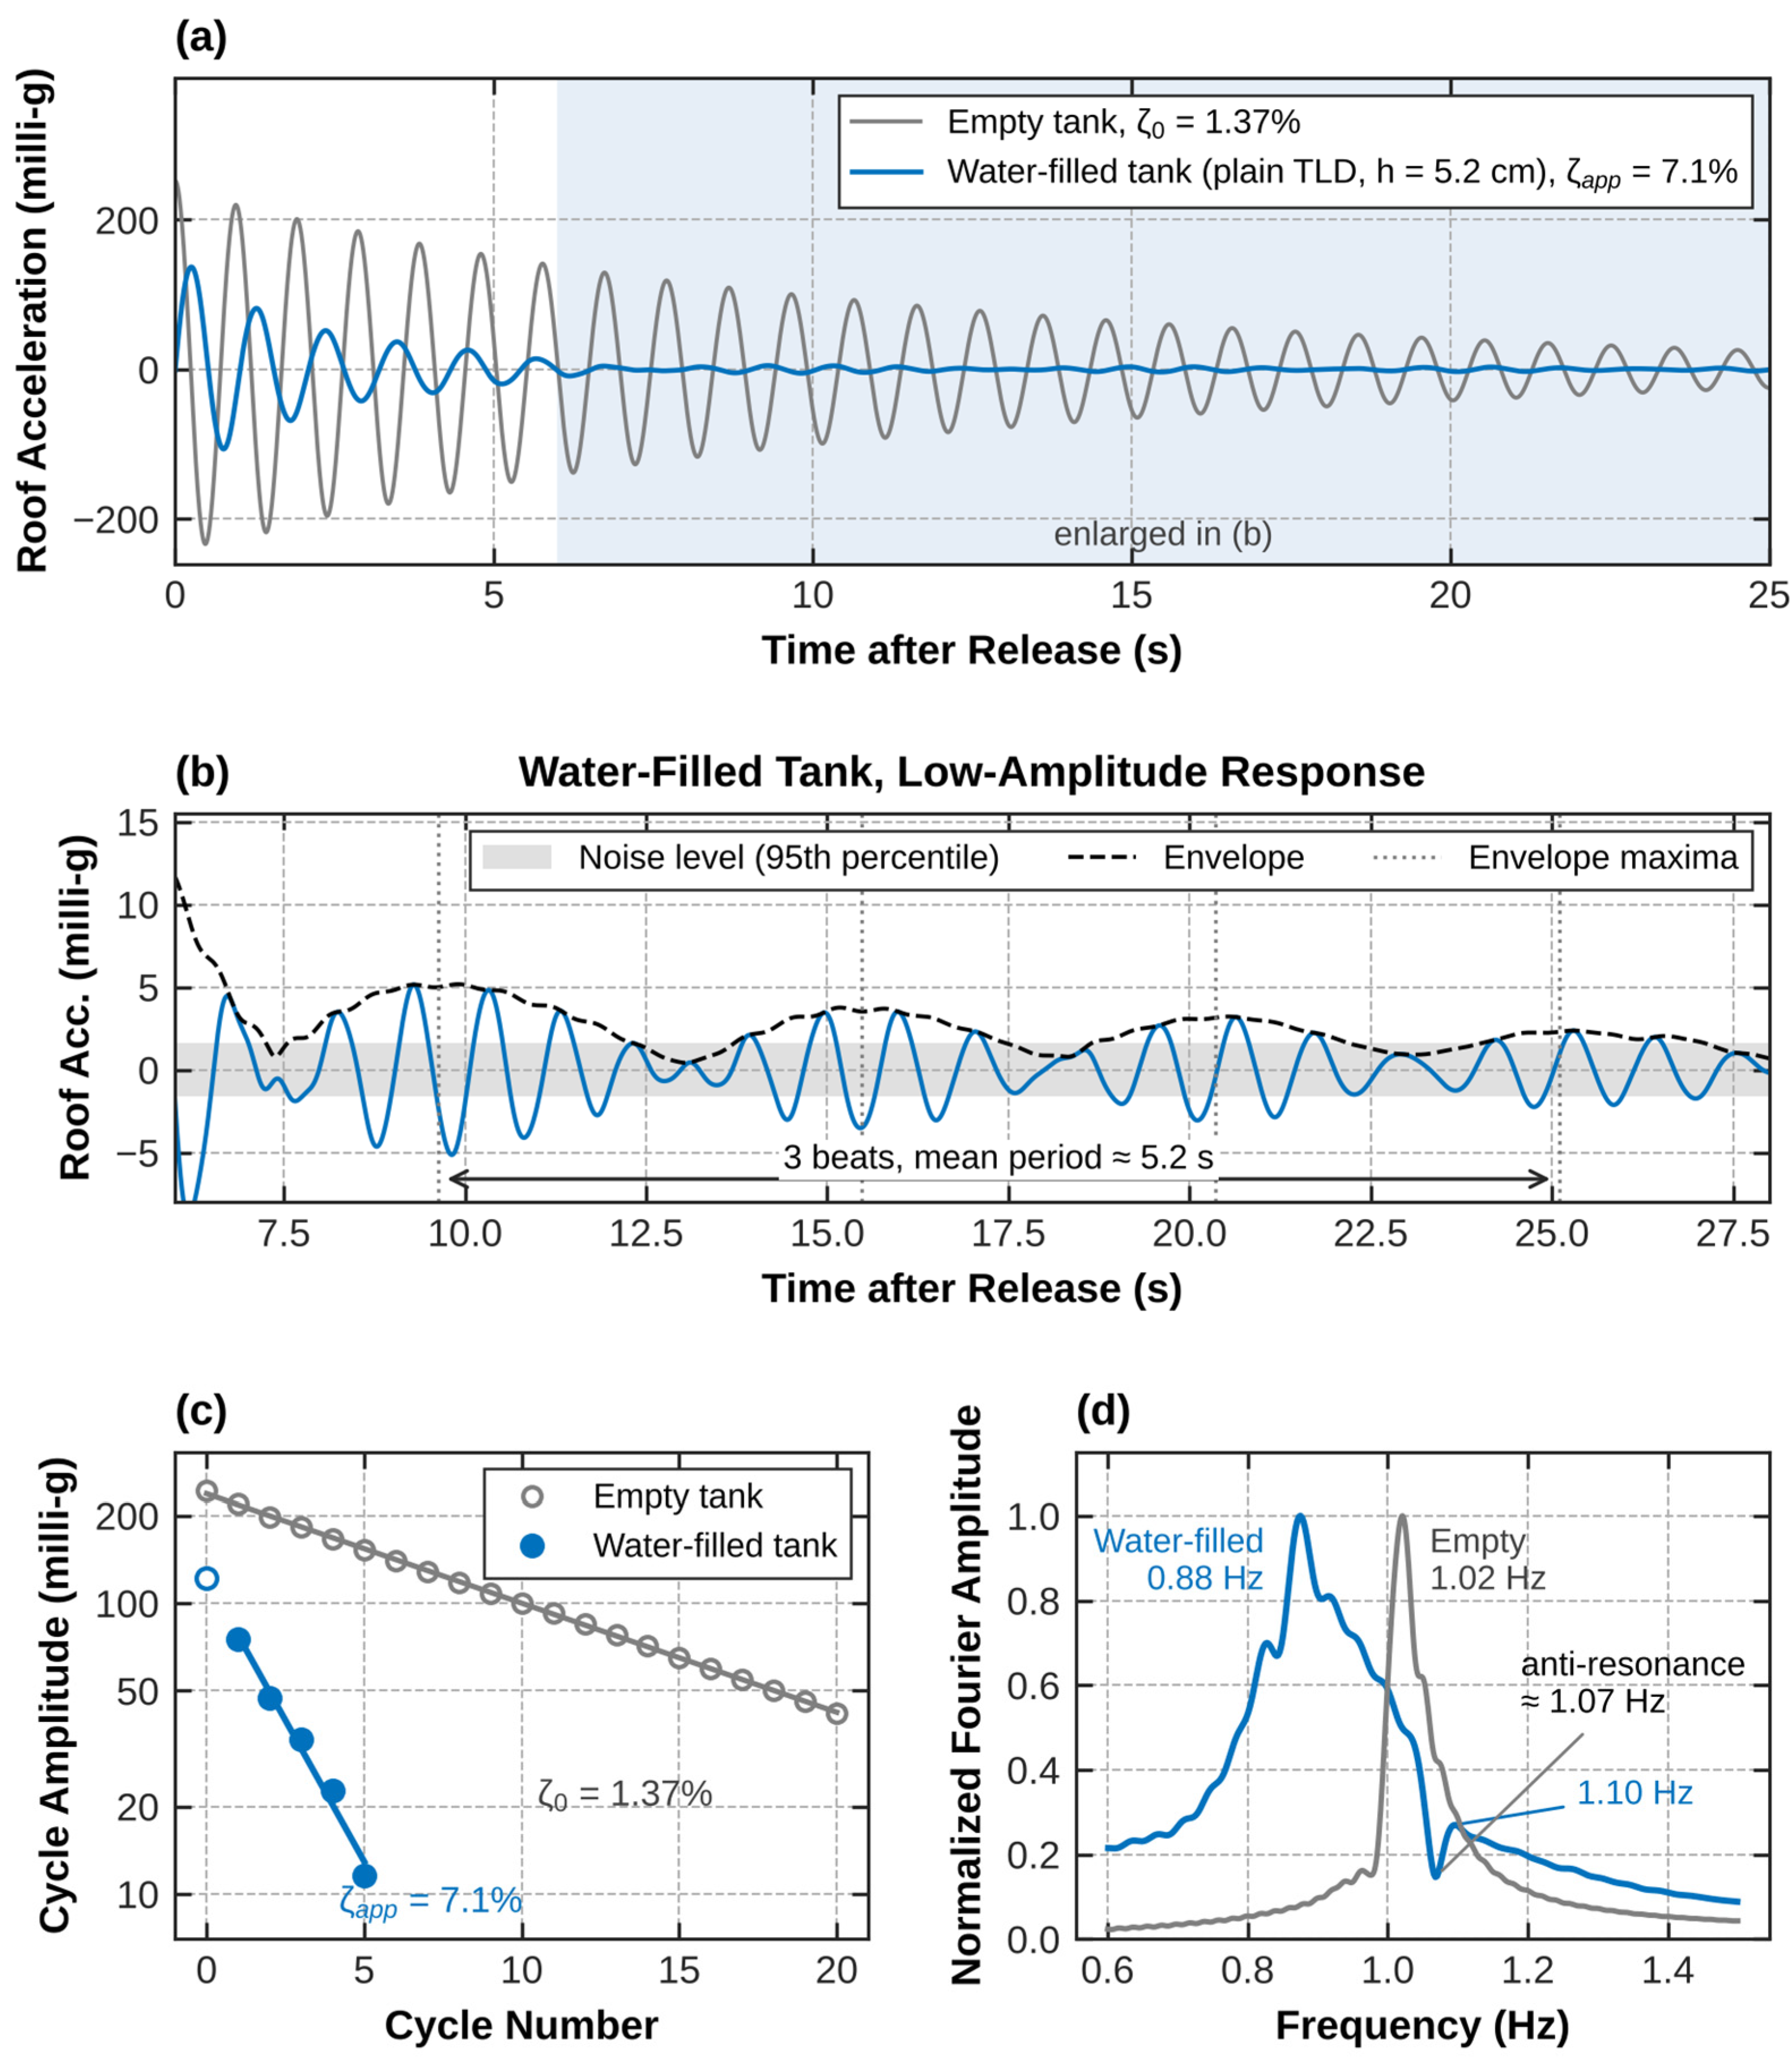
In the release test, the apparent damping ratio of the frame with the water-filled plain TLD (h = 5.2 cm) was 7.1% (cycle-by-cycle values 5.1–10.7%), against 1.37% for the frame with the empty tank (Figure 8). The roof acceleration decreased from 75 to 12 milli-g within four cycles, whereas the empty-tank frame needed about 20 cycles for the same relative decay. The envelope was close to exponential only over this large-amplitude range. Below about 10% of the initial amplitude, the response continued as a beating between the two coupled modes of the frame–liquid system (0.88 and 1.10 Hz), with an anti-resonance near the sloshing frequency (about 1.07 Hz). The envelope of this beating has maxima about 5 s apart, decreasing from 5 to 2 milli-g over 25 s, i.e., above the noise level of about 1.6 milli-g (Figure 8b). Therefore, the damping ratio provided by sloshing decreased at small amplitudes.
Figure 8.
Release tests of the frame with the empty tank and water-filled plain TLD (h = 5.2 cm): (a) roof acceleration after release; (b) low-amplitude response of the water-filled tank between 6 and 28 s, with its envelope and the noise level of the measurement; (c) cycle amplitude with exponential fits (open symbols: not used in the fit); (d) normalized Fourier amplitude spectra of the decay.
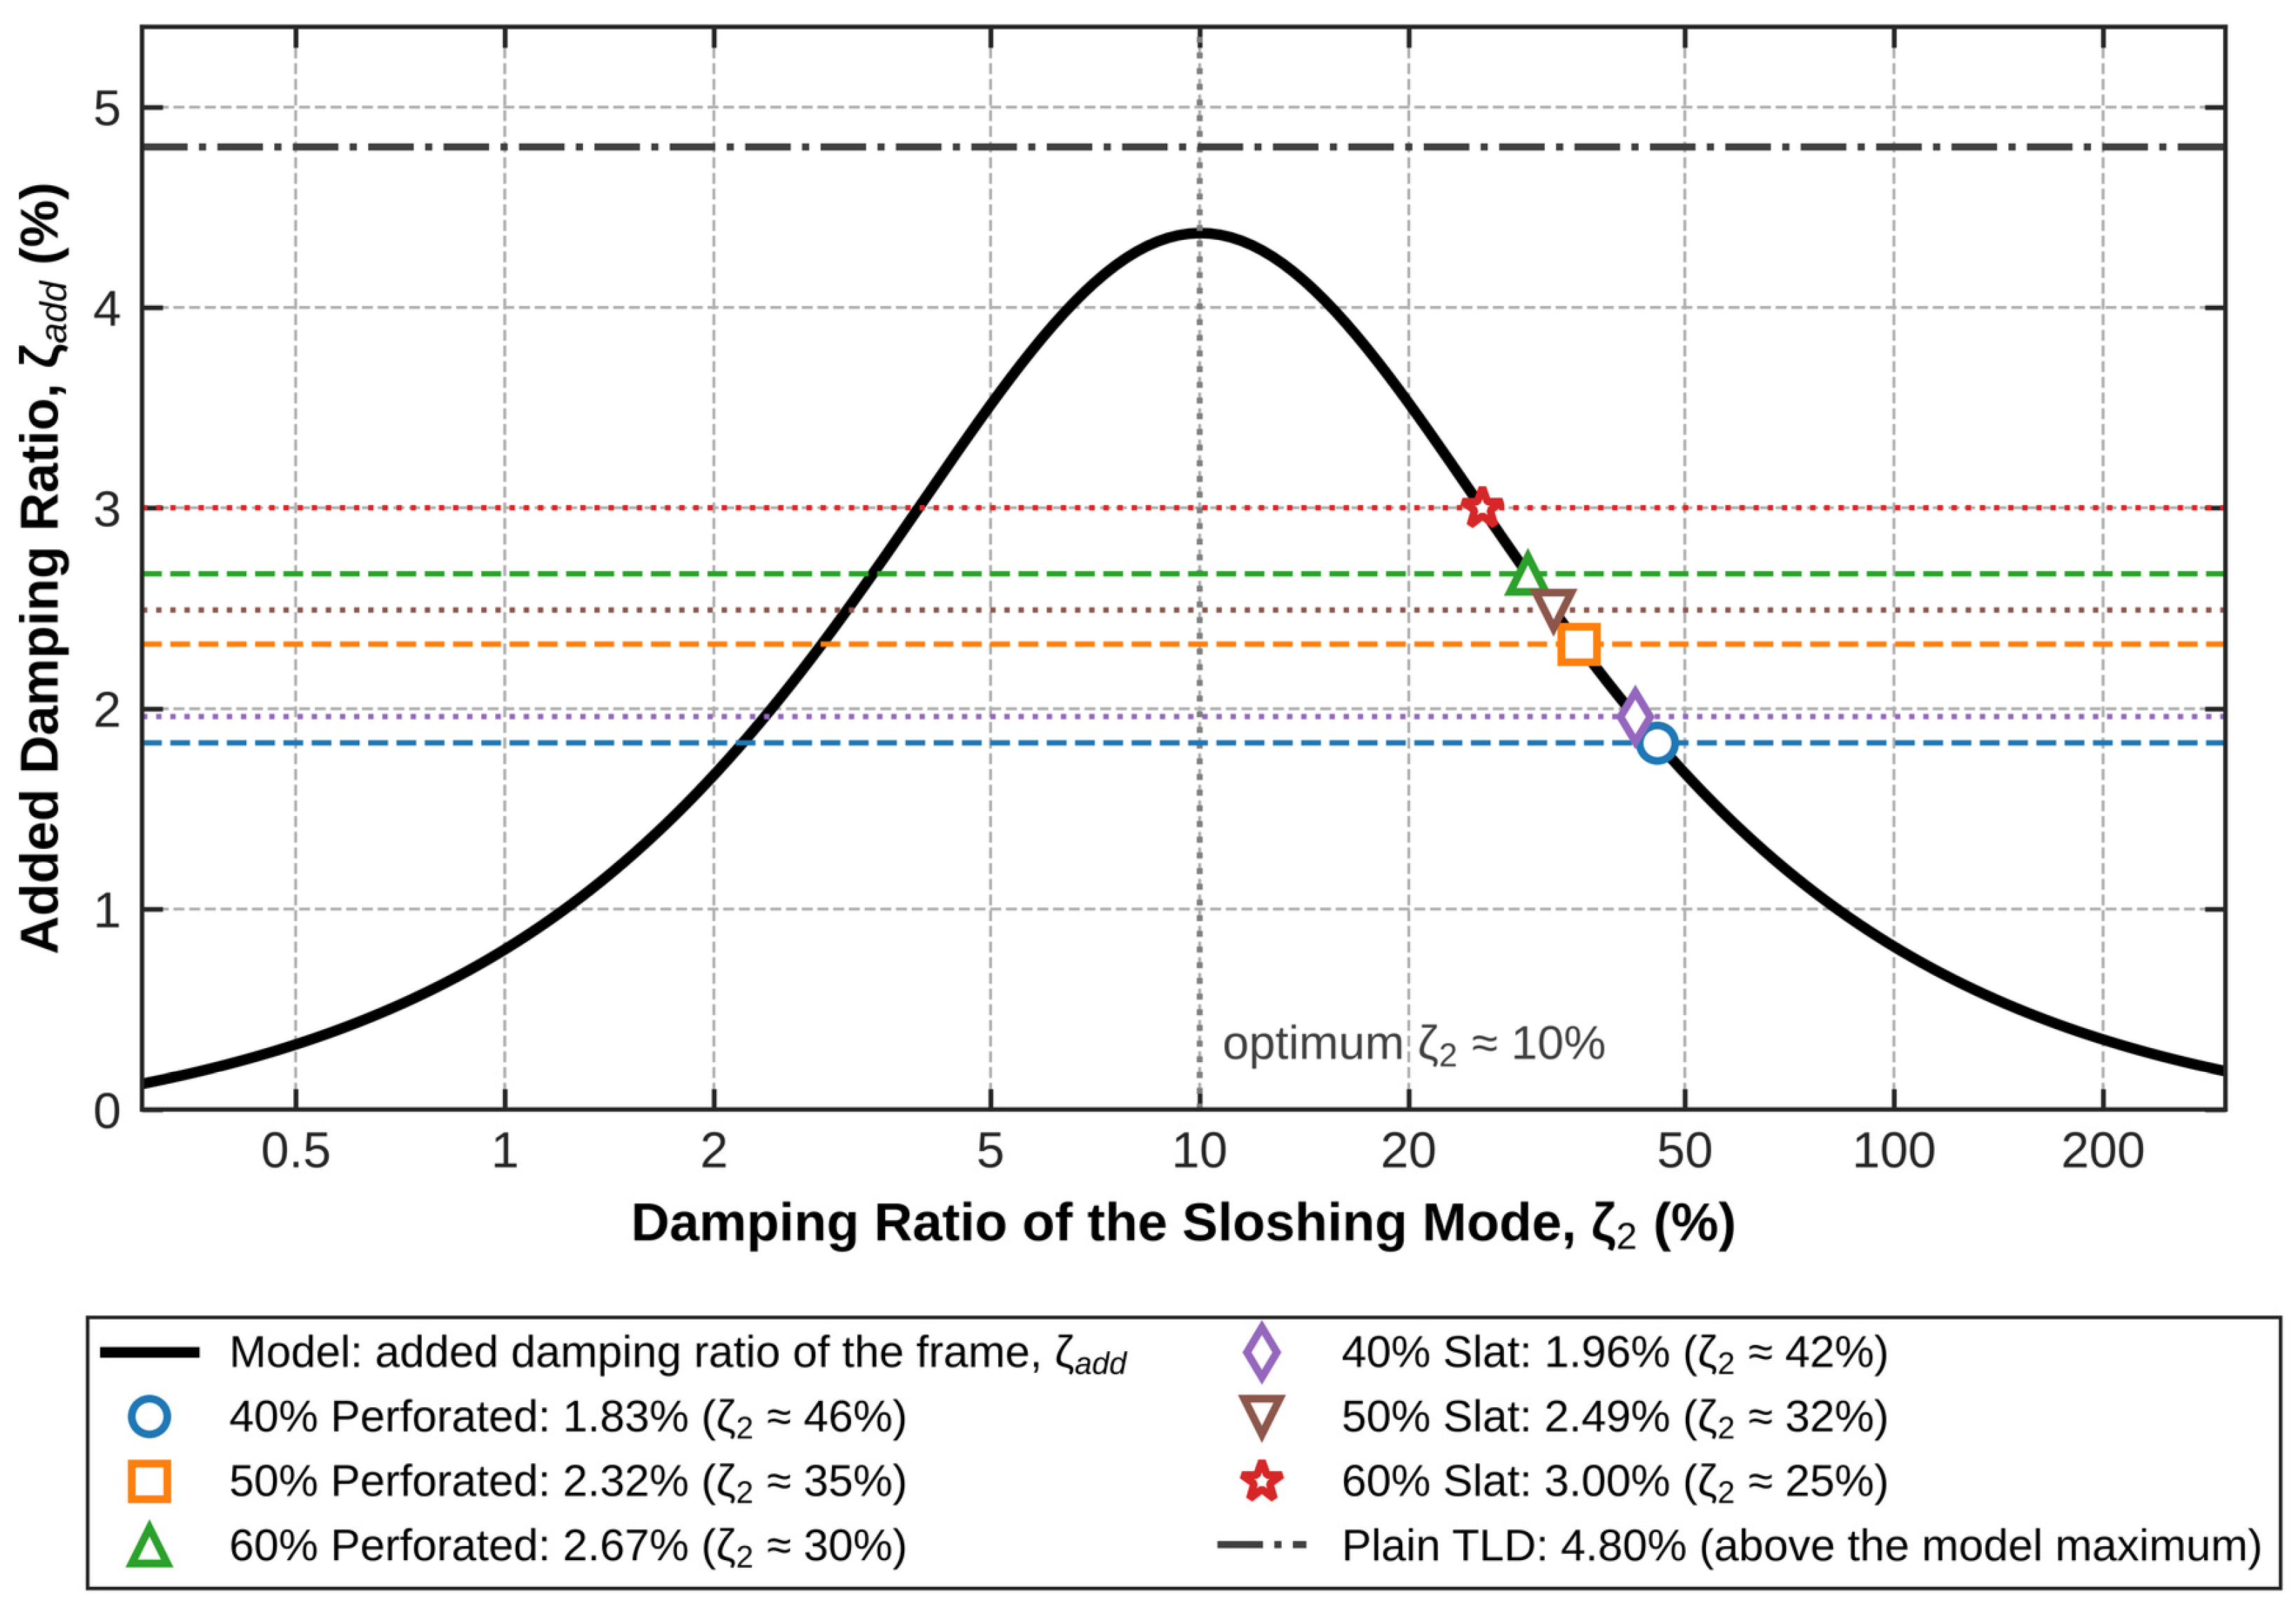
To relate the measured damping ratios to the design model, the added damping ratio of the frame was computed using the state-space model of Section 2.2 (μ = 4.2%, h = 5.2 cm, ζ0 = 1.37%) for sloshing damping ratios ζ2 = 0.3–300%. Following Love et al. [30], the effective damping ratio ζeff of the TLD-equipped frame is the damping ratio that the frame without the damper would need to have the same response variance, and the added damping ratio ζadd is its difference from the inherent damping ratio of the frame:
where σ0 and σ are the RMS roof displacements of the frame without and with the TLD under white-noise base acceleration, respectively, and H0 and H are the corresponding H2 norms (Equation (8)). For white-noise excitation, the response variance is proportional to the squared H2 norm; therefore, the two forms of Equation (10) are identical; the latter is the frequency-domain form given in [30]. The H2 norms were computed from the controllability Gramian of the state-space model (Equations (6) and (7)), that is, from the solution of a Lyapunov equation. Because the two coupled modes are closely spaced, their modal damping ratios do not describe the decay of the roof response, which shows beating; the effective damping ratio is used instead, consistent with the H2 criterion of the design.
ζadd = ζeff − ζ0
As with a tuned mass damper, the added damping ratio is bounded (4.4%) and reaches its maximum at ζ2 ≈ 10%; it decreases for both smaller and larger ζ2. Each measured value of the added damping ratio therefore corresponds to two values of ζ2, one on each side of the optimum. The overdamped branch was selected for two reasons: the screens add flow resistance to the sloshing liquid and therefore increase ζ2, and only on this branch does the added damping ratio increase with porosity, as measured; on the underdamped branch, a higher porosity, i.e., a lower flow resistance, would reduce the added damping ratio. On this branch, the measured added damping ratio of the screen-equipped TLDs (1.8–3.0%, Table 3) corresponds to ζ2 ≈ 25% (slat, 60%) to 46% (perforated, 40%), i.e., to overdamping of the sloshing mode. This explains why the added damping ratio increases with porosity and why the 40% screens perform worst, without assuming a particular flow mechanism. The plain TLD, whose energy dissipation at large amplitude comes mainly from wave breaking, gives the largest added damping ratio (4.8%), slightly above the maximum of the linear model. The model is also consistent with the release test of the water-filled tank: it predicts coupled modes at 0.92 and 1.12 Hz, against 0.88 and 1.10 Hz measured (Figure 8). The mapping in Figure 9 is indicative, because the apparent damping ratio of a transient decay is not identical to the effective damping ratio of the linear model under white-noise excitation.
Figure 9.
Added damping ratio of the frame, ζadd, as a function of the damping ratio of the sloshing mode (Equations (10) and (11); calibrated equivalent mechanical model, μ = 4.2%, h = 5.2 cm). Dashed lines: added damping ratios measured after the resonant harmonic burst; symbols: corresponding ζ2 on the overdamped branch.
3.2. Seismic Time-History Response
3.2.1. Input Ground Motions and Response Spectra
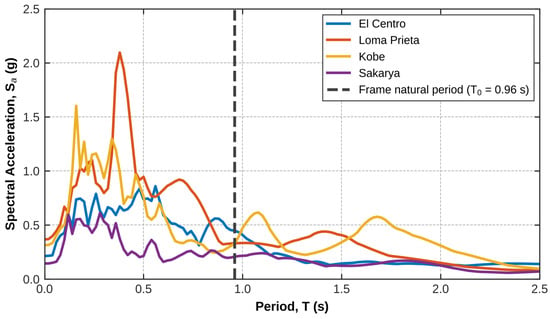
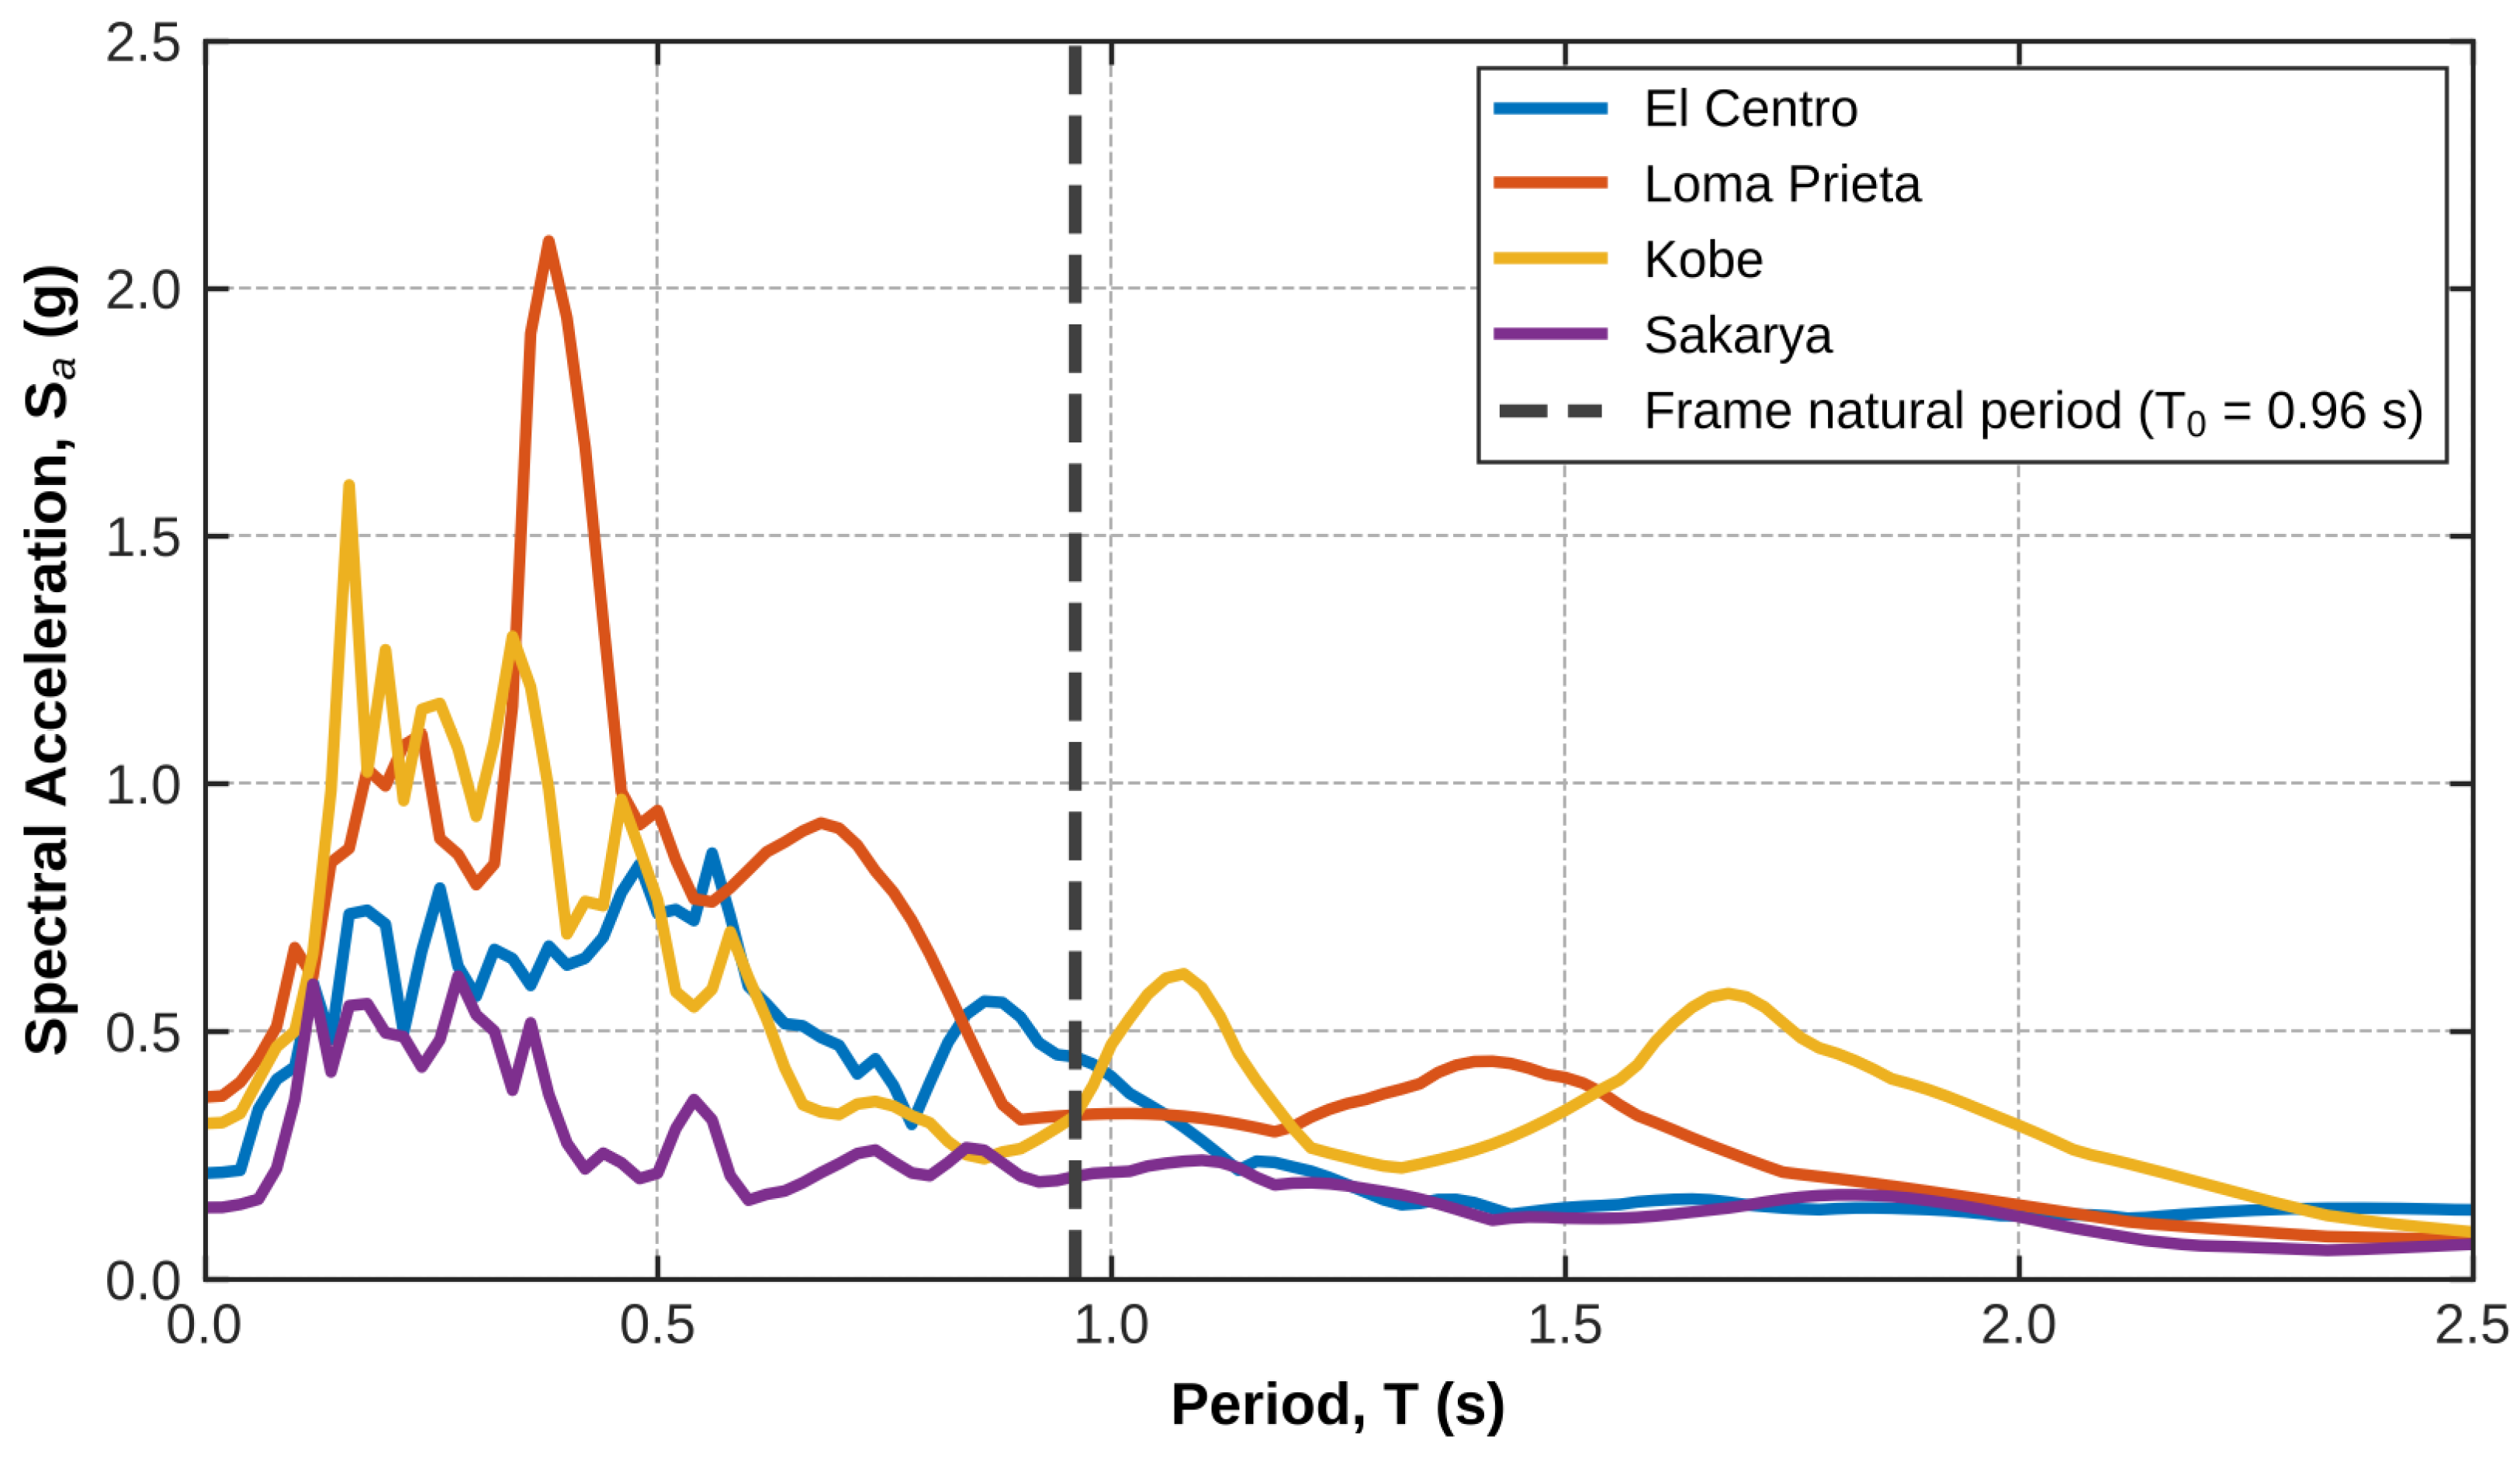
To evaluate the vibration control performance under transient ground motions, the test structure was subjected to four historical earthquake records: El Centro (1940), Kobe (1995), Loma Prieta (1989), and Sakarya (1999). Because of the stroke limits of the shake table, the original seismic records were scaled. The scaling factors were determined as 0.67, 0.91, 1.0, and 0.23, which correspond to Peak Ground Acceleration (PGA) values of 0.214 g, 0.315 g, 0.367 g, and 0.144 g for the El Centro, Kobe, Loma Prieta, and Sakarya records, respectively. The records were scaled in amplitude only; the time step was not changed. Table 4 lists the properties of the scaled records, and Figure 10 illustrates the 2% damped acceleration response spectra of the selected ground motions.
Table 4.
Properties of the scaled input records (D5–95: 5–95% significant duration; Tm: mean period [31]).
Figure 10.
The 2% damped acceleration response spectra of the scaled ground motions; the dashed line marks the natural period of the frame with the empty tank (T0 = 0.96 s).
3.2.2. Comparative Analysis of Peak and RMS Accelerations Under Seismic Excitation
To analyze the seismic mitigation performance of the tested TLD configurations, both the absolute peak roof acceleration and the RMS acceleration demands were examined. While the peak roof acceleration is the largest instantaneous response at the roof, the RMS acceleration is an average measure of the response level over a time window. The maximum peak and RMS roof accelerations, along with the corresponding reduction percentages relative to the uncontrolled structure, are summarized in Table 5 and Table 6, respectively. The RMS roof acceleration is computed over a time window as
where ai is the measured roof acceleration at sample i, k is the first sample of the window, N is the number of samples in the window, and ā is the mean of the whole record, which removes the constant sensor offset. aRMS is reported for the whole record, for the strong-motion interval (5–95% of the Arias intensity of the input), and for 15 structural periods after the end of the input. All peak values were computed after removal of the sensor offset. For the screen-equipped TLDs, the values refer to a water depth of 5.0 cm, and for the plain TLD to 5.2 cm.
Table 5.
Comparison of absolute maximum peak roof accelerations for the uncontrolled structure and various TLD configurations (offset-corrected).
Table 6.
Comparison of RMS roof accelerations for the uncontrolled structure and various TLD configurations: whole record, strong-motion interval (5–95% Arias intensity of the input) and residual free vibration (15 structural periods after the end of the input; about 10 s for Kobe).
The RMS reduction percentages exceeded the peak acceleration reductions across all configurations and seismic records. For example, under the Sakarya earthquake, the 60% perforated screen reduced the absolute peak acceleration by 21.7%, while the reduction in the whole-record RMS response reached 49.0%. The RMS reduction depends strongly on the time window. During strong ground motion, the reductions were 7–31% (Table 6), which is comparable to the peak reductions, whereas in the residual free vibration after the input, the TLDs reduced the RMS response by 63–96%. The large whole-record reductions therefore come mainly from the faster decay of the response after the input ends.
Furthermore, lower porosity screens (40%) consistently led to reduced performance, consistent with the overdamping of the sloshing mode shown in Figure 9. Increasing the porosity to 60% yielded the most favorable response reductions across nearly all ground motion records.
Relative to the plain TLD, the screens improved the response only under some inputs (Table 5 and Table 6). Under the Kobe record, all screen-equipped TLDs gave lower peak roof accelerations than the plain TLD, by 5–12% of the plain-TLD value, and lower whole-record RMS values, by 1–7%. Under El Centro, all screens gave higher peaks (by 7–19%) and higher RMS values (by 16–33%) than the plain TLD. Under Loma Prieta, the peaks differed by less than 2%, but the whole-record RMS values of the screen-equipped TLDs were 10–18% higher. Under Sakarya, only the 50% and 60% perforated screens gave lower peaks (by 0.5% and 4.5%), and the 60% perforated screen and the plain TLD gave the same whole-record RMS reduction (49.0%). The screen-equipped TLDs were tested at 5.0 cm and the plain TLD at 5.2 cm, so these comparisons also include a small difference in tuning.
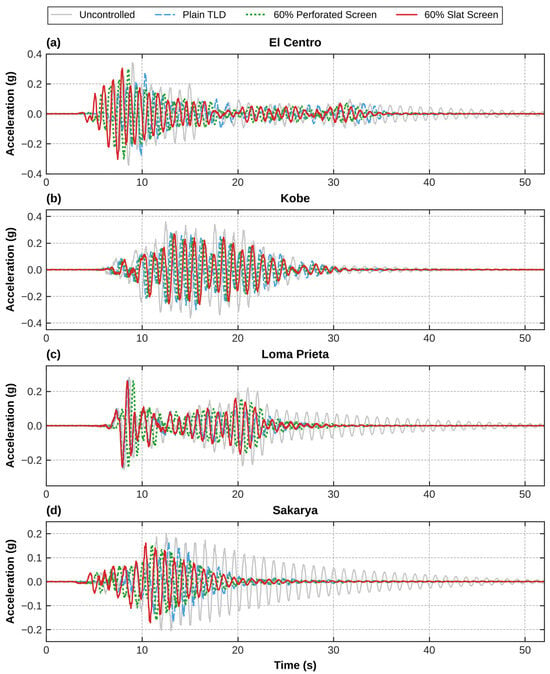
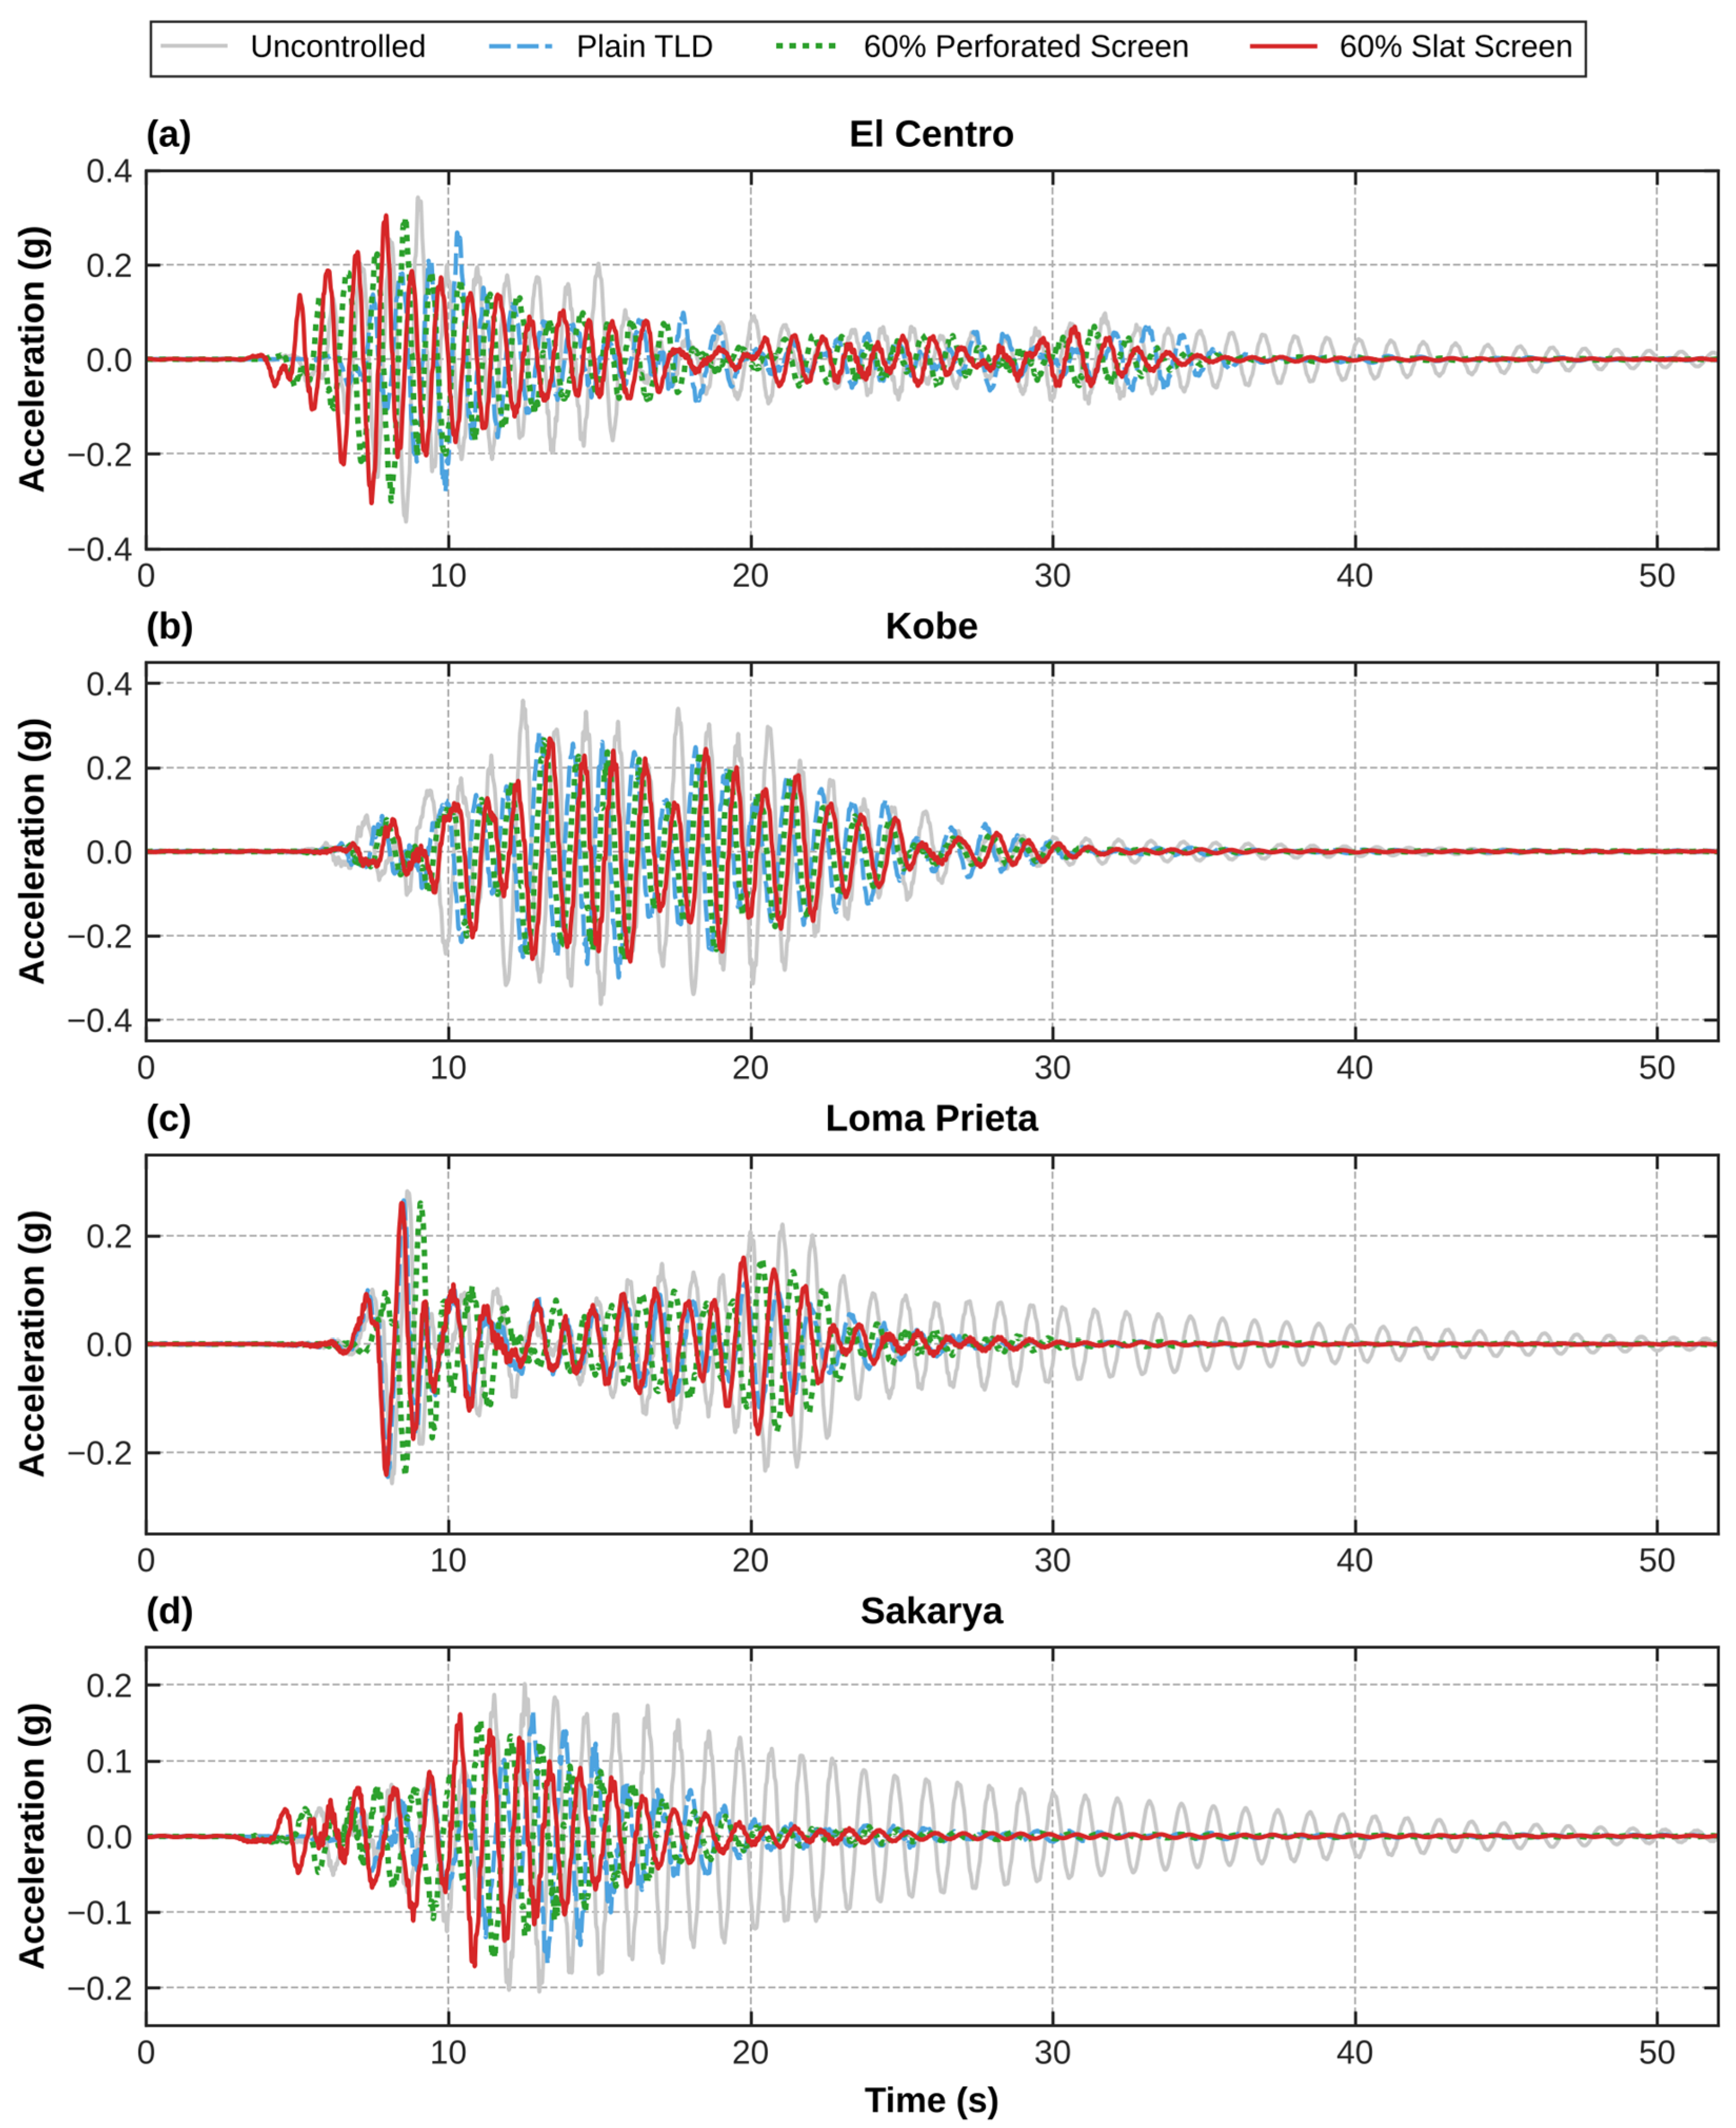
To examine the origin of the RMS reduction, roof acceleration time histories were examined. As shown in Figure 11, the time-history overlays reveal two distinct time-history phases: forced vibration mitigation during strong ground motion and structural stabilization during free vibration.
Figure 11.
Roof acceleration time histories of the uncontrolled structure, Plain TLD, 60% Perforated Screen TLD, and 60% Slat Screen TLD under scaled seismic excitations: (a) El Centro; (b) Kobe; (c) Loma Prieta; (d) Sakarya.
During the forced vibration phase, the liquid in the plain TLD (blue line) sloshes nonlinearly with wave breaking. In contrast, both the 60% perforated (green line) and 60% slat (red line) screen configurations suppress wave breaking and keep the sloshing closer to linear, achieving stable peak response reductions.
In the free-vibration phase after the input, the uncontrolled structure (gray line) continued to oscillate because of its low damping ratio (1.37%), whereas all TLDs reduced the residual vibration strongly. Over 15 structural periods after the end of the input (about 10 s for Kobe), the residual RMS response was 63–96% lower than that of the uncontrolled structure (Table 6). In this phase, the residual RMS values of the plain TLD (1.4–3.5 milli-g) and of the screen-equipped TLDs (0.8–4.2 milli-g) were of the same order as the noise level of the measurement; therefore, the tests did not show a consistent difference between them.
3.2.3. Sensitivity Analysis: Effect of Water Depth and Detuning on Mitigation Performance
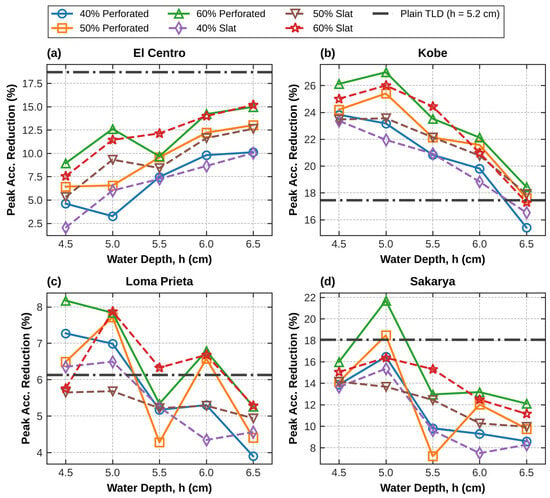
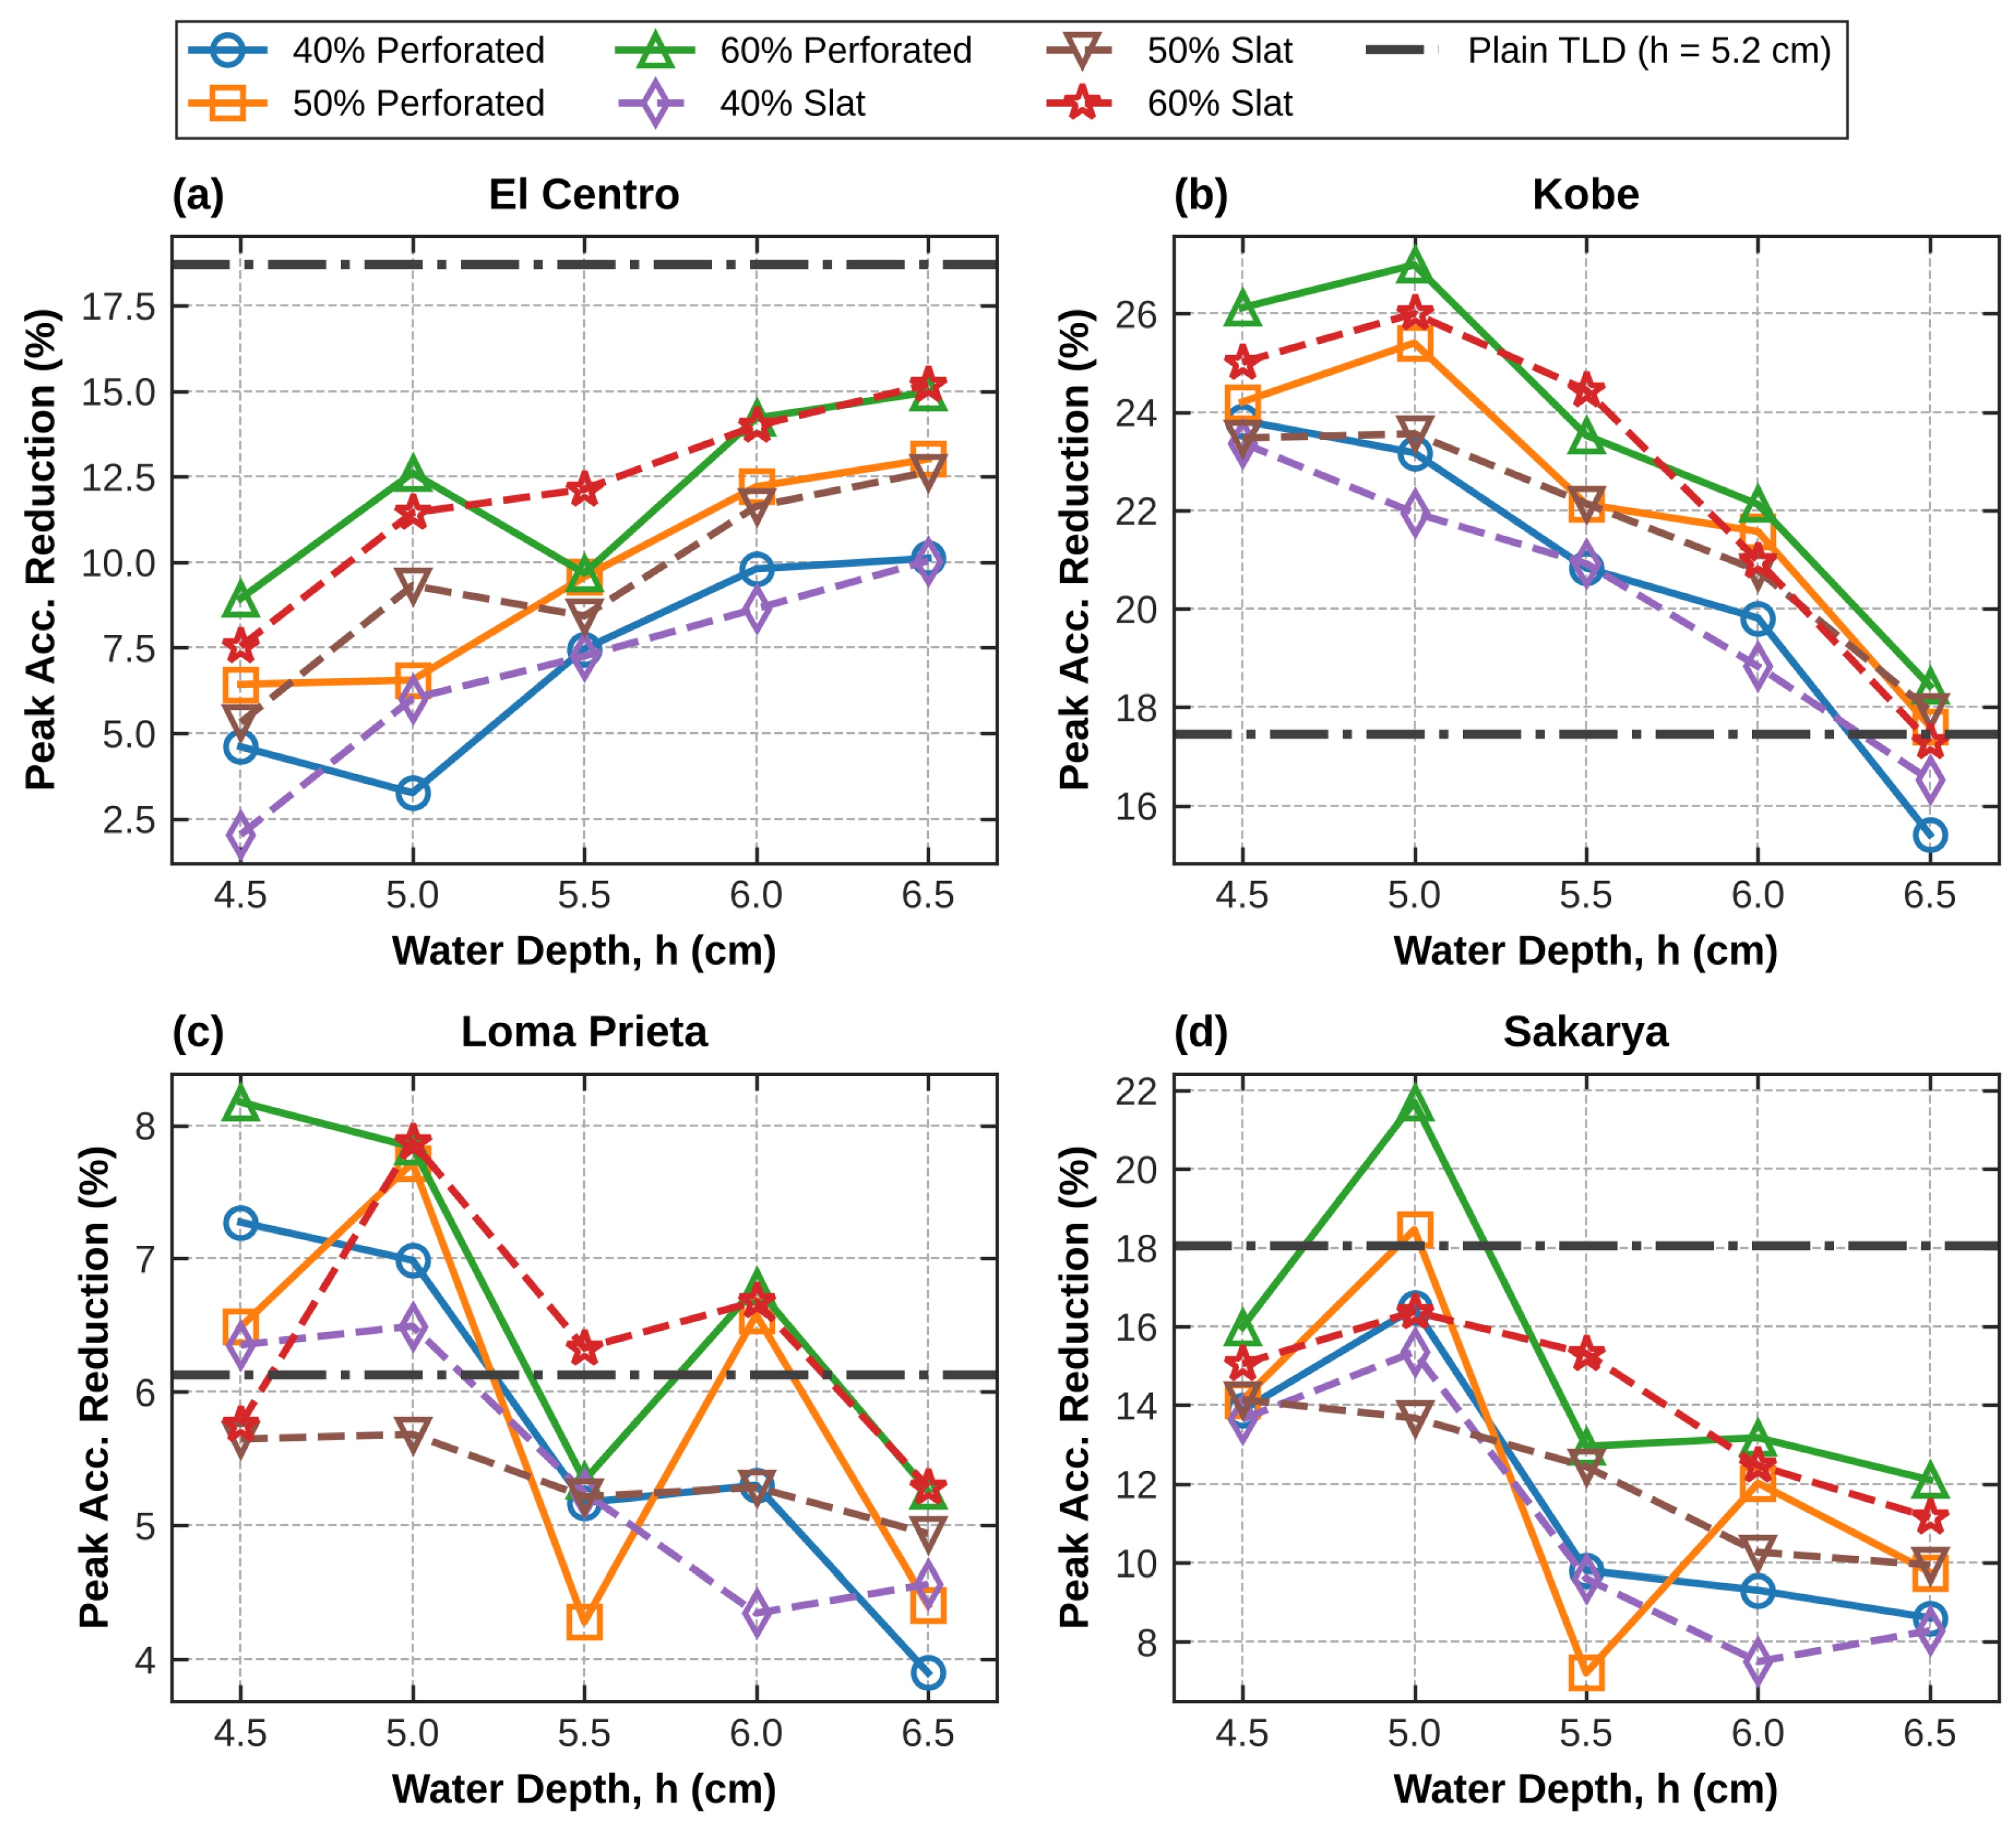
The efficiency of the TLD depends on the sloshing frequency of the fluid, which is governed by the water depth (h). To investigate the tuning sensitivity and detuning effects of the screen-equipped configurations, dynamic tests were carried out across fluid depths ranging from 4.5 cm to 6.5 cm with an increment of 0.5 cm. The absolute peak acceleration reduction percentages with respect to the water depth are plotted in Figure 12 for each seismic record. The plain TLD was tested only at the design depth of 5.2 cm; its result is shown in Figure 12 as a horizontal reference line and is not a measurement at the other depths.
Figure 12.
Effect of water depth on peak acceleration reduction for plain and screen-equipped TLDs under scaled seismic excitations: (a) El Centro; (b) Kobe; (c) Loma Prieta; (d) Sakarya. The plain TLD was tested at 5.2 cm only (horizontal reference line).
The experimental data reveal a depth-dependent performance variation that correlates with the frequency content of the respective ground motions. Under the Kobe and Sakarya records, the best response among the tested depths was obtained at a water depth of 5.0 cm. At this depth, the 60% perforated and slat screens achieved the highest mitigation rates. However, a deviation from this depth by ±0.5 cm induces significant detuning. This detuning leads to a marked decline in the vibration mitigation performance.
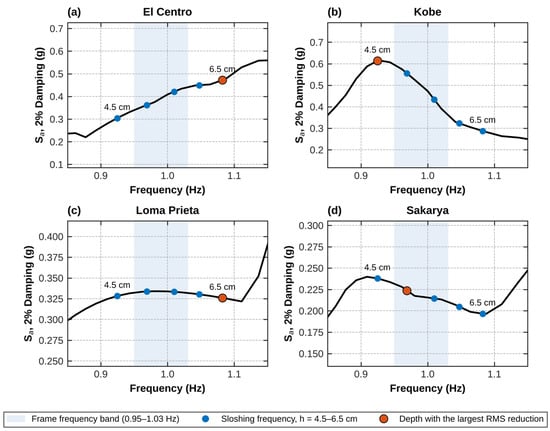
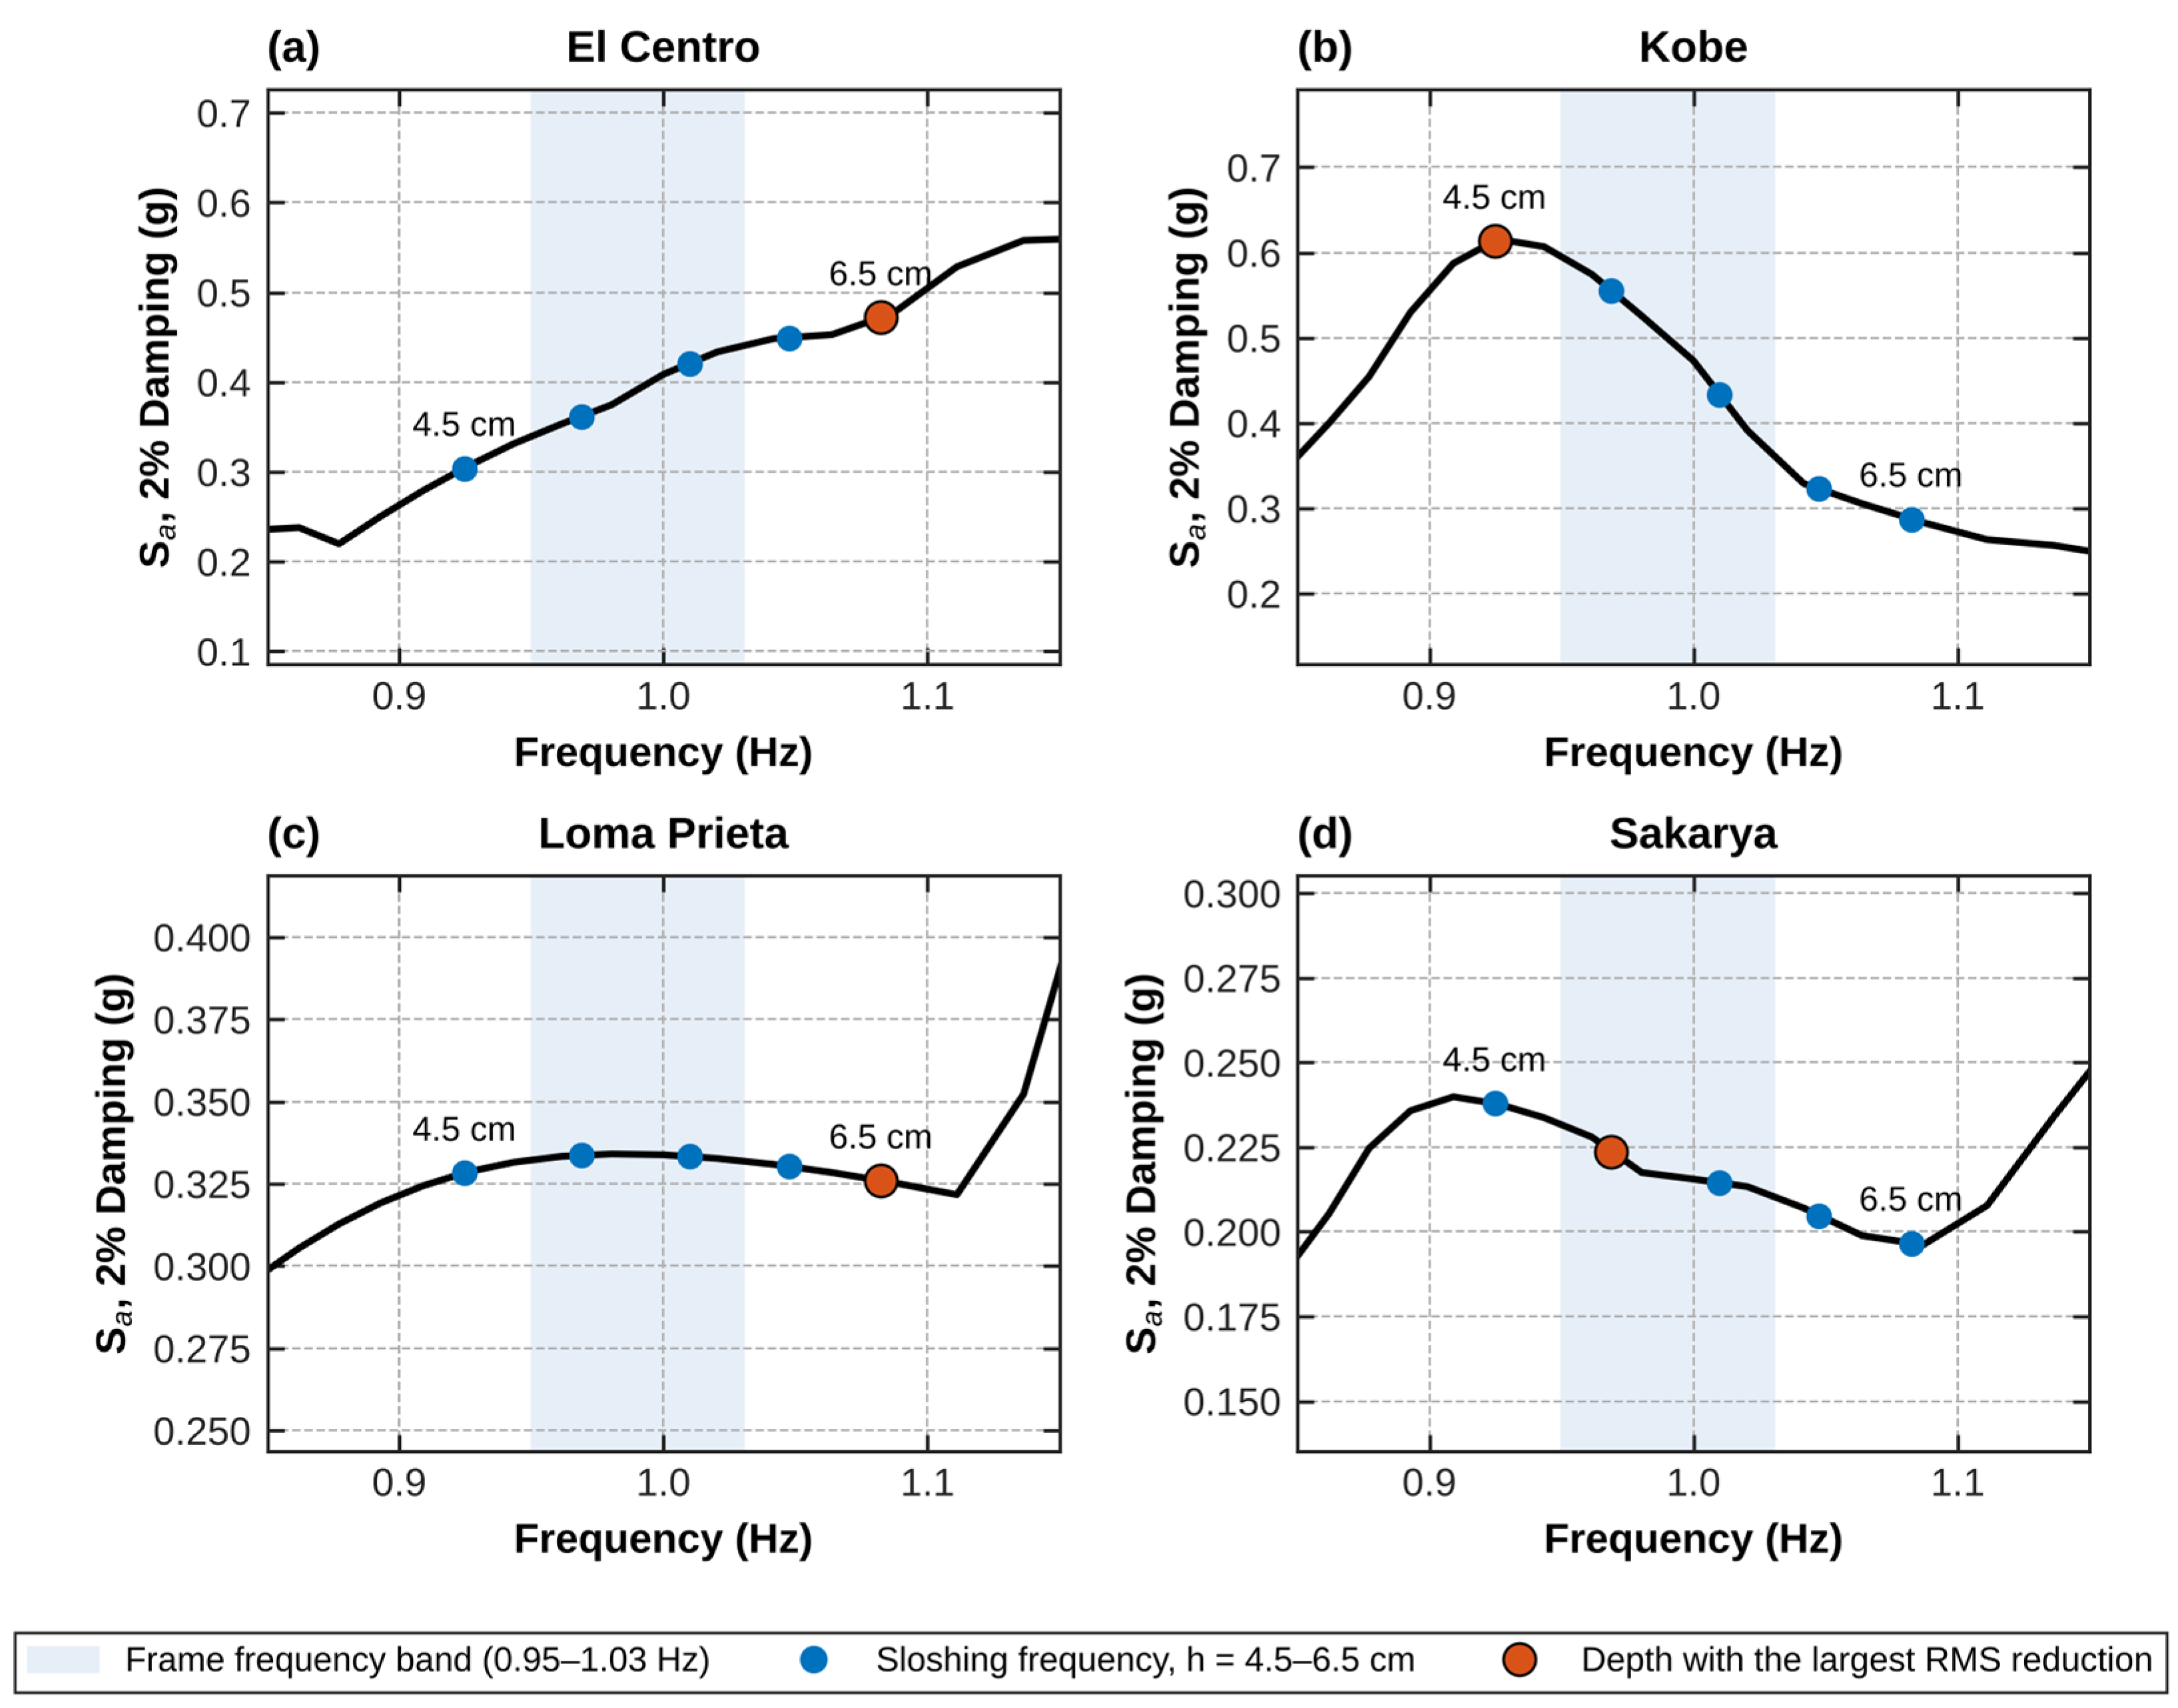
Conversely, the response under the El Centro excitation demonstrated different behavior. The spectral demand of the El Centro record at the structure’s natural period was relatively higher (Figure 10). Because the El Centro spectrum increases with frequency in the structural band (Figure 13), a higher sloshing frequency, i.e., a deeper water layer (6.5 cm), is favorable. Because 6.5 cm is the deepest tested level, the best depth for El Centro may lie beyond the tested range. Consequently, response mitigation under the El Centro record improved as the water depth increased.
Figure 13.
Response spectra (2% damping) of the scaled inputs near the frame frequency: (a) El Centro; (b) Kobe; (c) Loma Prieta; (d) Sakarya. The dots mark the linear sloshing frequencies of the tested depths (4.5–6.5 cm), and the large dot marks the depth giving the largest RMS reduction. The shaded band marks the frequency range of the frame (0.95–1.03 Hz).
The tested depths of 4.5–6.5 cm correspond to linear sloshing frequencies f2 = 0.93–1.08 Hz, i.e., f2/f0 = 0.89–1.04 for f0 = 1.04 Hz. Figure 13 shows the response spectra of the inputs in this frequency band together with the sloshing frequencies of the tested depths. The best depth follows the slope of the input spectrum around the frame frequency: the Kobe spectrum decreases strongly between 0.93 and 1.03 Hz (spectral ratio 1.69), favoring shallow water and a low sloshing frequency (4.5–5.0 cm), whereas the El Centro spectrum increases in this band (spectral ratio 0.71), favoring deeper water and a higher sloshing frequency (6.5 cm). Because the frequency of the frame itself varies with amplitude (Section 2.1), a single optimal depth does not exist for this structure; this is the situation of uncertain modal parameters discussed by Weber [32]. Increasing the depth also increases the sloshing mass, from m2 = 1.49 kg (μ = 3.7%) at 4.5 cm to 2.05 kg (μ = 5.1%) at 6.5 cm. The tests cannot separate this effect from the change in sloshing frequency. However, for a fixed tuning a larger mass ratio increases the attainable added damping ratio for any input, so the mass effect alone would favor the deepest level for every record, whereas the best depth differs between records (4.5–5.0 cm for Kobe and Sakarya, 6.5 cm for El Centro). This indicates that the tuning relative to the input spectrum dominates.
Across all evaluated water depths and seismic scenarios, the screen porosity ratio remained a key parameter for performance stability. Low-porosity screens (40%) consistently yielded lower reductions, consistent with the overdamping of the sloshing mode (Section 3.1.3). The 60% porosity configurations (both perforated and slat) gave the largest reductions among the screens at most depths. Because 60% is the highest tested porosity, it is the best tested value rather than the established optimum.
4. Conclusions
In this study, the mitigation performance of TLDs equipped with varying configurations of internal damping screens (perforated and slat) was experimentally investigated. The experimental study included both harmonic tests at fixed frequencies and shake table tests using four scaled historical ground motions (El Centro, Kobe, Loma Prieta, and Sakarya). Based on the experimental findings, the following conclusions can be drawn:
- •
- The harmonic tests showed that the apparent damping ratio of the structure–TLD system, identified from the free decay after each burst, increased with screen porosity (3.4–4.3% for perforated and 3.5–4.6% for slat screens) and was higher for slat than for perforated screens at every porosity. The plain TLD showed the highest apparent damping ratio (6.4%), whereas the 60% slat screen provided the largest reduction in the resonant peak (36.4%, compared to 32.9% for the plain TLD). All other screens gave smaller reductions in the resonant peak than the plain TLD.
- •
- The porosity ratio of the damping screens is critical for the TLD efficiency. Screens with a lower porosity (40%) resulted in the lowest added damping ratio. The equivalent mechanical model indicates that all tested screens overdamped the sloshing mode, most strongly at 40% porosity. The 60% porosity configurations (both perforated and slat) provided the best balance among the tested screens, linearizing the sloshing while giving the largest added damping ratio.
- •
- In the shake-table tests, TLDs with 60% porosity screens (water depth 5.0 cm) reduced the peak roof acceleration by up to 27.0% (perforated) and 26.0% (slat) under the Kobe record, compared with 17.5% for the plain TLD (5.2 cm). The RMS roof acceleration, an average measure of the response level over the record, was reduced by up to 49.0% under the Sakarya record, by both the 60% perforated screen and the plain TLD. Relative to the plain TLD, the screens improved the peak reduction only under the Kobe record; under El Centro, the plain TLD performed better, and under Loma Prieta and Sakarya, the differences were small.
- •
- All TLDs strongly reduced the residual free vibration after the strong ground motion (residual RMS 63–96% lower than for the uncontrolled structure). In this phase, the differences between the plain and screen-equipped TLDs were small and of the same order as the noise level of the measurement.
- •
- The best tested water depth depends on the frequency content of the seismic input. For the Kobe and Sakarya records, the best tested depth for the screen-equipped TLDs was 5.0 cm. However, under the El Centro excitation, the deepest tested level (6.5 cm), i.e., the highest sloshing frequency, gave the best results, because the El Centro spectrum increases with frequency around the frame frequency.
- •
- Harmonic tests were conducted only at the design depth of 5.2 cm, and the tuning sensitivity was assessed using seismic inputs only. Only three porosities (40%, 50%, and 60%) were tested; all of them overdamped the sloshing mode, so the optimum porosity, which is expected above 60% for this tank, was not bracketed experimentally. The seismic tests used four records, selected to give different spectral slopes around the frame frequency (Figure 13), and each configuration was tested once; a larger set of ground motions is needed to generalize the seismic results.
Within the tested configurations, the internal screens changed the sloshing of the shallow TLD from wave breaking to a more regular motion, and their effect on the structural response depended on the porosity and the input. The 60% screens provided the largest added damping ratio among the screens, while the screen-equipped TLDs outperformed the plain TLD only under some inputs. Because the frame was not a scaled model of a specific building, the results apply to the tested frame, tank, and excitation levels.
For a TLD of this type (μ = 4.2%, h/L ≈ 0.15), the results support tuning the water depth to f2/f0 ≈ 0.95–0.97, using the frame frequency at the expected response amplitude, and selecting screens that bring the damping ratio of the sloshing mode towards the optimum of about 10% without exceeding it; of the tested screens, the 60% slat screens are therefore recommended, and porosities above 60% should be examined. The interpretation of the screen effect in this study is based on the measured response and a linear equivalent mechanical model; the flow field around the screens was not measured. Computational fluid dynamics (CFD) modelling of the screened tank, with a validated two-phase model that includes wave breaking, is the natural next step to verify the flow mechanisms discussed in Section 3.1.
Author Contributions
A.B.: literature review, data curation, conceptualization, methodology, validation, investigation, writing—original draft, and writing—review and editing. Ö.A.: methodology, funding acquisition, investigation, formal analysis, data curation. All authors have read and agreed to the published version of the manuscript.
Funding
This research was funded by the Scientific and Technological Research Council of Türkiye (TÜBİTAK), grant number 1919B012004087.
Data Availability Statement
The data presented in this study are available on request from the corresponding author.
Acknowledgments
During the preparation of this manuscript, the authors used Claude (Opus 5.5, Anthropic) to assist with the preparation of the figures with Python scripts, and Paperpal (Cactus Communications) for language editing. The prompts used were requests to write Python (Matplotlib) scripts that plot the measured data. The authors have reviewed and edited the output and take full responsibility for the content of this publication.
Conflicts of Interest
The authors declare no conflicts of interest.
Abbreviations
The following abbreviations are used in this manuscript:
| TLD | Tuned Liquid Damper (sloshing type, also termed Tuned Sloshing Damper, TSD) |
| TLCD | Tuned Liquid Column Damper |
| TSD | Tuned Sloshing Damper |
| TMD | Tuned Mass Damper |
| FDD | Flow Damping Device |
| RMS | Root Mean Square |
| CFD | Computational Fluid Dynamics |
Appendix A. Equivalent Mechanical Model, H2 Optimization and Screen Dimensions
The coupled frame–TLD model in Section 2.2 has three degrees of freedom: the displacements of the intermediate floor (u1), roof (u2), and sloshing mass (u3), all relative to the base. Under the base acceleration ẍg, the equations of motion are M ü + C ü + K u = −M r ẍg, where r = [1 1 1]T. The mass matrix is M = diag(ma, mr + mt + mi, m2), with ma = 30.95 kg, mr = 12.02 kg, the tank mass mt = 1.10 kg, and mi and m2 from Equations (3) and (4). The stiffness matrix of the frame is the inverse of the flexibility matrix of the SAP2000 model, F = [0.482236 0.50725; 0.50725 0.557756] m/kN, multiplied by 0.944 so that the frame with the empty tank has f0 = 1.042 Hz, and k2 = m2ω22 (Equation (5)) connects the roof and the sloshing mass. The damping matrix of the frame is the Rayleigh matrix a0Mf + a1Kf of the frame with the empty tank (Mf = diag(30.95, 13.12) kg), with the measured damping ratio ζ0 = 1.37% in both of its modes (1.042 and 10.55 Hz; a0 = 0.1633 s−1, a1 = 3.764 × 10⁻⁴ s); c2 = 2ζ2m2ω2 connects the roof and sloshing mass. Table A1 lists the matrices at the design depth.
Table A1.
Matrices of the equivalent mechanical model at the design depth (h = 5.2 cm, ζ0 = 1.37%, ζ2 = 6%).
With the state vector x = [uT üT]T, the matrices in Equation (6) are A = [0 I; −M−1K −M−1C] and B = [0; −r]. For the displacement criterion, Cy = [0 1 0 0 0 0] selects the roof displacement relative to the base. For the acceleration criterion, the absolute roof acceleration is the second row of −M−1(K u + C ü), so Cy consists of the second rows of −M−1K and −M−1C, and no feedthrough term is required. The H2 norm (Equation (8)) was computed as (CyWcCyT)1/2, where Wc is the controllability Gramian, the solution of AWc + WcAT + BBT = 0. It was evaluated for h = 1.0–20.0 cm in steps of 1 mm, with mi, m2, k2, and c2 updated at each depth, and the depth with the smallest norm was taken as optimal (Figure A1). For ζ2 = 6%, the displacement criterion yields h = 5.2 cm (f2/f0 = 0.95) and the acceleration criterion yields h = 5.5 cm (f2/f0 = 0.97); at 5.2 cm, the acceleration norm is 1.6% above its minimum. For ζ2 = 0.5%, the optima are 4.5 cm (displacement) and 5.4 cm (acceleration). The dimensions of the screens are listed in Table A2.
Figure A1.
H2 norm of the roof relative displacement and of the absolute roof acceleration versus water depth, normalized by the minimum of each curve, for ζ2 = 6% and 0.5%. The dots mark the optima, and the dotted line marks the design depth of 5.2 cm.
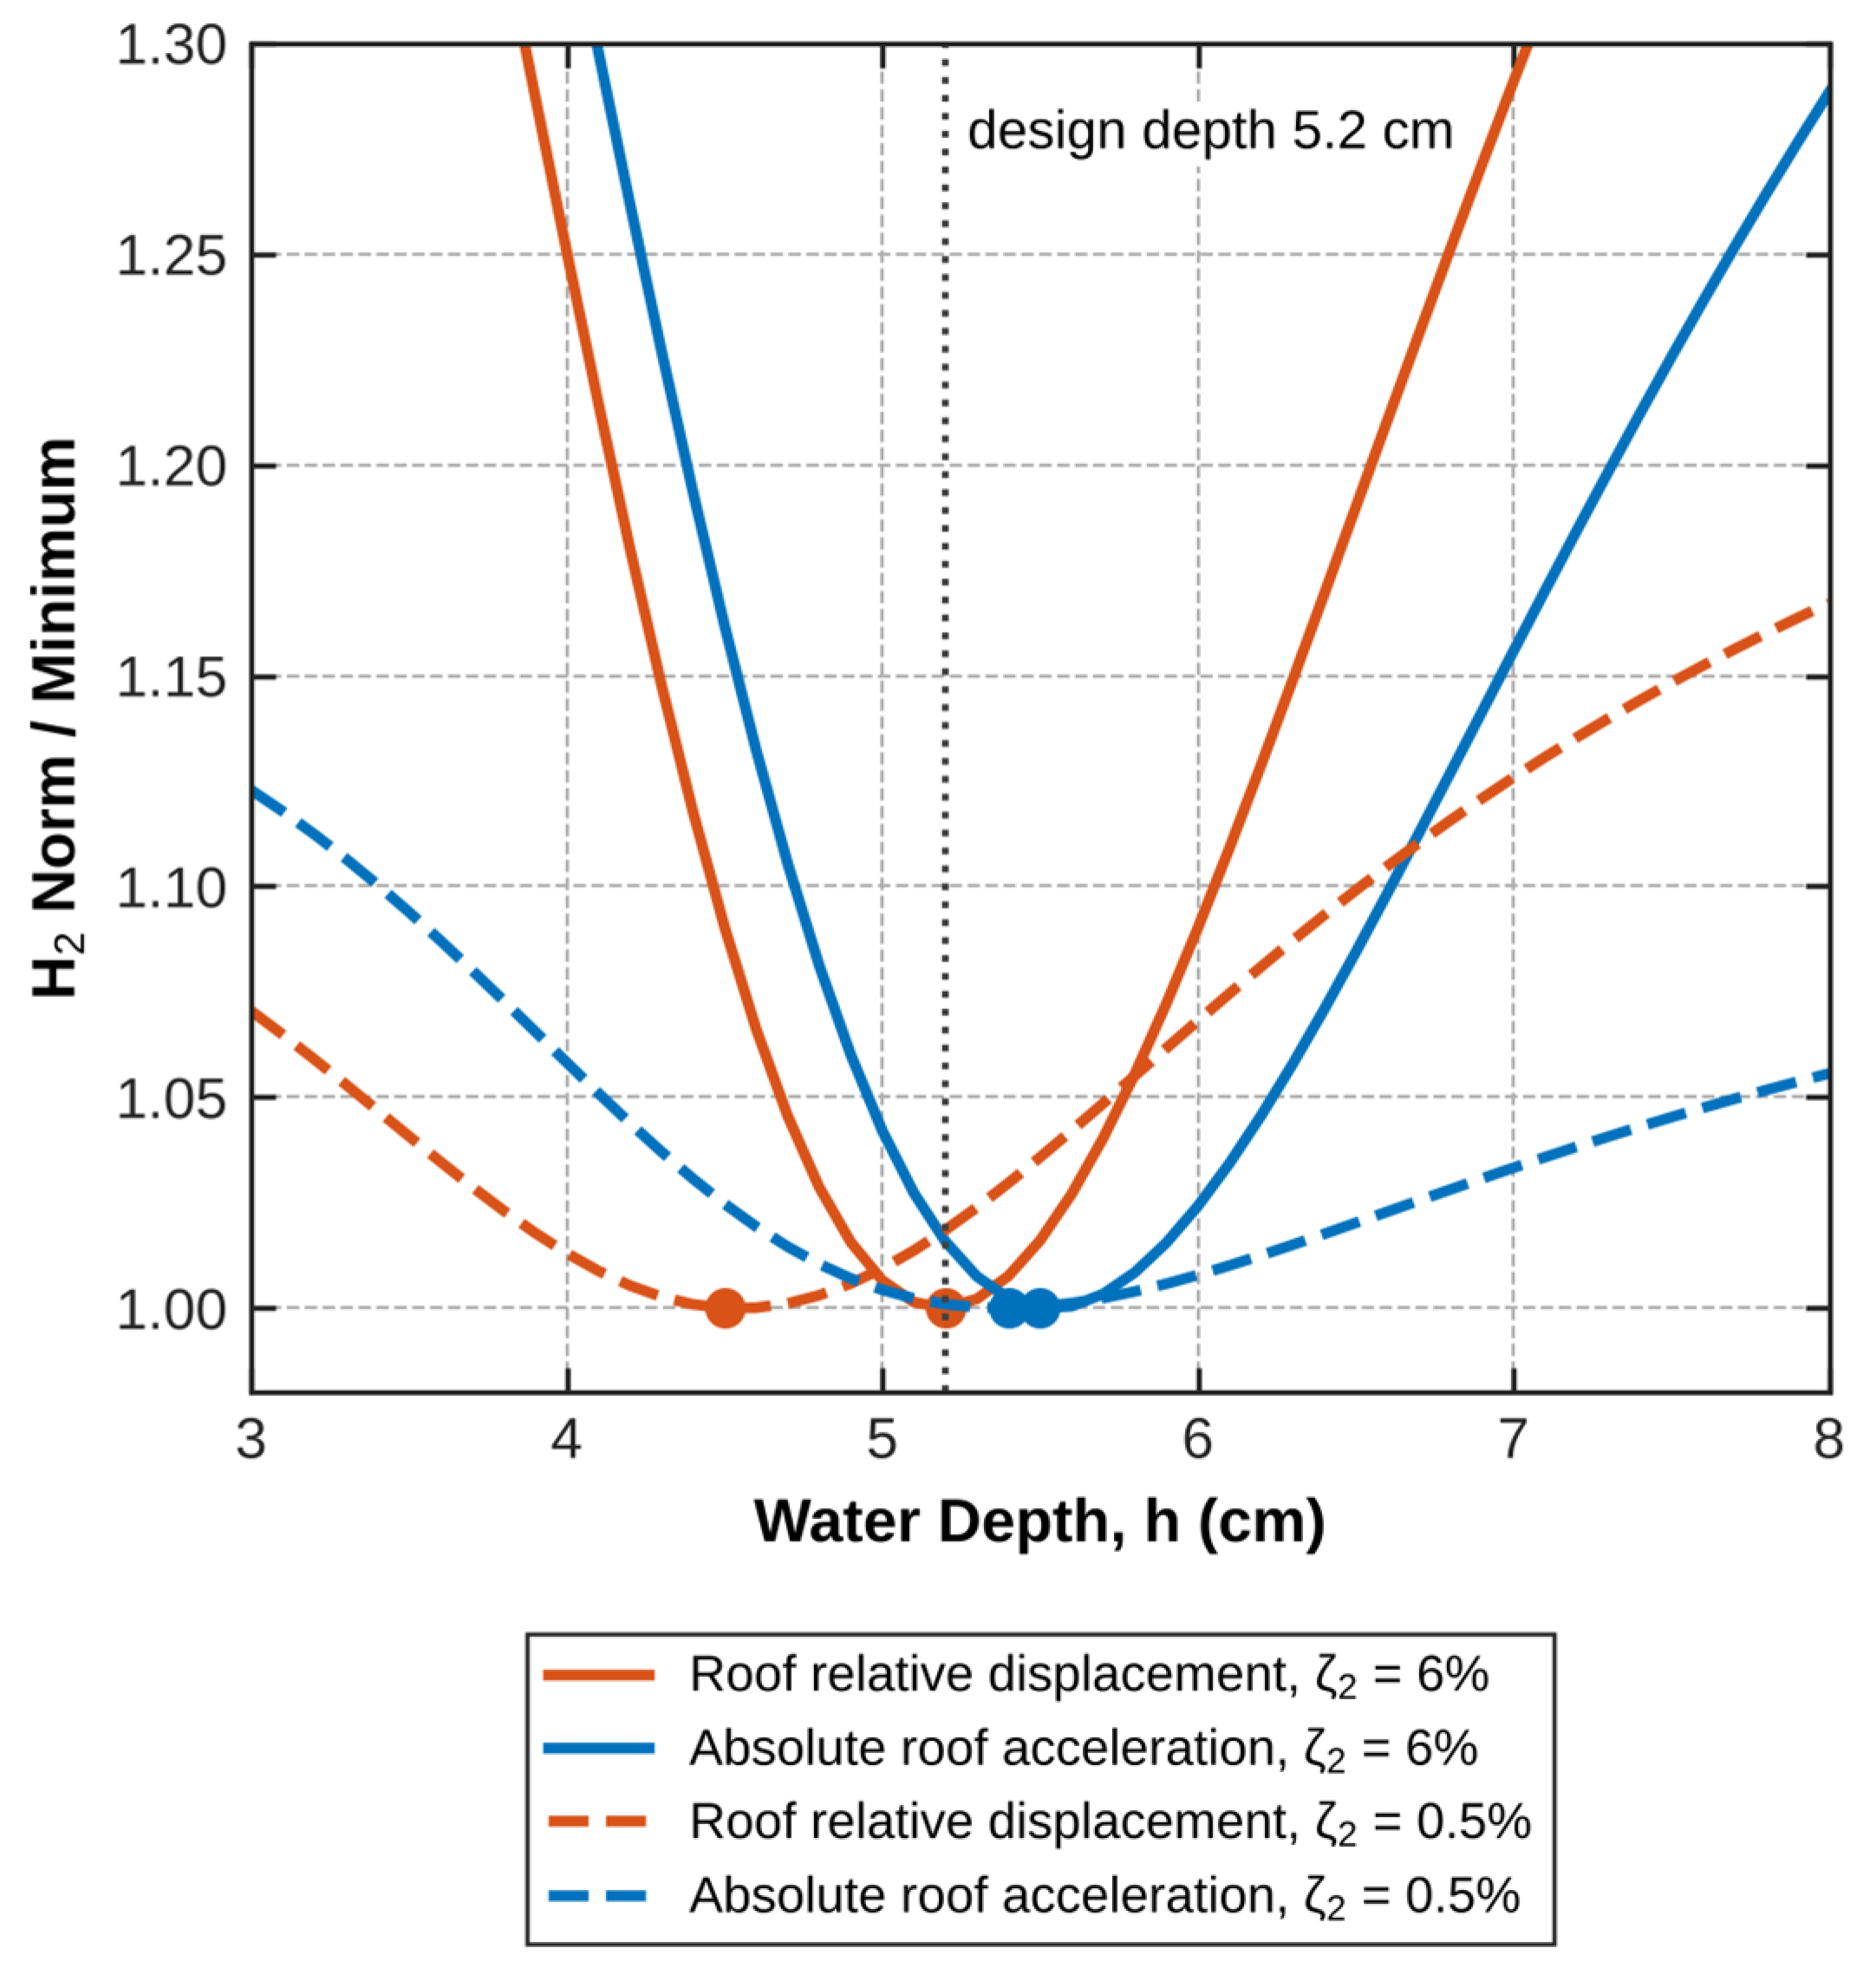
Table A2.
Dimensions of the flow damping screens (two identical screens per configuration). Spacing: center-to-center distance of the holes (horizontal × vertical) or vertical pitch of the slats. Porosity: nominal value, with the value computed from the dimensions in parentheses.
References
- Konar, T.; Dey Ghosh, A. Flow Damping Devices in Tuned Liquid Damper for Structural Vibration Control: A Review. Arch. Comput. Methods Eng. 2021, 28, 3323–3351. [Google Scholar] [CrossRef] [Scilit]
- Housner, G.W. Dynamic pressures on accelerated fluid containers. Bull. Seismol. Soc. Am. 1957, 47, 15–35. [Google Scholar] [CrossRef] [Scilit]
- Fujino, Y.; Sun, L.; Pacheco, B.M.; Chaiseri, P. Tuned Liquid Damper (TLD) for Suppressing Horizontal Motion of Structures. J. Eng. Mech. 1992, 118, 2017–2030. [Google Scholar] [CrossRef] [Scilit]
- Modi, V.J.; Welt, F. Suppression of flow-induced oscillations using sloshing liquid dampers. J. Wind Eng. Ind. Aerodyn. 1992, 40, 25–38. [Google Scholar]
- Tait, M.J.; El Damatty, A.A.; Isyumov, N.; Siddique, M.R. Numerical flow models to simulate tuned liquid dampers (TLD) with slat screens. J. Fluids Struct. 2005, 20, 1007–1023. [Google Scholar] [CrossRef] [Scilit]
- Tait, M.J.; Deng, X. The performance of structure-tuned liquid damper systems with different tank geometries. Struct. Control Health Monit. 2010, 17, 254–277. [Google Scholar]
- Halabian, A.M.; Torki, M. Numerical studies on the application of tuned liquid dampers with screens to control seismic response of structures. Struct. Des. Tall Spec. Build. 2011, 20, 121–150. [Google Scholar] [CrossRef] [Scilit]
- Cassolato, M.R.; Love, J.S.; Tait, M.J. Modelling of a tuned liquid damper with inclined damping screens. Struct. Control Health Monit. 2011, 18, 674–681. [Google Scholar] [CrossRef] [Scilit]
- Maravani, M.; Hamed, M.S. Numerical modeling of sloshing motion in a tuned liquid damper outfitted with a submerged slat screen. Int. J. Numer. Methods Fluids 2011, 65, 834–855. [Google Scholar] [CrossRef] [Scilit]
- Faltinsen, O.M.; Firoozkoohi, R.; Timokha, A.N. Analytical modeling of liquid sloshing in a two-dimensional rectangular tank with a slat screen. J. Eng. Math. 2011, 70, 93–109. [Google Scholar] [CrossRef] [Scilit]
- Crowley, S.; Porter, R. An analysis of screen arrangements for a tuned liquid damper. J. Fluids Struct. 2012, 34, 291–309. [Google Scholar] [CrossRef] [Scilit]
- Marivani, M.; Hamed, M.S. Evaluate pressure drop of slat screen in an oscillating fluid in a tuned liquid damper. Comput. Fluids 2017, 156, 384–401. [Google Scholar] [CrossRef] [Scilit]
- Sahaj, K.V.; Nasar, T.; Vijay, K.G. Experimental study on liquid sloshing with dual vertical porous baffles in a sway excited tank. Ocean Syst. Eng. 2021, 11, 353–371. [Google Scholar] [CrossRef]
- Zhou, Q.; Wang, L.; Zhang, X. Vibration control in high-rise buildings with tuned liquid dampers–Numerical simulation and engineering applications. Wind Struct. 2023, 36, 115–128. [Google Scholar]
- Xiao, C.; Wu, Z.; Chen, K.; Tang, Y.; Yan, Y. An experimental study on the equivalent nonlinear model for a large-sized tuned liquid damper. J. Build. Eng. 2023, 73, 106754. [Google Scholar] [CrossRef] [Scilit]
- Sun, H.D.; He, H.X.; Cheng, Y.; Cao, Q. Theoretical and experimental research on vibration control of the tuned liquid damper with damping net and sloped-bottom. J. Build. Eng. 2024, 81, 108170. [Google Scholar] [CrossRef] [Scilit]
- Pirner, M.; Urushadze, S. Liquid damper for suppressing horizontal and vertical motions—Parametric study. J. Wind Eng. Ind. Aerodyn. 2007, 95, 1329–1349. [Google Scholar] [CrossRef] [Scilit]
- Lee, C.; Lee, W.; Yoo, J.; Ha, D. Experimental study on damping ratio increases of circular TLDs with dampers. J. Earthq. Eng. Soc. Korea 2025, 29, 361–367. [Google Scholar] [CrossRef] [Scilit]
- McNamara, K.P.; Awad, B.N.; Tait, M.J.; Love, J.S. Incompressible smoothed particle hydrodynamics model of a rectangular tuned liquid damper containing screens. J. Fluids Struct. 2021, 103, 103295. [Google Scholar] [CrossRef] [Scilit]
- Ashasi Sorkhabi, A.; Qiu, B.; Mercan, O. Investigating large-scale tuned liquid dampers through real-time hybrid simulations. Buildings 2024, 14, 2017. [Google Scholar] [CrossRef] [Scilit]
- El Ouni, M.H.; Abdeddaim, M.; Elias, S.; Ben Kahla, N. Review of vibration control strategies of high-rise buildings. Sensors 2022, 22, 8581. [Google Scholar] [CrossRef] [Scilit] [PubMed]
- Tan, P.; Liu, Y.; Zhou, F.L.; Teng, J. Hybrid mass dampers for Canton Tower. CTBUH J. 2012, 1, 24–29. [Google Scholar]
- Liu, X.; Ding, Y.; Zhang, H.; Zhao, H.; Li, A. A novel brace-damper system for seismic response suppression of high-rise steel frame structures. J. Build. Eng. 2023, 72, 106655. [Google Scholar] [CrossRef] [Scilit]
- Kareem, A.; Kijewski, T.; Tamura, Y. Mitigation of motions of tall buildings with specific examples of recent applications. Wind Struct. 1999, 2, 201–251. [Google Scholar] [CrossRef] [Scilit]
- Vázquez-Greciano, A.; Aznar López, A.; Buratti, N.; Ortiz Herrera, J.M. Magnetic fields to enhance tuned liquid damper performance for vibration control: A review. Arch. Comput. Methods Eng. 2024, 31, 25–45. [Google Scholar] [CrossRef] [Scilit]
- Chopra, A.K. Dynamics of Structures: Theory and Applications to Earthquake Engineering, 3rd ed.; Prentice Hall: Upper Saddle River, NJ, USA, 2007. [Google Scholar]
- EN 1998-4:2006; Eurocode 8: Design of Structures for Earthquake Resistance—Part 4: Silos, Tanks and Pipelines. European Committee for Standardization (CEN): Brussels, Belgium, 2006.
- Asami, T.; Nishihara, O.; Baz, A.M. Analytical solutions to H∞ and H2 optimization of dynamic vibration absorbers attached to damped linear systems. J. Vib. Acoust. 2002, 124, 284–295. [Google Scholar] [CrossRef] [Scilit]
- Zhang, L.; Zhou, Z.; Xie, Z.; Zhang, L.; Huang, H. Damping performance evaluation of tuned liquid dampers for wind-induced vibration control of high-rise buildings. Wind Struct. 2026, 42, 1–21. [Google Scholar] [CrossRef]
- Love, J.S.; Haskett, T.C.; Morava, B. Effectiveness of dynamic vibration absorbers implemented in tall buildings. Eng. Struct. 2018, 176, 776–784. [Google Scholar] [CrossRef] [Scilit]
- Rathje, E.M.; Abrahamson, N.A.; Bray, J.D. Simplified frequency content estimates of earthquake ground motions. J. Geotech. Geoenviron. Eng. 1998, 124, 150–159. [Google Scholar] [CrossRef] [Scilit]
- Weber, F. TMD damping for structures with uncertain modal parameters. Appl. Sci. 2025, 15, 5619. [Google Scholar] [CrossRef] [Scilit]

Disclaimer/Publisher’s Note: The statements, opinions and data contained in all publications are solely those of the individual author(s) and contributor(s) and not of MDPI and/or the editor(s). MDPI and/or the editor(s) disclaim responsibility for any injury to people or property resulting from any ideas, methods, instructions or products referred to in the content. |
© 2026 by the authors. Licensee MDPI, Basel, Switzerland. This article is an open access article distributed under the terms and conditions of the Creative Commons Attribution (CC BY) license.