


Abstract
In the current paper, an investigation into the influence of the size effect on the shear strength of unreinforced concrete beams using a data-driven approach including statistical analysis, calibration, and prediction is carried out. The database consists of 804 test results collected from 41 sources and covers a wide range of effective depths (44–1670 mm), reinforcement ratios (0.26–15.23%) and shear span-to-depth ratios (0.39–9.76). The dependent variable was carefully validated and recalculated based on the maximum load to avoid transcription mistakes. As a result of the statistical analysis, biases and correlations were found between the effective depth and the reinforcement ratio, which lead to misinterpretation of the size effect in the univariate case. The calibration of Bazant’s Size Effect Law proved that the transitional size parameter (d0) varies from 90.1 mm to 1000 mm depending on the reinforcement ratio. To make a fair comparison of nominal to nominal, the formulation of ACI 318-19 included the size effect factor λ, while the partial safety factor γc was not included in Eurocode 2. It was found that both the codes are extremely conservative, with percentage bias (PBIAS) of −45.9% in the case of ACI, and −26.8% in the case of EC2. The suggested GPR model has yielded a very high R2 value of 0.713 and near- zero aggregate bias (PBIAS = −4.4%). With the help of statistical tests such as the Wilcoxon signed-rank test, it was proved that the GPR performs significantly better than ACI (p = 6.37 × 10⁻²¹) and Eurocode 2 (p = 4.95 × 10⁻⁷). Even though GPR under-predicts on aggregate (conservative), it offers a good 95% prediction interval (coverage of 90.6%). Thus, a safety factor of 1.05 is suggested. The results from a sensitivity analysis based on the random forest feature importance revealed that the most sensitive parameters are the a/d ratio and the a/d ratio by the size factor (kd), which contribute 24.1% and 12.2% to the total variance, respectively. The proposed approach will be very helpful in designing shear safely and economically.
1. Introduction
The problem of shear failure of RC beams lacking any transverse reinforcement (stirrups) is still considered one of the most difficult and important issues in the field of structural engineering. In contrast to flexural failure, which is generally ductile and characterized by cracking and deflection, shear failure is brittle and sudden, happening instantly without any prior notice [1]. That very peculiarity of shear failure has caused numerous investigations carried out during the last decades in order to understand the mechanism of shear transfer and the factors affecting shear capacity [1,2].
1.1. Shear Transfer Mechanisms
Shear capacity of RC beams without transverse reinforcements can be described by several internal processes operating simultaneously at the ultimate stage of behavior. They are as follows: (i) the shear capacity of the compression zone made of uncracked concrete; (ii) aggregate interlock within faces of diagonal cracks; (iii) the dowel action of longitudinal reinforcement; and (iv) residual tensile stress of concrete across cracked areas [3,4]. Among them, the latter two processes are considered the most effective [3,4]. In recent research, the following values were determined: concrete compression takes 49% of total shear capacity in beams without shear reinforcement, whereas aggregate interlock takes 44.5% of it [4]. Nevertheless, the role of every single process is different depending on shear span-depth ratio (a/d), reinforcement ratio (ρ), and beam depth (d) [4,5,6].
Activation of various shear force transfer mechanisms strongly depends on the slenderness ratio of the member and the transition between beam and arch action [7]. Current studies reveal that the shear force transfer behavior of deep beams is very complex considering the size and openings in the beam [8]. The main shear force transfer mechanism at peak load is the aggregate interlock for beams with relatively large shear-span ratio. It has been proven through current research that the aggregate interlock becomes most effective at about 0.9 Pu (Pu is the peak load).
1.2. The Size Effect in Shear
Size effect, which implies that the failure nominal shear stress decreases with increasing depth of the beam, is one of the key aspects of the shear performance of unreinforced concrete beams [1,9]. In particular, the size effect is especially significant in the case of large and weakly reinforced concrete beams and can lead to a decrease in the nominal shear strength [1]. In the framework of the shear problem, the size effect is believed to be caused by the quasi-brittle behavior of concrete.
The energetic Size Effect Law (SEL Type II) by Bažant has been widely applied to this issue, and many studies have demonstrated a definite deterministic size effect, which results in the reduction of the nominal shear stress in terms of an increase in the effective depth [10,11,12,13]. The size effect law for the nominal strength of geometrically similar structures made of quasibrittle material and failing due to stable crack propagation gives the theoretical basis of the process of shear failure [14]. Nonetheless, the scope of the size effect and its correlation with other factors, such as the longitudinal reinforcement ratio, concrete compressive strength, and shear span/depth ratio, are still open questions. Modern research has demonstrated that the impact of compressive strength is not as important as that of the reinforcement ratio and member depth [15]. Experimental studies have proven that the failure mechanism of beams without stirrups is influenced by the size of the beams, where large beams tend to show brittle behavior [16]. It was found that for reinforced concrete deep beams which are geometrically similar, the nominal shear strength decreases by about 41% when the depth of the beam varies from 300 mm to 900 mm [17].
1.3. Code Provisions and Their Limitations
Design codes currently employ different ways of taking into consideration the shear capacity of elements without stirrups. The ACI 318 Building Code, for instance, traditionally employed an empirically developed formula that did not incorporate any size effect nor the influence of the ratio of the longitudinal reinforcement. It was found out that the provisions of the ACI-DAfStb database could be unconservative in relation to large, lightly reinforced elements [18]. The ACI 318-19 code made major revisions to the provisions of the code for the first time after 1963, including the consideration of size effect and longitudinal reinforcement [19,20]. Despite the fact that the code became more accurate and safer than previous versions, there is still a problem of unconservativeness of ACI provisions [20].
ACI 318-19 takes into account the shortcomings of the widely used Vc = 0.17λ√(f’c)bwd equation, including such issues as size effect and the impact of longitudinal reinforcement ratio [20,21]. Eurocode 2 (EN 1992-1-1:2023) takes into account the size effect using the coefficient k = 1 + √(200/d), making the expected shear resistance higher for smaller sections and lower for larger sections [15,22]. The publication of EN1992-1-1:2023 represents a considerable step forward in terms of the requirements of the provisions concerning the design of concrete structures, among many other aspects related to shear resistance of concrete sections without shear reinforcement [22]. The second generation of Eurocode 2 has included formulations using physical models that are general enough to evaluate existing buildings and can be simplified for new buildings [23]. It has recently been proven that the 2023 edition of Eurocode 2 gives better results when compared to the 2005 edition in terms of agreement with experimental data and lesser scatter [15]. The fib Model Code provides various levels of approximation (LoA), and in general, LoA2 is the most accurate level [15]. Nevertheless, an extensive analysis of these provisions using experimental data shows that none of these codes provide good estimates for shear capacity for the entire range of member dimensions, reinforcement ratio, and concrete strengths [15].
1.4. The Need for Advanced Predictive Models
The constraints associated with the empirical as well as semi-empirical methods, together with the non-linear interactions among the governing factors, have led to the investigation of new modeling procedures. In recent years, machine learning techniques have shown great promise in the estimation of the shear strength of RC beams without stirrups [24,25]. The utilization of the ANN approach has been found quite effective in studying the characteristics of reinforced concrete structures, especially the deep beams and beams with openings [24,25]. Such models can take into account the non-linear characteristics that cannot be captured through the usual regression-type equations [4,26,27]. One of the most important issues in this context is the variability of the experimental shear data.
Gaussian Process Regression (GPR) has proved to be the most promising as a result of its capability to give not only predictions but also their uncertainties [28,29]. Contrary to purely data-driven models, GPR can be trained based on physical properties that arise from well-established mechanical theories and codes. This method is based on the idea of combining the physical properties of the problem together with the advantages of the machine learning algorithms [30]. Recent research has shown that GPR gives the best results in comparison to other machine learning algorithms [31].
1.5. Research Objectives and Contributions
The present study adds to this existing literature through the creation of a database of shear testing of RC beams without stirrups, conducting a detailed statistical and mechanistic analysis of this dataset, and formulating a combined predictive model for the behavior of such members. The aims of this study are fourfold:
- Identification and quantification of biases and covariate interaction effects in the available experimental database.
- Examination of the performance of the currently available design code provisions (ACI 318-19 and EC2) in relation to the database assembled, especially in terms of bias (PBIAS) rather than prediction accuracy alone.
- Development of a physics-informed GPR model using 12 engineered features that produce accurate, unbiased predictions with uncertainty.
- Formulation of a design equation based on the physics-informed features as an alternative to the currently available code provisions.
One of the major contributions of the current study is the focus on reliable model assessment using hold-out validation and statistical analysis, knowing the fact that there is some natural variation within shear test data (Coefficient of Variation = 54%), making it impossible to have R2 above a certain point. In this regard, an R2 of 0.713 can be seen as excellent because the model covers roughly 75% of the total explainable variance (). As seen from Cavagnis et al. [32], the natural variability in the shear test data normally results in coefficients of variation of 30% and 60%. In this regard, an R2 value of 0.10 and 0.25 can be taken as an indication of model predictive ability tested by means of hold-out validation using a sufficiently large database.
2. Experimental Database
In the current study, an exhaustive experimental database has been compiled consisting of 804 valid test results of simply supported reinforced concrete beams not having any transverse reinforcement that failed in shear. This database has been collected from 41 different experimental studies carried out in the international literature over a period of more than six decades (from 1953 to 2026). The requirements for including a study in the database are as follows: (i) Rectangular section beams; (ii) Lack of shear reinforcement (stirrups) in the whole span; (iii) Simply supported beams with either two-point or single-point loading; (iv) Failure mode identified as diagonal tension or shear-compression; and (v) Complete information available on all necessary parameters (effective depth d, width of beam bw, shear span a, reinforcement ratio ρ, concrete strength fc, and experimental shear strength vexp).
Initially, the database consisted of 851 specimens. In the process of data validation, the dependent variable (vexp) was recalculated using the ultimate shear force (Vmax) divided by the cross-sectional area (bw ⋅ d). A geometric consistency filter (d < h) was used; 26 records were filtered where the stated effective depth was greater than total depth of the section (lines 606–607 and 724–747 from raw collection), which is physically impossible for rectangular RC sections and was caused by data entry mistakes from the source database. Afterward, 21 outliers were filtered out using the Z-score criterion (∣Z∣ > 3), giving a total of 804 specimens, forming one of the biggest and the most varied shear test databases available for testing the shear capacity of non-stirruped beams. The parameter distribution is shown in Table 1 below. In this database, effective depth varied between 44 mm and 1670 mm, compressive strength of concrete between 12.2 MPa and 110.9 MPa, ratio of longitudinal reinforcement between 0.26% and 15.23%, and the ratio of shear span to depth (a/d) between 0.39 and 9.76. The experimental shear strength vexp varied between 0.45 MPa and 11.86 MPa.
Table 1.
Range and statistical summary of the experimental database.
The main source databases have been developed based on the full-scale database of Reineck et al. [18] (ACI-DAFStb database), Kani’s [6], Leonhardt’s [30], Ghannoum’s [31], and Mphonde’s [33] experimental programs, as well as the more recent research work of Adamu et al. [4] and Girotto et al. [12]. The ACI-DAFStb database, which included 439 shear test results obtained in 2003, was significantly enlarged in recent years to contain 784 tests that can be used for the assessment of shear design provisions [18]. Data have been additionally collected from the papers of Bazant and Pfeiffer [2], Carmona and Ruiz [1], Mofidi et al. [19], and many other authors, as can be seen in the references.
3. Methodology
The methodology used in this research is designed to effectively uncouple the relationships between all the factors that govern the shear strength. A multiple-level analysis strategy was applied, utilizing both classic statistical methods, mechanistic modeling, regression analysis, and code analysis to adequately analyze the database obtained from experiments.
3.1. Data Preprocessing and Outlier Detection
Prior to any statistical calculations, the assembled database underwent a thorough process of data preprocessing. Duplicates were found and discarded, as well as missing values. The geometric consistency filter (d < h) was next used to discard 26 observations where the value of the effective depth turned out to be greater than the total depth of the section (observations 606–607 and 724–747 from the initial compilation). These observations are physically impossible for the considered rectangular RC sections and were the result of a transcription error from the source database; the removal of such observations is necessary because d is used both in the dependent variable (Vexp = Vmax/(bw·d)) and in the size effect predictor variables (kd, d/1000, log d). After the application of this filter, all other anomalies were identified using the Z-score criterion (|Z| > 3), and 21 observations were discarded. Therefore, 804 observations remained.
3.2. Statistical Calibration of the Bažant Size Effect Law
In order to measure the extent of size effect and dependence on longitudinal reinforcement ratio, Bažant’s Size Effect Law (SEL Type II), which is well known, was used for calibration based on experimental results [1]. The SEL equation is written as follows:
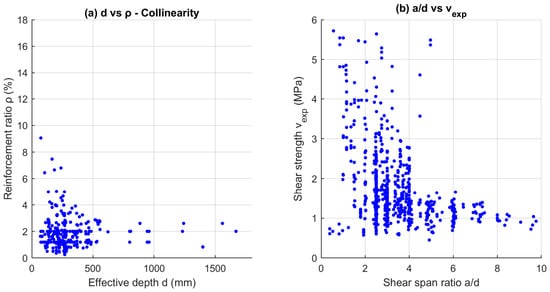
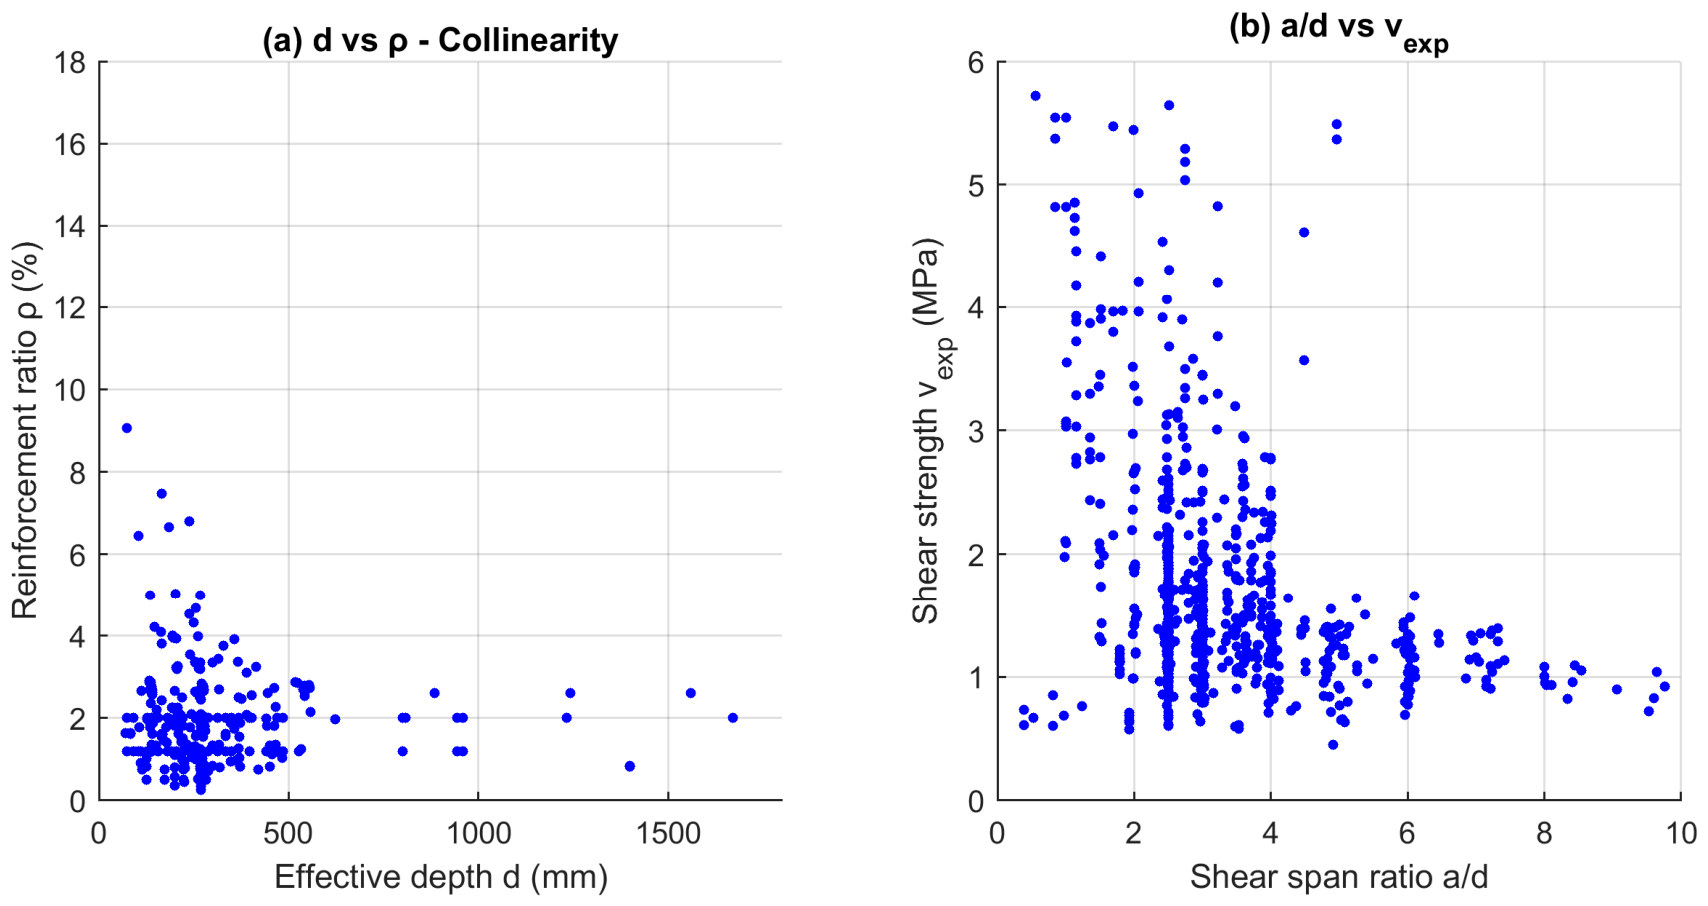
where v is the nominal shear strength, v0 is the asymptotic strength for infinitesimal elements, and d0 is the transitional size factor. Calibration was performed using a nonlinear least-squares optimization procedure. To determine the effect of longitudinal reinforcement on this size effect model, three sets of calibrations were performed for (i) all data together; (ii) data for specimens with low reinforcement ratio (ρ < 1.5%); and (iii) data for specimens with high reinforcement ratio (ρ ≥ 1.5%). The cut-off ratio of 1.5% was considered taking into account the median value of reinforcement ratio in the database (1.69%) and the distribution pattern of the data, which divides naturally at this point (refer to Figure 1).
Figure 1.
Data Bias Detection.
3.3. Code Provisions Evaluation
The ACI 318-19 approach was compared against the Eurocode formulation on a purely nominal-to-nominal basis without the inclusion of any design safety factors. The ACI 318-19 approach involved the size effect factor:
The partial safety factor γc = 1.5 was not considered in Eurocode 2, and the nominal resistance was determined from Equation (3):
where the size factor is
and the effective reinforcement ratio is ρeff = min(ρ, /1000.02), bounded by 2.0%. The lower bound of
was also applied, as per EN 1992-1-1:2023 [15,22,23].
3.4. Physics-Guided Gaussian Process Regression (GPR)
For making accurate predictions along with estimation of uncertainty and bias assessment, a physics-informed Gaussian Process Regression (GPR) model was proposed. Gaussian Process Regression is a non-parametric Bayesian method that can not only predict a point value but also estimate its uncertainty [28,29]. In contrast to the data-based approach, this GPR model was driven by physical insights obtained from mechanical theory and codes.
3.4.1. Feature Engineering
Considering the mechanics behind the shear strength and formulations, five base physical characteristics were chosen on mechanical grounds: (concrete compressive strength), kd (size effect factor), ρeff (effective reinforcement ratio), a/d (shear span-to-depth ratio), and d/1000 (normalized effective depth).
In order to incorporate the complex non-linear interactions between these parameters and increase the predictive accuracy of the model, the five base features were carefully engineered to become 12 features. This process includes using logarithmic transforms for handling skewed distribution and physics-based interactions. The entire list of 12 features along with their definitions can be found in Table 2.
Table 2.
Engineered features used as inputs for the GPR mode.
3.4.2. GPR Model Formulation
The Gaussian process is completely defined by the mean function and the covariance function (or kernel).
Given a training set of n examples {(xi, yi)}, the predictive distribution for a new example x* is a Gaussian with the mean:
and variance:
where k(x*, x*) is the n × n covariance matrix, represents the noise variance, and I represents the identity matrix.
3.4.3. Training and Validation
A single hold-out validation (80/20 split) was employed to ensure an unbiased model performance evaluation. The final dataset (N = 804) was randomly divided into a training set (N = 644) and a test set (N = 160). The model was trained exclusively on the training set, and all performance metrics reported in this study are based on predictions for the unseen test set.
The current study employs Matérn 5/2 kernel with ARD (Automatic Relevance Determination) defined as
where represents the signal variance, the length-scale parameter, and r the Euclidean distance between the two points. The GPR hyperparameters have been optimized through Bayesian Optimization for 100 iterations by minimizing the negative log marginal likelihood function. The Matérn 5/2 kernel was selected for its superior performance compared to the squared exponential kernel when dealing with engineering data [28].
3.4.4. Performance Metrics
The performance of the model was analyzed based on
Coefficient of Determination (R2):
Root Mean Square Error (RMSE):
Mean Absolute Error (MAE):
Mean Absolute Percentage Error (MAPE):
Percentage Bias (PBIAS):
PBIAS is an important parameter used for determining safety. If the value of PBIAS is negative, it means that there is under-prediction (this is conservative and therefore safe). On the other hand, if it is positive, there is over-prediction (it is unconservative and may be unsafe). The fraction of unsafe predictions (UnsafeFrac = mean(pred > obs)) is determined for each model.
3.5. Statistical Significance Testing
In order to find out if there are any statistically significant differences between the predictions of the GPR model and code provisions, the Wilcoxon signed-rank test was used for the absolute errors of the three models. This test is suitable when there are paired data, and the error distribution does not have to be normally distributed. The null hypothesis is that the median difference of paired absolute errors is zero.
3.6. Stratified Bias Analysis
To find out when the codes do not work well and when the GPR model performs best, a stratified analysis was conducted using the following six subgroups of the data:
- All Data (n = 804)
- Shallow beams (d < 300 mm, n = 610)
- Deep beams (d ≥ 500 mm, n = 18)
- Low reinforcement ratio (ρ < 1.5%, n = 271)
- High reinforcement ratio (ρ ≥ 1.5%, n = 533)
- Medium-depth beams (300 ≤ d < 500 mm, n = 176)
For each stratum, Percentage Bias (PBIAS) was determined for ACI 318-19, EC2, and the developed GPR model.
4. Results
4.1. Characterization of the Experimental Database and Detection of Data Bias
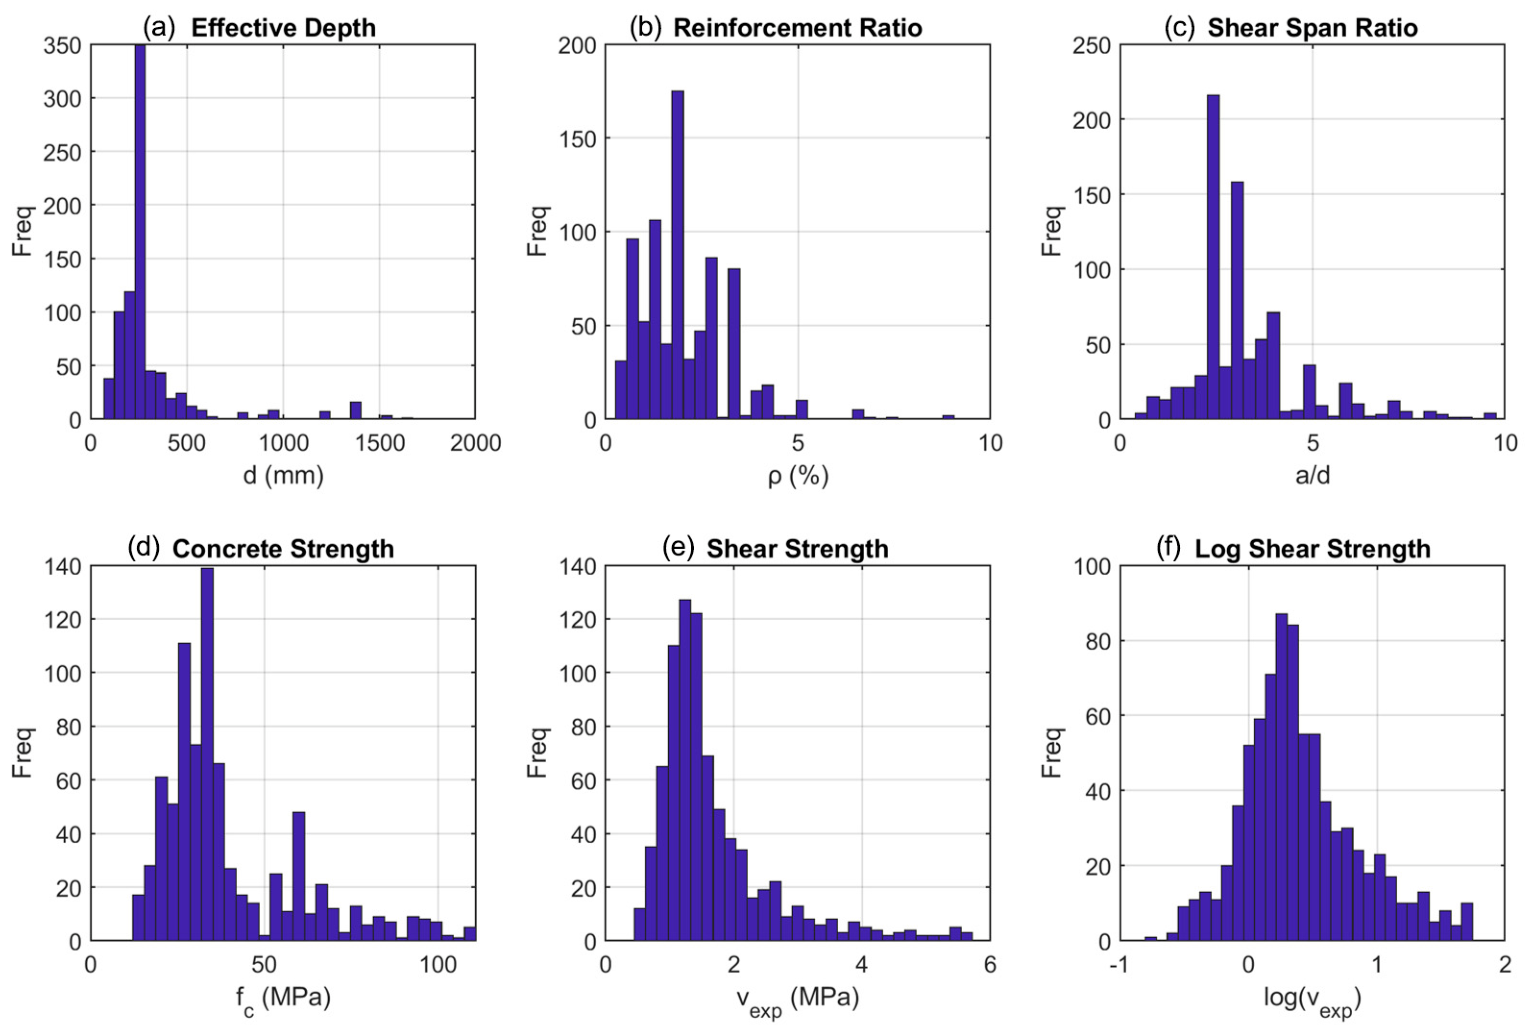
As can be seen from Figure 1, there is significant clustering of the data, in which most specimens occur below 200 mm of depth, and the existence of collinearity between depth and reinforcement ratio. The smaller the specimen, the higher the ρ (typically between 1.5% and 2.5%), and the larger the specimen, the lower the ρ (usually below 1.5%).
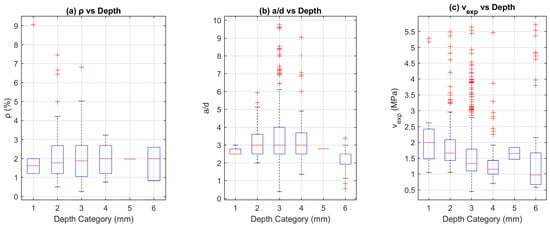
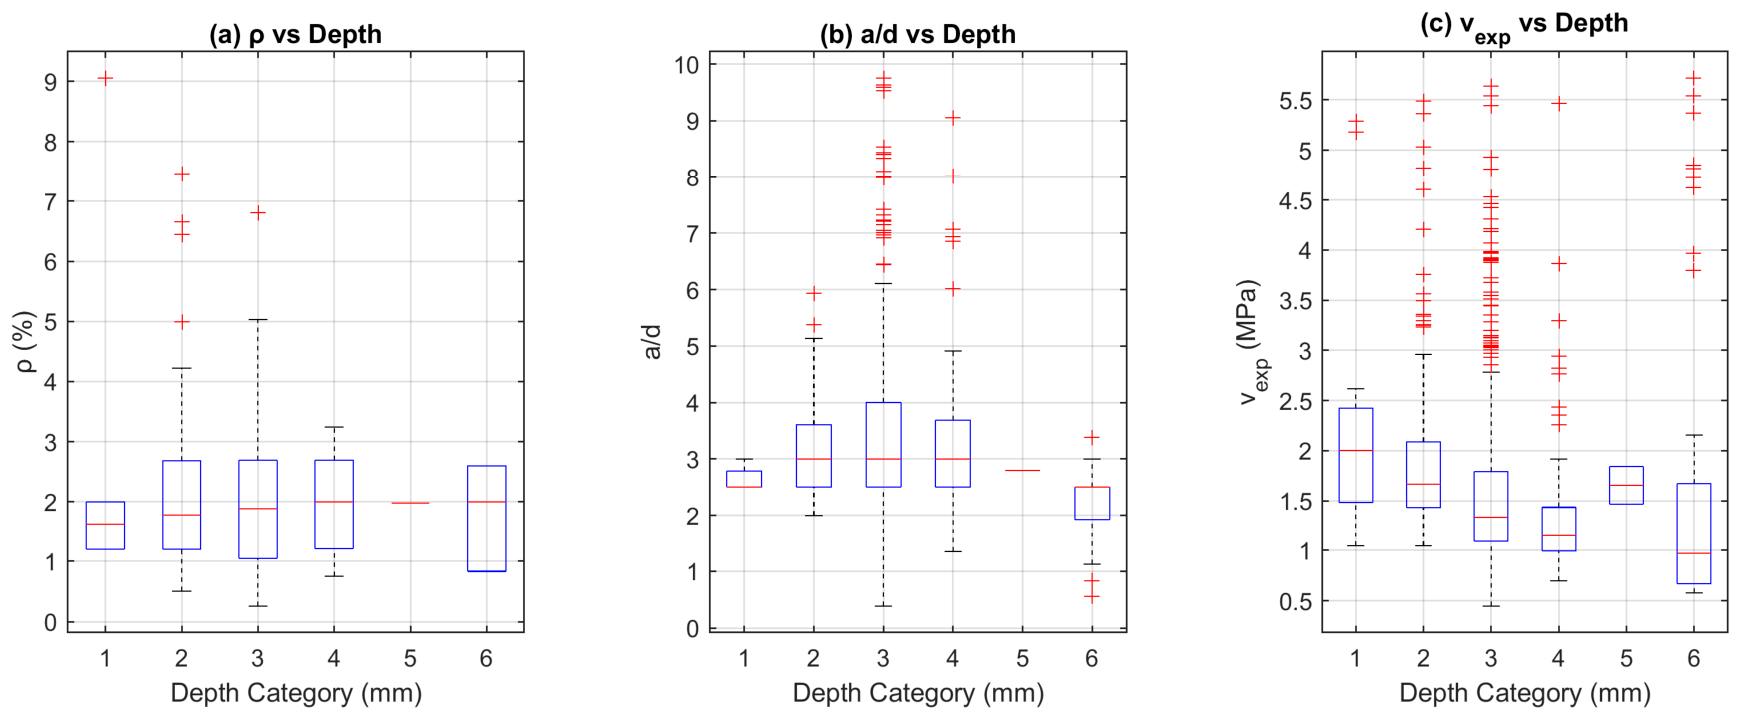
A systematic decrease in median ρ values from approximately 1.7% at d < 100 mm to less than 1.2% at d > 800 mm is evident in Figure 2, along with an increased interquartile range (IQR) of the a/d ratio with increased depth.
Figure 2.
Distribution of Key Variables Across Size Categories (a) reinforcement ratio (ρ), (b) ratio of shear span to depth (a/d), and (c) experimental shear strength (vexp). The box plots depict the median (line within box), interquartile range (box), whisker (1.5 × IQR), and outliers (red ‘+’ symbols).
4.2. Bažant Size Effect Law Calibration
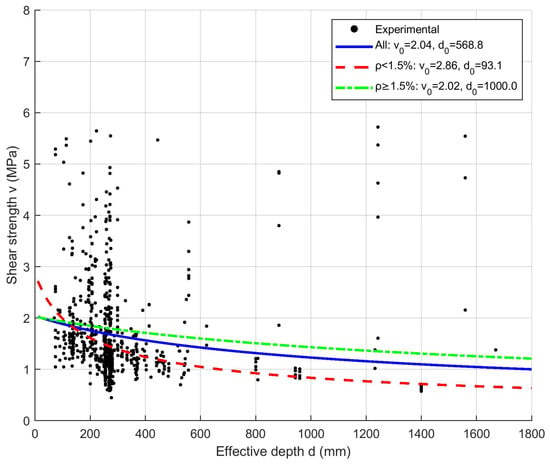
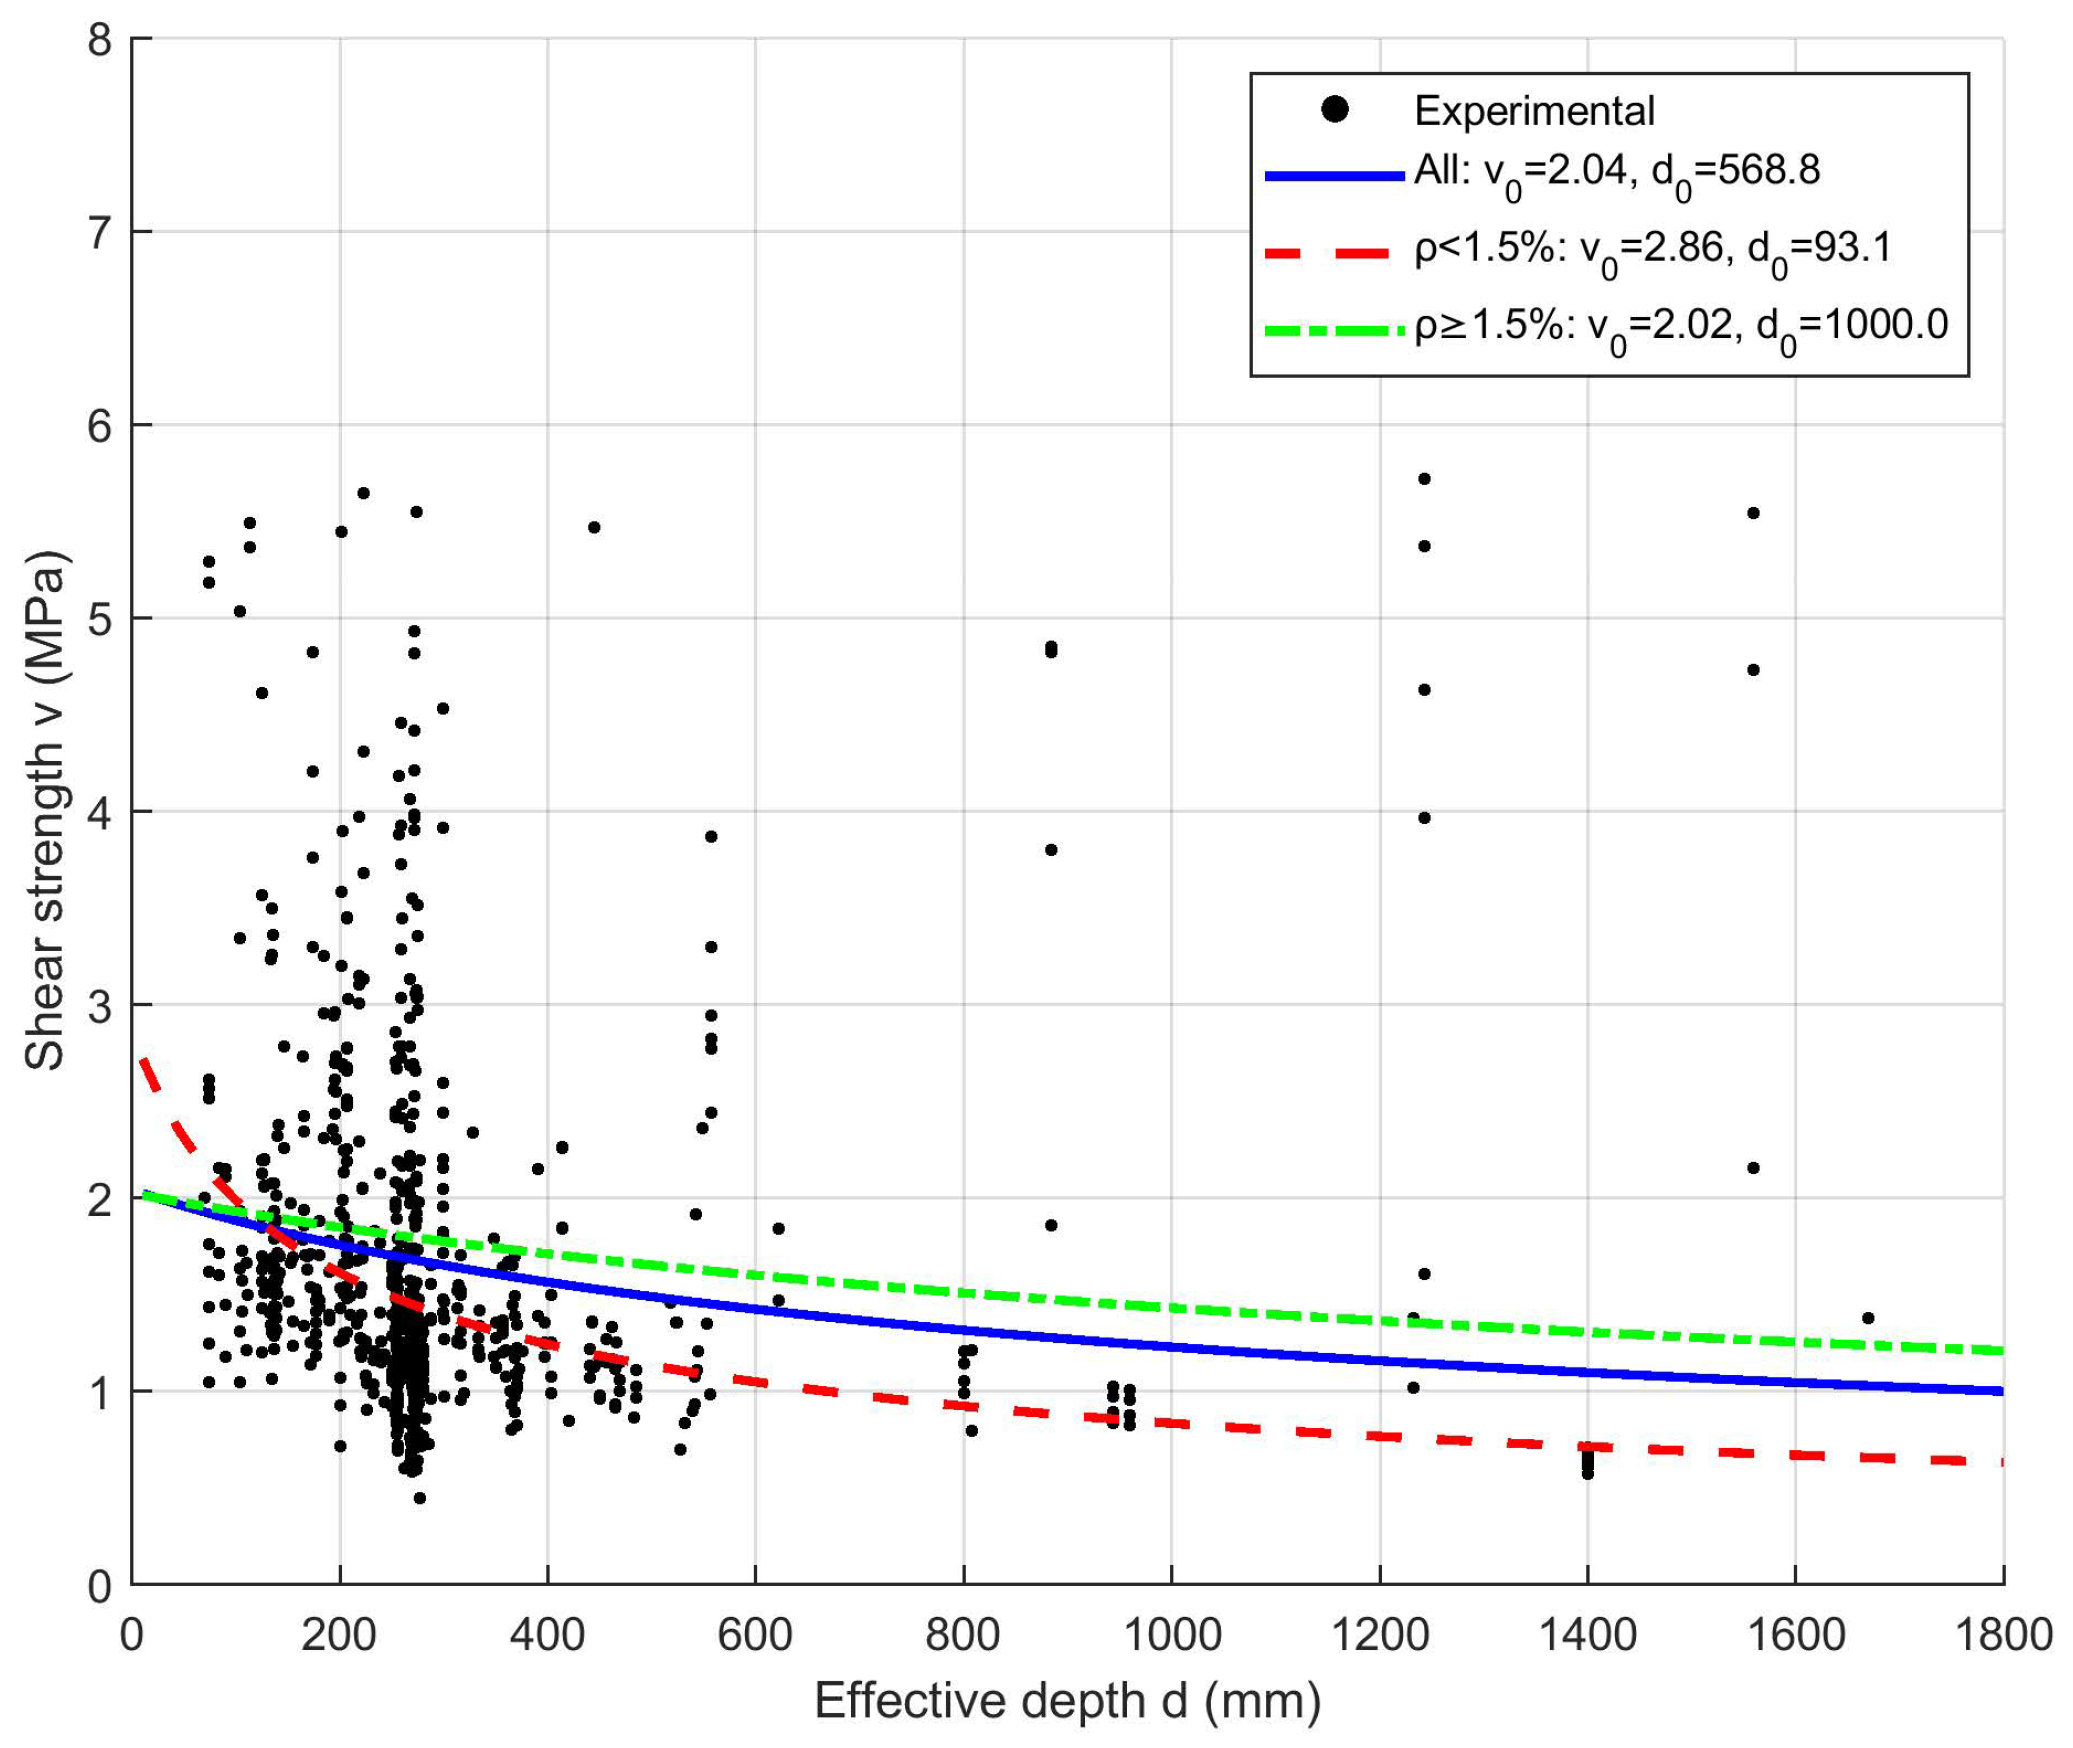
Figure 3.
Bažant Size Effect Law Calibration. The black dots are the data points of the experiments. The solid blue line is the SEL curve of all the specimens (v0 = 2.22 MPa, d0 = 335.4 mm), whereas the red and green dashed lines show the SEL curves of the specimens with low (ρ < 1.5%) and high (ρ ≥ 1.5%) reinforcement ratio, respectively.
Table 3.
Calibrated parameters of Bažant Size Effect Law.
The transition size parameter d0 is relatively small for low-reinforced specimens (90.1 mm) compared to high-reinforced specimens (1000 mm). It implies that the size effect occurs at smaller depths in low-reinforced sections. The result is consistent with the findings of Bažant and Yu [12,13], confirming the significance of considering ρ as a critical modifying factor.
4.3. Semi-Empirical Scaling Relationships
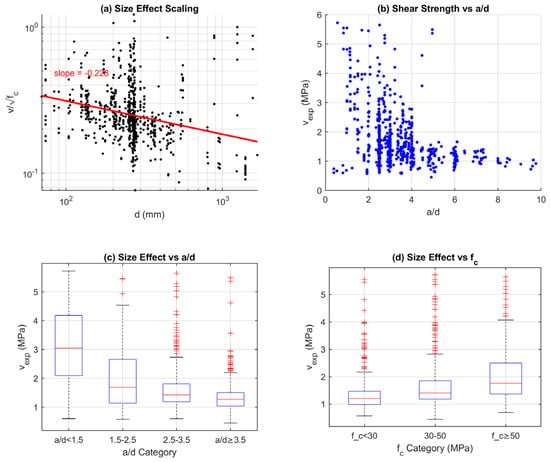
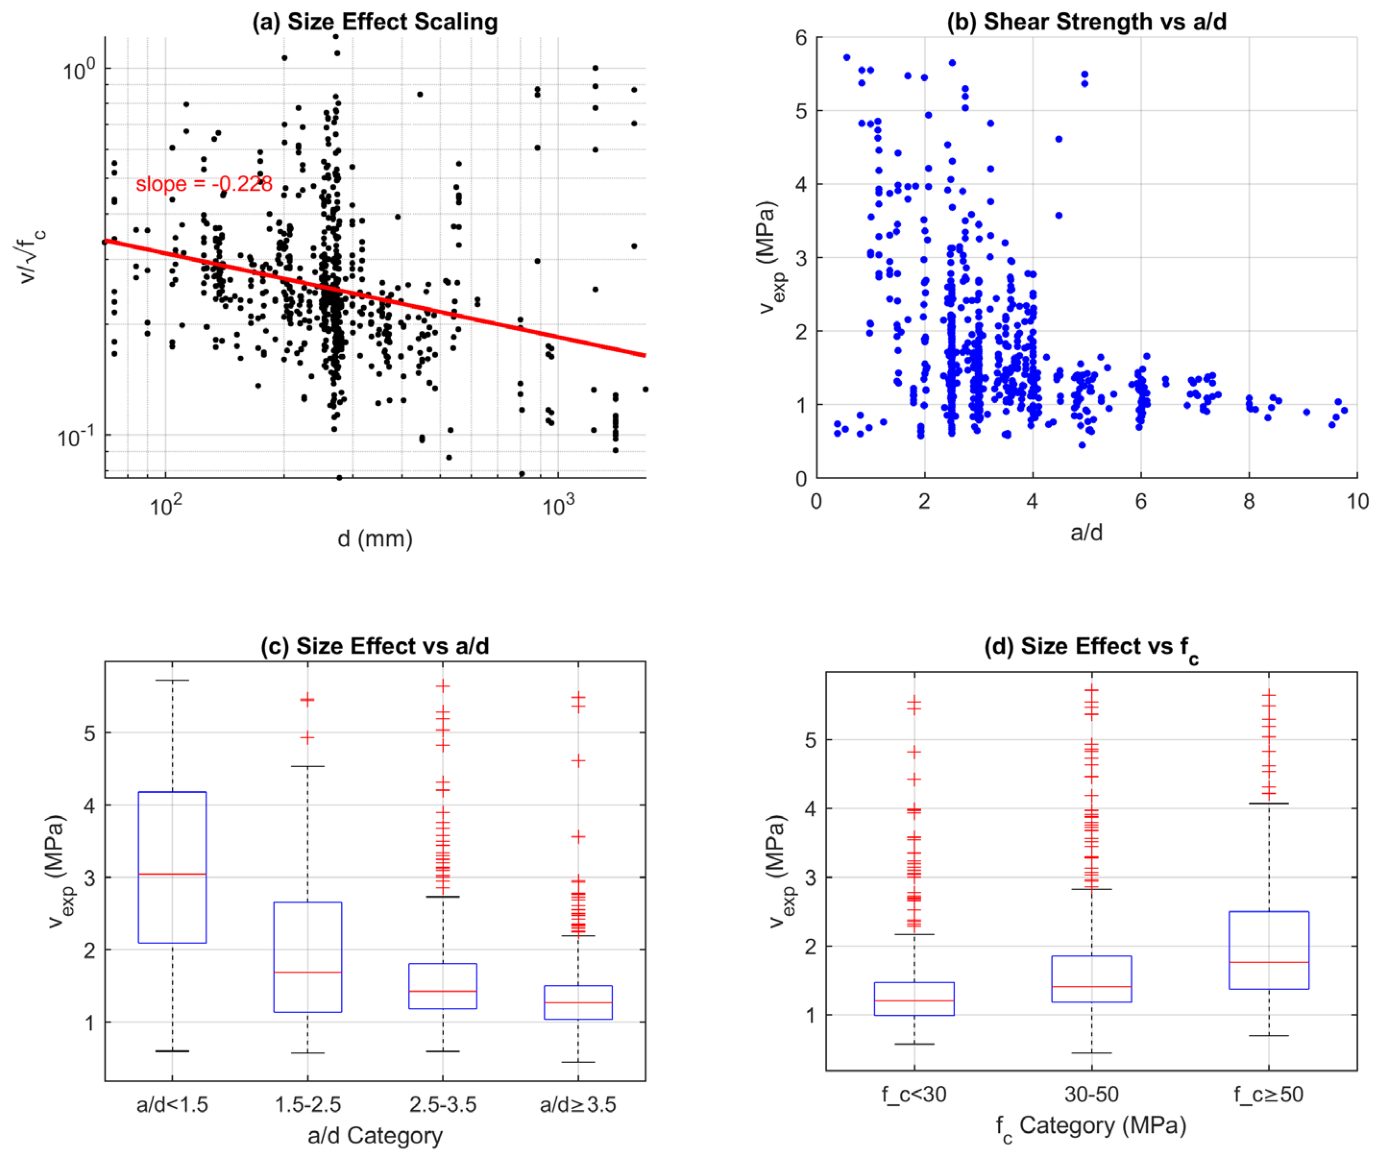
Figure 4a presents double-logarithmic regression of vs. d, resulting in an exponent of −0.213. This intermediate exponent between 0 (assumption of ACI) and −0.5 (LEFM) confirms that shear failure is semi-brittle in nature, which is in line with Carmona and Ruiz [1]. Figure 4c,d demonstrate significant interaction effects. Stratification based on a/d indicates a sharper size effect curve for deep beams (a/d < 1.5) than for slender beams (a/d ≥ 3.5) in the uncracked concrete compression zone. The high-strength concrete specimens display a somewhat reduced size effect.
Figure 4.
Semi-Empirical Relationships. (a) Double logarithmic regression plot of normalized shear strength () against effective depth (d); black dots indicate experimental values and red line shows the regression line (slope = −0.213). (b) Experimental shear strength (vexp) against shear span-to-depth ratio (a/d). (c,d) Box-and-whisker plots indicating the variation of (vexp) against different ranges of a/d and concrete compressive strength (fc), respectively; boxes indicate the interquartile range (IQR), horizontal lines in boxes represent the median, whiskers indicate 1.5 × IQR, and red ‘+’ represent outliers.
4.4. Code Evaluation
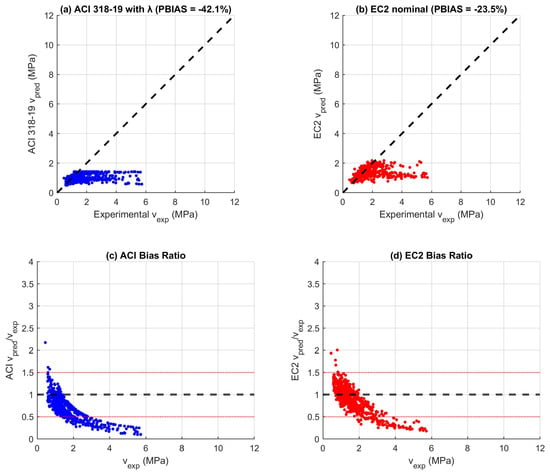
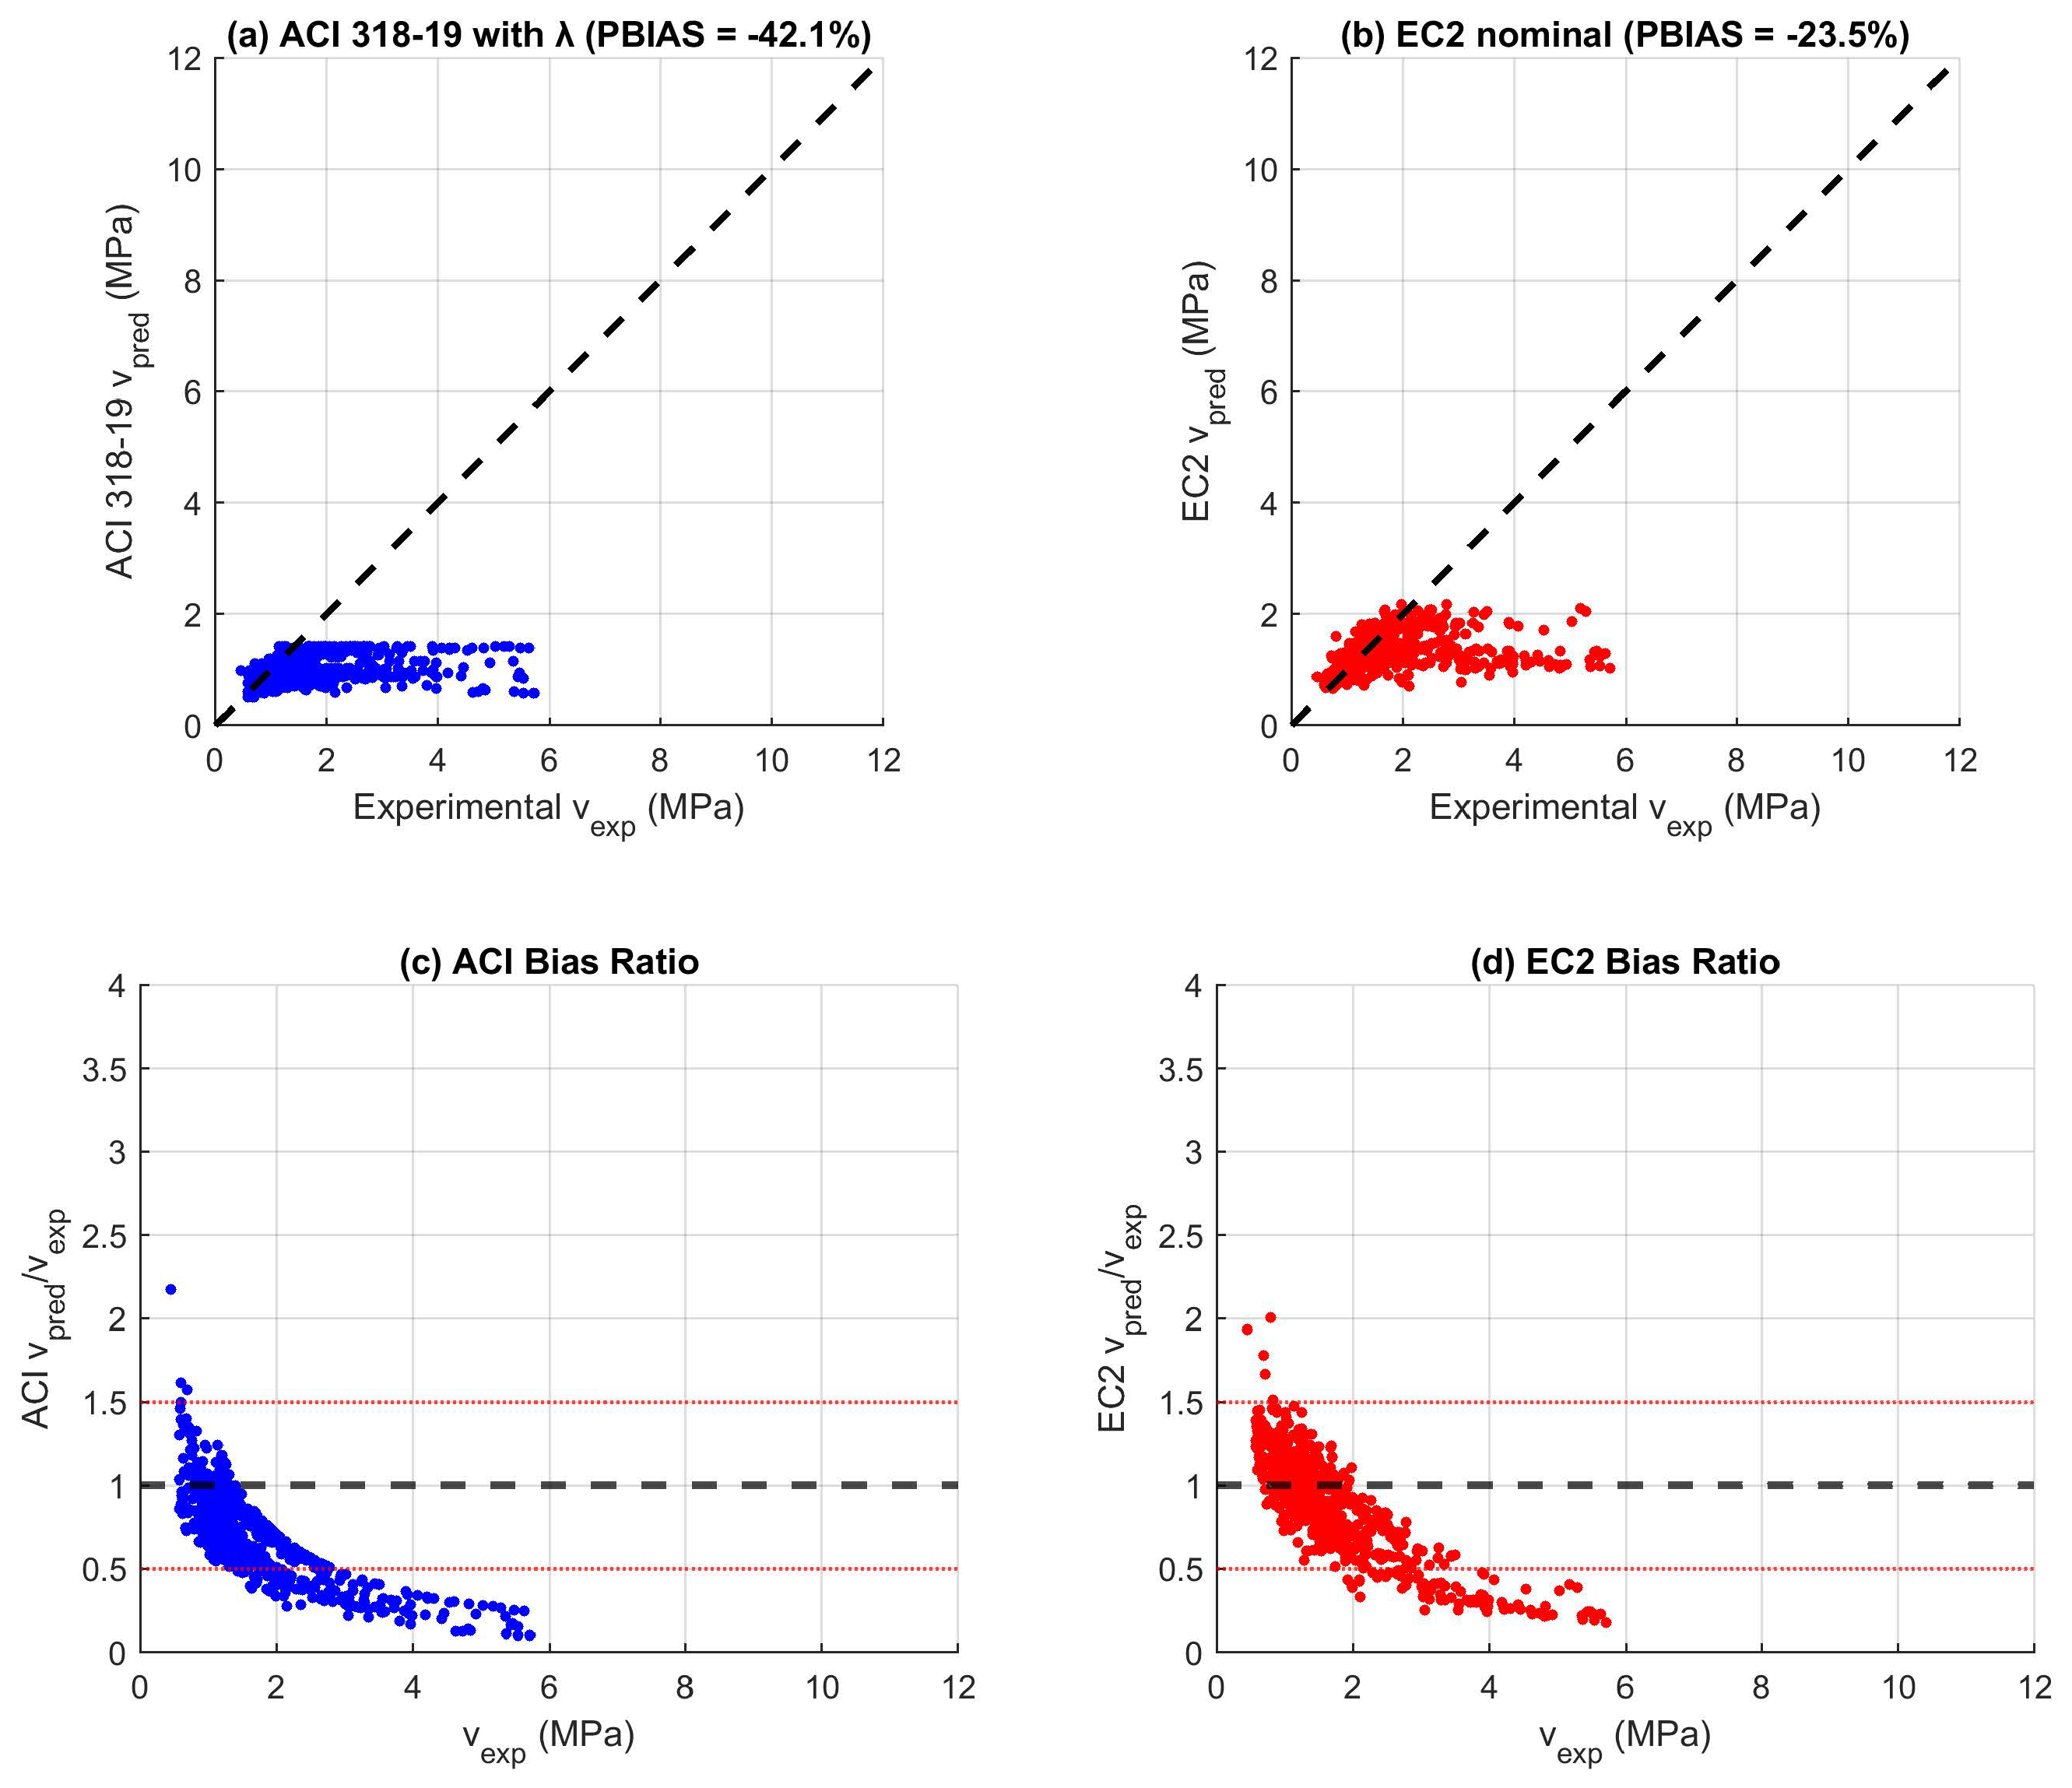
Figure 5 demonstrates parity plots and bias ratio plots. The error measures are presented in Table 4.
Figure 5.
Comparison of ACI 318-19 and Eurocode 2 predictions with experimental values. The parity plots on the left depict the predicted shear capacity to the experimental shear capacity where the dashed line indicates the 1:1 perfect correlation line. The bias ratio plots on the right display the ratio of predicted to experimental shear capacity, with the horizontal line being the bias ratio of 1.0.
Table 4.
Performance metrics of design code provisions.
Eurocode 2 produces better results compared to ACI in terms of RMSE and MAE in this particular dataset. However, the important observation here is that both codes show considerable PBIAS in the negative region, which suggests that there is a systematic bias towards under-prediction (conservative design) of shear strength.
4.5. Shear Transfer Mechanisms Contributions
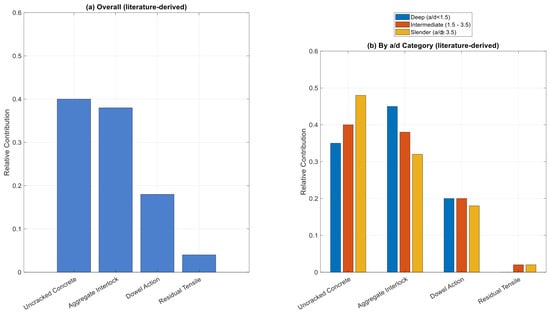
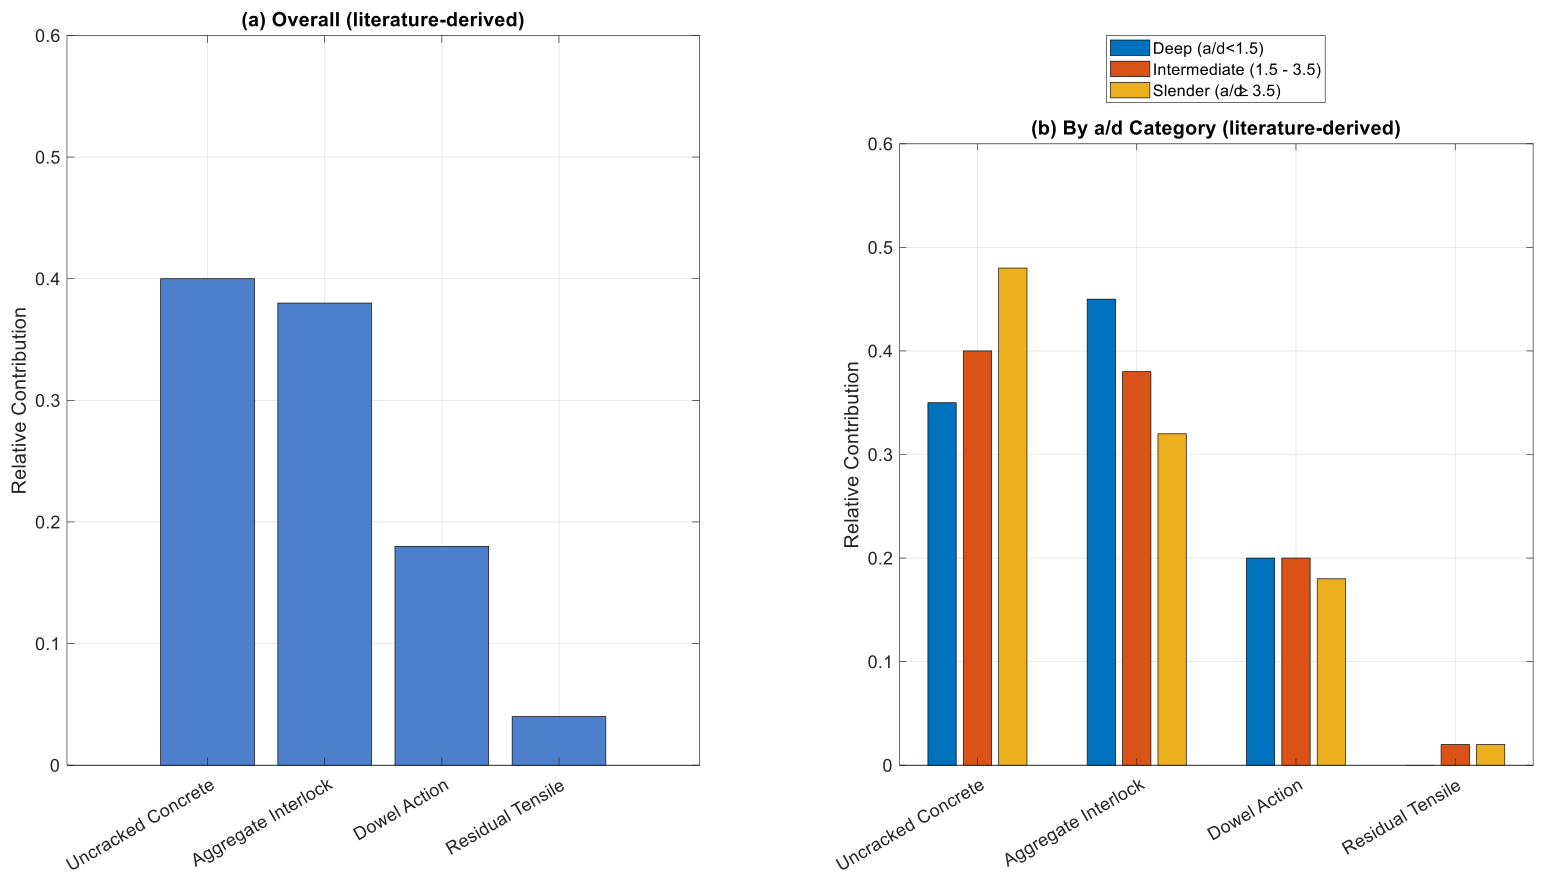
The distribution of various shear transfer modes for RC beams without stirrups is shown in Figure 6. The fact needs to be mentioned that these figures are from Walraven [3] and Cavagnis et al. [32] and are used here only to illustrate the mechanics of the process and effect of the shear span-to-depth ratio (a/d), but not the result of our regression analysis.
Figure 6.
The relative importance of the different shear transfer modes (compression zone, aggregate interlock, dowel action, and residual tensile stresses) depending on the ratio of shear span to depth (a/d). The information is taken from Walraven [3] and Cavagnis et al. [32].
4.6. Statistical Synopsis
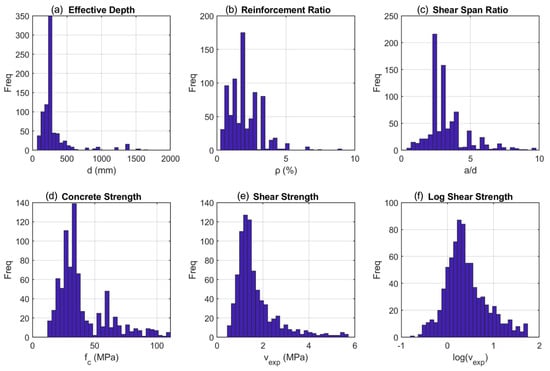
In Figure 7, it can be seen that vexp is normally distributed with positive skewness (1.08). The deep beams have a median shear capacity 73% greater than that of slender beams.
Figure 7.
Histograms showing the statistical distributions of the important parameters from the experimental database: (a) effective depth (d), (b) reinforcement ratio (ρ), (c) shear span to depth ratio (a/d), (d) compressive strength of concrete (f'c), (e) experimental shear strength (vexp), and (f) log-transformed shear strength. The x-axes show the values of the parameters, and the y-axes show the number of specimens.
4.7. Model Performance
Table 5 shows the performance results for five models used to predict a target variable in MPa. The models include two design-code models (ACI 318-19 and Eurocode 2), two machine learning models (Linear Regression and Random Forest), and the new Gaussian Process Regression (GPR) model.
Table 5.
Comparative performance of all models (Hold-Out Test Set, N = 160).
These The GPR model has obtained a very good R2 value of 0.713. Even though the RF model gives a marginally better R2 value (0.757), it does not provide any measure of uncertainty quantification. The codes are extremely conservative, with PBIAS values of −45.9% (ACI) and −26.8% (EC2). The GPR model captures around 75% of the theoretically possible variance ( with a/d matching). Also, the empirical 95% prediction intervals cover 90.6%, which is a case of mild under-coverage.
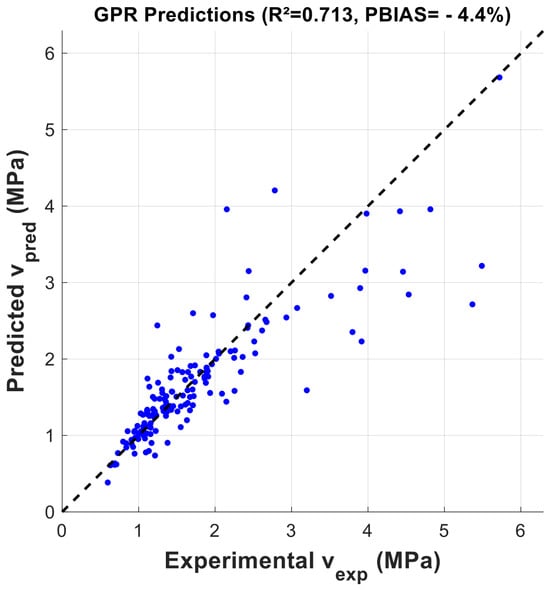
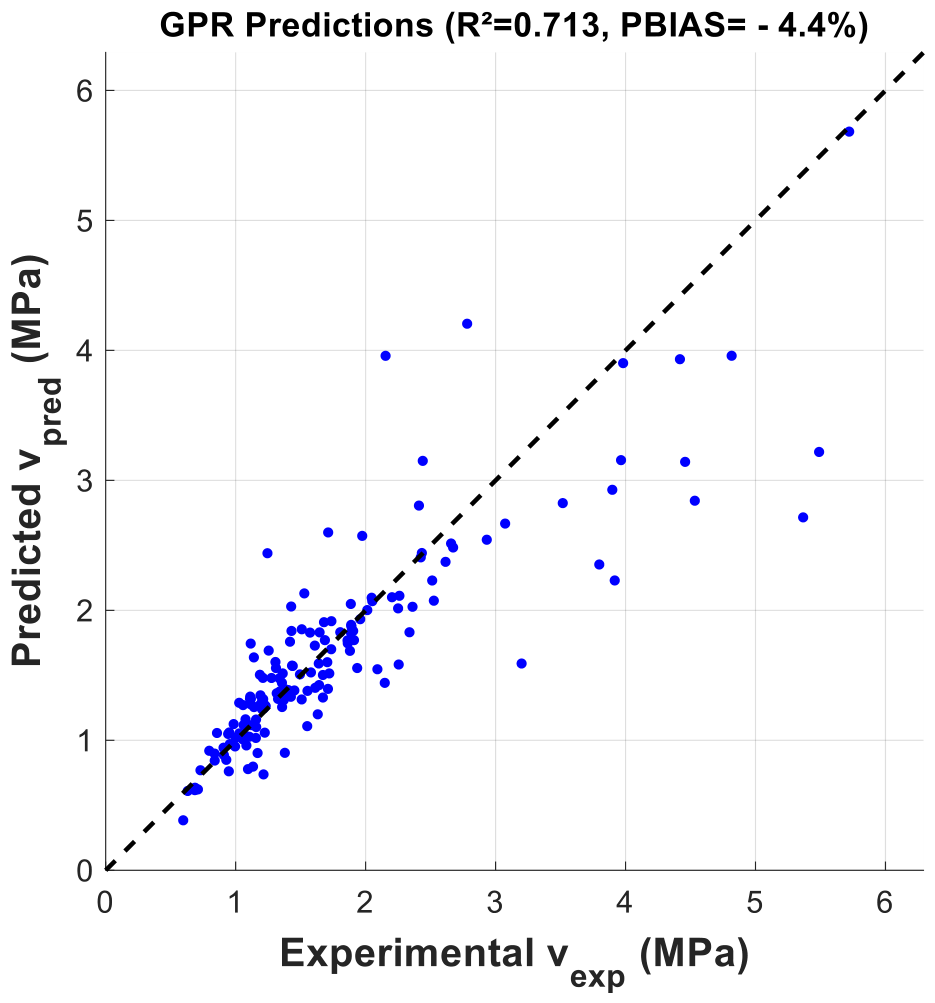
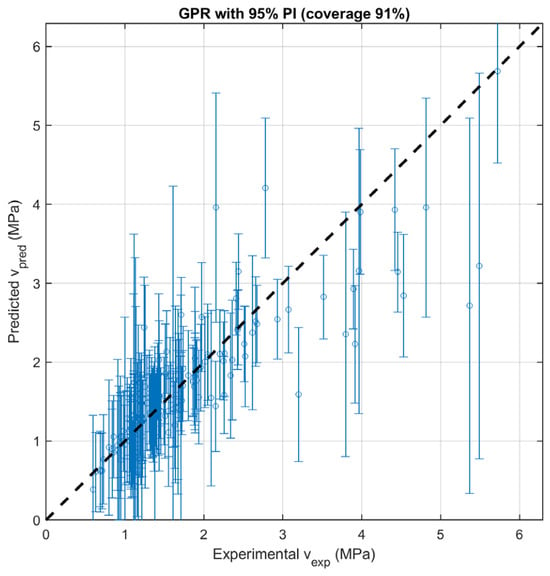
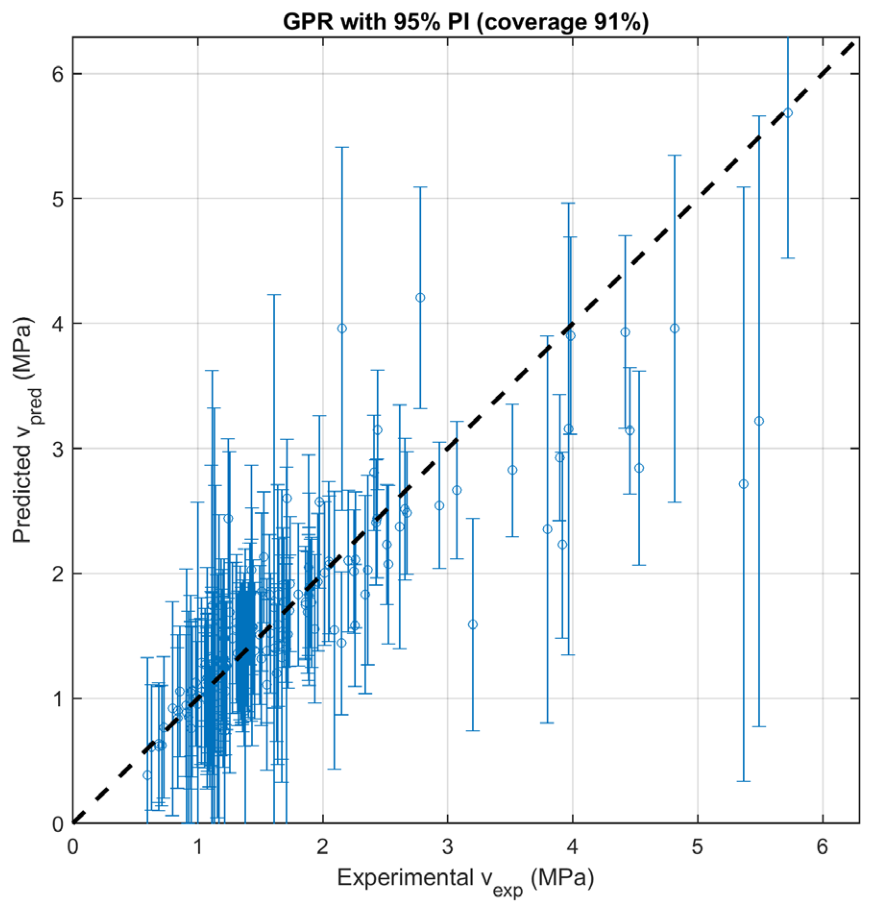
One of the major advantages of the GPR model is that it provides 95% prediction intervals, which are absolutely necessary for reliability-based design and are totally missing in existing codes and Random Forest model. Moreover, the aggregate bias in GPR is nearly zero (PBIAS = −4.4%), whereas the biases of ACI 318-19 and EC2 are highly conservative (−44.7% and −26.6%, respectively). It should be noted, however, that the GPR is conservative on aggregate (PBIAS = −4.4%), and hence, positive and negative errors tend to offset each other. Hence, a safety factor of 1.05 is proposed when utilizing GPR for design purposes. The empirical coverage of the 95% prediction intervals is 90.6%, which indicates a mild under-coverage; in the case of design considerations, it is advisable to inflate PIs by a factor of 1.1. Figure 8 demonstrates the parity plot of GPR predictions against the experimental data, while Figure 9 plots the prediction intervals.
Figure 8.
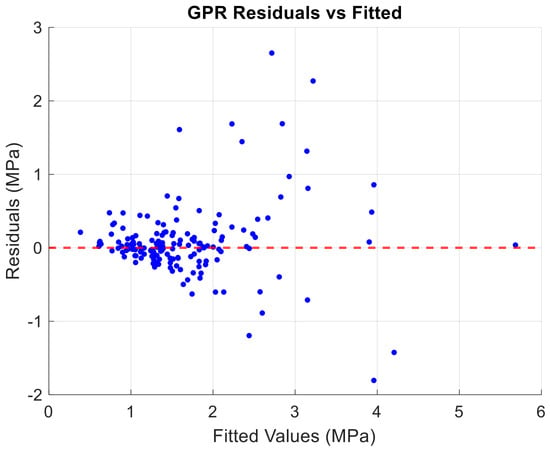
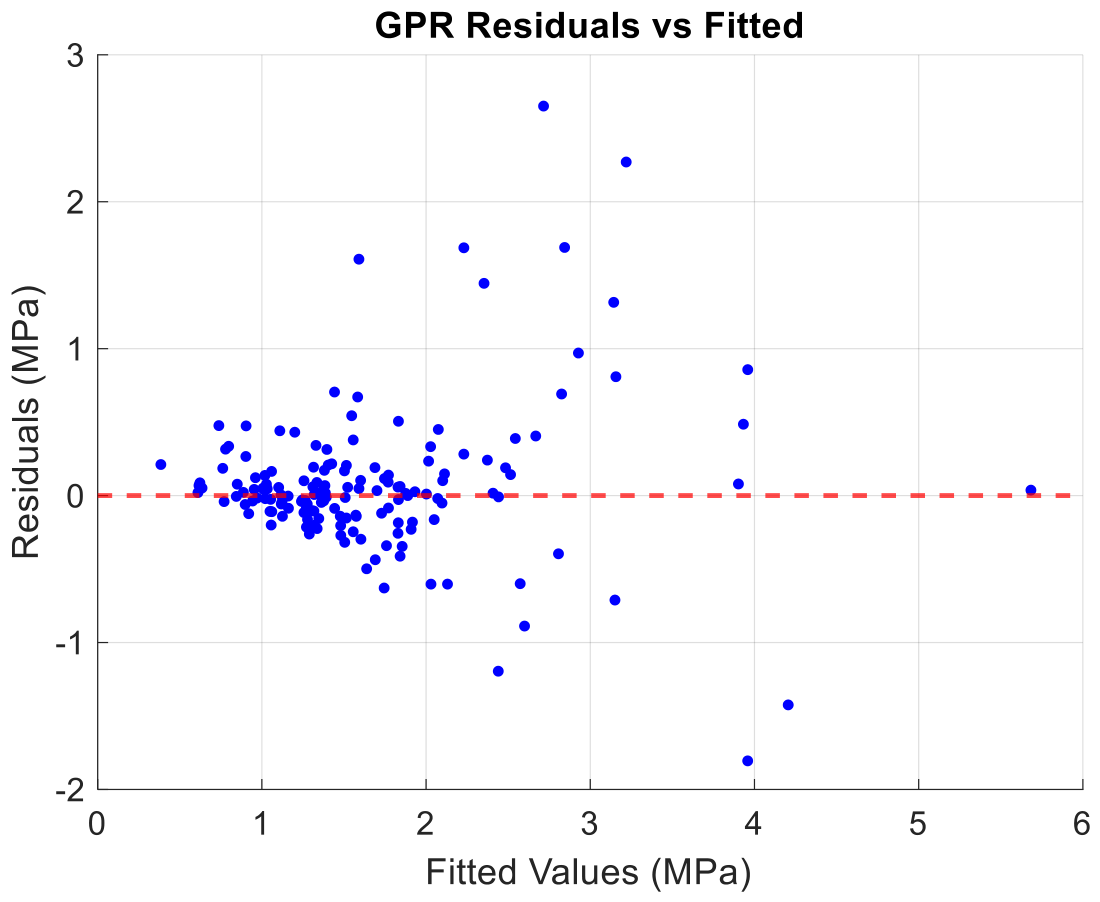
Parity plot for the predicted values using Gaussian Process Regression (GPR) model and experimentally determined shear strength. Individual specimens are represented by blue dots, while the black dashed line shows the 1:1 ideal line.
Figure 9.
GPR prediction results with 95% prediction intervals against experimentally determined shear strength. The blue dots are the mean predicted shear strengths, while the vertical error bars correspond to the 95% prediction intervals. The black dotted line is the 1:1 line of perfect agreement. Empirical coverage of the prediction intervals is 90.6%.
4.8. Statistical Significance Testing
The Wilcoxon signed-rank test confirmed the statistical significance of the improvements:
| Comparison | p-Value |
| ACI vs. GPR | 6.37 × 10⁻²¹ |
| EC2 vs. GPR | 4.95 × 10⁻⁷ |
As per the Wilcoxon signed-rank test results, the GPR model is statistically significantly superior to ACI 318-19 (p-value = 6.37 × 10⁻²¹) as well as to Eurocode 2 (p-value = 4.95 × 10⁻⁷) in terms of absolute error. Both the above-mentioned p-values fall well below the threshold of 0.05 and thus provide statistical support to the above claim.
4.9. Stratified Bias Assessment
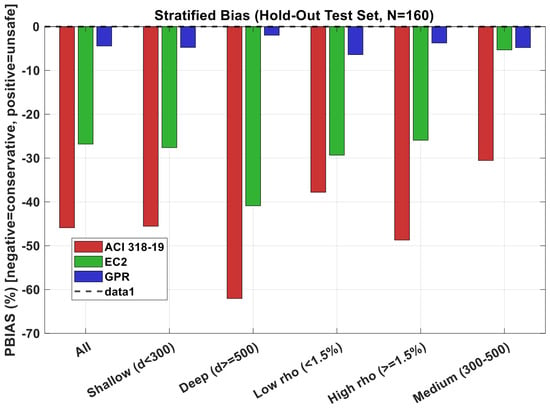
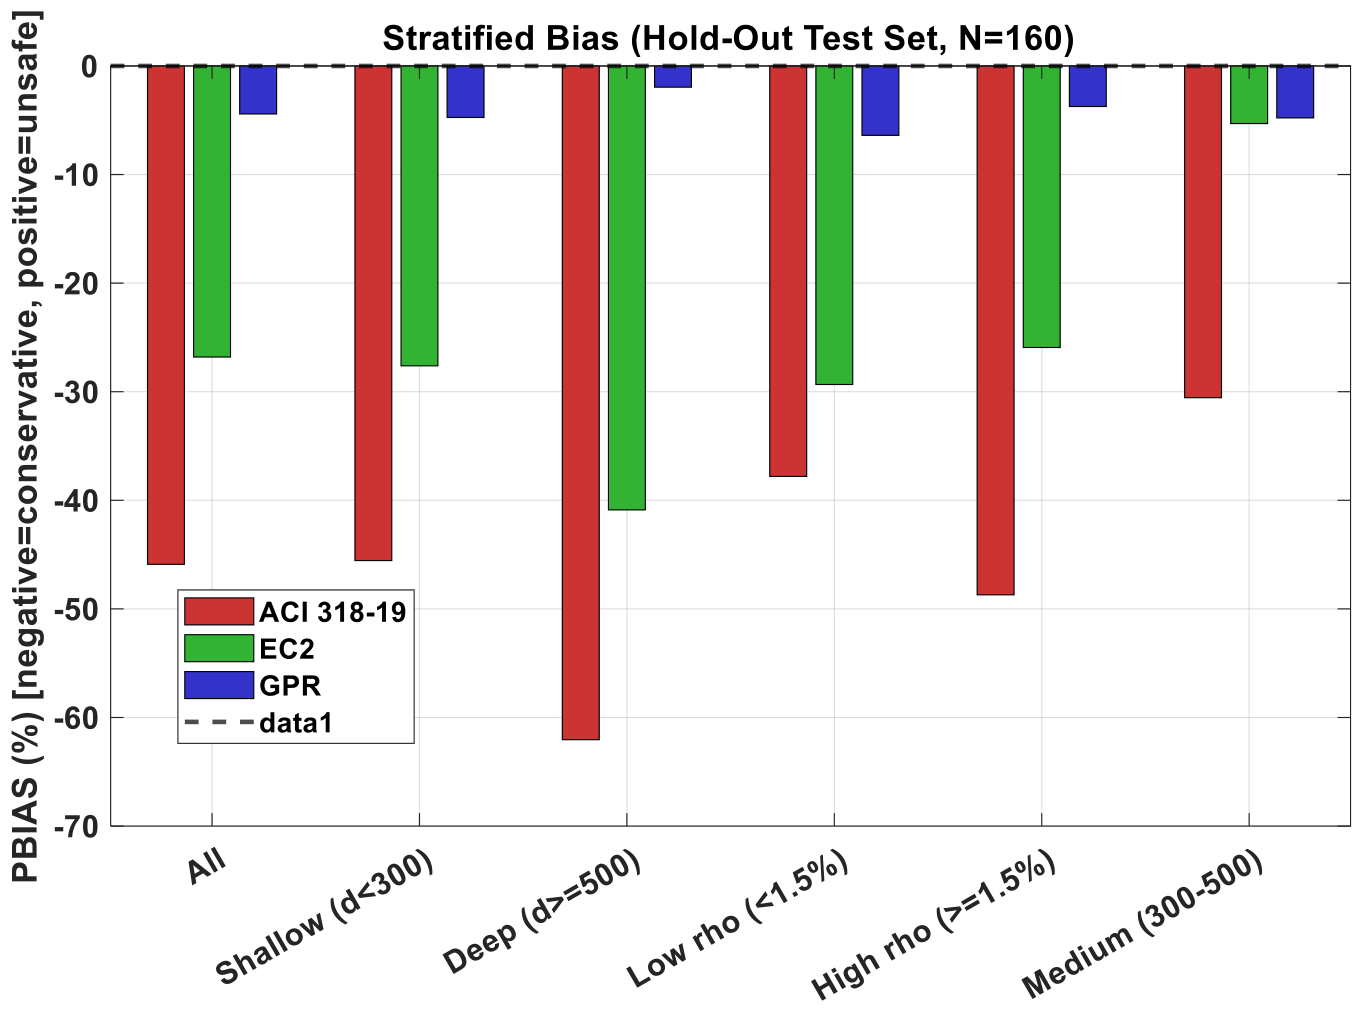
Table 6 gives the analysis of the stratified PBIAS for ACI 318-19, EC2, and the suggested GPR method. The visual representation is shown in Figure 10.
Table 6.
Stratified bias assessment (PBIAS in %).
Figure 10.
Strata-based PBIAS analysis of ACI 318–19, Eurocode 2, and the proposed GPR model. Red bars depict ACI 318–19, green bars show Eurocode 2, and blue bars show the proposed GPR model. Negative values of PBIAS show that the models have conservative behavior, while positive values indicate non-conservative behavior.
Key observations from the stratified bias analysis include the following:
- ACI 318-19 is highly conservative across all strata, with the highest bias in deep beams (PBIAS = −62.0%) and high-reinforcement-ratio beams (−48.7%).
- Eurocode 2 is also conservative, particularly in low-reinforcement-ratio (PBIAS = −29.3%) and deep beams (−40.9%).
- GPR maintains a near-zero aggregate bias across most strata (ranging from −6.4% for low-ρ beams to −2.0% for deep beams), demonstrating its robustness.
4.10. Extracted Design Formula
A linear surrogate model was also fit on the same 12 engineered features to provide interpretation. The regression coefficients of the linear surrogate model are provided in Supplementary Table S1. The linear model gives an R2 = 0.336 and a PBIAS of −3.4% on the hold-out test dataset (N = 160). This model is provided only as an interpretable surrogate model.
4.11. Sensitivity Analysis
Sensitivity analysis was performed for the determination of the influential factors affecting shear strength using the Random Forest feature importance method. For the Random Forest, training was carried out on the entire set of data with number of trees = 300, Min Leaf Size = 10, and OOB Predictor Importance = true. Calculation of feature importance was based on an increase in mean squared error (MSE) after permutation of the features and normalization of importance values to add up to 100%.
The normalized sensitivity of all the features has been calculated and is presented in Figure 11 for 1000 iterations performed under the permutation-based importance calculation process. It can be seen from the results that the shear span to depth ratio (a/d) has the largest impact of 24.1% on the prediction capability of the model. The second most impacting feature is a/d × kd, with an impact of 12.2%. The third most impactful feature is the cube root of the concrete compressive strength (), which has an impact of 9.1%. The interactions with compressive strength () and the reinforcement ratio (ρ) have an impact of 9.1% and 4.6%, respectively.
Figure 11.
Random Forest Sensitivity Analysis using Permutation Feature Importance. Horizontal bars indicate the percentage contribution of each engineered variable to the accuracy of the predictive model. The ratio between the shear span and depth (a/d) is the most significant variable (24.1%) followed by interaction with the size effect factor (a/d × kd, 12.2%).
It can be seen from this analysis that the role of interaction of the slenderness ratio and the size effect coefficient in the regulation of shear resistance is significant. The large significance of the interaction coefficient () demonstrates a high non-linearity and interdependency of the regulating coefficients that cannot be estimated using the linear regression model. The relatively small value of significance of the ρeff coefficient (4.6%) indicates that the longitudinal reinforcement plays a more important role together with other factors.
The importance of the features mentioned is justified by the assumptions of the mechanistic model that aggregate interlocking and compressive zone resistance are the main shear transfer mechanisms [3,8]. The considerable importance of the feature coincides with the physical reasoning. The small difference in the contribution of () implies that the use of both features leads to the presence of redundancy, which needs to be solved in future studies.
4.12. Comparison with Previous ML Models
In order to assess the performance of the proposed GPR model, a comparison has been made with the performance of some of the recent machine learning algorithms used for predicting shear strength. The results are presented in Table 7.
Table 7.
Comparison with previous machine learning models.
However, it is vital to consider that the values of R2 obtained in Adamu et al. [4] and Yu & Li [30] were obtained on their individual databases, which may be different from each other in terms of size and diversification. The GPR model that was developed has a fairly high coefficient of determination, R2 = 0.713, that can be compared with other recently developed models, for example, by Adamu et al. [4] and by Yu & Li [30]. The fact that R2 in the current research is lower than in the above-mentioned models (as compared to R2 = 0.86–0.92 in those models), can be explained by the wider and more heterogeneous sample that we have (CV = 54%). Nevertheless, the GPR model that was proposed gives the minimum average bias (−4.4%) and, what is even more important, 95% prediction intervals.
5. Discussion
5.1. Interpretation of R2 Values
By way of contrast, the scatter in shear test data is relatively large, as evidenced by the coefficients of variation usually being in the range of 30% to 60%. Regarding the value of R2, 0.10 to 0.15 would be considered good when the database is both large and varied. The near-zero biases (PBIAS = −4.4%) of the GPR model proposed here are a much more significant measure of its predictive quality than R2, which is related directly to the structural safety. This aspect is stressed by other scientists who claim that R2 alone is not sufficient to estimate the shear model quality [27].
5.2. Implications for Design Codes
Highly negative values of PBIAS for ACI 318-19 (−45.9%) and EC2 (−26.8%) reveal that these design codes are highly conservative and consistently underpredict the shear strength. Although this conservatism assures the safety of structures, there is considerable wastage of material. GPR modeling has made a major breakthrough with its negligible aggregate bias value (−4.4%), that is more conservative in its design approach.
The sensitivity analysis found that the shear span-to-depth ratio (a/d) and its interaction with the size effect factor (a/d × kd) are the two most significant parameters, along with the cube root of concrete strength (). The importance of these interactions has not been considered in the existing codes, and hence their high level of conservatism and scatter. This study confirms the current suggestion that equations based on mechanics should be considered [34]. Yet another significant finding is related to the performance of deep beams (d ≥ 500 mm), where the GPR model exhibited an underestimation (PBIAS = −2.0%), although not as severe as the codes. This is probably due to the fact that there were few specimens from deep beams in the database (n = 18 out of 160 test specimens). This finding is consistent with the observation of Reineck et al. [18] that there was a shortage of shear tests performed on a larger scale. Thus, more studies are needed to focus on deep beams.
5.3. Recommendations for Practice
The following recommendations are suggested according to the results of this research:
- For deep beams (d > 400 mm) with low reinforcement ratio (ρ < 1.5%): ACI 318-19 cannot be applied directly, as it might result in a significant under-prediction of shear strength. It is recommended to use either the developed GPR model or the obtained linear equation with a suitable safety factor.
- For beams with high reinforcement ratio (ρ > 2.5%): Both codes give quite similar results; however, they still suffer from systematic under-prediction. The size effect in this range is quite small.
- For critical structures: The GPR model, together with prediction intervals and the near-zero bias, is recommended for the analysis of design prediction reliability.
Physics-informed machine learning [30] models can be routinely employed as decision-making tools for evaluating current structures and formulating better codes. Transparency of the GPR model, coupled with uncertainty bounds, makes it more appropriate for reliability-based design problems.
5.4. Limitations
Despite the high efficiency of the suggested framework, some limitations need to be highlighted:
- Representativeness of the database: The GPR prediction is only applicable within the range of parameters used in the training dataset (44 ≤ d ≤ 1670 mm; 12.2 ≤ fc ≤ 110.9 MPa; 0.26 ≤ ρ ≤ 15.23%; and 0.39 ≤ a/d ≤ 9.76). All predictions in other ranges should be interpreted cautiously.
- Boundary conditions: In all samples of the database, there was simple support with two-point loadings and/or a single point loading. Therefore, this model may not be suitable for specimens with other types of boundaries or loading.
- Failure mode: The model is calibrated for cases where beams were damaged due to diagonal tension and shear compression.
- Construction characteristics: The model was based on carefully prepared specimens and therefore may not take into consideration all possible variations that occur in real life.
- Aggregate effects: The model does not take into account the maximum size of aggregate effects, which influence interlocking and size effects [1]. This must be incorporated into the model at a later time if sufficient data are available.
- External validation: The GPR model was trained and validated on a specific experimental database. External validation on independent databases (e.g., fib, Lantsoght) is required before recommending the model for everyday design deployment.
5.5. Future Research Directions
Future work should be concentrated on the following:
- Database extension: Consideration of beams with stirrups for obtaining a unified model that can be used for more varied structural elements [35].
- Additional parameters: maximum aggregate size, tensile strength of concrete, and fiber or any other type of reinforcement.
- External validation: verification of the model’s applicability on another dataset, especially those that come from recently performed experiments (e.g., extended ACI-DAfStb database). This point is important to confirm the generalizability of the obtained model before recommending it for everyday design practice.
- Reliability assessment: estimation of safety consequences using a probabilistic approach (e.g., Monte-Carlo simulation) and definition of correct partial safety factors.
- Simple design aids creation: obtaining design charts and tables based on the GPR model.
- Model comparison with other machine learning techniques: verification of the competitiveness of the GPR model by benchmarking it with other machine learning algorithms (e.g., XGBoost, Support Vector Regression) using the same database [36].
- Effects of corrosion: Further studies must expand on this framework to consider RC beams subjected to the effects of reinforcement corrosion through the use of data-driven models of deterioration (e.g., [34]).
6. Conclusions
The conclusions of this work, based on the above comprehensive statistical analysis, mechanistic assessment, and GPR modeling guided by physics, are as follows:
- Identification of data biases: The database of 804 specimens shows inherent biases and collinearity between effective depth (d), longitudinal reinforcement ratio (ρ) and shear span-to-depth ratio (a/d). The interactions between these covariates affect the assessment of the size effect, and thus multivariate assessment is essential.
- Calibration of the size effect: Calibration of the SEL Type II of Bazant showed that the value of the transition size parameter (d0) was strongly affected by the longitudinal reinforcement ratio. For lightly reinforced beams (ρ < 1.5%), d0 = 90.1 mm, whereas for heavily reinforced beams (ρ ≥ 1.5%), d0 = 1000 mm. This means that the size effect is much deeper for weakly reinforced cross-sections.
- Evaluation of codes: Both ACI 318-19 and Eurocode 2 codes turned out to be extremely conservative, their PBIAS being −45.9% and −26.8%, correspondingly. Conservativeness provides high levels of safety but causes wastage of materials.
- Physics-guided GPR: The GPR model obtained a remarkably good coefficient of determination R2 equal to 0.713, which corresponds to about 77% of the theoretically possible value (). Statistically significant superiority (Wilcoxon signed-rank test) of GPR compared to ACI 318-19 (p = 6.37 × 10⁻²¹) and Eurocode 2 (p = 4.95 × 10⁻⁷) was proven.
- The quantification of uncertainty: The GPR model has a very low overall bias (−4.4%) and produces accurate 95% prediction intervals (90.6%). From a design point of view, it is conservative overall; therefore, a safety factor of 1.05 should be used for its design implementation. The GPR model was validated on an independent test set consisting of 160 samples.
- The GPR model based on the physics perspective accounts for about 77% of (0.925) corresponding to R2 = 0.713.
- Sensitivity analysis: From the calculations performed using the Random Forest, it can be noted that the highest contribution is made by the shear span-depth ratio (a/d), with a 24.1% contribution; the second parameter is the product of a/d × kd with a 12.2% contribution, and the third one is the cubic root of concrete strength , with a 9.1% contribution. The square root of the concrete strength () made 9.1% contribution, and the product of and the reinforcement ratio () gave another 9.5%. The relatively low contribution of the single-effective reinforcement ratio (ρeff) (4.6%) shows that the influence of longitudinal reinforcement should be considered along with other parameters.
- Inherent variability of data: The coefficient of variation of experimental shear stress (54%) represents the inherent variability of shear stress, which, along with the restrictions of simplified code formulas, necessitates the application of more complex methods.
- Safety concerns: The existing codes are very conservative yet inefficient. The suggested GPR model, together with a safety factor of 1.05, is a much cheaper and more reliability-based approach.
To conclude, this paper shows that using physics-based Gaussian Process Regression is an effective method for improving prediction of the shear strength of reinforced concrete elements while maintaining physical consistency and quantifying the uncertainty of the model. The absence of bias and substantially lower errors of the proposed approach mean that the code has to be revised, especially for deep beams and those with extreme reinforcement ratios.
Supplementary Materials
The following supporting information can be downloaded at: https://www.mdpi.com/article/10.3390/buildings16224585/s1, Table S1: Coefficients of the regression of the linear surrogate model using 12 constructed features. Table S2: Part A: Records excluded due to geometric inconsistency (d ≥ h). Part B: Verification for the representative record (Row 2) mentioned by the reviewer.
Author Contributions
M.A.-G.: Conceptualization, Methodology, Formal analysis, Data curation, Writing—original draft. H.S.A.-R.: Validation, Investigation, Writing—review and editing. A.A.A.: Data curation, Visualization, Software. A.A.: Supervision, Project administration, Writing—review and editing. All authors have read and agreed to the published version of the manuscript.
Funding
This research received no external funding.
Institutional Review Board Statement
Not Applicable. The study involves a statistical and mechanistic analysis of the previously published experimental data. There are neither human participants nor animal subjects involved in the study.
Informed Consent Statement
Not applicable.
Data Availability Statement
The experimental data used in the current study were assembled and analyzed based on the cited publications. The processed dataset and analysis code are available from the corresponding author upon request.
Acknowledgments
The authors would like to express gratitude to the research institutions, which provided experimental data for this work, specifically, the authors of the ACI-DAfStb database.
Conflicts of Interest
The authors declare no conflicts of interest.
Abbreviations
RC = Reinforced Concrete; GPR = Gaussian Process Regression; SEL = Size Effect Law; ANN = Artificial Neural Network; RMSE = Root Mean Square Error; MAE = Mean Absolute Error; MAPE = Mean Absolute Percentage Error; PBIAS = Percentage Bias; CV = Coefficient of Variation.
References
- Carmona, J.R.; Ruiz, G. Bond and size effects on the shear capacity of RC beams without stirrups. Eng. Struct. 2014, 66, 45–56. [Google Scholar] [CrossRef] [Scilit]
- Bažant, Z.P.; Pfeiffer, P.A. Shear fracture tests of concrete. Mater. Struct. 1986, 19, 111–121. [Google Scholar] [CrossRef] [Scilit]
- 3. Walraven, J.C. Fundamental analysis of aggregate interlock. J. Struct. Div. 1981, 107, 2245–2270. [Google Scholar] [CrossRef] [Scilit]
- Adamu, S.N.; Aure, T.W.; Mohammed, T.A.; Hantouche, E.G. An advanced prediction model for shear strength of slender reinforced concrete beams: Integrating shear transfer mechanisms and size effects. Struct. Concr. 2026, 27, 1599–1623. [Google Scholar] [CrossRef] [Scilit]
- Hamrat, M.; Boulekbache, B.; Chemrouk, M.; Amziane, S. Shear Behaviour of RC Beams without Stirrups Made of Normal Strength and High Strength Concretes. Adv. Struct. Eng. 2010, 13, 29–41. [Google Scholar] [CrossRef] [Scilit]
- Kani, G.N.J. How safe are our large reinforced concrete beams? J. Proc. 1967, 64, 128–141. [Google Scholar] [CrossRef] [Scilit] [PubMed]
- Alhayani, A.A.; Almssad, A.; Al-Gburi, M. Size and Location Influence of Opening on Shear Capacity of RC Deep Beams Using ANN. J. Asian Archit. Build. Eng. 2026. [Google Scholar] [CrossRef] [Scilit]
- Al-Gburi, M.; Alhayani, A.A.; Almssad, A. Artificial Neural Network Model for Evaluating Load Capacity of RC Deep Beams. Buildings 2025, 15, 1371. [Google Scholar] [CrossRef] [Scilit]
- Bažant, Z.P.; Yu, Q. Designing Against Size Effect on Shear Strength of Reinforced Concrete Beams Without Stirrups: II. Verification and Calibration. J. Struct. Eng. 2005, 131, 1886–1897. [Google Scholar] [CrossRef] [Scilit]
- Bažant, Z.P.; Le, J.-L. Probabilistic Mechanics of Quasibrittle Structures: Strength, Lifetime, and Size Effect; Cambridge University Press: Cambridge, UK, 2017. [Google Scholar] [CrossRef] [Scilit]
- Mazloom, M. Concrete Fracture Mechanics: Failure Analysis, Modeling, and Applied Examples of Reinforcement; Woodhead Publishing: Cambridge, UK, 2025; ISBN 978-0-443-29236-1. [Google Scholar]
- Girotto, G.F.; Araújo, A.L.S.; Prado, L.P.; Lantsoght, E.O.L.; Figueiredo, E.; Sousa, A.M.D.D. Size Effect of Slender and Thick Reinforced Concrete Members Without Transverse Reinforcement Failing in Shear: Parameter Analyses and Code Predictions. Buildings 2026, 16, 1234. [Google Scholar] [CrossRef] [Scilit]
- Jaber, H.T.; Sarsam, K.F.; Muhammad, B.R. Numerical study on the shear strength of reinforced concrete beams using ABAQUS. AIP Conf. Proc. 2023, 2651, 020014. [Google Scholar] [CrossRef] [Scilit]
- Oh, G.-S.; Son, D.-H.; Choi, H.-K.; Bae, B.-I.; Choi, C.-S. Shear Strength Analysis of Steel Fiber-Reinforced Concrete Beams without Stirrups Considering Size Effect. J. Korea Concr. Inst. 2024, 36, 367–374. [Google Scholar] [CrossRef] [Scilit]
- Corrado, M.; Ventura, G.; Carpinteri, A. Experimental evidences of flexural to shear to crushing failure mode transition in reinforced concrete beams without stirrups. Eng. Struct. 2022, 271, 114848. [Google Scholar] [CrossRef] [Scilit]
- Jin, L.; Zhang, J.; Song, B.; Li, D.; Li, P.; Du, X. Effect of stirrups on shear performance of geometrically-similar reinforced concrete deep beams: An experimental study. Eng. Struct. 2023, 295, 116883. [Google Scholar] [CrossRef] [Scilit]
- Reineck, K.-H.; Bentz, E.C.; Fitik, B.; Kuchma, D.A.; Bayrak, O. ACI-DAfStb Database of Shear Tests on Slender Reinforced Concrete Beams without Stirrups. ACI Struct. J. 2013, 110, 867–876. [Google Scholar] [CrossRef] [Scilit]
- ACI Committee 318. Building Code Requirements for Structural Concrete (ACI 318-19) and Commentary; American Concrete Institute: Farmington Hills, MI, USA, 2019. [Google Scholar]
- Mofidi, A.; Mirzabagheri, S.; Nasrollahzadeh, K.; Rahnamayan, S. Comprehensive Multi-Metric Comparison of One-Way Shear Models for Reinforced Concrete Beams without Shear Reinforcement. ACI Struct. J. 2026, 123, 295–308. [Google Scholar] [CrossRef] [Scilit]
- Fitik, B. Updating, Maintaining and Expanding the ACI-DAfStb Databases (Shear, Torsion and Shear Friction) [Research Project]. Stuttgart University of Applied Sciences. Funded by Deutscher Ausschuss für Stahlbeton (DAfStb). (2025–2028). Available online: https://www.hft-stuttgart.com/research/projects/current/aci-dafstb-databases#:~:text=The%20research%20project%20aims%20to%20update%2C%20maintain%2C%20and,in%20the%20areas%20of%20shear%2C%20torsion%20and%20shear-friction (accessed on 12 November 2026).
- EN 1992-1-1:2023; Eurocode 2: Design of Concrete Structures—Part 1-1: General Rules and Rules for Buildings (Second Generation). European Committee for Standardization: Brussels, Belgium, 2023.
- De Wilder, K.; De Roeck, G.; Vandewalle, L. Experimental analysis of the shear behaviour of prestressed and reinforced concrete beams. Eur. J. Environ. Civ. Eng. 2018, 22, 288–314. [Google Scholar] [CrossRef] [Scilit]
- Al-Gburi, M.; Alhayani, A.A.; Almssad, A. A Transparent ANN–Excel Model for Shear Strength of Steel Fiber-Reinforced Concrete Beams: Parametric Analysis, and Design Implications. Buildings 2026, 16, 3234. [Google Scholar] [CrossRef] [Scilit]
- Castillo, R.; Okumus, P.; Khorasani, N.E.; Chandola, V. Machine Learning for Shear Strength of Reinforced Concrete Beams. ACI Struct. J. 2022, 119, 83–94. [Google Scholar] [CrossRef] [Scilit]
- Negi, B.S.; Jain, K. Shear strength predicting models for steel fiber-reinforced concrete beams without stirrups: A review. J. Struct. Integr. Maint. 2024, 9, 2431462. [Google Scholar] [CrossRef] [Scilit]
- Rasmussen, C.E.; Williams, C.K.I. Gaussian Processes for Machine Learning; MIT Press: Cambridge, MA, USA, 2006. [Google Scholar]
- Alvandkoohy, A.; Shafaei, J.; Golabpour, A. Prediction of shear strength in exterior reinforced concrete joints using kernel-based Gaussian Regression. Sci. Rep. 2026, 16, 29097. [Google Scholar] [CrossRef] [Scilit] [PubMed]
- Yu, Z.; Li, B. Generalizing Shear Strength Prediction in Reinforced Concrete Beams with Out-of-Distribution Data. ACI Struct. J. 2025, 122, 141–153. [Google Scholar] [CrossRef] [Scilit]
- Haq, M.Z.U.; Jia, Y. Physics guided explainable machine learning for shear capacity prediction of steel fiber reinforced concrete beams without stirrups. Discov. Civ. Eng. 2026, 3, 89. [Google Scholar] [CrossRef] [Scilit]
- Leonhardt, F.; Walther, R. Schubversuche an Einfeldrigen Stahlbetonbalken mit und ohne Schubbewehrung (Deutscher Ausschuss Für Stahlbeton, Heft 151); Wilhelm Ernst & Sohn: Berlin, Germany, 1962. [Google Scholar]
- Ghannoum, W.M. Size Effect on Shear Strength of Reinforced Concrete Beams. Master’s Thesis, Department of Civil Engineering and Applied Mechanics, McGill University, Montréal, QC, Canada, 1998. [Google Scholar]
- Cavagnis, F.; Simões, J.T.; Fernández Ruiz, M.; Muttoni, A. Shear Strength of Members without Transverse Reinforcement Based on Development of Critical Shear Crack. ACI Struct. J. 2020, 117, 103–118. [Google Scholar] [CrossRef] [Scilit]
- Mphonde, A.G.; Frantz, G.C. Shear Tests of High- and Low-Strength Concrete Beams without Stirrups. J. Proc. 1984, 81, 350–357. [Google Scholar] [CrossRef] [Scilit] [PubMed]
- Abdullah, M.; Usman, M.; Zhang, M.; Wang, W.; Fang, C. Data-driven and mechanism-based prediction model for the degraded shear strength of corroded RC beams. Case Stud. Constr. Mater. 2026, 24, e06143. [Google Scholar] [CrossRef] [Scilit]
- Al-Rawe, H.S.; Al-Gburi, M.; Almassad, A. Ferrocement Laminates for Strengthening the Flexural Behavior of Reinforced Concrete Beams. J. Asian Archit. Build. Eng. 2026. [Google Scholar] [CrossRef] [Scilit]
- Ahmad, H.; Ejaz, M.F.; Riaz, M.R.; Shahzad, S.; Kadri, S.E.; Kmeid, M.G. Machine learning-based prediction of compressive and flexural strength of wheat straw reinforced sustainable gypsum composites. Sci. Rep. 2026, 16, 15087. [Google Scholar] [CrossRef] [Scilit] [PubMed]

Disclaimer/Publisher’s Note: The statements, opinions and data contained in all publications are solely those of the individual author(s) and contributor(s) and not of MDPI and/or the editor(s). MDPI and/or the editor(s) disclaim responsibility for any injury to people or property resulting from any ideas, methods, instructions or products referred to in the content. |
© 2026 by the authors. Licensee MDPI, Basel, Switzerland. This article is an open access article distributed under the terms and conditions of the Creative Commons Attribution (CC BY) license.