


Abstract
Additively manufactured structural composites exhibit geometry-dependent responses that require both accurate prediction and defensible validation. This study develops a robustness-aware explainable machine-learning framework for apparent modulus of elasticity (MOEapp), modulus of rupture (MOR), and nominal maximum section shear stress (τmax) of extrusion-printed PrinTimber composite beams. An ABAQUS finite-element framework benchmarked against single- and two-layer beams was extended to 100 configurations spanning 1–10 layers, widths of 42 mm and 84 mm, and span-to-depth ratios (S/D) of 6–30. Because span-to-width ratio is an exact deterministic function of the primary geometry, the analysis uses the independent predictor set [layer count, width, S/D]. Seven surrogates—linear regression, quadratic response-surface modeling, Random Forest, artificial neural network, XGBoost, LightGBM, and Gaussian-process regression—were compared under nested cross-validation with matched tuning budgets. XGBoost gave the highest out-of-fold R2 for all three responses: MOEapp (0.964), MOR (0.702), and τmax (0.836). Across 50 repeated holdouts, it remained most stable for MOEapp (0.941 ± 0.042) and τmax (0.833 ± 0.119), while MOR stayed partition-dependent. Repeated SHAP over 50 partitions identified S/D as dominant for MOEapp (76.4%) and τmax (74.5%) and coupled layer-count/S/D control for MOR. A local ±20% cohesive-parameter perturbation changed predicted ultimate load by, at most, 2%. The framework supports interpretable screening within the modeled design domain while separating numerical-surrogate accuracy from experimental generalization.
1. Introduction
Additive manufacturing (AM) is increasingly investigated for construction and structural applications because it enables automated fabrication, geometric customization, near-net-shape production, and potentially, reduced material waste [1]. Renewable and bio-based feedstocks provide an additional route for reducing dependence on resource-intensive materials. Wood and lignocellulosic derivatives are particularly attractive for extrusion-based AM because of their renewable origin, availability from industrial residues, and potential for circular material use [2].
Structural use of additively manufactured wood-based composites remains comparatively underdeveloped. Material anisotropy, printability, dimensional stability, interlayer bonding, mechanical-property variability, and scale-up remain major challenges [2]. These issues become more important for load-bearing members because layer-by-layer deposition introduces interfaces whose stiffness, strength, and fracture characteristics may govern structural response. Wood–sodium silicate composites provide one bio-based route toward printed structural components; prior work established the material-processing system [3,4] and demonstrated experimentally that PrinTimber beam stiffness, bending strength, and shear response vary with slenderness and layer configuration [5,6].
Validated FE modeling can extend an experimental program across a larger geometric design space, but the resulting simulation database should not be treated as equivalent to independent experiments. Surrogate models trained on FE data primarily learn the numerical response surface, and their apparent accuracy can be inflated by data leakage, redundant engineered predictors, or favorable train–test partitions. These concerns are especially relevant for small deterministic databases, where a single 80/20 split may contain only a small number of genuinely independent response levels [7,8]. For deterministic computer experiments in particular, Gaussian-process and response-surface models are established surrogate baselines [9,10,11], and recent work argues that interpretable surrogates should be judged on robustness and decision context as well as on error [12].
Recent AM studies illustrate both the opportunity and the methodological challenge of data-driven modeling. Der et al. [13] investigated CO2-laser cutting of four fused-filament-fabrication (FFF) thermoplastics—PLA, carbon-fiber-reinforced PLA (PLA-CF), Acrylonitrile Styrene Acrylate (ASA), and Polyethylene Terephthalate Glycol (PETG)—through 72 experimental trials. Their input space combined material type, plate thickness, laser power, and cutting speed, while four distinct manufacturing-quality responses were predicted: kerf-opening deviation, kerf angle, bottom heat-affected-zone extent, and material-removal rate. Seven regression algorithms were compared—linear regression, decision tree, Random Forest, CatBoost, support-vector regression, k-nearest neighbors, and multilayer perceptron—and Random Forest and multilayer perceptron provided the strongest overall predictive performance, with high R2 and low error measures across the response variables. The material-specific results were also response-dependent: PLA-CF produced the highest material-removal rate, whereas ASA and PETG showed greater dimensional stability, with smaller kerf and thermal-distortion measures. This study is directly relevant to the present work because it demonstrates that AM performance is inherently multi-response, that model rankings should be evaluated across several outputs rather than declared from a single target, and that ML can support process optimization only when prediction quality is considered together with the physical meaning of each response.
Hariharan et al. [14] addressed a complementary AM problem by coupling extreme high-speed laser material application (EHLA), high-throughput microstructural/mechanical characterization, and explainable ML for alloy development. High-manganese steel was alloyed in situ with Al over a targeted 0–10 wt.% range while laser power and volumetric energy input were varied to generate a broad set of composition–process conditions. Large-area EBSD, local chemistry measurements, and spherical nanoindentation were used to establish process–structure–property relationships. For the data-driven stage, grain-scale descriptors were assembled into an 18,873-row dataset containing grain area, grain aspect ratio, grain-average misorientation, and phase fractions of austenite, ferrite, and ε-martensite. The data were randomized, highly correlated features were removed, a 70/30 train–test split was used, and 10-fold cross-validation supported model assessment. Among more than 20 candidate models, a gradient boosting regressor gave the best reported performance for indentation-derived yield-strength prediction (R2 = 0.89; MSE = 0.0004). SHAP analysis then linked the prediction to microstructural features, showing phase fractions—particularly the austenite/ferrite balance—as dominant contributors, with lower austenite and higher ferrite generally associated with higher predicted yield strength. Importantly, the authors explicitly restricted model generalization to the bounds of the training/testing data and cautioned that SHAP associations can be biased by the feature space and should not automatically be interpreted as causal. These points closely motivate the present emphasis on repeated validation, domain-limited surrogate claims, feature-dependence checks, and cautious physical interpretation of SHAP.
Together, these studies show two complementary ways in which ML can accelerate AM research: response-specific prediction of manufacturing quality and explainable learning of process–structure–property relations from high-throughput experiments. Neither study, however, addresses structural-member responses generated from an interface-sensitive FE design space in which one target is, itself, estimated at group level. The present work, therefore, extends these data-driven AM concepts toward leakage-aware validation, response-specific surrogate comparison, and repeated explainability for structural stiffness, strength, and shear responses of printed composite beams.
Explainability is equally important. SHapley Additive exPlanations (SHAP) assign additive contributions to individual predictors [15,16]. For structural engineering, this enables a surrogate to be evaluated not only by prediction error but also by whether the learned feature hierarchy is mechanically plausible. However, dependence among predictors can redistribute attribution credit [17]. In the present design, span-to-width ratio (S/W) is exactly determined by layer count, beam width, S/D, and fixed layer thickness, so it should not be interpreted as an independent physical variable. The revised study, therefore, uses only the independent design variables [n, b, S/D] for its primary models and repeated SHAP analysis. Several recent structural-engineering studies reinforce the need for robust validation. Gray et al. [18] trained six supervised ML algorithms on a validated FE database of 105 cold-formed steel beam models, used 50 repeated train/test splits, quantified uncertainty, and applied SHAP; CatBoost achieved R2 = 0.959 with 6.49% MAPE. Lazaridis and Thomoglou [19] compared and tuned 17 ML models using 113 experimental masonry-wall examples, combined strong regressors into a voting model (R2 = 0.95; MAPE = 8.03%), interpreted the predictors, and deployed the final tool in a web application. Zhang et al. [20] demonstrated a graph-neural-network framework for complex train–bridge systems in which the graph structure itself can evolve beyond known configurations. Collectively, these studies emphasize that model comparison, leakage control, interpretability, and explicit definition of the validation domain are central to credible engineering ML.
Accordingly, this study develops a robustness-aware, multi-response surrogate framework for additively manufactured PrinTimber beams. The objectives are to (1) compare seven statistical and ML surrogates under matched predictors and nested tuning; (2) quantify ranking stability across 50 repeated partitions; (3) assess feature-attribution stability with repeated SHAP using only independent geometric predictors; (4) quantify the local sensitivity of a representative higher-layer FE prediction to cohesive-interface parameters; and (5) distinguish interpolation of the deterministic FE design space from experimental or off-grid generalization.
2. Materials and Methods
2.1. Overall Research Framework
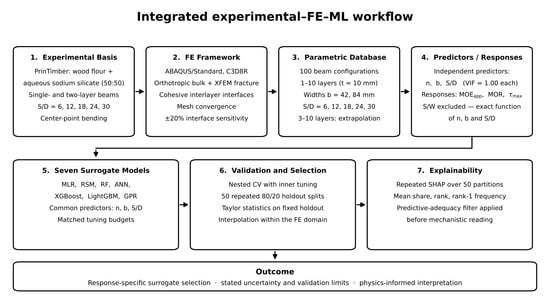
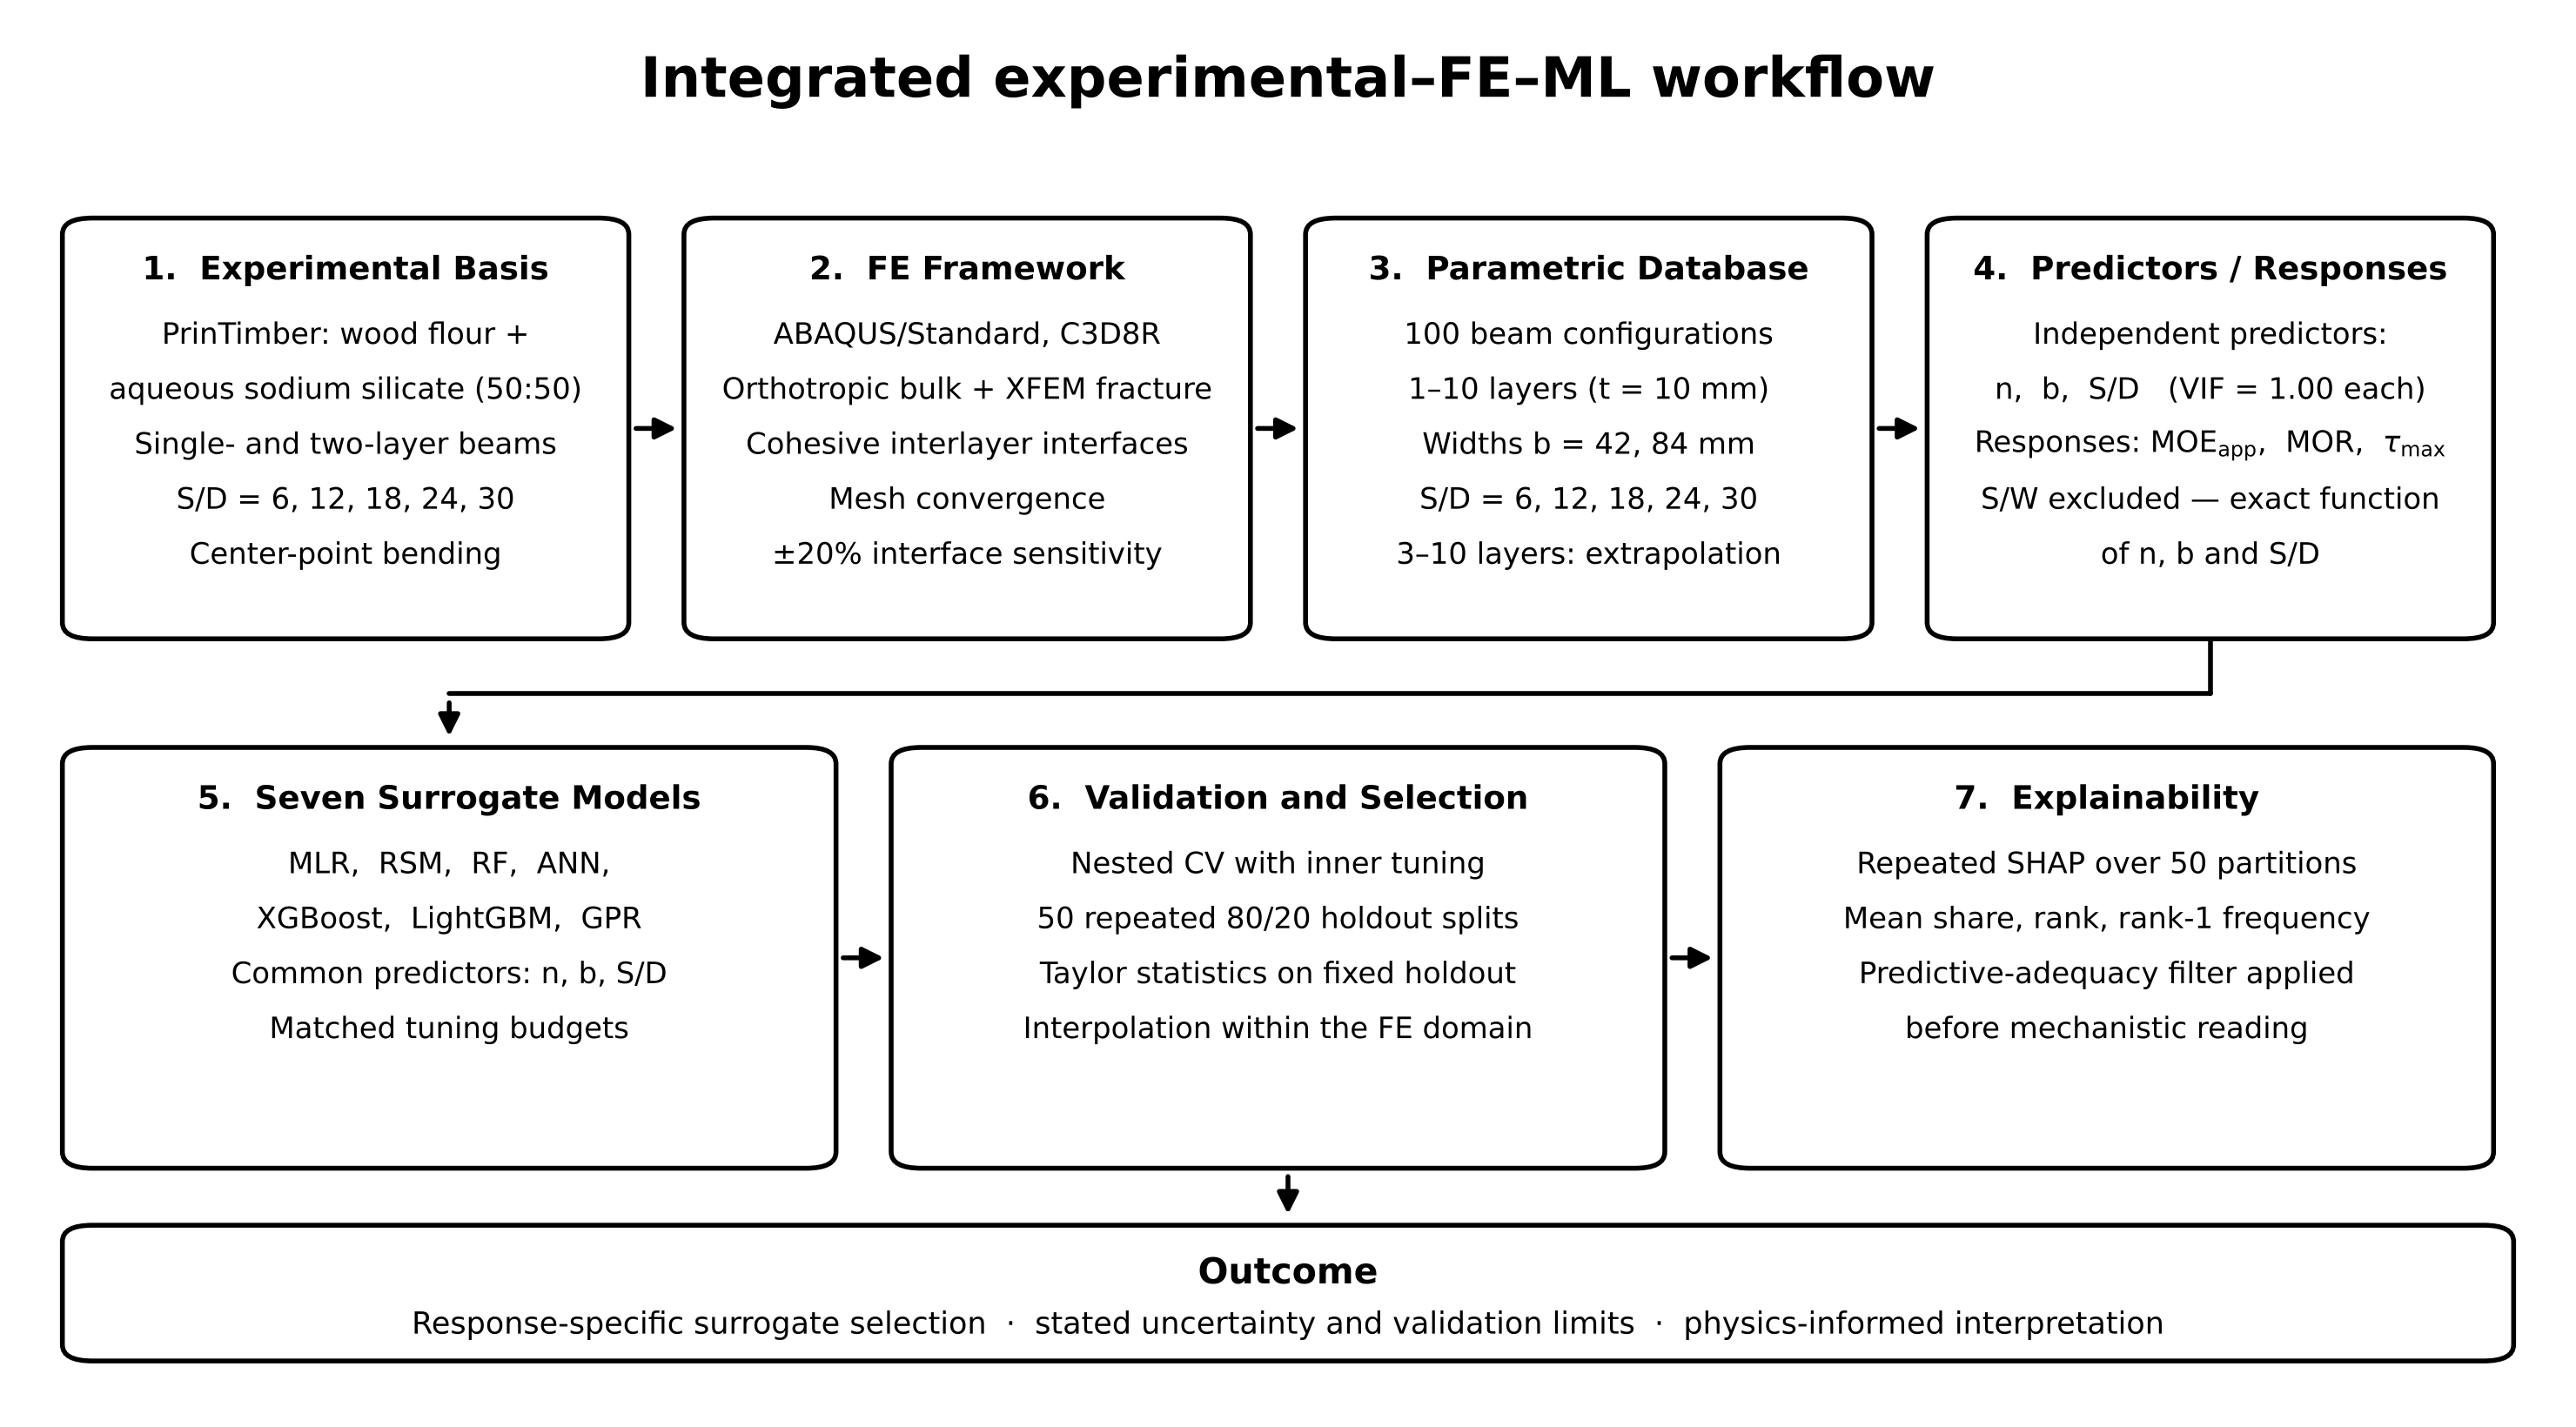
The workflow combines experimental evidence, FE simulation, surrogate modeling, resampling-based validation, and explainable AI. Single- and two-layer experimental beams provide the physical basis for the FE framework; the calibrated constitutive and interfacial model is then used to generate a 100-configuration factorial design. The revised surrogate analysis uses three independent geometric predictors, seven candidate regressors, response-appropriate nested cross-validation, 50 repeated holdouts, repeated SHAP interpretation, and a local cohesive-interface sensitivity analysis.
2.2. Experimental Basis and Fe Validation Scope
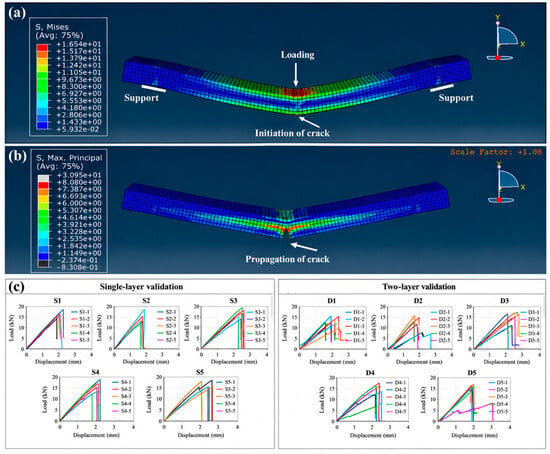
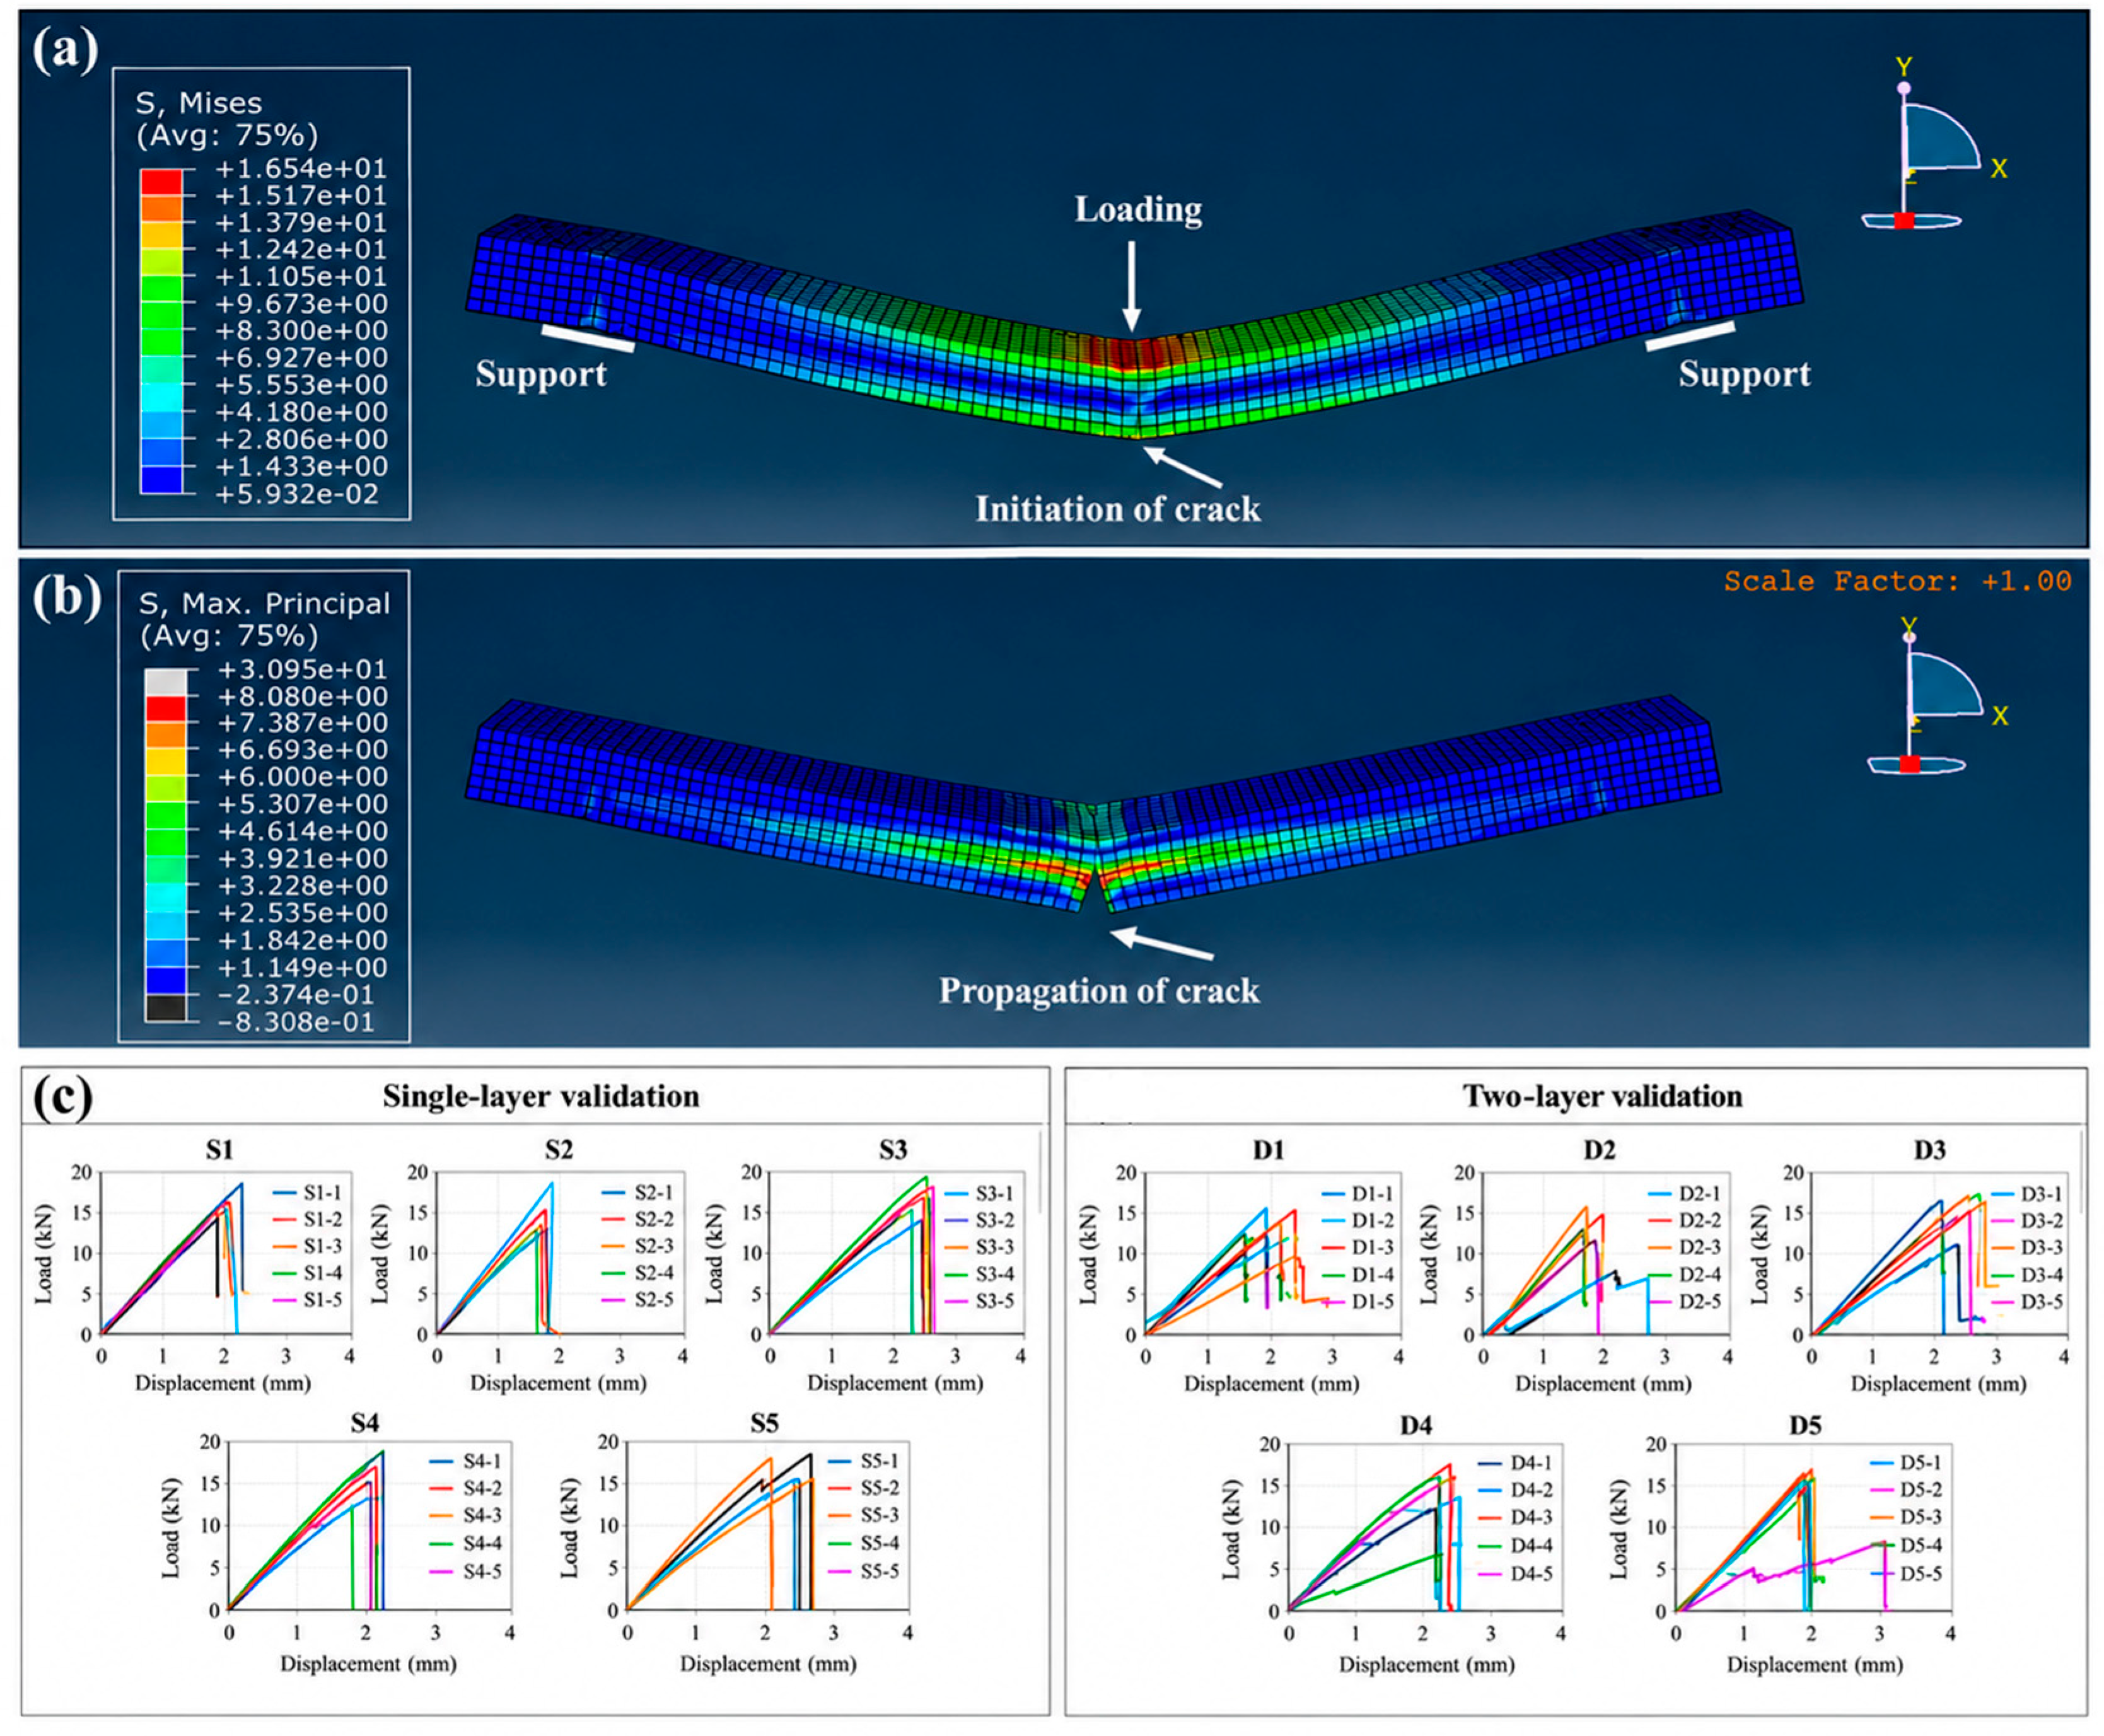
The underlying experimental program used a 50:50 dry-weight mixture of wood flour and aqueous sodium silicate. Single- and two-layer specimens were fabricated and tested under center-point loading over S/D = 6, 12, 18, 24, and 30, with six replicate specimens at each ratio for each layer configuration (60 specimens total) [5,6]. The FE framework reproduced the global load–deflection behavior and experimentally observed transition from material-dominated fracture to combined fracture/delamination behavior in the validated one- and two-layer configurations. The validation scope is deliberately stated narrowly: beams containing three to ten layers are parametric extrapolations of the validated constitutive and interfacial framework rather than configurations independently verified by physical testing.
In the physical PrinTimber specimens, adjacent layers were produced in a continuous extrusion-additive-manufacturing process. The second layer was deposited directly onto the first without a separate gluing step; the sodium-silicate-containing material therefore formed the interlayer bond in situ during printing, followed by oven drying/curing. There are no discrete mechanical connectors between layers in the tested beam system. In the FE model, this continuously bonded printed interface is idealized by the surface-based cohesive traction–separation formulation described below, allowing the bond to remain elastic, initiate damage, and progressively debond. Figure 1 summarizes the overall workflow, and Figure 2 shows the experimental and numerical basis of the FE framework.
Figure 1.
Integrated experimental, finite-element (FE) and machine-learning workflow used to generate, validate, and interpret the surrogate models.
Figure 2.
Experimental basis and finite element (FE) validation supporting the surrogate database: (a) representative FE simulation illustrating crack initiation; (b) subsequent crack propagation under three-point bending; and (c) experimental load–deflection responses of single-layer and two-layer composite beams used for FE validation across S/D = 6–30. Experimental datasets were obtained from [5,6].
2.3. Finite-Element Model (FEM)
The beam models were implemented in ABAQUS/Standard 2023 (Dassault Systèmes Simulia Corp., Providence, RI, USA) [21] and solved using the implicit equilibrium framework under displacement-controlled center-point loading. The dominant nonlinearities represented in the model are material and interface nonlinearities: progressive XFEM bulk cracking and cohesive damage initiation/evolution. The archived model documentation available for this revision does not support a separately verified statement about a user-selected geometric-nonlinearity (NLGEOM) setting; therefore, no unverified solver-control or tolerance values are introduced here. The bulk PrinTimber material was represented by orthotropic elastic engineering constants together with XFEM-based bulk cracking. Eight-node linear brick elements with reduced integration and hourglass control (C3D8R) were used in a structured mesh. Center-point displacement was applied through a rigid analytical loading surface, with pin/roller support conditions representing the experimental bending setup. Adjacent printed layers were coupled through surface-based cohesive interactions using a traction–separation law, quadratic nominal-stress damage initiation, and energy-based damage evolution. This combination enables bulk tensile fracture and interlayer debonding to occur within the same model The constitutive and interfacial parameters are listed in Table 1 [21,22,23].
Table 1.
FE material and cohesive-interface parameters used in the parametric model.
The bulk elastic and strength properties were obtained from dedicated characterization of the wood–sodium silicate composite. Cohesive stiffness, strength, and fracture-energy parameters were informed by two-layer in-plane shear response and calibrated to reproduce the observed delamination tendency in multilayer specimens; the mixed-mode exponent and friction coefficient were assigned representative values for the interface formulation. XFEM used a maximum-principal-stress initiation criterion with energy-based linear softening and a viscosity regularization of 10−5.
Mesh convergence was checked for a two-layer S/D = 30 beam using characteristic element sizes of 20, 15, 10, 5, 3, 2, and 1 mm. The corresponding predicted peak loads were 260, 220, 191, 170, 166, 163, and 161 N, respectively. The change from 5 to 3 mm was 2.35%, after which further refinement produced progressively smaller changes. A 5 mm characteristic element size was, therefore, adopted for the full parametric study as a balance between convergence and computational cost.
2.4. Parametric Design Space and Independent Predictors
Following validation, the FE framework was extended to one through ten layers, two widths, and five S/D levels. Individual layer thickness was fixed at t = 10 mm, so total depth h = nt and span L = (S/D)h. The factorial combination produced 100 FE configurations. Table 2 summarizes the design space.
Table 2.
Parametric FE design space.
The engineered span-to-width ratio satisfies S/W = L/b = (S/D)(10n)/b and is, therefore, an exact deterministic nonlinear function of n, b, and S/D. The three primary predictors are mutually orthogonal in the balanced factorial design (VIF = 1.00 for each). When S/W is added, its VIF is 5.95 and the VIFs of n, b, and S/D increase to 3.23, 1.91, and 2.82, respectively. More importantly, the exact deterministic relationship makes four-feature attribution non-unique. The primary models therefore use X = [n, b, S/D], while S/W is treated only as a derived geometric descriptor rather than an independent ML input.
2.5. Structural Response Variables
2.5.1. Apparent Modulus of Elasticity (MOEapp) and Modulus of Rupture (MOR)
MOEapp was obtained from the linear-elastic portion of the center-point load–deflection response, following the static bending provisions of ASTM D198 [24]. For a simply supported beam under a midspan concentrated load,
where m = P/Δ is the elastic load–deflection slope. MOR was calculated from the peak bending moment,
where Pu is the FE peak load.
MOEapp = mL3/(48I), I = bh3/12,
MOR = 3PuL/(2bh2),
2.5.2. Nominal Maximum Section Shear Stress (τmax)
The reported τmax is a nominal maximum section shear stress evaluated at peak load, not a local FE stress or a material shear strength. For the rectangular section under center-point loading,
with Vmax = Pu/2 and A = bh. This terminology is used throughout the revision to avoid conflating a section-level demand measure with local cohesive traction or material failure stress.
τmax = 3Vmax/(2A) = 3Pu/(4bh),
2.6. Surrogate Models and Nested Hyperparameter Selection
Seven regressors were compared: multiple linear regression (MLR), quadratic response-surface modeling (RSM), Random Forest (RF) [25], artificial neural network (ANN), XGBoost [26], LightGBM [27], and Gaussian-process regression (GPR) [11]. All models were implemented in scikit-learn [28], The machine-learning analyses were conducted using Python (version 3.13.5), scikit-learn (version 1.8.0), XGBoost (version 3.1.3), and SHAP (version 0.50.0) apart from the two gradient-boosting libraries, and the ANN was trained with the Adam optimizer [29]. All models received the same three independent predictors. Response scaling was performed within each training fold using a transformed-target pipeline so that preprocessing was estimated from training data only. Predictor standardization was applied where required by the model architecture. Table 3 lists the model families and their inner-loop tuning grids.
Table 3.
Surrogate-model families and inner-loop tuning spaces.
The primary performance estimate used nested five-fold cross-validation. The outer loop used shuffled K-fold partitions, and each training fold contained an inner four-fold grid search. Hyperparameters were selected exclusively inside the corresponding outer training fold. This design prevents optimistic reuse of validation data during model selection.
2.7. Fifty-Partition Robustness Analysis
To quantify ranking sensitivity beyond the nested-CV estimate, all seven models were also evaluated across 50 repeated 80/20 partitions. All three responses used random observation-level holdouts. For each model–response pair, mean and standard deviation of R2, empirical 2.5th–97.5th percentile interval, mean MAE and RMSE, and model win rate were recorded.
The earlier leave-one-level-out diagnostics are interpreted only as factor-specific stress tests, not as directly comparable model-ranking statistics. Although the factorial design is internally balanced, omitting one layer level withholds 10 of 100 rows (10%), omitting one S/D level withholds 20 rows (20%), and omitting one width level withholds 50 rows (50%). These different test fractions and extrapolation distances can change R2 independently of model quality. For this reason, the revised primary ranking relies on matched nested cross-validation and repeated holdouts, while leave-one-level behavior is discussed only qualitatively where relevant.
2.8. Repeated SHAP Analysis
SHAP was used to quantify model-based feature contributions [15,16]. XGBoost was used as a common explanation architecture across the three responses so that feature shares could be compared without changing model family. Fifty independently fitted partitions were analyzed. Each repetition used an independent 80/20 random split. Model selection was performed using training data only. For each repetition, the SHAP background/masker was constructed only from the corresponding training data using an independent masker with, at most, 50 background samples. Model-agnostic permutation SHAP was then evaluated on held-out observations with max_evals = 100. For each feature, mean absolute SHAP magnitude, normalized share, rank, and rank-1 frequency were aggregated across the 50 repetitions. For MOR, a secondary sensitivity check repeated the interpretation summary using only partitions with test R2 ≥ 0.50; this threshold is used as a diagnostic filter rather than as a universal adequacy criterion.
SHAP was selected instead of LIME because the present objective requires both local additive attributions and consistent global aggregation across many repeated partitions. LIME remains valuable for local neighborhood explanations, but its result depends on the perturbation neighborhood and local surrogate specification. SHAP is not assumed to be universally superior; it is used here because its additive attribution structure directly supports the repeated global stability analysis required for this multi-response comparison.
2.9. Taylor Statistics and Interpretation Boundary
Taylor statistics were retained only as a descriptive assessment of correlation, predicted standard deviation, and centered RMS difference on held-out points [30]. They are not used as evidence of extrapolation to new geometric levels, new materials, or physical beams. Extrapolation claims in the earlier analysis were removed; the revised conclusions are restricted to the modeled FE domain unless otherwise stated.
2.10. Local Cohesive-Interface Sensitivity Analysis
To quantify whether a representative higher-layer prediction depends strongly on uncertain cohesive parameters, a one-factor-at-a-time local sensitivity analysis was performed for a seven-layer beam with b = 42 mm, h = 70 mm, S/D = 18, and L = 1260 mm. This configuration lies well beyond the experimentally validated one- and two-layer cases while avoiding an extreme S/D value. Three cohesive parameter families were varied independently by ±20%: elastic traction–separation stiffness (Knn, Kss, Ktt), damage-initiation strengths (tn0, ts0, tt0), and interface fracture energies (GIc,int, GIIc,int). Bulk XFEM properties, geometry, mesh, supports, and all other analysis settings were unchanged. The baseline peak load was Pu,0 = 1112.58 N. The response change and central normalized sensitivity were evaluated as
ΔPu(%) = 100(Pu,var − Pu,0)/Pu,0, SP = (Pu,+20 − Pu,−20)/(0.40Pu,0).
This study is intentionally described as local sensitivity of peak capacity, not global uncertainty propagation. Load–deflection and post-peak delamination histories were not available for all six perturbation runs, so no claims are made about the sensitivity of post-peak response.
3. Results and Discussion
3.1. Nested Cross-Validation Across Seven Surrogates
Nested cross-validated performance for all seven surrogates is reported in Table 4, and the corresponding out-of-fold coefficients are compared in Figure 3 together with the repeated-holdout distributions described in Section 3.2.
Table 4.
Nested cross-validated out-of-fold performance using the common independent predictor set [n, b, S/D].
Figure 3.
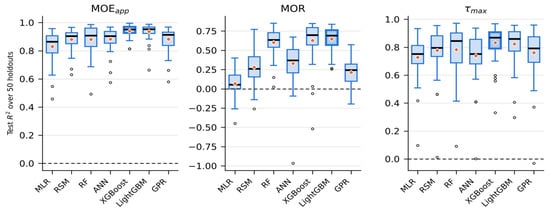
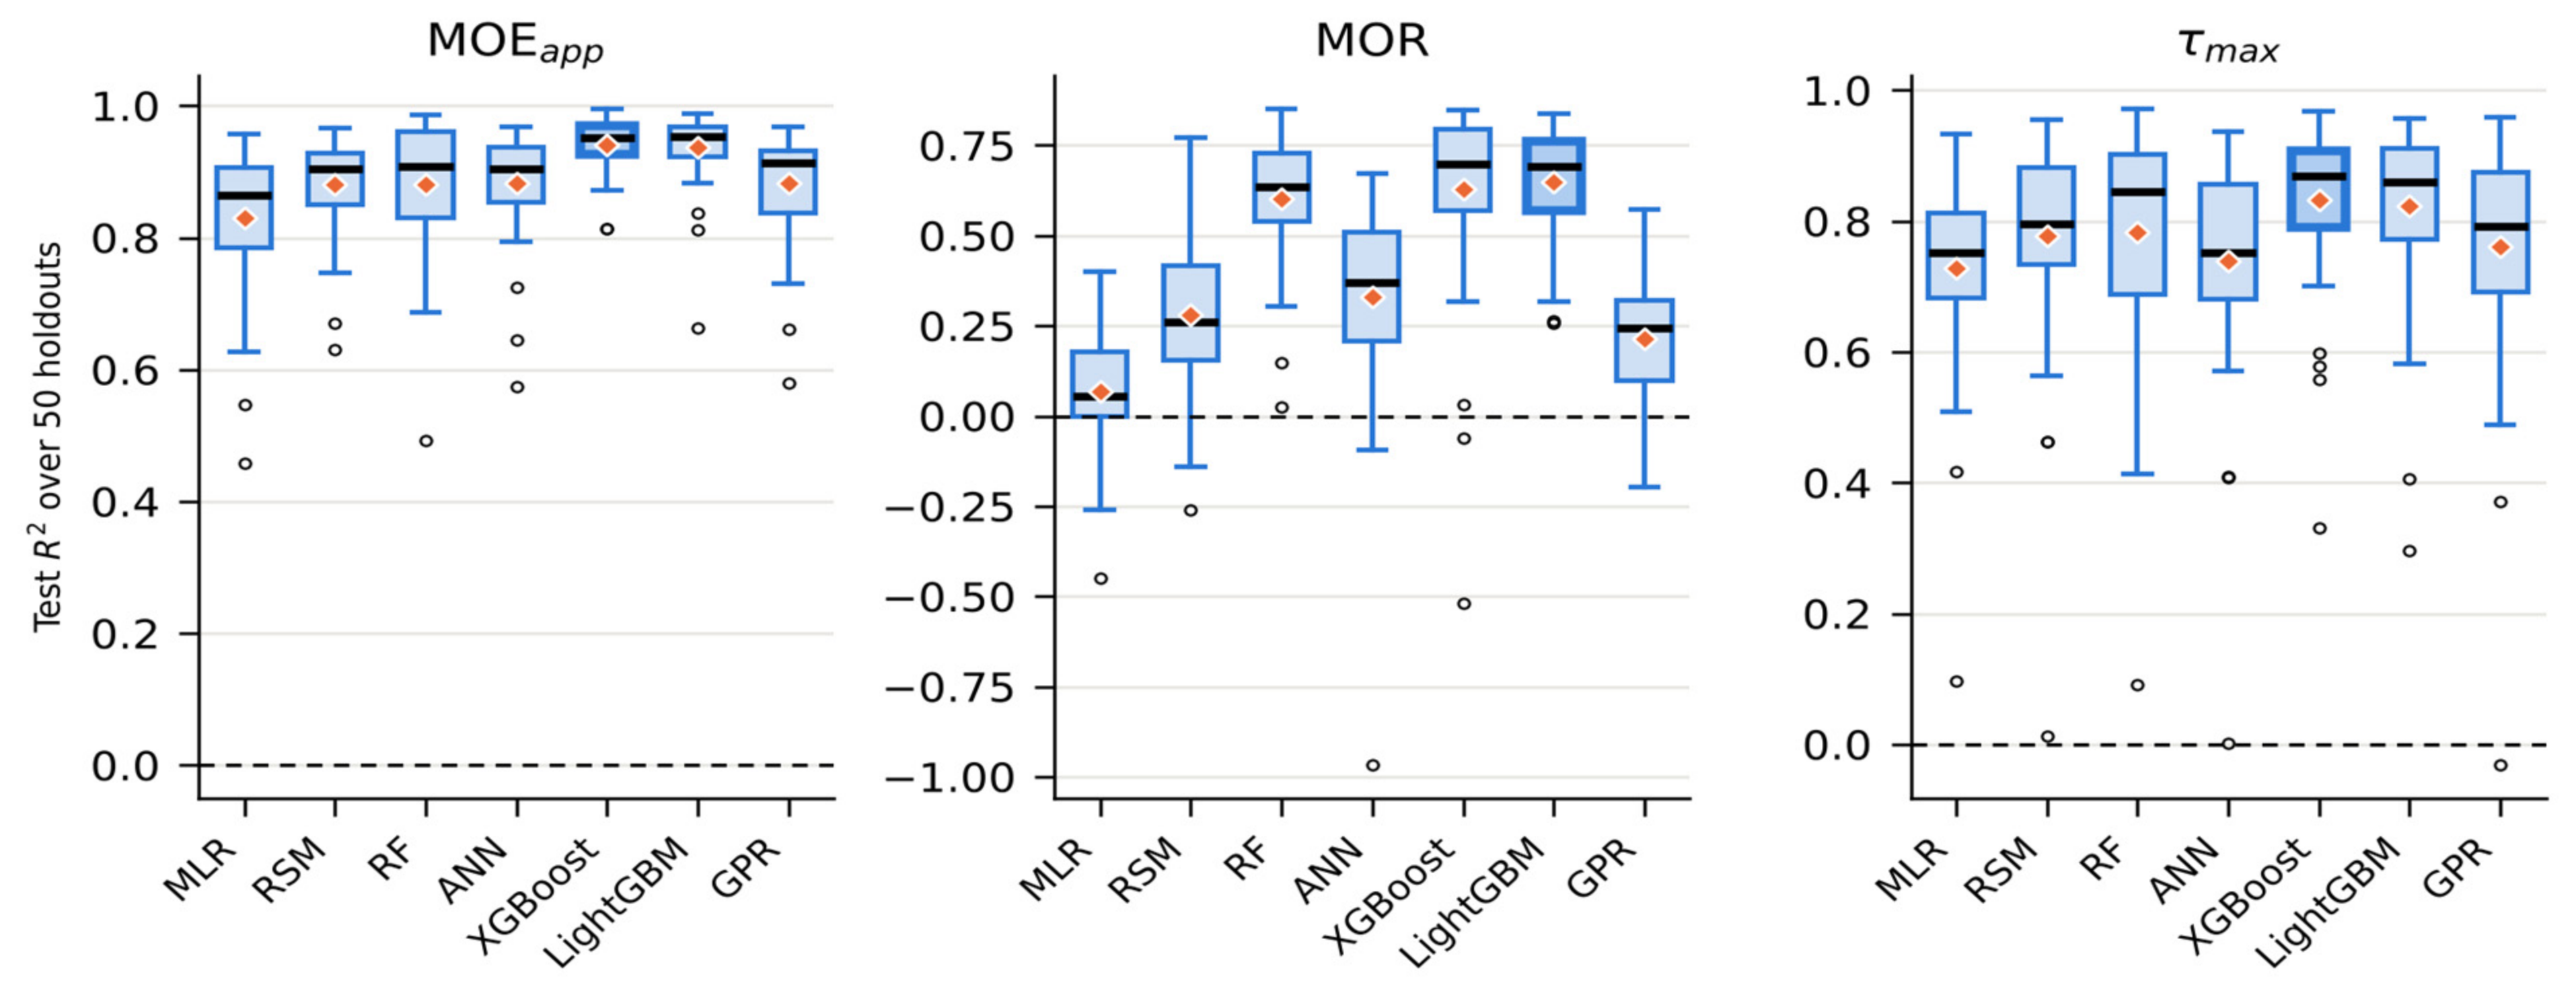
Distribution of test R2 across 50 repeated 80/20 holdout splits for the seven surrogate models and three structural responses. Boxes show the interquartile range and median; diamonds mark the mean; circles are individual splits beyond the whiskers. The dashed line marks R2 = 0.
The matched nested comparison changes several conclusions drawn from a single fixed holdout. XGBoost was the strongest surrogate for MOEapp (R2 = 0.964, RMSE = 164.3 MPa), MOR (R2 = 0.702, RMSE = 0.969 MPa), and τmax (R2 = 0.836, RMSE = 0.069 MPa). LightGBM was close to XGBoost for MOEapp (R2 = 0.955) and τmax (0.814), while RF and RSM were also competitive for τmax. MOR remained the most difficult response: although XGBoost reached 0.702, LightGBM (0.608) and RF (0.585) were materially lower, and the linear/GPR baselines were weak.
3.2. Robustness Across 50 Repeated Holdouts
Table 5.
Fifty-split random-holdout robustness for MOEapp, MOR, and τmax.
XGBoost remained the most stable MOEapp model, with mean R2 = 0.941 ± 0.042 and 60% of the 50 split-wise wins; LightGBM was very close in mean performance (0.937 ± 0.054) but won 28% of splits. For τmax, XGBoost again had the highest mean R2 (0.833 ± 0.119) and the highest win rate (42%), followed by LightGBM (0.824 ± 0.129; 30% wins).
MOR remained ranking-sensitive. LightGBM had the highest mean R2 (0.648 ± 0.150), whereas XGBoost had a slightly lower mean (0.628 ± 0.250) but the highest win rate (48%) and marginally lower mean MAE/RMSE. This combination does not support a single universal MOR winner; it supports identifying LightGBM and XGBoost as the strongest pair under different ranking criteria.
3.3. Repeated SHAP Feature Stability
Table 6.
Repeated XGBoost SHAP attribution across 50 held-out partitions using [n, b, S/D].
Figure 4.
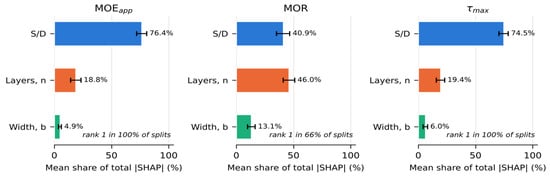
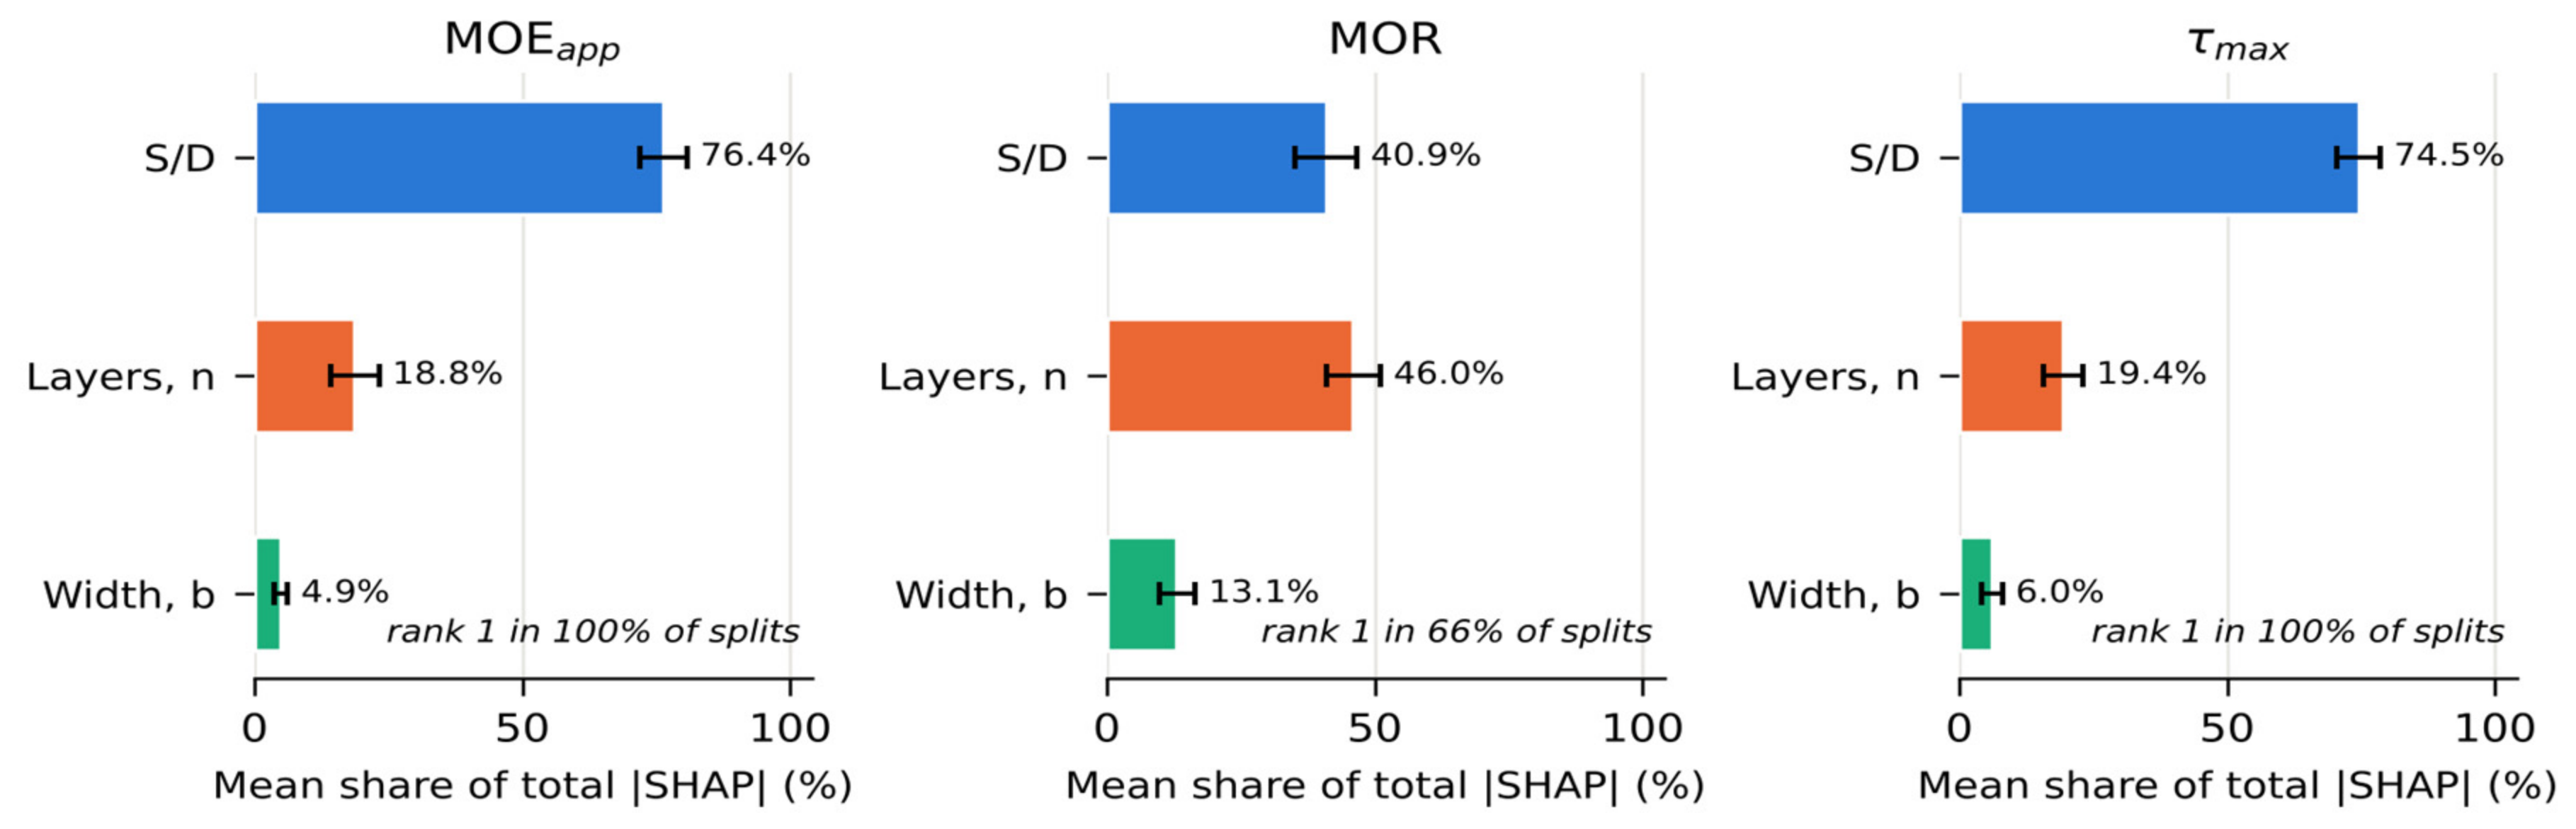
Mean share of total absolute SHAP attribution across 50 held-out partitions, with standard-deviation bars. Attributions use the independent predictor set [n, b, S/D] and a common XGBoost explanation architecture.
The repeated explanations are substantially more stable than a single SHAP plot. S/D was the dominant MOEapp feature in all 50 partitions and accounted for 76.35% of mean absolute SHAP magnitude; layer count and width contributed 18.77% and 4.88%. The same hierarchy occurred for τmax, where S/D contributed 74.54% and ranked first in every split. These responses can, therefore, be described as robustly slenderness-controlled within the modeled domain.
MOR exhibited a coupled hierarchy. Layer count contributed 45.99% and ranked first in 66% of partitions, while S/D contributed 40.90% and ranked first in 34%; width remained third at 13.11%. Restricting the diagnostic to the 42 of 50 MOR partitions with test R2 ≥ 0.50 changed the shares only slightly (46.51% layer count, 40.60% S/D, 12.89% width), indicating that the coupled interpretation is not driven solely by poorly predicted splits. The 0.50 filter is used only as a sensitivity check, not as a universal acceptance threshold.
3.4. Cohesive-Interface Sensitivity of a Higher-Layer Prediction
Table 7.
Local one-factor-at-a-time cohesive-interface sensitivity for the seven-layer, b = 42 mm, S/D = 18 beam.
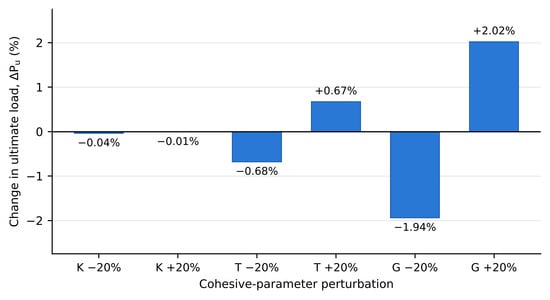
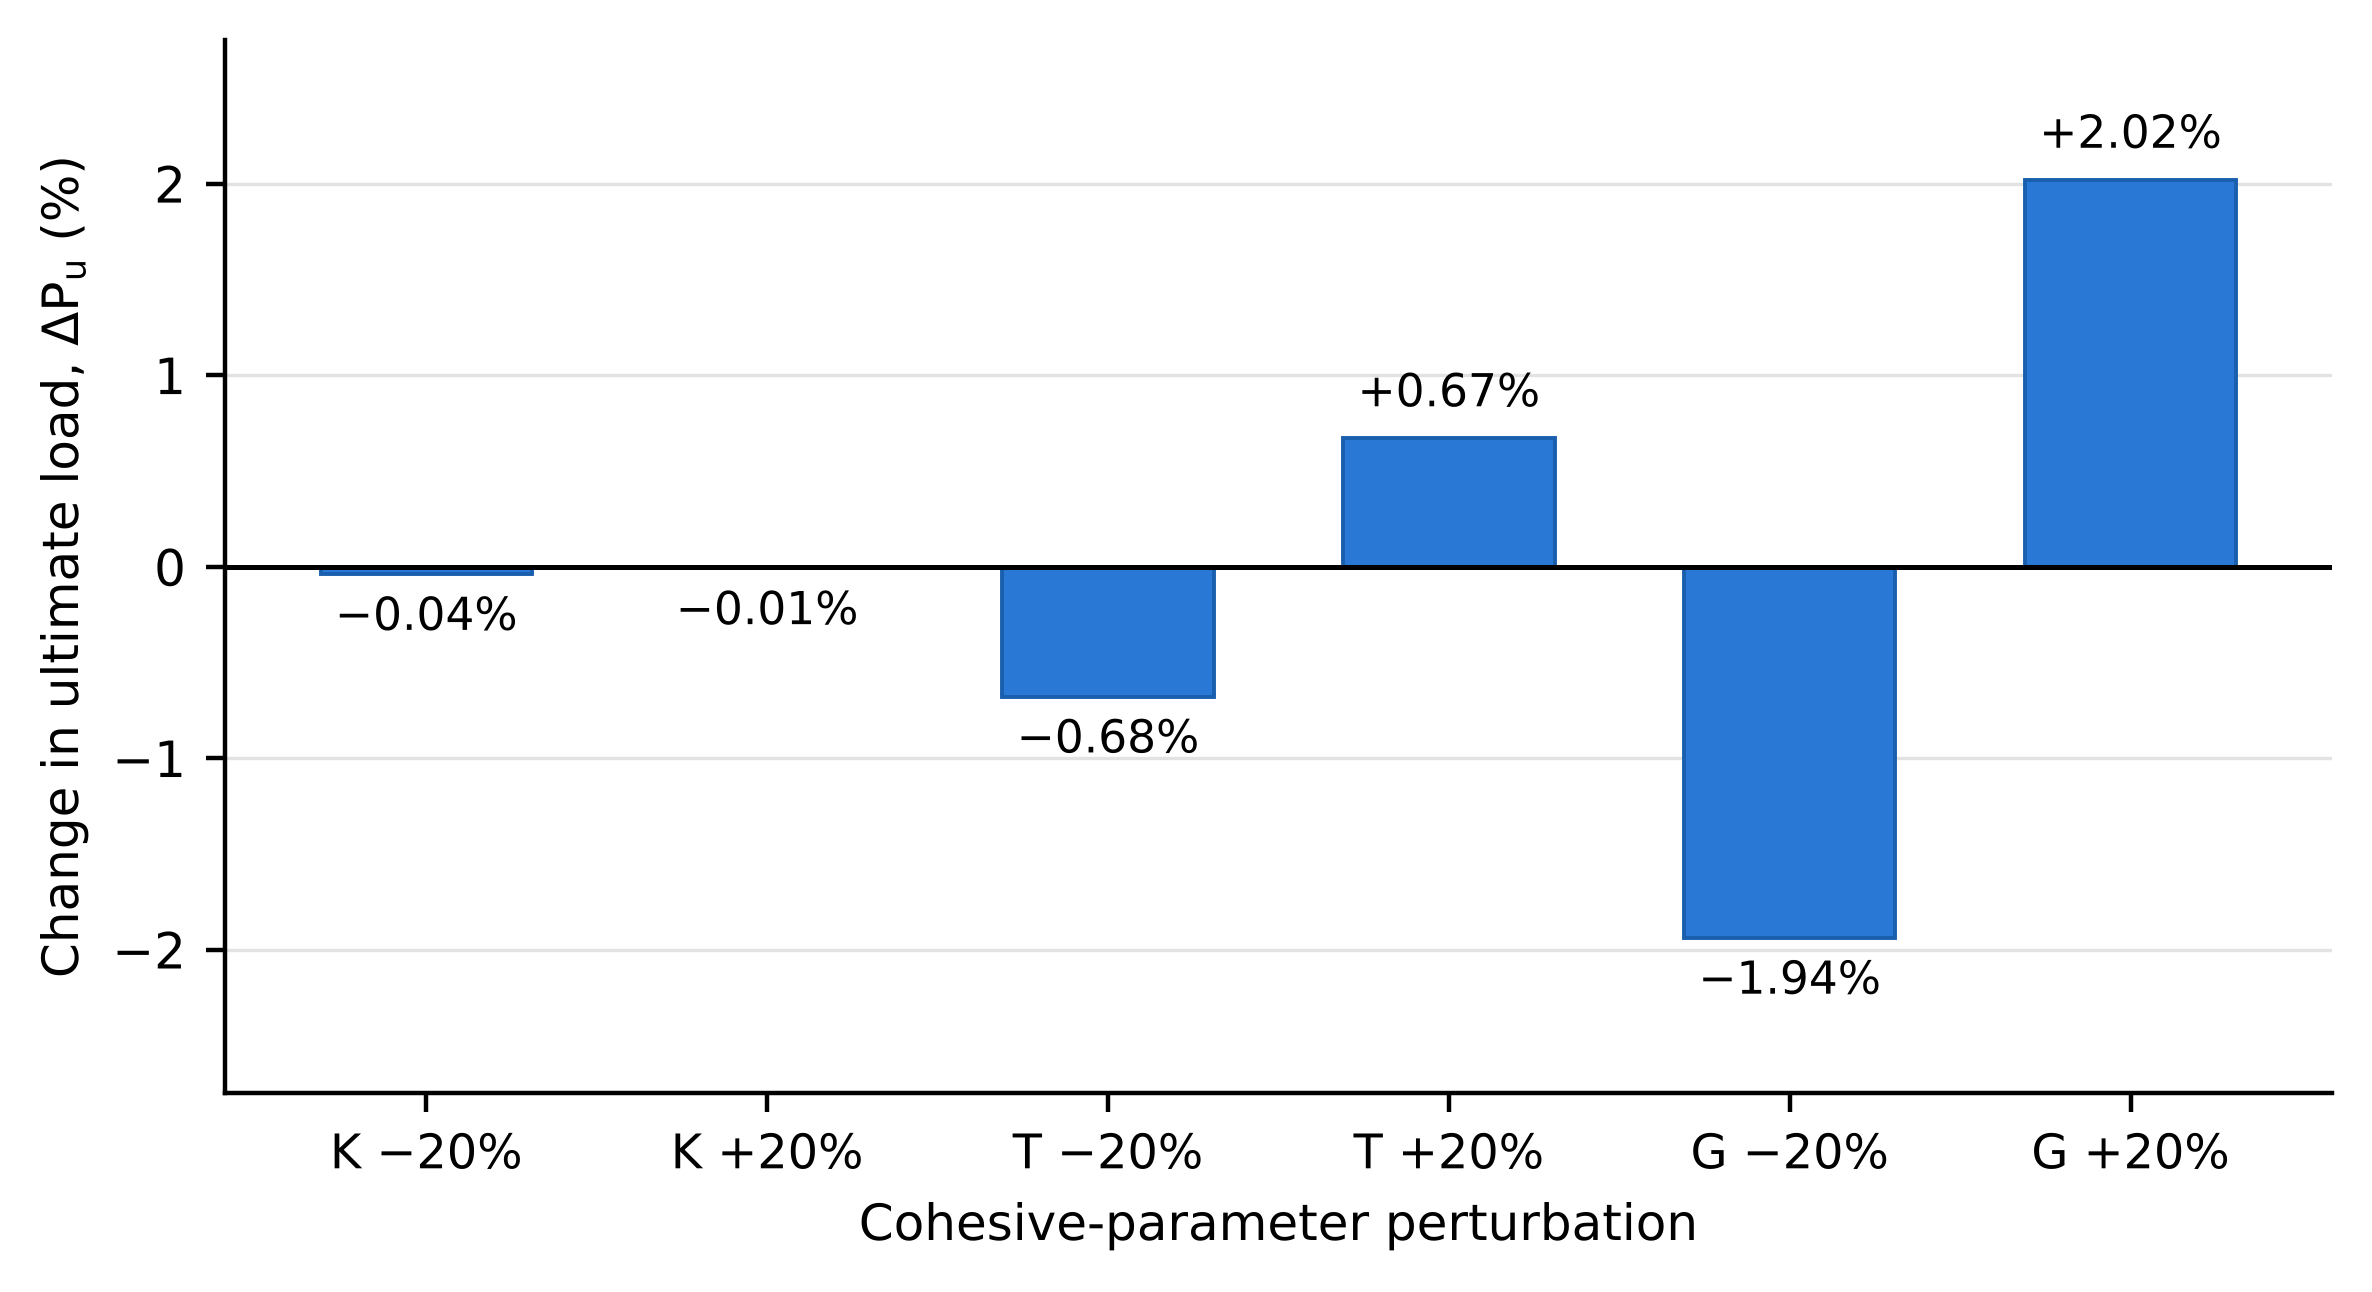
Figure 5.
Change in predicted ultimate load under ±20% perturbations of cohesive stiffness (K), damage-initiation strength (T), and interface fracture energy (G).
The peak-load prediction is nearly insensitive to the elastic cohesive stiffness over the tested ±20% interval: the maximum absolute change was only 0.04%. Damage-initiation strength had a larger but still small effect, approximately ±0.7%. Interface fracture energy was the most influential family, with −20% and +20% perturbations changing Pu by −1.94% and +2.02%, respectively. The normalized central sensitivities therefore follow Gc (0.0989) > interface strength (0.0337) ≫ cohesive stiffness (0.0008).
This result provides quantitative evidence that the representative seven-layer peak-capacity prediction is not strongly dependent on moderate uncertainty in the calibrated cohesive parameters. For context, within the same n = 7, b = 42 mm family, changing S/D from 6 to 30 changes Pu from 2341.77 to 563.33 N, whereas the largest ±20% cohesive perturbation changes the S/D = 18 peak load by only about 2%. Thus, for this representative family, the tested interface-parameter uncertainty is much smaller than the geometric variation in ultimate capacity and is unlikely to reverse the broad S/D-driven peak-load trend. This remains a local comparison, not proof of global robustness for every geometry, response, or post-peak delamination behavior; those questions require broader uncertainty analysis and consistent load–deflection/interface-damage histories.
3.5. Taylor-Diagram Description of Held-Out Agreement
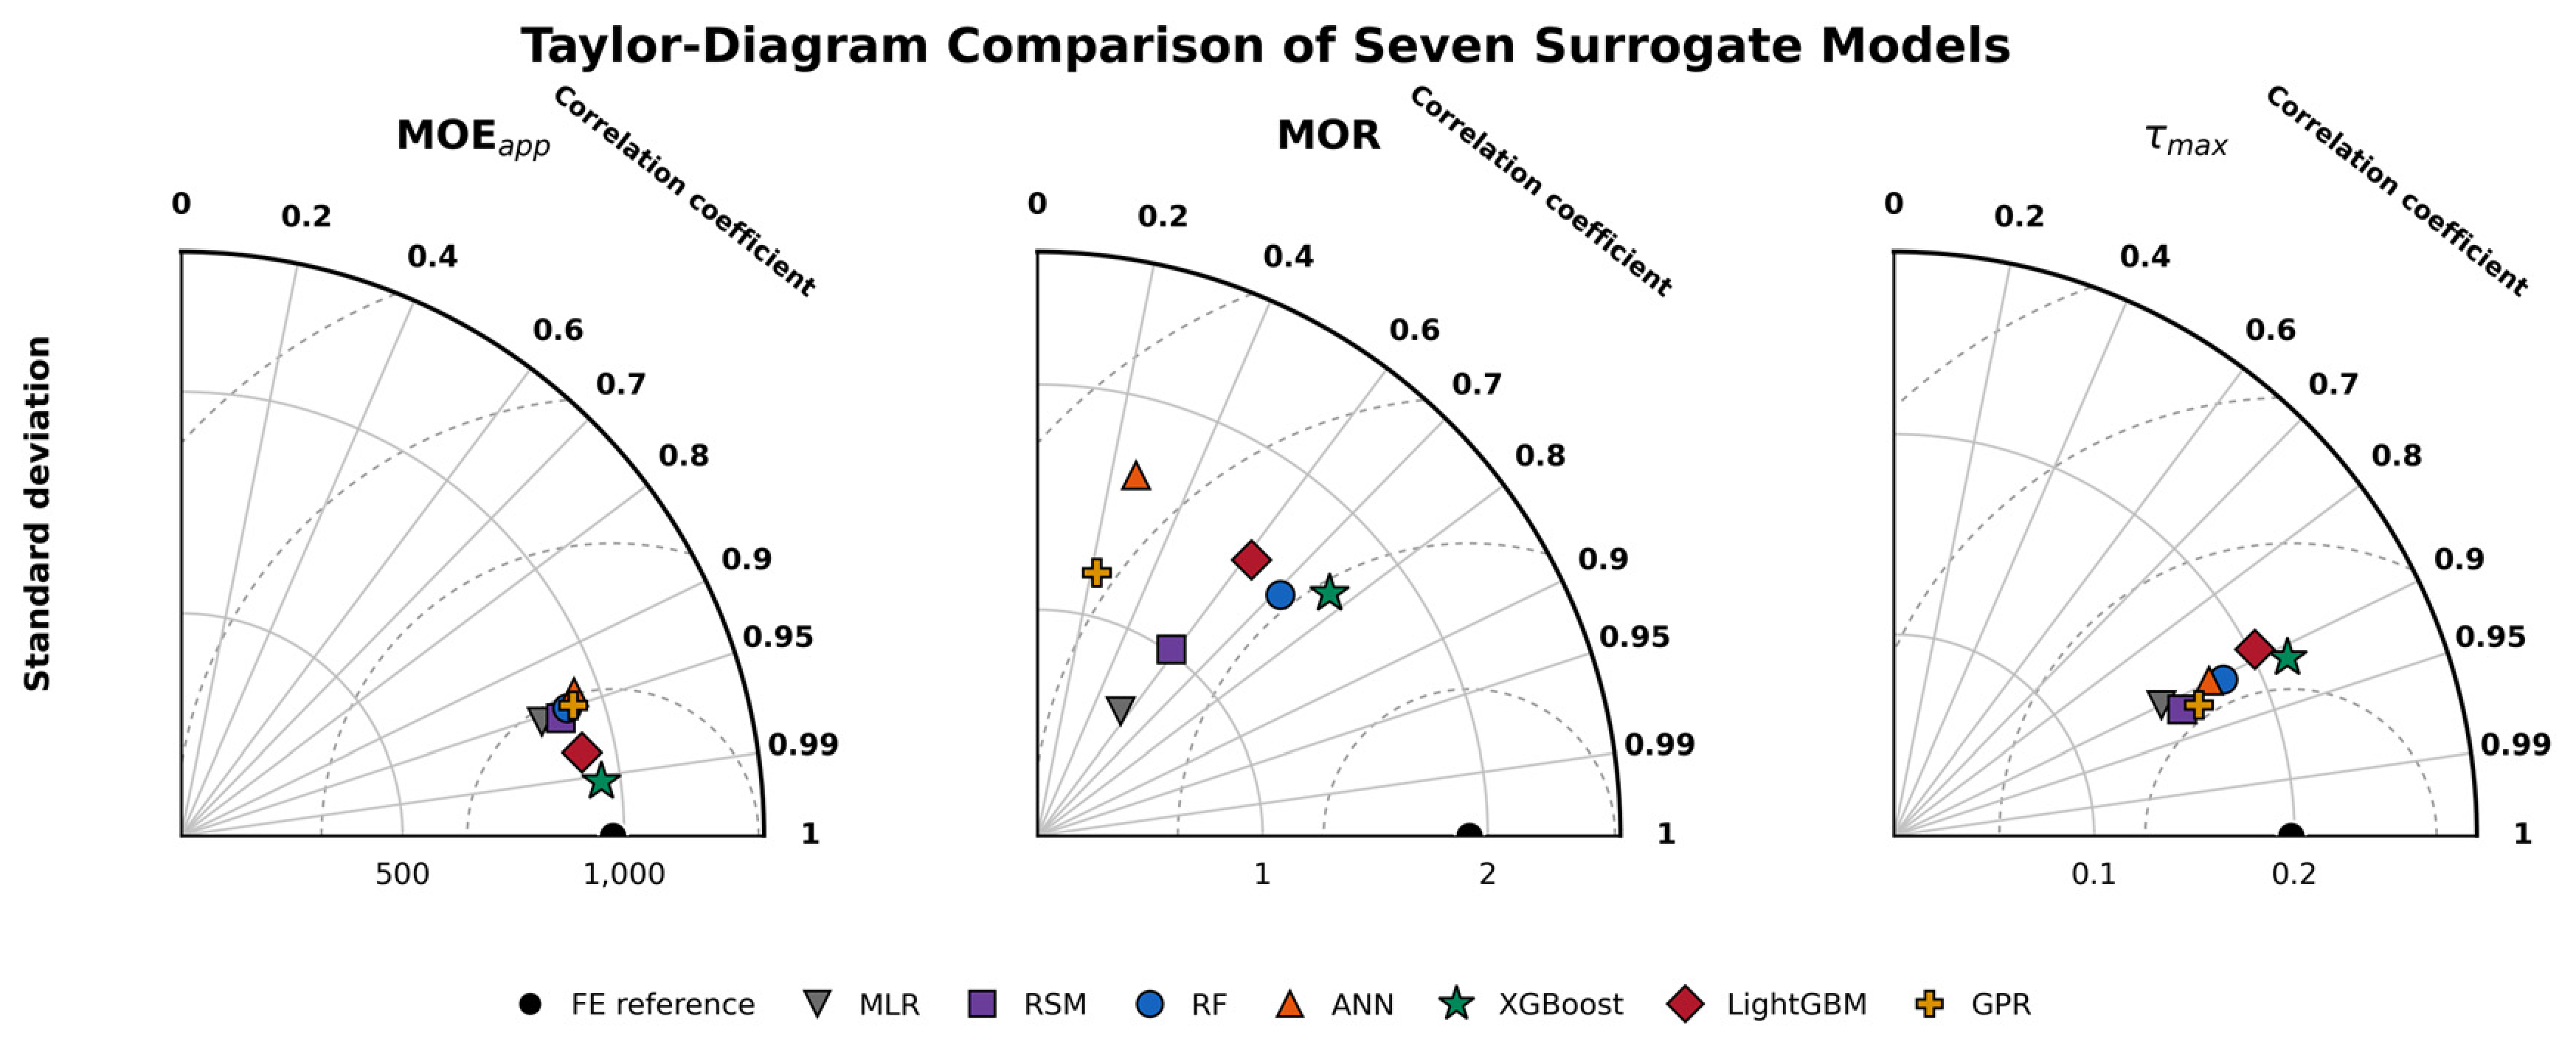
Taylor statistics for the fixed holdout are retained as a descriptive summary of correlation, predicted standard deviation, and centered RMS difference, and are shown in Figure 6. Consistent with Section 2.9, these statistics characterize agreement on points drawn from inside the factorial design and are not evidence of transfer to unseen geometric levels, new materials, or physical specimens.
Figure 6.
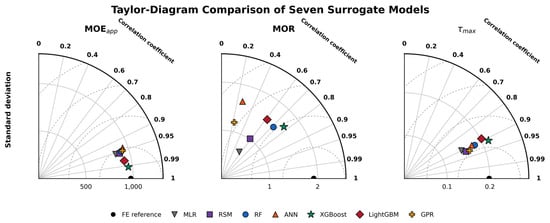
Taylor-diagram comparison of the surrogate models for MOEapp, MOR, and τmax on the fixed holdout. Radial distance represents standard deviation, the arc represents correlation coefficient, and dashed contours represent centered RMS difference.
For MOEapp, the Taylor view reproduces the ranking obtained from nested validation. XGBoost attains the highest correlation (r = 0.992) and, by a clear margin, the lowest centered error (CRMSD = 124.3 MPa), with LightGBM second (r = 0.979; CRMSD = 199.5 MPa); the remaining five models cluster between 288 and 334 MPa. Every model under-predicts the reference spread, which is the expected regression-to-the-mean behavior, and XGBoost does so least (predicted standard deviation 956.5 MPa against a reference of 974.8 MPa).
For MOR, the same ordering holds, with XGBoost strongest (r = 0.771; CRMSD = 1.238 MPa) followed by Random Forest (r = 0.711; CRMSD = 1.357 MPa). The Taylor view also makes the failure of the two weakest models explicit: the centered errors of the artificial neural network (2.178 MPa) and the Gaussian process (2.023 MPa) both exceed the reference standard deviation of 1.918 MPa, so neither improves on predicting the sample mean. This is consistent with their nested out-of-fold coefficients of 0.306 and 0.075.
For τmax, the criteria disagree, and the disagreement is instructive. On the fixed holdout, the Gaussian process gives both the highest correlation (r = 0.920) and the lowest centered error (CRMSD = 0.0794 MPa), with the quadratic response surface second (r = 0.917; CRMSD = 0.0828 MPa), whereas nested cross-validation ranked XGBoost first for this response. XGBoost is the only model that over-predicts the reference spread here (0.2156 MPa against 0.1982 MPa), which raises its centered error to 0.0885 MPa despite a competitive correlation of 0.912. Because the seven models occupy a narrow band for τmax, a single twenty-point partition is enough to reorder them. This illustrates directly the argument developed in Section 3.1 and Section 3.2: where models are closely matched, the evaluation criterion and the particular partition determine the ranking, and a preference asserted from one holdout statistic should not be read as a property of the algorithm.
3.6. Cross-Response Interpretation and Relation to the Recent ML Literature
The revised results support a response-dependent rather than algorithm-centric interpretation. MOEapp is the most consistently learned response: both nested validation and repeated holdout favor XGBoost, and the repeated SHAP hierarchy is exceptionally stable. τmax is also predictable by several nonlinear and second-order models, but XGBoost has the highest average repeated-holdout performance, and the SHAP mechanism remains strongly S/D-dominated. MOR is physically and statistically more heterogeneous; its strongest models depend on the validation criterion, and its interpretation is best expressed as coupled layer-count/slenderness behavior rather than a single dominant mechanism.
This validation emphasis is consistent with Gray et al. [18], whose FE-based structural surrogate study used repeated train/test splits and explicit no-leakage conditions in addition to SHAP. Their high accuracy for cold-formed steel shear capacity illustrates what can be achieved when the target is directly available for each independent FE model. The present comparison reinforces that a surrogate benchmark is only as credible as the partitioning rule behind it and that the rule must follow the data-generating mechanism of each response.
The breadth of the present model comparison is also consistent with these recent AM studies. Der et al. [13] showed that Random Forest and multilayer perceptron can both perform strongly across several laser-cutting quality responses, reinforcing the need to compare algorithms on a response-by-response basis rather than assume a universally superior learner. Hariharan et al. [14] demonstrated how high-throughput AM experiments can be coupled with model selection and SHAP to extract interpretable process–structure–property relationships from a data-limited materials-development problem; equally important, they restricted inference to the sampled domain and warned against treating SHAP correlation as causation. The present PrinTimber results lead to the same methodological conclusion in a structural setting: predictive ranking, validation scheme, feature dependence, and the physical domain of the training data must be considered together before an ML explanation is used as engineering evidence. The web-deployed masonry predictor of Lazaridis and Thomoglou [19] further illustrates the potential for eventual practical deployment, but a design-facing PrinTimber application should follow independent physical validation of higher-layer configurations and external off-grid validation.
Recent explainable-ML studies in structural materials have similarly used nonlinear ensembles and SHAP to identify governing mechanical variables [31,32,33,34,35,36,37,38,39]. These methods are most useful when the explanation is tied to a validated predictive model and when attribution is not confused with causality. In the present data, S/D control of MOEapp and nominal τmax is consistent with beam slenderness mechanics. For MOR, the comparable attribution shares of n and S/D and the larger resampling variability argue for more cautious physical interpretation.
The graph-based train–bridge framework of Zhang et al. [20] also points toward a future direction: models that encode structural topology can potentially generalize more naturally when geometry or connectivity changes. The current work uses compact scalar descriptors and should, therefore, be understood as a surrogate for the defined PrinTimber factorial design rather than a universal structural representation.
3.7. Limitations and Scope of Applicability
- •
- The FE framework was experimentally validated for single- and two-layer configurations. Predictions for beams containing three to ten layers are parametric extrapolations of the validated constitutive and interfacial modeling framework rather than configurations independently verified by physical testing.
- •
- The new cohesive-parameter study is local: it quantifies peak-load sensitivity for one representative seven-layer configuration and does not replace a global uncertainty analysis over the full 100-case design or a dedicated study of post-peak delamination.
- •
- No new off-grid FE campaign was performed outside the factorial levels, and no systematic ±5% geometric-perturbation study was added. Consequently, performance on unmodeled intermediate geometries remains an external-validation question rather than a demonstrated result.
- •
- The response database is deterministic. Reported ML metrics quantify surrogate reproduction of FE outputs and do not include experimental noise, manufacturing variability, moisture scatter, or uncertainty in material properties.
- •
- Effective shear stiffness was excluded from this study. Its variable-span identification yields one value per layer-count/width group rather than per configuration, and the identified values were not internally consistent with the input shear modulus; a per-configuration derivation from the FE shear field is required before that response can be modeled reliably.
- •
- τmax is a nominal section stress calculated from peak load and geometry. It is not a local FE shear stress, cohesive traction, or intrinsic material shear strength; local stress/traction extraction and failure-mode-stratified surrogate errors remain future work.
- •
- A public web application or permanent data repository has not been created for this revision. Data and analysis scripts are available from the corresponding author upon reasonable request; a deployable tool should follow additional experimental validation.
- •
- A layered-versus-equivalent-monolithic FE comparison was not added in this revision. Isolating the interlayer contribution from gross-section growth, therefore, remains future work.
4. Conclusions
- Using the independent predictor set [n, b, S/D] and matched nested tuning, XGBoost gave the strongest out-of-fold performance for all three responses: MOEapp (R2 = 0.964), MOR (0.702), and τmax (0.836). The linear and Gaussian-process baselines were far weaker for MOR (0.092 and 0.075), confirming that the nonlinear ensembles capture structure that a low-order surrogate does not.
- Removing the deterministically derived span-to-width ratio from the predictor set left three mutually orthogonal design variables (VIF = 1.00 each), so the reported attributions are identifiable rather than divided among algebraically dependent features.
- Fifty repeated holdouts confirmed XGBoost as the most stable MOEapp model (0.941 ± 0.042; 60% wins) and the highest-average τmax model (0.833 ± 0.119; 42% wins). MOR remained partition-dependent: LightGBM had the highest mean R2 (0.648), whereas XGBoost had the highest win rate (48%).
- Repeated SHAP identified robust S/D dominance for MOEapp (76.35% mean share, ranking first in 100% of partitions) and τmax (74.54%, first in 100%), and coupled layer count/S/D control for MOR (45.99% and 40.90%, with layer count ranking first in 66% of partitions).
- A local ±20% cohesive-interface sensitivity analysis for a representative seven-layer beam changed peak load by <0.04% for elastic cohesive stiffness, approximately ±0.7% for damage-initiation strength, and approximately ±2.0% for interface fracture energy. Thus, within this local test, peak capacity was most sensitive to fracture energy but remained only modestly affected by the tested interface uncertainty.
- The resulting framework is suitable for rapid, interpretable screening within the investigated numerical design space. Experimental validation of higher-layer beams, off-grid numerical/physical validation, and broader uncertainty propagation are required before using the surrogate predictions as general structural-design evidence.
Author Contributions
H.H.: Conceptualization, methodology, software, validation, formal analysis, investigation, data curation, visualization, writing—original draft. A.A.I.: Conceptualization, methodology, supervision, project administration, funding acquisition, writing—review and editing. All authors have read and agreed to the published version of the manuscript.
Funding
This work was supported by the National Science Foundation under Grant No. 2119809.
Data Availability Statement
The original contributions presented in this study are included in the article. Further inquiries can be directed to the corresponding authors.
Conflicts of Interest
The authors declare no conflicts of interest.
Nomenclature
| AM | additive manufacturing |
| ANN | artificial neural network |
| b | beam width (mm) |
| CRMSD | centered root-mean-square difference |
| CV | cross-validation |
| EIapp | apparent flexural stiffness (N·mm2) |
| FE | finite element |
| GPR | Gaussian-process regression |
| h | total section depth (mm) |
| I | second moment of area (mm4) |
| L | support span (mm) |
| LightGBM | light gradient-boosting machine |
| m | slope of the linear load–deflection response (N/mm) |
| MAE | mean absolute error |
| ML | machine learning |
| MLR | multiple linear regression |
| MOEapp | apparent modulus of elasticity (MPa) |
| MOR | modulus of rupture (MPa) |
| n | number of printed layers |
| Pu | peak load (N) |
| R2 | coefficient of determination |
| RF | Random Forest |
| RMSE | root-mean-square error |
| RSM | response-surface modeling |
| S/D | span-to-depth ratio (=L/h) |
| S/W | span-to-width ratio (=L/b) |
| SHAP | SHapley Additive exPlanations |
| t | layer thickness (mm) |
| Vmax | maximum transverse shear force (N) |
| XGBoost | extreme gradient boosting |
| Δ | midspan deflection (mm) |
| Δtotal | total midspan deformation (mm) |
| τmax | maximum transverse shear stress (MPa) |
| φij SHAP | contribution of feature j for observation i |
References
- Hassan, H.; Rodriguez-Ubinas, E.; Al Tamimi, A.; Trepci, E.; Mansouri, A.; Almehairbi, K. Towards innovative and sustainable buildings: A comprehensive review of 3D printing in construction. Autom. Constr. 2024, 163, 105417. [Google Scholar] [CrossRef] [Scilit]
- Ramaux, J.; Ziegler-Devin, I.; Besserer, A.; Nouvel, C. 3D Printing of Wood Composites: State of the Art and Opportunities. Polymers 2024, 16, 2827. [Google Scholar] [CrossRef] [Scilit] [PubMed]
- Orji, B.O.; Thie, C.; Baker, K.; Maughan, M.R.; McDonald, A.G. Wood fiber–sodium silicate mixtures for additive manufacturing of composite materials. Eur. J. Wood Wood Prod. 2023, 81, 45–58. [Google Scholar] [CrossRef] [Scilit]
- Carne, R.H.R.; Alade, A.A.; Orji, B.O.; Ibrahim, A.; McDonald, A.G.; Maughan, M.R. A screw extrusion-based system for additive manufacturing of wood: Sodium silicate thermoset composites. Adv. Mech. Eng. 2023, 15, 16878132231210373. [Google Scholar] [CrossRef] [Scilit]
- Hematabadi, H.; Alade, A.A.; Carne, R.H.R.; Robertson, D.; Yapa, M.; McDonald, A.G.; Ibrahim, A.A. Structural performance of additive manufactured wood-sodium silicate composite beams for sustainable construction. Sustain. Struct. 2024, 4, 000054. [Google Scholar] [CrossRef] [Scilit]
- Hematabadi, H.; McDonald, A.G.; Ibrahim, A.A. Shear performance of PrinTimber composite beams for sustainable 3D-printing structures. Mater. Struct. 2025, 58, 304. [Google Scholar] [CrossRef] [Scilit]
- Thai, H.-T. Machine learning for structural engineering: A state-of-the-art review. Structures 2022, 38, 448–491. [Google Scholar] [CrossRef] [Scilit]
- Samadian, D.; Muhit, I.B.; Dawood, N. Application of Data-Driven Surrogate Models in Structural Engineering: A Literature Review. Arch. Comput. Methods Eng. 2025, 32, 735–784. [Google Scholar] [CrossRef] [Scilit]
- Sacks, J.; Welch, W.J.; Mitchell, T.J.; Wynn, H.P. Design and Analysis of Computer Experiments. Stat. Sci. 1989, 4, 409–435. [Google Scholar] [CrossRef] [Scilit]
- Forrester, A.I.J.; Keane, A.J. Recent advances in surrogate-based optimization. Prog. Aerosp. Sci. 2009, 45, 50–79. [Google Scholar] [CrossRef] [Scilit]
- Rasmussen, C.E.; Williams, C.K.I. Gaussian Processes for Machine Learning; MIT Press: Cambridge, MA, USA, 2006. [Google Scholar]
- Palar, P.S.; Saves, P.; Robani, M.D.; Verstaevel, N.; Garouani, M.; Aligon, J.; Shimoyama, K.; Morlier, J.; Gaudou, B. Interpretable and Explainable Surrogate Modeling for Simulations: A State-of-the-Art Survey and Perspectives on Explainable AI for Decision-Making. Arch. Comput. Methods Eng. 2026, 33, 12511–12565. [Google Scholar] [CrossRef] [Scilit]
- Der, O.; Tasci, M.; Basar, G.; Ercetin, A. Intelligent modeling and prediction of CO2 laser cutting performance in FFF-printed thermoplastics using machine learning algorithms. Proc. Inst. Mech. Eng. Part E J. Process Mech. Eng. 2025. [Google Scholar] [CrossRef] [Scilit]
- Hariharan, A.; Ackermann, M.; Koss, S.; Khosravani, A.; Schleifenbaum, J.H.; Köhnen, P.; Kalidindi, S.R.; Haase, C. High-Speed 3D Printing Coupled with Machine Learning to Accelerate Alloy Development for Additive Manufacturing. Adv. Sci. 2025, 12, 2414880. [Google Scholar] [CrossRef] [Scilit] [PubMed]
- Lundberg, S.M.; Lee, S.-I. A Unified Approach to Interpreting Model Predictions. Adv. Neural Inf. Process. Syst. 2017, 30, 4765–4774. [Google Scholar]
- Lundberg, S.M.; Erion, G.; Chen, H.; DeGrave, A.; Prutkin, J.M.; Nair, B.; Katz, R.; Himmelfarb, J.; Bansal, N.; Lee, S.-I. From local explanations to global understanding with explainable AI for trees. Nat. Mach. Intell. 2020, 2, 56–67. [Google Scholar] [CrossRef] [Scilit] [PubMed]
- Aas, K.; Jullum, M.; Løland, A. Explaining individual predictions when features are dependent: More accurate approximations to Shapley values. Artif. Intell. 2021, 298, 103502. [Google Scholar] [CrossRef] [Scilit]
- Gray, D.T.; Simwanda, L.; Sifan, M.; Poologanathan, K.; Kannan, T. Machine Learning Prediction of Shear Strength in Cold-Formed Steel Modular Construction-Optimised (MCO) Beam. Buildings 2026, 16, 1497. [Google Scholar] [CrossRef] [Scilit]
- Lazaridis, P.C.; Thomoglou, A.K. Rapid shear capacity prediction of TRM-strengthened unreinforced masonry walls through interpretable machine learning deployed in a web app. J. Build. Eng. 2024, 98, 110912. [Google Scholar] [CrossRef] [Scilit]
- Zhang, P.; Zhao, H.; Shao, Z.; Xie, X.; Hu, H.; Zeng, Y.; Xiang, P. A novel graph neural network framework with self-evolutionary mechanism: Application to train-bridge coupled systems. Adv. Eng. Softw. 2024, 197, 103751. [Google Scholar] [CrossRef] [Scilit]
- Dassault Systèmes SIMULIA Corp. Abaqus 2023 Documentation; Dassault Systèmes SIMULIA Corp: Providence, RI, USA, 2023. [Google Scholar]
- Moës, N.; Dolbow, J.; Belytschko, T. A finite element method for crack growth without remeshing. Int. J. Numer. Methods Eng. 1999, 46, 131–150. [Google Scholar] [CrossRef]
- Turon, A.; Dávila, C.G.; Camanho, P.P.; Costa, J. An engineering solution for mesh size effects in the simulation of delamination using cohesive zone models. Eng. Fract. Mech. 2007, 74, 1665–1682. [Google Scholar] [CrossRef] [Scilit]
- ASTM D198-22a; Standard Test Methods of Static Tests of Lumber in Structural Sizes. ASTM International: West Conshohocken, PA, USA, 2022. [Google Scholar] [CrossRef] [Scilit]
- Breiman, L. Random Forests. Mach. Learn. 2001, 45, 5–32. [Google Scholar] [CrossRef] [Scilit]
- Chen, T.; Guestrin, C. XGBoost: A Scalable Tree Boosting System. In Proceedings of the 22nd ACM SIGKDD International Conference on Knowledge Discovery and Data Mining, San Francisco, CA, USA, 13–17 August 2016; pp. 785–794. [Google Scholar] [CrossRef] [Scilit]
- Ke, G.; Meng, Q.; Finley, T.; Wang, T.; Chen, W.; Ma, W.; Ye, Q.; Liu, T.-Y. LightGBM: A Highly Efficient Gradient Boosting Decision Tree. Adv. Neural Inf. Process. Syst. 2017, 30, 3146–3154. [Google Scholar]
- Pedregosa, F.; Varoquaux, G.; Gramfort, A.; Michel, V.; Thirion, B.; Grisel, O.; Blondel, M.; Prettenhofer, P.; Weiss, R.; Dubourg, V.; et al. Scikit-learn: Machine Learning in Python. J. Mach. Learn. Res. 2011, 12, 2825–2830. [Google Scholar]
- Kingma, D.P.; Ba, J. Adam: A Method for Stochastic Optimization. International Conference on Learning Representations. arXiv 2015, arXiv:1412.6980. [Google Scholar]
- Taylor, K.E. Summarizing multiple aspects of model performance in a single diagram. J. Geophys. Res. 2001, 106, 7183–7192. [Google Scholar] [CrossRef] [Scilit]
- Ye, M.; Li, L.; Zhou, C.; Tang, J.; Yoo, D.-Y.; Jin, W. Interpretable ensemble machine learning models for predicting the shear capacity of UHPC joints. Eng. Struct. 2024, 315, 118443. [Google Scholar] [CrossRef] [Scilit]
- Zhu, Y.; Taffese, W.Z.; Chen, G. Enhancing FRP-concrete interface bearing capacity prediction with explainable machine learning: A feature engineering approach and SHAP analysis. Eng. Struct. 2024, 319, 118831. [Google Scholar] [CrossRef] [Scilit]
- Gharagoz, M.M.; Noureldin, M.; Kim, J. Explainable machine learning framework for seismic assessment of structures using XGBoost. Eng. Struct. 2025, 327, 119621. [Google Scholar] [CrossRef] [Scilit]
- Taffese, W.Z.; Zhu, Y. Explainable machine learning for predicting flexural capacity of reinforced UHPC beams. Eng. Struct. 2025, 343, 121188. [Google Scholar] [CrossRef] [Scilit]
- Liu, Y.; Rahimi, S.; Avramidis, S.; Nasir, V. Stiffness and hardness of thermally modified timber assessed with explainable machine learning. Constr. Build. Mater. 2024, 452, 138956. [Google Scholar] [CrossRef] [Scilit]
- Long, W.; Cheng, B.; Luo, S.; Li, L.; Mei, L. Interpretable auto-tune machine learning prediction of strength and flow properties for self-compacting concrete. Constr. Build. Mater. 2023, 393, 132101. [Google Scholar] [CrossRef] [Scilit]
- Talatahari, S.; Chen, F.; Gandomi, A.H. Developing a robust machine learning framework for predicting the behavior of large-scale structure. J. Build. Eng. 2025, 105, 112204. [Google Scholar] [CrossRef] [Scilit]
- Yang, C.; Wang, C.; Wu, B.; Zhao, F.; Fan, J.-S.; Zhou, L. Settlement estimation during foundation excavation using pattern analysis and explainable AI modeling. Autom. Constr. 2024, 166, 105651. [Google Scholar] [CrossRef] [Scilit]
- Akber, M.Z.; Anwar, G.A.; Chan, W.-K.; Lee, H.-H. TPE-XGBoost for explainable predictions of concrete compressive strength considering compositions and mechanical and microstructure properties. Constr. Build. Mater. 2024, 457, 139398. [Google Scholar] [CrossRef] [Scilit]

Disclaimer/Publisher’s Note: The statements, opinions and data contained in all publications are solely those of the individual author(s) and contributor(s) and not of MDPI and/or the editor(s). MDPI and/or the editor(s) disclaim responsibility for any injury to people or property resulting from any ideas, methods, instructions or products referred to in the content. |
© 2026 by the authors. Licensee MDPI, Basel, Switzerland. This article is an open access article distributed under the terms and conditions of the Creative Commons Attribution (CC BY) license.