


Abstract
Treating architectural space as a relational structure that organizes practice, this study examines how the configuration of Aba Tibetan dwellings relates to behavioral, cognitive, and meaning-related responses. A standardized prototype from 75 surveyed dwellings was analyzed using convex space syntax and visibility graph analysis; 36 culturally unfamiliar participants explored a full-scale virtual model with cultural and religious signs removed, yielding movement trajectories, cognitive maps, and perception ratings. Findings: Higher-integration spaces showed greater visitation and dwell activity; cognitive maps centered on circulation spaces rather than functionally prominent rooms; and more enclosed, lower-integration spaces received higher mystery and ritual character ratings. Boundaries: Under the pre-specified evidential rule, none of the six principal associations is established—three are suggestive and three are not established—visitation cannot be separated from the functional role of circulation spaces, and dwell activity largely reflects visitation frequency. “Structural affordance” is therefore offered as a descriptive vocabulary for these responses rather than a validated construct, and the contribution is a reproducible procedure with stated limits, not confirmed findings. Findings therefore concern controlled-condition perception, not the culturally embedded meaning of Tibetan dwellings.
1. Introduction
Architectural space is not only a physical environment that accommodates human activities but also an important medium for organizing behavioral practices, cognitive processes, and social interactions [1]. In recent years, architectural space research has gradually shifted from focusing on spatial form to spatial organization mechanisms, with spatial configuration becoming an important theoretical perspective for explaining how architectural space may condition behavior [2]. Space syntax, as a representative spatial analysis method, provides effective tools for revealing the relationship between spatial configuration and behavioral patterns by quantifying spatial topological relationships, spatial hierarchy, and visual organization.
However, existing research has largely addressed these connections separately. Space syntax studies have related spatial configuration to behavioral patterns and, in parallel, to wayfinding, spatial cognition, and environmental perception [3], yet behavioral, cognitive, and perceptual responses are seldom examined together within a single design. Meanwhile, spatial meaning research mostly explains meaning sources from perspectives of cultural symbolism, religious beliefs, and historical memory, with less attention to the role of architectural spatial organization itself in the meaning-related perception process [4]. What therefore remains limited is not configurational analysis or meaning interpretation in isolation, but a descriptive vocabulary connecting spatial organization, spatial practice, and meaning-related perception—particularly one supported by behavioral evidence in vernacular dwelling contexts.
Traditional dwellings, with their stable spatial organization forms and long-accumulated spatial practices, provide typical contexts for studying how architectural space participates in meaning-related perception [5]. This study takes Aba Tibetan traditional dwellings as the research object. Their unique spatial characteristics, formed by spatial hierarchy, path organization, and the embedding of religious space into daily life, provide a representative case for exploring the relationship between spatial configuration and meaning-related perception.
Addressing the above issues, this study focuses on answering: (1) What spatial configuration characteristics do Aba Tibetan traditional dwellings possess? (2) How is spatial configuration associated with behavioral practice, cognitive practice, and spatial perception? (3) How may spatial configuration be associated with the formation of meaning-related perception through spatial practice? Based on Structuration Theory, this study develops the concept of “structural affordance” as a descriptive vocabulary and, combined with architectural typology, space syntax analysis, and VR experiments, examines the relationships among spatial configuration, spatial practice, and meaning-related perception.
The contributions of this study include three aspects: First, it integrates configurational analysis (space syntax) with a VR-based behavioral experiment to construct a two-stream analytical pipeline for architectural spatial-meaning research. Second, it develops structural affordance as a descriptive vocabulary connecting spatial configuration with meaning-related perception, offered as a provisional formulation: the relational patterns it comprises were derived inductively and, as reported in Section 5.4, none is established as a confirmed finding. Third, using Aba Tibetan dwellings as a case, it provides an interpretive account of how architectural spatial organization may participate in meaning-related perception, offering an empirical pathway for traditional architectural space research while specifying which of its own claims the present design cannot test. Because no Tier-1 association is established under the evidential rule specified in Section 3.7, these contributions are procedural and descriptive: what the study offers is a reproducible procedure with stated limits and a bounded descriptive vocabulary, not a set of confirmed findings.
Conventional affordance theory accounts for the action possibilities offered by local environmental features. It does not specify how the ordering of spaces within a building is related to sustained patterns of practice, or to what occupants come to know and feel about a place. Drawing on Structuration Theory as an interpretive lens rather than as a directly testable theoretical foundation, the study reads spatial configuration as a structuring medium through which the behavioral, cognitive, and meaning-related responses of inhabitants may be sustained over time.
2. Literature Review and Research Framework
2.1. Architectural Spatial Configuration and Spatial Practice
Space-syntax research has long examined how architectural configuration shapes spatial behavior, including pedestrian movement patterns, occupancy distribution, and circulation density [6]. These studies provide an established empirical base for connecting configurational properties with behavioral measures at the building scale.
Numerous space syntax studies have shown that spatial configuration can effectively explain spatial usage patterns, gradually expanding from “space-behavior” relationships to “space-experience” relationships. Jiang and Jia found that even without explicit goals, group movement patterns remain highly consistent with spatial configuration, indicating that spatial organization possesses stable behavioral organizing capacity [7]. In recent years, related research has been further applied to Tibetan traditional architecture, revealing organizational characteristics centered on circulation space with hierarchical differentiation between living space and religious space [8,9,10].
More recently, configurational analysis has been extended to cognitive and experiential domains, linking spatial layout with wayfinding performance, spatial memory, environmental cognition, and the formation of place meaning. Cross-disciplinary work in this vein demonstrates that spatial configuration can be examined jointly with cognitive and meaning-related responses, rather than in isolation from them [11].
2.2. From Affordance Theory to Structural Affordance
To understand the relationship between environment and action, Gibson proposed affordance theory, arguing that the environment provides action possibilities to actors through its own attributes. Affordance is not an attribute possessed unilaterally by the environment or the actor, but a relational characteristic formed in the interaction between environmental conditions and action capabilities [12]. Norman further proposed perceived affordance, emphasizing that action opportunities need to be perceived and recognized by actors [13]. Subsequent research further developed affordance as a dynamic relationship of continuous coupling between environment and action, emphasizing the organizing role of environmental structure in action practice [14,15,16].
In recent years, affordance theory has gradually entered architectural research. Related studies point out that architectural space not only provides functional usage conditions but is also associated with activity patterns through spatial organization. For example, Lechner et al. introduced affordance into architectural typology, emphasizing that building form structure supports subsequent transformation and use [17]. However, such research primarily focuses on the potential capacity of building form itself and has not yet explained how overall spatial configuration relates to action, cognition, and perception processes.
Behavioral practice in architectural space is not determined by individual spatial elements but is formed through the joint action of spatial hierarchy, path organization, visual relationships, and topological structure [18]. Therefore, while traditional affordance theory can explain how the environment provides action opportunities, it has difficulty explaining how the overall spatial organization of buildings continuously organizes spatial practice [19].
Conventional affordance theory therefore leaves a gap at the configurational scale.
Extending affordance thinking to this configurational scale, however, involves more than applying the existing concept to larger objects. Three shifts are required. First, the unit of analysis shifts from local environmental features to the configuration itself—to the relations among spatial units rather than the properties of any single unit. Second, the temporal scope shifts from immediate action possibilities to sustained patterns of practice: not what a feature invites an actor to do here and now, but how the ordering of spaces shapes encounters, movement, and occupation over time. Third, the explanatory target shifts from action alone to the coupling of action with cognition and perception, since configurational position plausibly relates not only to where people go but also to what they come to know and to feel about a place.
For this purpose, this study proposes structural affordance as a descriptive vocabulary for describing recurring relational patterns between spatial configuration and spatial practice, cognition, and meaning-related perception. The framework is offered as an extension of affordance thinking to the configurational scale, not as a new theory of affordance: it preserves the core premise that environments provide action possibilities while relocating the unit of analysis from feature–action pairs to configuration–practice relations. Structural affordance is not itself a directly measurable variable, nor a validated theory, and it names recurring relational patterns between configuration and practice rather than a new causal mechanism.
Existing affordance research primarily addresses correspondences between specific environmental features and specific actions: a surface may afford sitting; an opening may afford passage. This does not mean that conventional affordance theory cannot address spatial configuration, nor that empirical links between configuration, wayfinding, cognition, and perception are absent—as the space syntax research reviewed in Section 2.1 has documented extensively. Rather, the contribution of structural affordance is to provide a single analytical vocabulary that connects configurational properties with recurring patterns in behavioral, cognitive, and meaning-related responses.
Structural affordance must also be distinguished from space syntax, on which it depends for its measures. Space syntax supplies the formal apparatus used here: integration and control value are derived from the adjacency graph of the building and describe relations among spatial units independently of any particular observer, and the space syntax literature has documented extensively how such properties are associated with movement and with patterns of occupation. Structural affordance borrows these measures but is not a variant of space syntax and is not offered as a test of it. Three boundaries should be stated. First, the two operate at different levels of claim: space syntax provides a descriptive and predictive account of configuration and its correlates, whereas structural affordance is an interpretive vocabulary for relating those correlates to one another across behavioral, cognitive, and perceptual responses. Second, the framework does not add evidence to the configuration–movement relation already established in the space syntax literature, and it is not proposed as an alternative explanation of movement; its content lies in holding movement, cognitive salience, and dimension-specific perception within a single descriptive frame. Third, because the framework borrows its measures from space syntax it inherits the latter’s assumptions, in particular that the convex map is an adequate representation of the units among which inhabitants move. The distinctiveness claimed for structural affordance is therefore narrow—an architectural-scale vocabulary holding these three response types in a single frame—and remains open to further testing across buildings, user groups, and cultural contexts.
Finally, structural affordance is treated as an interpretive concept, and its plausibility therefore depends on whether configurational properties show differentiated relationships with behavioral, cognitive, and meaning-related responses. Findings that would count against this interpretation include the following. First, behavioral, cognitive, and perceptual responses show little correspondence with configurational measures, or their variation can be fully accounted for by non-configurational factors such as room size, furnishing, or finish. Second, a single spatial unit might rank highest on all syntactic measures and on all perceptual dimensions alike; no differentiated distribution across the configuration would then exist, and an interpretation centered on relations would lose its content and require reformulation. Third, if cognitive salience disappeared entirely after controlling for participants’ actual exposure frequency, this salience may primarily reflect traffic volume rather than configurational position. Whether the present data meet these scope conditions is examined against the empirical results in Section 6.2.
2.3. Spatial Cognition and Meaning-Related Perception
Spatial cognition research focuses on how actors acquire, organize, and interpret spatial information. Building on the concept of cognitive maps, Lynch demonstrated that individuals construct mental representations of environments through five key elements—paths, nodes, districts, edges, and landmarks—which provide important foundations for spatial recognition and wayfinding [20]. In recent years, VR experiments and spatial behavior research have further shown that architectural spatial configuration is associated with not only movement behavior but also spatial memory and cognitive organization processes. However, existing studies mainly examine cognitive processes from the perspective of individuals, while how architectural spatial configurations relate to spatial cognition remains underexplored [21,22].
Norberg-Schulz, Relph, and Tuan argued that spatial meaning emerges through continuous interactions between humans and environments, in which lived experiences, perceptions, and cultural associations transform physical spaces into meaningful places [23,24,25]. However, existing research focuses more on the influence of cultural, religious, and social factors on meaning formation, with less discussion of how architectural spatial organization itself participates in meaning-related perception. Recent studies have shown that embodied exploration and movement play an important role in spatial knowledge acquisition [26]. Therefore, this study further explores how spatial configuration participates in the meaning-related perception process through spatial practice.
Two levels of “meaning” must be distinguished throughout this study. Culturally embedded spatial meaning refers to the significance a space holds for community members who inhabit it and reproduce it through long-term practice, including associations formed through Buddhist altars, ritual activities, kinship relations, and residence experience. Such meaning belongs to community practice; it cannot be directly measured through a single-session experiment, although it can be studied through resident interviews, oral history, and long-term ethnography, which lies beyond the present design. Meaning-related perception, by contrast, refers to spatial impressions formed by participants under controlled conditions, such as perceived importance, centrality, enclosure, mystery, ritual character, or religious atmosphere. This study measures only the latter.
2.4. Structuration Theory and Research Framework
Structuration Theory, proposed by Giddens, argues that structure is both the medium and the outcome of social practices. Structures, composed of rules and resources, enable and constrain human actions while being continuously reproduced and transformed through recurrent practices [27].
It should be noted that the experiment operationalizes only one aspect of Structuration Theory—the enabling and constraining role of structure. Rules and resources, the duality of structure, and the recursive reproduction of structure in Giddens’ account all presuppose recurrent social practice over time, whereas the present VR sessions lasted only several dozen minutes and participants did not engage in the long-term practices through which structure is reproduced. Structuration Theory is therefore employed as an interpretive lens rather than as a directly testable theoretical foundation. The findings describe relations between spatial organization and immediate behavioral, cognitive, and perceptual responses, and should not be read as demonstrating a complete structuration process. Accordingly, “structure” in this paper refers to configuration in the spatial sense, not to the rules and resources reproduced through practice in Giddens’ sociological sense.
Accordingly, the research framework proceeds as follows. Spatial configuration, characterized by its topological, hierarchical, and visual relationships, is treated as a structural condition that may enable and constrain spatial practice. Structural affordance, as defined in Section 2.2, provides an interpretive vocabulary for describing the relational opportunities associated with this configuration and their connection to spatial practice. The VR experiment then observes participants’ immediate behavioral, cognitive, and perceptual responses under these spatial conditions. Meaning-related perception is examined as an outcome associated with spatial configuration and practice, rather than as something directly endowed by spatial structure. The framework is interpretive throughout, without claiming that a single short-term experiment demonstrates a complete structuration process.
3. Materials and Methods
3.1. Overall Research Design
This study adopts a two-stream design combining configurational analysis (space syntax) with a VR-based behavioral experiment. Structuration Theory serves as an interpretive lens (Section 2.4), and structural affordance as the descriptive vocabulary connecting spatial configuration with practice, constructing the research pathway of “spatial configuration–spatial practice–meaning-related perception.”
First, a spatial prototype model is established through typological analysis of Aba Tibetan dwellings. Second, convex space syntax and visibility graph analysis are used to quantify building spatial configuration characteristics. Third, a VR experimental environment is built based on the spatial prototype, collecting participants’ behavioral trajectories, cognitive maps, and spatial perception evaluations. Fourth, the relationships among spatial configuration, behavior, cognition, and meaning-related perception are comprehensively analyzed (Figure 1).
Figure 1.
Research framework of this study, combining configurational analysis (space syntax) with the VR-based behavioral experiment [27].
3.2. Identification of the Spatial Prototype
Aba Tibetan traditional dwellings, as the research object, possess stable spatial organizational characteristics, including clear spatial hierarchy, path relationships, and religious space embedding patterns [28]. To reduce the influence of individual building variations, this study does not select a single building but establishes a standardized spatial prototype model based on typological analysis. Figure 2 illustrates the geographical location of the study area.
Figure 2.
Geographical location of the study area: (a) location of the study area in China; (b) location of the study area in Sichuan Province.
The typological analysis rests on a systematic field survey in Aba County (the upper and central Aba region), covering 43 administrative villages in the region; excluding the 15 administrative villages located in pastoral areas or under the jurisdiction of the county seat, 28 administrative villages were investigated, and 75 representative traditional Tibetan dwellings were measured on site by a survey team of 12–14 members over 35 days, covering buildings constructed from the Ming and Qing dynasties to the present [29]. On this basis, eight dwellings with distinctive configurational features were selected from the measured sample to construct a typological chart (Figure 3), and the analysis of this chart established the characteristic spatial pattern of the local dwellings: although individual dwellings differ in scale, courtyard form, and ancillary space configuration, the main spatial structure can be summarized as a binary spatial structure consisting of a Front Hall and a Core Unit.
Figure 3.
The eight selected cases: (a) Zanmushang, Andou Township; (b) Leihashang, Gemo Township; (c) Jiawoshang, Longzang Township; (d) Rewoshang, Longzang Township; (e) Jiadishang, Andou Township; (f) Sebenshang, Gemo Township; (g) Paiserbangshang, Woerma Township; (h) Qishang, Woerma Township.
The Front Hall serves traffic organization and spatial transition, while the Core Unit organizes main living and religious activities within a stable vertical spatial hierarchy: livestock pens and storage spaces on the ground floor, the Main Room on the second floor, and the Buddhist shrine room, living room, and open hall on the third floor.
The prototype was accordingly constructed through typology-informed standardization rather than by averaging metric dimensions or synthesizing arbitrary features. The derivation followed the typological procedure reported in Li and Li [29]. First, the eight representative cases compiled in the typological chart were decomposed into their constituent spatial parts, and an invariant structural core was identified: a three-story volume whose vertical functional sequence recurs irrespective of building age and exterior form. This invariant core is termed the “base type” and corresponds to the Core Unit here. Second, the dwellings were classified according to the relational arrangement of the front hall and the base type; the configuration placing the front hall directly in front of the base type is the most frequent, whereas side-positioned and partially embedded arrangements occur as rarer variants. Third, the prototype retains this invariant core together with the dominant front-hall configuration, whereas variable elements—overall scale, courtyard form, and ancillary buildings—were standardized to typical values. In the subsequent virtual model, explicit cultural symbols (Buddhist statuary, religious images, and text signage) were further removed, while basic construction features such as rammed earth walls and timber elements were retained (Section 3.4). Consequently, the findings of this study pertain to the standardized virtual prototype rather than to the full diversity of Aba Tibetan dwellings.
Therefore, this study defines the “Front Hall-Core Unit” spatial organization pattern and its vertical hierarchical relationship as the Aba Tibetan dwelling spatial prototype, and establishes a standardized model as the object for subsequent space syntax analysis and VR experiments.
3.3. Space Syntax Analysis
This study employs space syntax to analyze building spatial configuration characteristics. AutoCAD 2020 is used to build spatial models, which are imported into DepthmapX-0.7.0 for calculation. For internal building spatial relationships, convex space analysis and visibility graph analysis (VGA) are combined [30,31].
Convex space analysis is used to describe spatial topological relationships, and VGA is used to analyze visual organization characteristics. According to research objectives, integration, connectivity, control value, visual integration, and visual connectivity are selected as spatial configuration indicators.
Among these, integration, connectivity, and control value are used to describe topological structure, while visual integration and visual connectivity are used to describe visual structure. This study uses global integration (Rn) to reflect the participants’ spatial experience process in the overall building environment.
The space syntax indicators are defined as follows:
Control Value (Equation (1)):
Integration (Equation (3)):
Table 1.
Space syntax measures of the 13 analyzed spatial units in the spatial prototype.
Convex spaces were segmented along functional room boundaries, with door openings treated as connections between adjacent convex units; each staircase was coded as a stair-hall unit on its floor, connecting the adjacent stories (Table 1). The exterior was modeled as a single convex node attached to the entries of all first-floor spaces, so that the topological measures reflect the building’s permeability structure relative to its surroundings rather than an arbitrarily bounded interior system; the sensitivity of the results to this treatment is reported in Section 4.1. For VGA, a uniform visibility grid of 0.7 m was generated at an eye height of 1.6 m, with door openings treated as fully open for visibility; visibility was analyzed floor by floor, and the resulting measures were subsequently combined for the whole building.
The syntactic calculations were based on the complete convex map of the prototype, which comprised 25 spatial units, including the exterior node and the 13 analytical units reported in Table 1, together with additional units such as the storage spaces (S1, S2), grain-drying sheds (GD1, GD2), open platforms (PO1, PO2), and other auxiliary spaces. All space-syntax metrics were computed on this complete network, and the resulting values were extracted for the 13 analytical units. The 13 analytical units were selected as a functionally representative set. They jointly cover all functional space types present in the prototype—circulation and transition spaces (H1, H2, H3, C), the living core (MR, LR), private rooms (BR2–BR4), the sacred space (BS), and service and production spaces (AS, S3, GD3)—as well as all three floors and the full range of configurational positions in the building (integration from 0.628 to 1.417). The remaining units are further instances of functional types already represented, or open auxiliary spaces, and were therefore not evaluated separately; their inclusion would have increased respondent burden without adding functional or configurational information. Importantly, the selection was based solely on functional representativeness and evaluability in the VR environment, prior to and independently of any outcome data; since the syntax metrics were computed on the complete network, the configuration–perception analysis is not subject to selection bias arising from this choice.
3.4. Virtual Reality Experimental Design
Based on the spatial prototype model, this study uses Unity to build a full-scale three-dimensional virtual building environment, maintaining the spatial topological relationships, vertical hierarchy, and visual connections of the prototype.
To control the possible influence of non-spatial factors (kept as a methodological caution), the experimental environment removes explicit cultural symbols such as Buddhist shrines, religious images, and text signage, retaining only basic architectural features such as rammed earth walls and wooden structural elements. The hearth and Tibetan-style furniture were likewise not modeled; only generic, culturally non-specific furnishings (e.g., tables and chairs) were included. Nevertheless, retained features such as rammed earth and timber materials, window and skylight openings, and the characteristic spatial proportions and vertical room positions may themselves have constituted suggestive cues.
The experiment uses HTC Vive Pro equipment, with participants freely exploring in a first-person perspective, while the system records spatial positions and movement trajectories. The experimental procedure included equipment adaptation, virtual environment exploration, a spatial perception questionnaire, and cognitive-map drawing, during which participants briefly explained their drawings when clarification was needed.
All participants began at the same fixed starting position on the ground floor of the virtual building and were instructed to explore it freely until they indicated completion; no additional search or wayfinding task was given, and no time limit was imposed. Locomotion was continuous and controller-based, and position and orientation were recorded at 10 Hz throughout the session. Prior to analysis, the raw records were screened for sensor artifacts: terminal segments showing fixed orientation values, which are produced when the tracking device is not shut down normally, were identified and removed, and all behavioral statistics reported below were computed from the cleaned trajectories. Across the 36 participants, the cleaned exploration sessions lasted 765.9 s on average (SD = 450.3 s; range 220.9–2627.7 s, i.e., 3.7–43.8 min), and all 36 trajectories were retained in the analysis.
A total of 36 participants were recruited (9 male, 27 female), aged 18–33 years (20.7 ± 2.47 years). Except for one person, all participants had no prior experience with Aba Tibetan dwellings and received no relevant cultural background introduction before the experiment to reduce the influence of prior knowledge. All participants signed informed consent forms, and the experimental protocol was approved by the Ethics Committee of Beijing Forestry University.
3.5. Data Collection and Analysis
This study collected three types of analytical data: (1) behavioral data, including VR trajectories, spatial visitation rates, and dwell times; (2) cognitive data, including post-experiment cognitive maps and rating scales; and (3) perceptual data, including spatial meaning-related perception questionnaires. In addition, brief verbal explanations offered by participants while drawing their cognitive maps were recorded only as supplementary contextual information; they were not treated as an independent analytical dataset and were not subjected to separate coding or thematic analysis. Their sole function was to disambiguate ambiguous or partial drawings during cognitive-map coding.
Perceptual data were collected through a self-developed spatial perception questionnaire covering six dimensions—Importance, Centrality, Enclosure, Mystery, Rituality, and Religious Atmosphere—each rated on a 7-point Likert scale. The six dimensions were derived from an initial pool of 14 candidate items, generated through a review of the literature on spatial experience, place meaning, and environmental cognition and a pilot phase in which 12 non-participant volunteers (not included in the final sample) rated the relevance of each item to spatial meaning in the context of Tibetan dwellings; items with low relevance or high redundancy were removed, yielding the final six dimensions. For the full questionnaire item wording and item-level coding, see the Supplementary Materials.
Data analysis includes: identifying building spatial configuration characteristics through space syntax analysis; conducting trajectory statistics, dwell analysis, and spatial distribution analysis on VR behavioral data; performing statistical analysis on cognitive maps and perception evaluations; and comprehensively analyzing the relationships among spatial configuration, spatial practice, and meaning-related perception.
Each cognitive map was coded against a structured framework comprising six modules: spatial-structure cognition (e.g., main room and shrine room location, vertical entrance sequence, connection types), spatial cognitive elements classified after Lynch (boundaries, thresholds, landmarks, circulation anchors) and coded by floor, cognitive pattern assessment (path-dominant, structure-dominant, embodied, predictive, or mixed), influencing factors, drawing method (plan, axonometric, perspective, section, fragment view), and function-and-meaning inference. Each item carried a pre-specified coding standard and was scored for identification (0/1) and clarity (1–3), with the data source (drawing, verbal explanation, or questionnaire) recorded for every judgement so that map evidence could be cross-checked against participants’ own verbal explanations. Ambiguous or partial drawings were retained and classified explicitly (e.g., as fragment views) rather than excluded. Spatial completeness was computed for each participant as the proportion of the ten predefined spatial-structure features correctly identified (covering the composition of entrance hall and base type, the location and role of the main room and the shrine room, the vertical entrance sequence, and the principal connection types), averaged across participants; element identification was scored against the 24 predefined spatial elements. Connection accuracy was computed for each participant as the mean accuracy rating of the four predefined spatial-connection features—the vertical entrance-hall connection between floors, the hall-type connection, the corridor-type connection, and the room-chaining connection—on the three-point scale (1 = partially correct, 2 = basically correct, 3 = fully correct), with unidentified features scored as zero, scaled to the proportion of the maximum score and averaged across participants (M = 38.66%). Coding was conducted by a single primary coder, with the coding decisions subsequently reviewed in group sessions with three additional researchers; ambiguous or contested items were resolved through consensus discussion against the pre-specified criteria, and coding proceeded without reference to the syntactic results of the spatial units. Because the initial coding was performed by a single coder, formal inter-rater reliability coefficients could not be computed, and the coded results should accordingly be read as provisional pending independent verification through double coding; this limitation and the corresponding future directions are discussed in Section 7.3.
All statistical analyses were performed in Python 3.13. Descriptive statistics and Pearson correlations were computed with pandas 2.2 and SciPy 1.14. Cronbach’s α, the one-way repeated-measures ANOVA with Mauchly’s test of sphericity, Greenhouse–Geisser correction, and Bonferroni post hoc comparisons were computed with pingouin 0.5.6. Effect sizes for the repeated-measures analyses are reported as generalized eta-squared, η2G = SS_effect/SS_total, computed from the uncorrected sums of squares so that between-participant variance remains in the denominator; partial η2, which excludes that variance, is larger for every test reported here (0.29–0.39 for the six tests of Section 5.3.2, 0.06–0.30 for the floor-level tests of Section 5.3.3) and is not reported. The exploratory principal-component analysis, with Kaiser–Meyer–Olkin (KMO) sampling adequacy and Bartlett’s test of sphericity, was performed with factor_analyzer 0.11.0. Linear mixed-effects models were fitted by restricted maximum likelihood (REML) using the MixedLM implementation in statsmodels 0.14.4, with z-score-standardized Integration and Control Value as fixed effects and a participant-specific random intercept as the only random effect; marginal and conditional R2 values were derived from the fitted variance components. The binomial GEE logistic model for visitation was fitted with an exchangeable working correlation structure, clustered by participant (statsmodels GEE). Spatial-unit-clustered sandwich standard errors (G = 13 clusters; small-sample degrees of freedom G − 1 = 12) were computed with the cluster-robust covariance option of statsmodels, and the null-imposed wild cluster bootstrap with Rademacher weights (B = 9999) was implemented with wildboottest 1.2.1. In each application the imposed null hypothesis is that the coefficient of interest equals zero, and the test statistic is the cluster-robust t statistic recomputed on every resample, with the 13 spatial units as the resampling clusters; the procedure therefore addresses uncertainty attributable to the spatial units rather than to the participants. The significance level was set at α = 0.05, and all reported p-values are two-sided. Benjamini–Hochberg false discovery rate (FDR) correction (q = 0.05) was applied to the six repeated-measures F tests and, within each family, to the four composite-level and the 24 dimension-level Pearson correlations reported in Section 5.3.4; dimension-level correlation results are interpreted as exploratory and hypothesis-generating rather than confirmatory.
3.6. Reliability and Validity
This study cross-validates spatial-structure, behavioral, and perceptual evidence obtained from three complementary data streams, all built on the same spatial prototype: VR behavioral experiments, cognitive maps, and spatial perception evaluation. Findings from one stream can thus be constrained and checked against the others, with configurational metrics derived from space syntax serving as the analytical anchor against which the three streams are interpreted. Interview responses were used only as supplementary contextual information during the cognitive-map sessions (Section 3.5) and are not counted among the study’s analytical evidence.
Both space syntax analysis and VR experiments are conducted based on the same spatial prototype model, ensuring consistency of the analytical object. Meanwhile, all participants completed testing under uniform experimental environment and procedures to control experimental condition variations.
To further examine the construct validity of the questionnaire, an exploratory principal-component analysis was conducted on the dimension-level ratings (36 participants × 13 spatial units, N = 468). Sampling adequacy was acceptable (KMO = 0.80), and Bartlett’s test of sphericity was significant (χ2(15) = 1448.3, p < 0.001). Because the 468 ratings are non-independent, these statistics are reported as descriptive summaries of the covariance structure: with effective sample sizes between 37 and 53 (below), Bartlett’s χ2 is inflated, and its significance is not interpreted. The first component explained 58.3% of the variance and received substantial loadings from all six dimensions (0.55–0.88), which would be compatible with a general meaning-related perception dimension at the level of individual responses; whether it also reflects a structure shared across spatial units is examined below. The second component (17.5%) contrasted Enclosure and Mystery with Importance and Centrality, indicating systematic heterogeneity among the dimensions, consistent with the conceptual distinction between physical–perceptual attributes and affective, meaning-related evaluations. The six dimension scores showed good internal consistency at this level (Cronbach’s α = 0.853), and the arithmetic-mean composite correlated almost perfectly with the first component score (r = 0.998). This correlation is, however, close to tautological and is not treated as evidence of unidimensionality: the composite is an unweighted mean of the six dimensions and the first component is a weighted mean of the same six variables, so a high correlation between them is expected irrespective of whether the dimensions share a single underlying construct. The composite is accordingly retained only as an exploratory aggregate index for descriptive comparison, not as a validated measure of a single latent construct; dimension-specific results are treated as the primary perceptual evidence throughout Section 5.3. Because the hierarchical structure applies to the principal-component analysis itself, that analysis was repeated on the 13 spatial-unit mean ratings, where clustering is removed by aggregation. The loading pattern was unchanged in direction. The higher proportion of variance explained at that level (71.7% against 58.3%) is not interpreted quantitatively, because with 13 observations and six variables the leading eigenvalue is inflated by construction; the partition of rating variance between individual and spatial sources is instead documented by the intraclass correlations reported below. With only 13 units this analysis is reported as a check on the direction of the loading pattern, not as an independent factor analysis, and individual loadings are not interpreted. Reliability coefficients are consolidated here: with each dimension averaged across the 13 spatial units within the building, the six dimensions showed good internal consistency across participants (Cronbach’s α = 0.888), and at the level of the 468 individual ratings α = 0.853; the two coefficients refer to the same six dimensions aggregated at different levels and are reported for transparency, and neither is used inferentially. The building-level scale showed only modest internal consistency (α = 0.602); its mean inter-item correlation was 0.170 and several item pairs were negatively correlated (the lowest being −0.33), indicating that these items do not form a single dimension, so the scale was retained for descriptive purposes only (Section 5.3.1) and no scale-level interpretation is made of it.
The 468 ratings are not independent observations: each participant rated all 13 units, so the ratings are clustered within participants and within spatial units simultaneously. The principal-component analysis therefore describes the covariance structure of individual responses rather than the configuration-level structure of the 13 spatial units. Intraclass correlation coefficients indicate that 22% to 33% of the variance in the dimension ratings lies between spatial units (composite index, 0.329; individual dimensions, 0.222 to 0.327), with the remainder reflecting differences among participants; the effective sample size of the pooled ratings with respect to spatial-level inference is accordingly between 37 and 53 rather than 468 (effective n per unit, 2.88 to 4.10), obtained as m_eff = m/[1 + (m − 1)·ICC] with m = 36 participants per unit and then multiplied by the 13 units; this value accounts for clustering by spatial unit only and not for clustering within participants, and is therefore an upper bound rather than an exact figure. The first component is accordingly driven to a substantial extent by individual response tendencies rather than by a meaning structure shared across spaces, which is a further reason not to read it as evidence of a unified construct. The 13 unit-level mean ratings are nevertheless estimated with acceptable reliability (Spearman–Brown estimates from m = 36 participants and the intraclass correlations above fall between 0.91 and 0.95), so the aggregates used in Section 5.3 remain usable and the between-unit differences they carry are measurable rather than incidental—a precondition for the relational claims made in Section 6.
The heterogeneity among the dimensions is conceptual as well as statistical. Importance, Centrality, and Enclosure concern how participants evaluate the spatial properties of a unit, whereas Mystery, Rituality, and Religious Atmosphere concern culturally resonant evaluations. The empirical structure does not reproduce this contrast cleanly: on the second component, Enclosure and Mystery load together against Importance and Centrality, while Rituality and Religious Atmosphere contribute little. The two partitions therefore serve different purposes and are not treated as competing measurement models: the Section 6 grouping follows each dimension’s sensitivity to configurational position, whereas the second component summarises covariance among the dimensions; that the two do not coincide is itself an indication of multidimensionality rather than a defect of either partition, and with 13 units neither is offered as a validated two-factor measurement model. Because the number of spatial units is 13, no confirmatory factor analysis was attempted, and the principal-component analysis is reported throughout as a description of covariance structure rather than as confirmation of a latent structure.
3.7. Analysis Tiers and Inference Strategy
Three tiers of analysis are distinguished in advance. Tier 1 comprises the primary models specified before the sensitivity analyses were conducted: the dwell-time and perception linear mixed-effects models and the visitation model reported in Section 5.1.4 and Section 5.3.5. Their coefficients are reported under three inferential procedures—conventional model-based inference, spatial-unit-clustered robust inference (G = 13), and the null-imposed wild cluster bootstrap. For the two linear mixed-effects models the wild cluster bootstrap is the most conservative of the three and is therefore reported as the primary spatial-level procedure, with the model-based and cluster-robust results reported alongside it. For the generalized estimating equation used for the visitation outcome the bootstrap has been evaluated primarily for linear models, so the cluster-robust spatial-level result (G = 13) is reported as the primary spatial-level procedure for that model and the bootstrap is reported as a supplementary check; both are reported for every visitation coefficient so that the two procedures can be compared directly. Associations are labeled by evidential strength, as a description of how far the two spatial-level procedures agree: an association is labeled established if it is significant under both of the two spatial-level procedures (cluster-robust and wild cluster bootstrap), suggestive if it is significant under the cluster-robust procedure but not under the bootstrap, and not established if it is significant under neither. The labels are descriptive, are applied uniformly to all six Tier-1 associations reported in Section 5.4, and are the only descriptions of evidential strength used in the text. A suggestive label records the procedure-dependence of an estimate and supports no claim beyond directional consistency; no statement in the Abstract, Discussion, or Conclusions depends on a suggestive association being treated as significant. Tier 2 comprises the exploratory dimension-level analyses of the six perceptual dimensions (Section 5.3.4 and Section 5.3.5); two families of tests receive Benjamini–Hochberg false discovery rate control: the 24 dimension-level Pearson correlations of Section 5.3.4 and the four composite-level correlations reported in Section 5.3.4. No multiplicity correction is applied across the six dimension-level mixed-effects models of Section 5.3.5, each of which tests a single coefficient of interest; those models are reported as exploratory and are not treated as independent confirmatory evidence. False discovery rate control does not convert an exploratory result into confirmatory evidence, and no Tier 2 result is used to introduce claims that Tier 1 does not support. Tier 3 comprises the diagnostic sensitivity analyses: the leave-one-space-out refits, the wild cluster bootstrap, the visited-only refit, and the spatial-level refit of the visitation model, all reported in Section 5.4. Tier 3 results are used only to assess whether Tier 1 conclusions depend on individual spatial units or on the choice of inferential procedure; they do not generate independent substantive claims.
No analysis that was conducted has been omitted on the basis of the direction or significance of its result, and no model specification was altered after results were observed. Because the configurational predictors vary only across 13 spatial units, inference on those predictors is conducted with spatial-unit clusters throughout, and the 468 participant-level observations are not treated as independent with respect to them. Because the wild cluster bootstrap has been evaluated primarily for linear models, its application to the generalized estimating equation is reported as a supplementary check, and the cluster-robust result is treated as the primary spatial-level inference for that model.
4. Spatial Configuration Analysis
This section employs convex space analysis and visibility graph analysis (VGA) to quantitatively analyze the Aba Tibetan dwelling spatial prototype, identifying internal spatial topological relationships, visual structure, and spatial hierarchy characteristics.
Figure 4 shows the spatial prototype model and space numbering. This model retains the typical “Front Hall-Core Unit” organizational pattern of Aba Tibetan dwellings, along with spatial unit relationships, vertical hierarchy, and visual connection characteristics.
Figure 4.
(a) Plan of the spatial prototype model; (b) abbreviations of spatial units used in the floor plans.
Based on the same spatial prototype, a convex space model and a visibility graph model are established separately. The convex space model is used to analyze the spatial topological network, and the visibility graph model is used to analyze the visual relationship network.
4.1. Topological Configuration Analysis
Based on the convex space model (Figure 5), this study calculated integration and control value for each spatial node, analyzing the internal topological organizational characteristics of the building.
Figure 5.
The convex space model. Note: Spaces are represented as labeled nodes and the exterior is marked by ⊕. Nodes were arranged by spatial depth, and connections were classified as external, same-floor, and inter-floor links using different line types.
Results show clear variation among spatial node indicators, with high-value spaces primarily concentrated in circulation connection areas, while peripheral functional spaces generally show lower levels. The building interior forms a clear center-periphery spatial hierarchy.
Internal building integration shows clear differences, with H2 space being the highest (1.417), followed by C (1.381), H3 (1.201), and H1 (1.128). These spaces are all located in main circulation connection areas, possessing high accessibility in the overall topological network. Because the two are monotone functions of one another within a fixed graph (Section 3.3), this ordering can equally be read as one of increasing global depth; mean depth adds no information beyond the integration column and is therefore not tabulated. Step depth, measured from the exterior entrance, ranges from 2 (H1) through 3 (AS, C), 4 (H2), 5 (H3, MR) and 6 (LR, S3, BR2, BR3, GD3) to 7 (BR4, BS), with a mean of 5.08 (SD = 1.61): the entrance hall is the first interior unit reached, and the shrine room and the rear bedroom the last. The two depth orderings agree only partially (r = +0.724), so the sequence of access from the entrance is not simply the reverse of the integration ordering.
The corridor C has the highest control value (3.667), followed by H3 (2.667), the Main Room (MR, 2.333), and H1 (1.450). The exterior was modeled as a single convex node attached to entries of all first-floor spaces, as specified in Section 3.3; a sensitivity analysis excluding the exterior node yielded the same rank order of integration values across the 13 internal spaces.
High control value spaces are mainly concentrated in the front hall, stairs, and floor transition areas, whereas bedrooms, storage spaces, and other peripheral spaces have low control values, so the interior forms a local connection structure organized by a few key nodes (Figure 6, Table 1).
Figure 6.
Heatmaps of spatial configuration based on the convex space model: (a) integration; (b) control value.
4.2. Visual Configuration Analysis
Based on the VGA model, this study calculated visual connectivity and visual integration, analyzing the internal visual network characteristics of the building.
The highest visual connectivity values occur in the first-floor Front Hall (217.9) and the Animal stable (164.7), followed by the third-floor Hall (155.8) and the Buddhist shrine room (138.0); the Main Room (113.4) ranks seventh of the 13 units, so the high-connectivity zone is not confined to the second floor. Bedrooms and storage spaces generally exhibit low visual connectivity, suggesting a tendency for visual connectivity to decrease from central to peripheral spaces. In contrast, the Buddhist shrine room does not follow this pattern, despite its relatively peripheral spatial position (Figure 7, Table 1).
Figure 7.
Spatial configuration heatmaps based on the VGA model: (a) visual connectivity; (b) visual integration.
High visual integration areas are mainly distributed in the building center, Main Room, and circulation connection spaces, showing high consistency with the topological integration distribution.
As spatial depth increases, visual integration does not decrease uniformly: the lowest values occur in the second-floor Bedroom (BR2, 3.55) and Storage (S3, 4.06), whereas the Buddhist shrine room (5.75) and one third-floor bedroom (BR3, 8.47) lie above the building median despite their depth (Figure 7, Table 1).
4.3. Characteristics of Spatial Configuration
Synthesizing topological structure and visual structure analysis results, the Aba Tibetan dwelling spatial prototype exhibits the following configuration characteristics.
Multi-level spatial centers. Integration and control value analyses show that the building interior does not have a single center but forms multiple spatial nodes with different network roles. The front hall, stairs, and main room area perform highly across multiple indicators, constituting the core of the building’s spatial network; peripheral bedrooms, storage spaces, and the Buddhist shrine room form relatively peripheral areas.
Topological-visual consistency. Topological and visual analysis results show that the two types of spatial networks have high consistency. High integration spaces typically correspond to higher visual connectivity and visual integration levels. The central circulation spaces and main room area both appear as dual core areas, while peripheral spaces are low in both types of indicators.
Continuous vertical organization. Space syntax and VGA results show that the front hall and stair system connect different floors, forming a continuous vertical spatial organization. Circulation transition spaces maintain high spatial indicators across different floors, enabling the building interior to form a three-dimensional spatial structure composed of horizontal connections and vertical circulation.
5. Spatial Configuration and Spatial Responses
Section 4 revealed the internal topological relationships, visual structure, and vertical spatial organization characteristics of the Aba Tibetan dwelling spatial prototype through space syntax analysis. However, spatial configuration indicators primarily reflect the relational attributes within the building’s spatial system, and how they relate to actors’ actual experience processes requires further verification.
This section uses immersive virtual reality (VR) experiments to analyze participants’ behavioral, cognitive, and perceptual responses in the building environment.
5.1. Behavioral Responses: Spatial Configuration and Behavioral Practice
Behavioral responses reflect actors’ movement and dwell processes in architectural space, serving as an important basis for testing the effects of spatial configuration. This subsection analyses behavioral characteristics of different spatial units based on exploration trajectories, dwell times, and spatial visitation data from VR experiments, and further examines the statistical relationships between spatial configuration indicators and behavioral responses.
5.1.1. Spatial Exploration Path Characteristics
VR experiment results show that participants’ overall exploration process has high consistency, with spatial movement showing a characteristic of gradual unfolding from lower to upper floors.
The average exploration path length of 36 participants was 116.22 m, with a maximum of 335.99 m and a minimum of 36.60 m. The maximum is approximately 9.18 times the minimum, indicating certain individual differences in spatial exploration extent.
By floor distribution: the first floor average path length was 34.82 m (29.96%); the second floor was 40.15 m (34.55%); the third floor was 41.25 m (35.49%). Although the third floor has a smaller area, it has the highest exploration proportion, indicating higher spatial attention.
Overall trajectories show that participants’ movement mainly revolved around the front hall, stairs, and main circulation spaces, extending further to the Main Room, hall, and the Buddhist shrine room, forming an exploration pattern expanding from circulation spaces to core spaces.
5.1.2. Spatial Dwell Behavior Characteristics
Dwell time and visitation were operationalized from the cleaned position records (10 Hz; Section 3.4). Trajectories were recorded in the world coordinate system of the virtual model (in metres), aligned with the prototype from which the VR environment was built (Section 3.2); spatial-unit boundaries were taken from the same prototype and followed the functional room boundaries of the convex map (Section 3.3). Each spatial unit was treated as a three-dimensional region defined by its floor-plan polygon together with the vertical extent (z-range) of its floor; a position record was assigned to a spatial unit when its (x, y) coordinates fell within the unit polygon and its z-coordinate fell within the corresponding floor interval, which disambiguated vertically overlapping units on different floors. A visit to a unit was registered for a participant if at least one record was assigned to that unit, and the visitation rate was defined as the proportion of the 36 participants with at least one such record. Dwell time was computed as the cumulative within-unit duration, estimated as the sum of inter-sample intervals (0.1 s) over consecutive in-unit records; no minimum dwell threshold was imposed, so brief pass-throughs were counted as dwell time. For each unit, the average dwell time was computed across all 36 participants, with participants who never entered the unit assigned 0 s (Section 5.1.3, Table 2 note).
Table 2.
Correlation analysis between spatial configuration indicators and behavioral responses.
Dwell behavior further reflects the attraction degree of different spaces during the experience process.
Results show clear dwell differences among different spatial units. The third-floor Hall (H3) had the highest average dwell time of 147.34 s (25.5%); the first-floor Front Hall (H1) was 72.69 s (12.6%); the second-floor Corridor (C) was 71.85 s (12.4%); and the second-floor Main Room (MR) was 63.81 s (11.1%).
In contrast, auxiliary spaces had lower dwell times: Bedroom (BR2): 8.68 s; Storage (S3): 10.89 s; Animal stable (AS): 12.49 s.
Spatial visitation rates further show: front hall, corridor, stairs, and third-floor hall all had 100% visitation rates; the Buddhist shrine room had 91.7%; the Main Room had 69.4%; and the Storage attached to the Main Room (S3) had 30.6%.
The trajectory heatmap (Figure 8) shows that high-density activity areas are mainly concentrated in the front hall, stairs, second-floor corridor, Main Room, and third-floor hall.
Figure 8.
Trajectory heatmap showing movement density of the 36 participants across the three floors of the virtual prototype.
Notably, the third-floor Hall does not have the highest integration but has the highest dwell time, indicating that behavioral responses are not entirely explained by any single space syntax indicator.
5.1.3. Relationship Between Spatial Configuration Indicators and Behavioral Responses
To examine the relationship between spatial configuration and behavioral responses, this study uses Integration and Control Value as spatial configuration variables, average dwell time and spatial visitation rate as behavioral indicators, and employs Pearson correlation analysis (Table 2).
The dependent variable for inferential analyses was ln(StayTime + 1). This transformation allows zero-valued dwell times to be retained without arbitrary zero replacement, with non-visitors coded as ln(0 + 1) = 0. Thus, the 0 s observations were retained as valid observations and entered the linear mixed model on the transformed scale, while the participant-level random intercept accounted for between-participant baseline differences. Descriptive statistics were calculated using the original StayTime values.
Results show that Integration is significantly positively correlated with average dwell time (r = 0.669, p = 0.012), and also significantly correlated with visitation rate (r = 0.596, p = 0.032), indicating that higher spatial centrality is associated with higher visitation and dwell activity.
Control shows a stronger correlation with average dwell time (r = 0.769, p = 0.002), but does not reach significance with visitation rate (r = 0.395, p = 0.182), indicating that spatial control capacity is more strongly associated with dwell behavior than with entry behavior.
5.1.4. Linear Mixed-Effects Model of Dwell Time Under Cluster-Level Inference
Because the correlation analysis was based on only 13 spatial units, a linear mixed-effects model (LMM) was additionally fitted to examine the association between spatial configuration and dwell behavior while accounting for repeated observations within participants, with 36 participants and 13 spaces yielding 468 observations.
Model settings: Dependent variable: ln(StayTime + 1); Fixed effects: z-score-standardized Integration and Control Value; Random effects: participant-specific random intercept. Integration and Control Value were moderately correlated (r = 0.704; VIF = 1.980), indicating no substantial multicollinearity. Because both configuration predictors varied only at the spatial-unit level, with 13 distinct values across the 468 observations, model-based standard errors may underestimate the uncertainty associated with spatial-level effects. Therefore, inference was additionally evaluated using spatial-unit-clustered robust standard errors (G = 13, df = 12) and a null-imposed wild cluster bootstrap with Rademacher weights (B = 9999), both clustered by spatial unit, as complementary small-sample sensitivity analyses.
The model is expressed as Equation (4):
The fixed-effect estimates from this model are reported in Table 3, and the corresponding variance components in Table 4.
Table 3.
LMM results for spatial configuration and behavioral responses.
Table 4.
Random effects results for the dwell-time model.
The full-sample model treats non-entry as a dwell time of zero and therefore combines two distinct processes: whether a space was entered, and how long visitors stayed once inside. It is reported here as the reference specification, and the two component processes are analyzed separately below. Under model-based inference, both Integration (β* = 0.594, p < 0.001) and Control Value (β* = 0.316, p < 0.001) were positively associated with dwell time (Table 3). Under spatial-unit-clustered robust inference, the Integration association remained significant (SE = 0.175, t = 3.39, p = 0.005), whereas the Control Value association did not (SE = 0.194, t = 1.62, p = 0.130). Under the wild cluster bootstrap, neither coefficient reached the 0.05 level (Integration: p = 0.092; Control Value: p = 0.352). The marginal R2 was 0.235 and the conditional R2 was 0.347. The random effects indicated non-negligible individual-level variation among participants (Variance = 0.340; Table 4); accounting for this heterogeneity did not materially alter the estimated Integration coefficient. For the visitation process, a binomial GEE logistic model (clustered by participant, exchangeable working correlation, predictors standardized at the spatial-unit level) indicated a strong positive association between Integration and the probability of visitation (OR = 5.43, 95% CI [3.54, 8.34], p < 0.001), whereas Control showed a weaker negative association (OR = 0.58, 95% CI [0.38, 0.88], p = 0.010). The direction of this Control coefficient differs from the positive, non-significant unit-level correlation (r = 0.395, p = 0.182), because the unit-level correlation is marginal whereas the GEE coefficient is conditional on Integration (with which Control is correlated at r = 0.704); the two statistics therefore describe different contrasts rather than contradictory results. For the conditional dwell process, the model was refitted on the 363 observations in which the space was actually entered, excluding the 105 non-visits. The Integration coefficient was substantially attenuated relative to the full-sample estimate (β* = 0.116 versus 0.594; model-based p = 0.028) and was no longer significant under spatial-unit-clustered (p = 0.073) or wild cluster bootstrap (p = 0.145) inference. The Control Value coefficient remained positive (β* = 0.395 versus 0.316; model-based p < 0.001; cluster-robust p = 0.036; WCB p = 0.182). Read against these two component processes, the full-sample Integration–dwell-time association should be interpreted as largely reflecting differences in visitation rather than longer dwell times among visitors. This is consistent both with the space-level correlation between Integration and dwell activity (r = 0.669, p = 0.012; Table 2) and with the earlier observation that the third-floor Hall recorded the longest dwell time despite not having the highest integration. Overall, Integration was strongly associated with whether a space was visited, whereas its association with dwell time among entered spaces was small and not statistically robust; the Control Value association with dwell behavior was positive but statistically non-robust. The inferential strength of all coefficients remains limited by the small number of spatial units (G = 13), and the results should be interpreted cautiously.
Because the configurational predictors vary only across the 13 spatial units, the participant-clustered specification reported above does not address spatial-level uncertainty. The visitation model was therefore refitted with spatial-unit clusters (G = 13). The Integration estimate remained similar in magnitude (OR = 5.69) but was far less precisely estimated (cluster-robust 95% CI [1.20, 26.98], p = 0.049; wild cluster bootstrap p = 0.229), and the Control association was no longer distinguishable from no effect (OR = 0.57, cluster-robust 95% CI [0.22, 1.48], p = 0.267; bootstrap p = 0.305). Following the convention stated in Section 3.7, the cluster-robust result is taken as the primary spatial-level inference for this model and the bootstrap result as a supplementary check. The visitation–integration association is accordingly significant under the primary spatial-level procedure (p = 0.049) but not under the bootstrap, and is labeled suggestive rather than established under the rule set out in Section 3.7; the Control association is significant under neither procedure.
A structural limitation applies to the visitation outcome independently of the inferential procedure. The four units with the highest integration values—Staircase Hall (H2, 1.417), Corridor (C, 1.381), Hall (H3, 1.201), and Front Hall (H1, 1.128)—were entered by all 36 participants, so that the set of high-integration units coincides exactly with the set of circulation spaces that every participant had to traverse. In the opposite direction, the Buddhist shrine room shares the lowest integration value in the building (0.628) yet was entered by 91.7% of participants. The association between integration and visitation is therefore not separately identifiable from the functional requirement to pass through circulation spaces, and the visitation rate of the shrine room indicates that entry behavior is also shaped by functional and cultural factors that configurational position does not capture. This confounding is a property of the study design and cannot be resolved by any choice of estimator or inferential procedure; it is restated as a limitation in Section 6.4. At the same time, at G = 13 clusters neither inferential procedure is ideal: cluster-robust standard errors are known to over-reject with as few as 13 clusters, whereas the wild cluster bootstrap has limited power at the same cluster count; the cluster-robust p-value of 0.049 for this association therefore falls at the margin of the more anti-conservative of the two procedures and is read here as a directional indication only.
5.2. Cognitive Responses: Spatial Configuration and Spatial Cognition
Behavioral responses reflect actors’ actual movement processes in architectural space, while cognitive responses further reveal how actors organize, encode, and reconstruct spatial information. Cognitive maps can reflect internal spatial representations after spatial experience, and thus can be used to examine how spatial configuration is associated with cognitive organization [26].
This study, based on 36 post-VR cognitive maps and following Lynch’s cognitive map theory, classifies spatial cognitive elements into five categories: Paths, Nodes, Districts, Edges, and Landmarks. Combined with element identification count, spatial completeness, and connection accuracy rate, spatial cognitive characteristics are quantitatively analyzed.
5.2.1. Overall Spatial Cognition Characteristics
Cognitive map results show that participants could identify major building spatial elements but had relatively limited ability to reconstruct overall topological relationships (Table 5).
Table 5.
Cognitive map quantitative results.
Participants identified an average of 13.75 spatial elements (SD = 4.12), with spatial completeness of 40.00% and spatial connection accuracy of 38.66%. Some participants could completely reconstruct spatial relationships (both completeness and connection accuracy reaching 100%), but clear individual differences existed.
By cognitive element type: Landmarks had the highest identification count (4.17 ± 1.59); Nodes were second (3.33 ± 1.22); Districts: 2.75 ± 1.48; Paths: 2.42 ± 0.81; Edges were the lowest (1.08 ± 0.69).
Results indicate that actors more frequently remembered elements with visual prominence and spatial transition functions, constructing spatial cognitive frameworks using key nodes and visual references rather than completely replicating the building’s spatial structure.
5.2.2. Cognitive Organization Characteristics in Relation to Spatial Configuration
The frequency of spatial elements in cognitive maps shows that actors’ spatial cognition has obvious selectivity, with cognitive focus mainly concentrated on circulation organization, spatial transitions, and areas with prominent visual characteristics (Figure 9).
Figure 9.
Recognition frequencies of spatial areas in participants’ cognitive maps (N = 36; horizontal axis: recognition frequency, %; bar labels give percentage and n/36).
Circulation spaces form the cognitive skeleton. Stairs, as vertical circulation spaces connecting different floors, were identified in all 36 cognitive maps (100%); the front hall identification rate reached 97.2%. Since both serve spatial entry and path organization functions, they became the most stable spatial references.
Spatial area cognition shows hierarchical differences. The courtyard identification rate was 91.7%, the front hall area 72.2%, and the rear core unit space 63.9%. In contrast, the Main Room identification rate was only 36.1%, and the Buddhist shrine room only 22.2%. This result indicates that spatial functional importance does not necessarily translate into spatial cognitive prominence; cognitive formation relies more on spatial organization processes and experience paths.
Visual prominence further reinforces spatial localization ability. Pillars (77.8%), windows (66.7%), skylights (58.3%), and generic furniture (58.3%) all have high identification rates, providing actors with stable spatial references.
5.2.3. Correspondence Between Behavioral Practice and Spatial Cognition
Combined with the behavioral data from Section 5.1, spatial behavior and cognition have certain consistency but are not completely corresponding.
Circulation connection spaces simultaneously show high behavioral and cognitive importance. For example, stairs and the front hall have high identification rates. Although these spaces are not the highest dwell time areas, since all participants must pass through them, they become stable cognitive nodes.
In contrast, behavioral hotspots do not necessarily form cognitive hotspots. The third-floor Buddhist shrine room has a visitation rate of 91.7% but a cognitive identification rate of only 22.2%; the second-floor Main Room has relatively high dwell time but a cognitive reproduction rate of only 36.1%. This indicates that spatial entry and dwelling are not sufficient to directly form spatial memory; cognitive prominence is also jointly associated with spatial position, circulation organization, and visual characteristics.
Further analysis of cognitive map drawing methods found that over 60% of participants adopted a hierarchical representation approach, correctly expressing stair direction, showing a path-dominant cognitive mode that relies on environmental elements for localization. This indicates that actors mainly establish spatial cognitive structures through paths, nodes, and visual references rather than memorizing spatial units one by one.
Overall, spatial configuration was associated with the selective representation of paths, nodes, and spatial hierarchy in participants’ cognitive maps, although these representations also varied jointly with exposure frequency, exploration order, and visual salience rather than with configurational position alone. Circulation structure, spatial hierarchy, and visual references thus jointly constitute the foundations of the spatial cognition observed after exploration.
5.3. Perceptual Responses: Spatial Configuration and Meaning-Related Perception
To further explore the correspondence between architectural spatial configuration and meaning-related perception, this study organized 36 participants to complete a spatial perception questionnaire after VR experiments. All 13 spatial units were evaluated. In the questionnaire, these units were identified by number rather than by functional name, so that the religious connotations of room labels were not transmitted to participants. For spatial units that participants did not enter, ratings were based on the visual information available from the entrance or during passage. The questionnaire included building overall evaluation and spatial unit evaluation. Spatial evaluation covered six dimensions: Importance, Centrality, Enclosure, Mystery, Rituality, and Religious Atmosphere. Through descriptive statistics, repeated measures ANOVA, and floor comparisons, meaning-related perception characteristics of different spaces were analyzed, and their correspondence with spatial configuration was further explored. Throughout this section, “ritual character” and “religious atmosphere” denote meaning-related impressions formed under the sign-free condition, rather than recognition of culturally embedded meaning.
5.3.1. Overall Building Spatial Perception
Building overall evaluation results show that participants formed relatively consistent perception evaluations of the building’s overall spatial characteristics. The overall evaluation average score was 41.61 ± 3.57 (out of 49). Among these, special spatial atmosphere, spaces of particular significance, and spatial hierarchy and primary-secondary relationships all scored highly (M > 6), while ritual characteristics, spiritual or cultural activity support, and religious atmosphere all scored above the scale median of 4.
With explicit cultural symbols removed—and the hearth and Tibetan-style furniture likewise not modeled—relatively stable meaning-related perceptions still emerged among culturally unfamiliar observers. These perceptions cannot, however, be attributed to spatial organization alone: the design included no neutralised control condition, and retained materials, openings, and spatial proportions may also have contributed suggestive cues (Section 6.4). The overall building evaluation scale showed modest internal consistency (Cronbach’s α = 0.602, Section 3.6), below the level at which internal consistency is conventionally taken to indicate a homogeneous scale [32]; the relatively low α may reflect the broad content of its seven items, covering atmosphere, ritual support, and spatial hierarchy [33]. It was therefore used for descriptive purposes only, with all inferential analyses based on the spatial-unit scale (Section 3.5).
5.3.2. Meaning-Related Perception Differences Among Different Spaces
Comprehensive evaluation of different spatial units shows significant differences in meaning-related perception within the building. Among the six indicators’ comprehensive scores (calculated for each space as the arithmetic mean of the six dimension ratings; the construct validity of this composite is examined in Section 3.6), the Main Room (MR) was highest (5.72), followed by the Buddhist shrine room (BS) (4.89) and the third-floor Living Room (LR) (4.67). The Main Room received high evaluations in Importance (6.19), Centrality (5.69), and Religious Atmosphere (5.75); the Buddhist shrine room performed prominently in Mystery (5.03), Rituality (5.08), and Religious Atmosphere (4.83). In contrast, the Corridor (C) and Stair Hall (H2) had the lowest comprehensive evaluations (2.94, 3.04). Figure 10 illustrates the heatmap of meaning-related perception dimensions.
Figure 10.
Heatmap of perceived spatial meaning dimensions.
To test perception differences among different spaces, one-way repeated measures ANOVA was used. Since all six dimensions violated the sphericity assumption (Mauchly’s test, all p < 0.001), Greenhouse–Geisser correction was applied. Results showed that the spatial factor had significant main effects on all six perception dimensions: Importance (F(6.13, 214.67) = 18.185, ε = 0.511, η2G = 0.30), Centrality (F(6.43, 225.20) = 22.484, ε = 0.536, η2G = 0.33), Enclosure (F(6.47, 226.61) = 19.538, ε = 0.540, η2G = 0.31), Mystery (F(6.26, 219.20) = 14.236, ε = 0.522, η2G = 0.23), Rituality (F(6.99, 244.48) = 17.244, ε = 0.582, η2G = 0.26), and Religious Atmosphere (F(6.45, 225.82) = 17.006, ε = 0.538, η2G = 0.23), all p < 0.001, with effect sizes in the medium-to-large range.
To account for multiple testing across the six perception dimensions, the six omnibus F-test p-values were adjusted using the Benjamini–Hochberg false discovery rate (FDR) procedure [34]. All six dimensions remained statistically significant after adjustment, with adjusted p-values ranging from approximately 6.4 × 10⁻²¹ to 4.3 × 10⁻¹⁴. The BH-FDR correction reported here applies to the six predefined dimension-level F-tests. The configuration–dwell correlations of Table 2 and the composite-level correlations reported in Section 5.3.4 are likewise exploratory in status; exploratory status concerns the inferential weight accorded to a result and is independent of whether multiplicity is corrected. The four composite-level correlations reported in Section 5.3.4 and the 24 dimension-level correlations of Section 5.3.4 are accordingly reported with BH-FDR-adjusted p-values, and correction does not convert any of these exploratory results into confirmatory evidence.
Bonferroni post hoc comparisons showed numerous significant differences between core functional spaces and circulation spaces.
5.3.3. Spatial Perception Characteristics by Floor
Further analysis of spatial perception differences by floor (Table 6). Results show that different floors have different meaning characteristics:
Table 6.
Spatial perception comparison by floor.
First floor spaces: Enclosure was highest (M = 5.39), and Centrality was highest (M = 4.32), largely reflecting the ratings of the Front Hall (H1) and the Animal stable (AS). Second floor spaces had the lowest overall evaluation; except for the Main Room, the rest were mainly circulation and auxiliary spaces, with lower scores in Rituality and Religious Atmosphere. Third floor spaces received the highest ratings for Rituality (M = 4.09) and Religious Atmosphere (M = 4.04); Importance was descriptively highest on the third floor (M = 4.47, against 4.42 on the first floor) but did not differ across floors in the tests reported below.
Statistical tests were one-way repeated-measures analyses of variance with floor (1F, 2F, 3F) as a within-participant factor, computed on each participant’s mean rating across the units located on that floor (n = 36); Greenhouse–Geisser correction was applied, pairwise comparisons were Bonferroni-adjusted, and the six omnibus F-tests, one per perceptual dimension, were additionally adjusted using the Benjamini–Hochberg procedure. Enclosure differed across floors (F(1.81, 63.33) = 15.284, ε = 0.905, p < 0.001, η2G = 0.20), with first-floor ratings higher than both second-floor (p = 0.0002) and third-floor ratings (p = 0.0003). Centrality also differed across floors (F(1.73, 60.70) = 8.013, ε = 0.867, p = 0.001, η2G = 0.10), with first-floor ratings higher than second-floor ratings (p = 0.003). Rituality (F(1.71, 59.79) = 6.089, ε = 0.854, p = 0.006, η2G = 0.08) and Religious Atmosphere (F(1.71, 59.71) = 4.755, ε = 0.853, p = 0.016, η2G = 0.04) also differed across floors, in both cases with third-floor ratings higher than second-floor ratings (p = 0.0008 and p = 0.007). Two dimensions showed no overall floor difference: Mystery (F(1.85, 64.62) = 2.304, ε = 0.923, p = 0.112) and Importance (F(1.60, 56.12) = 2.266, ε = 0.802, p = 0.123). The null result for Importance does not conflict with the strong unit-level differentiation reported in Section 5.3.2 (F(6.13, 214.67) = 18.185, η2G = 0.30): Importance ratings vary mainly between units, and floor membership averages over units that differ in opposite directions, the second floor containing both the highest-rated unit (MR, M = 6.19) and the lowest-rated one (S3, M = 2.83); floor is therefore a coarse proxy for this dimension, and the pairwise contrast between the second and third floors (Bonferroni-adjusted p = 0.032) is not reported as a floor effect because the corresponding omnibus test is not significant. After Benjamini–Hochberg adjustment across the six floor-level F-tests, Enclosure (q < 0.001), Centrality (q = 0.004), Rituality (q = 0.012) and Religious Atmosphere (q = 0.024) remained significant; Mystery and Importance did not (q = 0.123 for both).
5.3.4. Relationship Between Spatial Configuration Indicators and Meaning-Related Perception
To further examine the relationship between spatial configuration and meaning-related perception, this study employs Pearson correlation analysis and linear mixed models (LMM).
Space syntax indicators include: Integration, Control Value, Visual Connectivity, and Visual Integration. All indicators were z-score standardized. Using 13 spatial units as objects, meaning-related perception means were correlated with space syntax indicators (Table 7).
Table 7.
Correlation analysis between spatial configuration and comprehensive meaning-related perception.
Results show no significant linear correlation between comprehensive meaning-related perception and space syntax indicators. At the dimension level, however, Enclosure was significantly negatively correlated with both Integration (r = −0.783, p = 0.002) and Control (r = −0.596, p = 0.032), Mystery with Integration (r = −0.656, p = 0.015), and Centrality positively with Visual Connectivity (r = 0.613, p = 0.026).
To address the multiplicity of these dimension-level tests (six perception dimensions × four configuration indicators = 24 Pearson correlations), Benjamini–Hochberg false discovery rate (FDR) correction was applied across the full set of 24 p-values; all 24 correlations are reported with their raw and adjusted p-values in Table S1. After correction, only the negative association between Enclosure and Integration remained significant (r = −0.783, p = 0.002, q = 0.038). The Mystery–Integration (q = 0.180), Centrality–Visual Connectivity (q = 0.191), and Enclosure–Control (q = 0.191) correlations did not survive correction and are therefore interpreted as exploratory rather than confirmatory. Given the small number of spatial units (n = 13), all dimension-level correlations are treated as hypothesis-generating, consistent with the exploratory status declared in Section 3.7. When the same BH-FDR procedure was applied to the four composite-level correlations in Table 7, none approached significance (adjusted p-values: Integration and Visual Connectivity, 0.578; Visual Integration and Control, 0.855). Because integration is derived from mean depth, the corresponding depth correlations are a re-parameterisation of the integration correlations rather than an additional family of tests: across the 13 units mean depth and integration are almost perfectly collinear (r = −0.976), so their agreement with the perceptual and behavioral outcomes follows by construction and is not treated as corroboration. They are reported without a separate multiplicity correction and are not entered into the set of 24. The depth measure that is not reducible to integration is step depth, the number of topological steps separating a unit from the exterior entrance; it is only partly redundant with integration (r = −0.690, p = 0.009; Spearman ρ = −0.758) and only moderately related to mean depth (r = +0.724). Step depth was not significantly associated with any of the outcomes: Enclosure (r = +0.258, p = 0.394), Mystery (r = +0.405, p = 0.170), Rituality (r = +0.184, p = 0.547) and Religious Atmosphere (r = +0.216, p = 0.478), dwell time (r = −0.356, p = 0.232) and visitation rate (r = −0.326, p = 0.278); none of these correlations reached significance. This provides no evidence that entrance proximity alone accounts for the observed Integration associations. However, given the small number of spatial units (n = 13), the non-significant correlations cannot rule out residual confounding by access sequence or other spatial properties. The distinction between configurational position and entrance proximity therefore remains suggestive rather than conclusive.
This indicates that the relationship between space syntax indicators and meaning-related perception is not a simple linear correspondence but varies across perceptual dimensions.
5.3.5. Linear Mixed-Effects Model of Meaning-Related Perception Under Cluster-Level Inference
The LMM uses all 468 individual-level observations while accounting for repeated measurements within participants. However, because the configuration predictors vary only across the 13 spatial units, the effective inferential information for their coefficients remains constrained by the number of spatial units (G = 13). Spatial-unit-clustered robust standard errors and a wild cluster bootstrap (WCB) [35] were therefore used as complementary small-sample sensitivity analyses; model-based, spatial-unit-clustered, and WCB results are reported in Table 8.
Table 8.
LMM results for the association between spatial configuration and meaning-related perception.
Model settings: Dependent variable: Comprehensive meaning-related perception; Fixed effects: z-score-standardized Integration and Control; Random effects: participant-specific random intercept.
Model form (Equation (5)):
The variance components corresponding to this model are reported in Table 9.
Table 9.
Random effects results for the meaning-related perception model.
The dependent variable in the LMM reported here is the composite meaning-related perception score (arithmetic mean of the six dimension ratings, treated as an exploratory summary index; Section 3.6). To address the dimension heterogeneity indicated by the second PCA component, dimension-level LMMs (Meaning_dimension ~ Z(Integration) + Z(Control) + (1|Participant), with the same cluster-robust and wild cluster bootstrap inference) were also fitted for all six dimensions; the dimension-specific coefficients were not uniform: Integration was strongly negatively associated with Enclosure (β* = −0.68), Religious Atmosphere (β* = −0.68), Mystery (β* = −0.57), and Rituality (β* = −0.49), all p < 0.001 under model-based inference, but was close to zero for Importance (β* = −0.05, p = 0.637) and Centrality (β* = −0.06, p = 0.546). The composite-level coefficient therefore summarises a heterogeneous set of dimension-level associations rather than a uniform one. The four associations remained significant under spatial-unit-clustered inference, whereas none of the six coefficients reached the 0.05 level under the wild cluster bootstrap (p = 0.22 to 0.84); full estimates are given in Table S2. In accordance with Section 3.7, these dimension-level models are treated as exploratory and no multiplicity correction is applied across them: they are used to characterize how the association differs across dimensions, which is the primary perceptual evidence reported in this section, and they are not used to introduce at the composite level any claim that the composite-level model does not itself support; the full set of estimates is reported in Table S2.
LMM results show that, after controlling for individual differences, Integration is negatively associated with meaning-related perception (β* = −0.423, p < 0.001) and Control is positively associated with meaning-related perception (β* = 0.255, p = 0.001) under model-based inference (Table 8 and Table 9). Under cluster-robust inference at the space level, the negative Integration association remains statistically significant (SE = 0.190, t = −2.23, p = 0.046), whereas the Control association does not (SE = 0.305, t = 0.84, p = 0.419). Under the wild cluster bootstrap sensitivity analysis, neither association reaches significance (Integration: p = 0.427; Control: p = 0.599). The Integration coefficient estimate was stable in magnitude across the procedures (β* ≈ −0.42), but its significance depended on the inferential method. The Integration–meaning relationship should therefore be interpreted as suggestive rather than conclusive, while the Control effect was directionally positive but not statistically robust. The marginal R2 was 0.051 and the conditional R2 was 0.207.
Higher-Integration spaces did not necessarily receive higher overall meaning evaluations. Rather, lower-Integration spaces were associated with differentiated meaning-related perceptions, particularly in dimensions related to mystery and religious atmosphere evoked among culturally unfamiliar observers, suggesting that spatial centrality alone does not account for the observed variation in perceived meaning.
Overall, the findings do not support a simple “central space–high meaning” correspondence between spatial configuration and meaning-related perception. These findings provide the empirical basis for Section 6, where they are discussed in relation to structural affordance, spatial practice, and perceived meaning.
5.4. Sensitivity and Robustness Analyses
To examine whether the reported estimates depend on any single spatial unit, the two primary linear mixed-effects models were refitted 13 times, omitting one spatial unit at a time and holding all other specifications fixed, including the standardization of the predictors, which was retained at the full-sample values so that the refitted coefficients remain comparable with those reported above. The Integration coefficient remained positive in every refit of the dwell-time model (β* = 0.52 to 1.06) and negative in every refit of the perception model (β* = −0.48 to −0.24). The Control coefficient was less stable, reversing sign when H2 was omitted from the dwell-time model (β* = −0.06) and when MR was omitted from the perception model (β* = −0.04). Because each refit shares 12 of the 13 units with every other refit, agreement in sign across them is not independent evidence and is used here only to identify which units drive the estimates. Table S3 reports the full set of refits.
The visitation model was subjected to the same procedure (Table S4). The Integration odds ratio exceeded 1 in all 13 refits (OR = 4.13 to 10.55), with confidence intervals excluding 1 throughout, whereas the Control odds ratio remained below 1 in all 13 refits but had confidence intervals crossing 1 in four of them. Two units exerted marked leverage: omitting the Buddhist shrine room raised the Integration odds ratio from 5.43 to 10.55, and omitting BR4 raised it to 10.11, indicating that these two units depart substantially from the trend implied by the remaining units.
Leave-one-space-out analysis indicates whether an estimate is driven by any single spatial unit; it does not address inferential precision with 13 clusters, so the two procedures can legitimately differ. The bootstrap is therefore the primary spatial-level procedure for the two linear mixed-effects models, and the cluster-robust result is the primary spatial-level procedure for the visitation model (Section 3.7), whereas the leave-one-space-out results are used only to identify which units drive the estimates. As a formal counterpart to the refits, unit-level influence was assessed directly for the three unit-level associations on which the patterns rest–dwell time, visitation rate and Enclosure–each regressed on Integration across the 13 unit means, using leverage (h), Cook’s distance and DFBETAS with the conventional thresholds D > 4/n = 0.31 and |DFBETAS| > 2/√n = 0.55. Two units exceeded both thresholds in the dwell-time model, H2 (h = 0.35, D = 1.01, DFBETAS = −1.24) and H3 (h = 0.17, D = 0.79, DFBETAS = +1.59), and they act in opposite directions: omitting H2 raises the slope from 92.2 to 130.9 s per unit of integration, and omitting H3 lowers it to 63.9. No unit exceeded either threshold in the visitation model, where the largest distances were those of S3 (D = 0.28), BS (D = 0.25) and BR4 (D = 0.21). One unit exceeded both thresholds in the Enclosure model, the Corridor C (h = 0.31, D = 0.57, DFBETAS = −0.87), whose omission weakens the slope from −2.78 to −2.16 without reversing it. These diagnostics concern the Integration coefficient, on which the three patterns rest. The dwell-time association is accordingly the most unit-dependent of the three, whereas the Enclosure association, although influenced by a single unit, retains its direction and significance when that unit is excluded.
Table 10 summarises the evidential status of the principal associations. Two regularities are apparent. First, the three Integration coefficients remained significant under spatial-unit-clustered inference (p = 0.005, 0.049, and 0.046 for the dwell-time, visitation, and perception outcomes respectively), whereas the three Control coefficients did not (p = 0.130, 0.267, and 0.419). Second, under the wild cluster bootstrap none of the six coefficients remained significant, so that under the labelling rule of Section 3.7 the three Integration associations are suggestive and the three Control associations are not established (final column of Table 10). The divergence between the cluster-robust and bootstrap results is consistent with, though not shown to be caused by, the low power of the bootstrap when the number of clusters is small, and is reported as a difference between inferential procedures rather than as evidence that the associations are absent. One dimension-level association stands apart from this pattern: the negative association between Enclosure and Integration is the only one of the 24 dimension-level correlations to survive false discovery rate correction (r = −0.783, q = 0.038). The dimension-level linear mixed-effects model for Enclosure is a separate analysis from this correlation: fitted on the 468 participant-level observations, it gives β* = −0.68 (95% CI [−0.87, −0.49]), which is significant under spatial-unit-clustered inference (p = 0.002) but not under the wild cluster bootstrap (p = 0.419). The two analyses agree in direction but are not the same test, and the bootstrap result is not a direct check on the correlation. The non-significant wild cluster bootstrap result may reflect limited power under the small number of spatial clusters; however, the present data do not allow this explanation to be distinguished conclusively from weak or heterogeneous associations. The Enclosure–Integration association is accordingly reported as the strongest exploratory signal among the dimension-level configuration–perception associations, and as suggestive rather than established. Because this correlation is computed on 13 unit means, it was given the same spatial-level checks as the fitted models. Across the thirteen leave-one-unit-out refits r ranged from −0.844 to −0.694, remaining negative and significant in every case (p = 0.0006 to 0.0124); the correlation is weakest when the Corridor (C) is omitted, and no single unit reverses it. A unit-level bootstrap (9999 resamples of the 13 units) gave a 95% percentile interval of [−0.954, −0.187], with 98.7% of resamples negative; the corresponding Fisher z interval is [−0.93, −0.41]. Both intervals are wide, as expected when G = 13, and neither includes zero, so the association does not depend on any single unit. It remains an exploratory dimension-level result and is not entered into the Tier 1 labelling of Table 10.
Table 10.
Evidential status of the principal associations (labels defined in Section 3.7).
Table S2 reports the dimension-level models referred to in Section 5.3.5. The negative association with Integration is concentrated in Enclosure, Religious Atmosphere, Mystery, and Rituality, whereas Importance and Centrality show no association at all. The same divergence between inferential procedures recurs: the four associations remain significant under spatial-unit-clustered inference, but none of the six coefficients is significant under the wild cluster bootstrap. Consistent with Section 3.7, these models are exploratory and are not used to assert associations that the bootstrap does not support.
6. Discussion
6.1. Spatial Configuration and Meaning-Related Perception
The results show that there is no simple linear correspondence between architectural spatial configuration and meaning-related perception. Space syntax analysis revealed the building’s internal topological relationships, visual structure, and spatial hierarchy, while VR experiments showed that different spaces present differentiated responses at behavioral, cognitive, and perceptual levels. Behaviourally, higher-integration spaces generally showed greater dwell activity, although the corresponding association was not significant under the wild cluster bootstrap (p = 0.092; Section 5.4). The Buddhist shrine room, despite low integration, received prominent evaluations on Mystery, Rituality, and Religious Atmosphere. Cognitively, actors did not simply replicate the building but formed selective spatial representations organized around circulation paths, key nodes, and vertical hierarchy. Together, these results indicate dimension-specific associations: different configurational properties align with different behavioral, cognitive, and perceptual responses, and neither usage frequency nor spatial centrality alone accounts for meaning-related perception.
Based on this, architectural space does not directly endow fixed meaning but participates in meaning formation through the organization of action paths, spatial cognition, and experience processes. This does not add evidence to the configuration–behavior relation, which the space syntax literature has already established. In the terms of Structuration Theory, architectural space is read here as a structural condition of practice rather than an external force that fully determines action—it provides organizational conditions that actors engage with actively. Because the study examined a single standardized prototype rather than experimentally manipulating multiple configurations, these associations are interpreted as relational rather than causal.
6.2. Structural Affordance as a Configurational Framework
As stated in Section 2.2, structural affordance is a descriptive vocabulary naming the relational capacity formed between spatial configuration and practice; it is not itself a directly measurable variable. Evaluated against these three conditions, the findings are as follows. The first was only partly met: its first clause is not supported, because the behavioral, cognitive, and perceptual responses did show correspondence with the configurational measures rather than little correspondence, although the strength of this correspondence varied across response types and inferential procedures and was in most cases descriptive or inferentially suggestive rather than established; its second clause—that the variation could be fully accounted for by non-configurational factors—is not excluded, because room function and floor area are confounded with configurational position in this building (Section 5.1.4 and Section 6.4). The second was not met: no single spatial unit ranked highest on all syntactic measures and all perceptual dimensions alike, so a differentiated distribution across the configuration does exist. The third could not be evaluated: whether cognitive salience remains associated with configurational position after accounting for exposure frequency remains unresolved, because the units most often represented in the cognitive maps were also those most often traversed (Section 6.2.2 and Section 6.4). On this basis, three recurring relational patterns—derived inductively from the results rather than specified in advance—are interpreted as manifestations of structural affordance. Of the three conditions set out in Section 2.2, none was clearly met, one was only partly met because the confounding of spatial function and area with configurational position could not be excluded, and one could not be evaluated. The evidence base for the framework is therefore weak: the three patterns described below are an ordering of what was observed, not a corroboration of the framework.
6.2.1. Path Facilitation
Higher integration was associated with greater dwell activity and visitation, whereas the association with control value was more behavior-specific, concentrating on dwell time rather than visitation. Importantly, the third-floor Hall, which recorded the longest average dwell time, was not the highest-integration space, indicating that configurational position does not act alone. This pattern is consistent with the natural-movement line of space-syntax research, which associates configuration with movement distribution independently of attractors [36], and with configurational analyses of Tibetan vernacular dwellings [8,9,10]. The standardized VR setting reduces variation from function, furnishing, and field conditions while lowering ecological validity, so the comparison is indicative rather than direct and should not be framed as demonstrating that integration determines movement. Rather, the recurring configuration–behavior association, considered together with the cognitive and perceptual findings, is interpreted as a cross-level relational pattern termed path facilitation. The evidence for this pattern is directional but inferentially weak. The corresponding unit-level correlations were positive (r = 0.669 for dwell time, r = 0.596 for visitation); the dwell-time association was not significant under the wild cluster bootstrap (p = 0.092), and the visitation association was significant under spatial-unit-clustered inference but not under the bootstrap (cluster-robust p = 0.049; bootstrap p = 0.229); under the labelling rule of Section 3.7 both are therefore suggestive rather than established. As Section 5.4 reports, the sign of the Integration coefficient was consistent across the leave-one-space-out refits while its magnitude was not (dwell-time β* = 0.52 to 1.06; visitation OR = 4.13 to 10.55); because the refits share 12 of the 13 units, this consistency identifies the units that drive the estimates and does not constitute independent evidence. In addition, visitation rate is confounded with the functional requirement to pass through circulation spaces (Section 5.1.4), so the visitation evidence cannot distinguish configurational position from circulation function. Path facilitation is therefore proposed as a pattern whose direction the present data consistently indicate and whose magnitude and significance they do not establish.
6.2.2. Node Anchoring
Circulation and transition spaces dominated the cognitive maps, particularly the staircase and front hall, whereas the Buddhist shrine room was frequently visited but far less frequently represented. This divergence raises the possibility that exposure frequency alone may not fully explain cognitive salience. However, the most frequently represented units were also those most frequently traversed, so the present data cannot distinguish the contribution of configurational position from that of exposure frequency, visual salience, or the distinctiveness of vertical circulation. The pattern is therefore interpreted as consistent with node anchoring, in which configurational position within the transition structure may be associated with cognitive reference points [20,21,22,26], rather than as evidence that configuration determines cognitive formation. This evidence is descriptive: no inferential test was applied to the frequency with which units were represented, so configurational position and exposure frequency are not separable here (Section 6.4). Node anchoring is accordingly the least substantiated of the three patterns and is stated as an observation to be tested rather than as a finding.
6.2.3. Configurational Differentiation
Configuration was associated with perception in dimension-specific ways: more enclosed, lower-integration spaces tended to receive higher mystery and ritual character evaluations, third-floor spaces received higher rituality ratings than second-floor spaces, and integration was negatively associated with the exploratory composite index in the linear mixed-effects model (β* = −0.42), although this association was not significant under the wild cluster bootstrap (p = 0.427) and is therefore treated as suggestive rather than as evidence of a general configurational–semantic relationship. The dimension-level evidence is more differentiated than the composite suggests: the negative association between Enclosure and Integration is the only one of the 24 dimension-level correlations to survive false discovery rate correction (r = −0.783, q = 0.038), and the separate dimension-level linear mixed-effects model for Enclosure is significant under spatial-unit-clustered inference (β* = −0.68, p = 0.002) but not under the bootstrap (p = 0.419), whereas Importance and Centrality showed no association with Integration at all (β* = −0.05 and −0.06; Table S2). Configurational differentiation is therefore supported at the level of specific perceptual dimensions, Enclosure in particular, and is not supported as a general relation between configuration and overall meaning-related perception. The pattern is named after the variable that does the differentiating, and the term is used here in a restricted sense. What differentiates the units is their position in the configurational ordering of the building, indexed by integration, not their position along the sequence of access from the entrance: step depth, measured from the exterior node of the convex map, was not significantly associated with any of the perceptual or behavioral outcomes (Section 5.3.4), so the pattern is described here as one of configurational rather than sequential differentiation. This null result is informative rather than merely negative: it argues against entrance proximity as the sole driver of the integration associations, since had those associations reduced to entrance proximity, step depth would have been expected to track the outcomes as well. Given the moderate collinearity between integration and step depth (r = −0.690), however, this check has limited power to separate the two, and the distinction is reported as suggestive rather than decisive. Perceived sequence was not measured directly, and the step-depth analysis is reported as a check on that alternative interpretation rather than as evidence for a sequential mechanism.
This is broadly consistent with research on partial concealment and sequential revelation, which links delayed visual access to exploratory and affective responses [37], and with studies of sacred space in traditional settlements: Jiang et al. [38] show that sacred spaces, including Tibetan household shrine rooms, operate as organizing principles of settlement layout across ethnic groups. The present findings complement this literature from a different direction. Because explicit religious signs were removed from the model, the residual association between enclosure, integration, and perceived rituality suggests, without demonstrating, that configurational properties may form part of the conditions associated with meaning-related perception, though it cannot demonstrate recognition of culturally embedded Tibetan meanings.
6.2.4. Theoretical Contribution
Taken together, the three patterns suggest that structural affordance operates at the configurational rather than the feature level. Path facilitation concerns the relation between configurational centrality and movement; node anchoring concerns the emergence of cognitive reference points; and configurational differentiation concerns the relation between a unit’s position in the configurational ordering of the building and its meaning-related perception. These patterns are not causal mechanisms but provisional relational distinctions derived from the present data, which future research may refine or replace. Table S5 states, for each pattern, the observations consistent with it, the observations that qualify or count against it, the alternative explanations that the present design does not exclude, and the aspects that remain unverified.
The value of the framework does not depend on all three patterns being confirmed. Its contribution is threefold. It provides an architectural-scale vocabulary that allows behavioral, cognitive, and perceptual findings about the same building to be stated in comparable terms rather than in separate literatures. It yields one dimension-specific finding—the negative association between Enclosure and Integration—that survives both correction for multiplicity and spatial-unit-clustered inference, even though it does not survive the bootstrap. And it specifies, for this design, which of its own claims cannot be tested with the present data. The third of these is as much a result as the first two: the non-identifiability of the visitation association and the inseparability of configurational position from exposure frequency are properties of the design that any study of this kind will have to address.
We would also state explicitly what the three patterns are not: each corresponds to a relation that has been examined before, and none is presented as newly discovered. Path facilitation restates the configuration–movement relation established in the natural-movement literature [36] and in configurational studies of Tibetan vernacular dwellings [8,9,10]; node anchoring restates the landmark and node elements of cognitive-map research [20,21,22,26]; and configurational differentiation restates work on partial concealment and sequential revelation [37] and on sacred space as an organizing principle of settlement layout [38]. The contribution claimed is therefore not the discovery of these associations but their alignment: stated for one building, one syntactic description and one sample of participants, they can be used to constrain one another. The units that carry the movement association also carry the cognitive association, so path facilitation and node anchoring cannot be separated at this building (Section 6.4); and the perceptual association is present for Enclosure but absent for Importance and Centrality (Table S2), so configurational differentiation cannot be stated as a general configuration–meaning relation. Neither qualification follows from any one of the three literatures taken alone, and both are reported as limitations of the framework rather than as confirmations of it.
6.2.5. Position Within the Affordance Lineage
The contribution can be further clarified by comparison with specific empirical work in the affordance lineage. Gibson’s affordance [12] concerns local feature-action correspondences; the present study instead documents configuration-practice-cognition-perception relations that are distributed across the spatial network rather than paired with individual features. Norman [13] emphasizes whether action opportunities are perceived; the present finding that explicitly religious signs were removed yet differentiated meaning-related ratings still emerged across spaces suggests that configurational position may contribute to perceived spatial character even in the absence of explicit sign-based cues, while remaining subject to the inferential uncertainty reported in Section 5.4.
Lechner et al. [17] focus on the transformation capacity of building form (Umbau); the present study instead offers an empirical reading of ‘form already in use’ rather than ‘form to be transformed,’ examining how an existing configuration is associated with observable behavioral, cognitive, and meaning-related responses. This reading is compatible with Chemero’s [14] radical embodied cognitive science, although structural affordance is limited here to a configurational scale and does not claim the broader organism-environment coupling Chemero addresses. On this basis, the present study suggests that affordance-like relational patterns may be described at the configurational scale: the distribution and ordering of action possibilities across a configuration may be associated not only with practice but also with cognitive salience and meaning-related perception. Consistent with the tiering set out in Section 3.7, this description is provisional: none of the associations on which it rests is established under the evidential rule, and it is therefore offered as a formulation to be tested rather than as a demonstrated extension of affordance theory. The contribution is not a replacement of affordance theory but an indication that affordance-like relational patterns may persist at the level of overall spatial ordering, where the relevant “features” are configurational positions rather than local attributes.
6.3. Structuration and the Active Role of Spatial Practice
The framework treats participants as active interpreters rather than as passively determined by spatial configuration. Their trajectories, dwell behavior, and cognitive maps indicate that participants encountered and interpreted path relationships, spatial nodes, and hierarchical structures during exploration. Given the short-term and unfamiliar setting, these observations are interpreted as immediate behavioral and cognitive responses rather than evidence of reflexive monitoring in Giddens’ specific theoretical sense or of the recursive reproduction of social structure.
The findings can be interpreted through a provisional process-oriented framework in which spatial configuration provides conditions for spatial practice, while structural affordance offers a vocabulary for describing the relational opportunities associated with configuration. Participants’ behavioral, cognitive, and perceptual responses are consistent with aspects of this interpretation, but the present design does not establish a causal sequence among these responses or demonstrate a process of long-term meaning formation. These relationships therefore remain propositions for further empirical testing rather than a validated mechanism. This interpretation avoids both environmental determinism and the reduction in spatial meaning to cultural symbols alone.
6.4. Scope and Limitations of the Interpretation
The interpretation is bounded by the study design. The results concern a single standardized prototype of Aba Tibetan dwellings, experienced through short-term VR exploration by culturally unfamiliar participants, with explicit religious signs removed. Moreover, because the design included no control condition in which the same configuration was presented with fully neutralised materials and openings, the contributions of configurational properties and of retained suggestive features to the ritual character and religious atmosphere ratings cannot be causally separated. They therefore characterize meaning-related perception under controlled conditions rather than culturally embedded meaning, and generalisation to other dwelling types or to inhabitants’ experience is not warranted. Configurational position and exposure frequency could not be fully separated in the cognitive analysis, and the number of spatial units (n = 13) limits inferential robustness, as the sensitivity analyses in Section 5 indicate. Within these bounds, structural affordance offers a vocabulary for connecting configurational properties with practice, cognition, and meaning-related perception.
A further limitation concerns identifiability. As set out in Section 5.1.4, the association between integration and visitation cannot be separated from the functional requirement to traverse the high-integration circulation spaces, and no inferential procedure can resolve this within the present design. The sensitivity analyses in Section 5.4 show that the inferential results depend on the procedure used. At G = 13 clusters, neither procedure is ideal: cluster-robust standard errors are known to over-reject with as few as 13 clusters, while the wild cluster bootstrap has limited power at the same cluster count. The visitation–integration association should therefore be read as a directional indication only.
7. Conclusions
7.1. Main Findings
This study takes Aba Tibetan dwellings as a case, employing convex space syntax, visibility graph analysis, VR experiments, cognitive maps, and spatial perception evaluation to examine the relationships among spatial configuration, action practice, and meaning-related perception.
The typological analysis characterizes Aba Tibetan dwellings as organized around a stable Front Hall-Core Unit pattern with a vertical spatial hierarchy, and the standardized prototype constructed from this pattern shows clear differences among spatial units in integration, control value, and visual characteristics.
Further analysis shows dimension-specific associations between spatial configuration and behavioral, cognitive, and perceptual responses: The fitted models showed a positive association between Integration and visitation and a positive association between Integration and dwell time, although neither association was established under all spatial-level inferential procedures. The Control coefficient was positive in the dwell-time model under conventional inference but was not robust to spatial-level inference, while its association with visitation was not established. Moreover, the Integration–dwell association largely reflected differences in visitation rather than longer dwell time per visit. Cognitive maps showed that participants organized environmental understanding primarily around paths, nodes, and the vertical hierarchy, although this was also associated with exposure frequency and visual salience. Lower-integration, more enclosed spaces received differentiated meaning-related evaluations. None of these associations is established under the evidential rule specified in Section 3.7, and the visitation association in particular is not separable from the functional requirement to pass through circulation spaces (Section 5.1.4 and Section 5.4). The Enclosure–Integration association is the strongest exploratory signal among these findings, although the corresponding dimension-level mixed-effects model was not significant under the wild cluster bootstrap.
Based on these results, this study offers structural affordance as a descriptive vocabulary for translating the structure–practice relationship of Structuration Theory, employed here as an interpretive lens, into architectural spatial analysis. This vocabulary orders the observed correspondences between objective spatial configuration and subjective spatial experience through three relational patterns—path facilitation, node anchoring, and configurational differentiation—offering an interpretive analytical perspective for understanding the formation of meaning-related perception in traditional architectural space. These three patterns are provisional relational distinctions derived inductively from the present results; they are offered as hypotheses for further testing rather than as established findings (Table S5), and the evidence presently available is insufficient either to confirm or to reject them. What the study therefore contributes is not a confirmed set of associations but a procedure for producing and reporting them under stated evidential limits (Section 7.2).
7.2. Contributions
Under the evidential rule specified in Section 3.7, none of the six Tier-1 associations summarized in Table 10 is established: three are suggestive and three are not established under either spatial-level procedure. Accordingly, the contribution of this study is not a set of established associations but a reproducible procedure for relating configurational measures to behavioral, cognitive, and meaning-related responses under explicitly stated evidential limits, together with a descriptive vocabulary for reporting such associations. Within this framing, the study contributes in three main aspects.
First, at the methodological level, it integrates configurational analysis (space syntax) with a VR-based behavioral experiment across three complementary data streams—movement trajectories, cognitive maps, and multi-dimensional perception ratings—with the configurational metrics serving as the analytical anchor for their interpretation. Because the evidential rule is specified in advance and the inferential limits of the design are reported together with the results, this pipeline can be reproduced on other building types and its outputs compared under the same limits.
Second, at the theoretical level, it develops structural affordance as a descriptive vocabulary rather than a theory, drawing on the structure–practice relationship in Structuration Theory to interpret how spatial configuration may provide practical conditions for action, cognition, and meaning-related perception. The three relational patterns identified inductively in Section 6.2—path facilitation, node anchoring, and configurational differentiation—characterize this vocabulary at the configurational scale; they order what was observed rather than describe effects demonstrated here. As reported in Section 5.4, Section 6.2.1, Section 6.2.2 and Section 6.2.3 and summarized in Table 10, none of the associations on which they rest is established. The supporting, qualifying, and alternative evidence for each pattern is set out in Table S5.
Third, at the practical level, within the scope of the present findings, the study suggests that the value of traditional architecture may reside not only in individual functional spaces or cultural symbols but also in overall spatial relationships and in the configurational ordering of those relationships. Because the associations on which this suggestion rests are not established, it is offered as a consideration for further examination rather than as a basis for practice guidance: should these relational patterns be confirmed in further work, conservation and renewal practice would have reason to attend to the integrity of spatial organizational structure rather than being limited to physical form preservation.
7.3. Limitations and Future Research
This study has several limitations.
First, VR experiments reflect short-term spatial experience: in Giddens’ terms [27], the recurrent practices through which structure is reproduced cannot be captured by a short-term design, so the findings concern immediate responses to configurational properties rather than long-term processes of meaning formation. Future research combining long-term behavioral observation, ethnographic research, and usage records could further examine the role of spatial configuration in continuous social practice.
Second, the single-case basis of the study means that the generality of the framework requires verification through cross-regional, cross-cultural, and cross-typological research.
Third, the perceptual ratings for spaces that some participants did not enter were based on visual information available from entrances or passing views, and therefore reflect partially inferred rather than fully embodied spatial experience.
Fourth, the sample of 36 participants (9 male, 27 female; mean age 20.7 ± 2.47 years) was young, gender-unbalanced, and drawn from a single university context; the generalizability of the findings to Tibetan residents, older residents, or culturally knowledgeable users remains to be tested.
Fifth, as noted in Section 6.4, the study measures meaning-related perception among culturally naïve observers; future research should compare culturally embedded and culturally naïve perceptions of the same environments.
Sixth, the three relational patterns were identified inductively; alternative categorisations of the same data cannot be ruled out on the basis of a single study, and the correspondence between conceptual dimensions and empirical patterns awaits further theoretical development and independent testing.
Seventh, the cognitive maps were initially coded by a single primary coder and subsequently reviewed in group discussion with three additional researchers, rather than by independent coders, so inter-rater reliability coefficients could not be computed; although the group-review procedure reduced single-coder discretion, future studies should employ independent double coding with formal reliability assessment.
Eighth, the brief verbal explanations collected during cognitive-map drawing were used only to disambiguate ambiguous drawings rather than developed into an independent semi-structured interview system, so the analytical evidence base comprises three quantitative streams (behavioral, cognitive, and perceptual) rather than a fully triangulated mixed-methods design. Future work should incorporate a purpose-built interview guide with documented coding procedures so that interview-based evidence can complement the quantitative streams in interpreting spatial meaning and the plausibility of the structural-affordance framework.
Furthermore, this study focuses on the relationships among spatial configuration, behavior, cognition, and perception; future research could incorporate multi-sensory factors—acoustic environment, material characteristics, and lighting—and physiological data to explore the formation of architectural spatial experience more comprehensively.
Supplementary Materials
The following supporting information can be downloaded at: https://www.mdpi.com/article/10.3390/buildings16224518/s1, Table S1: Full results of the 24 dimension-level Pearson correlations and Benjamini–Hochberg false discovery rate (FDR) correction; Tables S2–S5: Dimension-level linear mixed-effects models for the six perceptual dimensions (Integration coefficient),leave-one-space-out refits of the two primary linear mixed-effects models, leave-one-space-out refits of the visitation model (binomial GEE, clustered by participant),evidence for and against the three relational patterns.
Author Contributions
Conceptualization, Y.J., X.H. and D.L.; methodology, Y.J., X.H. and D.L.; software, X.H. and Y.R.; formal analysis, Y.J. and D.L.; investigation, Y.J., Y.R., Y.C., Y.X. and D.L.; resources, D.L. and Y.J.; data curation, Y.J. and X.H.; writing—original draft preparation, Y.J. and D.L.; writing—review and editing, Y.J.; visualization, Y.J. and D.L.; supervision, D.L.; project administration, D.L. and Y.J.; funding acquisition, D.L. All authors have read and agreed to the published version of the manuscript.
Funding
This research received no external funding.
Institutional Review Board Statement
Ethics approval was obtained from the Ethics Committee of Beijing Forestry University (Approval No. LARCH/Ethics/2026/042. Date: 1 April 2026).
Informed Consent Statement
Informed consent was obtained from all subjects involved in the study.
Data Availability Statement
The datasets generated and analyzed during the current study are partially publicly available in the Science Data Bank (ScienceDB) at https://doi.org/10.57760/sciencedb.45143. The publicly archived materials include (1) the space syntax metrics of the 13 analyzed spaces (integration, control value, visual connectivity, and visual integration); (2) the anonymized 3D movement trajectories of the 36 participants; (3) the aggregated spatial perception ratings and cognitive map coding results; (4) the 24 dimension-level correlation results with their Benjamini–Hochberg FDR adjusted p-values, reported as Table S1; and (5) the leave-one-space-out refits, the dimension-level model estimates, and the evidence summary for the three relational patterns, reported as Tables S2–S5. The raw cognitive map sketches and individual-level questionnaire responses are not publicly available due to privacy restrictions, and can be obtained from the corresponding author (D.L.; ldf21@bjfu.edu.cn) upon reasonable request.
Acknowledgments
We acknowledge the technical support from the Undergraduate Innovation and Entrepreneurship Training Program of Beijing Forestry University under the project “Research on the Mapping Relationship Between Spatial Exploration Behavior and Spatial Memory from the Perspective of Embodied Cognition in Virtual Reality Environments”. During the preparation of this work, the authors used WorkBuddy v4.22.15 for language polishing. After using these tools, the authors reviewed and edited the content as needed and take full responsibility for the content of the publication.
Conflicts of Interest
The authors declare no conflicts of interest.
References
- Hillier, B. Space and spatiality: What the built environment needs from social theory. Build. Res. Inf. 2008, 36, 216–230. [Google Scholar] [CrossRef] [Scilit]
- Hillier, B. Space Is the Machine: A Configurational Theory of Architecture; Cambridge University Press: Cambridge, UK, 1996. [Google Scholar]
- Mohamed, A.A. Using BERTopic modeling to map the evolution of space syntax research. Land Use Policy 2025, 157, 107639. [Google Scholar] [CrossRef] [Scilit]
- Bo, L.; Abdul Rani, M.F. The Value of Current Sense of Place in Architectural Heritage Studies: A Systematic Review. Buildings 2025, 15, 903. [Google Scholar] [CrossRef] [Scilit]
- Ding, C.; Zhuo, X.; Xiao, D. Ethnic differentiation in the internal spatial configuration of vernacular dwellings in the multi-ethnic region in Xiangxi, China from the perspective of cultural diffusion. Herit. Sci. 2024, 12, 3. [Google Scholar] [CrossRef] [Scilit]
- Hillier, B.; Hanson, J. The Social Logic of Space; Cambridge University Press: Cambridge, UK, 1984. [Google Scholar] [CrossRef] [Scilit]
- Jiang, B.; Jia, T. Agent-based simulation of human movement shaped by the underlying street structure. Int. J. Geogr. Inf. Sci. 2011, 25, 51–74. [Google Scholar] [CrossRef] [Scilit]
- An, Y.; Liu, L.; Guo, Y.; Wu, X.; Liu, P. An Analysis of the Isomerism of Tibetan Vernacular Dwellings Based on Space Syntax: A Case Study of the Semi-Agricultural and Semi-Pastoral District in Gannan Prefecture, China. Buildings 2023, 13, 2501. [Google Scholar] [CrossRef] [Scilit]
- Lei, Z.; Li, J. Genotype extraction of traditional dwellings using space syntax: A case study of Tibetan rural houses in Ganzi County, China. npj Herit. Sci. 2025, 13, 13. [Google Scholar] [CrossRef] [Scilit]
- Wu, K.; Wang, H.; Liu, H.; Yin, M.; Xu, J.; Qiang, M.; Su, Y. A Study on the Inheritance and Differentiation of Spatial Forms of Vernacular Architecture in the Yunnan–Tibet Area. Buildings 2025, 15, 2087. [Google Scholar] [CrossRef] [Scilit]
- Batty, M. Integrating space syntax with spatial interaction. Urban Inform. 2022, 1, 4. [Google Scholar] [CrossRef] [Scilit]
- Gibson, J.J. The Ecological Approach to Visual Perception; Houghton Mifflin: Boston, MA, USA, 1979. [Google Scholar]
- Norman, D.A. The Psychology of Everyday Things; Basic Books: New York, NY, USA, 1988. [Google Scholar]
- Chemero, A. Radical Embodied Cognitive Science; MIT Press: Cambridge, MA, USA, 2009. [Google Scholar]
- Rietveld, E.; Kiverstein, J. A Rich Landscape of Affordances. Ecol. Psychol. 2014, 26, 325–352. [Google Scholar] [CrossRef] [Scilit]
- Withagen, R.; de Poel, H.J.; Araújo, D.; Pepping, G.-J. Affordances can invite behavior: Reconsidering the relationship between affordances and agency. New Ideas Psychol. 2012, 30, 250–258. [Google Scholar] [CrossRef] [Scilit]
- Lechner, A.; Postiglione, G.; Serrazanetti, F.; Gold, M. Architectural affordances: Typologies of Umbau. In PhD-Workshop “Counterintuitive Typologies”; Thymos Books: Naples, Italy, 2025. [Google Scholar]
- Karimi, K. A configurational approach to analytical urban design: ‘Space syntax’ methodology. Urban Des. Int. 2012, 17, 297–318. [Google Scholar] [CrossRef] [Scilit]
- Seamon, D. A Geography of the Lifeworld (Routledge Revivals): Movement, Rest and Encounter; Routledge: London, UK, 2015. [Google Scholar]
- Lynch, K. The Image of the City; MIT Press: Cambridge, MA, USA, 1960. [Google Scholar]
- Huang, Y. Leveraging virtual reality to understand human spatial navigation. Nat. Rev. Psychol. 2023, 2, 662. [Google Scholar] [CrossRef] [Scilit]
- Monteiro, D.; Wang, X.; Liang, H.N.; Cai, Y. Spatial knowledge acquisition in virtual and physical reality: A comparative evaluation. In Proceedings of the 2021 IEEE 7th International Conference on Virtual Reality (ICVR), Foshan, China, 20–22 May 2021; pp. 86–91. [Google Scholar] [CrossRef] [Scilit]
- Norberg-Schulz, C. Genius Loci: Towards a Phenomenology of Architecture; Rizzoli: New York, NY, USA, 1979. [Google Scholar]
- Relph, E. Place and Placelessness; Pion: London, UK, 1976. [Google Scholar]
- Tuan, Y.-F. Space and Place: The Perspective of Experience; University of Minnesota Press: Minneapolis, MN, USA, 1977. [Google Scholar]
- König, S.U.; Keshava, A.; Clay, V.; Rittershofer, K.; Kuske, N.; König, P. Embodied spatial knowledge acquisition in immersive virtual reality: Comparison to map exploration. Front. Virtual Real. 2021, 2, 625548. [Google Scholar] [CrossRef] [Scilit]
- Giddens, A. The Constitution of Society: Outline of the Theory of Structuration; Polity Press: Cambridge, UK, 1984. [Google Scholar]
- Zhang, J.; Li, J.; Tian, Q. Everyday Spatial Practices in Tibetan Houses: A Study of the Spatial Production of Gyalrong Tibetan Vernacular Houses in Western Sichuan. Cult. Int. J. Philos. Cult. Axiolog. 2024, 21, 983. Available online: https://culturajournal.com/submissions/index.php/ijpca/article/view/983 (accessed on 28 October 2026).
- Li, D.; Li, L. Tibetan housing spatial configuration in upper and middle Aba areas. Community Des. 2012, 2, 60–68. (In Chinese) [Google Scholar]
- Turner, A.; Doxa, M.; O’Sullivan, D.; Penn, A. From isovists to visibility graphs: A methodology for the analysis of architectural space. Environ. Plan. B Plan. Des. 2001, 28, 453–484. [Google Scholar] [CrossRef] [Scilit]
- Turner, A. Depthmap: A program to perform visibility graph analysis. In Proceedings of the 3rd International Symposium on Space Syntax, Atlanta, GA, USA, 7–11 May 2001; pp. 31.1–31.9. [Google Scholar]
- Hair, J.F., Jr.; Black, W.C.; Babin, B.J.; Anderson, R.E. Multivariate Data Analysis, 7th ed.; Pearson Prentice Hall: Upper Saddle River, NJ, USA, 2010. [Google Scholar]
- Tavakol, M.; Dennick, R. Making sense of Cronbach’s alpha. Int. J. Med. Educ. 2011, 2, 53–55. [Google Scholar] [CrossRef] [Scilit] [PubMed]
- Benjamini, Y.; Hochberg, Y. Controlling the false discovery rate: A practical and powerful approach to multiple testing. J. R. Stat. Soc. Ser. B Methodol. 1995, 57, 289–300. [Google Scholar] [CrossRef] [Scilit]
- Cameron, A.C.; Gelbach, J.B.; Miller, D.L. Bootstrap-based improvements for inference with clustered errors. Rev. Econ. Stat. 2008, 90, 414–427. [Google Scholar] [CrossRef] [Scilit]
- Hillier, B.; Penn, A.; Hanson, J.; Grajewski, T.; Xu, J. Natural movement: Or, configuration and attraction in urban pedestrian movement. Environ. Plan. B Plan. Des. 1993, 20, 29–47. [Google Scholar] [CrossRef] [Scilit]
- Kaplan, S.; Kaplan, R. Cognition and Environment: Functioning in an Uncertain World; Praeger: New York, NY, USA, 1982. [Google Scholar]
- Jiang, B.; Jiang, T.; Du, Y.; Si, J.; Huang, Y.; Chen, Y. Mechanism of the connection between sacred and secular space: Settlement morphology characteristics in the multi-ethnic areas of the Gansu–Qinghai Plateau. Front. Earth Sci. 2025, 13, 1674493. [Google Scholar] [CrossRef] [Scilit]
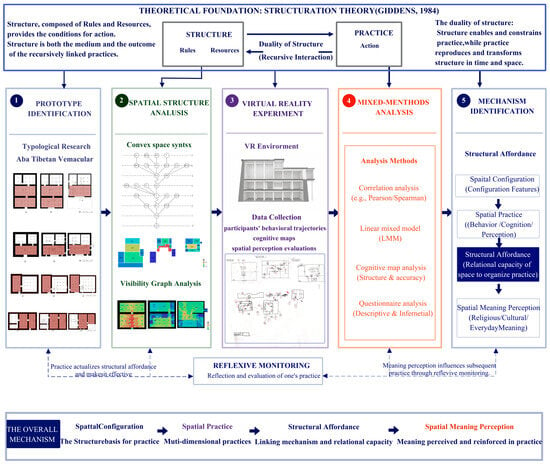
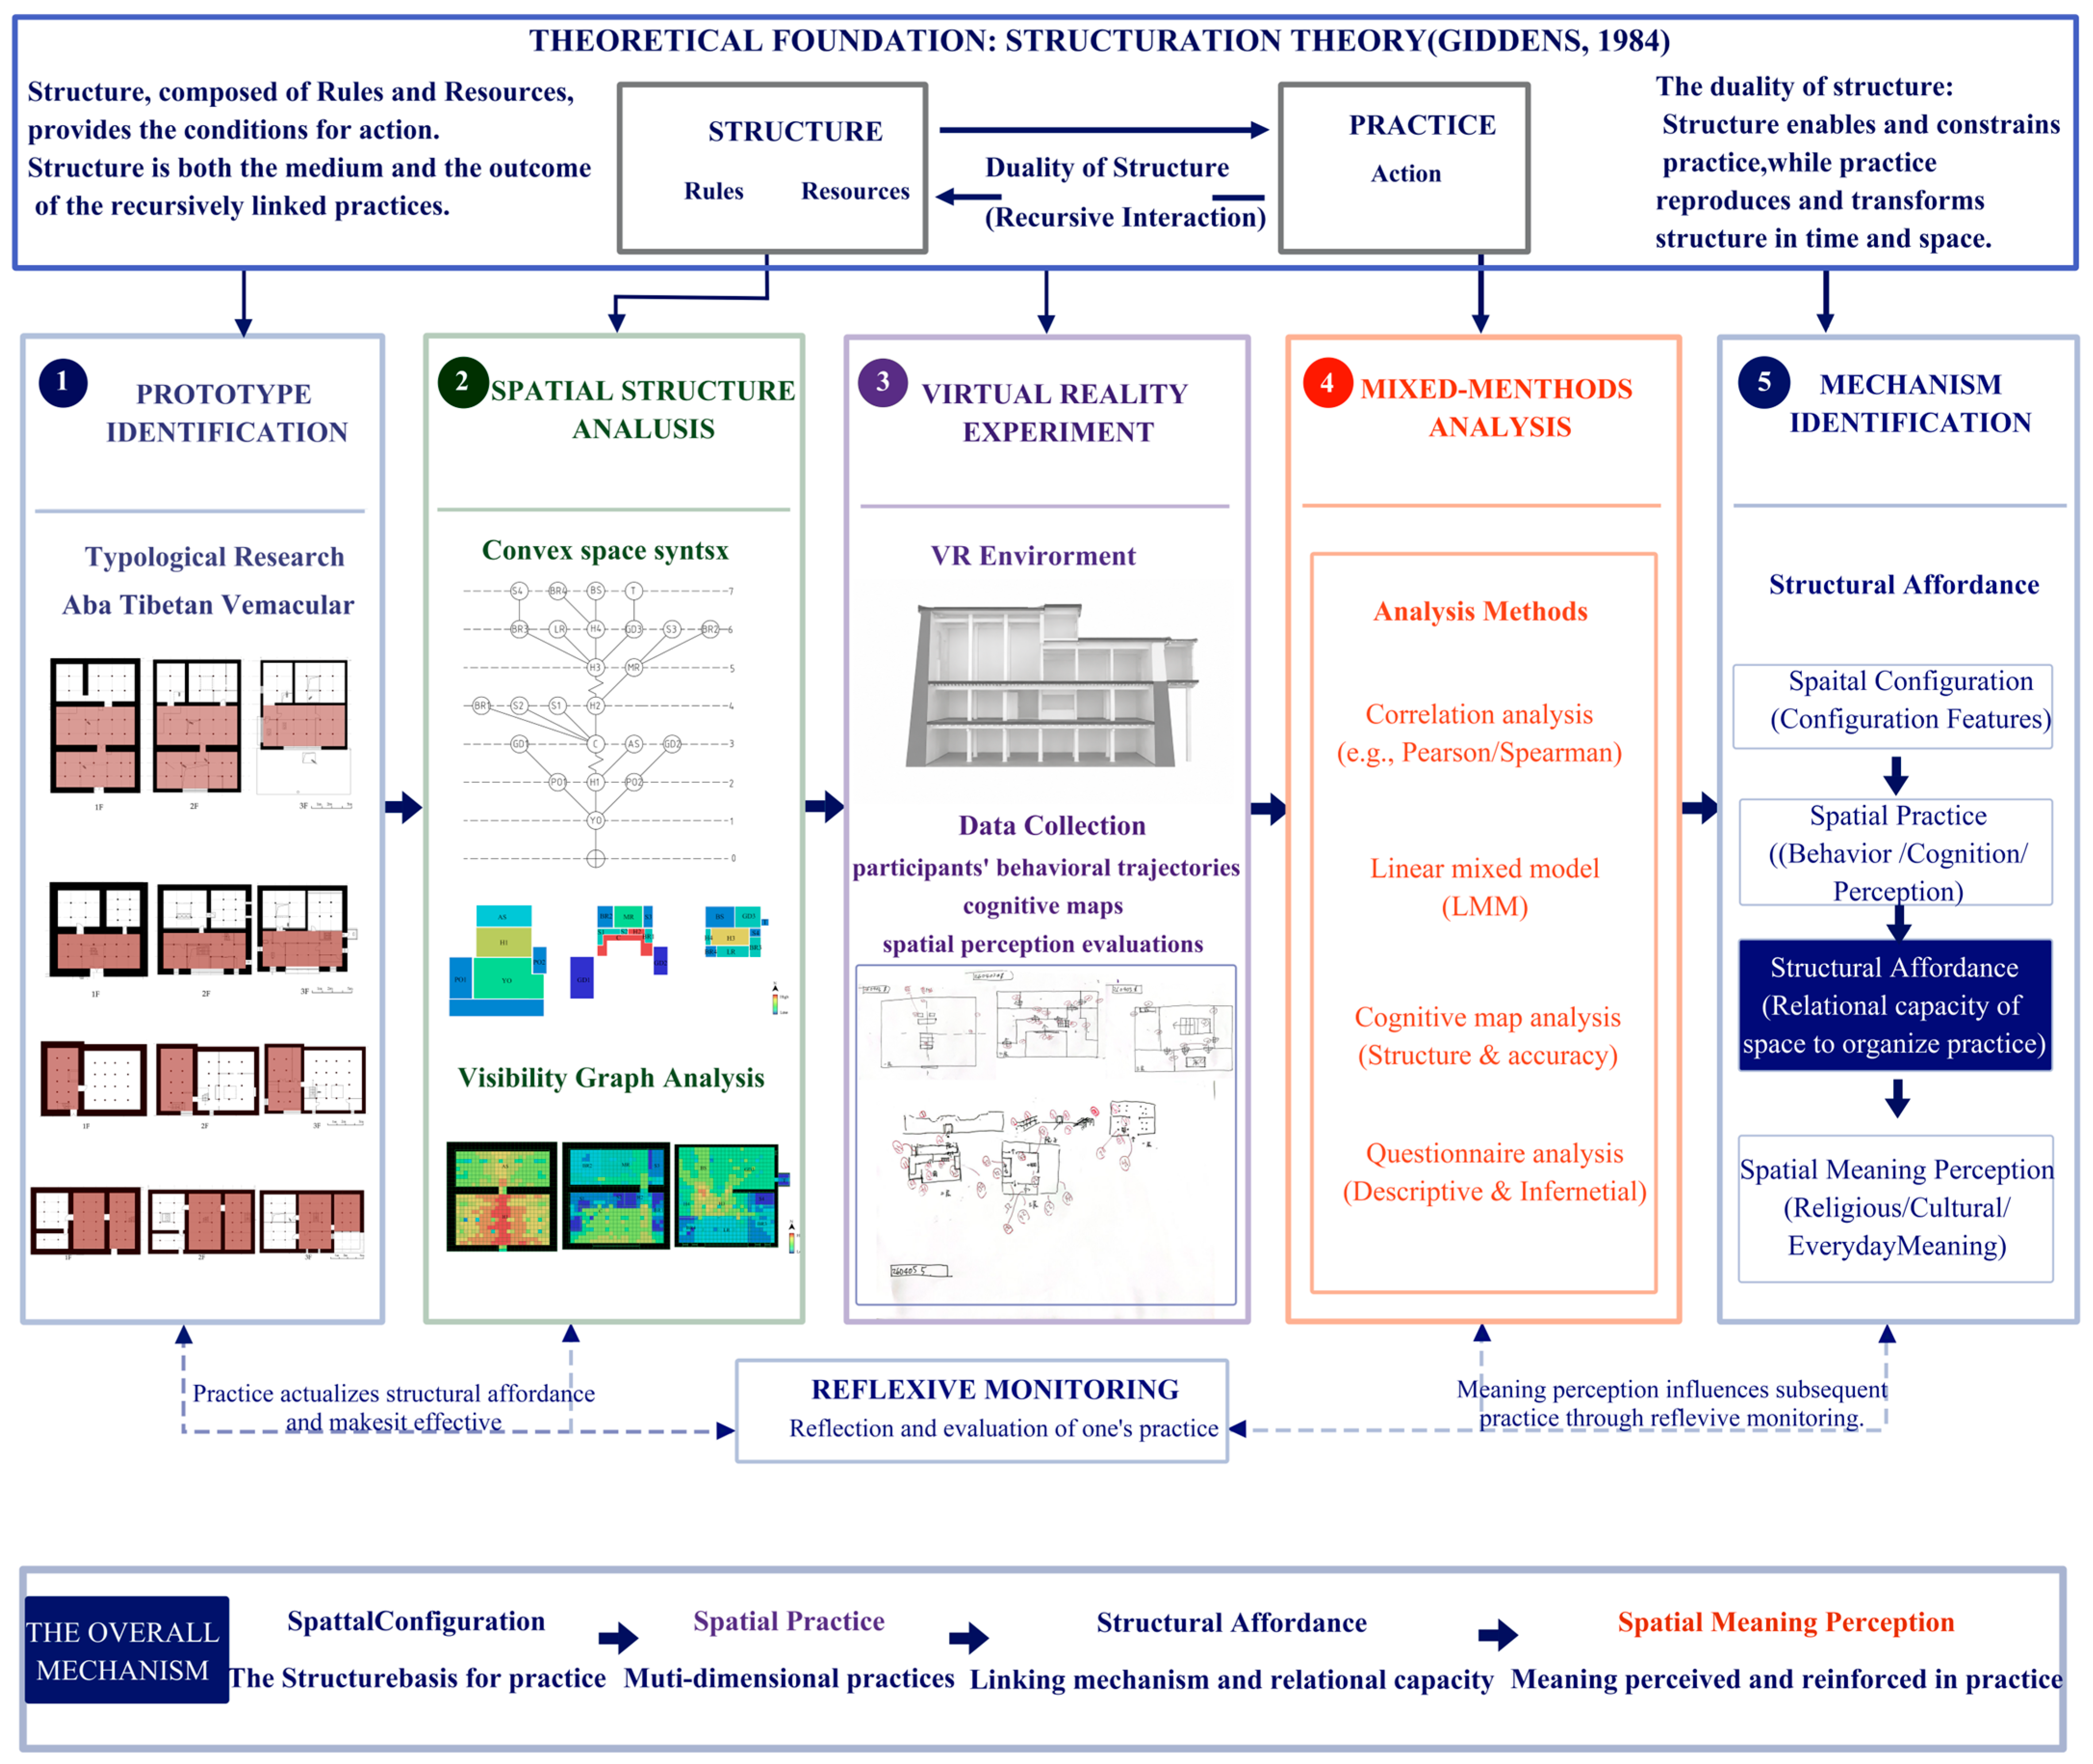
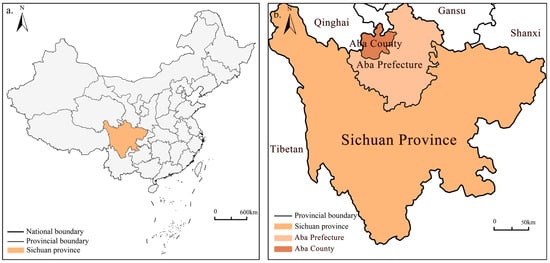
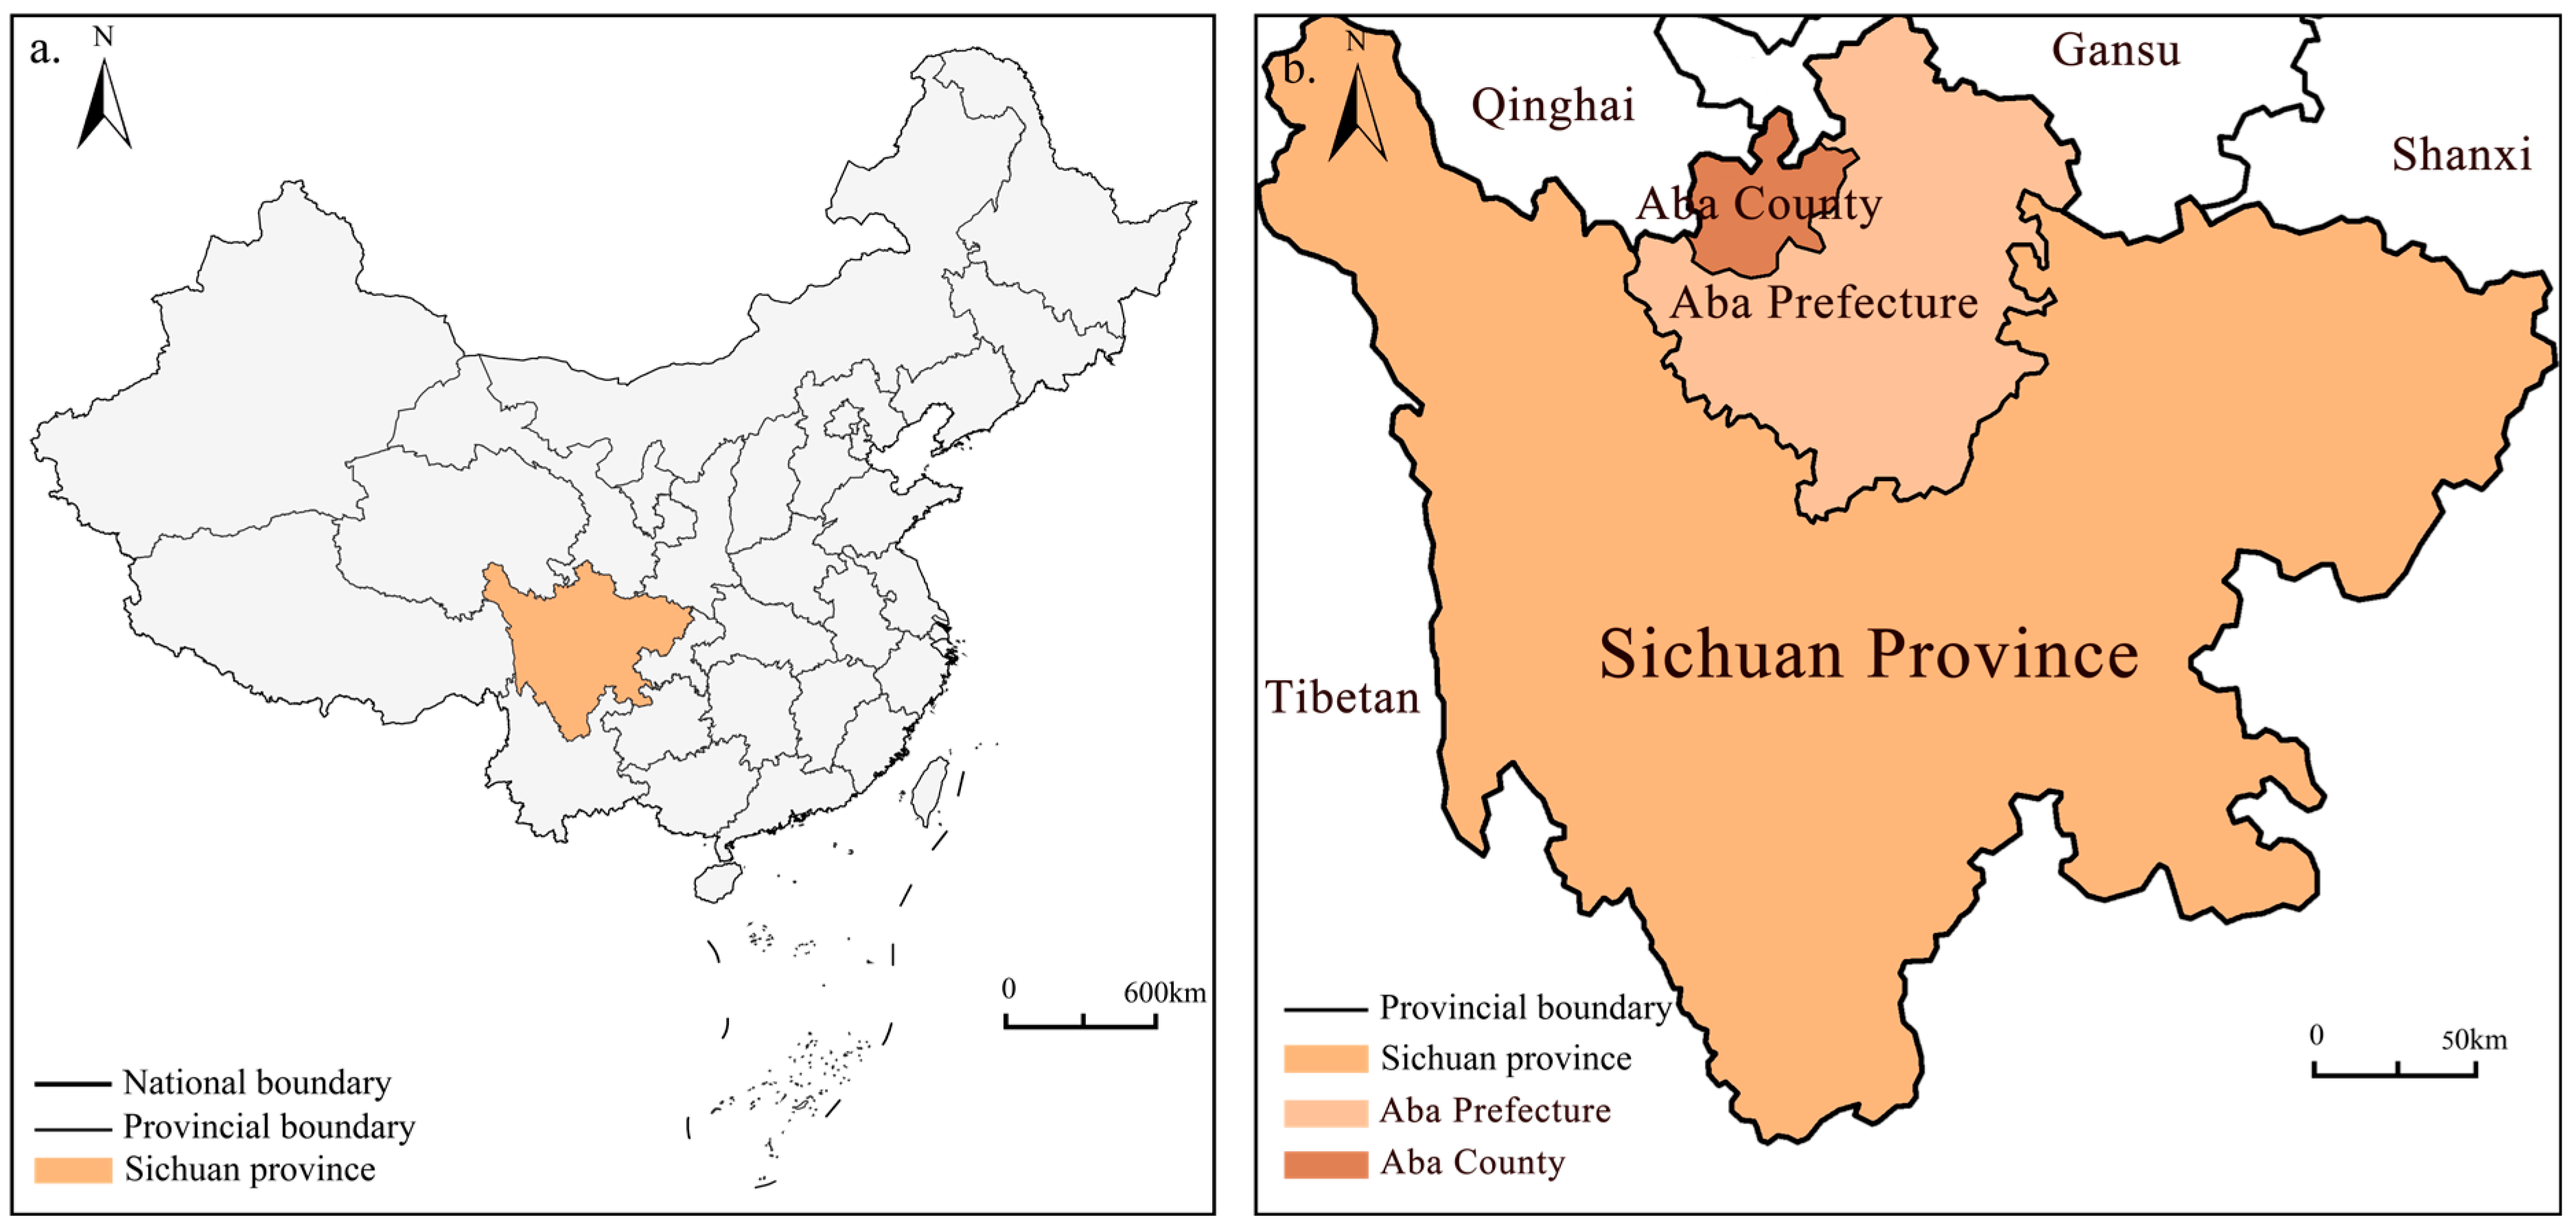
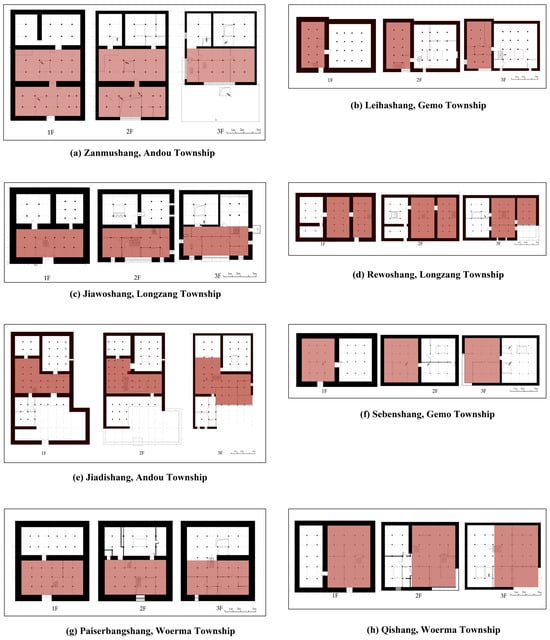
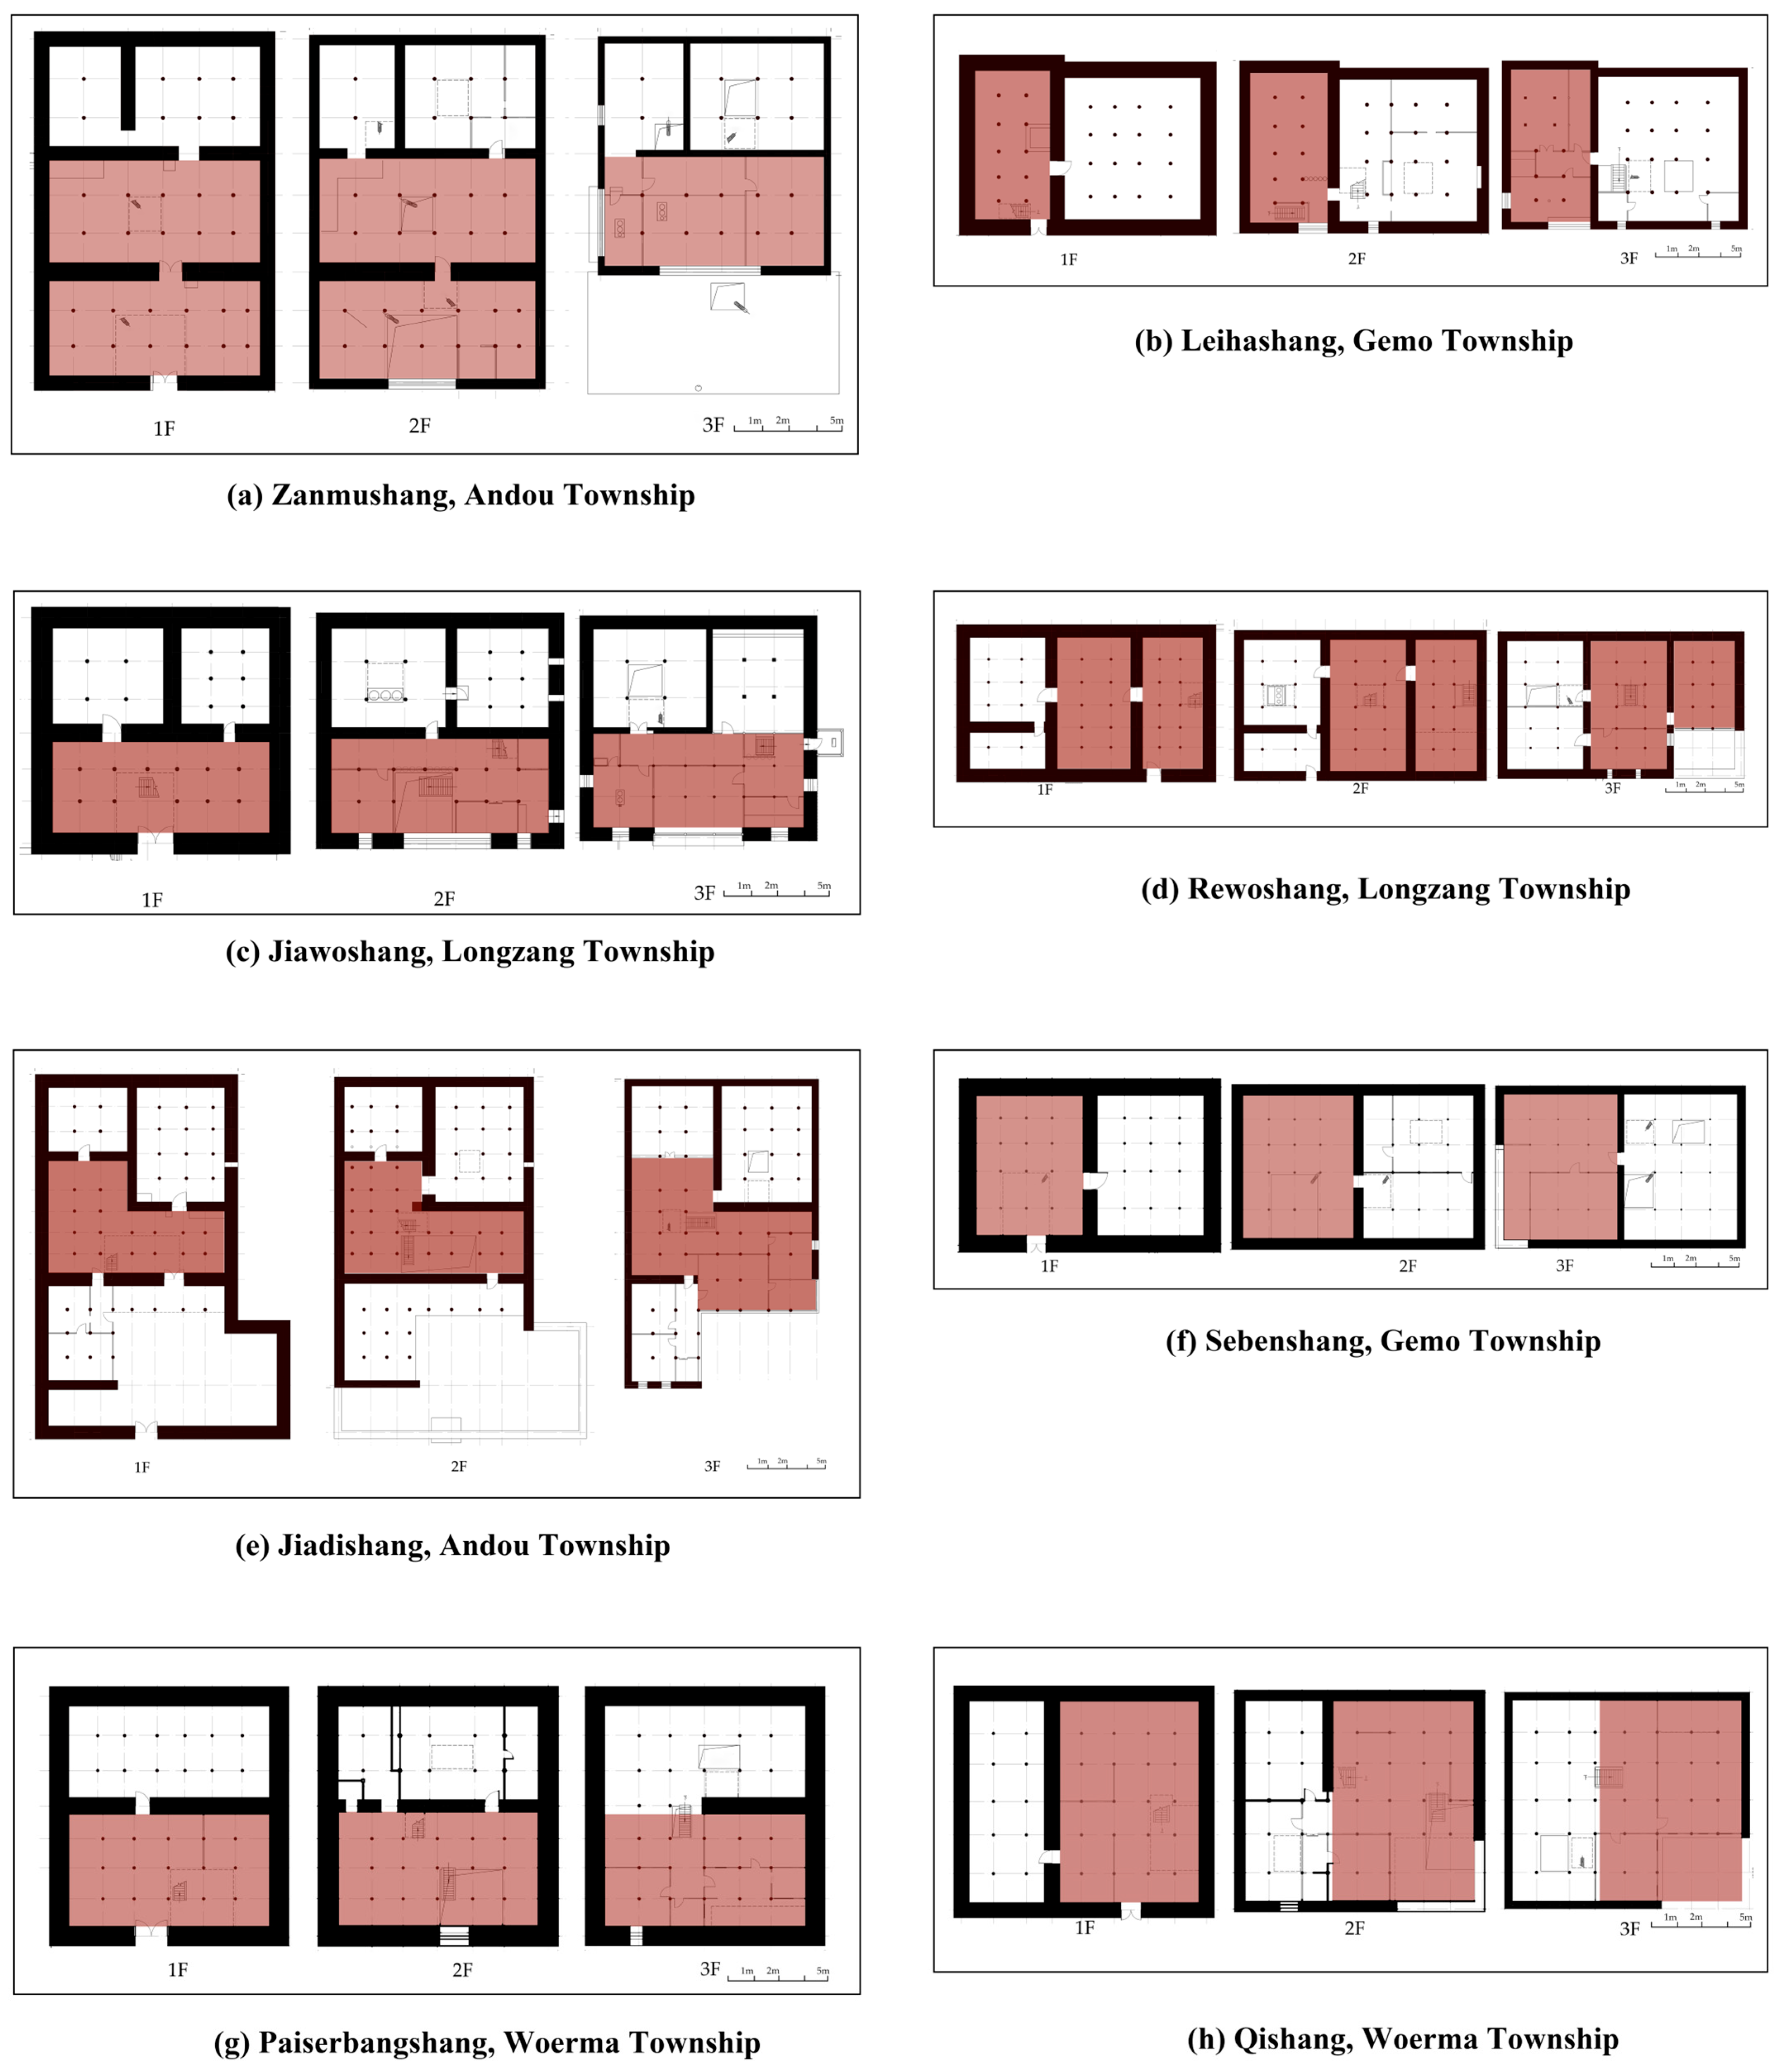
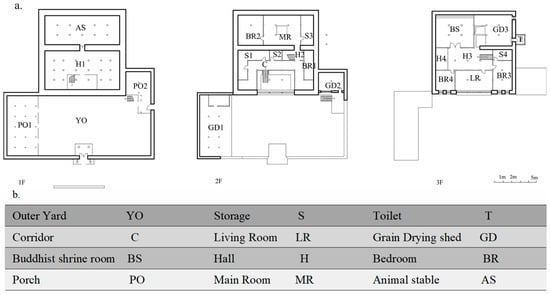
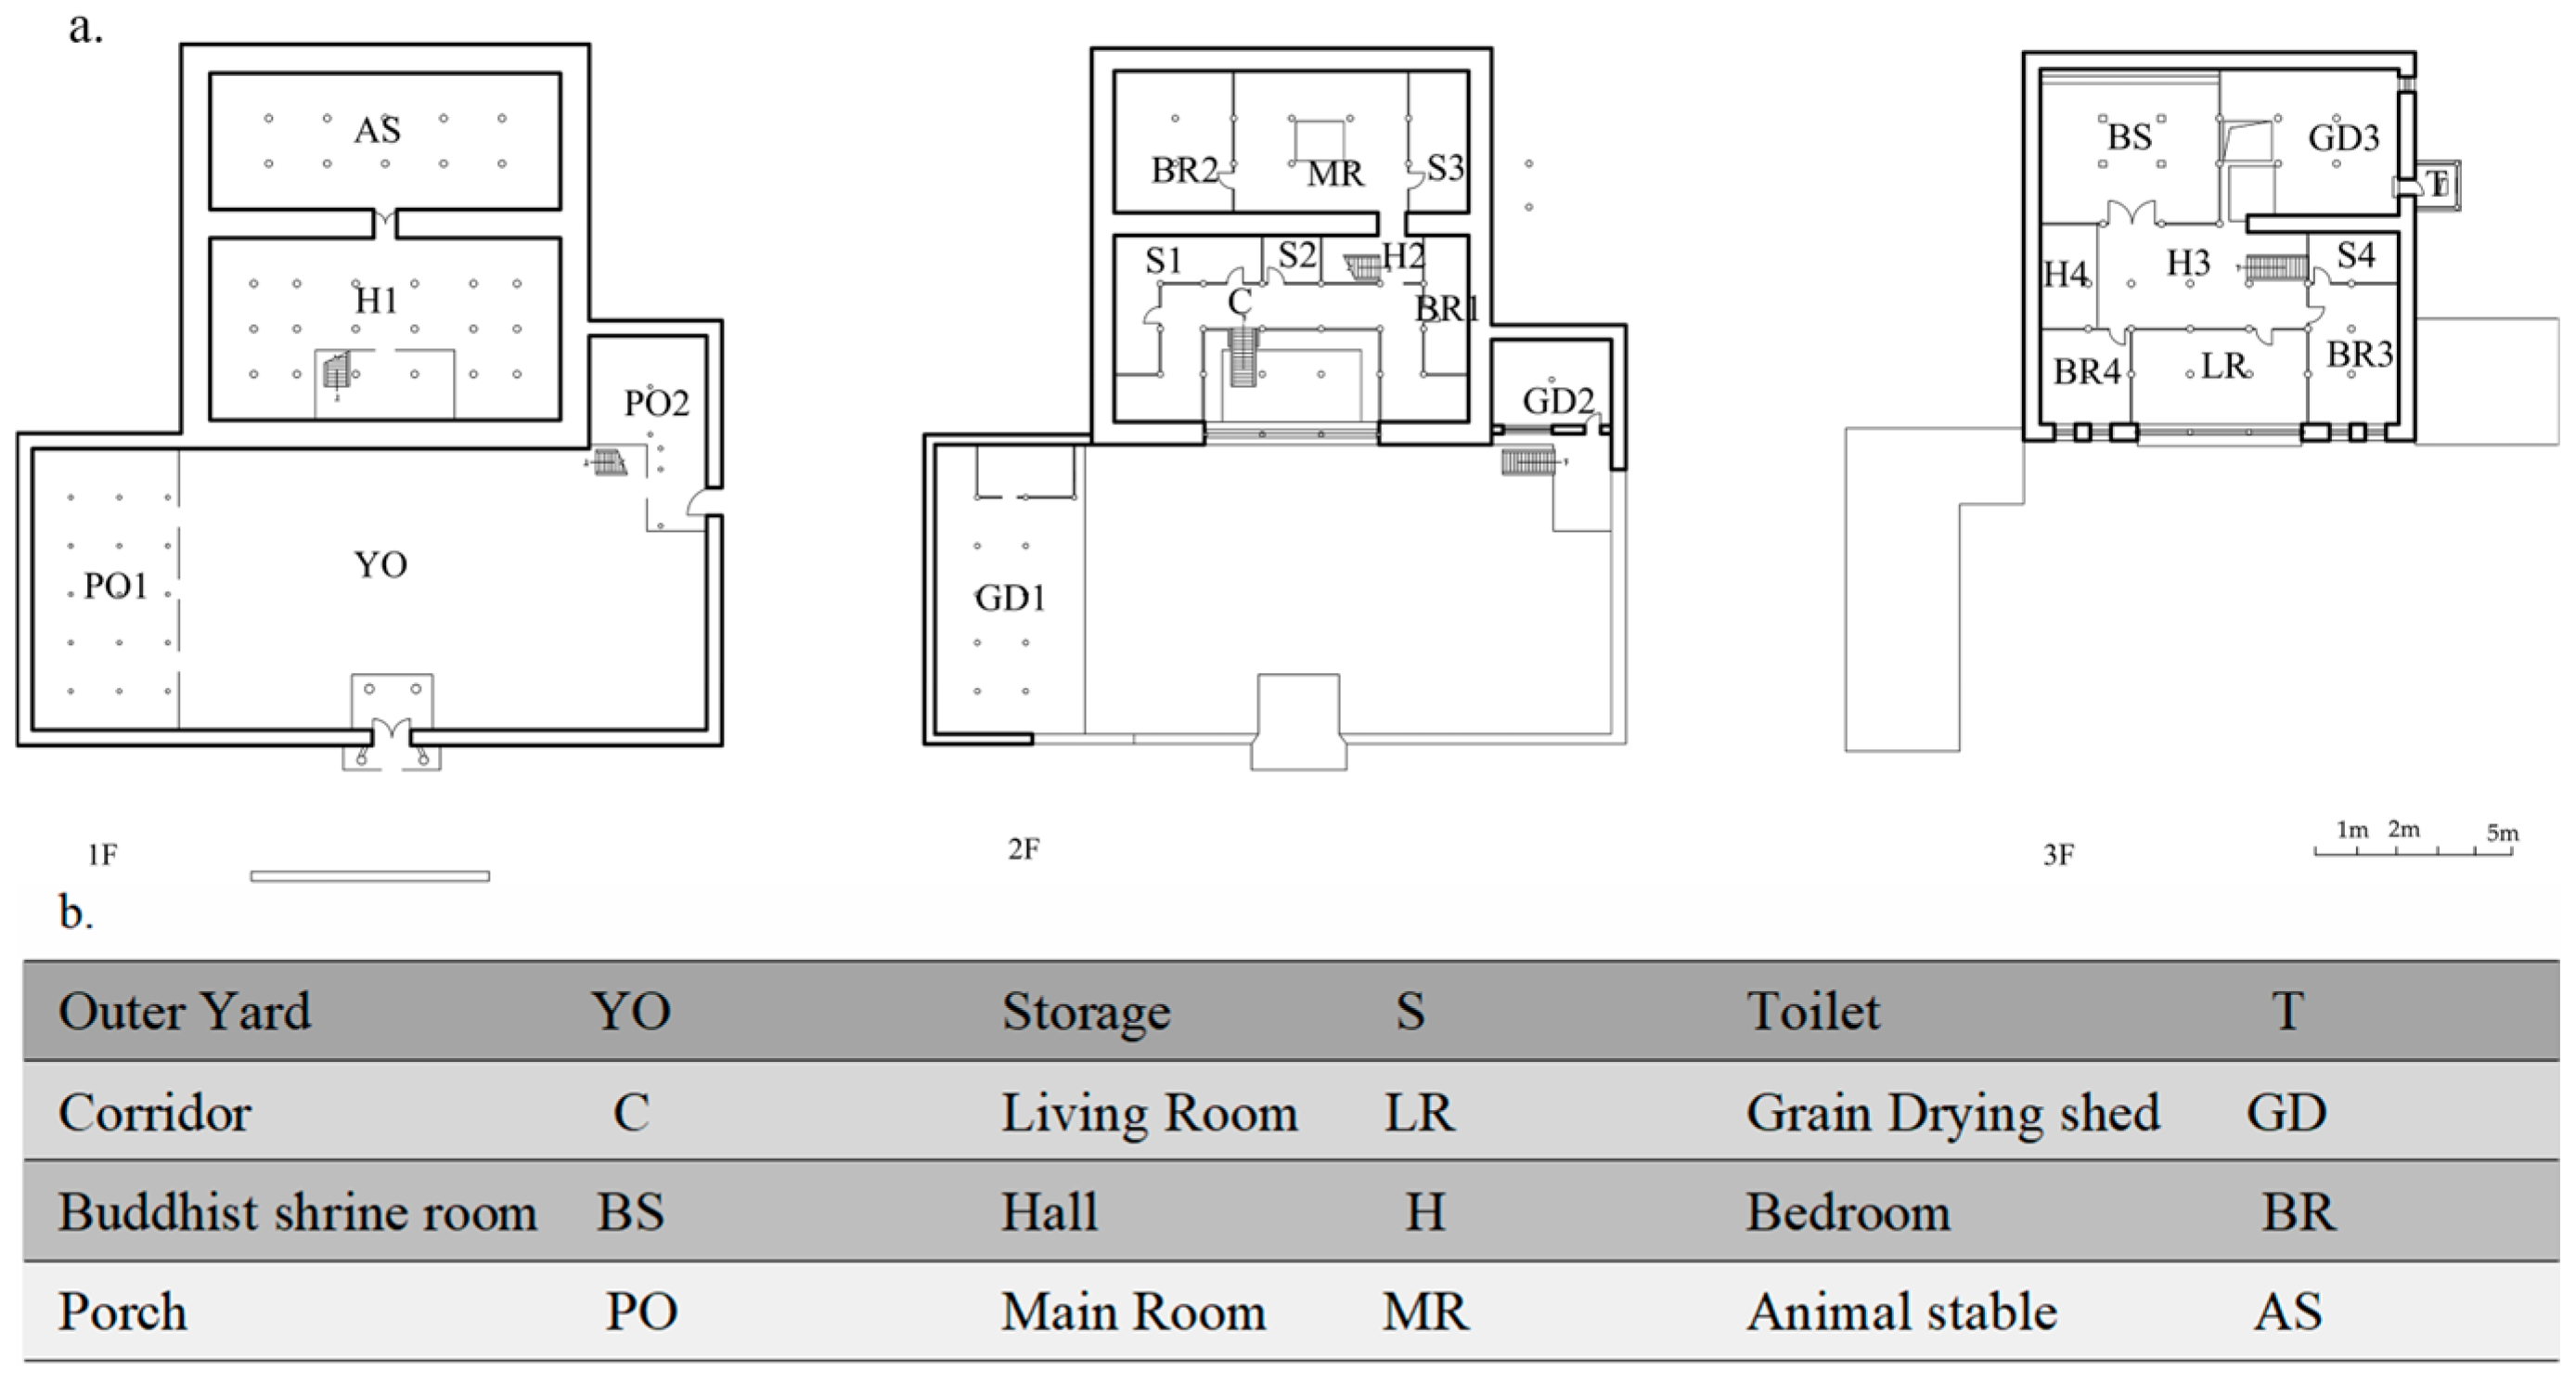
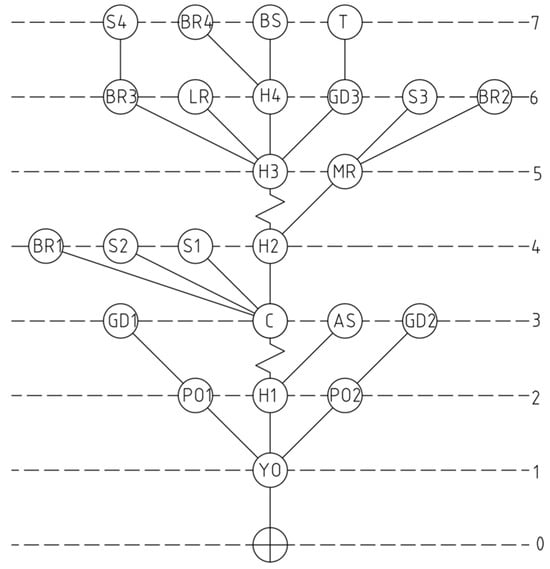
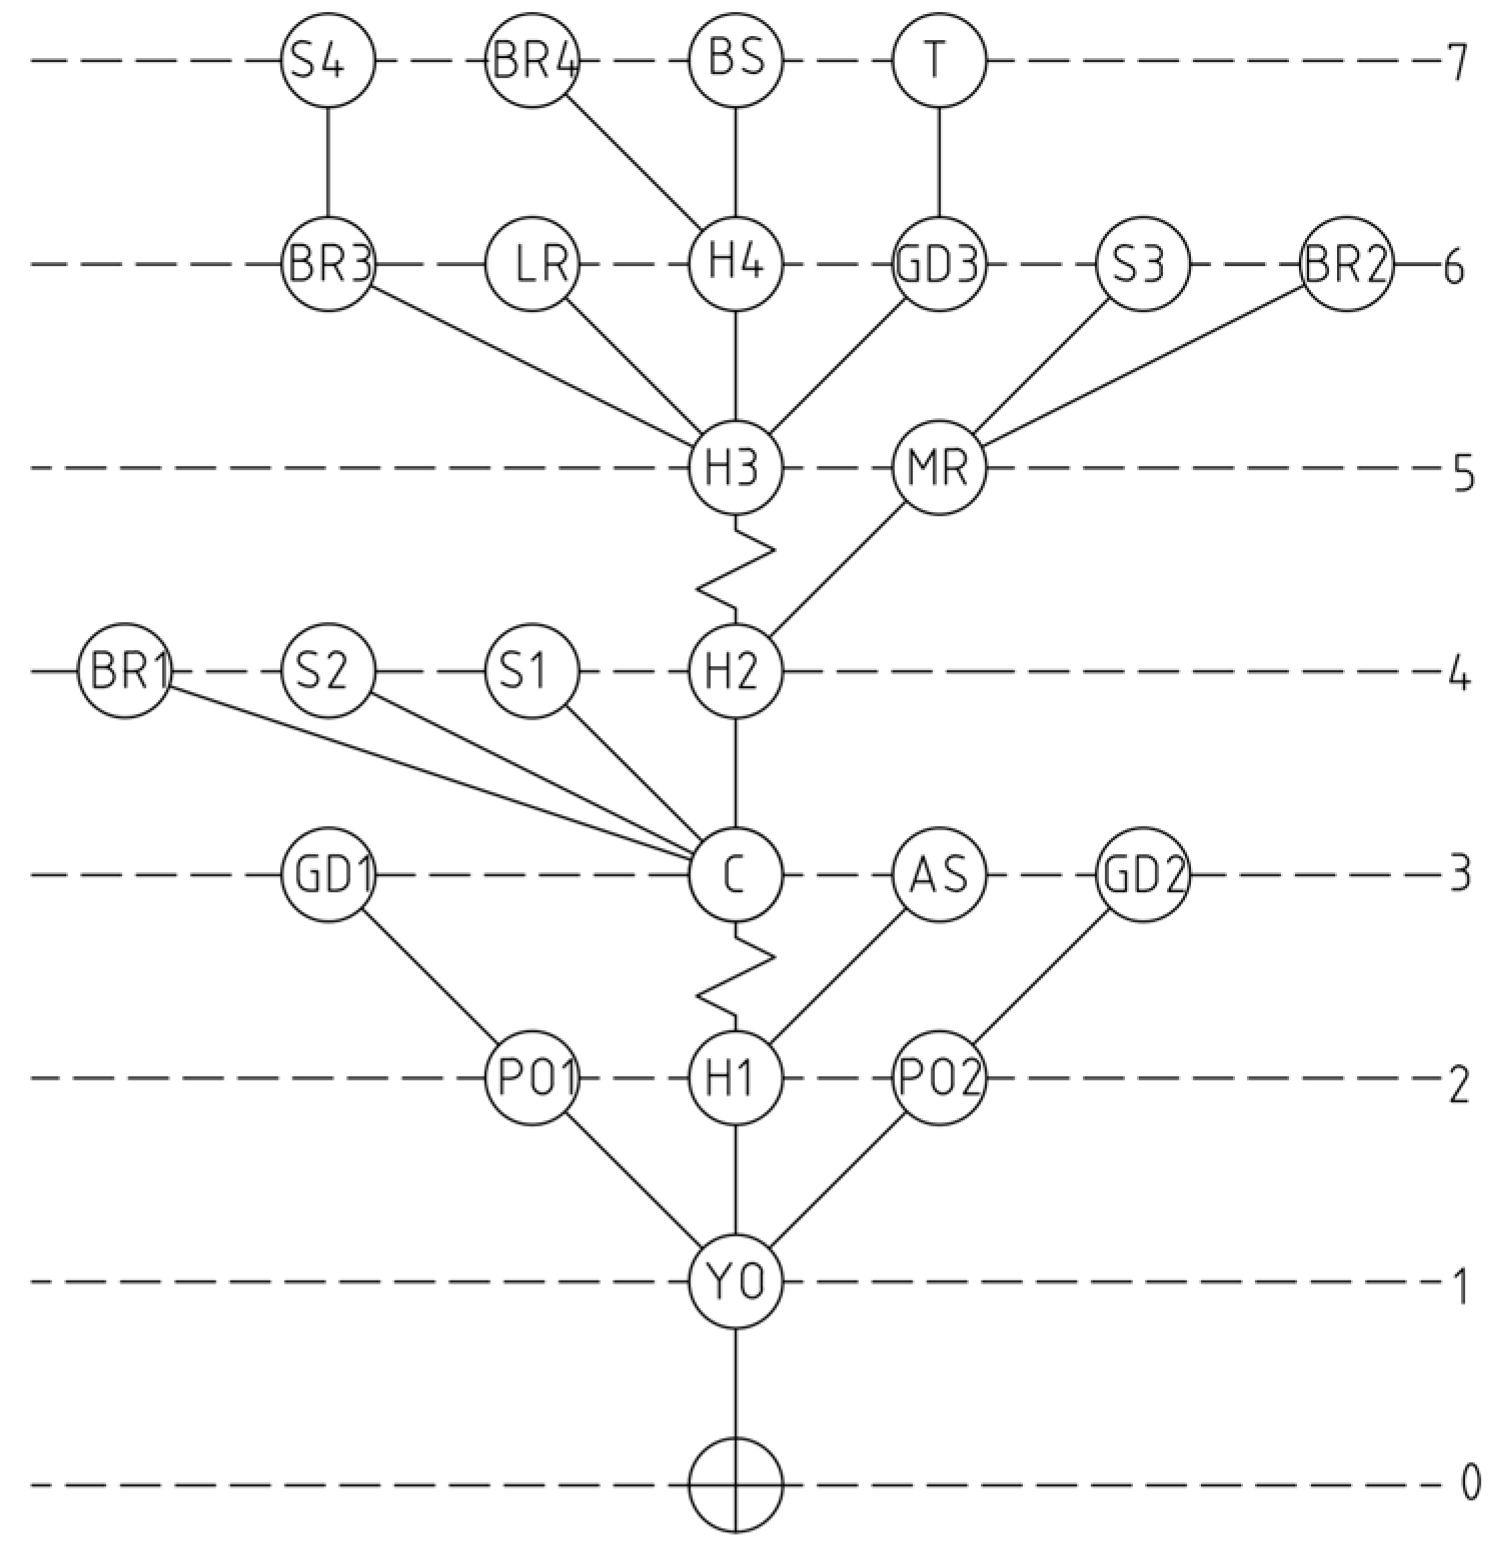




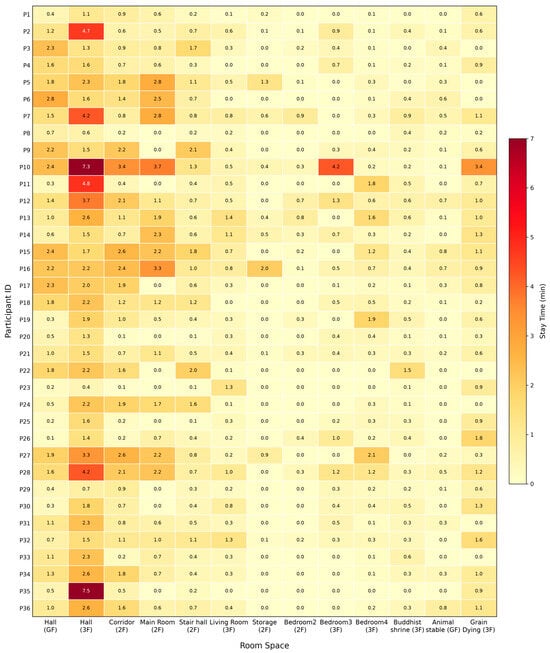
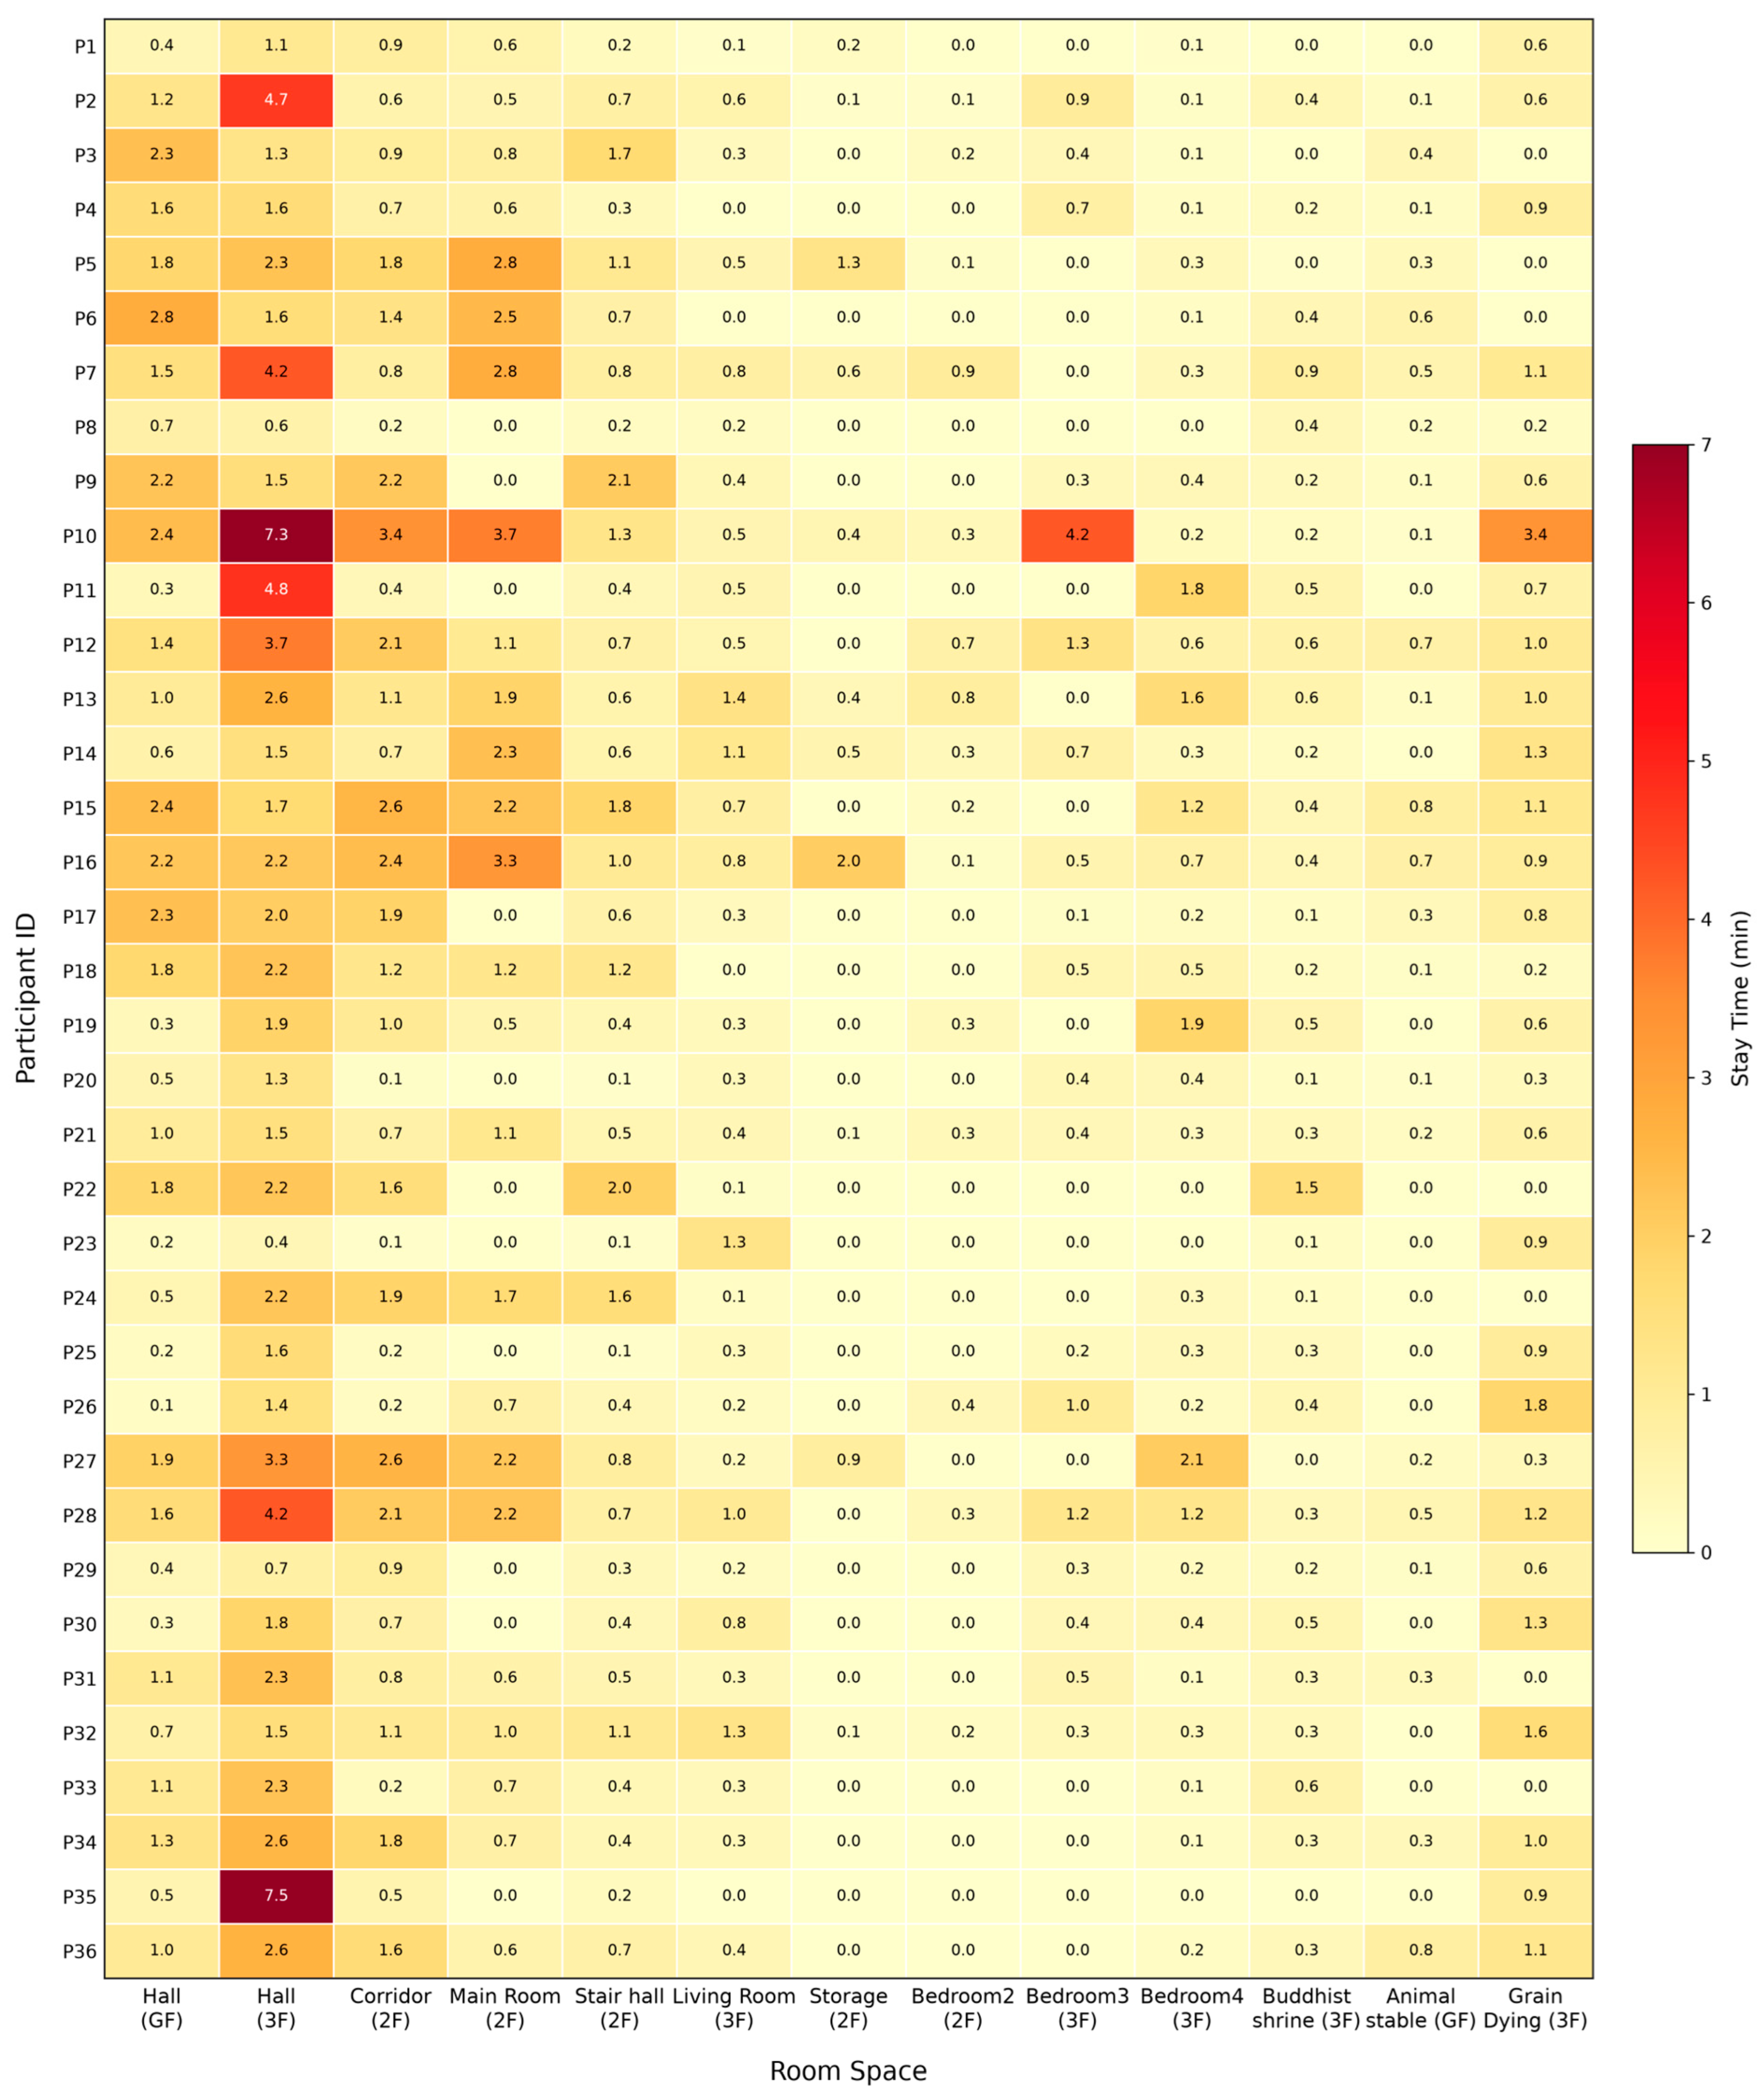
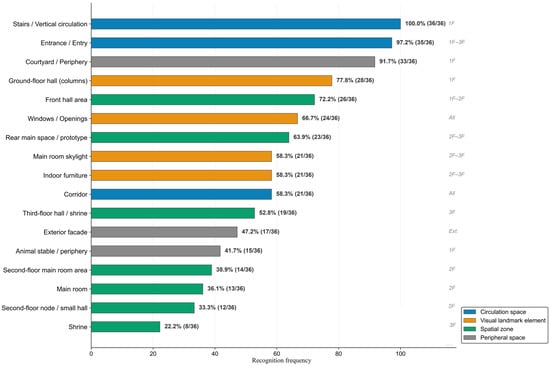
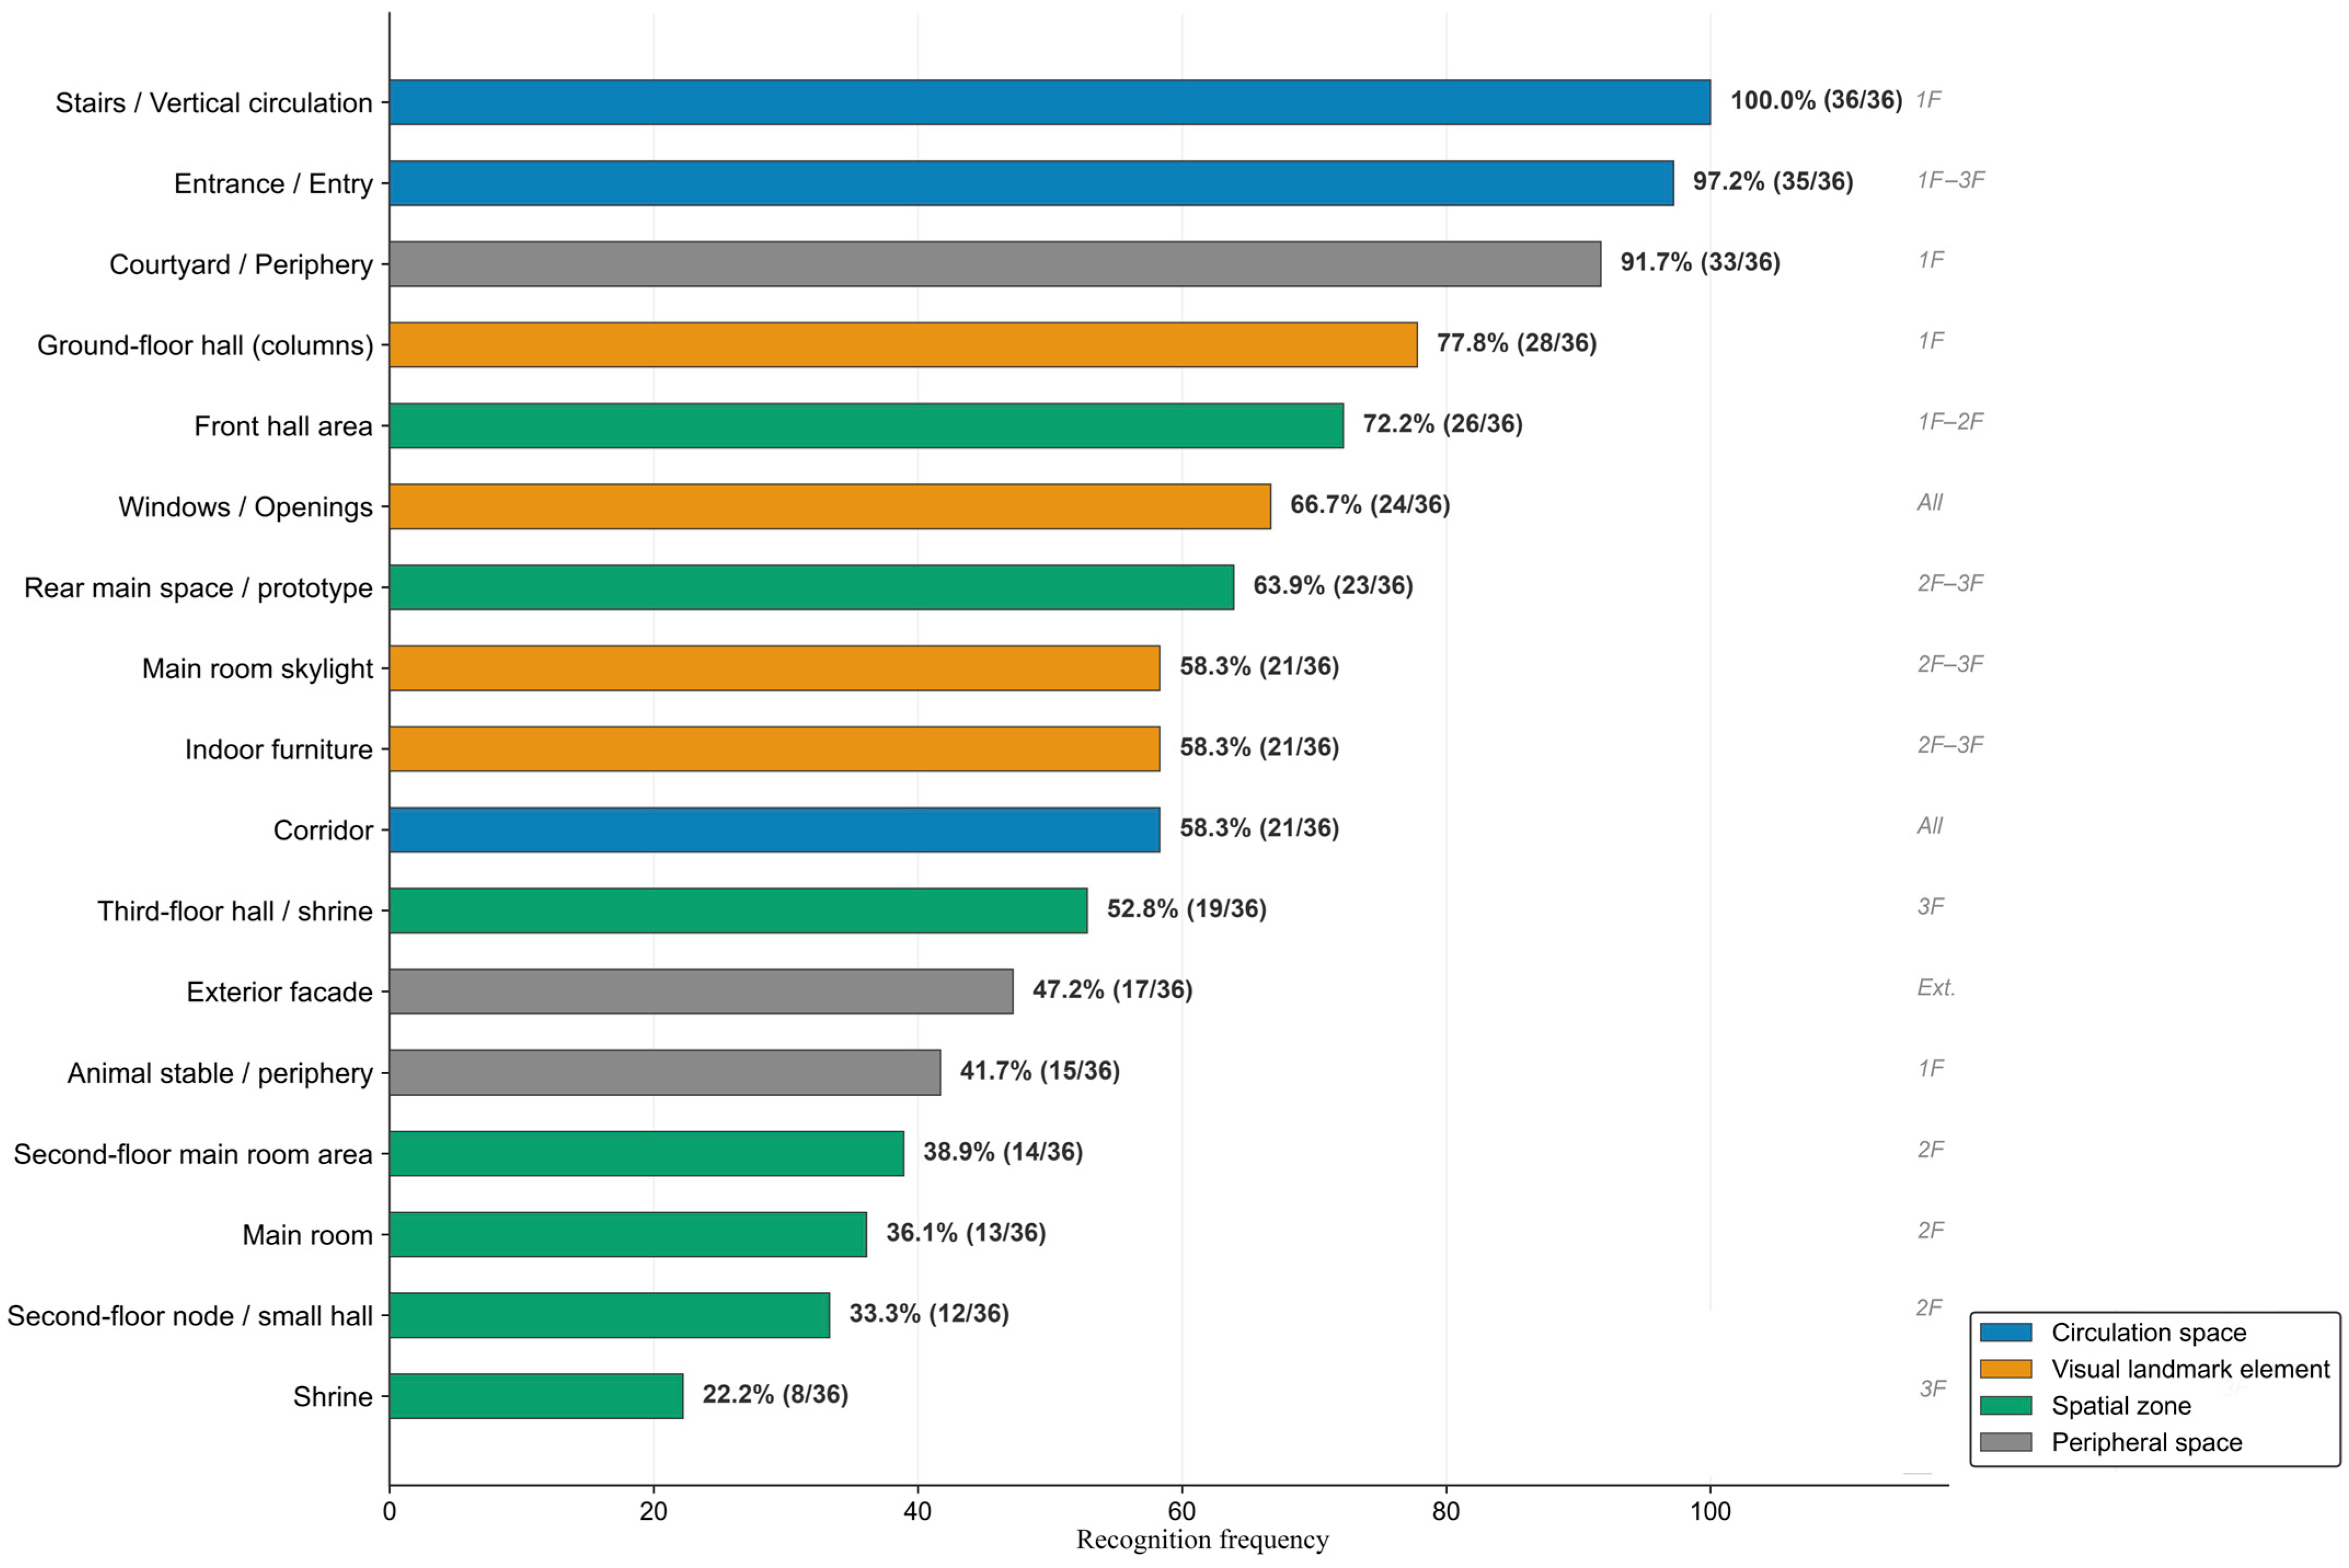
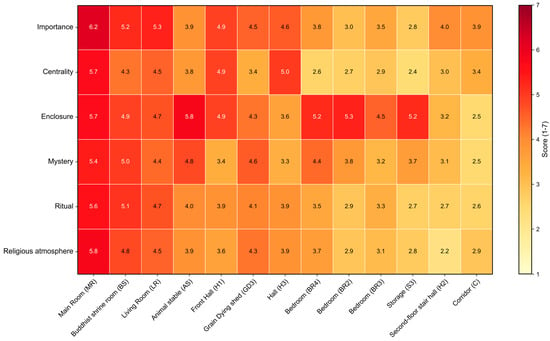
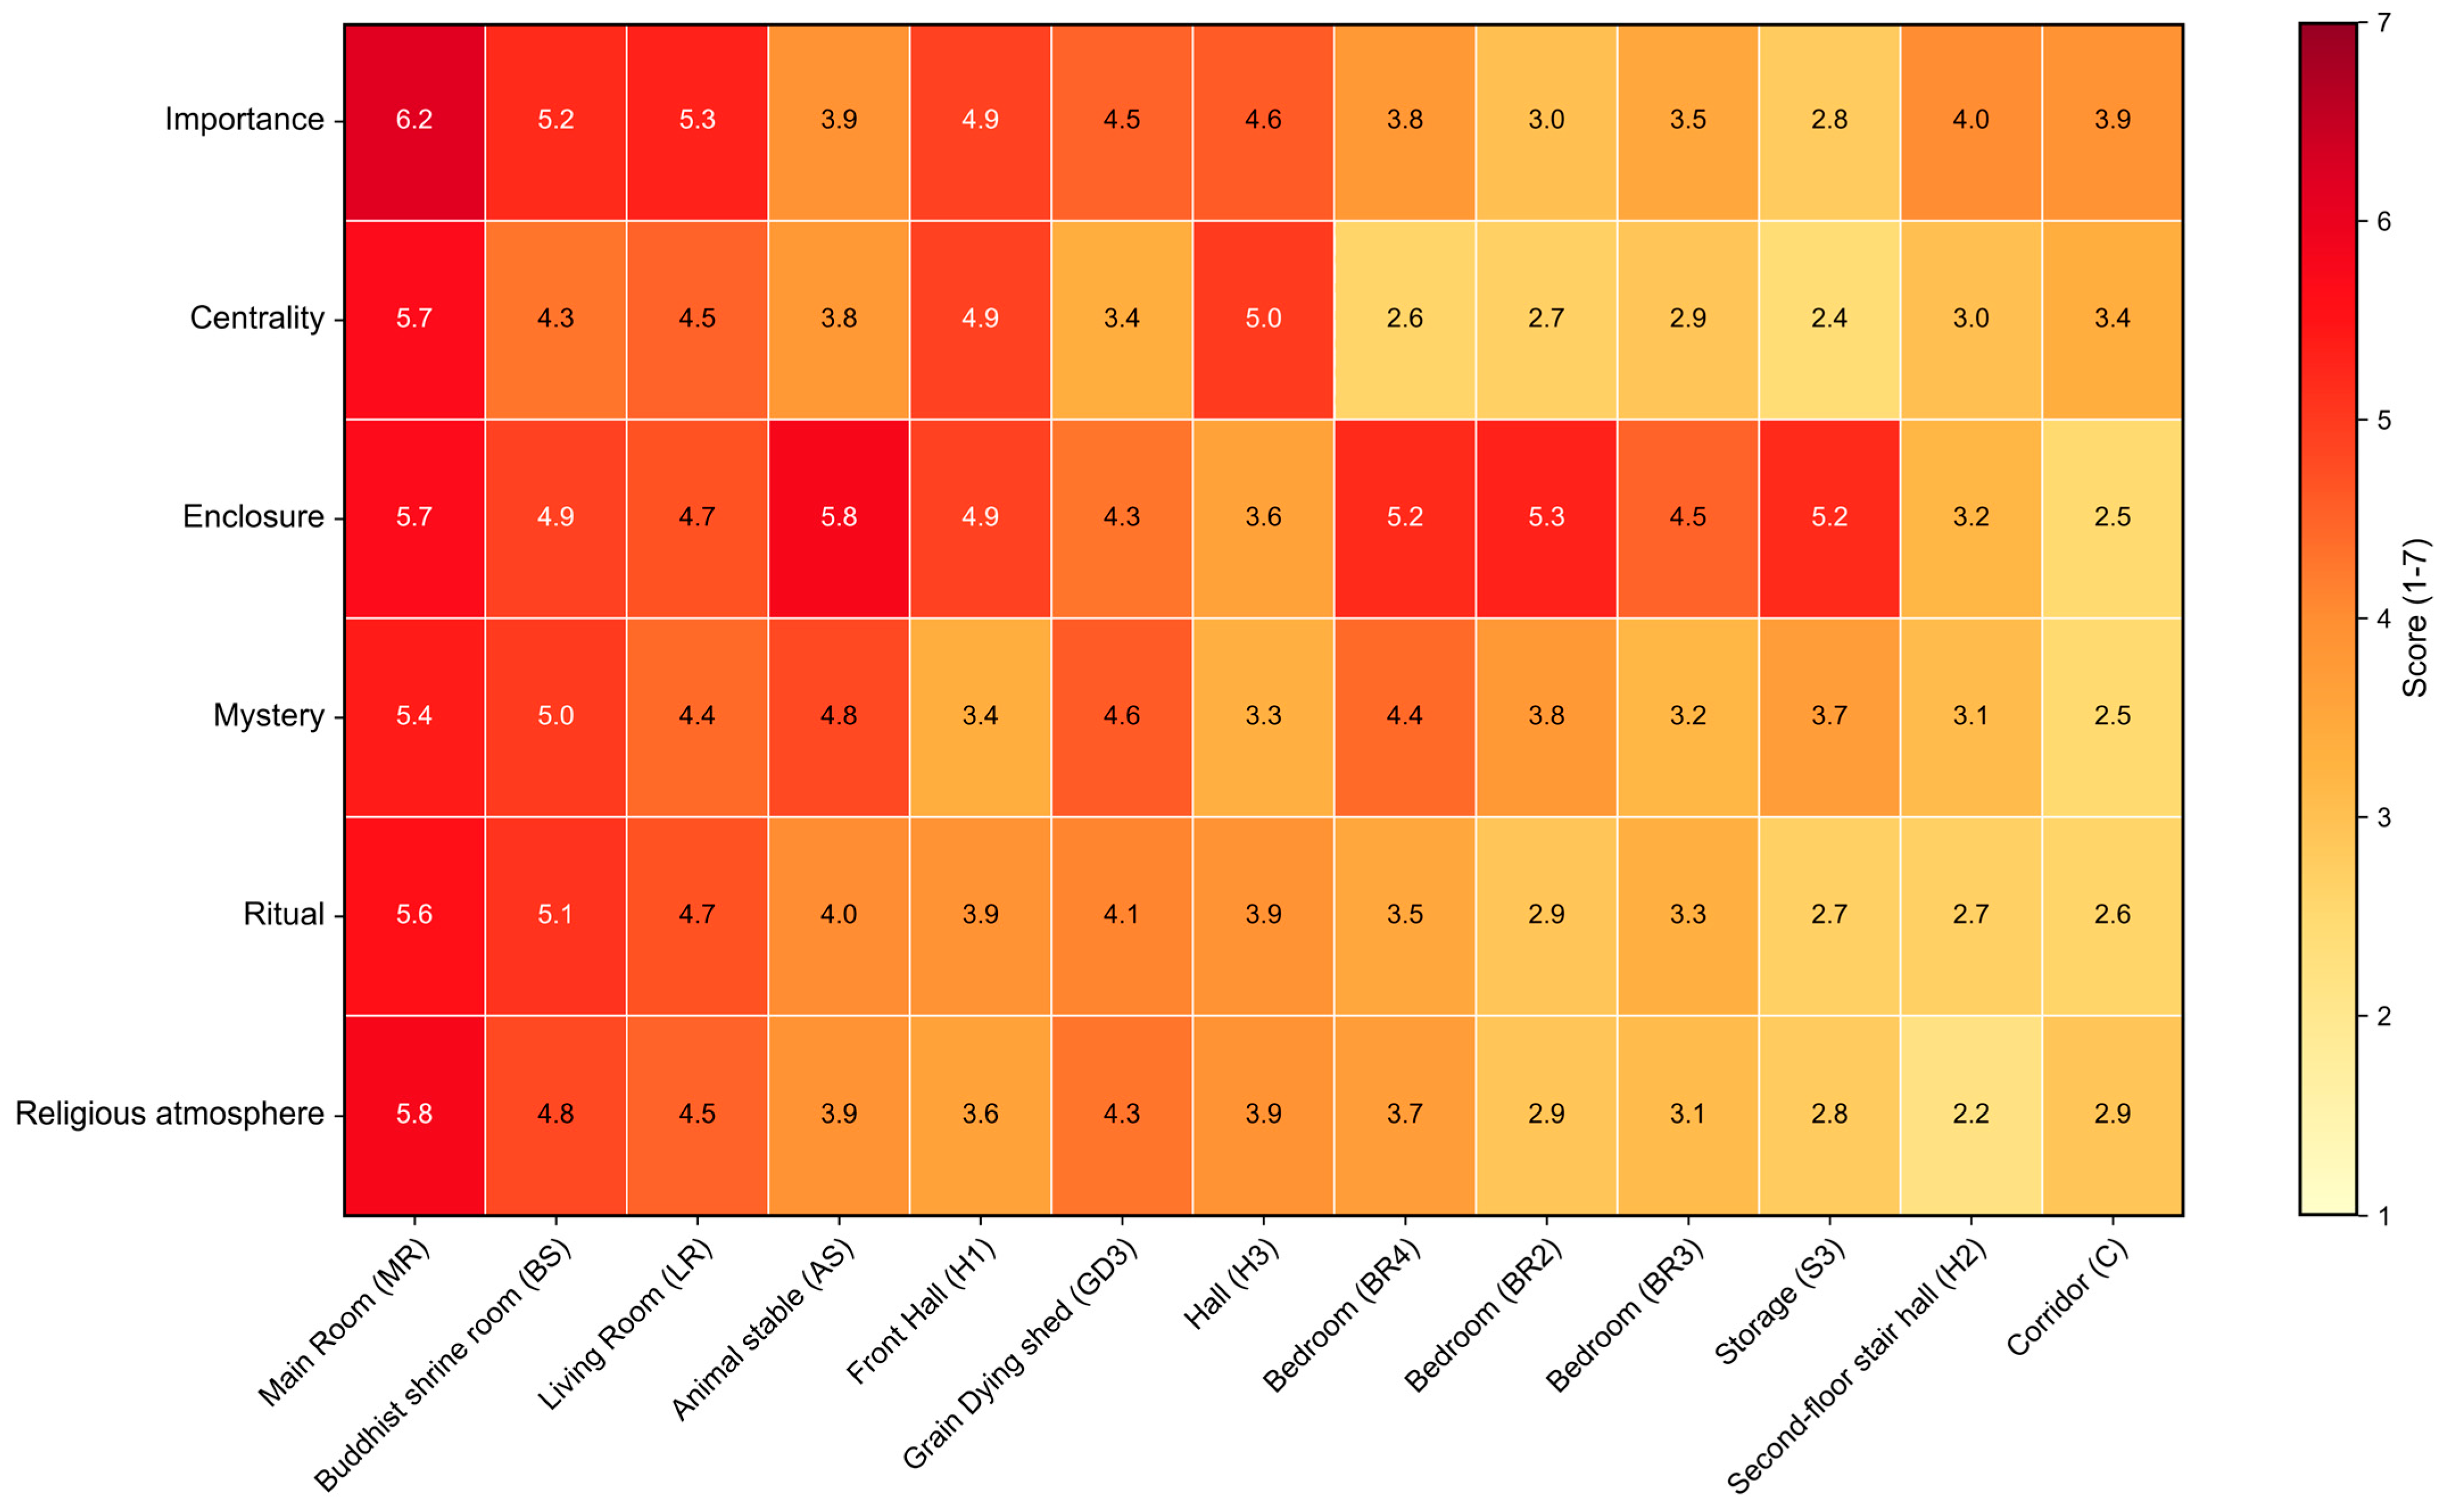

Disclaimer/Publisher’s Note: The statements, opinions and data contained in all publications are solely those of the individual author(s) and contributor(s) and not of MDPI and/or the editor(s). MDPI and/or the editor(s) disclaim responsibility for any injury to people or property resulting from any ideas, methods, instructions or products referred to in the content. |
© 2026 by the authors. Licensee MDPI, Basel, Switzerland. This article is an open access article distributed under the terms and conditions of the Creative Commons Attribution (CC BY) license.