


Abstract
Parcel-scale urban regeneration combines administrative, legal, stakeholder-related, and construction processes with uncertain durations. This study applies deterministic and probabilistic scheduling to a standardized hypothetical project in the context of Türkiye and examines the sensitivity of schedule-risk outputs to expert aggregation and modeling assumptions. A 25-activity network was parameterized using minimum, most likely, and maximum duration estimates from 50 experts. The baseline combined deterministic scheduling with a 10,000-iteration Monte Carlo simulation (MCS) in Powerproject; independent 100,000-iteration analyses varied aggregation, three-point distributions, activity overlap, and positive within-process dependence. Expert estimates showed substantial concordance (Kendall’s W = 0.756–0.811) despite a median coefficient of variation of 0.417 for most-likely durations. The most-likely-value deterministic duration was 583 days; Powerproject produced P50 = 689 days, whereas the independent beta-PERT reference produced P50 = 652 days. Across assumption-sensitivity specifications, P50 ranged from 632 to 717 days. Deterministic expected-duration references were 649 days for beta-PERT and 713 days for triangular inputs, showing that much of their P50 difference reflected different implied central tendencies. Activity-sensitivity rankings were comparatively stable under aggregation, distribution, and overlap changes but diverged under positive dependence. Reported schedule outputs are conditional on expert inputs, network structure, and modeling assumptions rather than externally validated forecasts.
1. Introduction
Urban regeneration projects extend beyond the physical renewal of aging or unsafe building stock. They involve changes in the built environment, economic value and social relations, property-related decisions, legal and administrative procedures, stakeholder interaction, and project implementation. Roberts [1] defines urban regeneration as an integrated approach aimed at providing lasting solutions to urban problems. Subsequent research has similarly emphasized sustainability, financing, benefit sharing, demolition and compensation, stakeholder participation, planning decisions, and social impacts as important dimensions of regeneration processes and outcomes [2,3,4,5,6,7]. Project success therefore depends not only on the physical production of new buildings but also on how interrelated decisions, risks, resources, and implementation processes are managed over time.
In Türkiye, the need to renew vulnerable building stock is closely associated with seismic risk. The 6 February 2023 Kahramanmaraş earthquakes caused widespread structural and geotechnical damage [8]. Official reporting for the broader 2023 Kahramanmaraş and Hatay earthquake sequence records 53,697 deaths and 107,213 injuries and cites an initial estimate of USD 103.6 billion for the total economic cost of the earthquakes [9]. More recently, the Mw 6.1 Sındırgı (Balıkesir) earthquake of 10 August 2025 again highlighted the continuing seismic hazard in western Türkiye and the importance of reducing the vulnerability of the existing building stock [10]. An empirical assessment of 12 designated at-risk areas affected by the 2023 earthquakes further found significantly lower damage in several regenerated areas, whereas some non-regenerated at-risk areas experienced severe damage [11]. These findings underline both the potential contribution of completed urban regeneration to disaster-risk reduction and the importance of effective prioritization and timely implementation.
Schedule management is particularly challenging in urban regeneration because implementation depends on multiple actors and interrelated decisions. Property owners, users, local governments, central-government institutions, investors, contractors, design teams, and technical consultants may have different responsibilities, expectations, and decision-making capacities. Previous research identifies financing difficulties, demolition and compensation issues, limited participation, conflicting stakeholder interests, relocation, planning decisions, and administrative procedures among the factors that can complicate regeneration processes [3,4,5,7]. Project duration is therefore influenced not only by construction capacity but also by negotiations, owner decisions, approvals, financing conditions, administrative procedures, and site-level circumstances.
Schedule overruns are also a persistent management problem in the wider construction sector. Previous studies have identified financing problems, design changes, approval and coordination delays, material-supply problems, inadequate site management, contractual issues, and inaccurate duration estimates among recurring causes of construction delay [12,13,14,15,16,17,18,19]. Such delays can lead to cost escalation, inefficient resource use, contractual disputes, and broader disruptions to project delivery [17,18,20]. Moreover, uncertainty may arise from common external disturbances that affect several activities simultaneously. The COVID-19 pandemic, for example, generated labor scarcity, supply-chain disruption, reduced construction productivity, and financing difficulties [21]. Such common shocks illustrate why schedule uncertainty cannot always be represented adequately by assuming that individual activity durations vary independently.
Deterministic scheduling approaches represent project activities using specified durations and precedence relationships and provide a planned project duration, critical-path information, and activity float [22,23,24]. They therefore remain essential for establishing and communicating an operational project schedule. However, a deterministic completion date does not indicate the probability of achieving that date when activity durations are uncertain. Probabilistic schedule-risk analysis addresses this limitation by representing uncertain activity durations through probability distributions and repeatedly recalculating the schedule under alternative duration realizations [25,26,27,28,29].
Monte Carlo simulation (MCS) is an established approach for estimating project-completion probabilities, duration thresholds, activity-sensitivity measures, and criticality information under uncertainty [25,26,27,28,29]. Recent studies have extended probabilistic schedule analysis to infrastructure projects, expert-based duration estimation, interacting schedule risks, and probabilistic corrective-action planning [30,31,32,33]. The present study therefore does not propose a new MCS or PERT technique; instead, it examines whether project-level completion estimates and activity-level schedule-risk measures remain stable when assumptions concerning expert aggregation, probability distributions, activity overlap, and dependence are varied within the same network. This assumption-sensitivity design provides a basis for distinguishing outputs that depend materially on modeling choices from activity-level signals that persist across alternative specifications.
Parcel-scale urban regeneration provides a useful setting in which to examine this problem because administrative, legal, stakeholder-related, demolition, permitting, construction, and approval activities coexist within a single project network. Urban-regeneration research has extensively addressed stakeholder relations, financing, participation, sustainability, social risk, decision-making, and implementation processes [3,4,5,6,7,34,35,36]. Rather than treating the comparatively limited attention to probabilistic scheduling in this context as the principal novelty, the present study uses the integrated parcel-scale regeneration process as an analytical setting for examining the assumption sensitivity of project-level completion estimates and activity-level schedule-risk measures.
The main research question is: How sensitive are project-level and activity-level schedule-risk outputs from an expert-based parcel-scale urban regeneration model to changes in expert aggregation and key probabilistic and network assumptions? Four subquestions are addressed: (1) What completion probability and probabilistic duration thresholds are associated with the deterministic baseline schedule in the original model? (2) How much between-expert variability and agreement exist in the activity-duration estimates, and are these estimates systematically associated with professional experience or profession? (3) How do project-completion probabilities and duration thresholds vary under alternative expert-aggregation, probability-distribution, activity-overlap, and duration-dependence assumptions? (4) Within the specified network, which activity-level duration-sensitivity and criticality patterns remain comparatively stable, and which change when these modeling assumptions are varied?
Within this analytical scope, the study contributes in three ways. First, it characterizes between-expert dispersion and concordance and examines whether duration estimates vary systematically with professional experience or profession. Second, it evaluates expert aggregation, probability distribution, activity overlap, and positive dependence within the same project network and compares their effects on project-level completion estimates and all-activity schedule-risk rankings. Third, these comparisons provide a diagnostic basis for distinguishing assumption-sensitive outputs from activity-level patterns that remain comparatively stable across several, but not all, specifications.
2. Theoretical Framework
2.1. Urban Regeneration and the Regulatory Framework in Türkiye
Parcel-scale transformation of risky buildings in Türkiye is primarily governed by Law No. 6306 on the Transformation of Areas under Disaster Risk and its implementing regulation [37,38]. The framework encompasses risk assessment of existing buildings, administrative review and notification, objection procedures, evacuation and demolition, decisions among property owners, and subsequent redevelopment. Implementation therefore involves multiple actors, including property owners, licensed risk-assessment organizations, land-registry authorities, local administrations, design and construction professionals, contractors, and central-government institutions [35,37,38,39].
The regulatory framework has been updated since the activity network used in this study was developed in 2021, while its principal procedural stages have remained broadly consistent. The Urban Transformation Presidency was established in October 2023 [40], and Law No. 7471, enacted in November 2023, amended Law No. 6306 by revising certain institutional responsibilities, ownership-decision requirements, notification procedures, and share-sale mechanisms [39,40,41]. Current official guidance nevertheless continues to organize parcel-scale risky-building transformation around risk assessment, notification and objection, evacuation and demolition, owner decision-making, redevelopment, design and permitting, construction, and occupancy-related approval procedures [42].
Accordingly, the activity network developed in 2021 remains consistent with the main procedural logic of parcel-scale urban regeneration under the current framework. The later regulatory amendments primarily affect specific institutional responsibilities and procedural details rather than the overall sequence of the principal transformation stages represented in the model. The network can therefore be interpreted as a standardized representation of the core parcel-scale transformation process evaluated by the expert panel, while recognizing that individual administrative procedures may be implemented differently under subsequent regulatory arrangements.
2.2. Process Interdependence and Schedule Uncertainty in Urban Regeneration Projects
Schedule uncertainty in urban regeneration arises not only from construction activities but also from the interdependence of pre-construction and post-construction processes. Property-related decisions, agreements among owners, risk assessment, notification, evacuation, demolition, design, permitting, construction, inspection, and occupancy approval follow sequential, parallel, or conditional relationships. Total project duration should therefore be understood as the outcome of an interconnected process network shaped by decisions made by different actors and institutions rather than simply as the sum of construction-site activities [1,3,7].
Urban regeneration also involves interacting physical, economic, social, environmental, and managerial dimensions [1,2,6]. A delay in negotiation or owner decision-making can postpone evacuation, demolition, permitting, and the start of construction. Similarly, project revisions, administrative approvals, financing constraints, supply conditions, and site-related problems can alter individual activity durations and subsequently affect downstream activities [3,7,12,18].
Schedule uncertainty consequently involves more than the possibility that a project will finish later than planned. Activity durations can vary across possible project realizations, and changes in these durations can alter the relative importance of activities and, in networks containing parallel or competing paths, the critical path itself. Schedule analysis under uncertainty should therefore provide not only an activity sequence and a planned completion date but also information about the likelihood of achieving that date and about the activities whose duration variability is most strongly associated with overall project duration [25,28,29,43].
2.3. Scheduling and Schedule Overruns in Construction Projects
Project scheduling involves defining activities, estimating their durations, specifying predecessor–successor relationships, and determining how these activities combine to produce the overall project duration. In addition to establishing a planned completion date, a schedule supports workflow planning, identification of critical activities and float, progress monitoring, and project-control decisions [22,23,24].
Construction projects are nevertheless exposed to numerous causes of schedule overrun. Previous studies have identified design changes, delayed payments, material-supply problems, inadequate site management, coordination difficulties, contractual issues, approval processes, and inaccurate duration estimates among recurring causes of delay [12,13,14,16,18,19]. Recent data-driven studies have extended construction delay analysis from risk identification toward interpretable prediction and prioritization. Tian et al. [44] developed an explainable ensemble-learning framework for prefabricated-construction delay risks and used SHAP analysis to identify influential delay drivers and their interactions. Cho et al. [45] similarly combined automated delay-risk prediction and prioritization with SHAP-based interpretation in highway earthwork projects, illustrating the growing emphasis on transparent identification of the factors associated with schedule outcomes. In urban regeneration, the consequences of prolonged implementation may also extend beyond the contractor and client because property owners, displaced users, surrounding communities, and local-government processes can remain affected while transformation is incomplete [3,5,36].
Systemic external disruptions are particularly relevant to schedule-risk analysis because a single event may influence several project activities simultaneously. The effects of the COVID-19 pandemic on construction projects—including labor scarcity, supply-chain disruption, reduced productivity, and financing difficulties—provide an example of a common shock that cannot be represented fully as isolated variation in individual activity durations [21]. Similar shared effects may arise from weather conditions, financing constraints, administrative backlogs, market conditions, labor availability, or supply disruptions. This provides a theoretical basis for considering dependence among activity durations in addition to models that assume statistically independent duration uncertainty.
2.4. Limitations of Deterministic Scheduling Approaches
Deterministic scheduling approaches such as the Linked Bar Chart and Critical Path Method (CPM) assign a specified duration to each activity and calculate project duration from the activity network. The mathematical foundations of critical-path scheduling were established by Kelley and Walker [46] and Kelley [47]. Deterministic approaches remain useful for representing workflow, activity relationships, critical paths, and total float and therefore continue to provide an essential basis for project planning and control [22,23,24].
Their principal limitation for uncertainty analysis is the representation of each activity by a single duration value. In practice, labor productivity, material supply, weather conditions, administrative approvals, financing, design revisions, site coordination, and stakeholder decisions can all cause activity durations to vary [12,18,27,29,30]. A deterministic completion date therefore represents the calculated outcome of one specified set of activity-duration assumptions; it does not quantify the probability that the project will actually be completed by that date.
Project-management research has consequently emphasized the need to treat uncertainty as a broader decision problem rather than only as a collection of individually identified risks. Ward and Chapman [48] advocate a broader uncertainty-management perspective, while Atkinson et al. [49] and Perminova et al. [50] similarly emphasize the role of uncertainty in project planning and decision-making. Applied to schedule management, this perspective requires evaluating not only when a project is planned to finish but also the uncertainty surrounding that completion date and the assumptions on which the schedule is based.
2.5. Probabilistic Scheduling, PERT, and Monte Carlo Simulation
Probabilistic scheduling represents uncertain activity durations through probability distributions rather than fixed values, allowing project completion to be expressed as a range of possible durations associated with different probabilities [25,28,29]. One of the earliest approaches was the Program Evaluation and Review Technique (PERT), which represents uncertain activity durations using multiple duration estimates rather than a single deterministic value [51]. Subsequent research has examined issues including expected-value simplification, criticality and sensitivity in activity networks, calendar effects, and the influence of activity-duration distributions on PERT-based results [52,53,54,55]. Comparisons among three-point distributions require particular care because distributions specified with the same minimum, most likely, and maximum values need not imply the same expected activity duration; apparent distribution effects may therefore combine changes in central tendency and distributional shape.
Monte Carlo simulation provides a more flexible framework for schedule-risk analysis. Activity durations are repeatedly sampled from specified probability distributions, and the project schedule is recalculated across a large number of iterations. The resulting project-duration distribution can be used to estimate the probability of meeting a target duration, duration thresholds associated with specified probability levels, activity-duration sensitivity, and the frequency with which individual activities become critical [25,27,29,43].
These capabilities are well established in the schedule-risk literature. Chen et al. [30] incorporate interacting risks into infrastructure schedule analysis; Ichsan et al. [31] combine expert judgments, PERT, and MCS to evaluate a railway-station construction schedule; Song and Vanhoucke [32] examine schedule-risk analysis in the presence of risk interactions; and Vaseghi and Vanhoucke [33] investigate probabilistic corrective actions for projects with stochastic activity durations. Collectively, these studies demonstrate that completion probabilities, activity sensitivity, criticality, and risk dependence are established components of probabilistic schedule-risk analysis.
Recent risk-analysis research has also moved toward multidimensional and explainable analytical frameworks. In construction, Wuni [56] developed a multidimensional risk-assessment model integrating management, technical, stakeholder, regulatory, material, and economic risk dimensions, while Tian et al. [57] identified increasing use of data-driven and explainable approaches across the construction-risk-management lifecycle. Related work outside project scheduling has combined composite multidimensional indices with explainable machine learning to identify influential variables and provide interpretable importance rankings [58,59]. These approaches illustrate complementary ways of representing heterogeneous risk dimensions and examining the relative importance of contributing factors. They do not replace precedence-based schedule simulation, but they provide a broader analytical perspective for interpreting sensitivity, ranking stability, and multidimensional uncertainty in complex decision systems.
Accordingly, the present study applies established probabilistic scheduling methods to examine expert-level variability and the sensitivity of schedule-risk outputs to alternative aggregation, distribution, overlap, and dependence assumptions [26,32,55].
3. Methodology
3.1. Research Design
This study employed a quantitative, simulation-based research design to investigate schedule uncertainty in a standardized hypothetical parcel-scale urban regeneration project. The analysis consisted of two complementary components. First, the deterministic and probabilistic schedule analyses developed from the original 2021 expert data were retained as the baseline. The deterministic baseline was developed using the Linked Bar Chart method, whereas the probabilistic baseline was obtained from a 10,000-iteration Monte Carlo simulation (MCS) implemented in Powerproject XV software (version 15). Second, expert-level statistical analyses and independent assumption-sensitivity simulations were conducted to examine how project-level and activity-level schedule-risk outputs changed when key input and modeling assumptions were varied.
The deterministic and probabilistic baseline analyses used the same project scope, 25-activity network, predecessor–successor relationships, project start date, and working calendar. The additional analyses examined (i) dispersion and concordance in the individual expert duration estimates; (ii) associations between duration estimates and professional experience or profession; (iii) alternative expert-aggregation methods; (iv) alternative three-point probability distributions; (v) removal of the two construction-overlap assumptions; and (vi) positive dependence among activity durations belonging to the same main process. A fully specified independent duration-sensitivity analysis was also conducted for all 25 activities.
The methodological workflow is presented in Figure 1.
Figure 1.
Methodological workflow of the study.
3.2. Hypothetical Project Model
A standardized hypothetical project was defined within the context of parcel-scale urban regeneration in Türkiye. The project was not intended to represent every parcel-scale urban regeneration project in the country or a particular completed project. Instead, standardizing its physical and procedural characteristics provided a common analytical basis for collecting expert duration estimates and comparing schedule-risk results under different modeling assumptions. Accordingly, the research design supports controlled within-model comparison of alternative assumptions rather than empirical assessment of predictive performance against realized project outcomes.
The hypothetical project was defined as a five-story residential building containing 10 dwelling units and having a reinforced-concrete structural system. The parcel area was 500 m2, the building footprint was 220 m2, and the gross floor area was 1100 m2. The project start date used in the scheduling models was 3 January 2022. The model covered pre-construction, construction, and post-construction stages rather than construction-site activities alone.
The physical project characteristics were held constant for all participants. The project location was specified as Türkiye, and participants were informed that they could consider the district associated with their institution when estimating durations. This standardized project definition ensured that all experts evaluated the same project scenario and provided duration estimates on a common analytical basis.
3.3. Activity Network and Expert Duration Estimation Form
The activity network was developed through a review of the legal, administrative, and implementation stages of parcel-scale urban regeneration involving risky buildings in Türkiye. The process structure was informed by Law No. 6306 on the Transformation of Areas under Disaster Risk, its implementing regulation, relevant literature on urban regeneration in Türkiye [35,37,38], and consultations conducted during the study with authorized personnel from seven provincial directorates of the Ministry of Environment and Urbanization in Türkiye. These consultations were used to clarify the sequence and practical implementation of parcel-scale urban-regeneration stages. The identified stages were then translated into schedulable activities and linked according to their procedural relationships.
The resulting network comprised seven main processes and 25 activities: preliminary agreement, building risk assessment, agreement, demolition, design and permitting, construction, and approval. The network therefore incorporated administrative, legal, stakeholder-related, permitting, construction, inspection, and occupancy-related processes within a single schedule structure.
Most predecessor–successor relationships were defined as Finish-to-Start (FS). Two relationships within the construction process permitted overlap. Finishing works (Activity 22) were allowed to start with a lead equal to 20% of the duration of structural works (Activity 21), while landscaping and external works (Activity 23) were allowed to start with a lead equal to 10% of the duration of finishing works (Activity 22). These relationships formed part of the original schedule model, and their influence was subsequently examined using an alternative no-overlap specification.
Before the duration-elicitation stage, the complete activity network was reviewed by five practitioners who were subsequently included in the 50-member expert panel. They represented public-sector administration, municipal planning, contracting, civil engineering, and project management and had 5–34 years of professional experience at the time of the study. The reviewers considered the activity structure and inter-activity relationships appropriate and did not recommend any revisions.
Figure 2 presents the complete activity network.
Figure 2.
Activity network of the standardized parcel-scale urban regeneration project. Arrows indicate the direction of predecessor–successor relationships between activities.
The expert duration estimation form consisted of three sections. The first collected information on professional background, field of work, and years of sector experience. The second presented the standardized characteristics of the hypothetical project. The third presented the predefined activity network and requested minimum, most likely, and maximum duration estimates for each of the 25 activities. All participants therefore evaluated the same project definition and activity structure.
The activity network reflects the process evaluated by the expert panel in 2021. As discussed in Section 2.1, the principal activity sequence represented in the network remains unchanged under the current procedural framework, although some institutional responsibilities and procedural details have changed since then. This continuity supports the continued relevance of the activity sequence, but it does not show that the administrative and approval durations estimated in 2021 still represent current project conditions. Accordingly, the 2021 duration estimates are retained here as inputs to the original expert-based model rather than treated as current observed durations. Because the duration estimates were elicited specifically for this predefined network, the activity definitions and relationships were held constant in the analyses rather than being retrospectively modified.
The activity network and rounded arithmetic-mean duration inputs used in the baseline schedule models are presented in Table 1.
Table 1.
Activity network and rounded arithmetic-mean duration inputs used in the baseline schedule models.
3.4. Selection of Expert Participants and Data Collection
Expert participants were selected using purposive sampling. The inclusion criteria were professional knowledge of the processes, stages, and durations of urban regeneration projects and at least five years of experience in relevant fields. Potential participants were identified through private-sector organizations, municipalities, relevant public institutions involved in urban regeneration, publicly available institutional and company contact information, and professional networks.
This procedure resulted in a pool of 296 potential participants. Potential participants were initially contacted by telephone, during which the purpose and scope of the study were explained, eligibility was assessed, and voluntary participation was requested. Sixty-six of the 296 contacted experts initially agreed to participate (22.3%) and were subsequently sent the expert duration estimation form by email. Fifty participants completed and returned the form, corresponding to 75.8% of those who initially agreed and 16.9% of the contacted pool, and constituted the final expert panel.
Data were collected in October and November 2021. Participants completed the forms independently and returned them by email. For each of the 25 activities, they provided minimum, most likely, and maximum duration estimates in days. The minimum value represented the shortest expected duration under favorable conditions without delays; the most likely value represented the expected duration under normal conditions; and the maximum value represented the longest expected duration under adverse or delaying conditions.
The final panel comprised 18 civil engineers, 15 contractors, five architects, three urban regeneration consultants or specialists, two real estate valuation or consultancy specialists, two surveying/geomatics professionals, one urban planner, one project manager, one construction technician, one restoration specialist, and one participant from another consultancy field. Sector experience ranged from 5 to 45 years, with a mean of 16.7 years and a median of 12.5 years.
The duration estimation form stated that the research was being conducted as part of a master’s thesis within the Housing Production and Construction Management Master’s Program at Yıldız Technical University. Participants were informed of the purpose and scope of the research before agreeing to participate, and the form stated that their personal information would not be disclosed to or used by third parties other than the thesis supervisor. No participant identities, institutional affiliations, or contact information are reported in this article.
3.5. Data Preparation and Baseline Model Inputs
The expert duration estimates were organized in Microsoft Excel. Minimum, most likely, and maximum estimates were processed separately for each activity. The arithmetic mean of the 50 expert estimates was calculated for each duration type, and these group-level values were rounded to the nearest whole day when the baseline Powerproject inputs were created. Each expert contributed equally to the original arithmetic-mean aggregation. Equal weighting was retained as the baseline because it formed the aggregation rule of the original schedule model and because no external calibration or performance data were available to derive empirically calibrated differential weights for individual experts. Rather than imposing unvalidated expert-specific weights, the influence of the aggregation rule was examined separately through experience-weighted, median, and 10% trimmed-mean specifications.
For activity j and duration type k, the arithmetic mean was calculated using Equation (1):
where si,j,k denotes the estimate provided by expert i for activity j and duration type k, and n = 50. The three duration types correspond to minimum, most likely, and maximum estimates.
The deterministic baseline used the rounded arithmetic mean of the most likely estimates. The original MCS implemented in Powerproject used the rounded arithmetic means of all three duration types.
To evaluate sensitivity to the equal-weight aggregation assumption, an experience-weighted mean was additionally calculated using Equation (2):
where ei denotes the years of sector experience of expert i. Experience weighting was used only as an alternative aggregation specification and did not replace the equal-weight arithmetic means used in the baseline analyses.
Two further aggregation specifications were examined: the median and a 10% trimmed mean. For consistency with the integer-day inputs used in the original schedule model, the alternative aggregated minimum, most likely, and maximum values were also rounded to the nearest whole day before simulation.
3.6. Deterministic Baseline and Original Monte Carlo Simulation
The 25-activity network was implemented in Powerproject XV software (version 15). For the deterministic baseline, the rounded arithmetic mean of the most likely duration estimate was assigned to each activity. The project start date was 3 January 2022. Sundays and the designated non-working holidays specified in the project calendar were excluded from working time. The designated non-working holiday dates encoded in the project calendar were 1 January, 23 April, 19 May, 15 July, 30 August, and 29 October 2022; 19 May, 15 July, and 30 August 2023; and 1 January, 23 April, 15 July, 30 August, and 29 October 2024. For reproducibility, these dates are also explicitly defined in Supplementary File S1 under the NONWORKING_DATES definition. Activity durations and total float were evaluated in working days, whereas overall project duration was reported in elapsed days. The predecessor–successor relationships presented in Table 1, including the original 20% and 10% lead relationships, were retained.
The original probabilistic analysis was implemented in Powerproject XV using Monte Carlo simulation. The risk-analysis scope was set to All, the sampling method to Monte Carlo, and the distribution type to Skewed normal (PERT), following the terminology displayed in the software interface. The simulation used 10,000 iterations, and Elapsed Day was selected as the finish-date variance unit. The Use task min/max durations and probabilities option was enabled. The risk-analysis code library and default-risk percentage options were not used. For each activity, the rounded arithmetic means of the minimum, most likely, and maximum estimates reported in Table 1 were used as the three-point distribution inputs.
Scheduling dependencies were incorporated through the predecessor–successor network. No additional statistical correlation structure was specified among activity durations, and no common risk factor was defined to alter multiple activity durations simultaneously.
Powerproject recalculated the complete schedule in each simulation iteration using sampled activity durations. The outputs retained for analysis comprised (i) project-completion probabilities and associated duration thresholds; (ii) the software-reported activity duration-sensitivity percentages; and (iii) criticality indices representing the proportion of iterations in which each activity was on the critical path.
Probability-based duration thresholds are denoted throughout the study as Px, where x represents the cumulative completion probability. For example, P50 is the elapsed project duration at or below which 50% of simulated project completions occur, while P80 and P90 correspond to the 80% and 90% completion thresholds, respectively.
3.7. Expert-Level Statistical Analyses and Assumption-Sensitivity Assessment
3.7.1. Expert-Level Statistical Methods
The expert-level analyses used the original individual duration estimates rather than only the aggregated inputs. For each of the 25 activities and each of the three duration types, the arithmetic mean, standard deviation (SD), median, first quartile (Q1), third quartile (Q3), interquartile range (IQR), and coefficient of variation (CV) were calculated. The IQR was defined as Q3 − Q1, and the CV was calculated as the SD divided by the arithmetic mean.
During data screening, two of the 1250 expert–activity three-point estimates (0.16%) did not satisfy the expected minimum ≤ most likely ≤ maximum ordering. Inspection of the original response forms confirmed that these values reflected the recorded responses rather than transcription errors. Because the expert-level descriptive, experience-association, and profession-comparison analyses treated the minimum, most likely, and maximum estimates separately, the recorded values were retained unchanged in the primary analyses. As an additional data-quality sensitivity check, the aggregated inputs for the two affected activities were recalculated after excluding only the corresponding three-point estimate from each activity (n = 49 for those activities); no values were imputed, reordered, or retrospectively corrected.
Kendall’s coefficient of concordance (W) was calculated separately for the minimum, most likely, and maximum duration estimates to assess agreement among the 50 experts in their relative ordering of the 25 activity durations. This analysis therefore distinguished concordance in the relative ranking of activities from dispersion in the absolute duration estimates.
Associations between years of sector experience and individual duration estimates were evaluated using Spearman’s rank correlation coefficient. Separate tests were conducted for the 25 activities and three duration types, resulting in 75 experience–duration tests.
Profession-related differences were examined using Kruskal–Wallis tests. To avoid comparisons based on very small subgroups, this analysis was restricted to the three professional categories containing at least five participants: civil engineers (n = 18), contractors (n = 15), and architects (n = 5). The smaller categories were not pooled because they represented substantively different professional backgrounds. Separate tests were conducted for all 25 activities and three duration types, resulting in 75 profession-based comparisons.
Benjamini–Hochberg false-discovery-rate (FDR) adjustment was applied separately to the 75 experience tests and the 75 profession tests. The two sets of tests were treated as separate hypothesis families because they addressed two distinct prespecified questions: associations with years of professional experience and differences among professional groups. Statistical significance was evaluated at an FDR-adjusted p < 0.05.
3.7.2. Independent Assumption-Sensitivity Simulations
The assumption-sensitivity analyses were implemented independently of Powerproject, while the original Powerproject results were retained unchanged as the original software-generated reference. Because the original Powerproject analysis and the independent simulation framework differ in software implementation, duration-distribution specification, and iteration count, the Powerproject output was not included in the numerical ranges used to summarize the independently implemented alternative specifications. The independent simulations were implemented in Python (version 3.13.5) using NumPy (version 2.3.5) and SciPy (version 1.17.0).
Each alternative specification used 100,000 Monte Carlo iterations and a fixed random seed of 20260903. The larger iteration count was used to reduce Monte Carlo sampling error in the independent analyses, while the original 10,000-iteration Powerproject analysis was retained unchanged. Unless explicitly changed in a given specification, the same 25-activity network, project start date, working calendar, rounded arithmetic-mean three-point inputs, and original 20% and 10% overlap relationships were retained. Monte Carlo precision for Pr(≤583 days) was quantified using two-sided 95% Wilson intervals. Convergence of the independent simulations was additionally examined by dividing each 100,000-iteration run into ten contiguous batches of 10,000 iterations and comparing the batch estimates of Pr(≤583 days), P50, P80, and P90.
Before conducting the assumption-sensitivity analyses, the independently implemented network and calendar were checked using the rounded most likely durations from the deterministic baseline. The reconstructed calculation reproduced the baseline project duration of 583 elapsed days, providing an internal check of the network and calendar implementation. In the independent simulations, sampled activity durations were retained as continuous working-day values during the network calculations; the resulting total working duration was rounded upward to the next whole working day before conversion to elapsed calendar days using the reconstructed project calendar. This check concerns computational consistency and should not be interpreted as external validation against an observed project.
The assumption-sensitivity analysis covered three groups of assumptions. First, the equal-weight arithmetic-mean inputs were compared with median, 10% trimmed-mean, and experience-weighted aggregations. Second, sensitivity to the duration-distribution specification was examined using alternative bounded three-point distributions. Third, the influence of network overlap and positive dependence among activity durations was examined.
The available duration information consisted of expert-elicited minimum, most likely, and maximum estimates rather than samples of realized activity durations. Consequently, an empirical goodness-of-fit procedure could not be used to identify a statistically best-fitting activity-duration distribution. Sensitivity to the duration-distribution assumption was therefore examined using two explicitly specified three-point distributions: standard beta-PERT with λ = 4 and the triangular distribution.
For the beta-PERT specification, the shape parameters for activity j were calculated using Equations (3) and (4):
where aj, mj, and bj denote the minimum, most likely, and maximum inputs for activity j, respectively, and λ = 4. A beta-distributed random variable Xj∼Beta(αj,βj) was transformed to the activity-duration scale using Equation (5):
Dj = aj + (bj − aj)Xj
The triangular specification used the same minimum aj, mode mj, and maximum bjvalues. These distributions were used as alternative specifications and were not intended to reproduce or replace Powerproject’s software-specific Skewed normal (PERT) implementation. The two specifications do not, however, imply identical expected activity durations. For beta-PERT with λ = 4, the expected value is (aj + 4mj + bj)/6, whereas the triangular expected value is (aj + mj + bj)/3. For all 25 aggregated three-point inputs used here, bj − mj > mj − aj; consequently, the triangular specification assigns a higher expected duration than beta-PERT to every activity. The comparison therefore changes both central tendency and distributional shape and should not be interpreted as a mean-matched test of distributional shape alone. For diagnostic interpretation, deterministic schedules were also calculated using the expected activity durations implied by each specification while holding the network and calendar unchanged; these calculations are reference values rather than additional stochastic simulation scenarios.
Sensitivity to activity overlap was examined through a no-overlap specification in which the original 20% lead from Activity 21 to Activity 22 and 10% lead from Activity 22 to Activity 23 were removed and both relationships were represented as pure Finish-to-Start links.
3.7.3. Positive Dependence Scenarios
The baseline probabilistic model did not include an additional statistical dependence structure among activity durations. To evaluate the potential consequences of shared sources of schedule variation, two positive within-process dependence scenarios were constructed using a Gaussian-copula factor structure. This parsimonious factor structure was used as a scenario-based dependence model because it preserves the specified beta-PERT marginal distributions while introducing shared within-process variation without requiring empirically calibrated common-risk-driver occurrence data, which were not available for the present study.
For activity j, belonging to main process g(j), the latent variable in simulation iteration r was generated using Equation (6):
where Fg(j),r is a standard-normal process-level factor shared by activities belonging to the same main process and εj,r is an independent standard-normal activity-specific term. The latent values were transformed to uniform probabilities according to Equation (7):
and the inverse cumulative distribution function of the corresponding beta-PERT distribution was then used to obtain the simulated activity duration.
Uj,r = Φ(Zj,r)
Two scenarios were examined using latent dependence parameters of ρ = 0.25 and ρ = 0.50 to represent progressively stronger positive within-process dependence. Positive dependence was examined because activities within the same main process may be jointly affected by shared disturbances or common process-level conditions, as discussed in Section 2.3. The parameter values were used as illustrative sensitivity levels to examine how increasing positive dependence affects the model outputs. They were not estimated from empirical correlations among observed activity durations. They therefore represent analytical scenario values rather than calibrated dependence parameters for actual urban regeneration projects. Activities belonging to different main processes did not share the same process-level factor. The marginal distribution for each activity remained beta-PERT, allowing the effect of dependence to be examined while holding the marginal duration specification constant. For both dependence scenarios, the process-level factors and activity-specific standard-normal terms were regenerated from the same fixed seed, so the ρ = 0.25 and ρ = 0.50 runs used common random numbers.
3.7.4. Reproducible Duration-Sensitivity, Ranking-Stability, and Criticality Analyses
The original Powerproject report provided software-generated duration-sensitivity percentages for the 20 highest-ranked activities. These historical software outputs were retained as the original software-generated reference and were not assigned a retrospectively assumed correlation formula.
For the independent reference analysis, duration sensitivity was calculated for all 25 activities using Pearson’s correlation coefficient between sampled activity duration and overall elapsed project duration. For activity j, Pearson’s coefficient was calculated across R = 100,000 simulation iterations using Equation (8):
where Dj,r is the sampled duration of activity j in iteration r, is its mean sampled duration, Tr is the corresponding overall elapsed project duration, and T is the mean elapsed project duration across all iterations.
Spearman’s rank correlation coefficient between sampled activity duration and project duration was additionally calculated for all 25 activities as a sensitivity check for monotonic relationships that need not be linear. Agreement between the complete Pearson- and Spearman-based rankings was also evaluated using Spearman rank correlation.
To quantify within-framework ranking stability, the activity ranking obtained from each independent alternative specification was compared with that of the independent beta-PERT arithmetic-mean reference specification using Spearman rank correlation across all 25 activities. The comparison was based on the Pearson duration-sensitivity coefficients calculated within each independent simulation specification. This all-activity comparison served as the primary ranking-stability measure because it avoids mixing the effects of alternative assumptions with differences between the Powerproject and Python implementations.
For contextual comparison with the original software output, a secondary cross-framework comparison was retained between the original Powerproject duration-sensitivity percentages and the corresponding Pearson coefficients from the independent beta-PERT reference analysis. Because the original Powerproject report displayed sensitivity results for 20 activities, this secondary comparison was restricted to those same 20 activities (n = 20), with tied Powerproject values retained as ties.
For each independent simulation specification, the criticality index of an activity was defined as shown in Equation (9):
where Nj,critical is the number of iterations in which activity j was critical and R is the total number of simulation iterations.
The assumption-sensitivity assessment therefore evaluated both project-level and activity-level outcomes: completion probabilities and duration thresholds at the project level, and duration-sensitivity rankings and criticality indices at the activity level. The executable Python code for the independent all-activity duration-sensitivity, ranking-stability, and Monte Carlo precision reanalysis is provided as Supplementary File S1.
4. Results
4.1. Expert-Level Variability, Agreement, Experience, and Profession
The expert-level analysis showed variation in the absolute duration estimates together with substantial concordance in the relative ordering of activities. Kendall’s coefficient of concordance was W = 0.756 for the minimum estimates, W = 0.773 for the most likely estimates, and W = 0.811 for the maximum estimates (all p < 0.001). Thus, although the 50 experts differed in the absolute durations assigned to individual activities, their relative ordering of longer and shorter activities was comparatively consistent.
For the most likely duration estimates, the median coefficient of variation across the 25 activities was 0.417. The highest relative variability was observed for finalization of the risk assessment report (Activity 10; CV = 0.705), signing the project contract (Activity 12; CV = 0.627), signing the preliminary agreement with the contractor (Activity 3; CV = 0.625), and preparation of feasibility and preliminary design studies (Activity 2; CV = 0.587). Lower relative dispersion was observed for structural works (Activity 21; CV = 0.245), landscaping and external works (Activity 23; CV = 0.247), and finishing works (Activity 22; CV = 0.250). Complete descriptive statistics for all three duration types are provided in Supplementary Table S1.
Table 2 summarizes the distributional characteristics of the most likely duration estimates across the 50 experts, including measures of central tendency, dispersion, and the observed range of the recorded estimates.
Table 2.
Descriptive statistics of the most likely duration estimates provided by the 50 experts.
Years of sector experience were examined as a potential source of variation in the duration estimates. After Benjamini–Hochberg FDR adjustment across the 75 experience–duration tests, statistically significant positive associations with experience remained only for Activity 25, obtaining the occupancy permit. Spearman’s coefficients were ρ = 0.439 for the minimum estimate, ρ = 0.464 for the most likely estimate, and ρ = 0.449 for the maximum estimate; the FDR-adjusted p-value was 0.036 for each association. The positive coefficients indicate that more experienced experts tended to provide longer duration estimates for this activity. No other activity–duration combination remained statistically significant after FDR adjustment. Complete results are provided in Supplementary Table S4.
Across the 75 profession-based comparisons, no statistically significant difference among civil engineers, contractors, and architects remained after FDR adjustment. These results do not demonstrate equivalence among the professional groups, particularly given the unequal group sizes, but no systematic profession-related difference was detected in this sample. Complete profession-based comparisons are reported in Supplementary Table S5.
4.2. Deterministic Scheduling Results
The deterministic Linked Bar Chart model produced a project start date of 3 January 2022 and a completion date of 8 August 2023, corresponding to a total project duration of 583 elapsed days.
Activities 1–10, 13–15, and 18–25 had zero total float and formed the deterministic critical path. Activities 11, 12, 16, and 17 were outside the deterministic critical path and each had six working days of total float.
The float associated with these four activities resulted from the two parallel branches converging at Activity 18. The branch consisting of Activities 13–15 had a total duration of 53 working days, whereas the branch consisting of Activities 11, 12, 16, and 17 had a total duration of 47 working days. The six-working-day difference between the branches therefore determined the total float of Activities 11, 12, 16, and 17. The deterministic scheduling results are summarized in Table 3.
Table 3.
Deterministic scheduling results and critical-path summary.
4.3. Original Monte Carlo Simulation Implemented in Powerproject
The original 10,000-iteration MCS implemented in Powerproject produced a distribution of possible project-completion durations. The probability of completing the project within the deterministic duration of 583 elapsed days was only 0.23%. At 10,000 iterations, the reported 0.230% corresponds to 23 simulated completions and a Wilson 95% Monte Carlo interval of 0.153–0.345%. For the independently rerun 100,000-iteration analyses, Monte Carlo precision was additionally assessed using 10-batch stability diagnostics, as reported in Supplementary Table S6.
The 50% completion threshold (P50) was 689 days, meaning that 50% of the simulated project completions occurred at or before this duration. The P10, P80, and P90 thresholds were 640, 724, and 744 days, respectively. Relative to the deterministic duration, P50 was 106 days longer, while P80 and P90 were 141 and 161 days longer, respectively.
The lower end of the reported simulation output was 550 elapsed days, while the 99.99% completion threshold was 849 days. The maximum completion duration observed across the 10,000 iterations was 850 days. The original simulation therefore produced an observed project-duration range of 550–850 elapsed days. The corresponding completion-probability thresholds and dates are summarized in Table 4.
Table 4.
Completion probability levels from the original Monte Carlo simulation implemented in Powerproject.
4.4. Duration-Sensitivity Results
In the original Powerproject output, the highest duration-sensitivity percentages were associated with finalization of the risk assessment report (Activity 10; 43%), finishing works (Activity 22; 37%), obtaining the building permit (Activity 18; 35%), obtaining the occupancy permit (Activity 25; 32%), notification to property owners (Activity 9; 29%), and structural works (Activity 21; 28%). The original software report displayed the 20 highest-ranked activities; these historical baseline values are provided in Supplementary Table S2.
The independent beta-PERT arithmetic-mean reference analysis provided fully specified Pearson and Spearman duration-sensitivity coefficients for all 25 activities. The highest Pearson coefficient was obtained for finalization of the risk assessment report (Activity 10; r = 0.412). This was followed by obtaining the building permit (Activity 18; r = 0.386), finishing works (Activity 22; r = 0.382), obtaining the occupancy permit (Activity 25; r = 0.361), structural works (Activity 21; r = 0.298), and notification to property owners (Activity 9; r = 0.291).
The lowest Pearson coefficient was observed for signing the project contract (Activity 12; r = 0.017). The Pearson- and Spearman-based activity rankings were nearly identical, with a Spearman rank correlation of 0.999 between the complete sets of 25 activity rankings. For the 20 activities displayed in the original Powerproject sensitivity output, rank agreement between the software-reported sensitivity values and the corresponding Pearson coefficients from the independent beta-PERT reference analysis was also high (Spearman rank correlation = 0.947). The complete all-activity duration-sensitivity results are reported in Table 5.
Table 5.
Duration sensitivity for all 25 activities in the independent beta-PERT arithmetic-mean reference analysis.
Reporting the complete 25-activity reference is important because the ranking-stability analysis in Section 4.6 compares each alternative specification against this same beta-PERT arithmetic-mean benchmark. This full-network basis avoids restricting the comparison to the 20 activities displayed in the original Powerproject output and allows rank shifts to be evaluated consistently across all modeled activities. It also provides the reference sensitivity coefficients used to interpret changes in activity prioritization under alternative modeling assumptions.
4.5. Criticality Results
The original MCS implemented in Powerproject showed that Activities 1–10 and 18–25 were critical in every simulation iteration and therefore had a criticality index of 1.00.
The two parallel branches between Activity 10 and Activity 18 showed stochastic variation in critical status. Activities 13–15 had a criticality index of 0.68, whereas Activities 11, 12, 16, and 17 had a criticality index of 0.32. Thus, although Activities 13–15 constituted the critical branch in the deterministic schedule, variation in activity durations allowed the competing branch containing Activities 11, 12, 16, and 17 to become critical in a proportion of the probabilistic realizations. The criticality indices obtained from the original Powerproject simulation are summarized in Table 6.
Table 6.
Criticality indices from the original Monte Carlo simulation implemented in Powerproject.
The independent beta-PERT arithmetic-mean reference analysis produced a closely comparable branching pattern, with a criticality index of 0.658 for Activities 13–15 and 0.342 for Activities 11, 12, 16, and 17. Criticality results for all independent alternative specifications are summarized in Section 4.6.
4.6. Sensitivity of Probabilistic Results to Modeling Assumptions
The independent simulations showed that project-level probabilistic results were sensitive to the assumptions used to construct the schedule-risk model.
Under the independent beta-PERT arithmetic-mean reference specification, the probability of completing the project within the deterministic duration of 583 days was 4.471%, and P50 was 652 days. Using the same minimum, most likely, and maximum inputs with the triangular specification reduced the corresponding probability to 0.132% and increased P50 to 717 days. To clarify the source of this difference, deterministic reference schedules were calculated from the expected activity durations implied by the two distributions while holding the network and calendar unchanged. The beta-PERT expected-duration inputs produced 548.25 working days, rounded upward to 549 working days for calendar conversion, corresponding to 649 elapsed days; the triangular expected-duration inputs produced 604 working days, corresponding to 713 elapsed days. Thus, 64 of the 65 elapsed days separating the beta-PERT and triangular P50 values were already present in the deterministic expected-duration references. The observed difference should therefore be interpreted primarily as a consequence of the different central tendencies implied by the two three-point distributions, rather than as a pure distribution-shape effect.
Changing the expert-aggregation method also affected the results. Median aggregation produced a probability of 9.953% for completion within 583 days and a P50 of 632 days. The experience-weighted mean produced corresponding values of 1.103% and 676 days, while the 10% trimmed mean produced 8.209% and 638 days. Removing the original construction overlaps resulted in a 0.466% probability of completion within 583 days and increased P50 to 688 days.
Across the independently implemented alternative aggregation, marginal-distribution, and network-overlap specifications, P50 therefore ranged from 632 to 717 elapsed days, while the probability of completion within the deterministic 583-day duration ranged from 0.132% to 9.953%.
Monte Carlo precision checks indicated that the independent 100,000-iteration results were numerically stable. As shown in Table 7, the Wilson 95% intervals for Pr(≤583 days) were narrow relative to the between-specification differences. Across ten 10,000-iteration batches, P50 varied by no more than 3 elapsed days, P80 by no more than 3 days, and P90 by no more than 5 days across the independent specifications. Complete batch-stability diagnostics are provided in Supplementary Table S6.
Table 7.
Project-level and activity-level results for the original Powerproject baseline and the independently implemented alternative specifications.
The additional order-consistency sensitivity check produced only negligible changes in the probabilistic results. After excluding the two order-inconsistent expert–activity triplets only when recalculating the affected activity-level aggregate inputs, the probability of completion within 583 days was 4.216%, compared with 4.471% in the beta-PERT arithmetic-mean reference specification. P50 changed from 652 to 653 days and P80 from 687 to 688 days, while P90 remained unchanged at 706 days. The complete activity-sensitivity ranking also remained virtually unchanged relative to the corresponding beta-PERT reference analysis (Spearman ρ = 0.995). These results indicate that the two recorded order inconsistencies had no material influence on the corresponding project-level or activity-level model outputs. Project-level and activity-level results for the original Powerproject reference and the independently implemented alternative specifications are summarized in Table 7.
Using the independent beta-PERT arithmetic-mean specification as the all-activity reference, duration-sensitivity rankings remained comparatively stable under changes in marginal distribution, expert aggregation, and network overlap. Spearman rank agreement was 0.980 for the triangular specification, 0.930 for median aggregation, 0.984 for experience weighting, 0.993 for the 10% trimmed-mean specification, and 0.997 for the no-overlap network. The order-consistency sensitivity check likewise showed very high agreement with the reference ranking (0.995). These high agreement values should be interpreted within the present network topology, which is largely serial and contains one principal competing-branch structure.
Positive within-process dependence produced a different pattern. P50 remained at 652 days under both dependence scenarios, while P80/P90 increased from 687/706 days under the independent beta-PERT reference model to 695/718 days at latent ρ = 0.25 and 702/730 days at latent ρ = 0.50. The standard deviation of elapsed project duration increased from 41.6 days under independence to 50.3 and 57.9 days, respectively. The probability of completion within 583 days was 7.998% at latent ρ = 0.25 and 11.144% at latent ρ = 0.50. Rank agreement with the independent reference decreased to 0.760 and 0.547, respectively. However, the two dependence-conditioned rankings remained highly similar to each other (Spearman rank correlation = 0.933). These results indicate that positive dependence shifted activity prioritization away from the independence reference while the rankings under the two positive-dependence levels remained comparatively stable relative to each other.
Criticality of the two competing branches also varied across the alternative specifications. The criticality index of Activities 13–15 ranged from 0.549 under median aggregation to 0.722 under the 10% trimmed-mean specification, with corresponding indices of 0.451 and 0.278 for Activities 11, 12, 16, and 17.
Complete results for the alternative specifications, including P10, P95, P99, mean elapsed duration, and additional scenario details, are provided in Supplementary Table S3.
Figure 3 presents the original Powerproject baseline for contextual comparison alongside the P50, P80, and P90 completion-duration thresholds from the selected independently implemented alternative specifications. The original Powerproject baseline is not included in the numerical range reported for the independent specifications.
Figure 3.
Completion-duration thresholds for the original Powerproject baseline and selected independently implemented alternative specifications. The original Powerproject result is shown for contextual comparison and is not included in the numerical range reported for the independent specifications.
Figure 4 further illustrates the effect of positive within-process dependence on the completion-duration distribution within the independent beta-PERT framework.
Figure 4.
Empirical cumulative distributions of project completion duration for the independent beta-PERT arithmetic-mean reference and the two positive within-process dependence scenarios. The vertical reference line indicates the 583-day deterministic duration. Positive dependence leaves the median completion duration essentially unchanged while progressively widening the distribution, particularly toward the upper tail.
5. Discussion
The contrast between the deterministic and probabilistic schedules should be interpreted primarily as a modeling issue rather than as a direct measure of stochastic schedule uncertainty. Much of the difference arises because the deterministic baseline uses aggregated most-likely values, whereas the probabilistic specifications are constructed from three-point distributions whose implied expected durations can differ from those modes. The independent beta-PERT analysis confirms that this shift in central tendency accounts for most of the separation between the deterministic baseline and the probabilistic median. The Powerproject and independent beta-PERT outputs should likewise not be treated as directly comparable reproductions because their software implementation, distribution specification, and iteration count differ. The broader implication is that probabilistic schedule outputs depend not only on stochastic sampling but also on how central tendency and model structure are specified.
The expert-level analyses provide important context for interpreting the aggregated model inputs. Substantial concordance in the relative ordering of activity durations coexisted with considerable dispersion in absolute estimates, indicating that agreement on which activities are relatively longer or shorter does not imply agreement on their precise durations. Because aggregation compresses heterogeneous judgments into common model inputs, elicitation uncertainty and the choice of aggregation rule remain relevant [60,61,62]. Although participants completed the forms independently, individual judgments may still have been affected by anchoring, overconfidence, or differences in professional experience and interpretation; the present dataset does not permit these effects to be identified or corrected directly.
Professional experience was significantly associated only with the three duration estimates for the occupancy-permit activity after FDR correction, while no systematic profession-related difference remained significant. There was therefore insufficient empirical justification for replacing equal weighting with a profession- or experience-based scheme as the primary model. Nevertheless, project-level completion estimates changed meaningfully across alternative aggregation rules, supporting their interpretation as sensitivity specifications rather than as competing claims of superior validity. More formal aggregation approaches, including Cooke’s Classical Model [62] or Bayesian expert-elicitation and pooling approaches [60], could be considered where suitable calibration variables, performance information, or prior distributions are available.
The comparison of beta-PERT and triangular inputs similarly indicates that apparent distributional effects can largely reflect differences in implied central tendency. The close correspondence between the change in deterministic expected-duration references and the change in simulated median duration shows that most of the contrast was already embedded in the expected values implied by the two three-point specifications. This interpretation is consistent with longstanding analyses of PERT assumptions and moment estimation [63,64] and helps contextualize previous findings concerning the influence of three-point estimation and distribution choice [55]. The comparison should therefore be interpreted as sensitivity to alternative three-point specifications rather than as evidence of a pure distribution-shape effect.
At the activity level, duration-sensitivity rankings remained comparatively stable across changes in aggregation, marginal distribution, and activity overlap within the tested network. This suggests that some activity-prioritization signals may be less sensitive to these modeling choices than project-level completion estimates. However, this stability remains conditioned by the tested network topology and should not be generalized to networks with more extensive parallelism or multiple competing paths [43].
Positive within-process dependence qualifies this pattern. Increasing positive dependence widened the upper tail of the completion-duration distribution and altered activity prioritization relative to the independence specification, even though the median completion duration changed comparatively little. Because the dependence parameters were not empirically calibrated, the magnitude of these changes should not be interpreted as an estimate of the effect expected in actual urban regeneration projects. Rather, the scenarios show that shared duration variation can alter both contingency-relevant tail risk and activity prioritization, reinforcing the importance of considering dependence and common-risk effects in stochastic project networks [32,65].
The criticality results further demonstrate why network position should be distinguished from duration sensitivity. Activities may appear frequently critical because of their precedence relationships even when their duration variability is not among the strongest contributors to overall project-duration variation. Sensitivity and criticality should therefore be interpreted as complementary rather than interchangeable indicators for project monitoring and control [43,53]. More generally, realistic project-network simulation requires attention to precedence relationships, interactions, and the assumptions through which uncertainty propagates across the network [66].
The activity-level results indicate that schedule uncertainty in the tested network is not confined to on-site construction: administrative and approval processes appeared among the stronger duration-sensitivity signals alongside structural and finishing works. This pattern reflects the connected legal, administrative, stakeholder-related, and construction stages of urban regeneration and is consistent with literature identifying approvals, coordination, stakeholder relations, financing, and administrative procedures as important sources of delay [12,13,14,15,16,17,18,19].
This point is particularly relevant to the Turkish urban-regeneration context. Regeneration can provide an important mechanism for reducing the physical vulnerability of risky building stock; evidence following the 2023 Kahramanmaraş earthquakes indicates lower damage in several regenerated at-risk areas examined by Sakarya and Bektaş [11]. At the same time, the implementation process can involve extended waiting, negotiations, legal and planning procedures, and conflicts among actors [36,67]. Urban regeneration should therefore not be considered only in terms of its completed physical outcome. The time required to move from risk identification and owner decisions through demolition, permitting, construction, and occupancy is itself an important component of implementation performance. From this perspective, schedule management can contribute to the practical realization of the potential disaster-risk-reduction benefits of regeneration, while prolonged or contested implementation may delay those benefits.
As discussed in Section 2.1, the 2021 activity network retains the same principal activity sequence under the current parcel-scale transformation framework, although some institutional responsibilities and procedural details have changed since then [39,40,41,42]. For application to a specific contemporary project, however, individual administrative durations and project-specific procedural requirements should be recalibrated to the conditions prevailing at the time of implementation; such recalibration may also affect the relative sensitivity of regulation-affected administrative activities, even though the overall activity sequence remains unchanged.
Deterministic and probabilistic scheduling should therefore be treated as complementary rather than substitutive. Deterministic schedules define workflow, precedence relationships, planned dates, and float, whereas probabilistic analysis adds completion likelihoods and identifies activities or branches that may warrant closer investigation. Reporting a single probabilistic specification can create false precision; completion thresholds should therefore be interpreted together with their aggregation, distribution, network, and dependence assumptions. Activity-level signals that persist across alternative specifications may provide a stronger basis for additional data collection or schedule monitoring than rankings obtained from a single model.
From a broader uncertainty-management perspective, these outputs are better interpreted as decision-support information for risk-informed planning and governance than as stand-alone forecasts [48,49,50]. Completion thresholds can inform schedule-contingency decisions across different confidence levels, while sensitivity and criticality measures can direct monitoring, coordination, and management attention toward processes that contribute more strongly to schedule exposure [25,30,32,43]. In multi-actor infrastructure and urban-regeneration settings, such information may also help identify activities or process interfaces that warrant contingency planning or coordinated intervention.
Transferability should be understood at the procedural rather than numerical level. For other construction, infrastructure, or large-scale public-investment projects, application would require reconstructing the activity network and working calendar for the relevant governance, contractual, and regulatory setting; recalibrating activity-duration inputs, overlap relationships, and dependence assumptions using project records and/or context-specific expert elicitation; and repeating the assumption-sensitivity analyses under the resulting project-specific model. This would preserve the analytical logic without directly transferring the numerical thresholds or rankings obtained from the present standardized network; operational use should then be validated in the target context.
Recent explainable delay-prediction studies and multidimensional risk frameworks provide a complementary perspective by linking broader representations of risk or performance with transparent importance diagnostics [44,45,56,57,58,59]. Within such approaches, multidimensional or composite representations can be examined together with interpretable importance rankings to assess which factors dominate model outputs and whether priority signals remain stable across alternative analytical specifications. Although these approaches are methodologically distinct from precedence-based probabilistic schedule simulation, this perspective is relevant to the present findings because the current analysis likewise distinguishes project-level outputs that are sensitive to modeling assumptions from activity-level rankings that remain comparatively stable under some, but not all, specifications.
Schedule uncertainty also has implications for cost management, since construction delays and time overruns can affect project completion costs [15,20]. Previous research on BIM-based project cost management has also identified Monte Carlo simulation among the techniques integrated with cost-control applications [68]. In this respect, schedule-risk information may provide a useful basis for closer coordination between time and cost control, although cost effects were not modeled in the present study.
Several limitations remain. First, the standardized hypothetical project and expert-elicited durations are not observed schedules from completed or ongoing projects, so the completion probabilities and duration thresholds have not been externally validated. The simulations are therefore conditional analyses of the specified inputs, network, and modeling assumptions rather than tests of predictive accuracy. Their numerical probabilities, thresholds, sensitivity coefficients, and criticality patterns should not be transferred quantitatively without project-specific recalibration and comparison with realized schedules. Second, purposive sampling and judgment-based estimation introduce elicitation and sampling uncertainty [60,61,62]. Although the analyses quantify dispersion, concordance, and experience- and profession-related variation, they cannot eliminate cognitive or self-selection effects, and the panel should not be interpreted as statistically representative of the wider practitioner population.
Third, the beta-PERT and triangular distributions were specified from three-point estimates rather than fitted to observed duration samples. They are alternative modeling specifications rather than empirically validated distributions, and their comparison is not mean-matched because they imply different expected durations from the same asymmetric inputs. Fourth, the original 20% and 10% overlap assumptions were not estimated from observed project records; the no-overlap analysis tests sensitivity but does not identify an optimal overlap structure. Fifth, criticality and ranking stability are conditioned by the predefined, largely serial network with one principal competing branch. Alternative network configurations were not tested, and ranking stability may be lower in projects with more extensive parallelism or multiple competing paths.
Sixth, the dependence parameters of 0.25 and 0.50 are scenario values rather than estimated correlations, and common-risk drivers were not empirically calibrated [65,66]. More broadly, the model represents uncertainty mainly through activity-duration variability, while aggregation, distribution, overlap, and dependence are treated as alternative modeling assumptions in the sensitivity analysis. Regulatory changes, financing conditions, stakeholder decisions, external disruptions, and changes in network structure may introduce additional forms of uncertainty that are not modeled as separate stochastic processes or event-based risks.
Future research should therefore prioritize validation using completed and ongoing urban regeneration projects for which activity-level and total project durations can be observed. Such data would permit empirical calibration of activity-duration distributions, overlap relationships, and inter-activity dependence and would enable simulated completion distributions to be compared directly with realized schedules. Multi-project analyses across different cities, parcel sizes, ownership structures, contractor profiles, and administrative contexts could then determine whether the activity-level risk signals identified here generalize beyond the standardized model. Observed project data could also support explicit modeling of common risk factors and risk interactions, extending recent developments in schedule-risk analysis [30,32]. More comprehensive uncertainty frameworks could further represent regulatory changes, financing disruptions, stakeholder decision events, and other common-cause risks explicitly, allowing their occurrence and interactions to alter activity durations, dependencies, or network structure within the simulation.
6. Conclusions
This study examined schedule uncertainty in a standardized hypothetical parcel-scale urban regeneration project in Türkiye using expert-based duration estimates, deterministic scheduling, Monte Carlo simulation, and assumption-sensitivity analysis. The comparison of deterministic and probabilistic outputs showed that differences in completion estimates reflect not only stochastic variation but also the central tendencies implied by alternative duration specifications.
Project-level completion estimates were materially affected by aggregation, distribution, overlap, and dependence assumptions, whereas activity-level sensitivity rankings were comparatively stable under changes in aggregation, distribution, and overlap but less stable under positive within-process dependence. Administrative and approval processes appeared among the stronger sensitivity signals alongside structural and finishing works, reinforcing the need to treat urban-regeneration schedules as integrated administrative–construction networks rather than as construction-site sequences alone.
The study does not introduce a new probabilistic scheduling technique. Its contribution is a diagnostic assumption-sensitivity layer that evaluates several model-form choices within the same network and distinguishes assumption-sensitive project outputs from comparatively persistent activity-level signals. Because the results are conditional on expert inputs, the predefined network, and unvalidated modeling assumptions, they should not be interpreted as forecasts for actual projects. Future applications should recalibrate the model with project-specific data and validate completion outputs and activity-level patterns against observed schedules.
Supplementary Materials
The following supporting information can be downloaded at: https://www.mdpi.com/article/10.3390/buildings16214454/s1, Tables S1–S6 (.xlsx): Table S1, expert-level descriptive statistics for all 25 activities and three duration-estimate types; Table S2, original Powerproject duration-sensitivity values for the 20 highest-ranked activities displayed in the software report; Table S3, complete assumption-sensitivity results; Table S4, experience–duration association tests; Table S5, profession-based comparison tests; Table S6, Monte Carlo precision and batch-stability diagnostics; Supplementary File S1 (.py): Python code for the independent all-activity duration-sensitivity, ranking-stability, and Monte Carlo precision reanalysis.
Author Contributions
Conceptualization, O.T. and S.B.; methodology, O.T. and S.B.; software, O.T.; validation, O.T. and S.B.; formal analysis, O.T.; investigation, O.T.; resources, O.T. and S.B.; data curation, O.T.; writing—original draft preparation, O.T.; writing—review and editing, O.T. and S.B.; visualization, O.T.; supervision, S.B.; project administration, S.B. All authors have read and agreed to the published version of the manuscript.
Funding
This research received no external funding.
Institutional Review Board Statement
Formal institutional ethics committee approval was not obtained for this study. The research was conducted in 2021 as part of a master’s thesis and involved adult professionals who provided technical duration estimates for predefined activities in a hypothetical urban regeneration project. No intervention was undertaken, and no identifying participant information is reported in this article.
Informed Consent Statement
Participants were informed about the purpose and scope of the study during the initial telephone contact and voluntarily agreed to participate. The expert duration estimation form was subsequently sent to the participating experts by email, and the completed forms were voluntarily returned by email. A separate written informed consent form was not collected.
Data Availability Statement
The data supporting the findings of this study are presented in aggregated form in the article and Supplementary Materials. The Python code for the independent all-activity duration-sensitivity, ranking-stability, and Monte Carlo precision reanalysis is provided as Supplementary File S1. Participant-level data are not publicly available because of the confidentiality commitments made to the participants during data collection.
Acknowledgments
This article is based on the master’s thesis of the corresponding author, completed in January 2022 in the Housing Production and Construction Management Master’s Program, Department of Architecture, Yıldız Technical University. The authors thank the experts who voluntarily contributed their professional duration estimates to the study. During the preparation of this manuscript, the authors used OpenAI ChatGPT (GPT-5.6) for translation from Turkish into English and language editing. The authors reviewed and edited the output and take full responsibility for the content of this publication.
Conflicts of Interest
The authors declare no conflicts of interest.
Abbreviations
The following abbreviations are used in this manuscript:
| MCS | Monte Carlo simulation |
| CPM | Critical Path Method |
| PERT | Program Evaluation and Review Technique |
| FS | Finish-to-Start |
| SD | Standard deviation |
| IQR | Interquartile range |
| CV | Coefficient of variation |
| FDR | False discovery rate |
References
- Roberts, P. The evolution, definition and purpose of urban regeneration. In Urban Regeneration: A Handbook; Roberts, P., Sykes, H., Eds.; SAGE Publications Ltd.: London, UK, 2008; pp. 9–36. [Google Scholar] [CrossRef] [Scilit]
- Couch, C.; Fraser, C.; Percy, S. (Eds.) Urban Regeneration in Europe; Blackwell Science: Oxford, UK, 2003. [Google Scholar] [CrossRef] [Scilit]
- Liao, Z.; Liu, M. Critical barriers and countermeasures to urban regeneration from the stakeholder perspective: A literature review. Front. Sustain. Cities 2023, 5, 1115648. [Google Scholar] [CrossRef] [Scilit]
- Wang, H.; Zhao, Y.; Gao, X.; Gao, B. Collaborative decision-making for urban regeneration: A literature review and bibliometric analysis. Land Use Policy 2021, 107, 105479. [Google Scholar] [CrossRef] [Scilit]
- Xie, H.; Zhang, L.; Cui, P.; Yuan, J.; Li, Q. Exploring the evolution mechanisms of social risks associated with urban renewal from the perspective of stakeholders. Buildings 2024, 14, 1470. [Google Scholar] [CrossRef] [Scilit]
- Zheng, H.W.; Shen, G.Q.P.; Song, Y.; Sun, B.; Hong, J. Neighborhood sustainability in urban renewal: An assessment framework. Environ. Plan. B Urban Anal. City Sci. 2017, 44, 903–924. [Google Scholar] [CrossRef] [Scilit]
- Zhuang, T.; Qian, Q.K.; Visscher, H.J.; Elsinga, M.G. Stakeholders’ expectations in urban renewal projects in China: A key step towards sustainability. Sustainability 2017, 9, 1640. [Google Scholar] [CrossRef] [Scilit]
- Avğın, S.; Köse, M.M.; Özbek, A. Damage assessment of structural and geotechnical damages in Kahramanmaraş during the 6 February 2023 earthquakes. Eng. Sci. Technol. Int. J. 2024, 57, 101811. [Google Scholar] [CrossRef] [Scilit]
- Presidency of the Republic of Türkiye, Presidency of Strategy and Budget. Kahramanmaraş ve Hatay Depremleri Yeniden İmar ve Gelişme Raporu; Presidency of Strategy and Budget: Ankara, Türkiye, 2026. Available online: https://www.sbb.gov.tr/wp-content/uploads/2026/02/Kahramanmaras-ve-Hatay-Depremleri-Yeniden-Imar-ve-Gelisme-Raporu.pdf (accessed on 4 September 2026). (In Turkish)
- Büyüksaraç, A.; Avcil, F.; Alkan, H.; Işık, E.; Harirchian, E.; Özçelik, A. Seismic Hazard Implications of the 2025 Balıkesir Earthquake of Mw 6.1 for Western Türkiye. GeoHazards 2025, 6, 64. [Google Scholar] [CrossRef] [Scilit]
- Sakarya, A.; Bektaş, Y. Urban regeneration in response to natural disasters: Insights from the 2023 Kahramanmaraş earthquakes. J. Hous. Built Environ. 2025, 40, 1541–1571. [Google Scholar] [CrossRef] [Scilit]
- Assaf, S.A.; Al-Hejji, S. Causes of delay in large construction projects. Int. J. Proj. Manag. 2006, 24, 349–357. [Google Scholar] [CrossRef] [Scilit]
- Chan, D.W.M.; Kumaraswamy, M.M. A comparative study of causes of time overruns in Hong Kong construction projects. Int. J. Proj. Manag. 1997, 15, 55–63. [Google Scholar] [CrossRef] [Scilit]
- Doloi, H.; Sawhney, A.; Iyer, K.C.; Rentala, S. Analysing factors affecting delays in Indian construction projects. Int. J. Proj. Manag. 2012, 30, 479–489. [Google Scholar] [CrossRef] [Scilit]
- Kaming, P.F.; Olomolaiye, P.O.; Holt, G.D.; Harris, F.C. Factors influencing construction time and cost overruns on high-rise projects in Indonesia. Constr. Manag. Econ. 1997, 15, 83–94. [Google Scholar] [CrossRef] [Scilit]
- Odeh, A.M.; Battaineh, H.T. Causes of construction delay: Traditional contracts. Int. J. Proj. Manag. 2002, 20, 67–73. [Google Scholar] [CrossRef] [Scilit]
- Sambasivan, M.; Soon, Y.W. Causes and effects of delays in Malaysian construction industry. Int. J. Proj. Manag. 2007, 25, 517–526. [Google Scholar] [CrossRef] [Scilit]
- Sanni-Anibire, M.O.; Mohamad Zin, R.; Olatunji, S.O. Causes of delay in the global construction industry: A meta analytical review. Int. J. Constr. Manag. 2022, 22, 1395–1407. [Google Scholar] [CrossRef] [Scilit]
- Zidane, Y.J.-T.; Andersen, B. The top 10 universal delay factors in construction projects. Int. J. Manag. Proj. Bus. 2018, 11, 650–672. [Google Scholar] [CrossRef] [Scilit]
- Aibinu, A.A.; Jagboro, G.O. The effects of construction delays on project delivery in Nigerian construction industry. Int. J. Proj. Manag. 2002, 20, 593–599. [Google Scholar] [CrossRef] [Scilit]
- Rani, H.A.; Farouk, A.M.; Anandh, K.S.; Almutairi, S.; Rahman, R.A. Impact of COVID-19 on Construction Projects: The Case of India. Buildings 2022, 12, 762. [Google Scholar] [CrossRef] [Scilit]
- Project Management Institute. Practice Standard for Scheduling, 3rd ed.; Project Management Institute: Newtown Square, PA, USA, 2019. [Google Scholar]
- Mubarak, S.A. Construction Project Scheduling and Control, 4th ed.; John Wiley & Sons: Hoboken, NJ, USA, 2019. [Google Scholar]
- Vanhoucke, M. Project Management with Dynamic Scheduling: Baseline Scheduling, Risk Analysis and Project Control; Springer: Berlin/Heidelberg, Germany, 2012. [Google Scholar] [CrossRef] [Scilit]
- AACE International. Integrated Cost and Schedule Risk Analysis Using Risk Drivers and Monte Carlo Simulation of a CPM Model; Recommended Practice No. 57R-09; AACE International: Morgantown, WV, USA, 2019. [Google Scholar]
- Khodabakhshian, A.; Puolitaival, T.; Kestle, L. Deterministic and probabilistic risk management approaches in construction projects: A systematic literature review and comparative analysis. Buildings 2023, 13, 1312. [Google Scholar] [CrossRef] [Scilit]
- Koulinas, G.K.; Xanthopoulos, A.S.; Tsilipiras, T.T.; Koulouriotis, D.E. Schedule delay risk analysis in construction projects with a simulation-based expert system. Buildings 2020, 10, 134. [Google Scholar] [CrossRef] [Scilit]
- Herroelen, W.; Leus, R. Project scheduling under uncertainty: Survey and research potentials. Eur. J. Oper. Res. 2005, 165, 289–306. [Google Scholar] [CrossRef] [Scilit]
- Hulett, D. Practical Schedule Risk Analysis, 1st ed.; Routledge: London, UK, 2009. [Google Scholar] [CrossRef] [Scilit]
- Chen, L.; Lu, Q.; Han, D. A Bayesian-driven Monte Carlo approach for managing construction schedule risks of infrastructures under uncertainty. Expert Syst. Appl. 2023, 212, 118810. [Google Scholar] [CrossRef] [Scilit]
- Ichsan, M.; Isvara, W.; Karim, S. Monte Carlo simulation for enhancing the schedule completion forecast of Jakarta Central Railway Station construction project. Appl. Sci. 2025, 15, 7464. [Google Scholar] [CrossRef] [Scilit]
- Song, Y.; Vanhoucke, M. Schedule risk analysis for project control with risk interactions. Ann. Oper. Res. 2025. [Google Scholar] [CrossRef] [Scilit]
- Vaseghi, F.; Vanhoucke, M. Probabilistic optimization of corrective actions for project deadline adherence in projects with stochastic activity durations. Ann. Oper. Res. 2026. [Google Scholar] [CrossRef] [Scilit]
- Chen, Y.; Yao, F.; Zhuang, T. Deciphering the risk of area-wide coordinated urban regeneration in Chinese small cities from the project portfolio perspective: A case study of Yancheng. Buildings 2025, 15, 983. [Google Scholar] [CrossRef] [Scilit]
- Candas, E.; Flacke, J.; Yomralioglu, T. Understanding urban regeneration in Turkey. Int. Arch. Photogramm. Remote Sens. Spat. Inf. Sci. 2016, XLI-B4, 669–675. [Google Scholar] [CrossRef] [Scilit]
- Ay, D.; Penpecioglu, M. Politics of ‘waiting for transformation’ in protracted urban renewal projects in Turkey. Environ. Plan. C Polit. Space 2024, 42, 1026–1044. [Google Scholar] [CrossRef] [Scilit]
- Republic of Türkiye. Law No. 6306 on the Transformation of Areas under Disaster Risk. In Official Gazette of the Republic of Turkey No. 28309; Republic of Türkiye: Ankara, Turkey, 2012. (In Turkish) [Google Scholar]
- Republic of Türkiye; Ministry of Environment and Urbanization. Regulation on the Implementation of Law No. 6306. In Official Gazette of the Republic of Turkey No. 28498; Republic of Türkiye: Ankara, Turkey, 2012. (In Turkish) [Google Scholar]
- Uysal Gezer, A.N.; İnce, H.H. Examination of the Amendments to the Urban Transformation Law after the 6 February 2023 Kahramanmaraş Earthquakes; Innovations, Implementation Process. Turk. J. Earthq. Res. 2024, 6, 420–433. [Google Scholar] [CrossRef] [Scilit]
- Presidency of the Republic of Türkiye. Presidential Decree No. 153 Amending Certain Presidential Decrees. In Official Gazette of the Republic of Turkey No. 32341; Republic of Türkiye: Ankara, Turkey, 2023. (In Turkish) [Google Scholar]
- Republic of Türkiye. Law No. 7471 on Amendments to the Law on Transformation of Areas under Disaster Risk and Certain Laws and Decree Law No. 375. In Official Gazette of the Republic of Turkey No. 32364; Republic of Türkiye: Ankara, Turkey, 2023. (In Turkish) [Google Scholar]
- Kentsel Dönüşüm Başkanlığı. Riskli Yapı Süreci. Available online: https://kdb.gov.tr/Mevzuat?uniq=c6db6650-9348-42dd-bffe-6ab4977787cf (accessed on 4 September 2026). (In Turkish)
- Vanhoucke, M. Using activity sensitivity and network topology information to monitor project time performance. Omega 2010, 38, 359–370. [Google Scholar] [CrossRef] [Scilit]
- Tian, Y.; Chen, Y.; Ning, Y. Identifying and predicting delay risks in prefabricated construction: An explainable ensemble learning approach. Adv. Eng. Inform. 2026, 71, 104219. [Google Scholar] [CrossRef] [Scilit]
- Cho, M.; Park, M.; Park, J.; Park, S.-K.; Cha, G.; Park, S. From prediction to prioritization: Automated framework for delay risk management in highway earthwork projects. Autom. Constr. 2026, 181, 106588. [Google Scholar] [CrossRef] [Scilit]
- Kelley, J.E., Jr.; Walker, M.R. Critical-path planning and scheduling. In Proceedings of the December 1–3, 1959, Eastern Joint IRE-AIEE-ACM Computer Conference; Association for Computing Machinery: New York, NY, USA, 1959; pp. 160–173. [Google Scholar] [CrossRef] [Scilit]
- Kelley, J.E., Jr. Critical-path planning and scheduling: Mathematical basis. Oper. Res. 1961, 9, 296–320. [Google Scholar] [CrossRef] [Scilit]
- Ward, S.; Chapman, C. Transforming project risk management into project uncertainty management. Int. J. Proj. Manag. 2003, 21, 97–105. [Google Scholar] [CrossRef] [Scilit]
- Atkinson, R.; Crawford, L.; Ward, S. Fundamental uncertainties in projects and the scope of project management. Int. J. Proj. Manag. 2006, 24, 687–698. [Google Scholar] [CrossRef] [Scilit]
- Perminova, O.; Gustafsson, M.; Wikström, K. Defining uncertainty in projects—A new perspective. Int. J. Proj. Manag. 2008, 26, 73–79. [Google Scholar] [CrossRef] [Scilit]
- Malcolm, D.G.; Roseboom, J.H.; Clark, C.E.; Fazar, W. Application of a technique for research and development program evaluation. Oper. Res. 1959, 7, 646–669. [Google Scholar] [CrossRef] [Scilit]
- Cottrell, W.D. Simplified Program Evaluation and Review Technique (PERT). J. Constr. Eng. Manag. 1999, 125, 16–22. [Google Scholar] [CrossRef] [Scilit]
- Elmaghraby, S.E. On criticality and sensitivity in activity networks. Eur. J. Oper. Res. 2000, 127, 220–238. [Google Scholar] [CrossRef] [Scilit]
- Hajdu, M. Effects of the application of activity calendars on the distribution of project duration in PERT networks. Autom. Constr. 2013, 35, 397–404. [Google Scholar] [CrossRef] [Scilit]
- Hajdu, M.; Bokor, O. Sensitivity analysis in PERT networks: Does activity duration distribution matter? Autom. Constr. 2016, 65, 1–8. [Google Scholar] [CrossRef] [Scilit]
- Wuni, I.Y. Developing a multidimensional risk assessment model for sustainable construction projects. Eng. Constr. Archit. Manag. 2025, 32, 4155–4173. [Google Scholar] [CrossRef] [Scilit]
- Tian, K.; Zhu, Z.; Mbachu, J.; Moorhead, M.; Ghanbaripour, A. Artificial intelligence in construction risk management: A decade of developments, challenges, and integration pathways. J. Risk Res. 2025, 28, 1078–1110. [Google Scholar] [CrossRef] [Scilit]
- Demir, S.; Sarıışık, G.; İlhan, N. Measuring the Performance Impact of Industry 4.0 in Manufacturing SMEs: An Integrated MPI–Explainable Machine Learning Framework. Systems 2026, 14, 833. [Google Scholar] [CrossRef] [Scilit]
- Şenol, H.I.; Sarıışık, G. A Multidimensional Traffic Accident Causation Index for Severity Modeling Using Explainable Machine Learning. Systems 2026, 14, 282. [Google Scholar] [CrossRef] [Scilit]
- O’Hagan, A.; Buck, C.E.; Daneshkhah, A.; Eiser, J.R.; Garthwaite, P.H.; Jenkinson, D.J.; Oakley, J.E.; Rakow, T. Uncertain Judgements: Eliciting Experts’ Probabilities; John Wiley & Sons: Chichester, UK, 2006. [Google Scholar] [CrossRef] [Scilit]
- Morgan, M.G. Use (and abuse) of expert elicitation in support of decision making for public policy. Proc. Natl. Acad. Sci. USA 2014, 111, 7176–7184. [Google Scholar] [CrossRef] [Scilit] [PubMed]
- Cooke, R.M. Experts in Uncertainty: Opinion and Subjective Probability in Science; Oxford University Press: New York, NY, USA, 1991. [Google Scholar] [CrossRef] [Scilit]
- MacCrimmon, K.R.; Ryavec, C.A. An Analytical Study of the PERT Assumptions. Oper. Res. 1964, 12, 16–37. [Google Scholar] [CrossRef] [Scilit]
- Herrerías-Velasco, J.M.; Herrerías-Pleguezuelo, R.; van Dorp, J.R. Revisiting the PERT Mean and Variance. Eur. J. Oper. Res. 2011, 210, 448–451. [Google Scholar] [CrossRef] [Scilit]
- van Dorp, J.R.; Duffey, M.R. Statistical dependence in risk analysis for project networks using Monte Carlo methods. Int. J. Prod. Econ. 1999, 58, 17–29. [Google Scholar] [CrossRef] [Scilit]
- Williams, T. Towards realism in network simulation. Omega 1999, 27, 305–314. [Google Scholar] [CrossRef] [Scilit]
- Kurt-Özman, E.; Tasan-Kok, T. Community politics in urban regeneration under authoritarian entrepreneurial governance. Urban Stud. 2025, 62, 2935–2955. [Google Scholar] [CrossRef] [Scilit]
- Farouk, A.M.; Rahman, R.A. Integrated applications of building information modeling in project cost management: A systematic review. J. Eng. Des. Technol. 2025, 23, 287–305. [Google Scholar] [CrossRef] [Scilit]
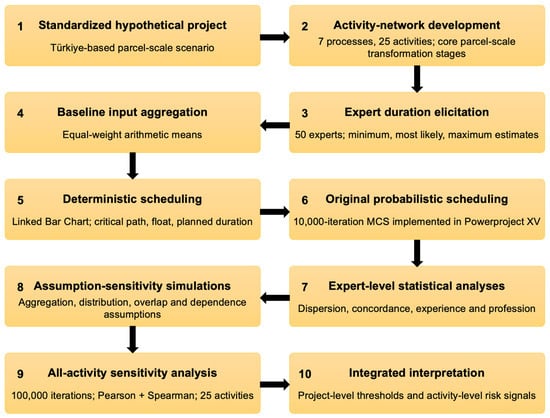
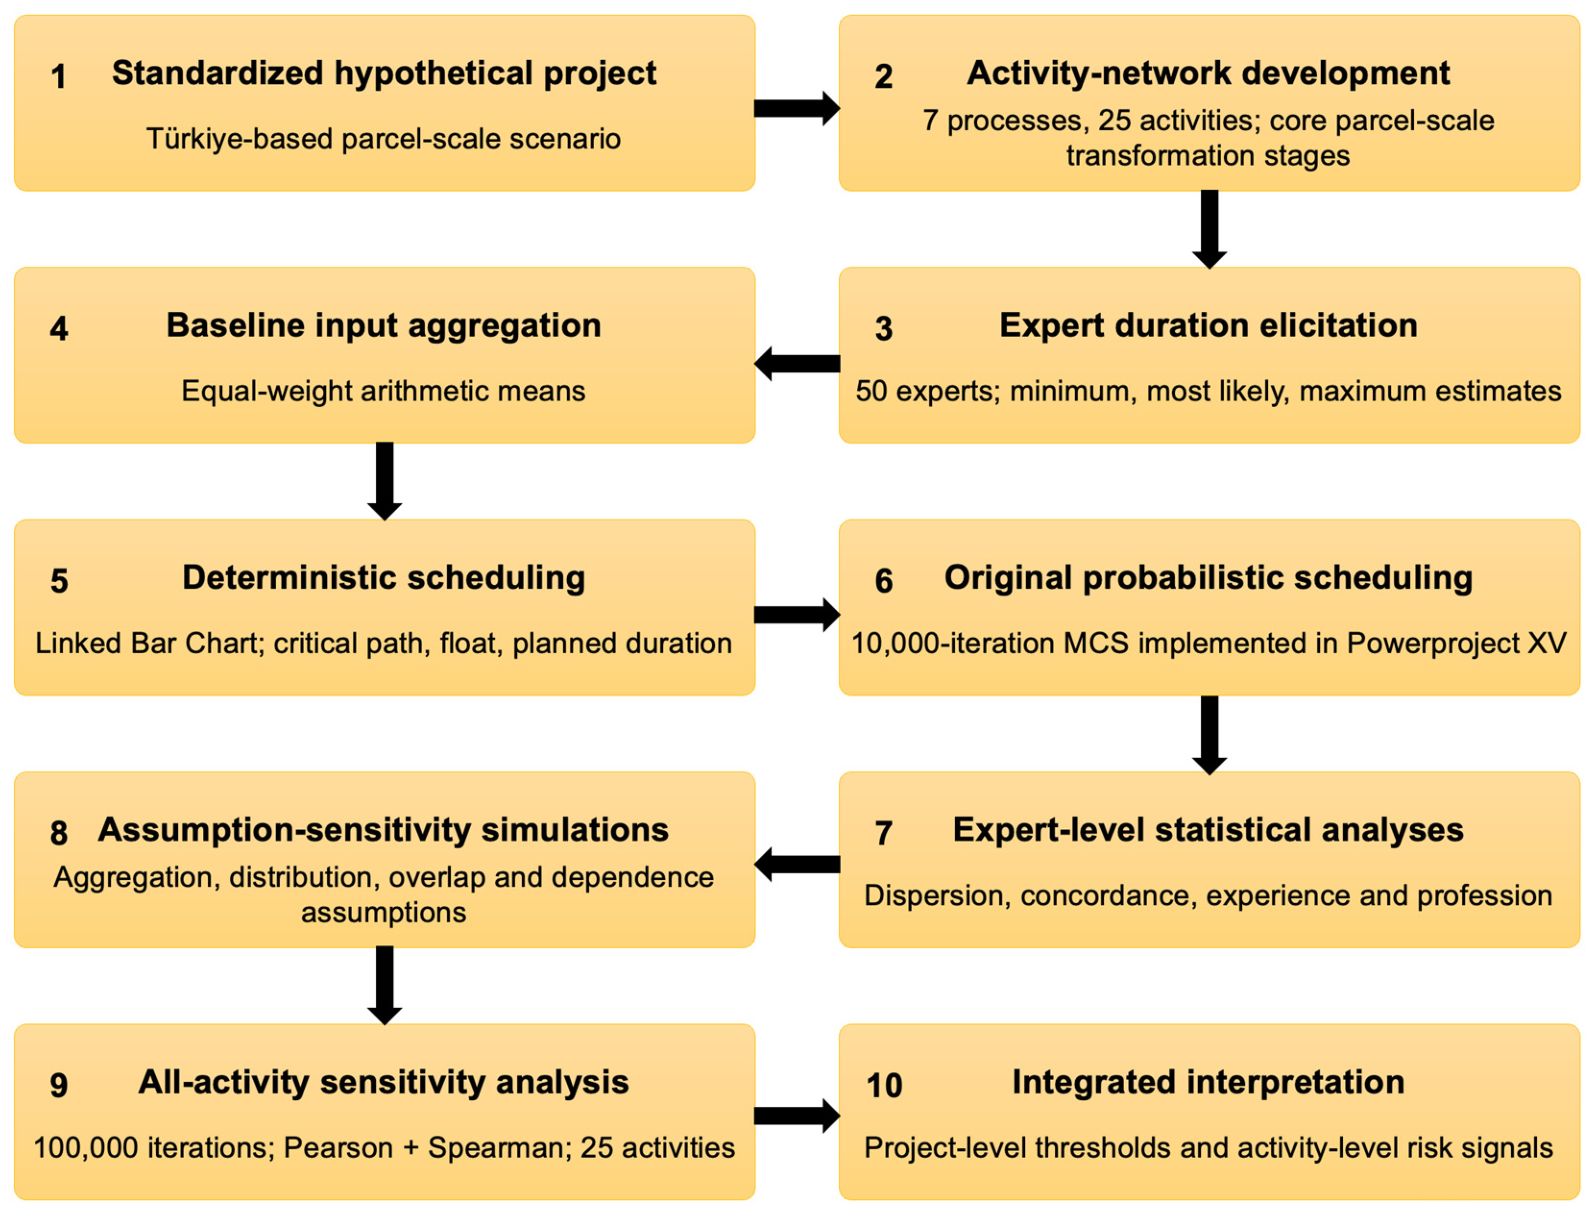
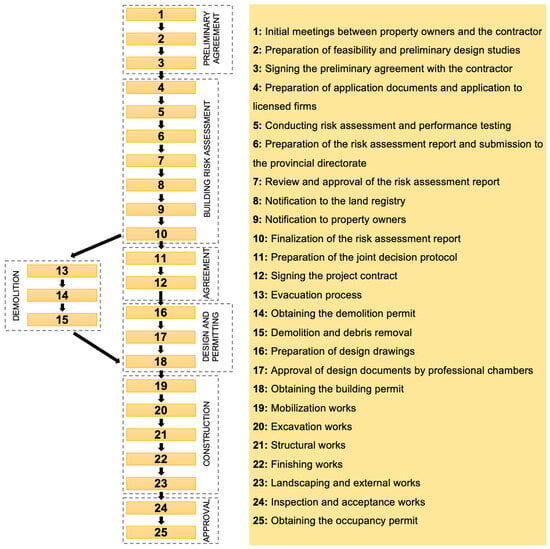
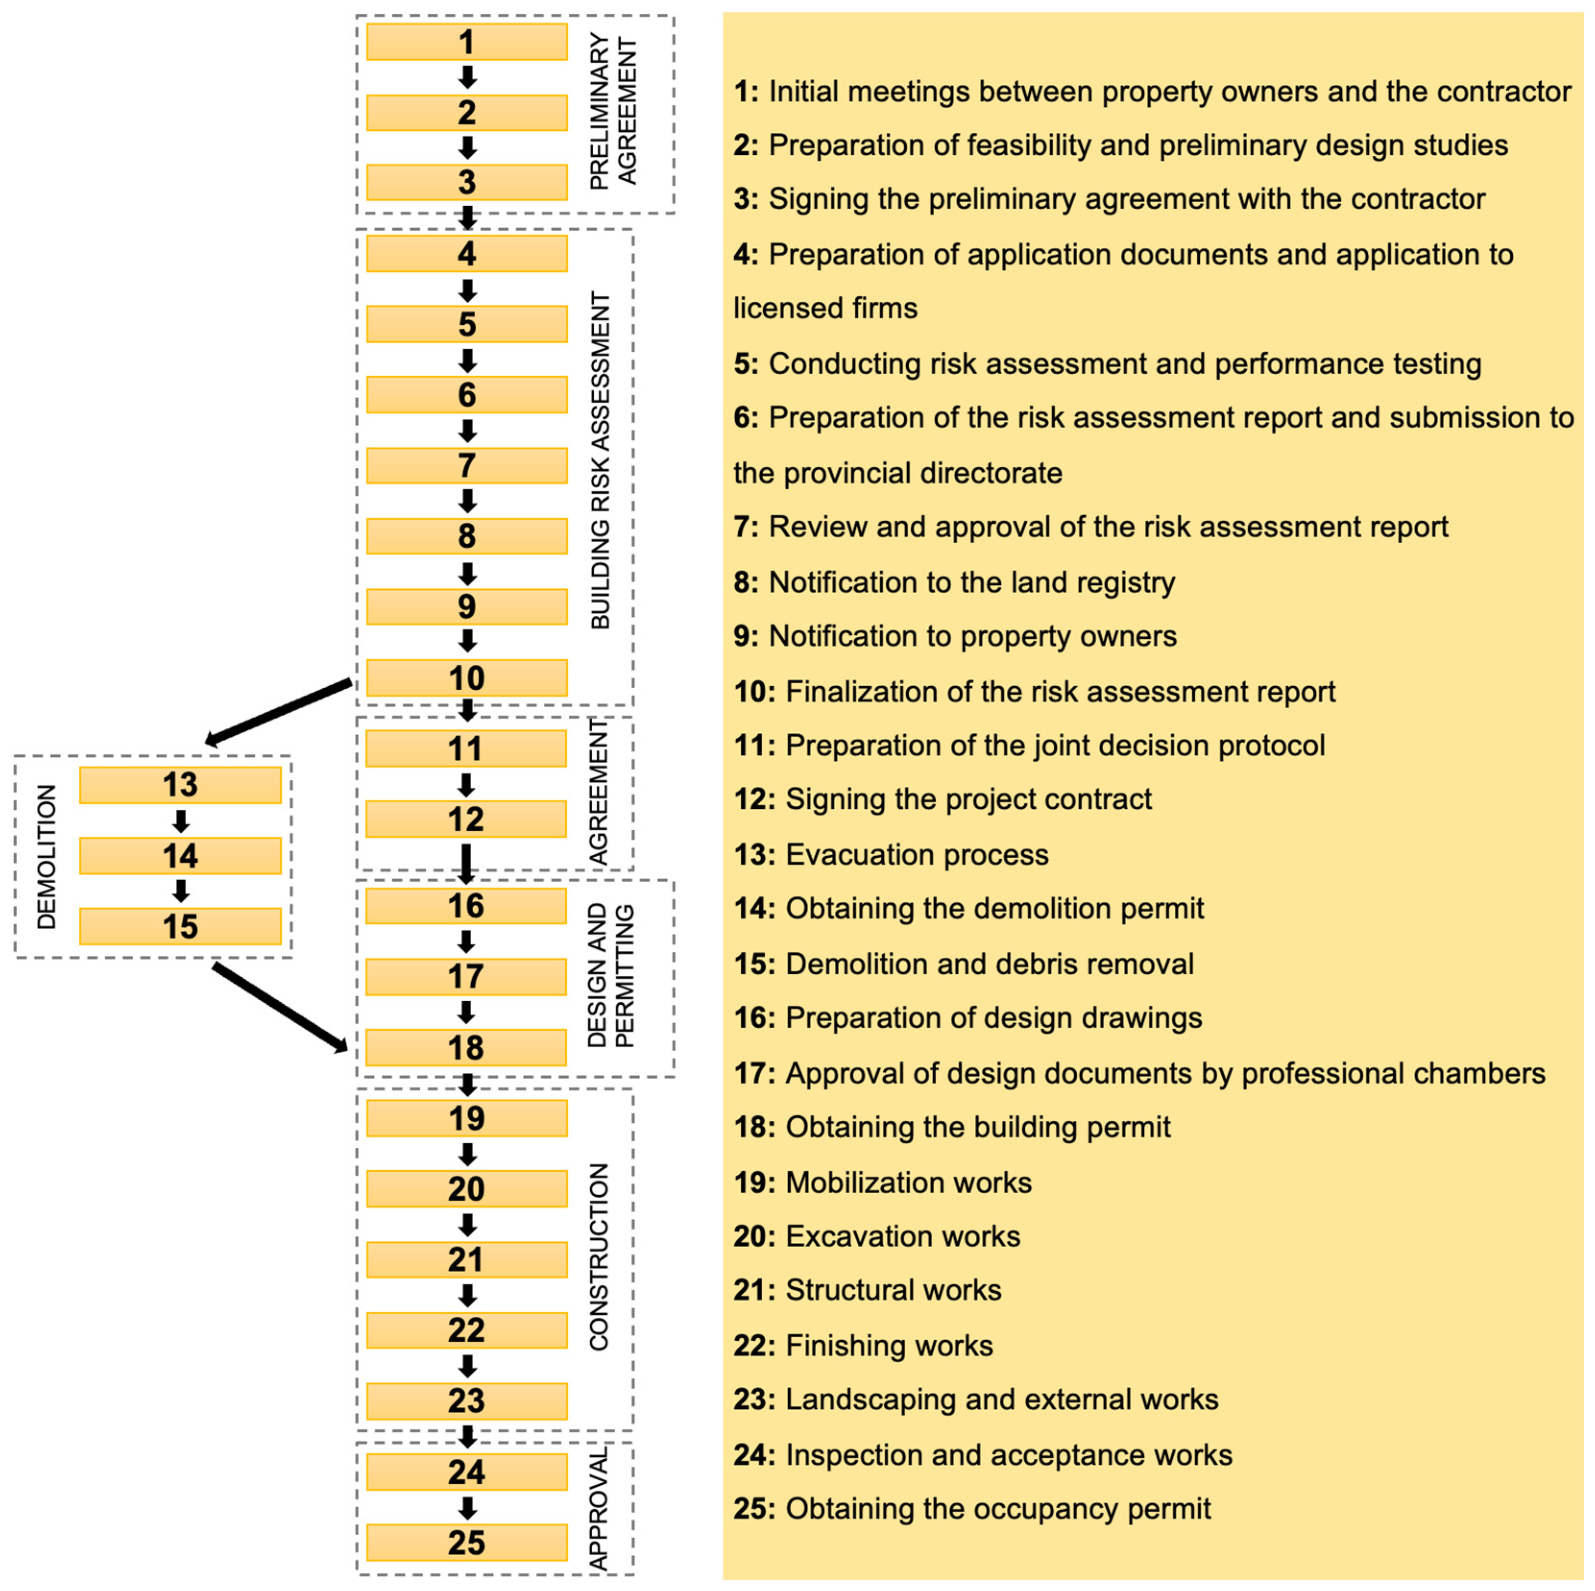
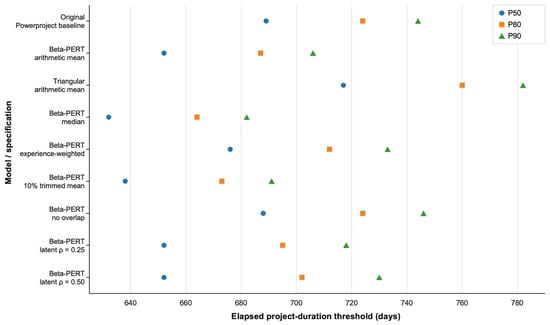
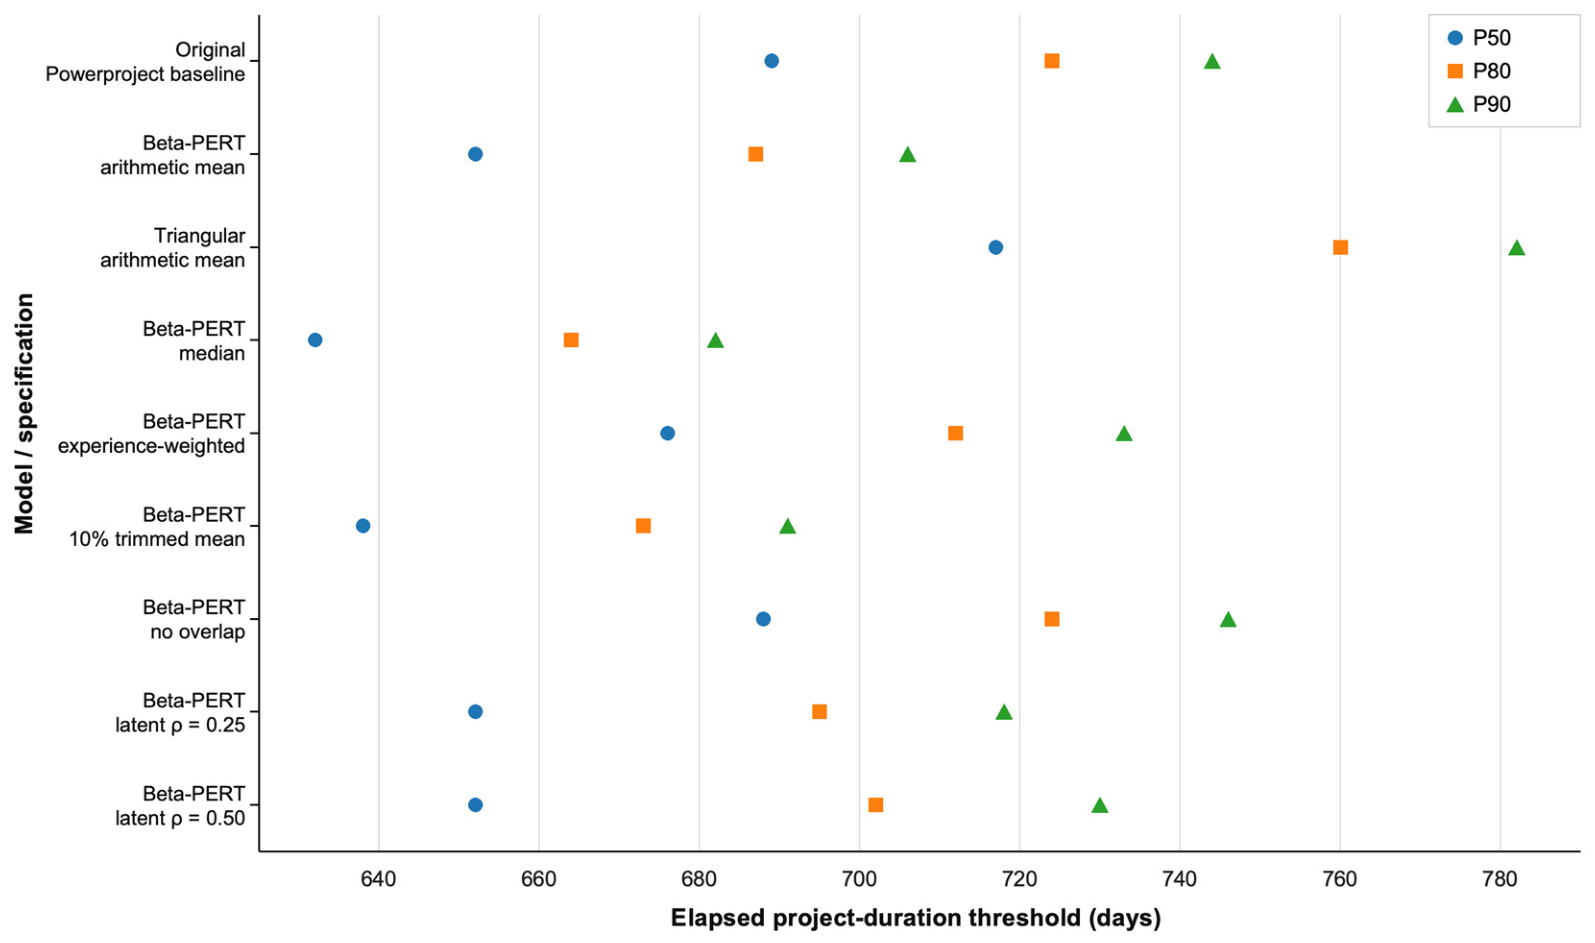
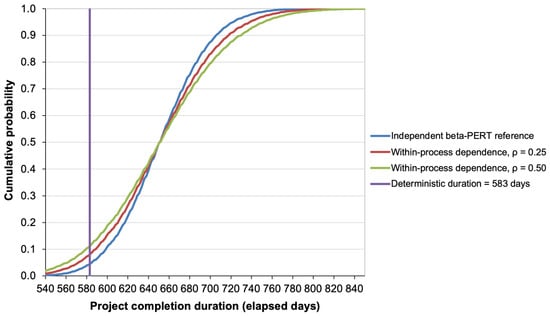
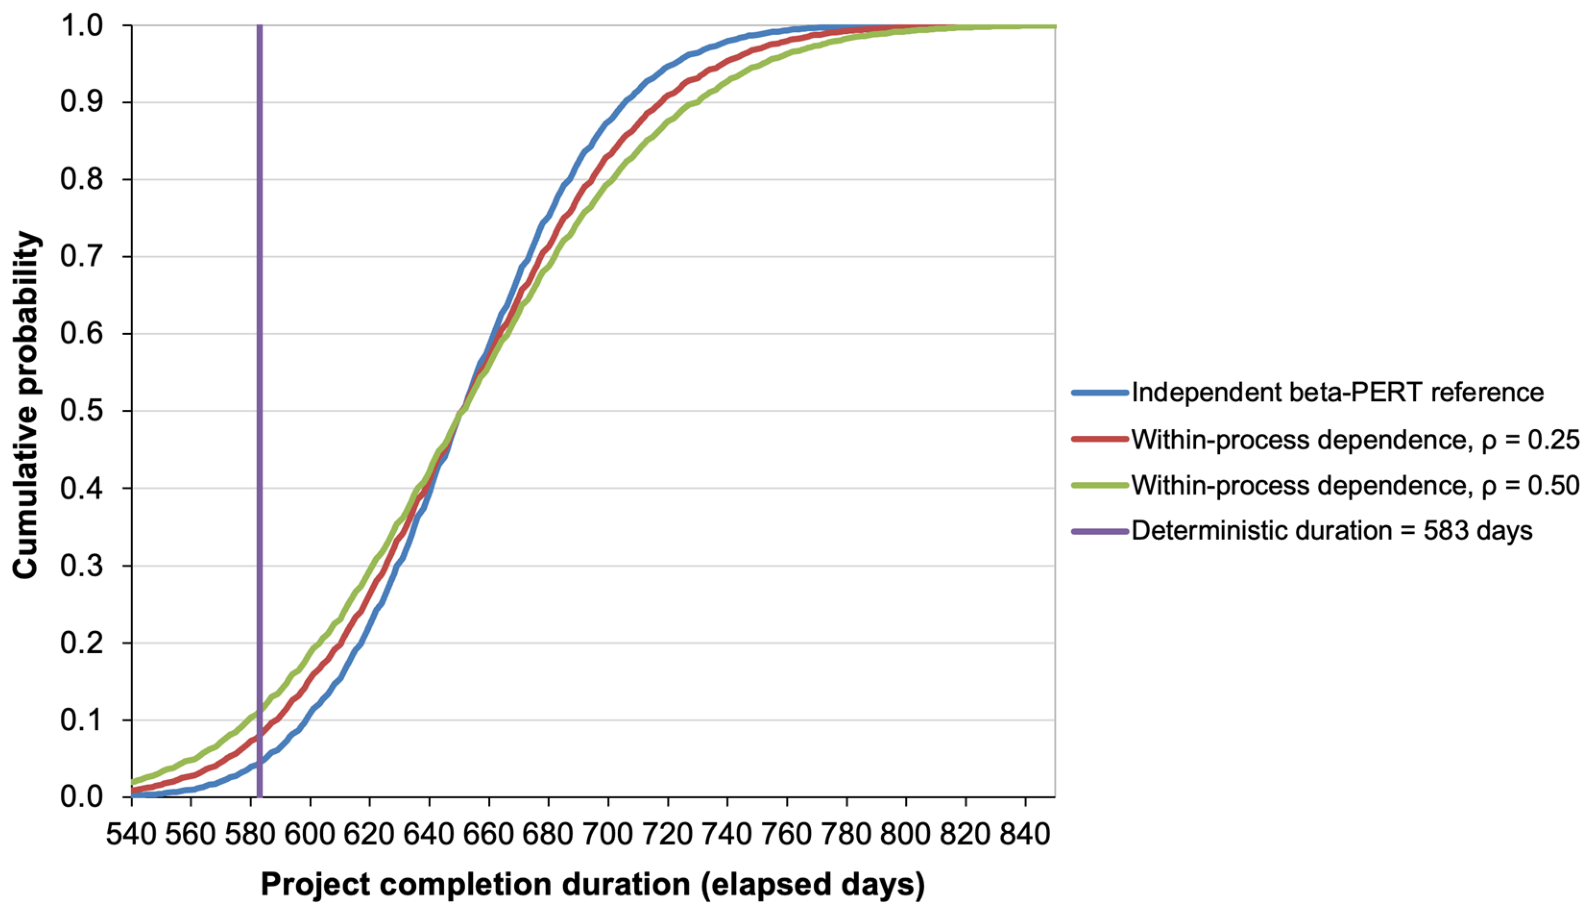

Disclaimer/Publisher’s Note: The statements, opinions and data contained in all publications are solely those of the individual author(s) and contributor(s) and not of MDPI and/or the editor(s). MDPI and/or the editor(s) disclaim responsibility for any injury to people or property resulting from any ideas, methods, instructions or products referred to in the content. |
© 2026 by the authors. Licensee MDPI, Basel, Switzerland. This article is an open access article distributed under the terms and conditions of the Creative Commons Attribution (CC BY) license.