


Abstract
Accelerating residential building decarbonization is pivotal for China’s carbon neutrality, yet mitigating regional inequalities necessitates localized assessments. To this end, in this study, a stock turnover model is employed to evaluate the spatiotemporal evolution and technoeconomic feasibility of decarbonizing space cooling equipment in China’s urban and rural residential buildings: (1) Urban and rural cooling-related carbon dioxide (CO2) emissions peak in 2022 at 87.2 and 35.9 megatons of carbon dioxide (MtCO2), respectively. (2) Rural cooling energy consumption is projected to peak at 78.0 TWh in 2026, trailing the urban sector by four years, highlighting spatiotemporal decoupling. (3) Decarbonization investments and their benefits exhibit a nonlinear relationship, demonstrating pronounced spatial polarization across climate zones, with the highest decarbonization benefit reaching 86.0 billion CNY in Guangdong Province, whereas carbon-intensive central regions face significant short-term economic deficits. (4) Upgrading urban split air conditioners (ACs) offers a highly viable transition pathway, expected to cumulatively decrease by 142.9 MtCO2 between 2025 and 2060. Overall, this framework establishes a scientific baseline for policymakers to design equitable and cost-effective mitigation strategies within the cooling sector.
1. Introduction
The operational phase of residential buildings has long been recognized as a persistent and substantial source of global carbon emissions [1,2]. The increasing demand for space cooling in the residential sector has emerged as a critical driver of worldwide energy consumption, significantly exacerbating the challenges of greenhouse gas mitigation. In China, accelerating the deep decarbonization of the residential building sector is imperative for closing the emission mitigation gap and achieving the national carbon neutrality vision by 2060 [3,4]. Given the vast geographical expanse, it is crucial to implement localized low-carbon strategies for cooling equipment across diverse regions. However, uniform policy frameworks may not fully reflect spatial differences across climate zones or economic differences between urban and rural areas. Recent studies on the echelon peaking paths of provincial building carbon emissions have demonstrated that recognizing these spatial and temporal constraints is a fundamental prerequisite for effective policymaking [5]. Consequently, formulating regionally differentiated transition strategies and optimizing targeted capital subsidies for residential cooling are crucial for facilitating an equitable and robust net-zero transition [6].
An increasing number of studies have explored historical trends in building energy consumption, space cooling demand, and potential emission reduction pathways [7,8], providing valuable guidance for controlling operational carbon emissions [9,10]. For instance, recent global tracking efforts have systematically evaluated the historical transition of operational carbon in residential buildings since the millennium [11], whereas other scholars have further elucidated the unique decarbonization patterns and ambitions within major developing nations such as China [12]. Nevertheless, cooling equipment decarbonization pathways vary across regions and are also shaped by demographic changes [13]. Furthermore, recent academic discussions have examined how regional differences may influence the evolution of residential building operations [14].
Significant regional heterogeneity and a pronounced “urban–rural dual structure” have led to highly uneven spatiotemporal distributions of cooling demand and equipment adoption [15,16]. The influence of these variations on the technoeconomic feasibility of decarbonization remains largely unclear [17]. While recent studies have evaluated the macroscopic costs and co-benefits of room air-conditioner efficiency standards [18,19], conventional assessments often fail to fully integrate dynamic equipment turnover with granular technoeconomic evaluations across diverse climate zones and the urban–rural divide. The following issues are covered in this study to help fill these gaps.
- •
- How will the stock and carbon emissions of cooling equipment evolve across the urban–rural divide?
- •
- How do cooling decarbonization costs and benefits vary by climate zone?
- •
- What are the technoeconomic feasibility and decarbonization potential of the various measures?
To address these challenges, this study employs dynamic scenario analysis to examine the carbon emissions associated with cooling equipment during the operational phase of residential buildings in China. By integrating building and cooling equipment stock turnover models, a bottom-up analytical framework for energy consumption and carbon emissions under business-as-usual (BAU) and decarbonization scenarios is constructed. An economic quantification system rooted in engineering economics is subsequently developed to evaluate the cost-effectiveness of individual energy efficiency and decarbonization measures, utilizing key metrics such as net present value (NPV) and the cost of conserved carbon (CCC).
The scientific novelty of this study lies in its comprehensive quantification of the long-term evolutionary trajectories of cooling equipment within urban and rural residential buildings across 30 provinces in China from 2000 to 2070. This analysis systematically illuminates the spatial–temporal decoupling features across the urban–rural divide, elucidating a significant structural transition in residential cooling from “rapid single-unit proliferation” to “high-efficiency system integration”.
Furthermore, by assessing individual decarbonization measures at the provincial scale, this study identifies urban–rural differences in technoeconomic feasibility and regional variations in cost-effectiveness. Ultimately, the scientific value of this framework is demonstrated by delivering a robust evaluation of economic viability and mitigation potential across various deep decarbonization pathways, overcoming the limitations of conventional spatially aggregated macro-models and establishing a granular scientific baseline for navigating the complex low-carbon transition in the residential sector.
The remaining structure of this study is organized as follows: Section 2 provides an overview of the literature. Section 3 details the integrated stock turnover model and the economic evaluation methods. Section 4 reveals the dynamic evolutionary trajectories of building floor areas and cooling equipment carbon emissions. Section 5 delves into the investment costs and decarbonization benefits of cooling equipment, the provincial-level cost-effectiveness analysis of individual measures, and the optimization of regional carbon mitigation strategies. Finally, Section 6 summarizes the primary conclusions of this study.
2. Literature Review
The accurate quantification of building energy consumption and carbon emissions serves as a core foundation for addressing the global net-zero challenge and advancing carbon mitigation in the building sector [20]. It is highly important for mapping historical reduction pathways and projecting future carbon peaks [21,22]. Existing studies have developed primarily three categories of methodological frameworks for carbon accounting [23,24]. The bottom-up methodology enables granular analysis. Taniguchi-Matsuoka et al. [25] developed an end-use energy simulation model for Japanese residential buildings to identify key policy levers. Na and Wang [26] integrated a Bayesian approach with an urban-scale energy model for Beijing, reducing heating energy consumption calibration errors by more than 30% and increasing accounting accuracy. Conversely, the top-down approach focuses on macroscale correlations, leveraging data availability for long-term forecasting. Zhang et al. [27] created the GLOBUS dynamic building stock turnover model, providing the first multiscale estimation of global building stock and energy consumption (2000–2070). It forecasts a peak in global building stock approximately in 2050, aiding coordinated international action. However, its reliance on macroscale statistical data limits its ability to reflect individual building-level variations, reducing its utility in granular energy-efficiency retrofit assessments. Coupling both methodologies addresses their respective limitations. Collectively, research has formed a comprehensive, methodology-integrated technical framework spanning micro to macro scales, offering robust support for the development of energy consumption accounting and emission reduction policy formulation.
Building floor area and stock serve as the fundamental basis for evaluating the emission mitigation potential of a sector [28,29,30]. To date, researchers worldwide have extensively studied the quantification of building floor area and stock, identifying critical knowledge gaps and research priorities [31]. Such quantification relies on the top-down method, the bottom-up method, and their integration, which differ in terms of data sources, applicability, and accuracy [32]. The top-down approach provides a macroscale framework [31], whereas the bottom-up approach emphasizes microscale precision via high-resolution data integration [33]. The integration of both approaches has become mainstream and involves the use of data-driven techniques to balance macro trends with microscale data fidelity [34]. Accurate residential end-use equipment stock accounting is critical for assessing deep decarbonization measures. The mainstream methods for equipment stock accounting include the archetype building configuration method [35,36], survey-based statistical extrapolation [37], and dynamic stock turnover model simulation [7]. In contrast, top-down approaches indirectly reflect efficiency trends via macro parameters such as energy intensity and technological progress [38].
Cooling energy consumption accounts for a significant proportion of total energy use, particularly in hot climate regions and during summer peak load periods. Its energy-saving potential and carbon reduction effects have therefore drawn considerable attention [39]. In recent years, studies on decarbonization pathways for residential space cooling in emerging economies have further demonstrated the immense challenges and opportunities between meeting cooling demands and achieving decarbonization goals in the 21st century [40]. From a technological perspective, comprehensively advancing end-use electrification in residential buildings is regarded as an inevitable path to realizing global carbon neutrality [41]. Existing research on single-measure energy savings and carbon reduction for cooling end uses focuses primarily on two pathways: enhancing building envelope performance to reduce the cooling load [42] and integrating renewable energy to enable a low-carbon cooling supply [43]. In terms of cost-effectiveness, studies typically employ life-cycle cost (LCC) and carbon reduction cost for evaluation. The economic viability of building envelope retrofits is influenced by the building type, climate zone, and material price, which often prove more cost-effective when integrated into a comprehensive energy-saving retrofit [44]. The feasibility of renewable energy systems depends on local resources, technology maturity, and policy support. In regions with abundant solar radiation, photovoltaic (PV) cooling systems have already achieved cost competitiveness [45].
Existing research has established a foundation for measuring energy consumption in cooling end-use equipment, assessing single-technology cost-effectiveness, and conducting macroscale stock prediction. In terms of provincial-level carbon management, existing studies have begun to evaluate the provincial carbon budgets of residential buildings to advance the achievement of net-zero targets [46]. However, macroscale stock turnover models and microscale simulations of equipment usage behavior lack dynamic coupling, causing forecasts to misalign with short-term load responses and evolving user habits. Furthermore, recent studies have examined how regional differences may influence the evolution of operational carbon emissions in residential buildings [14]. However, research on how cooling demands, equipment accessibility, and technology choices vary across climate zones and the urban–rural divide is insufficient. This limits the usefulness of generalized findings for local differentiated equipment upgrading and subsidy policies [47].
To address the above gaps, this study conducts region- and type-specific scenario analyses to capture the pronounced heterogeneity in cooling demand and technology choices across different climate zones and urban and rural residential areas. By explicitly accounting for climatic conditions, housing characteristics, and socioeconomic attributes, this study examines how cooling energy use patterns and the adoption of low-carbon cooling technologies vary among regions and urban and rural sectors across different climate zones. In particular, the analysis incorporates differentiated cooling service demand, equipment efficiency levels, and technology accessibility to explore diversified decarbonization pathways, thereby providing a more nuanced understanding of regionally and socially differentiated strategies for reducing cooling-related carbon emissions in the residential-building sector.
This study not only elucidates the pronounced regional heterogeneity and social differentiation in the cooling-related energy consumption and carbon emissions of residential buildings but also provides a quantitative basis for evaluating diversified decarbonization pathways arising from the synergistic deployment of high-efficiency cooling technologies, building envelope retrofits, and renewable energy systems such as rooftop PVs. In doing so, it offers robust scientific support for the design of place-specific and regionally differentiated mitigation policies and subsidy schemes targeting residential cooling decarbonization.
3. Materials and Methods
This study employed dynamic scenario analysis to examine the carbon emissions associated with cooling equipment during the operational phase of residential buildings in China. To provide an intuitive overview of the study’s logical framework, Figure 1 depicts the interconnections among the methods, the definitions of the research variables, the key findings, and the subsequent discussion.
Figure 1.
Framework of this study.
3.1. Building a Stock Turnover Model
The building stock turnover model is based on the premise that the scale and structure of the building stock were determined by historical construction and demolition activities. Owing to the long lifespan of buildings, these past decisions continue to influence the future. The model consisted of three components: stock (existing buildings), inflow (new construction), and outflow (demolition).
To assess policy impacts, two scenarios were established in this study: the BAU scenario and the decarbonization scenario. The BAU scenario served as the baseline, with an average building lifespan of 35 years and large-scale demolition and reconstruction continuing. It should be explicitly noted that these two scenarios are not probabilistic forecasts predicting exact future outcomes. Instead, they are policy-driven political constructions designed to explore the boundaries of potential carbon mitigation trajectories under varying degrees of policy intervention. The decarbonization scenario adopted a phased urban renewal approach to extend the average lifespan to more than 60 years. It required a slowdown in new construction, stringent enforcement of ultralow energy consumption standards, a significant acceleration in building energy efficiency retrofits, and the rapid adoption of low-carbon technologies and renewable energy. Recent advancements in bottom-up dynamic modeling have demonstrated the efficacy of tracking building inflows and outflows to evaluate such long-term carbon mitigation strategies [17]. The residential building stock turnover model can be represented by Equation (1):
where SBt, SBt−1, and NBt denote the residential building stock area in the current year, the residential building stock area of the previous year, and the newly developed area of residential buildings in the current year, respectively. DBt, RBt, and DRBt represent the area of nonrenovated residential buildings to be demolished in the current year, the renovated area of residential buildings in the current year, and the area of renovated residential buildings to be demolished in the current year, respectively.
In this study, it was assumed that the service life of residential buildings followed a normal distribution N(μ, σ2). For residential buildings constructed before 2020, the mean service life (μ) was 35 years, and the variance of the service life was μ/3 years. The buildings were demolished once their service life expired. Accordingly, in year t, the remaining stock and demolition amount of residential buildings constructed in year x can be expressed by Equation (2) and Equation (3), respectively.
The residential building stock turnover model calculation was divided into two phases [see Equation (1)]. The future phase was stock-driven, and the annual new construction area was estimated from a preset stock target [see Equation (1)]. The future residential building stock is expressed via Equation (4).
where ASt denotes the per capita floor area in year t and Pt represents the population size in year t. Accurately measuring and projecting building floorspace and stock is a fundamental prerequisite for dynamic energy modeling and has been widely recognized as a critical research priority globally [31].
3.2. Space Cooling Equipment Stock Turnover Model
The carbon emission analysis framework for residential building operation comprises two parts: the building physics system and the end-use system. The building physics system was the building envelope. Its thermal performance directly determines the energy demand for space cooling and other needs, and its turnover aligns with building stock turnover. The end-use system met various energy demands. Its model was structured into four tiers: total energy consumption and emissions, primary and secondary end-use categories, and end-use appliances. This study focused on residential cooling end-use appliances.
Under both building-stock scenarios, end-use equipment turnover accounted for installations in newly constructed buildings, periodic replacement within surviving buildings, and equipment removal upon building demolition. Newly installed equipment, including replacement equipment, was assigned the performance parameters and technology composition applicable to its installation year under the corresponding scenario. Under the BAU scenario, equipment efficiency followed the assumed historical improvement trend; under the decarbonization scenario, equipment efficiency and technology composition followed the corresponding decarbonization assumptions.
Equipment was initially installed when the associated building was constructed and was subsequently replaced according to the service-life assumptions for each equipment type while the building remained in service. Equipment reaching the end of its service life was retired and replaced, whereas building demolition terminated the associated in-service equipment stock. Equipment-cohort survival therefore depended on both equipment service life and the continued existence of the associated building, with building survival determined by Section 3.1 and Equations (2) and (3). Each replacement installation formed a new equipment cohort and was assigned the performance parameters applicable to its installation year and scenario. Transfers between buildings were not considered. The equipment stock present in 2000 was treated as the initial base-year cohort and assigned the 2000 baseline efficiency; it was subsequently subject to the equipment-replacement assumptions.
The end-use equipment stock turnover model uses the secondary end-use category as the total stock unit. By controlling the annual proportion of different equipment types and the ratio of high-efficiency devices to low-efficiency devices in this category, the model determined the stock structure and technology distribution of both the terminal equipment and the secondary end-use category.
The stock turnover model for end-use equipment can be represented by Equations (5) and (6).
In Equations (5) and (6), denotes the total in-service equipment stock of secondary end-use category a in year t. includes installations of appliance i in newly constructed buildings and replacement installations in surviving buildings, while includes equipment retired at the end of its service life and equipment removed upon building demolition. is the total inflow across appliance types in category a, and is the share of appliance i in that inflow. Replacement contributes to both equipment inflows and outflows and updates the equipment composition without necessarily increasing the total equipment stock.
The average energy efficiency of appliance i in secondary end-use category a in evaluation year t was calculated as the stock-weighted average of the efficiencies assigned to the appliance cohorts that remained in service in that year, as shown in Equation (7). The share of appliance i in category a was calculated using Equation (8).
In Equation (7), a denotes a secondary end-use category, i denotes an appliance type within category a, t denotes the evaluation year, and x denotes the equipment cohort year. The model base year is t0 = 2000. denotes the in-service stock in year t of appliance i in category a belonging to cohort x, and denotes the total in-service stock of that appliance in that category in year t. denotes the efficiency assigned to cohort x. The x = 2000 cohort represents the initial equipment stock at the model base year and is assigned the 2000 baseline efficiency; it does not imply that all equipment in this cohort was physically purchased in 2000. For x > 2000, the cohort year denotes the equipment installation year, including both initial installation in newly constructed buildings and replacement installation in surviving buildings. Replacement equipment is assigned the performance parameters applicable to year x under the corresponding scenario and contributes to the stock-weighted average efficiency only while it remains in service (see Supplementary Material S2).
Equipment performance was characterized using technology-specific metrics: air-delivery efficiency for electric fans; the seasonal energy efficiency ratio for split-type air conditioners, ducted split air conditioners, and variable refrigerant flow (VRF) systems; and the annual performance factor for air-source heat pumps (ASHPs) (see Table S7 in the Supplementary Materials).
3.3. Space Cooling-Associated Carbon Emission Assessment
This study used a Python-based annual CDD26 framework to estimate envelope-transmission-related sensible cooling-demand intensity. The calculations were implemented in Python 3.12.7. The resulting annual thermal-demand intensity was used as the cooling-demand input to Equation (9) (see Supplementary Material S1). The projections used a fixed climate baseline represented by the adopted CDD26 values. Future changes in mean temperature and extreme heat were not explicitly incorporated. The results should therefore be interpreted as projections under the specified climate baseline.
Exterior-wall and window U-values and assumed whole-building window-to-wall ratios were specified by climate zone, urban/rural sector, and construction period (see Table S4 and S5 in the Supplementary Materials). The parameter periods were 2000–2012, 2013–2025, and 2026–2070. Pre-2000 buildings were assigned the parameters of the 2000–2012 group while retaining their surviving floor area in the calculation. For 2026–2070, the U-values and window-to-wall ratios specified for 2013–2025 were held constant. The pre-2000 assignment and post-2025 carry-forward are modeling assumptions. The component-to-floor area ratios were derived from the assumed building geometry (see Supplementary Material S1).
City-level annual cooling degree-days at a base temperature of 26 °C (CDD26) were taken directly from Appendix A of JGJ/T 346—2014 [48], Standard for Weather Data of Building Energy Efficiency. The CDD26 value of each provincial capital or municipality was assigned to the corresponding region’s urban and rural residential buildings (see Table S3 in the Supplementary Materials). The 26 °C threshold denotes the outdoor-temperature base for CDD26, rather than an indoor thermostat setpoint; no indoor setpoint was specified. CDD26 accumulates positive differences between daily mean outdoor dry-bulb temperatures and the base temperature, but the adopted annual values do not identify specific cooling dates. Accordingly, no fixed calendar cooling period or hourly occupancy, lighting, or air-conditioning schedules were specified. Air infiltration and internal heat gains were not included as separate model inputs (see Table S6, S8 and S9 in the Supplementary Materials). Cooling-demand intensity was calculated from CDD26, wall and window U-values, and component-to-floor area ratios. Each province used annual national surviving-floor-area shares for its corresponding urban or rural sector to weight construction-period intensities. No additional adjustment factors were applied (see Supplementary Material S1).
With respect to end-use systems, this study focused primarily on the energy consumption and indirect electricity-related carbon emissions of cooling end-use equipment in residential buildings, excluding direct refrigerant emissions. High-resolution projections of energy and emissions under dynamic socioeconomic scenarios are critical for formulating targeted and robust carbon peak evaluations [13]. Space cooling in this study was categorized into two main types: electric fans and air conditioning heat pumps. The latter comprises four subtypes: split-type air conditioners (ACs), ducted split ACs, variable refrigerant flow (VRF) systems, and air source heat pumps (ASHPs). The formula for energy consumption calculation is given in Equation (9).
In the equation, s denotes the residential floor area, rcooling represents the fraction of residential floor area served by cooling, eicooling indicates the cooling demand intensity per unit residential floor area, rc represents the market share of cooling device c, and copc reflects the cooling performance coefficient of equipment type c.
Tracking the dynamic transition of operational carbon in residential buildings enables a more accurate estimation of historical emission baselines and helps identify future mitigation gaps [49]. The carbon emissions during the operational phase of residential buildings (Coperation) were calculated using Equation (10).
In the equation, eoperation,fuel denotes the amount of final energy (fuel) consumed during the operational phase of residential buildings, effuel represents the emission factor of the final energy (fuel) (kgCO2/kWh), epv indicates the electricity generated by rooftop PV systems on residential buildings, and efelectricity represents the emission factor of electricity.
The emission factor of electricity was determined by the energy mix and the share of renewable energy generation, as shown in Equation (11).
where and denote the total amount of renewable electricity generation and thermal power generation, respectively. represents the consumption of the fossil fuel n used for thermal power generation within the region, and EFn indicates the emission factor of fuel n.
3.4. Cost-Effectiveness Analysis
This study evaluates the economic feasibility and climate mitigation efficiency of individual decarbonization measures by constructing a cost-effectiveness analysis framework based on engineering economics. Key economic indicators, including NPV, IRR, and CCC, were calculated and compared for various technologies.
Unless otherwise specified, all prices and costs are evaluated with 2025 as the base year and expressed in constant CNY (see Table S1 in the Supplementary Materials).
To assess the financial payback performance of individual equipment at the micro-level, the NPV and IRR were calculated using Equation (12) and Equation (14), respectively. Furthermore, to evaluate the macroscopic decarbonization trajectories, the NPV for specific measure K (NPVK) over a time horizon from 2025 to 2060 was established using Equation (13). To quantify the unit economic cost required to mitigate one ton of CO2 emissions, the CCC was calculated using Equation (15).
where the variables and parameters are defined as follows: r is the social discount rate, set at 5%. For individual equipment evaluation, n denotes the technology service life, Bt is the annual monetized carbon-reduction and energy-saving revenue, Ct is the investment and operating cost incurred in year t, and ΔCO2,t is the physical carbon-emission reduction achieved in that year. For macroscopic evaluation, MBK(t) denotes the annual monetized economic benefit of measure K, while MCK(t) denotes its annual total cost, including replacement expenditure associated with physical equipment replacements occurring within the assessment period. Replacement expenditure is recorded in the year of the corresponding replacement event, using the applicable equipment cost. The replacement schedule used for cost accounting is consistent with the physical equipment-turnover model.
According to Equation (15), a negative CCC indicates that the total physical carbon reduction is negative, whereas a negative NPV indicates that the discounted monetized benefits are lower than the discounted costs. Under the grid emission factors and economic assumptions adopted in this study, some provinces may exhibit both negative CCC and negative measure-level NPV. These results apply to the assessed measures under the modeled conditions and should not be interpreted as universal outcomes.
Accordingly, the NPV, IRR, and CCC values reported in this study are baseline estimates conditional on a 5% social discount rate, the specified electricity-price and equipment-cost parameters, equipment service lives, modeled operating conditions, and the 2025–2060 assessment period. Alternative assumptions may change the magnitude and, in some cases, the sign of these indicators.
3.5. Data Sources
This study covered data from 30 provinces in China’s residential building sector. However, owing to the lack of relevant data, Tibet, Hong Kong, Macao, and Taiwan were not included in the analysis due to data unavailability. Given Tibet’s minimal cooling demand and the small combined floor area of the other three regions, this exclusion negligibly affects the national totals and peaking trajectories. Furthermore, it is formally stated that the administrative boundaries depicted in all maps within this manuscript are used solely for analytical and visualization purposes, and do not imply any political endorsement, expression of opinion, or official demarcation. The annual data on newly built residential floor area were sourced from the China Statistical Yearbook (available at https://www.stats.gov.cn/sj/ndsj/ (accessed on 3 January 2026)). National and provincial historical energy use data from 2000–2020 were sourced from the China Energy Statistical Yearbook (available at https://www.stats.gov.cn/english/ (accessed on 6 January 2026)). For historical terminal stock data, reference was made to the per-100-household ownership of home appliances in the China Statistical Yearbook and the Chinese Household Energy Consumption Survey Database (available at http://crecs.ruc.edu.cn/sjxz/sjsysm/index.htm (accessed on 15 January 2026)). The operational energy and carbon emissions data for residential buildings were obtained from the Global Building Emissions Database (GLOBE, available at http://globe2060.org/ (accessed on 29 December 2025)) (see Table S2 in the Supplementary Materials).
4. Results
Building on the methodological framework outlined in Section 3, this section presents three key empirical results. First, the turnover dynamics of urban and rural residential building stock across China from 2000 to 2070 were investigated under both nonrenovation and renovation scenarios. Second, the stock evolution of secondary terminal cooling equipment in these buildings over the same period was analyzed. Third, the long-term pathways of carbon emissions and energy consumption associated with residential cooling equipment nationwide are explained.
4.1. Analysis of Floor Area Stock
In this study, the residential floor area in the nonrenovation scenario accounted for both occupied and vacant buildings in urban and rural areas, whereas in the renovation scenario, vacant buildings were excluded from the floor area calculation. The evolutionary trends of residential building stock across urban and rural areas nationwide from 2000 to 2070 under both the nonrenovation scenario and the renovation scenario are shown in Figure 2.
Figure 2.
Evolution of urban and rural residential building stock in China under both the nonrenovation and renovation scenarios, 2000–2070. Panel (a): urban stock under the nonrenovation scenario; Panel (b): urban stock under the renovation scenario; Panel (c): rural stock under the nonrenovation scenario; Panel (d): rural stock under the renovation scenario.
The stock turnover results for residential buildings in urban China under both the nonrenovation scenario and the renovation scenario are presented in Figure 2a and Figure 2b, respectively. The findings indicate that China’s urban residential building stock is substantial and generally exhibits a continuous upward trajectory. Specifically, Figure 2a illustrates that under the nonrenovation scenario, the stock stood at 9.7 billion square meters in 2000, followed by a period of sustained rapid growth. It is projected to peak at 43.8 billion square meters in approximately 2058, before gradually declining to approximately 41.9 billion square meters by 2070. This sustained prepeak expansion can be attributed to ongoing rural-to-urban migration and the associated increase in per capita living space, both of which generate new housing demand across both scenarios. Conversely, the postpeak decline is driven by a combination of factors: as urbanization and per capita floor area approach saturation and demographic transitions slow population growth, the volume of new construction drops, and the demand for housing upgrades diminishes. This trend is further compounded by the natural life cycles of the buildings. The stock turnover results for urban residential buildings under the renovation scenario are shown in Figure 2b. Under this scenario, the stock stood at 9.7 billion square meters in 2000 and is projected to grow continuously, peaking at 38.5 billion square meters in approximately 2058, before gradually declining to approximately 37.0 billion square meters by 2070.
Figure 2c and Figure 2d illustrate the evolution of the rural residential building stock nationwide from 2000 to 2070 under the nonrenovation and renovation scenarios, respectively. Compared with their urban counterparts, rural residential buildings in China reach their peak stock earlier and subsequently experience a marked decline. As shown in Figure 2c, under the nonrenovation scenario, the rural residential building stock increased from 19.9 billion square meters in 2000 to a peak of 25.8 billion square meters in 2017, a period that coincided with China’s phase of accelerated urbanization. Thereafter, the rural residential stock is projected to progressively decline over the long term, reaching approximately 15.2 billion square meters by 2070. The long-term postpeak decline can be fundamentally attributed to the sustained, large-scale out-migration of the rural population coupled with the accelerated pace of population aging. The stock turnover results for rural residential buildings under the renovation scenario are shown in Figure 2d. Under this scenario, the rural residential building stock rose continuously from 19.9 billion square meters in 2000, peaked at 24.3 billion square meters in 2011, and is projected to decline steadily to approximately 14.0 billion square meters by 2070.
Overall, throughout the study period from 2000 to 2070, the dynamic evolution of China’s residential floor area stock is fundamentally synchronized with the process of population urbanization across both policy scenarios.
4.2. Characteristics of Existing Cooling Equipment
The stock evolution of the five types of cooling equipment within urban and rural residential buildings under the renovation scenario from 2000 to 2070 is shown in Figure 3. The cooling equipment examined in this study can be broadly classified into two primary categories: electric fans and air-conditioning heat pumps. The air-conditioning heat pump category encompasses four specific subcategories: split ACs, ducted split ACs, VRF systems, and ASHPs.
Figure 3.
Evolution of the stock of five types of cooling equipment in residential buildings under the renovation scenario, 2000–2070. Panel (a): urban areas; panel (b): rural areas.
The evolution of the stock of five types of cooling equipment in urban residential buildings under the renovation scenario over the period 2000–2070 is shown in Figure 3a. In urban areas, the electric fan stock increased steadily from 24.4 million units in 2000 to 1055.2 million units in 2060, with rapid early growth followed by a slowdown. This finding indicates that fans become supplementary cooling devices and are not fully replaced, reflecting a shift from single-dominant to multitype coexistence. Split AC stock follows an inverted U-shaped trajectory, peaking at 408.7 million units in 2026 and declining to 102.5 million units by 2070, signaling stock saturation and accelerated replacement.
The stock of VRF systems first increased steadily to approximately 6.3 million units in 2020; thereafter, it is projected to increase rapidly from 2021 to 2060 before eventually stabilizing. The intersection of its stock curve with that of split ACs is expected to occur in 2037, suggesting that China’s residential building cooling market will transition from an expansion phase characterized by the rapid proliferation of single-unit systems to a restructuring phase centered on system integration upgrades and the optimization of existing equipment stock. The stock trajectory of ASHPs closely mirrors that of VRF systems. The stock curve of ASHPs is projected to intersect with that of split ACs in 2042. This suggests that, within the residential building cooling sector, such high-efficiency cooling systems will gradually replace conventional split-type equipment, becoming a pivotal technological pathway to drive carbon emissions from building cooling toward their peak and subsequent deep decarbonization.
In contrast, the stock of ducted split ACs is projected to initially increase slowly but then increase steadily, peaking at approximately 137.6 million units in approximately 2050 before gradually declining to approximately 91.6 million units by 2070. This suggests that their market diffusion exhibits distinct stage-specific characteristics. During periods of new construction and large-scale renovation, ducted units are rapidly adopted because of their concealed installation and uniform air distribution. As the growth of new housing slows and more efficient cooling equipment gradually penetrates the stock replacement market, ducted units are partially displaced, entering a restructuring phase characterized by stock optimization and gradual phase-out.
In summary, the evolution of the cooling equipment stock in urban areas follows a clear trajectory: from the predominance of traditional electric fans and split ACs to the gradual adoption of high-efficiency integrated systems, such as VRF systems and ASHPs. The stock of split ACs is projected to peak in 2026, indicating that the urban cooling market will transition into a phase characterized by stock optimization and improved energy efficiency. This structural shift not only reflects the sustained influence of rising living standards on cooling demand but also indicates that, in the context of deep decarbonization, high-efficiency cooling systems are gradually replacing conventional equipment, thereby becoming a pivotal driver in achieving the peak and subsequent reduction in carbon emissions from urban building cooling.
The stock evolution of the five types of cooling equipment within rural residential buildings under the renovation scenario from 2000 to 2070 is shown in Figure 3b. In rural areas, the stock of electric fans follows an inverted U-shaped trajectory; it rose rapidly from approximately 50.0 million units in 2000 to a peak of approximately 348.4 million units in 2016 and is projected to gradually decline to approximately 333.5 million units by 2030, further decreasing to approximately 164.4 million units by 2070. This growth was particularly rapid between 2000 and 2010, with an average annual increase exceeding 21.0%. This finding indicates that while electric fans experienced rapid diffusion in the early stages as low-cost primary cooling devices, they were later relegated to auxiliary roles because of improving living standards and gradual substitution by higher-efficiency equipment such as ACs. Furthermore, the stock of split ACs in rural areas is projected to exhibit an inverted U-shaped trajectory, peaking at approximately 164.5 million units in 2028 before gradually declining to approximately 30.8 million units by 2070. Compared with their urban counterparts, this peak year lags by two years, reflecting a notable delay in their diffusion process due to constraints such as the urban–rural economic divide and infrastructure limitations.
The stock of VRF systems is projected to first increase steadily, with its curve expected to intersect with that of split ACs in 2058—approximately 21 years later than in urban areas. This delay clearly highlights the significant developmental gradient between urban and rural areas in terms of the diffusion of high-efficiency cooling technologies. Moreover, the stock trajectory of ASHPs closely mirrors that of VRF systems, with the ASHP curve projected to intersect with that of split ACs in 2054. These intersections signal the rural cooling market’s forthcoming transition from a diffusion phase dominated by conventional split ACs to a stock optimization phase centered on high-efficiency integrated systems. Overall, this suggests a shift in the cooling demand structure from basic diffusion toward greater emphasis on energy-efficiency improvements.
In contrast, the stock evolution of ducted split ACs in rural areas largely aligns with that observed in urban areas. It is projected to exhibit a pattern of slow initial growth followed by a steady increase, peaking at approximately 15.5 million units in approximately 2043, before it will gradually decline and decrease to approximately 8.9 million units by 2070. This trajectory indicates that the technological upgrading path of rural cooling systems parallels that of urban areas, albeit with a smaller market scale and a faster replacement pace.
Overall, the rural cooling equipment stock demonstrates modest growth during its early stage. However, driven by factors such as rural-to-urban migration, shrinking household sizes, and slower equipment replacement cycles, it is projected to exhibit a clear downward trend in its later stage. This trajectory indicates that rural cooling demand is shifting from volume-driven expansion toward a new phase of structural optimization and energy efficiency enhancement. Ultimately, a comparison of the evolutionary trajectories of the cooling equipment stock between urban and rural areas reveals significant urban–rural heterogeneity.
4.3. Carbon Emission Analysis of the Cooling Equipment
The long-term trends in carbon emissions from residential cooling equipment across both urban and rural sectors in China from 2000 to 2070 are shown in Figure 4. Specifically, Figure 4a and Figure 4b depict the emission trajectories of secondary terminal cooling equipment in urban and rural residential buildings, respectively. As shown in Figure 4a, urban carbon emissions from these systems tend to increase from approximately 30.4 megatons of carbon dioxide (MtCO2) in 2000 to a peak of 87.2 MtCO2 in 2022 before declining to 65.4 MtCO2 by 2025. Thereafter, these emissions are projected to follow a sustained downward trajectory, ultimately decreasing to 14.5 MtCO2 by 2070. This postpeak decline is primarily attributed to the rapid adoption of high-efficiency air conditioners and the continuous stringency of energy efficiency standards. These technological and policy advancements effectively counteract the increased cooling demand driven by rising living standards.
Figure 4.
Composition and trajectories of cooling equipment energy consumption in Chinese residential buildings, 2000–2070: panels (a,b) illustrate the carbon emission trajectories of five types of end-use cooling equipment in urban and rural residential buildings in China, respectively; panels (c,d) illustrate the energy consumption by equipment type for urban and rural sectors, respectively.
As depicted in Figure 4b, rural carbon emissions from cooling equipment experienced a progressive increase, increasing from 11.5 MtCO2 in 2000 to a peak of 35.9 MtCO2 in 2022 before decreasing to approximately 30.4 MtCO2 by 2025. Thereafter, these emissions are projected to follow a steady and sustained downward trajectory, ultimately decreasing to approximately 2.3 MtCO2 by 2070. This trajectory reflects the rapid proliferation of air conditioning in rural areas; the lagged emission peak relative to urban centers highlights the spatial transmission and diffusion of cooling demand. Furthermore, the post-2025 decline indicates that stringent energy efficiency standards and the adoption of low-carbon technologies are gradually becoming effective in these regions. Compared with urban areas, the steeper postpeak decline in rural emissions exemplifies China’s urban–rural dual structure, which is driven by systemic disparities in economic development, consumption patterns, and policy coverage depth.
The energy consumption trajectories of secondary terminal cooling equipment in urban and rural residential buildings for 2000 to 2070 are shown in Figure 4c and Figure 4d, respectively. As shown in Figure 4c, urban residential energy consumption increased steadily from approximately 45.0 TWh in 2000 to a peak of 171.9 TWh in 2022 and is projected to decline to 90.4 TWh by 2070. Conversely, Figure 4d indicates that rural cooling energy consumption increased from approximately 16.1 TWh in 2000 and is projected to peak at 78.0 TWh in 2026, and will subsequently decrease to 14.7 TWh by 2070. A comparison of these trends reveals that energy demand for cooling in urban areas peaks earlier than that in their rural counterparts.
Fundamentally, a direct causal relationship exists between the energy consumption of cooling equipment and its resulting carbon emissions. Therefore, the emissions from residential cooling systems are jointly determined by their absolute energy demand and the energy mix.
5. Discussion
Building upon the preceding analysis, this chapter examines the broader implications of these findings, specifically focusing on the capital costs and decarbonization benefits of residential cooling across urban and rural China under the designated decarbonization scenario. By evaluating the provincial-level cost-effectiveness and emission reduction potential of specific interventions, this analysis provides an evidence-based foundation for formulating tailored regional transition strategies.
5.1. Investment Costs and Energy-Saving Decarbonization Benefits of Cooling Equipment
In this study, the Qinling Mountains–Huaihe River line is employed as a geographical demarcation to categorize 30 provinces in China into northern, transitional, and southern regions. Under the decarbonization scenario, emission reduction strategies for cooling equipment are broadly classified into two technological pathways. Efficiency improvement measures optimize equipment performance through technological advancements without altering the underlying energy source, thereby reducing electricity consumption per unit of cooling demand. Conversely, energy transition measures shift the energy supply to fulfill this cooling demand from high-carbon sources to lower-carbon systems or alternative technological configurations.
Figure 5 and Figure 6 illustrate the initial unit investment costs for the five cooling equipment types under efficiency improvement and energy transition measures, respectively, for urban and rural residential buildings. These projections cover the years 2025, 2040, 2055, and 2070 across China’s northern, transitional, and southern regions under the decarbonization scenario.
Figure 5.
Initial investment cost per unit of equipment for five types of cooling equipment under efficiency improvement and energy transition measures for urban residential buildings across the northern, transitional, and southern regions of China under the decarbonization scenario. Panels (a–d) show the costs for the years 2025, 2040, 2055, and 2070, respectively.
Figure 6.
Initial investment cost per unit of equipment for five types of cooling equipment under efficiency improvement and energy transition measures for rural residential buildings across the northern, transitional, and southern regions of China under the decarbonization scenario. Panels (a–d) show the costs for the years 2025, 2040, 2055, and 2070, respectively.
The projected 2025 initial investment costs for cooling equipment in urban residential buildings across northern, transitional, and southern China under the decarbonization scenario are shown in Figure 5a. For split and ducted split ACs, costs in the southern region are marginally lower—by approximately 0.07%—than those in the other regions. Moreover, the unit costs for the ASHP and VRF systems are 554 yuan/m2 and 310.3 yuan/m2, respectively. Electric fans remain the most economical alternative, with an estimated cost of approximately 232.8 yuan per unit. In the northern region, substantial heating demands necessitate the adoption of dual-function equipment, which consequently drives up capital costs. Overall, high-efficiency technologies require greater upfront capital expenditure than conventional equipment does.
The projected initial investment costs for urban cooling equipment in 2040 and 2055 under the decarbonization scenario are shown in Figure 5b and Figure 5c, respectively. In northern urban areas, the costs of VRF systems are projected to be lower than those in the transitional and southern regions. This cost advantage stems primarily from the lower cooling design load characteristic of drier summers coupled with centralized procurement practices and policy subsidies. Notably, the projected stock curves of VRF systems and split ACs intersect in 2037, indicating a market transition from single-unit proliferation to integrated system upgrades. Conversely, the southern region has the lowest projected costs nationwide for electric fans, ASHPs, and split and ducted split ACs. With respect to split ACs, the costs associated with energy transition measures decrease gradually, whereas those driven by efficiency improvement measures increase significantly. The projected initial investment costs for urban cooling equipment in 2070 under the decarbonization scenario are shown in Figure 5d. In the transitional region, the capital costs for split ACs driven by efficiency improvement measures are projected to increase substantially—by approximately 54% relative to 2025 levels. Similarly, the costs of electric fans exhibit an even more pronounced increase, exceeding 113%. As the carbon neutrality target approaches, the widespread adoption of low-carbon cooling technologies shifts the primary drivers of regional disparities toward operation and maintenance expenses and energy pricing.
The projected initial investment costs for cooling equipment in rural residential buildings across the three climate zones in 2025 under the decarbonization scenario are shown in Figure 6a. Consistent with the urban sector, these costs are uniform across all equipment types and regions. The projected initial investment costs for rural cooling equipment in 2040 and 2055 are shown in Figure 6b and Figure 6c, respectively. By 2040, rural VRF systems in the northern region associated with energy transition measures are projected to cost 282.2 yuan/m2, a figure lower than those in other regions, before dropping further to 277.6 yuan/m2 by 2055. This cost advantage stems primarily from lower summer cooling loads and regional policy subsidies. Notably, mirroring urban trends, the costs of rural split ACs are projected to decline gradually under energy transition measures but rise sharply when driven by efficiency improvements. Although a unified national market and widespread technology diffusion help mitigate regional disparities, the urban–rural divide persists. Specifically, the peak in the rural split AC stock lags that of urban areas by two years, and the projected intersection of the VRF system and split AC stock curves occurs 21 years later. This substantial temporal lag explains the slower cost reduction for rural high-efficiency equipment and the rising costs of conventional units resulting from delayed replacement. Consequently, the costs of rural electric fans are projected to exceed urban levels by 2% to 2.5% in 2040, with this gap widening to 4% to 5% by 2055. In contrast, the costs of rural VRF systems under energy transition measures are expected to remain marginally lower than those of their urban counterparts. This underscores a localized cost advantage for high-efficiency equipment, thereby establishing the economic feasibility of a rural low-carbon transition.
The projected initial investment costs for rural cooling equipment in 2070 are shown in Figure 6d. By 2070, the costs of rural electric fans are projected to reach 524.5–528.5 yuan per unit, representing an increase of more than 125% relative to the 2025 baseline, thereby widening the urban–rural gap to 6–8%. Concurrently, rural carbon emissions from cooling are projected to decrease significantly from a peak of 35.9 MtCO2 to 2.3 MtCO2. This substantial reduction reflects rapid late-stage decarbonization driven by high-efficiency equipment upgrades and rural population contraction. Moreover, mirroring urban trends, the costs of split ACs driven by efficiency improvement measures are projected to increase by approximately 56% compared with 2025 levels. Regionally, these disparities are characterized primarily by elevated costs for ASHPs in the north under efficiency measures, whereas the south retains a distinct cost advantage for both split and ducted split ACs.
The projected energy savings and decarbonization benefits associated with the five types of cooling equipment for urban and rural residential buildings across China under the decarbonization scenario for 2025 to 2070 are presented in Figure 7. Notably, this potential is most substantial in hot and humid southern regions and is closely correlated with regional economic scale, population density, and climatic conditions. Guangdong Province achieves the greatest total benefit, estimated at 86.0 billion CNY, followed by Guangxi and Hainan. This leading position reflects Guangdong’s robust economy, large population, and extensive residential building stock; these factors, combined with high air conditioning penetration and usage, maximize the emission reduction returns from energy efficiency improvements and technology substitution. Furthermore, despite their smaller economies and populations, Guangxi and Hainan yield significant benefits because of their geographic location within the hot summer and warm winter climate zone, which drives substantial cooling demand.
Figure 7.
The energy-saving and decarbonization benefits of five types of cooling equipment in urban and rural residential buildings across China under the decarbonization scenario for the period 2025–2070.
The provinces of Hunan, Hubei, and Jiangxi exhibit the lowest total energy-saving and decarbonization benefits for residential cooling. In the hot summer and cold winter climate zone, the harsh temperature and humidity profiles drive persistent cooling demand, thereby increasing the lower bound of decarbonization costs. Furthermore, the prevalence of outdated, low-efficiency equipment directly influences both energy consumption and carbon emissions. Although upgrading this legacy stock is essential, the substantial initial investment and subsequent disposal costs can render overall net benefits negative in the short term. Moreover, the high proportion of small, low-efficiency equipment in rural areas poses a formidable “long-tail” decarbonization challenge. Moreover, compared with the southern coastal provinces, Central China’s thermal-dominated power grid features a lower renewable energy share. Consequently, its 2023 carbon emission factor (0.53 kgCO2/kWh) significantly exceeds that of the Southern Power Grid (0.40 kgCO2/kWh). This elevated carbon intensity dilutes the emission reductions achieved per unit of electricity saved, directly suppressing the monetized value of these decarbonization benefits. Recent studies on provincial residential buildings confirm that regional energy structures significantly dictate the actual emission reduction pathways and their environmental benefits [50,51].
In summary, the modeled results support consideration of context-specific policies that account for regional and urban–rural differences in China’s residential cooling sector. Initial investment costs may also be considered alongside the estimated energy-saving and decarbonization benefits. Thus, the second research problem identified in Section 1 has been effectively addressed.
5.2. Provincial-Level Cost-Effectiveness and Emission Reduction Analysis of Individual Measures
The comprehensive technoeconomic performance of the two categories of technical measures applied to five types of cooling equipment in urban and rural China for 2025 to 2060 is shown in Figure 8. Under the decarbonization scenario for 2025–2060, the NPVs shown in Figure 8a are negative for the province–urban/rural cases presented. This result does not mean that all evaluated technology measures have negative NPVs. As shown in Figure 8c, the energy-transition measures for split-type air conditioners show positive economic results in the specific urban and rural cases indicated. These findings apply to the measures and cases shown and should not be generalized to all cooling technologies or locations.
Figure 8.
Technoeconomic evaluation and decarbonization potential of cooling equipment under multiple measures in Chinese residential buildings, 2025–2060: panels (a,b) show the provincial spatial distributions of NPV aggregated across the assessed measures and CCC, respectively, with urban and rural results reported separately in panel (a); panel (c) presents the NPV and CCC of individual technology measures in the urban and rural sectors, with bubble size representing cumulative emission reductions.
For each province and urban/rural sector, the NPV shown in Figure 8a is the sum of the NPVs of the assessed technology measures for that province–sector case over 2025–2060. It therefore represents an aggregate provincial-sector result, whereas Figure 8c reports the NPV of each technology measure separately for the urban and rural sectors. In provinces where both the provincial NPV and CCC are negative under the baseline assumptions, the assessed measures are associated with net costs and increased emissions over the evaluation period. This finding applies to the specific provinces and measures evaluated and may differ under alternative grid emission factors or economic assumptions. In provinces with limited cooling demand and low grid emission factors, the modeled measures yield relatively small emission reductions and higher CCC values, indicating lower cost-effectiveness under the assumptions used here.
The distribution of NPVs across various mitigation measures provides a quantitative basis for precisely establishing low-carbon subsidy thresholds. The CCC across urban and rural areas in northwestern cold and arid provinces, such as Qinghai and Ningxia, is negative on the order of tens of millions, serving as a critical metric for evaluating the cost-effectiveness of decarbonization (Figure 8b). This phenomenon primarily stems from the confluence of two extreme conditions. First, under the adopted climate and equipment assumptions, limited annual cooling demand restricts the electricity savings achievable through equipment-efficiency improvements. Second, as these provinces are clean-energy-rich regions, their exceptionally low grid carbon emission factors further dilute the already minor electricity savings when converted into absolute carbon reductions, compressing them near zero. Conversely, the CCC of cooling equipment across both urban and rural sectors remains consistently high in Northeast China (e.g., Heilongjiang, Jilin, and Liaoning). Under the model assumptions, limited annual cooling demand in these northeastern provinces constrains the estimated electricity savings and associated emission reductions from high-efficiency equipment replacement, thereby limiting its cost-effectiveness.
As residential cooling equipment evolves toward deep decarbonization technologies, its economic feasibility varies across technology categories and between urban and rural areas. Under the decarbonization scenario for 2025–2060, the energy-transition measures for split-type air conditioners show positive NPVs in the specific urban and rural cases indicated in Figure 8c. These cases are associated with projected cumulative emission reductions of 142.9 MtCO2 in urban areas and 56.4 MtCO2 in rural areas. This result is specific to the split-type air conditioner energy-transition measures shown and does not imply positive NPVs for all technologies or assessed cases. For ducted split air conditioners, the estimated economic performance differs between urban and rural areas. In urban areas, the modeled operating conditions yield negative abatement costs and a projected cumulative emission reduction of 4.2 MtCO2. In rural areas, the assumed equipment premium and operating conditions result in lower estimated financial returns and higher abatement costs.
To contextualize the robustness of our proposed framework, it is essential to compare our approach and outcomes with existing mainstream models. While top-down macro-models like the GLOBUS framework provide excellent long-term aggregate estimations at the global or national scale, they often lack the granularity to capture sub-national socio-economic disparities. Conversely, urban-scale Bayesian models excel in localized calibration, reducing single-city heating estimation errors by over 30%, but are computationally difficult to scale nationally. Our integrated approach bridges this gap by quantifying the turnover of five specific cooling technologies across 30 provinces. More importantly, the results show that cooling-related CO2 emissions peak in both urban and rural sectors in 2022, whereas cooling energy consumption peaks in 2022 in urban areas and 2026 in rural areas This level of detail helps identify urban–rural differences in technoeconomic outcomes and regional variations in cost-effectiveness that may be less visible in broader aggregate analyses.
Overall, the third problem presented in Section 1 is systematically addressed based on our current assumptions.
5.3. Policy Implications
Spatial variation in the technoeconomic performance of residential cooling decarbonization, together with urban–rural differences in equipment ownership and energy use, suggests that a uniform regulatory framework may not fully reflect local conditions. To achieve carbon neutrality within China’s residential building sector by mid-century, a coordinated governance approach combining a national framework with region-specific policies could be considered. This model combines a unified national framework with region-specific mitigation policies. Consequently, provinces could develop customized transition roadmaps on the basis of their unique emission profiles, economic conditions, and technological capacities [52].
To mitigate the diffusion lag of low-carbon technologies across the urban–rural divide, policymakers could consider lifecycle-oriented market regulations. Conversely, for system-level technologies burdened by high upfront capital costs, targeted subsidies and green financial instruments could be considered to lower initial barriers for consumers.
Regionally, the findings may inform consideration of tailored policies grounded in our quantitative findings. In coastal economic hubs like Guangdong, where the decarbonization benefit reaches 86.0 billion CNY, market-based mechanisms and stronger building energy-performance standards may warrant consideration. Under the baseline assumptions, the estimated NPVs for the assessed measures in Hunan and Hubei are negative (−69.8 and −63.3 billion CNY, respectively). In Jilin and Qinghai, the estimated CCC values indicate relatively high abatement costs under the modeled conditions. These results suggest that targeted support and building-envelope improvements may merit consideration alongside equipment upgrades.
These findings further underscore the critical role of residential cooling decarbonization in China’s energy transition and climate governance, which aligns closely with national commitments to peak carbon emissions before 2030 and achieve carbon neutrality by 2060. Given the urban–rural differences in China, the analysis of spatially differentiated and technology-specific cooling strategies may offer insights for cooling decarbonization. These findings may also provide a useful evidence base for other emerging economies seeking to balance growing cooling demand, economic equity, and net-zero goals.
6. Conclusions
On the basis of the dynamic evolution of residential building stock turnover across urban and rural China, combined with scenario analysis, this study quantified the long-term trajectories of stock evolution, energy consumption, and carbon emissions for secondary terminal cooling equipment from 2000 to 2070. By further evaluating the investment costs, energy-saving and decarbonization benefits, and economic feasibility of individual interventions at the provincial scale, this study revealed the structural characteristics of deep decarbonization in cooling equipment across spatial distributions and technological pathways, thereby providing a theoretical basis for formulating regionally differentiated transition strategies.
6.1. Core Findings
- •
- Residential cooling technology is experiencing a notable structural transition from “rapid single-unit proliferation” to “high-efficiency system integration”, demonstrating complex spatial–temporal decoupling features across the urban–rural divide. With respect to carbon emissions, both urban and rural areas reach their peaks in 2022 at 87.2 MtCO2 and 35.9 MtCO2, respectively, and are projected to decline substantially to 14.5 MtCO2 and 2.3 MtCO2, respectively, by 2070. In terms of energy consumption, the urban sector peaks in 2022 (171.9 TWh), whereas the rural peak is significantly delayed until 2026 (78.0 TWh); by 2070, these figures are anticipated to decrease to 90.4 TWh and 14.7 TWh, respectively. The sustained postpeak decline is attributed primarily to the widespread adoption of high-efficiency equipment and the continuous improvement in energy efficiency standards. Furthermore, the steeper projected decline in rural carbon emissions is consistent with the influence of the urban–rural dual structure and its associated economic and policy factors.
- •
- Under the decarbonization scenario, the investment costs and energy-saving and decarbonization benefits exhibit high spatial heterogeneity across different climate zones. With respect to upfront capital costs, high-efficiency technologies are notably more expensive. For example, the projected 2025 cost for ASHPs in urban areas is as high as 554 yuan/m2, in contrast to the mere 232.8 yuan per unit for electric fans. In terms of emission-reduction benefits, the hot and humid southern region has demonstrated substantial potential. Notably, Guangdong Province leads the nation with a total benefit of 86.0 billion CNY because of its scale advantages. In contrast, the central provinces of Hunan (−69.8 billion CNY) and Hubei (−63.3 billion CNY) are characterized by hot summers and cold winters. These extreme climatic conditions substantially increase the lower bound of abatement costs. Moreover, their carbon-intensive, coal-dominated grids heavily decrease the decarbonization value of electricity savings. This dual constraint results in the lowest comprehensive benefits nationwide and pushes overall returns into negative territory in the short term.
- •
- The economic feasibility of the deep decarbonization of cooling equipment exhibits significant regional variations in cost-effectiveness and divergent urban–rural technoeconomic outcomes. Grid carbon intensity and macroeconomic development levels constitute the fundamental underlying variables governing its cost-effectiveness. Under the 2025–2060 decarbonization scenario, the NPVs shown in Figure 8a are negative for the provincial urban and rural cases presented. In contrast, the energy-transition measures for split-type air conditioners show positive NPVs in the specific cases indicated in Figure 8c, with projected cumulative emission reductions of 142.9 MtCO2 in urban areas and 56.4 MtCO2 in rural areas. These findings are specific to the assessed measures and cases and should not be interpreted as indicating that all cooling decarbonization measures have the same economic outcome. For ducted systems, the modeled technoeconomic outcomes differ between urban and rural areas. Under the baseline assumptions, the urban case yields negative abatement costs and a cumulative emission reduction of 4.2 MtCO2. The rural case shows lower estimated financial returns under the assumed equipment costs and annual cooling-demand conditions.
6.2. Limitations and Future Work
To refine the decarbonization roadmap for the residential building sector and support China’s carbon neutrality vision, several research gaps warrant investigation. While this study focused exclusively on the evolutionary trajectories of cooling equipment, future modeling frameworks could integrate the multidimensional interactions among space heating, domestic hot water, and cooking systems to evaluate thermal coupling and prevent suboptimal technology lock-in. Future studies could also examine the integration of building-level renewable energy generation. Quantifying the dynamic alignment between hourly solar power production and residential cooling loads will help unlock the potential for demand-side electricity management. Finally, future simulations could incorporate dynamic climate change trends (e.g., progressive global warming), extreme climate data, and dynamic demographic shifts to evaluate the additional cooling load shocks and support robust grid stress testing, thereby optimizing targeted capital subsidy schemes for vulnerable rural populations during late transition stages. Furthermore, the economic interpretations in this study, such as NPV and CCC, rely on deterministic parameters, including a static 5% discount rate, constant electricity prices, and current equipment costs. Accordingly, the reported economic results should be interpreted as baseline estimates rather than unconditional predictions; alternative assumptions may change the estimated cost-effectiveness of individual measures. Future studies could incorporate stochastic economic modeling to explicitly address the uncertainties in equipment learning curves and the potential financial benefits from an expanding carbon trading market, which could significantly alter the long-term cost-effectiveness landscape. Geographically, Tibet, Hong Kong, Macao, and Taiwan were excluded due to data limitations. While this negligibly impacts macroscopic totals, integrating these regions remains a future priority for an exhaustive national analysis. Furthermore, omitting direct refrigerant emissions is a limitation [53]. Future research could include these life-cycle dynamics in future analyses to comprehensively assess the climate impact of cooling decarbonization.
Supplementary Materials
The following supporting information can be downloaded at https://www.mdpi.com/article/10.3390/buildings16214453/s1. The supplementary file contains the following tables and methods: Table S1: Summary of key technoeconomic parameters and simplified boundaries; Table S2: Summary of core data sources and coverage in this study; Table S3: Province-to-capital-city assignment and CDD26 values; Table S4: Envelope thermal parameters for urban residential buildings; Table S5: Envelope thermal parameters for rural residential buildings; Table S6: Data source, base temperature, and provincial assignment of CDD26; Table S7: Annual performance parameters for the five types of cooling equipment (2000–2070); Table S8: Sources of parameters; Table S9: Summary of key parameters and assumptions; Table S10: Assumed residential geometries and derived normalization factors; Table S11: Inputs and intermediate results for the Guangdong urban example; Supplementary Method S1: CDD26-based cooling-demand calculation.
Author Contributions
Conceptualization, M.M.; methodology, S.Z. and R.Y.; software, S.Z. and R.Y.; validation, S.Z.; formal analysis, S.Z. and R.Y.; investigation, S.Z.; resources, R.Y.; data curation, S.Z. and R.Y.; writing—original draft preparation, S.Z.; writing—review and editing, S.Z., M.M. and R.Y.; visualization, S.Z.; supervision, M.M.; project administration, R.Y.; funding acquisition, M.M. All authors have read and agreed to the published version of the manuscript.
Funding
This study was funded by the Chongqing Social Science Planning Annual Project (General Project), grant number 2026NDYB053.
Data Availability Statement
The provincial-level datasets and core models are available from the corresponding author upon reasonable academic request.
Conflicts of Interest
The authors declare no conflicts of interest.
Abbreviations
| AC | Air Conditioner(s) |
| BAU | Business-as-Usual |
| CCC | Cost of Conserved Carbon (CNY/tCO2) |
| CDD | Cooling Degree-Day |
| CO2 | Carbon dioxide |
| CRC | Carbon Reduction Cost |
| IRR | Internal Rate of Return |
| LCC | Life Cycle Cost |
| MtCO2 | Megatons of carbon dioxide |
| NPV | Net Present Value (CNY) |
| PV | Photovoltaic |
Nomenclature
| a | Subscript index for secondary end-use category |
| ASt | Per capita floor area in year t |
| Bt | Carbon reduction revenue in year t |
| c | Subscript index for cooling device type |
| Coperation | Carbon emissions during operational phase |
| Ct | Annual investment and operational cost in year t |
| copc | Operating cycle/performance coefficient of cooling device c |
| Outflow of equipment from category a and appliance i in year t | |
| DBt | Demolished area of nonrenovated residential building stock in year t |
| DBt,x | Demolished area in year t of building stock constructed in year x |
| DRBt | Demolished area of renovated residential building stock in year t |
| ecooling,c | Final energy consumption of cooling device c |
| Average energy efficiency of end-use appliance i in year t | |
| eicooling | Annual cooling thermal-demand intensity per unit residential floor area |
| eoperation,fuel | Final energy (fuel) consumed during operational phase |
| epv | Electricity generation by rooftop PV systems |
| Average energy efficiency of appliance i in category a in evaluation year t | |
| Efficiency assigned to cohort x of appliance i in category a | |
| Total electricity generation from renewable sources | |
| Total electricity generation from thermal power | |
| efelectricity | Carbon emission factor of grid electricity |
| effuel | Carbon emission factor of final energy (fuel) |
| EFele | Comprehensive grid carbon emission factor |
| EFn | Carbon emission factor of fossil fuel n |
| i | Subscript index for end-use appliance/technology |
| K | Specific decarbonization measure or technology |
| MBK(t) | Annual monetized economic benefit of measure K in year t (CNY) |
| MCK(t) | Annual total cost of measure K in year t (CNY) |
| MDCK(t) | Annual physical carbon emission reduction in measure K in year t (tCO2) |
| n | Technology service life |
| Inflow to category a | |
| Equipment inflow volume of end-use appliance i within category a in year t | |
| NBt | Newly built area of residential building stock in year t |
| NBt,x | Remaining building stock in year t of buildings constructed in year x |
| Thermal electricity generation specifically from fossil fuel n | |
| Pt | Population size in year t |
| r | Discount rate |
| Market share of end-use appliance i within category a | |
| rc | Market share of cooling device c |
| rcooling | Spatial penetration rate of cooling |
| RBt | Renovated area of residential building stock in year t |
| s | Total residential floor area |
| In-service stock in year t of appliance i in category a belonging to cohort x | |
| Total equipment stock of secondary end-use category a in year t | |
| Total in-service stock in year t of appliance i in category a | |
| SBt | Residential building stock area of previous year |
| t | Evaluation year |
| x | Building construction or equipment installation year, including replacement |
| ΔCO2,t | Physical carbon-emission reduction in year t |
| μ | Mean service life for residential buildings or end-use equipment |
| σ2 | Variance of the service life |
References
- Zhong, X.; Hu, M.; Deetman, S.; Steubing, B.; Lin, H.X.; Hernandez, G.A.; Harpprecht, C.; Zhang, C.; Tukker, A.; Behrens, P. Global greenhouse gas emissions from residential and commercial building materials and mitigation strategies to 2060. Nat. Commun. 2021, 12, 6126. [Google Scholar] [CrossRef] [Scilit] [PubMed]
- Xia, B.; Xiao, J.; Liu, G.; Guan, X.; Lu, Y.; Wang, Y.C. Exploiting vacant urban residential buildings to promote carbon neutrality in China. Nat. Commun. 2025, 16, 7661. [Google Scholar] [CrossRef] [Scilit] [PubMed]
- Liu, Z.; Deng, Z.; He, G.; Wang, H.; Zhang, X.; Lin, J.; Qi, Y.; Liang, X. Challenges and opportunities for carbon neutrality in China. Nat. Rev. Earth Environ. 2022, 3, 141–155. [Google Scholar] [CrossRef] [Scilit]
- Zhang, S.; Zhou, N.; Feng, W.; Ma, M.; Xiang, X.; You, K. Pathway for decarbonizing residential building operations in the US and China beyond the mid-century. Appl. Energy 2023, 342, 121164. [Google Scholar] [CrossRef] [Scilit]
- Li, R.; Liu, Q.; Cai, W.; Liu, Y.; Yu, Y.; Zhang, Y. Echelon peaking path of China’s provincial building carbon emissions: Considering peak and time constraints. Energy 2023, 271, 127003. [Google Scholar] [CrossRef] [Scilit]
- Du, Q.; Wan, Z.; Yang, M.; Wang, X.; Bai, L. Dynamic integrated simulation of carbon emission reduction potential in China’s building sector. Sustain. Cities Soc. 2024, 116, 105944. [Google Scholar] [CrossRef] [Scilit]
- You, K.; Li, Y.; Cai, W.; Zhang, L.; Liu, Z.; Feng, W.; Wei, Y.-M. Mitigating emissions and costs through demand-side solutions in Chinese residential buildings. Nat. Commun. 2025, 16, 7358. [Google Scholar] [CrossRef] [Scilit] [PubMed]
- Li, X.C.; Zhao, L.; Luo, Z.; Oleson, K.; Cheng, Y.; Xie, X.; Varquez, A.C.G.; Sekiya, M. Divergent humidity-driven growth in urban air-conditioning energy demand under climate change. Nat. Cities 2026, 3, 718–730. [Google Scholar] [CrossRef] [Scilit]
- Guo, X.; Pang, J. Analysis of provincial CO2 emission peaking in China: Insights from production and consumption. Appl. Energy 2023, 331, 120446. [Google Scholar] [CrossRef] [Scilit]
- Yu, S.; Zheng, S.; Li, X.; Li, L. China can peak its energy-related carbon emissions before 2025: Evidence from industry restructuring. Energy Econ. 2018, 73, 91–107. [Google Scholar] [CrossRef] [Scilit]
- Xiang, X.; Zhou, N.; Ma, M.; Feng, W.; Yan, R. Global transition of operational carbon in residential buildings since the millennium. Adv. Appl. Energy 2023, 11, 100145. [Google Scholar] [CrossRef] [Scilit]
- Yan, R.; Ma, M.; Zhou, N.; Feng, W.; Xiang, X.; Mao, C. Towards COP27: Decarbonization patterns of residential building in China and India. Appl. Energy 2023, 352, 122003. [Google Scholar] [CrossRef] [Scilit]
- Ding, D.; Liu, X.; Xu, X. Projecting the future fine-resolution carbon dioxide emissions under the shared socioeconomic pathways for carbon peak evaluation. Appl. Energy 2024, 365, 123240. [Google Scholar] [CrossRef] [Scilit]
- Yan, R.; Chen, M.; Xiang, X.; Feng, W.; Ma, M. Heterogeneity or illusion? Track the carbon Kuznets curve of global residential building operations. Appl. Energy 2023, 347, 121441. [Google Scholar] [CrossRef] [Scilit]
- Lin, C.; Li, X. Carbon peak prediction and emission reduction pathways exploration for provincial residential buildings: Evidence from Fujian Province. Sustain. Cities Soc. 2024, 102, 105239. [Google Scholar] [CrossRef] [Scilit]
- Shuang, H.; Luo, J.; Gan, X.; Xiang, S. LEED certification system for green buildings in China: Examining spatial differences, temporal evolution, and spatial overflow. J. Clean. Prod. 2024, 458, 142479. [Google Scholar] [CrossRef] [Scilit]
- Yang, J.; Deng, Z.; Guo, S.; Chen, Y. Development of bottom-up model to estimate dynamic carbon emission for city-scale buildings. Appl. Energy 2023, 331, 120410. [Google Scholar] [CrossRef] [Scilit]
- Wang, X.; Purohit, P.; Höglund-Isaksson, L.; Zhang, S.; Fang, H. Co-benefits of Energy-Efficient Air Conditioners in the Residential Building Sector of China. Environ. Sci. Technol. 2020, 54, 13217–13227. [Google Scholar] [CrossRef] [Scilit] [PubMed]
- Karali, N.; Shah, N.; Park, W.Y.; Khanna, N.; Ding, C.; Lin, J.; Zhou, N. Improving the energy efficiency of room air conditioners in China: Costs and benefits. Appl. Energy 2020, 258, 114023. [Google Scholar] [CrossRef] [Scilit]
- Li, Y.; Feng, H. Pathways to urban net zero energy buildings in Canada: A comprehensive GIS-based framework using open data. Sustain. Cities Soc. 2025, 122, 106263. [Google Scholar] [CrossRef] [Scilit]
- Ma, M.; Zhou, N.; Feng, W.; Yan, J. Challenges and opportunities in the global net-zero building sector. Cell Rep. Sustain. 2024, 1, 100154. [Google Scholar] [CrossRef] [Scilit]
- Ma, M.; Ma, X.; Cai, W.; Cai, W. Low carbon roadmap of residential building sector in China: Historical mitigation and prospective peak. Appl. Energy 2020, 273, 115247. [Google Scholar] [CrossRef] [Scilit]
- Luo, Y.; Shen, J.; Liang, H.; Sun, L.; Dong, L. Carbon monitoring, reporting and verification (MRV) for cleaner built environment: Developing a solar photovoltaic blockchain tool and applications in Hong Kong’s building sector. J. Clean. Prod. 2024, 471, 143456. [Google Scholar] [CrossRef] [Scilit]
- Qiu, Y.; Kahn, M.E. Better sustainability assessment of green buildings with high-frequency data. Nat. Sustain. 2018, 1, 642–649. [Google Scholar] [CrossRef] [Scilit]
- Taniguchi-Matsuoka, A.; Shimoda, Y.; Sugiyama, M.; Kurokawa, Y.; Matoba, H.; Yamasaki, T.; Morikuni, T.; Yamaguchi, Y. Evaluating Japan’s national greenhouse gas reduction policy using a bottom-up residential end-use energy simulation model. Appl. Energy 2020, 279, 115792. [Google Scholar] [CrossRef] [Scilit]
- Na, W.; Wang, M. A Bayesian approach with urban-scale energy model to calibrate building energy consumption for space heating: A case study of application in Beijing. Energy 2022, 247, 123341. [Google Scholar] [CrossRef] [Scilit]
- Zhang, S.; Ma, M.; Zhou, N.; Yan, J.; Feng, W.; Yan, R.; You, K.; Zhang, J.; Ke, J. Estimation of global building stocks by 2070: Unlocking renovation potential. Nexus 2024, 1, 100019. [Google Scholar] [CrossRef] [Scilit]
- Greer, F.; Raftery, P.; Horvath, A. Considerations for estimating operational greenhouse gas emissions in whole building life-cycle assessments. Build. Environ. 2024, 254, 111383. [Google Scholar] [CrossRef] [Scilit]
- Zhong, Y.; Li, R.; Cai, W. Coordinating building electrification with regional grid decarbonization: Comparison of carbon emissions of different scheduling strategies. Energy 2024, 303, 131942. [Google Scholar] [CrossRef] [Scilit]
- Hu, Y.; Waite, M.; Patz, E.; Xia, B.; Xu, Y.; Olsen, D.; Gopan, N.; Modi, V. A data-driven approach for the disaggregation of building-sector heating and cooling loads from hourly utility load data. Energy Strategy Rev. 2023, 49, 101175. [Google Scholar] [CrossRef] [Scilit]
- Ma, M.; Zhang, S.; Liu, J.; Yan, R.; Cai, W.; Zhou, N.; Yan, J. Building floorspace and stock measurement: A review of global efforts, knowledge gaps, and research priorities. Nexus 2025, 2, 100075. [Google Scholar] [CrossRef] [Scilit]
- Zhou, X.; Huang, Z.; Scheuer, B.; Wang, H.; Zhou, G.; Liu, Y. High-resolution estimation of building energy consumption at the city level. Energy 2023, 275, 127476. [Google Scholar] [CrossRef] [Scilit]
- Heisel, F.; McGranahan, J.; Ferdinando, J.; Dogan, T. High-resolution combined building stock and building energy modeling to evaluate whole-life carbon emissions and saving potentials at the building and urban scale. Resour. Conserv. Recycl. 2022, 177, 106000. [Google Scholar] [CrossRef] [Scilit]
- Yap, W.; Wu, A.N.; Miller, C.; Biljecki, F. Revealing building operating carbon dynamics for multiple cities. Nat. Sustain. 2025, 8, 1199–1210. [Google Scholar] [CrossRef] [Scilit]
- Tang, S.; Leng, W.; Liu, G.; Li, Y.; Xue, Z.; Shi, L. Development of a framework to forecast the urban residential building CO2 emission trend and reduction potential to 2060: A case study of Jiangxi province, China. J. Environ. Manag. 2024, 351, 119399. [Google Scholar] [CrossRef] [Scilit] [PubMed]
- Adebayo, P.; Beragama Jathunge, C.; Darbandi, A.; Fry, N.; Shor, R.; Mohamad, A.; Wemhöner, C.; Mwesigye, A. Development, modeling, and optimization of ground source heat pump systems for cold climates: A comprehensive review. Energy Build. 2024, 320, 114646. [Google Scholar] [CrossRef] [Scilit]
- Zhou, N.; Fridley, D.; Khanna, N.Z.; Ke, J.; McNeil, M.; Levine, M. China’s energy and emissions outlook to 2050: Perspectives from bottom-up energy end-use model. Energy Policy 2013, 53, 51–62. [Google Scholar] [CrossRef] [Scilit]
- Levesque, A.; Pietzcker, R.C.; Baumstark, L.; De Stercke, S.; Grübler, A.; Luderer, G. How much energy will buildings consume in 2100? A global perspective within a scenario framework. Energy 2018, 148, 514–527. [Google Scholar] [CrossRef] [Scilit]
- Levesque, A.; Osorio, S.; Herkel, S.; Pahle, M. Rethinking the role of efficiency for the decarbonization of buildings is essential. Joule 2023, 7, 1087–1092. [Google Scholar] [CrossRef] [Scilit]
- Yan, R.; Zhou, N.; Ma, M.; Mao, C. India’s residential space cooling transition: Decarbonization ambitions since the turn of millennium. Appl. Energy 2025, 391, 125929. [Google Scholar] [CrossRef] [Scilit]
- Wang, Y.; Ma, M.; Zhou, N.; Ma, Z. Paving the way to carbon neutrality: Evaluating the decarbonization of residential building electrification worldwide. Sustain. Cities Soc. 2025, 130, 106549. [Google Scholar] [CrossRef] [Scilit]
- Luo, Y.; Zhang, L.; Bozlar, M.; Liu, Z.; Guo, H.; Meggers, F. Active building envelope systems toward renewable and sustainable energy. Renew. Sustain. Energy Rev. 2019, 104, 470–491. [Google Scholar] [CrossRef] [Scilit]
- Giama, E.; Sittas, K.; Chantzis, G.; Papadopoulos, A. Carbon neutrality in the building sector: Optimization of heat pumps operation in combination to PV/T as auxiliary renewable energy system. Energy 2025, 330, 136726. [Google Scholar] [CrossRef] [Scilit]
- Chen, H.; Shen, G.Q.; Feng, Z.; Liu, Y. Optimization of energy-saving retrofit solutions for existing buildings: A multidimensional data fusion approach. Renew. Sustain. Energy Rev. 2024, 201, 114630. [Google Scholar] [CrossRef] [Scilit]
- Luo, D.; Liu, J.; Wu, H.; Zhang, G.; Pan, Z.; Huang, J. Advancing smart net-zero energy buildings with renewable energy and electrical energy storage. J. Energy Storage 2025, 114, 115850. [Google Scholar] [CrossRef] [Scilit]
- Yuan, H.; Ma, M.; Zhou, N.; Ma, Z.; Zhang, C. Assessing provincial carbon budgets for residential buildings to advance net-zero ambitions. Carbon Neutrality 2026, 5, 5. [Google Scholar] [CrossRef] [Scilit]
- Manfren, M.; James, P.A.B.; Tronchin, L. Data-driven building energy modelling—An analysis of the potential for generalisation through interpretable machine learning. Renew. Sustain. Energy Rev. 2022, 167, 112686. [Google Scholar] [CrossRef] [Scilit]
- Standard’s JGJ/T 346-2014; Standard for Weather Data of Building Energy Efficiency. China Architecture & Building Press: Beijing, China, 2014.
- Ürge-Vorsatz, D.; Khosla, R.; Bernhardt, R.; Chan, Y.C.; Vérez, D.; Hu, S.; Cabeza, L.F. Advances Toward a Net-Zero Global Building Sector. Annu. Rev. Environ. Resour. 2020, 45, 227–269. [Google Scholar] [CrossRef] [Scilit]
- Chen, X.; Shuai, C.; Wu, Y.; Zhang, Y. Analysis on the carbon emission peaks of China’s industrial, building, transport, and agricultural sectors. Sci. Total Environ. 2020, 709, 135768. [Google Scholar] [CrossRef] [Scilit] [PubMed]
- Sun, X.; Lian, W.; Gao, T.; Chen, Z.; Duan, H. Spatial-temporal characteristics of carbon emission intensity in electricity generation and spatial spillover effects of driving factors across China’s provinces. J. Clean. Prod. 2023, 405, 136908. [Google Scholar] [CrossRef] [Scilit]
- Zheng, J.; Mi, Z.; Coffman, D.M.; Milcheva, S.; Shan, Y.; Guan, D.; Wang, S. Regional development and carbon emissions in China. Energy Econ. 2019, 81, 25–36. [Google Scholar] [CrossRef] [Scilit]
- Jiang, P.; Purohit, P.; Xiang, X.; Chen, Z.; Bai, F.; Zhao, X.; Zhang, X.; Hu, J. Cooling China without warming the planet: Climate and co-benefits of HFC phase-down. npj Clim. Atmos. Sci. 2025, 9, 18. [Google Scholar] [CrossRef] [Scilit]
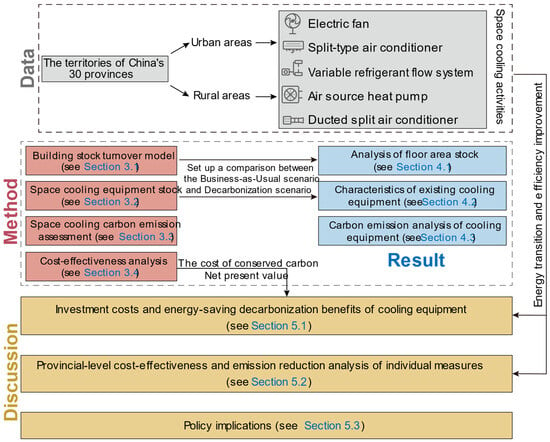
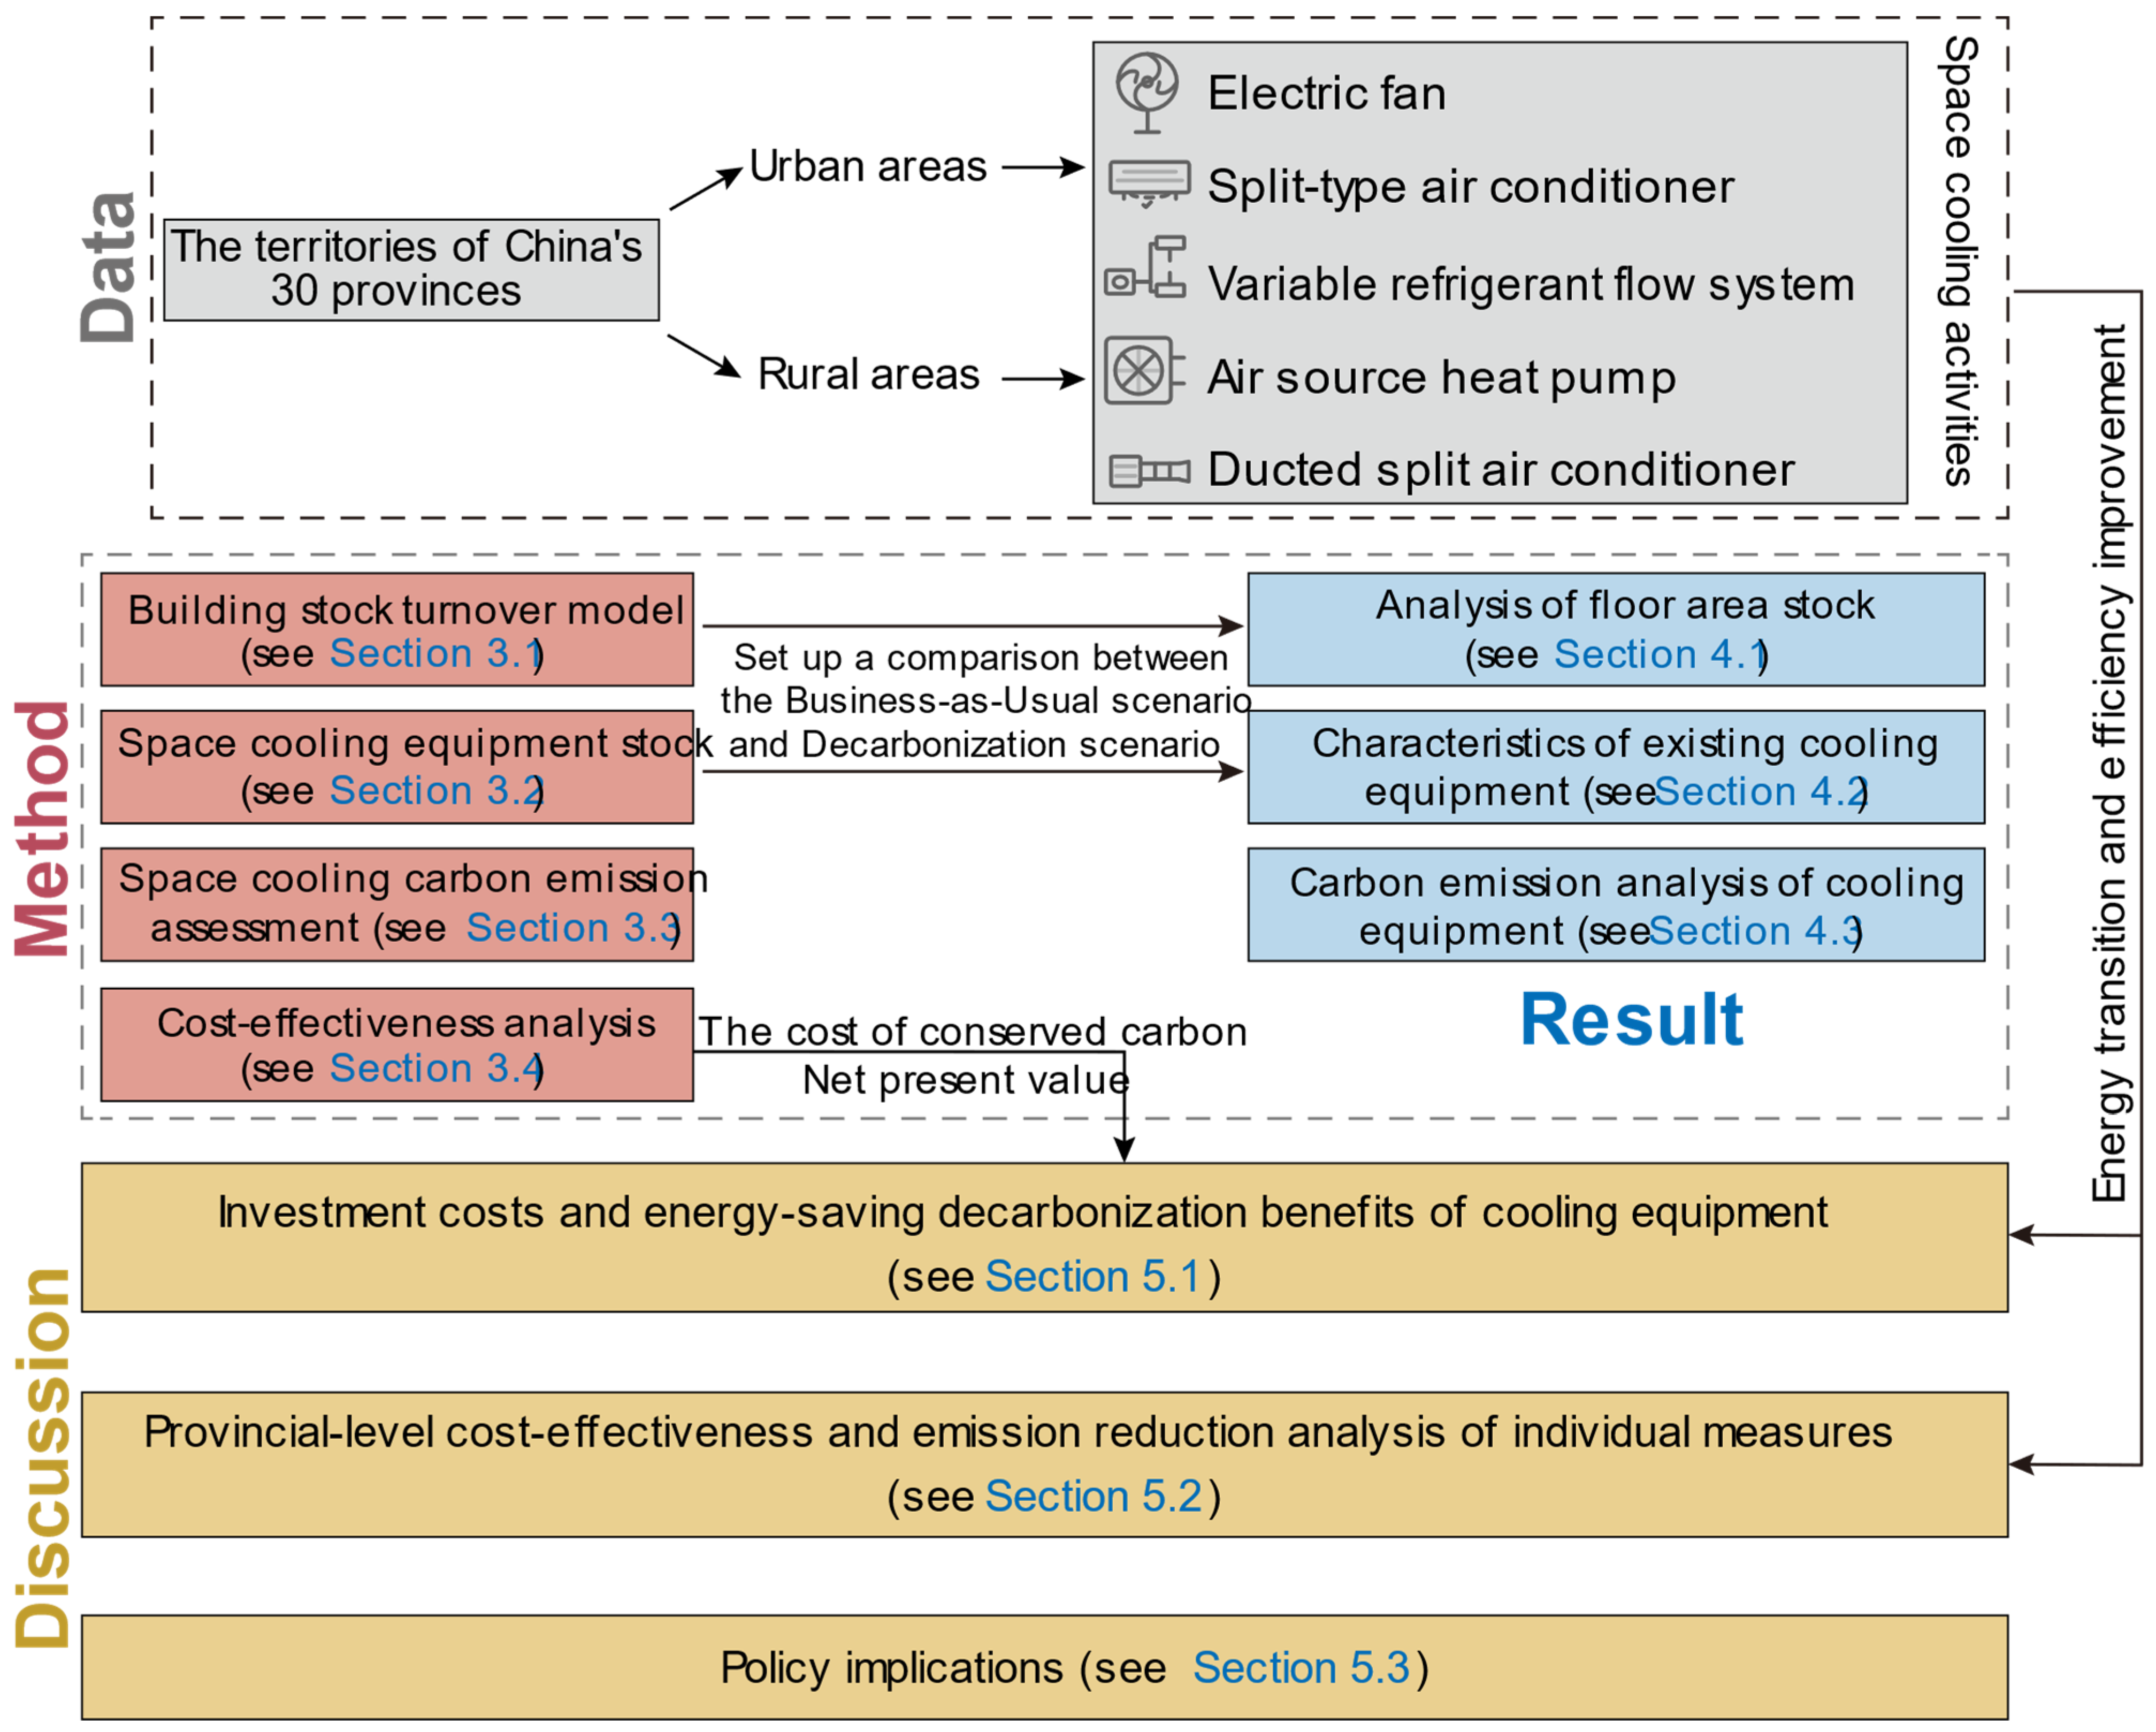
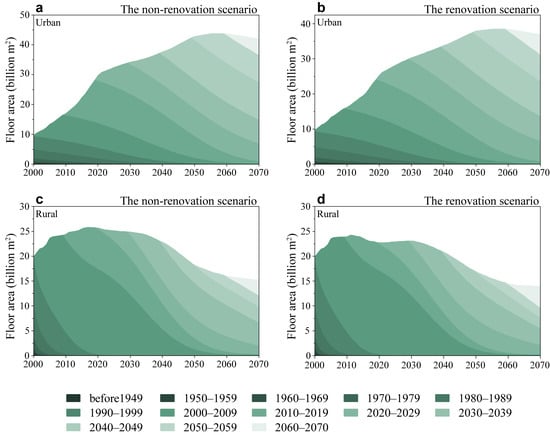
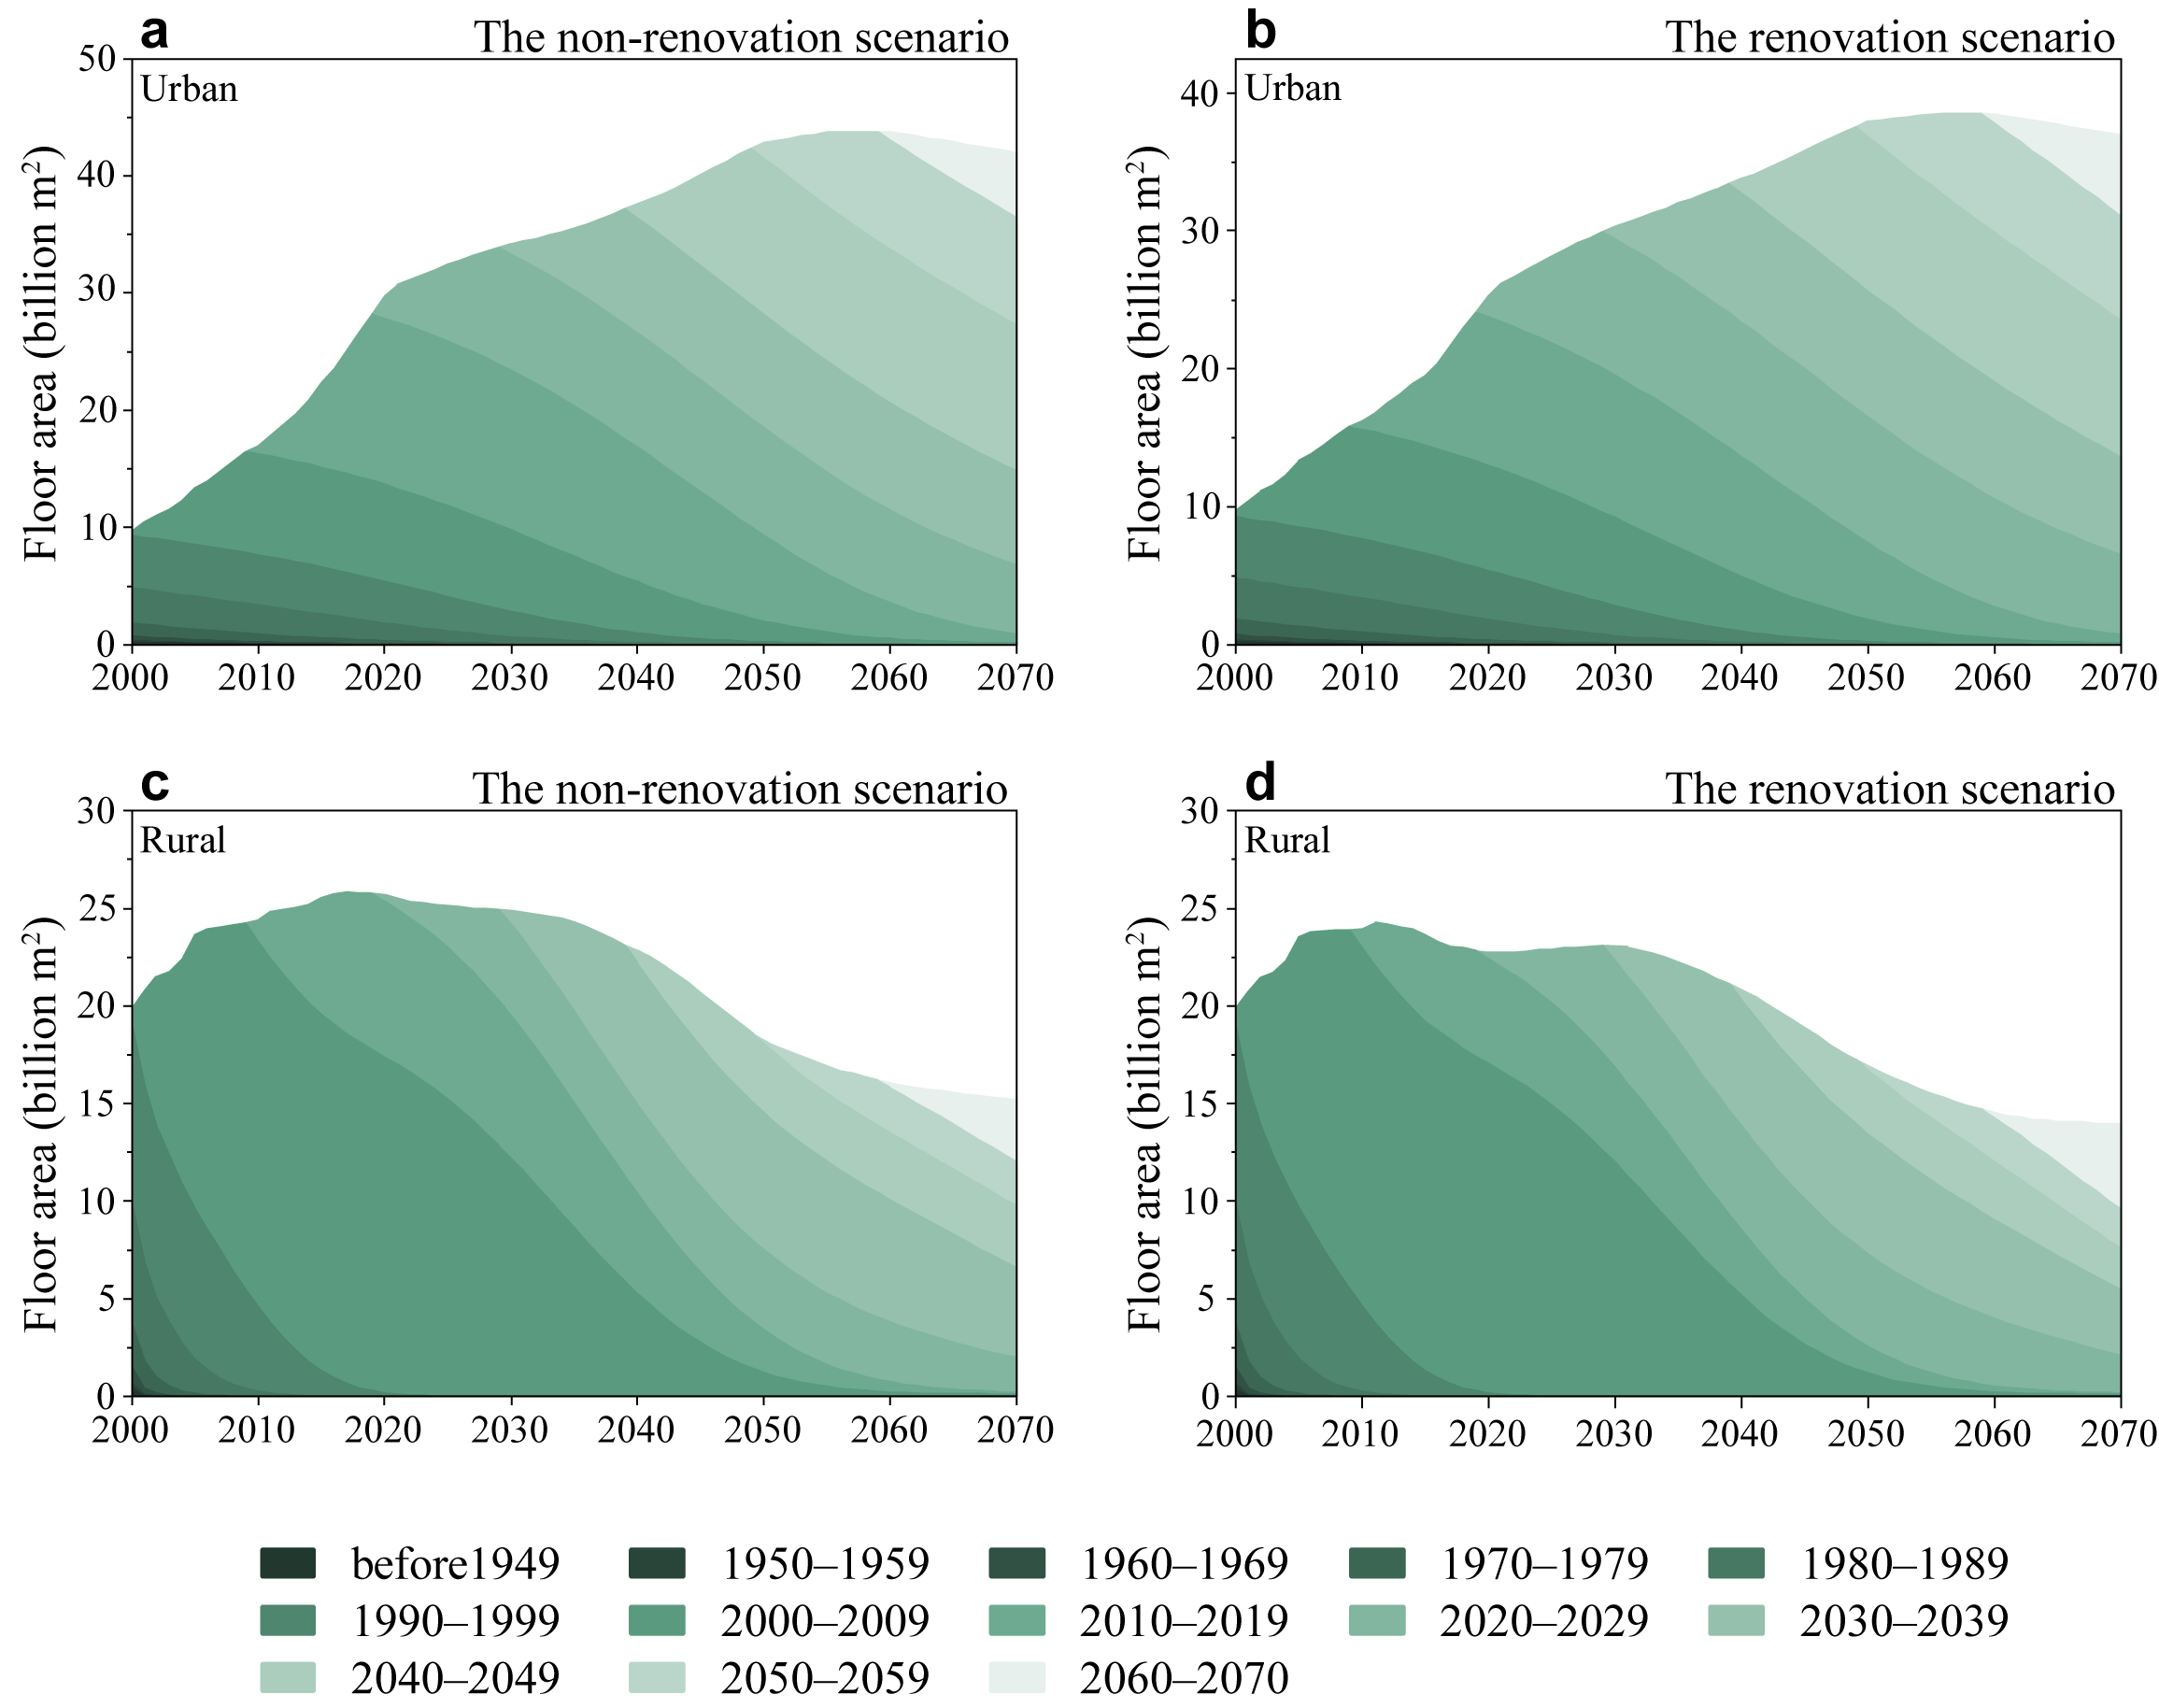
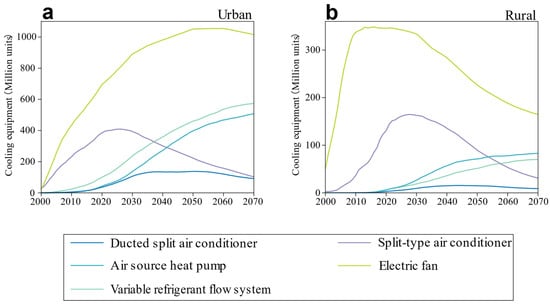
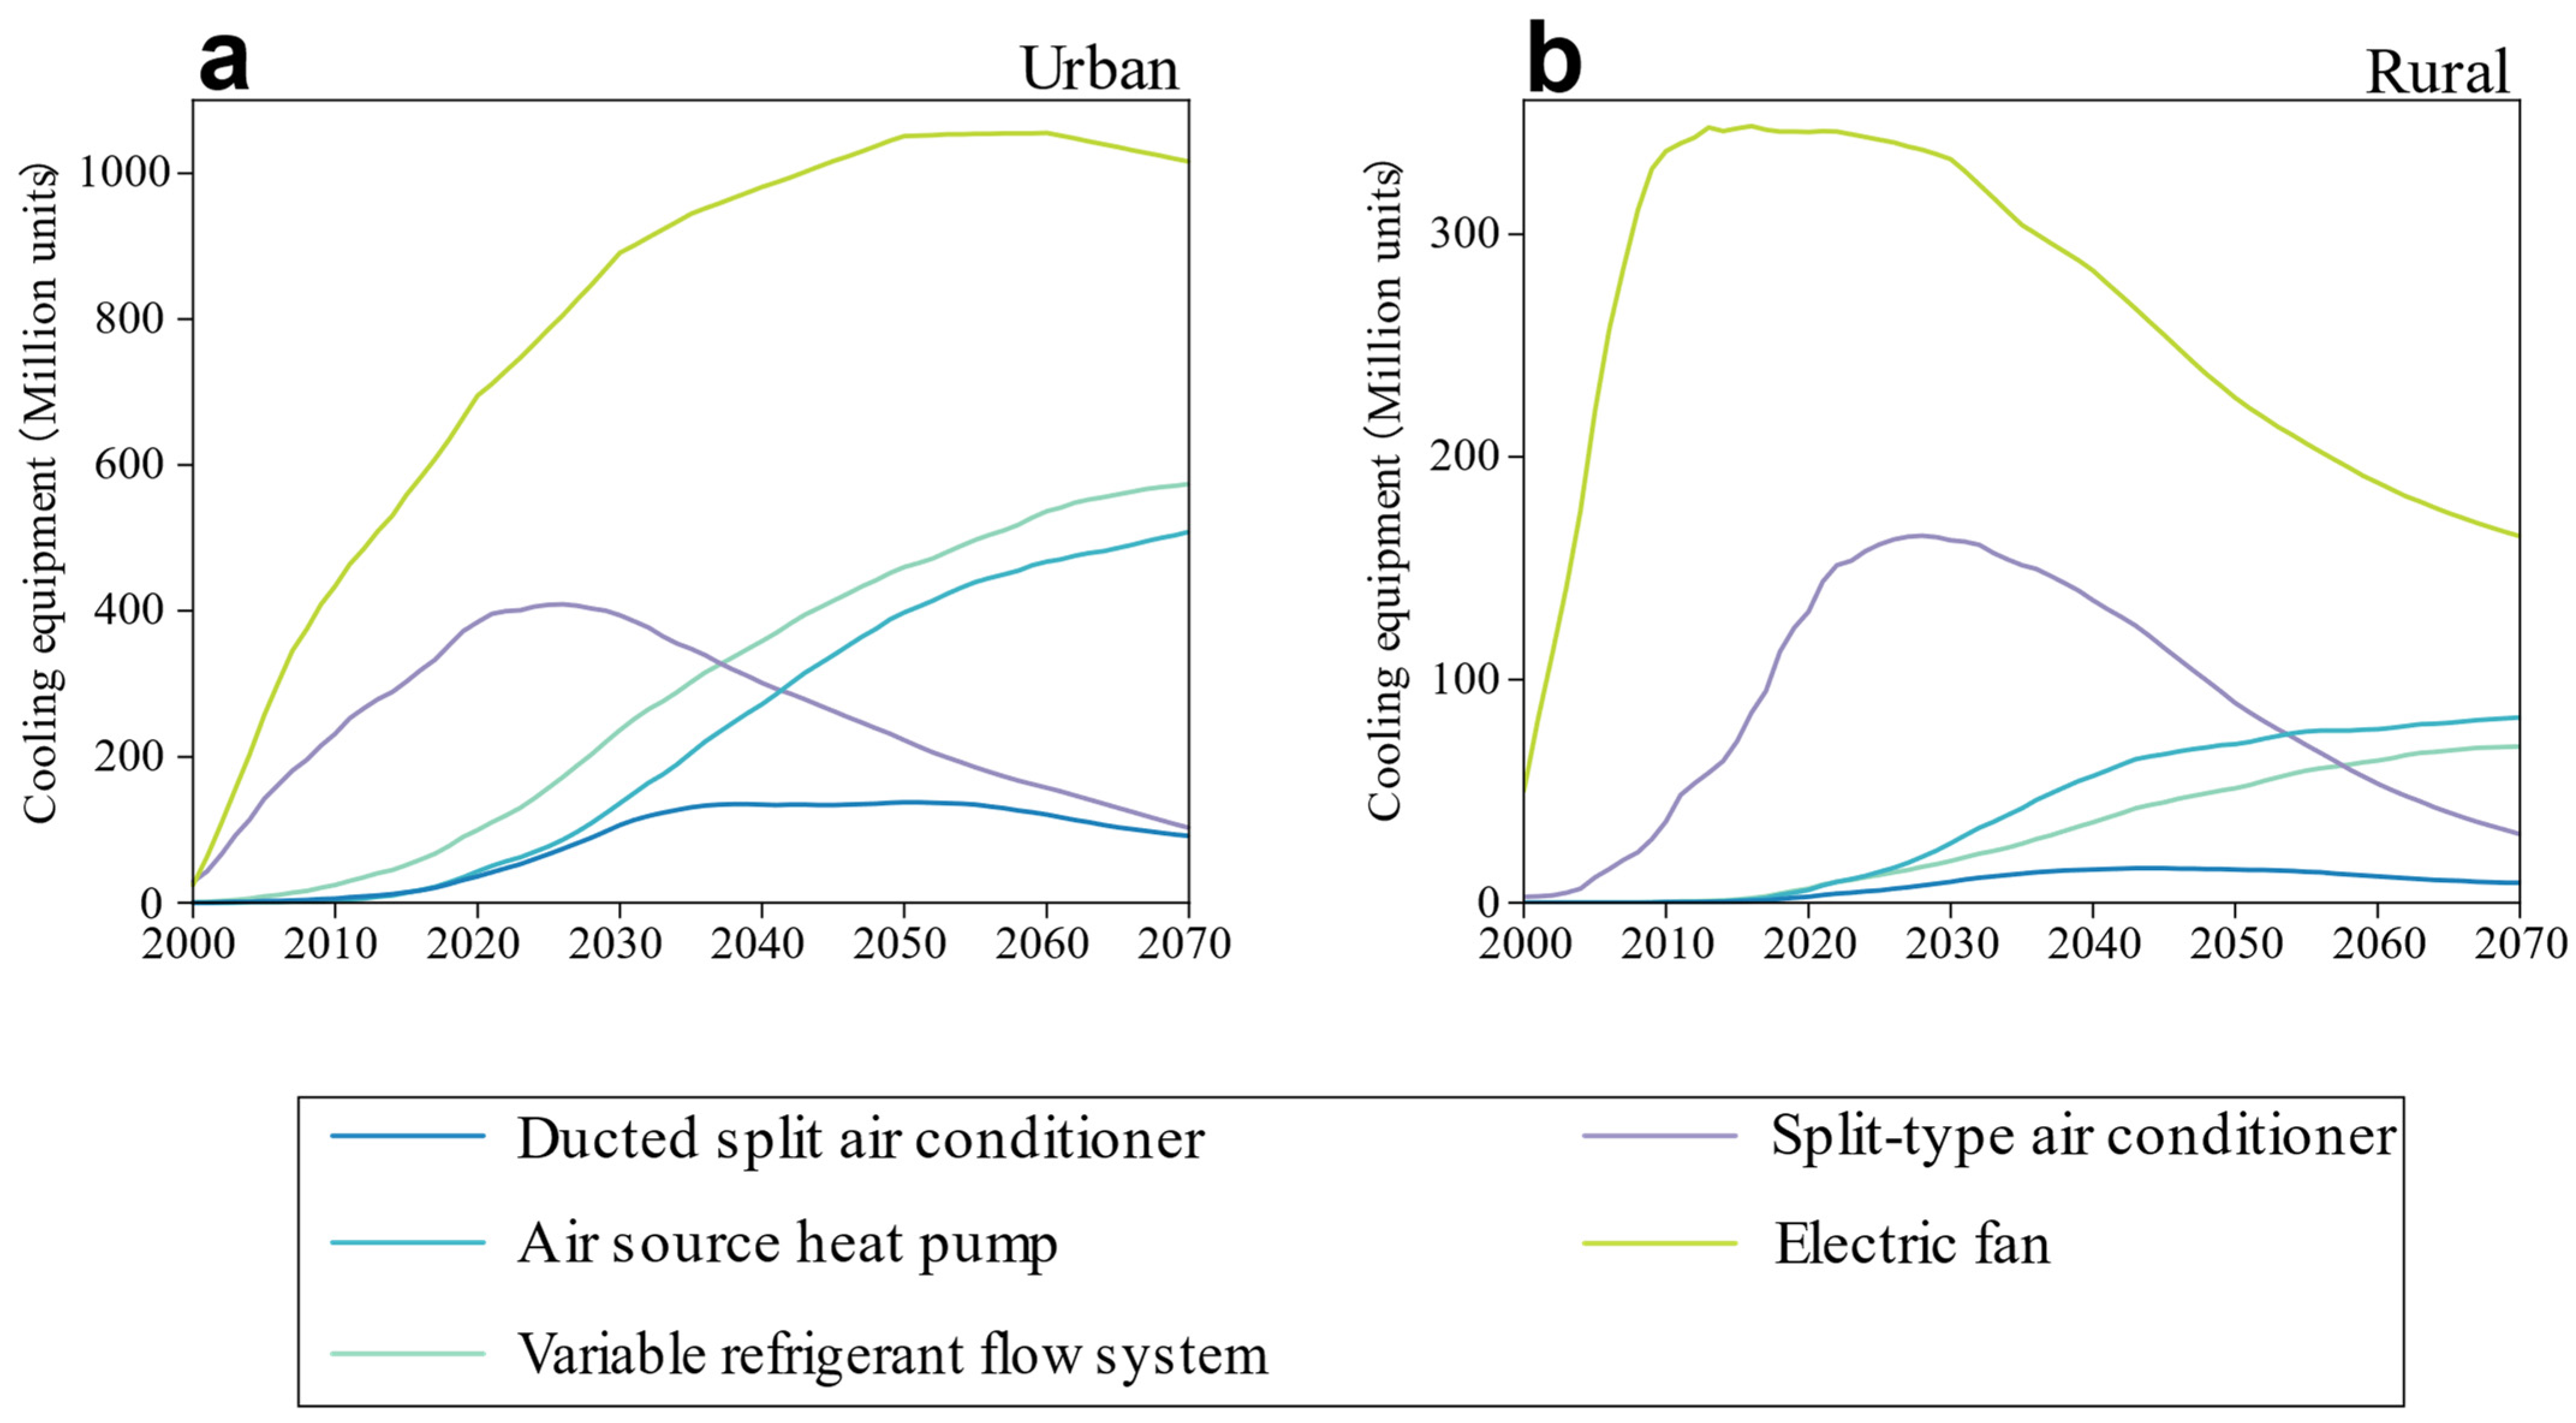
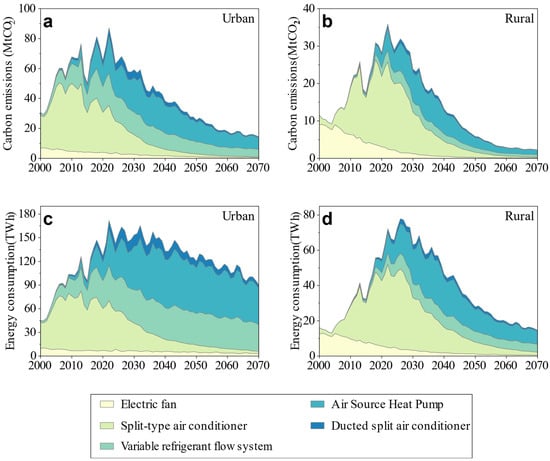
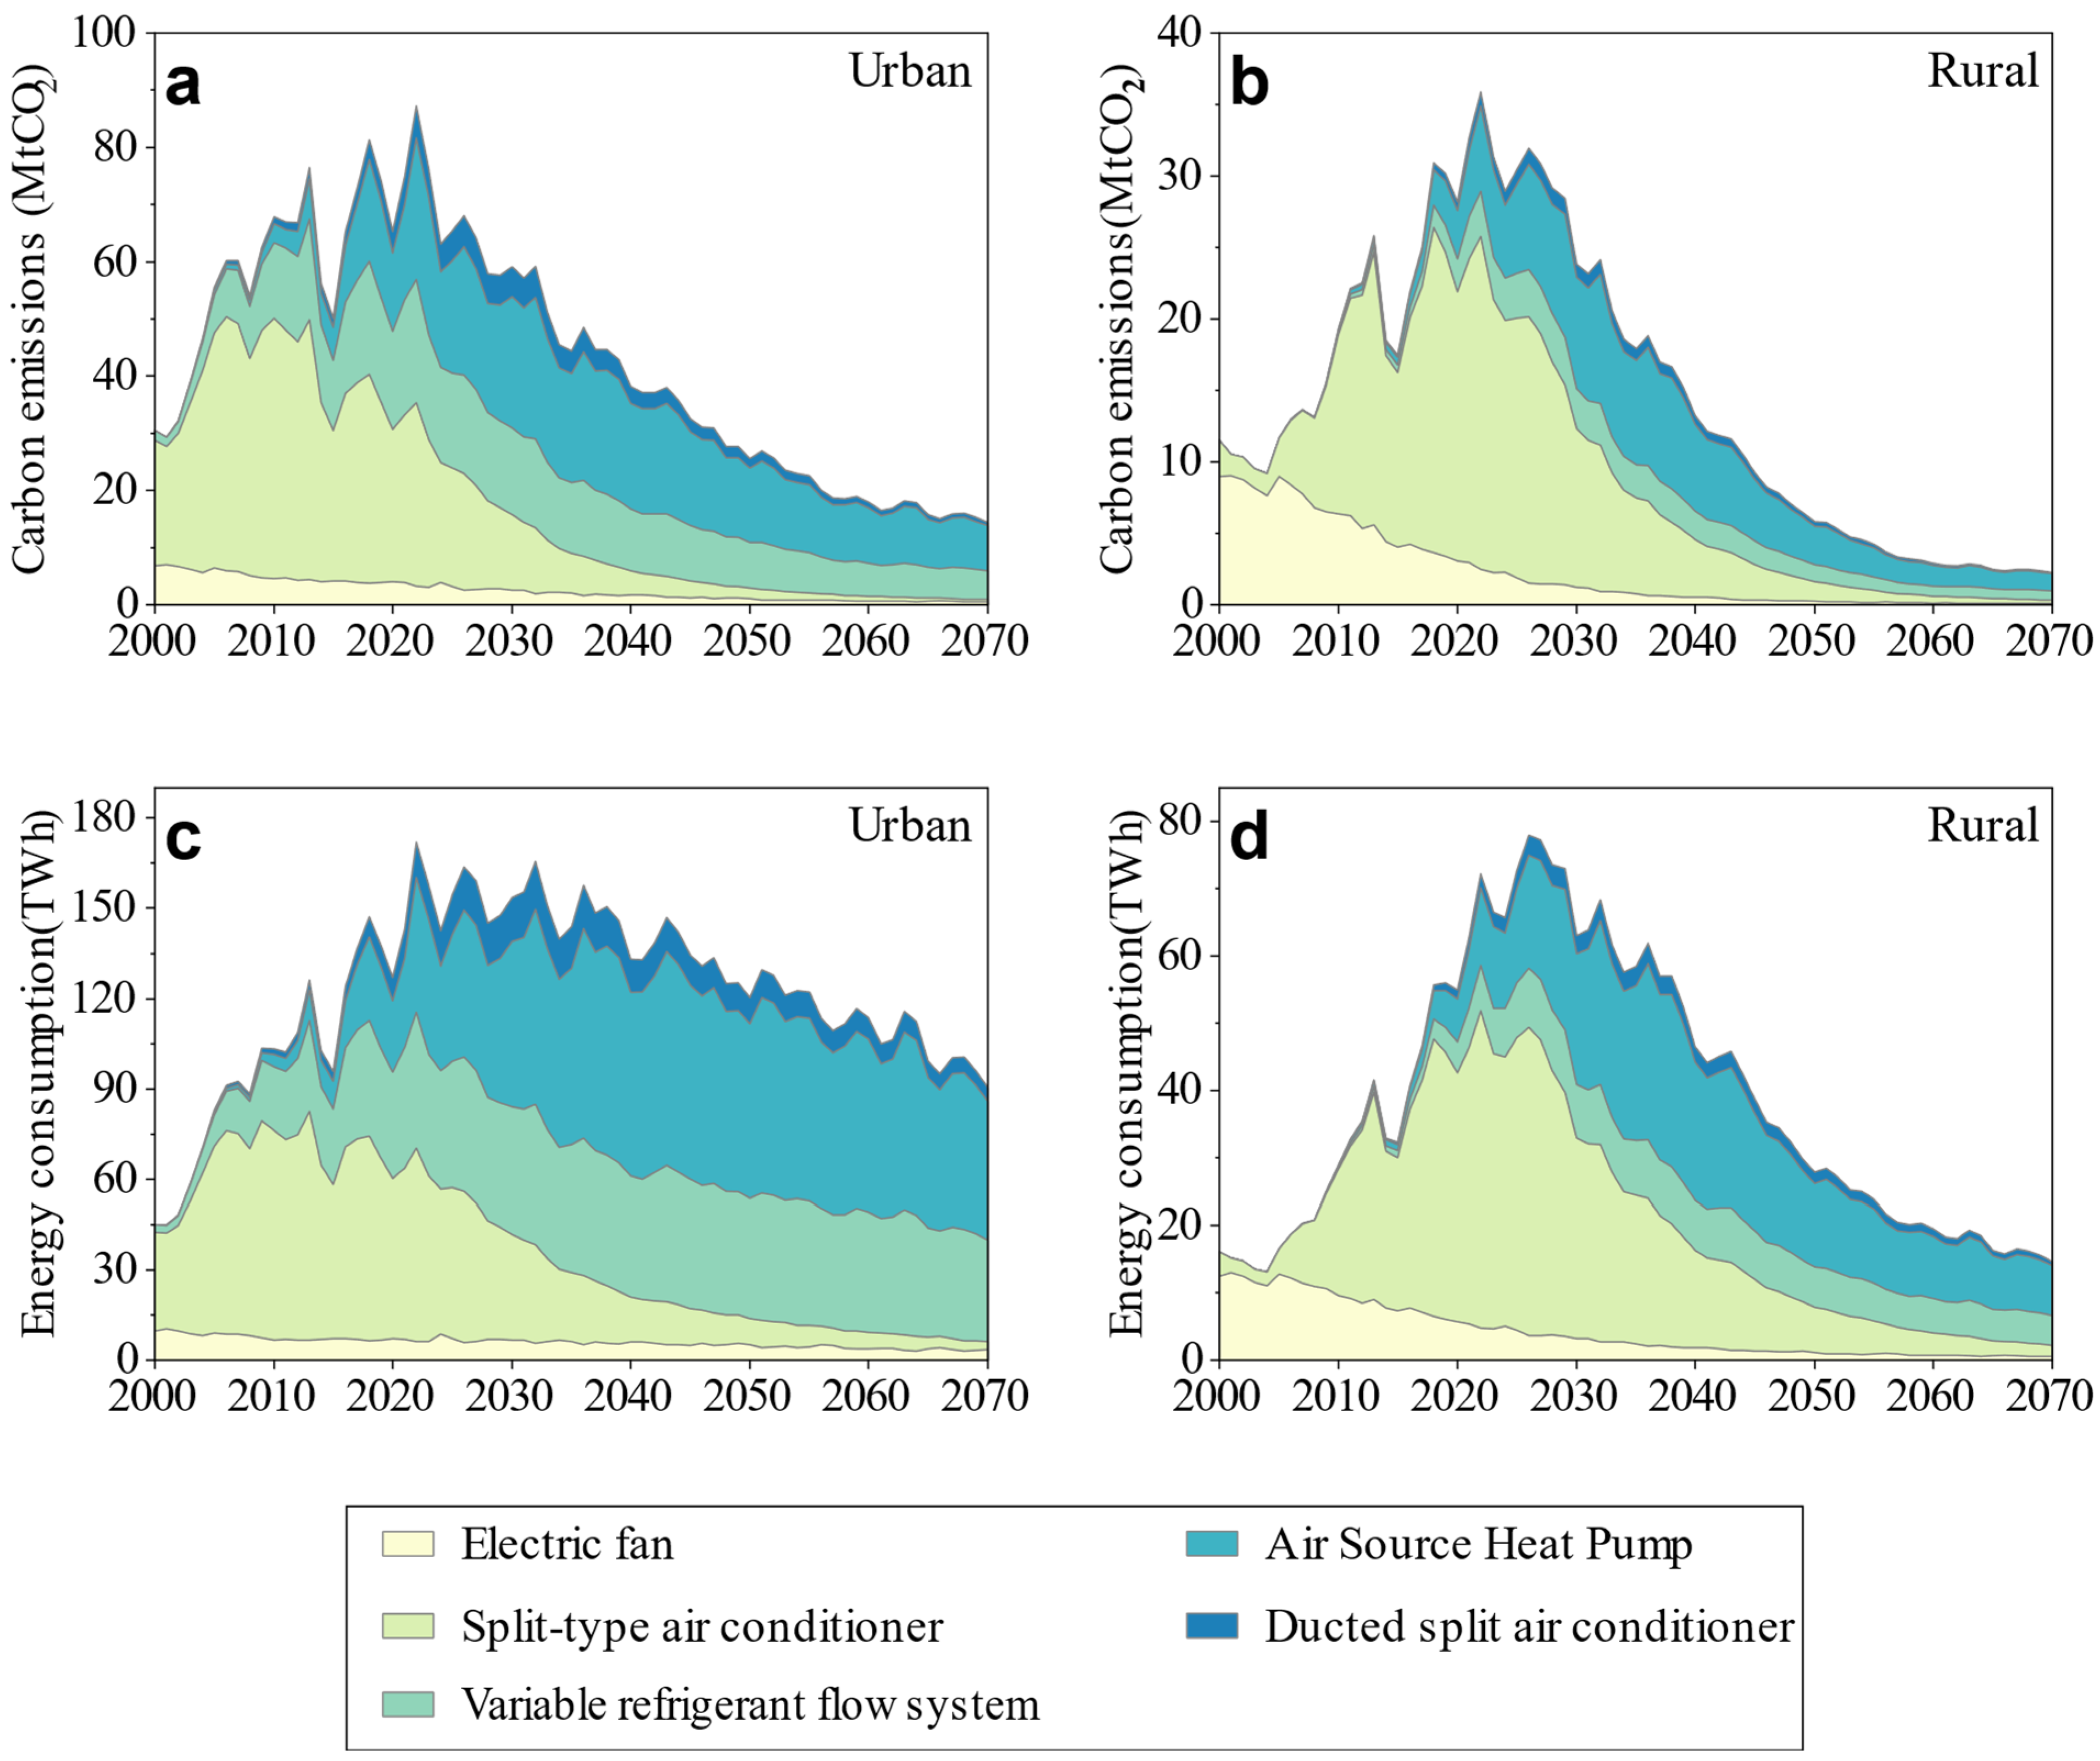
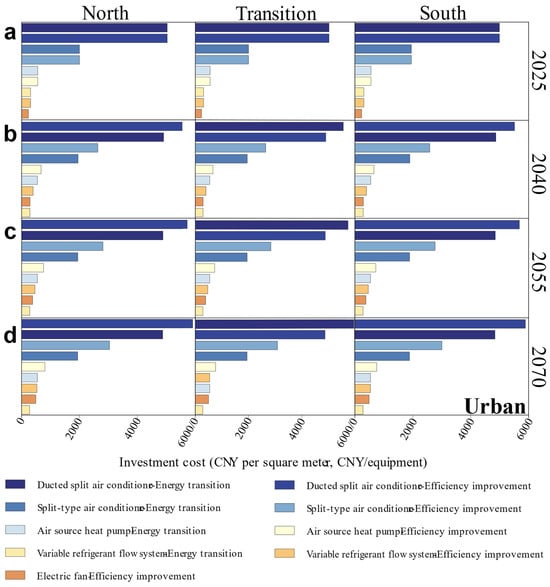
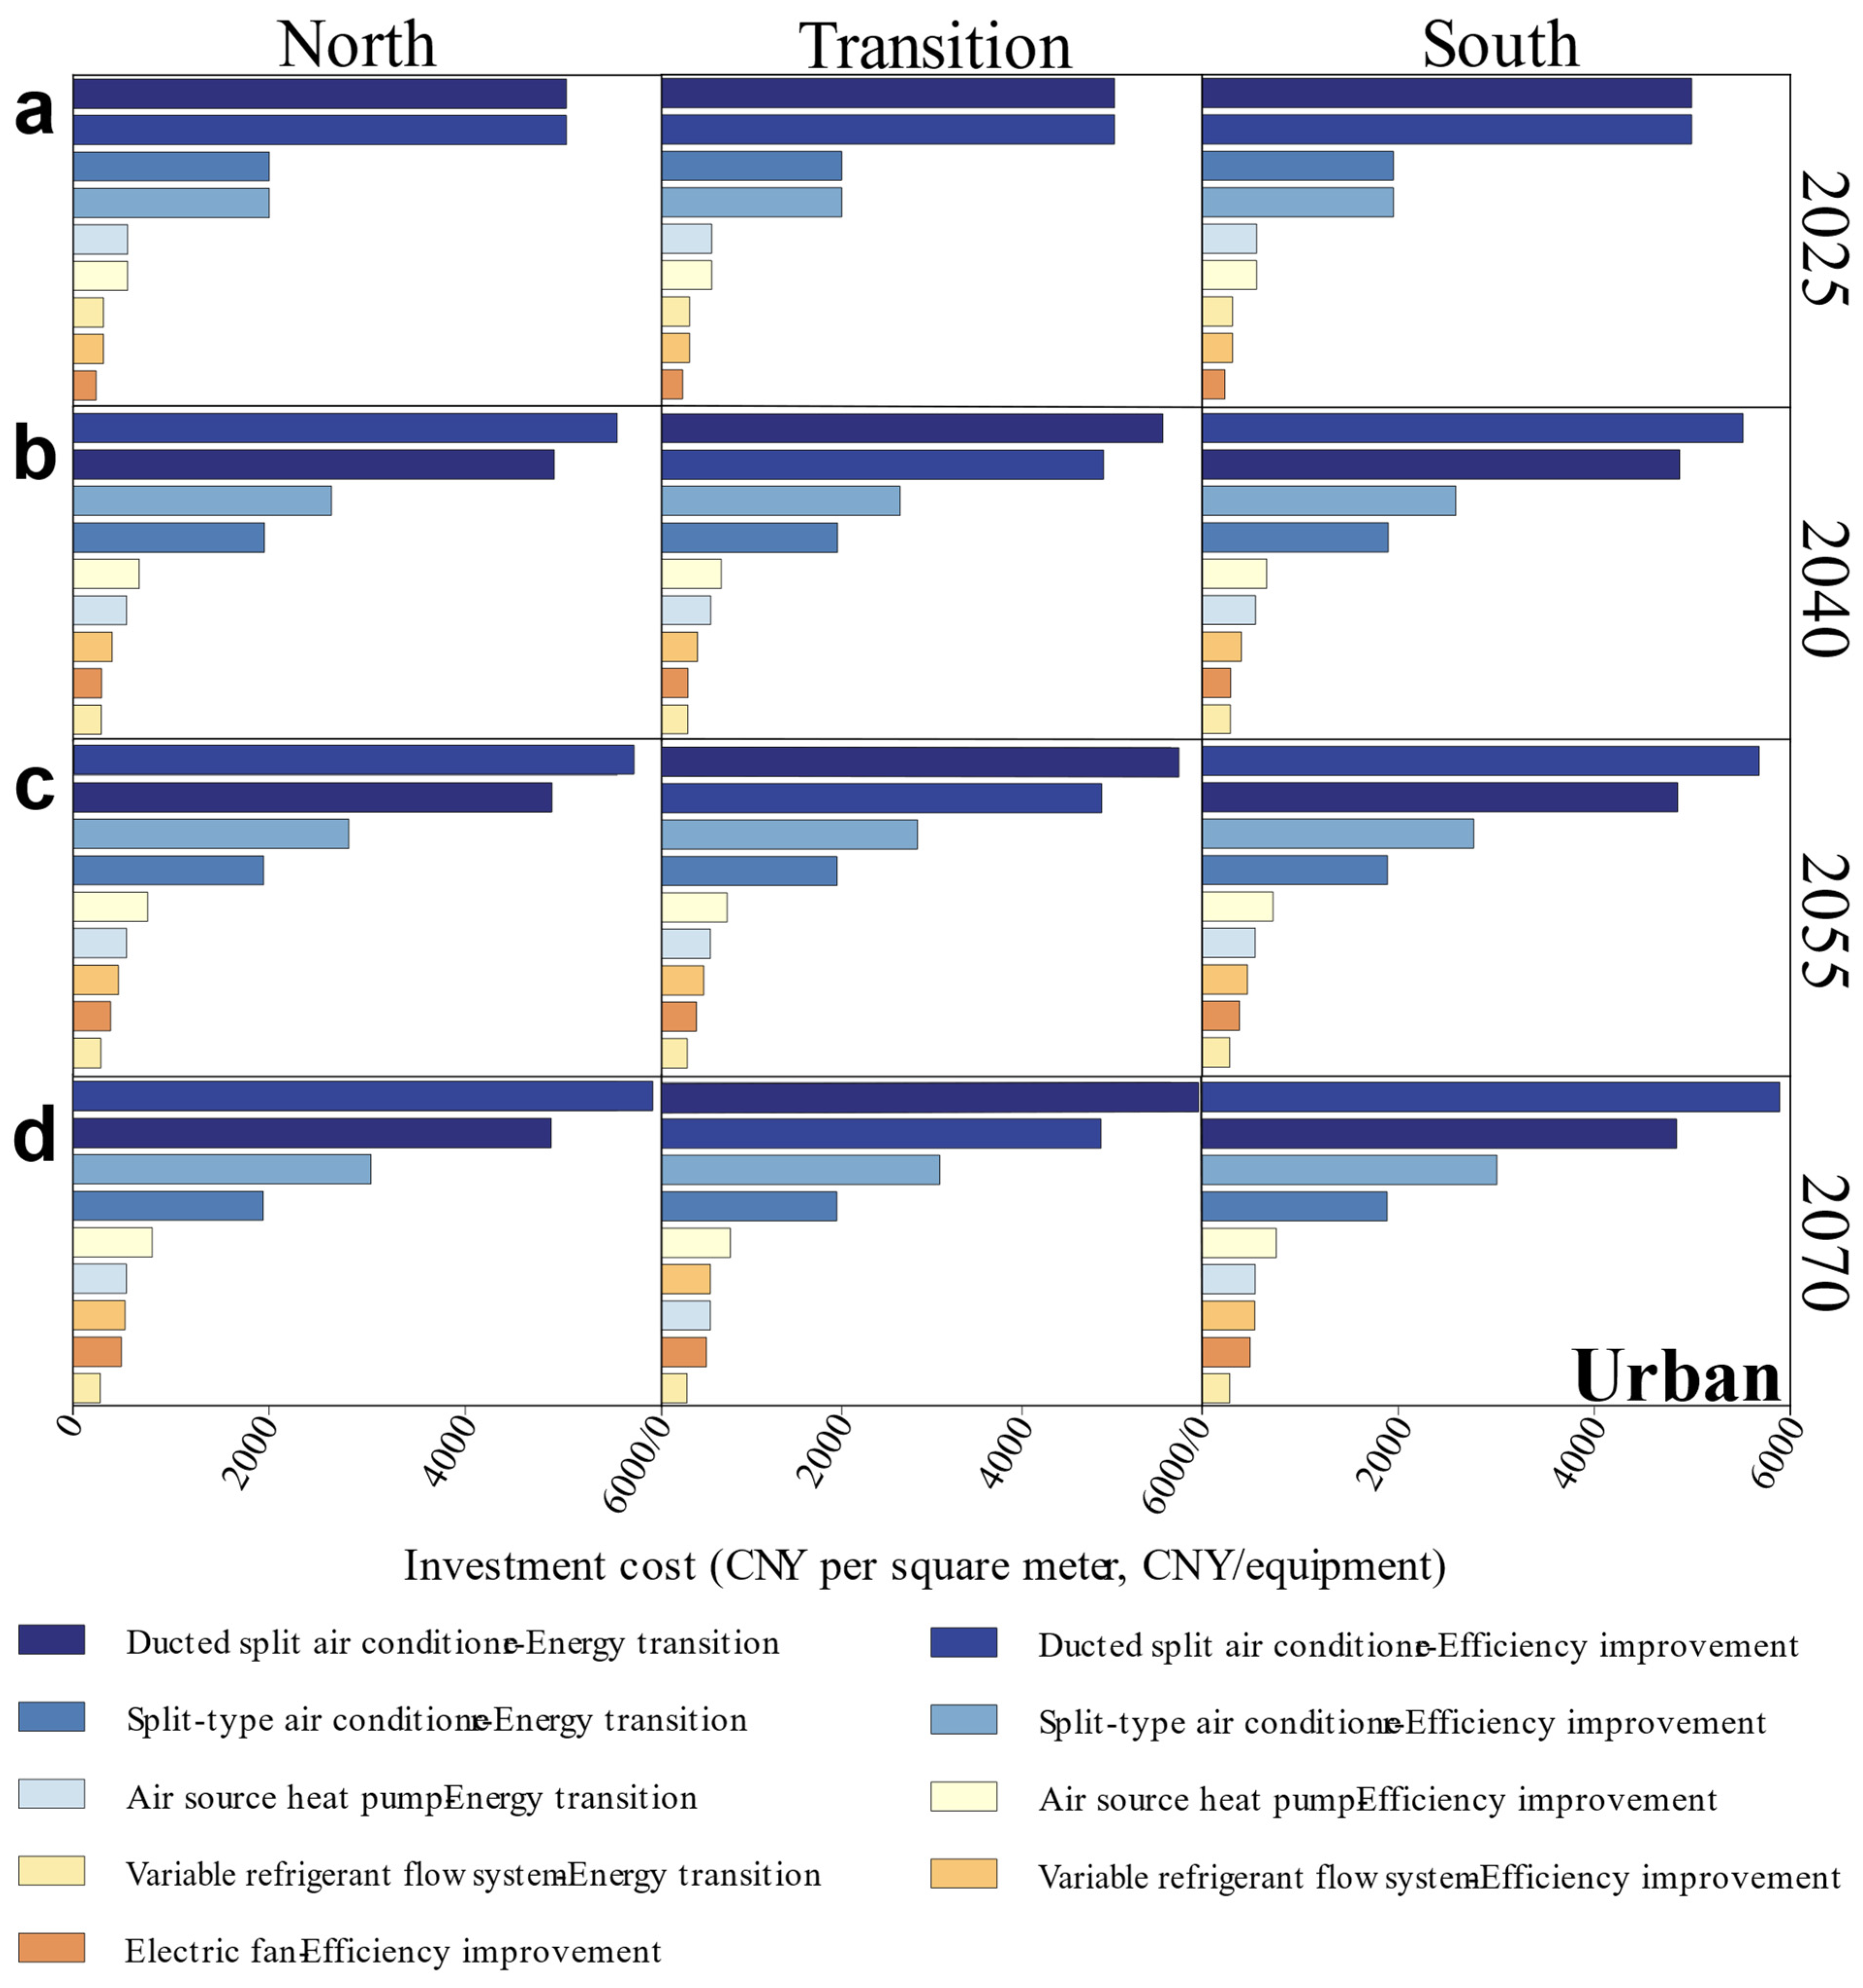
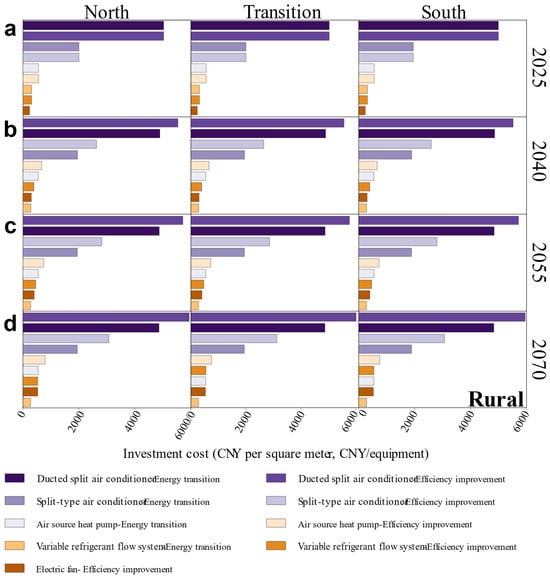
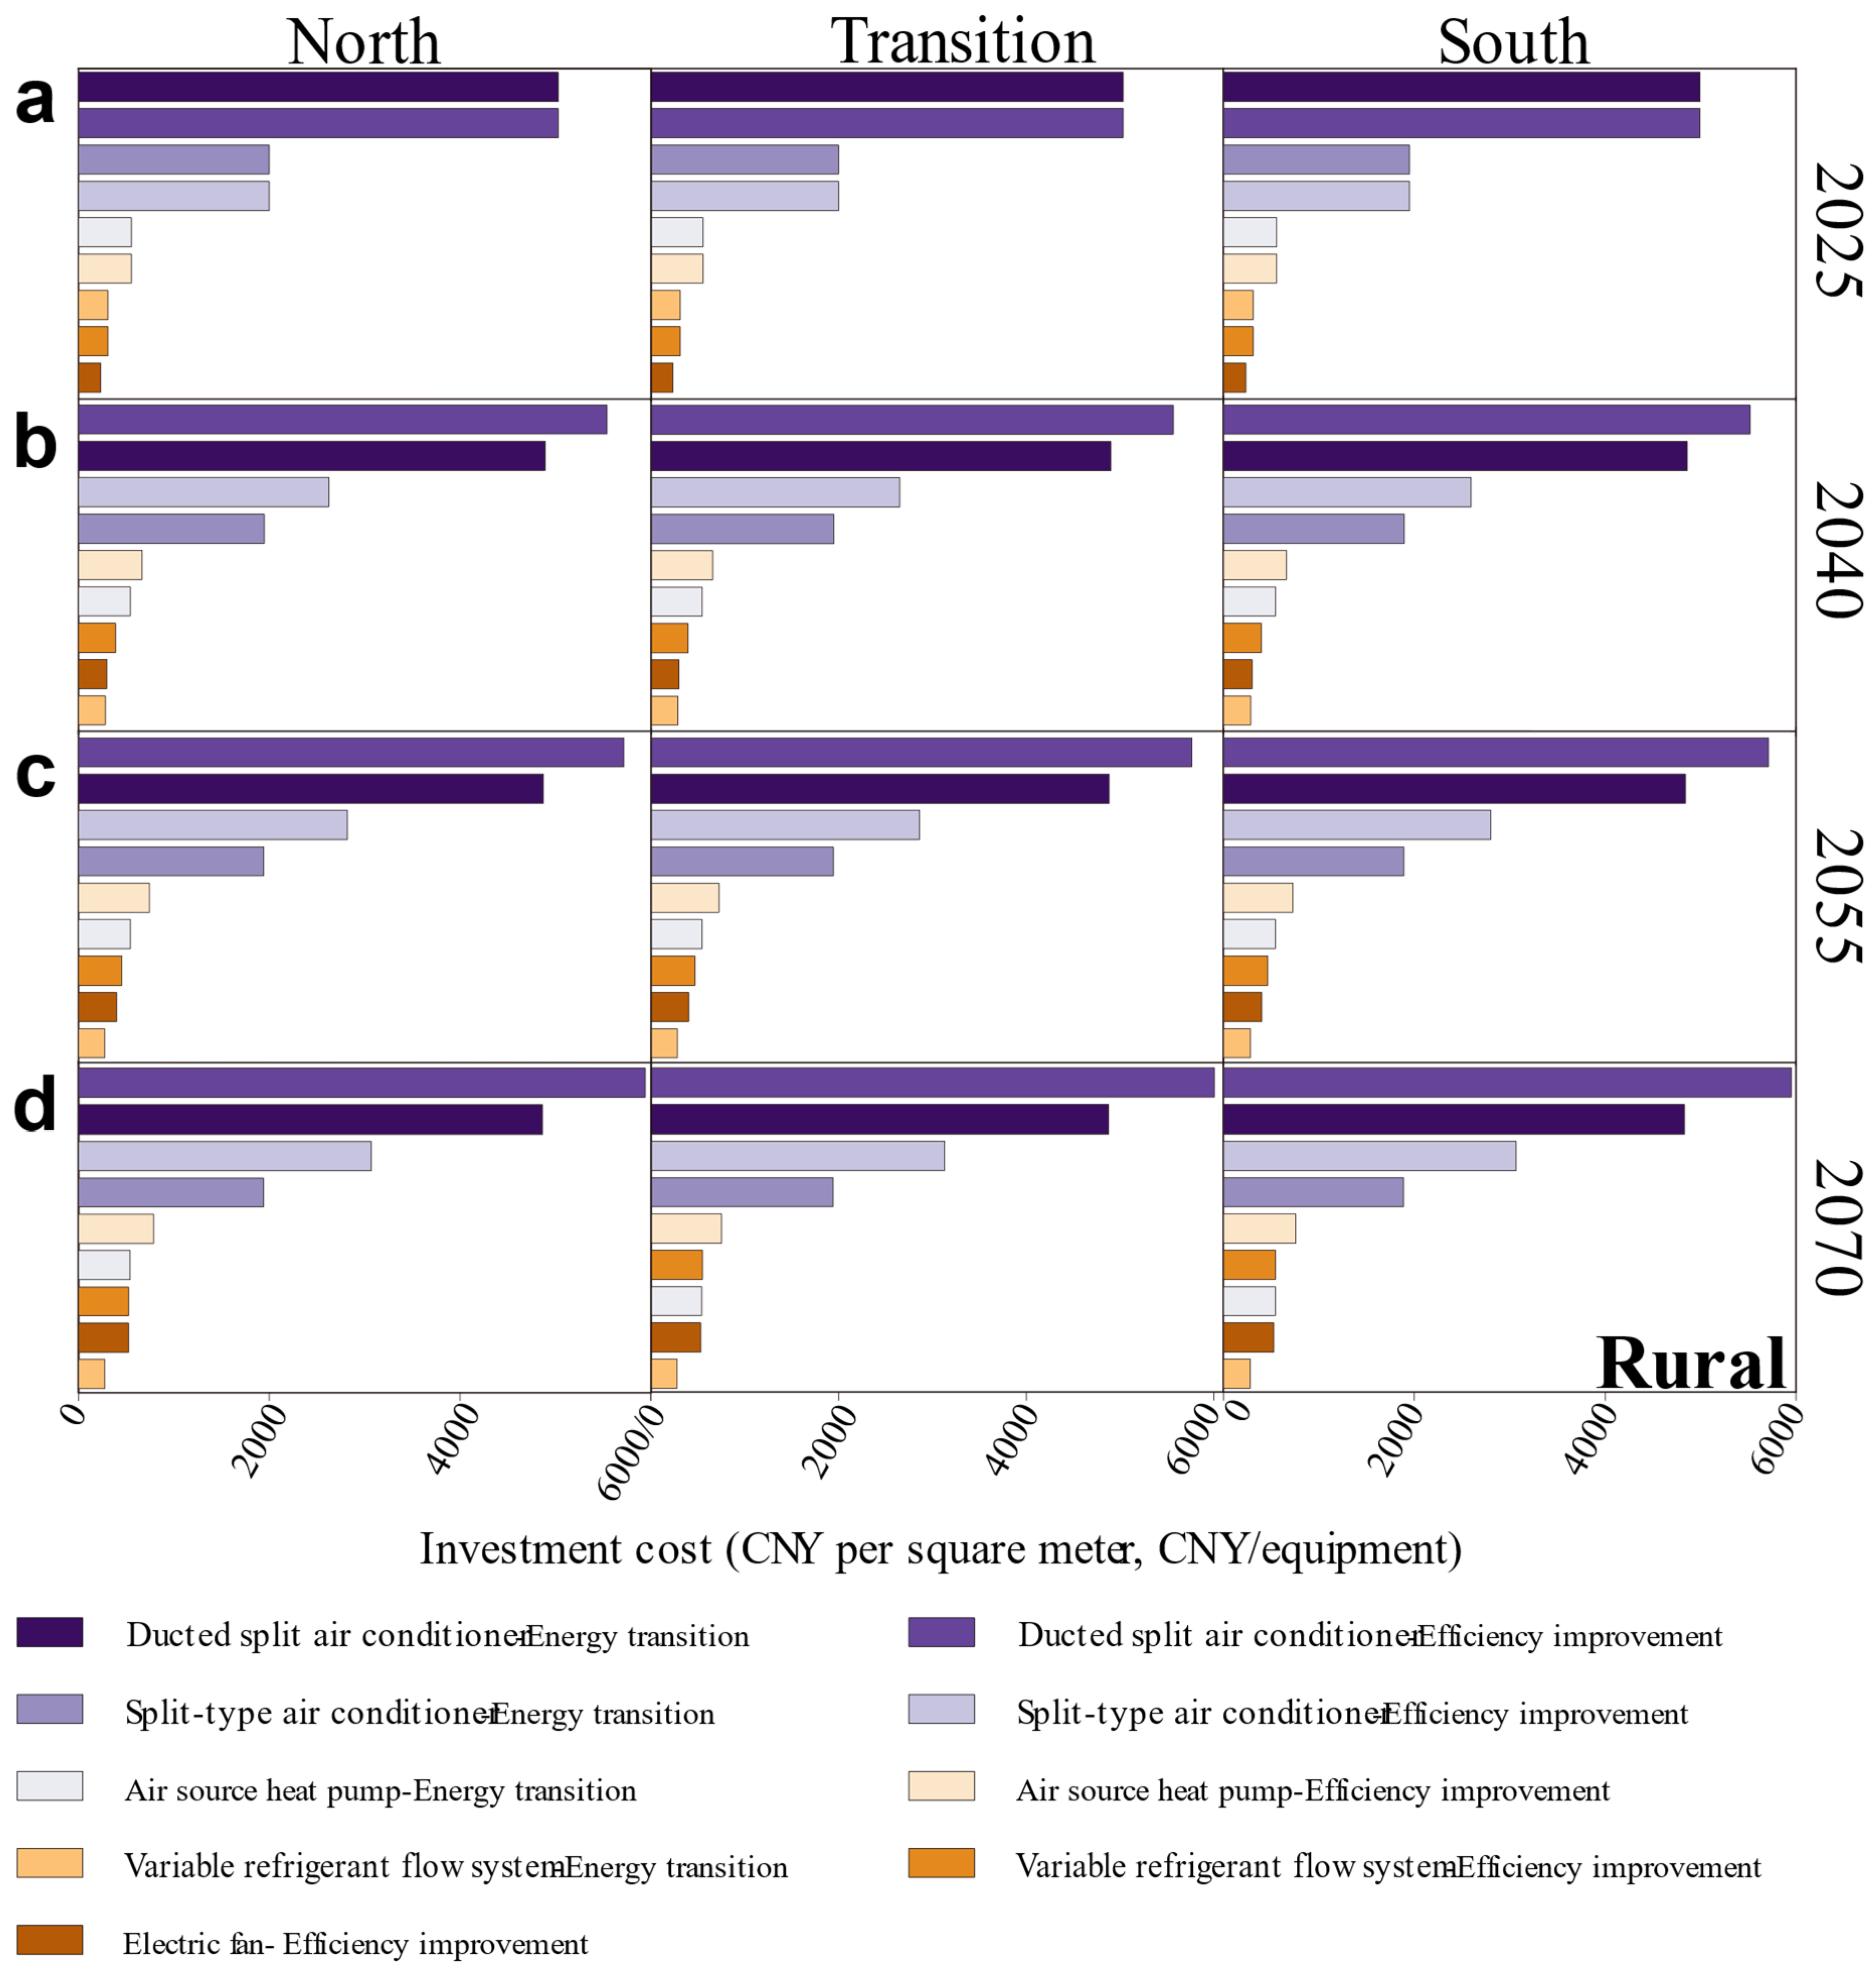
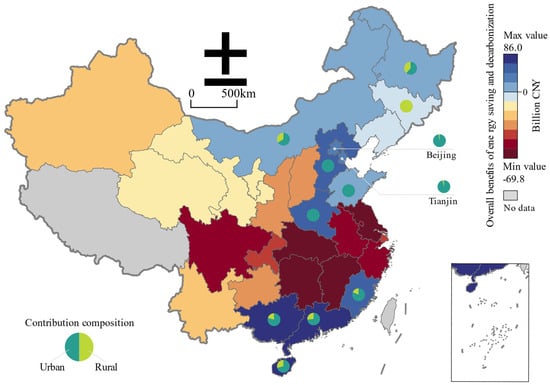
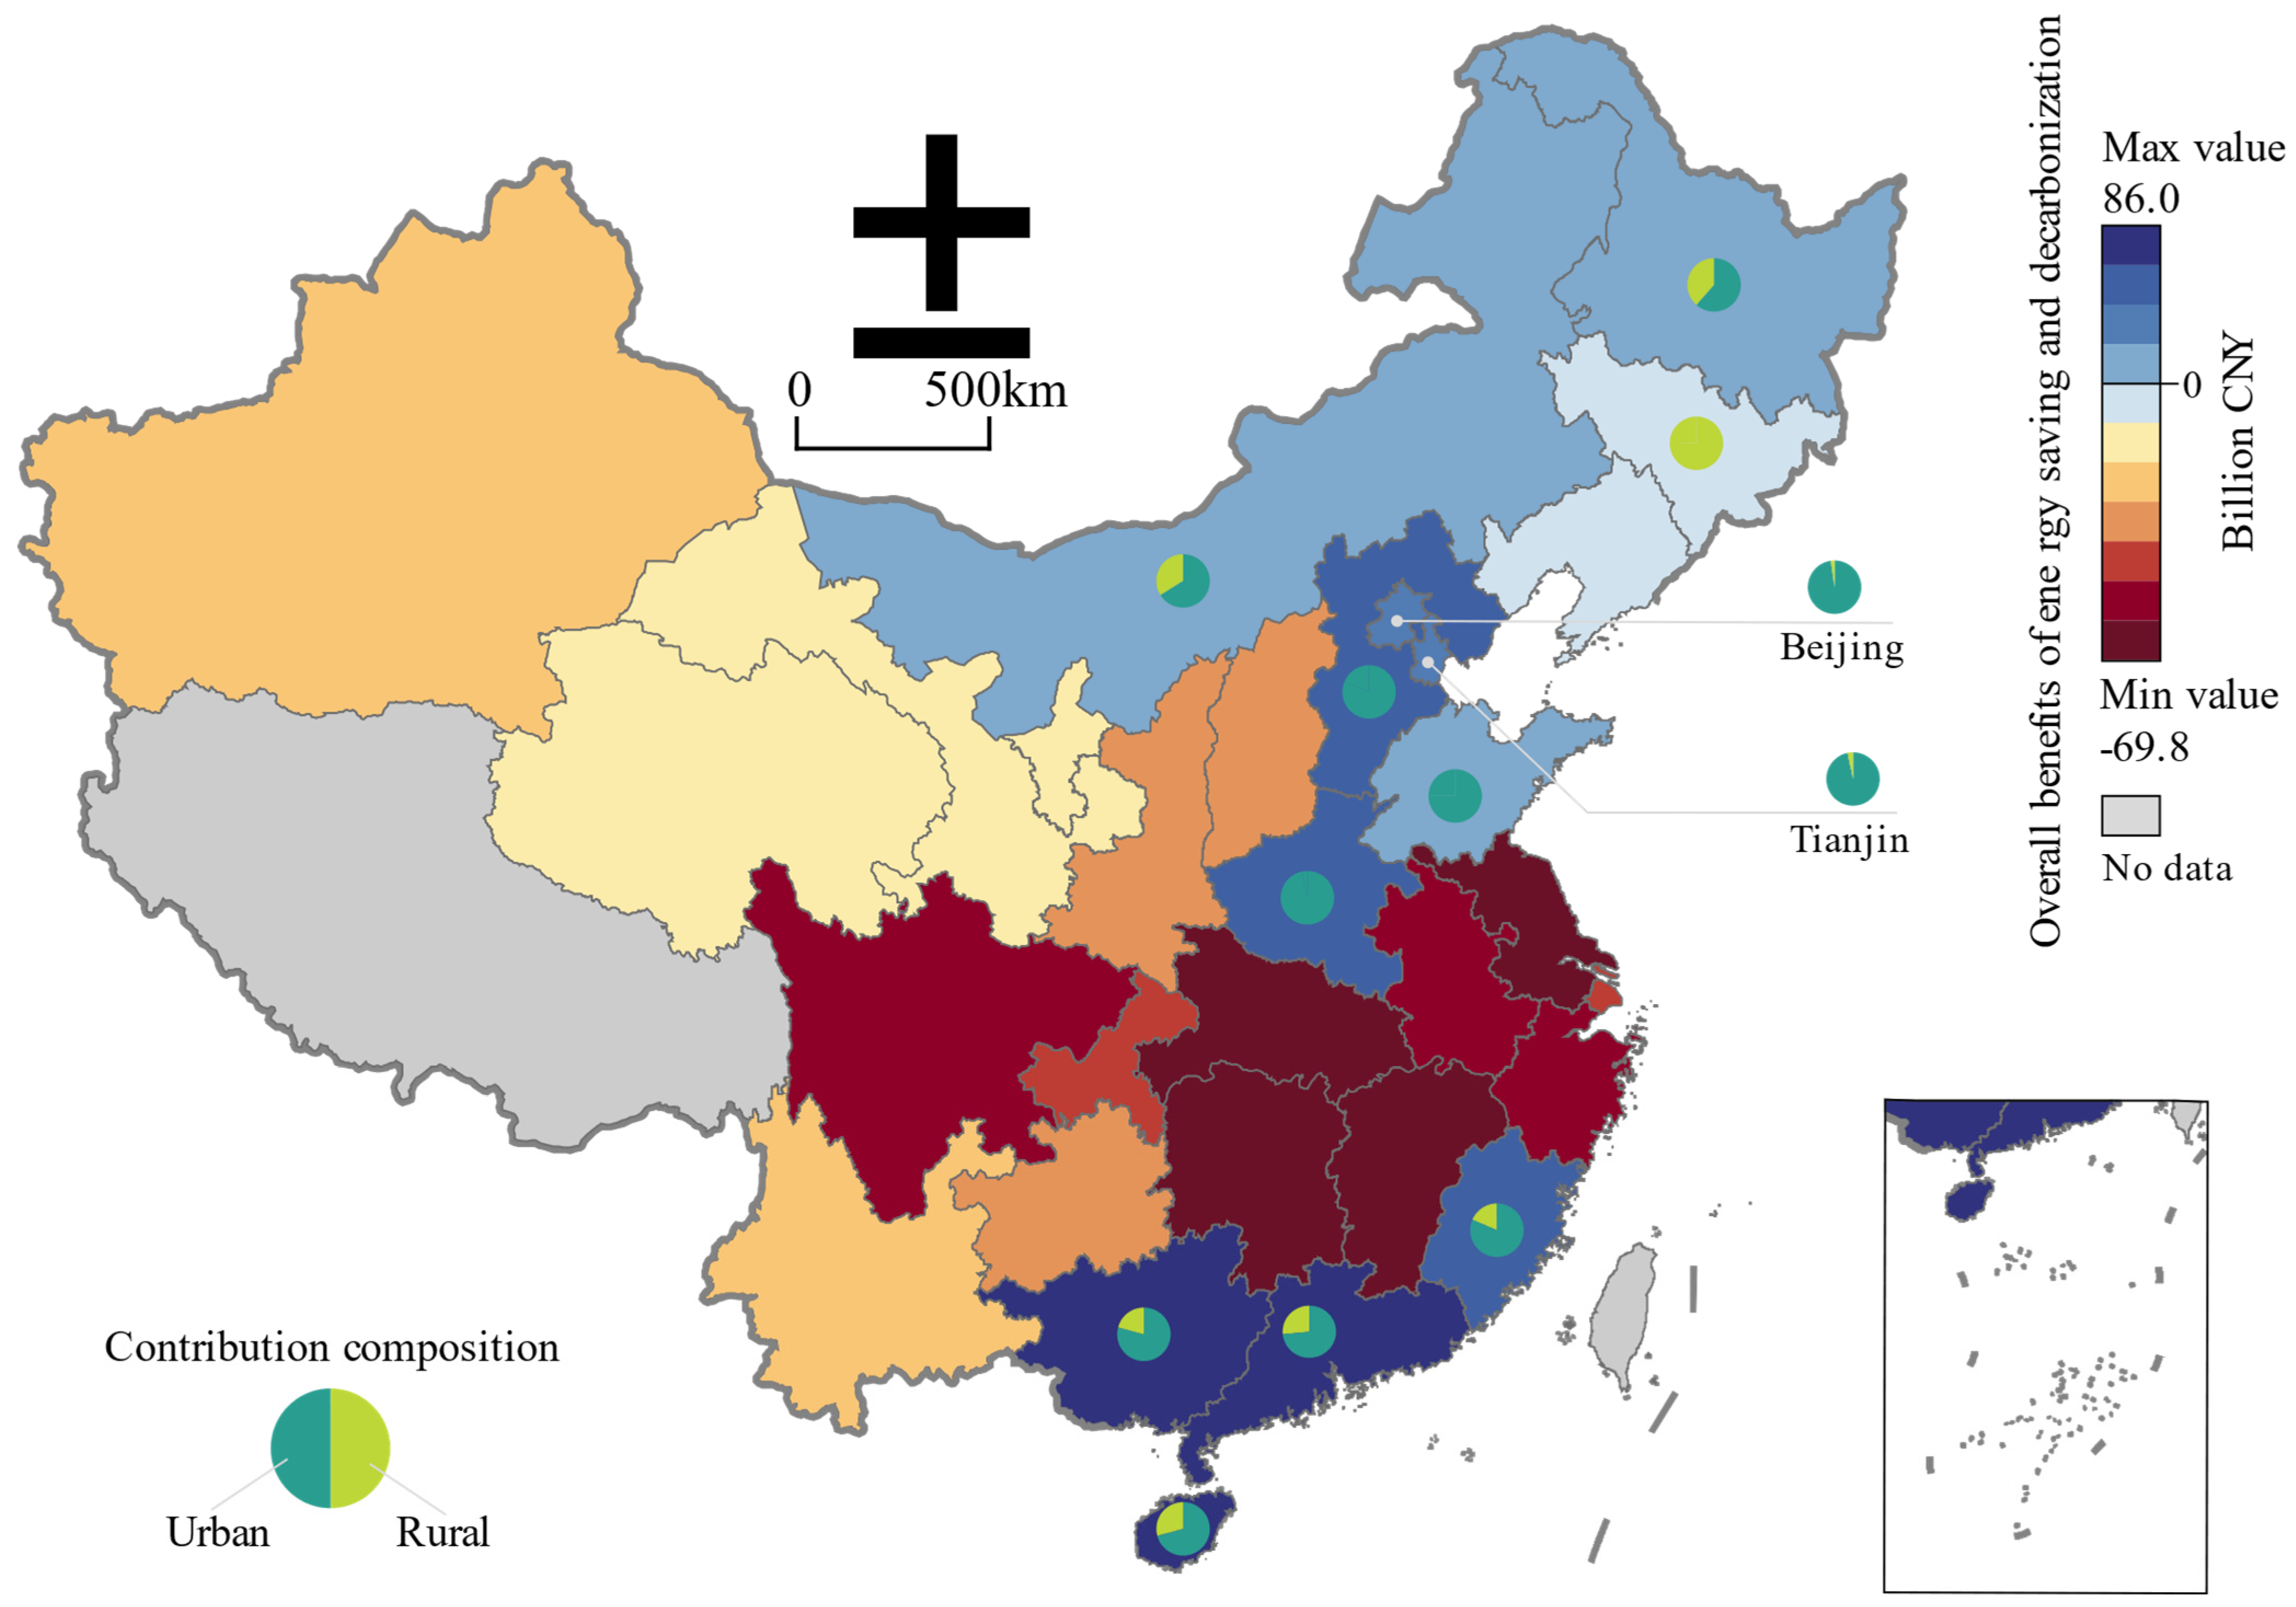
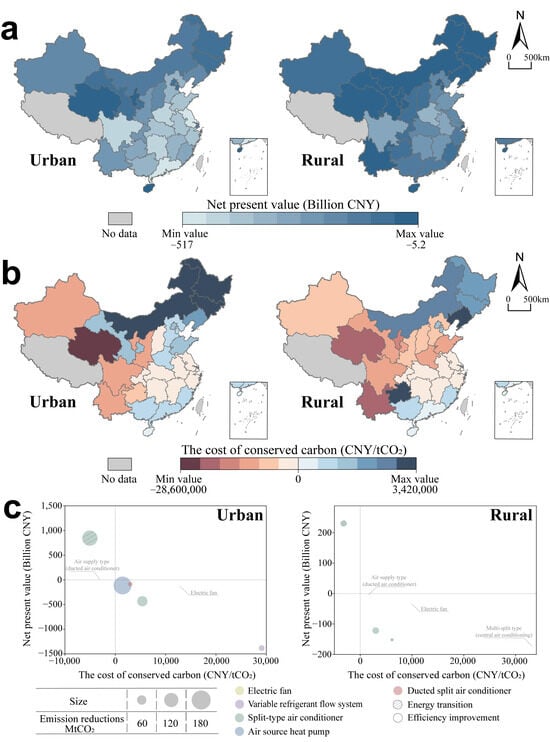
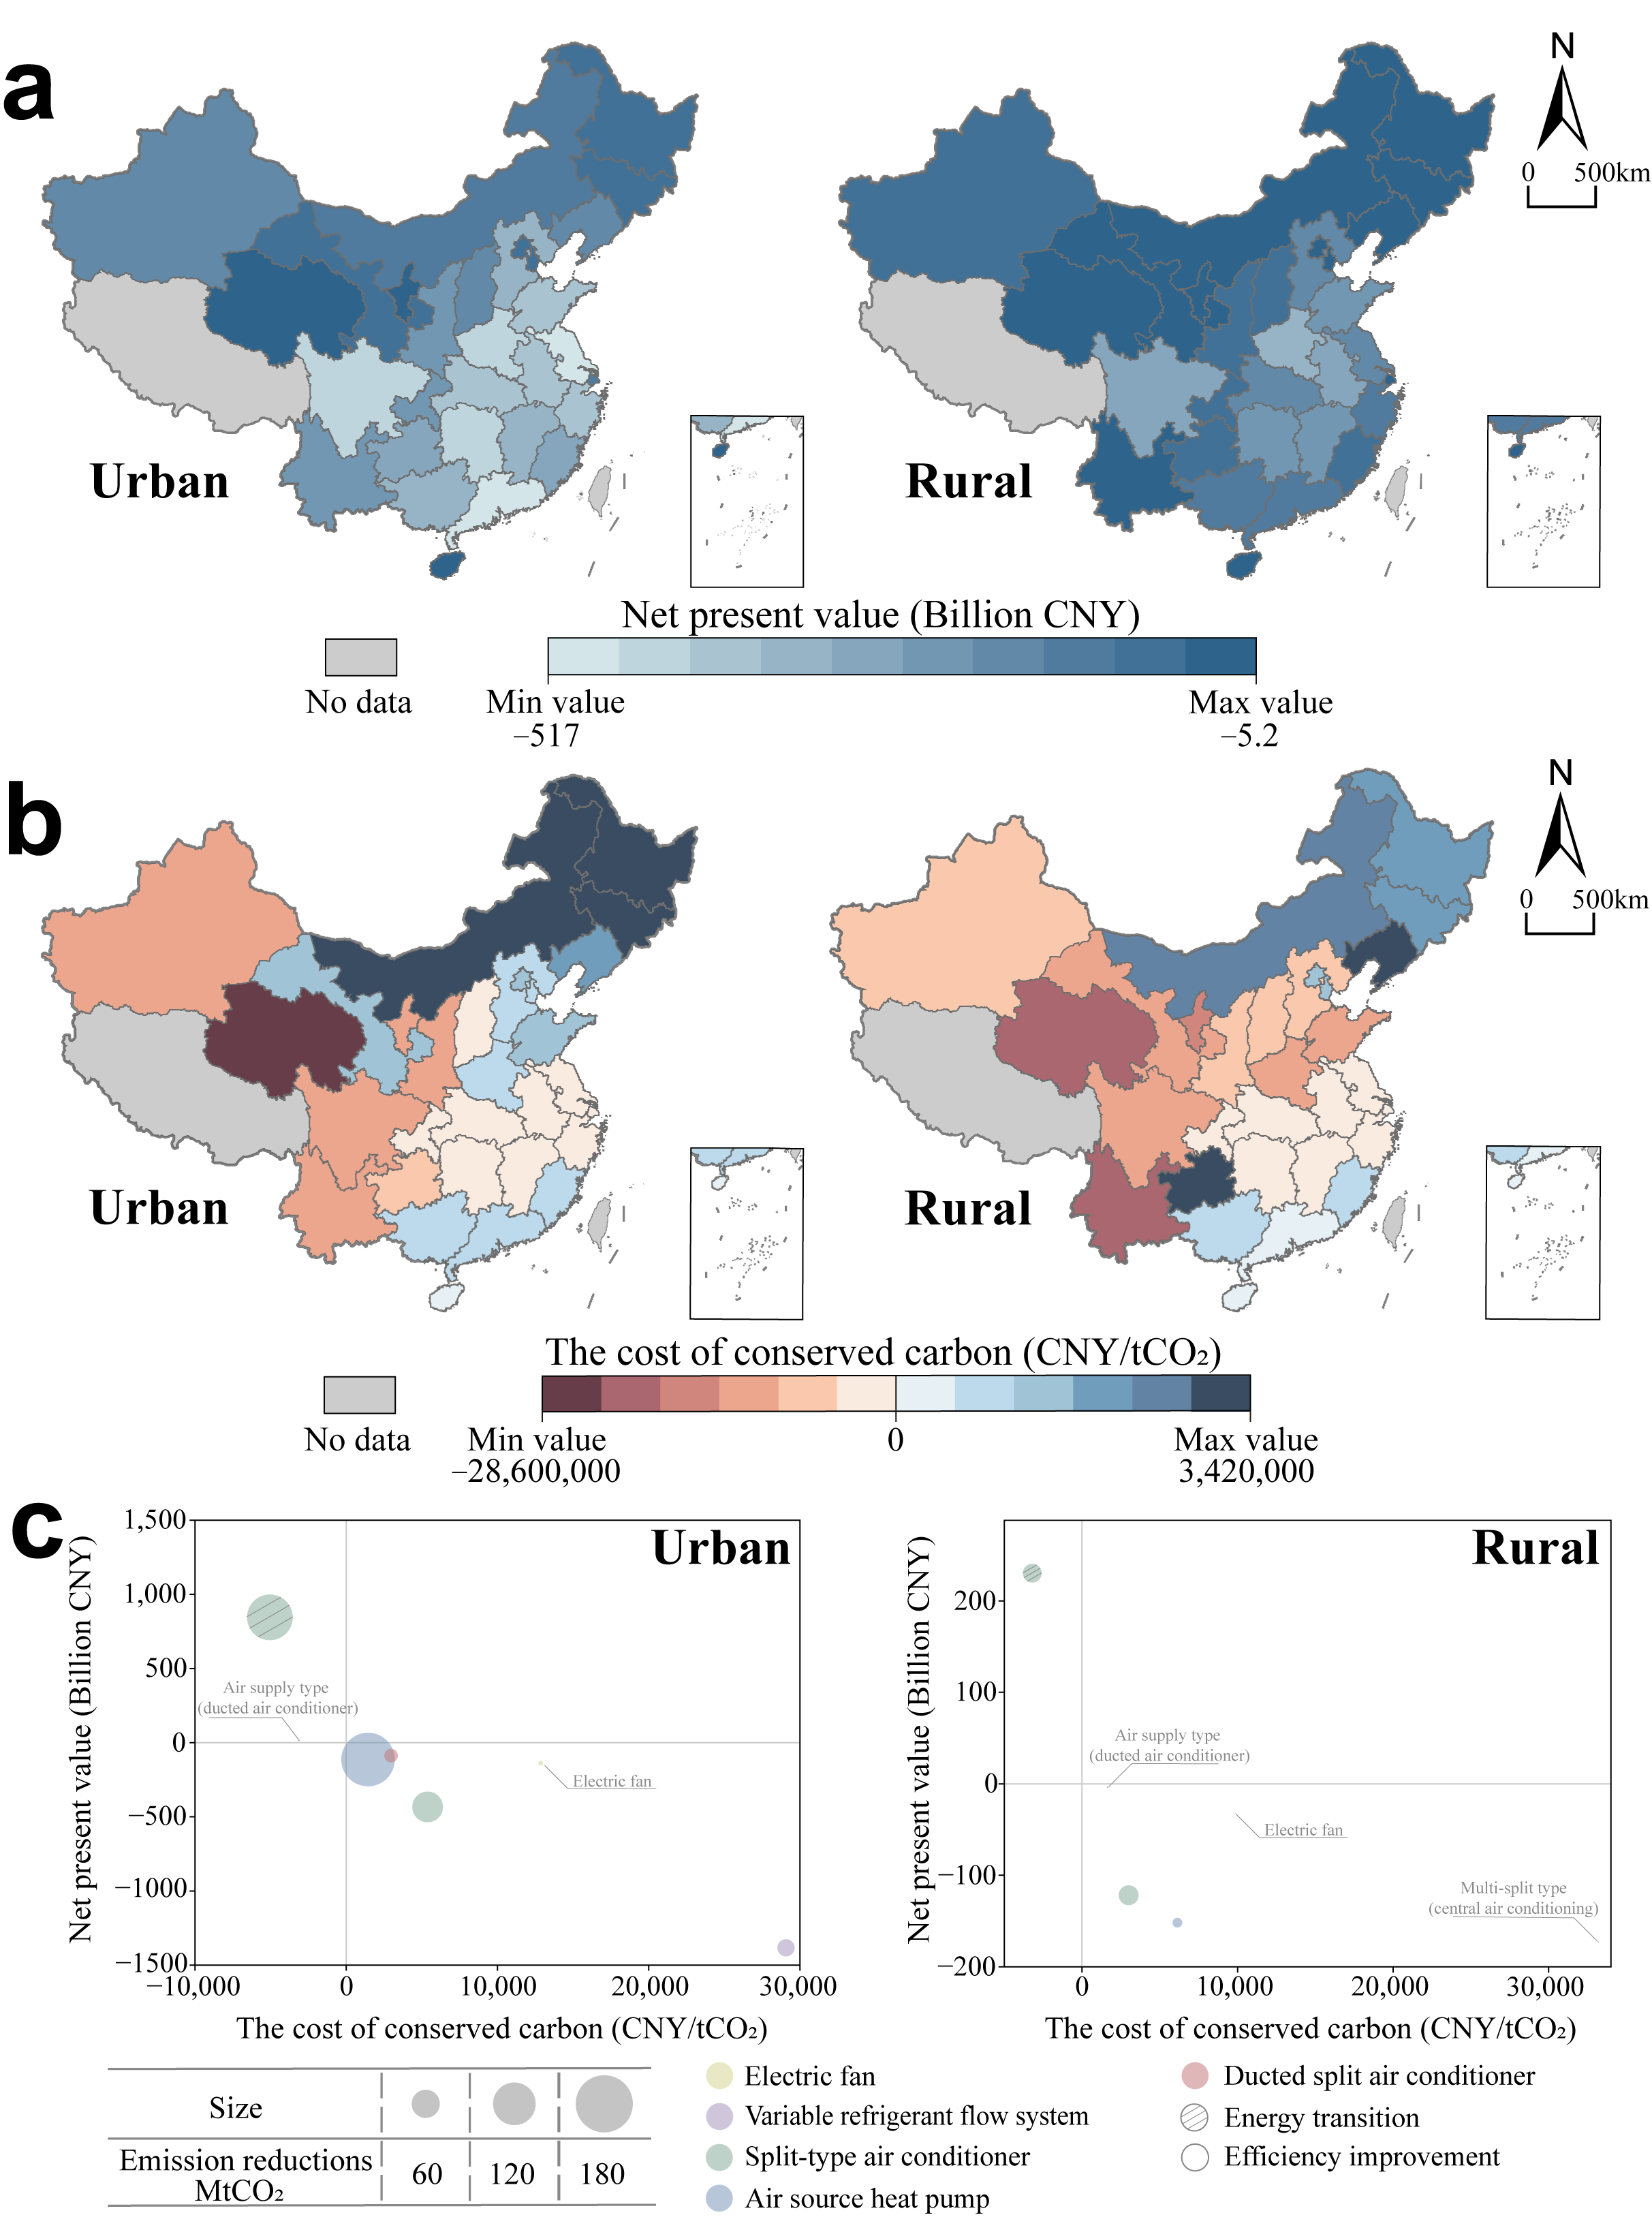
Disclaimer/Publisher’s Note: The statements, opinions and data contained in all publications are solely those of the individual author(s) and contributor(s) and not of MDPI and/or the editor(s). MDPI and/or the editor(s) disclaim responsibility for any injury to people or property resulting from any ideas, methods, instructions or products referred to in the content. |
© 2026 by the authors. Licensee MDPI, Basel, Switzerland. This article is an open access article distributed under the terms and conditions of the Creative Commons Attribution (CC BY) license.