


Abstract
This research aims to investigate the durability and behavior of Jordanian oil shale ash (OSA) as a substitute material for ordinary Portland cement (OPC) and Portland Pozzolana cement (PPC) in mortar under sulfate attack. Mortar samples with replacement ratios of 0%, 10%, 20%, and 30% of OSA were utilized in this investigation. The study is divided into two stages. In the first stage, the effect of OSA replacement on the mechanical properties and hardening time of mortar samples is examined over a curing period of 3, 7, 14, and 28 days using potable water. The second stage focuses on studying the durability of mortar samples with the aforementioned OSA replacement ratios. These mortar samples are fully immersed in a sodium sulfate solution with a concentration of 5% and subjected to wet and dry cycles for degradation at 1, 6, 12, 18, 24, 30, and 36 days. Various analyses were conducted, including compressive strength testing, SEM analysis, mass loss measurement, ultrasonic pulse velocity assessment, relative dynamic modulus of elasticity (RDME) evaluation, and visual inspection. For OPC-based mortars, compressive strength ranged from 44.00 to 49.75 MPa (0% OSA), 42.88 to 48.29 MPa (10% OSA), 44.50 to 50.88 MPa (20% OSA), and 31.00 to 36.53 MPa (30% OSA). For PPC-based mortars, compressive strength ranged from 36.00 to 42.32 MPa (0% OSA), 39.73 to 43.60 MPa (10% OSA), 44.97 to 46.06 MPa (20% OSA), and 22.35 to 28.18 MPa (30% OSA). Specimens with 0%, 10%, and 20% OSA showed continued increases in compressive strength, UPV, and RDME throughout exposure, while 30% OSA specimens showed deterioration after 24 days (OPC) and 18 days (PPC), with mass losses increasing from 0.52% to 8.4% (OPC) and 0.75% to 7.8% (PPC). The results indicate that while moderate OSA replacement (up to 20%) may be viable under sulfate exposure, 30% replacement leads to significant deterioration. However, the absence of non-sulfate controls prevents definitive separation of continued hydration from sulfate resistance. These findings provide practical guidance for the use of OSA in sulfate-prone environments.
1. Introduction
Oil shale ash (OSA) is a byproduct of the oil shale industry and has gained attention as a potential replacement for ordinary Portland cement (OPC) in construction materials [1,2,3,4]. This literature review aims to provide an overview of the research conducted on the utilization of OSA as a partial replacement for OPC, focusing on its impact on the properties and performance of cement-based materials [5,6,7]. The rapid growth of population and urbanization has led to a significant demand for construction materials, including cement and concrete, in buildings and infrastructure systems [1,8,9]. However, the production of ordinary Portland cement (OPC) consumes a large amount of energy [10,11] and releases substantial carbon dioxide emissions [12,13]. To address these challenges, researchers in construction science have been exploring alternative resources such as silica fume, fly ash, volcanic tuff, feldspar, and oil shale ash (OSA) to be used as substitutes in mortar mixtures [14]. Studies have focused on the utilization of Jordanian OSA as a major raw material or filler in Portland cement mortar and concrete [15,16]. Various mixtures with different water-to-binder ratios and different proportions of OSA cement and/or sand have been created and analyzed [17,18,19]. The findings show that substituting OSA for approximately 10% of the total weight ensures optimal compressive strength, while replacing up to 30% does not significantly diminish the compressive strength [20]. Despite OSA having a limited amount of cementitious value on its own, its chemical composition is significantly influenced by the components of oil shale [19,21,22]. As a result, shale rich in silica can produce ash with notable pozzolanic properties, which can be incorporated with Portland cement to create innovative blended cement [23,24,25]. Furthermore, OSA can also be utilized in the production of various building materials, including concrete and bricks [25,26]. Pozzolanic cement, a type of building material that has been used for centuries, continues to be widely employed in diverse construction projects [18]. Its usage in mortars and concretes has notably increased over the past 25 years as an efficient means to produce high-strength concrete [17,26,27]. The findings revealed that the hydration and physical properties of specific blended cement systems containing oil shale ash (OSA) were influenced by various types of alkali activators when OSA was used at levels of two percent, 10%, and 30% [25,26]. It was observed that incorporating additional alkali activators into these two mixtures enhanced their mechanical strength, with SAIII demonstrating notably superior pozzolanic characteristics compared to the others [20,28,29].
The utilization of pozzolanic materials as a partial replacement for cement in blended cements and concrete has gained popularity due to its environmental friendliness and energy-saving benefits [9,30,31]. A study was conducted to investigate the mechanical and thermal properties of concrete made from combinations of cement, sand, oil shale ash (OSA), and aggregates [1,32,33]. The results revealed that as the concentration of OSA in the mixtures increased, the compressive strength decreased but improved with longer curing duration [1,3,32]. Furthermore, the thermal conductivity of the concrete mixtures decreased as the concentration of OSA rose [21,25].
The aim of incorporating soluble SiO2 and Al2O3 found in the glass phase of pozzolanic materials is to generate additional calcium silicate hydrate (CSH) gel [21,34]. This gel enhances the strength of hardened concrete structures by reacting with the Ca(OH)2 released during the cement hydration process [29,35]. The utilization of oil shale ash (OSA) as a primary binder for low-strength concrete was investigated in [19,25,27]. The results indicated that increasing the concentration of OSA in circulating fluidized-bed (CFB) binders enhanced water resistance while simultaneously reducing expansion [18,21,28].
The majority of components present in cement paste, mortar, and concrete are derived from limestone or chalky limestone, combined with clay minerals such as shale or clay, which are abundant sources of calcium oxide and silica [30,32]. Oil shale ash (OSA) can serve as a substitute for a portion of Portland cement or PPC mortar blending, thanks to its favorable physical and mechanical properties [3,14,23]. By replacing cement with OSA in mortar mixtures, cost reduction can be achieved, as OSA is widely available globally [21,27,36]. This environmentally friendly alternative also helps to mitigate pollution resulting from cement production.
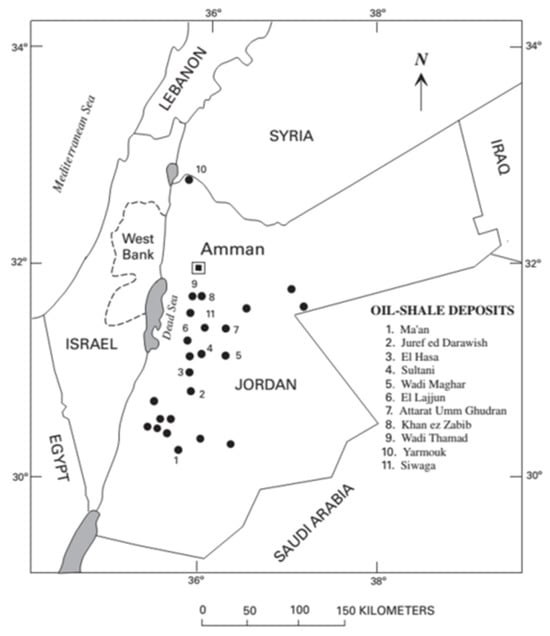
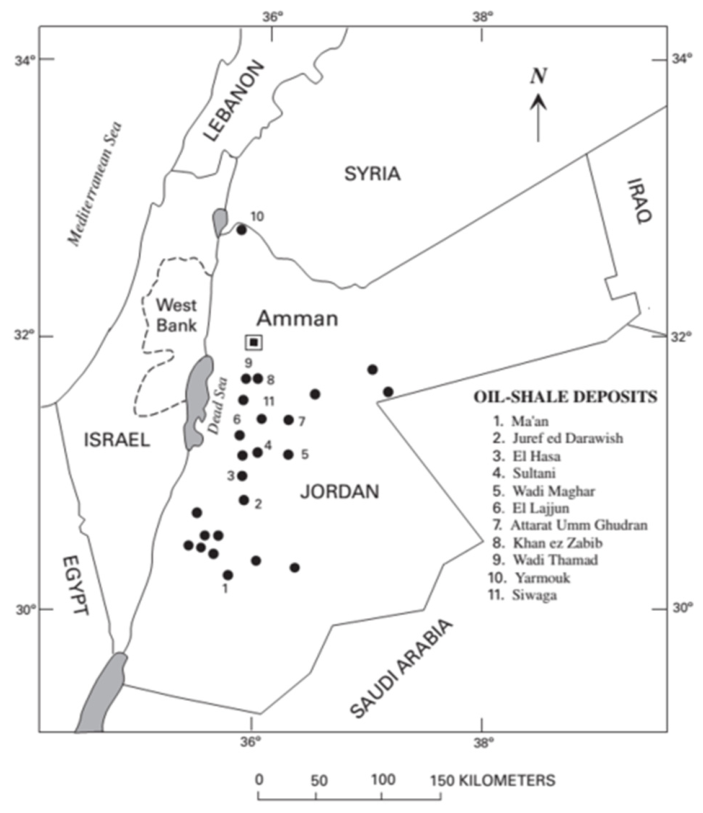
Jordan has large viable oil shale resources, an indigenous energy source [30,37,38]. The resources have been estimated to be 40 to 70 billion tons of oil shale, mostly in Jordan’s central regions [3,30]. The expected investment and utilization of these rocks as a construction material will decrease the percentage of cement used in construction purposes while reducing the carbon footprint caused by the heating of oil shale [38,39,40]. Oil shale could be defined as a natural rock that contains a large amount of organic materials and non-organic matter [40]. The rocks forming oil shale ash were deposited in a shallow marine environment, where the organic matter in these rocks was transformed into kerogen in limestone or marl in our study area (north of Jordan) due to the decline of the Tethys Sea, which led to the formation of marl that differs from the formed oil shale (in southern Jordan); this was reflected in the presence of some oxides in the marl oil shale, such as Al2O3, SO3, and Fe2O3, which were minimal [37,38]. Jordan is extremely rich in oil shale. The initial speculations on the amount of oil shale were 50 billion tons, which might generate 34.172 million barrels of shale oil [23]. Jordan does have a total of 24 identified surface, near-surface, and deep oil shale occurrences [37], with the eight most major deposits located in the west-central portion of the country, as shown in Figure 1.
Figure 1.
Oil shale occurrences in Jordan [3,37].
Research Significance
The increasing demand for sustainable construction materials has intensified research into alternative binders that can partially replace ordinary Portland cement (OPC) without compromising durability or mechanical performance. Among such alternatives, oil shale ash (OSA), a byproduct of oil shale combustion, presents a promising supplementary cementitious material due to its chemical reactivity and potential to reduce the environmental footprint of cement-based materials.
This study is significant in several respects. First, it provides a systematic evaluation of OSA as a partial substitute for OPC in mortar, focusing on its performance under sulfate exposure, a critical durability concern in aggressive environments. By assessing both the flexural and compressive strength of OSA-modified mortars, the research contributes to filling the knowledge gap regarding the long-term mechanical integrity of these composites in sulfate-rich conditions. Second, the work aligns with global efforts to mitigate the environmental impact of the cement industry, which is responsible for a substantial share of CO2 emissions. Incorporating OSA into cementitious systems not only valorizes an industrial byproduct that is otherwise considered waste but also supports circular economy principles in the construction sector.
Finally, while previous studies have investigated the use of OSA as a partial replacement for OPC in cementitious materials, several gaps remain. First, most studies have focused on mechanical properties under standard curing conditions, with limited attention to durability under sulfate attack and wetting–drying cycles. Second, the comparative behavior of OPC and PPC systems incorporating OSA under identical sulfate exposure conditions has not been systematically evaluated. Third, the combination of destructive (compressive strength), nondestructive (UPV, RDME), physical (mass loss), and microstructural (SEM) techniques to assess OSA-modified mortars under sulfate exposure has not been reported for Jordanian OSA from Wadi Shallala. This study addresses these gaps by providing a comprehensive evaluation of OPC- and PPC-based mortars with 0%, 10%, 20%, and 30% OSA replacement under 5% sodium sulfate exposure with wetting–drying cycles.
2. Materials and Methods
2.1. Oil Shale Ash (OSA)
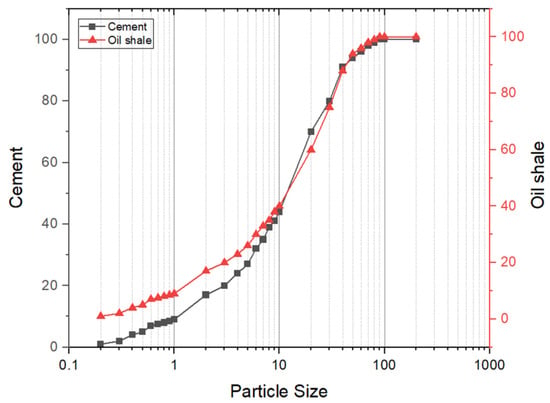
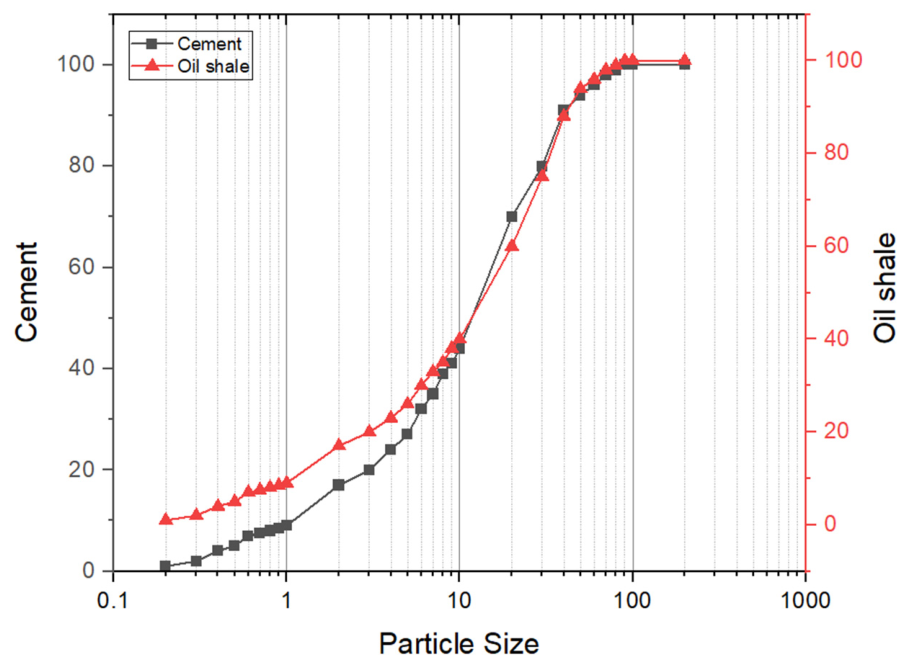
The Jordanian oil shale utilized for this research was sourced from Wadi Shallala, situated roughly 10 km to the northeast of the Irbid district in Jordan (32°37′26.07″ N, 35°56′32.36″ E). This material is part of the Belqa Group (Late Cretaceous–Paleogene), particularly the Wadi Shallala Chalk (WSC) unit, which is characterized by chalky limestone containing layers rich in organic matter [41]. To prepare the samples, the raw shale underwent crushing in a ball mill and was pulverized until it could pass through a 200 µm (0.075 mm) mesh, followed by a 24 h combustion process at 800 °C. The produced oil shale ash (OSA) was then ground again to clear a 63 µm sieve [41]. Table 1 details the chemical makeup of the OSA, which was established using X-ray fluorescence (XRF) analysis. Particle size distribution is shown in Figure 2.
Table 1.
Chemical composition of OSA.
Figure 2.
Particle size distribution for both cement and oil ash.
According to Table 1, the Loss on Ignition (LOI) of OSA is 11.36%. This relatively high value is consistent with the presence of unburnt carbon and carbonate decomposition; however, it cannot be directly equated with the unburnt carbon content. LOI may also include mass losses associated with the decomposition of carbonate minerals and the release of other volatile constituents. Residual unburnt carbon can increase water demand and may retard early hydration; therefore, to prevent this, the OSA was ground to pass a 63–200 µm sieve to reduce this effect.
2.2. Cement
Based on the following criteria, Al- Manaseer Company (Amman, Jordan)’s ordinary Portland cement (OPC)—Type I of grade 42.5 with a specific gravity of 3.24 and fineness modulus of 2.03%—was used, and the chemical composition is shown in Table 2. Pozzolanic Portland cement (PPC) produced by Al- Manaseer company was used, based on [42], Type II of grade 42.5, with a specific gravity of 2.9 gr/cm3, fineness modulus of 2.1%; the chemical composition of PPC is also shown in Table 2.
Table 2.
Chemical composition of OPC—Type I and PPC—Type II.
2.3. Fine Aggregate
Fine aggregate of natural sand with a maximum size of 1.2 mm had a fineness modulus of 3.22 and a specific gravity of 2.52. The ASTM C33/C33M-08 [43] standard specification was met by the natural sand that was utilized. Table 3 shows the fine aggregate sieve analysis, and Table 4 shows its properties.
Table 3.
Fine aggregate sieve analysis.
Table 4.
Fine aggregate properties.
2.4. Specimen Preparation
Two distinct phases of experiments were conducted as previously described. To obtain Control 1 for Phase-1, the control mix (OPC, OPC/0% Ash replacement) was prepared. Thereafter, OSA had to partially replace cement in the cement paste at three levels (10%, 20%, 30%), with two control mixes, giving rise to eight mixes (Mix 1–Mix 8). Table 5 shows the mix details. The control mixture (PPC, PPC/0% Ash) was prepared for Control 2 for Phase-2. The preparation involved two distinct groups of cement mortar samples. Three substitution levels of PPC, Ash (10%, 20%, 30%) were used for Group 1 specimens. In addition, for Control 2, three levels of PPC/Ash substitution (10%, 20%, 30%) were used for Group 2 samples. According to (ASTM C109/C109M-20b, 2020), the amounts of cement, fine aggregate, and water for the two groups were fixed at 1: 2.75: 0.485. The two groups of specimens are presented in Table 4.
Table 5.
The mixing ratio of OPC and PPC by replacement OSA.
2.5. Test Procedure
The blended cement pastes were created in Phase-1 by mixing the blended cement (OPC and PPC)/OSA utilizing the standard method of normal consistency and mixing the needed amount of water [3,23,30].
The mechanical properties of mortars incorporating Jordanian oil shale ash as a partial replacement for OPC were evaluated through a series of standardized tests. All specimens were exposed to sulfate solutions before testing. Visual inspection was carried out in accordance with ASTM C856 [44] to document surface changes, cracking, and discoloration. Microstructural characterization was performed using Scanning Electron Microscopy (SEM) following ASTM C1723 [45] on small fractured pieces taken from 50 mm cubes to identify hydration products and sulfate attack manifestations. Compressive strength was measured on mortar cubes of 50 × 50 × 50 mm following ASTM C109 [46], while the ultrasonic pulse velocity (UPV) test was conducted on prisms of 40 × 40 × 160 mm according to ASTM C597 [47] to evaluate internal integrity and microcrack development.
The relative dynamic modulus of elasticity (RDME) was determined using prism specimens of the same dimensions in accordance with ASTM C666 [48], providing a measure of stiffness degradation under sulfate exposure. The relative dynamic modulus of elasticity (RDME) was calculated from the ultrasonic pulse velocity (UPV) using the following equation:
where Vt is the ultrasonic pulse velocity at the specified exposure time (m/s), and V0 is the initial ultrasonic pulse velocity measured before sulfate exposure (m/s). This equation is based on the relationship between dynamic modulus of elasticity and pulse velocity, as described in ASTM C666 [48]. Also, mass loss was monitored on the same prisms following ASTM C642-90, indicating an inverse relationship [49] to quantify weight reduction caused by sulfate-induced deterioration. Together, these tests provided a comprehensive evaluation of the mechanical performance and sulfate resistance of OSA-blended mortars.
RDME (%) = (Vt/V0)2 × 100
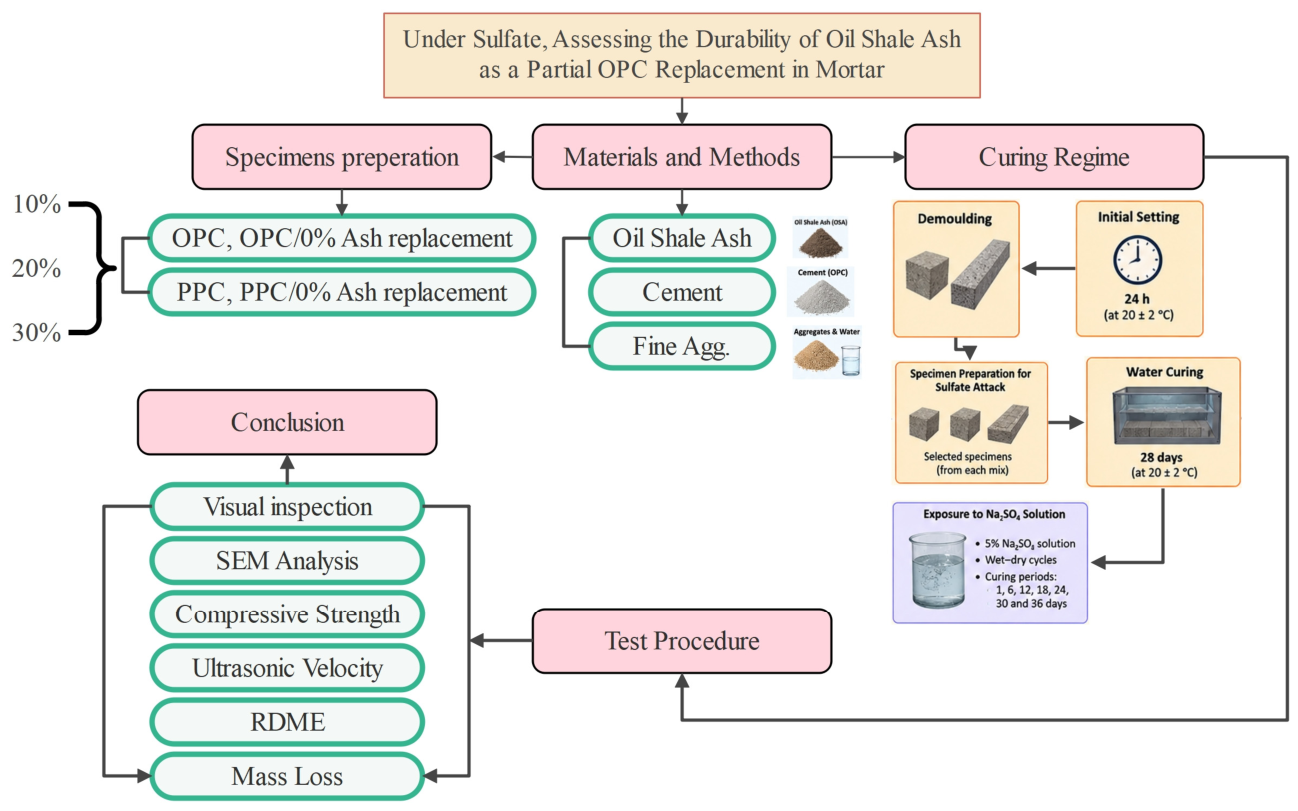
According to Chart 1, the flowchart illustrates the curing and testing sequence. For each test group, three specimens were tested unless otherwise stated. Before sulfate exposure, all specimens were cured in potable water at 20 ± 2 °C for 28 days. The wet–dry cycling regime consisted of immersion in 5% Na2SO4 solution for 8 h, followed by drying at 60 °C for 16 h, completing one cycle per day. The sulfate solution was renewed every 7 days, and the pH was monitored and maintained within the range of 6.5–7.5.
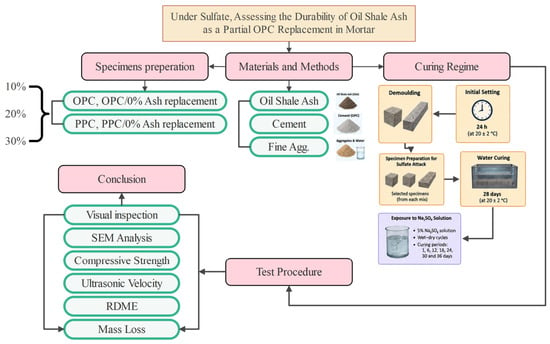
Chart 1.
The flowchart illustrates the curing and testing sequence.
3. Results
3.1. Visual Inspection
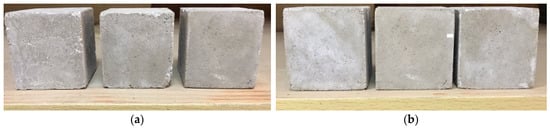
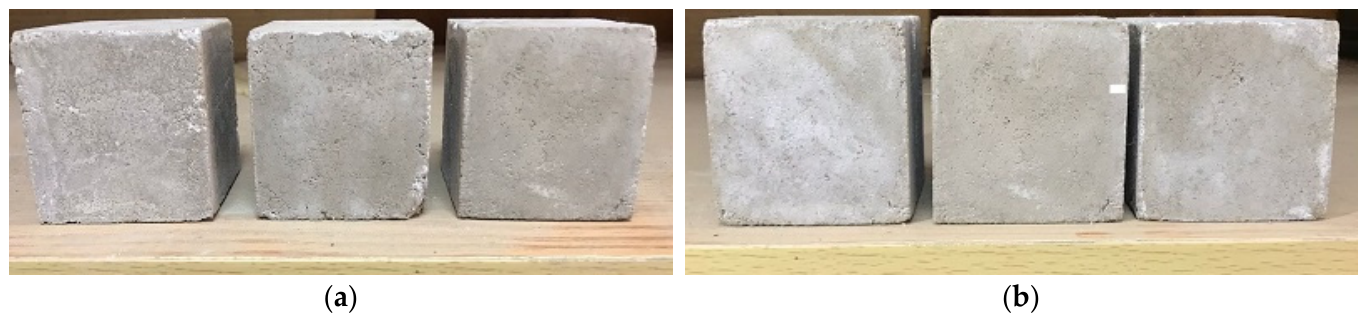
Figure 3a,b illustrates the visual inspection and surface condition of the mortar samples after 28 days of curing, before the initiation of the degradation process. The surfaces of the OPC and PPC samples exhibit a smooth and defect-free appearance, indicating the excellent quality of the samples.
Figure 3.
(a) OPC-C (28-day curing before wet and dry cycles), (b) PPC-C (28-day curing before wet and dry cycles).
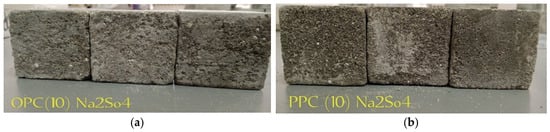
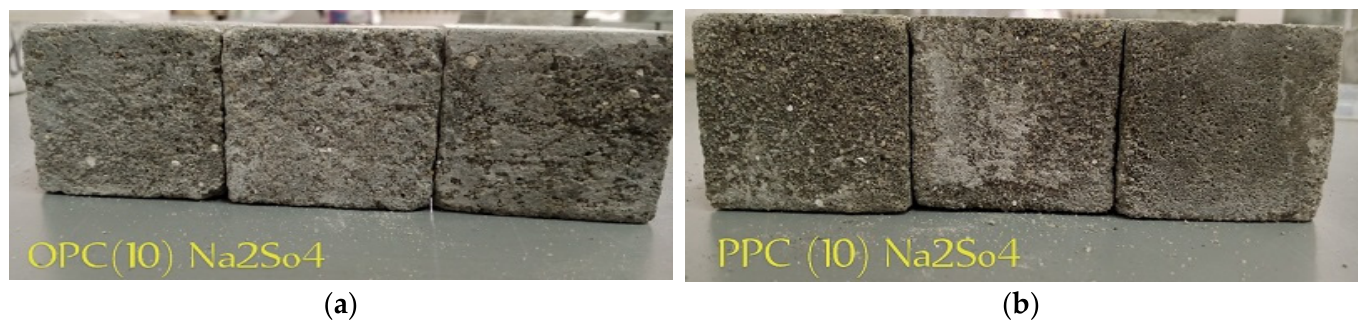
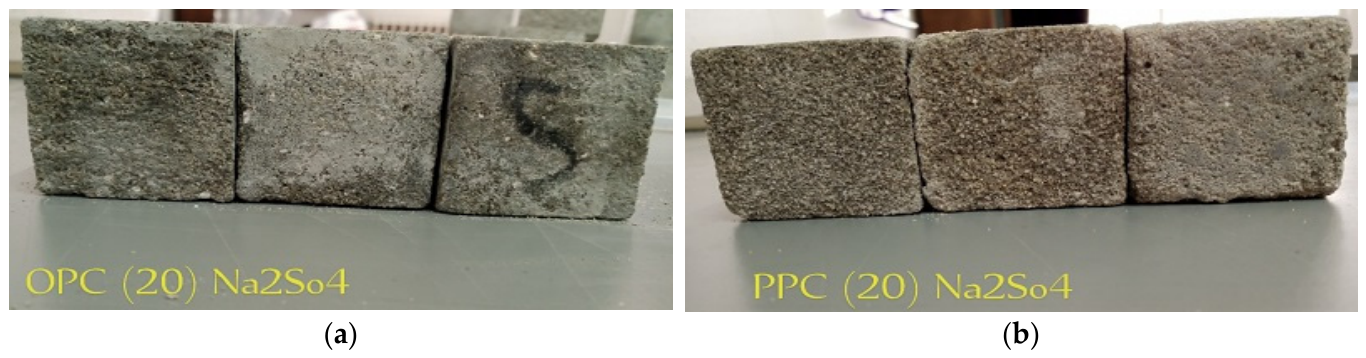
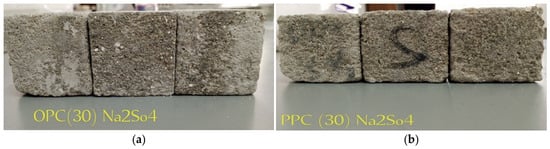
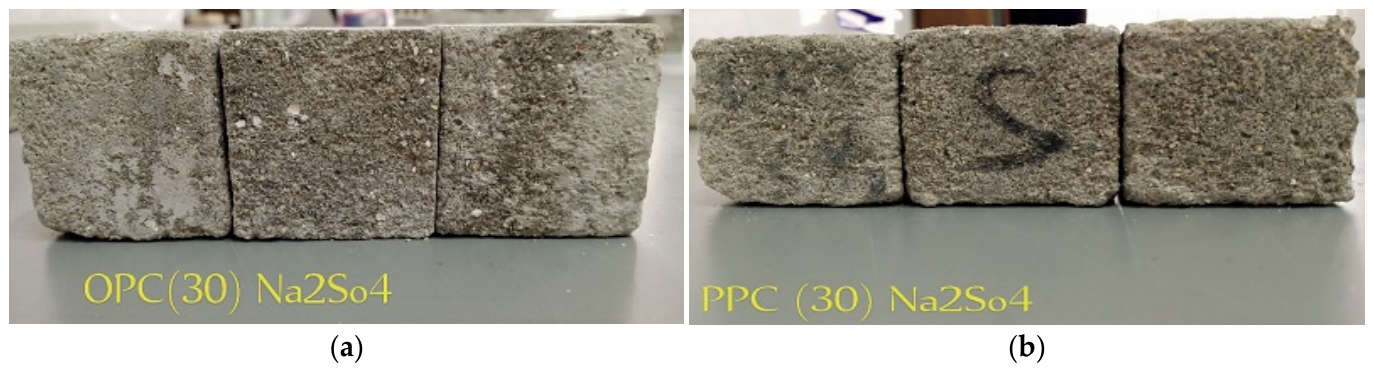
After 36 days of degradation (Figure 4, Figure 5 and Figure 6), both OPC and PPC samples experienced degradation from a combination of sodium sulfate and wet–dry cycles. The surface of the mortar samples underwent a careful visual inspection to identify signs of deterioration, including erosion, cracks, discoloration, and other indicators. It was observed that all samples, regardless of the percentage replacement, exhibited erosion and discoloration due to the wet–dry cycles. These characteristics serve as indicators of the severity and extent of damage caused by sulfate attack. Specifically, the presence of white patches on the sample surface can indicate sulfate attack and the formation of ettringite. Additionally, spalling or cracking of the surface, resulting from increased pressure due to the formation of gypsum or ettringite, was observed [25].
Figure 4.
(a) OPC-10 (36-day curing after wet and dry cycles), (b) PPC-10 (36-day curing after wet and dry cycles).
Figure 5.
(a) OPC-20 (36-day curing after wet and dry cycles), (b) PPC-20 (36-day curing after wet and dry cycles).
Figure 6.
(a) OPC-30 (36-day curing after wet and dry cycles), (b) PPC-30 (36-day curing after wet and dry cycles).
The visual inspection of PPC samples showed more surface erosion compared to OPC samples, although both exhibited erosion due to the wet–dry cycles. It is important to note that relying solely on visual inspection may not provide a comprehensive understanding of the extent of degradation. To accurately assess the effects of sulfate attack and wet–dry cycles on the mortar samples, additional testing such as compressive strength testing, ultrasonic pulse velocity, SEM analysis, and mass loss measurements was conducted. These supplementary tests offer a more thorough and accurate evaluation of the deterioration caused by sulfate attack.
3.2. SEM Analysis
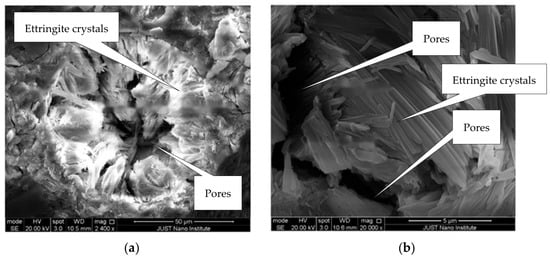
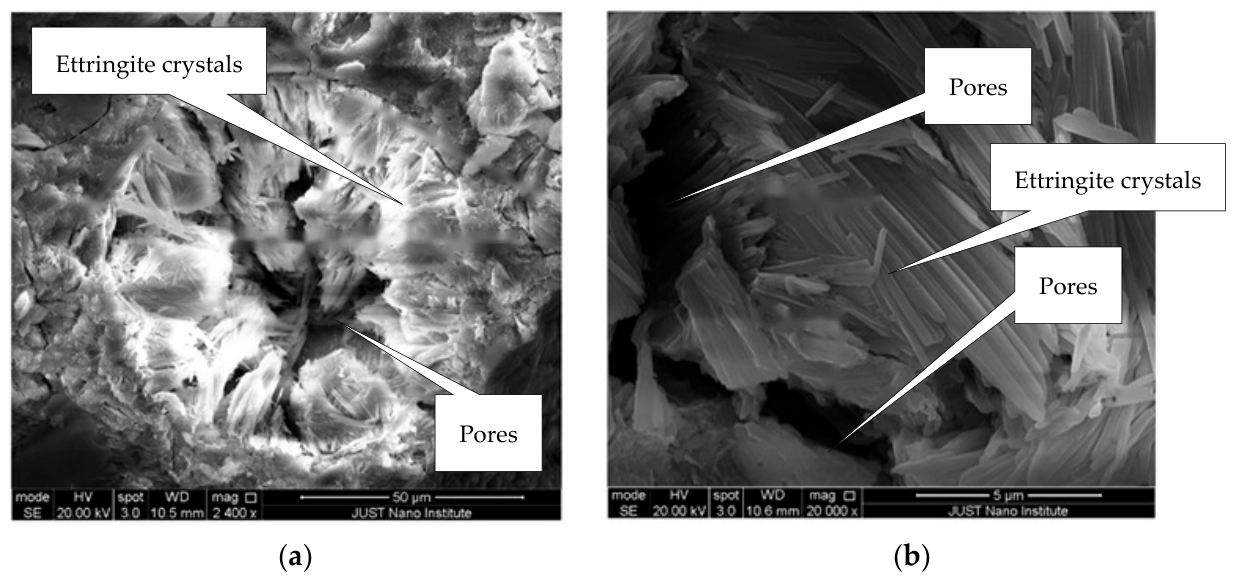
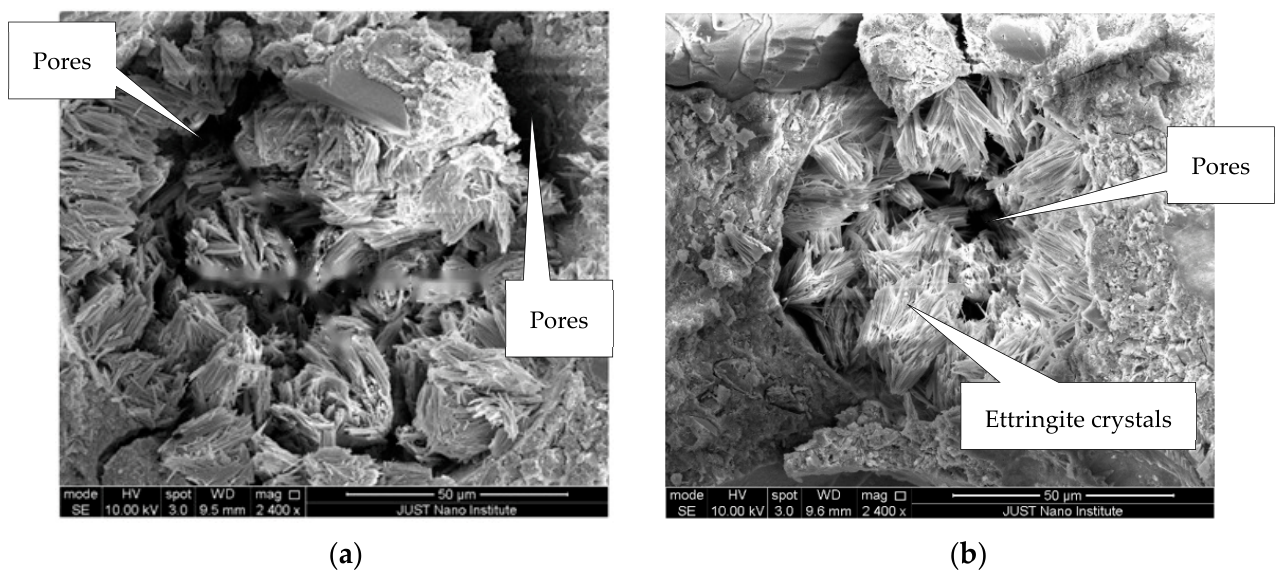
A comparative microstructural analysis of the mortar samples was performed using Scanning Electron Microscopy (SEM), and the results are illustrated in Figure 7 and Figure 8. Figure 7a and Figure 7b show the microstructures of the OPC and PPC reference samples without oil shale ash addition, respectively. Both images reveal a relatively dense microstructure; however, fine cracks are observed along the matrix in the OPC sample (Figure 7a). The PPC specimen (Figure 7b) shows a slightly more refined appearance, though microcracks are still visible. In both figures, needle-like crystals of ettringite are identifiable within voids and along crack boundaries.
Figure 7.
SEM analysis of (a) OPC-28 and (b) PPC-30 after 28 days of sulfate exposure under wet–dry cycles (5% Na2SO4, 8 h immersion/16 h drying at 60 °C).
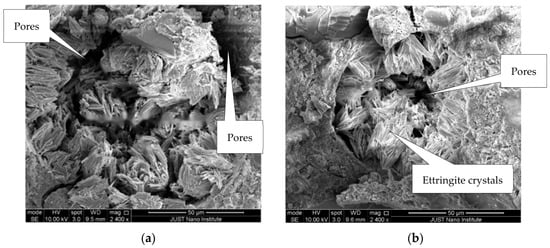
Figure 8.
SEM analysis of (a) OPC-30 and (b) PPC-30 after 36 days of sulfate exposure under wet–dry cycles (5% Na2SO4, 8 h immersion/16 h drying at 60 °C).
Figure 8a and Figure 8b present the SEM micrographs of the mortar specimens incorporating 30% oil shale ash (OSA) as a partial cement replacement for OPC and PPC, respectively. In the OPC + OSA sample (Figure 8a), the microstructure shows fewer and narrower dark linear features compared to plain OPC; however, these features cannot be unequivocally classified as cracks on the basis of morphology alone and may correspond to pores, interfacial boundaries, or specimen preparation artefacts, and ettringite crystals appear less abundant and more confined within voids. Similarly, the PPC + OSA sample (Figure 8b) exhibits a dense and uniform matrix with well-distributed hydration products. Ettringite crystals are primarily filling isolated voids.
It should be emphasized that these observations are qualitative and based on selected micrograph fields. They do not constitute quantitative evidence of bulk porosity, pore-size distribution, or crack density. Also, it should be noted that the identification of ettringite and microcracks in SEM images is based on morphological features and is therefore tentative.
The observed increase in compressive strength may be attributed to a combination of continued hydration of the cement paste and the formation of ettringite within the pores of the samples. Ettringite formation can initially fill pore spaces and contribute to strength gain; however, with continued ettringite growth, expansive stresses may develop, leading to microcracking and subsequent strength reduction. This behavior is consistent with findings reported by previous studies [17,18,28,35].
The SEM observations at 30% OSA replacement indicate localized densification and confinement of ettringite within voids in the selected micrograph fields. However, these observations are qualitative and represent localized morphology at specific ages. They do not necessarily reflect the bulk specimen response, particularly at later stages of degradation where mechanical and durability tests indicate deterioration. The overall data suggest that while 30% OSA may initially contribute to pore filling, continued sulfate exposure leads to expansive ettringite growth, microcracking, and strength reduction.
Also, the identification of ettringite and microcracks in SEM images is based on morphological features and is therefore tentative” and the observations “do not constitute quantitative evidence of bulk porosity, pore-size distribution, or crack density.
3.3. Compressive Strength
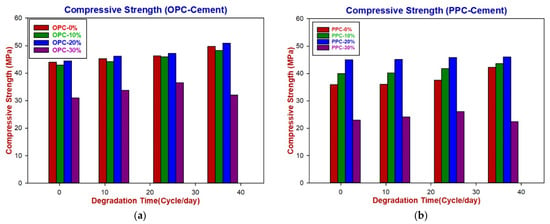
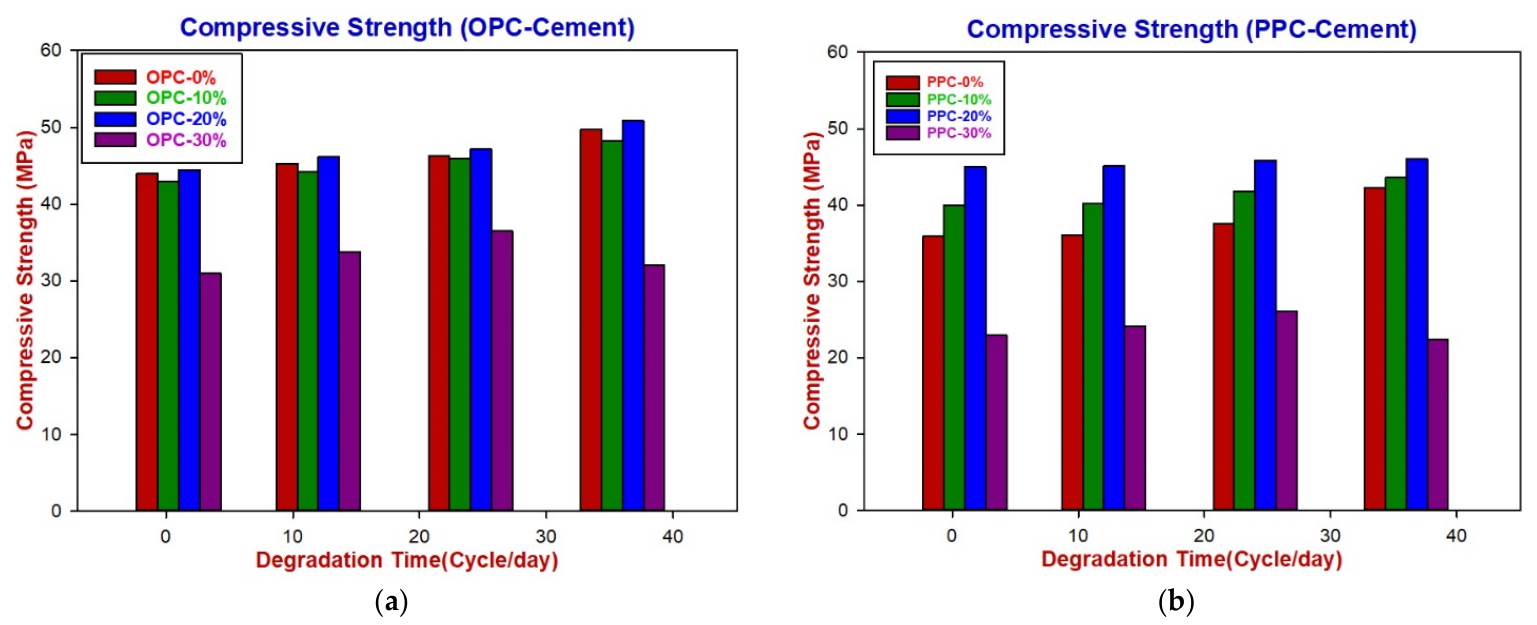
Figure 9a,b present the compressive strength results of OPC + OSA and PPC + OSA samples at 1, 6, 12, 18, 24, 30, and 36 days. It is evident that the samples with 0%, 10%, and 20% replacement show a gradual increase in compressive strength throughout the entire degradation period for both types of cement. For the samples with 30% replacement, in the case of OPC samples, the compressive strength increased until 24 days of degradation, while for PPC samples, it increased until 18 days, after which it decreased until the end of the degradation time.
Figure 9.
(a) Compressive strength (OPC + OSA). (b) Compressive strength (PPC + OSA).
On the other hand, in terms of OSA replacement, the mortar samples with 20% OSA replacement exhibited a higher compressive strength compared to those with 0% OSA replacement. However, samples with 10% OSA replacement showed a lower compressive strength value for OPC cement. In the case of PPC cement, both replacement ratios of 10% and 20% demonstrated a higher compressive strength value compared to the samples with 0% OSA replacement.
Based on the aforementioned results, it can be inferred that the observed increase in compressive strength can be attributed to the formation of ettringite within the pores of the samples, as shown before in SEM analysis. This formation causes the ettringite to expand until its volume is equal to that of the pores. Until this stage, the formed crystals lead to an increase in strength, the same behavior as observed in [13]. After that, with continuing increases in ettringite volume, cracks develop within the microstructure of the mortar samples, resulting in a subsequent decrease in compressive strength. This decrease indicates the degradation of the samples due to sulfate attack. The observed behavior aligns with the findings reported by previous studies where the decrease in strength can be attributed to the drying process, which resulted in the super-saturation of sodium sulfate. Consequently, the super-saturation exerted high tensile stress on the pore walls, leading to the formation of microcracks [20,27,50]. During the wetting phase, these microcracks, in conjunction with capillary absorption, facilitated the penetration of additional sulfates into the mortar. As a result, both the chemical reaction and the physical crystallization process were accelerated [18,20].
For the other replacement percentages of 0%, 10%, and 20%, an increase in compressive strength was observed until 36 days of degradation. However, it is difficult to determine whether this increase in strength is due to the hydration of cement paste or the formation of ettringite within the pores. So, to obtain accurate results and interpret them correctly, additional techniques, such as SEM analysis and porosity testing, are necessary to examine the components produced by sulfate attack. These techniques were not utilized in this investigation during the degradation stage. Furthermore, an extension of the exposure time is required in addition to the aforementioned techniques.
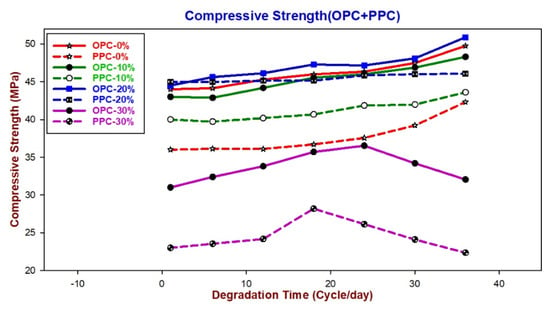
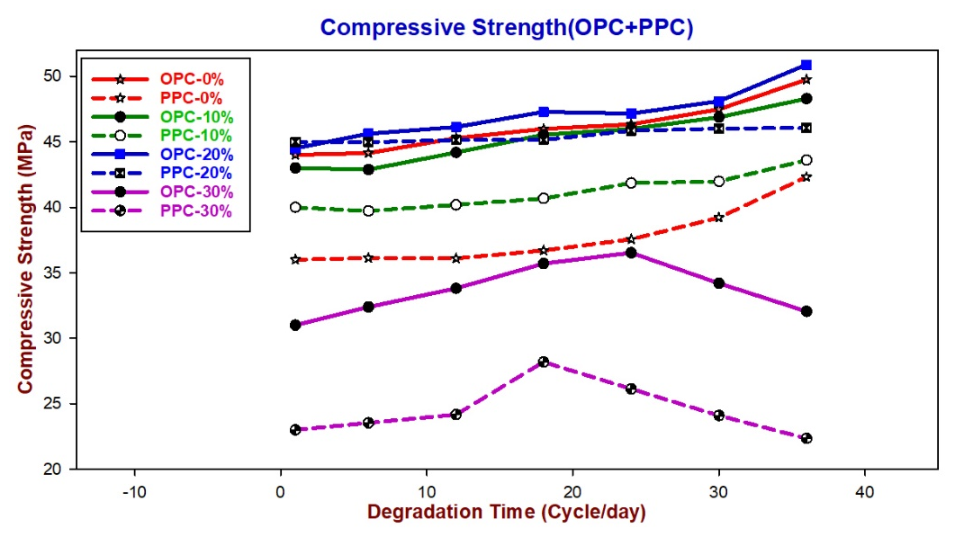
Also, Figure 10 illustrates the results of the compressive strength of PPC + OSA samples. A similar trend was observed as in the case of OPC + OSA samples, with the only difference being that samples with 10% and 20% replacement had a higher compressive strength than that of samples with zero replacement. For 30% samples, the strength increased until 18 days of degradation and then decreased until the end of the exposure time. In contrast, for OPC + OSA samples, the increasing trend was observed until 24 days. This difference may reflect that PPC + OSA samples degraded faster than OPC + OSA samples; the same behavior was noticed on visual inspection before.
Figure 10.
Compressive strength of OPC + OSA and PPC + OSA mortars as a function of degradation time (cycles/day).
It is important to note that the observed increase in compressive strength for the 0%, 10%, and 20% OSA replacement ratios cannot be attributed solely to sulfate resistance, as continued hydration of the cement paste may also contribute to strength development. Matched non-sulfate control specimens tested at the same ages were not included in this study, and therefore the effects of continued hydration and sulfate exposure cannot be fully separated. Independent evidence of deterioration, including mass loss, UPV reduction, RDME reduction, visible damage, and SEM observations, provides a more reliable indication of sulfate-induced degradation.
Figure 10 illustrates the variation in compressive strength for OPC and PPC cements. The aim was to study and compare the changes in strength over time. Upon comparing each percentage of replacement for both types, it was observed that:
- ▪
- For OPC + 0% OSA, the compressive strength ranges from 44.00 MPa to 49.75 MPa, while for PPC + 0% OSA, it ranges from 36.00 MPa to 42.32 MPa. Both OPC and PPC show an increasing trend in compressive strength over time, with slight variations. Notably, the OPC + 0% OSA consistently exhibits higher compressive strength values compared to the PPC + 0% OSA throughout the degradation period.
- ▪
- For OPC + 10% OSA, the compressive strength ranges from 42.88 MPa to 48.29 MPa, while for PPC + 10% OSA, it ranges from 39.73 MPa to 43.60 MPa. Similarly, the compressive strength shows an increasing trend over time for both mixtures.
- ▪
- For OPC + 20% OSA, the compressive strength ranges from 44.50 MPa to 50.88 MPa, while for PPC + 20% OSA, it ranges from 44.97 MPa to 46.06 MPa. As observed in the previous ratios, the compressive strength also demonstrates an increasing trend over degradation time.
- ▪
- In the case of OPC + 30% OSA, the compressive strength ranges from 31.00 MPa to 36.53 MPa, but it decreases from 24 days of degradation until the end of the degradation period. For PPC + 30% OSA, the compressive strength ranges from 22.35 MPa to 28.18 MPa, and it also decreases from 18 days until the end of the degradation period.
Overall, the OPC + OSA mixtures generally exhibit higher compressive strength values compared to the PPC + OSA mixtures throughout the degradation time for all OSA replacement ratios. This is due to the fact that OPC cement contains a higher percentage of clinker, which is the primary component responsible for providing strength and binding properties to the cement; OPC has a higher early-age compressive strength. On the other hand, Portland Pozzolana cement (PPC) typically has a lower early-age compressive strength, but a higher long-term compressive strength. This is because PPC contains pozzolanic materials such as fly ash or silica fume, which react with calcium hydroxide in the presence of water to produce additional calcium silicate hydrate (C-S-H) gel. This additional gel fills the pore spaces in the concrete or mortar, making it denser and more durable over the long term.
3.4. Ultrasonic Velocity
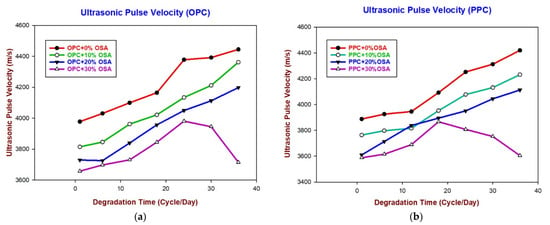
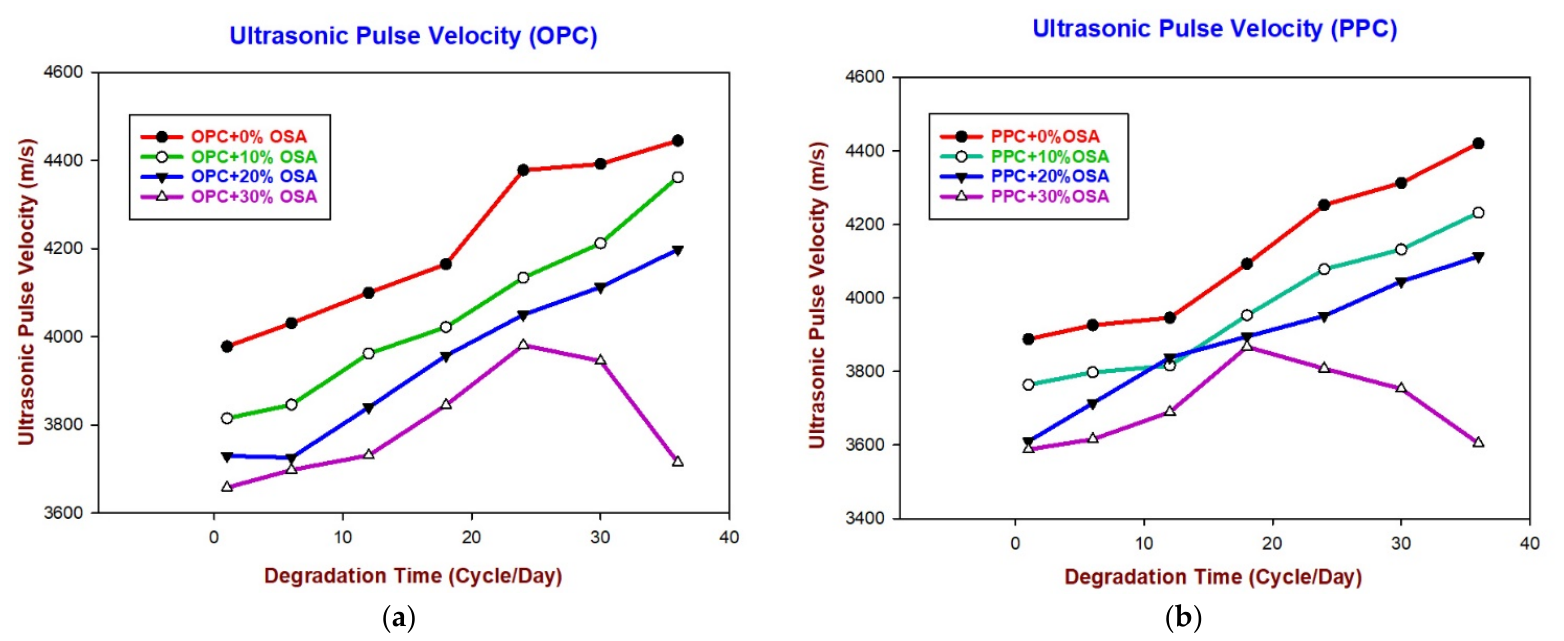
Figure 11a illustrates the ultrasonic velocity of degraded mortar samples made with OPC+ OSA replacement. For a replacement ratio of 30%, the ultrasonic pulse velocity (UPV) increased up to day 24, then showed a slight decrease at day 30, before a clear drop in velocity was observed until the end of the exposure time.
Figure 11.
(a) Ultrasonic velocity for (OPC + OSA). (b) Ultrasonic velocity for (PPC + OSA).
As previously mentioned, the OPC samples with 30% OSA replacement exhibited the same behavior in compressive strength. It is worth noting that both UPV and compressive strength showed an increasing trend until 24 days of degradation, after which they decreased. However, it should be emphasized that both UPV and compressive strength of the 30% OSA sample were the lowest values compared to 0%, 10%, and 20% OSA replacement.
For samples with 0%, 10%, and 20% replacement, UPV continued to increase until the end of the exposure time. The same behavior is also observed in the compressive strength results. As mentioned earlier, the samples may have begun to degrade and form ettringite in the pores, contributing to the increase in UPV. Alternatively, the continued hydration of cement leads to a decrease in pore size, resulting in an increase in ultrasonic velocity.
This may be due to the fact that ultrasonic waves are highly sensitive to changes in the microstructure of the mortar. The highest UPV value observed may be attributed to the formation of ettringite in the mortar pores. Ettringite can fill voids and increase material density, in addition to the quantity formed. The formation of ettringite may cause a significant increase in ultrasonic velocity. However, if ettringite continues to expand in a way that causes cracking or destruction of the material, it can lead to a decrease in ultrasonic velocity, as observed after 24 days of degradation. At this stage of degradation, OPC + 30% OSA samples exhibited the lowest values for both compressive strength and UPV.
Figure 11b illustrates the ultrasonic velocity of degraded mortar samples made with PPC+ OSA replacement. Exactly the same behavior is observed as in OPC + OSA; the only difference is for PPC+ 30% OSA samples. Also, the behavior observed is exactly the same as in OPC + OSA samples. The only difference is that for PPC + 30% OSA samples, the ultrasonic wave velocity increased until day 18, after which it decreased until the end of the exposure time. This indicates that PPC + OSA samples degraded more quickly than OPC + OSA samples. The same trend was observed for replacement percentages of 0%, 10%, and 20% of OSA as for OPC + OSA samples.
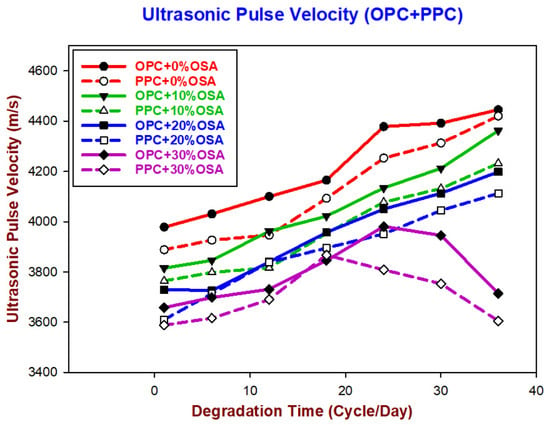
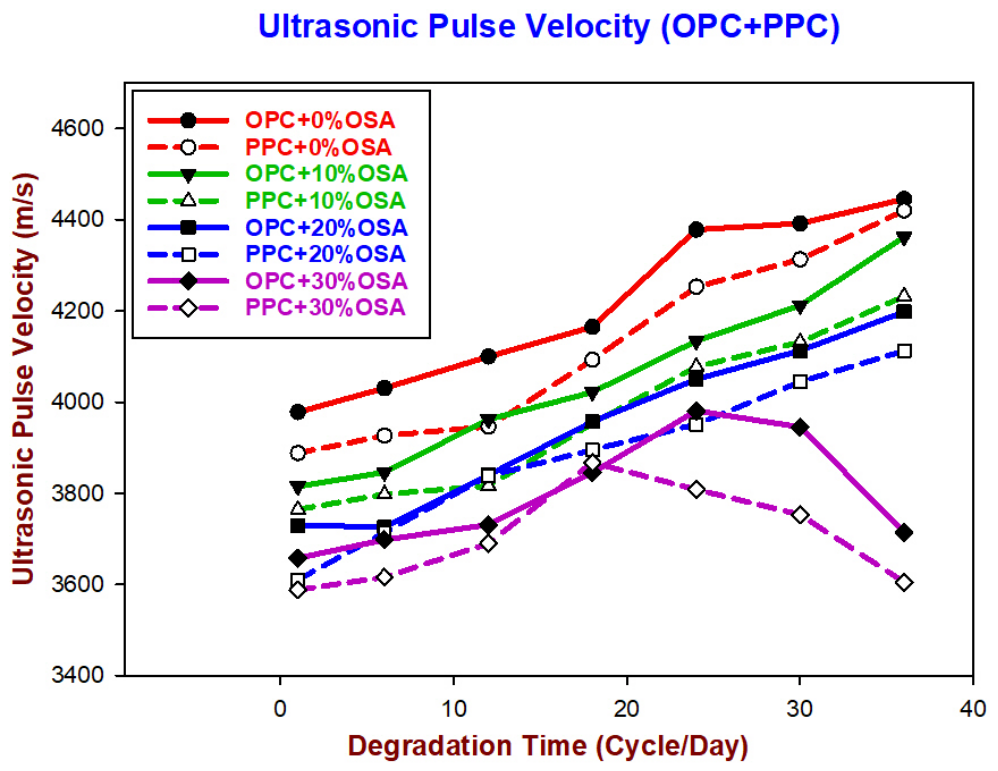
Figure 12 illustrates the ultrasonic pulse velocity (UPV) for different OSA replacement ratios in both OPC and PPC cement as a function of degradation time.
Figure 12.
Ultrasonic velocity for OPC and PPC cement plus OSA replacement.
In the case of OPC + 0% OSA and PPC + 0% OSA, both groups display an increasing trend in UPV values over time. The UPV values for OPC + 0% OSA range from 3978 m/s to 4445 m/s, while for PPC + 0% OSA, they range from 3888 m/s to 4420 m/s. Generally, OPC + 0% OSA exhibits slightly higher UPV values compared to PPC + 0% OSA at each degradation time.
For OPC + 10% OSA and PPC + 10% OSA, the UPV values for OPC + 10% OSA range from 3815 m/s to 4362 m/s, while for PPC + 10% OSA, they range from 3764 m/s to 4232 m/s. OPC + 10% OSA generally exhibits slightly higher UPV values compared to PPC + 10% OSA at each degradation time.
Regarding OPC + 20% OSA and PPC + 20% OSA, the UPV values for OPC + 20% OSA range from 3730 m/s to 4198 m/s, while for PPC + 20% OSA, they range from 3610 m/s to 4113 m/s. Also, OPC + 20% OSA generally demonstrates slightly higher UPV values compared to PPC + 20% OSA at each degradation time. For OPC + 30% OSA and PPC + 30% OSA, the UPV values for OPC + 30% OSA range from 3658 m/s to 3945 m/s, while for PPC + 30% OSA, they range from 3588 m/s to 3867 m/s; OPC + 30% OSA generally exhibits slightly higher UPV values compared to PPC + 30% OSA at each degradation time.
In conclusion, it can be observed that, throughout the entire degradation time, the ultrasonic pulse velocity of OPC + OSA is higher than that of PPC + OSA. Furthermore, for both OPC and PPC, an increase in OSA ratio leads to a decrease in ultrasonic pulse velocity.
3.5. Relative Dynamic Modulus of Elasticity-OPC (RDME)
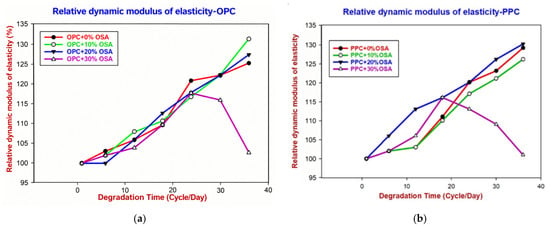
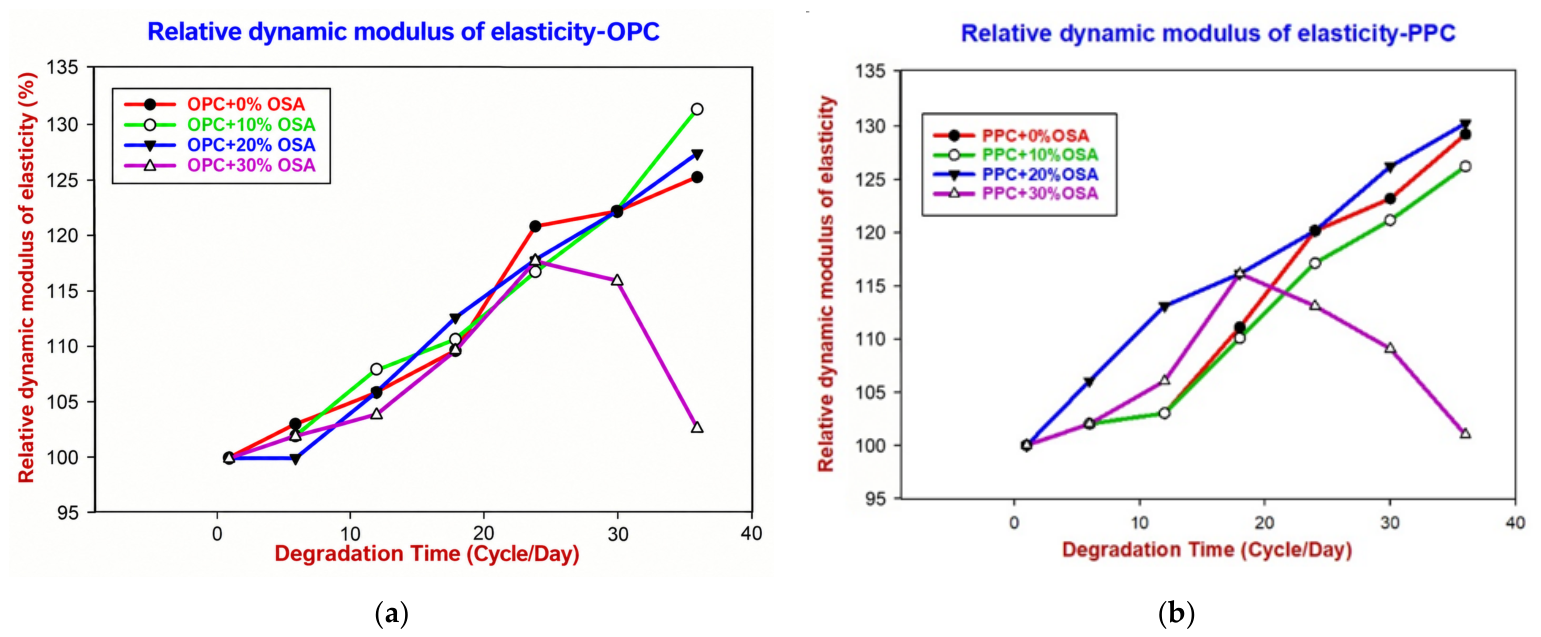
Figure 13a illustrates the relative dynamic modulus of elasticity (RDME) of OPC samples over a degradation period of 36 days. It can be observed that the RDME gradually increases until the end of the exposure time for OSA ratios of 0%, 10%, and 20%. However, for the 30% OSA replacement ratio, the RDME increases until 24 days of degradation, but subsequently decreases until the end of the exposure time [29]. This pattern of initially increasing RDME followed by a decrease was previously reported [34].
Figure 13.
(a) Relative dynamic modulus of elasticity (RDME) for (OPC + OSA). (b) Relative dynamic modulus of elasticity (RDME) for (OPC + OSA).
Sulfate degradation can have a significant impact on the relative dynamic modulus of elasticity (RDME) of mortar. RDME was determined by measuring the ultrasonic wave velocity of mortar, which is closely linked to the compactness and the microstructure formation of the specimen. For samples with 30% OSA, during the initial phase of sulfate attack, the sulfate solution permeated the mortar samples and reacted with the cement hydration products, resulting in the formation of expansive compounds such as ettringite, which filled the pores and cracks, leading to a denser mortar structure. As a result, both the ultrasonic wave velocity and the relative dynamic elastic modulus (RDME) gradually increased in the specimen. In the later stage of sulfate attack, as shown previously in SEM results, the continuous accumulation and expansion of these compounds caused cracks to develop within the specimens, resulting in a looser structure, as reported by Yujing et al. [35,50] and Gospodinov [19]. In Figure 13b, the same behavior was observed in PPC cement samples, with the only difference being the onset of RDME decrease at 18 days of degradation.
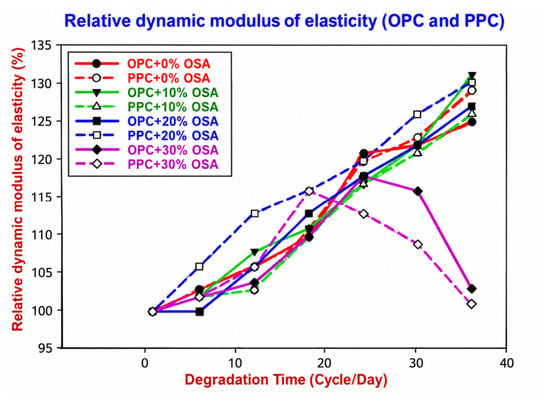
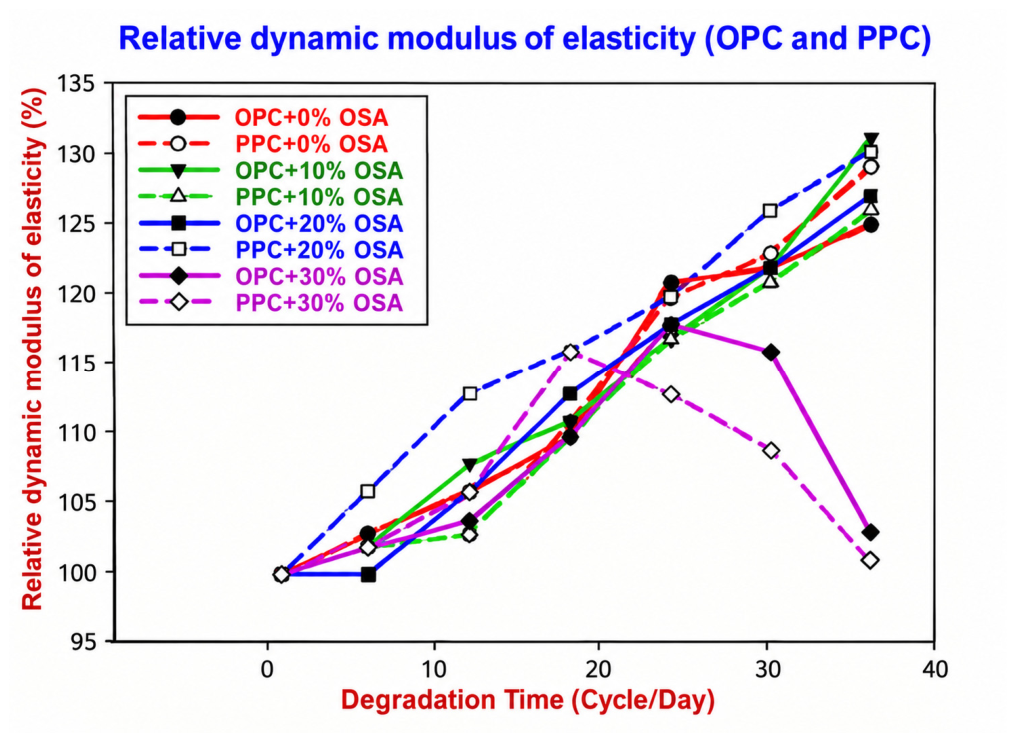
Figure 14 illustrates the results of the relative dynamic modulus of elasticity (RDME) for both OPC and PPC when comparing the same ratios of OSA over the entire degradation time.
Figure 14.
Comparison of RDME for both OPC + OSA and PPC + OSA.
Both OPC and PPC mixtures with 0%, 10%, and 20% OSA exhibited an increasing trend in RDME values over time. For the 0% OSA mixtures, RDME values ranged from 100 to 125 for OPC and from 100 to 129 for PPC, with PPC showing slightly higher values at each degradation time. At 10% OSA, the trend reversed: OPC exhibited higher RDME values (100 to 131) compared to PPC (100 to 126) at each degradation time. At 20% OSA, the trend reversed again, with PPC showing slightly higher RDME values (100 to 130) compared to OPC (100 to 127) at each degradation time. Overall, all mixtures in this group demonstrated a consistent increase in RDME with degradation time, regardless of the cement type or OSA content.
The OPC and PPC mixtures with 30% OSA exhibited a different behavior compared to the lower OSA contents, showing variation in RDME values over time rather than a continuous increase. For OPC + 30% OSA, RDME values increased from 100 to 118 until 24 days and then decreased until the end of degradation. For PPC + 30% OSA, RDME values increased from 100 to 116 until 18 days and then decreased until the end of exposure time. When comparing the two cement types, PPC exhibited higher RDME values than OPC until 18 days of degradation; after that, PPC values became lower than those of OPC until the end of the degradation period. This indicates that at 30% OSA, the degradation behavior becomes more complex, and the cement type influences the timing of the peak RDME value.
In summary, the RDME values for PPC with 0% and 20% OSA are higher than those for OPC at the same ratios. However, for the ratio of 10% OSA, the PPC has a lower RDME compared to OPC. For 30% OSA, the PPC initially exhibits a higher RDME value until 18 days, after which it becomes lower, which reflects the same trend as the UPV data, as expected from Equation (1); the apparent divergence between the two presentations arises from the squaring of the velocity ratio and the different axis scales rather than from a physical inverse relationship.
3.6. Mass Loss
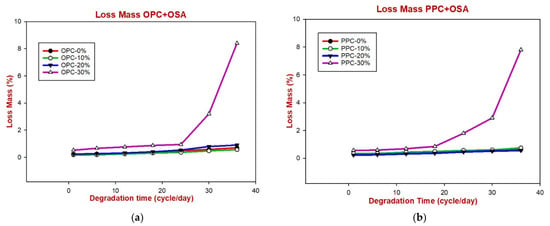
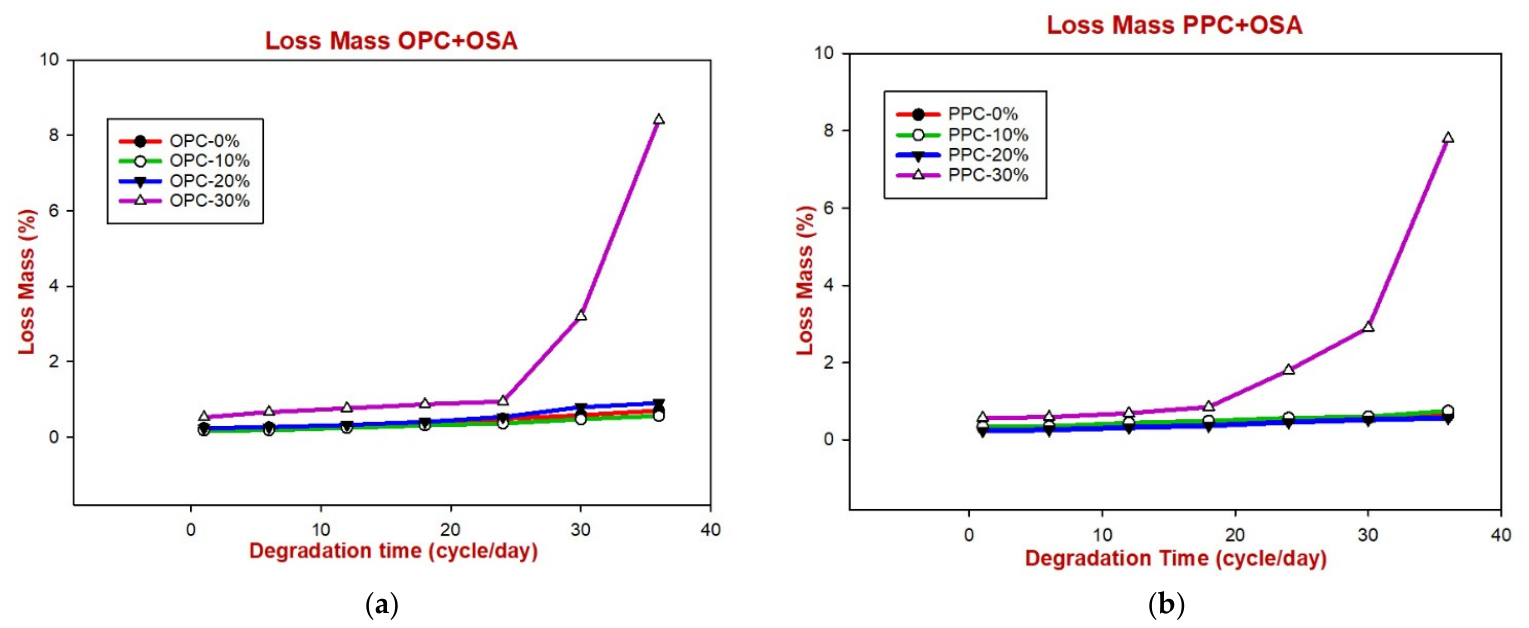
In Figure 15a,b, the mass loss of OPC and PPC cement samples with 0%, 10%, 20%, and 30% OSA subjected to sulfate and wet–dry cycles is presented. It is worth noting that the mass loss does not exhibit a significant change until 36 cycles of degradation time for ratios of 0%, 10%, and 20%. This trend is consistent with the findings reported [29], which observed similar results for concrete samples fabricated with natural and recycled aggregates and subjected to sulfate and wet–dry cycles for up to 50 cycles.
Figure 15.
(a) Mass Loss for (OPC + OSA). (b) Mass Loss for (PPC + OSA).
The results indicate a notable rise in mass loss for samples with a 30% replacement of OSA. In the case of OPC samples, the mass loss escalated from 0.52% to 8.4%, while for PPC samples, it increased from 0.75% to 7.8%. This trend aligns with the findings of Yujing et al. [29], who also observed an increase in mass loss for various concrete samples exposed to sulfate and wet–dry cycles. However, it is worth mentioning that Esam et al. [29] reported an increase in mass loss for concrete incorporating different replacements of recycled aggregate when subjected to varying concentrations of magnesium and sodium sulfate.
In the case of the 30% samples, two stages were observed. The first stage occurred over 24 cycles in OPC samples and 18 cycles in PPC samples. During this stage, sulfate ions permeated the mortar samples and filled the concrete pores, resulting in the formation of ettringite and a slight increase in mass. It is possible that the mass of the ettringite observed during this stage is equivalent to the mass loss caused by sample erosion due to the wet–dry cycles, as observed during visual inspection.
In the second stage (occurring from 24 cycles for OPC samples and from 18 cycles for PPC samples until 36 cycles), a significant increase in mass loss was observed. This may be due to the increase in the volume of ettringite produced within the pores and cracks of the mortar specimens, as shown previously by SEM analysis, in addition to the erosion of the mortar surface. As a result, there was a faster loss of mass compared to the first stage.
The reasons for the increase in mass loss in concrete specimens subjected to sulfate attack can be summarized as follows: Firstly, during sulfate attack, chemical reactions take place between sulfate ions and hydration products, resulting in the formation of gypsum and ettringite. These compounds have a higher volume compared to the original materials, which can generate increased pressure and ultimately lead to cracking or spalling in the concrete. Secondly, sulfate salts have the ability to crystallize within the pores and cracks of the concrete, creating additional pressure on the concrete surface. This heightened pressure can cause the concrete paste to spall or fracture. Lastly, it is important to note that the mass losses observed in our study are significantly lower than those reported in previous studies that did not take into account the impact of drying/wetting cycles [35,50].
4. Conclusions
This study investigated the durability performance of mortar incorporating Jordanian oil shale ash (OSA) as a partial replacement for ordinary Portland cement (OPC) and Portland Pozzolana cement (PPC) when subjected to sulfate attack. A series of mechanical and durability tests, including compressive strength, ultrasonic pulse velocity, relative dynamic modulus of elasticity, mass loss, and microstructural examination, were conducted to evaluate the influence of different OSA replacement levels. The findings provide valuable insights into the role of OSA in enhancing or reducing mortar resistance under aggressive sulfate conditions.
- Generally, the 0%, 10%, and 20% OSA replacement ratios showed increases in compressive strength, UPV, and RDME during sulfate exposure. However, in the absence of matched non-sulfate control specimens, these increases cannot be attributed solely to improved sulfate resistance, since continued hydration may also contribute to strength development.
- OSA replacement up to 20% generally increased compressive strength during sulfate exposure, with 20% showing the most favorable results, particularly for PPC mortar. However, 30% OSA led to initial strength gains followed by deterioration.
- OPC-based mortars generally exhibited higher compressive strength than PPC-based mortars, potentially due to their higher clinker content and different hydration characteristics.
- The 0%, 10%, and 20% OSA replacement ratios showed increases in compressive strength, UPV, and RDME during sulfate exposure. However, these increases cannot be attributed solely to improved sulfate resistance, as continued hydration may also contribute and non-sulfate control specimens were not included.
- UPV generally increased at 0–20% OSA replacement, potentially reflecting continued hydration and pore filling. At 30% OSA, UPV declined after an initial increase, suggesting possible crack development and internal damage.
- RDME generally increased at 0–20% OSA replacement, whereas specimens containing 30% OSA peaked at approximately 24 days before declining, indicating progressive internal deterioration.
- Mortars containing 30% OSA experienced considerable deterioration, with OPC-based specimens generally exhibiting greater mass loss than PPC-based specimens. This behavior may be associated with sulfate-related cracking, surface scaling, and material loss.
- Continued hydration and sulfate-reaction products may contribute to pore filling and early strength gains. However, the available evidence does not conclusively establish improved pore refinement or confirm ettringite as the sole cause of the observed strength changes and deterioration.
- Mass loss under wet–dry cycles cannot be directly compared with static immersion results because of differences in exposure conditions, specimen geometry, and mixture proportions. Surface scaling, spalling, and sulfate salt deposition may also influence measured mass changes.
5. Future Studies
- ▪
- Residual carbon and other LOI-contributing constituents may influence water demand and hydration kinetics by adsorbing water or admixtures; however, these effects are recommended for future investigation.
- ▪
- Quantitative techniques such as mercury intrusion porosimetry (MIP) or water absorption testing are recommended for future work to substantiate the microstructural observations.
- ▪
- The present study did not include quantitative porosity measurements, QXRD, or TG/DTG analysis, and, therefore, the relative contributions of continued hydration and ettringite formation to the observed strength changes cannot be definitively separated. Future work should incorporate these techniques to elucidate the underlying mechanisms.
Author Contributions
Conceptualization, T.I.S., A.A.-K.A.A.S., and W.F.E.; methodology, H.M.M.; software, M.A.-T. and A.A.-K.A.A.S.; validation, H.M.M., T.I.S., and W.F.E.; formal analysis, A.A.-K.A.A.S.; investigation, T.I.S., A.A.-K.A.A.S., and W.F.E.; resources, H.M.M. and W.F.E.; data curation, T.I.S. and H.M.M.; writing—original draft preparation, T.I.S. and A.A.-K.A.A.S.; writing—review and editing, A.A.-K.A.A.S., W.F.E., M.A.-T. and H.M.M.; visualization, H.M.M. and T.I.S.; supervision, W.F.E., M.A.-T., and T.I.S.; project administration, W.F.E.; funding acquisition, H.M.M. All authors have read and agreed to the published version of the manuscript.
Funding
The authors gratefully acknowledge that this research work was financed by Kingdom University, Bahrain, from the research grant number [KU-RIU-2026-2-1].
Data Availability Statement
All published data are available from the authors upon request.
Conflicts of Interest
Author Heba M. Mhedat was employed by the Higher Institute of Mining Resources Company. The remaining authors declare that the research was conducted in the absence of any commercial or financial relationships that could be construed as potential conflicts of interest.
References
- Raado, L.M.; Hain, T.; Liisma, E.; Kuusik, R. Composition and properties of oil shale ash concrete. Oil Shale 2014, 31, 147–160. [Google Scholar] [CrossRef] [Scilit]
- Radwan, M.M.; Farag, L.M.; Abo-El-Enein, S.A.; Abd El-Hamid, H.K. Alkali activation of blended cements containing oil shale ash. Constr. Build. Mater. 2013, 40, 367–377. [Google Scholar] [CrossRef] [Scilit]
- Smadi, M.M.; Haddad, R.H. The use of oil shale ash in Portland cement concrete. Cem. Concr. Compos. 2003, 25, 43–50. [Google Scholar] [CrossRef] [Scilit]
- Zhao, Y.; Qiu, J.; Wu, P.; Guo, Z.; Zhang, S.; Sun, X. Preparing a binder for cemented paste backfill using low-aluminum slag and hazardous oil shale residue and the heavy metals immobilization effects. Powder Technol. 2022, 399, 117167. [Google Scholar] [CrossRef] [Scilit]
- Bourdot, A.; Thiéry, V.; Bulteel, D.; Hammerschlag, J.G. Effect of burnt oil shale on ASR expansions: A petrographic study of concretes based on reactive aggregates. Constr. Build. Mater. 2016, 112, 556–569. [Google Scholar] [CrossRef] [Scilit]
- Shawabkeh, R.; Al-Harahsheh, A.; Al-Otoom, A. Copper and zinc sorption by treated oil shale ash. Sep. Purif. Technol. 2004, 40, 251–257. [Google Scholar] [CrossRef] [Scilit]
- Shawabkeh, R.; Al-Harahsheh, A.; Hami, M.; Khlaifat, A. Conversion of oil shale ash into zeolite for cadmium and lead removal from wastewater. Fuel 2004, 83, 981–985. [Google Scholar] [CrossRef] [Scilit]
- Attia, M.M.; Al Sayed, A.A.K.A.; Tayeh, B.A.; Shawky, S.M.M. Banana agriculture waste as eco-friendly material in fibre-reinforced concrete: An experimental study. Adv. Concr. Constr. 2022, 14, 355–368. [Google Scholar] [CrossRef]
- Raado, L.M.; Tuisk, T.; Rosenberg, M.; Hain, T. Durability behavior of Portland burnt oil shale cement concrete. Oil Shale 2011, 28, 507–515. [Google Scholar] [CrossRef] [Scilit]
- Al Sayed, A.A.A.; Ali, A.; Al-fasih, M.Y.M. Investigating the shear flexural behavior of NSM FRP-strengthened RC beams by experimentation and numerical analysis. ENGINOM Eng. Innov. 2026, 1, 1–14. [Google Scholar] [CrossRef] [Scilit]
- Al Sayed, A.A.A.; Abdelkhalik, A. Radiation Aspects and Performance of Geo-polymerized Zeolite Con- crete. ENGINOM Eng. Innov. 2026, 1, 1–13. [Google Scholar] [CrossRef] [Scilit]
- Saeed, M.K.; Al Sayed, A.A.K.A.; Almutairi, A.D.; Dahish, H.A.; Al-Fasih, M.Y.M. Utilizing Alkali-Activated Recycled Concrete Aggregates from Demolished Structures to Investigate Concrete Properties in the Jeddah Region of Saudi Arabia. Sustainability 2025, 17, 1903. [Google Scholar] [CrossRef] [Scilit]
- Al-jabali, H.M.; Edris, W.F.; Al-Tamimi, M.; Al Sayed, A.A.K.A.; Selouma, T.I. Evaluation of the degradation of mortar with volcanic tuff replacement via destructive and non-destructive testing. Case Stud. Constr. Mater. 2025, 22, e04308. [Google Scholar] [CrossRef] [Scilit]
- Usta, M.C.; Yörük, C.R.; Hain, T.; Paaver, P.; Snellings, R.; Rozov, E.; Gregor, A.; Kuusik, R.; Trikkel, A.; Uibu, M. Evaluation of new applications of oil shale ashes in building materials. Minerals 2020, 10, 765. [Google Scholar] [CrossRef] [Scilit]
- Edris, W.F.; Al-Tamimi, M.; Aldelgawy, M. Implementation of Feldspar As a Partial Replacement Material in Cement Mortar (Exploration and Application). J. Appl. Eng. Sci. 2022, 20, 177–185. [Google Scholar] [CrossRef] [Scilit]
- Al-Fhaid, H.; Edris, W.F.; Al-Tamimi, M. Potential utilization of oil shale as a stabilizing material for compressed Earth block. Front. Built Environ. 2023, 9, 1199744. [Google Scholar] [CrossRef] [Scilit]
- Scherer, G.W. Stress from crystallization of salt. Cem. Concr. Res. 2004, 34, 1613–1624. [Google Scholar] [CrossRef] [Scilit]
- Sahmaran, M.; Erdem, T.K.; Yaman, I.O. Sulfate resistance of plain and blended cements exposed to wetting-drying and heating-cooling environments. Constr. Build. Mater. 2007, 21, 1771–1778. [Google Scholar] [CrossRef] [Scilit]
- Gospodinov, P.N. Numerical simulation of 3D sulfate ion diffusion and liquid push out of the material capillaries in cement composites. Cem. Concr. Res. 2005, 35, 520–526. [Google Scholar] [CrossRef] [Scilit]
- Yu, X.T.; Chen, D.; Feng, J.R.; Zhang, Y.; Liao, Y.D. Behavior of mortar exposed to different exposure conditions of sulfate attack. Ocean Eng. 2018, 157, 1–12. [Google Scholar] [CrossRef] [Scilit]
- Hewayde, E.; Pachenari, A.; Al-Eleaj, H. Resistance of Recycled Aggregate Concrete (RAC) Subjected to Drying-Wetting Cycles to Attack of Magnesium and Sodium Sulfates. J. Eng. 2020, 2020, 9746341. [Google Scholar] [CrossRef] [Scilit]
- Goncharov, A.; Zhutovsky, S. Eco-friendly belite cement from crude calcareous oil shale with low calorific value. Cem. Concr. Res. 2022, 159, 106874. [Google Scholar] [CrossRef] [Scilit]
- Vatin, N.; Barabanshchikov, Y.; Usanova, K.; Akimov, S.; Kalachev, A.; Uhanov, A. Cement-based materials with oil shale fly ash additives. In Proceedings of the IOP Conference Series: Earth and Environmental Science; IOP Publishing: Bristol, UK, 2020; Volume 578. [Google Scholar] [CrossRef] [Scilit]
- Chan, S.Y.N.; Ji, X. Water sorptivity and chloride diffusivity of oil shale ash concrete. Constr. Build. Mater. 1998, 12, 177–183. [Google Scholar] [CrossRef] [Scilit]
- Robert, J. Flatt Salt damage in porous materials: How high supersaturations are generated. J. Cryst. Growth 2002, 242, 435–454. [Google Scholar] [CrossRef] [Scilit]
- Tsui, N.; Flatt, R.J.; Scherer, G.W. Crystallization damage by sodium sulfate. J. Cult. Herit. 2003, 4, 109–115. [Google Scholar] [CrossRef] [Scilit]
- Yuan, J.; Liu, Y.; Tan, Z.; Zhang, B. Investigating the failure process of concrete under the coupled actions between sulfate attack and drying-wetting cycles by using X-ray CT. Constr. Build. Mater. 2016, 108, 129–138. [Google Scholar] [CrossRef] [Scilit]
- Rangel, C.S.; Amario, M.; Pepe, M.; Martinelli, E.; Filho, R.D.T. Influence of wetting and drying cycles on physical and mechanical behavior of recycled aggregate concrete. Materials 2020, 13, 5675. [Google Scholar] [CrossRef] [Scilit] [PubMed]
- Lv, Y.; Zhang, W.; Wu, F.; Li, H.; Zhang, Y.; Xu, G. Influence of Initial Damage Degree on the Degradation of Concrete Under Sulfate Attack and Wetting–Drying Cycles. Int. J. Concr. Struct. Mater. 2020, 14, 47. [Google Scholar] [CrossRef] [Scilit]
- Haddad, R.H.; Lababneh, Z.K. Geopolymer composites using natural pozzolan and oil-shale ash base materials: A parametric study. Constr. Build. Mater. 2020, 240, 117899. [Google Scholar] [CrossRef] [Scilit]
- Upnere, S.; Novakova, I.; Jekabsons, N.; Krasnikovs, A.; Macanovskis, A. Bridging Law Application to Fracture of Fiber Concrete Containing Oil Shale Ash. Buildings 2023, 13, 1868. [Google Scholar] [CrossRef] [Scilit]
- Chen, W.; Li, Y.; Chen, S.; Zheng, C. Properties and economics evaluation of utilization of oil shale waste as an alternative environmentally-friendly building materials in pavement engineering. Constr. Build. Mater. 2020, 259, 119698. [Google Scholar] [CrossRef] [Scilit]
- Huntzinger, D.N.; Eatmon, T.D. A life-cycle assessment of Portland cement manufacturing: Comparing the traditional process with alternative technologies. J. Clean. Prod. 2009, 17, 668–675. [Google Scholar] [CrossRef] [Scilit]
- Tan, Y.; Yu, H.; Ma, H.; Zhang, Y.; Wu, C. Study on the micro-crack evolution of concrete subjected to stress corrosion and magnesium sulfate. Constr. Build. Mater. 2017, 141, 453–460. [Google Scholar] [CrossRef] [Scilit]
- Tian, B.; Cohen, M.D. Does gypsum formation during sulfate attack on concrete lead to expansion? Cem. Concr. Res. 2000, 30, 117–123. [Google Scholar] [CrossRef] [Scilit]
- Abdullah, A.; Jaafar, M.S.; Taufiq-Yap, Y.H.; Alhozaimy, A.; Al-Negheimish, A.; Noorzaei, J. The effect of various chemical activators on pozzolanic reactivity: A review. Sci. Res. Essays 2012, 7, 719–729. [Google Scholar] [CrossRef] [Scilit]
- Al-harahsheh, A.; Al-otoom, A.; Al-harahsheh, M.; Al-adamat, R.; Al-ayed, O. The Leachability Propensity of El-Lajjun Jordanian. Oil Shale 2012, 4, 29–34. [Google Scholar]
- Hakimi, M.H.; Abdullah, W.H.; Alqudah, M.; Makeen, Y.M.; Mustapha, K.A. Organic geochemical and petrographic characteristics of the oil shales in the Lajjun area, Central Jordan: Origin of organic matter input and preservation conditions. Fuel 2016, 181, 34–45. [Google Scholar] [CrossRef] [Scilit]
- Wang, C.Q.; Lin, X.Y.; He, M.; Wang, D.; Zhang, S.L. Environmental performance, mechanical and microstructure analysis of concrete containing oil-based drilling cuttings pyrolysis residues of shale gas. J. Hazard. Mater. 2017, 338, 410–427. [Google Scholar] [CrossRef] [Scilit] [PubMed]
- Geller, Y.I.; Burg, A.; Halicz, L.; Kolodny, Y. System closure during the combustion metamorphic “Mottled Zone” event, Israel. Chem. Geol. 2012, 334, 25–36. [Google Scholar] [CrossRef] [Scilit]
- Cordova, C.E. Floodplain degradation and settlement history in Wadi al-Wala and Wadi ash-Shallalah, Jordan. Geomorphology 2008, 101, 443–457. [Google Scholar] [CrossRef] [Scilit]
- ASTM C150/C150M-15; Standard Specification for Portland Cement. ASTM International: West Conshohocken, PA, USA, 2019; pp. 1–9. [Google Scholar] [CrossRef] [Scilit]
- ASTM C33/C33M-18; Concrete Aggregates 1. ASTM International: West Conshohocken, PA, USA, 2010; pp. 1–11. [Google Scholar] [CrossRef] [Scilit]
- Boye Bork, J.; Preben, C. Petrographic examination of hardened concrete. Bull. Int. Assoc. Eng. Geol. 1989, 39, 99–103. [Google Scholar] [CrossRef] [Scilit]
- ASTM C1723-16; Standard Guide for Examination of Hardened Concrete Using Scanning Electron Microscopy. Annual Book of ASTM Standards. ASTM International: Conshohocken, PA, USA, 2016; pp. 1–5. [Google Scholar] [CrossRef] [Scilit]
- ASTM C109/C109M; Standard Test Method for Compressive Strength of Hydraulic Cement Mortars. ASTM International: Conshohocken, PA, USA, 2020; p. 9. [Google Scholar] [CrossRef] [Scilit]
- ASTM C597-09; Standard Test Method for Pulse Velocity Through Concrete. ASTM International: Conshohocken, PA, USA, 2010; pp. 3–6.
- ASTM C666/C666M; Standard Test Method for Resistance of Concrete to Rapid Freezing and Thawing. ASTM International: Conshohocken, PA, USA, 2003; pp. 1–6.
- ASTM C642-90; Standar Test Method for Spesific Gravity, Absorption, and Voids in Hardened Concrete. ASTM International: Conshohocken, PA, USA, 1990. [Google Scholar] [CrossRef] [Scilit]
- Salah Alaloul, W.; Al Salaheen, M.; Malkawi, A.B.; Alzubi, K.; Al-Sabaeei, A.M.; Ali Musarat, M. Utilizing of oil shale ash as a construction material: A systematic review. Constr. Build. Mater. 2021, 299, 123844. [Google Scholar] [CrossRef] [Scilit]

Disclaimer/Publisher’s Note: The statements, opinions and data contained in all publications are solely those of the individual author(s) and contributor(s) and not of MDPI and/or the editor(s). MDPI and/or the editor(s) disclaim responsibility for any injury to people or property resulting from any ideas, methods, instructions or products referred to in the content. |
© 2026 by the authors. Licensee MDPI, Basel, Switzerland. This article is an open access article distributed under the terms and conditions of the Creative Commons Attribution (CC BY) license.