


Abstract
In the context of global carbon reduction, university teaching buildings, as typical densely populated public spaces, face the dual challenges of high operational carbon emissions and strict daylighting demands. This study therefore focuses on jointly improving daylighting performance and reducing operational carbon emissions. However, current optimization practices are largely constrained by a “homogeneous” design paradigm applied to spatial layouts and building envelopes, which fails to fully exploit the passive energy-saving potential of buildings. To address this limitation, this study proposes a daylighting-carbon emission synergistic optimization framework integrating parametric modeling, Non-dominated Sorting Genetic Algorithm II (NSGA-II) multi-objective optimization, Stacking ensemble prediction models, and Shapley Additive Explanations (SHAP) analysis. The results indicate that: (1) compared to the homogeneous baseline model, the comprehensive Pareto optimal solution reduces the operational carbon emission intensity (CEI) by 12.5%, while simultaneously increasing spatial daylight autonomy (sDA) and useful daylight illuminance (UDI) by 14.1% and 18.9%, respectively; (2) the Pareto optimal solutions exhibit distinct heterogeneous distribution characteristics in spatial morphology and facade configuration. Specifically, the floor plan adopts an asymmetrical layout characterized by “deep south (9.0–9.5 m) and shallow north (6.5–7.0 m)” zones, while the facade window-to-wall ratio (WWR) displays a vertical gradient of “larger upper and smaller lower” openings (with a high-to-low zone WWR ratio of 1.07–1.25); (3) the two developed Stacking prediction models achieve R2 values greater than 0.90, substantially reducing the computational cost of dynamic simulations while ensuring high predictive accuracy; (4) SHAP analysis quantifies the contributions of 24 design parameters and 12 spatial heterogeneity indicators (HIs) to model predictions of daylighting and carbon performance. In conclusion, this study proposes heterogeneous design strategies, providing a scientific reference for the synergistic optimization of daylighting and carbon emissions in teaching buildings located in cold climates.
1. Introduction
1.1. Background
Amidst the escalating severity of global climate change, the green and low-carbon transition of the building sector has become pivotal for achieving global greenhouse gas emission reduction targets [1]. This urgency is particularly pronounced for public buildings, driven by China’s proactive “dual-carbon” strategy (carbon peaking and carbon neutrality), which accelerates the demand for energy conservation and carbon mitigation [2,3,4]. Among various public facilities, teaching buildings—characterized by high occupancy density and prolonged daily usage—account for a substantial proportion of operational carbon emissions [5]. Simultaneously, the quality of the indoor physical environment in these educational spaces is directly linked to the visual health, cognitive performance, and learning efficiency of students and teachers, thereby necessitating stringent requirements for high-quality daylighting [6]. Consequently, this study investigates how daylighting quality and operational carbon emissions can be jointly considered in the performance optimization of teaching buildings.
Particularly in cold climates, achieving this synergistic objective is confronted by a rigorous “daylight-thermal tradeoff” [7]. On one hand, introducing abundant, high-quality daylight can significantly enhance the psychological comfort of occupants [8]. On the other hand, the pursuit of higher spatial daylight autonomy (sDA) and useful daylight illuminance (UDI) often compels designers to expand the transparent boundaries of building facades (e.g., by increasing the window-to-wall ratio) [9]. During the protracted winters typical of cold regions, expansive glazed windows inevitably compromise the overall thermal resistance of the building envelope, resulting in a surge of conductive heat loss. Conversely, during summer, these highly transparent boundaries invite excessive solar heat gains. The massive heating and cooling loads required to offset these adverse thermal transfers ultimately translate into a soaring annual operational carbon emission intensity (CEI) [10]. Identifying the optimal equilibrium within these intricate physical boundaries—ensuring high-quality daylighting while minimizing operational carbon emissions—remains a pressing technical challenge.
However, conventional teaching building designs are predominantly constrained by standardized construction paradigms. They rely heavily on “homogeneous” spatial morphologies and envelope configurations, such as perfectly symmetrical north–south room depths, uniform window-to-wall ratios, and monolithic glass materials across all facades [11]. This homogeneous strategy fails to adequately respond to the variations in solar radiation and thermal conditions across different orientations and vertical heights, thereby severely limiting the potential for passive energy savings. In contrast, a “heterogeneous” design strategy—characterized by the differentiated configuration of spatial scales (e.g., room depth and width) and facade parameters (e.g., window-to-wall ratio and glass type) across horizontal and vertical dimensions—has been proven to balance illuminance distribution and regulate thermal loads more effectively [12]. In this study, the horizontal dimension refers to differences between north- and south-facing spaces, while the vertical dimension refers to differences between floors or height zones. Therefore, an in-depth exploration of the mechanisms by which heterogeneous design drives the synergistic enhancement of daylighting and carbon reduction holds significant theoretical importance and practical engineering value [13].
1.2. Related Work
1.2.1. Research on Daylighting and Thermal Performance of Teaching Buildings
Teaching buildings, as typical spaces characterized by high-intensity visual tasks and high occupancy density, have drawn significant academic attention in recent years regarding their indoor physical environmental quality and operational carbon emission control [14]. Relevant studies primarily unfold across two dimensions: the improvement of single physical environments and multi-objective synergistic optimization.
In the dimension of luminous environment optimization, numerous studies have been dedicated to maximizing the effective utilization of indoor daylighting through foundational parametric design. Xu et al. [15] developed a multi-objective classroom design method considering energy demand, thermal comfort, and daylighting, while Samiou et al. [16] examined daylighting and artificial lighting criteria for visual comfort in preschool classrooms. Zhu et al. [17] investigated kindergarten daylighting optimization across different light climate zones, and Chiou et al. [18] examined visual comfort in university classrooms. Furthermore, Chen et al. [9] combined NSGA-II and machine learning to optimize teaching building atriums, reporting improvements in light comfort of 5.85% and 20% for four-directional and tri-directional atriums, respectively.
With increasing emphasis on emission reduction in the building sector, the thermal optimization of building envelopes and the control of operational carbon emissions have emerged as another research focus in recent years. Previous studies have examined building design strategies for balancing energy use and indoor environmental performance. Xu et al. [15] developed a classroom optimization method considering energy demand, thermal comfort, and daylighting. Nazari et al. [19] investigated window and shading optimization to reduce energy consumption and improve occupant comfort, while Liu et al. [2] examined multi-objective design optimization for energy use and thermal comfort in a university student center.
Given the inherent physical tradeoff between enhancing daylighting and reducing operational carbon emissions, the coupled optimization of daylight-thermal environments has become a mainstream trend in current research [20]. Wang et al. [21] and He et al. [22] employed a co-simulation framework coupling EnergyPlus and Radiance, achieving the synchronous deduction of design variables under composite daylight-thermal boundaries. To search for optimal solutions amidst vast combinations of design variables, Wani et al. [23], Wang et al. [24], and Zhai et al. [25] introduced non-dominated sorting genetic algorithms (e.g., NSGA-II) to iteratively solve for multi-dimensional parameters—such as window-to-wall ratios, shading dimensions, and envelope materials—successfully obtaining Pareto optimal solution sets for daylight-thermal synergistic optimization.
Previous optimization studies commonly adopted homogeneous facades or standardized floor layouts [26,27], leaving orientation- and floor-specific design configurations less explored.
1.2.2. Multi-Objective Optimization and Regression Prediction Models
This study employs NSGA-II to explore trade-offs between daylighting and carbon emissions. Repeated performance simulations are computationally demanding, motivating the use of machine learning surrogate models for efficient prediction [28].
Previous studies have investigated algorithms such as SVM, RF, and ANN, alongside component-based prediction approaches and reviews of data-driven building performance modelling [29,30,31,32]. These studies provide a basis for surrogate modelling, while two challenges remain relevant to heterogeneous building design: model generalization and interpretability.
First, regarding model generalization, the vast majority of daylighting-thermal regression prediction tasks still rely on single machine learning algorithms. While individual learners fit well with conventional boundaries, their generalization capability and robustness are significantly constrained when facing large-scale datasets and nonlinear features.
Second, regarding mechanistic interpretability, existing prediction models typically manifest as impenetrable “black boxes.” These models often overly focus on pursuing absolute precision in terminal predicted values (such as illuminance metrics and carbon emission intensity). Although they capture the nonlinear characteristics of the data, they obscure the deep physical mechanisms through which input variables drive target performance, making it difficult to translate high-precision prediction models into actionable building design guidelines with clear guiding significance.
To address the aforementioned pain points, introducing a multi-model fusion Stacking ensemble learning framework has become an effective approach to breaking through the robust prediction bottleneck of high-dimensional heterogeneous parameters and solving the generalization limitation of models. Meanwhile, combined with the cutting-edge SHAP interpretability analysis, it enables a deep decoding of the marginal contributions and nonlinear regulatory patterns of design parameters on various performance metrics [33]. Nevertheless, relevant research that deeply integrates the Stacking architecture with SHAP and specifically applies it to the “daylighting-carbon” synergistic optimization of heterogeneous building spaces remains scarce.
1.3. Research Gaps and Objectives
Despite advances in the synergistic optimization of daylighting and operational carbon emissions in teaching buildings, three research gaps remain:
- (1)
- Existing studies often adopt symmetrical spatial layouts and uniform envelope configurations, leaving the potential of differentiated designs across orientations and floors insufficiently explored.
- (2)
- Individual design parameters do not directly quantify spatial heterogeneity. Explicit indicators are needed to characterize north–south differences and vertical gradients and support the extraction of quantitative design patterns.
- (3)
- The integration of ensemble prediction and interpretable analysis remains limited for heterogeneous teaching building designs, hindering the translation of performance predictions into practical design guidance.
To address these gaps, this study develops a framework integrating parametric modeling, multi-objective optimization, ensemble prediction, and interpretable analysis. The specific research objectives are as follows:
- (1)
- To define 24 design parameters representing horizontal and vertical differentiation and apply NSGA-II multi-objective optimization to identify heterogeneous design configurations that improve daylighting performance while reducing operational carbon emissions.
- (2)
- To establish 12 Heterogeneity Indicators (HIs) that quantify north–south differences and vertical gradients, and develop and evaluate Stacking regression models using the original parameters and HIs as two separate feature sets for rapid performance prediction.
- (3)
- To apply SHAP analysis to identify influential design parameters and heterogeneity indicators, interpret their contributions to predicted daylighting and carbon performance, and derive heterogeneous design strategies for teaching buildings in cold climates.
2. Methodology
2.1. Overall Research Framework
Targeting teaching buildings in cold regions, this study constructed an integrated design framework that fuses parametric model construction, multi-objective optimization, and prediction modeling. The overall workflow is illustrated in Figure 1, specifically comprising the following three core phases:
Figure 1.
Overall research framework.
- (1)
- Parametric Model Construction and Establishment of Heterogeneity Indicators
First, the heterogeneous design parameters of the teaching building were identified, and their specific value ranges were delineated. Subsequently, systematic heterogeneity indicators (HIs) were established to provide precise variable boundaries and evaluation benchmarks for subsequent dynamic simulation, optimization, and data mining. Finally, based on these indicators, a parametric physical model of a typical teaching building in a cold region was constructed.
- (2)
- Dynamic Performance Simulation and Multi-Objective Optimization
The EnergyPlus and Radiance physical engines were utilized to conduct annual dynamic simulations of the daylight-thermal environment on the parametric model. Operational carbon emission intensity (CEI), spatial daylight autonomy (sDA), and useful daylight illuminance (UDI) were extracted as the core objective functions. Building upon this, the NSGA-II multi-objective optimization algorithm was executed to perform iterative searches, acquiring the Pareto optimal solution set that balances carbon reduction requirements in cold climates with high-quality daylighting. The heterogeneous distribution patterns of the spatial geometry and facade parameters within this set were then extracted.
- (3)
- Prediction Model Construction and SHAP Analysis
Integrating the large-sample database generated during the multi-objective optimization phase, machine learning-based ensemble regression prediction models were constructed to achieve efficient and precise predictions of the building’s daylighting and carbon performance indicators. Finally, the SHAP (Shapley Additive Explanations) analytical method was introduced to perform explainable decoding of the black-box regression models, accurately quantifying the driving mechanisms and relative contributions of individual heterogeneous design parameters and heterogeneity indicators to building performance.
2.2. Parametric Model Construction
2.2.1. Selection and Field Measurement of the Case Study Building
The Sixth Teaching Building of Yantai University, located in Yantai, Shandong Province, within China’s cold climate zone (37.5° N, 121.4° E), was selected for field measurements and as the reference case for parametric modelling. Constructed around 1990, the building accommodates teaching activities for students and teachers and has a double-loaded corridor layout, with classrooms arranged on the north and south sides. The building plan is 72 m long and 19 m wide, with a central inner corridor 3 m in width. It comprises five above-ground stories, with a floor-to-floor height of 3.6 m. As one of the 17 surveyed teaching buildings, it shares their multi-story form and corridor-based spatial organization, providing a reference case grounded in the surveyed local building type. Despite its homogeneous facade configuration, the building exhibited spatial variations in daylighting and thermal conditions across orientations and floors under external meteorological influences. These characteristics made it suitable for investigating spatial differentiation and informed the subsequent decoupling of plan and facade parameters.
To quantify the spatial differences in daylighting and thermal conditions and obtain data for model validation, synchronized indoor–outdoor measurements were conducted on 14 June 2026, covering one day from 8:00 to 18:00 under overcast conditions. Outdoor air temperature, relative humidity, and illuminance were recorded concurrently. Four representative classrooms were selected for the measurements: the south-facing ground floor (1F-S), the north-facing ground floor (1F-N), the south-facing top floor (5F-S), and the north-facing top floor (5F-N). Within each tested classroom, 24 illuminance measurement points were evenly distributed across a standard workplane at a height of 0.75 m above the floor. Simultaneously, an air temperature measurement point was positioned at the geometric center of each classroom to synchronously record temperature and illuminance variations (detailed instrument parameters are listed in Table 1, and the layout of measurement points is shown in Figure 2) [9]. During the measurement period, the target classrooms were strictly maintained in an unoccupied state, and all mechanical and electrical equipment, including artificial lighting and HVAC systems, were completely turned off. This was done to accurately capture the natural daylight-thermal response characteristics of the building body operating in a passive mode [6].
Table 1.
Test parameters and measuring instruments.
Figure 2.
Measurement point layout and instrument photographs: (a) layout of measurement points; (b) thermo-hygrometers; (c) lux meter.
2.2.2. Design Parameters and Their Value Ranges
To establish design variable ranges for the subsequent multi-objective optimization, field surveys and architectural mapping were conducted on 17 teaching buildings, including the Sixth Teaching Building of Yantai University. All surveyed buildings were located in Yantai, within China’s cold climate zone. The sample was selected based on a shared teaching function, multi-story form, and double-loaded corridor layout with classrooms on the north and south sides, ensuring consistency with the reference case in building use and spatial organization. The surveys recorded room depth, room width, window height, and window-to-wall ratio. These data were then examined using boxplots, and the interquartile range (25th–75th percentiles) of each parameter was used to define the conventional design boundaries (Figure 3).
Figure 3.
Distribution of measured data for design parameters: (a) room depth; (b) room width; (c) window height; (d) window-to-wall ratio.
Within these parameter ranges, classroom dimensions were adjusted while keeping the building’s external dimensions and corridor width fixed. The combined depth of the north- and south-facing classrooms was constrained to 16 m, and classroom widths varied within the fixed building length. These adjustments redistributed internal space while preserving gross floor area, total building volume, and overall compactness, thereby excluding changes in these quantities as a source of performance improvement. Occupancy in each classroom was calculated from its floor area at 1.5 m2/person, rather than fixed independently of room size.
Based on the establishment of the baseline building physical model, to further explore the heterogeneous design strategies required for buildings to respond to external meteorological conditions, this study conducted a refined spatial decoupling of the conventional parameters obtained from the field survey:
- (1)
- Orientation decoupling in the horizontal dimension refers to specifying room dimensions separately for the north and south orientations within the fixed building geometry. The corresponding parameters are north-facing depth (DN), south-facing depth (DS), north-facing width (WN), and south-facing width (WS).
- (2)
- Facade decoupling in the vertical dimension: The North and South facades were vertically subdivided into three sub-zones: High (H, 5th floor), Middle (M, 2nd–4th floors), and Low (L, 1st floor). The window-to-wall ratio (WWR), window height (HW), and glazing type (GT) were independently assigned for all 6 zones across the building.
- (3)
- Thermal property decoupling refers to specifying envelope thermal properties separately by orientation or facade zone. Glazing types were assigned to the six facade zones described above, while the north- and south-facing exterior wall heat transfer coefficients (UWN and UWS) were specified separately. Furthermore, the values for the wall heat transfer coefficients and the thermo-optical properties of the glazing strictly refer to the current “Design Standard for Energy Efficiency of Public Buildings” (GB 50189-2015) [34].
Through the multi-dimensional detailed subdivision described above, this study ultimately established 24 independent design variables categorized into plan, facade, and envelope configurations. The specific design variables, their value ranges, and iteration steps are detailed in Table 2; the thermo-optical properties of the glazing involved in the optimization are detailed in Table 3. The cross-combination of these 24 variables can construct a high-dimensional parametric solution space containing rich asymmetric features, laying a robust data foundation for subsequent multi-objective evolutionary optimization.
Table 2.
Design parameters of the teaching building model.
Table 3.
Construction and key thermo-optical properties of different glazing types.
2.2.3. Construction of Spatial Heterogeneity Indicators
The 12 Heterogeneity Indicators (HIs) were selected to describe relative differences in spatial dimensions, fenestration, and envelope thermal properties. Six horizontal indicators compare north- and south-facing parameters, while six vertical indicators compare upper and lower facade parameters. Previous research has used the north-to-south room-depth ratio to describe spatial asymmetry [35]; this study extends the ratio-based approach to both horizontal and vertical dimensions.
For horizontal comparisons, room depth, room width, and wall U-value are compared directly between orientations. Window-to-wall ratio, window height, and glazing U-value are first averaged within each orientation using weights of 1:3:1 for the high, middle, and low zones, corresponding to their respective floor counts.
For vertical comparisons, the five-story building is divided into two equal-height halves. Each half contains one end floor and 1.5 middle-zone floors. The upper-to-lower ratio is therefore calculated as (XH + 1.5XM)/(XL + 1.5XM), equivalent to (2XH + 3XM)/(2XL + 3XM). Thus, the coefficients 2 and 3 arise from the geometric subdivision. These ratios describe relative parameter differences, with glazing U-values treated as floor-weighted features rather than effective whole-facade U-values. The definitions and calculation formulas of the 12 heterogeneity indicators are presented in Table 4.
Table 4.
Classifications, definitions, and calculation formulas of the Heterogeneity Indicators (HIs).
2.2.4. Parametric Model Construction
Upon the completion of variable definition and feature extraction, this study leveraged Rhino 3D and its visual programming plug-in, Grasshopper, to translate the aforementioned 24 independent design parameters into a dynamically driven building physical model. Simulations were performed using Ladybug Tools v1.8.0, Radiance v5.4a, and EnergyPlus v23.2.0. The schematic diagram of the parametric teaching building model is illustrated in Figure 4.
Figure 4.
Schematic diagram of the parametric teaching building model.
The model generation strictly adhered to the decoupling logic of the heterogeneous design parameters: First, asymmetrical north–south topological grids were generated based on four horizontal geometric variables (DN, DS, WN, WS). Second, the parametric subdivision of the transparent facades was executed by reading the window-to-wall ratios and window heights (WWR, HW) across the six elevational sub-zones. Finally, utilizing the Ladybug Tools (Honeybee) components, the glazing types (GTs) and exterior wall heat transfer coefficients of each sub-zone were precisely assigned to their corresponding physical surfaces, thereby constructing a comprehensive building physical simulation boundary.
Regarding the setup of simulation boundaries and environmental conditions, the model was driven by the EnergyPlus Weather (EPW) data for Yantai. In accordance with the Design Standard for Energy Efficiency of Public Buildings (GB 50189-2015) [34], the indoor occupancy density was set to 1.5 m2/person, while the winter heating and summer cooling setpoint temperatures were controlled at 18 °C and 26 °C, respectively (detailed parameters for indoor internal heat gains and operational schedules are presented in Table 5).
Table 5.
Parameter settings for occupants and equipment.
Surrounding buildings were included in the model to account for external obstructions. No shading devices or blinds were modelled, consistent with the surveyed conditions. Interior surface reflectances and roughness are specified in Table 5. Preliminary parameter exploration showed that daylighting metrics were highly sensitive to glazing visible transmittance. Therefore, visible transmittance (T) was fixed at 0.81 across all glazing options to control this influence and more clearly assess performance differences associated with spatial layout and facade heterogeneity. Daylighting was evaluated using a 2 m × 2 m sensor grid at a workplane height of 0.75 m. This grid spacing follows a precedent in classroom daylighting simulation [36].
2.3. Performance Simulation and Multi-Objective Optimization
2.3.1. Construction of Daylighting-Carbon Emission Optimization Objectives
- (1)
- Dynamic Daylighting Metrics (sDA and UDI)
Daylighting performance metrics can be classified into static and dynamic categories. Considering the drastic seasonal variations in solar radiation typical of cold-climate regions, this study adopted the dynamic metrics of sDA and UDI, based on annual hourly meteorological data, to evaluate natural daylighting performance from the dimensions of “quantity” and “quality,” respectively.
Spatial Daylight Autonomy (sDA) is used to characterize the proportion of indoor effective floor area that can continuously receive sufficient workplane illuminance. In accordance with the standards of the Illuminating Engineering Society (IES) and addressing the high-intensity visual task requirements in teaching spaces, this study adopted the sDA300/50% evaluation benchmark [37,38]. This metric represents the percentage of floor area where the illuminance reaches or exceeds 300 lx for at least 50% of the annual operating hours. Its calculation formula is as follows (Equation (1)):
where N is the total number of illuminance sensor nodes within the space; Ai is the effective area represented by the i-th node; A_total is the total analysis area of the evaluated zone. The weighting factor wi depends on the daylight autonomy of that specific node (DAi), which is determined as follows: when DA ≥ 50%,wi = 1; otherwise, wi = 0
However, the singular pursuit of a high sDA can easily induce direct glare. Useful Daylight Illuminance (UDI) compensates for this limitation by focusing on the proportion of time during the annual occupied hours when the indoor illuminance falls within the visually comfortable range (100–2000 lx) [39,40]. The introduction of UDI100–2000lx aims to simultaneously avert the risks of insufficient daylighting (<100 lx) and excessive glare (>2000 lx). Its calculation formula is as follows (Equation (2)):
where Ttotal is the total annual operational hours (h); t represents a specific hour of the year. When the indoor natural illuminance Ei,t at time step t satisfies 100 ≤ 2000 lx, the binary parameter hi,t = 1; otherwise, hi,t = 0.
- (2)
- Heating- and Cooling-Related Operational Carbon Emission Intensity (CEI)
Under the macro-guidance of the “dual-carbon” strategy, reducing the environmental cost during the building operation phase is the core objective of performance optimization [41]. CEI is defined as the annual operational carbon emissions from heating and cooling per unit floor area, calculated using the corresponding electricity consumption and the electricity carbon emission factor. Lighting electricity is excluded from this indicator.
First, hourly simulations were conducted utilizing the EnergyPlus engine to obtain the building’s annual heating and cooling energy use intensities (EUIheating and EUIcooling, unit: kWh/m2). Subsequently, based on the average carbon emission factor of the Shandong provincial power grid specified in the Announcement on the Release of 2022 Carbon Dioxide Emission Factors for the Power Sector issued by the Ministry of Ecology and Environment [42], the energy consumption data were uniformly converted into the building’s annual operational carbon emission intensity (Carbon Emission Intensity, unit: kgCO2/m2). The calculation formula is as follows (Equation (3)):
where EUIheating is the annual heating energy use intensity per unit area; EUIcooling is the annual cooling energy use intensity per unit area; and fc is the average carbon emission factor of the Shandong provincial power grid, taken as 0.6410 kgCO2/kWh in this study.
CEI = (EUIheating + EUIcooling) × fc
2.3.2. Multi-Objective Optimization Experiment
To ensure adequate exploration of the design boundaries, maintenance of population diversity, and stable convergence to the Pareto front, the core operational parameters of the NSGA-II algorithm were configured as detailed in Table 6. The entire optimization process conducted dynamic performance evaluations on a total of 6000 design scenarios.
Table 6.
Parameter settings for the Wallacei (NSGA-II) multi-objective optimization algorithm.
The core of multi-objective optimization lies in quantifying and resolving the physical trade-off between daylight admission and building thermal loads through algorithmic iteration. This study leveraged the Wallacei plug-in within the Grasshopper platform to drive the NSGA-II algorithm. Given that the underlying logic of this algorithm operates on a “minimization” search, the daylighting performance metrics (sDA, UDI) intended for maximization were mathematically transformed into their reciprocals. Conversely, the carbon emission intensity (CEI), which inherently requires minimization, remained unmodified. Consequently, a three-dimensional synergistic optimization objective function, constrained by the 24 heterogeneous design variables x, was formulated (Equation (4)):
minF(x) = {f1(x),f2(x),f3(x)}
The individual objective functions are specifically defined as follows (Equations (5)–(7)):
f3(x) = CEI(x)
Wherein, the decision variable set x encompasses all the planar-elevational geometric boundaries and envelope thermal parameters listed in Table 3 of the preceding text, with its optimization search domain strictly constrained by the preset boundaries (Equation (8)):
xi = [xi,min,xi,max], i = 1, 2, …, 24
2.3.3. Selection of Comprehensive Optimal Solutions
To select the optimal Pareto solutions generated by the final generation, the Min-Max normalization method was employed to map all performance metrics uniformly onto the [0, 1] interval. To ensure consistency in the benefit orientation of the final score (where a higher score indicates superior comprehensive performance), positive normalization was applied to the maximization objectives (sDA, UDI) (Equation (9)), while reverse normalization was applied to the minimization objective (CEI) (Equation (10)):
Upon completion of normalization, given that the multi-objective optimization did not impose extreme preferences on any single objective, this study assigned equal weights to the three daylight-thermal metrics to calculate the Comprehensive Performance Index (CPI) for each design scheme. The calculation formula is as follows (Equation (11)):
Based on the aforementioned formula, the scheme with the highest comprehensive CPI score within the solution set was extracted as the comprehensive optimal solution of this study.
2.4. Regression Prediction Models and SHAP Analysis
2.4.1. Dataset Construction
A total of 6000 valid continuous performance simulation datasets were generated through the multi-objective optimization experiments. To comprehensively compare the representation capabilities of design parameters versus heterogeneity indicators on building performance, this study concurrently constructed two parallel feature datasets: the baseline dataset, constructed based on the 24 design parameters listed in Table 2, and the HIs dataset, constructed based on the 12 heterogeneity indicators listed in Table 4. The continuous performance outcomes (sDA, UDI, CEI) output by these 6000 simulations directly served as the ground truth to drive the regression models.
Regarding dataset partitioning, each of the two parallel datasets was divided into training, validation, and test sets at a ratio of 7:1:2. Specifically, 4200 samples (70%) were used for model training, 600 samples (10%) for performance validation during model development, and 1200 samples (20%) for the final evaluation of predictive performance. The test set was reserved for final evaluation and was not used for model fitting or selection. Five-fold cross-validation was performed within the training subset. The validation subset supported model selection, and the testing subset was reserved for final evaluation. [6].
2.4.2. Predictive Model Construction
When confronted with an extensive library of design schemes containing numerous differentiated configurations, the computational cost of traditional physical engines becomes prohibitively high [4]. To this end, this study incorporates machine learning techniques to construct efficient surrogate models, aiming to directly establish a non-linear regression mapping relationship between architectural geometric parameters (or heterogeneity indicators) and continuous daylighting-thermal performance metrics (sDA, UDI, CEI).
Three baseline regressors—XGBoost, RF, and MLP—and a Stacking ensemble were evaluated. Records containing missing or non-finite values were excluded. Target variables and MLP input features were standardized using training data, with predictions transformed back to their original units. Hyperparameters were tuned through randomized search with five-fold cross-validation within the training subset.
- (1)
- Machine Learning Models
To fully capture the complex correlations between building facade features and performance, this study selected classical tree-based ensemble algorithms as core baseline predictors, specifically Extreme Gradient Boosting (XGBoost) and Random Forest (RF). By incorporating regularization terms and second-order derivative-based approximate optimization, XGBoost effectively controls model complexity and enhances fitting accuracy. In contrast, RF relies on the Bagging strategy to construct multiple deep decision trees and computes their average, exhibiting strong robustness in handling non-linear features and resisting outliers [43].
- (2)
- Multi-Layer Perceptron (MLP)
The Multi-Layer Perceptron (MLP) is a classical feed-forward artificial neural network that demonstrates superior deep feature extraction capabilities in handling highly complex non-linear regression tasks [44]. During the forward propagation of information within the network, neurons in each layer receive weighted inputs from the preceding layer and transform them via non-linear activation functions, thereby achieving high-order mapping of the feature space. The mathematical expression of this hierarchical information transmission is as follows (Equation (12)):
where h(l) is the output vector of the l-th layer; W(l) and b(l) are the weight matrix and bias vector of the layer, respectively; and f(·) denotes the activation function that introduces non-linearity.
h(l) = f(W(l)h(l−1) + b(l))
- (3)
- Stacking Ensemble Model
The Stacking ensemble used XGBoost, RF, and MLP as base regressors and RidgeCV as the meta-learner. Five-fold out-of-fold predictions from the training subset were combined with the original input features to train the meta-learner. The base regressors were subsequently fitted on the full training subset, and a separate ensemble was fitted for each prediction target.2.4.3 Predictive Model Evaluation
To scientifically quantify the prediction accuracy and generalization capability of the regression models, this study selected three core evaluation metrics—the coefficient of determination (R2), root mean square error (RMSE), and mean absolute percentage error (MAPE)—to comprehensively validate the prediction results [45,46,47].
In Equations (13)–(15), n is the total number of samples in the test set, yi is the true simulated value calculated by the physical engine, is the predicted value of the regression model, and is the sample mean of the true values.
Coefficient of Determination (R2) (Equation (13)): Reflects the proportion of variance in the dependent variable (true values) that is predictable from the independent variables (predicted values) by the model. A value closer to 1 indicates a higher goodness of fit.
Root Mean Square Error (RMSE) (Equation (14)): Measures the sample standard deviation of the differences between predicted and true values. It exhibits strong penalty sensitivity to large local errors, and a smaller value indicates higher absolute prediction accuracy.
Mean Absolute Percentage Error (MAPE) (Equation (15)): Presents the prediction error in the form of a relative percentage, effectively eliminating the influence of scale differences among various performance metrics (such as illuminance and carbon emissions) and enabling an intuitive evaluation of the relative deviation of the model across different value intervals.
2.4.3. SHAP Explainability Analysis
Despite the high prediction accuracy offered by high-dimensional Stacking ensemble models, their complex “black-box” nature conceals the underlying building physics, making it difficult for designers to extract actionable design rules [48]. To this end, this study introduces the SHAP (Shapley Additive exPlanations) algorithm to conduct an in-depth interpretation of the machine learning models [49].
The core concept of SHAP is to achieve local linear attribution of complex non-linear prediction results by calculating the marginal contribution of each input feature to the model’s final output (i.e., the Shapley value) [50]. For a given sample x, the fundamental calculation formula for the Shapley value φi of the i-th feature is as follows (Equation (16)):
where F represents the set of all architectural design features; |F| is the total number of features; S is any feature subset that excludes feature i; |S| is the number of features contained in subset S; fx(S ∪ {i}) is the model prediction output when feature i is included; fx(S) is the baseline prediction output when feature i is excluded. Consequently, fx(S ∪ {i}) − fx(S) represents the marginal contribution brought by feature i after joining subset S.
SHAP ranks feature importance and describes positive and negative contributions to model predictions, rather than causal effects. Because some HIs share underlying variables, correlations between them may affect attribution; individual contributions should not be interpreted as independent physical effects.
3. Results
3.1. Field Measurement Results and Baseline Model Validation
3.1.1. Classroom Thermal-Daylighting Field Measurement Results
Field measurement data indicate (Figure 5) that in terms of planar distribution, the top-floor south-facing classroom (5F-S) experienced a peak working-plane illuminance of 1700 lux, with indoor temperatures peaking at 32.0 °C. In comparison, the north-facing classroom on the same floor (5F-N) recorded a peak illuminance of 1162.4 lux and temperatures ranging from 28.8 °C to 29.9 °C, demonstrating that illuminance and temperatures are significantly higher in south-facing rooms than in north-facing ones. Vertically, the daily peak illuminance in the first-floor south-facing classroom (1F-S) dropped to a low of 825.0 lux, and its daily peak temperature was 4.5 °C lower than that of 5F-S (peaking at 27.5 °C). For the bottom-floor shaded north-facing room (1F-N), the illuminance plummeted to a minimum of only 52.9 lux during the afternoon, exhibiting pronounced daylight deficiency. These field results intuitively reveal the significant spatial heterogeneity existing in the indoor thermal-daylighting environment of the teaching building across both horizontal and vertical dimensions.
Figure 5.
Comparison of measured indoor conditions in the four classrooms: (a) air temperature; (b) illuminance.
3.1.2. Validation of Model Simulation Against Field Measurements
The baseline model was evaluated against field measurements using the measured outdoor temperature, relative humidity, and illuminance as the corresponding boundary inputs. An overcast sky model was used for the measurement-day daylighting validation, consistent with the observed weather conditions. Occupancy, artificial lighting, and HVAC operation were disabled to match the measurement conditions. Simulated indoor temperatures and illuminance were compared with measurements at corresponding locations and times using R2 and MAPE.
Figure 6 and Table 7 compare the measured and simulated results. For indoor temperature, R2 ranges from 0.92 to 0.96 and MAPE from 1.05% to 1.52%. For illuminance, R2 ranges from 0.97 to 0.99 and MAPE from 5.95% to 9.48%.
Figure 6.
Comparison between indoor thermal and daylighting field measurements and simulation data: (a) temperatures for 5F-S; (b) temperatures for 5F-N; (c) temperatures for 1F-S; (d) temperatures for 1F-N; (e) illuminance for 5F-S; (f) illuminance for 5F-N; (g) illuminance for 1F-S; (h) illuminance for 1F-N.
Table 7.
Error analysis of measured and simulated data for the baseline model.
The agreement between measured and simulated results supports the model’s ability to reproduce indoor temperature and daylight illuminance under the monitored conditions, providing an empirical basis for subsequent parametric analysis.
3.2. Multi-Objective Optimization Experiments
3.2.1. Convergence Evaluation
In this study, the number of evolutionary generations for the NSGA-II algorithm was set to 120, evaluating a total of 6000 independent design schemes. Figure 7 illustrates the generation-by-generation changes in the average values of the three evaluation metrics: sDA, CEI, and UDI.
Figure 7.
Convergence of simulated performance during NSGA-II optimization: (a) sDA; (b) CEI; (c) UDI. The blue dots and solid lines represent the mean objective values across generations, while the red dots and dashed lines indicate the overall change from the initial to the final generation.
Figure 7a illustrates the generation-by-generation average value change curve of spatial Daylight Autonomy (sDA). The sDA metric experienced a global parameter exploration in the first 20 generations, followed by a steady increase, and leveled off after 80 generations. Figure 7b illustrates the generation-by-generation average value change curve of Carbon Emission Intensity (CEI) during the operation phase. Within the first 40 generations of evolution, the CEI rapidly declined, quickly eliminating inferior high-carbon solutions. After 60 generations, the mean curve remained largely horizontal, achieving convergence first. Figure 7c illustrates the generation-by-generation average value change curve of Useful Daylight Illuminance (UDI). Due to the complex physical trade-offs among UDI, sDA, and CEI, its evolutionary process exhibited moderate fluctuations; however, the overall mean still maintained a clear directional evolution and eventually converged within a concentrated solution space.
After 120 generations of evolution, the population means of all three evaluation metrics smoothly transitioned to directional convergence, proving that the algorithm has effectively approached the Pareto optimal front. These 6000 sets of continuous simulation data also provide a reliable data basis for the subsequent training of classification surrogate models.
3.2.2. Distribution Characteristics of Design Parameters for Optimal Solutions
This study conducted an in-depth analysis of the 37 non-dominated solution sets from the final generation of the multi-objective optimization experiments. The spatial design parameters of these solutions exhibited highly converged and heterogeneous distribution characteristics across both horizontal and vertical dimensions.
- (1)
- Horizontal Differences: Asymmetric Reconstruction of Spatial Geometry
As illustrated in Figure 8a, the Pareto optimal solution sets abandon conventional homogeneous and symmetric layouts in planar spatial partitioning, exhibiting a “deep-south and shallow-north” distribution pattern in room depth. In cold climate regions, since winter heating energy consumption dominates the annual operational carbon emissions, the south-facing room depth (DS) of the vast majority of solutions converges to the maximum values (9.0–9.5 m), aiming to maximize the capture of solar radiation in winter to reduce heating carbon emissions. Conversely, due to the lack of effective solar radiant heat gains, the north-facing room depth (DN) is compressed to 6.5–7.0 m to minimize indoor heat loss in winter. Regarding the room width (W) design, the data reveal a “wide-north and narrow-south” distribution characteristic, where the north-facing width (WN) is significantly broadened to approximately 14 m.
Figure 8.
Design parameter distributions of the Pareto-optimal solutions: (a) depth and width ratios; (b) WWR ratios; (c) north-facing window heights; (d) south-facing window heights; (e) north-facing glazing types; (f) south-facing glazing types; (g) exterior wall heat transfer coefficients.
In terms of the overall configuration of the building envelope, the optimal solutions also demonstrate a clear directional bias. According to the boxplot on the left side of Figure 8b, the mean value of the ratio of North-to-South facade window-to-wall ratios (WWRN/WWRS) is 0.95, indicating that the center of gravity of the total fenestration area is skewed toward the south. Regarding the thermal performance of the opaque envelope, the wall heat transfer coefficients exhibit a strong insulation tendency with subtle directional variations. As shown in Figure 8g, for the north-facing exterior wall—serving as the winter heat dissipation surface—its heat transfer coefficient (UN) converges to 100% of the optimal insulation limit of 0.3 W/(m2·K) to maximally cut off winter heat loss. Meanwhile, although 91.89% of the south-facing exterior wall heat transfer coefficients (US) similarly adopt 0.3 W/(m2·K), 8.11% of the solutions are relaxed to 0.5 W/(m2·K). This indicates that, under the compensation of abundant solar radiation gains on the south side, the system’s absolute reliance on the thermal insulation performance of south-facing solid walls is slightly reduced.
- (2)
- Vertical Differences: Refined Decoupling of Facade Interfaces
As shown in Figure 8b, the window-to-wall ratios of the upper and lower zones on both north and south facades consistently exhibit an “upper-large and lower-small” distribution, with their ratios (WWRN, Upper/WWRN,Lower and WWRS,Upper/WWRS,Lower) concentrated between 1.07 and 1.25.
The values of window height (HW) also exhibit significant orientation and floor differentiation. Comparing Figure 8c,d, the window heights in the middle and lower zones of the south facade (HWS,L, HWS,M) highly converge to full-scale large windows of 2.6 m, accounting for 81.08% and 100%, respectively. In contrast, the window heights in the upper zone of the north facade (HWN,H) are strictly restricted, with the vast majority of non-dominated solutions converging to smaller values of 2.0 m (43.24%) and 2.2 m (56.76%).
In terms of facade material configuration, the 37 solution sets exhibit a converging trend in the selection of glass types (GTs). All north-facing facades and the low zone of the south facade (GTS,L) 100% select Type 4 glass with the lowest heat transfer coefficient, whereas the top-floor high zone of the south facade (GTS,H) 100% shifts to Type 3 glass with a higher solar heat gain coefficient (SHGC).
3.2.3. Performance Analysis of the Pareto-Optimal Solution Set
To intuitively quantify the optimization efficacy of the three evaluation metrics, this study employed a parallel coordinates plot (Figure 9) to compare the performance metrics of the 37 Pareto non-dominated solutions with those of the benchmark physical model.
Figure 9.
Comparison of simulated performance between the baseline model and Pareto-optimal solutions.
The data comparison shows that, compared to the homogenized baseline model (CEI = 16.705 kgCO2/m2, sDA = 0.610, UDI = 0.386), the Pareto solution sets exhibit a significant directional shift in the objective space. In the carbon emission dimension, the CEI of all 37 solutions achieved a substantial downward shift (with values converging between 13.545 and 15.408 kgCO2/m2, representing a maximum reduction of 18.9%). In the daylighting environment dimension, sDA and UDI present a distinct topological trade-off: some solutions guided by extreme heating load reduction successfully drove CEI below 14.0 kgCO2/m2, but resulted in an irreversible attenuation of UDI (dropping to a minimum of 0.301); whereas the core polyline group successfully pulled sDA up to 0.68–0.71 and broadened UDI to 0.44–0.47 while maintaining CEI stable within the range of 14.5–15.0 kgCO2/m2, thereby achieving collaborative optimization of thermal and daylighting performance.
To intuitively quantify the optimization efficacy of the multi-objective evaluation metrics and distill underlying design principles, this study extracted three sets of single-objective extreme solutions and one comprehensive optimal solution from the Pareto front, conducting a comparative analysis of these four typical solutions against the baseline model. The spatial morphologies and thermal configuration parameters are detailed in Table 8 and Figure 10.
Table 8.
Design parameters and simulated performance of the baseline model and representative Pareto-optimal solutions.
Figure 10.
Parameterized models of the 5 design configurations: (a) baseline model; (b) maximum sDA solution; (c) minimum CEI solution; (d) maximum UDI solution; (e) comprehensive optimal solution.
Figure 10b represents the parameterized model for maximum sDA. In this scheme, the north-facing width is broadened to 14.0 m to maximize the intake of diffuse sky light. Simultaneously, the WWR in the middle and lower zones is enlarged to 0.60. To offset the heat loss caused by large-area fenestration, Type 4 glass with optimal insulation is mandatory for the entire building. This configuration boosts sDA to a peak of 0.717, while maintaining CEI at 14.689 kgCO2/m2.
Figure 10c is the parameterized model for minimum CEI. This scheme presents a “deep-north and shallow-south” (DN 8.5 m, DS 7.5 m) inverse pattern, which differs from the main solution cluster. Furthermore, the window-to-wall ratio on all floors is compressed to between 0.2 and 0.35. This geometric configuration minimizes the building’s overall light-transmitting and heat-dissipating surface, reducing CEI to as low as 13.545 kgCO2/m2. However, the trade-off is severely restricted natural light input, causing UDI to plummet to 0.301.
Figure 10d represents the parameterized model for maximum UDI. This scheme exhibits a significant “deep-south and shallow-north” (DS 9.5 m, DN 6.5 m) asymmetric pattern and reduces the south-facing near-window area significantly by narrowing the south-facing width (WS 12.0 m), effectively avoiding the spread of direct glare. This spatial strategy drives the Useful Daylight Illuminance (UDI) to a peak value of 0.469.
Figure 10e is the comprehensive optimal parameterized model. This scheme exhibits the heterogeneous design characteristics described above. The spatial layout adopts an asymmetric partition with a 9.5 m-deep south side and 6.5 m-shallow north side. The facade strictly implements an “upper-large and lower-small” fenestration gradient to balance daylighting and thermal storage, while the south-facing high zone is precisely decoupled and configured with Type 3 glass to capture solar radiation. While reducing CEI by 12.5%, this solution simultaneously increases sDA and UDI by 14.1% and 18.9%, respectively, achieving an optimal trade-off between the indoor daylighting environment and carbon emission targets under cold climate constraints.
3.3. Prediction Model and SHAP Interpretability Analysis
3.3.1. Evaluation of Predictive Performance of Prediction Models
This study conducted performance evaluations on the prediction models for 24 design parameters and 12 heterogeneity indicators, respectively, comprehensively comparing the regression prediction performance of Extreme Gradient Boosting (XGBoost), Random Forest (RF), Multi-Layer Perceptron (MLP), and the Stacking ensemble architecture.
- (1)
- Performance Validation Based on 24 Original Design Parameters
Table 9 presents the generalization performance of each model on the independent test set. Within the 24-dimensional high-dimensional original feature space, all four algorithms possess excellent baseline fitting capabilities (global R2 > 0.98). Among them, the Stacking ensemble model demonstrates the optimal numerical fidelity by integrating the heterogeneous advantages of tree-based models and neural networks: its R2 values for the three core objectives—sDA, UDI, and CEI—reached 0.9941, 0.9957, and 0.9985, respectively, while the Mean Absolute Percentage Error (MAPE) for each was strictly controlled below 0.54%, significantly reducing the risk of overfitting inherent in single-algorithm approaches.
Table 9.
Accuracy of ML predictions against simulated reference values using 24 original design parameters.
- (2)
- Dimensionality Reduction Validation Based on 12 Heterogeneity Indicators
To further decouple the thermal-daylighting synergy mechanism from the perspective of spatial heterogeneity, this study comprehensively evaluated the generalization performance of each prediction model on the high-order feature dataset composed of 12 heterogeneity indicators (HIs) (Table 10).
Table 10.
Accuracy of ML predictions against simulated reference values using 12 heterogeneity indicators.
The results show that when facing data dimensionality reduction and high-order feature recombination, the prediction accuracy of single baseline models (such as RF and MLP) experienced a certain degree of attenuation, whereas the Stacking ensemble model still maintained excellent robustness. Its coefficients of determination (R2) for predicting sDA and UDI in the test set remained stable above 0.94, and the R2 for CEI also reached 0.9022.
The above comparison results indicate that the Stacking ensemble prediction model can not only resolve basic physical boundaries with high precision, but also effectively capture the correlations between heterogeneity indicators and comprehensive performance. Therefore, this study ultimately selected this Stacking ensemble model to conduct the subsequent SHAP interpretability analysis.
3.3.2. Global Contribution Analysis of Original Design Parameters
To further reveal the driving mechanisms of physical boundaries on the thermal-daylighting performance of buildings, this study selected the design parameters ranked in the top 10 by SHAP contribution to conduct a global attribution analysis (Figure 11).
Figure 11.
SHAP importance ranking of the top 10 original design parameters contributing to Stacking model predictions: (a) sDA; (b) UDI; (c) CEI.
Regarding the evaluation metrics of sDA and UDI, planar dimensions and facade fenestration areas exhibit a decisive influence, although the distribution of sensitivity differs between the two. The driving factors of Useful Daylight Illuminance (UDI) are highly concentrated, with the cumulative contribution of the north-facing middle-zone window-to-wall ratio (WWRN,M) and the south-facing middle-zone window-to-wall ratio (WWRS,M) reaching as high as 82.03%. This indicates that strictly controlling the absolute light-transmitting area of the primary north and south daylighting surfaces is the most critical pathway to avoiding extreme indoor illuminance (glare or insufficient light) and maintaining an effective illuminance range.
In contrast, the driving characteristics of spatial Daylight Autonomy (sDA) exhibit a multi-factor synergistic trend. Although WWRN,M still ranks first with a weight of 42.62%, the contributions of the north-facing width (WN, 12.89%) and north-facing depth (DN, 11.33%) increase significantly. This suggests that after satisfying basic natural daylighting, the spatial topological ratio of the building floor plan (the geometric reconstruction of width and depth) plays an important regulatory role in enhancing daylighting autonomy in the deep interior zones of the building.
For the Carbon Emission Intensity (CEI) metric, the driving logic of the parameters evolves from being purely geometrically dominated to a deep coupling of “geometry and thermal performance.” While WWRN,M and WWRS,M still maintain significant weights (totaling approximately 50%), the contribution of the thermal properties of the building envelope increases substantially: south-facing glass properties (UGS,M), south-facing wall heat transfer coefficient (UWS), north-facing glass properties (UGN,M), and north-facing wall heat transfer coefficient (UWN) all rose to the top six.
Furthermore, the SHAP rankings for each performance metric generally exhibit significant north–south asymmetry (e.g., the regulatory weight of WWRN,M on daylighting is far higher than that of the same layer on the south side). Based on these findings, Section 3.3 will specifically explore the underlying mechanisms through which the 12 heterogeneity indicators influence the three daylighting and thermal performance indicators.
3.3.3. SHAP Interpretability Results of Heterogeneity Indicators
Based on the Stacking ensemble prediction model constructed from the 12 HIs, this study utilized SHAP global importance and beeswarm plots to quantitatively analyze the nonlinear driving laws of horizontal (north–south differences) and vertical (facade upper-lower zone gradients) heterogeneity on the core performance objectives.
Figure 12 indicates that horizontal heterogeneity indicators play a dominant role in the driving mechanism of sDA. As shown in Figure 12a, the top four core parameters (HWN/HWS, WWRN/WWRS, DN/DS, WN/WS) are all horizontal heterogeneity indicators, with a cumulative contribution rate reaching 65.66%. Combined with the SHAP beeswarm plot in Figure 12b, it can be seen that high feature values of the north-to-south width ratio (WN/WS) are densely distributed in the positive SHAP interval, indicating that increasing the proportion of north-facing width has a positive compensatory effect on the enhancement of overall daylighting area. Meanwhile, high feature values of the window height ratio between north- and south-facing rooms (HWN/HWS) are significantly distributed in the negative SHAP interval, suggesting that blindly raising the north-facing window height will instead inhibit overall daylighting performance.
Figure 12.
SHAP contributions of heterogeneity indicators to Stacking model predictions of sDA: (a) global importance ranking; (b) SHAP beeswarm plot.
In the physical driving mechanism of Useful Daylight Illuminance (UDI), horizontal heterogeneity parameters (especially the light-transmitting skin configuration across north and south orientations) play a decisive and dominant role. As shown in Figure 13a, the SHAP contribution of the north-to-south window-to-wall ratio (WWRN/WWRS) ranks first (25.41%) and exhibits a significant positive gain on the target performance. In addition, the heat transfer coefficient ratio of the upper and lower zones of glass on the north facade (UGN,Upper/UGN,Lower, 15.06%) also demonstrates a strong positive drive. This indicates that appropriately increasing the proportion of fenestration area on the north side and implementing differentiated material property configurations on the north facade in the vertical direction are conducive to the improvement of Useful Daylight Illuminance.
Figure 13.
SHAP contributions of heterogeneity indicators to Stacking model predictions of UDI: (a) global importance ranking; (b) SHAP beeswarm plot.
In stark contrast to the contributions of heterogeneity indicators to daylighting performance, the physical response mechanism of operational carbon emission intensity (CEI) relies more heavily on design variables in the vertical dimension. In the attribution results of the carbon emission objectives (Figure 14), the influence weight of vertical heterogeneity parameters increases remarkably, highlighting the critical role of thermal decoupling of the building envelope along the vertical height for energy consumption control in cold regions. Specifically, the ratio of the glass heat transfer coefficient between the upper and lower zones on the north side (UGN,Upper/UGN,Lower) ranks first with a contribution rate of 14.84% and exhibits a strong positive penalty effect—indicating that higher values of this ratio are associated with positive SHAP contributions to predicted CEI. Meanwhile, the second-ranked ratio of the glass heat transfer coefficient between the north and south sides (UGN/UGS, 14.02%) indicates that when the thermal insulation performance of the north-facing transparent envelope is weaker than that of the south side, it will result in an increase in the overall operational carbon emissions of the building.
Figure 14.
SHAP contributions of heterogeneity indicators to Stacking model predictions of CEI: (a) global importance ranking; (b) SHAP beeswarm plot.
4. Discussion
4.1. Discussion of the Daylighting–Carbon Optimization Framework
Addressing the bottlenecks faced by existing building performance optimization studies due to dimensional limitations and a lack of interpretability, this study proposes and validates a “parameter decoupling–multi-objective optimization–ensemble prediction–explainable attribution” synergistic optimization framework for daylighting and carbon emissions.
First, at the parameter representation level, numerous recent studies focusing on the multi-objective optimization of building daylighting and thermal performance have tended to seek global optimal solutions under the “homogenization” assumption [51]. However, in cold climates, blindly expanding global fenestration to meet the daylighting needs of deep interior spaces will inevitably lead to uncontrolled overall heat loss during winter. This framework decouples 24 fundamental geometric and thermal parameters and introduces 12 dimensionless Heterogeneity Indicators (HIs), describing the asymmetric features of multi-story building spaces.
Second, regarding algorithmic robustness and computational efficiency, research by Dinmohammadi et al. [52] indicates that single machine learning models are highly susceptible to a degradation in generalization capability when dealing with high-dimensional, non-linear, and complex building physical features. The Stacking ensemble model adopted in this framework successfully integrates the heterogeneous advantages of multiple models. On dual datasets encompassing original parameters and heterogeneity indicators, the core predictive metric R2 remains stable between 0.9022 and 0.9985. Compared to traditional dynamic physical simulations, this surrogate model achieves a substantial leap in computational efficiency, providing robust computational support for the rapid deduction of massive heterogeneous design schemes.
Finally, distinct from previous studies that rely on subjective experience or cluster analysis to select optimal solutions, this study introduces a Comprehensive Performance Index (CPI)—based on the positive and reverse normalization of indicators—to objectively screen the Pareto optimal solution set. The results demonstrate that the comprehensive optimal solution identified by this framework achieves improvements of 14.1% and 18.9% in sDA and UDI, respectively, compared to the homogenized baseline model, while simultaneously reducing the operational carbon emission intensity (CEI) by 12.5%. This effectively confirms the validity of the heterogeneous design strategy for the synergistic optimization of daylighting and thermal performance.
4.2. Extraction of Heterogeneous Design Strategies
Based on the optimization results, this study summarizes the following design strategies for early-stage architectural design. The strategies and associated quantitative ranges were obtained for multi-story, double-loaded corridor teaching buildings under Yantai’s climatic conditions, using the simulation assumptions and predefined parameter bounds specified in this study:
- (1)
- In terms of spatial layout: Architects should break away from the traditional symmetrical double-loaded corridor layout and adopt an asymmetrical spatial partitioning pattern characterized by a “deep-south and shallow-north” configuration. Specifically, the south-facing classroom depth (DS) can be expanded to 9.0–9.5 m to maximize passive solar heat storage, while the north-facing auxiliary classroom depth (DN) can be compressed to 6.5–7.0 m to minimize winter heat loss on the shaded side.
- (2)
- In terms of facade fenestration strategy: Architects can abandon the globally uniform window-to-wall ratio. Both north and south facades can follow a vertical fenestration gradient of “larger upper and smaller lower” openings (the ratio of upper-to-lower zone WWR is recommended to be controlled between 1.07 and 1.25). This strategy not only effectively increases the daylight penetration of natural light in the upper zones and improves the illuminance distribution in deep interior spaces, but also effectively controls the conductive heat loss of the building envelope by reducing the transparent surface area in the middle and lower zones.
- (3)
- In terms of envelope material configuration: Architects can adopt differentiated envelope configurations according to varying heights and floors. This study indicates that the south-facing top-floor high zone can be equipped with a glazing type featuring a higher solar heat gain coefficient (SHGC) to capture solar radiation, whereas the remaining facades and lower zones should be configured with glazing types offering superior thermal insulation performance, thereby achieving a balance between daylighting and thermal conservation.
4.3. SHAP-Based Interpretation of Heterogeneity Indicators
SHAP analysis was used to interpret the contributions of spatial and facade heterogeneity indicators to model predictions and identify associated performance trends.
In the horizontal dimension, higher north-to-south depth ratios (DN/DS) were associated with negative SHAP contributions to predicted UDI, while higher north-to-south width ratios (WN/WS) were associated with positive contributions to predicted sDA.
In the vertical dimension, higher upper-to-lower south-facing window-to-wall ratios were associated with lower predicted CEI. The physical processes underlying this association require further verification through controlled simulations and component-level energy analyses.
4.4. Limitations and Future Prospects
Although the “daylighting-carbon” synergistic optimization framework proposed in this study has verified its theoretical feasibility and performance optimization efficacy in cold climate regions, certain limitations remain that require further exploration in future research:
- (1)
- Climate Applicability Limitations. The heterogeneity strategies obtained in this study, such as “deep south and shallow north” for classroom depth and “upper-large and lower-small” for the window-to-wall ratio, are based on heating-dominated cold climate regions and exhibit strong regionality. Future work will extend this to different climate zones, such as hot summer and warm winter regions, to investigate the evolutionary laws and cross-climate adaptation mechanisms of heterogeneous design prototypes.
- (2)
- Lack of Spatial Standardization Constraints. Extreme performance-oriented asymmetric spatial morphologies (such as “wide north and narrow south”) may increase the difficulty of grid layout selection and prefabricated construction. Future optimization frameworks plan to incorporate standardized architectural modules as penalty constraints into the solution space to enhance the constructability of heterogeneous designs in engineering practice.
- (3)
- Expansion of Indoor Thermal Comfort Evaluation Dimensions. The current multi-objective optimization primarily focuses on daylight-carbon metrics and has not yet incorporated occupants’ thermal perception into the evaluation system. Future research intends to couple dynamic thermal comfort models to construct a multi-dimensional optimization framework encompassing “daylighting, carbon emissions, and thermal comfort,” thereby achieving a comprehensive synergy between indoor environmental quality and low-carbon targets.
- (4)
- Optimization Algorithm Comparison. This study employed NSGA-II to explore heterogeneous design solutions, while comparisons with other optimization algorithms remain to be undertaken. Future research will evaluate alternative algorithms under consistent design constraints and computational budgets to further examine the stability of the identified design strategies and opportunities for improving search efficiency. Given the computational demands of repeated simulation-based optimization, consistency across independent runs remains a topic for further investigation. Future work will repeat the optimization with different random seeds and quantify variations in objective values and design parameter ranges to further assess the stability of the identified solutions.
- (5)
- Scope of Experimental Validation. Field validation was based on one overcast day under unoccupied conditions with artificial lighting and HVAC systems switched off. These measurements supported assessment of the model under the monitored conditions, while annual performance under occupied and conditioned operation remains to be validated. Future research will combine multi-season measurements with operational energy monitoring to further assess heating, cooling, and annual daylighting predictions.
- (6)
- Integration of Daylighting and Lighting Control. This study focuses on early-stage design alternatives, with CEI limited to heating- and cooling-related emissions. Future research will incorporate daylight-responsive lighting controls and include lighting electricity in carbon accounting, considering the effects of lighting-related internal heat gains on heating and cooling demand. This will support further assessment of the combined benefits of passive design and building system controls.
- (7)
- Predictive Generalization. Optimization-generated samples may contain similar configurations across randomly divided subsets, potentially leading to optimistic accuracy estimates. The reported performance therefore primarily reflects prediction within the sampled design distribution. Future work will use similarity-based grouped splits and independent samples to further assess generalization.
5. Conclusions
To address the performance imbalance caused by the heavy reliance on “homogenization” assumptions in conventional designs of educational buildings in cold regions, this study proposes an integrated design framework that deeply integrates the decoupling of horizontal and vertical heterogeneity parameters, NSGA-II multi-objective evolutionary optimization, and data-driven interpretable analysis. Through the synergistic optimization and mechanistic analysis of spatial Daylight Autonomy (sDA), Useful Daylight Illuminance (UDI), and operational Carbon Emission Intensity (CEI), the following main conclusions are drawn:
- (1)
- The optimization identified 37 Pareto-optimal solutions. Compared with the baseline model, the comprehensive optimal solution reduced CEI from 16.705 to 14.617 kg CO2/m2, while increasing sDA from 0.610 to 0.696 and UDI from 0.386 to 0.459, corresponding to improvements of 12.50%, 14.10%, and 18.91%, respectively. This solution adopted south- and north-facing classroom depths of 9.5 m and 6.5 m, respectively, illustrating an asymmetric spatial configuration associated with improved daylighting and carbon performance under the investigated conditions.
- (2)
- The Stacking model was evaluated using both the original design parameters and the heterogeneity indicators. The maximum R2 values for sDA, UDI, and CEI were 0.9941, 0.9957, and 0.9985, respectively. These results support its use for predicting performance within the sampled design distribution.
- (3)
- SHAP analysis identifies the main contributors to model predictions. The north- and south-facing middle-zone window-to-wall ratios jointly account for 82.03% of the relative SHAP importance for UDI. Higher north-to-south depth ratios are associated with lower predicted UDI, while higher upper-to-lower south-facing window-to-wall ratios are associated with lower predicted CEI.
In summary, this study breaks through the inherent limitations of traditional symmetric space designs, providing not only actionable and quantifiable design guidelines for the passive low-carbon design of educational buildings in cold climate regions, but also solid theoretical and methodological support for high-dimensional asymmetric parameter optimization and interpretable performance evaluation under complex climate constraints.
Author Contributions
Conceptualization, M.Y.; methodology, M.Y.; software, M.Y.; validation, M.Y. and J.S.; formal analysis, M.Y. and S.M.; investigation, M.Y. and S.M.; resources, J.S.; data curation, M.Y. and J.S.; writing—original draft preparation, M.Y.; writing—review and editing, M.Y. and J.S.; visualization, M.Y.; supervision, J.S. All authors have read and agreed to the published version of the manuscript.
Funding
This research was funded by Research, Promotion and Application of Low-Carbon Dwelling Technology for New Steel Structures Based on Intelligent Construction grant number 2024TSGC0443.
Data Availability Statement
The data used in this study were acquired from our own experimental simulations.
Conflicts of Interest
The authors declare no conflicts of interest.
Abbreviations
The following abbreviations are used in this manuscript:
| Symbol/Abbreviation | Description |
| CEI | Carbon Emission Intensity (kgCO2/m2) |
| D | Depth of room (m) |
| EUI | Energy Use Intensity (kWh/m2) |
| GT | Glass Type |
| HIs | Heterogeneity indicators |
| HW | Height of window (m) |
| LightGBM | Light Gradient Boosting Machine |
| ML | Machine Learning |
| MLP | Multilayer Perceptron |
| NSGA-II | Non-dominated Sorting Genetic Algorithm II |
| RF | Random Forest |
| sDA | Spatial Daylight Autonomy |
| SHGC | Solar heat gain coefficient |
| SVM | Support Vector Machine |
| T | Visible transmittance |
| U | Thermal transmittance (W/(m2·K)) |
| UDI | Useful Daylight Illuminance |
| W | Width of room (m) |
| WWR | Window-to-wall ratio |
| XGBoost | Extreme Gradient Boosting |
| Subscripts | |
| Subscript | Description |
| H | High zone of the façade (5th floor) |
| L | Low zone of the façade (1st floor) |
| Lower | Lower half of the building |
| M | Middle zone of the façade (2nd–4th floors) |
| N | North orientation |
| S | South orientation |
| Upper | Upper half of the building |
References
- United Nations Environment Programme (UNEP). 2022 Global Status Report for Buildings and Construction: Towards a Zero-Emission, Efficient and Resilient Buildings and Construction Sector; United Nations Environment Programme: Nairobi, Kenya, 2022. [Google Scholar]
- Liu, M.; Que, Y.; Yang, N.; Yan, C.; Liu, Q. Research on Multi-Objective Optimization Design of University Student Center in China Based on Low Energy Consumption and Thermal Comfort. Energies 2024, 17, 2082. [Google Scholar] [CrossRef] [Scilit]
- Luo, J.; Zhuang, Z.; Bian, Y.; Wu, B.; Liang, G. Daylighting Performance Prediction Model for Linear Layouts of Teaching Building Clusters Utilizing Deep Learning. Sustain. Cities Soc. 2024, 115, 105821. [Google Scholar] [CrossRef] [Scilit]
- Shirzadi, N.; Lau, D.; Stylianou, M. Surrogate Modeling for Building Design: Energy and Cost Prediction Compared to Simulation-Based Methods. Buildings 2025, 15, 2361. [Google Scholar] [CrossRef] [Scilit]
- Khoshbakht, M.; Gou, Z.; Dupre, K. Energy Use Characteristics and Benchmarking for Higher Education Buildings. Energy Build. 2018, 164, 61–76. [Google Scholar] [CrossRef] [Scilit]
- Yan, J.; Gu, X.; Wu, G.; Wang, L.; Si, N.; Zhao, Y.; Han, D. Rapid Evaluation of University Classrooms Using an MLP Classification Model Based on Daylight–Thermal Performance. Buildings 2026, 16, 1566. [Google Scholar] [CrossRef] [Scilit]
- Chen, Y.; Wang, Z.; Peng, Z. A Study on Carbon Emission Reduction in the Entire Process of Retrofitting High-Rise Office Buildings Based on the Extraction of Typical Models. Sustainability 2024, 16, 8506. [Google Scholar] [CrossRef] [Scilit]
- Pradhan, S.; Jang, Y.; Chauhan, H. Investigating Effects of Indoor Temperature and Lighting on University Students’ Learning Performance Considering Sensation, Comfort, and Physiological Responses. Build. Environ. 2024, 253, 111346. [Google Scholar] [CrossRef] [Scilit]
- Chen, Z.; Cui, Y.; Zheng, H.; Ning, Q. Optimization and Prediction of Energy Consumption, Light and Thermal Comfort in Teaching Building Atriums Using NSGA-II and Machine Learning. J. Build. Eng. 2024, 86, 108687. [Google Scholar] [CrossRef] [Scilit]
- Shi, L.; Xu, D.; Li, X.; Huang, L.; Li, Y.; Huang, T.; Yang, Y. The Impact Characteristics of Common Low-Carbon Design Methods on Reducing Carbon Emissions in Industrial Plant Buildings in Architectural Design. Buildings 2025, 15, 974. [Google Scholar] [CrossRef] [Scilit]
- Chen, P.; Tang, H. A Framework for Adaptive Façade Optimization Design Based on Building Envelope Performance Characteristics. Buildings 2024, 14, 2646. [Google Scholar] [CrossRef] [Scilit]
- Tawfeeq, H.; Qaradaghi, A.M.A. Optimising Window-to-Wall Ratio for Enhanced Energy Efficiency and Building Intelligence in Hot Summer Mediterranean Climates. Sustainability 2024, 16, 7342. [Google Scholar] [CrossRef] [Scilit]
- Shan, R.; Junghans, L. Multi-Objective Optimization for High-Performance Building Facade Design: A Systematic Literature Review. Sustainability 2023, 15, 15596. [Google Scholar] [CrossRef] [Scilit]
- Ma, X.; Chen, H.; Lu, Y.; Luo, Q.; Yan, F.; Li, T.; Zhao, J.; Ding, H. Evaluating Blue-Green Infrastructure for Outdoor Thermal Comfort and Energy Efficiency in a University Campus Microclimate: A Case Study from Xi’an, China. Energy Build. 2026, 350, 116640. [Google Scholar] [CrossRef] [Scilit]
- Xu, Y.; Yan, C.; Qian, H.; Sun, L.; Wang, G.; Jiang, Y. A Novel Optimization Method for Conventional Primary and Secondary School Classrooms in Southern China Considering Energy Demand, Thermal Comfort and Daylighting. Sustainability 2021, 13, 13119. [Google Scholar] [CrossRef] [Scilit]
- Samiou, A.I.; Doulos, L.T.; Zerefos, S. Daylighting and Artificial Lighting Criteria That Promote Performance and Optical Comfort in Preschool Classrooms. Energy Build. 2022, 258, 111819. [Google Scholar] [CrossRef] [Scilit]
- Zhu, F.; Xu, Y.; Jiang, Y. Design Optimization of Daylighting for Kindergarten in Different Light Climate Zones in China. J. Asian Archit. Build. Eng. 2023, 22, 2977–2993. [Google Scholar] [CrossRef] [Scilit]
- Chiou, Y.-S.; Saputro, S.; Sari, D.P. Visual Comfort in Modern University Classrooms. Sustainability 2020, 12, 3930. [Google Scholar] [CrossRef] [Scilit]
- Nazari, S.; Keshavarz Mirza Mohammadi, P.; Ghaffarianhoseini, A.; Ghaffarianhoseini, A.; Doan, D.T.; Almhafdy, A. Comparison of Shading Design between the Northern and Southern Hemispheres: Using the NSGA-II Algorithm to Reduce Building Energy Consumption and Improve Occupants’ Comfort. Smart Sustain. Built Environ. 2025, 14, 889–920. [Google Scholar] [CrossRef] [Scilit]
- Wang, L.; Ibrahim, A.; Jiang, Y. Multi-Objective Optimization of Atrium Form Variables for Daylighting, Energy Consumption and Thermal Comfort of Teaching Buildings at the Early Design Stage in Cold Climates. Buildings 2025, 15, 4434. [Google Scholar] [CrossRef] [Scilit]
- Wang, Y.; Yang, W.; Wang, Q. Multi-Objective Parametric Optimization of the Composite External Shading for the Classroom Based on Lighting, Energy Consumption, and Visual Comfort. Energy Build. 2022, 275, 112441. [Google Scholar] [CrossRef] [Scilit]
- He, Y.; Li, N.; Lu, J.; Li, N.; Deng, Q.; Tan, C.; Yan, J. Meeting Thermal Needs of Occupants in Shared Space with an Adjustable Thermostat and Local Heating in Winter: An Experimental Study. Energy Build. 2021, 236, 110776. [Google Scholar] [CrossRef] [Scilit]
- Wani, M.; Swain, A.; Ukil, A.; Ploder, M.; Koole, R. Optimizing the Overall Performance of Forced Extraction Systems: A Multi-Objective Framework. Build. Environ. 2022, 221, 109214. [Google Scholar] [CrossRef] [Scilit]
- Wang, R.; Lu, S.; Feng, W. Impact of Adjustment Strategies on Building Design Process in Different Climates Oriented by Multiple Performance. Appl. Energy 2020, 266, 114822. [Google Scholar] [CrossRef] [Scilit]
- Zhai, Y.; Wang, Y.; Huang, Y.; Meng, X. A Multi-Objective Optimization Methodology for Window Design Considering Energy Consumption, Thermal Environment and Visual Performance. Renew. Energy 2019, 134, 1190–1199. [Google Scholar] [CrossRef] [Scilit]
- Aliparast, S.; Onaygil, S. A Field Study of Individual, Energy-Efficient, and Human-Centered Indoor Electric Lighting: Its Impact on Comfort and Visual Performance in an Open-Plan Office Part 1. Buildings 2024, 14, 936. [Google Scholar] [CrossRef] [Scilit]
- Wei, W.; Wargocki, P.; Zirngibl, J.; Bendžalová, J.; Mandin, C. Review of Parameters Used to Assess the Quality of the Indoor Environment in Green Building Certification Schemes for Offices and Hotels. Energy Build. 2020, 209, 109683. [Google Scholar] [CrossRef] [Scilit]
- Seyedzadeh, S.; Rahimian, F.P.; Glesk, I.; Roper, M. Machine Learning for Estimation of Building Energy Consumption and Performance: A Review. Vis. Eng. 2018, 6, 5. [Google Scholar] [CrossRef] [Scilit]
- Geyer, P.; Singaravel, S. Component-Based Machine Learning for Performance Prediction in Building Design. Appl. Energy 2018, 228, 1439–1453. [Google Scholar] [CrossRef] [Scilit]
- Deb, K.; Pratap, A.; Agarwal, S.; Meyarivan, T. A Fast and Elitist Multiobjective Genetic Algorithm: NSGA-II. IEEE Trans. Evol. Comput. 2002, 6, 182–197. [Google Scholar] [CrossRef] [Scilit]
- Runge, J.; Zmeureanu, R. Forecasting Energy Use in Buildings Using Artificial Neural Networks: A Review. Energies 2019, 12, 3254. [Google Scholar] [CrossRef] [Scilit]
- Somu, N.; Raman, M.R.G.; Ramamritham, K. A Deep Learning Framework for Building Energy Consumption Forecast. Renew. Sustain. Energy Rev. 2021, 137, 110591. [Google Scholar] [CrossRef] [Scilit]
- Wang, Y.; Xing, R.; Yang, Y.; Ren, J.; Zhou, M.; Zhao, J.; Cheng, X.; Ma, X. Morphology–Crowd Coupling and Mitigation of Pedestrian-Level PM2.5 Exposure in Summer Night Markets: Interpretable Machine Learning and CFD across Compact LCZs. Build. Environ. 2026, 304, 115107. [Google Scholar] [CrossRef] [Scilit]
- GB 50189-2015; Design Standard for Energy Efficiency of Public Buildings. Ministry of Housing and Urban-Rural Development of the People’s Republic of China: Beijing, China, 2015.
- Yang, M.; Sui, J. Research on the Synergistic Optimization of Daylighting and Thermal Performance in University Teaching Buildings from the Perspective of Spatial Heterogeneity. Buildings 2026, 16, 3278. [Google Scholar] [CrossRef] [Scilit]
- Song, Y.; Wang, H. Optimization Potential of Side-Lit Windows for Energy and Daylight Performance of University Classrooms in Shanghai. Buildings 2024, 14, 3947. [Google Scholar] [CrossRef] [Scilit]
- Pellegrino, A.; Cammarano, S.; Lo Verso, V.R.M.; Corrado, V. Impact of Daylighting on Total Energy Use in Offices of Varying Architectural Features in Italy: Results from a Parametric Study. Build. Environ. 2017, 113, 151–162. [Google Scholar] [CrossRef] [Scilit]
- Mardaljevic, J.; Heschong, L.; Lee, E. Daylight Metrics and Energy Savings. Light. Res. Technol. 2009, 41, 261–283. [Google Scholar] [CrossRef] [Scilit]
- Carlucci, S.; Causone, F.; De Rosa, F.; Pagliano, L. A Review of Indices for Assessing Visual Comfort with a View to Their Use in Optimization Processes to Support Building Integrated Design. Renew. Sustain. Energy Rev. 2015, 47, 1016–1033. [Google Scholar] [CrossRef] [Scilit]
- Sun, Y.; Liu, D.; Flor, J.-F.; Shank, K.; Baig, H.; Wilson, R.; Liu, H.; Sundaram, S.; Mallick, T.K.; Wu, Y. Analysis of the Daylight Performance of Window Integrated Photovoltaics Systems. Renew. Energy 2020, 145, 153–163. [Google Scholar] [CrossRef] [Scilit]
- Sun, Z.; Ma, Z.; Ma, M.; Cai, W.; Xiang, X.; Zhang, S.; Chen, M.; Chen, L. Carbon Peak and Carbon Neutrality in the Building Sector: A Bibliometric Review. Buildings 2022, 12, 128. [Google Scholar] [CrossRef] [Scilit]
- Ministry of Ecology and Environment; National Bureau of Statistics. Announcement on the Release of the 2022 Electricity Carbon Dioxide Emission Factor; Ministry of Ecology and Environment: Beijing, China; National Bureau of Statistics: Beijing, China, 2024. [Google Scholar]
- Alsharif, R.; Arashpour, M.; Golafshani, E.; Bazli, M.; Mohandes, S.R. Ensemble Machine Learning Framework for Daylight Modelling of Various Building Layouts. Build. Simul. 2023, 16, 2049–2061. [Google Scholar] [CrossRef] [Scilit]
- Birdsell, B.; Evins, R. Surrogate Modeling Performance for Building Design Problems. In Proceedings of the Building Simulation 2023: 18th Conference of IBPSA, Shanghai, China, 4–6 September 2023. [Google Scholar]
- Gorzałczany, M.B.; Rudziński, F. Energy Consumption Prediction in Residential Buildings—An Accurate and Interpretable Machine Learning Approach Combining Fuzzy Systems with Evolutionary Optimization. Energies 2024, 17, 3242. [Google Scholar] [CrossRef] [Scilit]
- Hosamo, H.; Mazzetto, S. Performance Evaluation of Machine Learning Models for Predicting Energy Consumption and Occupant Dissatisfaction in Buildings. Buildings 2024, 15, 39. [Google Scholar] [CrossRef] [Scilit]
- Mohammadiziazi, R.; Bilec, M. Application of Machine Learning for Predicting Building Energy Use at Different Temporal and Spatial Resolution under Climate Change in USA. Buildings 2020, 10, 139. [Google Scholar] [CrossRef] [Scilit]
- Li, D.; Qi, Z.; Zhou, Y.; Elchalakani, M. Machine Learning Applications in Building Energy Systems: Review and Prospects. Buildings 2025, 15, 648. [Google Scholar] [CrossRef] [Scilit]
- Tang, Z.; Chen, J.; Cheng, J. Benchmarking Automated Machine Learning for Building Energy Performance Prediction: A Comparative Study with SHAP-Based Interpretability. Buildings 2026, 16, 185. [Google Scholar] [CrossRef] [Scilit]
- Zheng, G.; Feng, Z.; Jiang, M.; Tan, L.; Wang, Z. Predicting the Energy Consumption of Commercial Buildings Based on Deep Forest Model and Its Interpretability. Buildings 2023, 13, 2162. [Google Scholar] [CrossRef] [Scilit]
- Li, L.; Qi, Z.; Ma, Q.; Gao, W.; Wei, X. Evolving Multi-Objective Optimization Framework for Early-Stage Building Design: Improving Energy Efficiency, Daylighting, View Quality, and Thermal Comfort. Build. Simul. 2024, 17, 2097–2123. [Google Scholar] [CrossRef] [Scilit]
- Dinmohammadi, F.; Han, Y.; Shafiee, M. Predicting Energy Consumption in Residential Buildings Using Advanced Machine Learning Algorithms. Energies 2023, 16, 3748. [Google Scholar] [CrossRef] [Scilit]
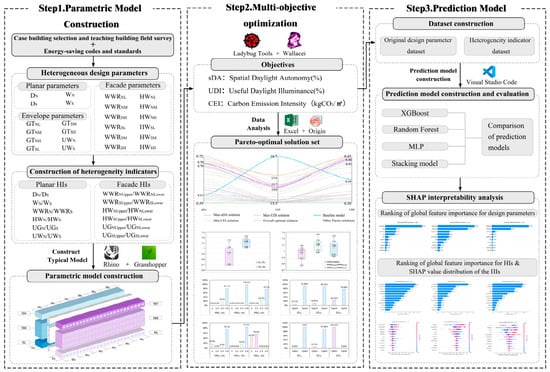
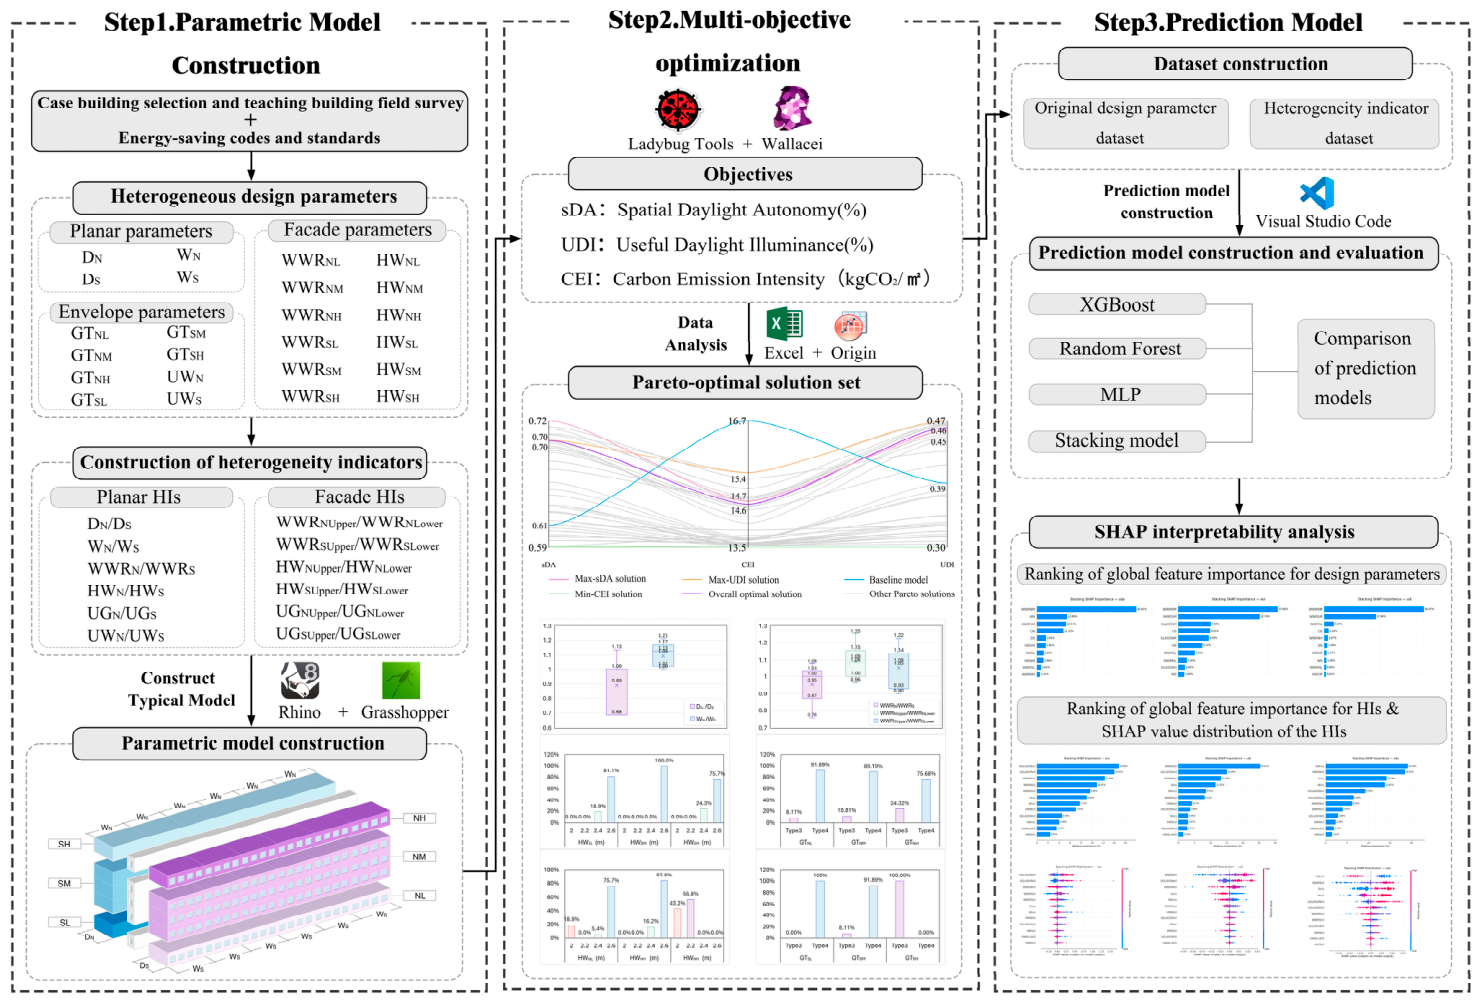
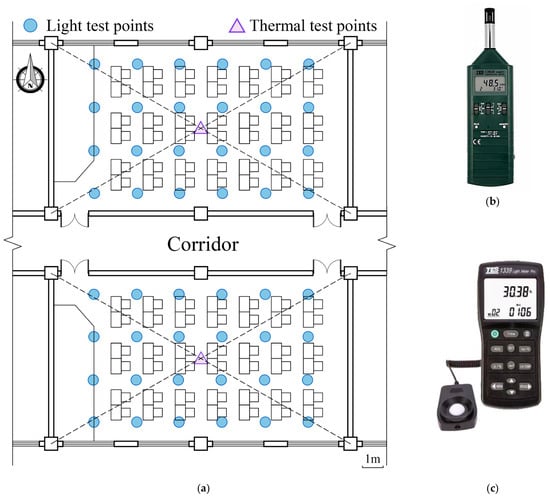
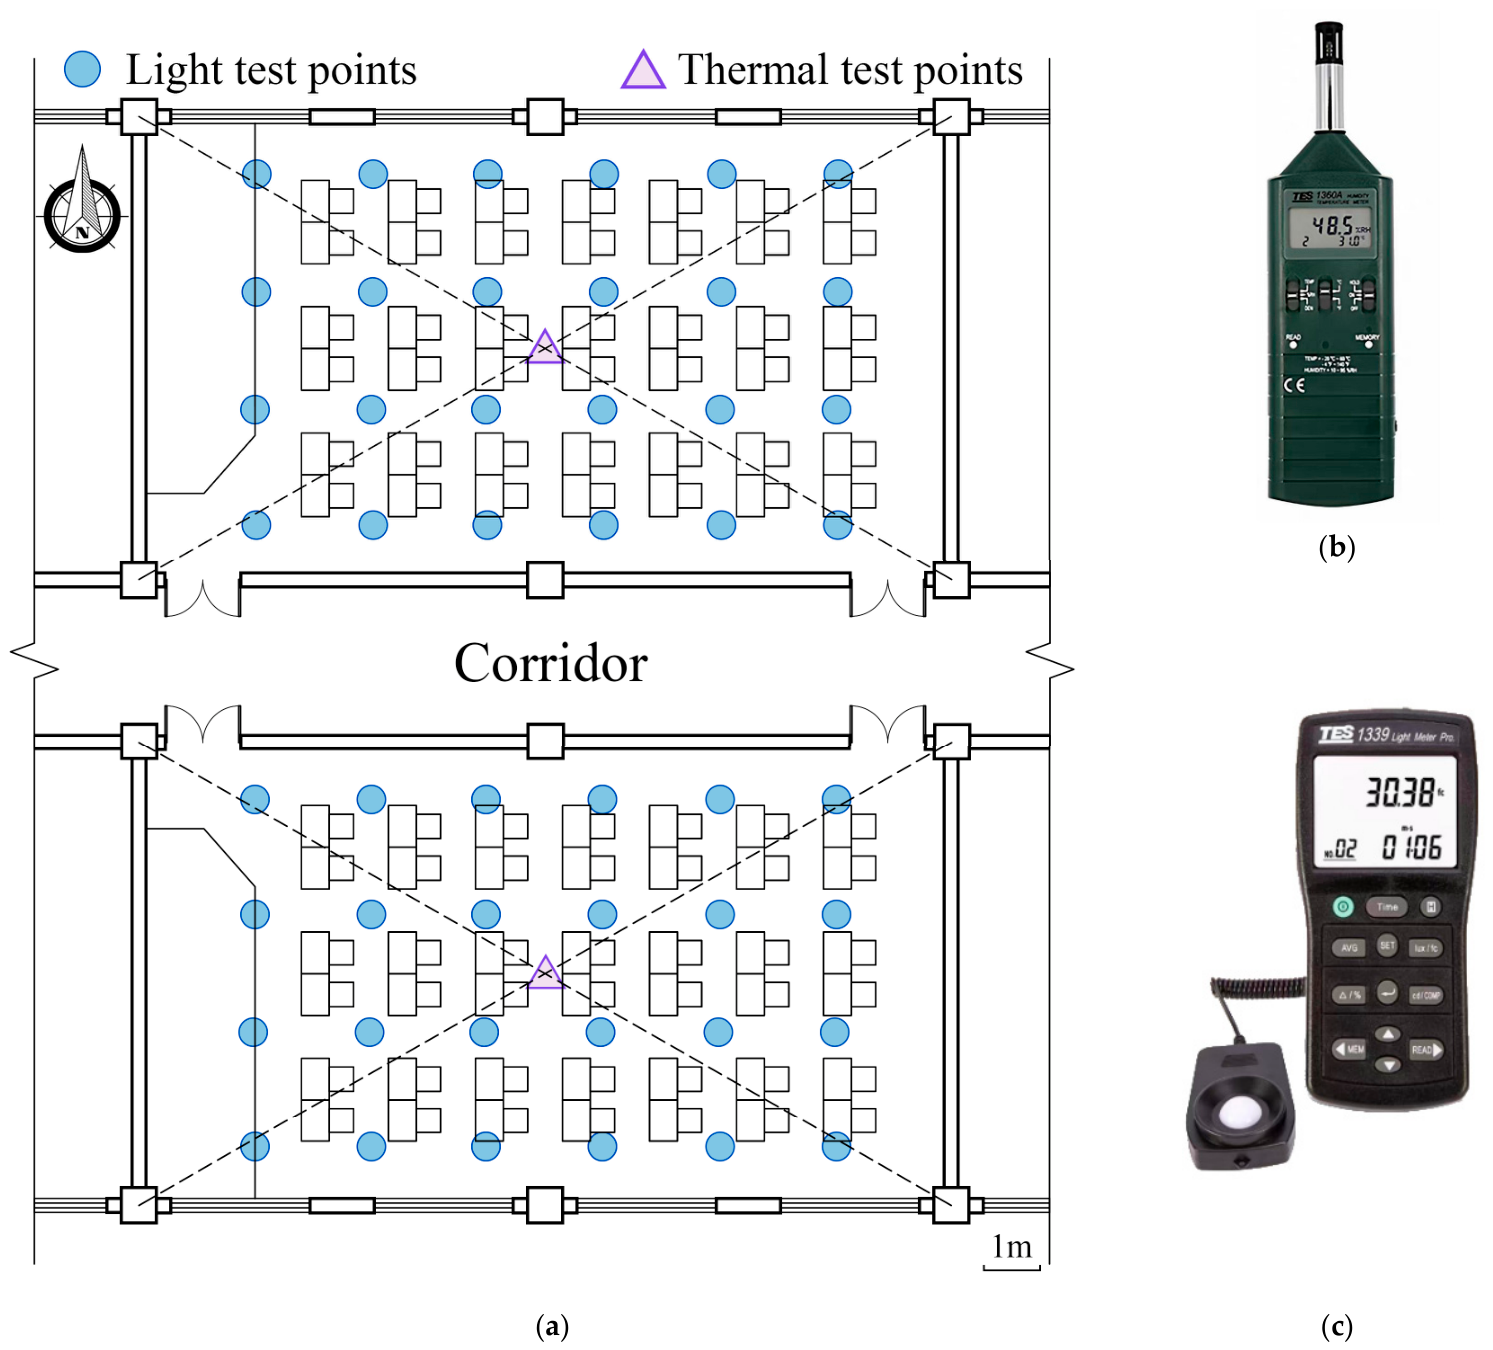
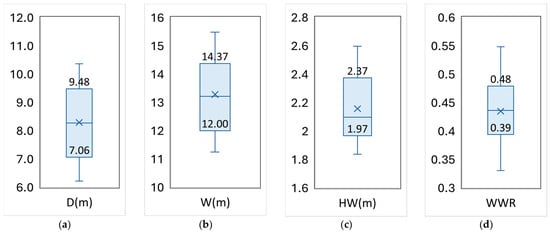
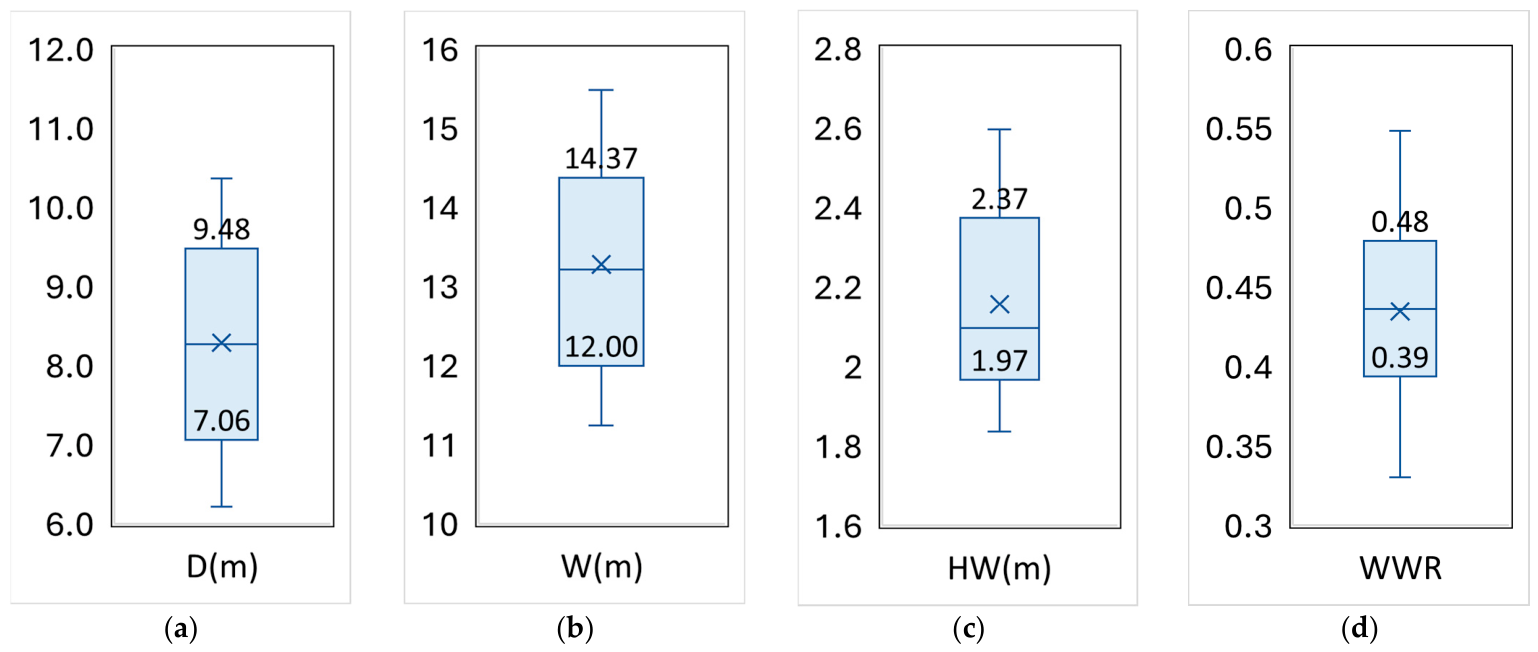
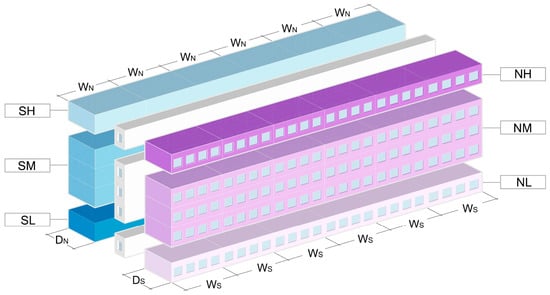
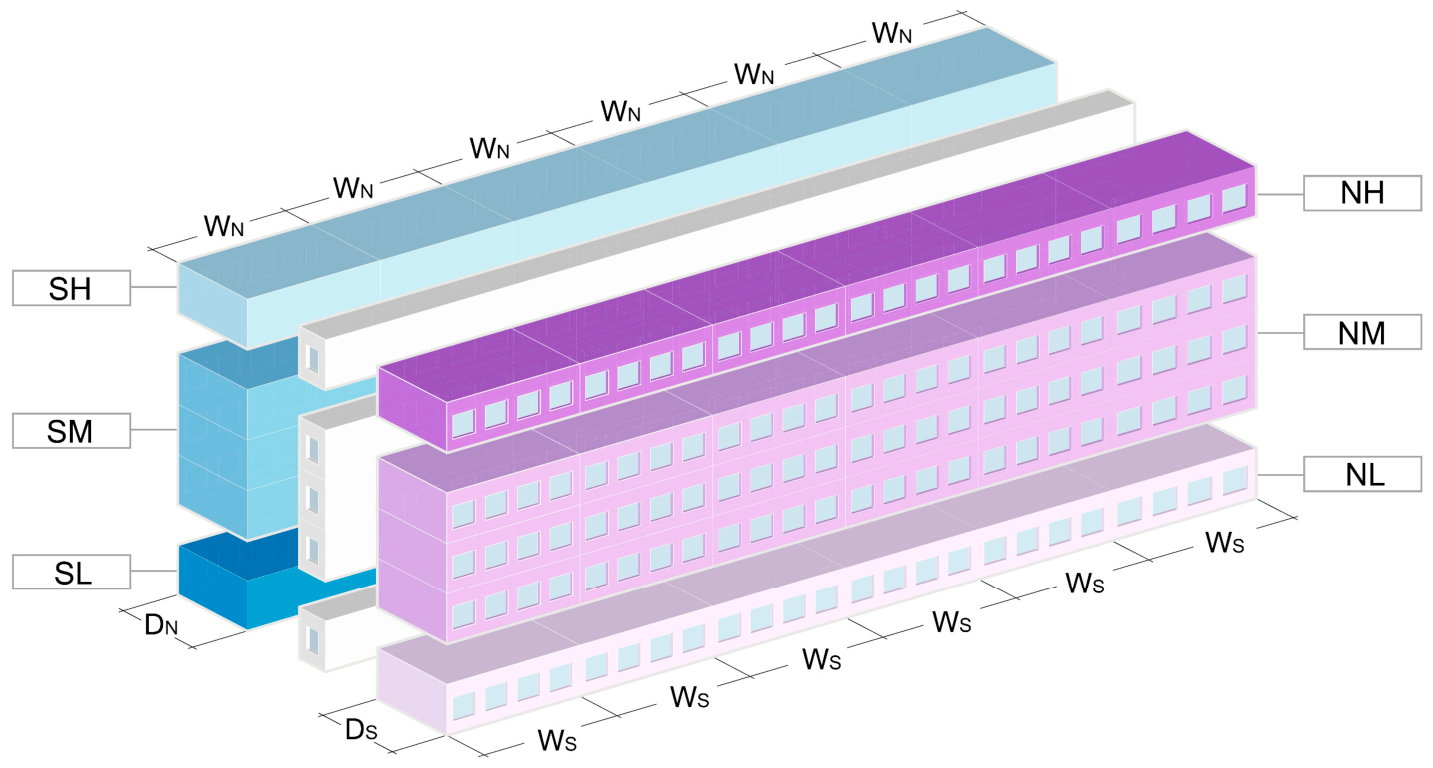
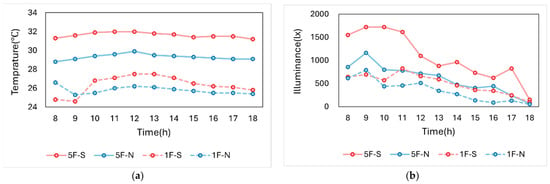
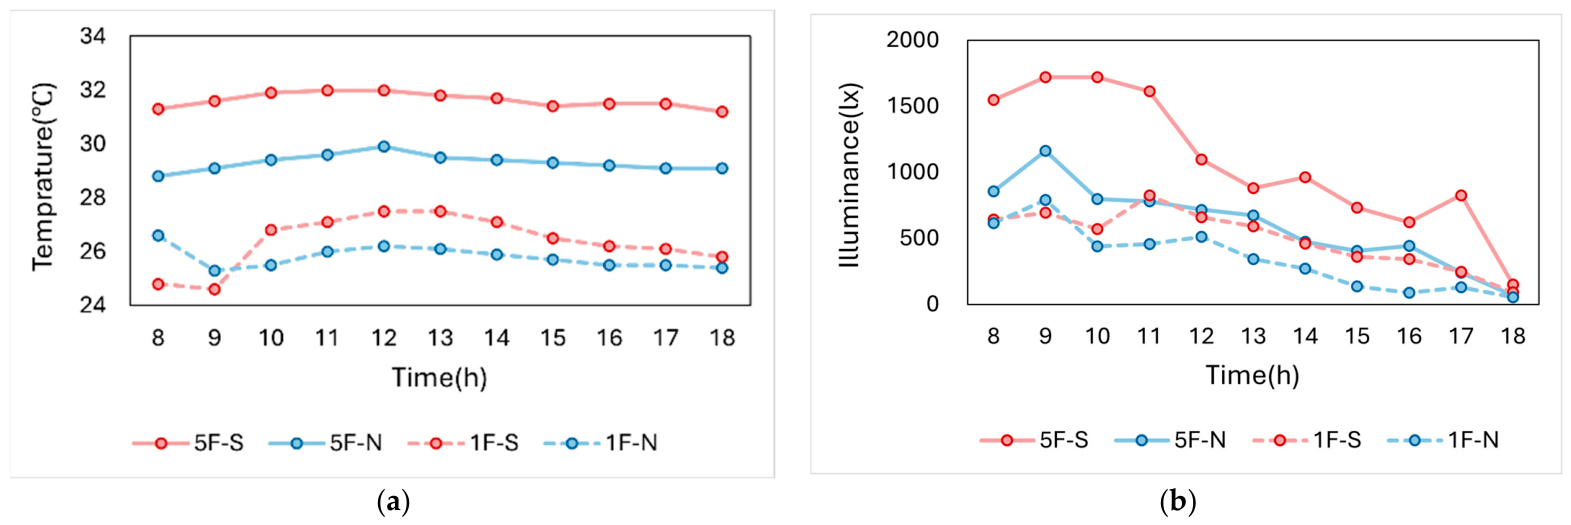
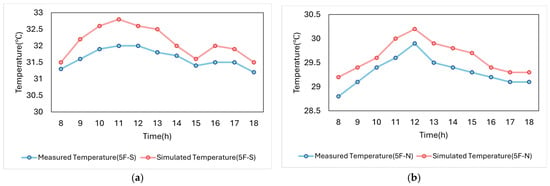
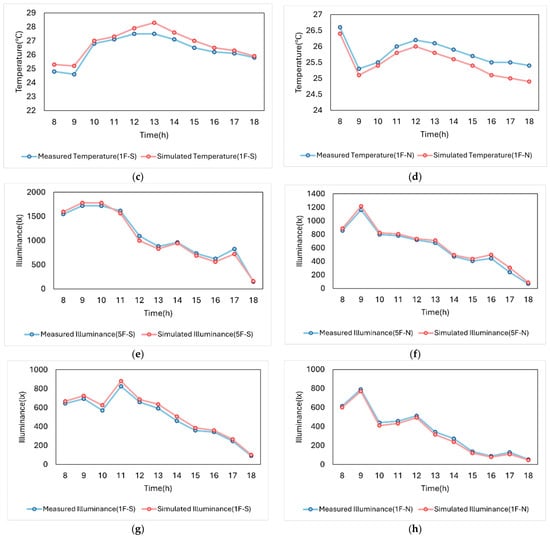
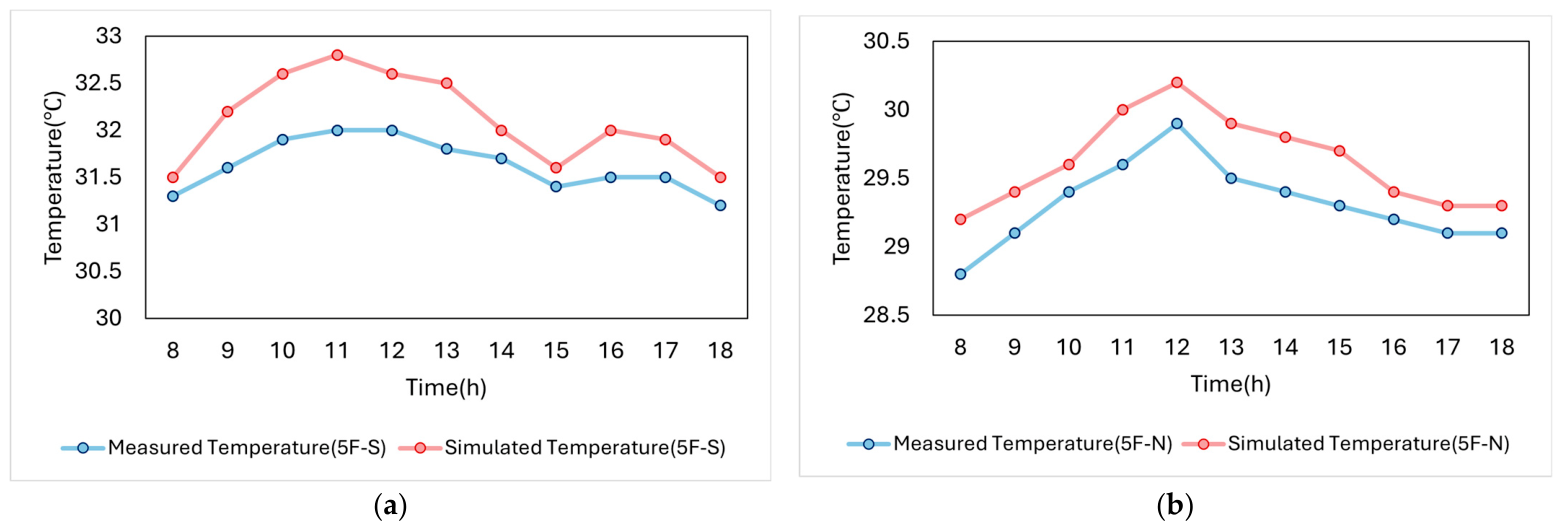
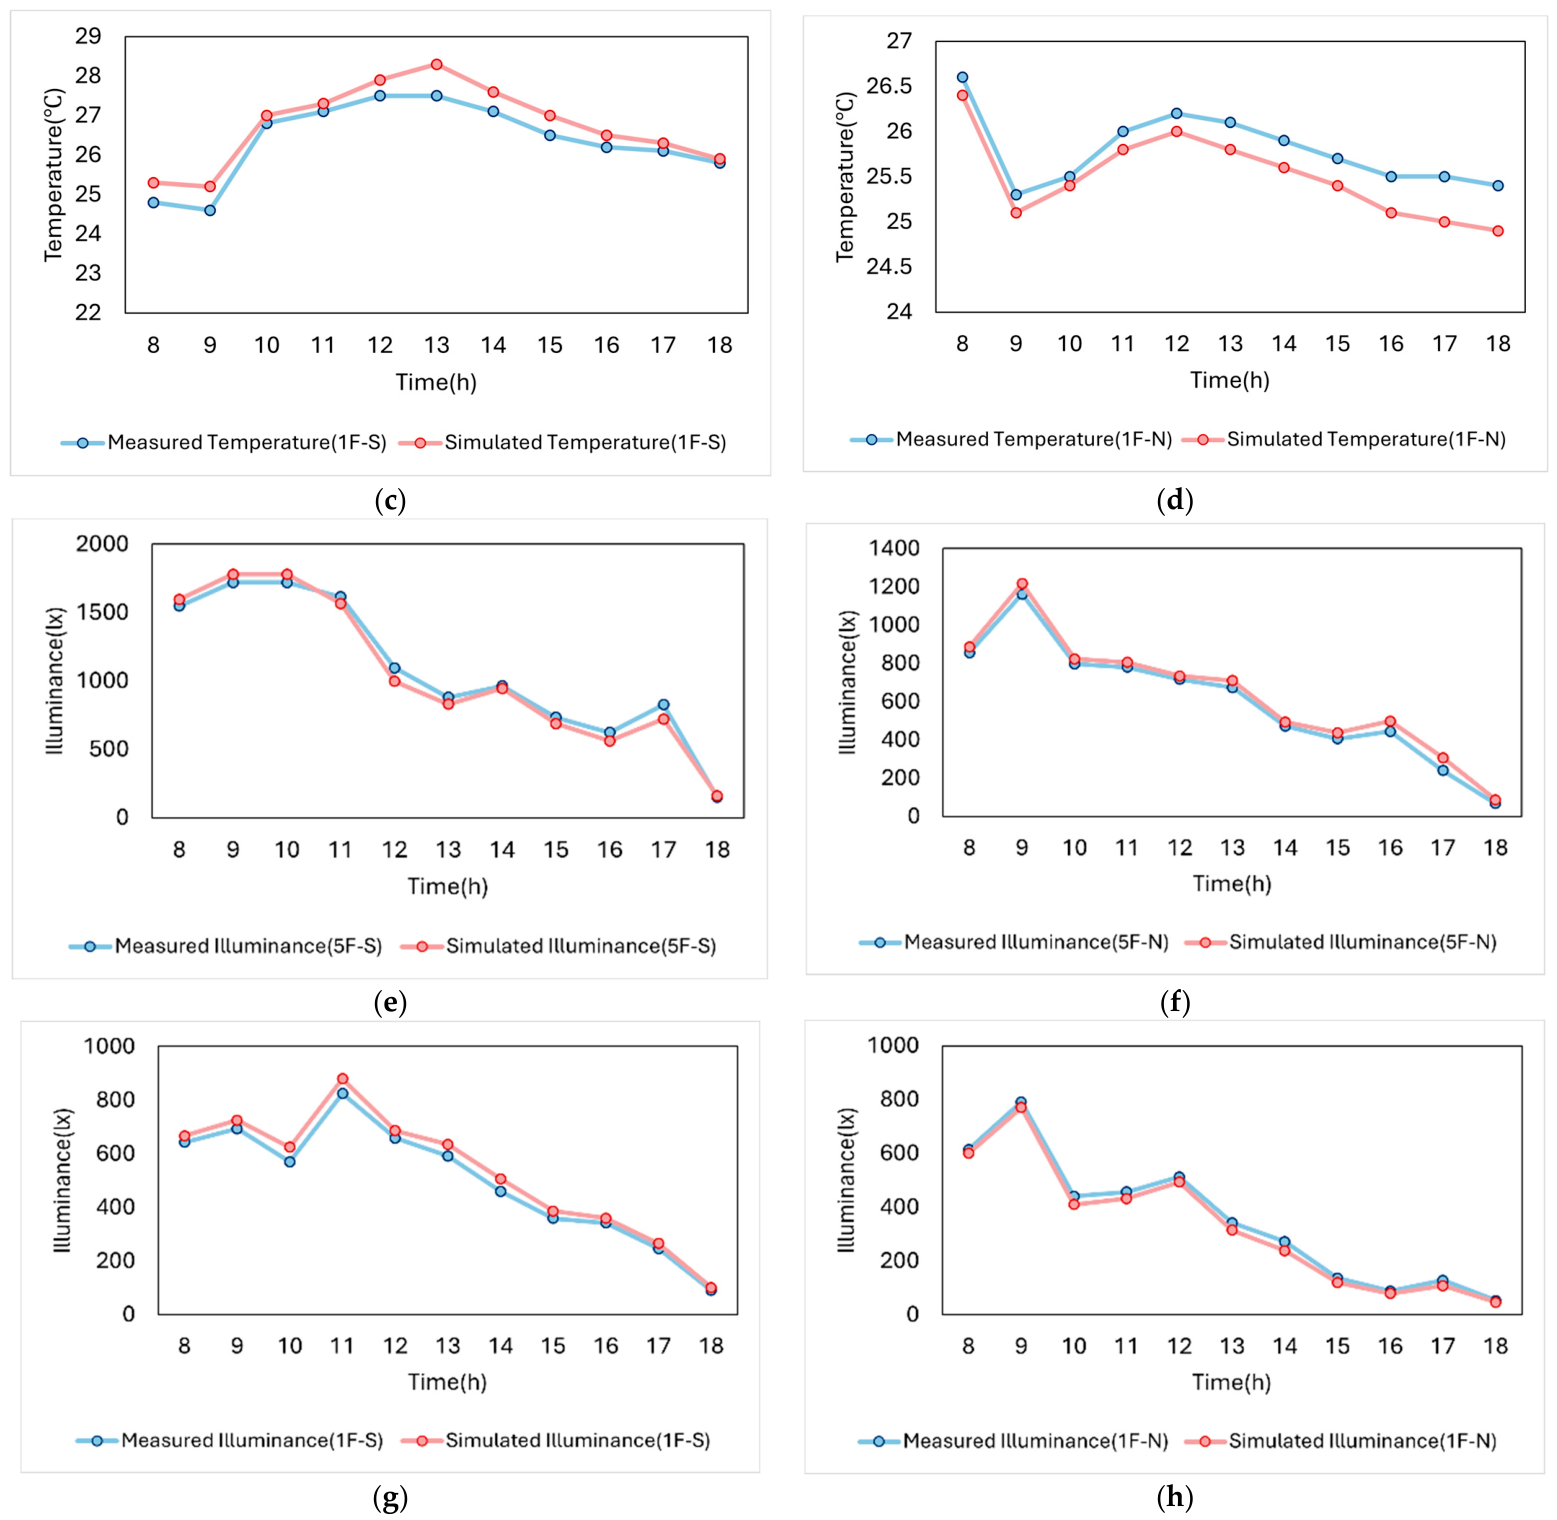


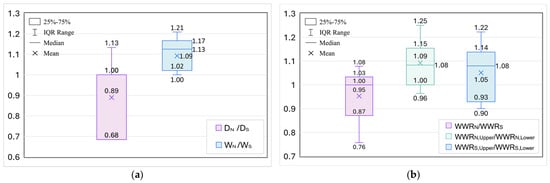
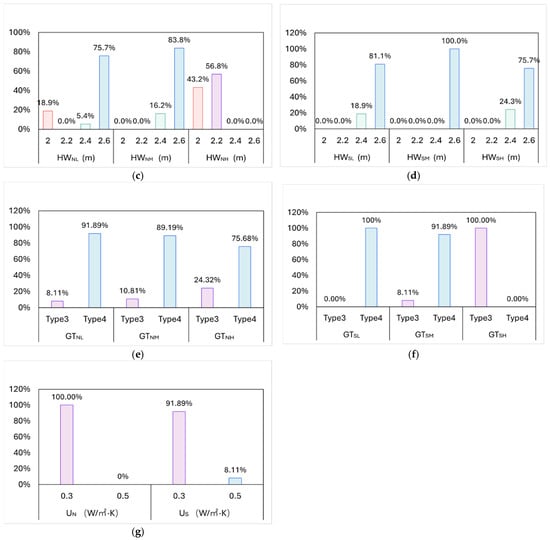
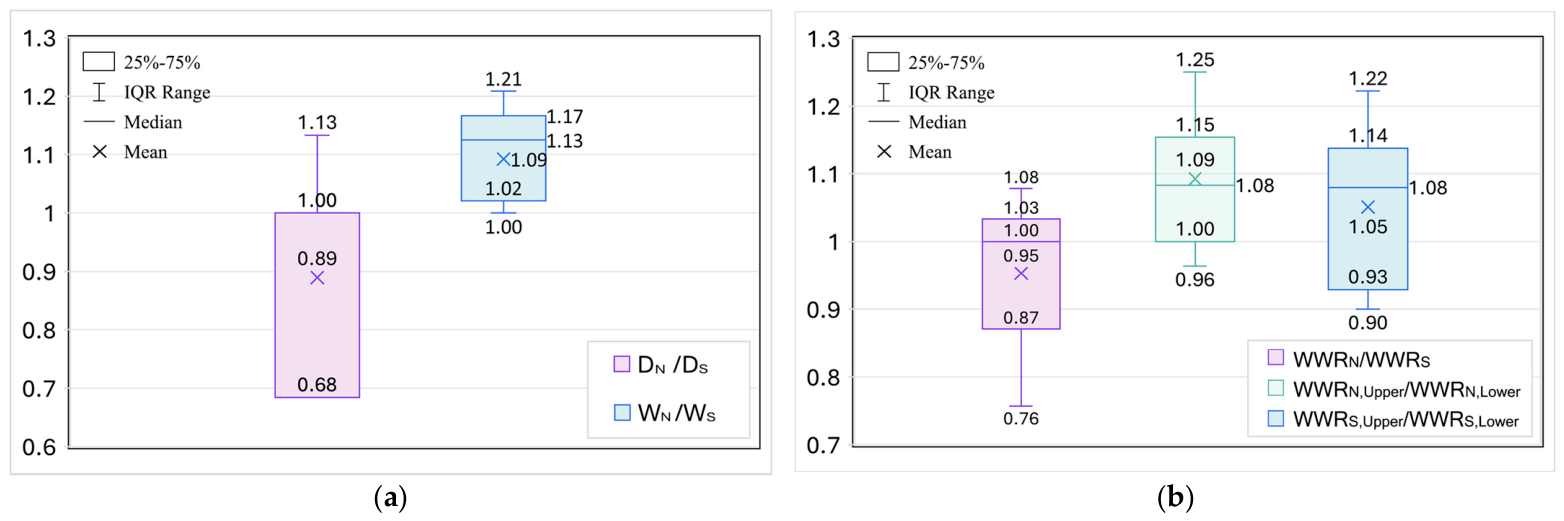
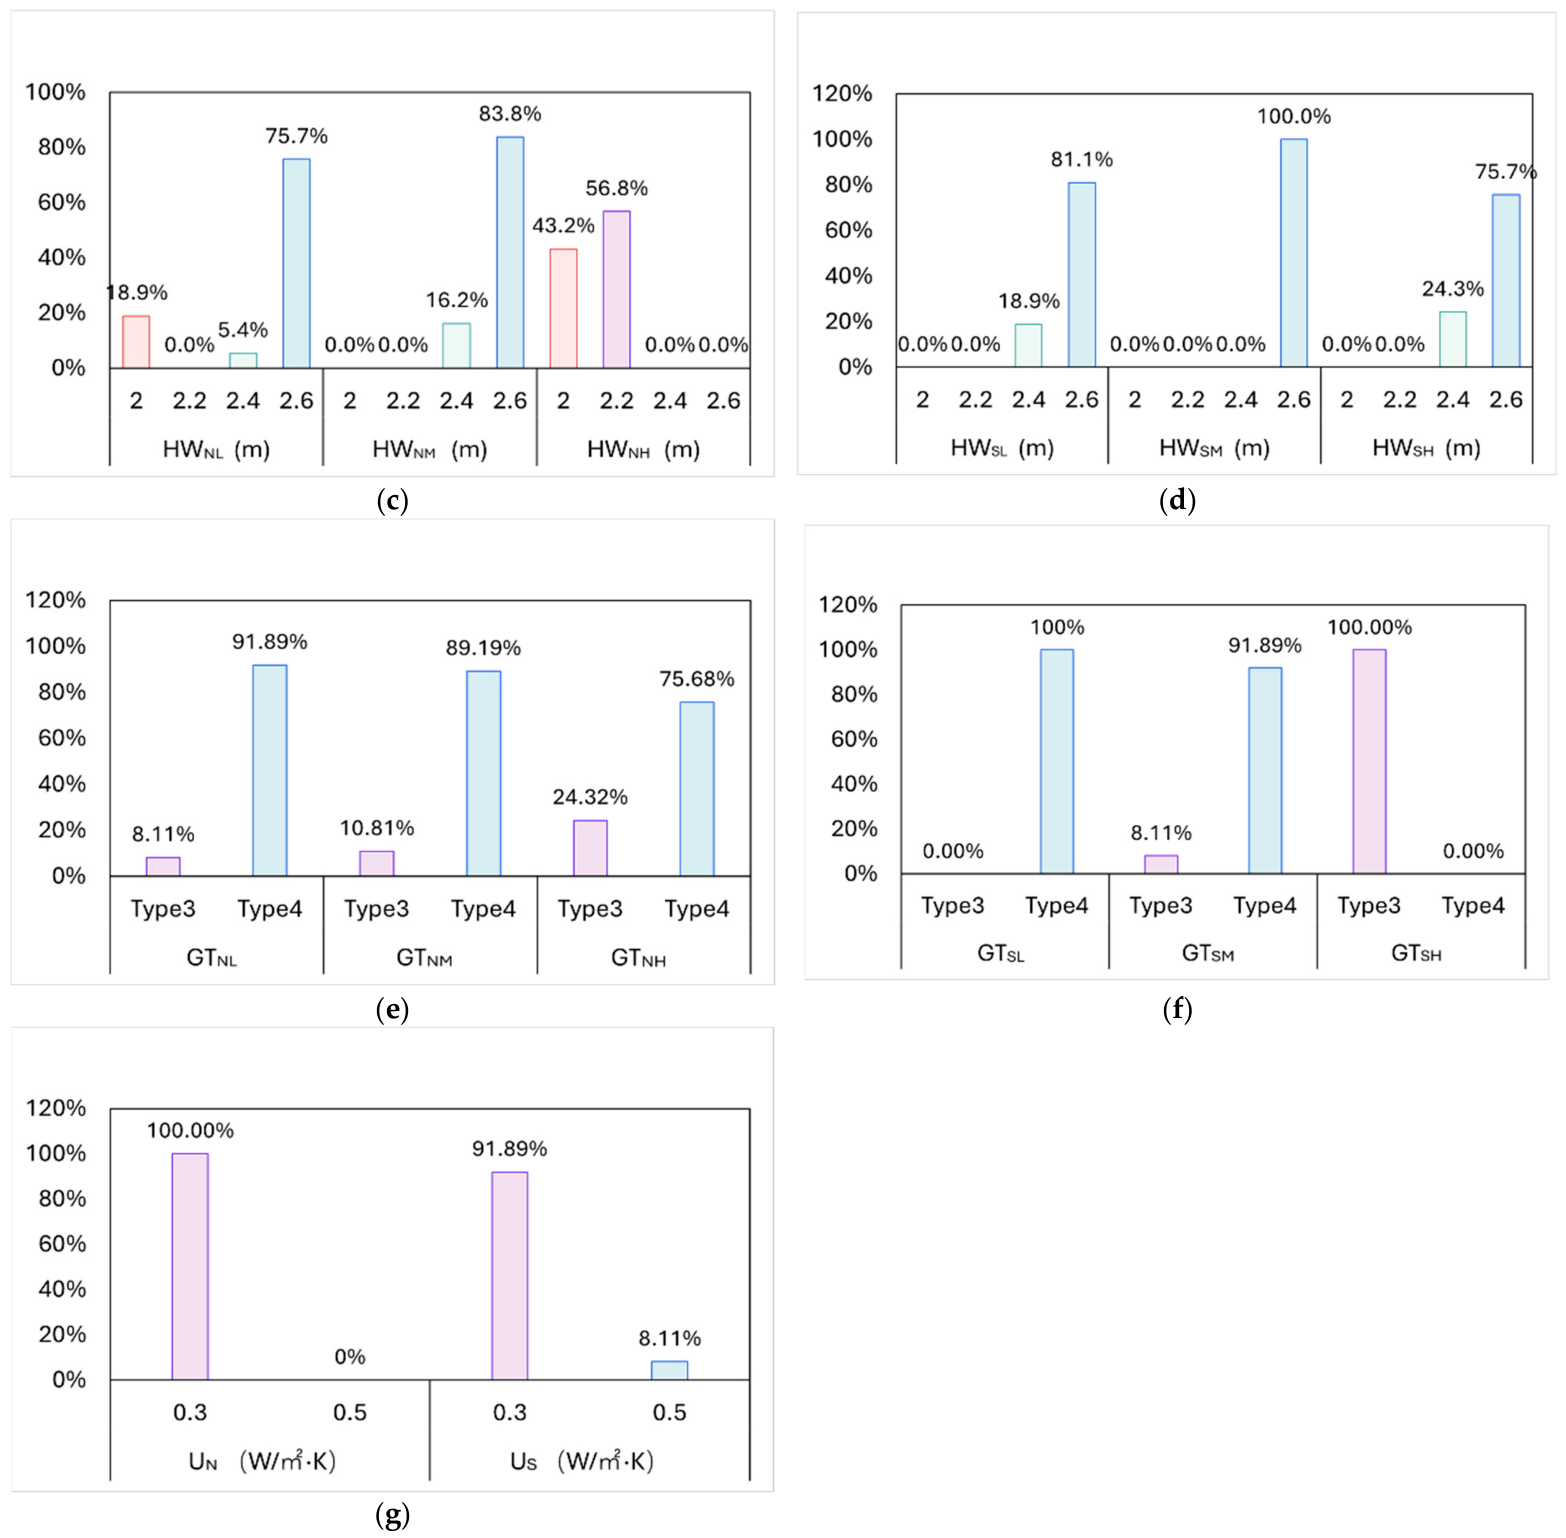
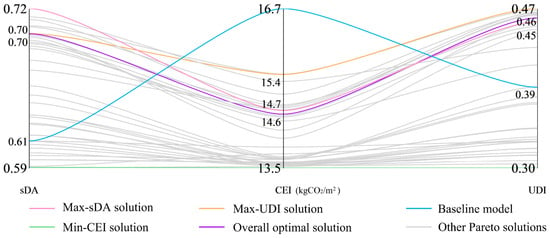
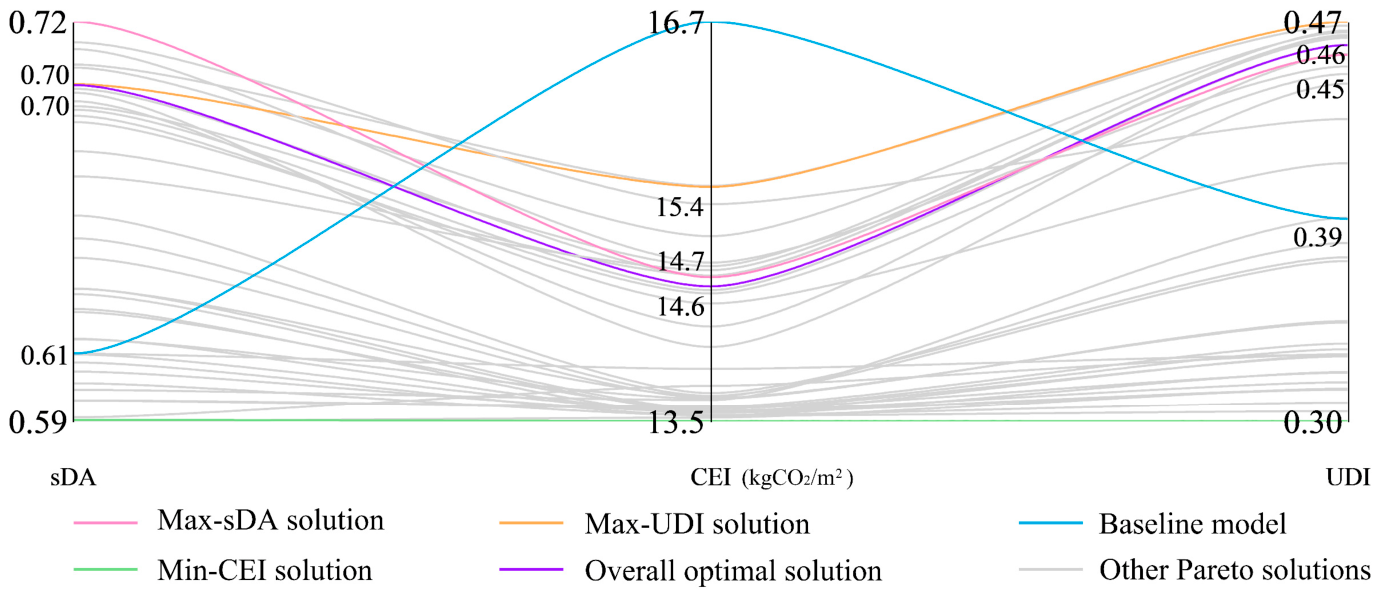
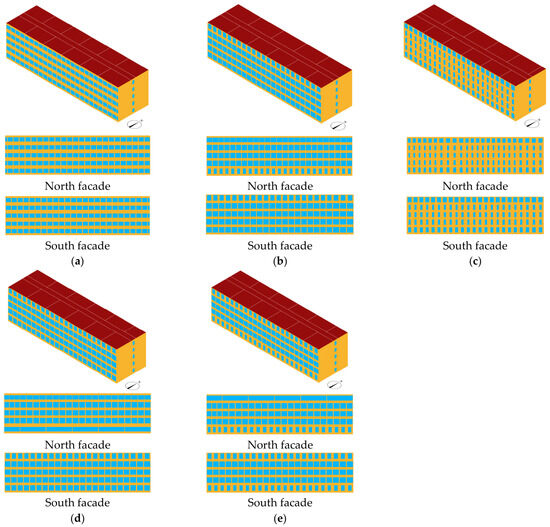
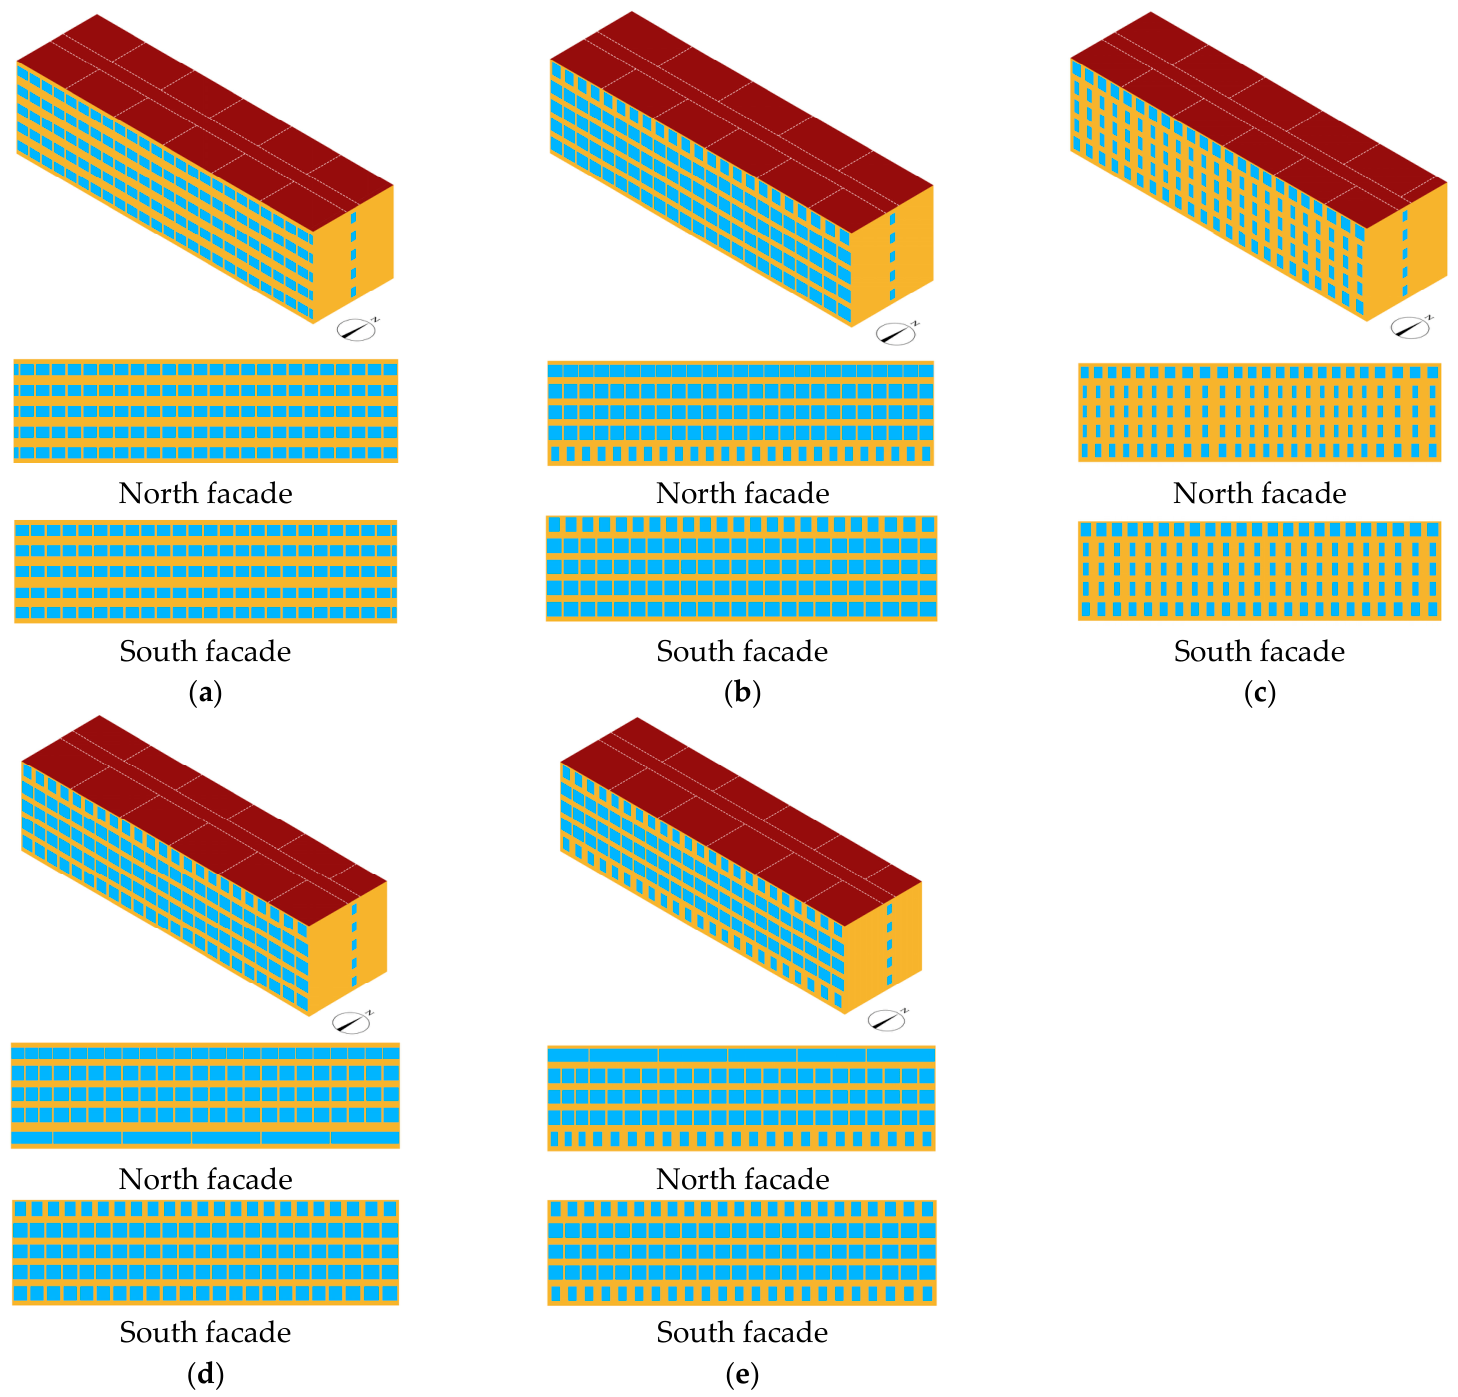
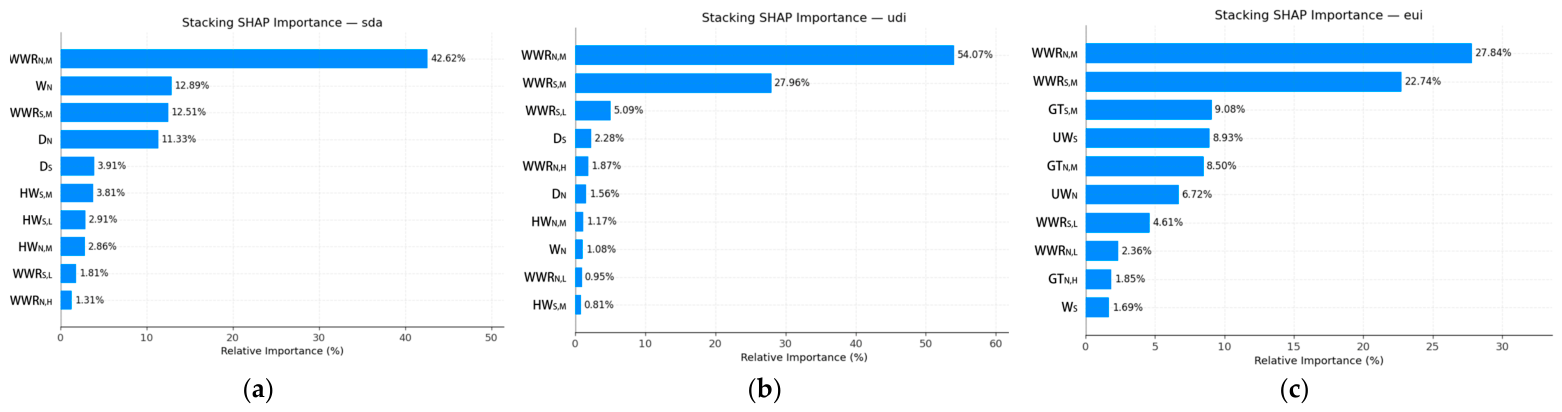
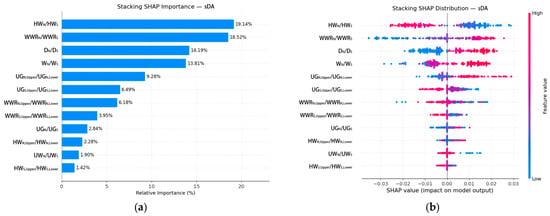
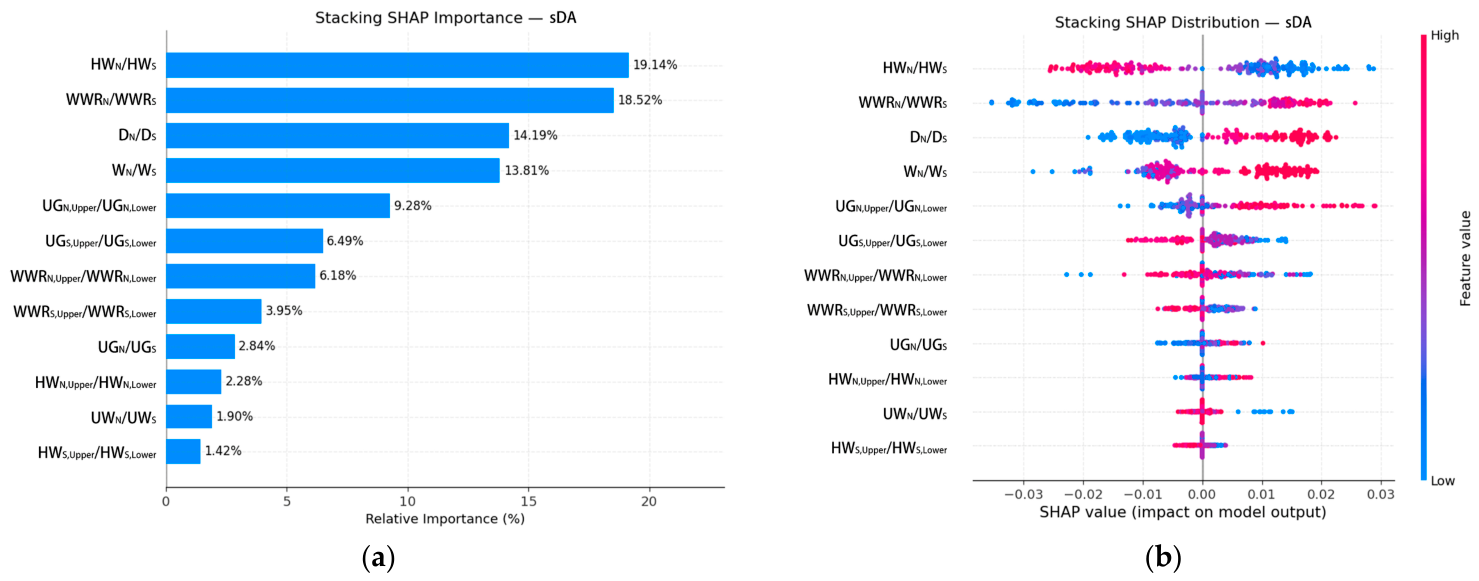
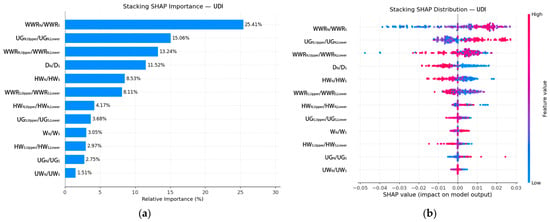
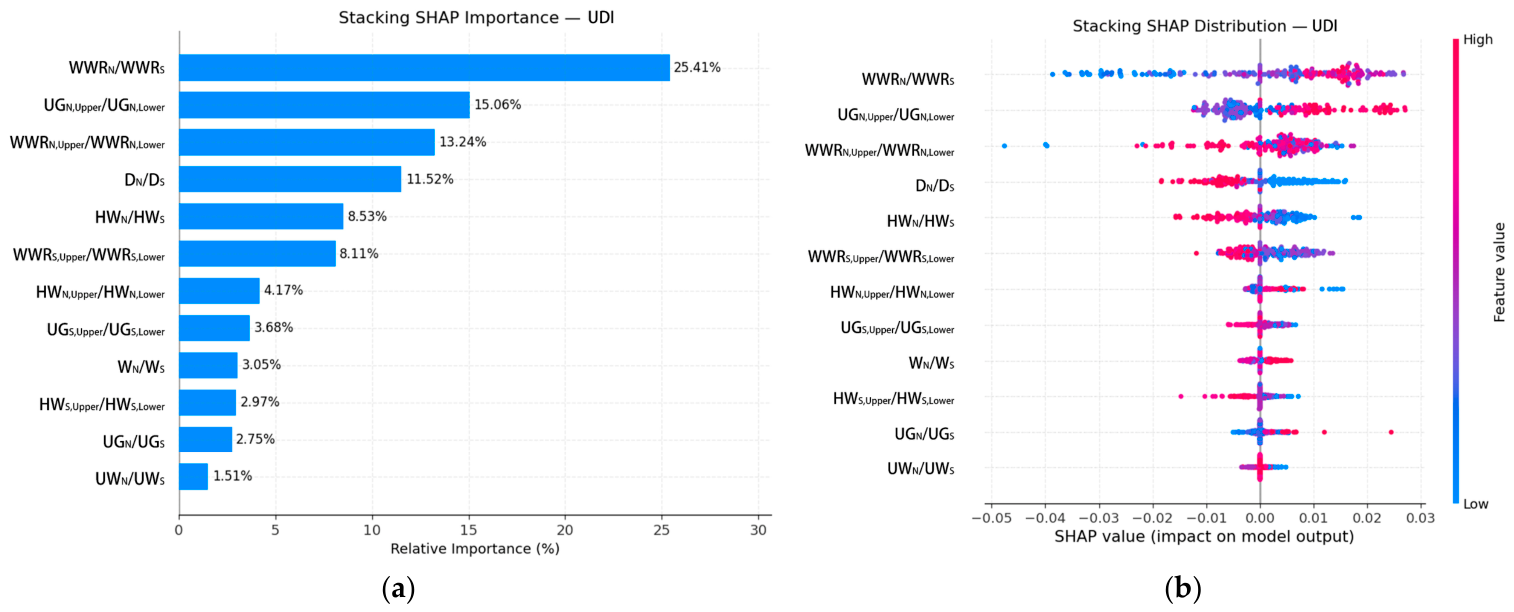
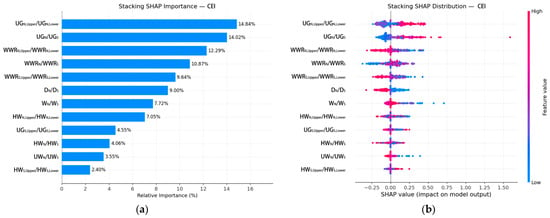
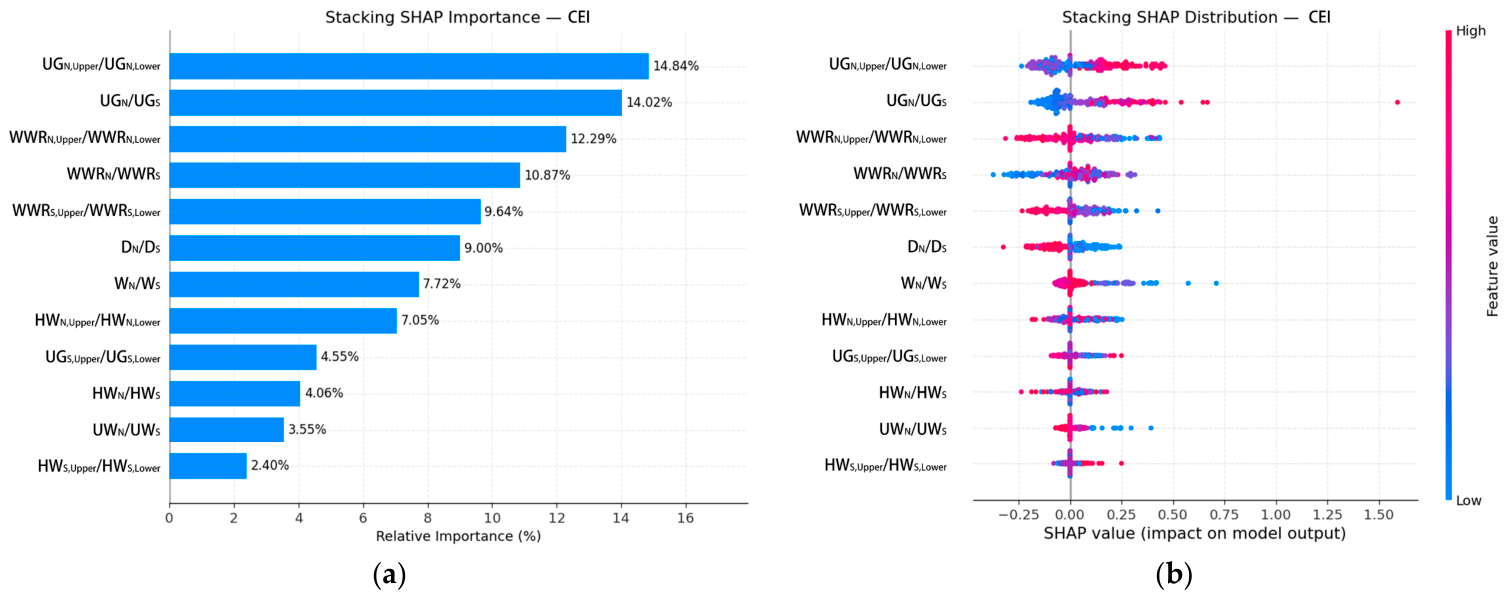

Disclaimer/Publisher’s Note: The statements, opinions and data contained in all publications are solely those of the individual author(s) and contributor(s) and not of MDPI and/or the editor(s). MDPI and/or the editor(s) disclaim responsibility for any injury to people or property resulting from any ideas, methods, instructions or products referred to in the content. |
© 2026 by the authors. Licensee MDPI, Basel, Switzerland. This article is an open access article distributed under the terms and conditions of the Creative Commons Attribution (CC BY) license.