


Abstract
Mixed-mode offices in sub-Saharan hot semi-arid climates face growing thermal stress, yet long-term evidence remains scarce. This study addresses this gap via a stress-test framework (RCP8.5) applied to a compressed earth bricks office in Ouagadougou, Burkina Faso. A calibrated DesignBuilder/EnergyPlus model evaluated four strategies—free-running (FR), natural ventilation (NV), mixed-mode (MM), and fully air-conditioned (AC)—under current (2023) and future horizons (2030, 2060, 2090). Thermal comfort was assessed using ASHRAE-55 adaptive (80%) for FR, NV, and MM, and PMV-PPD for AC. Results show that outdoor temperatures rise by +0.73 °C (2030), +2.6 °C (2060), and +4.71 °C (2090). Passive-only strategies maintain zero energy but show severely growing discomfort. Under AC27, energy demand reaches 282.6 kWh/m2·year by 2090. MM27 reduces discomfort from 9.8% (2023) to 28.1% (2090) while consuming about half the energy of full AC (124.7 kWh/m2·year by 2090), corresponding to an AC/MM energy ratio of 1.9 to 2.3 times. The share of occupied hours with windows open falls below 50% already in 2023, and below 30% between 2030 and 2060—a transition toward cooling-dominated behaviour not previously quantified for the Sudano-Sahelian zone. These findings support mixed-mode as a climate-contingent strategy for sub-Saharan offices, though validation across multiple zones and typologies is needed.
1. Introduction
1.1. Context and Problem Definition
Burkina Faso is urbanising rapidly, with Ouagadougou experiencing strong growth in commercial and office floor areas. Climate change is projected to intensify indoor thermal stress in office buildings [1]. In the hot, dry Sudano-Sahelian climate, acceptable indoor thermal conditions increasingly rely on split-unit air conditioners, often installed in buildings originally designed for natural ventilation with little climate-responsive design. This shift stresses fragile electricity grids and locks in high cooling demand over the building stock’s lifetime [2,3].
Field evidence from Burkina Faso shows that occupants in mixed-mode offices in Ouagadougou report high thermal acceptability at indoor temperatures averaging 27.1 °C, with neutral operative temperatures around 26.3–26.5 °C [4]. These conditions are significantly warmer than typical PMV-based setpoints imported from temperate climates, suggesting that current practice overcools offices and wastes energy [5]. In tropical mixed-mode ventilation contexts, comfort temperatures can reach 29–33.8 °C under natural ventilation conditions [6,7]. Simulation studies indicate that passive and mixed-mode strategies (natural ventilation, shading, nighttime cooling) can reduce cooling energy demand by up to 42% and discomfort hours by about 40% [2]. Retrofitting office buildings with mixed-mode ventilation can reduce cooling energy consumption by around 45% while maintaining acceptable indoor comfort [8].
Under climate change, these challenges are expected to amplify; rising cooling loads, more frequent overheating, and increasing reliance on mechanical cooling are anticipated if current design logics persist [2,9]. Climate change will intensify thermal extremes in West Africa, increasing hot days and warm nights and challenging indoor thermal comfort [10]. The IPCC AR6 projects a global mean temperature rise of 0.6–5 °C by 2100 depending on the SSP scenario [11]. Climate change is projected to significantly intensify heat stress in sub-Saharan Africa, with rising outdoor temperatures and longer hot periods driving higher indoor overheating risks and cooling needs [12]. Burkina Faso will face more frequent, longer, and more intense heatwaves by 2100, especially under high-emission scenarios [13].
Dynamic simulations consistently project growing cooling demands. In Greater Accra, Ghana, residential cooling demand is projected to increase by 31% by 2030 and 50% by 2050, together with higher operative temperatures, a greater proportion of hours above 27 °C, and rising thermal dissatisfaction [14]. In Morocco, cooling demand is projected to increase by 17% by 2050, with indoor overheating hours rising by approximately 27% and peak indoor temperatures exceeding current values by more than 1.5 °C on the hottest days [15]. For sub-Saharan offices, Nigerian cooling demand is projected to rise by 60–68% by 2080 under SSP5-8.5, with envelope properties such as wall conductivity and solar absorptance emerging as key levers for mitigating future cooling demand [16]. In Burkina Faso, ref. [17] reported projected increases in annual energy demand of 56% (2030–2049) and 99% (2060–2079) attributable to climate change. Mixed-mode operation based on adaptive comfort can support adaptation to climate change: adaptive setpoint control reduces cooling energy demand by roughly 75% and consumption by about 60% in current climates, preserving 31–39% demand reductions and 40–62% consumption reductions by 2080 relative to conventional operation [9,18]. Field studies confirm that occupants accept neutral temperatures several degrees above PMV-based criteria, remaining comfortable at 27–29 °C in mixed-mode offices [4,5,19]. Climate-responsive envelopes, passive cooling, and adaptive control are central to limiting cooling energy growth in sub-Saharan offices [20]. Further research is required to evaluate the applicability and robustness of adaptive thermal comfort models in mixed-mode office buildings operating under extreme thermal conditions, as climate change will substantially worsen cooling demand and HVAC use [21].
1.2. Gaps in Thermal Comfort Assessment and Climate Adaptation
Whether these projected increases translate into discomfort depends on the comfort model used to judge them, and the models embedded in current setpoints were not developed for this climate. Classical PMV/PPD models assume steady-state conditions and fixed clothing, activity, and air movement; these assumptions are rarely valid in naturally ventilated or mixed-mode buildings [22]. PMV systematically mispredicts thermal sensation in warm tropical contexts, overestimating discomfort and failing to capture behavioural, physiological, and psychological adaptation [23,24]. Regression-based adaptive models (ASHRAE-55 [25], EN 16798-1 [26]) improve realism but rely solely on the outdoor running mean temperature, ignoring behavioural variables such as fan use and window opening, which are central to comfort in tropical buildings [27,28]. Current adaptive models also exhibit regional bias, being derived largely from temperate-climate office datasets, and may misrepresent comfort in tropical, mixed-mode, or vulnerable-user contexts [20,24]. New approaches begin to bridge these gaps, but reviews highlight a lack of standardised methods and limited climate and building diversity [29,30]. Table 1 synthesises the key literature reviewed, outlining the methodological approaches, case studies, and main findings of studies comparable to the present work. Compared to previous studies, this study provides an integrated long-term assessment (2023–2090) of EMS-controlled mixed-mode operation in a real CEB office building in Burkina Faso; further details on the contributions are provided in Section 4.1.
Field studies in sub-Saharan Africa confirm these limitations. In Ouagadougou, a field study recorded an average indoor temperature of 27.1 °C, with neutral operative temperatures around 26.2–26.5 °C [4]. Another study found indoor temperatures averaging 28.9 °C (NV) and 27.3 °C (AC), with neutral temperatures of 26.1–30.3 °C and comfort limits exceeding standards by only 0.5–0.7 °C in the hot season [5]. Simulation studies show that natural ventilation alone cuts discomfort hours by ~40% and energy consumption by ~30%, while combining ventilation, shading, and nighttime cooling reduces cooling demand by 42–43% [2]. Recent studies have also addressed mixed-mode office performance under climate change in temperate and humid subtropical climates [9,31], and field studies have examined adaptive comfort in mixed-mode offices [21,32,33]. However, these studies have focused predominantly on residential buildings or on climatic contexts that differ substantially from the Sudano-Sahelian zone. Collectively, these studies indicate higher neutral and acceptable temperatures than classical standards, strong reliance on behavioural and building-level adaptation, and substantial energy-saving potential when mixed-mode aligns with adaptive comfort.
Table 1.
Synthesis of key literature on thermal comfort and energy performance in sub-Saharan and comparable climates.
Despite growing research on adaptive comfort and future climate impacts, three gaps remain unresolved for sub-Saharan office buildings. Most studies focus either on present-day field surveys or on future simulations but rarely integrate both within a calibrated real-building framework. The performance limits of mixed-mode office operation under future tropical hot semi-arid climates remain poorly quantified. The combined assessment of adaptive thermal comfort, cooling energy demand, and operational carbon emissions under progressive climate change remains limited for West African office buildings. To address these gaps, this study develops a calibrated dynamic model of a monitored CEB office building in Ouagadougou, applies ASHRAE-55 across four operational modes under current and future climates, and quantifies how mixed-mode operation reduces the trade-off between thermal comfort, cooling energy demand, and CO2 emissions under progressive warming. To this end, we define an operational threshold based on the share of occupied hours with windows open.
1.3. Research Aims and Objectives
The overarching aim of this study is to generate evidence-based, context-specific insights on thermal comfort, energy, and carbon performance trade-offs in a sub-Saharan mixed-mode office building, to inform future climate-responsive design frameworks and support research hypotheses on passive retrofit strategies in tropical hot semi-arid environments. Three research questions are addressed:
- (1)
- Which thermal comfort framework best reflects adaptive tolerance in a tropical hot semi-arid sub-Saharan climate?
- (2)
- How do free-running, natural ventilation, mixed-mode, and full air-conditioning strategies perform in terms of discomfort hours under current and future climates?
- (3)
- To what extent can mixed-mode operation reduce the trade-off between thermal comfort, cooling energy demand, and operational CO2 emissions under progressive warming?
The remainder of this article is organised as follows: Section 2 describes the materials and methods, including the case study building, the simulation setup, the mixed-mode control logic, the calibration and validation procedure, and the key performance indicators. Section 3 presents the results, focusing on model validation, comfort model analysis, annual simulated discomfort hours, energy use and CO2 emissions, and temperature trends. Section 4 discusses the findings, their implications, and the limitations of the study. Section 5 concludes with the main takeaways and recommendations for future work.
2. Materials and Methods
2.1. Selection of Case Study
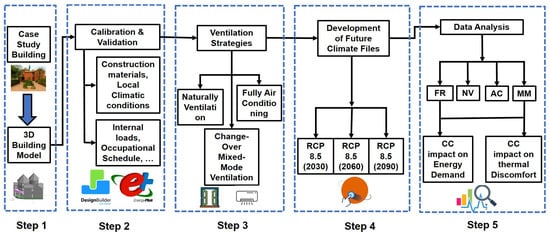
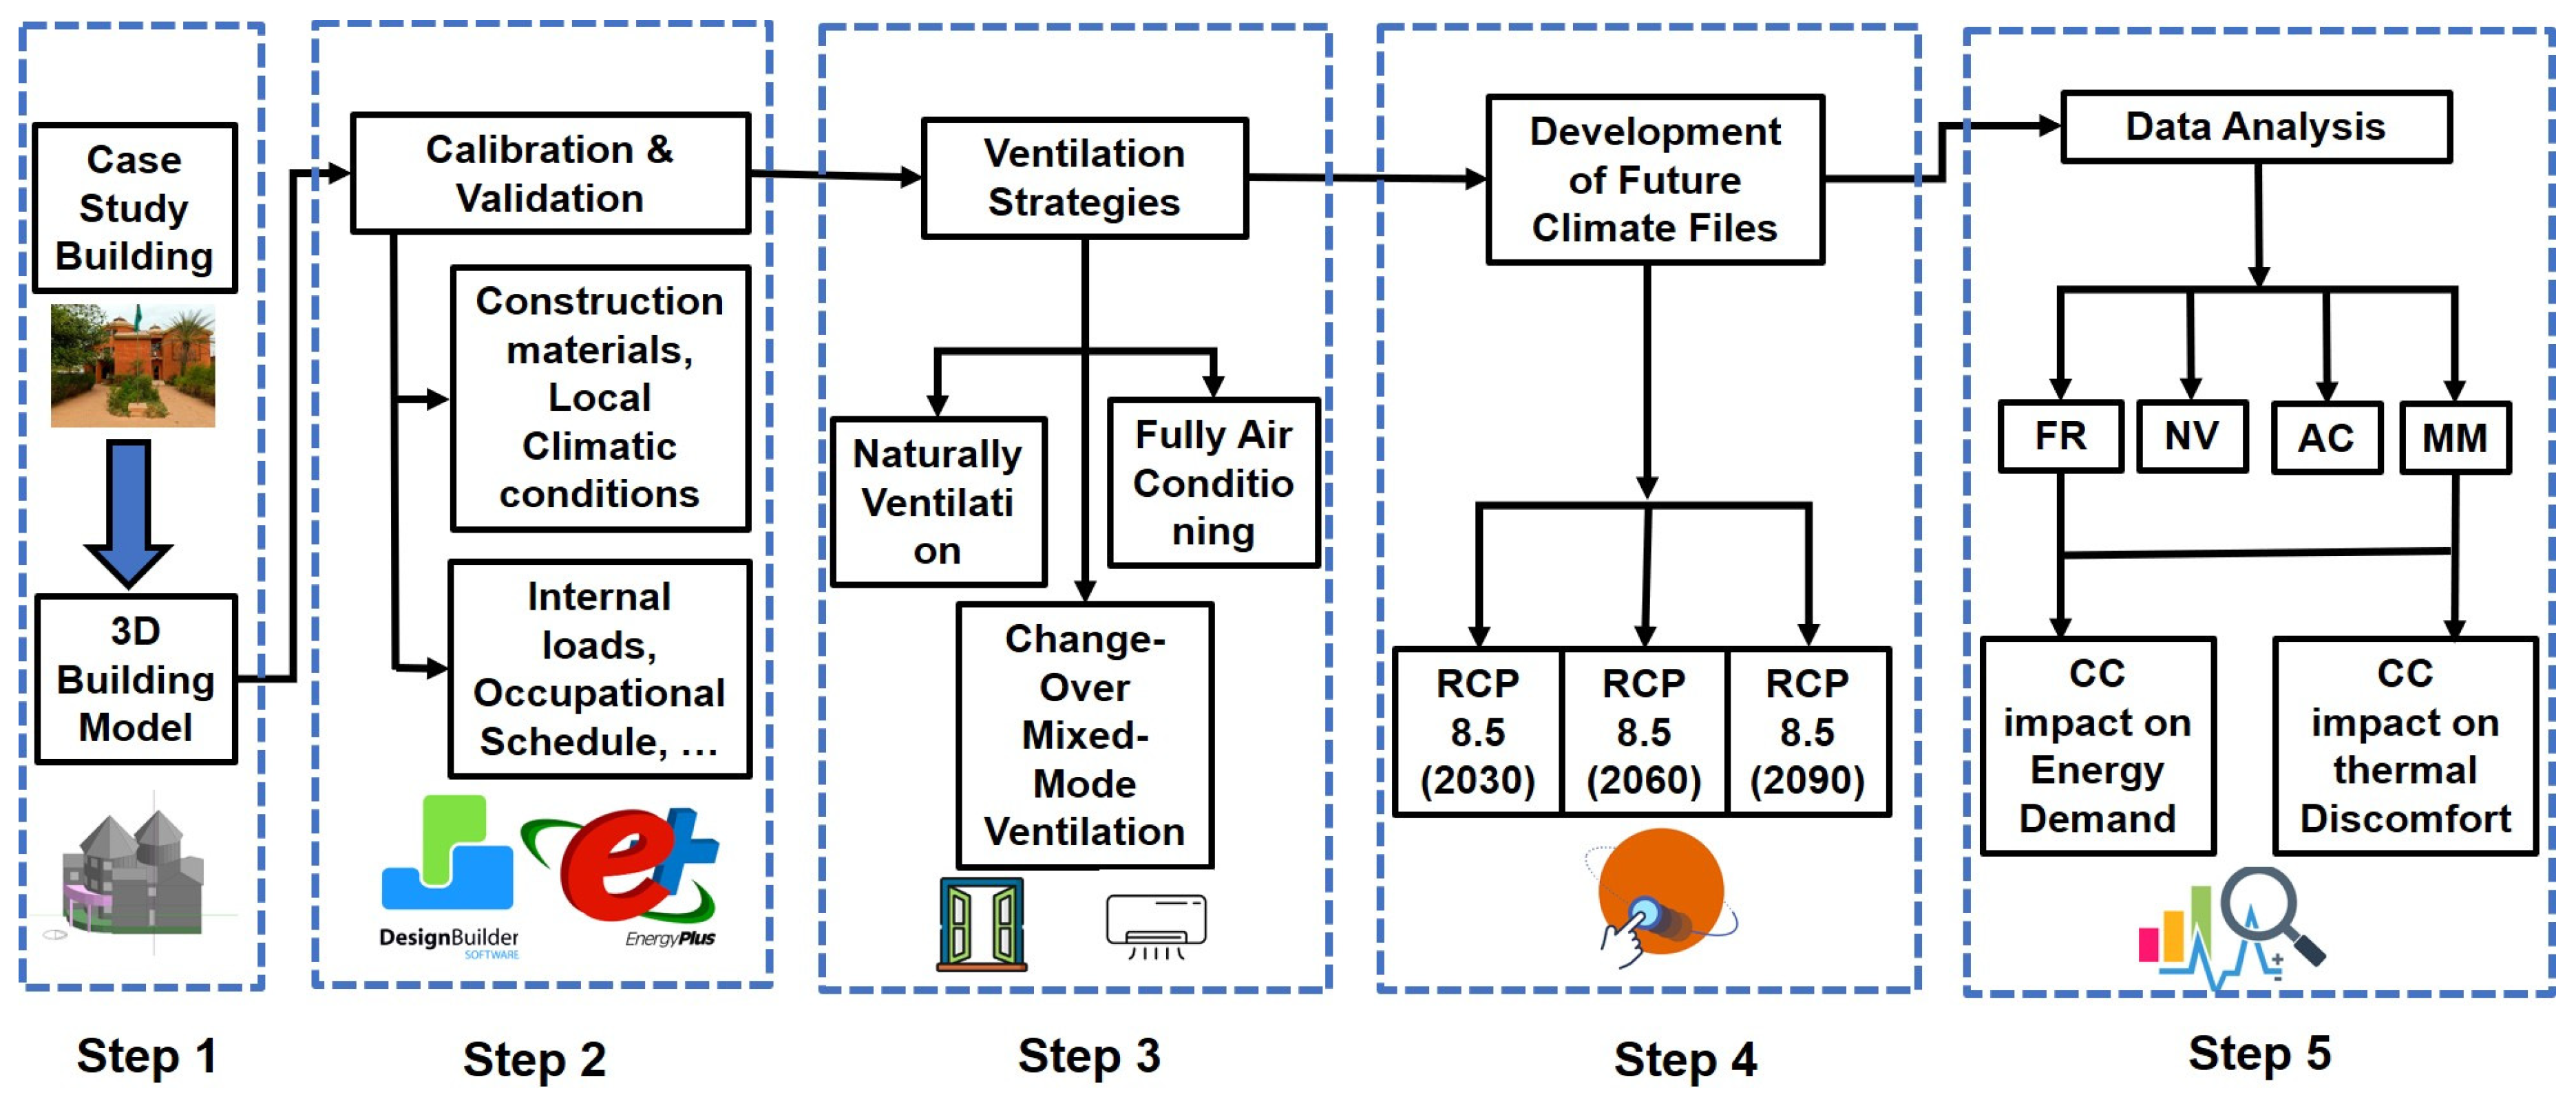
The methodological framework (Figure 1) is based on a real office building in Ouagadougou, Burkina Faso, selected following a previous on-site investigation [5]. The building is a three-story, mixed-mode office constructed with compressed earth brick (CEB) and reflects typical existing stock in Burkina Faso: uninsulated masonry walls, an uninsulated roof, and limited solar protection. All office spaces have operable windows, and internal heat gains arise from occupants, equipment, and lighting.
Figure 1.
Conceptual framework of the methodology. FR: free-running; NV: naturally ventilated; AC: air-conditioned; MM: mixed-mode.
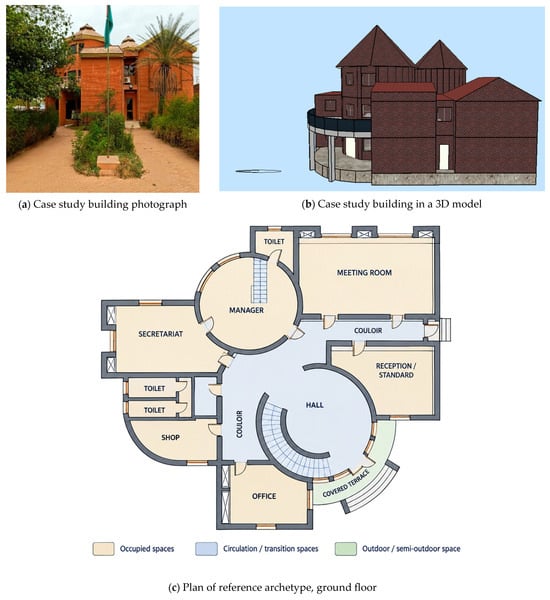
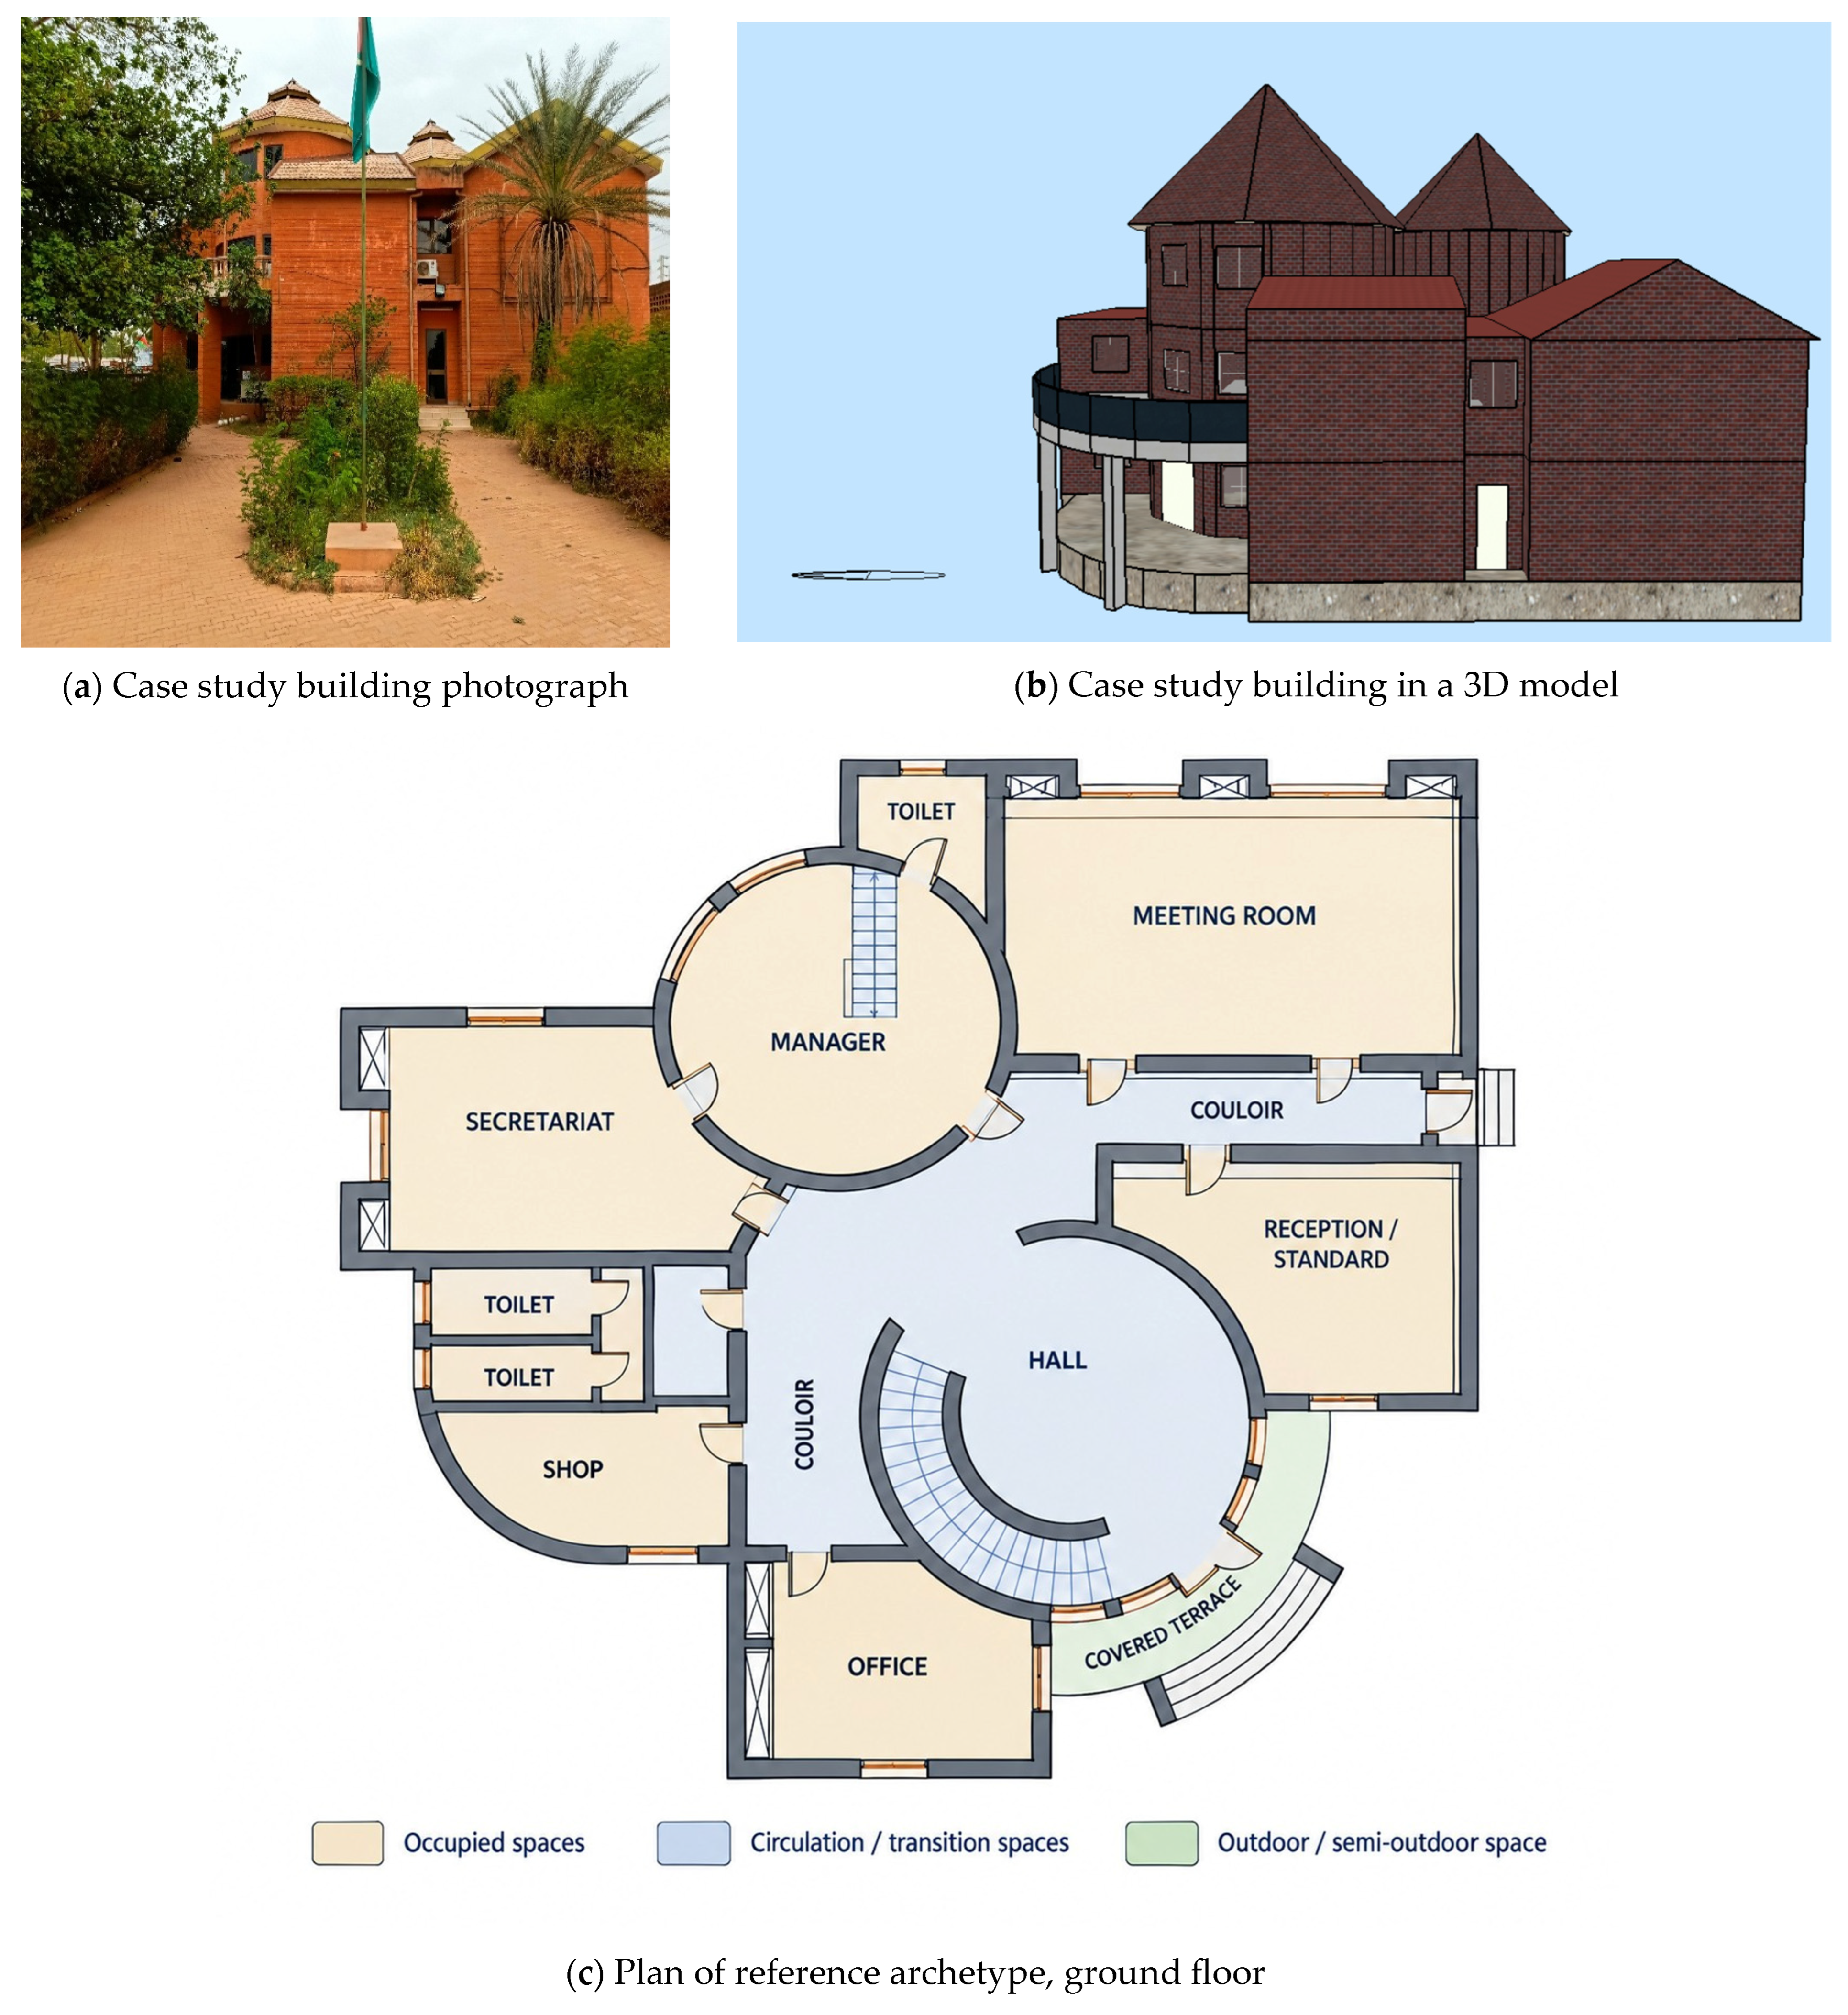
The 3D geometry was created in DesignBuilder (incorporating EnergyPlus), as illustrated in Figure 2a,b. The study room is a 25.11 m2 polygonal office on the building’s ground floor, with two glazed openings (East: 120 × 130 cm2; South: 120 × 120 cm2) and two west-oriented internal doors. The space hosts four permanent occupants plus occasional visitors, with weekday occupancy from 08:00 to 16:00. Additional thermal loads come from office equipment (computers, a printer, a refrigerator, lighting), and indoor conditions are regulated by a dedicated AC unit [35]. The thermal properties of the building materials (Table 2) were compiled from published experimental studies on compressed earth brick (CEB) and conventional construction materials in Burkina Faso [35,36,37]. Some of these values—particularly those of the CEB walls, floors, windows and doors—were determined experimentally by Maiga et al. [35] on the same case study building analysed in this paper, using locally available materials. The remaining values represent locally available materials in Burkina Faso and were validated through the calibration process.
Figure 2.
Case study building as a reference.
Table 2.
Thermal properties of the reference model.
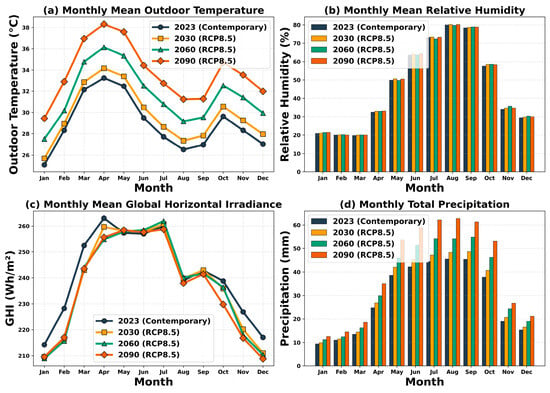
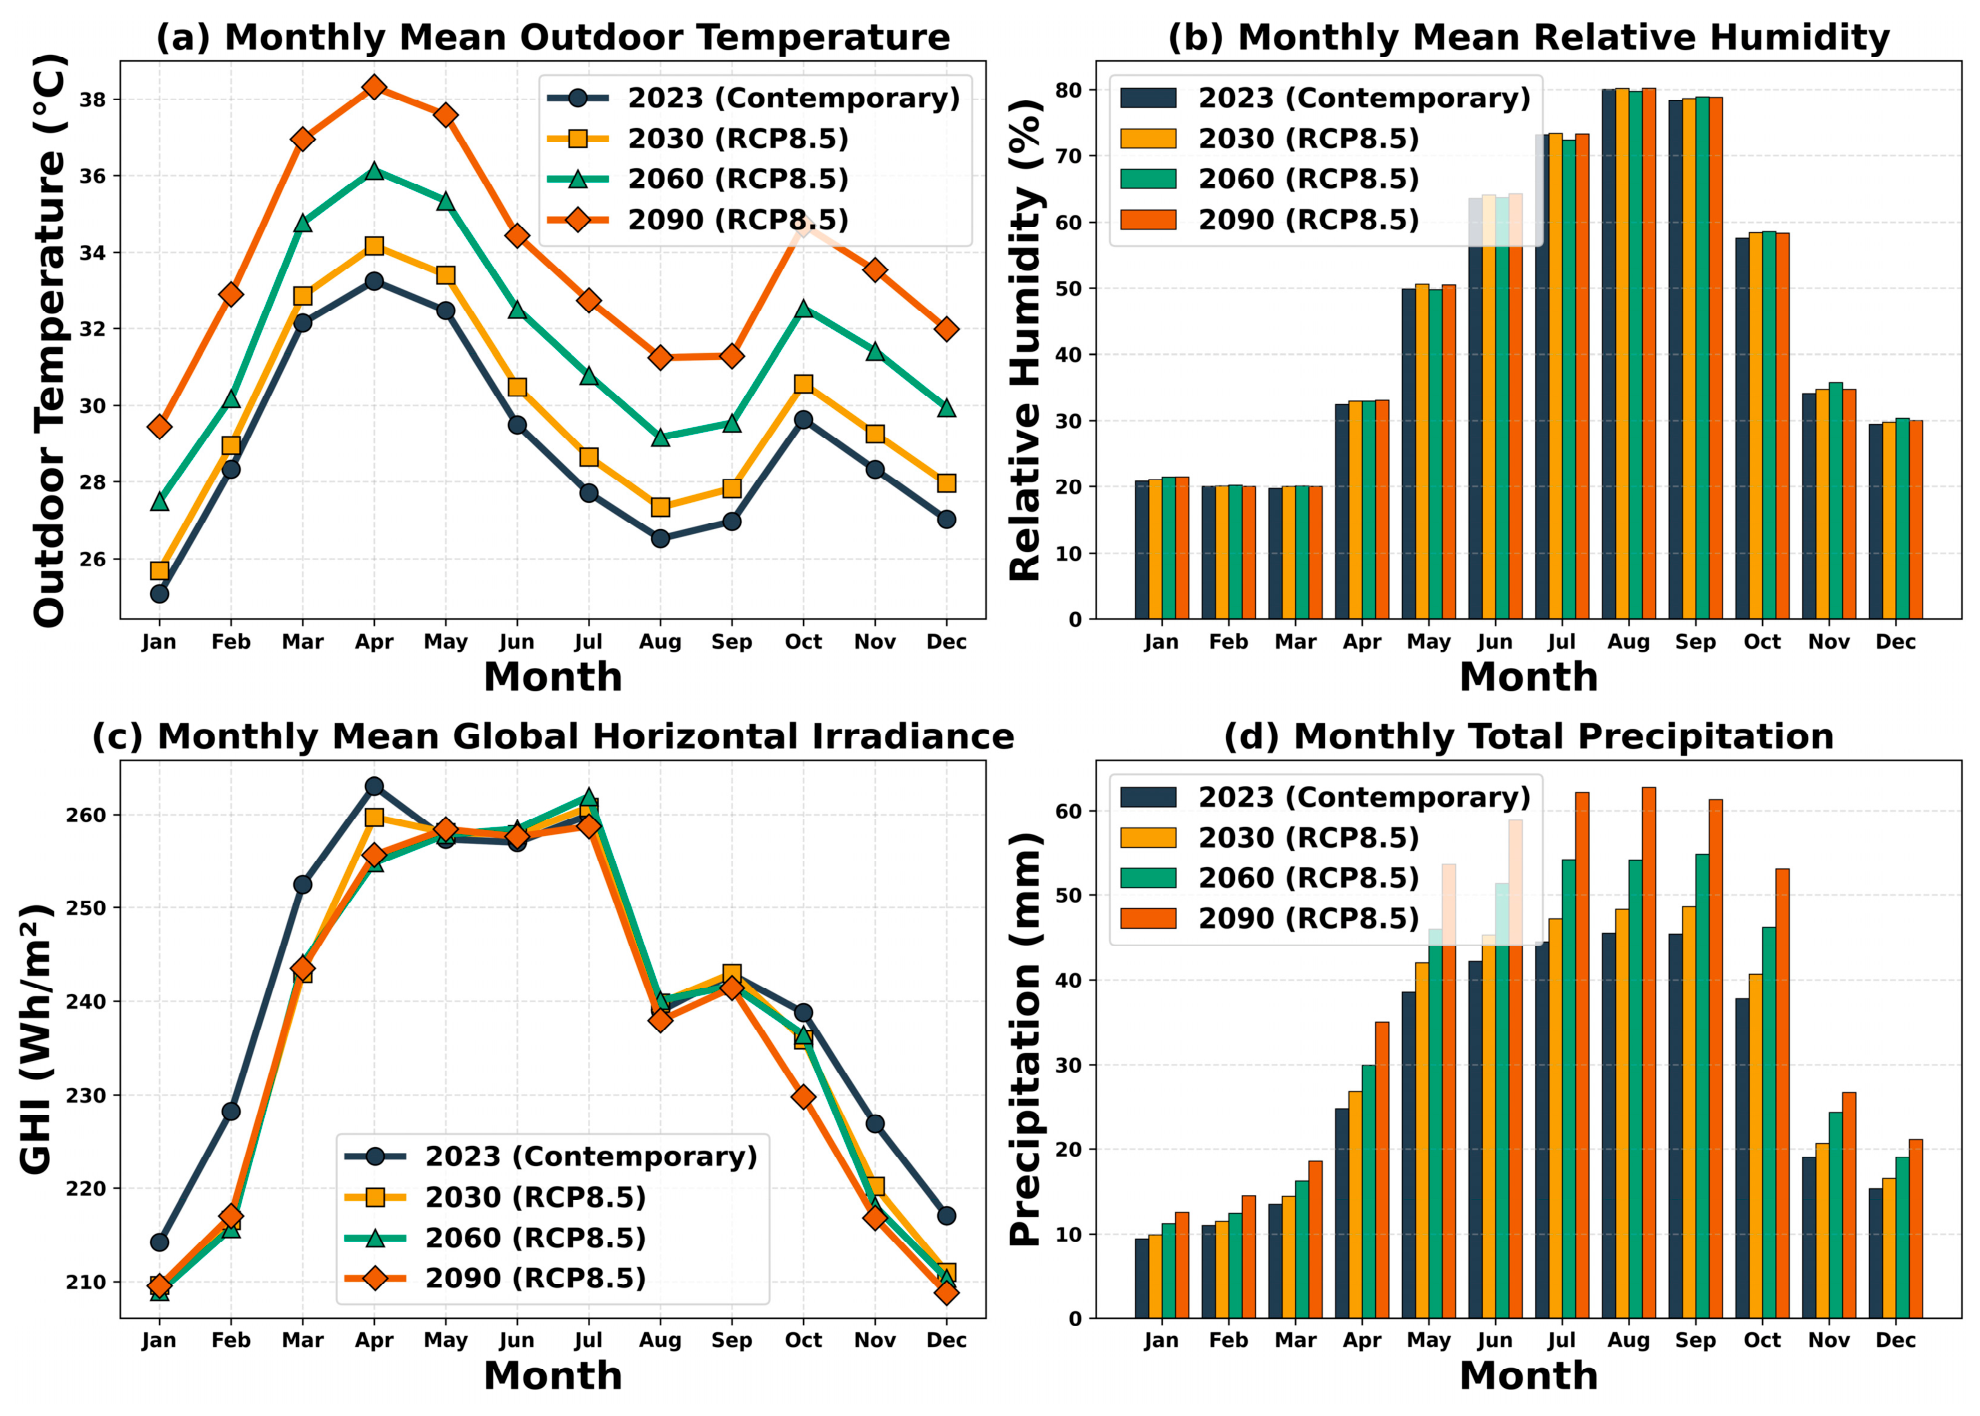
Ouagadougou has a tropical hot and semi-arid (BSh) climate, with a long dry season (October–May) and a shorter rainy season (June–September). Figure 3 illustrates the monthly mean outdoor temperature, relative humidity, global horizontal irradiance, and total precipitation for the four climate horizons considered in this study (2023, 2030, 2060, 2090 under RCP8.5). Monthly mean outdoor temperatures increase monotonically across horizons, from about 24–32 °C in 2023 to about 29–38 °C in 2090, with the strongest absolute increases occurring in the pre-monsoon months. Relative humidity remains seasonally structured but shows slight changes in amplitude, while GHI remains essentially unchanged across horizons. Monthly precipitation shows a marked reduction in the 2060 and 2090 horizons, especially during the peak of the rainy season. These trends result in increasing cooling loads, reduced passive cooling potential, and greater reliance on active or hybrid strategies in the second half of the century. The selected weather files capture both current conditions and projected warming under RCP8.5, which should be interpreted as scenario-based projections rather than deterministic forecasts. Long-term observations show a warming trend of approximately 1–1.5 °C since the 1980s, with more frequent extreme heat events [38,39]. RCP8.5 was selected as a high-end stress-test pathway for three reasons. First, it represents the upper bound of plausible warming and therefore constitutes a thermally conservative test for building performance. Second, RCP8.5-based morphed weather files were available for Ouagadougou from the Meteonorm database (Meteonorm v8.2, CMIP5-RCP8.5 morphing, reference period 2000–2019), whereas SSP-based morphed files (CMIP6) were not available through Meteonorm at the time of this study (April 2025). Third, RCP8.5 remains widely used in the building performance literature as a standard high-emission scenario, facilitating comparison with previous studies. Nevertheless, we acknowledge the ongoing transition to CMIP6 SSP scenarios in the IPCC AR6, and future work should incorporate SSP scenarios to align with the latest climate science.
Figure 3.
Annual weather data for Ouagadougou under current and future climate scenarios.
2.2. Simulation Setup and Mixed-Mode Control
Dynamic thermal simulations were performed using DesignBuilder v2025.1 (interface) and EnergyPlus v23.1 (engine), widely validated for building energy simulation [40]. Thermal zoning uses a single-zone representation, intentionally selected as a controlled thermal stress-test configuration. The selected office zone—south/east-facing glazing, high internal load density, and uninsulated envelope—isolates the thermal response of a highly exposed office under progressive warming, with greater interpretability than a whole-building multi-zone model. This represents a near-worst-case condition, not a whole-building average. This directional bias does not invalidate the mixed-mode advantage; if mixed-mode remains more efficient than full AC under this unfavourable configuration, its advantage is likely preserved under less exposed conditions. The complete list of simulation assumptions—including HVAC specifications, internal loads, infiltration, natural ventilation controls, and envelope properties—is provided in Table A1 (Appendix A).
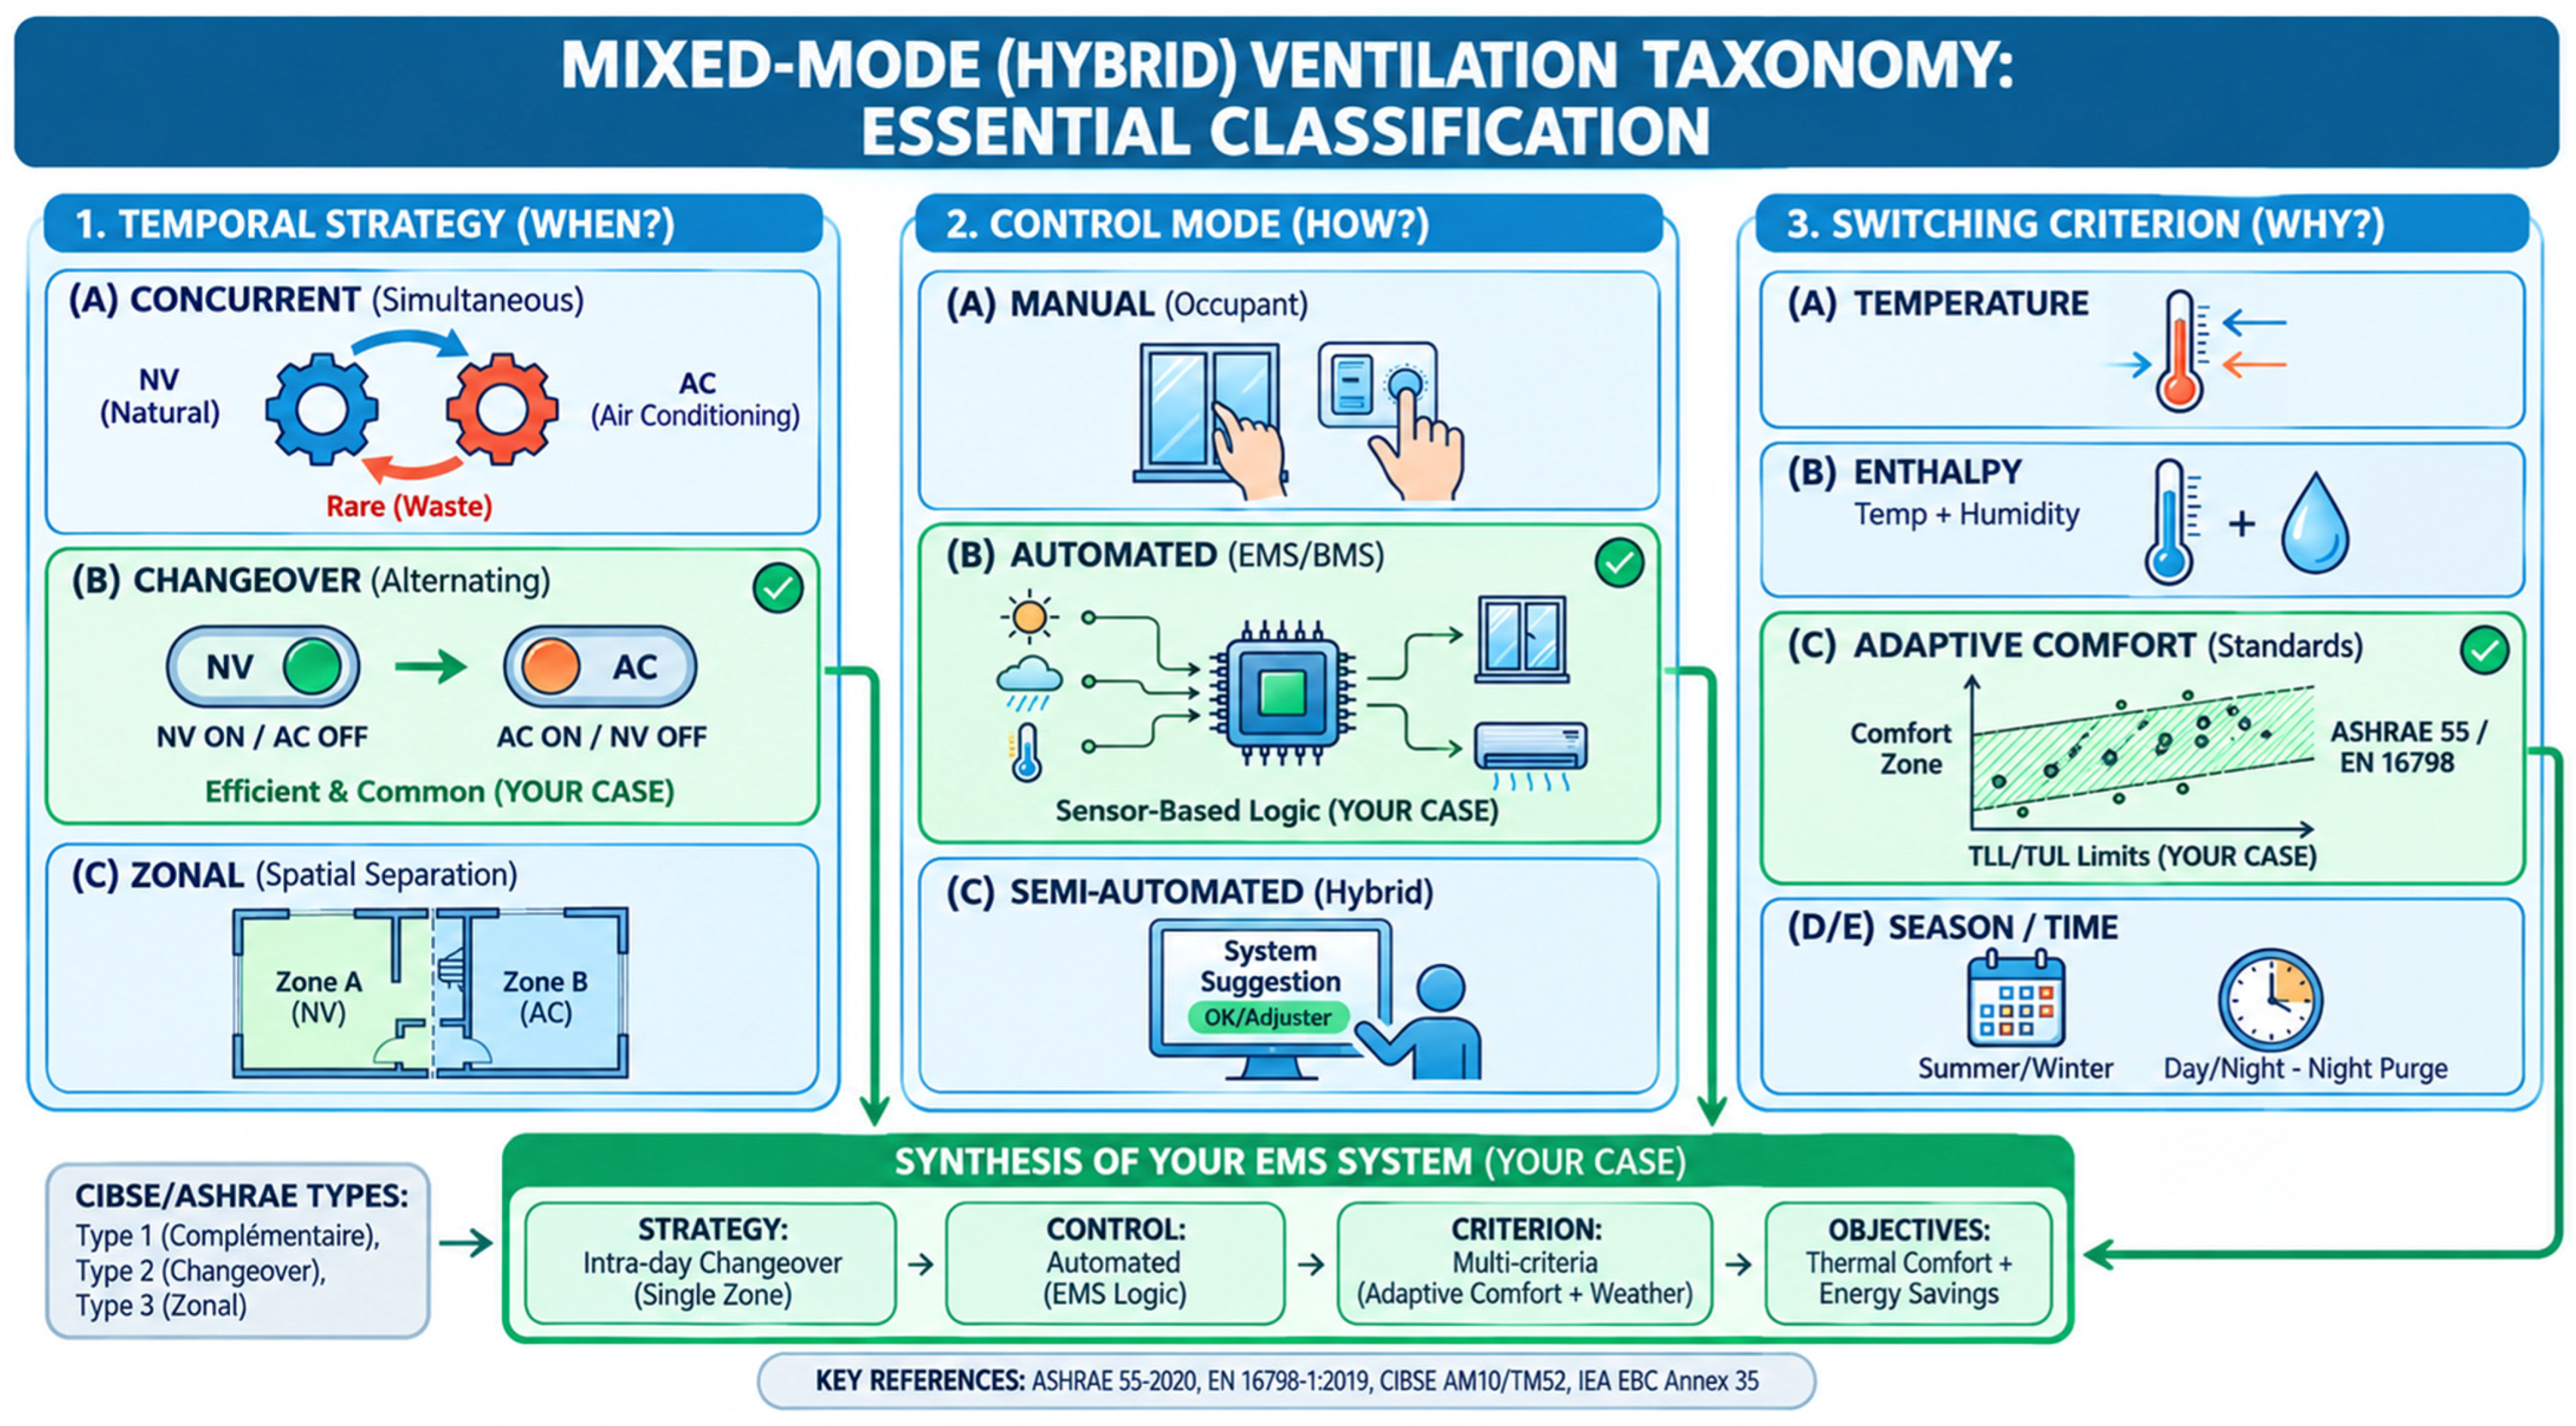
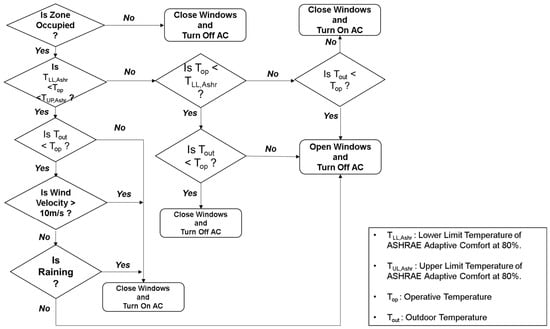
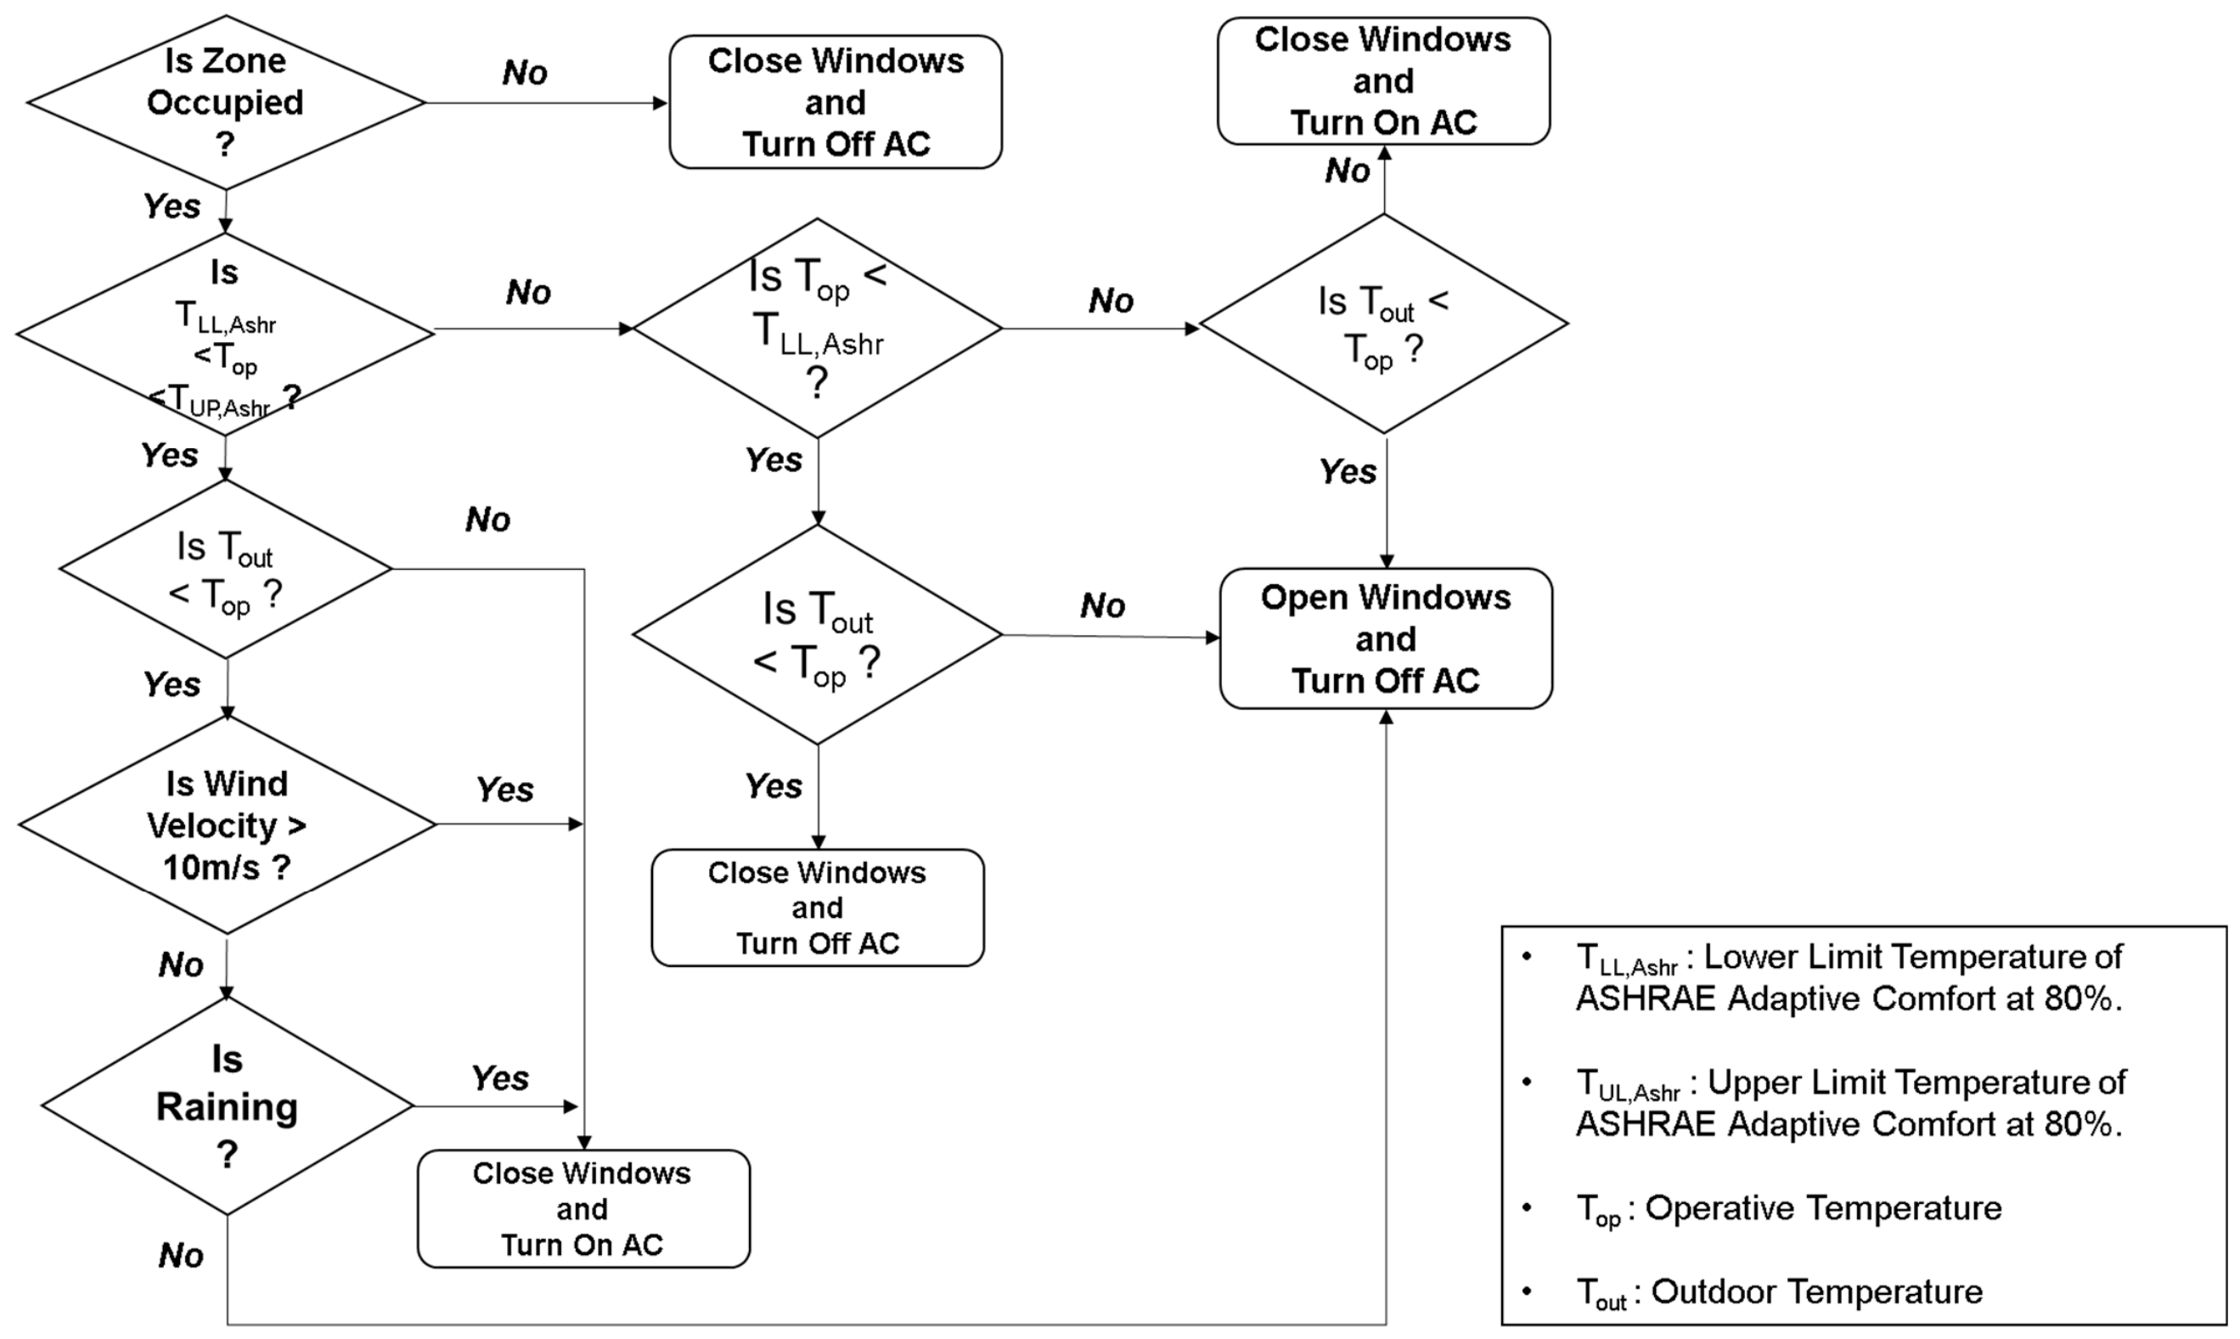
The taxonomy of mixed-mode ventilation is based on three dimensions: temporal strategy, control mode, and switching criteria, summarised in three different possible configurations (concurrent, zonal, and changeover) as shown in Figure A1 (Appendix B.1) [41]. This study adopts a changeover mixed-mode strategy, where natural ventilation and air-conditioning operate alternately. Control is implemented through automated, sensor-based logic aligned with ASHRAE-55, using thermal conditions as switching criteria, prioritising passive cooling whenever possible [32,42,43]. For natural ventilation modelling, we used the ASHRAE-55 adaptive model with 80% acceptability. Simulations were conducted using the multizone Airflow Network (AFN) in DesignBuilder. The Energy Management System (EMS) controlled window opening/closing based on internal temperatures (Figure 4, Table 3):
Figure 4.
Control flowchart of the EMS-based changeover mixed-mode strategy.
Table 3.
Control logic and operational assumptions for the four scenarios.
- Windows remain closed, and the air-conditioning system is activated if two conditions are simultaneously satisfied: the zone is occupied, and the operative temperature is outside the adaptive comfort limits established by ASHRAE 55 for 80% acceptability.
- Windows are opened, and the air-conditioning system is turned off if three conditions are simultaneously met: the zone is occupied, the operative temperature is within the adaptive comfort limits established by ASHRAE-55, 80% acceptability, and the external temperature is below the zone operative temperature.
- Windows are closed, and the air-conditioning system is turned off if the zone is unoccupied.
These window operation criteria are consistent with established practice in mixed-mode building simulation and with the adaptive comfort literature. The comfort band is defined by the ASHRAE-55 adaptive model (80% acceptability) [41]. The requirement that the outdoor temperature be lower than the indoor operative temperature ensures that natural ventilation provides effective cooling [42]. Similar control logic has been applied in previous mixed-mode simulation studies [8,33,43].
The mixed-mode changeover strategy follows a deterministic algorithm based on occupancy, operative temperature (Top), outdoor conditions, and the ASHRAE-55 80% band. During occupied hours, windows open only when Top is within the comfort band, the outdoor temperature is lower than Top, the wind speed is ≤10 m/s, and there is no rainfall. Otherwise, mechanical cooling is activated. During unoccupied periods, windows remain closed and HVAC remains off. This explicit control hierarchy is essential because mixed-mode performance is highly sensitive to switching logic, not just the ventilation category. Cooling setpoints were varied because they are the most practical parameter that can be adjusted without physical retrofit. In addition, field studies in Burkina Faso [6,7] indicate that occupants tolerate higher temperatures than conventional PMV-based setpoints allow. Other parameters, such as occupancy schedules and window-opening criteria, were kept unchanged because they were predefined or controlled by the EMS. Future research may examine the sensitivity of these parameters.
To characterise the progressive transition of mixed-mode operation toward cooling-dominated behaviour, an operational threshold is defined based on the share of occupied hours with windows open. This share is calculated from the EMS output as the ratio of the number of occupied hours during which the windows are open to the total number of occupied hours. Two thresholds are considered: the 50% threshold, which marks the point at which natural ventilation ceases to be the dominant cooling strategy, and the 30% threshold, which marks the point at which natural ventilation becomes marginal.
2.3. Model Calibration and Validation
Calibration was not a procedural step but the methodological basis for all future climate conclusions. Since the study extrapolates from present monitored conditions to 2030, 2060, and 2090, confidence in future simulations depends on demonstrating that the model reproduces present indoor thermal dynamics with sufficient accuracy [33]. Calibration focused on hourly indoor air temperature under both hot and cold periods, capturing mean trends, daily fluctuations, internal gains, and envelope response. Calibration followed ASHRAE Guideline 14 [44,45], using Normalised Mean Bias Error (NMBE) (Equation (1)) and Coefficient of Variation in the Root Mean Square Error (CV(RMSE)) (Equation (2)) to assess model accuracy. For hourly data, NMBE must be <10% and CV(RMSE) <30% for empirical validation. Validation compared simulated comfort outcomes with field investigation results, ensuring the model accurately captured both physical building performance and occupant adaptive behaviour. Monitoring was conducted in one chosen office [5]. Hourly temperature readings were used for a total of 41 days across two monitoring campaigns: 21 days in the cold season (4–24 December 2023) and 20 days in the hot season (11–30 April 2024).
It should be noted that the calibration period did not include the rainy season (June–September). Although the field investigation campaign did cover the rainy season (see in Bouda et al., 2026 [5]), the continuous data recorded during this period were not sufficiently coherent for reliable calibration, due to sensor-related issues. Therefore, calibration was restricted to the two periods with high-quality continuous measurements (cold and hot seasons).
2.4. Comfort Models and Key Performance Indicators
The ASHRAE-55 adaptive model (80% acceptability) was selected for FR, NV, and MM scenarios. Adaptive models allow wider acceptable temperature ranges by incorporating occupant behaviour and climatic context [41]. The appropriateness of the ASHRAE-55 adaptive model for Ouagadougou is supported by field studies in Burkina Faso [6,7], which demonstrate that occupants accept temperatures significantly higher than PMV-based recommendations. The comparison with EN 16798-1 in Section 3.1 points to the same conclusion. PMV-PPD was retained exclusively for AC scenarios, but AC operation was evaluated using cooling setpoints from 25 °C to 27 °C to represent locally calibrated cooling practices [5,18]. Adaptive comfort outputs for AC scenarios (AC-Adaptive27) were included for comparative purposes only and should not be interpreted as standard-compliant predictions, as ASHRAE-55 applies only where occupants retain meaningful control over their environment. Three key performance indicators (KPIs) [46] were used:
Discomfort Rate (DR) quantifies the percentage of occupied hours during which the indoor operative temperature (Top) exceeds the upper limit of the ASHRAE-55 80% adaptive comfort band (TUL,Ashr and TUL,Ashr).
where is the number of discomfort hours depending on the applied comfort model, and is the total number of occupied hours over the year.
Energy Use Intensity (EUI) represents the annual cooling electricity demand normalised by floor area.
where is the hourly cooling electricity consumption (kWh) and is the surface area in m2. EUI is calculated as the sum of hourly cooling electricity use per total area.
Operational Emission Intensity (OEI) is derived by multiplying EUI by the local electricity emission factor EF.
In Burkina Faso, the electricity mix is predominantly fossil-based, supplemented by regional imports. Based on values reported in the literature, the emission factor was set to 0.6 kgCO2/kWh, which lies at the midpoint of the commonly reported range of 0.5–0.7 kgCO2/kWh for the Burkinabè electricity mix. A sensitivity analysis was conducted using the lower (0.5) and upper (0.7) bounds of this range to assess the robustness of the OEI results (Table A2, Appendix A). This value falls within the commonly reported range of 0.5–0.7 kgCO2/kWh and provides a conservative estimate of operational carbon emissions [47]. This emission factor was held constant throughout the 2023–2090 horizon. This constitutes a conservative simplification, as it does not account for potential decarbonisation of the Burkinabe electricity mix or regional integration through the West African Power Pool (WAPP). Consequently, the CO2 emission trajectories presented in this study should be interpreted as upper-bound estimates under a business-as-usual grid scenario, rather than as predictions of future carbon intensity.
3. Results
3.1. BEM Validation and Comfort Model Analysis
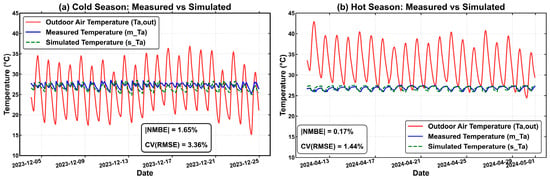
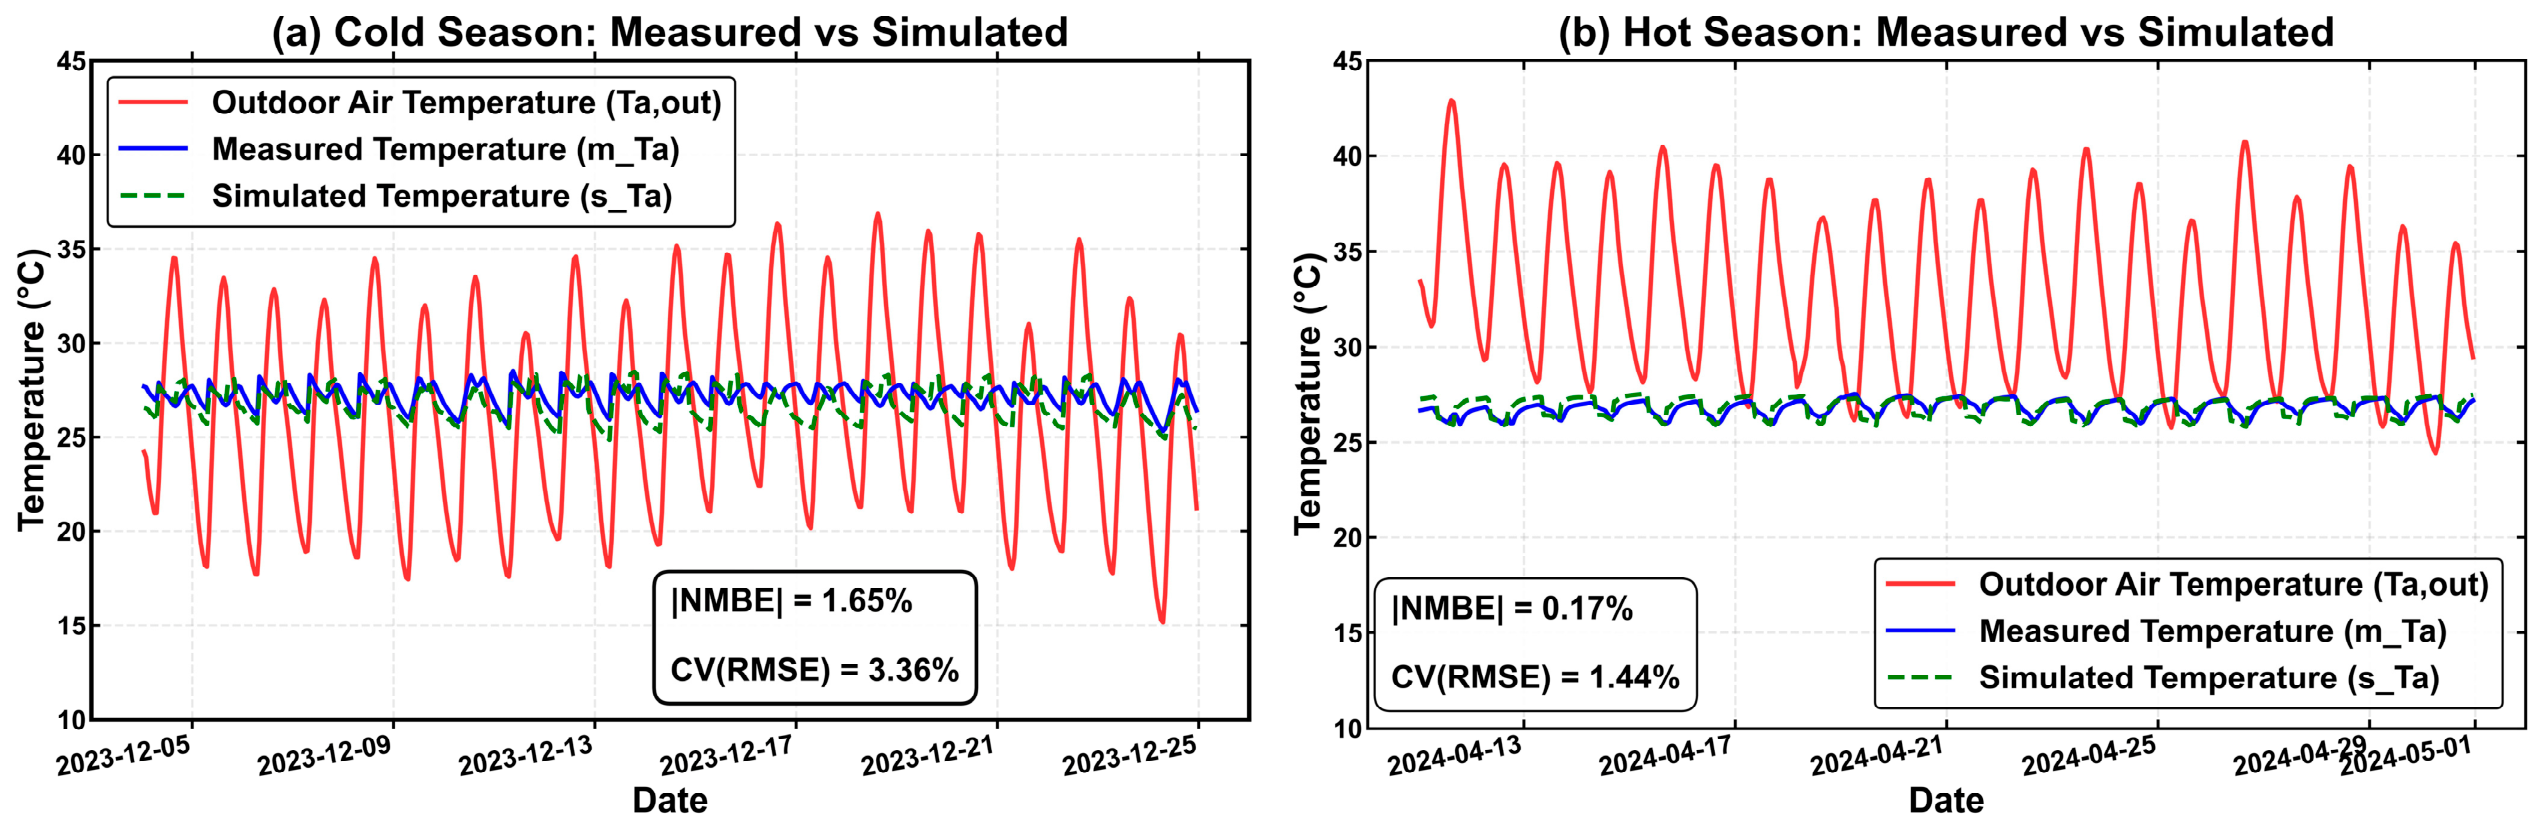
As shown in Figure 5a,b, most of the hourly simulated data closely match the measured values. |NMBE| is 1.65% for the cold season and 0.17% for the hot season, while the the CV(RMSE) is 3.36% and 1.44%, respectively (See Table 4). In this way, the developed BEM was made as accurate as possible in representing the real, existing office building. The very low NMBE and CV(RMSE) values indicate that the model reproduces measured indoor thermal behaviour with high fidelity and therefore provides a credible basis for future scenario analysis. The simulated data for the building under study in the next subsections enable us to assess the effects of a changing climate under the RCP 8.5 forcing scenario. Accordingly, the following aspects of performance are considered.
Figure 5.
Measured and simulated indoor air temperature during (a) the cold season and (b) the hot season.
Table 4.
NMBE and CV(RMSE) for the two seasons.
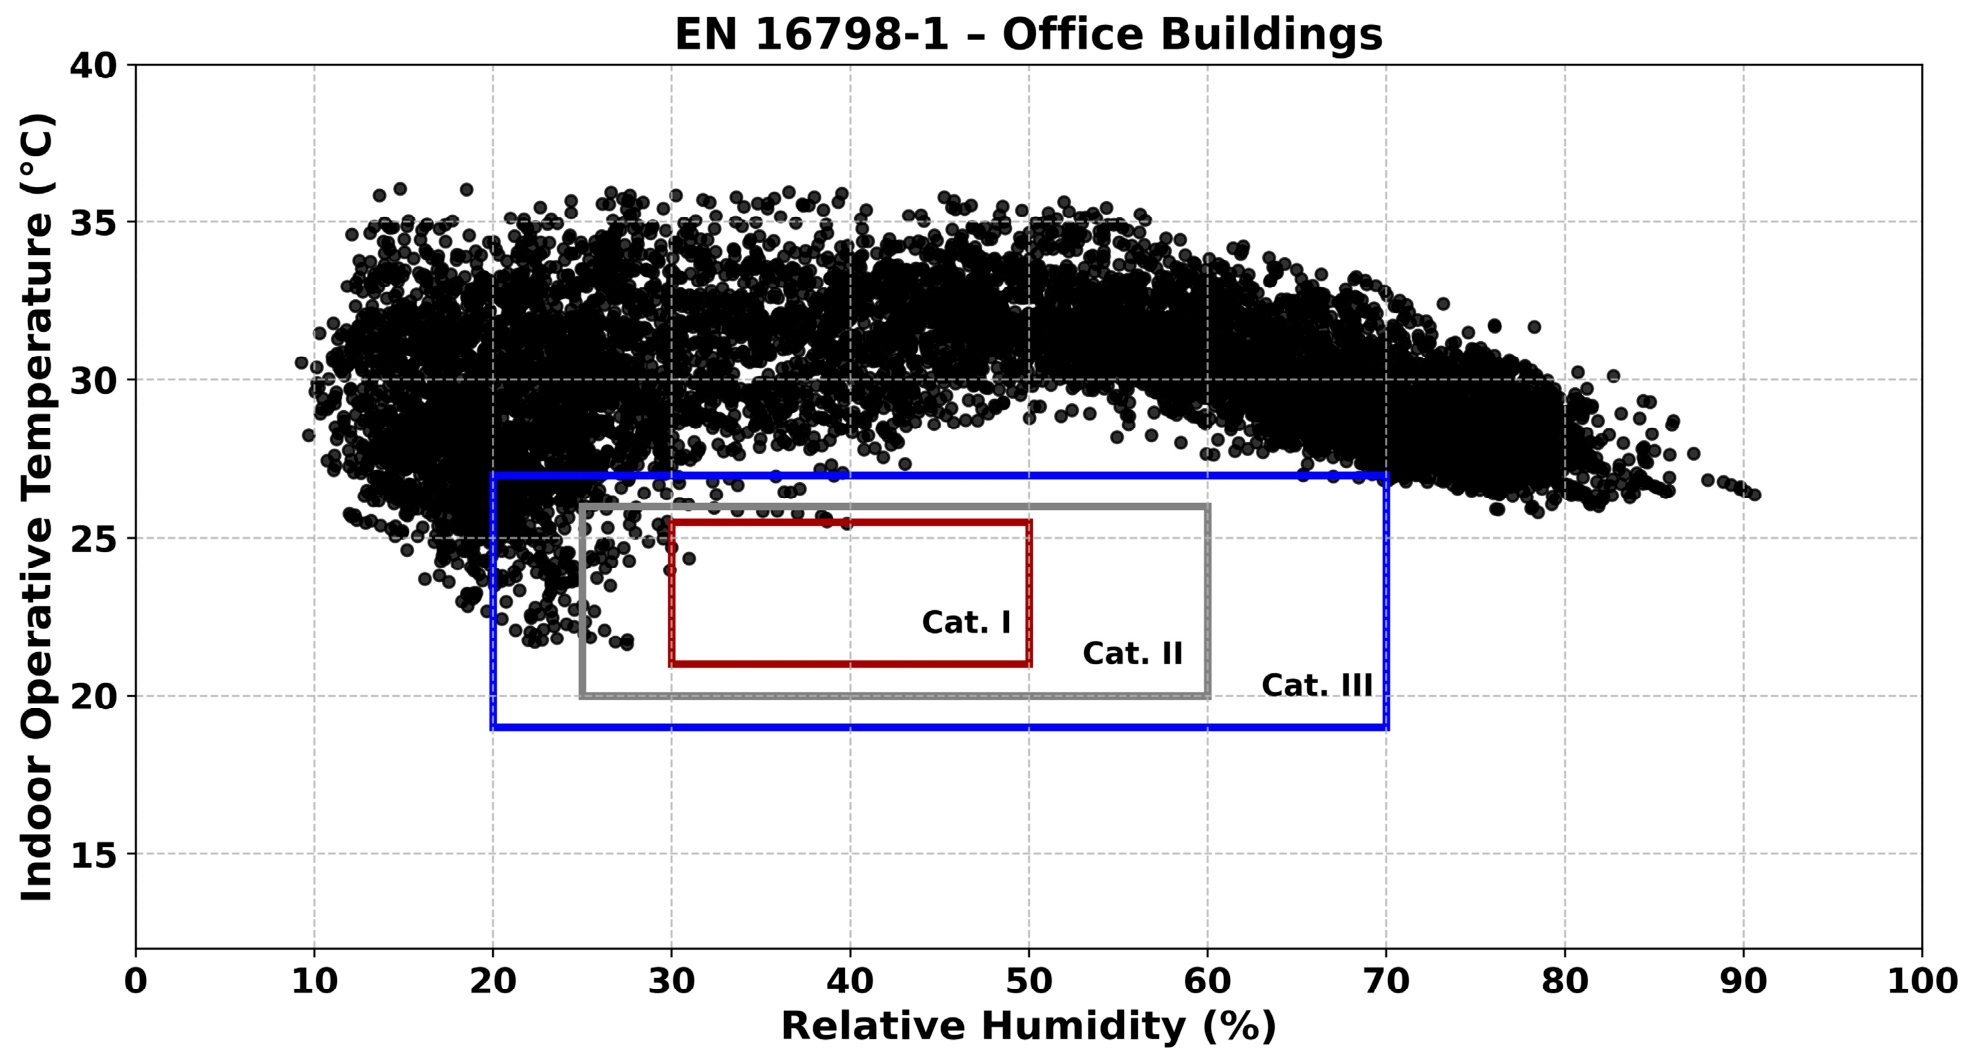
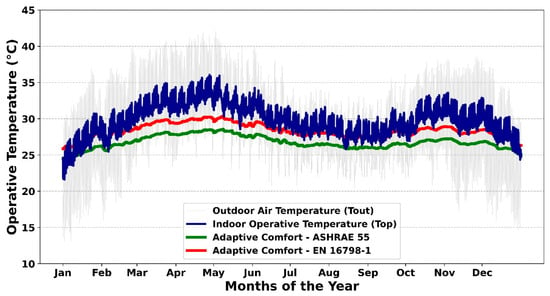
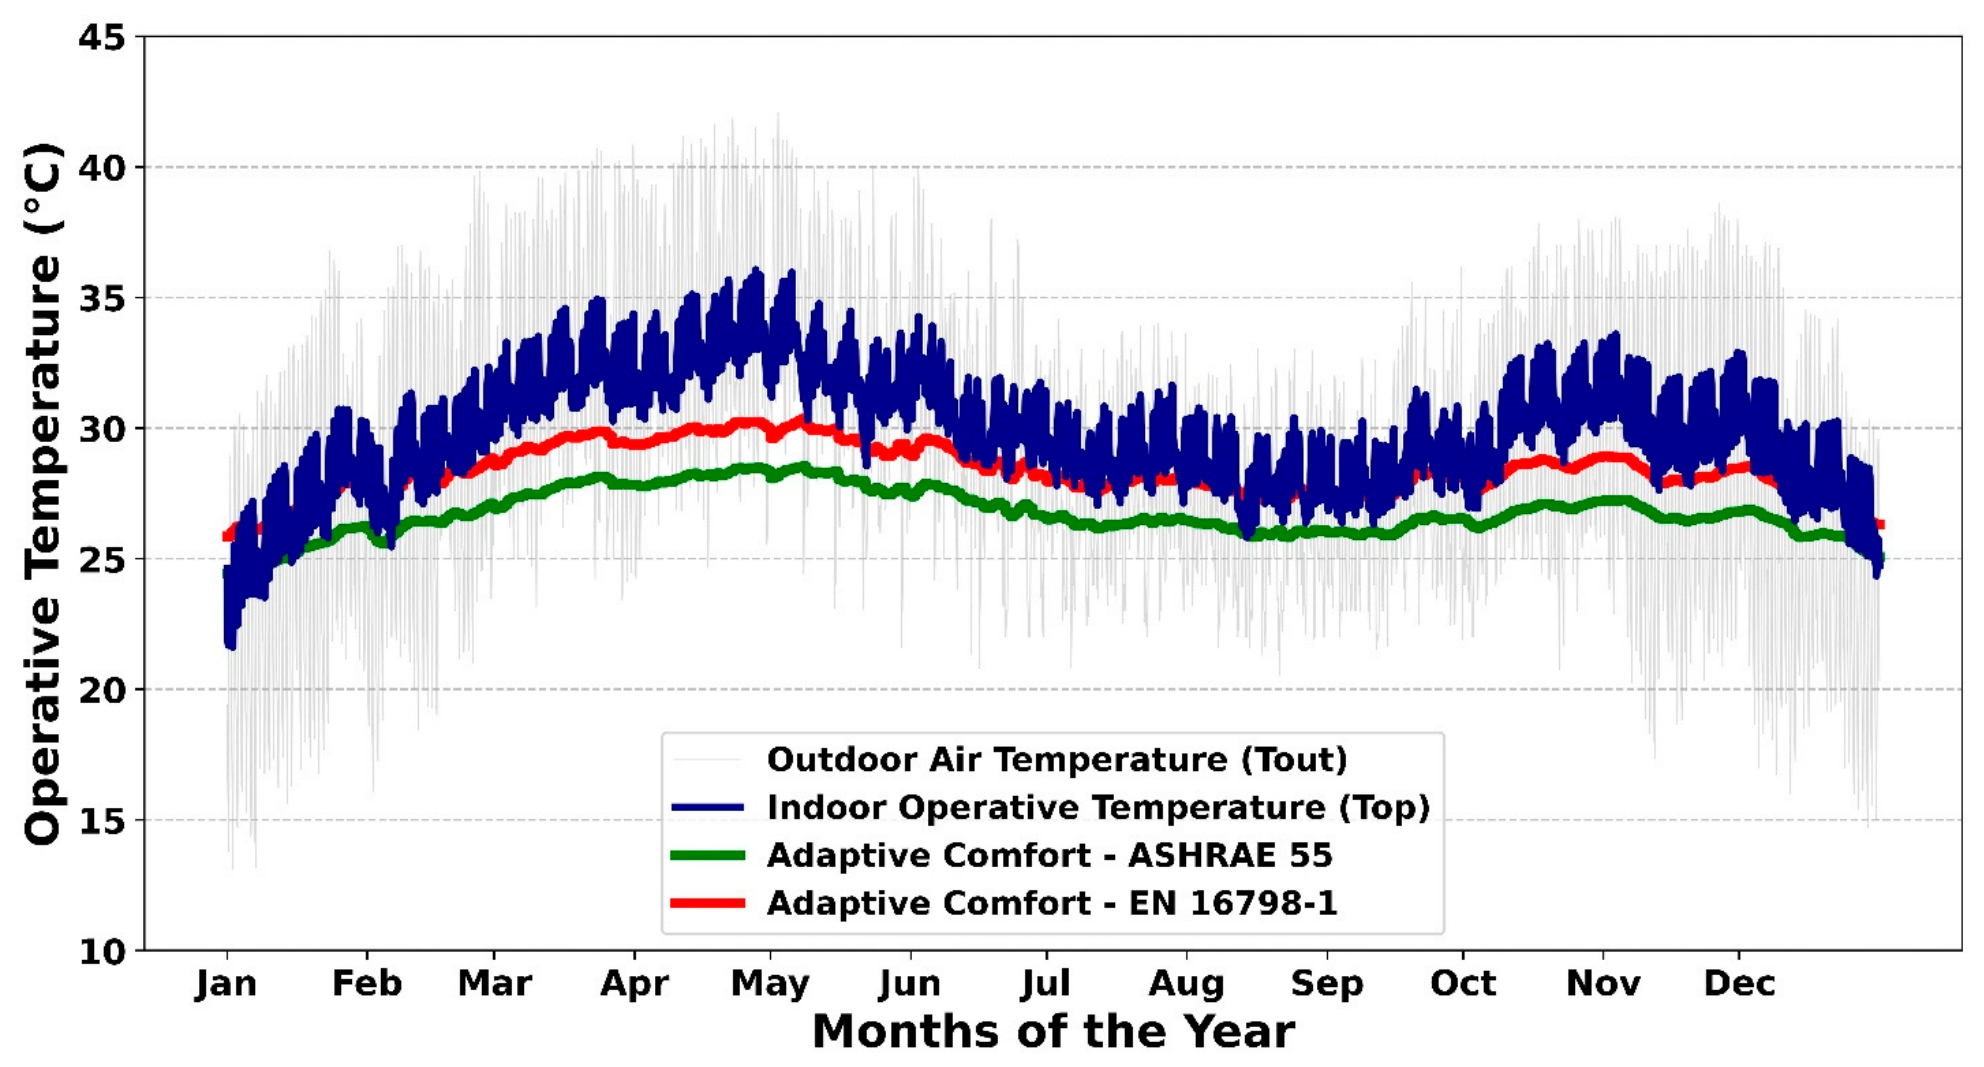
Figure 6 compares hourly outdoor air temperature, indoor operative temperature (Top), and the adaptive comfort reference temperatures derived from ASHRAE-55 and EN 16798-1 over the year for the Ouagadougou climate. Outdoor temperature exhibits strong short-term and seasonal variability, with pronounced peaks during the hot season. In contrast, indoor operative temperature shows a smoother profile, indicating the moderating effect of building thermal mass and operation, although it remains consistently high throughout most of the year. Both comfort models follow the seasonal trend of outdoor conditions, but ASHRAE-55 systematically predicts lower neutral operative temperatures than EN 16798-1. EN 16798-1 therefore allows a wider acceptable temperature range and is more permissive than ASHRAE-55 in this climate. Both models are adaptive in nature; however, they differ in their formulation and in the resulting width of the comfort band. Also, Figure A2 (Appendix B.2) compares hourly indoor operative temperature and relative humidity in office buildings in Ouagadougou with three thermal comfort categories. The indoor conditions form a dense horizontal cloud, indicating large humidity variability (~15–85%) but a much narrower temperature range (~24–33 °C). This shows that, in this climate, operative temperature is the dominant driver of thermal conditions, while humidity plays a secondary role. Most data points lie outside the central comfort envelopes, particularly above the upper temperature limits defined by static comfort models such as EN 16798-1. Even when relative humidity falls within acceptable ranges, operative temperatures often exceed comfort thresholds, underscoring the limited applicability of static humidity-temperature criteria in hot climates. More permissive comfort models capture a larger share of observed conditions, suggesting that adaptive comfort approaches better reflect realistic indoor environments and occupant expectations in Ouagadougou. This indicates that ASHRAE-55 better reflects thermal expectations in hot climates such as Ouagadougou, whereas EN 16798-1 appears more conservative and may overestimate comfort when applied without regional adaptation [48].
Figure 6.
Comparison of two adaptive comfort models (ASHRAE-55 and EN 16798-1) for the climate of Ouagadougou: hourly outdoor air temperature (Tout), indoor operative temperature (Top), and adaptive comfort reference temperatures over the year 2023.
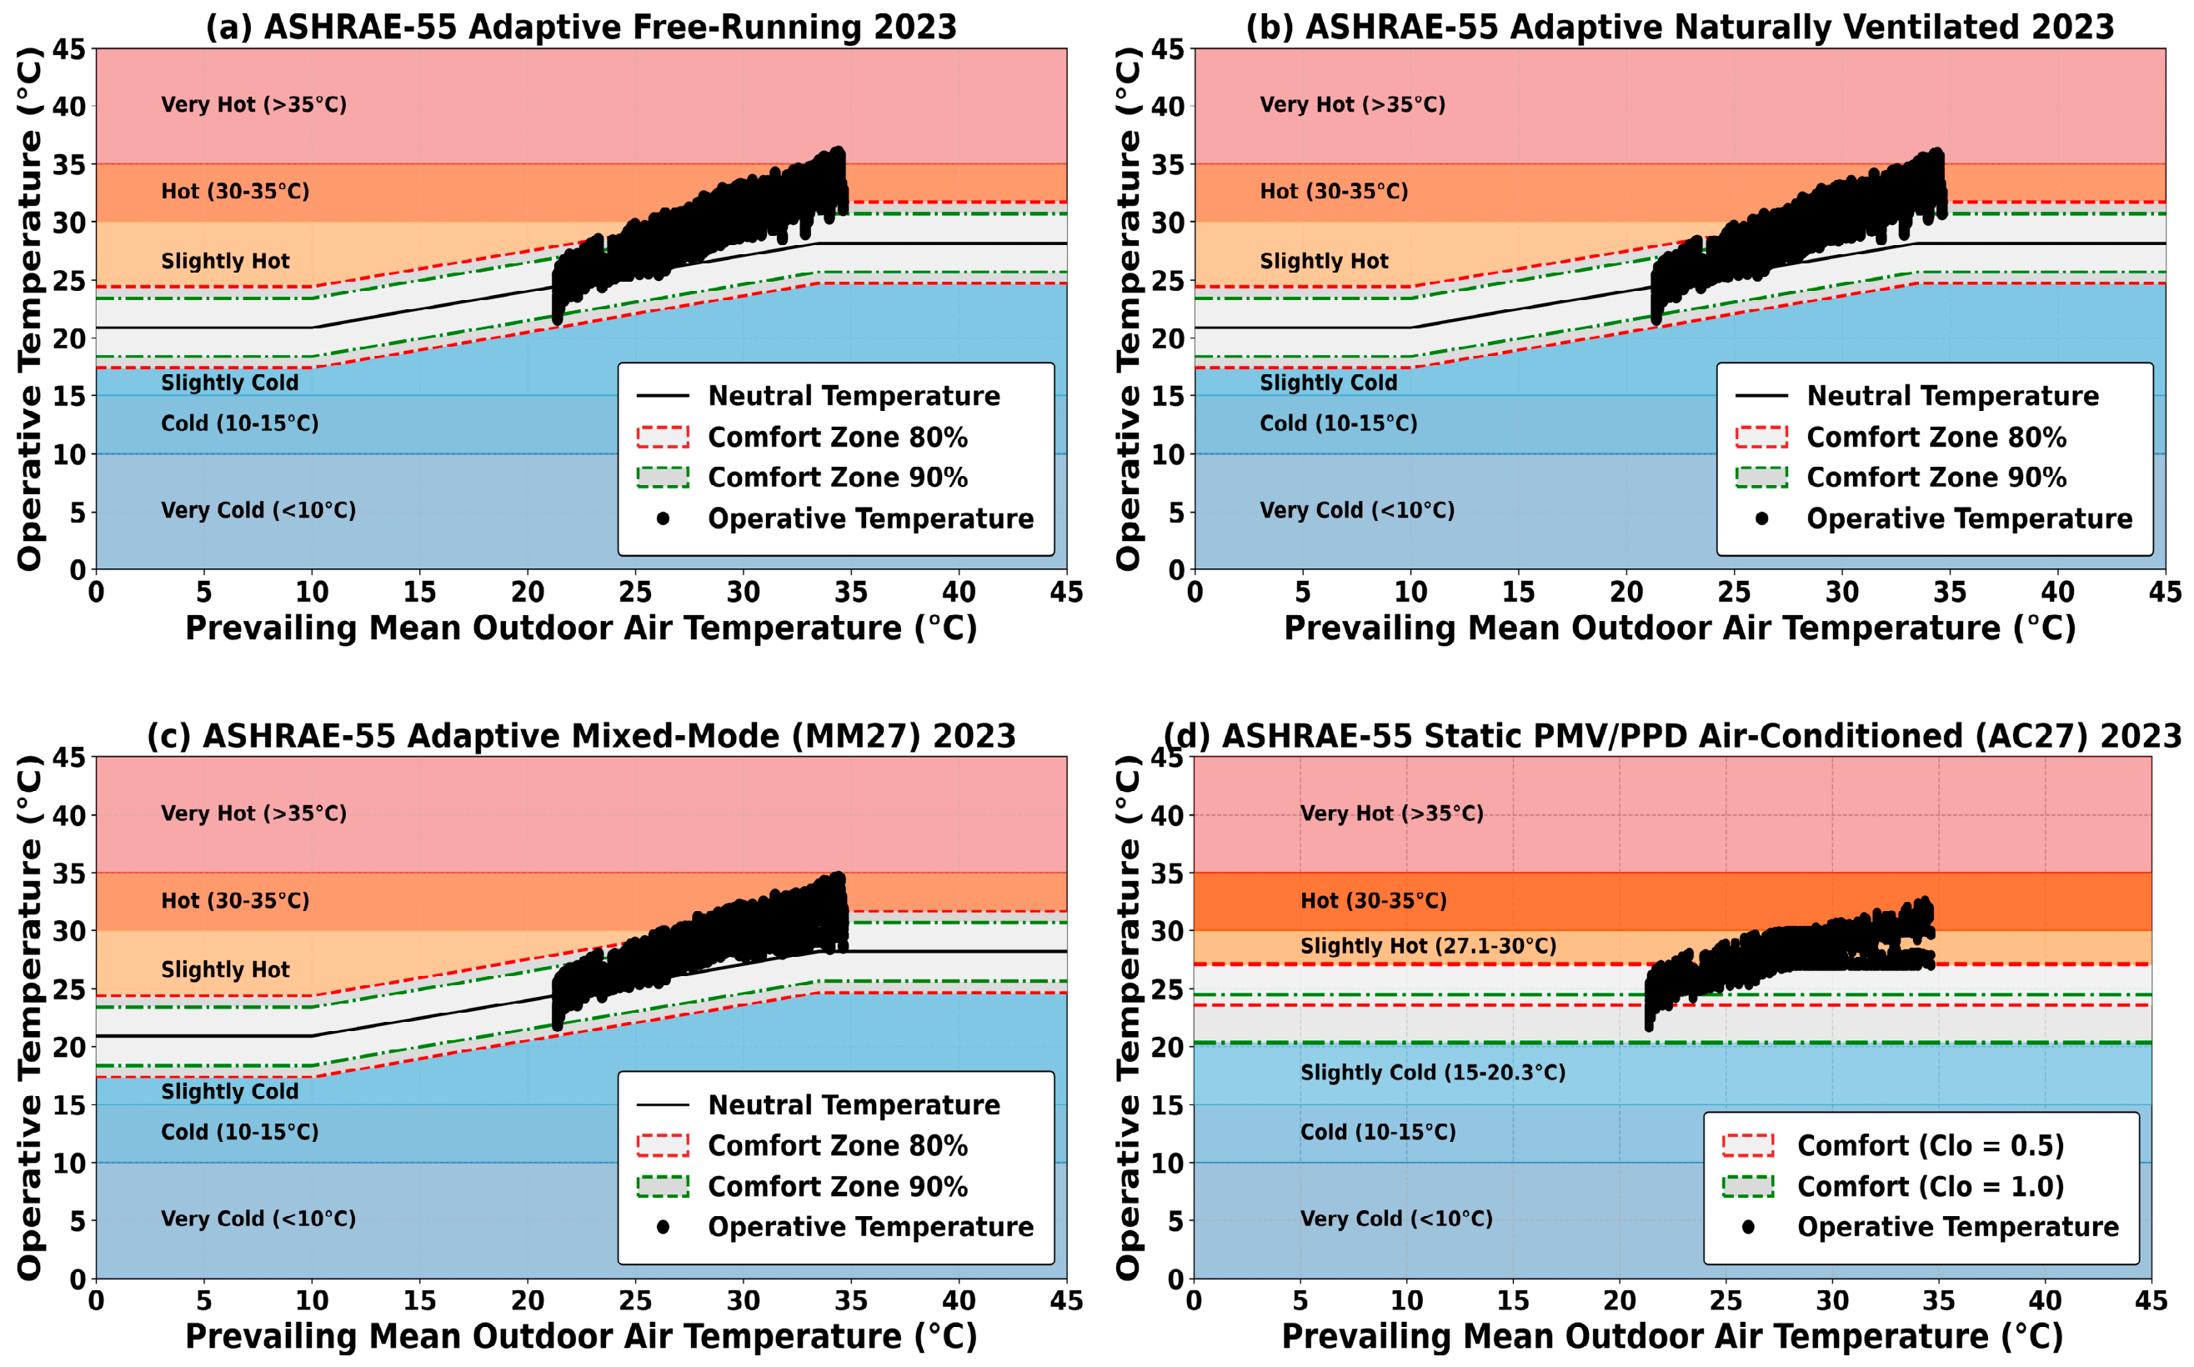
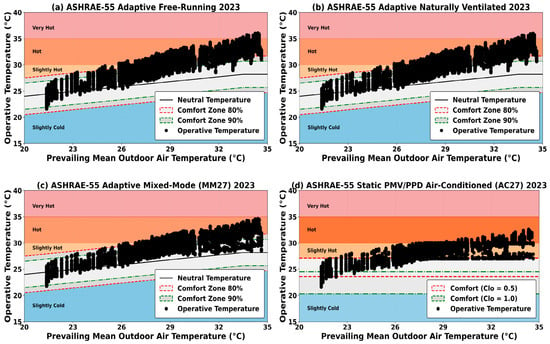
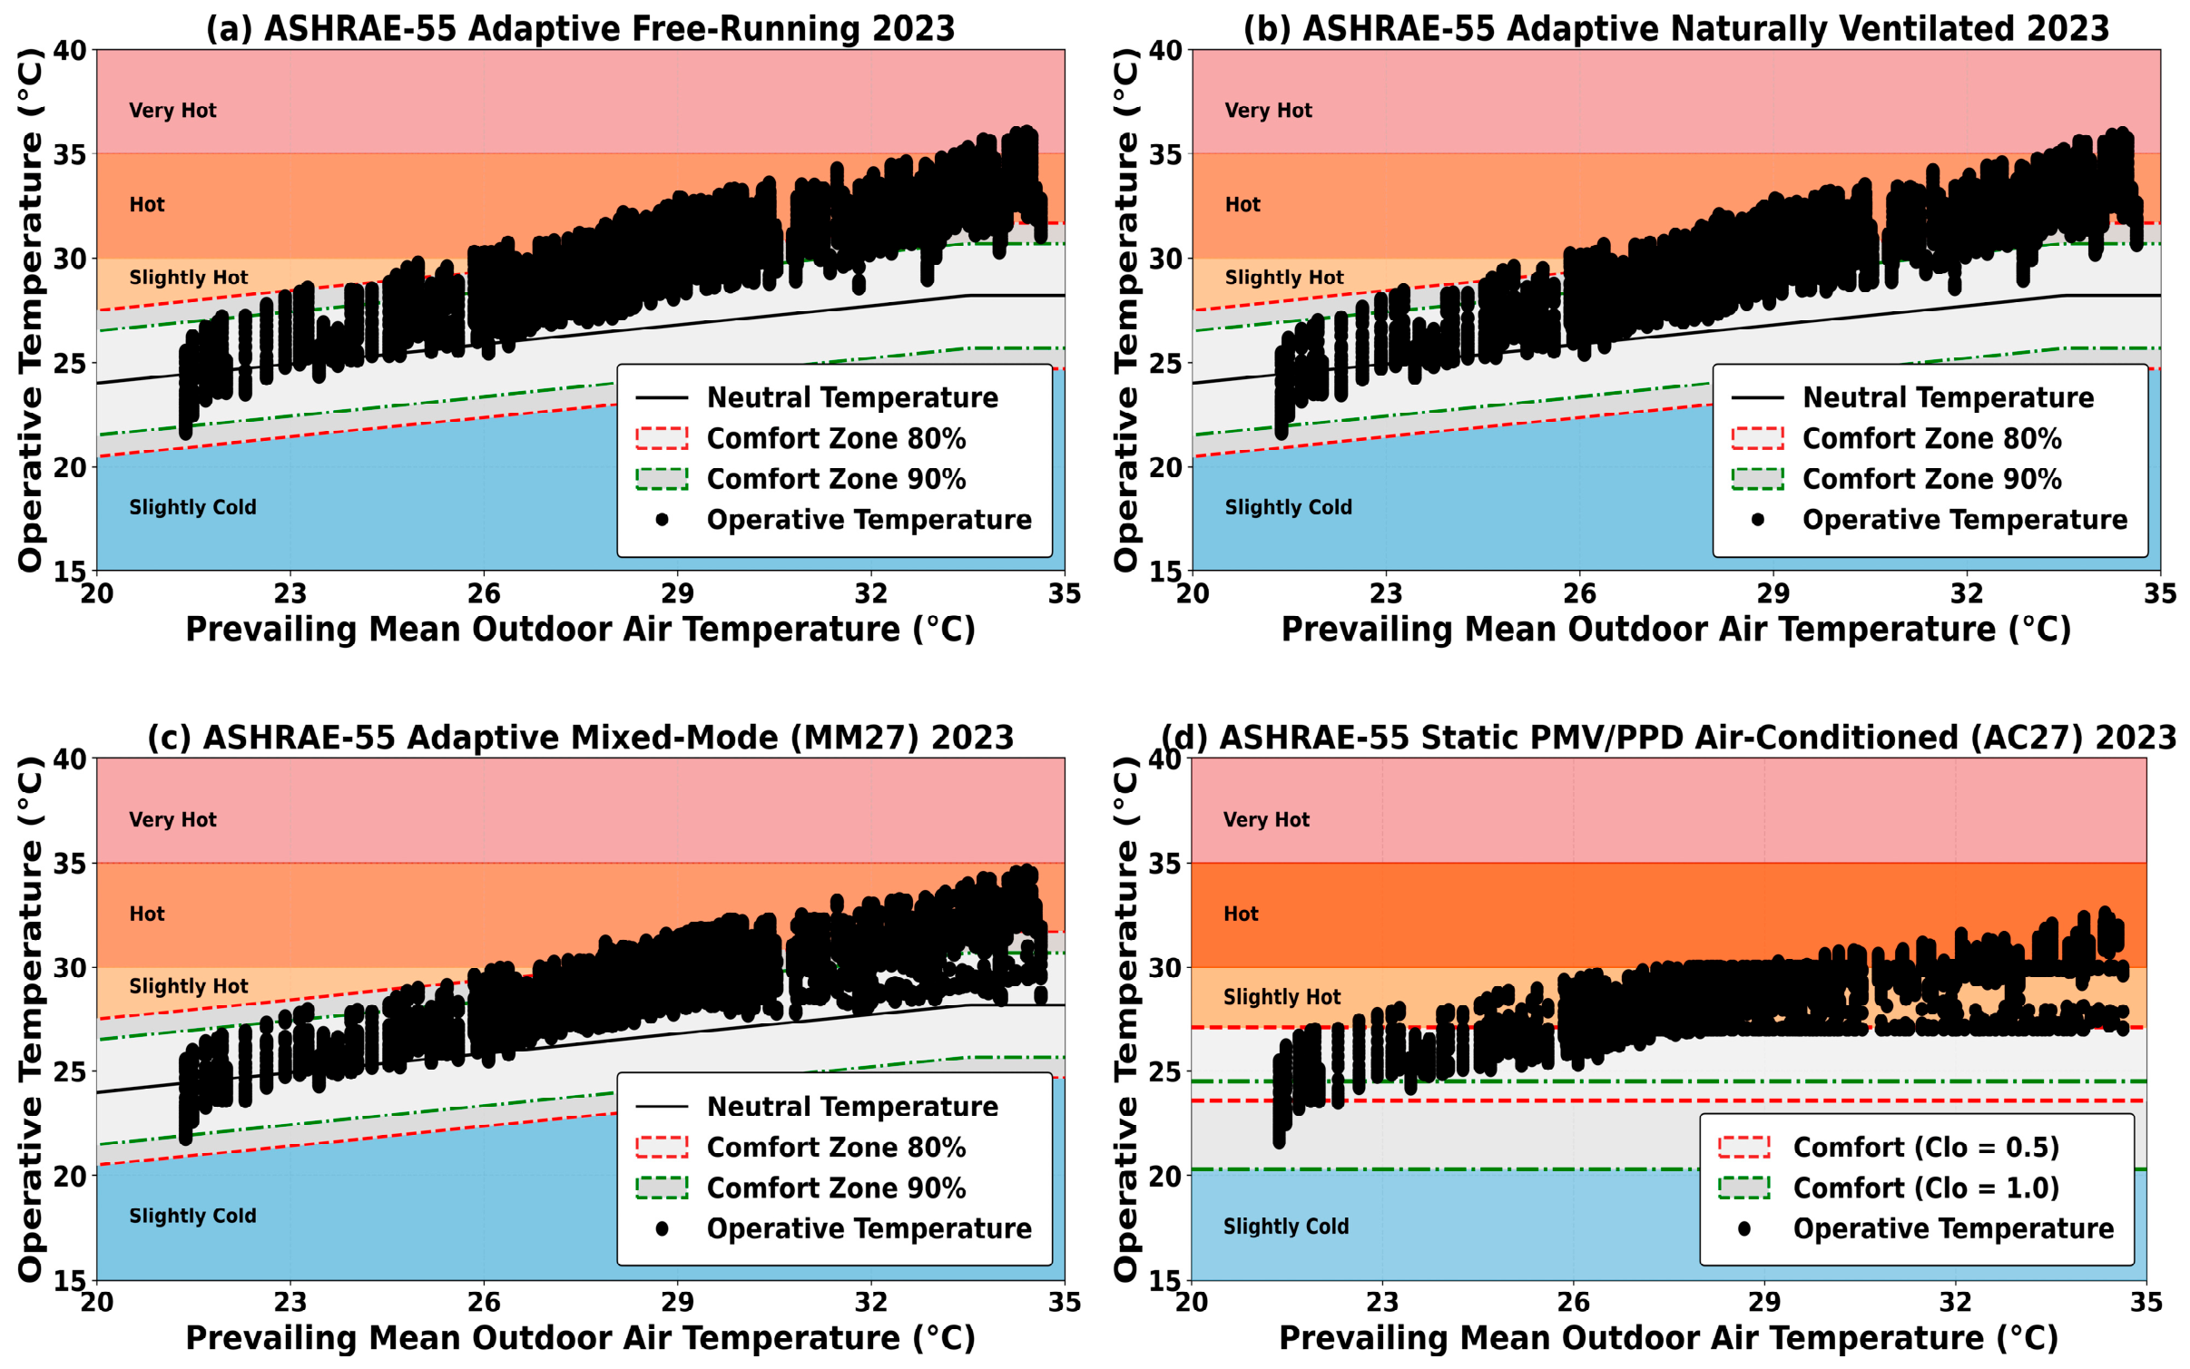
Figure 7 compares the relationship between indoor operative temperature (Top) and the prevailing mean outdoor temperature (Tpma,out) across four operational scenarios, according to the ASHRAE-55 adaptive framework in zoom mode. The full representation is shown in Figure A3 (Appendix B.3). In the free-running (FR) and natural ventilation (NV) cases, indoor operative temperatures closely follow outdoor conditions, with Top increasing from approximately 24–26 °C to approximately 33–36 °C as Tpma,out rises from ~22 °C to ~35 °C. In these two passive modes, most data points remain within or slightly above the 80% adaptive comfort zone, with occasional excursions toward the upper 90% boundary, particularly when Tpma,out exceeds 32 °C. The mixed-mode (MM) configuration exhibits a similar adaptive trend but with a slightly reduced dispersion of Top (~25–35 °C), indicating partial thermal regulation through intermittent mechanical cooling. In contrast, the air-conditioned (AC) scenario shows a markedly different pattern: indoor temperatures are largely decoupled from outdoor conditions, remaining concentrated between 25 and 29 °C despite outdoor temperatures reaching ~36–38 °C. This clustering reflects the control imposed by mechanical cooling and aligns with the static PMV-based comfort band defined for conditioned spaces.
Figure 7.
ASHRAE-55 adaptive (FR, NV, MM) and static (AC) comfort evaluation of indoor operative temperature (2023).
3.2. Annual Simulated Discomfort Hours
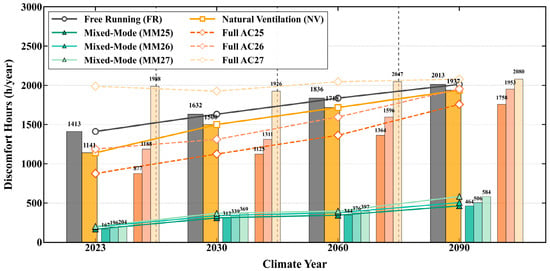
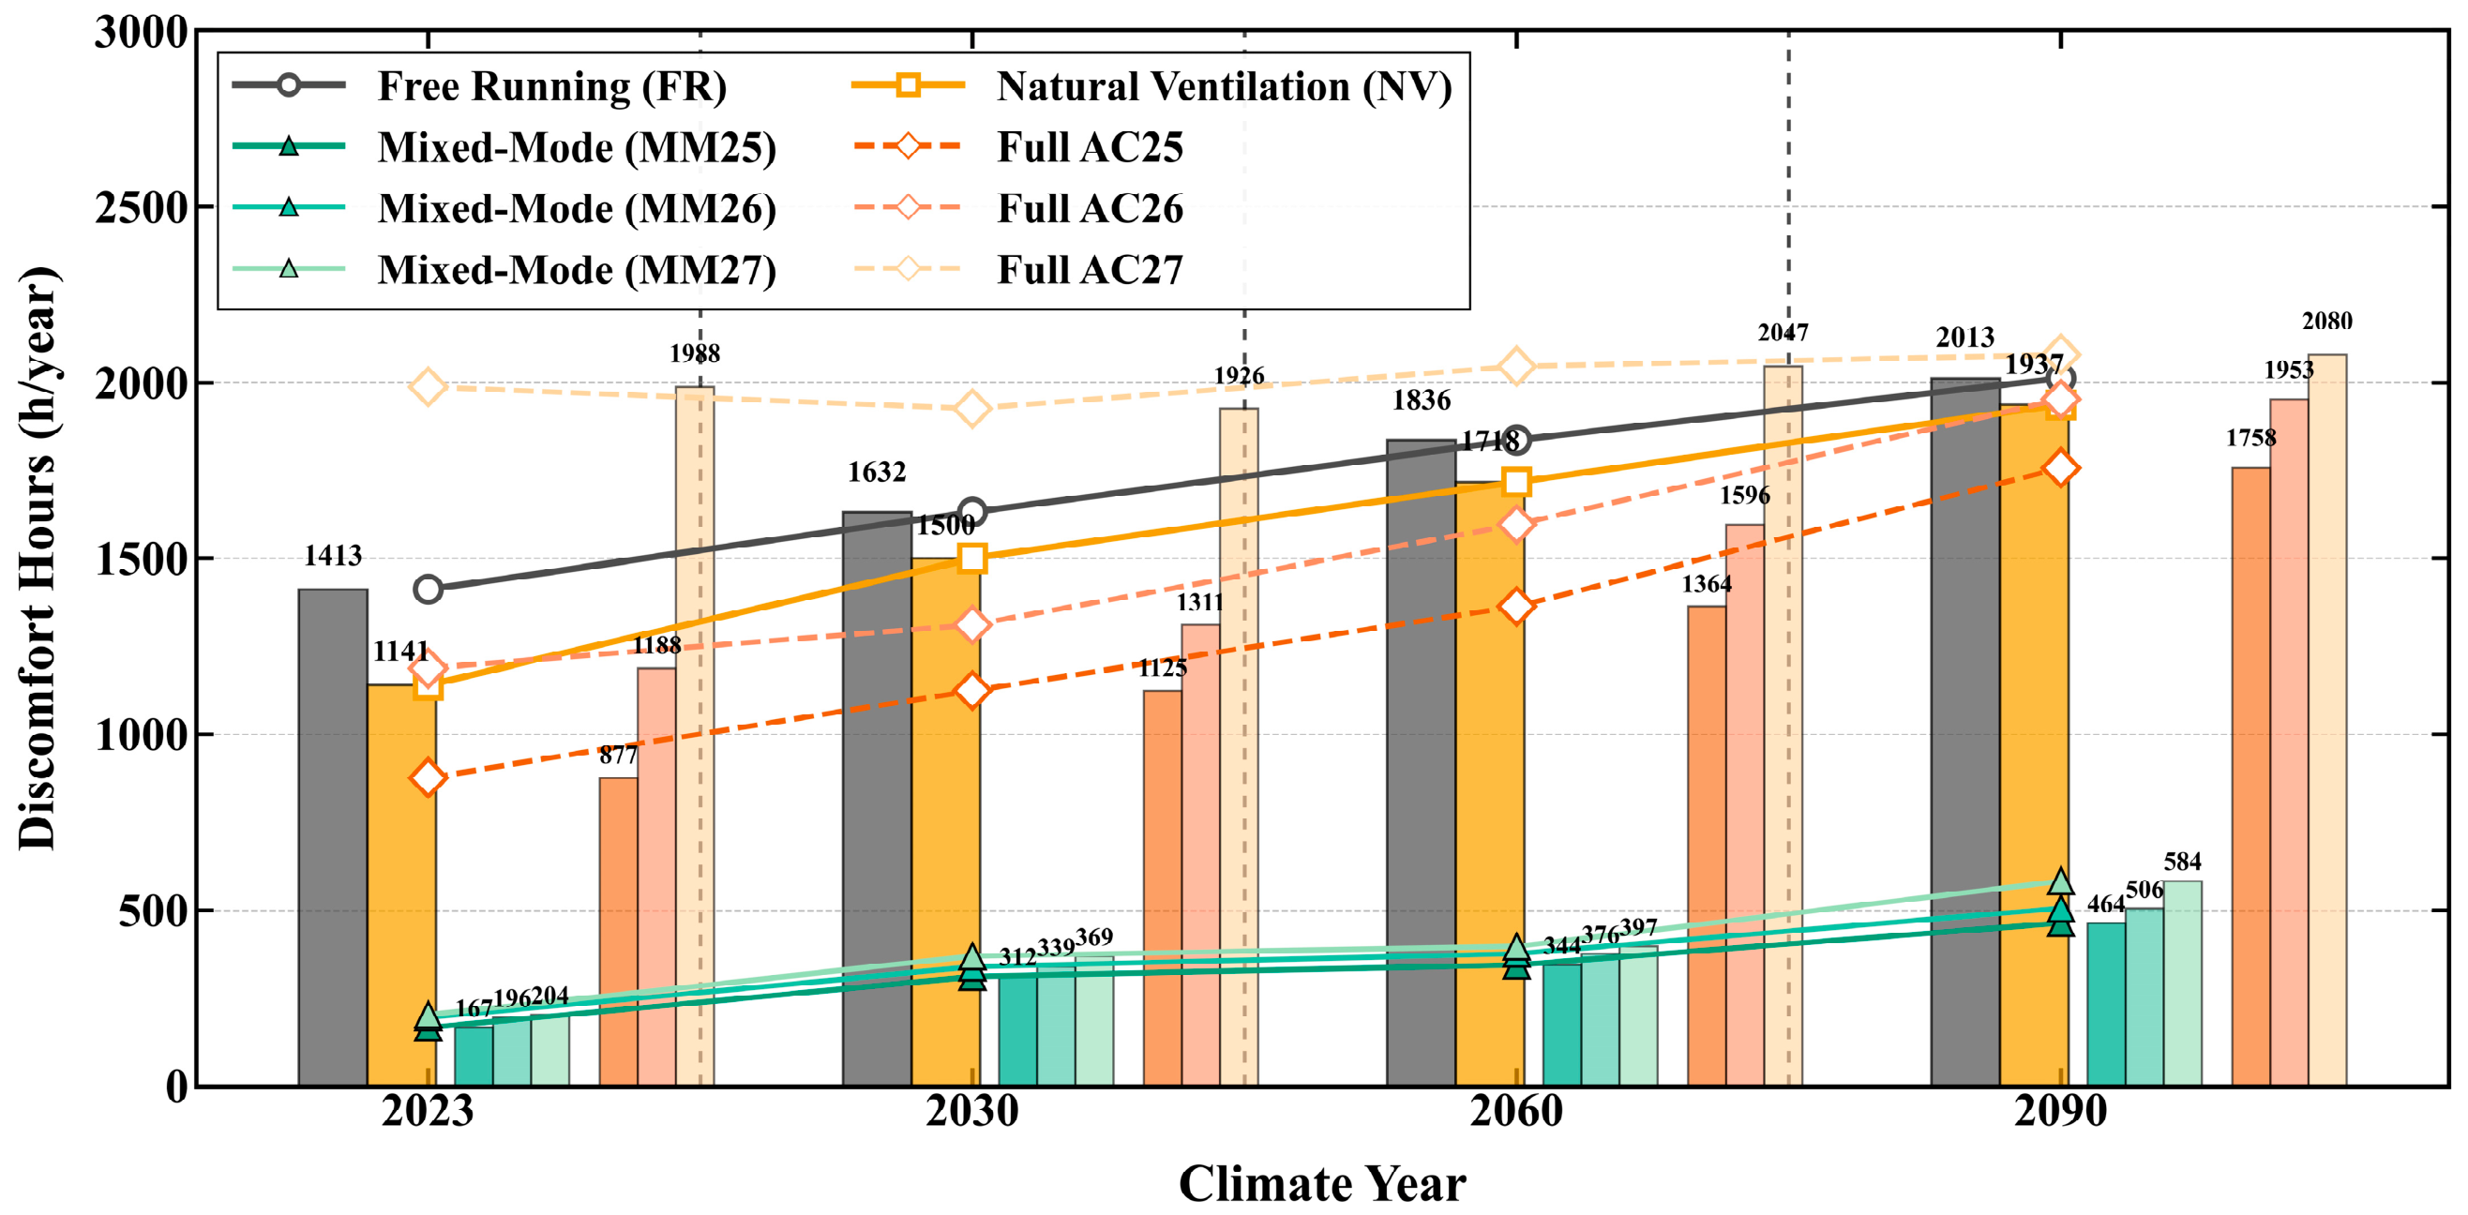
Discomfort hours were calculated using Equation (3). Figure 8 and Table A2 (Appendix A) show the evolution of thermal discomfort hours under climate change.
Figure 8.
Evolution of thermal discomfort hours under climate change for the four operational strategies across current and future weather under RCP8.5.
The results reveal a strong divergence in thermal discomfort across ventilation strategies and climate horizons, with a consistent amplification under future climate conditions. Under the FR configuration, discomfort rises from 1413 h (67.9%) in 2023 to 2013 h (96.8%) in 2090, representing an absolute increase of 600 h. A similar but slightly moderated trend appears for NV, where discomfort rises from 1141 h (54.9%) in 2023 to 1937 h (93.1%) in 2090, corresponding to a 70% increase in annual discomfort hours. These findings indicate that passive-only strategies progressively lose their capacity to maintain acceptable indoor thermal conditions under future warming.
Mixed-mode strategies substantially improve thermal comfort performance compared with FR and NV scenarios. For instance, MM25 reduces discomfort hours to 167 h/year (8.0%) in 2023, although discomfort progressively increases to 464 h/year (22.3%) by 2090. Similar trends were observed for MM25 and MM27. Nevertheless, even in 2090, mixed-mode configurations maintained considerably lower discomfort levels than fully naturally ventilated cases. Among mixed-mode scenarios, increasing the cooling setpoint from 25 °C to 27 °C slightly increased discomfort hours (from 464 h to 584 h in 2090) but significantly reduced cooling energy demand (from 158.5 to 124.7 kWh/m2·year in 2090).
In contrast, fully air-conditioned configurations based on the PMV-PPD model exhibited markedly different behaviour. In 2023, AC25 generated 877 discomfort hours (42.2%), while AC27 reached extremely high discomfort levels (1988 h/year, 95.6%). By 2090, AC27 resulted in complete thermal discomfort (2080 h/year, 100%). This demonstrates that elevated cooling setpoints become progressively ineffective under severe future climatic conditions. Although AC25 performed better than AC26 and AC27, discomfort still increased substantially over time, reaching 1758 h/year (84.5%) in 2090.
The high discomfort levels observed for AC27 under PMV-PPD are explained by three main factors. First, at a setpoint of 27 °C, the PMV index under typical office conditions (1.2 met, 0.1 m/s air velocity, 0.5–0.7 clo) is already approximately +0.5 to +0.9, which places the setpoint at or above the upper comfort limit; consequently, hours maintained at the setpoint are counted as discomfort. Second, the PMV-PPD model systematically overestimates discomfort in warm tropical contexts, as confirmed by the comparison with the adaptive evaluation presented below. Third, the combination of a high setpoint with significant internal gains and an uninsulated envelope causes the operative temperature to frequently exceed the PMV comfort limit, potentially leading to unmet cooling load hours under severe future climates.
To enable a fair comparison, fully air-conditioned scenarios were also evaluated using the ASHRAE-55 adaptive model (AC-Adaptive). When both strategies are assessed under the same adaptive metric, AC27 reaches 23.7% discomfort by 2090 (493 h), whereas MM27 reaches 28.1% (584 h). The difference between the two strategies is therefore moderate in comfort terms under a common metric, and the structural advantage of mixed-mode operation is primarily energetic: the EUI ratio between AC and MM ranges from approximately 1.9 to 2.3 across all horizons, indicating that mixed-mode consumes about half the energy of fully air-conditioned operation. In contrast, when AC is evaluated with the static PMV-PPD model (as conventionally applied to mechanically conditioned buildings), discomfort reaches 100% by 2090, whereas the adaptive model predicts only 23.7%. This discrepancy is not directly demonstrated by the simulation alone; field evidence from the occupant survey reported in [4,5] supports the adaptive interpretation, as the mean PMV was consistently higher than the mean thermal sensation vote (TSV) in the case study building, confirming that occupants in Ouagadougou accept temperatures warmer than those predicted by PMV-PPD.
It should nevertheless be emphasised that, although passive modes (FR and NV) become clearly unsuitable by 2090, with discomfort rates above 93%, the discomfort rate of MM27 (28.1%) remains substantially lower than those of FR (96.8%) and NV (93.1%), confirming that mixed-mode operation remains the most robust compromise under late-century warming. However, mixed-mode alone does not ensure acceptable comfort conditions: MM27 still leaves 28.1% of occupied hours outside the adaptive comfort band by 2090, and even the best-performing mixed-mode configuration (MM25) reaches 22.3% under the same conditions.
The progressive contraction of the adaptive ventilation window is quantitatively confirmed by the share of occupied hours with windows open, which declines from 32.8% in 2023 to 20.5% in 2090 (average across MM scenarios). Based on the operational thresholds defined in Section 2.2, the 50% threshold is already crossed in 2023 (32.8%), indicating that the building is already in a transitional regime where mechanical cooling is used more frequently than natural ventilation. The 30% threshold is crossed between 2030 (31.3%) and 2060 (23.5%), marking the point beyond which natural ventilation becomes marginal and mechanical cooling becomes unavoidable. These thresholds are summarised in Table 5.
Table 5.
Operational thresholds for the transition of mixed-mode operation.
3.3. The Influence of Climate Change on Energy Use and CO2 Emissions
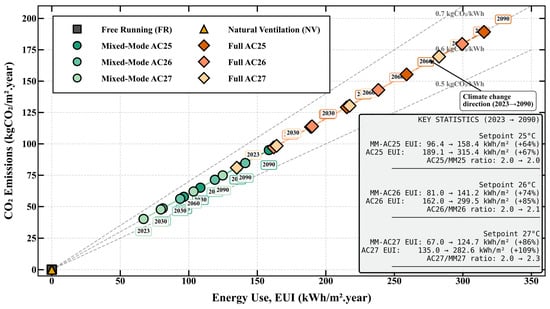
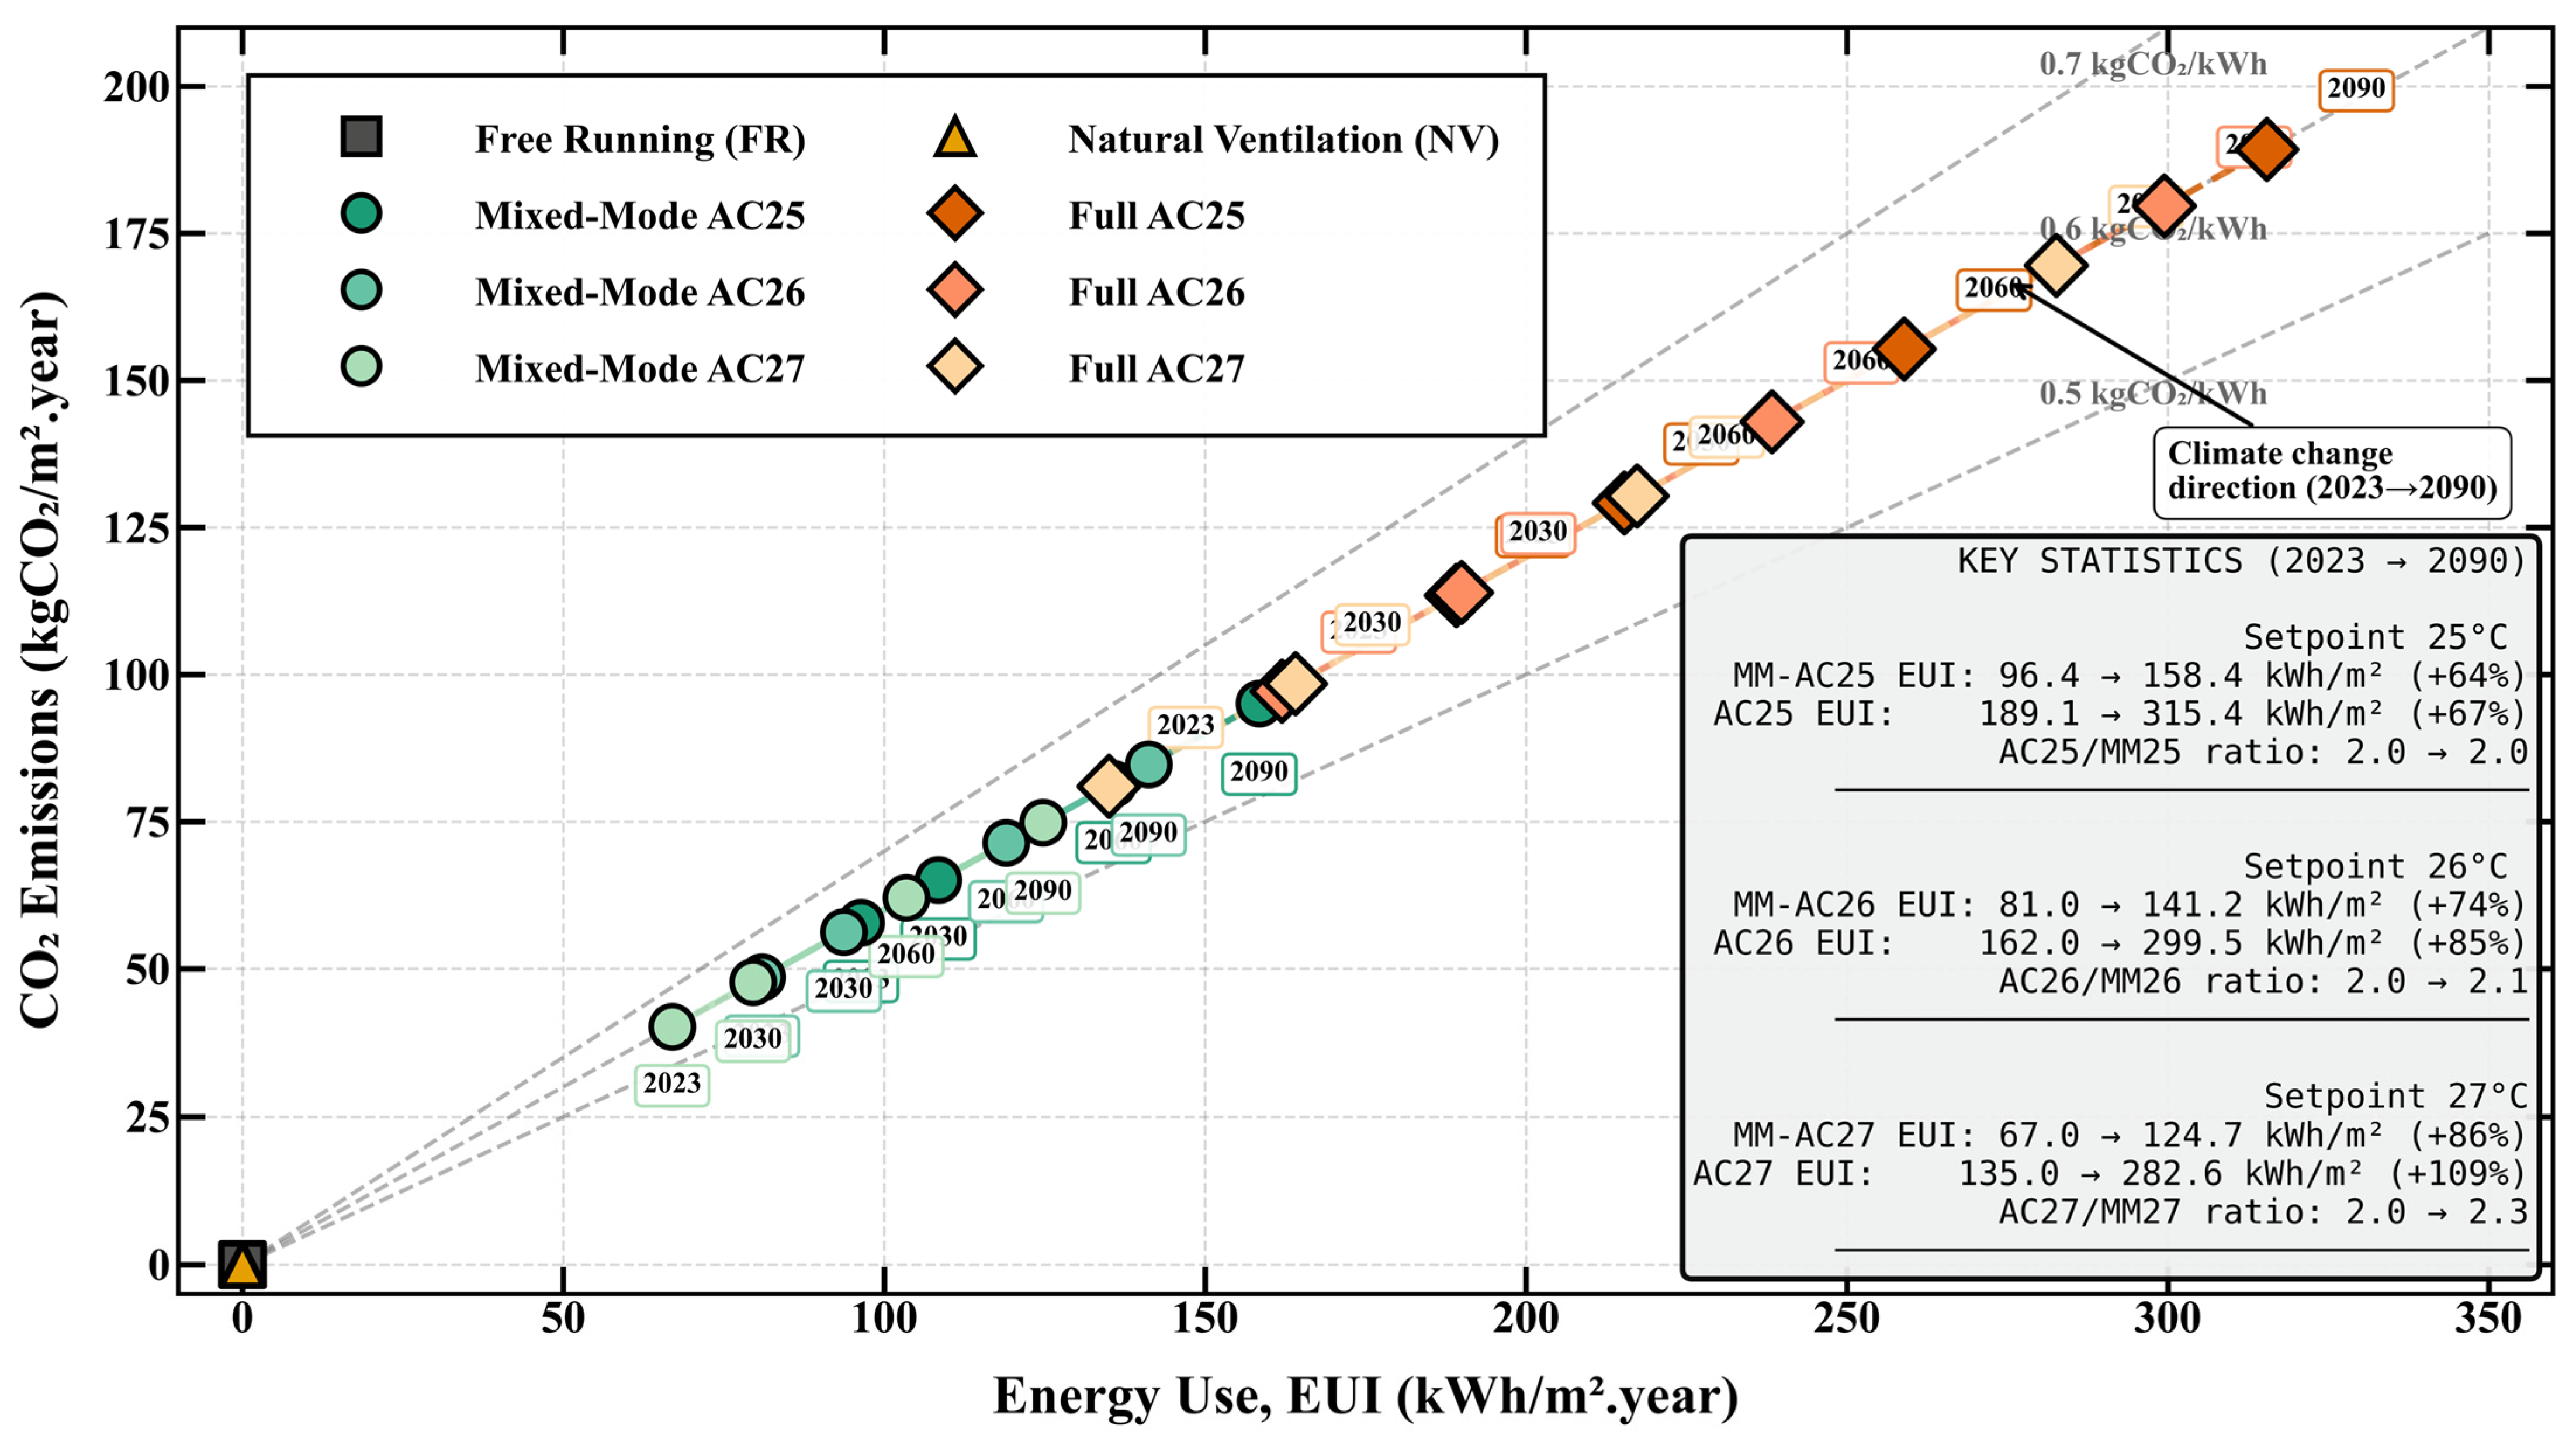
Figure 9 and Table A2 (Appendix A) show the carbon–energy trajectories by operational scenario. Electricity use patterns from the reference building were evaluated using Equation (4). Annual CO2 emissions were estimated by combining the simulated annual energy use with an electricity emission factor representative of the local context. Emissions were normalised by floor area and calculated using Equation (5).
Figure 9.
Relationship between annual cooling Energy Use Intensity (EUI) and operational CO2 emissions (OEI) for the four operational strategies under RCP8.5 across the 2023–2090 horizon.
The results reveal a strong structural contrast between passive, hybrid, and fully conditioned operation modes across the climate horizons. As expected, FR and NV configurations maintain zero operational energy consumption and CO2 emissions throughout all periods (2023–2090), reflecting the absence of mechanical cooling.
Two distinct performance clusters are visible. Mixed-mode strategies (MM25 to MM27) remain systematically located in the low-energy and low-carbon region, whereas fully air-conditioned scenarios (AC25 to AC27) occupy the high-energy and high-emission region. For the 25 °C setpoint, MM25 increases from 96.4 to 158.5 kWh/m2·year (+64%) and from 57.8 to 95.1 kgCO2/m2·year between 2023 and 2090. In comparison, AC25 increases from 189.2 to 315.4 kWh/m2·year (+67%) and from 113.5 to 189.3 kgCO2/m2·year. The AC25/MM25 energy ratio remained close to 2.0 throughout the century, demonstrating the persistent energy advantage of mixed-mode operation.
A similar trend was observed for the 26 °C setpoint, where MM26 consumed 81.0–141.2 kWh/m2·year compared with 162.0–299.5 kWh/m2·year for AC26, with the AC26/MM26 energy ratio remaining close to 2.0. However, the steepest trajectory was observed for AC27, whose energy demand increased by +109% between 2023 and 2090 (135.0 to 282.6 kWh/m2·year), while MM27 increased by +86% (67.0 to 124.7 kWh/m2·year). This indicates that higher cooling setpoints progressively lose effectiveness under severe future climates and that the energy advantage of mixed-mode operation becomes more pronounced by the end of the century. The AC27/MM27 energy ratio remained close to 2.0 in 2023 (2.02) and slightly increased to 2.27 by 2090.
A sensitivity analysis on the electricity emission factor was conducted using the lower (0.5) and upper (0.7) bounds of the Burkinabè range, in addition to the reference value of 0.6 kgCO2/kWh (Table A2, Appendix A). Since OEI = EUI × FE, the sensitivity is strictly linear, and the OEI values vary by ±17% around the reference. Despite this uncertainty, the relative ranking of scenarios is unchanged, and the AC/MM energy ratio (2.27 in 2090) remains independent of the emission factor, confirming the robustness of the mixed-mode advantage.
Across all setpoints, mixed-mode operation reduces energy use by approximately 50% (25 °C) to 56% (27 °C) in 2090 compared with fully air-conditioned operation, confirming the robustness of the mixed-mode advantage under progressive warming. It should be noted that AC27 evaluated with the ASHRAE-55 adaptive model (AC-Adaptive27) is not shown in Figure 9 but in Table A2 (Appendix A); it is discussed only in the text as a comparative device, with an explicit caveat that it falls outside the validity domain of ASHRAE-55. Under the same adaptive comfort model, AC27 reaches 23.7% discomfort by 2090 (493 h), while MM27 reaches 28.1% (584 h), confirming that the structural advantage of mixed-mode operation under the same metric is primarily energetic (EUI ratio ~2.0) rather than comfort-related.
3.4. The Influence of Climate Change on Outdoor and Indoor Temperature
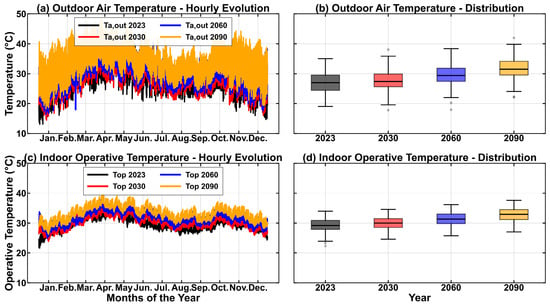
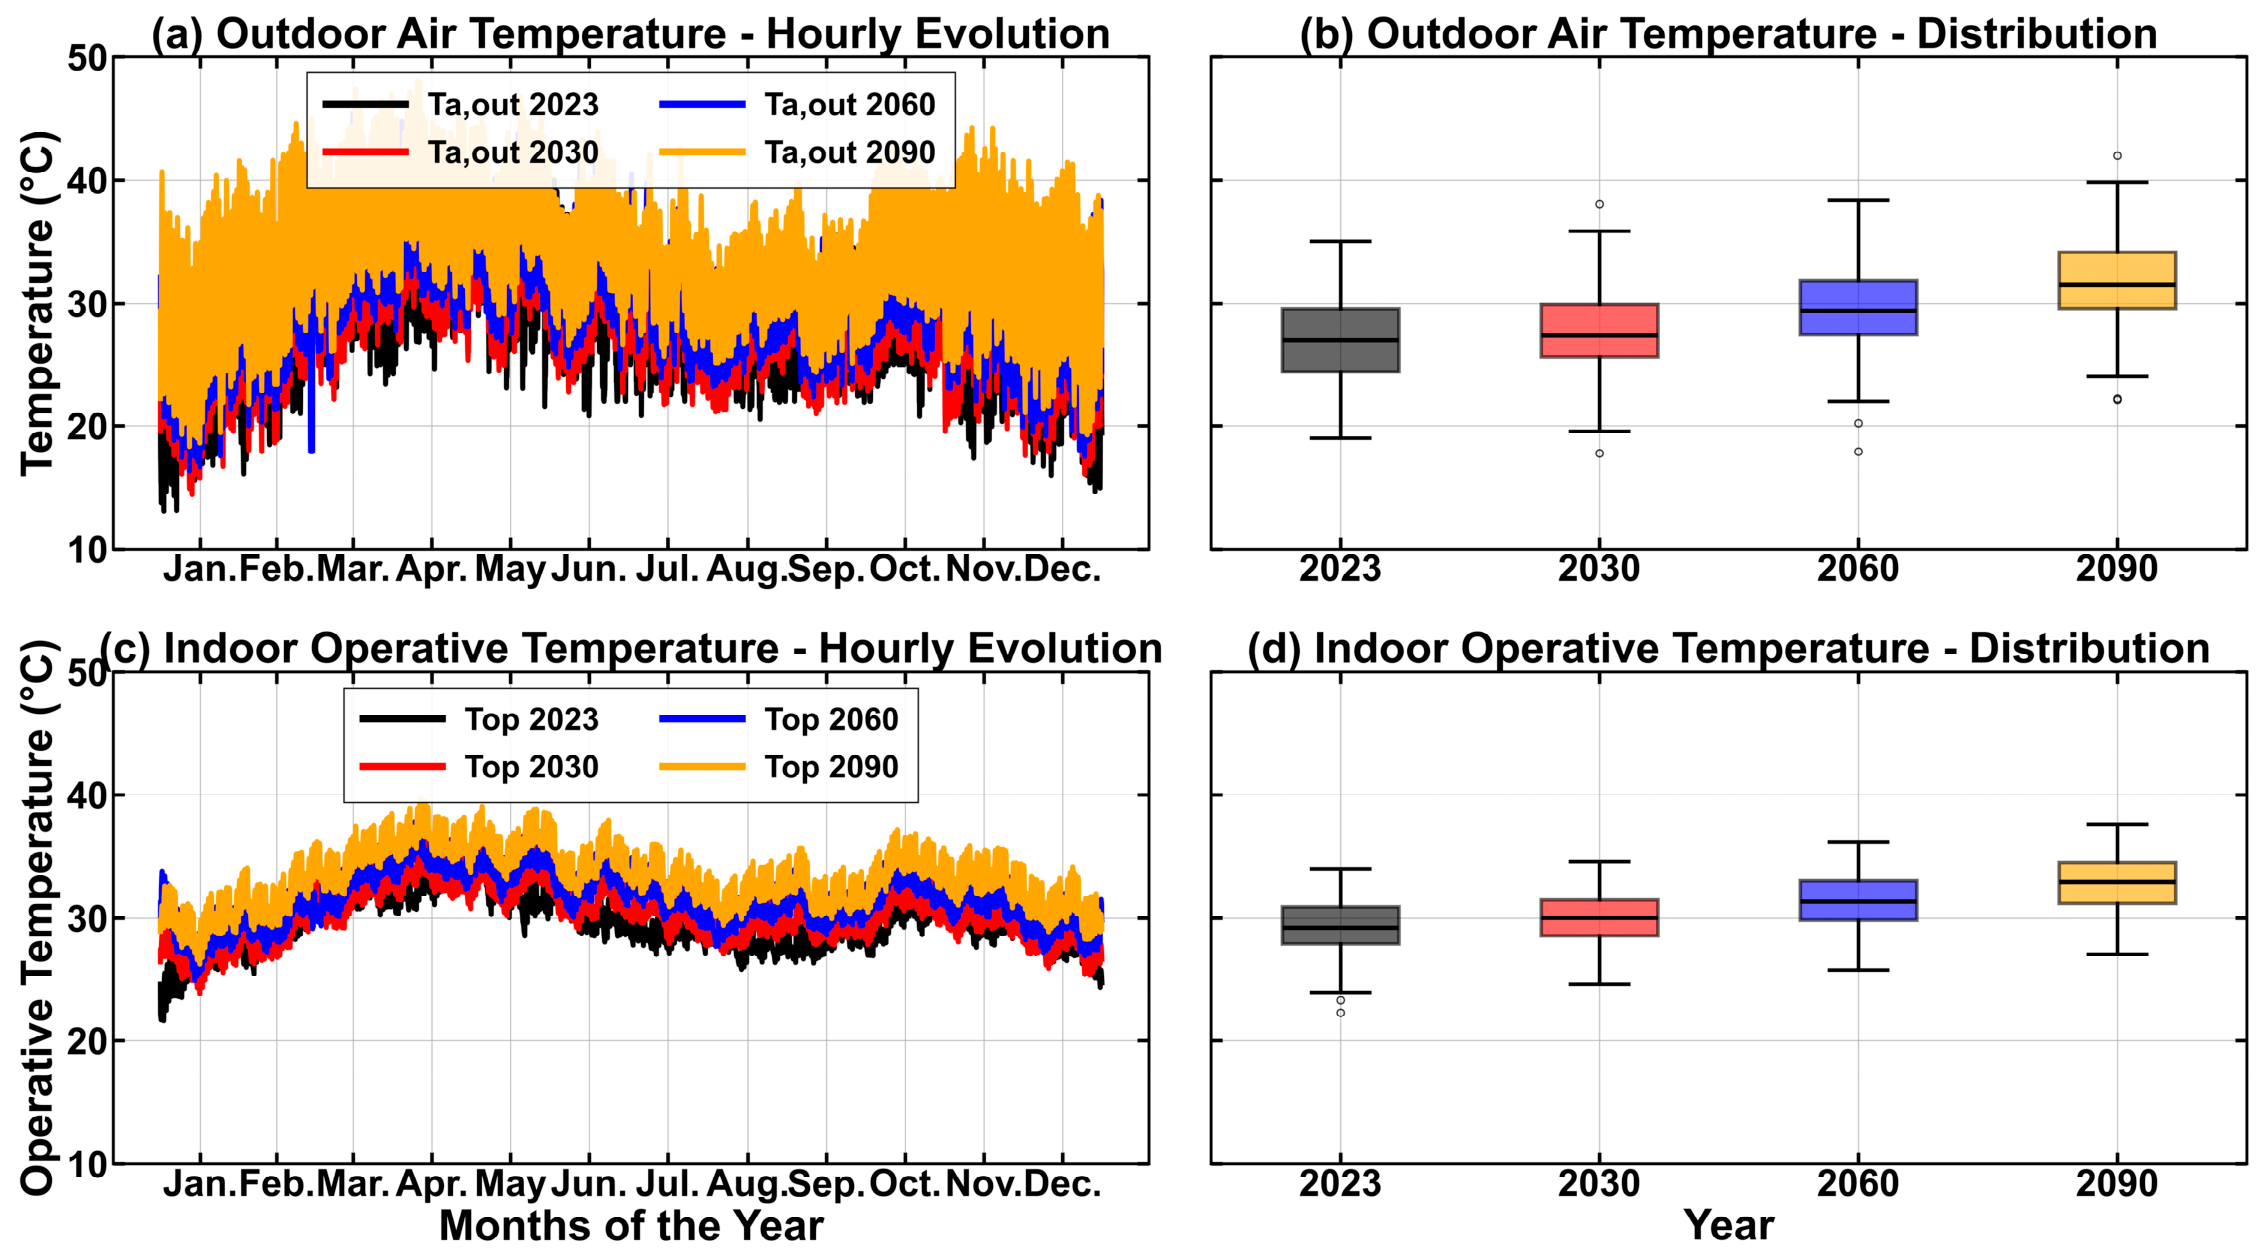
Figure 10, combined with the temperature deviation results, clearly demonstrates a progressive climate-driven warming effect on both outdoor and indoor thermal conditions. For outdoor air temperature (Figure 10a,b), the warming trend is consistent across the future scenarios. The average increase reaches +0.73 °C in 2030, +2.6 °C in 2060, and +4.71 °C in 2090 relative to 2023, corresponding to +3.28%, +9.92%, and +17.42%, respectively. The large maximum deviations (up to +19.53 °C) indicate more intense extreme heat events, even though occasional negative minima reflect intra-annual variability rather than a cooling trend. This outdoor warming is directly transferred indoors, as shown in Figure 10c,d and confirmed by the operative temperature deviations under free-running conditions. The mean indoor operative temperature increases from +0.71 °C (2030) to +2.0 °C (2060) and +3.49 °C (2090), representing relative increases of +2.56%, +6.91%, and +11.82%. Importantly, the minimum ∆Top in 2090 remains positive (+0.69 °C), indicating that indoor conditions are consistently warmer than the baseline year throughout the entire annual cycle.
Figure 10.
Annual hourly evolution and statistical distribution of outdoor air temperature (Ta,out) and indoor operative temperature (Top) across climate horizons (2023, 2030, 2060, 2090) under RCP8.5.
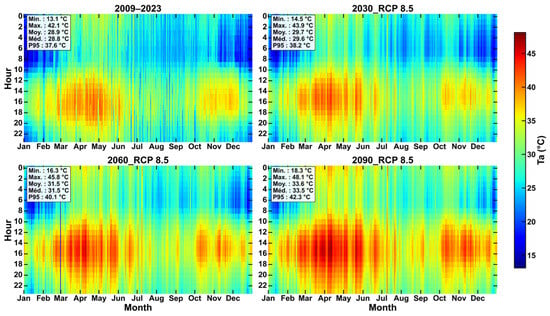
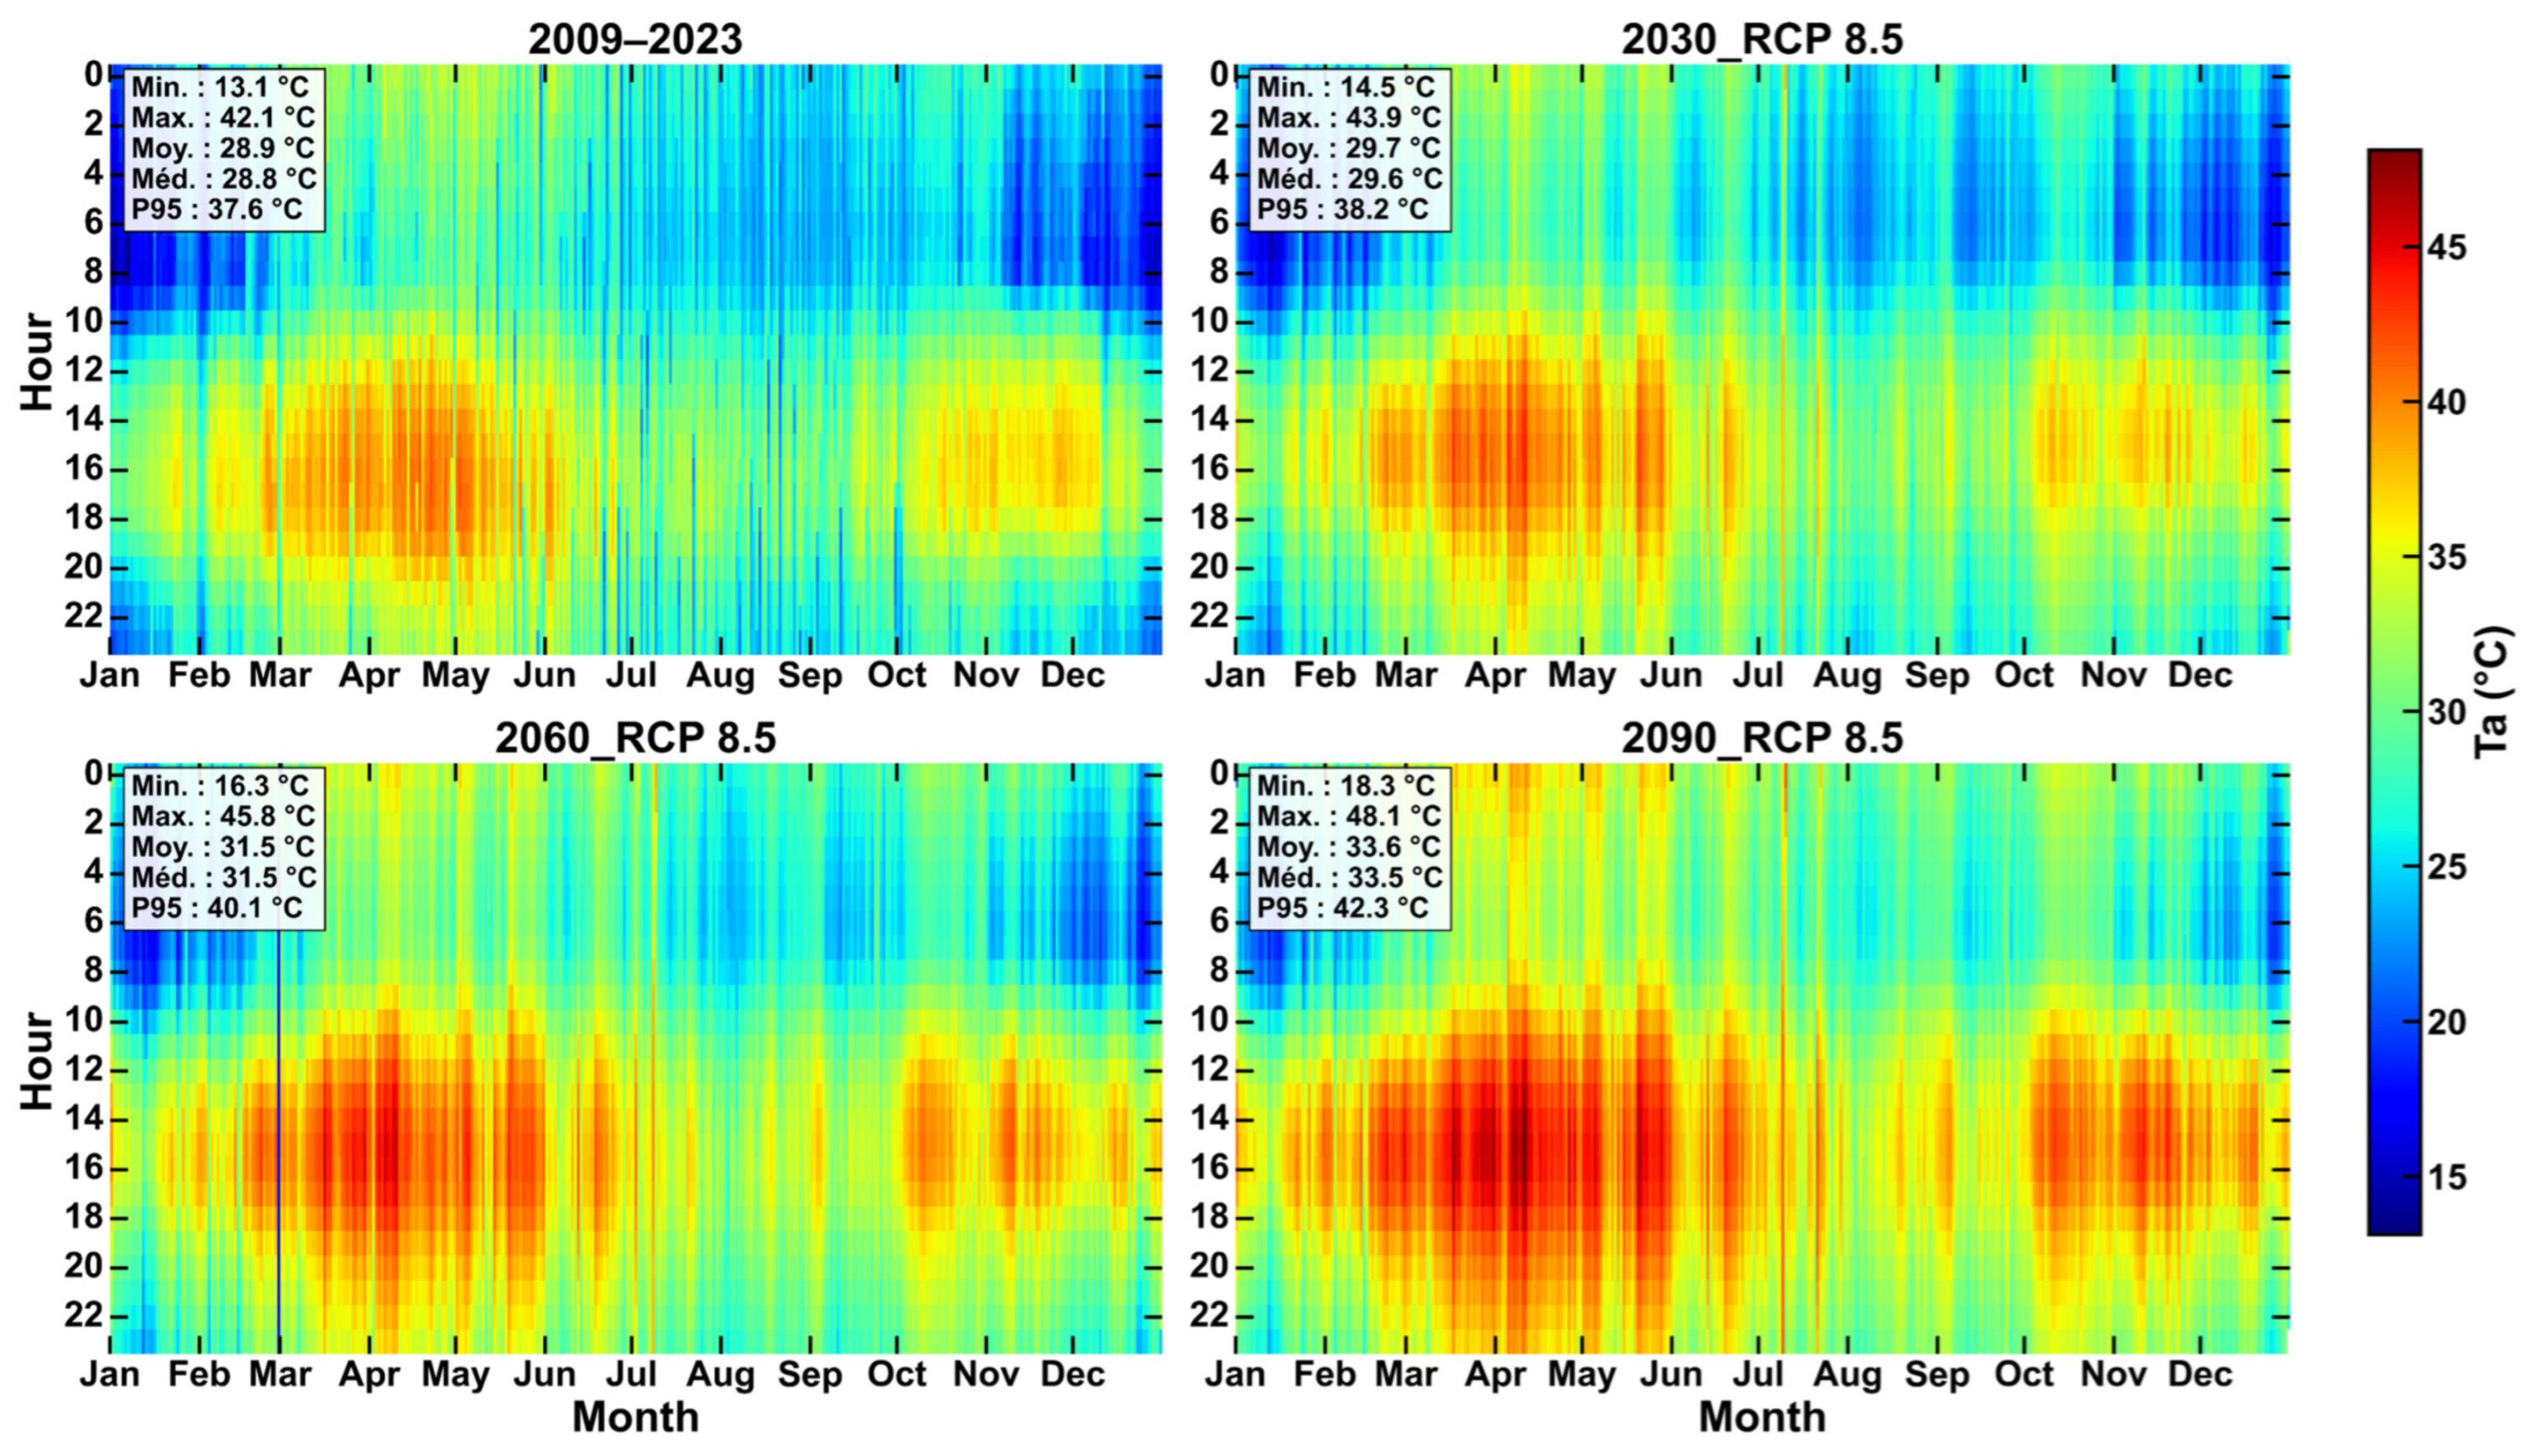
Figure 11 illustrates the heatmap of outdoor air temperature (Ta,out) from the reference period (2009–2023) to 2030, 2060, and 2090 under the RCP 8.5 scenario. A clear warming trend is observed throughout the century, while the seasonal pattern remains largely unchanged. The highest temperatures occur between March and May, whereas relatively cooler conditions persist during the rainy season. The statistical indicators show a substantial increase in outdoor thermal conditions, with the mean temperature rising from 28.9 °C during the reference period to 33.3 °C by 2090. Likewise, the 95th percentile increases from 37.8 °C to 43.5 °C, and maximum temperatures approach 49 °C. The most critical periods occur between approximately 11:00 and 18:00, particularly during March, April, and May, when outdoor temperatures frequently exceed 40 °C. The progressive expansion of warm conditions into the early morning and nighttime hours indicates a reduction in the daily cooling potential available to buildings.
Figure 11.
Heat map of outdoor air temperature in Ouagadougou from 2009 to 2023 and future projections (2030, 2060, 2090) under RCP8.5.
Overall, the heatmaps reveal a clear shift toward longer, hotter, and more persistent overheating periods, particularly during occupied daytime hours. These trends highlight the growing challenge of maintaining thermal comfort in free-running and naturally ventilated buildings and strongly justify the need for adaptive and mixed-mode strategies in future office buildings in Ouagadougou.
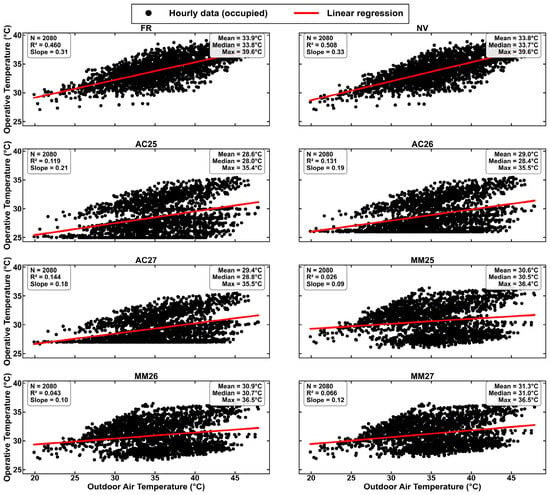
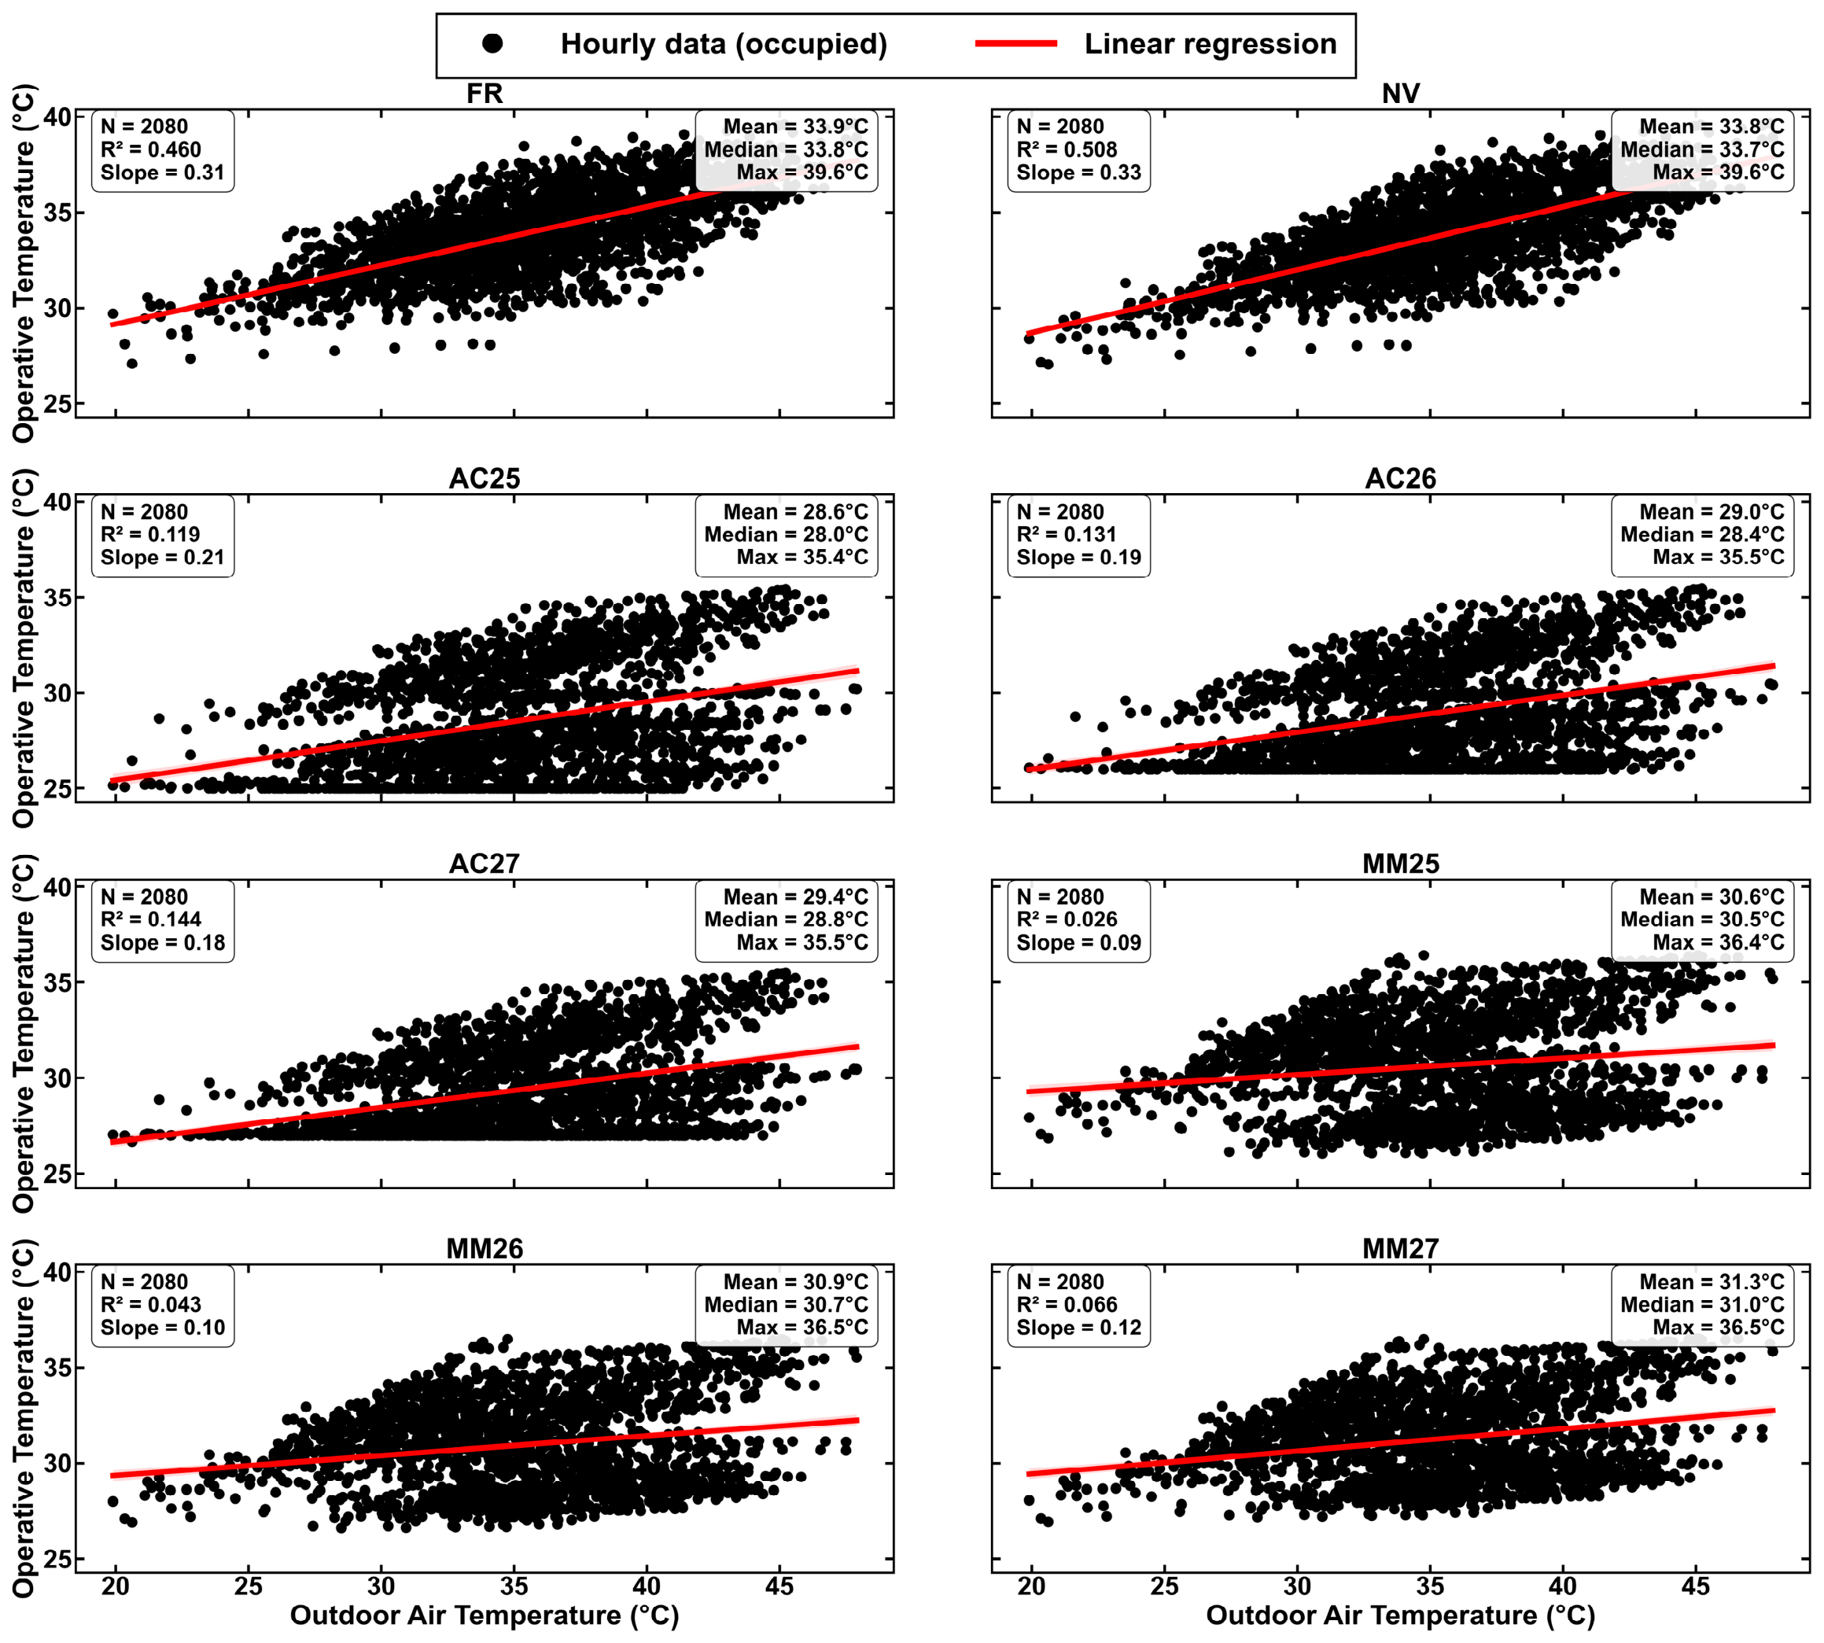
Figure 12 presents the regression analysis between outdoor air temperature (Ta,out) and indoor operative temperature (Top) for the 2090 horizon under RCP8.5, restricted to occupied hours. Passive strategies (FR, NV) show strong correlations (R2 = 0.46–0.51, slope = 0.31–0.33) with a mean Top of around 33.1–33.3 °C, confirming a high sensitivity to outdoor conditions. In contrast, air-conditioned configurations (AC25-27) exhibit very weak correlations (R2 = 0.11–0.19, slope = 0.18–0.20) with a mean Top maintained at 28.6–29.4 °C, demonstrating effective thermal decoupling from the outdoor environment.
Figure 12.
Relationship between outdoor air temperature (Ta,out) and operative temperature (Top) for the 2090 horizon under RCP8.5.
Mixed-mode configurations (MM25-27) show intermediate behaviour (R2 = 0.03–0.14, slope = 0.03–0.18) with a mean Top ranging from 30.6 to 31.3 °C. Unlike the monotonic trend observed in earlier analyses, the correlation strength and slope do not increase strictly with the cooling setpoint across the three mixed-mode variants; instead, MM27 shows a slightly higher slope (0.18) and R2 (0.14) than MM25 and MM26, while MM26 exhibits the weakest correlation (R2 = 0.03, slope = 0.03) and the highest median (31.2 °C), suggesting a non-monotonic response of the mixed-mode strategy to the cooling setpoint under the 2090 RCP8.5 climate. Overall, these findings confirm that mixed-mode operation provides only a partial decoupling from outdoor conditions compared with passive strategies, while remaining substantially decoupled relative to fully air-conditioned operation.
4. Discussion
Results reveal clear differences in thermal comfort performance across scenarios in Ouagadougou’s tropical semi-arid climate. Under present conditions (2023), mixed-mode (MM) strategies substantially outperform free-running (FR) and natural ventilation (NV). FR and NV recorded 1413 h (67.9%) and 1141 h (54.9%) of annual discomfort, while MM25, MM26, and MM27 reduced discomfort to 167 h (8.0%), 196 h (9.4%), and 204 h (9.8%)—aligning with [35] who reported near-balanced conditions under passive operation and confirming adaptive potential observed in Burkina Faso’s hot, dry climate [4,5]. Fully air-conditioned (AC) configurations based on PMV-PPD performed worse at higher setpoints, with discomfort increasing from 877 h (42.2%) in AC25 to 1988 h (95.6%) in AC27. MM27 emerges as the most energy-efficient compromise, achieving the lowest energy use (67.0 kWh/m2·year) and CO2 emissions (40.2 kgCO2/m2·year) with discomfort only slightly higher than that of MM25 (+37 h/year).
Under future climates, all scenarios exhibit progressive degradation. Between 2023 and 2090, discomfort increases from 1413 h to 2013 h in FR and from 1141 h to 1937 h in NV, confirming passive strategy loss under severe warming [34]. MM25 discomfort rises from 167 h (8.0%) to 464 h (22.3%) in 2090, while MM27 increases from 204 h to 584 h (28.1%). MM strategies keep discomfort below AC at equivalent setpoints: by 2090, AC25, AC26, and AC27 reach 84.5%, 93.9%, and 100% discomfort, indicating near-complete failure of fixed-setpoint cooling [49]. This nonlinear degradation is consistent with studies showing that climate warming constrains mixed-mode and mechanical cooling effectiveness [21,31]. Physically, as outdoor temperatures exceed adaptive comfort limits and nocturnal cooling weakens, the natural ventilation window collapses, and buildings transition from hybrid to cooling-dominated regimes [5,31]. This convergence is quantitatively confirmed by the share of occupied hours with windows open, which declines from 32.8% (2023) to 20.5% (2090). Based on the operational thresholds defined in Section 2.2 and summarised in Table 5, the 50% threshold was already crossed in 2023, indicating that natural ventilation is no longer the dominant cooling strategy in the reference year. The 30% threshold is crossed between 2030 and 2060, marking the point beyond which natural ventilation becomes marginal and mechanical cooling becomes unavoidable. These two thresholds provide a quantitative and reproducible definition of the transition of mixed-mode operation toward cooling-dominated behaviour, which represents one of the main contributions of this study.
FR and NV maintain zero energy and emissions, but high discomfort makes them unsuitable for future climates as shown previously [45,50]. Mixed-mode emerges as the most balanced solution. In 2023, MM27 reduced energy use by ~50% vs. AC27 (67.0 vs. 135.0 kWh/m2·year), halving CO2 emissions (40.2 vs. 81.0 kgCO2/m2·year). By 2090, MM27 consumed 124.7 vs. 282.6 kWh/m2·year for AC27 (−56%). AC25 energy demand increases from 189.2 to 315.4 kWh/m2·year (+67%), while MM25 rises from 96.4 to 158.5 kWh/m2·year (+64%). AC27 emissions rise from 81.0 to 169.6 kgCO2/m2·year (+109%), vs. 40.2 to 74.8 (+86%) for MM27. Similar cooling demand increases are documented in Brazil and sub-Saharan Africa [14,17,31]. Compared with [14] (113.9 and 104.4 kWh/m2·year), our baseline 135.0 kWh/m2·year is 18–29% higher due to our uninsulated envelope. Our 2030 increase (+21.5%) lies between +6% and +31% reported in their study, while our 2060 increase (+60.9%) exceeds both projections. Our values exceed optimised benchmarks [16] (45–100 kWh/m2·year), confirming we address existing non-insulated stock. The findings support that buildings increasingly rely on mechanical cooling as passive potential declines [45,51]. Simulated mixed-mode savings (50–56%) corroborate [8] (45%). Cooling demand increases align with [52], and building ageing may further exacerbate demand [53].
The sensitivity analysis shows that the absolute OEI values vary by ±17% around the reference emission factor, without affecting the relative ranking of scenarios or the AC/MM energy ratio (2.27 in 2090). The absolute OEI values should therefore be interpreted as a range under a business-as-usual grid scenario, rather than as a single prediction.
Degradation links directly to intensifying thermal conditions. Outdoor temperatures rise by +0.73 °C (2030), +2.6 °C (2060), and +4.71 °C (2090), propagating indoors (+0.71 °C, +2.0 °C, +3.49 °C) supported by previous studies [13,14,17]. Overheating periods become longer and more intense, while reduced nocturnal cooling limits heat dissipation. The results by Kameni et al. [54] indicate that climate change could increase indoor temperatures by about 1 °C and cooling energy demand by 10–25% by 2050, suggesting that passive measures alone may not maintain thermal comfort in the long term. The reduction in nighttime cooling shortens the natural ventilation window, explaining why MM converges toward AC-like behaviour [21,51]. The same mechanism explains why the gap between NV and MM narrows over time: as warming reduces the hours in which outdoor air can cool the zone, MM spends less time in its natural ventilation mode, and its discomfort rises faster than that of NV (Table A2, Appendix A). High AC cooling demand reflects the uninsulated envelope typical of existing Burkinabe stock; reported AC intensities are envelope-dependent [17,53]. The regression analysis for 2090 RCP8.5 (Figure 12) confirms the progressive convergence of mixed-mode toward cooling-dominated behaviour: while AC configurations show near-zero sensitivity to outdoor temperature (R2 = 0.11–0.19, slope = 0.18–0.20), mixed-mode sensitivity varies across setpoints (R2 = 0.03–0.14, slope = 0.03–0.18), indicating that as the cooling setpoint rises, the building relies more on passive cooling and becomes increasingly vulnerable to extreme outdoor conditions.
As a methodological caveat, applying the ASHRAE-55 adaptive to full-AC scenarios extends it beyond its domain of validity; AC-Adaptive discomfort values (e.g., 23.7% in 2090) are optimistic lower bounds, not realistic predictions. They serve only to demonstrate the magnitude of PMV-PPD bias and to provide a consistent comparison framework. The exclusive use of RCP8.5 provides an upper-bound assessment but does not capture the uncertainty associated with other climate pathways. Intermediate scenarios (e.g., RCP4.5, RCP2.6) would likely produce less severe warming and, consequently, lower discomfort and energy demand.
Overall, climate change fundamentally alters the balance between comfort, energy, and sustainability. Purely passive strategies become insufficient, while fully conditioned buildings become energy- and carbon-intensive. Mixed-mode emerges as the most robust compromise. MM27 appears particularly suitable for the Burkinabe context. However, discomfort remains non-negligible, reaching 19.1% by 2060 and 28.1% by 2090, confirming that mixed-mode alone cannot fully eliminate thermal degradation under late-century warming. Nevertheless, progressive degradation confirms that operational strategies alone will not maintain acceptable comfort in the long term. Future adaptation requires integrated passive and active measures [50,51].
4.1. Scientific Contributions and Implications
This study provides three scientific contributions. First, it offers an integrated long-term assessment (2023–2090) of EMS-controlled mixed-mode changeover operation in a real compressed earth brick office building in Burkina Faso, encompassing multiple ventilation modes within a single calibrated framework. Second, it jointly quantifies adaptive comfort degradation, energy use intensification, and operational carbon emission trajectories—a tripartite performance evaluation that complements existing studies in sub-Saharan Africa. Third, it intentionally applies RCP8.5 as a stress-test pathway to examine upper-bound thermal and operational performance, rather than as a prediction of the most probable climate future.
Beyond these contributions, the findings have practical, theoretical, and policy implications. From a practical perspective, mixed-mode ventilation with a 27 °C setpoint achieves the lowest energy use (124.7 kWh/m2·year in 2090) and CO2 emissions (74.8 kgCO2/m2·year in 2090) while maintaining discomfort levels only slightly higher than lower setpoints. EMS-based changeover control effectively prioritises natural ventilation before activating mechanical cooling, but its effectiveness declines as warming shortens the natural ventilation window.
From a theoretical perspective, the study provides a quantitative operational definition of the transition threshold based on the share of occupied hours with windows open (Table 5). The 50% threshold was already crossed in 2023 (32.8%), indicating that natural ventilation is no longer the dominant cooling strategy in the reference year, and the 30% threshold is crossed between 2030 and 2060, marking the point beyond which natural ventilation becomes marginal. The study also confirms the relevance of the ASHRAE-55 adaptive model for tropical hot semi-arid climates, while noting that applying it to fully air-conditioned spaces extends it beyond its validity domain.
From a policy perspective, the results support the integration of adaptive comfort criteria into national building codes, the promotion of mixed-mode ventilation in new and retrofitted office buildings, and investment in capacity building for climate-responsive design. The identification of two operational thresholds provides policymakers with a clear temporal boundary for the applicability of mixed-mode ventilation under future warming.
4.2. Limitations of the Study
This study has several limitations that should be acknowledged. The analysis is based on a single building, a single zone, and a single orientation (south/east-facing). While this configuration represents a near-worst-case condition, the results should not be generalised to all office buildings without further validation across multiple building typologies, orientations, and envelope qualities. In addition, occupancy and occupant behaviour are treated deterministically. Stochastic adaptive actions—such as window opening, fan use, and clothing adjustment—are not modelled, although they are known to significantly influence thermal comfort outcomes in mixed-mode buildings.
The emission factor was held constant at 0.6 kgCO2/kWh throughout the 2023–2090 horizon. This does not account for the potential decarbonisation of the Burkinabe electricity mix or regional integration through the West African Power Pool. Consequently, the absolute CO2 emission values should be interpreted as conservative upper bounds, though the relative ranking of strategies remains valid. Moreover, the study relies exclusively on RCP8.5 as a high-end stress-test scenario. While appropriate for examining upper-bound thermal and operational performance, this single-scenario approach does not capture the uncertainty associated with other climate pathways (e.g., RCP4.5, RCP2.6) or the dispersion of multi-model climate ensembles.
The calibration period did not include the rainy season (June–September), during which humidity is highest. Given that operative temperature, rather than humidity, is the dominant driver of thermal comfort in Ouagadougou, this is considered a minor limitation, though future work could extend calibration to the full annual cycle. Furthermore, the study does not include an economic analysis (life-cycle cost, payback periods), which limits the applicability of the findings to design decision-making. Similarly, advanced passive strategies (e.g., optimised shading, phase-change materials) were not evaluated.
Night ventilation was not modelled, and windows remain closed during unoccupied hours. Given the high thermal mass of the 30 cm CEB walls, night ventilation is a major passive cooling lever in this building typology; its absence likely makes the FR and NV results pessimistic by construction. Future work should test a night ventilation variant. In addition, the results represent the performance of the current building configuration under future climate conditions, not a realistic prediction of the actual building performance in 2060 and 2090. Building regulations, retrofit practices, and HVAC technologies are likely to evolve over such a long horizon, potentially altering the observed trends.
Finally, the study focuses on thermal comfort and cooling energy only. Other environmental impacts (embodied carbon, water use, life-cycle emissions) and potential health effects (e.g., indoor air quality) were not assessed.
5. Conclusions
This study assessed the impacts of climate change on thermal comfort, energy consumption, and CO2 emissions in a mixed-mode office building in Ouagadougou, Burkina Faso, under tropical hot semi-arid conditions. A calibrated DesignBuilder/EnergyPlus model evaluated four strategies—free-running (FR), natural ventilation (NV), mixed-mode (MM), and fully air-conditioned (AC)—across present and future scenarios (2023–2090) under RCP8.5.
Three research questions were addressed. Regarding the appropriate comfort framework, the ASHRAE-55 adaptive model (80% acceptability) better reflects occupant thermal tolerance than static PMV-PPD models, which systematically overestimate discomfort. Concerning strategy performance, passive modes (FR, NV) show severe and growing discomfort by 2090 (96.8% and 93.1%, respectively), while MM27 limits discomfort to 28.1%—substantially lower than passive modes and AC27 (100%). The study also identifies a progressive contraction of the adaptive ventilation window, with the share of occupied hours with windows open declining from 32.8% (2023) to 20.5% (2090). The 50% operational threshold was already crossed in 2023, and the 30% operational threshold is crossed between 2030 and 2060, marking the point beyond which natural ventilation becomes marginal and mechanical cooling dominates.
Regarding the trade-off between comfort, energy, and CO2, MM27 reduces energy use and emissions by 50–56% compared with AC across all horizons, under a constant emission factor assumption; the absolute emission values should be interpreted as conservative upper bounds. This reduction is achieved while maintaining lower discomfort than passive strategies. The progressive contraction of the adaptive ventilation window under warming reduces the extent to which mixed-mode operation can maintain its advantage over passive strategies in the Sudano-Sahelian zone. This contraction explains the gradual convergence of MM toward cooling-dominated behaviour—a transition now quantified through the operational thresholds defined in this study. Regarding the trade-off between comfort, energy, and CO2, MM27 reduces energy use and emissions by 50–56% compared to AC. A sensitivity analysis on the emission factor (0.5–0.7 kgCO2/kWh) confirms that the relative ranking of scenarios is unchanged. The study confirms the relevance of adaptive comfort approaches for tropical mixed-mode buildings and demonstrates that EMS-based changeover control effectively optimises comfort and energy performance.
However, the mixed-mode advantage is demonstrated for one uninsulated building, one zone orientation, and RCP8.5; validation across multiple typologies, envelope qualities, and climate scenarios is required before prescriptive guidance can be developed. Future work should explicitly determine the performance limits of the mixed-mode scenario by identifying the critical outdoor temperature threshold and the corresponding year beyond which MM no longer provides acceptable comfort (DR < 50%). This would involve establishing a clear operational boundary at which MM loses its adaptive advantage and transitions to full cooling dependency. Such quantification would provide designers and policymakers with a clear operational boundary for mixed-mode applicability under future warming. Under the assumptions of this study, these findings support mixed-mode ventilation as a structurally advantageous compromise for reducing cooling demand and limiting carbon emissions in office buildings in Ouagadougou and comparable Sudano-Sahelian contexts. These findings should be interpreted as indicative of system behaviour under extreme warming for a specific building configuration, rather than predictive outcomes or prescriptive design guidance applicable to all tropical office buildings.
Author Contributions
A.B.: Conceptualization, Methodology, Data acquisition, extraction and curation, Formal analysis and interpretation of data, Writing—original draft, preparation. C.H.: Conceptualization, Methodology, Data extraction and data curation, Formal analysis, Writing—review and editing, Supervision. A.M.: Conceptualization, Methodology, Formal analysis, supervision, Writing—review and editing, Project administration, Validation. T.D.: Project administration, Methodology, Formal analysis. S.A.: Methodology, Visualisation, Writing—review and editing, Validation. All authors have read and agreed to the published version of the manuscript.
Funding
This research was supported by the Regional Scholarship and Innovation Fund (RSIF) through the Partnership for Skills in Applied Sciences, Engineering and Technology (PASET) programme, which funded the PhD thesis from which this study is derived.
Data Availability Statement
The original contributions presented in this study are included in the article. Further inquiries can be directed to the corresponding author.
Acknowledgments
Alphonse BOUDA would like to thank the International Centre of Insect Physiology and Ecology (ICIPE) through the Regional Scholarship and Innovation Fund/Partnership for Skills in Applied Sciences, Engineering and Technology (RSIF/PASET) programme for supporting his PhD studies. We would like to acknowledge the Sustainable Building Design Lab at the Faculty of Applied Sciences at the University of Liege for the valuable support and use of the state-of-the-art Super COmputeR ProcessIng wOrkstatioN (SCORPION) for building performance simulations and data analysis.
Conflicts of Interest
The authors declare no conflicts of interest.
Abbreviations
The following abbreviations are used in this manuscript:
| AC | Air-Conditioned/Air Conditioning |
| AFN | Airflow Network |
| ASHRAE | American Society of Heating, Refrigerating and Air-Conditioning Engineers |
| BEM | Building Energy Model |
| BSh | Hot Semi-Arid Climate (Köppen classification) |
| CEB | Compressed Earth Block |
| CV(RMSE) | Coefficient of Variation in the Root Mean Square Error |
| DR | Discomfort Rate |
| EMS | Energy Management System |
| EUI | Energy Use Intensity |
| FR | free-running |
| HVAC | Heating, Ventilation, and Air-Conditioning |
| IPCC | Intergovernmental Panel on Climate Change |
| ISO | International Organisation for Standardisation |
| KPI | Key Performance Indicator |
| MM | Mixed-Mode |
| NMBE | Normalised Mean Bias Error |
| NV | Natural Ventilation |
| OEI | Operational Emission Intensity |
| PMV | Predicted Mean Vote |
| PPD | Predicted Percentage of Dissatisfied |
| RCP | Representative Concentration Pathway |
| RMSE | Root Mean Square Error |
| SD | Standard Deviation |
| Top | Operative Temperature |
| Ta,out | Outdoor Air Temperature |
| TSV | Thermal Sensation Vote |
| TLL,Ashr | Lower Limit of the ASHRAE-55 80% Adaptive Comfort Band |
| TUL,Ashr | Upper Limit of the ASHRAE-55 80% Adaptive Comfort Band |
Appendix A
Table A1.
Simulation details for HVAC, internal loads, infiltration, natural ventilation, and envelope.
Table A2.
Comparison of thermal comfort, energy use, and CO2 emissions across standards and operational scenarios under Climate Change (with sensitivity to the emission factor).
Appendix B
Appendix B.1
Figure A1.
Mixed-mode ventilation classification.
Appendix B.2
Figure A2.
Comparison of three comfort model categories for the climate of Ouagadougou.
Appendix B.3
Figure A3.
Full representation of indoor operative temperature in ASHRAE-55 standards.
References
- Sulzer, M.; Christen, A. Climate Projections of Human Thermal Comfort for Indoor Workplaces. Clim. Change 2024, 177, 28. [Google Scholar] [CrossRef] [Scilit] [PubMed]
- Zoure, A.N.; Genovese, P.V. Development of Bioclimatic Passive Designs for Office Building in Burkina Faso. Sustainability 2022, 14, 4332. [Google Scholar] [CrossRef] [Scilit]
- Zoure, A.N.; Genovese, P.V. Implementing Natural Ventilation and Daylighting Strategies for Thermal Comfort and Energy Efficiency in Office Buildings in Burkina Faso. Energy Rep. 2023, 9, 3319–3342. [Google Scholar] [CrossRef] [Scilit]
- Hema, C.; Ouédraogo, A.L.S.N.; Bationo, G.B.; Kabore, M.; Nshimiyimana, P.; Messan, A. A Field Study on Thermal Acceptability and Energy Consumption of Mixed-Mode Offices Building Located in the Hot-Dry Climate of Burkina Faso. Sci. Technol. Built Environ. 2024, 30, 184–193. [Google Scholar] [CrossRef] [Scilit]
- Bouda, A.; Hema, C.; Ouédraogo, A.L.S.-N.; Nshimiyimana, P.; Attia, S.; Daho, T.; Messan, A. Evaluation of Thermal Comfort in Mixed-Mode Office Buildings in Hot and Semi-Arid Climates: A Case Study from Burkina Faso. Energy Build. 2026, 352, 116781. [Google Scholar] [CrossRef] [Scilit]
- Lei, Y.; Tekler, Z.D.; Zhan, S.; Miller, C.; Chong, A. Experimental Evaluation of Thermal Adaptation and Transient Thermal Comfort in a Tropical Mixed-Mode Ventilation Context. Build. Environ. 2024, 248, 111043. [Google Scholar] [CrossRef] [Scilit]
- Arsad, F.S.; Hod, R.; Ahmad, N.; Baharom, M.; Ja’afar, M.H. Assessment of Indoor Thermal Comfort Temperature and Related Behavioural Adaptations: A Systematic Review. Environ. Sci. Pollut. Res. 2023, 30, 73137–73149. [Google Scholar] [CrossRef] [Scilit] [PubMed]
- Duan, Z.; Sun, Y.; Wang, M.; Hu, R.; Dong, X. Evaluation of Mixed-Mode Ventilation Thermal Performance and Energy Saving Potential from Retrofitting a Beijing Office Building. Buildings 2022, 12, 793. [Google Scholar] [CrossRef] [Scilit]
- Sánchez-García, D.; Rubio-Bellido, C.; del Río, J.J.M.; Pérez-Fargallo, A. Towards the Quantification of Energy Demand and Consumption through the Adaptive Comfort Approach in Mixed Mode Office Buildings Considering Climate Change. Energy Build. 2019, 187, 173–185. [Google Scholar] [CrossRef] [Scilit]
- Ringard, J.; Dieppois, B.; Rome, S.; Diedhiou, A.; Pellarin, T.; Konaré, A.; Diawara, A.; Konaté, D.; Dje, B.K.; Katiellou, G.L.; et al. The Intensification of Thermal Extremes in West Africa. Glob. Planet. Change 2016, 139, 66–77. [Google Scholar] [CrossRef] [Scilit]
- Trisos, C.H.; Adelekan, I.O.; Totin, E.; Ayanlade, A.; Efitre, J.; Gemeda, A.; Kalaba, K.; Lennard, C.; Masao, C.; Mgaya, Y.; et al. Africa. In Climate Change 2022—Impacts, Adaptation and Vulnerability; Pörtner, H.-O., Roberts, D.C., Tignor, M., Poloczanska, E.S., Mintenbeck, K., Alegría, A., Craig, M., Langsdorf, S., Löschke, S., Möller, V., et al., Eds.; Cambridge University Press: Cambridge, UK, 2022; pp. 1285–1456. [Google Scholar]
- Tajuddeen, I.; Sajjadian, S.M. Climate Change and the Built Environment—A Systematic Review. Environ. Dev. Sustain. 2024, 28, 549–590. [Google Scholar] [CrossRef] [Scilit]
- Millogo, Z.N.; Okogbue, E.C.; Diasso, J.U.; Ochei, M.C.; Sawadogo, W. Projection of Heatwave Characteristics over Burkina Faso under the Shared Socioeconomic Pathways Scenarios—SSP2-4.5 and SSP5-8.5. Theor. Appl. Climatol. 2025, 156, 461. [Google Scholar] [CrossRef] [Scilit]
- Dodoo, A.; Ayarkwa, J. Effects of Climate Change for Thermal Comfort and Energy Performance of Residential Buildings in a Sub-Saharan African Climate. Buildings 2019, 9, 215. [Google Scholar] [CrossRef] [Scilit]
- Idrissi Kaitouni, S.; Chahboun, R.; Bouhssine, Z.; Cakan, M.; Brigui, J.; Ahachad, M. Simulation-Based Assessment of the Climate Change Impact on Future Thermal Energy Load and Indoor Comfort of a Light-Weight Ecological Building across the Six Climates of Morocco. Therm. Sci. Eng. Prog. 2023, 45, 102137. [Google Scholar] [CrossRef] [Scilit]
- Tajuddeen, I.; Rodrigues, E. A Morris Sensitivity Analysis of an Office Building’s Thermal Design Parameters under Climate Change in Sub-Saharan Africa. Build. Environ. 2024, 262, 111771. [Google Scholar] [CrossRef] [Scilit]
- Ouedraogo, B.I.; Levermore, G.J.; Parkinson, J.B. Future Energy Demand for Public Buildings in the Context of Climate Change for Burkina Faso. Build. Environ. 2012, 49, 270–282. [Google Scholar] [CrossRef] [Scilit]
- Min Ye, Y.; Liang, W.; Xu, F.; Chong, A.; Barnes, C.M.; Yam, K.C. The Effects of Mixed-Mode Ventilation on Energy Saving and Employee Job Satisfaction, Work Engagement, and Job Performance. Sci. Rep. 2026, 16, 8463. [Google Scholar] [CrossRef] [Scilit] [PubMed]
- Lamsal, P.; Bajracharya, S.B.; Rijal, H.B. A Review on Adaptive Thermal Comfort of Office Building for Energy-Saving Building Design. Energies 2023, 16, 1524. [Google Scholar] [CrossRef] [Scilit]
- Karyono, K.; Abdullah, B.M.; Cotgrave, A.J.; Bras, A. The Adaptive Thermal Comfort Review from the 1920s, the Present, and the Future. Dev. Built Environ. 2020, 4, 100032. [Google Scholar] [CrossRef] [Scilit]
- Herling, R.M.; Neves, L.O. Climate Change Impacts on the Thermal and Energy Performance of Mixed-Mode Office Buildings in a Humid Subtropical Climate. Ambiente Construído 2025, 25, e145547. [Google Scholar] [CrossRef] [Scilit]
- Li, P.; Zhao, X.; Gao, N.; Luo, M.; Shi, X. Influencing Factors of Long-Term Thermal Comfort in Office Buildings. Build. Simul. 2024, 17, 2043–2061. [Google Scholar] [CrossRef] [Scilit]
- Aderinsola, A.; Dare-Abel, O.; Arayela, O.; Ajayi, O. Evaluating Thermal Comfort Standards of Residential Housing in Tropical Climates: A Systematic Review. J. Built Environ. Geol. Res. 2025. [Google Scholar] [CrossRef] [Scilit]
- Mohammadpourkarbasi, H.; Jackson, I.; Nukpezah, D.; Appeaning, I. Evaluation of Thermal Comfort in Library Buildings in the Tropical Climate of Kumasi, Ghana. Energy Build. 2022, 268, 112210. [Google Scholar] [CrossRef] [Scilit]
- ANSI/ASHRAE Standard 55-2020; Thermal Environmental Conditions for Human Occupancy. American Society of Heating, Refrigerating and Air-Conditioning Engineers: Atlanta, GA, USA, 2020.
- EN 16798-1:2019; Energy Performance of Buildings—Ventilation for Buildings—Part 1: Indoor Environmental Input Parameters for Design and Assessment of Energy Performance of Buildings Addressing Indoor Air Quality, Thermal Environment, Lighting and Acoustics; Module M1-6. European Committee for Standardization (CEN): Brussels, Belgium, 2019.
- Lamberti, G.; Boghetti, R.; Kämpf, J.H.; Fantozzi, F.; Leccese, F.; Salvadori, G. Development and Comparison of Adaptive Data-Driven Models for Thermal Comfort Assessment and Control. Total Environ. Res. Themes 2023, 8, 100083. [Google Scholar] [CrossRef] [Scilit]
- Yao, R.; Zhang, S.; Du, C.; Schweiker, M.; Hodder, S.; Olesen, B.W.; Toftum, J.; Romana d’Ambrosio, F.; Gebhardt, H.; Zhou, S.; et al. Evolution and Performance Analysis of Adaptive Thermal Comfort Models—A Comprehensive Literature Review. Build. Environ. 2022, 217, 109020. [Google Scholar] [CrossRef] [Scilit]
- Arakawa Martins, L.; Soebarto, V.; Williamson, T. A Systematic Review of Personal Thermal Comfort Models. Build. Environ. 2022, 207, 108502. [Google Scholar] [CrossRef] [Scilit]
- Lamberti, G.; Salvadori, G.; Leccese, F.; Fantozzi, F.; Bluyssen, P.M. Advancement on Thermal Comfort in Educational Buildings: Current Issues and Way Forward. Sustainability 2021, 13, 315. [Google Scholar] [CrossRef] [Scilit]
- Veloso, A.C.O.; Souza, R.V.G. Climate Change Impact on Energy Savings in Mixed-Mode Ventilation Office Buildings in Brazil. Energy Build. 2024, 318, 114418. [Google Scholar] [CrossRef] [Scilit]
- Lei, Y.; Zhan, S.; Chong, A. Sustainable Cooling in the Tropics with Mixed-Mode Ventilation and Thermal Adaptation. Build. Environ. 2025, 284, 113339. [Google Scholar] [CrossRef] [Scilit]
- Cheng, S.; Heo, Y.; Xin, W.; Chong, A. Assessing Passive Cooling Strategies for a Tropical Mixed-Mode Building Using Calibrated Simulations. Energy Build. 2026, 360, 117376. [Google Scholar] [CrossRef] [Scilit]
- Amraoui, K.; Ouanes, S.; Daich, S.; Reghiss, I.; Di Turi, S.; Stasi, R.; Ruggiero, F. Evaluating the Effects of Climate Change on the Thermal Performance of Residential Buildings in Hot and Arid Regions. Buildings 2025, 15, 4378. [Google Scholar] [CrossRef] [Scilit]
- Maiga, A.; Sagna, K.; Toussakoe, K.; Zoma, V.; Ouedraogo, L.; Kam, S. Optimization of Thermal Comfort in Compressed Earth Block (CEB) Buildings in Burkina Faso. Sci. J. Energy Eng. 2024, 12, 101–112. [Google Scholar] [CrossRef] [Scilit]
- Neya, I.; Yamegueu, D.; Messan, A.; Coulibaly, Y.; Ouedraogo, A.L.S.N.; Ayite, Y.M.X.D. Effect of Cement and Geopolymer Stabilization on the Thermal Comfort: Case Study of an Earthen Building in Burkina Faso. Int. J. Build. Pathol. Adapt. 2022, 43, 283–301. [Google Scholar] [CrossRef] [Scilit]
- Bamogo, S.; Zoma, F.; Malbila, E.; Toguyeni, D.Y.K. Thermal Characterization of Concrete and Cement Mortar from Construction Sites and Industrial Production Units in the City of Ouagadougou with a View to Standardization in Energy Certification. Engineering 2023, 15, 396–415. [Google Scholar] [CrossRef]
- Sawadogo, W.; Neya, T.; Semde, I.; Korahiré, J.A.; Combasséré, A.; Traoré, D.E.; Ouedraogo, P.; Diasso, U.J.; Abiodun, B.J.; Bliefernicht, J.; et al. Potential Impacts of Climate Change on the Sudan-Sahel Region in West Africa—Insights from Burkina Faso. Environ. Chall. 2024, 15, 100860. [Google Scholar] [CrossRef] [Scilit]
- Tazen, F.; Diarra, A.; Kabore, R.F.W.; Ibrahim, B.; Bologo/Traoré, M.; Traoré, K.; Karambiri, H. Trends in Flood Events and Their Relationship to Extreme Rainfall in an Urban Area of Sahelian West Africa: The Case Study of Ouagadougou, Burkina Faso. J. Flood Risk Manag. 2019, 12, 12507. [Google Scholar] [CrossRef] [Scilit]
- DesignBuilder. DesignBuilder Dynamic Simulation Model (DSM)—User Manual; DesignBuilder Software Ltd.: Stroud, UK, 2025; Available online: https://designbuilder.co.uk/download/sbem-dsm-manuals (accessed on 10 September 2025).
- Rupp, R.F.; Kim, J.; Toftum, J.; Brager, G.; de Dear, R. Ten Questions Concerning the Application of Adaptive Thermal Comfort in Mixed-Mode Buildings. Build. Environ. 2025, 284, 113490. [Google Scholar] [CrossRef] [Scilit]
- Lee, H.C.; Hsu, H.C.; Chang, C.W.; Pan, C.Y. Mixed-Mode Ventilation for Indoor Health and Energy Efficiency in Subtropical Climates. Energy Rep. 2025, 14, 1273–1282. [Google Scholar] [CrossRef] [Scilit]
- Veloso, A.C.O.; Filho, C.R.A.; Souza, R.V.G. The Potential of Mixed-Mode Ventilation in Office Buildings in Mild Temperate Climates: An Energy Benchmarking Analysis. Energy Build. 2023, 297, 113445. [Google Scholar] [CrossRef] [Scilit]
- ASHRAE. Guideline 14-2014: Measurement of Energy, Demand, and Water Savings; American Society of Heating, Refrigerating and Air-Conditioning Engineers: Atlanta, GA, USA, 2014. [Google Scholar]
- Attia, S.; Gobin, C. Climate Change Effects on Belgian Households: A Case Study of a Nearly Zero Energy Building. Energies 2020, 13, 5357. [Google Scholar] [CrossRef] [Scilit]
- Amaripadath, D.; Sailor, D.J.; Khan, A.; Bertini, A.; Attia, S. Achieving Low-Carbon Electricity Operations in Net Zero Energy Residential Buildings through Plug-in Battery Energy Storage Systems. J. Energy Storage 2026, 153, 120964. [Google Scholar] [CrossRef] [Scilit]
- Nana, B.; Zalle, H.; Ouarma, I.; Daho, T.; Yonli, A.; Bere, A. Assessment of Carbon Dioxide Emission Factors from Power Generation in Burkina Faso. Clean Air J. 2023, 33, 1–10. [Google Scholar] [CrossRef] [Scilit]
- Meshack, O. Efeoma; Ola Uduku Assessing Thermal Comfort and Energy Efficiency in Tropical African Offices Using the Adaptive Approach. Struct. Surv. 2014, 32, 396–412. [Google Scholar] [CrossRef] [Scilit]
- Jafarpur, P.; Berardi, U. Effects of Climate Changes on Building Energy Demand and Thermal Comfort in Canadian Office Buildings Adopting Different Temperature Setpoints Canadian Model of Ocean Carbon Canadian Weather Year for Energy Calculation. J. Build. Eng. 2021, 42, 102725. [Google Scholar]
- Farrokhirad, E.; Gao, Y.; Pitts, A.; Chen, G. A Systematic Review on the Risk of Overheating in Passive Houses. Buildings 2024, 14, 2501. [Google Scholar] [CrossRef] [Scilit]
- Liyanage, D.R.; Hewage, K.; Hussain, S.A.; Razi, F.; Sadiq, R. Climate Adaptation of Existing Buildings: A Critical Review on Planning Energy Retrofit Strategies for Future Climate. Renew. Sustain. Energy Rev. 2024, 199, 114476. [Google Scholar] [CrossRef] [Scilit]
- Delfani, S.; Karami, M.; Pasdarshahri, H. The Effects of Climate Change on Energy Consumption of Cooling Systems in Tehran. Energy Build. 2010, 42, 1952–1957. [Google Scholar] [CrossRef] [Scilit]
- Waddicor, D.A.; Fuentes, E.; Sisó, L.; Salom, J.; Favre, B.; Jiménez, C.; Azar, M. Climate Change and Building Ageing Impact on Building Energy Performance and Mitigation Measures Application: A Case Study in Turin, Northern Italy. Build. Environ. 2016, 102, 13–25. [Google Scholar] [CrossRef] [Scilit]
- Nematchoua, M.K.; Vanona, J.C.; Orosa, J.A. Energy Efficiency and Thermal Performance of Office Buildings Integrated with Passive Strategies in Coastal Regions of Humid and Hot Tropical Climates in Madagascar. Appl. Sci. 2020, 10, 2438. [Google Scholar] [CrossRef] [Scilit]

Disclaimer/Publisher’s Note: The statements, opinions and data contained in all publications are solely those of the individual author(s) and contributor(s) and not of MDPI and/or the editor(s). MDPI and/or the editor(s) disclaim responsibility for any injury to people or property resulting from any ideas, methods, instructions or products referred to in the content. |
© 2026 by the authors. Licensee MDPI, Basel, Switzerland. This article is an open access article distributed under the terms and conditions of the Creative Commons Attribution (CC BY) license.