


Abstract
To promote the co-utilization of municipal solid waste incineration fly ash (MSWIFA) and size-fractionated bottom ash (MSWIBA), an alkali-activated binder was prepared from MSWIFA, ground granulated blast furnace slag, and coal fly ash. The 0–2.36 and 2.36–4.75 mm MSWIBA fractions were converted into cold-bonded artificial lightweight aggregate (ALA; 2.36–4.75 mm), whereas the 4.75–9.5 mm fraction was used directly as coarse aggregate. An L9 orthogonal experiment evaluated water-to-binder ratio, sand ratio, and ALA-to-coarse MSWIBA ratio. Slump and 28 d compressive strength ranged from 125 to 180 mm and from 17.5 to 30.0 MPa, respectively. A1 reached a 28 d strength of 30.00 ± 1.57 MPa across three independent batches. The ALA-to-coarse MSWIBA ratio was associated with the largest strength variation. At 175 freeze–thaw cycles, A1 had a relative dynamic elastic modulus of 56.37 ± 0.81% and mass loss of 4.94 ± 0.05%. Continuous immersion in 5 wt.% Na2SO4 for 180 d gave reported strength retention coefficients of 72.6–74.8%; all were below the adopted 75% criterion. Short-term ICP-MS measurements showed Cd, Pb, and Ni concentrations below the corresponding Class III groundwater reference values. These results identify A1 as the preferred formulation for further component-scale evaluation, with sulfate resistance requiring improvement.
1. Introduction
With the continued growth of municipal solid waste generation, incineration has become an important waste management route in China because it provides substantial volume reduction, requires relatively little land, and permits energy recovery. By 2022, incineration accounted for nearly 80% of municipal solid waste treatment in China, and approximately 7.8 million tonnes of fly ash were generated annually [1]. Nevertheless, incineration still produces municipal solid waste incineration fly ash (MSWIFA) and bottom ash (MSWIBA), which account for approximately 10–20% and 80–90% of solid residues, respectively [2]. MSWIFA is enriched in soluble chlorides, heavy metals, and dioxins and is managed as hazardous waste in China. MSWIBA generally presents a lower environmental risk, but residual aluminum, chlorides, sulfates, and potentially harmful elements may still cause expansion, performance deterioration, and contaminant release [3]. Ashes produced by different incinerator types also vary markedly in composition and heavy metal speciation, introducing material variability and environmental uncertainty into engineering applications [4]. Large-scale utilization of these residues therefore requires simultaneous control of engineering performance and environmental safety.
Alkali-activated binders can convert Si-, Al-, and Ca-rich solid wastes into cementitious reaction products and thus provide a route for stabilizing and utilizing MSWIFA. Compared with Portland cement solidification, coal fly ash-based geopolymers have shown higher immobilization efficiencies for Pb, Zn, and Cd [5]. However, MSWIFA commonly contains insufficient reactive aluminosilicate phases, high salt concentrations, and a complex composition, making it difficult to achieve suitable setting, strength, and environmental performance when it is used alone. Pretreatment and blended precursor strategies have therefore been explored. Using ash from Copenhagen, Denmark, Zhan and Kirkelund showed that electrodialytic pretreatment can improve Si reactivity and enable MSWIFA incorporation into coal fly ash geopolymers [6], whereas additional reactive calcium can promote calcium-containing aluminosilicate reaction products and improve strength and Pb/Cd immobilization [7]. Steel slag can complement the Ca, Si, and Al supplied by MSWIFA [8], and coal gangue-based geopolymers can use the calcium-bearing constituents of MSWIFA to improve reaction development and mortar performance [9]. The combined use of construction waste [10] or phosphorus slag [11] with MSWIFA further indicates that multi-source precursor blending is a promising approach for improving alkali-activated materials containing MSWIFA. In Italy, Ferone et al. compared as-received and pre-washed MSWIFA in coal fly ash-based geopolymers, showing the importance of soluble salt removal as well as metal retention [12]. Using incinerator fly ash from Singapore, Liu et al. showed that alkali-activated slag binders could incorporate substantial fly ash contents and immobilize heavy metals, although strength decreased as the fly ash fraction increased [13].
Previous studies suggest that N-A-S-H- and C-A-S-H-type products formed during alkali activation can restrict heavy metal migration through physical encapsulation, surface adsorption, ion exchange, and chemical binding [14]. High early strength, however, does not necessarily ensure long-term stability. Sulfuric acid attack may cause decalcification and dealumination of the reaction products and promote crack development, thereby reducing strength and heavy metal retention [15]. Sulfate and sulfuric acid exposure can also affect calcium-rich MSWIFA-based geopolymers through different deterioration pathways [16]. Long-term dynamic leaching studies further show that metal release is controlled jointly by the pore structure, exposure solution, and solution pH; consequently, short-term leaching results cannot fully represent service life behavior [17]. Engineering assessment of MSWIFA-based alkali-activated materials should therefore consider strength, durability, and leaching together.
MSWIBA covers a wide particle size range and, after aging, screening, and metal recovery, can partly replace natural aggregate. Moderate MSWIBA contents may provide internal curing through water absorption and release, whereas excessive replacement can reduce concrete performance because of the lower particle strength and higher water absorption of the ash [18]. Fine fractions that are unsuitable for direct aggregate use can be reconstructed into artificial aggregates by cold-bonded pelletization. High-volume cold-bonded MSWIBA aggregate has been used in concrete [19], and its strength, water absorption, and heavy metal leaching depend strongly on binder composition and curing regime [20]. Although artificial lightweight aggregate is porous, controlled absorption and desorption and the resulting aggregate–paste interface may improve transport resistance [21]. Calcined clay-containing binders [22] and fiber reinforcement [23] have also been used to improve the particle performance and contaminant stability of artificial MSWIBA aggregates. Freeze–thaw studies indicate that the behavior of concrete containing lightweight MSWIBA aggregate is closely associated with pore structure, moisture condition, and interfacial characteristics [24]. In a study using bottom ash from northern Germany, Müller and Rübner identified metallic aluminum reactions and hydrogen release as important sources of concrete damage [25]. These European findings emphasize that ash composition, pretreatment, and exposure conditions must be considered when transferring a utilization route between regions. More recently, Chen et al. examined treated coarse MSWIBA in slag-based alkali-activated concrete in the Netherlands, relating its mechanical and freeze–thaw behavior to aggregate-related pore structure and microcracking [26].
Existing studies have demonstrated MSWIFA immobilization in geopolymers, direct use of MSWIBA as aggregate, and production of cold-bonded aggregate from fine MSWIBA. However, these routes are often investigated separately. Ji et al. assessed the bearing performance and heavy metal leaching of MSWIFA-based geopolymer-stabilized tailing subgrade filler [27]. The present study instead integrates three material functions within one concrete: MSWIFA is incorporated into both the matrix binder and the artificial aggregate binding phase, fine MSWIBA is reconstructed into aggregate, and coarse MSWIBA is used directly. The contribution is the evaluation of this size-specific combination through workability, strength, selected durability endpoints, and leaching measurements, rather than the use of either ash alone.
Accordingly, this study used MSWIFA, ground granulated blast furnace slag (GGBFS), and coal fly ash to prepare an alkali-activated binder. Different MSWIBA size fractions were used either to manufacture cold-bonded artificial lightweight aggregate or directly as coarse aggregate. An orthogonal experiment and control mixtures were employed to quantify the effects of the water-to-binder ratio, sand ratio, and artificial lightweight aggregate-to-coarse bottom ash aggregate volume ratio on workability and compressive strength. Freeze–thaw resistance, sulfate resistance, and heavy metal leaching were then evaluated. By integrating MSWIFA-based binder production, artificial aggregate manufacture from fine MSWIBA, and direct use of coarse MSWIBA within the same concrete, this study provides a material design basis for subsequent evaluation of MSWI residues in unreinforced precast road components.
2. Materials and Methods
2.1. Raw Materials
2.1.1. Municipal Solid Waste Incineration Fly Ash
The MSWIFA was obtained from an environmental energy company in Xi’an, China. Laser particle size analysis showed a particle size range of 0.3–2000 μm and a mean particle size of 44.115 μm; particles smaller than 100 μm accounted for 93.64%. The ash contained high proportions of CaO, Cl, Na2O, K2O, and SO3 but relatively low proportions of SiO2 and Al2O3 (Table 1). The concentrations of Cr, Cd, Pb, Ni, and Hg in the raw ash leachate were 0.23, 7.01, 14.39, 0.42, and <0.01 mg/L, respectively. The comparatively high Cd and Pb concentrations identified these metals as priority contaminants during subsequent material utilization. Qualitative XRD phase identification indicated chloride- and sulfate-bearing crystalline phases together with calcite; these observations are used to describe the ash rather than to quantify its reactive fraction.
Table 1.
Major chemical composition of the raw materials.
2.1.2. Ground Granulated Blast Furnace Slag
S105-grade GGBFSwas used. CaO, SiO2, and Al2O3 accounted for a combined mass fraction of 85.91%; the detailed composition is presented in Table 1.
2.1.3. Coal Fly Ash
Coal fly ash was obtained from a coal-fired power plant in Weicheng District, Xianyang, China. SiO2 and Al2O3 were the principal components and represented a combined mass fraction of 74.69% (Table 1).
2.1.4. Municipal Solid Waste Incineration Bottom Ash
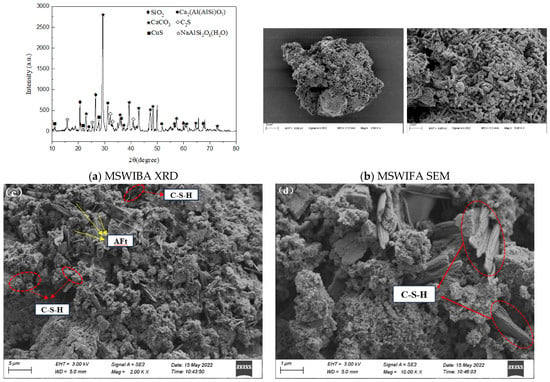
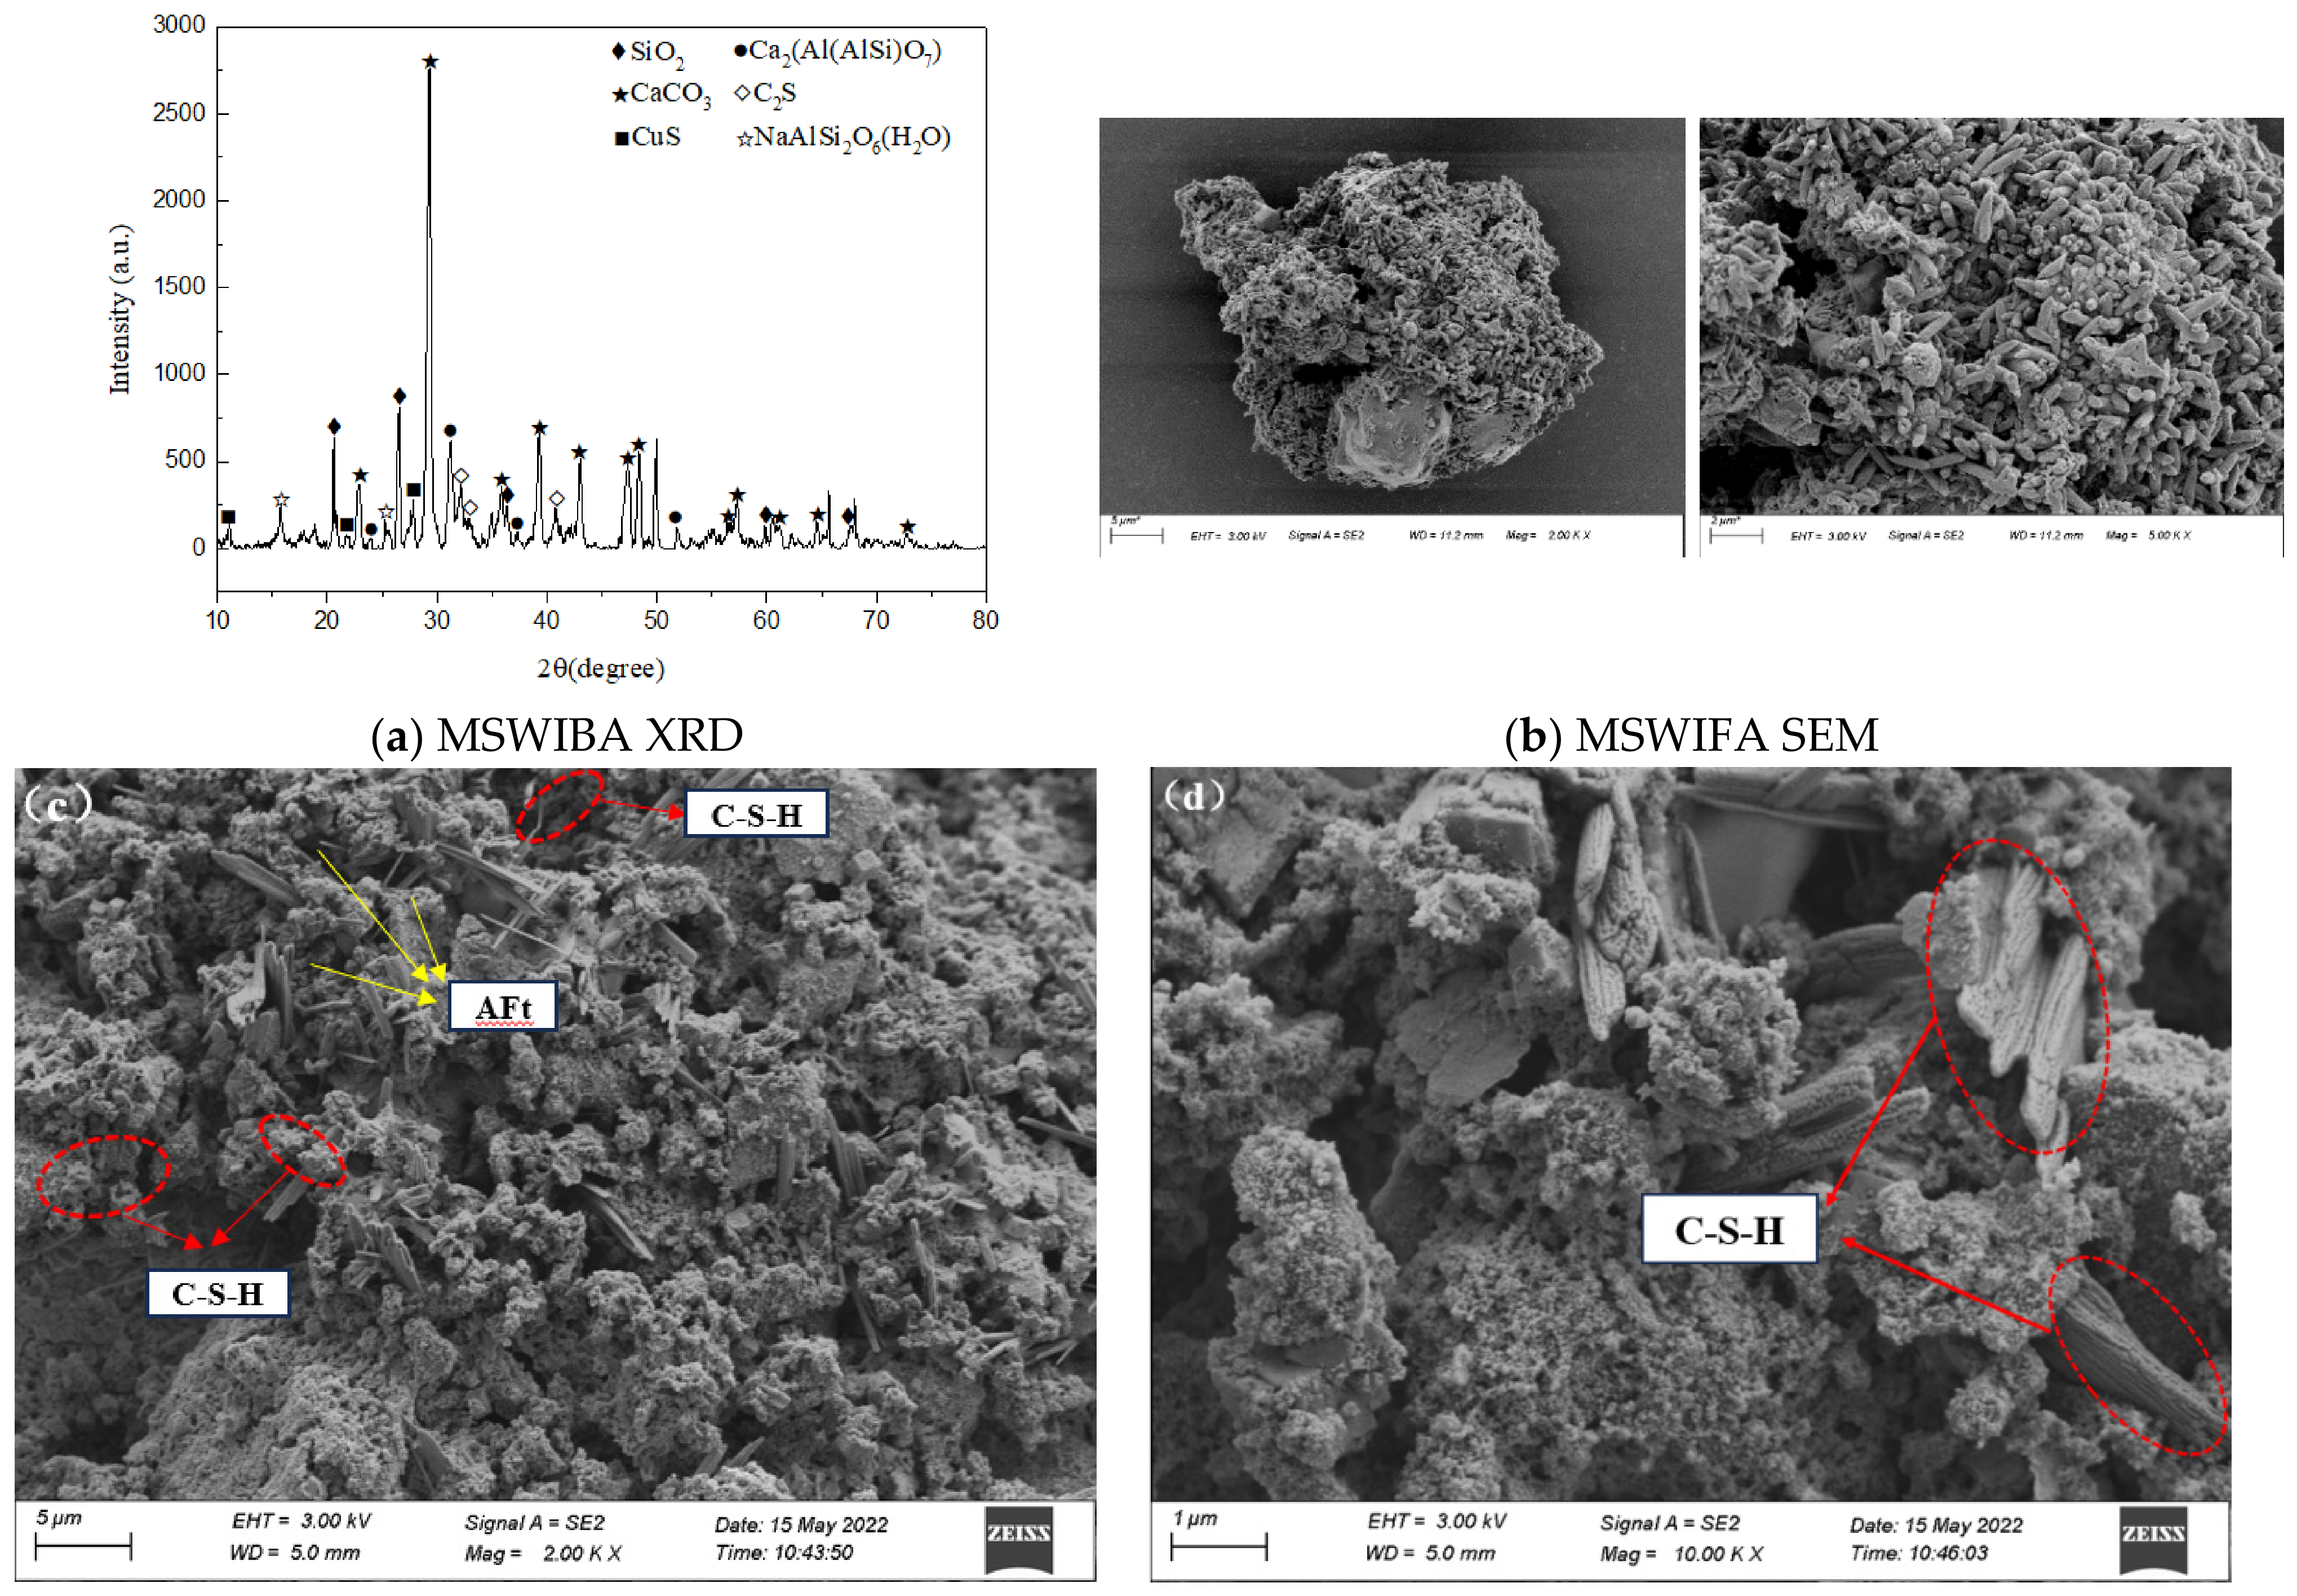
The MSWIBA was obtained from a municipal solid waste incineration power plant in Xi’an, Chinaand separated into 0–2.36, 2.36–4.75, and 4.75–9.5 mm fractions. The ash consisted mainly of CaO and SiO2 and also contained Fe2O3, Al2O3, Na2O, MgO, and small amounts of chloride (Table 1). The physical properties varied with particle size. The apparent densities of the 0–2.36 and 2.36–4.75 mm fractions were 2221 and 2365 kg/m3, respectively, and their water absorptions were 6.55% and 5.13%. For the 4.75–9.5 mm fraction, the bulk density, apparent density, water absorption, and cylinder compressive strength were 1177 kg/m3, 2211 kg/m3, 5.13%, and 10.7 MPa, respectively. The 0–2.36 mm fraction had the highest water absorption among the three fractions. The MSWIBA XRD pattern showed prominent quartz and calcite reflections (Figure 1a), whereas SEM of MSWIFA showed agglomerates of irregular, rod-like, and plate-like particles (Figure 1b).
Figure 1.
Additionalmaterial characterization: (a) XRD pattern of MSWIBA; (b) SEM images of MSWIFA at two magnifications; (c,d) representative SEM images of the hardened binder containing 60% MSWIFA. Original scale bars and morphology-based phase annotations are retained.
2.1.5. Alkali Activator
The alkali activator was prepared using NaOH and Na2SiO3. The NaOH was supplied as flakes with a purity above 96%, and instant Na2SiO3 was dissolved in distilled water before use. NaOH provided the alkaline reaction environment, whereas Na2SiO3 supplied soluble silicate and Na+ to promote dissolution and polymerization of the reactive aluminosilicate constituents.
2.1.6. Other Materials
Natural sand was used as the fine aggregate. Grade 32.5 Portland cement and natural crushed stone were used in the control mixtures to compare binder types and aggregate combinations.
2.2. Utilization Routes and Material Compositions
MSWIFA was used in both the concrete matrix binder and the binder phase of the artificial lightweight aggregate. After screening, the 0–2.36 and 2.36–4.75 mm MSWIBA fractions were used to manufacture artificial lightweight aggregate, whereas the 4.75–9.5 mm fraction was used directly as coarse aggregate.
2.2.1. Binder for the Concrete Matrix
The concrete matrix binder comprised MSWIFA, GGBFS, and coal fly ash at mass fractions of 60%, 32%, and 8%, respectively, based on total dry precursor mass, excluding activators. The GGBFS-to-coal fly ash mass ratio was 4:1. Preliminary screening of the GGBFS–coal fly ash subsystem selected formulation T8, with nominal SiO2/Al2O3 and Na2O/SiO2 molar ratio targets of 3.0 and 0.33 and a water-to-solids ratio of 0.54. These are screening descriptors of the precursor subsystem, not measured reactive-oxide ratios or the concrete water-to-binder ratio after MSWIFA addition. The concrete mixtures were specified directly by constituent masses: instant Na2SiO3 and NaOH were added at 7.0 and 4.8 g per 100 g of GGBFS plus coal fly ash. At 330 kg/m3 dry precursor, the GGBFS-plus-coal fly ash mass was 132 kg/m3, giving 9.24 kg/m3 Na2SiO3 and 6.336 kg/m3 NaOH, reported as 6.34 kg/m3. Binder compressive strengths at 3, 7, and 28 d were 25.2, 26.4, and 27.3 MPa, and flexural strengths were 2.9, 4.0, and 4.9 MPa. At MSWIFA contents of 50%, 60%, and 70%, the screened 28 d strengths were 32.71, 27.32, and 19.74 MPa. The selected 60% mixture balanced greater MSWIFA incorporation with strength retention.
2.2.2. Artificial Lightweight Aggregate
The artificial lightweight aggregate (ALA) was manufactured by cold-bonded pelletization of an alkali-activated binding phase and two MSWIBA size fractions. Based on the combined dry precursor and MSWIBA mass, excluding added activators, the alkali-activated binding phase accounted for 40%, whereas the 0–2.36 and 2.36–4.75 mm MSWIBA fractions each accounted for 30%. The mass ratio of the two MSWIBA fractions was 1:1, and the water-to-solids ratio of the pelletization mixture was 0.28.
The pelletization binding phase comprised MSWIFA, GGBFS, and coal fly ash at 40%, 48%, and 12% of its dry precursor mass. Per 1 kg of combined dry precursor and bottom ash feed, excluding activators, the quantities were 160 g MSWIFA, 192 g GGBFS, 48 g coal fly ash, and 300 g of each fine MSWIBA fraction. Applying the same activator basis to the 240 g of GGBFS plus coal fly ash gave 16.80 g instant Na2SiO3 and 11.52 g NaOH. Pelletization water was 280 g per kilogram of precursor-plus-bottom ash feed, including activator preparation water. Thus, the quoted water ratio of 0.28 and feed fractions exclude dry activator mass from their denominator.
The binding phase was mixed first, followed by the two MSWIBA fractions and the remaining water. The mixture was processed in an extrusion pelletizer. The finished ALA used in the concrete had a particle size range of 2.36–4.75 mm. It was cured naturally for 1 d, then sealed and cured under standard conditions. At 28 d, its bulk density, apparent density, water absorption, and cylinder compressive strength were 1164 kg/m3, 1911 kg/m3, 8.6%, and 14.1 MPa, respectively. The 2.36–4.75 mm finished product range is distinct from the two raw MSWIBA feed fractions (0–2.36 and 2.36–4.75 mm).
Additional characterization comprised qualitative XRD of the raw ashes and SEM of MSWIFA and the hardened 60% MSWIFA binder. Fractured binder pieces were vacuum-dried before SEM examination.Figure 1presents the MSWIBA diffraction pattern and representative SEM images.
2.2.3. Direct Use of Coarse MSWIBA
The 4.75–9.5 mm MSWIBA fraction was used directly without pelletization and combined with the 2.36–4.75 mm ALA. Their loose volume ratio was varied as a mixture-design factor. Together, these constituents formed the ALA–coarse MSWIBA aggregate system. Natural sand was added separately, and the alkali-activated binder bonded the aggregate particles.
2.3. Concrete Mixture Design
The orthogonal mixtures were designed using the loose volume method for a target 28 d compressive strength of 20 MPa. Each nominal cubic meter contained 330 kg of dry precursor, comprising 198.0 kg MSWIFA, 105.6 kg GGBFS, and 26.4 kg coal fly ash. Added instant Na2SiO3 and NaOH were 9.24 and 6.34 kg, respectively. Quantities are reported on the nominal design volume basis; fresh concrete yield was not independently measured.
The water-to-binder ratio was defined as the total mixing water mass divided by the dry binder mass; the total water included the water used to prepare the activator. At water-to-binder ratios of 0.55, 0.60, and 0.65, the total water contents were 181.5, 198.0, and 214.5 kg/m3, respectively. The ALA and coarse MSWIBA were added in the dry state without prewetting, and no additional absorption compensation water was included. The higher water absorption of ALA (8.6%) compared with coarse MSWIBA (5.13%) can reduce the water available to the paste during mixing. Accordingly, the stated water-to-binder ratios represent total mixing water.
The total loose volume of natural sand, ALA, and coarse MSWIBA was fixed at 1.20 m3 per nominal design cubic meter of concrete. The sand ratio was defined as the loose volume of natural sand divided by the total loose aggregate volume. Because the finished ALA was 2.36–4.75 mm, this design parameter describes the natural sand share only, not the total fine aggregate fraction. The remaining loose aggregate volume was apportioned between ALA and 4.75–9.5 mm MSWIBA at the stated ratio. Aggregate masses were calculated using conversion densities of 1911, 1164, and 1177 kg/m3 for natural sand, ALA, and coarse MSWIBA, respectively. A three-factor, three-level L9 (33) array varied water-to-binder ratio, natural sand ratio, and ALA-to-coarse MSWIBA loose volume ratio. The quantities per nominal cubic meter are listed in Table 2.
Table 2.
Mixture proportions for the orthogonal experiment.
Five control mixtures compared binder type and natural stone replacement by ALA (Table 3). Each contained 330 kg/m3 dry cement or precursor, 181.5 kg/m3 total water, a nominal water-to-binder ratio of 0.55, and a loose volume sand ratio of 33%. K1-K4 used cement; K5 used the same 60:32:8 precursor and activator dosages as the orthogonal mixtures. The natural stone:ALA ratios were 3:7, 2:8, and 1:9 in K2–K4. Total loose aggregate volume was adjusted between control mixtures rather than fixed at 1.20 m3. Replacement of natural stone by 2.36–4.75 mm ALA changed the aggregate grading and water demand, so the controls provide comparisons of the complete formulations. The stated sand ratio refers to natural sand only.
Table 3.
Control mixture conditions and aggregate quantities on the nominal design volume basis.
2.4. Specimen Preparation and Curing
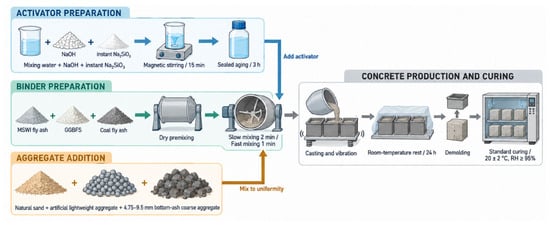
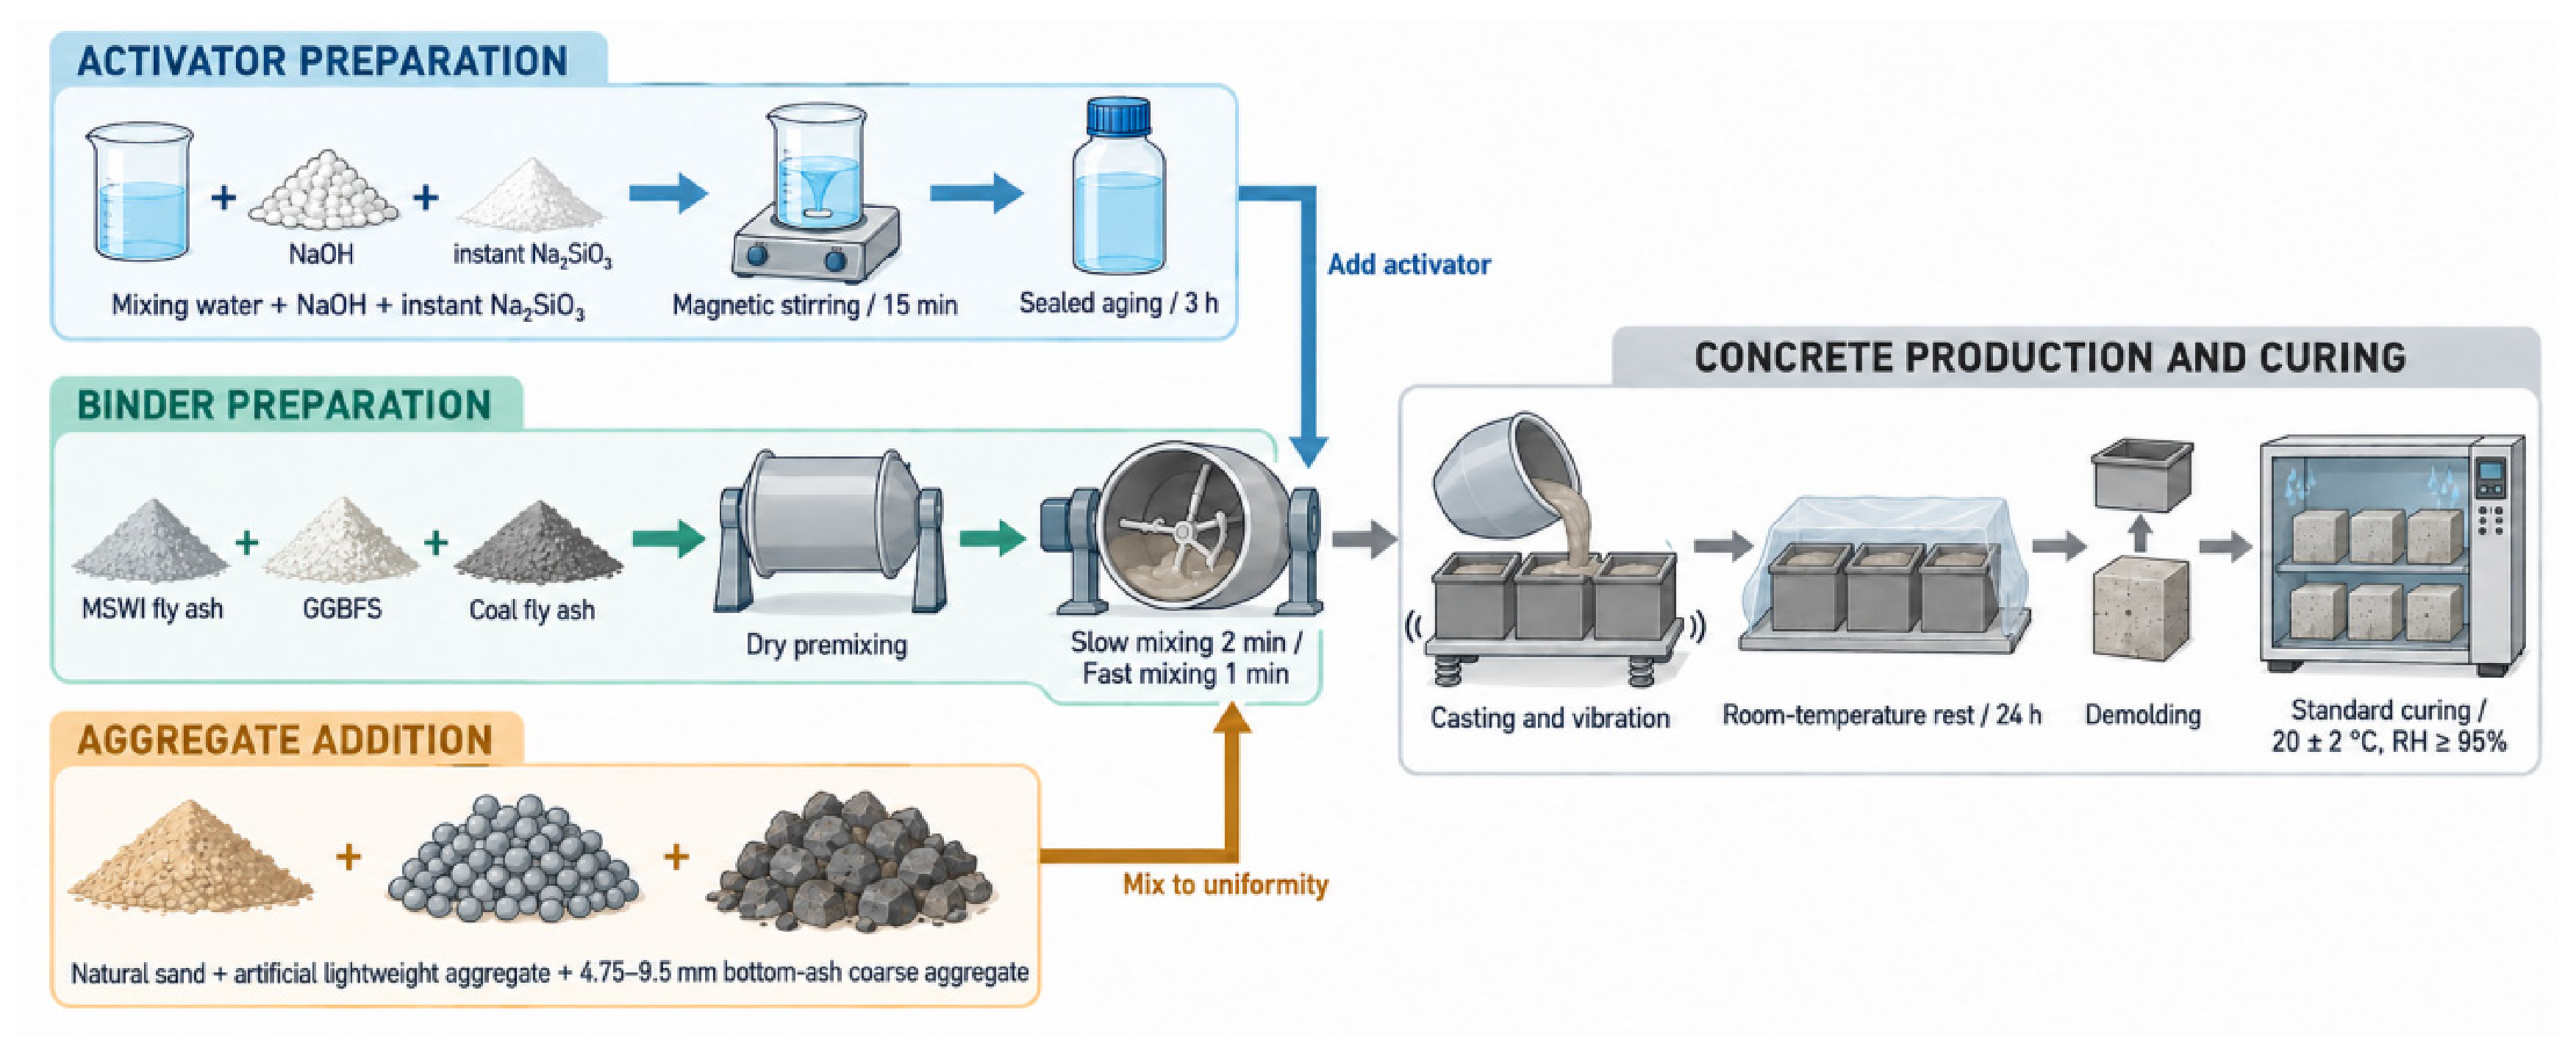
The weighed NaOH and instant Na2SiO3 were added to the mixing water in batches and stirred magnetically for 15 min. After the solution became uniform and free of visible precipitate, it was sealed and aged for 3 h. MSWIFA, GGBFS, and coal fly ash were dry-mixed to homogeneity, after which the activator was added. The mixture was stirred at low speed for 2 min and then at high speed for 1 min to produce a homogeneous alkali-activated paste. Natural sand, ALA, and 4.75–9.5 mm coarse MSWIBA were added according to Table 2 and mixed until uniform. The fresh concrete was cast into molds and compacted on a vibrating table. Specimens were kept at room temperature for 24 h, demolded, and then cured at 20 ± 2 °C and a relative humidity of at least 95% until testing. The preparation procedure is shown in Figure 2.
Figure 2.
Preparation and curing procedure for the alkali-activated concrete.
2.5. Test and Evaluation Methods
2.5.1. Workability
The slump test was conducted at 20 ± 5 °C immediately after concrete mixing. The slump cone was filled in three layers, and each layer was rodded uniformly 25 times. The cone was then lifted vertically, and the slump was measured. Testing was completed within 5 min after mixing.
2.5.2. Compressive Strength
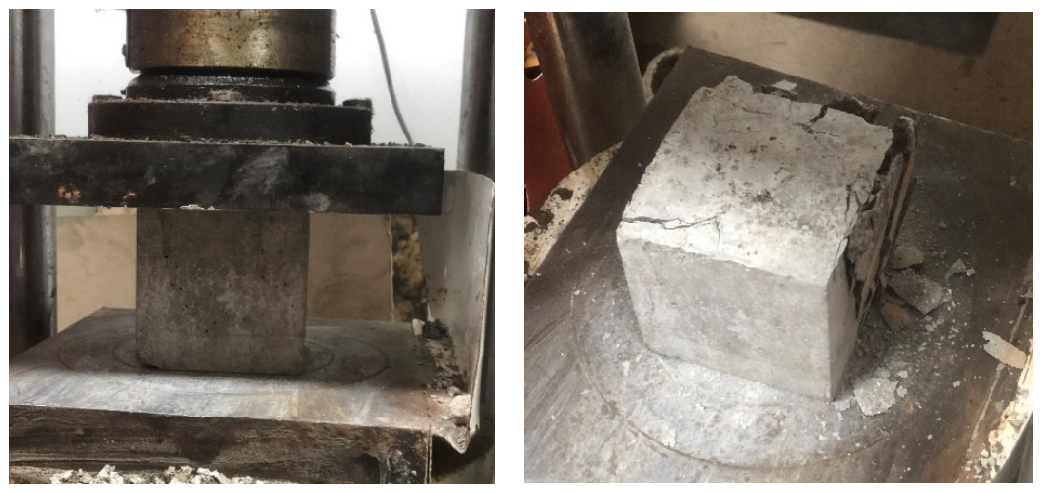
Compressive strength was measured on 150 × 150 × 150 mm cubes after 7 and 28 d of standard curing. Continuous loading at 0.3–0.5 MPa/s was applied until failure. The same procedure was used for orthogonal and control mixtures. For each mixture and age, the reported mean and sample standard deviation (SD) were calculated from three independently prepared batch means (n = 3). The compressive strength test is illustrated in Figure 3.
Figure 3.
Compressive strength test.
2.5.3. Freeze–Thaw Resistance
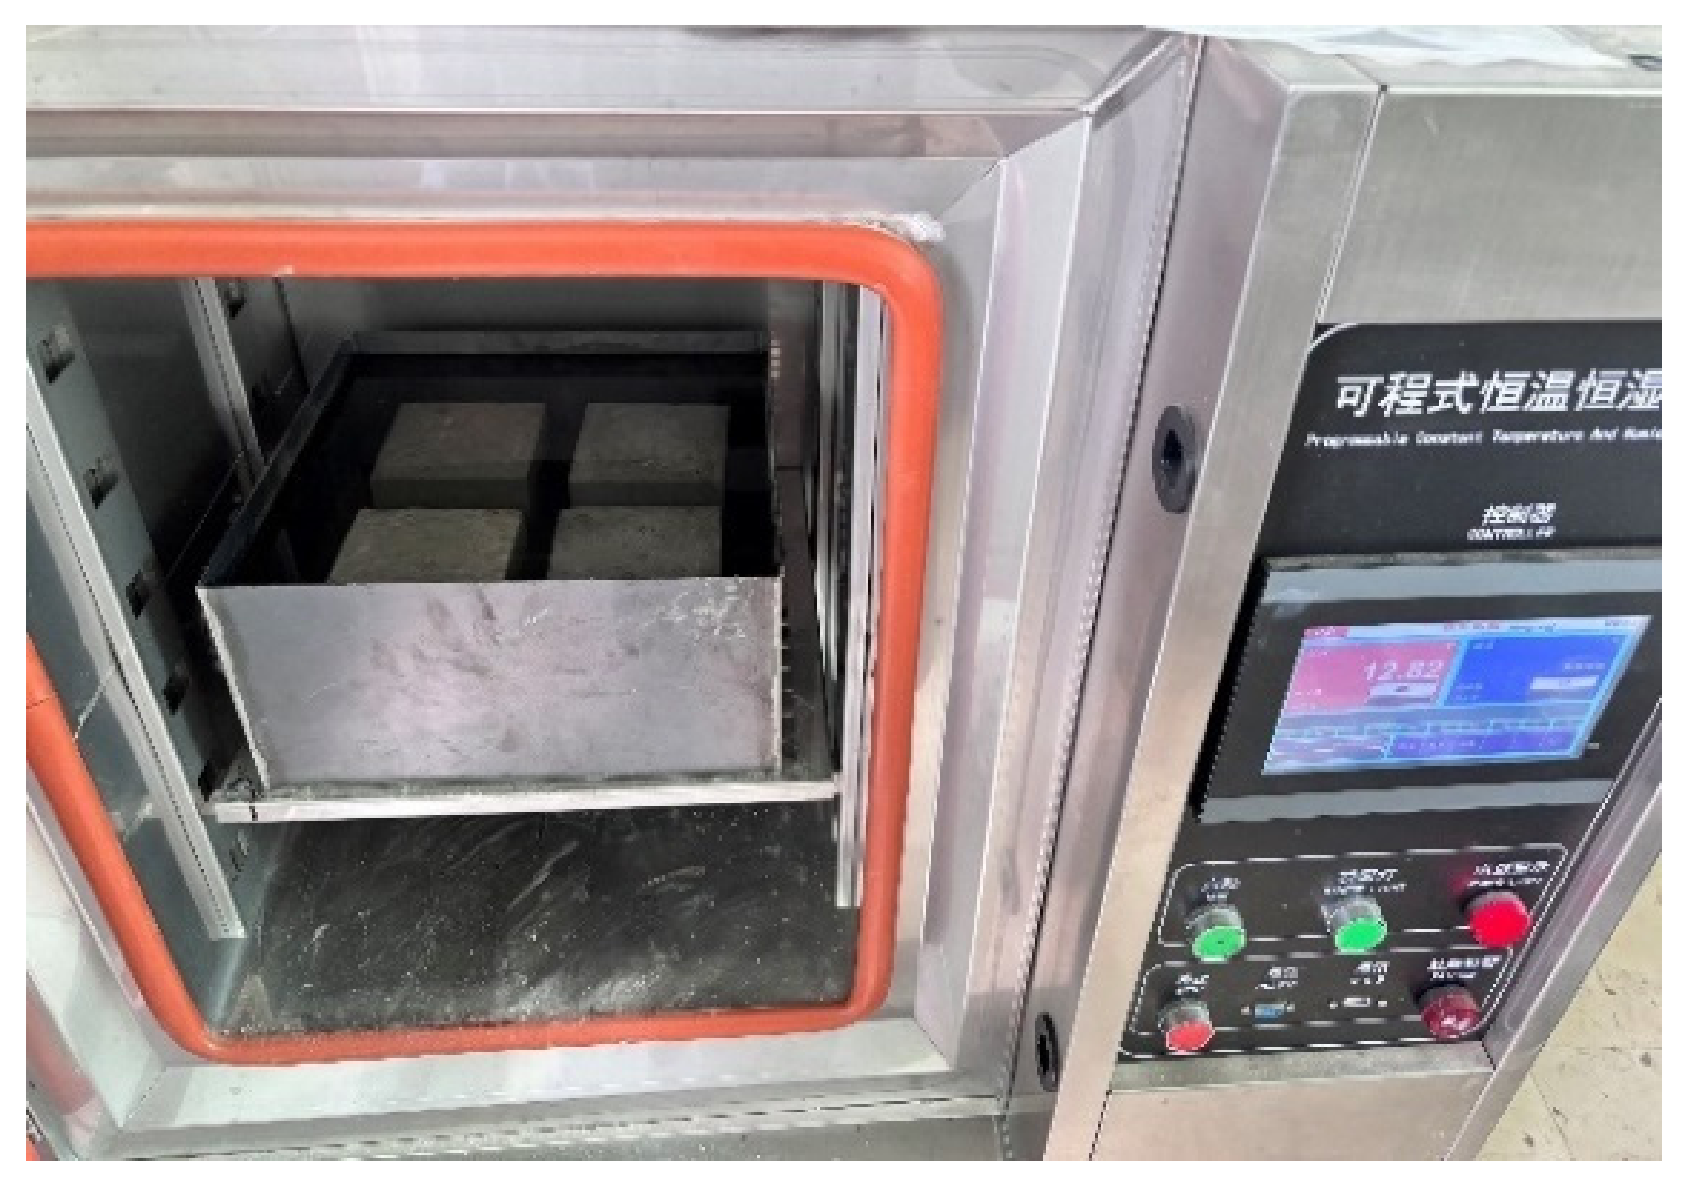
Mixtures A1, A4, A7, and A9 were selected for slow freeze–thaw testing after 28 d of standard curing. The specimens were 150 × 150 × 150 mm cubes. Three specimens, one from each independently prepared batch, were monitored repeatedly. Each cycle comprised freezing at −20 °C for 4 h and thawing at 20 °C for 4 h. Relative dynamic elastic modulus was measured every 25 cycles, and mass every 50 cycles and at termination. Relative modulus was calculated as 100(fn/f0)2, where f0 and fn are the initial and current fundamental frequencies; mass loss was 100(m0 − mn)/m0. Testing stopped at the first monitored node where the mean relative modulus was at most 60% or mean mass loss reached 5%. Values are means ± sample SD across the three specimens. The same specimens were followed throughout testing, and each series ends at its recorded termination node. The freeze–thaw test setup is shown in Figure 4.
Figure 4.
Freeze–thaw test. The Chinese control-panel label identifies a programmable temperature and humidity chamber.
2.5.4. Strength Retention After 180 d of Sulfate Immersion
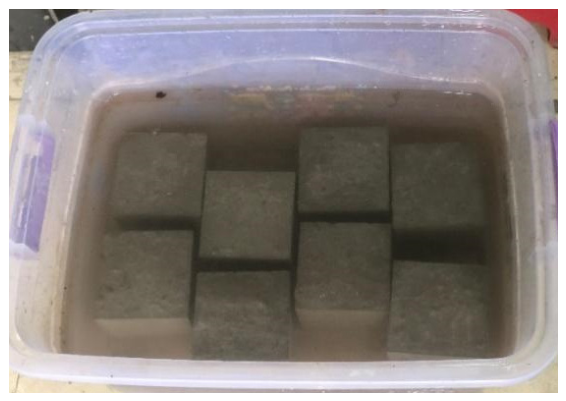
Sulfate resistance was evaluated by continuous immersion. Following 28 d of standard curing, 150 × 150 × 150 mm cubes of A1, A4, A7, and A9 were immersed in 5 wt.% Na2SO4 at 25 ± 2 °C for 180 d; the solution was renewed every 30 d. After immersion, the exposed specimens were removed, and surface solution was wiped off with a damp cloth. Both the exposed specimens and age-matched standard-cured reference specimens were then air-dried at 20 ± 2 °C for 24 h before compressive strength testing. High-temperature oven drying was not used. The same post-conditioning temperature and duration were applied to both groups to standardize the comparison. The strength retention coefficient K was defined as 100 fs/fr, where fs and fr are the mean strengths of the exposed and reference specimens, respectively. A coefficient of 75% was adopted as the study comparison criterion. The sulfate immersion specimens are shown in Figure 5.
Figure 5.
Specimens immersed in 5 wt.% Na2SO4 solution.
2.5.5. Heavy Metal Leaching
Leaching followed the horizontal vibration extraction procedure of HJ 557-2010 [28]. After 28 d of curing, concrete was cleaned, crushed, and sieved below 9.5 mm. A dry mass-equivalent 100 g sample was placed in a 2 L polyethylene container with 1 L distilled water. It was agitated for 8 h at 110 ± 10 cycles/min and 40 mm amplitude, then allowed to stand for 16 h. Leachate was filtered through a 0.45 μm membrane. Three independent extractions, one from each preparation batch, were analyzed; two instrument readings per extract were averaged and did not increase the independent sample size beyond n = 3. Total Cr, Cd, Pb, and Ni were measured by inductively coupled plasma mass spectrometry (ICP-MS). Filtered aliquots were acidified and diluted tenfold for analysis. Instrument calibration concentrations were 0, 0.005, 0.010, 0.050, 0.100, 0.500, and 1.000 μg/L. All reported results were corrected back to the original leachate concentration. Method detection limits were 0.05, 0.02, 0.05, and 0.01 μg/L for total Cr, Cd, Pb, and Ni, with quantification limits of 0.20, 0.08, 0.20, and 0.04 μg/L, respectively, on the original leachate basis. Quality control acceptance criteria were a procedural blank below the detection limit, matrix spike recovery of 80–120%, and continuing calibration deviation within ±10%. Cd, Pb, and Ni were compared with GB/T 14848-2017 [29] only as water contact screening benchmarks.
2.5.6. Data Analysis
Orthogonal factor ranges and contribution ratios were calculated from the nine mixture-level responses. Each strength response is the mean of three independent batch means. Level means average the three mixtures at each factor level; their maximum-minus-minimum difference defines the range. Strength SD bars describe variation across the three independent batch means. Leaching SD describes three independent extractions, and freeze–thaw SD describes three repeatedly monitored specimens.
Sum of squares contribution ratios were calculated from the nine mixture-level means. Let yi denote the response of mixture i (i = 1, …, 9), ȳ the grand mean, and ȳjl the mean at level l (l = 1, 2, 3) of factor j. Each factor level contains three mixtures. The total sum of squares SSt, factor sum of squares SSj, factor contribution Pj, unexplained sum of squares SSu, and unexplained contribution Pu were calculated as follows:
Pj = 100SSj/SSt
Pu = 100SSu/SSt
The unexplained contribution combines experimental variation and departures from the additive main effect model. Factor interactions were not separately resolved by the L9 design. For strength, a separate additive analysis of variance was fitted at each age using the 27 independent batch means, with three categorical factors (two degrees of freedom each) and 20 residual degrees of freedom. The model assumes independent batch errors and approximately constant error variance; the resulting tests assess factor main effects.
3. Results and Discussion
3.1. Workability of the MSWI Residue Concrete
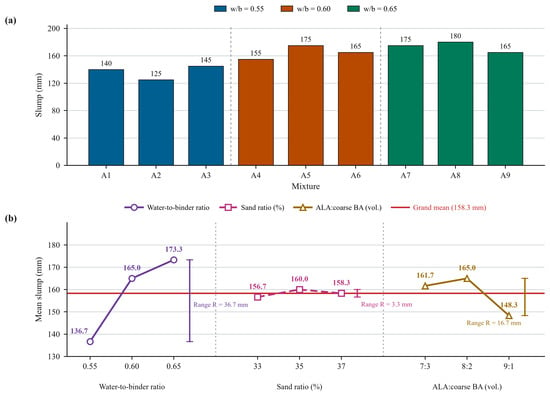
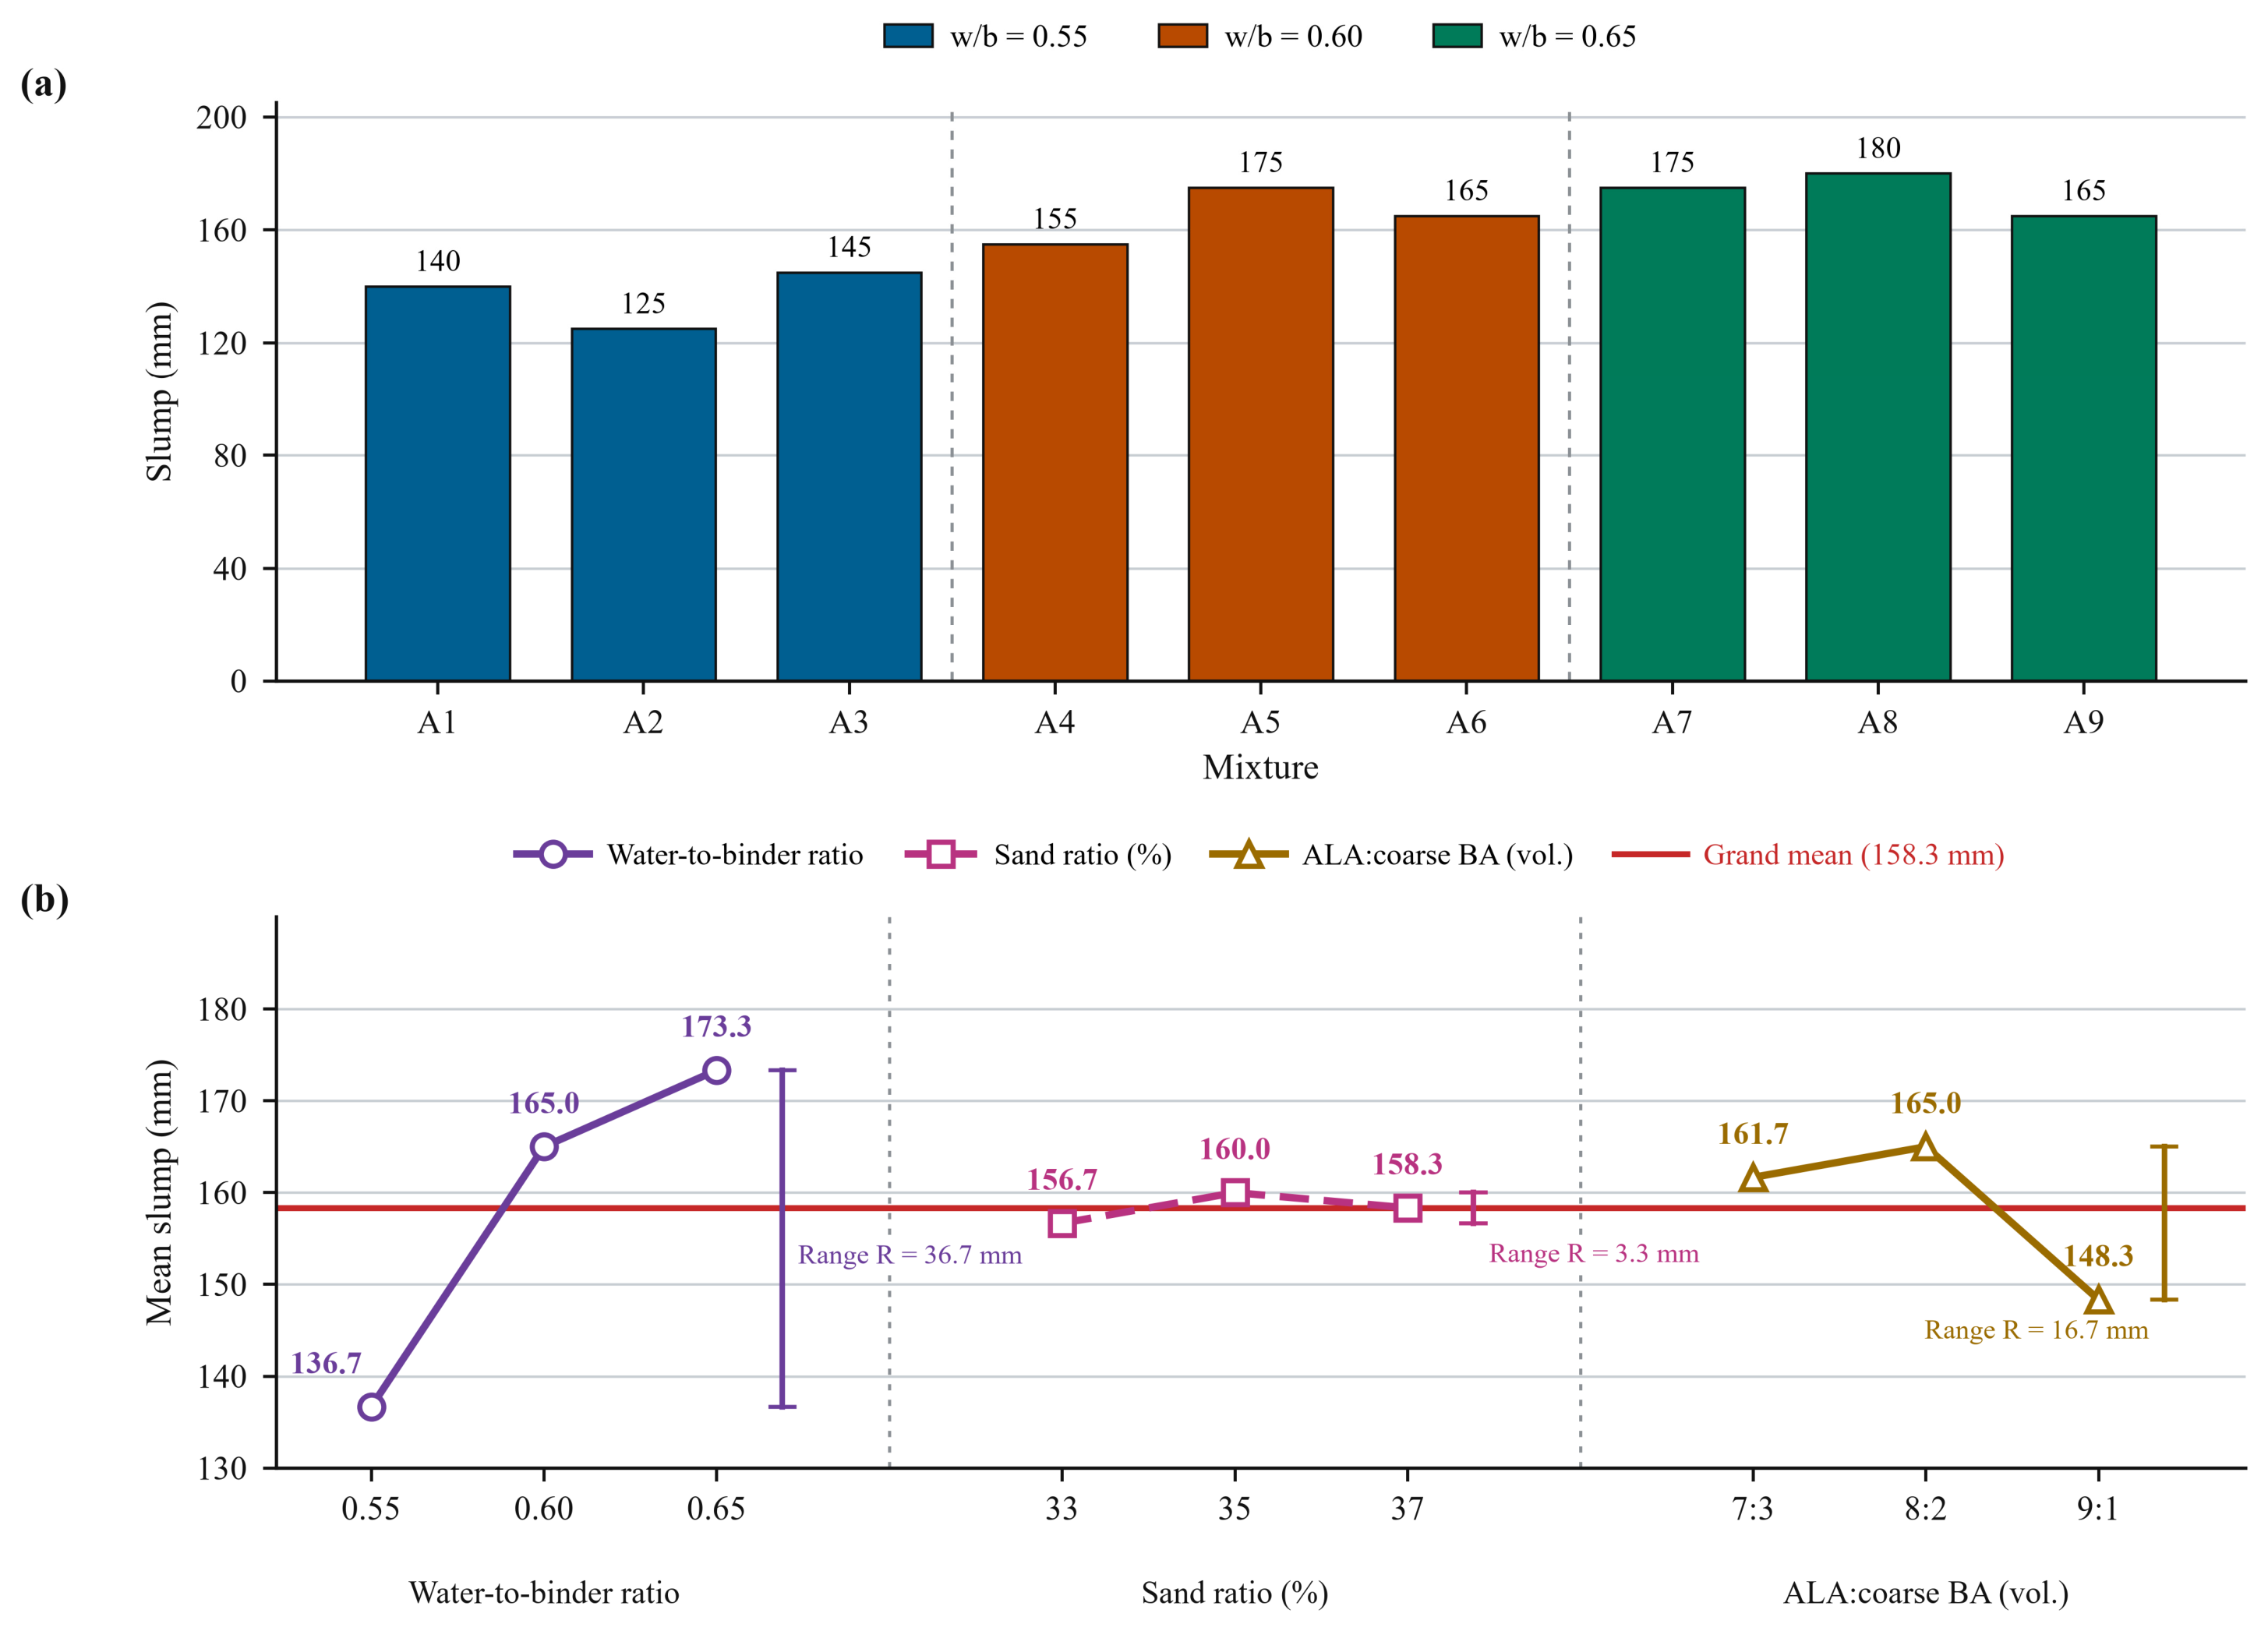
The slump results are shown in Figure 6a. The measured values ranged from 125 to 180 mm, with a grand mean of 158.3 mm. A2 exhibited the lowest slump (125 mm), whereas A8 exhibited the highest value (180 mm). Slump generally increased with the water-to-binder ratio; nevertheless, differences remained among mixtures at the same water-to-binder ratio, indicating additional effects of sand ratio and ALA-to-coarse MSWIBA ratio.
Figure 6.
Effects of mixture parameters on concrete slump: (a) measured slump of mixtures A1–A9; (b) factor-level means and ranges. ALA denotes artificial lightweight aggregate, and coarse BA denotes the 4.75–9.5 mm bottom ash aggregate.
The main effects were represented by the mean slump of the three mixtures at each factor level (Figure 6b). At water-to-binder ratios of 0.55, 0.60, and 0.65, the mean slumps were 136.7, 165.0, and 173.3 mm, respectively, giving a range R of 36.7 mm. Increasing the water-to-binder ratio from 0.55 to 0.60 increased the mean slump by 28.3 mm, whereas a further increase to 0.65 produced an additional increase of only 8.3 mm. The improvement in workability therefore diminished at the highest investigated level. At sand ratios of 33%, 35%, and 37%, the mean slumps were 156.7, 160.0, and 158.3 mm, respectively, and the range was only 3.3 mm. Thus, sand ratio had a comparatively small effect within the investigated interval.
At ALA-to-coarse bottom ash volume ratios of 7:3, 8:2, and 9:1, the mean slumps were 161.7, 165.0, and 148.3 mm, respectively, giving a range of 16.7 mm. The highest slump occurred at 8:2, whereas a further increase in the ALA proportion to 9:1 markedly reduced slump. This response may reflect the combined particle shape and absorption characteristics of the two aggregates. The rough surface of coarse MSWIBA may increase interparticle friction at high contents, whereas the comparatively regular but more absorptive ALA may reduce the free water available to the paste when its proportion becomes excessive. Previous studies similarly indicate that water absorption and interfacial characteristics of solid waste lightweight aggregates affect workability and transport behavior [18,21]. The aggregate composition response therefore reflects both particle packing and water demand.
Based on the ranges, the influence on slump within the investigated levels followed the order water-to-binder ratio > ALA-to-coarse MSWIBA ratio > sand ratio. The water-to-binder ratio produced the largest variation, whereas changing the sand ratio from 33% to 37% produced only a small response.
3.2. Mechanical Performance of the MSWI Residue Concrete
3.2.1. Effect of Mixture Proportions on Compressive Strength
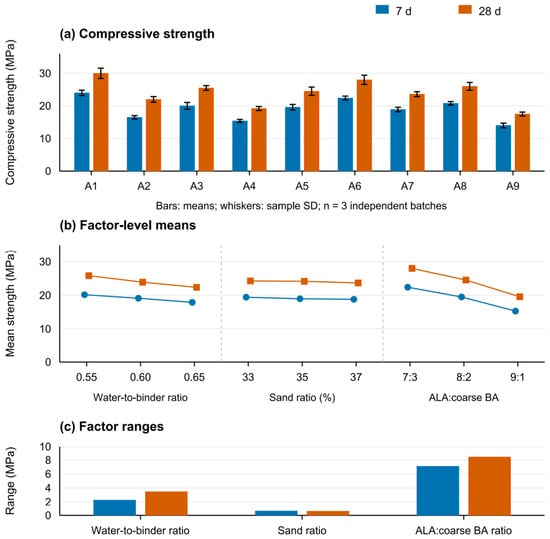
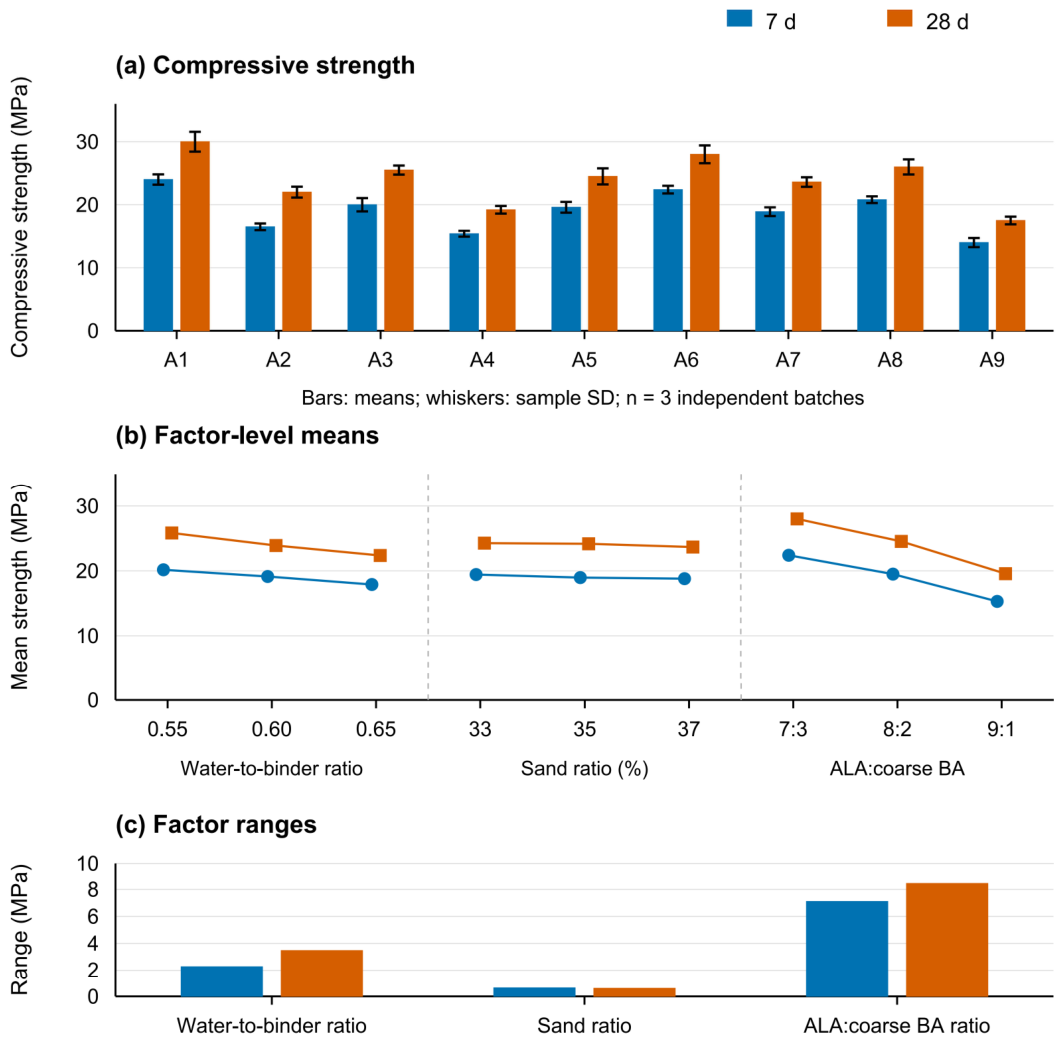
The mean compressive strengths, between-batch SDs, and factor analysis are presented in Figure 7. As shown in Figure 7a, the 7 and 28 d compressive strengths ranged from 14.0 to 24.0 MPa and from 17.5 to 30.0 MPa, respectively. Strength increased for every mixture between 7 and 28 d, with increments of 3.5–6.0 MPa, consistent with continued strength development after 7 d. The 7 d strength represented 75.0–80.2% of the corresponding 28 d value. A1 achieved the highest strengths at both ages (24.0 and 30.0 MPa), whereas A9 exhibited the lowest values (14.0 and 17.5 MPa), demonstrating substantial mixture-dependent variation.
Figure 7.
Compressive strength and factor analysis: (a) mean 7 and 28 d compressive strengths with sample SD bars (n = 3 independent batches per mixture and age); (b) factor-level means calculated across the three different mixtures at each level; (c) ranges of the factor-level means. The sand ratio is the natural sand share of total loose aggregate volume. ALA denotes 2.36–4.75 mm artificial lightweight aggregate, and coarse BA denotes 4.75–9.5 mm MSWIBA. Note: The SDs describe variation among independent batch means. Within-batch cubes are subsamples. In panel (b), blue circles and orange squares denote 7 d and 28 d strengths, respectively; the same color coding is used in panels (a,c).
The two ages showed the same response to water-to-binder ratio (Figure 7b). When the ratio increased from 0.55 to 0.65, the mean 7 d compressive strength decreased from 20.2 to 17.9 MPa and the mean 28 d strength decreased from 25.8 to 22.4 MPa. A lower water-to-binder ratio therefore favored strength under the present conditions. A similar trend has been reported for phosphogypsum lightweight aggregate concrete, whose compressive strength decreased as the net water-to-cement ratio increased [30]. Together with the workability results in Section 3.1, these data reveal a direct design trade-off: additional water improved slump but reduced the load bearing capacity of the hardened concrete.
Changes in sand ratio produced comparatively small strength differences. As the sand ratio increased from 33% to 37%, the mean 7 d strength decreased from 19.4 to 18.8 MPa, whereas the mean 28 d strength decreased from 24.3 to 23.7 MPa. The gradual and limited reductions at both ages indicate that sand ratio adjustment had only a minor influence within the range of 33–37%.
The ALA-to-coarse MSWIBA ratio produced the largest strength variation. Increasing the ALA-to-coarse bottom ash volume ratio from 7:3 to 9:1 reduced the mean 7 d strength from 22.4 to 15.3 MPa and the mean 28 d strength from 28.0 to 19.6 MPa. At both ages, strength decreased as the ALA fraction increased, identifying ALA-to-coarse MSWIBA ratio as a major mixture design variable. Although ALA had a higher cylinder compressive strength than coarse MSWIBA (14.1 versus 10.7 MPa), increasing its proportion reduced concrete strength. This suggests that aggregate grading, water absorption, and aggregate–paste interfaces also influenced the concrete response.
Figure 7c quantifies the magnitude of these main effects. At 7 d, the ranges associated with ALA-to-coarse MSWIBA ratio, water-to-binder ratio, and sand ratio were 7.10, 2.27, and 0.63 MPa, respectively; at 28 d, the corresponding values were 8.43, 3.47, and 0.60 MPa. The factor ranking was therefore ALA-to-coarse MSWIBA ratio > water-to-binder ratio > sand ratio at both ages. With continued curing, the absolute differences associated with aggregate composition and water-to-binder ratio increased, whereas the effect of sand ratio remained nearly unchanged.
Exploratory additive ANOVA of batch means gave F(2,20) = 21.42 and 22.23 for water-to-binder ratio at 7 and 28 d, respectively (both p < 0.001), and F(2,20) = 212.00 and 132.33 for ALA-to-coarse MSWIBA ratio (both p < 0.001). Sand ratio gave F(2,20) = 1.79 (p = 0.192) and 0.76 (p = 0.480). Thus, water-to-binder ratio and ALA-to-coarse MSWIBA ratio were significant main effects at both ages, whereas sand ratio was not significant at the 0.05 level.
Representative SEM images of the 60% MSWIFA binder show heterogeneous agglomerates, needle-like features, plate-like regions, and incompletely reacted particles (Figure 1c,d), consistent with a partially reacted binding network. Zhan and Kirkelund used complementary FTIR and SEM evidence for treated Danish MSWIFA geopolymers [6], providing a comparison for the binder morphology. Differences in pretreatment, precursor composition, and specimen type should be considered in this comparison. Using incinerator fly ash from Singapore, Liu et al. found that low ash reactivity hindered gel formation and reduced the strength of alkali-activated slag binders [13]. This highlights the importance of reactive precursor content when designing MSWIFA-rich binders.
3.2.2. Effects of Binder Type and Aggregate Composition
Control mixture strengths are reported as mean ± between-batch SD in Table 4 (n = 3 independent batches). Control proportions and nominal water-to-binder ratios are specified in Table 3 and its notes.
Table 4.
Compressive strength of control concretes and A1, mean ± sample SD across three independent batches.
The 7 d compressive strengths of K1 and K5 were 23.2 and 23.9 MPa, respectively; the K5 mean was 3.0% higher than that of K1. Their 28 d strengths were 32.8 and 30.2 MPa, respectively, and the K5 mean was 7.9% lower than that of K1. Between 7 and 28 d, the strength increases of K1 and K5 were 9.6 and 6.3 MPa, and their 7 d strengths represented 70.7% and 79.1% of their respective 28 d strengths. The alkali-activated system therefore developed a larger proportion of its 28 d strength by 7 d, whereas the cement system exhibited greater strength gain between 7 and 28 d. This difference may be associated with rapid early reaction in the alkali-activated binder and continued hydration of the cement binder at later ages, consistent with reported age-dependent behavior of fly ash geopolymers and slag-containing binders [27].
With binder type held constant, the strength of K1-K4 generally decreased as the ALA proportion increased. Relative to K1, the 7 d strengths of K2, K3, and K4 decreased by 13.4%, 15.5%, and 24.6%, respectively, and the 28 d strengths decreased by 16.2%, 17.1%, and 29.6%. K2 and K3 had similar mean strengths, with a further decrease at 90% ALA in K4. Replacement of natural crushed stone by 2.36–4.75 mm ALA changes aggregate grading as well as absorption and interfacial area.
K5 and A1 had mean 7 d strengths of 23.9 and 24.0 MPa and mean 28 d strengths of 30.2 and 30.0 MPa, respectively. These observations indicate similar strength levels under the respective formulations.
Together, the control tests show that the alkali-activated system developed a larger fraction of its 28 d strength by 7 d, while the cement system gained more strength between 7 and 28 d. Increasing natural stone replacement by ALA was associated with lower strength in the cement-based series.
3.3. Durability of the MSWI Residue Concrete
3.3.1. Freeze–Thaw Resistance
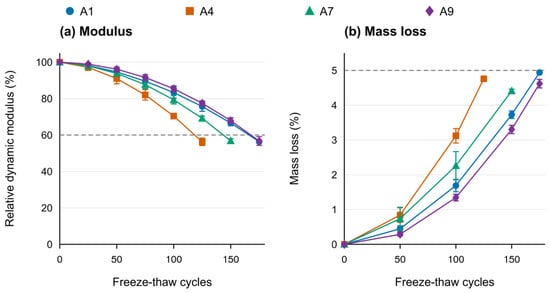
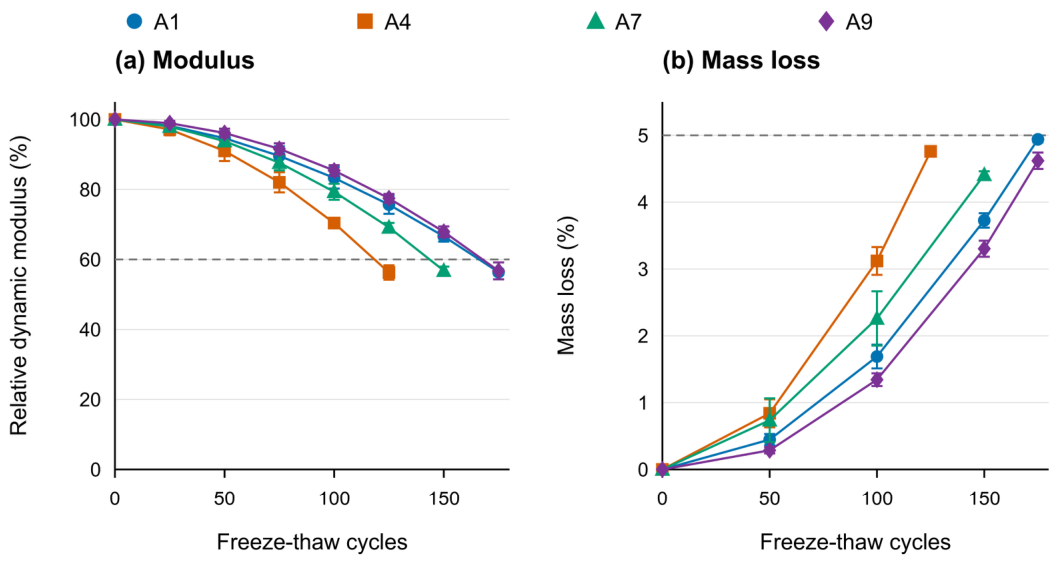
The monitored modulus and mass loss trajectories of A1, A4, A7, and A9 are shown in Figure 8. Curves end at each mixture’s first measured termination node.
Figure 8.
Freeze–thaw development: (a) relative dynamic elastic modulus; (b) mass loss. Points and bars show mean ± sample SD for three specimens, one per preparation batch. Horizontal dashed lines mark the 60% modulus and 5% mass loss criteria. Initial values are normalized to 100% modulus and 0% mass loss; their zero-plotted SD follows from normalization.
The measured termination nodes were 175, 125, 150, and 175 cycles for A1, A4, A7, and A9. Corresponding relative dynamic elastic moduli were 56.37 ± 0.81%, 56.27 ± 2.06%, 56.80 ± 1.15%, and 56.73 ± 2.42%, respectively. At the previous 25-cycle monitoring node, mean modulus remained above 60% for every mixture; at termination, all three specimens of each mixture were below 60%. Endpoint mass losses were 4.94 ± 0.05%, 4.76 ± 0.06%, 4.41 ± 0.05%, and 4.62 ± 0.12%, respectively. Thus, the monitored modulus criterion, rather than 5% mass loss, determined termination.
Based on the recorded termination cycles, A1 and A9 exhibited the longest freeze–thaw endurance among the four mixtures (175 cycles), followed by A7 (150 cycles) and A4 (125 cycles). At the common 175-cycle endpoint, A9 had a lower mean mass loss than A1 (4.62% versus 4.94%), indicating better mass retention at this exposure duration.
The different freeze–thaw responses may be associated with the combined effects of matrix pore structure, aggregate water absorption, and interfacial condition. The low water-to-binder ratio of A1 may reduce connected porosity in the hardened matrix and thereby slow water migration and damage accumulation. The porous ALA can provide space that partly accommodates water migration and freezing expansion, but at high contents it may also increase absorptive pores and weak interfacial regions. Previous studies of concrete containing lightweight MSWIBA aggregate similarly relate freeze–thaw deterioration to water absorption, pore structure, and aggregate–paste interfaces [21,24]. The German bottom ash study also identified aluminum-related reactions that can continue in the presence of moisture [25]. Chen et al. reported that treated bottom ash aggregates increased pore volume and microcracking and reduced freeze–thaw resistance in slag-based alkali-activated concrete in the Netherlands [26]. These findings support considering pore structure and interfacial integrity when interpreting the different freeze–thaw termination cycles observed here.
3.3.2. Strength Retention After 180dof Sulfate Immersion
Table 5 presents the strength retention coefficients of A1, A4, A7, and A9 after 180 d of continuous sulfate immersion. Exposed and age-matched reference specimens received the same 24 h air drying treatment before strength testing.
Table 5.
Strength retention coefficients after 180 d of continuous sulfate immersion.
The strength retention coefficients were 74.8%, 72.6%, 73.9%, and 73.1% for A1, A4, A7, and A9, respectively. A1 retained the highest fraction of reference strength. All four mixtures fell below the adopted 75% criterion, identifying sulfate resistance as a common durability weakness.
During continuous immersion, strength loss may involve ingress through connected pores and reactions involving calcium- and aluminum-bearing constituents. Sulfate deterioration of calcium-rich MSWIFA binders depends on binder chemistry and pore structure [15,16]. Post-exposure microstructural analysis would help distinguish the contributions of phase changes, pore structure, and cracking.
A1 combined a lower nominal water-to-binder ratio with the 7:3 ALA-to-coarse MSWIBA ratio and had the highest endpoint coefficient. A7 and A9 shared a water-to-binder ratio of 0.65 but differed in sand and ALA-to-coarse MSWIBA ratios; their coefficients differed by 0.8 percentage points. The narrow coefficient range and the common failure to reach 75% identify sulfate resistance as a priority for formulation improvement.
3.4. Heavy Metal Leaching Characteristics
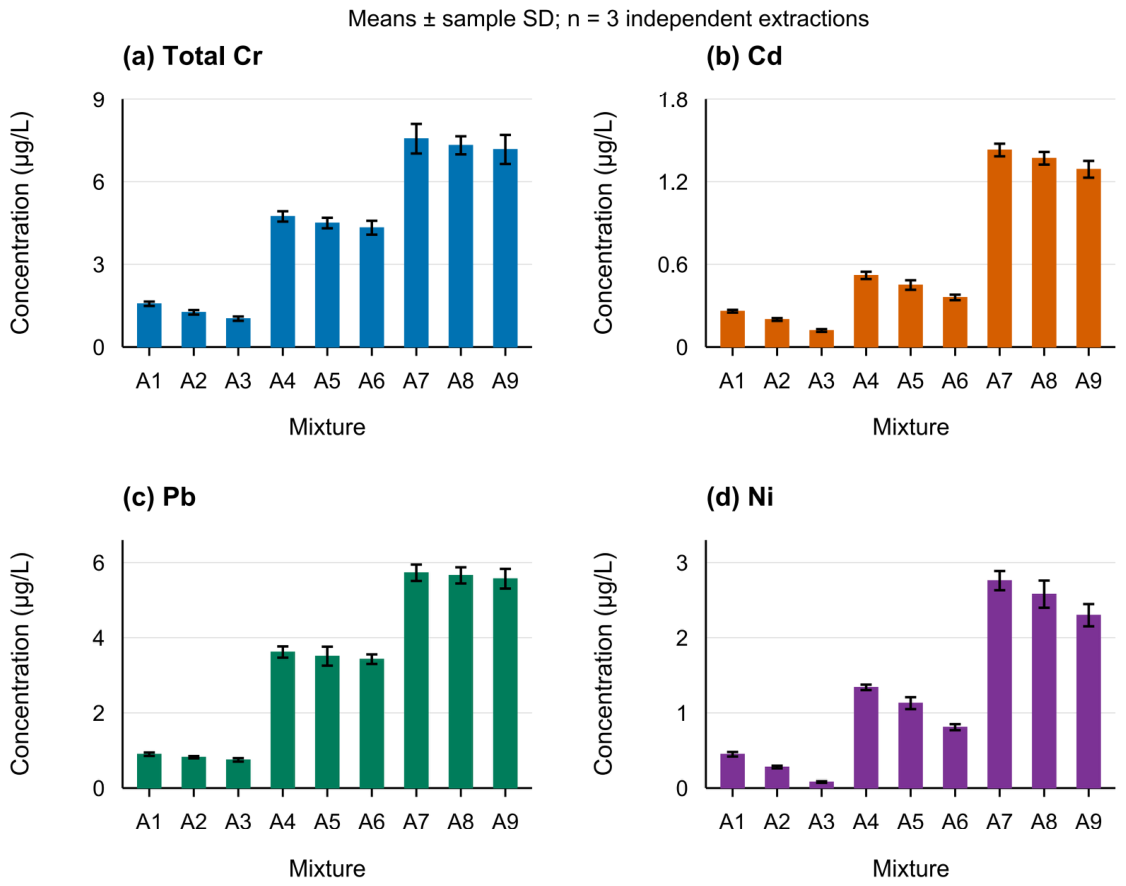
The leaching results for total Cr, Cd, Pb, and Ni are presented in Figure 9. The four analytes showed a consistent between-mixture pattern: concentrations were generally low for A1–A3, increased for A4–A6, and reached their highest levels for A7–A9. Differences among mixtures with the same water-to-binder ratio were comparatively small. This pattern indicates that the water-to-binder ratio accounted for a larger change in heavy metal leaching than either sand ratio or ALA-to-coarse MSWIBA ratio.
Figure 9.
Leaching concentrations of (a) total Cr, (b) Cd, (c) Pb, and (d) Ni in A1–A9. Bars and whiskers show means and sample SDs of three independent extractions, one per preparation batch. Instrument duplicate readings were averaged within each extract and were not counted as independent replicates. Concentrations refer to the original leachate before analytical dilution. Note: Cr denotes total Cr measured after filtration of the leachate through a 0.45 μm membrane.
At water-to-binder ratios of 0.55, 0.60, and 0.65, the mean leaching concentrations of total Cr were 1.29, 4.52, and 7.35 μg/L, respectively. The corresponding values were 0.19, 0.44, and 1.36 μg/L for Cd; 0.82, 3.52, and 5.65 μg/L for Pb; and 0.27, 1.09, and 2.55 μg/L for Ni. All four analytes therefore increased with increasing water-to-binder ratio. To compare the magnitudes of the mixture factor effects, ranges were calculated from the mean concentrations at the three levels of each factor (Figure 10).
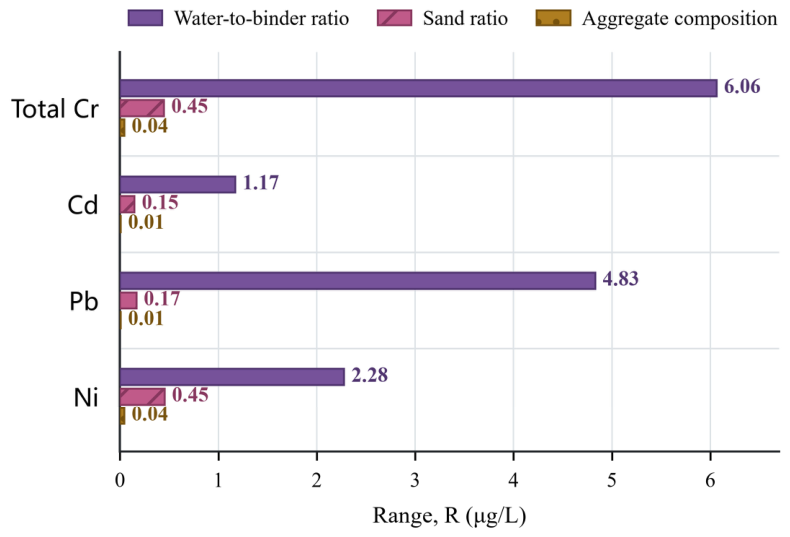
Figure 10.
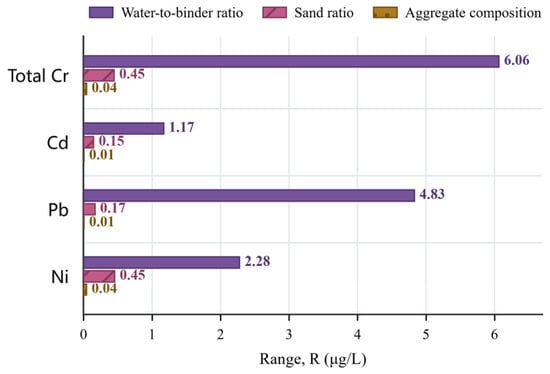
Ranges of the factor-level mean leaching concentrations.
As shown in Figure 10, the ranges associated with water-to-binder ratio were 6.06, 1.17, 4.83, and 2.28 μg/L for total Cr, Cd, Pb, and Ni, respectively, and were substantially larger than those associated with sand ratio or ALA-to-coarse MSWIBA ratio. For every analyte, the factor effect magnitude followed the order water-to-binder ratio > sand ratio > ALA-to-coarse MSWIBA ratio.
Alkali activation products can restrict heavy metal migration through physical encapsulation, adsorption, and chemical binding, whereas long-term release also depends on pore structure, exposure medium, and solution pH [5,14,17]. Ji et al. reported that a fly ash-based alkali-activated binder reduced heavy metal leaching from stabilized residue used as roadbed fill [27]. The increase in leaching concentration with water-to-binder ratio observed here may be associated with greater capillary porosity and pore connectivity in the hardened matrix. Conversely, a lower water-to-binder ratio may produce a denser binder matrix, improving encapsulation of fly ash particles and increasing resistance to ion transport.
The total Cr concentrations ranged from 1.03 to 7.56 μg/L. For reference screening against GB/T 14848-2017 [29], Cd, Pb, and Ni in A1–A6 were below the corresponding Class II values, whereas those in A7-A9 were between the Class II and Class III values. Their Class III reference values are 5, 10, and 20 μg/L, respectively. These values serve as screening benchmarks for potential water contact. Total Cr was not classified using the groundwater chromium criterion because the latter concerns Cr(VI). Interpretation should account for differences between laboratory extraction and field exposure in the medium, liquid-to-solid ratio, pH, and duration.
The 28 d extraction results support comparison of the four measured metals under the specified test conditions. Service-life assessment should address carbonation, changing pH, repeated water contact, and freeze–thaw or sulfate damage, which may alter metal retention [12,17,25]. The present tests did not include chloride, sulfate, organic contaminants, or leaching after durability exposure.
3.5. Engineering Applicability
In addition to range analysis, sum-of-squares contribution ratios were used to compare the relative proportions of the observed variation in slump, compressive strength, and heavy metal leaching associated with each mixture factor (Table 6). Water-to-binder ratio accounted for 80.6% of the slump variation; ALA-to-coarse MSWIBA ratio accounted for 89.6% and 84.3% of the 7 and 28 d compressive strength variation, respectively; and water-to-binder ratio accounted for 96.2–99.9% of the variation in total Cr, Cd, Pb, and Ni concentrations. Together with the range analysis, these results identify water-to-binder ratio as the primary design variable for workability and short-term metal release, and ALA-to-coarse MSWIBA ratio as the primary variable for strength within the tested factor levels.
Table 6.
Sum of squares contribution ratios of mixture factors to measured response variation.
MSWI residues were incorporated into the matrix and both aggregate routes. Before activator addition, the ALA feed contained 16% MSWIFA and 60% MSWIBA, giving 76% combined MSWI residues on the precursor-plus-bottom ash feed basis. This percentage describes the ALA manufacturing feed; the residue fraction in finished concrete additionally depends on activators, retained water, curing losses, and fresh concrete yield.
The laboratory results identify the following priorities for engineering development:
(1) A1 is the preferred formulation for further evaluation of unreinforced precast road accessories, combining a 28 d mean strength of 30.00 MPa, a freeze–thaw termination node of 175 cycles, and low short-term metal release. Its 180 d sulfate strength retention coefficient of 74.8% indicates that sulfate resistance requires improvement for sustained sulfate contact.
(2) A3 and A6 also achieved relatively high strength and low short-term leaching, providing alternatives for additional durability testing. Durability comparisons in this study concern the four tested formulations. Component validation should establish product-specific bending or splitting strength, abrasion resistance, water absorption, dimensional stability, and exposure performance.
(3) Controlling mixing water was the most effective of the investigated factors for limiting short-term metal release. Engineering verification should consider local freeze–thaw and sulfate exposure, repeated wetting, chloride release, and potential expansion reactions. Italian work on pre-washed MSWIFA showed the importance of salt removal alongside metal retention [12], while the northern German bottom ash study highlighted delayed aluminum-related damage [25].
4. Conclusions
(1) Within the tested factor levels, ALA-to-coarse MSWIBA ratio was the dominant factor for 28 d strength, accounting for 84.3% of the mixture mean strength variation. Water-to-binder ratio was the dominant factor for workability, accounting for 80.6% of slump variation.
(2) Mean 28 d strength ranged from 17.5 to 30.0 MPa. A1 reached 30.00 ± 1.57 MPa across three independent batches, close to the 30.20 ± 0.70 MPa mean of the alkali-activated natural stone control.
(3) A1 and A9 had the longest recorded freeze–thaw endurance, reaching the 175-cycle termination node. At termination, A1 had a relative dynamic modulus of 56.37 ± 0.81% and mass loss of 4.94 ± 0.05%. After 180 d of continuous sulfate immersion, strength retention coefficients were 72.6–74.8%, all below the adopted 75% criterion. Sulfate resistance was therefore a common weakness of the tested formulations.
(4) Increasing nominal water-to-binder ratio increased the short-term release of total Cr, Cd, Pb, and Ni. Under the specified extraction conditions, Cd, Pb, and Ni concentrations remained below the corresponding Class III groundwater screening benchmarks.
(5) The study demonstrates a coordinated route for incorporating MSWIFA into the matrix binder and artificial aggregate binding phase, reconstructing fine MSWIBA into aggregate, and directly using coarse MSWIBA. A1 is the leading candidate for further testing of unreinforced precast road components. Component-scale validation should prioritize sulfate resistance, abrasion, water absorption, dimensional stability, and long-term leaching.
Author Contributions
Conceptualization, T.L. and X.J.; methodology, X.J. and H.S.; validation, J.Z., P.L., H.W. and T.G.; formal analysis, T.L. and H.S.; investigation, T.L., J.Z., P.L., T.G. and H.S.; resources, J.Z. and P.L.; data curation, T.L. and H.S.; writing—original draft preparation, T.L. and H.S.; writing—review and editing, J.Z., X.J., P.L., H.W. and T.G.; visualization, H.S.; supervision, X.J.; project administration, J.Z. and X.J. All authors have read and agreed to the published version of the manuscript.
Funding
This research was funded by the Transportation Science and Technology Project of Shaanxi Province, grant number 23-97K.
Institutional Review Board Statement
Not applicable.
Informed Consent Statement
Not applicable.
Data Availability Statement
The mixture-level results presented in this study are included in the article. Further inquiries regarding the available supporting data may be directed to the corresponding author.
Conflicts of Interest
Author Tingting Li was employed by Jiantou Management and Operation Co., Ltd., Shaanxi Transportation Holding Group. Authors Jianqiao Zhang, Peng Li, and Tianyang Gao were employed by the Jingkun Expressway Reconstruction and Expansion Project Management Office, Shaanxi Transportation Holding Group. The remaining authors declare that the research was conducted in the absence of any commercial or financial relationships that could be construed as a potential conflict of interest.
References
- Teng, F.; Wang, Z.; Ren, K.; Liu, S.; Ding, H. Analysis of composition characteristics and treatment techniques of municipal solid waste incineration fly ash in China. J. Environ. Manag. 2024, 357, 120783. [Google Scholar] [CrossRef] [Scilit]
- Wu, H.; Liu, H.; Tian, S.; Lu, G.; Hao, Y. Current situation for utilization and disposal and environmental management of fly ash from municipal solid waste incineration. J. Environ. Eng. Technol. 2021, 11, 1034–1040. (In Chinese) [Google Scholar] [CrossRef]
- Lan, T.; Meng, Y.; Ju, T.; Chen, Z.; Du, Y.; Deng, Y.; Song, M.; Han, S.; Jiang, J. Synthesis and application of geopolymers from municipal waste incineration fly ash (MSWI FA) as raw ingredient: A review. Resour. Conserv. Recycl. 2022, 182, 106308. [Google Scholar] [CrossRef] [Scilit]
- Long, L.; Jiang, X.; Lv, G.; Chen, Q.; Liu, X.; Chi, Y.; Yan, J.; Zhao, X.; Kong, L.; Qiu, Q. Comparison of MSWI fly ash from grate-type and circulating fluidized bed incinerators under landfill leachate corrosion scenarios: The long-term leaching behavior and speciation of heavy metals. Environ. Sci. Pollut. Res. 2022, 29, 15057–15067. [Google Scholar] [CrossRef] [Scilit]
- Fan, C.; Wang, B.; Ai, H.; Qi, Y.; Liu, Z. A comparative study on solidification/stabilization characteristics of coal fly ash-based geopolymer and Portland cement on heavy metals in MSWI fly ash. J. Clean. Prod. 2021, 319, 128790. [Google Scholar] [CrossRef] [Scilit]
- Zhan, X.Y.; Kirkelund, G.M. Electrodialytic remediation of municipal solid waste incineration fly ash as pre-treatment before geopolymerisation with coal fly ash. J. Hazard. Mater. 2021, 412, 125220. [Google Scholar] [CrossRef] [Scilit]
- Long, L.; Zhao, Y.; Lv, G.; Duan, Y.; Liu, X.; Jiang, X. Improving stabilization/solidification of MSWI fly ash with coal gangue based geopolymer via increasing active calcium content. Sci. Total Environ. 2023, 854, 158594. [Google Scholar] [CrossRef] [Scilit]
- Liu, J.; Xie, G.; Wang, Z.; Li, Z.; Fan, X.; Jin, H.; Zhang, W.; Xing, F.; Tang, L. Synthesis of geopolymer using municipal solid waste incineration fly ash and steel slag: Hydration properties and immobilization of heavy metals. J. Environ. Manag. 2023, 341, 118053. [Google Scholar] [CrossRef] [Scilit]
- Feng, D.; Wang, J.; Chen, D.; Hou, W.; Liang, S. Experimental study on municipal solid waste incineration fly ash as a component of coal gangue geopolymer and the feasibility of making geopolymer mortar. Constr. Build. Mater. 2023, 409, 133862. [Google Scholar] [CrossRef] [Scilit]
- Tan, J.; De Vlieger, J.; Desomer, P.; Cai, J.; Li, J. Co-disposal of construction and demolition waste (CDW) and municipal solid waste incineration fly ash (MSWI FA) through geopolymer technology. J. Clean. Prod. 2022, 362, 132502. [Google Scholar] [CrossRef] [Scilit]
- An, S.; Wang, B.; Chen, W.; Yu, Z.; Fan, C. Preparation of geopolymer based on municipal solid waste incineration fly ash-phosphorus slag and its function for solidification of heavy metals. Waste Manag. 2024, 178, 186–198. [Google Scholar] [CrossRef] [Scilit]
- Ferone, C.; Colangelo, F.; Messina, F.; Santoro, L.; Cioffi, R. Recycling of pre-washed municipal solid waste incinerator fly ash in the manufacturing of low temperature setting geopolymer materials. Materials 2013, 6, 3420–3437. [Google Scholar] [CrossRef] [Scilit]
- Liu, Y.Q.; Zhu, W.P.; Yang, E.-H. Alkali-activated ground granulated blast-furnace slag incorporating incinerator fly ash as a potential binder. Constr. Build. Mater. 2016, 112, 1005–1012. [Google Scholar] [CrossRef] [Scilit]
- Sun, M.; Ma, L.; Dai, Q.; Yang, J.; Xie, L.; Hu, Y.; Duan, L.; Yan, X.; Zhou, G.; Zeng, L.; et al. Preparation of functional geopolymers from municipal solid waste incineration fly ash: An approach combining experimental and computational simulation studies. J. Environ. Manag. 2024, 355, 120226. [Google Scholar] [CrossRef] [Scilit]
- Bai, Y.; Guo, W.; Zhao, Q.; Zhang, N.; Xue, C.; Wang, S.; Song, Y. Performance deterioration of municipal solid waste incineration fly ash-based geopolymer under sulfuric acid attack. Constr. Build. Mater. 2023, 391, 131847. [Google Scholar] [CrossRef] [Scilit]
- Cao, X.; Yang, W.; Liu, S.; Fang, L.; Liu, R.; Ma, R. Durability of calcium-rich municipal solid waste incineration fly ash-based geopolymer to sulfate and sulfuric acid. Constr. Build. Mater. 2023, 405, 133389. [Google Scholar] [CrossRef] [Scilit]
- Liang, D.; Yan, J.; Wang, F.; Lv, G. The long-term leaching behavior of heavy metals in geopolymers and Portland cement bricks containing MSWI fly ash: A comparative study. J. Environ. Chem. Eng. 2024, 12, 112894. [Google Scholar] [CrossRef] [Scilit]
- Shen, P.; Zheng, H.; Lu, J.; Poon, C.S. Utilization of municipal solid waste incineration bottom ash (IBA) aggregates in high-strength pervious concrete. Resour. Conserv. Recycl. 2021, 174, 105736. [Google Scholar] [CrossRef] [Scilit]
- Liu, J.; Fan, X.; Li, Z.; Zhang, W.; Jin, H.; Xing, F.; Tang, L. Novel recycling application of high volume municipal solid waste incineration bottom ash (MSWIBA) into sustainable concrete. Sci. Total Environ. 2022, 838, 156124. [Google Scholar] [CrossRef] [Scilit]
- Liu, J.; Li, Z.; Zhang, W.; Jin, H.; Xing, F.; Chen, C.; Tang, L.; Wang, Y. Valorization of municipal solid waste incineration bottom ash (MSWIBA) into cold-bonded aggregates (CBAs): Feasibility and influence of curing methods. Sci. Total Environ. 2022, 843, 157004. [Google Scholar] [CrossRef] [Scilit]
- Li, Z.; Zhang, W.; Jin, H.; Fan, X.; Liu, J.; Xing, F.; Tang, L. Research on the durability and sustainability of an artificial lightweight aggregate concrete made from municipal solid waste incinerator bottom ash (MSWIBA). Constr. Build. Mater. 2023, 365, 129993. [Google Scholar] [CrossRef] [Scilit]
- Fan, X.; Li, Z.; Zhang, W.; Jin, H.; Liu, J.; Xing, F.; Tang, L. New applications of municipal solid waste incineration bottom ash (MSWIBA) and calcined clay in construction: Preparation and use of an eco-friendly artificial aggregate. Constr. Build. Mater. 2023, 387, 131629. [Google Scholar] [CrossRef] [Scilit]
- Song, H.; Liu, T.; Gauvin, F.; Brouwers, H. Investigation of sisal fiber incorporation on engineering properties and sustainability of lightweight aggregates produced from municipal solid waste incinerated bottom ash. Constr. Build. Mater. 2024, 413, 134943. [Google Scholar] [CrossRef] [Scilit]
- Shang, M.G.; Zhang, Y.S.; He, Z.M.; Qiao, H.X.; Feng, Q.; Xue, C.Z.; Zhang, Y. Freeze-thaw deterioration characteristics and micro-mechanism of solid waste incineration tailings and specified density concrete. Acta Mater. Compos. Sin. 2023, 40, 5241–5257. (In Chinese) [Google Scholar] [CrossRef]
- Müller, U.; Rübner, K. The microstructure of concrete made with municipal waste incinerator bottom ash as an aggregate component. Cem. Concr. Res. 2006, 36, 1434–1443. [Google Scholar] [CrossRef] [Scilit]
- Chen, B.; Paul, I.M.; Miranda de Lima, L.; Holthuizen, P.; He, S.; Aytekin, B.; Zeng, Y.; Ye, G. Blast furnace slag-based alkali-activated concrete with treated municipal solid waste incineration (MSWI) bottom ash as coarse aggregate: Mechanical properties, freeze-thaw resistance, and environmental impact. J. Build. Eng. 2026, 118, 115015. [Google Scholar] [CrossRef] [Scilit]
- Ji, X.P.; Liu, J.; Dong, X.Z.; Zhu, S.Y.; Li, X.J. Preparation and properties of fly-ash-based geopolymer for stabilizing tailing subgrade filler. China J. Highw. Transp. 2023, 36, 30–41. (In Chinese) [Google Scholar] [CrossRef]
- HJ 557-2010; Solid Waste–Extraction Procedure for Leaching Toxicity—Horizontal Vibration Method. China Environmental Science Press: Beijing, China, 2010.
- GB/T 14848-2017; Standard for Groundwater Quality. Standards Press of China: Beijing, China, 2017.
- Su, Y.; Gong, W.; Liu, C.B.; Zhang, J. Mix-ratio design and mechanical properties of phosphogypsum lightweight aggregate concrete based on machine learning. Bull. Chin. Ceram. Soc. 2025, 44, 1656–1665. (In Chinese) [Google Scholar] [CrossRef]

Disclaimer/Publisher’s Note: The statements, opinions and data contained in all publications are solely those of the individual author(s) and contributor(s) and not of MDPI and/or the editor(s). MDPI and/or the editor(s) disclaim responsibility for any injury to people or property resulting from any ideas, methods, instructions or products referred to in the content. |
© 2026 by the authors. Licensee MDPI, Basel, Switzerland. This article is an open access article distributed under the terms and conditions of the Creative Commons Attribution (CC BY) license.