


Abstract
Sustainable concrete mixture design requires reliable strength prediction, robust generalization, quantified uncertainty, and transparent environmental and economic assessment. This study presents an integrated, uncertainty-aware explainable AI framework combining family-aware validation, SHAP interpretation, applicability diagnostics, and multi-objective optimization. Following systematic auditing, 2623 records were retained from an initial dataset of 2700. Historical nested group-aware XGBoost validation achieved R2 = 0.857 ± 0.039 and RMSE = 5.386 ± 0.635 MPa. External evaluation employed 102 overlap-screened records from an independently sourced dataset of 427 observations, yielding R2 = −1.015 and RMSE = 11.115 MPa for the frozen model. External prediction-interval coverage reached 36.27% and 47.06% at nominal 90% and 95% levels, highlighting transferability and uncertainty-calibration challenges. A reproducible NSGA-II procedure incorporating absolute-volume constraints generated 200 candidate mixtures, accompanied by 35 sensitivity runs examining optimization and material assumptions. Carbon estimates employed documented emission-factor proxies, while cost assessment incorporated explicit procurement assumptions. The laboratory assessment of six concrete mixtures, supported by stamped reports documenting mixture compositions and specimen-level compressive strengths, yielded RMSE = 5.765 MPa. By integrating predictive modeling, interpretability, uncertainty, and engineering constraints, the framework provides a transparent basis for preliminary strength–carbon–cost screening and risk-informed sustainable concrete mixture design.
1. Introduction
- Part I: Research Background and Significance
The construction industry faces pressure to reduce greenhouse-gas emissions and improve resource efficiency while maintaining mechanical performance, constructability, durability, and economic viability. Concrete remains the most widely used construction material because of its versatility and availability. Its environmental burden is strongly influenced by Portland-cement production and the volume of constituents consumed globally. This has intensified the research into supplementary cementitious materials (SCMs), recycled constituents, and resource-efficient mixture proportioning to reduce clinker demand while preserving the required engineering performance [1,2,3,4,5,6].
Concrete proportioning remains a multivariable, multi-objective task because cementitious constituents, water, aggregates, chemical admixtures, and curing age have coupled effects. Sustainability introduces potentially conflicting objectives, including material carbon and cost. Empirical proportioning, laboratory experiments, and iterative trials remain indispensable for final qualification. However, exhaustive exploration becomes more resource-intensive as the composition space, low-carbon constituent options, and number of objectives increase [7,8,9,10]. Data-driven methods can assist screening if the generalization, uncertainty, and applicability are evaluated explicitly.
Machine-learning (ML) methods—including artificial neural networks, support-vector regression, random forests, gradient boosting, LightGBM, CatBoost, and XGBoost—have been used extensively to model concrete compressive strength and related properties [11,12,13,14,15,16,17,18,19,20,21,22,23,24,25,26,27,28,29,30,31,32,33,34,35,36,37]. Related materials studies address geopolymer mixtures, recycled constituents, and rice-husk-ash effects [38,39,40]. The recent work has moved well beyond prediction alone. Wang et al. [7] combined explainable ML with multi-objective optimization for recycled-aggregate concrete (RAC); Mohammadi Golafshani et al. [8] used a 5306-record literature database and optimization to address the strength, durability, cost, and carbon; Fan et al. [9] coupled ML with NSGA-II for RAC mixture design; and Gao et al. [10] proposed an explainable generative approach for sustainable concrete mixture generation. These studies establish that neither ML-assisted sustainable optimization nor explainability alone constitutes a sufficient contribution for a new framework.
The state of the art has also expanded toward uncertainty-aware and experimentally supported decision workflows. Tamuly and Nava [41] investigated multiple conformal-prediction formulations for concrete-strength estimation. La et al. [42] combined a surrogate neural model, NSGA-III, several interpretation techniques, and experimental verification for strength–energy–carbon optimization. Mobasheri et al. [43] evaluated CV+ and conformalized quantile regression for self-consolidating concrete. More recently, Zhang and Li [44] integrated XGBoost, SHAP, prediction intervals, NSGA-II, and field evidence for manufactured-sand concrete, whereas Zhu and Xu [45] combined audited data, tuned ML, SHAP, constrained three-objective optimization, life-cycle cost, carbon assessment, and preference-sensitive decision analysis for RAC. The unresolved question is therefore not whether these tools can be combined, but whether the complete evidential chain supporting a recommendation is sufficiently controlled and auditable.
Validation must reflect the intended generalization task. Concrete repositories may contain exact duplicates or the same composition tested at different ages. Splitting related compositions between training and testing can measure the interpolation within represented families rather than a generalization to unseen compositions. Cross-source transfer introduces constituent-distribution shifts, and intervals calibrated on development data may lose nominal coverage beyond empirical support. These issues are especially consequential in optimization, where attractive Pareto solutions can lie in poorly supported regions.
This study treats sustainable concrete mixture design as evidence-qualified screening. It connects database auditing, composition-family leakage control, group-aware model selection, frozen external evaluation after precision-aware overlap screening, applicability and conformal uncertainty assessment, SHAP interpretation, constrained optimization, and conditional comparisons with manuscript-reported laboratory means. Section 1.1, Section 1.2, Section 1.3 and Section 1.4 review these elements; Section 1.5 defines the gap and contributions.
- Part II: Literature Review and Research Gap
1.1. Sustainable Concrete and Intelligent Material Design
SCMs and secondary resources—including fly ash, ground-granulated blast-furnace slag (GGBFS), silica fume, metakaolin, and recycled constituents—can reduce clinker demand, promote waste valorization, and support circular-economy objectives [2,38,39,46,47,48,49,50,51,52]. Their engineering effects, however, depend on composition, replacement level, water demand, aggregate characteristics, admixture interactions, curing conditions, and age [53,54,55,56,57]. Sustainable proportioning is therefore not equivalent to maximizing SCM replacement; it requires balancing material efficiency against the required engineering response.
Recent computational studies illustrate this transition from single-response prediction to multi-criteria mixture exploration. Wang et al. [7] considered the compressive strength, chloride resistance, environmental impact, and life-cycle cost in RAC. Mohammadi Golafshani et al. [8] combined ML and optimization for strength, chloride penetration, carbonation, cost, and carbon, while Fan et al. [9] addressed strength–cost–carbon trade-offs using ML-assisted NSGA-II. Gao et al. [10] approached the same design problem through generative modeling intended to search for a lower-dimensional space of realistic mixtures. Collectively, these studies demonstrate that sustainability objectives and optimization are already established components of AI-assisted concrete design.
A computationally favorable candidate still requires fresh-property assessment, volumetric checks, raw-material characterization, durability testing, code checks, and trial batching. The constituent-level embodied carbon and material cost are therefore comparative screening criteria; engineering qualification remains outside the AI workflow.
1.2. Machine Learning, Validation Architecture, and Model Interpretability
Ensemble methods suit nonlinear tabular concrete data and have repeatedly produced competitive predictions [11,12,13,14,15,16,17,18,19,20,21,22,23,24,25,26,27,28,29,30,31,32,33,34,35,36,37]. XGBoost can efficiently represent nonlinear interactions through regularized tree boosting. Its use alongside Random Forest, CatBoost, and related established algorithms is a model-selection choice, not a claim of algorithmic novelty.
The validation unit is more consequential. A record-wise random split can place the same composition at different curing ages in training and testing, producing optimistic estimates for unseen families. We define families from constituent quantities and use nested group-aware validation with zero family overlap. The conventional random holdout is retained as a leakage diagnostic: it contained 320 shared families and is not the principal generalization estimate.
Interpretability asks what associations the fitted model has learned. SHapley Additive exPlanations (SHAP) provide global and observation-specific attributions [58]; LIME offers a different local explanation approach [59]. Sustainable-concrete studies use such tools to interpret constituents and support optimization [7,42,44,45]. SHAP describes model-based statistical associations, not physical causality. We therefore interpret the frozen model only after fixing the validation architecture.
1.3. Multi-Objective Optimization for Sustainable Concrete Development
Concrete proportioning involves competing objectives: a higher predicted strength may require constituent combinations that increase binder demand, material carbon, or cost, whereas aggressive reductions in cement content may compromise performance or move a candidate toward weakly represented regions of the data. Multi-objective evolutionary algorithms, including NSGA-II [60], are useful because they retain a Pareto set rather than collapsing these trade-offs into a single optimum; recent concrete applications include [9,42,44,45].
Such optimization is no longer unusual in concrete research. Fan et al. [9] coupled ML with NSGA-II for RAC; La et al. [42] used NSGA-III to balance strength, energy, and carbon; Zhang and Li [44] combined NSGA-II with strength, workability, cost, and environmental objectives for manufactured-sand concrete; and Zhu and Xu [45] used constrained three-objective optimization with preference-sensitive decision analysis for strength, life-cycle cost, and net carbon emissions. These studies establish direct precedents for AI-assisted sustainable mixture optimization; accordingly, the present work does not claim novelty from NSGA-II or from simultaneous strength–carbon–cost objectives.
An optimizer may favor weakly supported surrogate predictions. Constituent and ratio envelopes restrict the search; assumed densities and air enforce absolute-volume closure. Applicability is assessed separately, and zero candidates in the updated base set fail the adopted consensus rule. The complete archive retains all candidates and support flags for audit; outside-support candidates are not engineering recommendations. Every candidate requires laboratory qualification and code-based verification.
1.4. Predictive Uncertainty, External Generalization, and Applicability
Uncertainty quantification (UQ) is increasingly necessary when ML predictions inform engineering decisions. A point estimate does not indicate the range of plausible prediction error, and a nominal prediction interval does not by itself establish that its stated coverage will persist under transfer. Conformal prediction is attractive because it provides finite-sample marginal coverage under exchangeability assumptions [61,62]. Tamuly and Nava [41] demonstrated the direct relevance of conformal predictors to concrete compressive-strength estimation, while Mobasheri et al. [43] evaluated CV+ and conformalized quantile approaches for self-consolidating concrete. UQ in concrete ML is therefore an emerging but established research direction rather than an absent capability.
The critical issue is the relationship among uncertainty, domain shift, and applicability. An interval calibrated on development data can be statistically valid in-distribution yet under-cover observations drawn from a shifted source or weakly represented region. Zhang and Li [44], for example, coupled prediction intervals with an integrated manufactured-sand concrete framework but reported an empirical 90% interval coverage below the nominal level for 28-day strength and explicitly noted transfer limitations. This illustrates why UQ should not be interpreted independently of the support available for the prediction.
The interval branch fixes composition-family partitions before parameter selection, tunes only on proper training, and then separately calibrates and tests. Primary external evaluation uses 102 observations after precision-aware overlap exclusion. No external label enters fitting, tuning, selection, or calibration. Applicability diagnostics characterize input support independently of prediction errors. The question is whether empirical coverage survives these evidence controls; the new results show that it does not achieve nominal external levels.
Table 1 summarizes recent AI applications across conventional/high-performance, heavyweight, lightweight, fiber-reinforced, geopolymer, and cellular/foamed concrete. These comparisons establish the breadth of data-driven strength prediction and mixture assessment. The present contribution concerns the evidence needed to qualify prediction and downstream decision support, rather than the application of AI to concrete itself.
Table 1.
Representative recent AI applications across concrete and cementitious-material systems.
1.5. Research Gap and Study Contributions
Explainable ML and sustainability optimization are established in [7,8,9,10,42,44,45], as are conformal and interval-based uncertainty methods [41,43,44]. Recent frameworks also include experimental or field evidence [42,44] and data auditing [45]. The gap concerns a defensible evidence chain that controls the unit of generalization before interpretation, uncertainty assessment, and optimization, rather than novelty in any individual component.
Three separations are essential. Duplicate control and family separation must precede model selection to prevent related compositions crossing validation folds. Cross-source transfer must follow selection and model freezing so that external performance cannot influence the predictor choice. Uncertainty must be interpreted alongside applicability because nominal marginal coverage need not persist under a distribution shift. These controls must also inform support-constrained optimization: nondominance alone does not establish engineering validity.
The audited development database contains 2623 observations, with 1146 historical exact-value families or 1144 precision-connected families. Historical nested group-aware selection is preserved separately from new proper-training-only interval tuning. The frozen point model is assessed on 102 external observations after the exclusion of potentially shared compositions. This distinguishes diagnostic interpolation, historical group-aware selection, corrected intervals, and screened transfer.
The contribution is methodological: established prediction, explanation, interval and optimization tools are subjected to inspectable evidence controls. The external audit and isolated interval analysis expose transfer failure. A signed and stamped laboratory report documents the six reported compositions and mean strengths, allowing a comparison with the frozen estimator. A separate signed and stamped laboratory report provides individual strengths and within-mixture variability, but not independent-batch repeatability, and the observed prediction errors do not establish successful independent experimental validation.
Table 2 compares this architecture with recent sustainable-concrete AI frameworks. It reports only capabilities established from the cited sources. “Not established/verified” indicates an evidence limit, not proof that a procedure was absent.
Table 2.
Study-specific critical comparison of recent sustainable-concrete AI frameworks and the methodological distinction of the present study.
The central contribution is an auditable framework for deciding whether an AI-generated mixture recommendation has sufficient evidence for further engineering evaluation or requires additional experimental qualification. It is not another high-accuracy strength predictor, and no individual novelty is claimed for XGBoost, SHAP, conformal prediction, or NSGA-II.
The scientific problem is the lack of a defensible evidence chain beyond predictive benchmarking. Accuracy alone cannot establish decision-support credibility without jointly assessing family leakage, cross-source transfer, uncertainty, applicability, and optimization outside supported regions. The practical problem is balancing mechanical, environmental, and economic objectives while predictive support, uncertainty, fresh-state behavior, durability, material variability, and engineering qualification remain unresolved. Favorable computational trade-offs are not implementation-ready designs.
The aim is to critically evaluate a transparent decision-support workflow for sustainable concrete screening, including family-aware prediction, screened external assessment, isolated uncertainty calibration, documented optimization assumptions, and the limitations of available experimental records.
To achieve this aim, the specific objectives are as follows:
- Audit and harmonize the concrete database, including exact-duplicate removal and composition-family identification, to expose and control potential information leakage during model evaluation;
- Develop and compare predictive models under nested group-aware validation and select the final predictor using a predefined performance criterion before external assessment;
- Evaluate cross-source predictive transfer using an external dataset excluded from model fitting, hyperparameter tuning, model selection, and conformal calibration;
- Interpret the frozen model and characterize predictive uncertainty and applicability using SHAP, group-separated split-conformal assessment, and empirical support diagnostics;
- Integrate the predictive model with constrained multi-objective optimization to examine trade-offs among predicted 28-day compressive strength, a constituent-level embodied-carbon indicator, and a material-cost indicator;
- Provide preference-sensitive decision support through CDSS and sensitivity analysis, while auditing conditional laboratory comparisons and identifying evidence still required for engineering qualification.
2. Methodology
The workflow separates historical nested model selection and the frozen all-development point estimator from a newly retuned interval branch. Seven-constituent precision families are partitioned before interval tuning; proper-training data alone determine interval-model parameters. Calibration, internal testing, screened external evaluation, and laboratory comparisons are isolated from this tuning. Optimization uses the archived frozen point estimator. Figure 1 shows these distinct branches.
Figure 1.
Workflow separating archived point-model selection, corrected interval tuning, calibration, testing, and screened external evaluation.
2.1. Database Development, Provenance, and Data-Integrity Audit
The development repository was assembled from two publicly available concrete datasets that share a common analytical schema. The first source was the UCI Concrete Compressive Strength dataset containing 1030 records [69], and the second was the normal-concrete compressive-strength/slump dataset containing 1670 records. The locally retained files were Concrete_Data.csv and the corresponding archived spreadsheet of the second source; the cited Mendeley release of the latter is Version 1 [70]. Original download dates were not retained and are therefore not reconstructed retrospectively.
The initial development pool contained 2700 observations. Inclusion required numerical values for eight harmonized predictors—cement, ground-granulated blast-furnace slag (GGBFS), fly ash, water, superplasticizer, coarse aggregate, fine aggregate, and curing age—together with measured compressive strength as the target. The audited source files contained no missing values in these required fields; consequently, no imputation was applied. Constituent quantities were harmonized in kg/m3, curing age in days, and compressive strength in MPa. No predictive-feature scaling was required for the final tree-based XGBoost predictor; standardization used later for applicability analysis is a separate operation.
Exact duplicate observations were identified using the eight predictors together with compressive strength. Twenty-five duplicate records were removed from the UCI source and 52 from the second development source, giving 77 removals and a cleaned development database of 2623 observations.
Exact-record removal alone does not prevent information leakage when the same nominal mixture composition is reported at different curing ages. A composition family was therefore defined from the seven constituent quantities, with age and compressive strength excluded:
Family ID = {Cement, GGBFS, Fly Ash, Water, Superplasticizer, Coarse Aggregate, Fine Aggregate}
The historical exact-value grouping gives 1146 families and identifies 320 shared families in a diagnostic record-wise split. The new interval and external audits also allow small reporting-precision differences: development families are connected components of seven-constituent vectors with maximum component-wise distance ≤0.051 kg/m3. This conservative tolerance represents half a 0.1 kg/m3 reporting increment plus a 0.001 margin; it yields 1144 development families. Age and strength are excluded. These numerical families do not establish common batch identity, material source, or manufacturing history. Exact and precision family IDs are both supplied.
The external workbook has been traced to Nguyen and Ngo’s University of Melbourne Figshare dataset, Version 2, published 19 November 2018, DOI 10.26188/5bf33d0980a11 [71]. The downloaded Dataset2.xlsx is byte-identical to the retained 1133-row workbook (SHA-256 da7562cc6bcb43a233f40c49854a0400964e5e367032e5c0c02eebf7956104fb). All 427 previously retained observations were mapped to this source: 376 match exactly and 51 match at two-decimal precision. Exact seven-constituent matching finds no shared rows, but this misses source rounding differences. A maximum difference ≤ 0.051 kg/m3 in all seven constituents identifies 325 potentially shared records; these are excluded, leaving 102 for the primary external evaluation. Tolerances of 0.101 and 0.501 kg/m3 identify the same 325 records. The previous eight-predictor screening removed 706 from the raw workbook; the present family screening is an additional exclusion from the remaining 427. Table 3 distinguishes these stages. Repository provenance is established; original publication and experimental-batch identity for every row is not.
Table 3.
Development audit and successive external overlap screens.
Representative verified records illustrating the audited schema are provided in Table 4.
Table 4.
Actual records illustrating the audited development-database schema. Constituent quantities are kg/m3, age is days, and strength is MPa.
Table 4 contains actual records verified against the final audited 2623-record development dataset. The first three are DEV0001–DEV0003 from UCI Concrete Compressive Strength; the last three are DEV1006–DEV1008 from Normal Concrete Strength and Slump. They illustrate the schema, not a statistically representative subsample. Family identifiers are partition metadata, not predictors. Table 5 summarizes the predictors and target.
Table 5.
Input and output variables retained in the machine-learning framework.
2.2. Machine-Learning Framework, Nested Group-Aware Validation, and Hyperparameter Optimization
Compressive-strength estimation was formulated as a supervised regression problem. XGBoost (version 3.4.1), CatBoost (version 1.2.10), LightGBM (version 4.7.0), and Random Forest (implemented in scikit-learn, version 1.9.1) were compared under one common validation architecture. Model selection was based on nested composition-family-aware cross-validation, while a conventional record-wise holdout was retained only as a leakage diagnostic.
Five outer GroupKFold partitions were used for primary model comparison. Within each outer iteration, hyperparameter optimization was conducted only on the corresponding outer-training families using three inner GroupKFold folds. Each model received 12 Tree-structured Parzen Estimator (TPE) trials [72] implemented in Optuna [73] per tuning study, with mean inner-fold RMSE as the optimization objective. The outer held-out fold did not participate in its corresponding tuning process and was used only after inner optimization. All four candidate models were evaluated on identical outer held-out observations within each fold.
XGBoost was retained according to the prespecified criterion of the lowest mean nested outer-fold RMSE. This selection criterion is specific to the evaluated database and does not imply universal algorithmic superiority. Following nested comparison, a separate 12-trial all-development group-aware tuning study supplied the final XGBoost configuration. That configuration was frozen before external evaluation, and the all-development point predictor was fitted using all 2623 cleaned observations with seed 42. The verified hyperparameter search spaces are reported in Table 6.
Table 6.
Hyperparameter search spaces recovered from the executable tuning code.
Nested results are summarized as mean ± sample standard deviation (ddof = 1) across the five outer folds. Model selection uses the prespecified lowest mean outer-fold RMSE criterion. The close XGBoost and CatBoost results are interpreted descriptively; no statistically significant performance difference is asserted.
The TPE sampler and inner folds used the study seed, while trial models used the study seed plus trial number. Repeated grouped assessment with seeds 11, 22, 33, 44, and 55 produced 25 secondary fold estimates using the fixed final configuration. Because the final configuration had already been selected using the development data, this repeated assessment is interpreted as a stability analysis rather than a second unbiased model-selection experiment. The frozen XGBoost configuration used downstream is reported in Table 7.
Table 7.
Archived all-development point settings and newly selected proper-training-only interval settings. Complete configurations are supplied in Tables S2 and S3.
The full-precision optimized candidate archive is provided in Supplementary Table S1. Supplementary Table S2 reports the selected hyperparameter values for all four compared algorithms in each of the five outer-fold tuning studies and in the separate all-development tuning studies. Values were recovered from the completed Optuna trial archive by selecting the minimum mean inner-fold RMSE within each study. The table includes the selected trial, objective value, study seed, trial-estimator seed, and refit-estimator seed. These fold-specific configurations support the nested comparison; the final XGBoost configuration in Table 7 is the model used downstream.
The historical model-selection environment records Python 3.12.14, NumPy 2.5.3, pandas 3.0.6, scikit-learn 1.9.1, XGBoost 3.4.1, CatBoost 1.2.10, LightGBM 4.7.0, Optuna 5.0.0, SHAP 0.52.0, matplotlib 3.11.2, and joblib 1.6.0. The new interval branch uses seeded random search, not Optuna; its executable environment is separately pinned. Historical NSGA-II operators were not recovered, so the new optimization uses fully specified pymoo 0.6.2 settings.
2.3. Performance Metrics and Evaluation Evidence
Predictive performance was quantified using the coefficient of determination (R2), root mean square error (RMSE), and mean absolute error (MAE):
For a fixed evaluation vector, RMSE2/(1 − R2) = SST/n, where SST is the total sum of squares. This identity is checked at the individual outer-fold level because all candidate models share the same held-out observations within a fold. It is not applied to independently averaged fold-level R2 and RMSE values, for which the nonlinear identity need not hold.
The historical random holdout is a leakage diagnostic; historical exact-family nested validation supports the original model-selection decision. Primary current external assessment uses 102 observations after precision-aware family exclusion. The previous 427-record result is retained only as an overlap-contaminated diagnostic. External labels do not influence fitting, selection, or calibration.
2.4. Explainable Artificial Intelligence Analysis
SHAP (Shapley Additive Explanations) provides the explainability layer for the frozen all-development XGBoost predictor. TreeSHAP quantifies each recorded predictor’s contribution to strength predictions. Global importance is the mean absolute SHAP value across development observations, supporting engineering interpretation of the model.
SHAP is interpreted descriptively, not causally. Agreement with concrete-engineering expectations is a plausibility check. Correlation, interactions, source-specific data structure, and omitted material characteristics can affect attributions; they are not proof of physical mechanisms.
2.5. Split-Conformal Uncertainty Quantification
For the corrected interval analysis, GroupShuffleSplit seeds 42 and 43 partitioned the precision-family development repository into proper training (1826 observations), calibration (381), and internal testing (416), with zero family overlap. All partitions were fixed before parameter selection. A 12-trial seeded random search (seed 142) evaluated XGBoost only on proper training through three shuffled GroupKFold inner folds (seed 142), selecting the lowest mean validation RMSE. The XGBoost ranges in Table 6 were reused, with uniform integer/uniform or log-uniform continuous sampling as specified in the supplied code. Calibration and test labels were excluded from every trial. Selected parameters and fold assignments are supplied in Supplementary Table S3; Table 7 distinguishes this estimator from the archived all-development point model.
For calibration observation i, the nonconformity score is the absolute residual:
For nominal coverage 1 − α and calibration size ncal, the conformal quantile is obtained from the sorted residuals using the finite-sample order-statistic rank:
The corrected calibration set contains 381 absolute-residual scores. The finite-sample ranks ceil((381 + 1) × coverage) are 344 and 363 at nominal 90% and 95%; the corresponding quantiles are 6.949483 and 9.387052 MPa. Prediction intervals are the proper-training estimator’s predictions plus or minus the selected quantile. No external response was used for selection, fitting, or calibration.
PICP is the proportion of observations inside their intervals; MPIW is the mean upper-minus-lower bound, in MPa; and PINAW is MPIW divided by the proper-training strength range, 78.30 MPa. This denominator is frozen before evaluation and is used for all sets and nominal levels.
Family separation prevents related compositions entering model selection and interval evaluation across partitions. It does not make multiple ages within a calibration family independent. Row-score conformal results are therefore reported as empirical coverages, without an unconditional coverage guarantee for dependent rows or shifted external sources. A supplementary diagnostic uses the maximum calibration residual per family (172 calibration families) and reports both row coverage and all-observed-rows family coverage; it is not a retrospective replacement of the primary analysis.
No bootstrap procedure is used for predictive uncertainty. The historical model comparison is summarized descriptively using fold-level performance metrics.
2.6. Empirical Applicability and Source-Shift Assessment
Empirical applicability is evaluated separately from predictive uncertainty in the eight-dimensional predictor space. Features are standardized using development-fitted location and scale parameters. Three complementary diagnostics are then applied: (i) nearest-neighbor distance exceeding the 99th percentile of development leave-one-out nearest-neighbor distances; (ii) squared Mahalanobis distance in a principal-component representation retaining at least 95% of development variance, with a 99% chi-square threshold; and (iii) any predictor lying outside its development 1st–99th percentile envelope.
An observation is classified as outside the adopted empirical support when at least two of the three diagnostics are flagged; zero flags indicate interior support and one flag indicates a near-boundary condition. These diagnostics characterize empirical support only. They do not establish workability, durability, early-age performance, volumetric feasibility, raw-material equivalence, or code compliance. Applicability status is therefore reported as a distinct evidence layer and is not collapsed into a single reliability score.
2.7. Sustainability Assessment: Constituent-Level Carbon and Material-Cost Indicators
The archived, incompletely documented sustainability coefficients were replaced for a new optimization scenario. For constituent j with mass mj, the carbon and Egyptian material-cost screening indicators are calculated by the following sums:
Here, eⱼ is kg CO2e/kg and kⱼ is EGP/kg. Prior studies support the constituent-sum formulation [74,75]; sources for the replacement coefficients are documented separately [76,77,78,79,80,81,82,83]. Table 8 reports the adopted values and their limitations. Cement uses an Egyptian El Sokhna CEM I EPD (2024; A1–A3). GGBFS and fresh fly ash use 2025 UK MPA economic-allocation proxies; water uses a 2025 UK supply factor. Superplasticizer and aggregate coefficients use Greek EPD proxies with the allocation and periods recorded in the factor register. These are not measured footprints of the author’s purchased materials. Cost references use the October 2025 Egyptian ministry column where available. Fly ash is 15 EGP/kg, based on an author-reported Sika supplier enquiry around October 2025, inclusive of tax and transport; no written quotation or minimum order was recovered. GGBFS is approximately 3000 EGP/t (3 EGP/kg), and delivered water is 15 EGP/m3 (0.015 EGP/kg), based on author-reported oral enquiries to Al Aseel Ready-Mix Concrete around October 2025, near the time of the laboratory program, including supply, transport and all fees. Sika ViscoCrete 3425 is 4100 EGP per 20 kg pack (205 EGP/kg), including all fees and transport, based on an author-reported Sika enquiry in the same approximate period; the alternative 5 kg pack was 1100 EGP (220 EGP/kg). The 20 kg price is adopted, without asserting a separate industrial-bulk quotation. These enquiries are not authenticated with written supplier quotations. The previous slag advertisement/uplift/FX calculation, assumed water tariff, and online retail superplasticizer reference are superseded. The complete source, conversion, geography, date, currency, allocation, and remaining documentation fields are supplied in optimization_assumptions.json. The material-cost indicator is an exploratory, scenario-dependent estimate based on documented assumptions and partly unauthenticated supplier enquiries, rather than a universally applicable representation of Egyptian material prices.
Table 8.
Replacement constituent carbon proxies and exploratory Egyptian cost scenario. The full source and conversion register accompanies the reproduction package.
Carbon boundaries cover documented constituent production or supply proxies; concrete-plant transport, batching, construction, use, maintenance, and end of life are excluded. Mixed national sources and product classes are not a harmonized or certified concrete LCA. Material costs exclude concrete plant operation, labor, placement, and overhead; delivery and taxes are included only where their individual source explicitly establishes inclusion. Aggregate prices per loose m3 are converted using assumed loose bulk densities of 1500 kg/m3 for coarse and 1600 kg/m3 for fine aggregate, distinct from particle densities used for volume closure. No common tax or delivery basis is asserted. Accordingly, the resulting carbon and material-cost indicators should be interpreted as scenario-dependent screening estimates, and their application to other projects, suppliers, or geographical contexts requires verification and updating of the underlying coefficients and cost assumptions.
2.8. Multi-Objective Optimization Using NSGA-II
The frozen all-development XGBoost estimator is coupled with NSGA-II to maximize predicted 28-day strength and minimize constituent-carbon and scenario material cost. Six constituent masses are independently varied: cement, GGBFS, fly ash, water, superplasticizer, and coarse aggregate. Fine aggregate is derived from the absolute-volume equation. All seven resulting masses and derived ratios satisfy the empirical bounds in Table 9 and Table 10; age is fixed at 28 days.
Table 9.
Constituent mass bounds in kg/m3. Fine aggregate is volume-derived and constrained to these bounds; the other six masses are independent variables.
Table 10.
Empirical ratio and mass constraints. Absolute-volume closure is additionally imposed algebraically using the density and air assumptions in Section 2.8.
A new reproducible run replaces the incompletely preserved historical optimizer. Python 3.12.14 and pymoo 0.6.2 are used [84], with population and offspring sizes 200, 150 generations, seed 42, FloatRandomSampling, and duplicate elimination. Simulated binary crossover uses probability 0.9, variable probability 0.5, and η = 15. Polynomial mutation uses individual probability 1.0, variable probability 1/6, and η = 20. The code, environment versions, constraints, objective evaluation, seeds, and generation logs are supplied. Sensitivity comprises 28 separate ±20% single-coefficient runs, two air runs, one SCM allocation run, two solid-density runs, and seeds 43 and 44, in addition to the base run: 36 runs total. These are fresh searches; stochastic trajectory changes are not attributed solely to a coefficient change.
Absolute-volume closure is imposed algebraically: Σⱼmⱼ/ρⱼ + a = 1 m3. Fine-aggregate mass equals ρfine × (1 − a − Σother constituents mⱼ/ρⱼ). Particle-density assumptions in kg/m3 are cement 3100, GGBFS 2800, fly ash 2200, water 1000, superplasticizer 1080, and both aggregates 2650 [76,85,86,87,88]. Assumed entrapped air is 2%, with 1% and 3% sensitivity runs; no measured air content is claimed. Manufacturer/literature densities are proxies, not measurements of the tested materials. Solid densities are also varied ±5%. Full-precision compositions are checked before display rounding, with derived fine-aggregate bounds and the empirical ratio constraints enforced. Volume feasibility under these assumptions does not establish moisture correction, absorption, workability, durability, early-age performance, or code compliance.
2.9. Preference-Based Composite Decision-Support Score
A transparent Composite Decision-Support Score (CDSS) is used only to express preferences among the final nondominated candidates. Fixed-width split-conformal intervals do not provide candidate-specific uncertainty rankings, and empirical applicability is intentionally retained as a separate evidence layer rather than collapsed into the weighted score:
where are min–max normalized predicted strength, carbon indicator, and material-cost indicator, respectively, calculated across the same final candidate set; . Equal weights of 1/3 provide the baseline scenario. Priority scenarios assign 0.50 to the selected objective and 0.25 to each remaining objective. One-at-a-time ±20% weight perturbations are renormalized to sum to unity for sensitivity analysis. CDSS is a preference-based ranking device, not a structural reliability index. Conformal coverage and empirical applicability remain separate evidence layers.
2.10. Laboratory Report and Composition Evaluation
The signed and stamped laboratory compressive-strength report issued by Al Aseel Building Materials describes six cement–fly-ash mixtures, including a control and replacement levels of 15%, 20%, 25%, 30%, and 40%. Table 11 summarizes the reported constituent descriptions and material characteristics relevant to transfer assessment. The report provides constituent quantities, slump, ultrasonic pulse velocity, and mean compressive strengths at 7 and 28 days; these values agree with those presented in Table 12. The composition report documents mixture proportions and means; a separate signed and stamped laboratory test report provides individual strengths and descriptive statistics for the same M1–M6 mixtures (Supplementary Tables S5–S7). The reports provide documented mixture-level and specimen-level evidence, although they do not establish independent-batch repeatability or detailed material characterization.
Table 11.
Reported constituent descriptions and additional characterization relevant to interpreting model transfer. Detailed material certificates are not supplied by the mean-strength report.
Table 12.
Laboratory-report compositions and mean test results. Constituent quantities are expressed in kg/m3; FA denotes fly ash and SP denotes superplasticizer. Values are reported means, not individual specimen results.
The signed and stamped laboratory composition report lists cement plus fly ash totaling 450 kg/m3, with cement decreasing from 450 to 270 kg/m3 and fly ash increasing from 0 to 180 kg/m3. Water is 160 kg/m3, fine aggregate 700 kg/m3, coarse aggregate 1050 kg/m3, and superplasticizer increases from 4.50 to 5.50 kg/m3 (Table 12). The calculated water-to-binder ratio is 160/450 = 0.356 after rounding. The frozen model is evaluated using the Table 12 compositions, representing the described cement–fly-ash mixtures with GGBFS = 0 and age = 28 days.
The signed and stamped laboratory reports specify 150 × 150 × 150 mm cubes cast on 2 September 2025, with 7-day tests on 9 September 2025 and 28-day tests on 30 September 2025. The elapsed dates agree with the stated test ages. The composition report explicitly presents arithmetic mean strengths for each mixture and age, together with slump and ultrasonic pulse velocity. The separate signed and stamped specimen-level test report contains 18 numerical specimen-level strengths at 7 days (three per mixture) and 17 at 28 days (three per mixture except M6, with two). The correspondence and order of M1–M6 between reports were confirmed by the authors. The third 28-day M6 entry has no numerical result; its cause is not documented, and no value was reconstructed. Individual values are provided in Supplementary Table S6.
The six laboratory mixture compositions are reproduced in Supplementary Table S5. The separate signed and stamped specimen-level laboratory report supports descriptive variability analysis: within-mixture coefficients of variation range from 3.94% to 4.58% at 7 days and from 3.36% to 4.70% at 28 days (Supplementary Tables S6 and S7). The M6 28-day statistics use only two numerical observations. Both laboratory reports are supplied as documentary evidence. They authenticate the reported mixture compositions, specimen measurements and means at the report level, but do not identify independent production batches or provide separate batching sheets, material certificates, testing-machine calibration/loading records, a designated testing standard, or curing-temperature logs. Thus, independent-batch repeatability and broader experimental transfer remain unverified.
Slump, 7-day strength, and UPV were not harmonized predictors in the development and external machine-learning datasets and were not used as optimization objectives or constraints. No 2-day strength measurements were available. The six mixture-level mean 28-day strengths span only 48.60–51.20 MPa; therefore, the laboratory program provides a limited assessment of the frozen model’s predictive performance on the tested mixtures and does not establish validation at approximately 15 or 30 MPa or experimental verification of the NSGA-II-optimized candidates. Representative stages of the laboratory procedure are documented in Figure 2.
Figure 2.
Photographic documentation of the laboratory experimental program: (a) fresh concrete during laboratory mixing; (b) fresh concrete placed in a cylindrical mold during specimen preparation; (c) freshly cast concrete in a cube mold; (d) additional cube molds used during specimen preparation; and (e) representative compression-testing setup. Panels (b,e) document laboratory preparation/testing stages and are not evidence of the specimen geometry used for the reported cube-strength results.
2.11. Methodological Scope and Engineering-Qualification Boundaries
The directly assessed properties are surrogate compressive strength, documented carbon proxies, exploratory Egyptian material cost, empirical interval coverage, and predictor support. The new optimizer enforces absolute-volume closure under stated density and air assumptions. Fresh-state performance, durability, early-age behavior, moisture corrections, material-source equivalence, and code compliance still require independent measurements and engineering verification.
The signed and stamped laboratory reports support comparison with six documented mixture means and provide individual cube results for assessing within-mixture dispersion. They do not establish independent-batch repeatability or broad experimental validation. Stronger qualification would require documented independent batches, characterized material sources, lower- and intermediate-strength mixtures, additional fresh-state and multi-age testing, and appropriate durability measurements.
3. Results
The results distinguish historical exact-family nested validation from the corrected precision-family interval branch and the screened external assessment. The 427-observation evaluation is retained only as a diagnostic containing potential composition overlaps; primary external results use 102 observations after potential shared-family exclusion. Laboratory comparisons use the compositions and means in the supplied report. Full per-mixture predictions and evaluation statistics are provided in Supplementary Text S4. Optimization outputs are screening candidates, not validated mixtures.
3.1. Database Audit and Leakage Diagnostic
The initial development repository contained 2700 observations. The removal of 77 exact duplicates yielded 2623 clean observations organized into 1146 composition families. The cleaned repository spans compressive strengths from 2.33 to 82.60 MPa. A diagnostic record-wise random split placed 320 composition families on both sides of the train/test boundary, confirming that conventional random splitting would permit composition-related information leakage and could overstate the generalization to unseen mixture families. Descriptive statistics for the cleaned development repository are summarized in Table 13.
Table 13.
Descriptive statistics of the cleaned development repository (n = 2623).
The 2623 clean observations represent 1146 exact-value families or 1144 precision-connected families under the newly documented tolerance. Historical nested results use the former definition; the new interval tuning, calibration, and testing use the latter.
3.2. Nested Group-Aware Model Comparison and Model Selection
Table 14 preserves the historical nested group-aware comparison. Its former 427-record external columns are labeled as diagnostics containing potential shared families; they are not evidence of independent family transfer. The screened final XGBoost result is reported separately in Section 3.3.
Table 14.
Historical exact-family nested comparison and all-427 external diagnostic containing potentially shared families. These external columns are not the primary screened assessment. Nested metrics are mean ± sample SD across five folds; errors are MPa.
XGBoost had the lowest historical nested mean RMSE (5.386 MPa), with R2 = 0.857 ± 0.039 and MAE = 3.731 ± 0.311 MPa. CatBoost was close (RMSE = 5.403 ± 0.658 MPa), precluding a universal-superiority claim. XGBoost remains frozen under the original development-selection rule. The previous Random Forest external comparison involved all 427 records before precision-family exclusion and is retained only as a diagnostic. External findings do not trigger retrospective algorithm reselection.
The earlier random-holdout result (R2 = 0.912, RMSE = 4.139 MPa, MAE = 2.781 MPa) is interpreted only as a diagnostic illustration of the optimism introduced when related composition families occur in both subsets. It is not used as the principal estimate of generalization performance.
3.3. External Evaluation After Precision Overlap Screening
After the exclusion of 325 potentially shared seven-constituent records, the frozen all-development XGBoost estimator was evaluated on 102 observations: R2 = −1.015, RMSE = 11.115 MPa, MAE = 9.361 MPa, and prediction-minus-observation bias = −4.417 MPa. The previous all-427 result (R2 = 0.807, RMSE = 5.988 MPa) is an overlap-contaminated diagnostic rather than the primary external validation estimate.
The negative screened R2 indicates that the frozen model performs worse than the constant observed-mean benchmark on this set. Consequently, the earlier claim of successful independent cross-source validation is withdrawn. Figure 3 shows the screened response; no external labels were used to repair, recalibrate, or reselect the estimator.
Figure 3.
Frozen point predictions after precision-aware shared-family exclusion (102 external observations). The black dashed line represents perfect agreement (y = x) between measured and predicted compressive strengths.
The screened population differs from the original 427-record diagnostic because precision-aware matching removes compositions potentially represented in model development. The increase in RMSE from 5.988 to 11.115 MPa indicates a greater absolute prediction error, while the negative mean bias (−4.417 MPa; prediction minus observation) reflects the average underprediction. Although differences in constituent distributions, curing ages, testing conditions, and unmeasured material properties may contribute to this deterioration, their individual effects remain unresolved. These findings highlight the importance of independent, source-specific validation when extending the framework to new concrete mixtures and interpreting its practical applicability.
3.4. SHAP-Based Model Associations
Global SHAP importance values for the frozen XGBoost model are summarized in Table 15.
Table 15.
Global SHAP importance for the frozen XGBoost model.
Cement, curing age, and water were the three largest global SHAP contributors, accounting for 27.03%, 22.74%, and 16.91% of total mean absolute attribution, respectively. Superplasticizer, GGBFS, fine aggregate, fly ash, and coarse aggregate contributed smaller shares. The SHAP patterns are interpreted as model-specific statistical associations. Their qualitative consistency with established concrete-engineering expectations is used as a plausibility check, not as evidence of causal material mechanisms. The full SHAP distribution across observations is shown in Figure 4.
Figure 4.
SHAP summary for the frozen XGBoost model. Point color encodes the corresponding feature value; the horizontal position represents the SHAP contribution to the model output. The patterns are statistical model associations rather than causal effects.
3.5. External Domain Shift and Empirical Applicability
Table 16 compares the 102 screened external observations with the development repository; the same subset is visualized in Figure 5.
Table 16.
Feature shift after shared-family exclusion (external n = 102). SMD uses the square root of the mean of the two sample variances; exceedance refers to the development min–max range.
Figure 5.
Development and screened external predictor distributions (external n = 102).
Among the 102 screened external observations, the two-of-three applicability rule classifies 40 as outside, 25 as near-boundary, and 37 as interior support. These are empirical input-space diagnoses and cannot establish material or study independence.
Feature shifts and limited support contextualize poor external performance without proving its cause. Numerical family exclusion does not authenticate every row’s original experimental source; source-level independence remains unestablished.
3.6. Split-Conformal Uncertainty Results
The group-separated split-conformal results are summarized in Table 17.
Table 17.
Corrected interval results after proper-training-only tuning. All-427 results are diagnostic; primary external evaluation excludes potential shared families. PINAW denominator is 78.30 MPa.
After tuning solely on proper training, observed internal coverage was 82.21% at nominal 90% and 91.35% at nominal 95%. On the 102 screened external observations, coverage was 36.27% and 47.06%. All-427 diagnostic coverage was 78.69% and 84.07%. These values supersede the earlier intervals whose parameters were selected before calibration/test separation.
Interval widths are fixed at 13.899 and 18.774 MPa, with PINAW 0.1775 and 0.2398 using the proper-training range of 78.30 MPa. Figure 6 and Figure 7 show the screened external intervals and 381 calibration residuals. Fixed widths cannot rank candidate-specific uncertainty. The family-maximum supplementary diagnostic gives wider intervals (16.579 and 22.810 MPa) and external row coverage of 41.18% and 60.78%; it also fails to establish nominal cross-source coverage.
Figure 6.
New nominal 90% intervals on 102 screened external observations; empirical coverage 36.27%.
Figure 7.
Absolute residuals for the isolated 381-observation calibration set.
The substantial reduction in external prediction-interval coverage indicates that the nominal 90% and 95% coverage levels cannot be assumed to hold for the screened external population. Consequently, these intervals should not be treated as validated engineering safety bounds or used independently to qualify concrete mixtures. Their practical use requires further independent, source-specific validation and uncertainty recalibration, particularly when evaluating mixtures from previously unrepresented material sources.
3.7. Laboratory Comparison and Prediction Errors
Table 18 reports the frozen final XGBoost predictions and per-mixture errors for the six documented Table 12 compositions. The assessment yields RMSE = 5.765 MPa, MAE = 4.837 MPa, MAPE = 9.66%, and mean bias = +1.138 MPa. The measured 28-day means span 48.60–51.20 MPa; this narrow range does not explain away the substantial absolute prediction errors. Supplementary Text S4 provides complete metrics, the observed-mean benchmark and, separately, the recorded historical comparison whose generating model and exact inputs remain unrecovered.
Table 18.
Measured 28-day mean compressive strengths, frozen final XGBoost predictions, and per-mixture errors for the six laboratory mixtures. Predictions use the documented Table 12 compositions and the unchanged archived estimator. Signed error is prediction minus measured strength.
The laboratory series holds the total binder (450 kg/m3), water (160 kg/m3), and aggregate quantities constant while varying cement replacement by fly ash. Its limited composition and strength range provides a stringent local transfer check but cannot establish why the frozen estimator under- or overpredicts individual mixtures. Possible contributors include the incomplete representation of comparable composition families in the development data and unmeasured differences in binder reactivity, admixture chemistry, aggregate properties, or curing. These mechanisms have not been isolated experimentally or established through an input-distribution analysis; they are hypotheses, not demonstrated causes. Individual specimen strengths and descriptive variability are now reported in Supplementary Tables S6 and S7; independent-batch variability remains unverified.
Recorded historical prediction values are retained only in Supplementary Text S4 for traceability; their original input vectors and generating estimator configuration have not been recovered. Their arithmetic errors can be reproduced, but they are not substituted for the frozen-model evaluation in Table 18. Figure 8 compares the reported mean strengths with the frozen final predictions for all six mixtures. The six-mixture laboratory program provides a limited assessment of the frozen model’s predictive performance within the tested strength range; it does not establish the independent-batch repeatability, predictive validity at other strength levels (including approximately 15 or 30 MPa), or experimental validation of the NSGA-II-optimized mixtures. The overlap-screened external assessment remains a separate evaluation.
Figure 8.
Reported 28-day mean compressive strengths and frozen final XGBoost predictions for the six laboratory mixtures. Predictions use the Table 12 compositions with 450 kg/m3 total binder. Lines connect mixture labels to aid comparison and do not represent a fitted relationship. Table 18 reports per-mixture errors; Supplementary Text S4 provides complete metrics and the separate historical recorded comparison.
3.8. Constrained NSGA-II Optimization
The updated NSGA-II base run produced 200 nondominated candidates, with predicted strength 15.551–80.923 MPa, constituent-carbon proxy 124.404–436.603 kg CO2e/m3, and Egyptian material-cost scenario 1122.485–5264.902 EGP/m3. The full-precision volume closure is 1 m3 including the assumed air, and all enforced constraints pass. Differences across extremes are within-set trade-offs, not project-level savings relative to an equivalent verified reference mixture. The reported carbon and cost ranges are conditional on the adopted emission-factor proxies and Egyptian procurement assumptions and should not be interpreted as universally applicable environmental or economic outcomes.
The updated base set contains 67 interior, 133 near-boundary, and 0 outside-support candidates under the same two-of-three rule. Outside-support rows are explicitly flagged in the archive and excluded from engineering shortlisting. Volume closure does not resolve predictive transfer or fresh-state feasibility. Figure 9 and Figure 10 show the updated objectives and support classifications.
Figure 9.
Pairwise objectives of the new 200-candidate volume-constrained base run; cost is an exploratory Egyptian scenario.
Figure 10.
Updated 200-candidate objective space colored by empirical support: 67 interior, 133 near-boundary, and 0 outside-support candidates.
3.9. Composite Decision-Support Score and Sensitivity
Table 19 gives full compositions of five representative roles; Supplementary Table S1 provides all 200 base candidates at full precision, volume and constraint checks, support flags, and objective/CDSS values. All 36 run tables and convergence logs are supplied, together with coefficient, allocation, air, density, and seed sensitivity summaries.
Table 19.
New representative candidate compositions in kg/m3, with age fixed at 28 days. Volume constraints use full precision; rounding for display does not define feasibility.
Table 20 reports five representatives selected by the stated numerical rules, including a supported-interior alternative. Selection does not constitute an engineering recommendation.
Table 20.
Representative candidates and selection rules from the new volume-constrained base run. Scenario costs remain provisional.
The highest equal-weight CDSS is base_070 (P4): predicted strength 48.952 MPa, carbon proxy 162.264 kg CO2e/m3, scenario cost 1624.641 EGP/m3, and CDSS 0.7561. It is near-boundary. P1, P2, and P3 represent the maximum strength, minimum carbon, and minimum scenario cost; P5 is the highest-scoring interior candidate. Table 21 reports preference scenarios on this same updated base set.
Table 21.
Preference sensitivity on the new fixed 200-candidate base set.
Preference sensitivity includes ±20% individual weight changes and larger priority scenarios; the minimum rank correlation with the equal-weight ranking is 0.465. Fixed-candidate coefficient perturbations give a minimum rank correlation of 0.963. These fixed-set results isolate scoring changes, while the 36 fresh optimization runs also contain stochastic search effects. Figure 11 reports leading scores across weight scenarios. Accordingly, the resulting candidate rankings remain conditional on the adopted environmental and economic coefficients, preference weights, and optimization assumptions; no unique, universally applicable, or experimentally validated engineering optimum can be established from these results.
Figure 11.
Highest preference scores across weight scenarios on the new base set.
4. Discussion
4.1. Predictive Performance Under Leakage-Controlled and Cross-Source Evaluation
Precision-aware overlap screening changes the external evaluation population from 427 observations to 102 composition-screened observations. The frozen model deteriorates from the all-427 diagnostic (R2 = 0.807; RMSE = 5.988 MPa) to R2 = −1.015, RMSE = 11.115 MPa, and bias = −4.417 MPa. The negative R2 reflects a worse squared-error performance than the screened-set observed-mean benchmark, while the increased RMSE confirms a substantial absolute-error increase. This finding indicates limited predictive transferability to the screened population, although the relative contributions of input-distribution differences, source-specific measurements, and omitted material descriptors remain unresolved. No external labels informed model selection or calibration.
Composition-family separation reduces optimistic evaluation arising from related mixtures crossing data partitions. Because source-dependent numerical rounding may conceal shared compositions, exact matching alone is insufficient, motivating the documented precision-aware screening procedure. Neither screening nor frozen evaluation improves the predictor itself; instead, these procedures reveal its transfer limitations without retrospective adaptation or algorithm reselection.
Random-split R2 may be optimistic when repeated or related compositions occur in both training and testing sets. Grouping records by composition before partitioning provides a stricter assessment of the generalization to unseen mixture families, particularly when exploring new mixtures rather than interpolating among previously represented compositions.
The new audit exposes limitations of the framework rather than establishing deployment readiness. Frozen external assessment, parameter-isolated interval analysis, and documented volumetric optimization provide transparent and reproducible procedures, but reproducibility alone does not establish reliable predictive transfer or experimental validity. The principal contribution lies in the evidence audit and its explicit identification of transfer limitations.
High aggregate accuracy does not establish credibility for every low-carbon or low-cost candidate, particularly in sparsely supported regions. Leakage-controlled validation assesses baseline performance, cross-source testing probes transferability, and uncertainty and applicability analyses qualify individual predictions. Together, these layers support explainability and multi-objective decision analysis, while recognizing that a single R2 cannot establish engineering readiness.
4.2. Explainability and Engineering Interpretation
SHAP identified cement, curing age, and water as the dominant attribution variables, followed by superplasticizer, ground-granulated blast-furnace slag (GGBFS), fine aggregate, fly ash, and coarse aggregate. This ordering is broadly consistent with binder availability, hydration development, and the water-to-binder environment governing strength. Such consistency supports engineering plausibility, not the recovery of physical mechanisms or causal relationships.
SHAP describes how the frozen model attributes predictions to available variables; it cannot establish the physical response to changing one constituent in isolation. Constituent quantities are coupled through proportioning, and their interactions can affect predictions. High importance therefore indicates model reliance on a variable, not an experimentally isolated material effect.
The limitation is further reinforced by the level of material characterization available in the harmonized databases. Nominally equal cement contents can represent binders with different chemistry, mineralogy, fineness, strength class, or source. Similarly, equal fly-ash or GGBFS contents do not establish equivalence in chemical composition, reactivity, particle-size distribution, or replacement behavior. Aggregate quantities likewise do not capture grading, particle shape, absorption, density, strength, or impurities, while the nominal superplasticizer dosage does not fully characterize the chemical type or solids content. Because these physicochemical descriptors are not consistently available across the modeling sources, the surrogate cannot explicitly distinguish their effects.
SHAP has two diagnostic roles: identifying the variables on which predictions rely and flagging attribution patterns for engineering investigation. These roles improve transparency and plausibility assessment but do not replace material characterization, controlled experiments, sensitivity testing, or mechanistic verification.
For mixture screening, SHAP can explain why the surrogate favors a candidate. It cannot show that the response will persist when raw-material sources or physicochemical properties change. Confidence must also draw on uncertainty, applicability, and experimental qualification.
4.3. Uncertainty Quantification, Applicability Domain, and Reliability of Predictive Evidence
Uncertainty and applicability qualify individual predictions in complementary ways. Split-conformal prediction assesses empirical strength uncertainty; applicability analysis assesses representation in the development predictor space. Both inform caution in engineering screening, and neither replaces experimental validation.
The corrected interval branch partitions 1826 proper-training, 381 calibration, and 416 test observations before any interval-model tuning. Precision-connected composition families do not cross these boundaries. Twelve seeded random trials are evaluated only within grouped proper-training folds. Quantiles 6.949 and 9.387 MPa yield widths 13.899 and 18.774 MPa; the internal coverage is 82.21% and 91.35%, below nominal levels.
Screened external coverage decreases further to 36.27% and 47.06% on 102 observations, without external recalibration. This is inadequate coverage for claiming transferable predictive reliability. The all-427 diagnostic is more favorable but contains potentially shared families and cannot replace the screened estimate.
The screened external subset includes 40 outside-support, 25 near-boundary, and 37 interior observations. Applicability diagnoses characterize recorded input distributions, not the original study identity, missing material chemistry, or specimen provenance. They should accompany the failed transfer results rather than be used to convert them into a broad validation claim.
Multiple ages within one calibration family also challenge row exchangeability. A diagnostic based on each calibration family’s maximum residual increases widths to 16.579 and 22.810 MPa. The internal row coverage becomes 87.50% and 95.19%, while the all-observed-rows family coverage is 81.98% and 94.19%. The screened external coverage remains only 41.18% and 60.78%. Thus, wider, family-aware scores do not resolve source shift.
Nominal interval construction cannot establish trustworthy extrapolation. Empirical support, within-family dependence, missing material descriptors, and distribution shift require a separate assessment.
Optimization can concentrate attractive strength, carbon, or cost candidates near data boundaries where support is weaker. Uncertainty and applicability assessment guard against interpreting these predictions as automatically credible engineering solutions. Outside-support predictions are not invalid by definition, but require stronger independent experimental verification before mixture selection.
The primary row-score analysis lacks unconditional coverage guarantees for within-family dependent observations or shifted sources. The supplementary family-maximum diagnostic is transparently labeled and does not repair the observed transfer failure. Future interval methods require prospective source-aware and family-level evaluation with the strict separation of selection, calibration, and testing.
4.4. Sustainable Optimization and Decision-Support Scope
NSGA-II generated 200 nondominated 28-day screening candidates. Competing strength, constituent-carbon, and material-cost objectives do not generally yield a unique optimum. The Pareto set organizes trade-offs for project-specific priorities rather than selecting solely by maximum predicted strength.
The updated Pareto set spans predicted strength 15.551–80.923 MPa, constituent-carbon proxy 124.404–436.603 kg CO2e/m3, and Egyptian material-cost scenario 1122.485–5264.902 EGP/m3. These are outputs conditional on the frozen surrogate and supplier-reported cost assumptions, not demonstrated construction performance.
Volume feasibility and empirical support are distinct. All 200 candidates close volume under assumed densities and air: 0 are outside support, 133 near-boundary, and 67 interior. The archive retains support classifications; outside-support candidates are not shortlisted. Interior status still cannot establish material compatibility or fresh-state feasibility.
The concentration of near-boundary candidates reflects optimization’s search for favorable combinations near feasible or empirical limits. Ranking only by predicted objectives could conceal sparse support. Applicability therefore remains a separate evidence layer. Near-boundary status does not automatically reject a candidate, but signals a need for additional verification.
Replacement carbon factors have traceable sources and contexts, including explicit SCM allocation. Most non-cement footprints remain foreign/product-class proxies. The Egyptian cost scenario combines official October 2025 references with author-reported supplier enquiries around the laboratory trials: Al Aseel for ground GGBFS and delivered water, and Sika for fly ash and ViscoCrete 3425. The reported supplier prices include delivery and fees as stated by the author; no written quotations were recovered. No exchange-rate conversion is used for the updated GGBFS price. This improves the stated geographical, temporal and procurement context but does not establish authenticated supplier evidence or a uniform industrial-bulk purchase basis. Written quotations and consistent product/order/delivery details remain necessary before project-specific monetary conclusions.
Recent concrete studies combine strength with environmental, economic, or durability objectives [7,8,9,10]. Here, optimization also retains explicit support qualification before engineering interpretation. Its contribution is integration with validation, uncertainty, explainability, and applicability, not NSGA-II itself. Optimization is not independent proof of mixture feasibility.
CDSS expresses preferences among three min–max-normalized objectives within the same base set. Weight and coefficient sensitivity are provided separately from fresh-search sensitivity. Priority scenarios substantially change candidate rankings, indicating that the preferred candidate depends on the selected objective weights.
CDSS is not a structural reliability index, a probability of satisfactory performance, or an uncertainty measure. Uncertainty and applicability remain separate. Pareto analysis identifies nondominated alternatives, applicability characterizes support, and CDSS expresses objective preferences. Experimental and engineering qualification determines practical suitability.
4.5. Laboratory Evidence and Practical Applicability
The six laboratory means documented in the supplied report cover 48.60–51.20 MPa. The frozen final estimator gives RMSE = 5.765 MPa on the Table 12 compositions. For M1–M6, its signed prediction errors are +7.587, +5.660, +4.677, −0.392, −1.448 and −9.255 MPa, respectively (Supplementary Text S4). The separate historical comparison is retained in Supplementary Text S4; its generating model and exact input-vector provenance remain unrecovered. The frozen estimator overpredicts M1–M3 and underpredicts M6, whereas the reported means remain close to 50 MPa. The narrow strength range does not justify dismissing these prediction errors, and the results do not establish successful experimental validation.
The laboratory binder content is 450 kg/m3, as documented in the signed and stamped laboratory composition report and reproduced in Table 12. The frozen-model comparison uses these documented proportions. The supplied reports document the laboratory compositions and strengths, but do not establish that the optimized candidates were physically produced and tested.
The laboratory program provides no direct evidence at approximately 15 or 30 MPa. Lower-strength database records cannot substitute for independent testing under controlled material conditions. Differences in constituent effects, interactions, or model error across strength regimes remain unresolved. Hypotheses about the relative influence of raw-material properties in lower-strength concrete require prospective testing.
Practical implementation consequently requires conventional engineering qualification after computational screening. At minimum, a selected candidate should undergo complete volumetric proportioning and fresh-state verification, followed by compressive-strength testing at the required ages, durability and exposure assessment, constituent-source qualification, and verification against the applicable code and project specifications. Where relevant, additional requirements should include density, air content, setting behavior, segregation resistance, pumpability, and other construction-specific properties.
Workability was neither a harmonized predictor nor an optimization objective. Slump measurements from six laboratory mixtures are insufficient to model workability or establish it for Pareto candidates. Optimization at 28 days also cannot establish early- or later-age behavior. Pareto status does not demonstrate acceptable slump, flow, pumpability, segregation resistance, early-age performance, durability, or construction readiness.
The signed and stamped composition report documents mixture means, dates and test geometry; the separate signed and stamped specimen-level report supplies 35 numerical individual strengths, enabling within-mixture variability estimates (Supplementary Tables S6 and S7). These records do not establish independent-batch repeatability or transfer across material sources. Report-level authentication strengthens the traceability of the measured specimens; documented independent batches or a prospective experimental campaign would still be required for stronger generalization and repeatability claims.
4.6. Limitations and Future Development
The predictors describe constituent quantities and age but do not consistently capture cement chemistry and mineralogy, SCM composition and fineness, aggregate grading and absorption, admixture characteristics, or other physicochemical properties. Similar nominal proportions can therefore conceal material differences that the surrogate cannot explicitly resolve, limiting interpretation and predictive transferability.
Workability and durability are not modeled, and optimization is restricted to 28-day strength, carbon, and material cost. Accordingly, the framework supports preliminary mixture screening rather than complete mixture design. Fresh-state performance, early-age strength, shrinkage, creep, permeability, and exposure resistance remain outside its objectives and require harmonized experimental measurements before they can be incorporated as additional constraints.
Environmental proxies are traceable but are not uniformly Egyptian or product-specific. Monetary inputs combine official references with author-reported oral supplier prices from approximately October 2025. Thirty-six optimization runs, comprising one base run and 35 sensitivity runs, examine coefficient, allocation, air, density, and seed assumptions using the updated cost coefficients. Their variation demonstrates scenario dependence rather than robustness across all Egyptian procurement conditions. Written supplier quotations and measured material densities and air content remain necessary for project-specific assessment.
The screened external point result (R2 = −1.015) and prediction-interval coverages (36.27% and 47.06%) reveal substantial limitations in cross-source transferability. Numerical family exclusion strengthens evaluation integrity without improving predictive accuracy, while unavailable original study/batch labels and unmeasured material descriptors further restrict generalization claims.
The six-mixture laboratory program covers a narrow strength range around 50 MPa and a single fly-ash replacement sequence. It therefore does not establish lower-strength performance, transfer across material sources, or the experimental validation of Pareto-optimal mixtures. Future studies should evaluate approximately 15, 30, and 50 MPa mixtures using replicate specimens, preferably independent batches, and multiple material sources. Detailed characterization should include cement chemistry and strength class, SCM composition and fineness, aggregate grading and absorption, and admixture properties. Future testing should assess fresh-state behavior, strength at the early and later ages, and durability beyond 28 days. Prediction errors should then be examined by strength regime, age, material source, and empirical support status. Promising optimized candidates should be produced prospectively and compared with reference mixtures under consistent material, curing, and testing conditions to assess whether computational Pareto advantages persist after conventional engineering qualification.
Future computational development should preserve the separation of model selection, tuning, calibration, and testing while strengthening uncertainty and applicability assessment. Source-aware, group-level, and locally adaptive conformal methods warrant evaluation under heterogeneous sources and distribution shift. Larger source-labelled datasets may improve applicability diagnostics, while additional optimization constraints require corresponding measured variables.
Ultimately, future frameworks may integrate strength, fresh-state performance, durability, environmental impact, and economic objectives within a more comprehensive decision-support process. Progress toward engineering application will depend on stronger, traceable experimental evidence, particularly near applicability boundaries, rather than computational complexity alone. Predictive modeling and optimization should continue to complement laboratory qualification and code-based approval.
5. Conclusions
This study presents an auditable, uncertainty-aware, and explainable AI framework for sustainable concrete mixture screening, integrating leakage-controlled validation, model interpretation, applicability assessment, and multi-objective optimization. Its principal contribution lies in combining rigorous predictive evaluation with a dedicated engineering component for transparent and risk-informed mixture design.
Following systematic auditing, 2623 of 2700 development records were retained. Nested exact-family XGBoost validation achieved R2 = 0.857 ± 0.039 and RMSE = 5.386 ± 0.635 MPa. External screening excluded 325 potentially overlapping records, leaving 102 observations for frozen-model evaluation (R2 = −1.015; RMSE = 11.115 MPa). Prediction-interval coverage reached 36.27% and 47.06% at nominal 90% and 95% levels, respectively, highlighting transferability and uncertainty-calibration limitations. SHAP identified influential statistical associations without implying material causality.
The engineering component employed a reproducible NSGA-II procedure incorporating assumed absolute-volume closure to generate 200 nondominated candidate mixtures, including 67 interior and 133 near-boundary solutions, with none outside the defined applicability support. Thirty-six optimization runs, comprising one base run and 35 sensitivity runs, together with complete mixture compositions and objective calculations, support a transparent strength–carbon–cost trade-off analysis. Environmental and economic estimates remain conditional on documented emission-factor proxies and author-reported supplier-enquiry and published procurement assumptions.
The laboratory assessment of six concrete mixtures, supported by signed and stamped reports documenting mixture compositions and individual compressive-strength measurements, yielded RMSE = 5.765 MPa for the frozen model. The prediction errors characterize the frozen model’s performance on the six tested mixtures, while the specimen measurements describe within-mixture variability. Independent-batch repeatability and the performance of optimized mixtures require further investigation. Table 18 and Supplementary Text S4 preserve frozen-model and historical prediction results separately for traceability.
Future work should conduct the prospective testing of selected optimized mixtures and strengthen material characterization, durability assessment, and cost verification. The generating checkpoint and exact input vectors of the archived historical laboratory predictions remain unrecovered; those values are retained solely for traceability.
The framework integrates explainable AI with reproducible computational procedures to support the preliminary screening of sustainable concrete mixtures and guide subsequent experimental qualification.
Supplementary Materials
The following supporting information can be downloaded at: https://www.mdpi.com/article/10.3390/buildings16214407/s1, Table S1 provides all 200 new base candidates at full precision, volume/constraint checks, support diagnostics, and CDSS scenarios. Table S2 preserves historical nested and all-development model configurations. Table S3 provides the corrected proper-training-only interval parameters and trial/fold results. The review reproduction package also contains exact analysis inputs, family identifiers, partitions, source-row mapping, prediction outputs, factor/density assumptions, all 36 optimization tables and logs, software versions, and executable code. Supplementary Text S4 provides both sets of six laboratory predictions, the exact eight-feature frozen-model inputs, complete evaluation statistics, the mean-benchmark comparison, and the separately archived historical predictions. Figure S1 provides the signed and stamped laboratory composition report, including mixture compositions, test dates, cube dimensions, and mixture-level mean strengths. Figure S2 provides the separate signed and stamped laboratory report containing individual specimen compressive-strength measurements. Supplementary Tables S5–S7 provide the six laboratory mixture compositions, individual compressive-strength measurements at 7 and 28 days, and descriptive statistics, respectively.
Author Contributions
Conceptualization, A.N.E. and D.S.; methodology, A.N.E.; software, A.N.E.; validation, A.N.E.; formal analysis, A.N.E. and M.Z.; investigation, A.N.E.; resources, A.N.E. and M.Z.; data curation, A.N.E.; writing—original draft preparation, A.N.E.; writing—review and editing, A.N.E., D.S. and M.Z.; visualization, A.N.E.; supervision, A.N.E. and D.S. All authors have read and agreed to the published version of the manuscript.
Funding
This work was supported by the Interreg Hungary–Slovakia Programme, co-funded by the European Union through the European Regional Development Fund (ERDF), under project HUSK/2302/1.2/063, “Development of an ENVironmental Impact and Risk Assessment focusing on the activities on the catchment of the Sajó/Slaná River basin.”.
Data Availability Statement
Exact analysis datasets, family IDs, split assignments, predictions, model files, executable workflows for the corrected analyses, and source/hash manifests are supplied in the review reproduction package; the historical nested model-comparison and SHAP workflows are not included in the executable correction package. The external Dataset2.xlsx is traced to Nguyen and Ngo, University of Melbourne Figshare Version 2, DOI 10.26188/5bf33d0980a11 [71], under CC BY 4.0. UCI [69] and the cited Mendeley release [70] also display CC BY 4.0; their repository licenses do not independently verify every mapping in the locally compiled development spreadsheet. No public repository deposit is claimed. The signed and stamped laboratory composition report documents the six mixtures and their mean strengths (Supplementary Table S5). A separate signed and stamped laboratory specimen-level test report provides 35 numerical specimen-level strengths and descriptive statistics (Supplementary Tables S6 and S7); the third 28-day M6 entry lacks a numerical value. Both signed and stamped laboratory reports are provided as documentary evidence. Separate original batching sheets, independent-batch identifiers, and testing-machine calibration records have not been supplied; the reports do not establish independent-batch repeatability. Supplementary Text S4 supplies the complete laboratory numerical evaluation. Third-party EPD and price documents retain their own rights; source links and hashes identify them without asserting redistribution rights. The executable package covers the corrected nine-comment analyses; the historical nested model-comparison and SHAP workflows are not reproduced by its four-command workflow. The current six-mixture laboratory results are reproduced using current_laboratory/replay_frozen_lab.py. The preserved four-command historical workflow can regenerate superseded laboratory outputs and is retained for traceability; those outputs are not the current Table 18 or Figure 8 results.
Acknowledgments
The authors gratefully acknowledge the publicly available concrete databases utilized in this study and the support provided by the Construction and Building Engineering Department, Arab Academy for Science, Technology and Maritime Transport (AASTMT), Port Said, Egypt.
Conflicts of Interest
The authors declare no conflicts of interest.
Abbreviations
The following abbreviations are used in this manuscript:
| Abbreviation | Definition |
| CDSS | Composite Decision-Support Score |
| CV | Cross-Validation |
| FA | Fly Ash |
| GGBFS | Ground-Granulated Blast-Furnace Slag |
| MAE | Mean Absolute Error |
| MAPE | Mean Absolute Percentage Error |
| ML | Machine Learning |
| MPIW | Mean Prediction Interval Width |
| NN | Nearest Neighbor |
| NSGA-II | Non-dominated Sorting Genetic Algorithm II |
| PCA | Principal Component Analysis |
| PICP | Prediction Interval Coverage Probability |
| PINAW | Prediction Interval Normalized Average Width |
| RF | Random Forest |
| RMSE | Root Mean Squared Error |
| SCM | Supplementary Cementitious Material |
| SHAP | SHapley Additive exPlanations |
| SMD | Standardized Mean Difference |
| SP | Superplasticizer |
| TPE | Tree-structured Parzen Estimator |
| UQ | Uncertainty Quantification |
| XGBoost | Extreme Gradient Boosting |
References
- Zhao, Z.; Ji, C.; Xiao, J.; Yao, L.; Lin, C.; Ding, T.; Ye, T. A critical review on reducing the environmental impact of 3D printing concrete: Material preparation, construction process and structure level. Constr. Build. Mater. 2023, 409, 133887. [Google Scholar] [CrossRef] [Scilit]
- Snellings, R.; Suraneni, P.; Skibsted, J. Future and emerging supplementary cementitious materials. Cem. Concr. Res. 2023, 171, 107199. [Google Scholar] [CrossRef] [Scilit]
- Gartner, E.; Sui, T. Alternative cement clinkers. Cem. Concr. Res. 2018, 114, 27–39. [Google Scholar] [CrossRef] [Scilit]
- Ashish, D.K. Concrete made with waste marble powder and supplementary cementitious material for sustainable development. J. Clean. Prod. 2019, 211, 716–729. [Google Scholar] [CrossRef] [Scilit]
- Mehta, A.; Ashish, D.K. Silica fume and waste glass in cement concrete production: A review. J. Build. Eng. 2020, 29, 100888. [Google Scholar] [CrossRef] [Scilit]
- Supriya; Chaudhury, R.; Sharma, U.; Thapliyal, P.C.; Singh, L.P. Low-CO2 emission strategies to achieve net zero target in cement sector. J. Clean. Prod. 2023, 417, 137466. [Google Scholar] [CrossRef] [Scilit]
- Wang, S.; Xia, P.; Gong, F.; Zeng, Q.; Chen, K.; Zhao, Y. Multi-objective optimization of recycled aggregate concrete based on explainable machine learning. J. Clean. Prod. 2024, 445, 141045. [Google Scholar] [CrossRef] [Scilit]
- Mohammadi Golafshani, E.; Behnood, A.; Kim, T.; Ngo, T.; Kashani, A. A framework for low-carbon mix design of recycled aggregate concrete with supplementary cementitious materials using machine learning and optimization algorithms. Structures 2024, 61, 106143. [Google Scholar] [CrossRef] [Scilit]
- Fan, M.; Li, Y.; Shen, J.; Jin, K.; Shi, J. Multi-objective optimization design of recycled aggregate concrete mixture proportions based on machine learning and NSGA-II algorithm. Adv. Eng. Softw. 2024, 192, 103631. [Google Scholar] [CrossRef] [Scilit]
- Gao, J.; Wang, C.; Chu, S.H. Mix design of sustainable concrete using generative models. J. Build. Eng. 2024, 96, 110618. [Google Scholar] [CrossRef] [Scilit]
- Chen, T.; Guestrin, C. XGBoost: A scalable tree boosting system. In Proceedings of the 22nd ACM SIGKDD International Conference on Knowledge Discovery and Data Mining, San Francisco, CA, USA, 13–17 August 2016; pp. 785–794. [Google Scholar]
- Breiman, L. Random forests. Mach. Learn. 2001, 45, 5–32. [Google Scholar] [CrossRef] [Scilit]
- Friedman, J.H. Greedy function approximation: A gradient boosting machine. Ann. Stat. 2001, 29, 1189–1232. [Google Scholar] [CrossRef] [Scilit]
- Aalimahmoody, N.; Bedon, C.; Hasanzadeh-Inanlou, N.; Hasanzade-Inallu, A.; Nikoo, M. BAT algorithm-based ANN to predict the compressive strength of concrete—A comparative study. Infrastructures 2021, 6, 80. [Google Scholar] [CrossRef] [Scilit]
- Ahmad, A.; Ahmad, W.; Aslam, F.; Joyklad, P. Compressive strength prediction of fly ash-based geopolymer concrete via advanced machine learning techniques. Case Stud. Constr. Mater. 2022, 16, e00840. [Google Scholar] [CrossRef] [Scilit]
- Ahmed, H.U.; Mohammed, A.S.; Faraj, R.H.; Abdalla, A.A.; Qaidi, S.M.A.; Sor, N.H.; Mohammed, A.A. Innovative modeling techniques including MEP, ANN and FQ to forecast the compressive strength of geopolymer concrete modified with nanoparticles. Neural Comput. Appl. 2023, 35, 12453–12479. [Google Scholar] [CrossRef] [Scilit]
- Ahmed, H.U.; Mohammed, A.A.; Mohammed, A. Soft computing models to predict the compressive strength of GGBS/FA geopolymer concrete. PLoS ONE 2022, 17, e0265846. [Google Scholar] [CrossRef] [Scilit] [PubMed]
- Ahmed, H.U.; Mostafa, R.R.; Mohammed, A.; Sihag, P.; Qadir, A. Support vector regression (SVR) and grey wolf optimization (GWO) to predict the compressive strength of GGBFS-based geopolymer concrete. Neural Comput. Appl. 2023, 35, 2909–2926. [Google Scholar] [CrossRef] [Scilit]
- Amin, M.N.; Khan, K.; Javed, M.F.; Aslam, F.; Qadir, M.G.; Faraz, M.I. Prediction of mechanical properties of fly-ash/slag-based geopolymer concrete using ensemble and non-ensemble machine-learning techniques. Materials 2022, 15, 3478. [Google Scholar] [CrossRef] [Scilit] [PubMed]
- Bai, M.; Zhang, Z.; Cao, K.; Li, H.; He, C. Prediction of compressive strength of fly ash-slag based geopolymer paste based on multi-optimized artificial neural network. Materials 2023, 16, 1090. [Google Scholar] [CrossRef] [Scilit] [PubMed]
- Bu, L.; Du, G.; Hou, Q. Prediction of the compressive strength of recycled aggregate concrete based on artificial neural network. Materials 2021, 14, 3921. [Google Scholar] [CrossRef] [Scilit] [PubMed]
- Dao, D.V.; Adeli, H.; Ly, H.B.; Le, L.M.; Le, V.M.; Le, T.T.; Pham, B.T. A sensitivity and robustness analysis of GPR and ANN for high-performance concrete compressive strength prediction using a Monte Carlo simulation. Sustainability 2020, 12, 830. [Google Scholar] [CrossRef] [Scilit]
- Dodo, Y.; Arif, K.; Alyami, M.; Ali, M.; Najeh, T.; Gamil, Y. Estimation of compressive strength of waste concrete utilizing fly ash/slag in concrete with interpretable approaches: Optimization and graphical user interface (GUI). Sci. Rep. 2024, 14, 4598. [Google Scholar] [CrossRef] [Scilit] [PubMed]
- Emarah, D.A. Compressive strength analysis of fly ash-based geopolymer concrete using machine learning approaches. Results Mater. 2022, 16, 100347. [Google Scholar] [CrossRef] [Scilit]
- Gomaa, E.; Han, T.; ElGawady, M.; Huang, J.; Kumar, A. Machine learning to predict properties of fresh and hardened alkali-activated concrete. Cem. Concr. Compos. 2021, 115, 103863. [Google Scholar] [CrossRef] [Scilit]
- Huynh, A.T.; Nguyen, Q.D.; Xuan, Q.L.; Magee, B.; Chung, T.; Tran, K.T.; Nguyen, K.T. A machine learning-assisted numerical predictor for compressive strength of geopolymer concrete based on experimental data and sensitivity analysis. Appl. Sci. 2020, 10, 7726. [Google Scholar] [CrossRef] [Scilit]
- Kandiri, A.; Mohammadi Golafshani, E.; Behnood, A. Estimation of the compressive strength of concretes containing ground granulated blast furnace slag using hybridized multi-objective ANN and salp swarm algorithm. Constr. Build. Mater. 2020, 248, 118676. [Google Scholar] [CrossRef] [Scilit]
- Mai, H.V.T.; Nguyen, T.A.; Ly, H.B.; Tran, V.Q. Investigation of ANN model containing one hidden layer for predicting compressive strength of concrete with blast-furnace slag and fly ash. Adv. Mater. Sci. Eng. 2021, 2021, 5540853. [Google Scholar] [CrossRef] [Scilit]
- Nazar, S.; Yang, J.; Amin, M.N.; Khan, K.; Ashraf, M.; Aslam, F.; Javed, M.F.; Eldin, S.M. Machine learning interpretable-prediction models to evaluate the slump and strength of fly ash-based geopolymer. J. Mater. Res. Technol. 2023, 24, 100–124. [Google Scholar] [CrossRef] [Scilit]
- Peng, Y.; Unluer, C. Analyzing the mechanical performance of fly ash-based geopolymer concrete with different machine learning techniques. Constr. Build. Mater. 2022, 316, 125785. [Google Scholar] [CrossRef] [Scilit]
- Rathnayaka, M.; Karunasinghe, D.; Gunasekara, C.; Wijesundara, K.; Lokuge, W.; Law, D.W. Machine learning approaches to predict compressive strength of fly ash-based geopolymer concrete: A comprehensive review. Constr. Build. Mater. 2024, 419, 135519. [Google Scholar] [CrossRef] [Scilit]
- Shah, S.A.R.; Azab, M.; Seif ElDin, H.M.; Barakat, O.; Anwar, M.K.; Bashir, Y. Predicting compressive strength of blast furnace slag and fly ash based sustainable concrete using machine learning techniques: An application of advanced decision-making approaches. Buildings 2022, 12, 914. [Google Scholar] [CrossRef] [Scilit]
- Shah, S.F.A.; Chen, B.; Zahid, M.; Ahmad, M.R. Compressive strength prediction of one-part alkali activated material enabled by interpretable machine learning. Constr. Build. Mater. 2022, 360, 129534. [Google Scholar] [CrossRef] [Scilit]
- Verma, N.K.; Meesala, C.R.; Kumar, S. Developing an ANN prediction model for compressive strength of fly ash-based geopolymer concrete with experimental investigation. Neural Comput. Appl. 2023, 35, 10329–10345. [Google Scholar] [CrossRef] [Scilit]
- Wang, Y.; Iqtidar, A.; Amin, M.N.; Nazar, S.; Hassan, A.M.; Ali, M. Predictive modelling of compressive strength of fly ash and ground granulated blast furnace slag based geopolymer concrete using machine learning techniques. Case Stud. Constr. Mater. 2024, 20, e03130. [Google Scholar] [CrossRef] [Scilit]
- Zhang, L.V.; Marani, A.; Nehdi, M.L. Chemistry-informed machine learning prediction of compressive strength for alkali-activated materials. Constr. Build. Mater. 2022, 316, 126103. [Google Scholar] [CrossRef] [Scilit]
- Zhang, M.; Zhang, C.; Zhang, J.; Wang, L.; Wang, F. Effect of composition and curing on alkali-activated fly ash-slag binders: Machine learning prediction with a random forest–genetic algorithm hybrid model. Constr. Build. Mater. 2023, 366, 129940. [Google Scholar] [CrossRef] [Scilit]
- Singh, R.P.; Vanapalli, K.R.; Cheela, V.R.S.; Peddireddy, S.R.; Sharma, H.B.; Mohanty, B. Fly ash, GGBS, and silica fume based geopolymer concrete with recycled aggregates: Properties and environmental impacts. Constr. Build. Mater. 2023, 378, 131168. [Google Scholar] [CrossRef] [Scilit]
- Gopalakrishna, B.; Dinakar, P. Mix design development of fly ash-GGBS based recycled aggregate geopolymer concrete. J. Build. Eng. 2023, 63, 105551. [Google Scholar] [CrossRef] [Scilit]
- Alam, M.J.; Biswas, M.; Mia, M.B.; Alam, S.; Hossain, M.M. The influence of rice husk ash on mechanical properties of the mortar and concrete: A critical review. Open J. Civ. Eng. 2024, 14, 65–81. [Google Scholar] [CrossRef]
- Tamuly, P.; Nava, V. Machine learning based conformal predictors for uncertainty-aware compressive strength estimation of concrete. Constr. Build. Mater. 2025, 487, 141844. [Google Scholar] [CrossRef] [Scilit]
- La, H.; Uddin, M.; Nguyen, N.H.T.; Nguyen, T. Hybrid NSGA-III and surrogate model framework for sustainable concrete mix design: Balancing strength, energy, and carbon. Appl. Soft Comput. 2025, 185, 114018. [Google Scholar] [CrossRef] [Scilit]
- Mobasheri, F.; Hosseinpoor, M.; Yahia, A.; Pourkamali-Anaraki, F. Predicting the compressive strength of self-consolidating concrete using machine learning and conformal inference. Comput. Model. Eng. Sci. 2025, 145, 3309–3347. [Google Scholar] [CrossRef] [Scilit]
- Zhang, L.; Li, T. Interpretable XGBoost framework for multi-objective manufactured sand concrete mix design. Sci. Rep. 2026, 16, 21086. [Google Scholar] [CrossRef] [Scilit] [PubMed]
- Zhu, X.; Xu, W. Sustainable mix design of recycled aggregate concrete: Machine learning-assisted multi-objective optimization of strength, life-cycle cost, and net carbon emissions. Buildings 2026, 16, 3198. [Google Scholar] [CrossRef] [Scilit]
- Zhao, Z.; Remond, S.; Damidot, D.; Xu, W. Influence of fine recycled concrete aggregates on the properties of mortars. Constr. Build. Mater. 2015, 81, 179–186. [Google Scholar] [CrossRef] [Scilit]
- Duan, P.; Shui, Z.; Chen, W.; Shen, C. Enhancing microstructure and durability of concrete from ground granulated blast furnace slag and metakaolin as cement replacement materials. J. Mater. Res. Technol. 2013, 2, 52–59. [Google Scholar] [CrossRef] [Scilit]
- Ahmad, S.; Baghabra Al-Amoudi, O.S.; Khan, S.M.S.; Maslehuddin, M. Effect of silica fume inclusion on the strength, shrinkage and durability characteristics of natural pozzolan-based cement concrete. Case Stud. Constr. Mater. 2022, 17, e01255. [Google Scholar] [CrossRef] [Scilit]
- Anwar, M.; Emarah, D.A. Resistance of concrete containing ternary cementitious blends to chloride attack and carbonation. J. Mater. Res. Technol. 2020, 9, 3198–3207. [Google Scholar] [CrossRef] [Scilit]
- Huynh, T.P.; Ho, L.S.; Ho, Q.V. Experimental investigation on the performance of concrete incorporating fine dune sand and ground granulated blast-furnace slag. Constr. Build. Mater. 2022, 347, 128512. [Google Scholar] [CrossRef] [Scilit]
- Ho, L.S.; Huynh, T.P. Recycled waste medical glass as a fine aggregate replacement in low environmental impact concrete: Effects on long-term strength and durability performance. J. Clean. Prod. 2022, 368, 133144. [Google Scholar] [CrossRef] [Scilit]
- Zhong, H.; Zhang, M. Engineered geopolymer composites: A state-of-the-art review. Cem. Concr. Compos. 2023, 135, 104850. [Google Scholar] [CrossRef] [Scilit]
- Ganjian, E.; Pouya, H.S. The effect of Persian Gulf tidal zone exposure on durability of mixes containing silica fume and blast furnace slag. Constr. Build. Mater. 2009, 23, 644–652. [Google Scholar] [CrossRef] [Scilit]
- Alizadeh, R.; Ghods, P.; Chini, M.; Hoseini, M.; Ghalibafian, M.; Shekarchi, M. Effect of curing conditions on the service life design of RC structures in the Persian Gulf region. J. Mater. Civ. Eng. 2008, 20, 2–8. [Google Scholar] [CrossRef] [Scilit]
- Shekarchi, M.; Rafiee, A.; Layssi, H. Long-term chloride diffusion in silica fume concrete in harsh marine climates. Cem. Concr. Compos. 2009, 31, 769–775. [Google Scholar] [CrossRef] [Scilit]
- Ahmad, S. Reinforcement corrosion in concrete structures, its monitoring and service life prediction—A review. Cem. Concr. Compos. 2003, 25, 459–471. [Google Scholar] [CrossRef] [Scilit]
- Haque, M.N.; Al-Khaiat, H.; John, B. Climatic zones—A prelude to designing durable concrete structures in the Arabian Gulf. Build. Environ. 2007, 42, 2410–2416. [Google Scholar] [CrossRef] [Scilit]
- Lundberg, S.M.; Lee, S.-I. A unified approach to interpreting model predictions. Adv. Neural Inf. Process. Syst. 2017, 30, 4765–4774. [Google Scholar]
- Ribeiro, M.T.; Singh, S.; Guestrin, C. Why should I trust you? Explaining the predictions of any classifier. In Proceedings of the 22nd ACM SIGKDD International Conference on Knowledge Discovery and Data Mining, San Francisco, CA, USA, 13–17 August 2016; pp. 1135–1144. [Google Scholar]
- Deb, K.; Pratap, A.; Agarwal, S.; Meyarivan, T. A fast and elitist multiobjective genetic algorithm: NSGA-II. IEEE Trans. Evol. Comput. 2002, 6, 182–197. [Google Scholar] [CrossRef] [Scilit]
- Vovk, V.; Gammerman, A.; Shafer, G. Algorithmic Learning in a Random World; Springer: New York, NY, USA, 2005. [Google Scholar]
- Angelopoulos, A.N.; Bates, S. Conformal prediction: A gentle introduction. Found. Trends Mach. Learn. 2023, 16, 494–591. [Google Scholar] [CrossRef] [Scilit]
- Liu, Y. High-performance concrete strength prediction based on machine learning. Comput. Intell. Neurosci. 2022, 2022, 5802217. [Google Scholar] [CrossRef] [Scilit] [PubMed]
- Derakhshan Nezhad, A.H.; Hemati, S.A.; Rezaifar, O. Predicting compressive strength of heavyweight concrete using deep neural networks and Box–Behnken design. Chall. J. Concr. Res. Lett. 2025, 16, 173–202. [Google Scholar] [CrossRef] [Scilit]
- Kumar, A.; Arora, H.C.; Kapoor, N.R.; Mohammed, M.A.; Kumar, K.; Majumdar, A.; Thinnukool, O. Compressive strength prediction of lightweight concrete: Machine learning models. Sustainability 2022, 14, 2404. [Google Scholar] [CrossRef] [Scilit]
- Lu, X.; Liao, Z.; Liang, C.; Huang, J. Reliability-aware and interpretable machine learning for compressive strength prediction of fiber-reinforced concrete. J. Asian Archit. Build. Eng. 2026, 1–27. [Google Scholar] [CrossRef] [Scilit]
- Ezz, H.; Bakr, S.M. Comparative evaluation of machine learning and deep learning approaches for compressive strength prediction of geopolymer concrete. Sci. Rep. 2026, 16, 14652. [Google Scholar] [CrossRef] [Scilit] [PubMed]
- Salami, B.A.; Iqbal, M.; Abdulraheem, A.; Jalal, F.E.; Alimi, W.; Jamal, A.; Tafsirojjaman, T.; Liu, Y.; Bardhan, A. Estimating compressive strength of lightweight foamed concrete using neural, genetic and ensemble machine learning approaches. Cem. Concr. Compos. 2022, 133, 104721. [Google Scholar] [CrossRef] [Scilit]
- Yeh, I.-C. Concrete Compressive Strength. UCI Machine Learning Repository. 1998. Available online: https://archive.ics.uci.edu/dataset/165/concrete+compressive+strength (accessed on 28 October 2026). [CrossRef]
- Ke, L.; Qiu, M. Dataset of Compressive Strength and Slump of Normal Concrete. Mendeley Data, 16 April 2024. [CrossRef]
- Nguyen, T.; Ngo, T. Compressive strength dataset of foamed/normal concrete for prediction model. University of Melbourne Figshare, 19 November 2018; Version 2. [CrossRef]
- Bergstra, J.S.; Bardenet, R.; Bengio, Y.; Kégl, B. Algorithms for hyper-parameter optimization. Adv. Neural Inf. Process. Syst. 2011, 24, 1–9. Available online: https://papers.nips.cc/paper/2011/hash/86e8f7ab32cfd12577bc2619bc635690-Abstract.html (accessed on 8 October 2026).
- Akiba, T.; Sano, S.; Yanase, T.; Ohta, T.; Koyama, M. Optuna: A next-generation hyperparameter optimization framework. arXiv 2019, arXiv:1907.10902. [Google Scholar] [CrossRef] [Scilit]
- Nukah, P.D.; Abbey, S.J.; Booth, C.A.; Nounu, G. Optimisation of embodied carbon and compressive strength in low carbon concrete. Materials 2022, 15, 8673. [Google Scholar] [CrossRef] [Scilit] [PubMed]
- Shobeiri, V.; Bennett, B.; Xie, T.; Visintin, P. Mix design optimization of concrete containing fly ash and slag for global warming potential and cost reduction. Case Stud. Constr. Mater. 2023, 18, e01832. [Google Scholar] [CrossRef] [Scilit]
- Lafarge Egypt. Portland cement, Bulk, El Sokhna plant, Egypt. Environmental Product Declaration; Institut Bauen und Umwelt e. V. (IBU). 2024. Available online: https://ibudata.lca-data.com/datasetdetail/process.xhtml?uuid=9671e015-f2b6-42db-a6f9-9ac3a3bbee34&version=00.01.000 (accessed on 28 October 2026).
- MPA Cement. Fact Sheet 18 Embodied CO2e of UK Cements. Revision 4, 10 April 2025, Table 2. Available online: https://cement.mineralproducts.org/MPACement/media/Cement/Publications/Fact-Sheets/FS_18_Embodied_CO2e.pdf (accessed on 28 October 2026).
- UK Department for Energy Security and Net Zero. Greenhouse Gas Reporting Conversion Factors 2025. Full Workbook, Water Supply Sheet. Available online: https://www.gov.uk/government/publications/greenhouse-gas-reporting-conversion-factors-2025 (accessed on 28 October 2026).
- Sika Hellas ABEE. Superplasticizers Sika ViscoCrete and Sika ViscoFlow. Environmental Product Declaration S-P-06999; Published 22 September 2022; Valid to 21 September 2027. Sika ViscoCrete Ultra-350, Section 6.3; Reference Production 2021. Available online: https://environdec.com/library/epd6999 (accessed on 28 October 2026).
- Heracles. Environmental Product Declaration for Limestone Aggregates from Mesaio. S-P-09561, 2023, Reference Data 2022. Available online: https://heracles-footprint.gr/wp-content/uploads/2023/08/Heracles_EPD_Mesaio_S-P-09561_v3_26072023.pdf (accessed on 28 October 2026).
- Egypt Ministry of Housing Utilities and Urban Communities. Construction Material Prices Bulletin, 2026 Issue, Historical October 2025 Column. pp. 4, 11–12. Available online: https://img.mhuc.gov.eg/images/0dd01e2b-2a28-434c-be96-f8a4e953faf2.pdf (accessed on 28 October 2026).
- Author-Reported Supplier Enquiry to Sika for ViscoCrete 3425, Approximately October 2025: 20 kg pack 4100 EGP and 5 kg pack 1100 EGP, Including Transport and All Fees. Personal Communication; Oral Information Recorded in the Author Supplier-Price Record; No Written Quotation Retained.
- Author-reported supplier enquiries to Al Aseel Ready-Mix Concrete, approximately October 2025 around the laboratory program: Ground GGBFS approximately 3000 EGP/t and delivered water 15 EGP/m3, including supply, transport and all fees. Personal communication; oral information recorded in the author supplier-price record; no written quotation retained.
- Pymoo. Part II: Find a Solution Set Using Multi-Objective Optimization. Documentation for NSGA-II, Crossover and Mutation Configuration; Implementation Used: Pymoo 0.6.2. Available online: https://www.pymoo.org/getting_started/part_2.html (accessed on 8 October 2026).
- Sika Egypt. Sika Fly Ash Product Data Sheet, 2008. Specific Gravity 2.2. Available online: https://egy.sika.com/content/dam/dms/eg01/e/Sika%20Fly%20Ash.pdf (accessed on 28 October 2026).
- Abdelhalim, J.O.; Amer, I.; Abdel Latif, I.; Fawzy, I.; Ismail, S.; Khalaf, M.A. Investigation of the optimum calcination temperature for water treatment plant sludge to develop a sustainable alkali activated concrete. Sci. Rep. 2025, 15, 2117. [Google Scholar] [CrossRef] [Scilit] [PubMed]
- Sika Egypt. Sika ViscoCrete 3425 Product Data Sheet, 2015. Density Approximately 1.08 kg/L. Available online: https://egy.sika.com/content/dam/dms/eg01/e/Sika%20ViscoCrete%C2%AE%20-3425.pdf (accessed on 28 October 2026).
- Fataei, S.; Secrieru, E.; Mechtcherine, V. Experimental Insights into Concrete Flow-Regimes Subject to Shear-Induced Particle Migration (SIPM) during Pumping. Materials 2020, 13, 1233. [Google Scholar] [CrossRef] [Scilit] [PubMed]
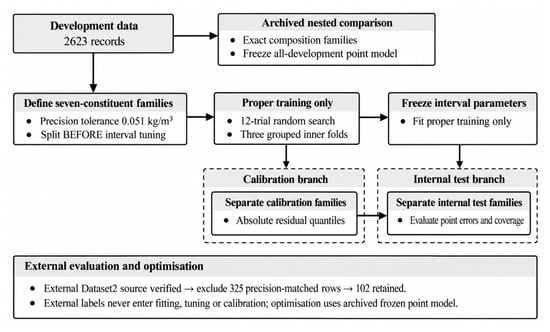
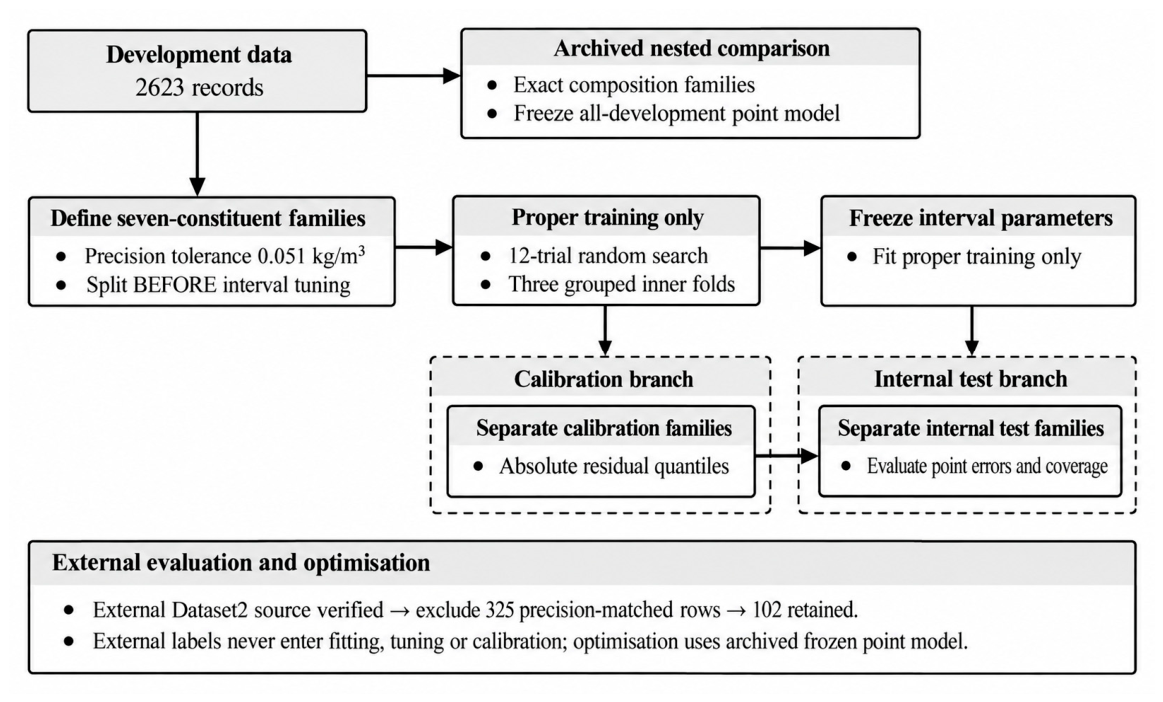
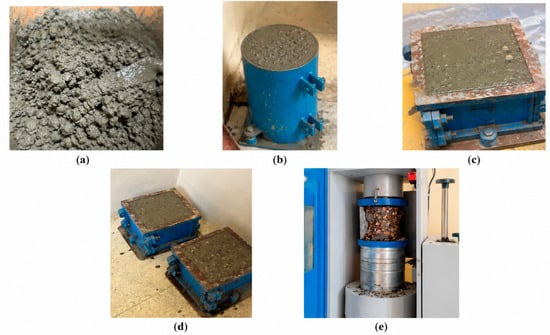
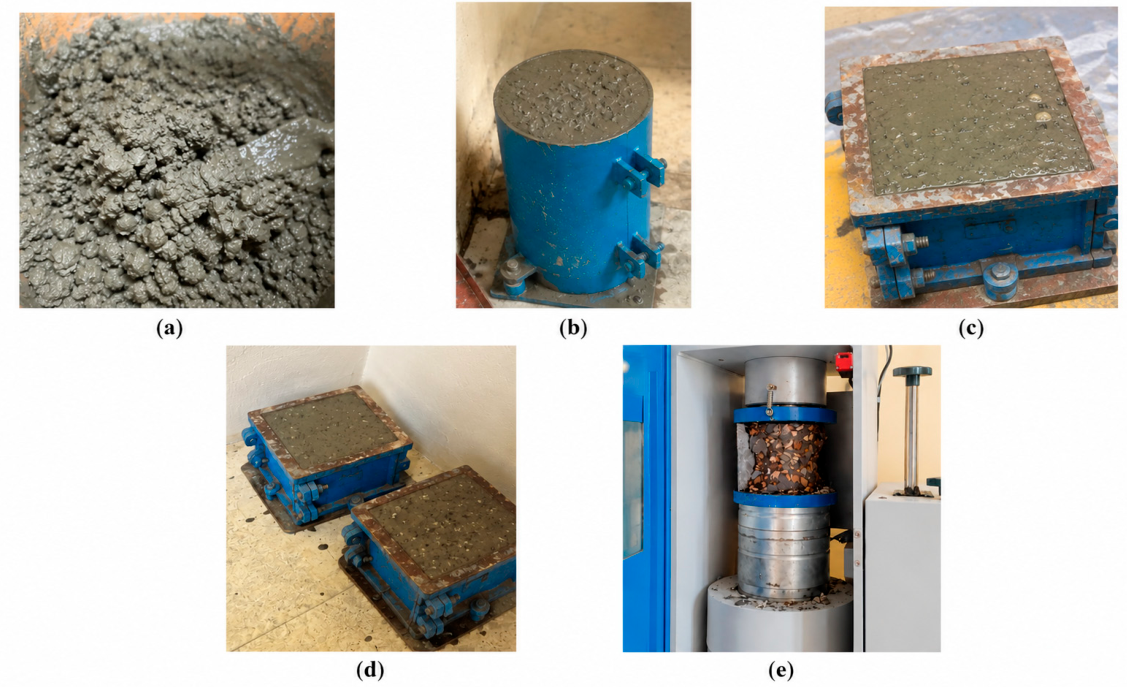
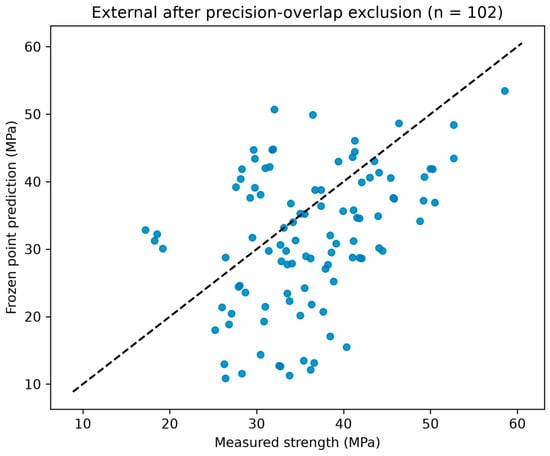
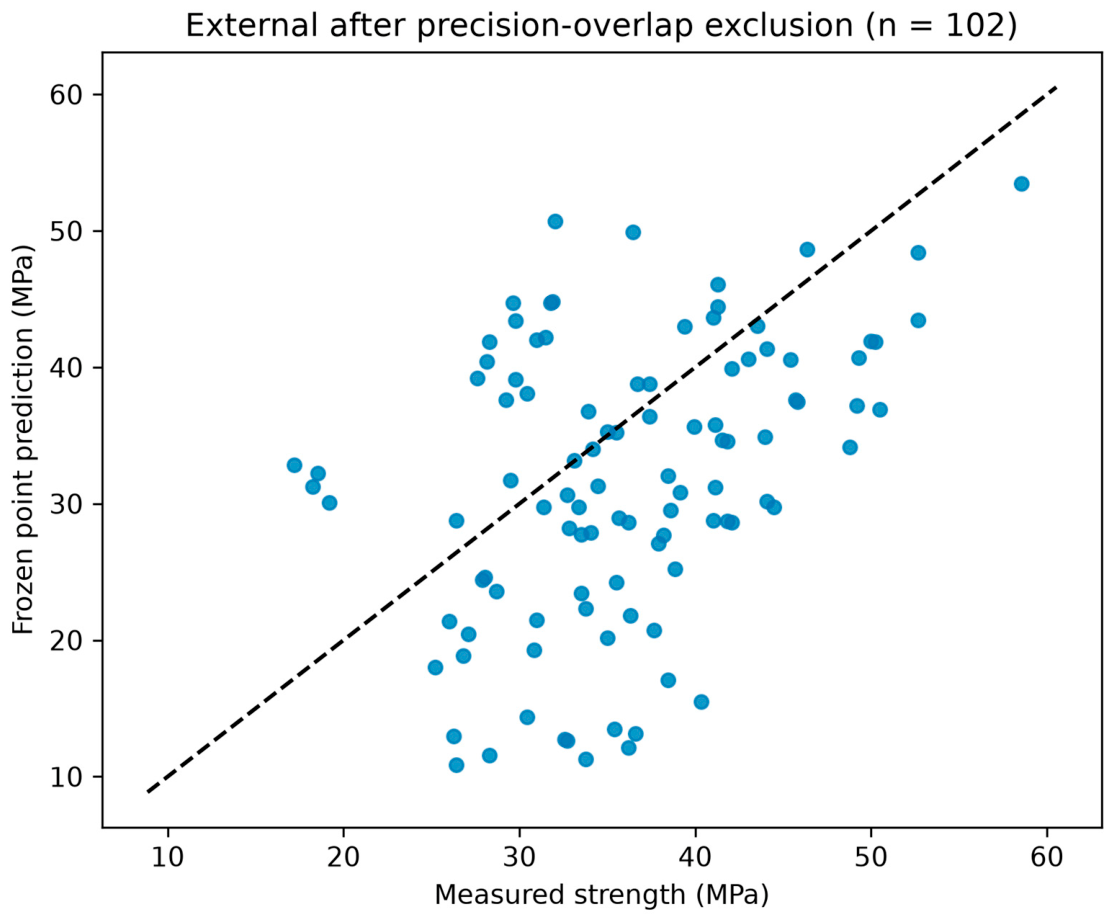
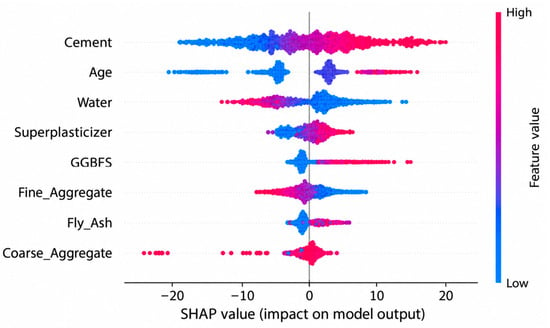
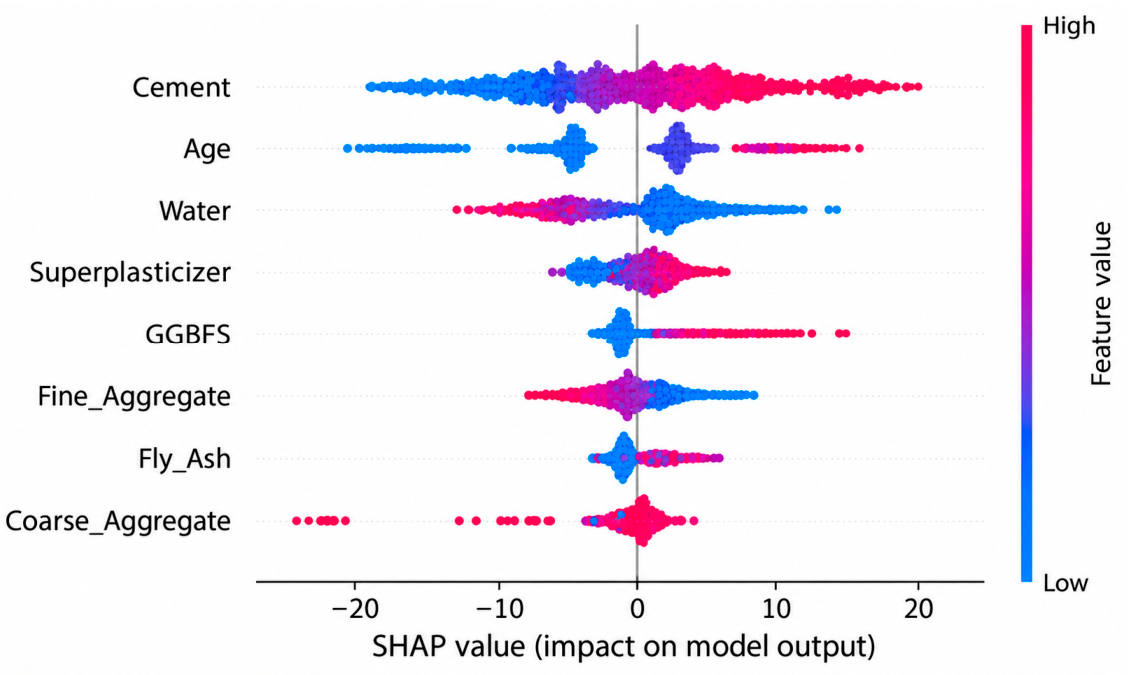
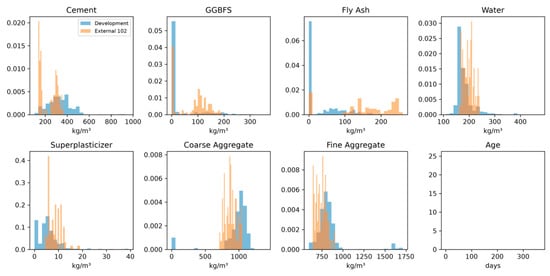
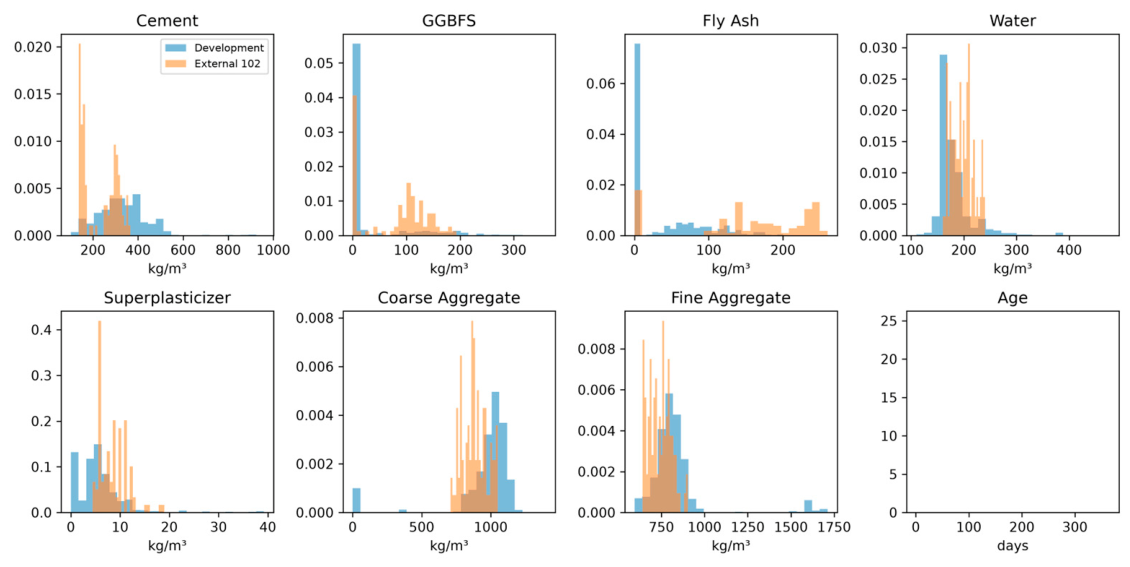
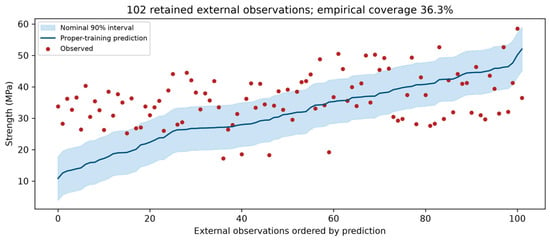
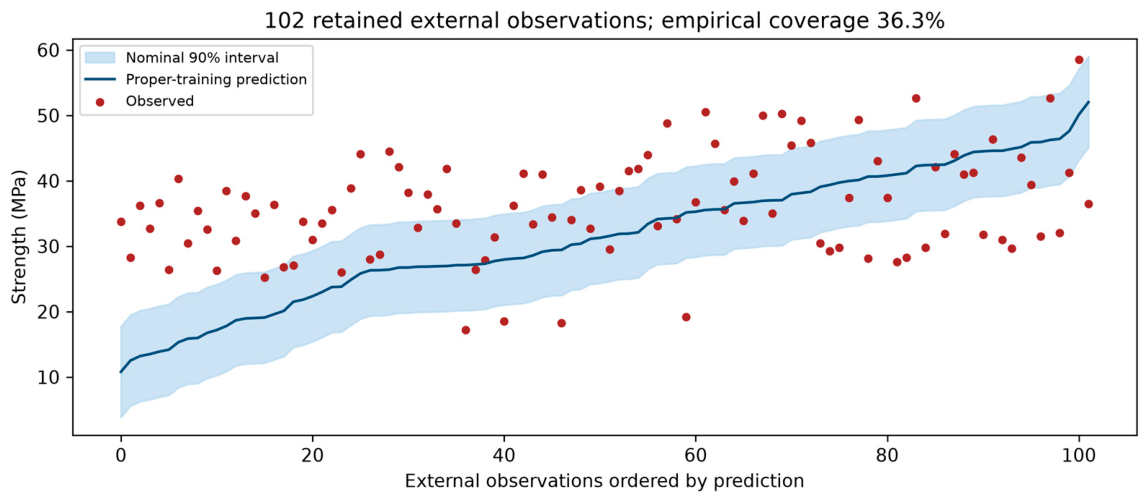
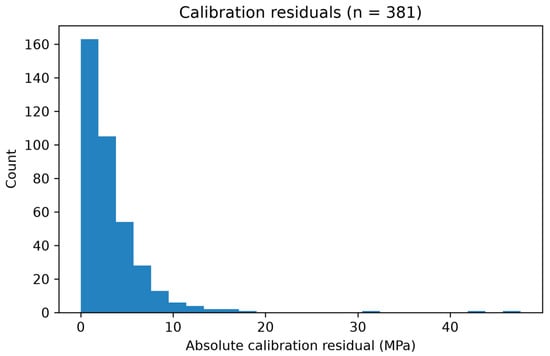
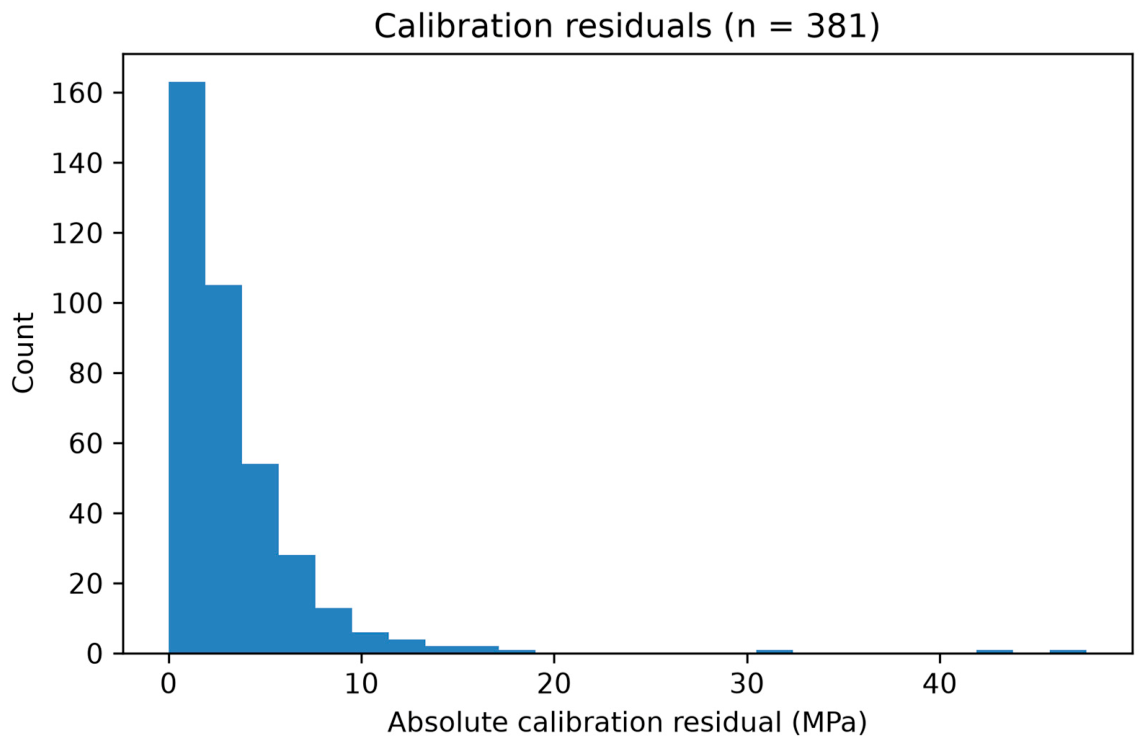
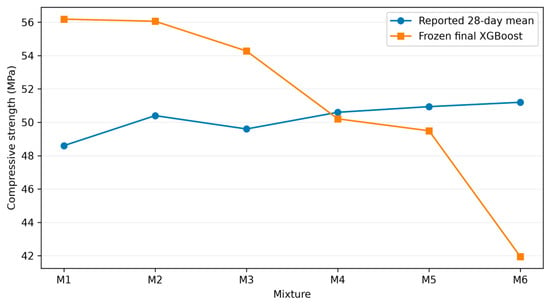
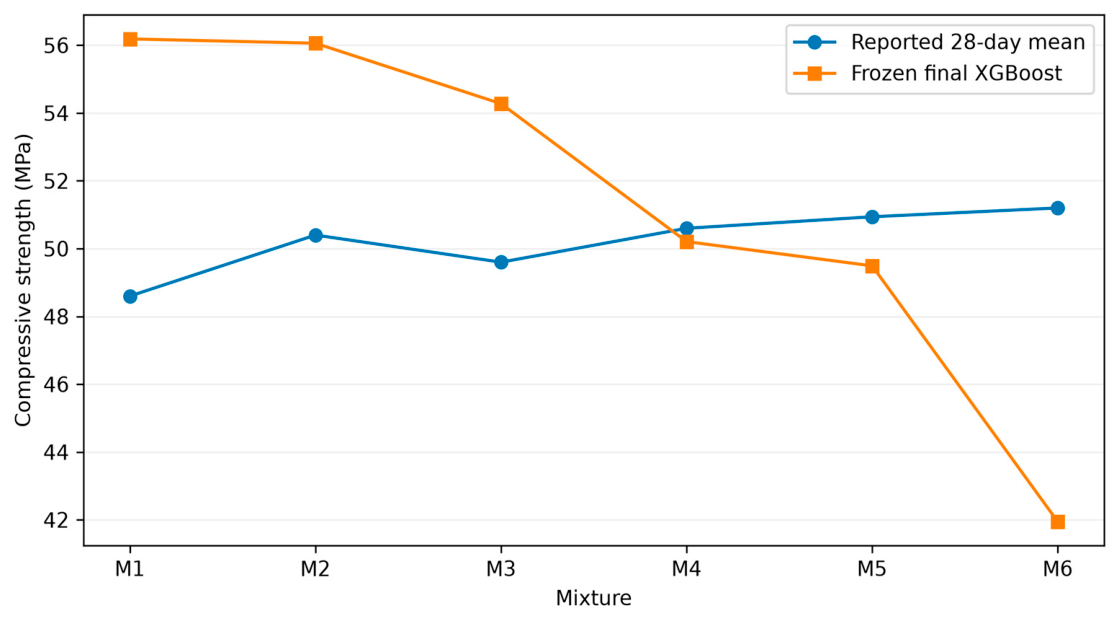
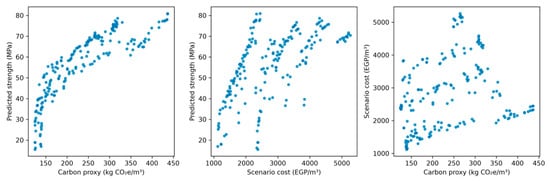
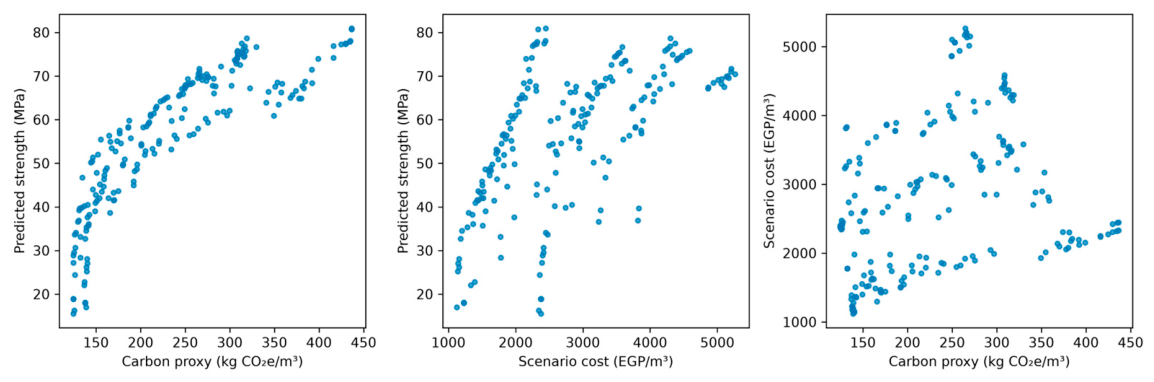
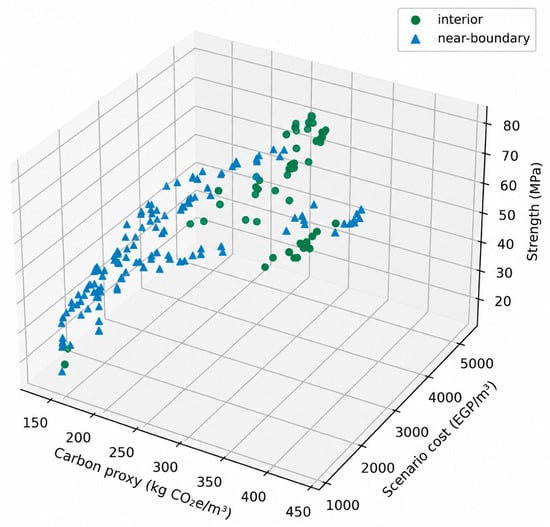
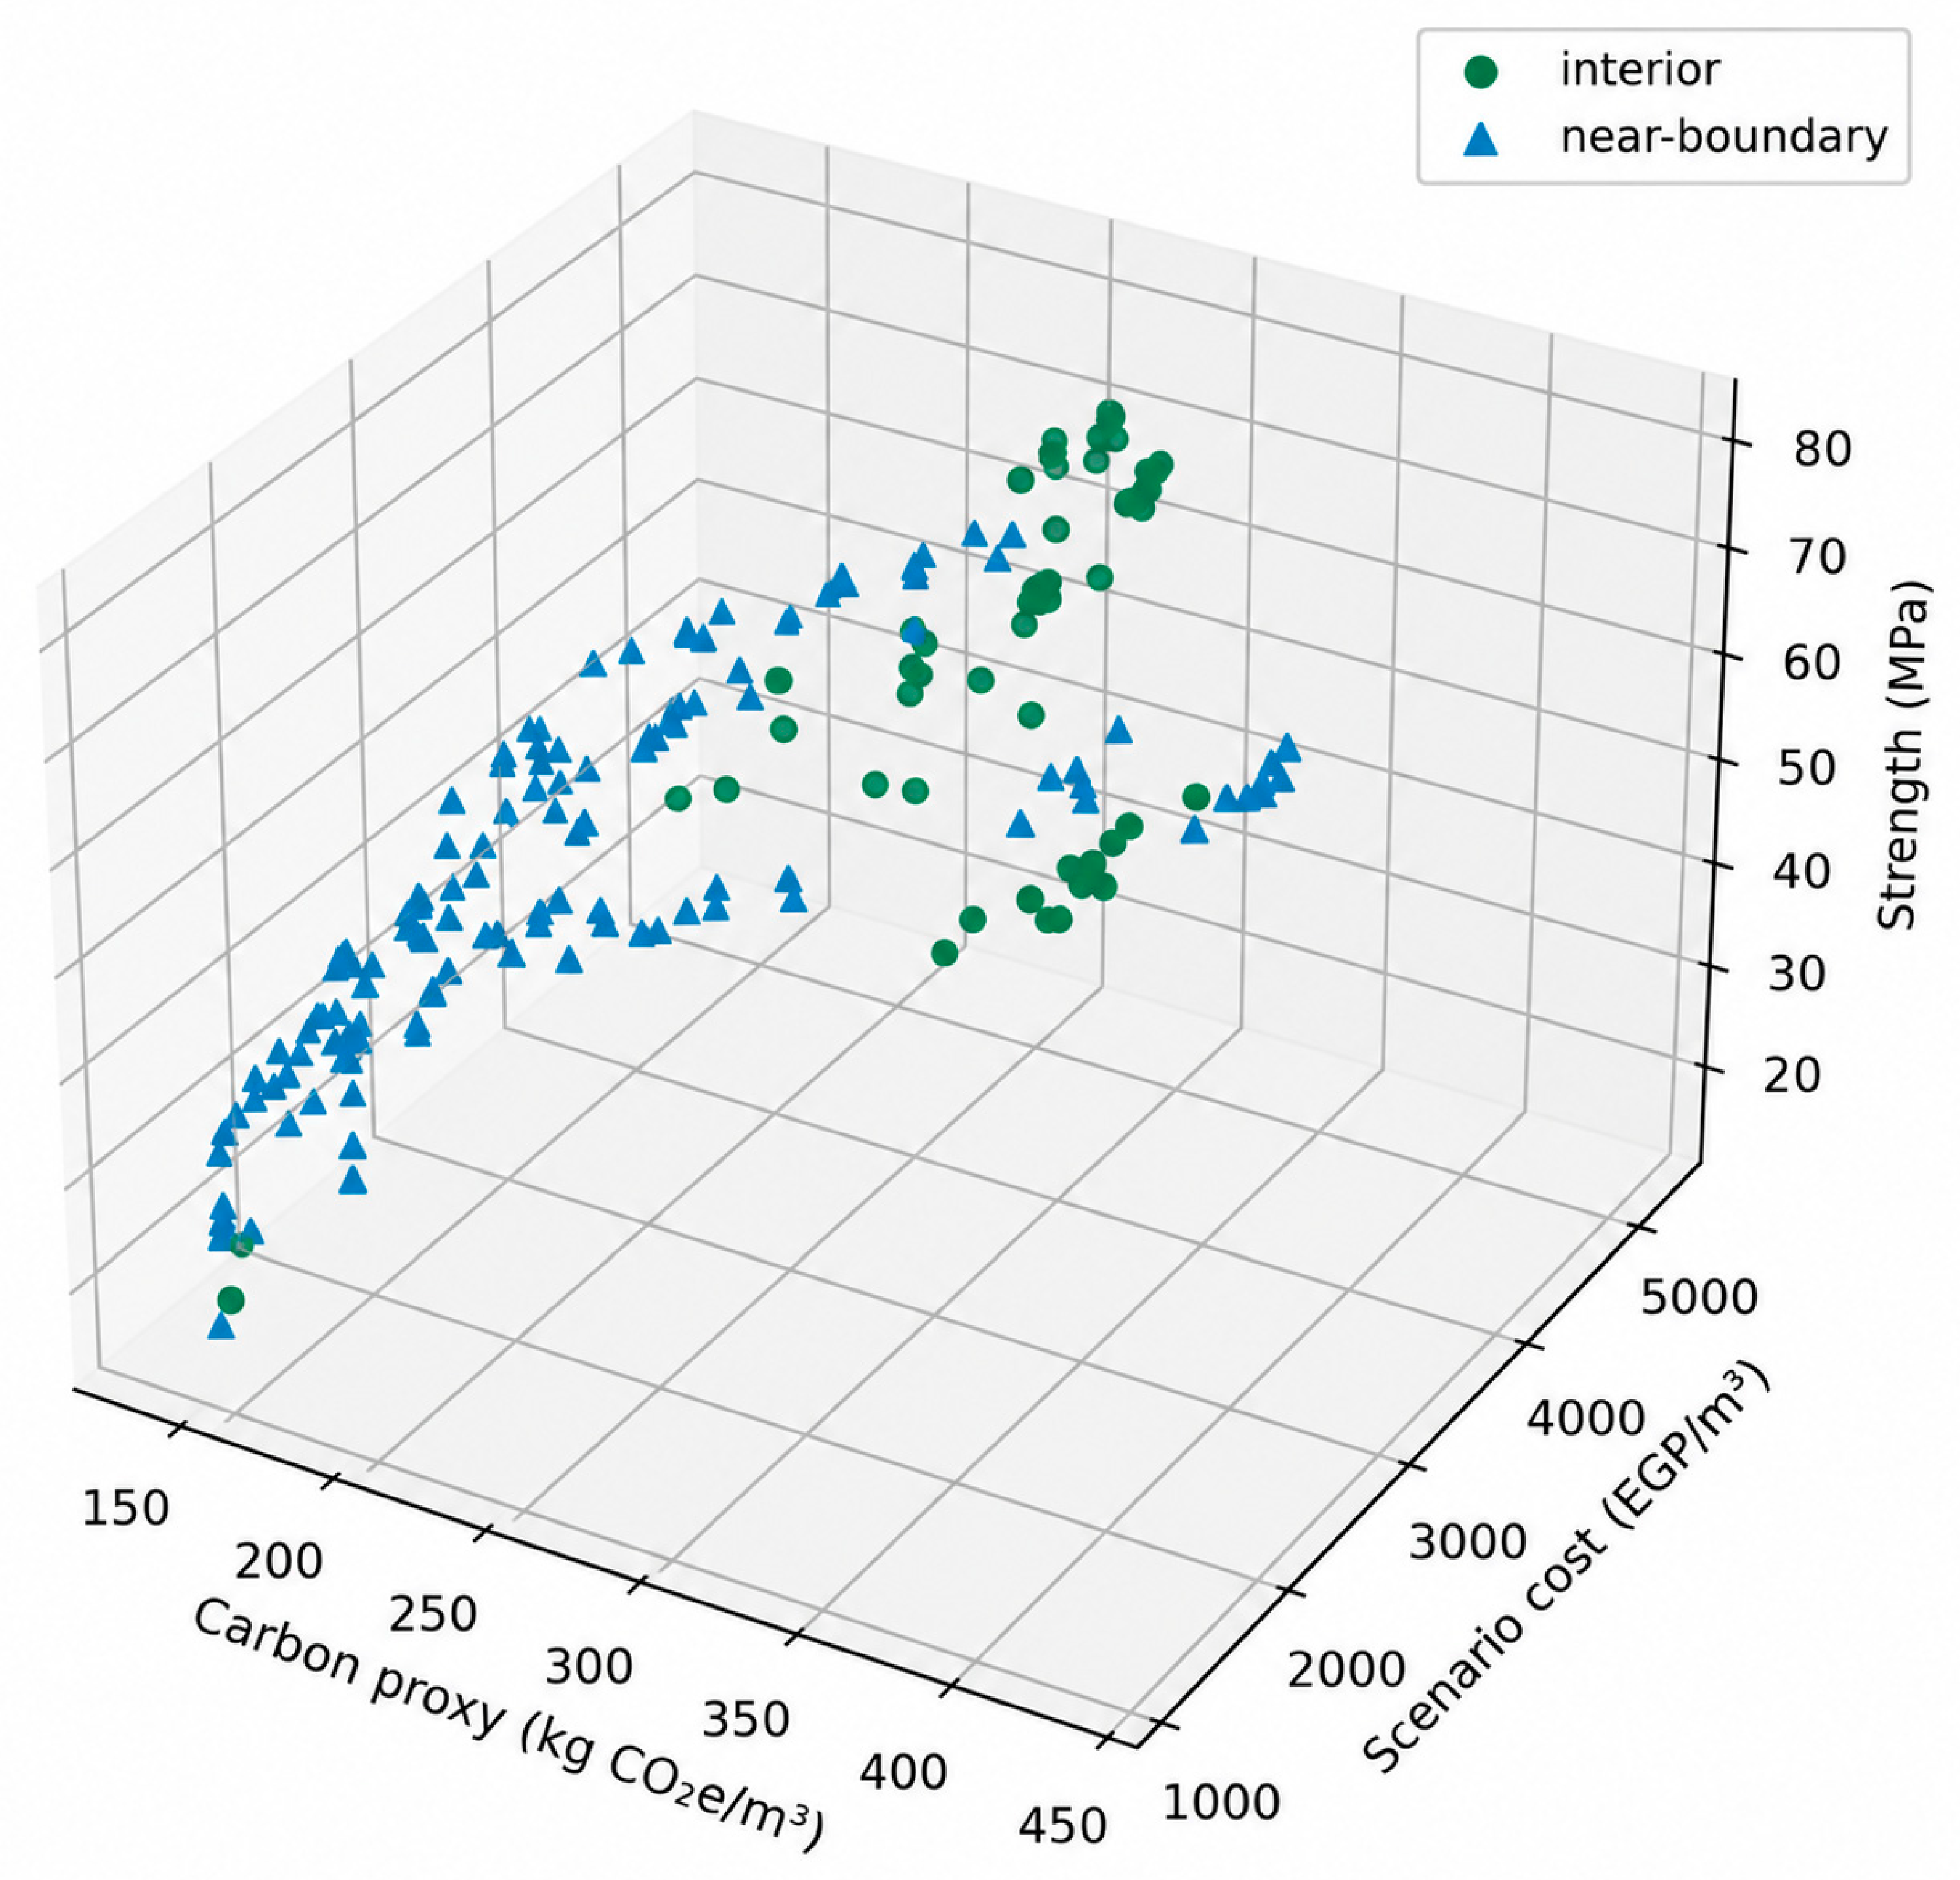
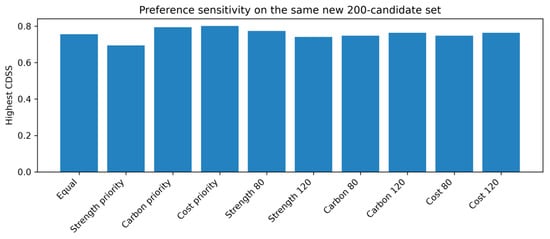
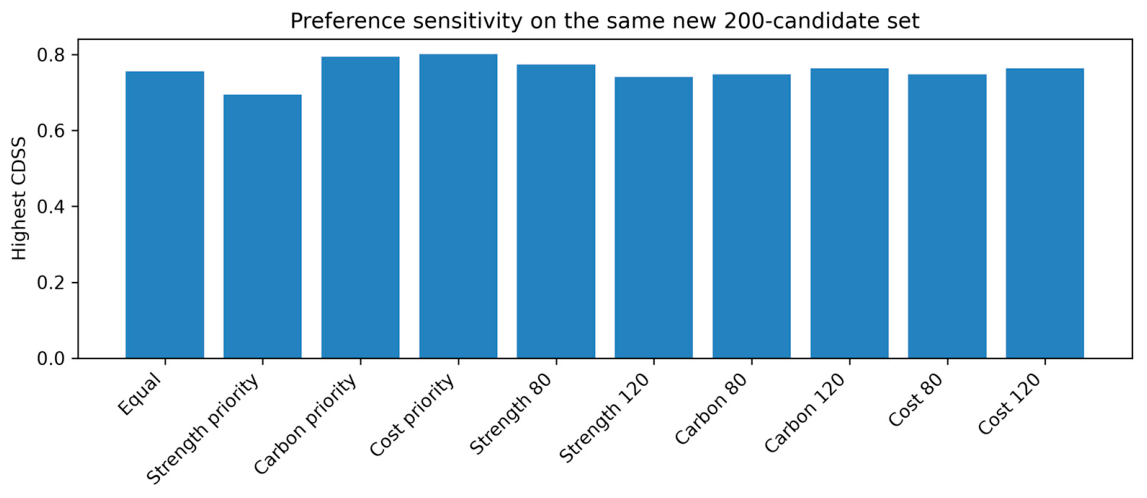

Disclaimer/Publisher’s Note: The statements, opinions and data contained in all publications are solely those of the individual author(s) and contributor(s) and not of MDPI and/or the editor(s). MDPI and/or the editor(s) disclaim responsibility for any injury to people or property resulting from any ideas, methods, instructions or products referred to in the content. |
© 2026 by the authors. Licensee MDPI, Basel, Switzerland. This article is an open access article distributed under the terms and conditions of the Creative Commons Attribution (CC BY) license.