


Abstract
Understanding how urban morphology affects land surface temperature (LST) across altitudinal and topographic contexts is vital for urban heat island mitigation. However, spatial heterogeneity, nonlinearities, and threshold effects remain understudied. Using an interpretable geographically weighted machine learning (IGWML) framework incorporating Shapley additive explanations (SHAP), we examined these effects at the block scale in Beijing, Chongqing, Lanzhou, and Lhasa. Mean summer daytime LST across the study blocks was highest in Beijing (43.87 °C) and lowest in Lhasa (37.84 °C). Hot and cold spots were clustered in Beijing and Lhasa but dispersed in Chongqing and Lanzhou. Hotspots occurred in commercial cores, transport hubs, and dense residential areas, whereas cold spots coincided with large blue-green spaces and rivers. The normalized difference built-up index (NDBI) was the strongest predictor in all cities. In Beijing and Chongqing, LST was primarily influenced by elevation and mean building height (BH); in Lanzhou and Lhasa, it was more sensitive to the Shannon diversity index. Nonlinear analyses identified exploratory reference points for changes in SHAP contribution sign. Interactions were also important: BH and the topographic wetness index showed negative SHAP interaction values in Beijing, whereas building density and NDBI showed positive SHAP interaction values in Chongqing. These findings provide quantitative support for heat-adaptation strategies tailored to different altitudinal and topographic contexts.
1. Introduction
Urbanization changes land cover and building geometry, altering radiative exchange, heat storage, and the partitioning of energy into sensible and latent heat. These changes can contribute to the urban heat island (UHI) effect, in which urban areas are warmer than their surrounding non-urban areas [1]. Within cities, differences in built form and landscape configuration are associated with spatial variation in surface thermal conditions. Satellite-derived land surface temperature (LST) provides spatially explicit information for examining these patterns and their relationships with urban morphology [2,3]. LST characterizes surface thermal conditions and exhibits spatial and temporal patterns that differ from those of near-surface air temperature [4]. Consequently, understanding the spatial patterns of urban LST and their relationships with urban morphology is important for identifying opportunities for surface cooling and informing context-specific spatial planning. In contrast to air temperature, which is constrained by the sparse distribution of meteorological stations, LST is extensively utilized for the quantitative assessment of UHI patterns and intensities, owing to its superior spatial continuity and accessibility [4,5]. LST characterizes surface thermal conditions associated with the surface energy balance. Surface moisture and wind conditions also influence urban thermal patterns [6,7]. Furthermore, as cities function as complex systems, LST fluctuations are governed by multifaceted drivers, including topographic features, landscape configurations, and anthropogenic activities. Extensive research underscores that the transformation of natural surfaces during rapid urbanization serves as a primary catalyst for LST intensification [8,9]. Elucidating the spatial patterns and underlying determinants of urban LST not only clarifies the intrinsic mechanisms of surface energy balance but also facilitates the optimization of urban thermal spatial layouts, thereby providing a scientific foundation for the formulation of context-specific UHI mitigation strategies.
LST is governed by a multitude of urban morphological factors. The existing literature indicates that among the environmental determinants influencing LST, physical surface, three-dimensional (3D) built form, landscape heterogeneity, anthropogenic factors, and geo-environmental contexts are recognized as core drivers with significant regulatory potential [10,11,12,13,14]. The physical surface directly dictates the efficiency of solar radiation absorption by modifying surface albedo and thermophysical properties; for instance, the expansion of normalized difference build-up index (NDBI) is typically associated with a sharp intensification of LST [8]. Concurrently, 3D built form indicators, such as mean building height (BH) and building density (BD), modulate the dissipation of long-wave radiation and local ventilation potential via shading effects and multiple reflections [5]. Landscape composition and configuration are also associated with LST, and their contributions can vary across local climate zones [9]. Furthermore, population density and other proxies for human activity may be associated with LST, with effects that vary across urban settings [9]. Finally, within the geo-environmental background, factors such as elevation (DEM) and slope exert fundamental constraints and regulatory effects on the evolution of the urban thermal environment [7]. However, reported morphology–LST associations differ in both direction and functional form across study settings. For mean building height, Han [15] reported a negative, nonlinear association with summer LST in Wuhan, whereas Dev Roy et al. [16] found positive associations in most of the European cities examined (Paris, Rotterdam, Milan and Vienna). For building density, Han [15] reported a positive, approximately linear relationship, whereas Zhang et al. [17] identified a relationship that shifted from negative to positive as building density increased in their block-scale analysis of Beijing and Shanghai. These contrasting findings suggest that a uniform response cannot be assumed for a given morphological indicator. Differences in urban context, observation conditions, spatial aggregation and modelling approaches may contribute to the reported variation, so spatial heterogeneity should not be treated as its sole explanation. Moreover, the nonlinear relationships reported in these studies highlight the need to examine response curves and threshold-like patterns rather than rely exclusively on linear associations [15,17]. Consequently, elucidating the spatial heterogeneity mechanisms, identifying nonlinear patterns, and recognizing critical thresholds under diverse altitudinal and topographic environments is of paramount academic and practical value for formulating precise and differentiated urban spatial optimization strategies.
Altitudinal and topographic settings provide the geographical background for interpreting urban surface thermal conditions. Mountainous terrain modifies atmospheric exchange through thermal and dynamic forcing, including slope and valley circulations [18]. Within this background, the urban surface energy balance provides a physical basis for understanding how building geometry, surface materials and land cover modify radiative exchange, heat storage and turbulent heat partitioning [1]. The local climate zone (LCZ) framework further characterizes environments through their surface structure, cover, materials and human activity, providing a consistent basis for comparing local thermal conditions [19]. Together, these principles support considering the geographical setting and urban morphology jointly when interpreting thermal responses.
Recent empirical studies illustrate the relevance of this perspective across seasons, climatic settings and spatial scales. In the Beijing–Tianjin–Hebei urban agglomeration, Zhang et al. identified seasonal differences in the contributions of elevation and land-cover-related drivers to LST [20]. Across representative cities in five climate zones of China, Li et al. reported city-specific factor importance and nonlinear response patterns [21]. At finer spatial scales, Li et al. documented differences in LST across LCZs and scale-dependent relationships between urban form and LST at the block and grid scales [11]. Building on these theoretical foundations and empirical findings, we use the “altitude–physiographic context–urban morphology–LST response” framework as a conceptual synthesis for comparative interpretation. Altitude is considered within the broader geographical context, and differences between cities are not assumed to result from altitude alone. However, significant divergence persists regarding the spatial scales employed in existing literature. The majority of studies rely on conventional regular grids as the primary analysis unit; while computationally efficient, this approach arbitrarily fragments continuous landscape patches, potentially inducing spatial estimation biases and limiting its applicability for precision-based urban management [22]. In contrast, the urban block scale more effectively preserves the physical boundaries of building clusters and open spaces, serving as the optimal interface between empirical findings and planning policy implementation [7,23]. Despite these advantages, systematic investigations that integrate block-level metrics with altitudinal and topographic gradients remain under-represented. This knowledge gap hinders a clear understanding of whether the relative importance (response weights) and critical threshold effects of morphological drivers on LST remain consistent across diverse topographic contexts when examined at the block scale.
To bridge these research gaps, this study employs an interpretable geographically weighted machine learning (IGWML) framework to investigate the nonlinear threshold effects and spatial heterogeneity of LST responses to urban morphology. By focusing on four cities with distinct altitudinal and topographic characteristics—Beijing, Chongqing, Lanzhou, and Lhasa—and leveraging high-resolution datasets to ensure scientific rigor, this research aims to address the following three questions: (1) How do the spatial distribution patterns of LST vary across diverse altitudinal and topographic gradients? (2) Which urban morphological factors serve as the primary determinants of LST in each city, and how do their spatial heterogeneity, nonlinear response patterns, and critical thresholds diverge under different geographic contexts? (3) How do the interactions between morphological factors modulate urban LST, and how can these empirical findings inform climate-adaptive spatial optimization and differentiated planning strategies to mitigate the urban heat island effect across varied terrains?
2. Materials and Methods
2.1. Study Area
This research investigates four Chinese cities—Beijing, Chongqing, Lanzhou, and Lhasa—characterized by distinct altitudinal and topographic gradients (Figure 1). Beijing, the capital of China, is situated on the northern fringe of the north China plain with a reported urban elevation of approximately 43.5 m [24]. At the end of 2023, Beijing had a permanent population of 21.858 million and an urbanization rate of 87.8% [25]. Its lowland areas have a warm-temperate monsoon climate [26]. The study area focuses on the region within the Fifth Ring Road, featuring a diverse morphological mosaic ranging from traditional low-rise courtyard houses to modern high-rise complexes, interspersed with significant blue-green spaces [27]. This diversity of urban form and land cover provides a useful setting for examining morphology–LST associations. Chongqing, located in southwestern China, is a major municipality and the economic hub of the upper Yangtze River basin, serving as a pivotal node in the Chengdu-Chongqing urban agglomeration. Positioned at the confluence of the Yangtze and Jialing Rivers, its terrain is a complex of mountains, hills, and valleys, with core area elevations ranging from 200 to 450 m, defining it as a quintessential mountain city [12]. At the end of 2023, Chongqing had a permanent population of approximately 31.914 million [28] and a humid subtropical monsoon climate [29]. The research scope is delimited to the area within Chongqing’s Inner Ring Road. Lanzhou, the capital of Gansu province in northwestern China, is the only provincial capital traversed by the Yellow River. Nestled in a valley basin between two mountain ranges, the central urban area sits at an average elevation of 1520 m. Topographical constraints have induced a unique ribbon-like (linear) urban form, extending 30 km east–west while restricted to a width of only 5–10 km north–south [30]. At the end of 2023, Lanzhou had a permanent population of approximately 4.425 million [31]. It has a dry temperate continental climate [32]. This study focuses on the primary built-up areas along the Yellow River corridor. Lhasa, situated in the southeastern Tibetan plateau, represents an extreme high-altitude urban environment with an average elevation of 3652 m. The 2020 population census recorded approximately 868,000 permanent residents in Lhasa [33]. Lhasa has a plateau monsoon climate with strong solar radiation [34]. The study area encompasses the primary urban districts of Lhasa. The main characteristics of the four cities and their study areas are summarized in Table 1.
Figure 1.
Location of study area. (a) Locations of Beijing, Chongqing, Lanzhou, and Lhasa in China. (b) Summer LST distributions in the four cities. (c) Axonometric maps showing building height, terrain elevation profiles along the selected transects, and enlarged views of four representative locations in each city. The yellow dashed E–E′ lines mark the elevation transects; the plot beneath each map shows the corresponding terrain elevation profile. The red dashed circles mark the locations corresponding to the numbered enlarged insets on the right.
Table 1.
Geographical, climatic and demographic characteristics of the four cities and the spatial coverage of the study areas.
2.2. Data and Processing
2.2.1. Data Source
This study integrates multi-source datasets categorized into four primary domains: LST, urban building morphology, landscape patterns, and environmental/socio-economic factors. (1) LST data for summer 2023 were obtained from Landsat 8 Collection 2 Level-2 (C2 L2) products provided by the U.S. Geological Survey Earth Resources Observation and Science (EROS) Center (Sioux Falls, SD, USA) and accessed through Google Earth Engine. For each city, images intersecting the study area were screened using the scene-level CLOUD_COVER metadata (≤20%), with the common image-selection start and end dates set to 30 June and 30 September 2023, respectively. Additional QA_PIXEL-based cloud and cloud-shadow masking could not be verified from the retained processing records. After applying the thermal-band scaling factors, the selected images were combined using the mean () function to calculate the pixelwise arithmetic mean of the available ST_B10 observations. The resulting composite was converted from kelvin to degrees Celsius and exported at a 30 m spatial resolution. No additional spatial interpolation was applied during compositing, and locations without available ST_B10 observations remained missing. (2) Regarding building morphology and spatial units, urban building data were derived from the “3D-GloBFP Asian Building Height Dataset” [35], from which eight key morphological indicators, including BD and floor area ratio, were calculated. This study employs the street block as the fundamental spatial unit. Block boundaries for Beijing, Chongqing, and Lanzhou were extracted from the “Global 985 Cities Multi-level Street Block Classification Dataset” [36]. Since this dataset excludes Lhasa, its block geometries were reconstructed using OpenStreetMap data. Redundant and fragmented patches were filtered based on area-to-perimeter ratios to ensure spatial consistency across all four cities. (3) Land use and landscape patterns were characterized using the GLC_FCS10 global 10 m fine land cover dataset [37]. To further enhance spatial granularity, this study fused the building morphology data to generate a refined land-use baseline with sub-10 m precision, from which nine landscape pattern metrics were computed. (4) For environmental and socio-economic variables, 13 factors—including topography, vegetation indices, and population density—were incorporated. Satellite data extraction and LST compositing were performed using the Google Earth Engine cloud platform [38]. Rigorous resampling and projection transformations were applied to ensure complete spatial alignment of LST, building morphology, and landscape indicators at a 30 m resolution.
2.2.2. Variable Selection
This study initially identified 30 potential determinants spanning two-dimensional (2D) and three-dimensional (3D) morphology, landscape patterns, geophysical backgrounds, and socio-economic factors to isolate the key drivers of LST. To mitigate information redundancy and multicollinearity, a multi-stage screening process was implemented using Beijing data to establish a common predictor set for the four-city comparison. First, Pearson correlations among predictors were used to screen redundancy, with |r| ≥ 0.9 adopted as the screening threshold in this study [39,40]. Subsequently, the remaining variables underwent multicollinearity diagnostics using the variance inflation factor (VIF) through a stepwise iterative procedure [41]. A VIF threshold of <10.0 was adopted as the screening criterion in this study [42,43]; variables with the highest VIF were systematically removed until all remaining predictors satisfied this criterion. Finally, sequential forward selection was performed using a gradient boosting regressor, with candidate subsets evaluated by five-fold cross-validated mean squared error. Following exploratory model comparisons, a final set of 18 predictors was adopted and applied unchanged to all four cities. Seven predictors were excluded during Pearson/VIF screening and were not reassessed for nonlinear relevance in the subsequent selection stage. Five additional predictors were evaluated as candidates during sequential forward selection but were not retained. The reported analysis did not include a post-selection sensitivity test reintroducing the excluded predictors. Detailed descriptions and computational methods for these selected factors are summarized in Table 2. While this multi-stage approach reduces the risk of overfitting, it may overlook minor factors with high physical relevance but marginal statistical contributions [40]. Furthermore, since Pearson and VIF tests primarily address linear dependencies, their results may not fully capture variable importance in non-linear modeling frameworks. The screening results, four-city VIF diagnostics, and initial Beijing correlation matrix are presented in Appendix A Table A1 and Table A2 and Figure A1.
Table 2.
Core independent variables selected in this study.
2.3. Methods
2.3.1. Research Framework
The integrated research framework and methodology flow (Figure 2). Initially, the mean LST for summer 2023 was retrieved from Landsat 8 satellite imagery provided by the U.S. Geological Survey Earth Resources Observation and Science (EROS) Center (Sioux Falls, SD, USA), concurrently with the systematic acquisition and multi-stage screening of urban morphological factors. To characterize the spatial clustering of thermal environments, the Getis–Ord Gi* statistic was employed to delineate significant hot and cold spots across the study areas. Subsequently, an IGWML framework was implemented to quantify the relative importance, spatial heterogeneity, and non-linear threshold effects of the selected determinants. This systematic approach facilitates a robust comparative analysis of the underlying thermal driving mechanisms across the four target cities.
Figure 2.
Research framework. Yellow, blue, and red dashed outlines indicate data collection and variable selection (Step I), research methods (Step II), and results (Step III), respectively. Colors in the example result panels are explained in the corresponding main figures. The panels in Step III show selected examples of the results from the corresponding analyses.
2.3.2. Model Construction and Interpretation
Given the inherent spatial non-stationarity between LST and its determinants, traditional global models often fail to account for complex spatial nonlinearities [44]. The IGWML framework utilized in this study comprises a geographically weighted machine learning (GWML) and Shapley additive explanations (SHAP). Rather than a singular algorithm, the GWML component serves as a versatile spatial weighting framework applicable to diverse machine learning models. Related nonlinear learning approaches have been applied to examine urban morphology–LST associations [8]. Its core logic integrates spatial kernel-based weighting with the robust fitting capabilities of machine learning to capture the spatially varying effects of morphological factors on LST [45]. In this study, extreme gradient boosting (XGBoost) was selected as the foundational algorithm. XGBoost is a high-performance ensemble learning technique that utilizes residual iterative optimization of decision trees to automatically identify complex interactions and nonlinear threshold effects among urban morphological factors. Consequently, XGBoost has seen increasing application in identifying the multi-faceted drivers of LST in recent years [22]. To provide a comprehensive analysis, this research employs both global and local modeling approaches: global extreme gradient boosting (GL-XGBoost) is designed to capture the mean impact of each factor across the entire study area, assuming spatial homogeneity; conversely, geographically weighted extreme gradient boosting (GW-XGBoost) incorporates a spatial weight function to train localized XGBoost models for each individual block, thereby quantifying the spatial heterogeneity of morphological influences on LST across different urban units.
The computational workflow of the geographically weighted ensemble learning framework developed in this study is delineated as follows:
- (1)
- Each individual street block serves as the fundamental unit of analysis and research sample.
- (2)
- For each focal block, neighborhood samples are identified based on spatial proximity utilizing an adaptive bandwidth to account for varying sample densities.
- (3)
- A bi-square kernel function is applied to assign spatial weights to these neighboring samples, ensuring that closer observations exert a greater influence on the localized model calibration [46].
- (4)
- The GW-XGBoost model is trained on the spatially weighted datasets. The optimal hyperparameters employed for the localized model training in each of the four cities are detailed in Table 3.
- (5)
- Localized prediction outputs and local predictor importance scores are extracted and mapped at the street-block scale to interpret the spatial variations in the driving mechanisms.
Table 3.
XGBoost model parameter settings for each city based on the automatic optimization algorithm.
To validate the performance of the XGBoost algorithms, this study incorporated several benchmark models: ordinary least squares (OLS) and geographically weighted regression (GWR) were utilized to assess baseline linear relationships, while global/geographically weighted random forest (GL-RF/GW-RF) and gradient boosting regression (GBR) were employed to evaluate nonlinear associations. Test-set R2 values ranged from 0.636 to 0.752 for GL-XGBoost and from 0.552 to 0.648 for GW-XGBoost. Corresponding RMSE ranges were 0.556–0.647 and 0.547–0.723, respectively, on the standardized LST scale (Figure 3, Table A3). Adaptive bandwidths were selected by minimizing mean RMSE in three-fold cross-validation using a random forest surrogate, with 50 observations as the lower bound of the candidate neighbourhood size. Spatial distances were calculated as Euclidean distances in each city’s projected coordinate system in metres. The selected neighbour counts and the minimum, median and maximum kernel radii across all complete study blocks are reported in Table A4. To ensure the robustness of the analytical framework, the original block-level dataset was rigorously screened by excluding samples with missing values. This ensured that every observation processed by the GW-XGBoost model possessed a complete set of morphological factors, thereby mitigating potential statistical bias in the spatial non-stationarity analysis.
Figure 3.
Performance comparison of different city models based on R2, RMSE, MAE, and MedAE. ((a) R2: coefficient of determination; (b) RMSE: root mean square error; (c) MAE: mean absolute error; (d) MedAE: median absolute error). Within each city group, the bars represent GL-XGBoost, GL-GBR, GL-RF, GW-XGBoost, GW-RF, GW-GBR, OLS, and GWR from left to right, with the same order maintained across all four panels.
Lastly, this study incorporates the SHAP attribution framework, an advanced interpretability method for machine learning [47,48,49]. The fundamental premise of SHAP is grounded in cooperative game theory, where the model’s predictive behavior is conceptualized as a “game.” Within this framework, the difference between an individual prediction and the mean expected value is fairly distributed among the input features according to their marginal contributions [50]. Unlike conventional global feature importance metrics, the SHAP framework generates localized explanations for every specific observation. Spatial variation in dominant predictors is mapped using local predictor importance scores from GW-XGBoost. SHAP has also been applied to the interpretation of thermal-comfort prediction models [48]. SHAP values were computed for test-set blocks using SHAP values were computed for test-set blocks using TreeExplainer from the SHAP Python package (version 0.50.0) in tree-path-dependent mode on each city’s global model and summarized by mean absolute values.. Spatial weights entered GW-XGBoost fitting, without additional spatial weighting of global SHAP values. Correlations were assessed through the preceding screening and diagnostics; residual dependence may affect individual attributions. All cities used the same 18 predictors and explanation procedure. LST was standardized using each city’s training-set mean and standard deviation, so SHAP values represent city-specific standardized contributions rather than temperature changes in °C. SHAP dependence curves were fitted using locally weighted scatterplot smoothing (LOWESS), with a smoothing fraction of 0.4. Pointwise 95% bootstrap confidence bands were estimated from 100 resamples of paired predictor and SHAP values, while holding the fitted prediction models fixed.
To examine the land-surface characteristics associated with NDBI, we ranked the blocks in each city by their NDBI values and compared the 25% of blocks with the lowest values with the 25% with the highest values. Only blocks with complete data were included, and median LST, building density, surface albedo and landscape diversity were compared between the two groups.
3. Results
3.1. Spatial Distribution and Patterns of LST
Hot and cold spots were delineated using the Getis–Ord Gi* statistic based on calculated Z-scores, with the results categorized into five distinct levels via the Jenks natural breaks optimization method (Figure 4). A pronounced spatial divergence between hot and cold spots is observed across the four cities, underscoring significant spatial heterogeneity. Specifically, Beijing and Lhasa exhibit high degrees of spatial clustering within their thermal landscapes. In contrast, the hot and cold spots in Chongqing and Lanzhou are more fragmented and exhibit a more uniform distribution across the urban fabric.
Figure 4.
Distribution of LST hotspots and cold spots in different cities. (a) Beijing; (b) Chongqing; (c) Lanzhou; (d) Lhasa.
In Beijing, hotspots and secondary hotspots are primarily clustered within the Second Ring Road and near major transportation hubs, exhibiting spatial radiation toward the east, southeast, and southwest. Between the Third and Fifth Ring Roads, the thermal landscape becomes increasingly fragmented, with scattered hotspots in the southeast and southwest corresponding to secondary commercial centers, large industrial parks, and high-density residential clusters. Conversely, significant cold spots are prominent within the Fifth Ring Road region, particularly in the northwest, where large blue-green spaces—such as the Olympic Forest Park and the Summer and Old Summer Palaces—coincide with lower LST. Additional cold spots are distributed along the western and southern peripheries, aligning with the Beijing Winter Olympic Park and the Nanyuan Forest Wetland Park. Chongqing’s LST hotspots exhibit a distinct patchy configuration, predominantly situated near commercial cores and transit hubs. Extensive, contiguous hotspots are identified on the northern fringe, encompassing industrial/logistics parks and the Guanyinqiao commercial core. Isolated hotspots also emerge in the west-central and southwestern sectors, coinciding with high-density residential and commercial developments. In contrast, cold spots are characterized by ribbon-like distributions running east–west and north–south, closely following the riparian corridors of the Yangtze and Jialing Rivers. Sparse cold spots also appear along the southern and eastern edges, buffered by urban mountain ranges and green belts. In Lanzhou, the distribution of hot and cold spots follows the east–west orientation of the Yellow River valley. Large, continuous high-temperature zones dominate the eastern sector, coinciding with the densely populated historic core of Chengguan. In the west, several independent hotspots correspond to the Xigu industrial zone, transportation hubs, and the Anning university town. The Yellow River, serving as the city’s primary ecological corridor, forms a continuous cooling belt through the central urban fabric. For Lhasa, hotspots are concentrated in the highly developed western district of Duilongdeqing, characterized by core commercial areas, high-density housing, and industrial clusters. Conversely, cold spots align with the eastern reaches of the Lhasa River and major blue-green infrastructures like the Lalu Wetland National Nature Reserve. These waterfront spaces, along with the mountain green belt systems on the urban periphery, function as critical ecological barriers against thermal accumulation. The identified hot- and cold-spot patterns apply only to summer daytime conditions at the Landsat 8 overpass times.
3.2. Relative Importance of Influencing Factors
The relative importance of LST predictors was assessed using mean absolute SHAP values from the city-specific GL-XGBoost models (Figure 5). NDBI ranked first in all four cities, with mean absolute SHAP values of 0.23 in Beijing, 0.36 in Chongqing, 0.26 in Lanzhou and 0.39 in Lhasa. The rankings of the other predictors differed across cities. In Beijing, DEM ranked second after NDBI, with both predictors showing greater importance than the remaining variables. In Chongqing, BH and slope had greater predictive importance than in Beijing. SHDI ranked second in both Lanzhou and Lhasa, while DEM ranked third in Lhasa.
Figure 5.
Ranking of the importance of influencing factors to LST in different cities. (a) Beijing; (b) Chongqing; (c) Lanzhou; (d) Lhasa. Category-level contribution percentages are summarised in Table A6.
The SHAP distributions further revealed differences in the direction of model contributions. Higher NDBI values generally corresponded to positive SHAP values in Beijing, Chongqing and Lanzhou, indicating positive contributions to predicted LST. In Lanzhou, higher BD and Cohesion values also tended to correspond to positive SHAP values. By contrast, higher SHDI values generally corresponded to negative SHAP values in Lanzhou and Lhasa, indicating negative contributions to predicted LST.
The category shares were calculated by summing mean absolute SHAP values within each category and expressing them as a percentage of total importance. In Beijing, physical surface and geo-environmental factors together accounted for 60.16% of total importance. In Chongqing, physical surface factors accounted for 59.71%, followed by 3D built form at 18.53%. In Lanzhou, landscape heterogeneity accounted for 24.81%, second only to physical surface factors at 41.52%. In Lhasa, physical surface factors accounted for 42.54%, while geo-environmental factors and landscape heterogeneity accounted for 23.51% and 18.44%, respectively. These results showed that the relative importance of the factor categories varied across the four city models.
To provide further context for the strong predictive importance of NDBI in Lhasa, surface characteristics were compared between low- and high-NDBI blocks (Table A5). Median LST in Lhasa was 35.49 °C in the low-NDBI group and 40.05 °C in the high-NDBI group, giving a difference of 4.56 °C. This difference exceeded the corresponding differences of 3.75 °C in Beijing, 3.35 °C in Chongqing and 2.69 °C in Lanzhou. The high-NDBI group in Lhasa also had a higher median building density of 0.193, compared with 0.104 in the low-NDBI group. Median SHDI was lower in the high-NDBI group, at 1.087, compared with 1.441 in the low-NDBI group. Median albedo was higher in the high-NDBI group, at 0.184, compared with 0.162 in the low-NDBI group. These descriptive contrasts showed that NDBI distinguished blocks with different surface characteristics and temperatures, providing a data-based context for its strong predictive importance in Lhasa.
3.3. Spatial Heterogeneity of Influence Factors
To explore the localized impacts of urban morphology on LST across diverse altitudinal and topographic gradients, the GW-XGBoost model was employed to identify and visualize the spatial distribution of dominant drivers at the block level (Figure 6). The results indicate that while NDBI exerts a predominant influence at the global scale, the leading predictor at the local block scale shift significantly due to variations in urban functional zones and topographic substrates. In the urban core and peripheral regions, dominant factors exhibit distinctive concentric and patchy distributions, suggesting that local microclimatic regulation is highly sensitive to land-use characteristics and geographical contexts across varying altitudes. Comparative analysis reveals that Beijing displays marked concentric heterogeneity in its driving mechanisms. In Chongqing, the dominant factors are characterized by a complex interplay between topography and vegetation. Lanzhou demonstrates a clear primacy of landscape configuration, where SHDI ranks as the most important local predictor in the majority of blocks within the valley corridor. In Lhasa, the dominance of SHDI, BD, and Albedo is primarily confined to specific high-density historic urban districts.
Figure 6.
Distribution of factors influencing LST dominance at the street scale. (a) Beijing; (b) Chongqing; (c) Lanzhou; (d) Lhasa.
In Beijing’s core commercial districts within the Third Ring Road, such as Xidan and Wangfujing, POP and NTL rank as the most important local predictors of LST. In specific blocks along the North Third Ring Road, SPLIT emerges as the dominant driver, reflecting the cooling influence of significant blue-green infrastructures like the Olympic Park and the Summer Palace. Beyond the Fifth Ring Road, the thermal landscape is largely dictated by macro-geographical factors, specifically DEM and Slope. In Chongqing, the dominance of SHDI is particularly concentrated along the riparian corridors of the Jialing and Yangtze Rivers and around the mountainous peripheries. In Lanzhou, the central districts of Chengguan and Qilihe exhibit a scattered, point-like distribution of NDBI-dominated blocks, while the vast majority of the river valley is controlled by SHDI. For Lhasa, NDBI-dominated patches encompass nearly the entire city; SHDI exerts localized dominance only sporadically along the western fringes of Duilongdeqing and within the historic urban core characterized by its unique cultural and architectural heritage.
3.4. Nonlinear Interpretation of Influence Factors
3.4.1. Nonlinear Marginal Effects and Exploratory Threshold Identification of Key Influencing Factors
The nonlinear marginal response analysis was executed within the GL-XGBoost global interpretation framework (Figure 7a–f for Beijing, Figure 7g–l for Chongqing, Figure 7m–r for Lanzhou, and Figure 7s–x for Lhasa). The findings reveal nonlinear SHAP response patterns, with estimated transition points differing across the four study areas. The shaded bands in Figure 7 represent pointwise 95% bootstrap confidence intervals for the LOWESS-fitted curves.
Figure 7.
Nonlinear marginal effects and exploratory threshold identification of key influencing factors. (a–f): Beijing; (g–l): Chongqing; (m–r): Lanzhou; (s–x): Lhasa. Points represent individual samples, blue lines show LOWESS fits, and shaded bands indicate pointwise 95% bootstrap confidence intervals for the fitted curves. Horizontal lines indicate SHAP = 0, and vertical dashed lines mark estimated zero crossings. These crossings represent model-based changes in SHAP contribution sign, rather than independently validated physical thresholds.
In Beijing, Chongqing, and Lanzhou, NDBI exhibits a generally increasing SHAP response, with contributions changing from negative to positive as NDBI increases. Notably, the warming slope of Cohesion in Lanzhou is the most abrupt among all local factors, highlighting the potent heat concentration and dissipation dynamics of highly connected green landscape patches within its constrained valley topography. In contrast, NDBI and Albedo in Lhasa display pronounced fluctuations. Regarding the estimated transition points, the SHAP values for NDBI in Beijing and Chongqing transition from negative to positive after exceeding −0.15 and −0.14, respectively. In Lanzhou, the fitted BD curve crosses SHAP = 0 at approximately 0.23, with generally positive SHAP contributions above this value. In Lhasa, the positive SHAP contribution of NDBI is narrowly concentrated within the range of −0.04 to 0.11. The fitted SHAP curves for BH in Beijing and Chongqing cross from positive to negative at approximately 17.87 m and 26.12 m, respectively, indicating negative contributions to predicted LST above these values. Similarly, the fitted SHDI curves in Lanzhou and Lhasa cross SHAP = 0 at approximately 0.87 and 1.25, respectively, with generally negative SHAP contributions above these values. The fitted DEM curves show generally negative SHAP contributions above approximately 58.10 m in Beijing and 3673.07 m in Lhasa. The reported confidence bands describe uncertainty in the fitted curves; confidence intervals for the exact zero-crossing locations were not separately estimated. These values are therefore interpreted as exploratory reference points for changes in SHAP contribution sign, rather than statistically confirmed breakpoints or validated planning thresholds.
3.4.2. Nonlinear Interaction Effects and Exploratory Threshold Identification of Key Influencing Factors
Nonlinear interaction analysis was executed within the GL-XGBoost global interpretation framework, as depicted in the key factor interaction diagrams (Figure 8) (Beijing: a–c; Chongqing: d–f; Lanzhou: g–i; Lhasa: j–l). The numerical reference values reported below are exploratory and conditional on the fitted models; they describe changes in SHAP interaction patterns rather than statistically confirmed breakpoints or validated planning thresholds. The results show positive and negative SHAP interaction values, indicating that the joint contributions of morphological factors to predicted LST differ from their additive contributions. These interaction patterns exhibit unique characteristics across varying altitudinal and topographic backgrounds. In both Beijing and Chongqing, 3D morphological factors act as critical constraints on the thermal impacts of 2D expansion factors. Specifically, Beijing’s interaction profiles highlight the synergistic cooling resulting from the combination of high-rise structures and hydrothermal conditions. In contrast, Chongqing is characterized by the “shading effect” of high-rise buildings, which effectively offsets the thermal contributions of NDBI. Furthermore, Lanzhou and Beijing demonstrate the inhibitory role of topographic backgrounds on temperature elevation; above the exploratory elevation reference values, DEM begins to suppress the heat contributions associated with POP or NDBI in both cities. The interaction mechanism in Lhasa is marked by high sensitivity to physical surface properties, where even subtle adjustments to the underlying surface can trigger significant interactive cooling effects.
Figure 8.
Nonlinear interaction effects and exploratory threshold identification of key influencing factors. (a–c): Beijing; (d–f): Chongqing; (g–i): Lanzhou; (j–l): Lhasa.
An analysis of negative SHAP interaction values reveals that in Beijing, the interaction between BH and TWI exhibits a downward trend when BH > 17.06. Specifically, for areas with higher humidity (TWI > −0.820), the cooling potential of high-rise structures is significantly amplified. Building-induced shading and local ventilation are possible explanations for this interaction, but these mechanisms were not directly tested. In Chongqing, an exploratory change in the BH–NDBI interaction pattern is observed at approximately BH = 22 m, above which the fitted SHAP interaction values show a downward trend. In Beijing, an estimated transition point in the DEM–POP interaction is observed at elevations of approximately 58–59 m (Figure 8c). Above this altitude, sparsely populated areas (POP ≤ 145.717) experience a rapid cooling effect, suggesting that topographic cooling effectively alleviates the UHI in low-density peripheral zones. Similarly, in Lanzhou, when the elevation exceeds 1540, the thermal contribution of NDBI (>−0.034) decreases sharply, indicating an elevation-dependent association in the fitted model. Conversely, the interaction analysis identifies exploratory reference values associated with changes in positive SHAP interaction contributions. In Chongqing, BD and NDBI exhibit positive SHAP interaction values once BD exceeds 0.34. In Lhasa, even marginal fluctuations in BVD lead to a rapid collapse in interaction values, indicating high sensitivity. In Lanzhou, the interaction between BD and Cohesion reveals a divergent pattern: when BD > 0.26, low-connectivity areas (Cohesion ≤ 96.421) show a sharp upward surge in LST, while high-connectivity areas exhibit a cooling trend. This pattern suggests that the association between landscape connectivity and predicted LST varies with building density; the roles of ventilation and heat retention require further investigation.
4. Discussion
4.1. The Relative Importance and Spatial Heterogeneity of Urban Form to LST
This study employed IGWML framework to elucidate the relative importance and spatial heterogeneity of urban morphological determinants on LST across diverse altitudinal gradients. Mean LST exceeded 43.8 °C in Beijing and Chongqing and was lower in Lanzhou and Lhasa. These contrasts may also reflect differences in climate, latitude, solar radiation, humidity, precipitation, city size and urban structure. Previous studies identify background climate, surface properties and urban morphology as joint influences on urban thermal conditions [43,51]. Precipitation and humidity can also modify vegetation-related surface cooling [52]. Such factors may contribute to differences in LST, predictor importance and fitted response patterns. The present comparison therefore does not isolate the independent effects of elevation or topography. Lhasa’s mean LST of 37.84 °C was lower than those of the other three cities, but it represents summer daytime surface conditions at satellite overpass rather than near-surface air temperature [4]. Strong solar radiation can still heat exposed surfaces despite Lhasa’s relatively cool atmospheric conditions [53]. Beijing has undergone prolonged, complex, and rapid urbanization, where intricate architectural configurations and high-intensity construction have induced significant spatial heterogeneity in LST [15,17]. In contrast, Chongqing, Lanzhou, and Lhasa are spatially constrained by mountainous terrains and river valleys, leading to more compact urban forms with relatively concentrated LST distributions and reduced internal spatial fluctuations. These patterns suggest context-dependent associations between urban compactness and surface thermal conditions [54]. Across all four cities, the NDBI emerged as a pivotal determinant of LST. The replacement of natural vegetation with hardened surfaces offsets the evaporative cooling effects provided by regional biomass and soil moisture, thereby exacerbating thermal accumulation and the proliferation of the UHI effect [17,51]. While morphological influences vary, physical surface factors remain dominant in Beijing, Chongqing, and Lhasa. Specifically, land cover types—including impervious surfaces, green spaces, and water bodies—directly alter surface radiation and energy balance, largely dictating the observed variances in urban LST. In the linearly constrained valley topographies and alpine ecosystems of Lanzhou and Lhasa, the configuration and diversity of green space patches demonstrate a stronger marginal moderating effect on LST. Enhancing overall landscape heterogeneity and patch mosaicism facilitates more efficient heat transfer and dissipation between discrete thermal hotspots [17]. Complex topography may modify surface thermal conditions through differences in solar exposure and shading. Research in complex terrain has identified associations of vegetation cover and shaded slopes with lower LST [55].
Dominant drivers at the block scale similarly exhibit pronounced spatial heterogeneity. Within Beijing’s Third Ring Road, the dense commercial fabric results in a diverse distribution of primary determinants. In the urban core, the vertical proliferation of building height and volume significantly alters localized aerodynamic roughness and shading patterns. This leads to a substantial escalation in the influence of 3D morphological parameters and anthropogenic activities on the thermal environment [17,56]. In Chongqing, while NDBI maintains absolute dominance in high-density blocks, its impact is critically moderated by SHDI in riparian and mountainous zones. Furthermore, Chongqing’s fragmented topography—characterized by a multi-centric and clustered structure—impedes the establishment of effective thermal ventilation corridors, thereby facilitating the stagnation of hot air masses [12]. In Lanzhou, the juxtaposition of blue-green spaces with built-up areas serves to mitigate thermal accumulation, with the strongest cooling effects observed in vegetation-dominated zones. However, the cooling efficiency of these ecological infrastructures diminishes in highly urbanized sectors, underscoring the imperative for context-specific heat mitigation strategies at the block scale [57]. Research in Lhasa highlights the cooling effects of tree shading and transpiration under its sunny plateau conditions [53]. NDBI can respond to exposed dry soil as well as built-up surfaces [58], so its high importance may reflect several surface differences rather than building density alone. The higher albedo in the high-NDBI group also shows that the observed pattern cannot be explained simply by assuming that higher NDBI always identifies darker surfaces. These possible explanations require further verification.
4.2. Nonlinear Response of Urban Morphology to LST and Threshold Identification
Traditional linear regression models are fundamentally constrained by the inherent assumption of linearity, which often fails to capture the complex, non-monotonic relationships between morphological indicators and LST within dynamic urban ecosystems [59]. Utilizing the IGWML framework, this study elucidates the nonlinear response trajectories of LST to urban morphology across diverse altitudinal gradients and identifies exploratory transition points in the fitted SHAP responses. While the existing literature has predominantly focused on the univariate effects of building morphology or green space characteristics [2], the intricate inter-factor synergies remain insufficiently explored. Consequently, this research incorporates interaction analysis to examine the joint impacts of morphological factors on the urban thermal environment. Our findings demonstrate that the influence of a single morphological determinant on LST is highly context-dependent, varying significantly across different altitudinal and topographic settings. Furthermore, these joint effects exhibit pronounced nonlinear characteristics and exploratory transition patterns, suggesting that the modelled LST–morphology relationship varies with specific morphological combinations.
This study identifies NDBI as a leading predictor of LST across all studied cities, consistent with previous block- and grid-scale findings [11]. From a physical standpoint, the low albedo and high thermal capacity of impervious materials facilitate the absorption and storage of shortwave radiation, which is subsequently released as sensible heat, driving large-scale urban warming [52,60]. The fitted BH SHAP curves show exploratory zero-crossing points at approximately 17.87 m in Beijing, 26.12 m in Chongqing, and 13.63 m in Lanzhou, around which SHAP contributions change from positive to negative. This suggests a context-dependent association between urban morphology and LST [54,61]. Differences in shading and convective heat transfer provide possible physical explanations for these associations, although these processes were not directly measured in this study. Furthermore, the fitted response patterns differed among the four cities. In Beijing, Chongqing, and Lanzhou, the fitted NDBI SHAP curves cross from negative to positive at approximately −0.15, −0.14, and −0.03, respectively. These exploratory reference points may vary with local topographic and surface-cover conditions. Valley topography may influence local ventilation, but its contribution to the observed NDBI patterns cannot be separated from climatic and other city-specific differences in this study. In Lhasa, SHDI was among the leading predictors of LST. This pattern may reflect differences in landscape composition, climate and other local conditions, but it does not establish a distinct plateau-specific mechanism.
The interaction analysis further elucidates that urban thermal behavior is not dictated by isolated variables but is governed by the synergistic integration of multiple morphological characteristics. In Beijing, negative SHAP interaction values are observed when BH > 17.06 and TWI ≥ −0.820. We hypothesize that high soil moisture (represented by TWI) and the shading effects of high-rise structures are physically complementary; this pairing could provide complementary cooling pathways, where moisture facilitates evaporative cooling while shadows reduce direct solar gain. In contrast, Chongqing exhibits positive SHAP interaction values when BD > 0.340 and NDBI ≥ −0.130. Restricted ventilation and heat retention in compact urban forms are possible explanations for this interaction [60,62], but these processes were not directly measured in this study. In Lanzhou, the fitted DEM–NDBI interaction showed a flatter response to increasing NDBI at higher elevations. However, this pattern does not isolate the contribution of elevation from climatic and other local influences. Finally, in Lhasa, negative SHAP interaction values are observed when Albedo > 0.190 and NDBI ≥ −0.039 (Figure 8j). This Albedo–NDBI interaction may reflect the influence of surface reflectance under different land-cover conditions. Greater reflectance may reduce absorbed solar energy [52], while NDBI characterizes surface-cover differences that may modify this relationship [63].
4.3. Implications for Future Planning and Management
As urbanization continues to accelerate, mitigating the UHI effect necessitates multifaceted interventions; consequently, urban planning must transition away from monolithic, “one-size-fits-all” paradigms [9]. Instead, differentiated planning strategies are indispensable for achieving long-term urban sustainability [64]. Recent work in Daegu has proposed the Smart Urban Resilience Assessment (SURA) framework to integrate climate hazards, urban regeneration and building renovation within a structured decision-support system [65]. In this broader planning context, the block-scale morphology–LST associations identified here could inform the thermal assessment component. Candidate measures, including pocket parks and blue–green corridors, could then be evaluated using multiple indicators covering thermal conditions, stormwater management and green infrastructure to examine potential co-benefits and trade-offs. The following planning options are proposed for evaluation based on observed associations. Their potential cooling benefits remain hypotheses requiring further empirical validation. In the urban renewal of low-altitude cities such as Beijing and Chongqing, policymakers could consider vertical morphological interventions, such as integrating roof structures or vertical greening systems to expand shaded areas. For Beijing specifically, one option for evaluation is the “fragmentation” of contiguous impervious surfaces by embedding micro-green spaces or “pocket parks” to disrupt the spatial connectivity of thermal hotspots [5]. In regions characterized by higher altitudes or significant topographic relief, planning could consider the composition and configuration of built-up and vegetated land cover. The potential cooling benefits of these options require further local evaluation [3,66]. For Lanzhou, planning efforts could explore options for adjusting the configuration of blue-green landscapes along the Yellow River corridor and within the valley floor. Enhancing landscape diversity could be evaluated as a potential cooling strategy for these ecological corridors [13]. Simultaneously, the ecological barriers provided by the northern and southern mountain ranges could be considered for protection. The potential cooling contributions of high-elevation terrain and mountain–valley airflow require further local investigation. In Lhasa, the promotion of high-albedo roofing and paving materials could be evaluated for its potential to reduce surface heating [67]. Furthermore, planners could consider safeguarding existing core ecological cooling patches, ensuring that these natural thermal regulators are not fragmented or isolated during the ongoing urbanization process.
4.4. Limitations and Future Prospects
While this study offers valuable insights into the impact of urban morphology on LST, several limitations remain. First, constrained by the current technical boundaries of thermal infrared remote sensing, the Landsat 8 LST data used here—despite being resampled to a 30 m resolution—still faces physical challenges in capturing microclimatic fluctuations and vertical heat exchanges within complex urban blocks. Such instantaneous satellite-derived snapshots cannot fully substitute for large-scale, long-term meteorological monitoring networks or high-fidelity field measurements. Second, due to the inherent orbit constraints of polar-orbiting satellites, this research focuses exclusively on summer daytime periods. However, urban energy balances are characterized by significant diurnal hysteresis and seasonal evolutionary patterns; thus, single-period observations may not fully elucidate the long-term thermal impacts across varying urban contexts. Scene-level cloud screening and mean compositing do not ensure the removal of residual cloud, cirrus or cloud-shadow contamination. City-specific cloud-free pixel fractions could not be reconstructed from the retained LST composites, leaving uncertainty in spatial coverage and the comparability of the summer thermal conditions across cities.
The IGWML-SHAP framework has methodological limitations related to bandwidth selection and local model fitting. Although bandwidth was selected through three-fold cross-validation using a random forest surrogate, the chosen neighborhood may not capture the spatial scale of every morphological process. Small neighborhoods can increase sensitivity to noise and local overfitting, whereas large neighborhoods may smooth spatial differences [68]. Cross-validation and the bandwidth-search lower bound (k = 50; Table A4) do not fully eliminate uncertainty in local predictions, particularly where few informative observations are available. SHAP is also conditional on the fitted models and input data and do not establish causal relationships. Residual prediction errors may reflect within-block differences in shading, surface materials and moisture that remain unresolved in the resampled 30 m thermal data. Nighttime light is also an indirect proxy for human activity and does not fully represent heat releases from traffic, buildings and air-conditioning. Summer composites represent conditions sampled at satellite overpass times and may miss the timing of peak surface heating. These plausible sources of residual error were not separately quantified in this study. Future work should assess the stability of predictions and SHAP patterns across alternative bandwidths and use spatially separated validation samples to evaluate generalization.
Predictor screening introduces an additional methodological limitation. Pearson correlation and VIF assess linear dependence among predictors and do not establish that excluded variables lack nonlinear predictive information [40]. Although the subsequent forward selection used a nonlinear gradient boosting regressor, it considered only predictors surviving the initial screening and could not recover information removed earlier. Consequently, the SHAP rankings and estimated transition points are conditional on the retained 18-predictor panel, and their sensitivity to alternative predictor sets remains untested. Applying a common panel supports consistent comparisons across cities but does not establish its completeness for every city. Future work should compare the retained panel with the full candidate set and alternative selections using spatial cross-validation.
The comparison includes only four cities, which were not matched for climatic conditions, city size or urban structure. Although morphological and topographic predictors were included, the city-specific models do not fully control for these differences between cities. Future studies should compare more cities within similar climatic settings and incorporate meteorological variables to better distinguish elevation and topographic effects from other influences. Simulations using ENVI-met or WRF could also help investigate interactions between urban morphology and atmospheric processes. UAV-based thermal infrared mapping or localized environmental sensors could provide independent observations for evaluating the model-derived transition patterns. Finally, comparative studies encompassing diurnal contrasts and full seasonal cycles are warranted to provide a more comprehensive understanding of urban thermal resilience.
5. Conclusions
This study used an interpretable geographically weighted machine-learning framework to examine how urban morphology is associated with land surface temperature across four cities with contrasting altitudes and topographic settings. Three main conclusions were obtained. First, land surface temperature patterns differed among the four cities. Hot and cold areas were spatially clustered in Beijing and Lhasa but were more fragmented in Chongqing and Lanzhou. Across all four cities, thermal hotspots were concentrated in commercial centers, transportation hubs, and densely built residential areas. In contrast, cooler areas were generally associated with large blue-green spaces and river corridors.
Second, the normalized difference built-up index, an indicator of built-up and impervious surfaces, was the most important predictor of land surface temperature in all four cities. The fitted NDBI SHAP curves crossed from negative to positive at exploratory reference points of approximately −0.15 in Beijing, −0.14 in Chongqing, and −0.03 in Lanzhou. Mean building height did not have a uniformly warming or cooling relationship with surface temperature. In Beijing, Chongqing, and Lanzhou, exploratory zero-crossing points in the fitted BH SHAP curves occurred at approximately 17.87, 26.12, and 13.63 m, respectively. Above these exploratory reference points, greater mean building height was associated with lower surface temperature, probably because of increased shading and ventilation. This context-dependent relationship does not imply that simply constructing taller buildings will cool every neighborhood.
Third, exploratory interaction patterns suggested that urban morphological and topographic factors were associated with LST in combination. In Beijing, wetter topographic conditions combined with a block mean building height above approximately 17 m were associated with more negative SHAP interaction values. In Chongqing, building density above 0.34 combined with extensive impervious surfaces was associated with more positive SHAP interaction values, whereas a block mean building height above approximately 22 m was associated with a weaker warming pattern. In Lanzhou, elevations above approximately 1540 m were associated with weaker warming patterns for built-up surfaces. In Lhasa, higher surface reflectivity was associated with cooling under strong solar radiation, although this relationship depended on the extent of built-up surface cover.
These findings suggest potential heat-mitigation options for local evaluation. Beijing could consider breaking up continuous impervious surfaces by introducing pocket parks and other small green spaces. Chongqing and Lanzhou could consider measures to control excessive building density and protect natural ventilation routes along river valleys. Lanzhou could also consider maintaining diverse and connected green spaces. In Lhasa, reflective construction materials and major ecological cooling areas could be considered for local evaluation. The cooling effectiveness of these candidate interventions requires further empirical validation under local climatic and land-cover conditions.
Author Contributions
Conceptualization, X.H. and X.Z. (Xiaozhou Zhang); methodology, X.H. and X.Z. (Xiaozhou Zhang); software, X.Z. (Xiaozhou Zhang); validation, X.Z. (Xin Zhong); formal analysis, X.H.; data curation, X.Z. (Xin Zhong); writing—original draft preparation, X.H. and X.Z. (Xiaozhou Zhang); writing—review and editing, X.Z. (Xin Zhong) and H.W.; visualization, X.H.; supervision, H.W.; project administration, H.W.; funding acquisition, H.W. All authors have read and agreed to the published version of the manuscript.
Funding
This research was funded by the Department of Education of Liaoning Province through the Basic Scientific Research Project, grant number JYTMS20231541, and by Shenyang Urban Construction University through the University-Level Course Construction Project (course title: Residential Landscape Design). The APC was funded by the authors.
Data Availability Statement
Publicly available input data were obtained from Landsat Collection 2 Level-2 products, the 3D-GloBFP Asian Building Height Dataset, GLC_FCS10, the Global 985 Cities Multi-level Street Block Classification Dataset, and OpenStreetMap data, as cited in the manuscript. The processed block-level datasets, model outputs, and analysis code generated in this study are available from the corresponding author upon reasonable request.
Conflicts of Interest
The authors declare no conflicts of interest. The funders had no role in the design, execution, interpretation, or writing of the study.
Abbreviations
The following abbreviations are used in this manuscript:
| 2D | Two-dimensional |
| 3D | Three-dimensional |
| 3D-GloBFP | Global three-dimensional building footprint dataset |
| APC | Article processing charge |
| BD | Building density |
| BH | Mean building height |
| BVD | Building volume density |
| C2 L2 | Landsat Collection 2 Level 2 |
| DEM | Digital elevation model |
| GBR | Gradient boosting regression |
| GL-RF | Global random forest |
| GL-XGBoost | Global extreme gradient boosting |
| GLC_FCS10 | Global 10 m land-cover dataset with a fine classification system |
| GW-RF | Geographically weighted random forest |
| GW-XGBoost | Geographically weighted extreme gradient boosting |
| GWML | Geographically weighted machine learning |
| GWR | Geographically weighted regression |
| IGWML | Interpretable geographically weighted machine learning |
| LST | Land surface temperature |
| MAE | Mean absolute error |
| MedAE | Median absolute error |
| NB | Number of buildings |
| NDBI | Normalized difference built-up index |
| NHB | Number of high-rise buildings |
| NP | Number of patches |
| NTL | Nighttime light |
| OLS | Ordinary least squares |
| POP | Population density |
| R2 | Coefficient of determination |
| RMSE | Root mean square error |
| SHAP | Shapley additive explanations |
| SHDI | Shannon’s diversity index |
| SPI | Stream power index |
| SPLIT | Splitting index |
| TPI | Topographic position index |
| TWI | Topographic wetness index |
| UAV | Unmanned aerial vehicle |
| UHI | Urban heat island |
| UV | Ultraviolet |
| VIF | Variance inflation factor |
| WRF | Weather Research and Forecasting model |
| CI | Confidence interval |
| GW-GBR | Geographically weighted gradient boosting regression |
| XGBoost | Extreme gradient boosting |
Appendix A
Table A1.
Beijing-based predictor screening, stage-specific VIF values and final retention.
Table A2.
VIF values for the common 18-predictor panel in the four study cities.
Figure A1.
Pearson correlations among the 30 initial candidate predictors in Beijing. Note: Correlations were calculated using 2171 complete Beijing blocks. Only the lower triangle is shown; the diagonal and redundant upper triangle are omitted. Outlined cells indicate |r| ≥ 0.9. LST and coordinates were excluded.
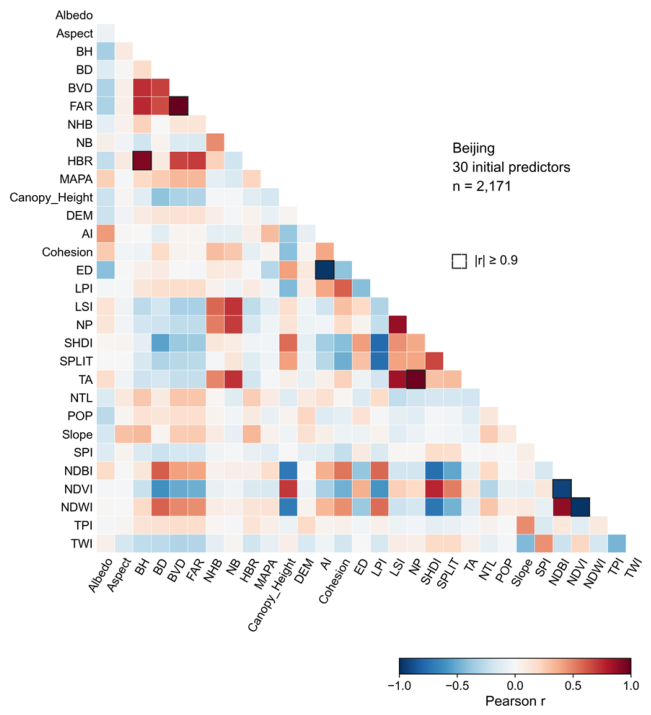
Table A3.
Test-set predictive performance of the focal and comparison models in the four cities.
Table A4.
Adaptive bandwidth settings and spatial kernel radii of the geographically weighted models in the four study cities.
Table A5.
Comparison of surface characteristics between blocks with low and high NDBI in the four study cities.
Table A6.
Relative contributions (%) of predictor categories in the four study cities.
References
- Oke, T.R. The Energetic Basis of the Urban Heat Island. Q. J. R. Meteorol. Soc. 1982, 108, 1–24. [Google Scholar] [CrossRef] [Scilit]
- Zhou, L.; Yuan, B.; Hu, F.; Wei, C.; Dang, X.; Sun, D. Understanding the Effects of 2D/3D Urban Morphology on Land Surface Temperature Based on Local Climate Zones. Build. Environ. 2022, 208, 108578. [Google Scholar] [CrossRef] [Scilit]
- Guo, A.; Yue, W.; Yang, J.; He, T.; Zhang, M.; Li, M. Divergent Impact of Urban 2D/3D Morphology on Thermal Environment along Urban Gradients. Urban Clim. 2022, 45, 101278. [Google Scholar] [CrossRef] [Scilit]
- Naserikia, M.; Hart, M.A.; Nazarian, N.; Bechtel, B.; Lipson, M.; Nice, K.A. Land Surface and Air Temperature Dynamics: The Role of Urban Form and Seasonality. Sci. Total Environ. 2023, 905, 167306. [Google Scholar] [CrossRef] [Scilit] [PubMed]
- Han, D.; An, H.; Cai, H.; Wang, F.; Xu, X.; Qiao, Z.; Jia, K.; Sun, Z.; An, Y. How Do 2D/3D Urban Landscapes Impact Diurnal Land Surface Temperature: Insights from Block Scale and Machine Learning Algorithms. Sustain. Cities Soc. 2023, 99, 104933. [Google Scholar] [CrossRef] [Scilit]
- Li, D.; Bou-Zeid, E. Synergistic Interactions between Urban Heat Islands and Heat Waves: The Impact in Cities Is Larger than the Sum of Its Parts. J. Appl. Meteorol. Climatol. 2013, 52, 2051–2064. [Google Scholar] [CrossRef] [Scilit]
- Wan, Y.; Du, H.; Yuan, L.; Xu, X.; Tang, H.; Zhang, J. Exploring the Influence of Block Environmental Characteristics on Land Surface Temperature and Its Spatial Heterogeneity for a High-Density City. Sustain. Cities Soc. 2025, 118, 105973. [Google Scholar] [CrossRef] [Scilit]
- Wang, Z.; Zhou, R.; Rui, J.; Yu, Y. Revealing the Impact of Urban Spatial Morphology on Land Surface Temperature in Plain and Plateau Cities Using Explainable Machine Learning. Sustain. Cities Soc. 2025, 118, 106046. [Google Scholar] [CrossRef] [Scilit]
- Xiong, W.; Wu, Q.; Qi, J.; Li, J.; Zhu, S.; Qiu, B. Spatiotemporal Dynamics of Land Surface Temperature and Its Drivers within the Local Climate Zone Framework. Sustain. Cities Soc. 2025, 133, 106859. [Google Scholar] [CrossRef] [Scilit]
- Chen, L.; Guo, G. Exploring the Nonlinear Interactions and Threshold Effects of Urban Building Morphology and Green Space on Land Surface Temperature in High-Density Areas: A Cross-City Comparative Study. Sustain. Cities Soc. 2026, 136, 107069. [Google Scholar] [CrossRef] [Scilit]
- Li, H.; Yang, J.; Xin, J.; Yu, W.; Ren, J.; Yu, H.; Xiao, X.; Xia, J. (Cecilia) Investigating the Effect of Urban Form on Land Surface Temperature at Block and Grid Scales Based on XGBoost-SHAP. Environ. Model. Softw. 2026, 195, 106738. [Google Scholar] [CrossRef] [Scilit]
- Luo, P.; Yu, B.; Li, P.; Liang, P.; Zhang, Q.; Yang, L. Understanding the Relationship between 2D/3D Variables and Land Surface Temperature in Plain and Mountainous Cities: Relative Importance and Interaction Effects. Build. Environ. 2023, 245, 110959. [Google Scholar] [CrossRef] [Scilit]
- Tong, H.; Wang, Q.; Li, Y. The Impact of Urban Green Space Pattern on Land Surface Temperature in a Valley City. Sustain. Cities Soc. 2025, 135, 106993. [Google Scholar] [CrossRef] [Scilit]
- Wang, R.; Wang, M. Multi-Scale Analysis of Surface Thermal Environment in Relation to Urban Form: A Case Study of the Guangdong-Hong Kong-Macao Greater Bay Area. Sustain. Cities Soc. 2023, 99, 104953. [Google Scholar] [CrossRef] [Scilit]
- Han, W. Analyzing the Scale Dependent Effect of Urban Building Morphology on Land Surface Temperature Using Random Forest Algorithm. Sci. Rep. 2023, 13, 19312. [Google Scholar] [CrossRef] [Scilit] [PubMed]
- Dev Roy, S.; Kuffer, M.; Wang, J. Exploring the Influence of Building Morphology on Surface Temperatures: A Multi-City Analysis in Europe. Build. Environ. 2025, 282, 113274. [Google Scholar] [CrossRef] [Scilit]
- Zhang, Z.; Luan, W.; Yang, J.; Guo, A.; Su, M.; Tian, C. The Influences of 2D/3D Urban Morphology on Land Surface Temperature at the Block Scale in Chinese Megacities. Urban Clim. 2023, 49, 101553. [Google Scholar] [CrossRef] [Scilit]
- Rotach, M.W.; Gohm, A.; Lang, M.N.; Leukauf, D.; Stiperski, I.; Wagner, J.S. On the Vertical Exchange of Heat, Mass, and Momentum Over Complex, Mountainous Terrain. Front. Earth Sci. 2015, 3, 76. [Google Scholar] [CrossRef] [Scilit]
- Stewart, I.D.; Oke, T.R. Local Climate Zones for Urban Temperature Studies. Bull. Am. Meteorol. Soc. 2012, 93, 1879–1900. [Google Scholar] [CrossRef] [Scilit]
- Zhang, M.; Liu, C.; Chen, E. Seasonal Responses of the Thermal Environment to Landscape Pattern and Land Use/Land Cover under Multiple Drivers in the Beijing–Tianjin–Hebei Urban Agglomeration, China. Sustain. Cities Soc. 2026, 149, 107713. [Google Scholar] [CrossRef] [Scilit]
- Li, M.; Xu, C.; Hu, Y.; Zou, Z.; Wang, X.; Chen, F.; Feng, Z.; Zhu, Z.; Huang, H.; Geng, X.; et al. Spatiotemporal Impact Mechanisms of Urban Multidimensional Form on Land Surface Temperature: A Case Study of Representative Cities in Five Climate Zones of China. Hum. Settl. Sustain. 2025, 1, 275–289. [Google Scholar] [CrossRef] [Scilit]
- Yuan, B.; Zhou, L.; Hu, F.; Wei, C. Effects of 2D/3D Urban Morphology on Land Surface Temperature: Contribution, Response, and Interaction. Urban Clim. 2024, 53, 101791. [Google Scholar] [CrossRef] [Scilit]
- Tang, G.; Du, X.; Wang, S. Impact Mechanisms of 2D and 3D Spatial Morphologies on Urban Thermal Environment in High-Density Urban Blocks: A Case Study of Beijing’s Core Area. Sustain. Cities Soc. 2025, 123, 106285. [Google Scholar] [CrossRef] [Scilit]
- Chen, Y.; Qiao, F.; Jiang, L. Effects of Land Use Pattern Change on Regional Scale Habitat Quality Based on InVEST Model A Case Study in Beijing. Acta Sci. Nat. Univ. Pekin. 2016, 52, 553–562. [Google Scholar] [CrossRef]
- Beijing Municipal Bureau of Statistics Statistical Communique on the 2023 National Economic and Social Development of Beijing. Available online: https://www.beijing.gov.cn/zhengce/zhengcefagui/202403/t20240321_3596451.html (accessed on 18 October 2026). (In Chinese)
- The People’s Government of Beijing Municipality Climate of Beijing. Available online: https://www.beijing.gov.cn/renwen/bjgk/bjgk/qh/201911/t20191106_1872564.html (accessed on 18 October 2026). (In Chinese)
- Liu, Q.; Ouyang, W.; Tan, Z.; Mei, Y.; Bai, B. The Dual Impacts of Built Environment on Extreme Heat and Urban Heat Resilience: A Comparative Study in Beijing. Urban Clim. 2025, 64, 102618. [Google Scholar] [CrossRef] [Scilit]
- Chongqing Municipal Bureau of Statistics Statistical Communique on the 2023 National Economic and Social Development of Chongqing. Available online: https://tjj.cq.gov.cn/zwgk_233/fdzdgknr/tjxx/sjzl_55471/tjgb_55472/202403/t20240326_13084652.html (accessed on 18 October 2026). (In Chinese)
- The People’s Government of Chongqing Municipality Overview of Chongqing. Available online: https://wap.cq.gov.cn/zjcq/sqgk/cqsq/202412/t20241231_14378522.html (accessed on 18 October 2026). (In Chinese)
- Tong, H.; Shi, P. City Profile Lanzhou. Cities 2015, 45, 51–59. [Google Scholar] [CrossRef] [Scilit]
- Lanzhou Municipal Bureau of Statistics Statistical Communique on the 2023 National Economic and Social Development of Lanzhou. Available online: https://manage.gsei.com.cn/index.php/cms/item-view-id-498951-page-1 (accessed on 18 October 2026). (In Chinese)
- Ministry of Ecology and Environment of the People’s Republic of China Lanzhou’s Approach to Air Pollution Control A Research Report Part I. Available online: https://www.mee.gov.cn/xxgk/hjyw/201606/t20160622_354961.shtml (accessed on 18 October 2026). (In Chinese)
- Lhasa Municipal Bureau of Statistics Communique on the Main Results of the Seventh National Population Census of Lhasa. Available online: https://tjj.lasa.gov.cn/tjj/tjgb/202106/7f3aa965cbd54478802c21ccfd06f538.shtml (accessed on 18 October 2026). (In Chinese)
- The People’s Government of Lhasa Municipality Notice Issuing the Lhasa 14th Five-Year Water Security Plan. Available online: https://www.lasa.gov.cn/lasa/wjzl/202204/0195f5cb1a964d6c9121791d618ed7e2.shtml (accessed on 18 October 2026). (In Chinese)
- Che, Y.; Li, X.; Liu, X.; Wang, Y.; Liao, W.; Zheng, X.; Zhang, X.; Xu, X.; Shi, Q.; Zhu, J.; et al. 3D-GloBFP: The First Global Three-Dimensional Building Footprint Dataset. Earth Syst. Sci. Data 2024, 16, 5357–5374. [Google Scholar] [CrossRef] [Scilit]
- Tang, J.; Xu, L.; Yu, H.; Jiang, H.; He, D.; Li, T.; Xiao, W.; Zheng, X.; Liu, K.; Li, Y.; et al. A Dataset of Multi-Level Street-Block Divisions of 985 Cities Worldwide. Sci. Data 2025, 12, 456. [Google Scholar] [CrossRef] [Scilit] [PubMed]
- Liu, L.; Zhang, X. GLC_FCS10: Global 10 m Land-Cover Dataset with Fine Classification System from Sentinel-1 and 2 Time-Series Data, Version 1. [Data Set]. Zenodo: Geneva, Switzerland, 2025. [CrossRef]
- Ermida, S.L.; Soares, P.; Mantas, V.; Göttsche, F.-M.; Trigo, I.F. Google Earth Engine Open-Source Code for Land Surface Temperature Estimation from the Landsat Series. Remote Sens. 2020, 12, 1471. [Google Scholar] [CrossRef] [Scilit]
- Xu, Y. Identifying the Dominant Seasonal Drivers of Land Surface Temperature on Xiamen Island: An Urban Functional Zone Perspective. Front. Environ. Sci. 2025, 13, 1661441. [Google Scholar] [CrossRef] [Scilit]
- Dormann, C.F.; Elith, J.; Bacher, S.; Buchmann, C.; Carl, G.; Carré, G.; Marquéz, J.R.G.; Gruber, B.; Lafourcade, B.; Leitão, P.J.; et al. Collinearity: A Review of Methods to Deal with It and a Simulation Study Evaluating Their Performance. Ecography 2013, 36, 27–46. [Google Scholar] [CrossRef] [Scilit]
- Wang, Q.; Wang, X.; Zhou, Y.; Liu, D.; Wang, H. The Dominant Factors and Influence of Urban Characteristics on Land Surface Temperature Using Random Forest Algorithm. Sustain. Cities Soc. 2022, 79, 103722. [Google Scholar] [CrossRef] [Scilit]
- Gao, W.; Liu, J.; Li, S.; Xu, K.; Wang, M.; Xia, Z. Effect of Urban Morphology on Local-Scale Urban Heat Island Intensity under Varying Urbanisation: A Case Study of Wuhan. Sustain. Cities Soc. 2025, 125, 106328. [Google Scholar] [CrossRef] [Scilit]
- Shao, L.; Liao, W.; Li, P.; Luo, M.; Xiong, X.; Liu, X. Drivers of Global Surface Urban Heat Islands: Surface Property, Climate Background, and 2D/3D Urban Morphologies. Build. Environ. 2023, 242, 110581. [Google Scholar] [CrossRef] [Scilit]
- Wei, Q.; Zhou, D.; Yang, X.; Zhang, W.; Fan, S.; Kuang, W.; Luo, S.; Yu, D.; Tan, J. Diurnal Inversion of LST Drivers in Urban-Rural Transition Zones: An Interpretable GWRF-SHAP Framework for Heat Mitigation in Changsha, China. SSRN 2026, 6127039. [Google Scholar] [CrossRef] [Scilit]
- Wang, S.; Hu, M.; Li, J.; Liu, G.; Hu, W.; Qi, J.; Huang, J.; Liu, Z.; Wang, H.; Han, B. An Interpretable Spatially Weighted Machine Learning Approach for Revealing Spatial Nonstationarity Impacts of the Built Environment on Air Pollution. Build. Environ. 2025, 280, 113150. [Google Scholar] [CrossRef] [Scilit]
- Zhao, H.; Ren, Z.; Tan, J. The Spatial Patterns of Land Surface Temperature and Its Impact Factors: Spatial Non-Stationarity and Scale Effects Based on a Geographically-Weighted Regression Model. Sustainability 2018, 10, 2242. [Google Scholar] [CrossRef] [Scilit]
- Lan, H.; Hou, H.; Gou, Z. A Machine Learning Led Investigation to Understand Individual Difference and the Human-Environment Interactive Effect on Classroom Thermal Comfort. Build. Environ. 2023, 236, 110259. [Google Scholar] [CrossRef] [Scilit]
- Zheng, G.; Zhang, Y.; Yue, X.; Li, K. Interpretable Prediction of Thermal Sensation for Elderly People Based on Data Sampling, Machine Learning and SHapley Additive exPlanations (SHAP). Build. Environ. 2023, 242, 110602. [Google Scholar] [CrossRef] [Scilit]
- Wei, X.; Guan, F.; Zhang, X.; Van De Weghe, N.; Huang, H. Integrating Planar and Vertical Environmental Features for Modelling Land Surface Temperature Based on Street View Images and Land Cover Data. Build. Environ. 2023, 235, 110231. [Google Scholar] [CrossRef] [Scilit]
- Lundberg, S.M.; Erion, G.; Chen, H.; DeGrave, A.; Prutkin, J.M.; Nair, B.; Katz, R.; Himmelfarb, J.; Bansal, N.; Lee, S.-I. From Local Explanations to Global Understanding with Explainable AI for Trees. Nat. Mach. Intell. 2020, 2, 56–67. [Google Scholar] [CrossRef] [Scilit] [PubMed]
- Li, Y.; Schubert, S.; Kropp, J.P.; Rybski, D. On the Influence of Density and Morphology on the Urban Heat Island Intensity. Nat. Commun. 2020, 11, 2647. [Google Scholar] [CrossRef] [Scilit] [PubMed]
- Zhao, L.; Lee, X.; Smith, R.B.; Oleson, K. Strong Contributions of Local Background Climate to Urban Heat Islands. Nature 2014, 511, 216–219. [Google Scholar] [CrossRef] [Scilit] [PubMed]
- Zhang, Y.; Chen, L.; Sun, C.; Fu, Y.; Xie, Y. An Investigation of the Influence of the Morphological Indexes of Trees on the Outdoor Microclimate at High Altitude in Summer. Front. Environ. Sci. 2023, 11, 1098966. [Google Scholar] [CrossRef] [Scilit]
- Yin, S.; Liu, J.; Han, Z. Relationship between Urban Morphology and Land Surface Temperature—A Case Study of Nanjing City. PLoS ONE 2022, 17, e0260205. [Google Scholar] [CrossRef] [Scilit] [PubMed]
- Huang, J.; Wang, Y. Cooling Intensity of Hybrid Landscapes in a Metropolitan Area: Relative Contribution and Marginal Effect. Sustain. Cities Soc. 2022, 79, 103725. [Google Scholar] [CrossRef] [Scilit]
- Wu, Y.; Che, Y.; Liao, W.; Liu, X. The Impact of Urban Morphology on Land Surface Temperature across Urban-Rural Gradients in the Pearl River Delta, China. Build. Environ. 2025, 267, 112215. [Google Scholar] [CrossRef] [Scilit]
- Bhattarai, S.; Banjara, P.; Pandey, V.P.; Aryal, A.; Pradhan, P.; Al-Douri, F.; Pradhan, N.R.; Talchabhadel, R. Quantifying the Cooling Effects of Blue-Green Spaces across Urban Landscapes: A Case Study of Kathmandu Valley, Nepal. Urban Clim. 2025, 61, 102493. [Google Scholar] [CrossRef] [Scilit]
- Rasul, A.; Balzter, H.; Ibrahim, G.R.F.; Hameed, H.M.; Wheeler, J.; Adamu, B.; Ibrahim, S.; Najmaddin, P.M. Applying Built-Up and Bare-Soil Indices from Landsat 8 to Cities in Dry Climates. Land 2018, 7, 81. [Google Scholar] [CrossRef] [Scilit]
- Liu, X.; Wu, T.; Jiang, Q.; Ao, X.; Zhu, L.; Qiao, R. The Nonlinear Climatological Impacts of Urban Morphology on Extreme Heats in Urban Functional Zones: An Interpretable Ensemble Learning-Based Approach. Build. Environ. 2025, 273, 112728. [Google Scholar] [CrossRef] [Scilit]
- Grimmond, C.S.B.; Oke, T.R. Heat Storage in Urban Areas: Local-Scale Observations and Evaluation of a Simple Model. J. Appl. Meteorol. 1999, 38, 922–940. [Google Scholar] [CrossRef] [Scilit]
- Tian, Y.; Xie, Z.; Xie, J.; Jia, B.; Chen, S.; Qin, P.; Li, R.; Wang, L.; Yan, H.; You, Y.; et al. Analyzing the Land Surface Temperature Response to Urban Morphological Changes: A Case Study of the Chengdu–Chongqing Urban Agglomeration. J. Geophys. Res. Atmos. 2024, 129, e2023JD040228. [Google Scholar] [CrossRef] [Scilit]
- Wan, B.; Shen, N.; Zhang, H.; Sheng, Q. Analyzing the Impact of Urban Morphology on Urban Land Surface Temperature from the Perspective of Spatial Configuration and Explainable Machine Learning: A Case Study of Seven Cities. Sustain. Cities Soc. 2026, 138, 107165. [Google Scholar] [CrossRef] [Scilit]
- Zha, Y.; Gao, J.; Ni, S. Use of Normalized Difference Built-up Index in Automatically Mapping Urban Areas from TM Imagery. Int. J. Remote Sens. 2003, 24, 583–594. [Google Scholar] [CrossRef] [Scilit]
- Hu, J.; Yang, Y.; Zhou, Y.; Zhang, T.; Ma, Z.; Meng, X. Spatial Patterns and Temporal Variations of Footprint and Intensity of Surface Urban Heat Island in 141 China Cities. Sustain. Cities Soc. 2022, 77, 103585. [Google Scholar] [CrossRef] [Scilit]
- Kim, J.; Meller, B.; Woo, J.; Arora, A.S.; Schuetze, T. Integrated Urban Climate Resilience and Sustainability Assessment System for Urban Regeneration and Building Renovation. Land 2026, 15, 920. [Google Scholar] [CrossRef] [Scilit]
- Liu, Y.; An, Z.; Ming, Y. Simulating Influences of Land Use/Land Cover Composition and Configuration on Urban Heat Island Using Machine Learning. Sustain. Cities Soc. 2024, 108, 105482. [Google Scholar] [CrossRef] [Scilit]
- Akbari, H.; Pomerantz, M.; Taha, H. Cool Surfaces and Shade Trees to Reduce Energy Use and Improve Air Quality in Urban Areas. Sol. Energy 2001, 70, 295–310. [Google Scholar] [CrossRef] [Scilit]
- Comber, A.; Brunsdon, C.; Charlton, M.; Dong, G.; Harris, R.; Lu, B.; Lü, Y.; Murakami, D.; Nakaya, T.; Wang, Y.; et al. A Route Map for Successful Applications of Geographically Weighted Regression. Geogr. Anal. 2023, 55, 155–178. [Google Scholar] [CrossRef] [Scilit]
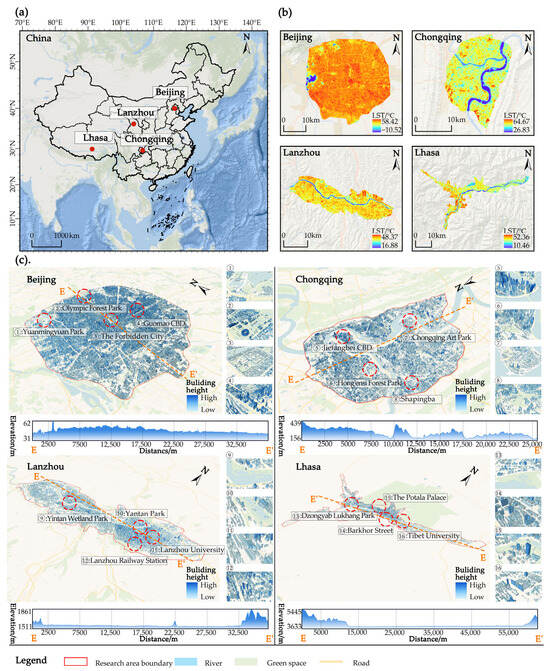
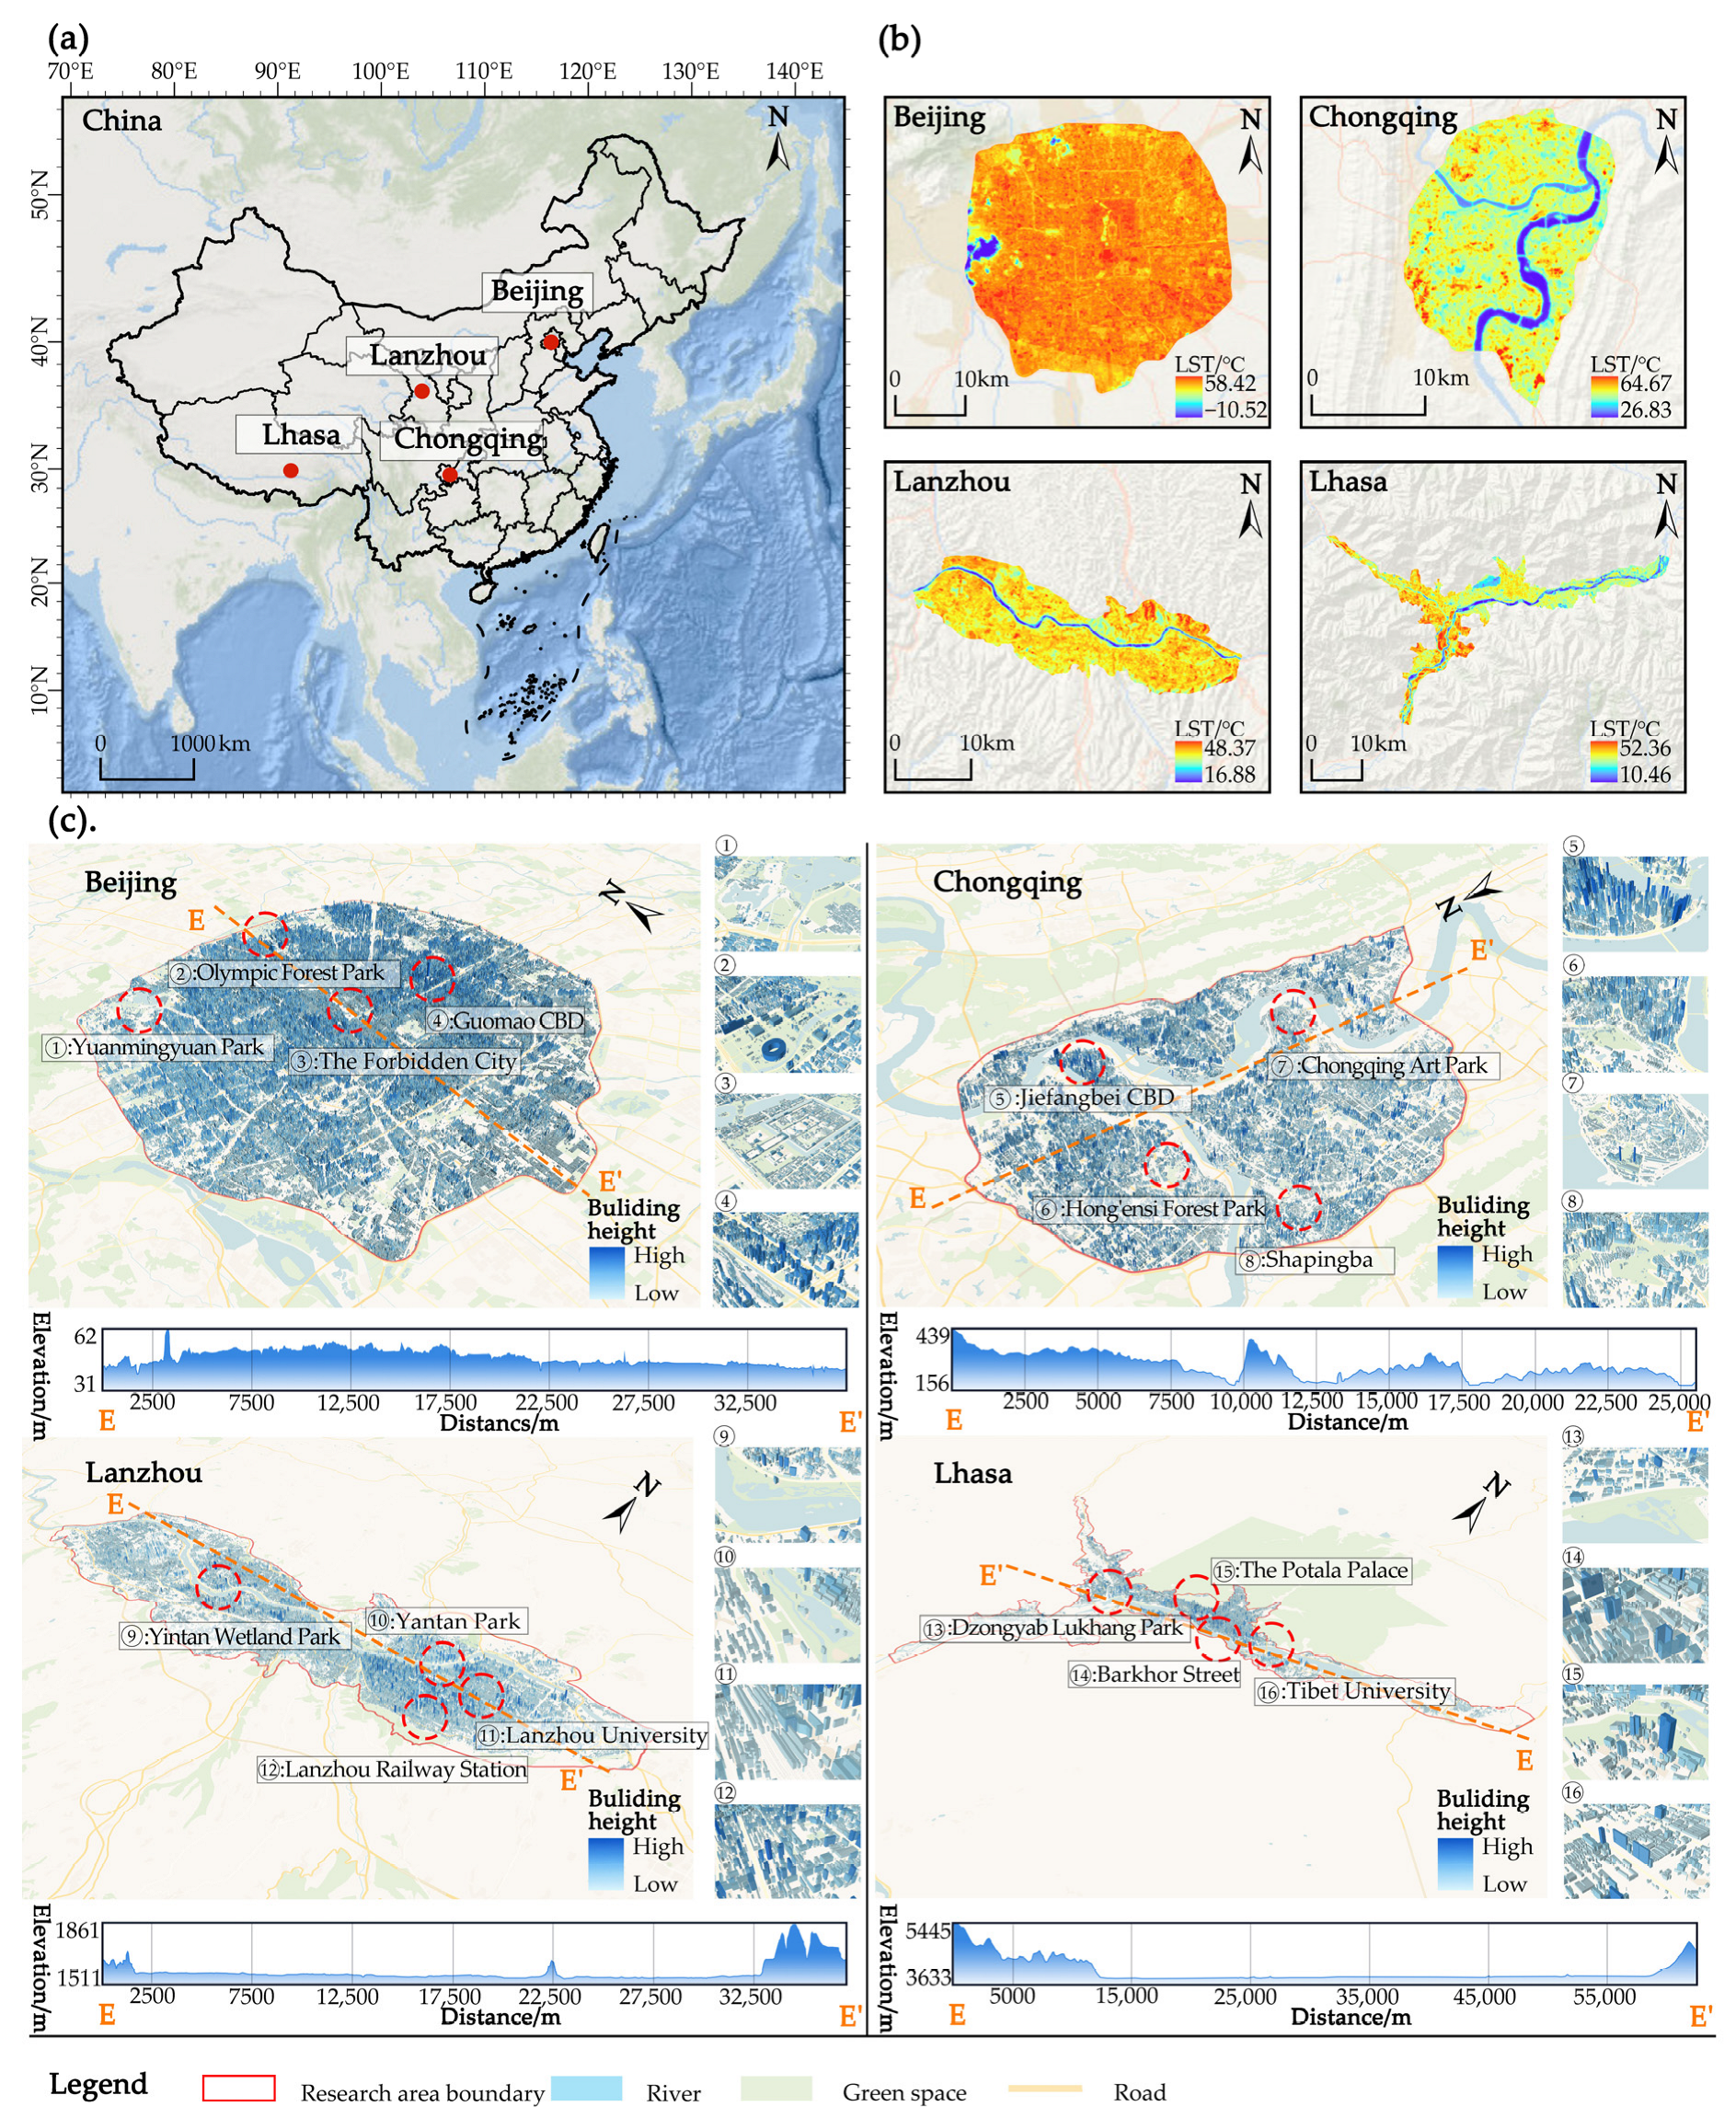
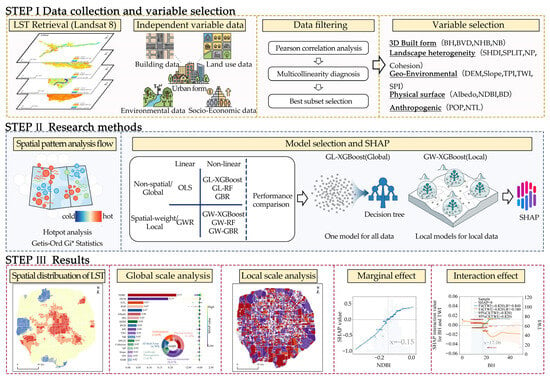
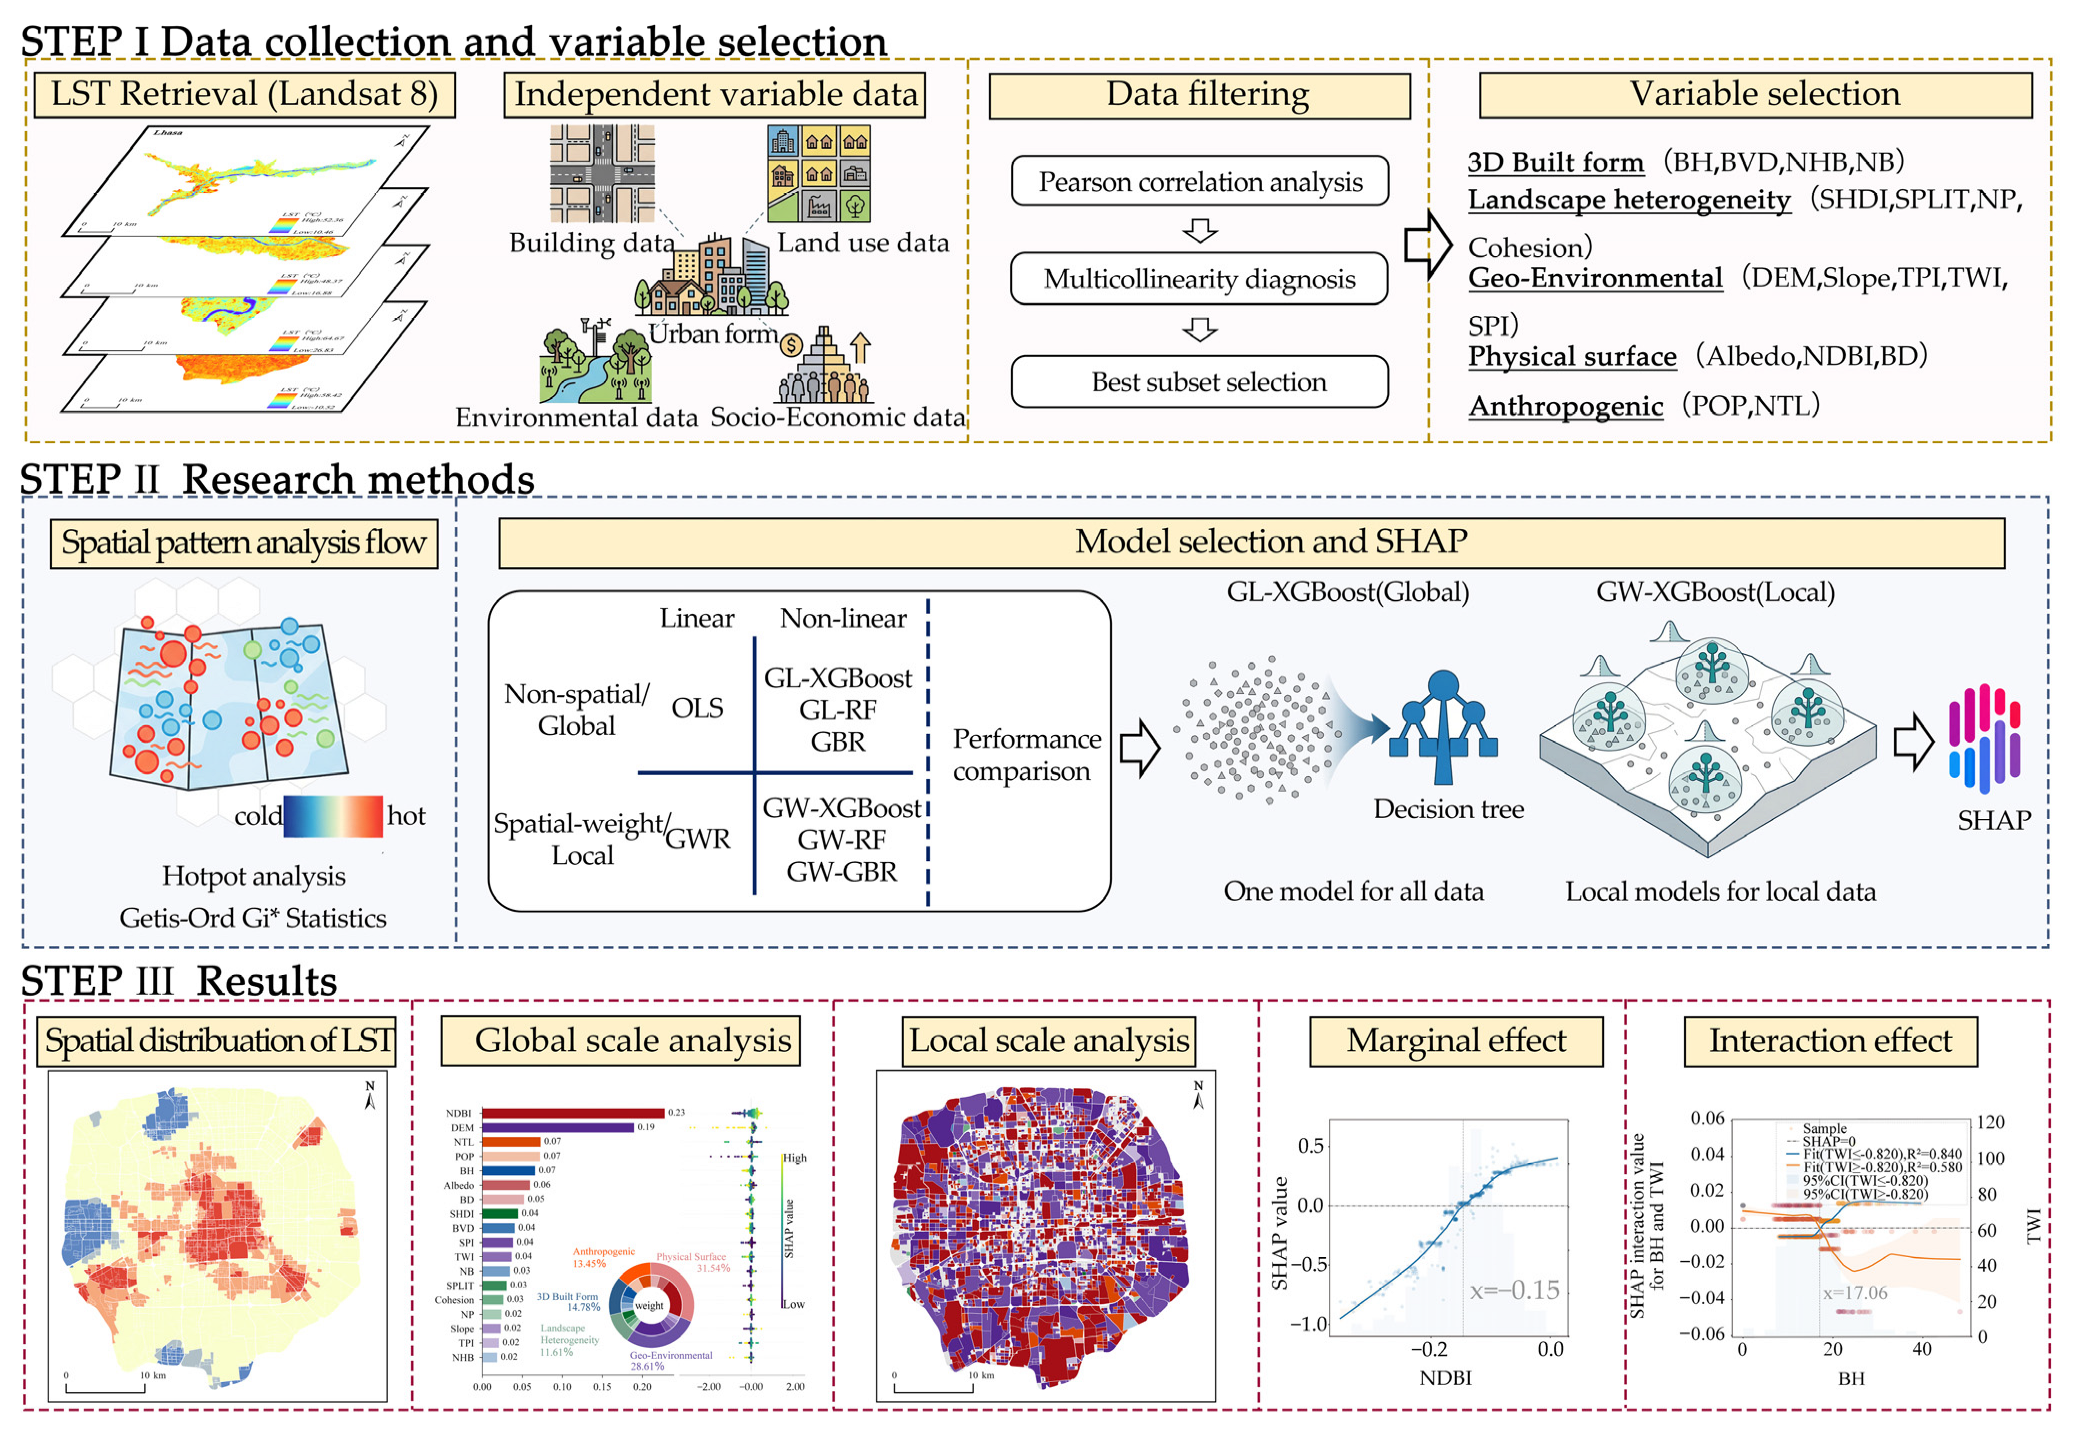
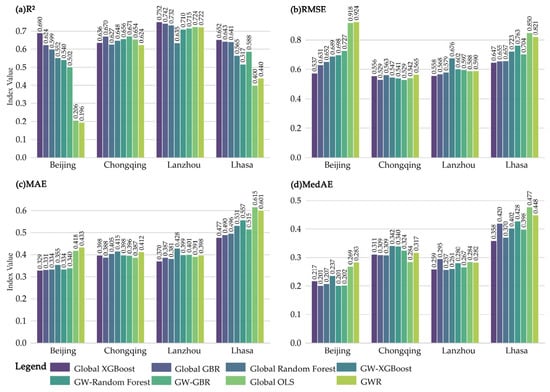
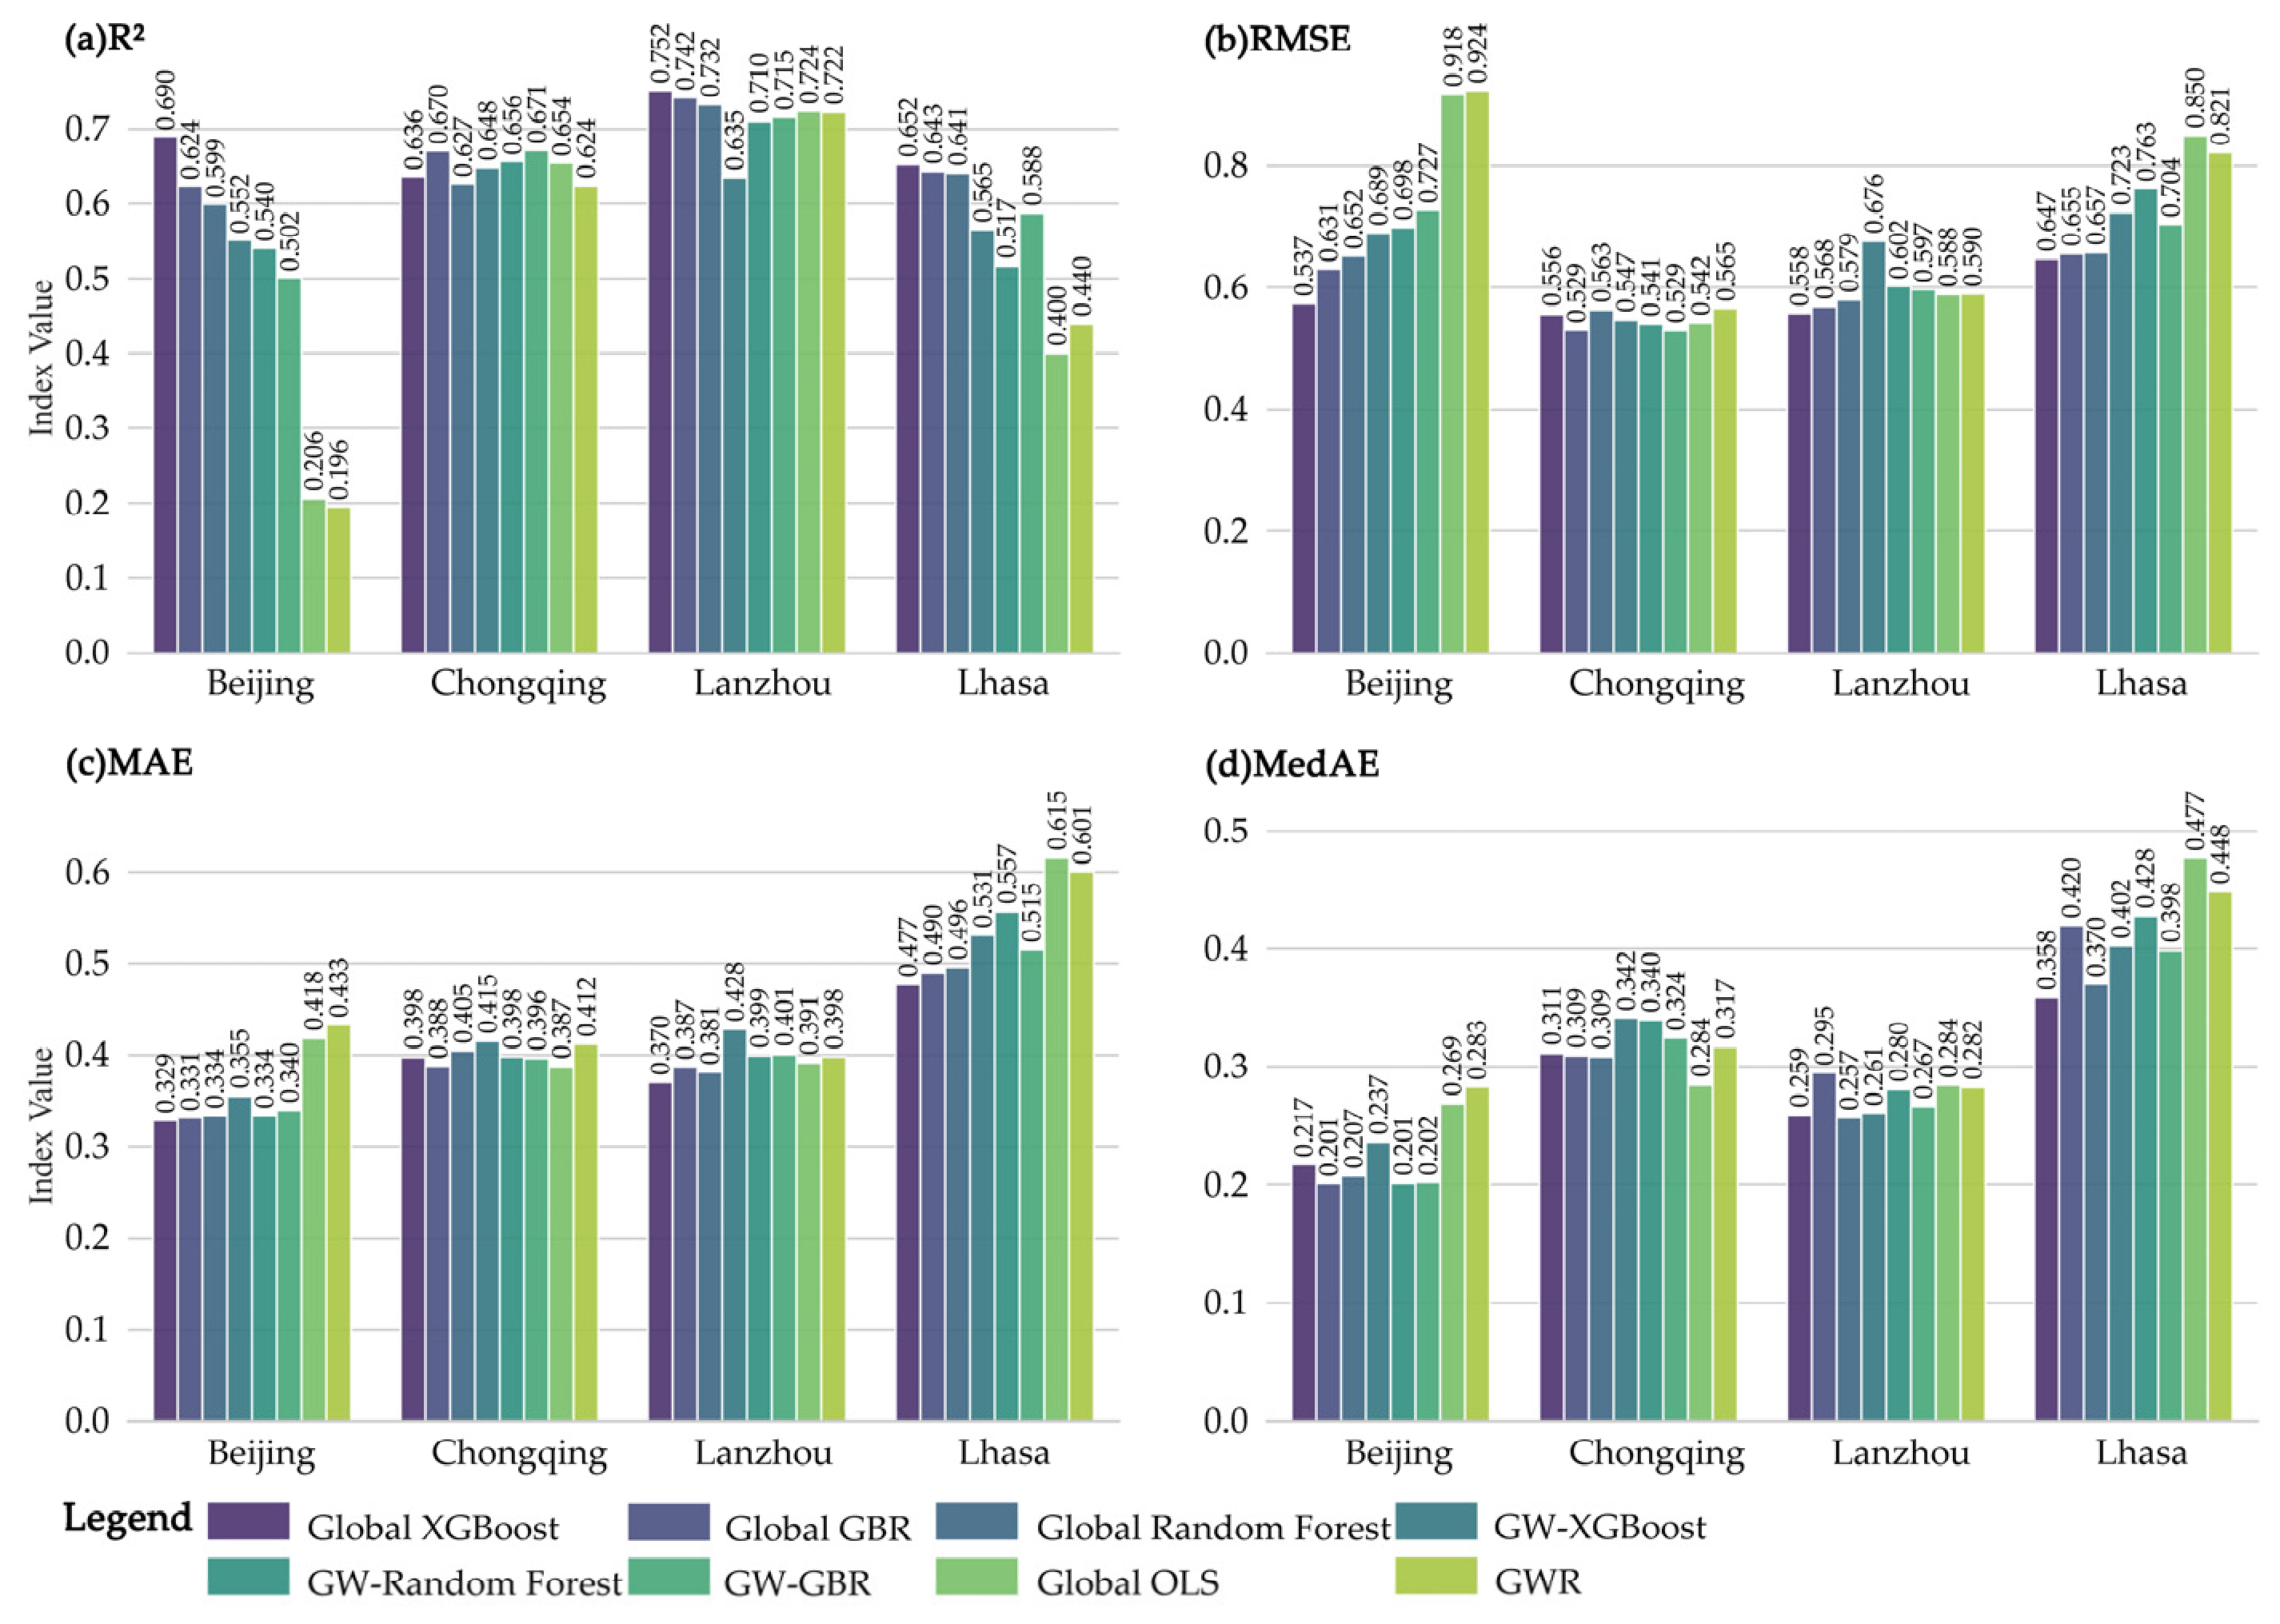
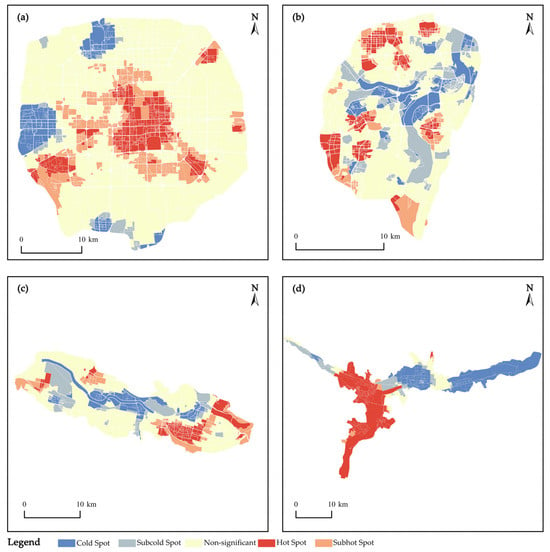
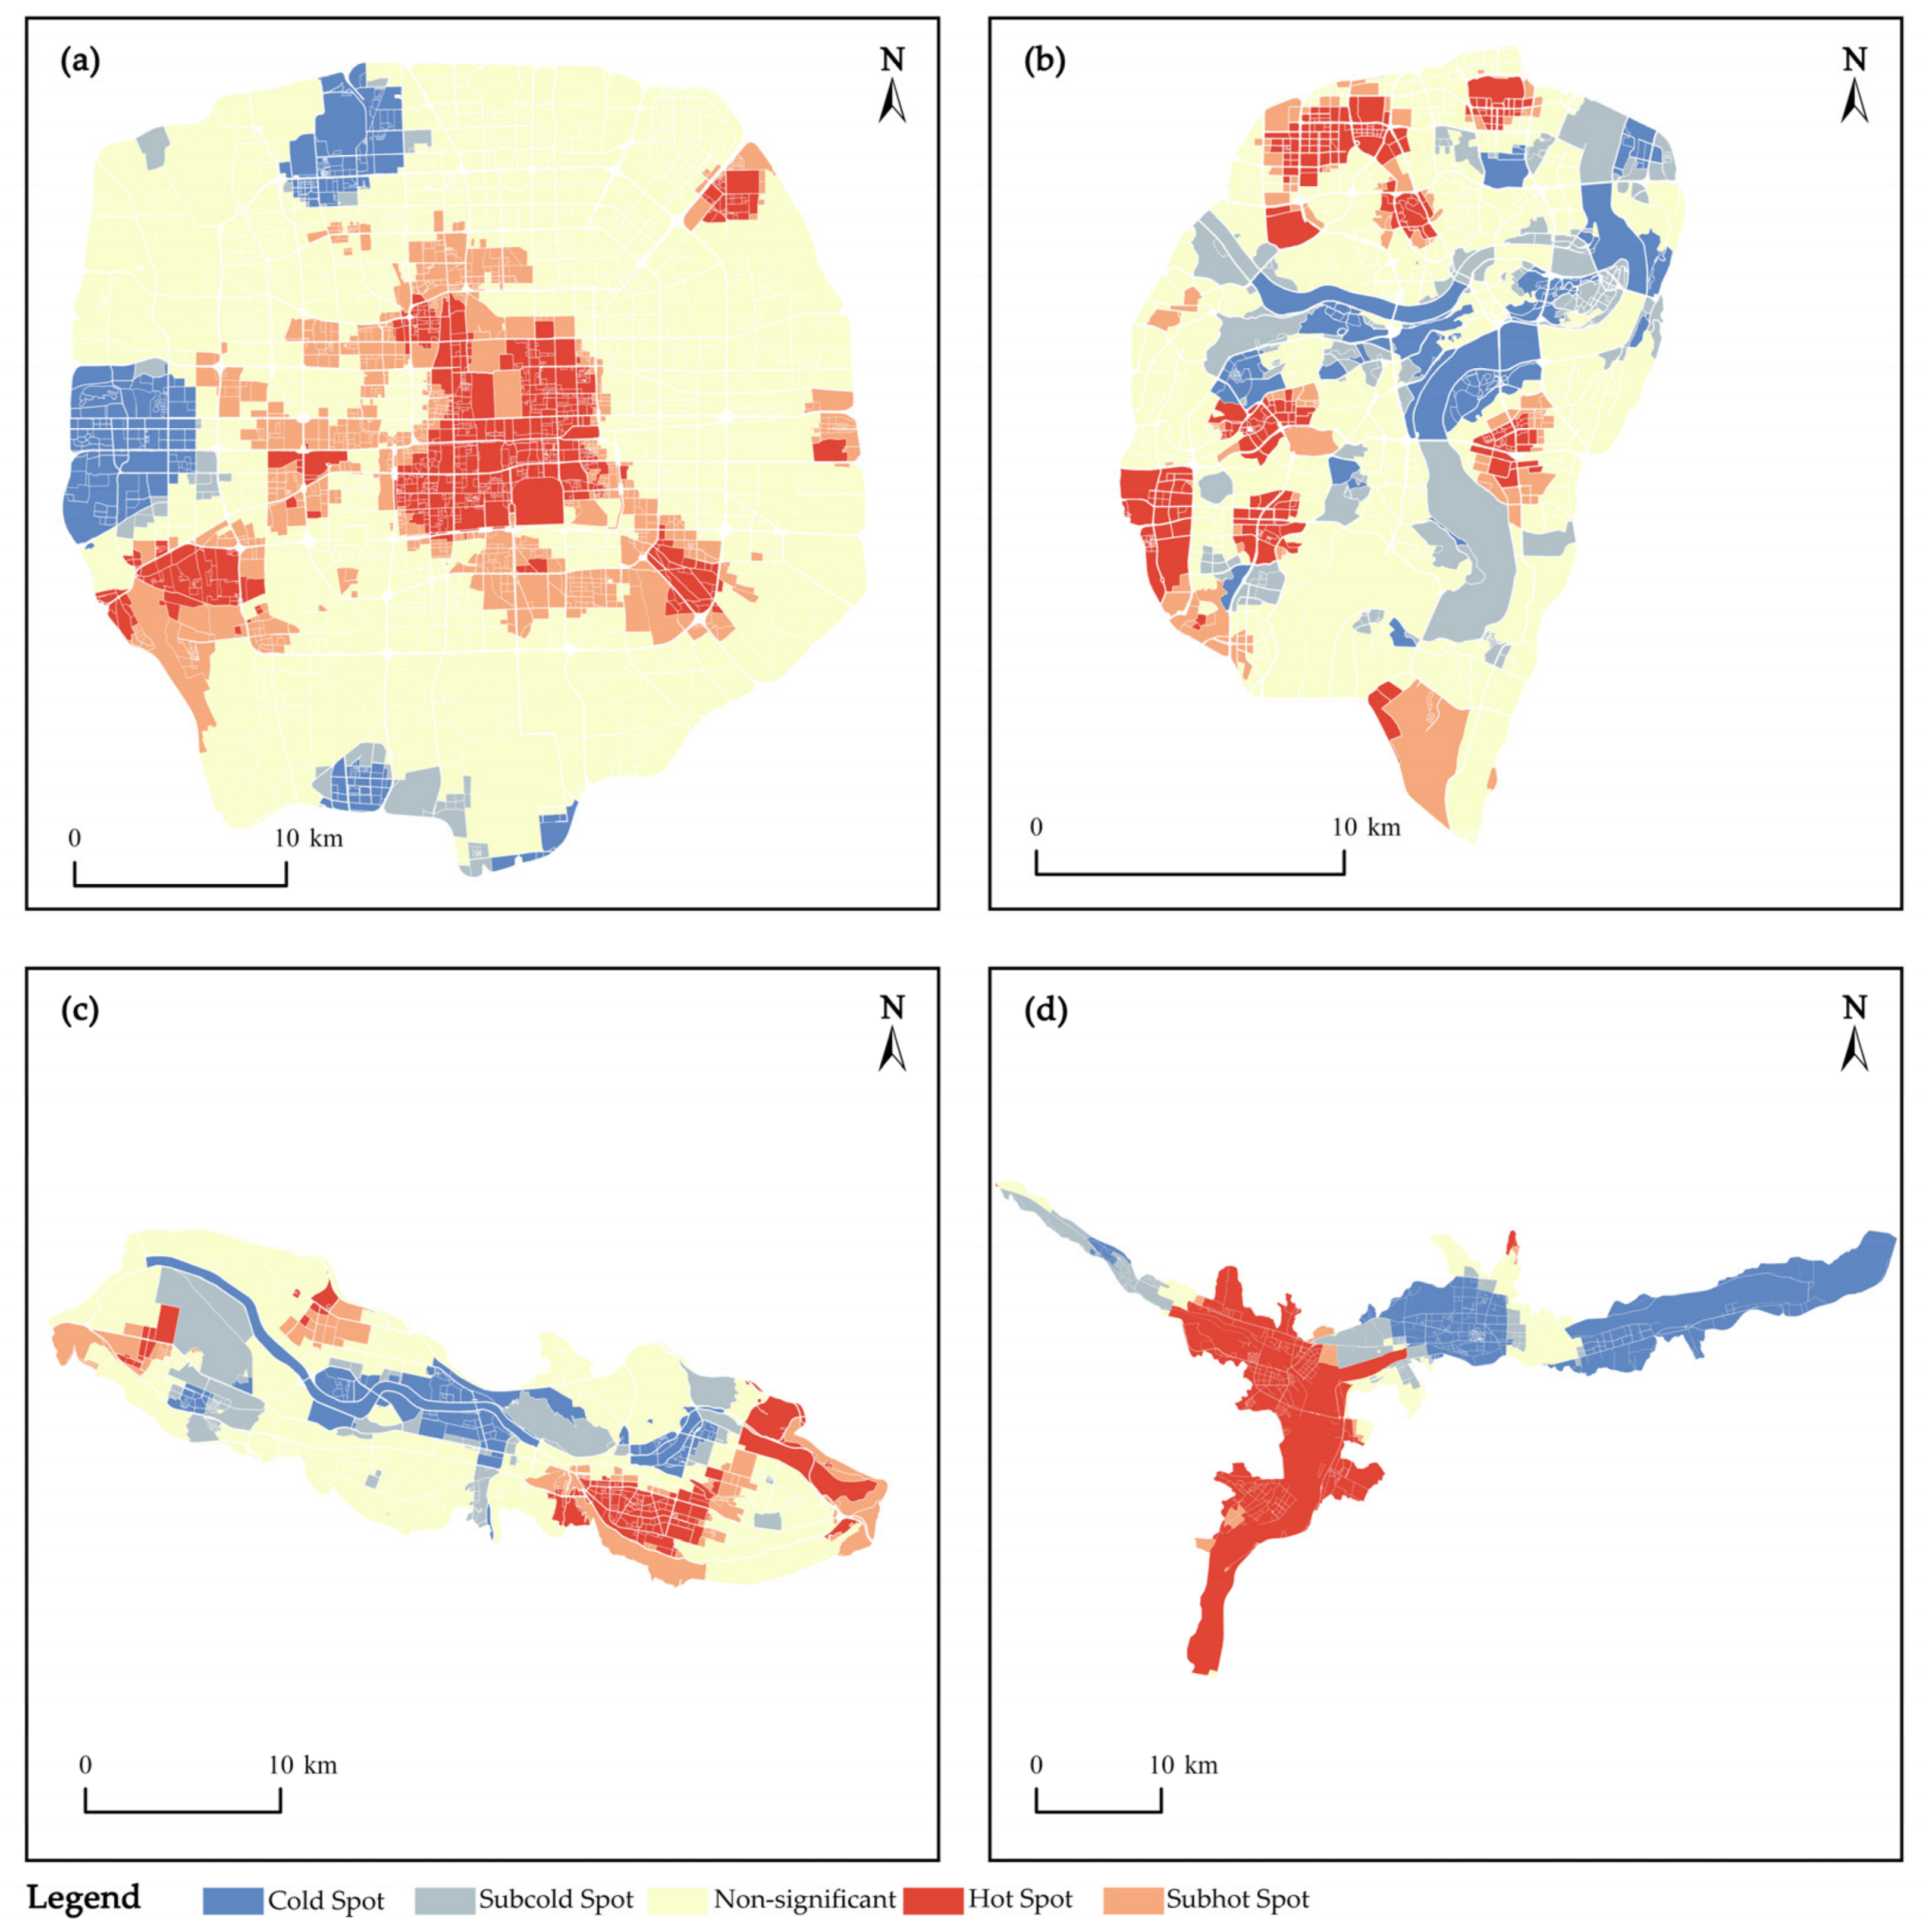
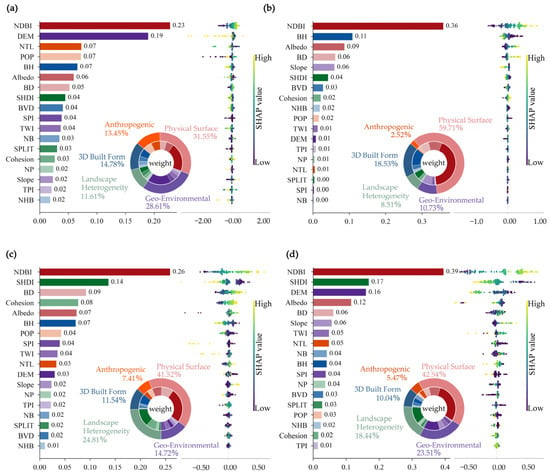
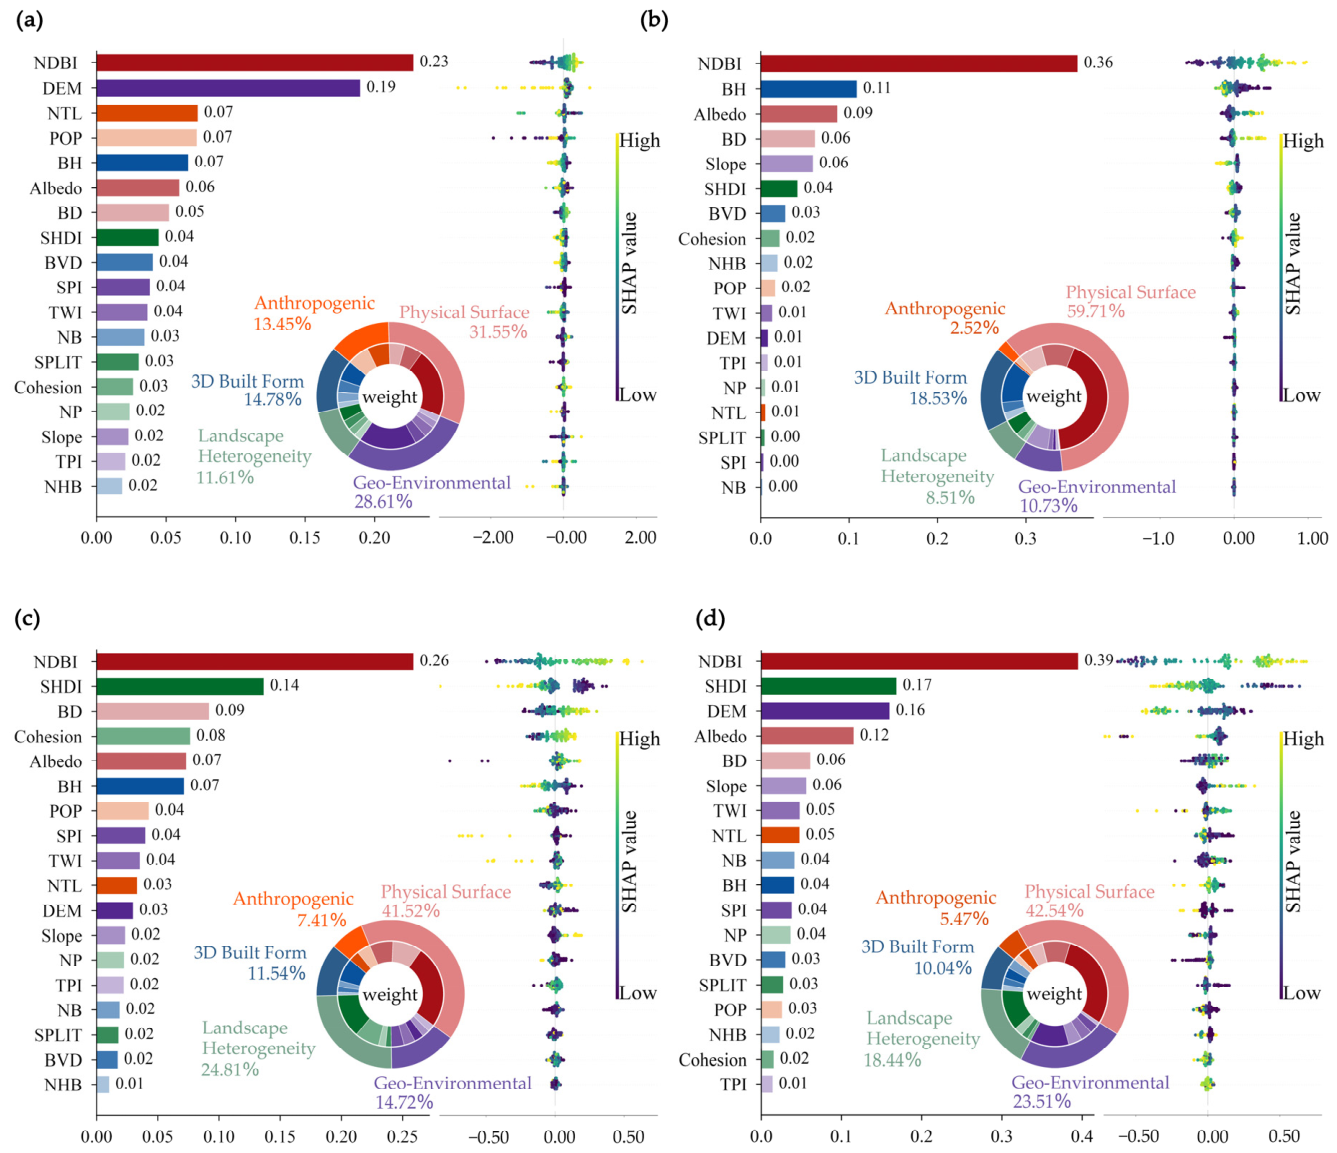
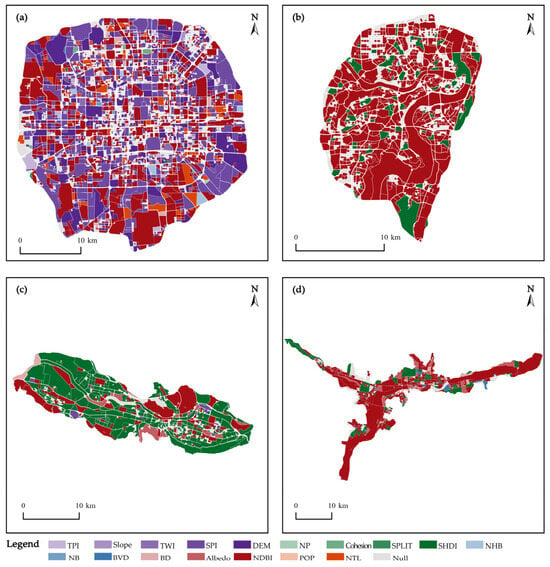
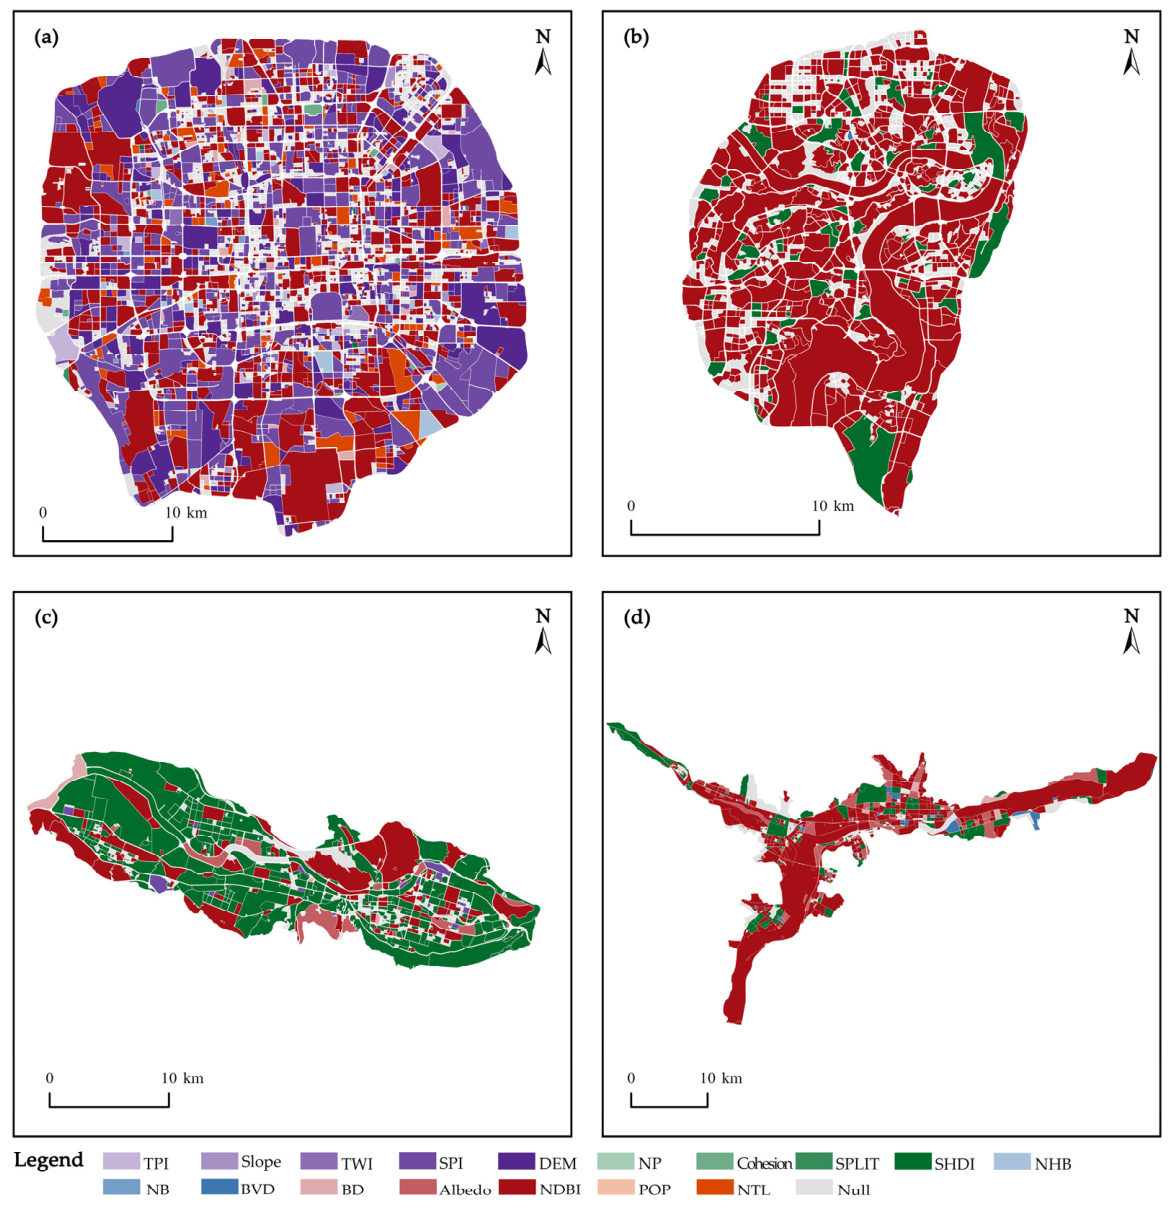
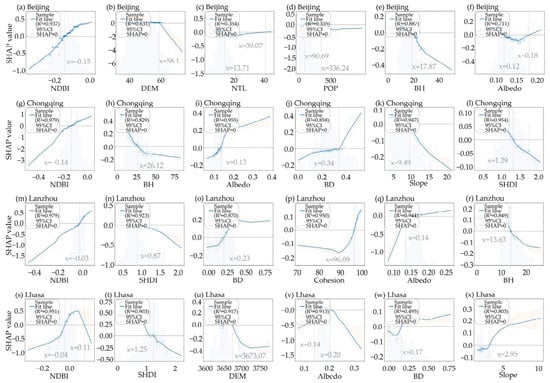
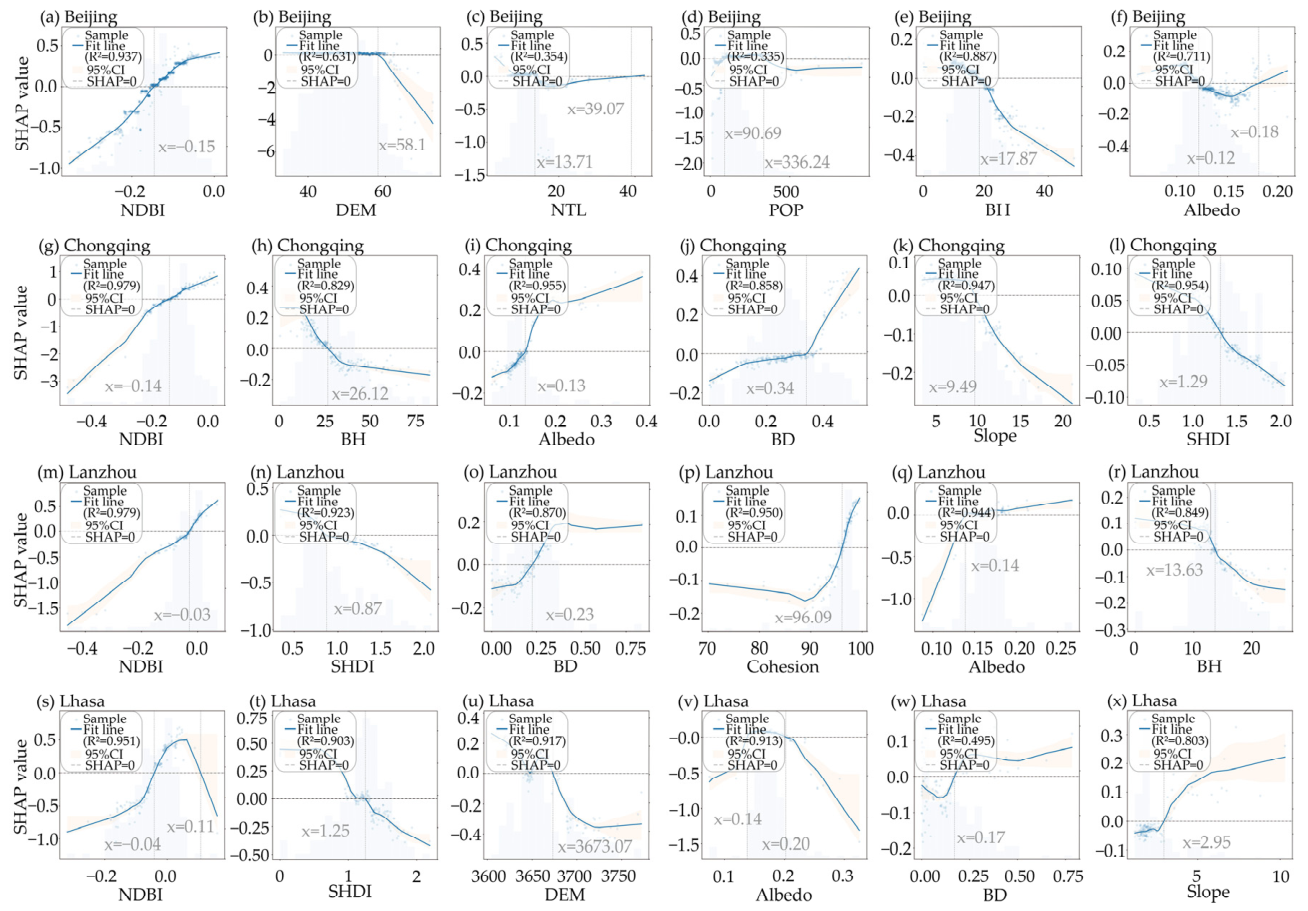
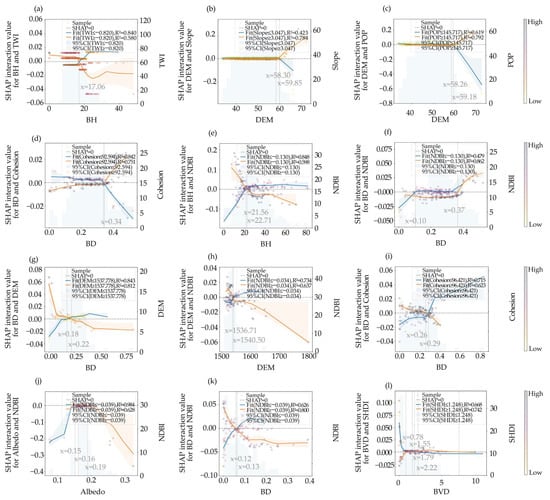
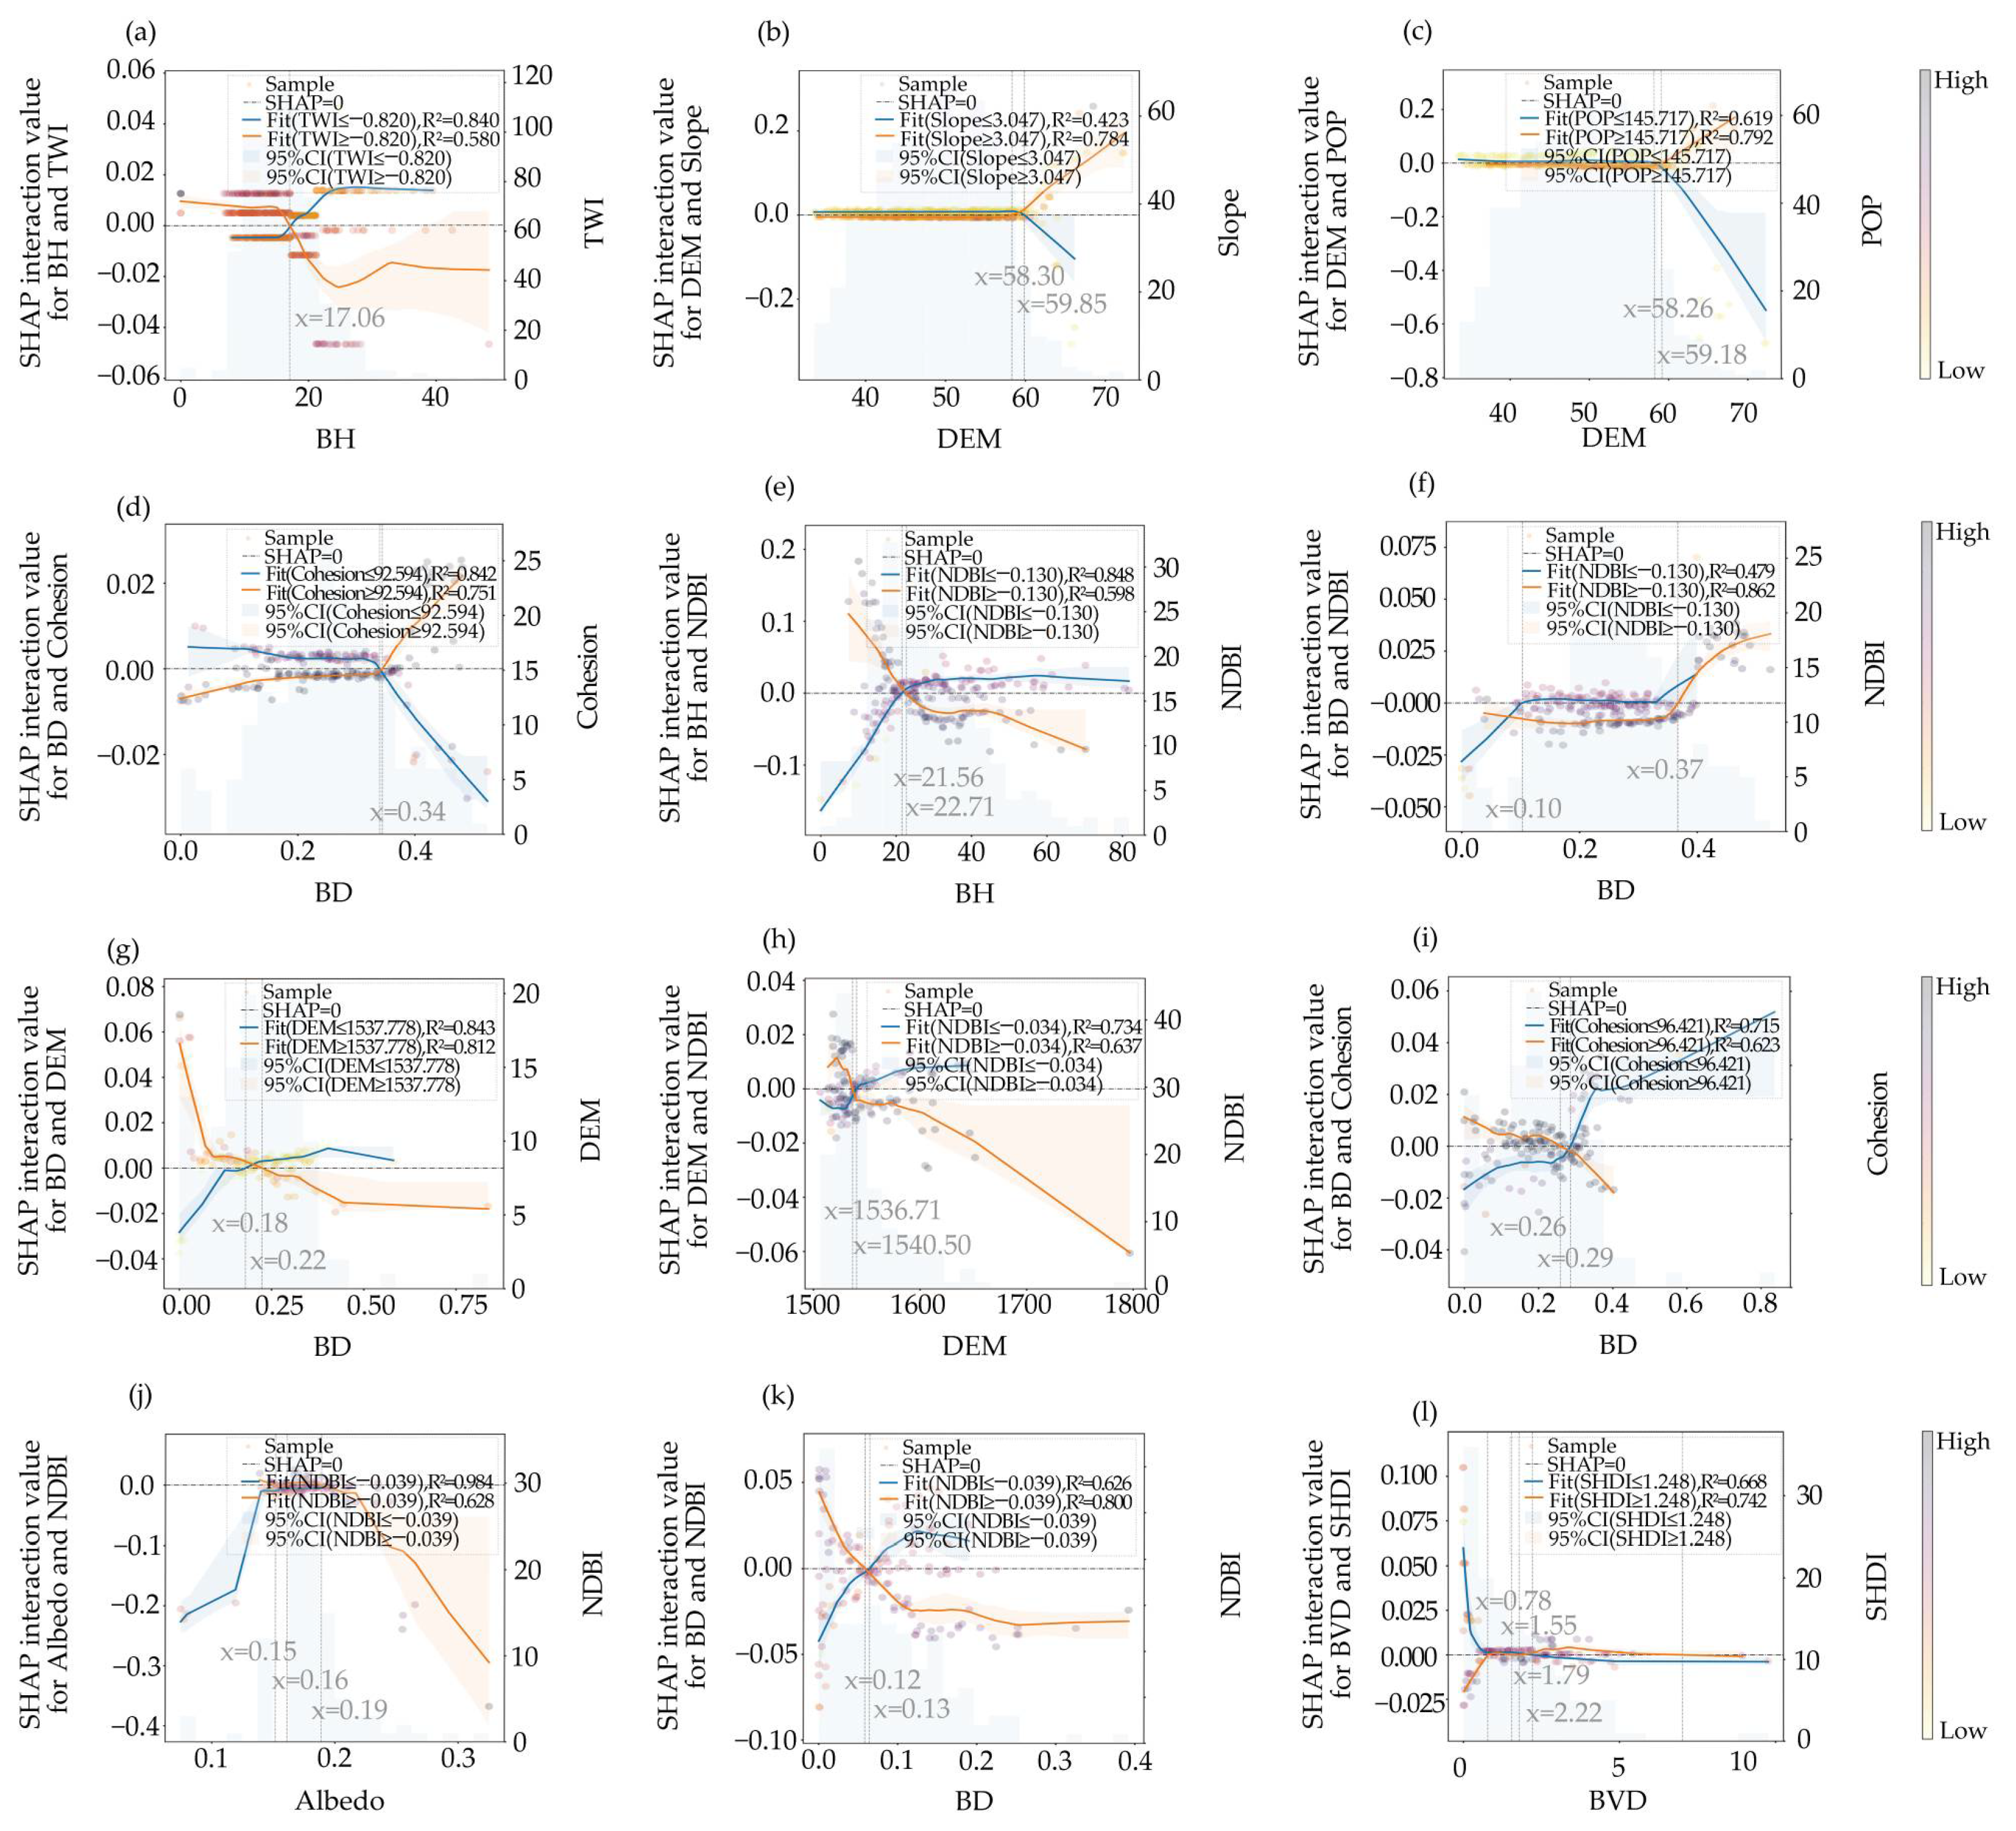

Disclaimer/Publisher’s Note: The statements, opinions and data contained in all publications are solely those of the individual author(s) and contributor(s) and not of MDPI and/or the editor(s). MDPI and/or the editor(s) disclaim responsibility for any injury to people or property resulting from any ideas, methods, instructions or products referred to in the content. |
© 2026 by the authors. Licensee MDPI, Basel, Switzerland. This article is an open access article distributed under the terms and conditions of the Creative Commons Attribution (CC BY) license.