


Abstract
An annual dynamic model is developed in TRNSYS 18 to coordinate thermal safety with low electricity and water use of modular data centers in cold regions. A heat and mass transfer model for the indirect evaporative cooler is established and validated against experimental data, with a maximum relative error of 4.5% in outlet temperature. Under full load, the effects of supply airflow rate, fresh/return air ratio, and spray efficiency are evaluated. At 2.1 × 10⁵ kg/h airflow, an 80.0% fresh/return air ratio, and a 95.0% spray efficiency, room temperature maintains 26.6–27.2 °C. Annual electricity and water consumption are 7.3 × 10⁶ kWh and 9.9 × 10⁷ kg, with PUE, WUE, and CUE of 1.31, 2.37, and 1.46, respectively. At a partial load rate of 0.6, key parameter sensitivities are quantified. Airflow rising from 9.0 × 10⁴ to 1.2 × 10⁵ kg/h increases annual electricity by only 0.2% but water consumption by 33.4%, with fan and spray pump power indices up 7.0% and 0.1%. Reducing the fresh/return air ratio from 90.0% to 80.0% cuts electricity and water by 29.8% and 12.5%; lowering spray efficiency from 98.0% to 90.0% reduces them by 25.3% and 8.9%. Finally, a staged control method is proposed via joint assessment. Airflow matches load rate, spray intensity adjusts with room temperature, and a low fresh/return air ratio is prioritized. It provides a feasible approach for energy-saving, water-saving, and low-carbon operation of green data centers.
1. Introduction
Data centers are essential infrastructure for cloud computing, artificial intelligence, and high performance computing [1,2,3,4]. Insufficient cooling can lead to an increase in server inlet temperature, local hotspots, and device frequency reduction [5,6,7]. Therefore, thermal safety is the primary goal of cooling system operation. However, excessive air supply, low temperature setting, and continuous high-intensity spraying can increase fan power consumption and evaporation water consumption [8,9]. Cold regions provide long periods of low outdoor temperature and favorable conditions for natural cooling. This climatic advantage, however, does not automatically produce low annual electricity and water consumption. Cooling performance is jointly determined by airflow organization, equipment configuration, climate, and operating control. It cannot be evaluated only from nominal heat-exchanger efficiency or design cooling capacity [10,11]. Therefore, how to determine a reasonable combination of supply airflow rate, fresh/return air ratio, and spray efficiency while meeting the room temperature boundary is the core issue for optimizing the operation of modular data centers in cold regions.
Indirect evaporative cooling can use the air wet bulb temperature to reduce the supply air temperature without directly introducing outdoor pollutants, which is suitable for data centers with strict air quality requirements [12,13]. For example, Jing et al. [14] conducted field tests on air-cooled data centers in two different climate regions (semi-humid and hot–dry regions), comparing and analyzing their cooling system performance and energy consumption characteristics. The study identified common issues such as low IT load rate, mixed cold and hot airflow, and scaling of cooling water systems, and proposed optimization solutions. Karimi et al. [15] developed a dynamic energy and water consumption data center model for hot and arid climates, with a focus on analyzing the impact of seasonal changes on energy and water resources. They found that the benefits of evaporative cooling and economizers are significantly affected by seasons and climate, and energy conservation does not necessarily correspond to on-site water conservation. Liao et al. [16] further utilized experiments and TRNSYS models to study evaporative precooling systems. Research has shown that the impact of return air temperature, airflow rate, and refrigerant flow rate varies, and multi-parameter resetting is more beneficial for improving annual efficiency than long-term maintenance of design values. For cold regions, low outdoor temperatures increase the available natural cooling hours, but the supply air volume, fresh/return air ratio, and spray intensity still change the water consumption and supply air status of the equipment. The optimal operating parameters for a specific computer room cannot be determined solely based on climate zoning. Therefore, the engineering evaluation of evaporative cooling systems should shift from the design point performance to the annual response under the combined action of meteorological, load, and control parameters. Operating parameter adjustment is a direct engineering means to connect thermal safety and energy consumption [17,18]. Lan et al. [19] studied the effects of supply air volume (SAV), supply air temperature (SAT), and data center total power (DCTP) on server inlet air temperature (SIAT) through a combination of experiments and numerical simulations. This study reveals the thermal environment characteristics of fan wall systems and improves the theory of data center thermal management. Karimi et al. [20] focused on two colocated data centers with different cooling systems in hot and arid climates as a case study and revealed the water energy consumption characteristics of different cooling systems by analyzing energy use efficiency (PUE) and water use efficiency (WUE). Although existing experimental research can identify specific equipment or on-site issues, the scale, cabinet density, and climate boundaries of different projects’ computer rooms are not consistent, making it difficult to distinguish the temperature, water consumption, and power consumption changes caused by distributed air volume, fresh/return air ratio, and spray efficiency under uniform conditions. Therefore, comparing only the total energy consumption or a single efficiency indicator on site is difficult to form a widely applicable parameter control strategy. Dynamic simulation provides a feasible approach for unified comparison of operating parameters [21,22]. Aili et al. [23] proposed integrating all-weather passive radiative cooling technology into data center cooling systems to reduce energy and water consumption. They found that radiation cooling technology provides multiple feasible energy-saving and water-saving solutions for data centers, especially suitable for tropical climate regions. Wang et al. [24] proposed a global optimization method based on predictive optimization control. By establishing equipment energy consumption models and load time series prediction models, combined with differential evolution algorithms to achieve early optimization of system parameters, the problems of local optimization and control lag have been solved. Cherqi et al. [25] investigated SiO2 coatings on aluminum substrates under humid conditions in Morocco. While their study focuses on material-level radiative cooling, the present work addresses airflow and spray operation in a data center cooling system. It provides context for alternative cooling pathways rather than validation of the present control settings. Although various methods have been developed from component performance to system control, there are still three shortcomings in modular indirect evaporative cooling systems. Firstly, supply airflow rate, mixing ratio, and spray performance are often discussed separately, lacking a unified process for first determining the feasibility of full load heating and then evaluating partial load energy consumption. Secondly, there is a lack of corresponding explanations between normalized indicators such as PUE, WUE, and CUE and annual electricity consumption and annual water consumption, as well as the response of fans and sprinkler pumps. Thirdly, design condition parameters are often directly used for partial loads, and there is still a lack of executable methods for selecting air volume levels based on load rates and determining spray input based on room temperature.
To solve the above problems, an annual dynamic model is established in TRNSYS 18 to examine load-adaptive operation of a modular data center. A heat and mass transfer model is also established for the indirect evaporative cooler, and its reliability is verified against experimental data. First, the effects of supply airflow rate, fresh/return air ratio, and spray efficiency are evaluated under full load. A feasible design combination is then identified near the 27.0 °C room-temperature limit. Second, the temperature, annual electricity consumption, and annual water consumption are compared under the actual partial load rates of engineering. Finally, a staged control method is obtained from the joint assessment of thermal safety, PUE, WUE, and CUE. The contribution of this study is the sequence of full-load temperature screening, partial-load electricity and water sensitivity assessment, and selection of load-dependent airflow and spray settings under a room-temperature constraint. This study provides a practical implementation pathway for achieving high efficiency energy utilization, water conservation, and low carbon operation of data center buildings.
2. Construction of Evaporative Cooling Systems in Modular Data Centers
2.1. Basic Principles of Evaporative Cooling Systems
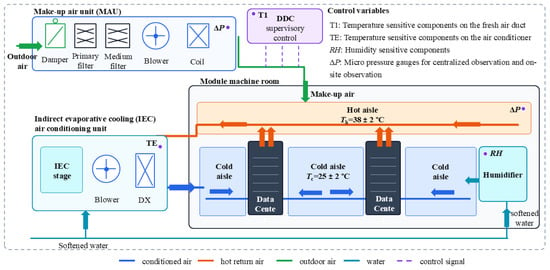
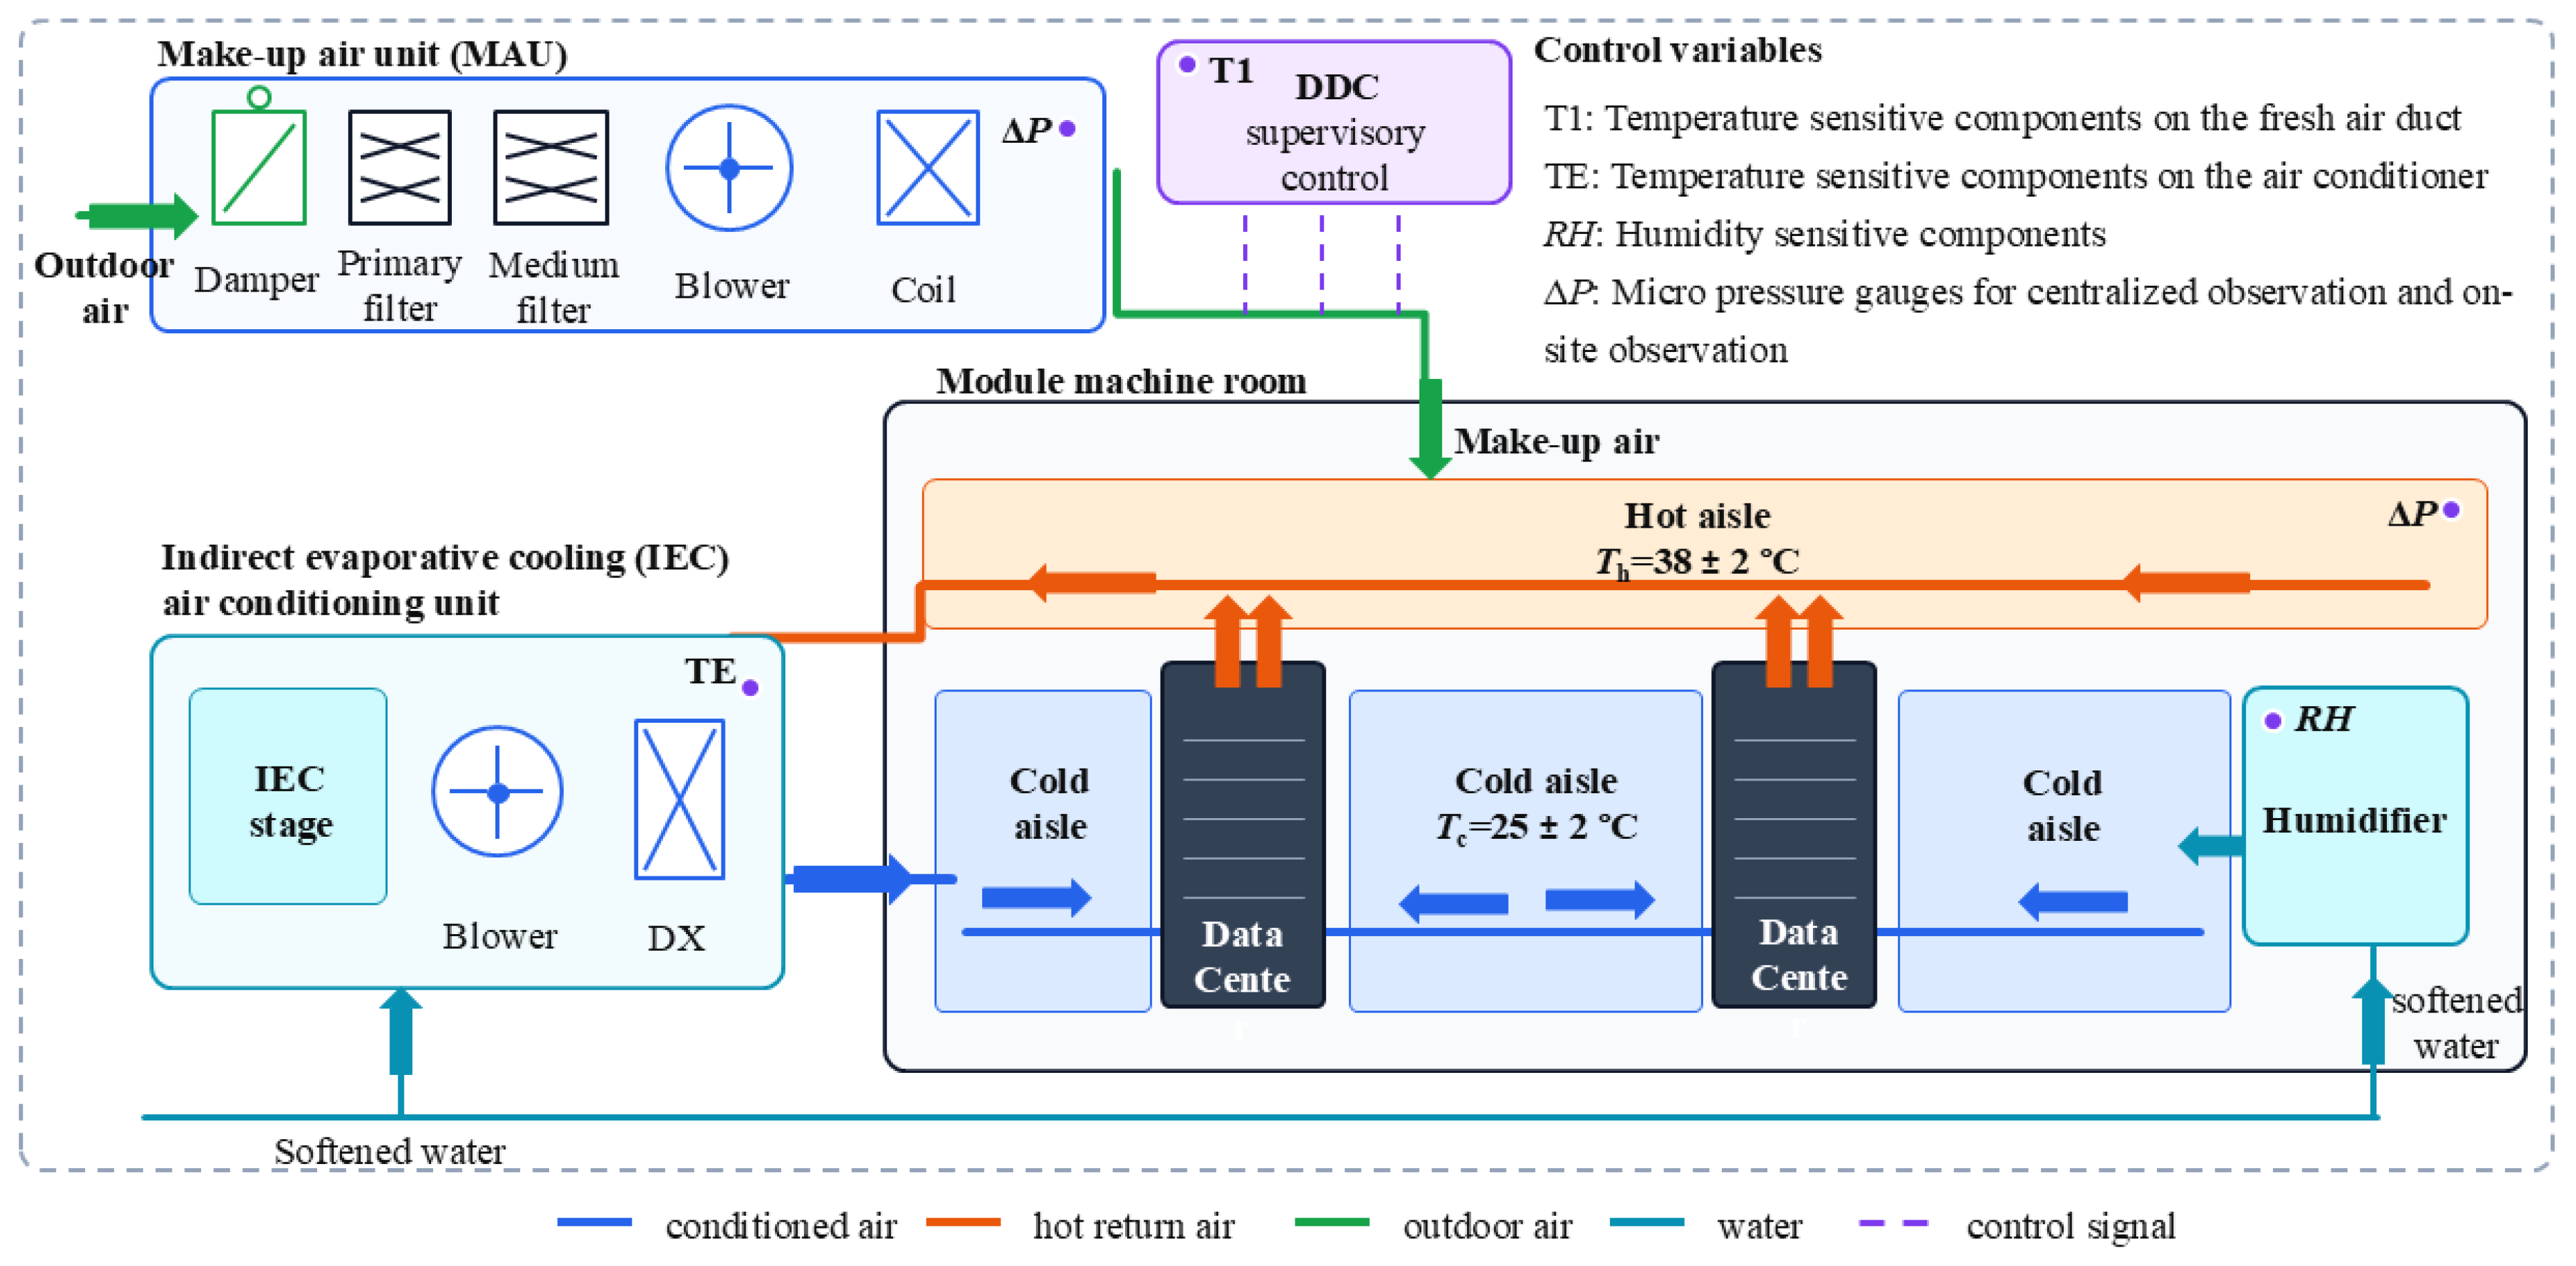
To ensure that the simulation boundary is consistent with the real air path of the engineering system, Figure 1 shows the connection schematic of the indirect evaporative cooling unit, module room, and control system. The outdoor air is cooled by the fresh air treatment unit and indirect evaporative cooling section before being sent into the cold aisle, and the hot air discharged from the server is centrally recovered by the hot aisle. Partial return air and fresh air are mixed according to the set ratio, while the remaining air is discharged outdoors. DDC adjusts the fan and spray branch based on the temperature of the computer room, mixed air status, and load rate. This structure combines the mixing of fresh/return air, indirect evaporative cooling, and the closure of cold channel supply and hot channel return air into an air cycle, resulting in a clear physical correspondence between the supply air volume, fresh/return air ratio, and spray efficiency in subsequent simulations.
Figure 1.
Schematic diagram of the indirect evaporative cooling system and control for the modular data center.
2.2. Construction of Heat and Mass Transfer Model for Evaporative Cooler
An indirect evaporative cooler is the core component that determines the air supply state [26]. To describe its dynamic heat and mass transfer process, an air-side and water-side coupling model was established based on the TRNSYS 18 component library, and the equipment pressure drop, target outlet relative humidity, and spray control signal were used as operating boundaries. It is worth noting that the outlet relative humidity setpoint is distinct from evaporative effectiveness. The former is the specified ratio of water-vapor partial pressure to saturation pressure at the local outlet temperature; a temperature-based effectiveness instead compares the achieved temperature reduction with an explicitly defined reference temperature difference. Consequently, a 90% relative humidity target must not be interpreted as 90% heat-transfer effectiveness or pump efficiency.
When the spray is turned off but there is still airflow passing through, the component keeps the moisture content and enthalpy of the outlet air approximately at the inlet state, and the outlet pressure is obtained by subtracting the equipment pressure drop from the inlet pressure. Thus, the energy exchange of airflow through the device can be expressed as follows [27,28]:
where is the heat gained or lost by the airflow, kJ/h; is air mass flow rate, kg/h; and hAir,In and hAir,Out are the enthalpy values of the inlet and outlet air of the device, respectively, kJ/kg.
When the spray control signal is turned on, the program iterates the outlet dry-bulb temperature under the given outlet pressure and inlet wet bulb temperature conditions until the calculated relative humidity reaches the set value. To avoid describing equipment solely based on empirical efficiency, the heat exchanger is divided into several microelements. Each element satisfies both air sensible heat balance and water vapor mass balance simultaneously, and the air side control equations can be expressed as follows [29,30]:
where Ga is the airflow rate, kg/s; cpa is the specific heat of air at constant pressure, kJ/(kg·K); ta and tw are, respectively, air and water temperature, °C; A is the heat exchange area, m2; and ωa and ωwa are the saturated moisture content at air humidity and water film temperature, respectively, kg/kg.
Gacpadta = −KsdA(tw − ta)
Gadωa = −KddA(ωwa − ωa)
In the active evaporation stage, the temperature difference between the water film and the air drives sensible heat exchange, while the difference between the saturated moisture content and the air moisture content drives mass exchange. After the iterative convergence of the export state, the components synchronously calculate the heat transfer, spray water consumption, and equipment power so as to maintain the conservation of temperature response and water and electricity consumption at the same time step. The energy change on the water side is determined by both sensible heat transfer and latent heat of evaporation, which can be expressed as follows [31,32]:
where Gw is the water quality flow rate, kg/s; cpw is the specific heat of water at constant pressure, kJ/(kg·K); and r0 is the latent heat of vaporization of water, kJ/kg. The water consumption reported in this study is the spray makeup water determined by this evaporative mass balance, i.e., net evaporation; blowdown (used to control dissolved solids and the scaling noted in the Introduction) and drift are not separately modeled, so the actual site makeup water may exceed the reported values where blowdown is required.
Gwcpwdtw = KsdA(ta − tw) + KddA(ωa − ωwa)
To facilitate solving in annual dynamic calculations, discretize continuous differential equations into difference form [33,34]:
where n is the number of discrete meshes in the countercurrent heat transfer model, and i is the mesh number. In this work, n = 100; doubling n to 200 in trial calculations changed the converged outlet temperature by less than 1%, so this mesh density is retained.
The entrance, exit, and adjacent grid boundaries of process 1 can be represented as follows [35]:
ta,n = ta,bout
ωa,n = ωa,in
The boundary conditions of process 2 can be expressed as follows:
ta,n = ta,bout
ωa,n = ωa,in
tw,1 = tw,bout
When stopping the self-circulating pump in winter, process 1 uses the following boundary conditions to distinguish between non-spray circulation and active evaporation conditions:
where ta,bout is the outlet air temperature of the air–water heat exchanger, °C; ωa,in is the moisture content at the air inlet, kg/kg; Gws and Gwb are the water flow rates of the user side and the air–water heat exchanger, respectively, kg/s; and tw,r and tw,bout are, respectively, the return water temperature and the outlet water temperature of the heat exchanger, °C.
ta,n = ta,bout
ωa,n = ωa,in
tw,1 = tw,r
2.3. Load Calculation Study and Simulation Methodology for Evaporative Cooling Systems
The study object is a modular data center located in the cold northern region of Hebei Province. The first floor of the building has a height of 7.0 m, the second floor has a height of 5.6 m, the structure of the computer room area has a lowered slab of 1.0 m, and the lowest elevation of the starting point of the third floor structure is 4.2 m. Based on the building layout, functional zoning, and HVAC design, the main module computer room on the first floor is selected as a typical object. The server density in this area is high, and the air treatment paths and control boundaries are clear, making it suitable for analyzing the coupling relationship between annual load and indirect evaporative cooling parameters. Table 1 and Table 2 provide thermal parameters for external doors, windows, and enclosure structures, respectively. Table 3 lists the design conditions for module rooms and cooling equipment. It is worth noting that the 3837.28 m3/h entry is a dimensional outdoor-air design value, whereas the 0.80–0.90 parameter is a dimensionless mixing setting. They should not be equated. The cooling equipment adopts a 9 + 3 redundant configuration (nine operating units and three standby units, twelve units in total), and the server uses a coefficient of 1.0 simultaneously. Dispersed air supply and grille vents are used on both sides of the computer room to organize cold air, thereby reducing the interference of local uneven air supply on the boundary of the system-level model.
Table 1.
Thermal conductivity and related parameters of external doors and windows.
Table 2.
Thermal conductivity and related parameters of external enclosure structures.
Table 3.
Design Parameters of a Modular Computer Room.
To distinguish between continuous heat dissipation of servers and disturbances to the external enclosure structure, DeST is used to estimate the annual room cooling load, whose reported seasonal variation is small relative to the server heat load. The envelope parameters in Table 4 is retained as boundary condition information rather than treated as a separate performance result. Load rates of 0.5, 0.6, 0.7, and 1.0 are considered in the operating comparison.
Table 4.
Specific Load Values of a Module Room.
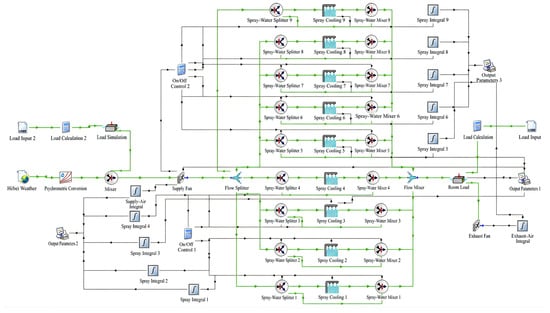
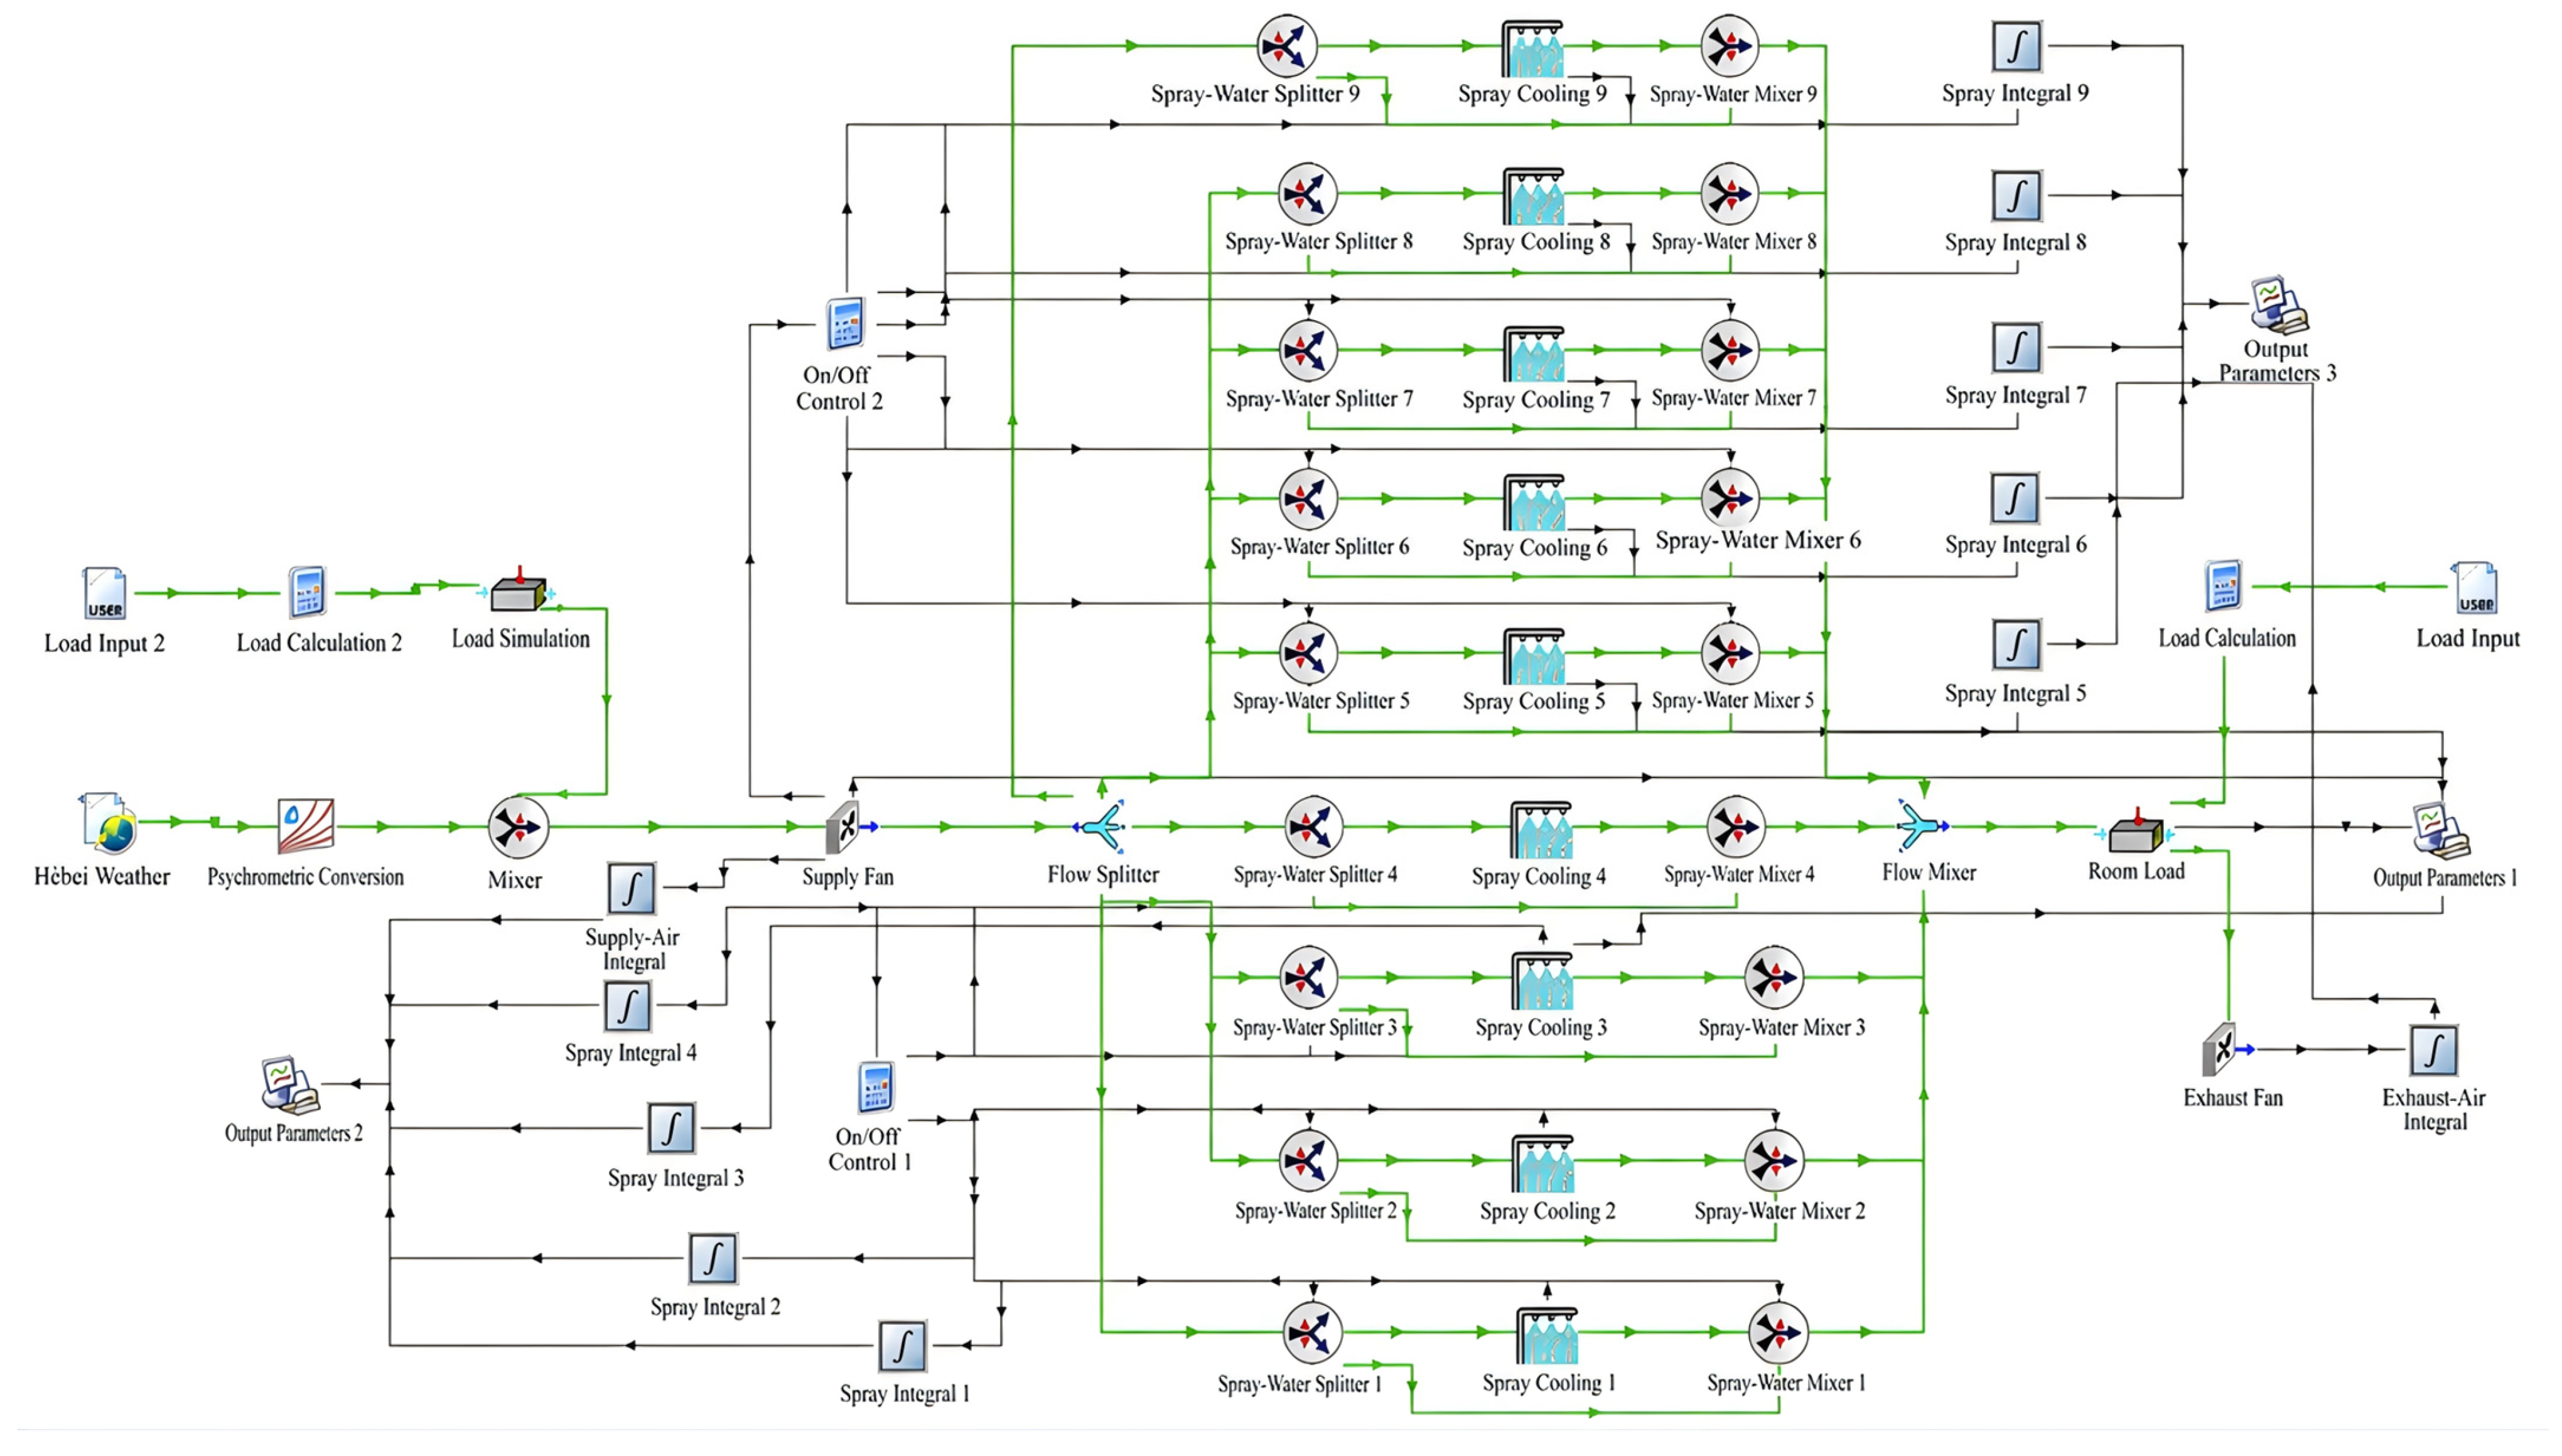
To quantify the annual temperature, water consumption, and power consumption response of the system, a dynamic model is constructed using TRNSYS 18 and the TESS component library, as shown in Figure 2. Specifically, a representative branch can be followed from the supply fan through the flow splitter, spray/bypass path, and branch mixer to the common outlet and room-load component. This pattern is repeated across nine operating branches. The weather, load rate, and equipment parameters are inputted at each time step, and each component completes airflow distribution, evaporative cooling, merging, and indoor sensible heat balance in sequence. The calculation time step is 30 min, the output is averaged over 1 h, and the annual power and water consumption are obtained by integrating 8760 h. Table 5 lists the main components and parameters. The operation steps are as follows: when calculating, the meteorological file first provides hourly outdoor dry-bulb temperature and moisture content in the Hebei region. After passing through the fan, the air supply is distributed to nine parallel spray branches, and the control signal determines whether each branch is in a bypass or spray state based on the air temperature. The processed airflow converges at the combiner and enters the air load component, where it balances energy with the sensible heat load and returns to indoor temperature and humidity. The distinction between the system concept and its numerical implementation is important. Standard TESS Type507 is a controlled direct evaporative device. Its presence alone does not represent the separation of dry primary air from wetted secondary air required for indirect evaporative cooling. The weather input is identified as a Hebei TMY-2 file, with a 0.5 h calculation step and hourly reported outputs over 8760 h. A typical-year calculation represents that input sequence rather than a worst-case weather envelope. Type9e reads the load input, Type693 imposes a load on an air stream, and Type24 integrates selected outputs. It should be clarified that the annual electricity consumption reported throughout this paper denotes the cooling system electricity only, namely the supply/exhaust fans (Type642) and the spray water circulation pump. It does not include the IT equipment power, which is prescribed by the Type9e load file and imposed on the air stream by Type693. With a nameplate IT power of 2304 kW, the annual IT energy that serves as the denominator of PUE, WUE, and CUE is load rate × 2304 kW × 8760 h, equal to 1.01 × 10⁷, 1.21 × 10⁷, 1.41 × 10⁷, and 2.02 × 10⁷ kWh at load rates of 0.5, 0.6, 0.7, and 1.0, respectively.
Figure 2.
Dynamic simulation model of evaporative cooling system based on TRNSYS18.
Table 5.
Key Equipment and Main Parameters in the New System Simulation Model.
Within each annual comparison, fixed nominal airflow, mixing ratio, and spray settings do not prescribe a constant outdoor or room temperature. Hourly weather inputs are supplied to the model, temperature-based control signals select spray or bypass operation, and the evaporative component calculates its outlet state subject to the relative humidity target. The reported room temperature is a system-level output of the imposed load air stream balance. It does not independently validate spatial room-temperature uniformity or the transient thermal response of the room.
2.4. Model Validation
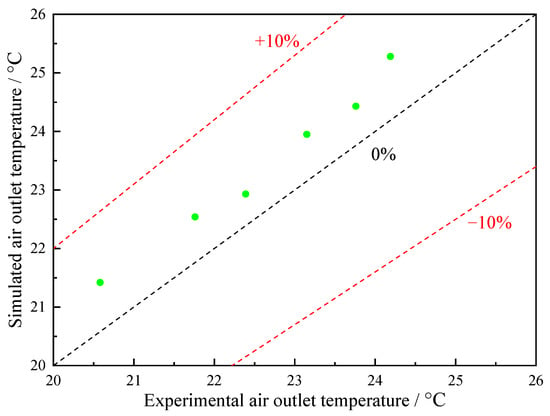
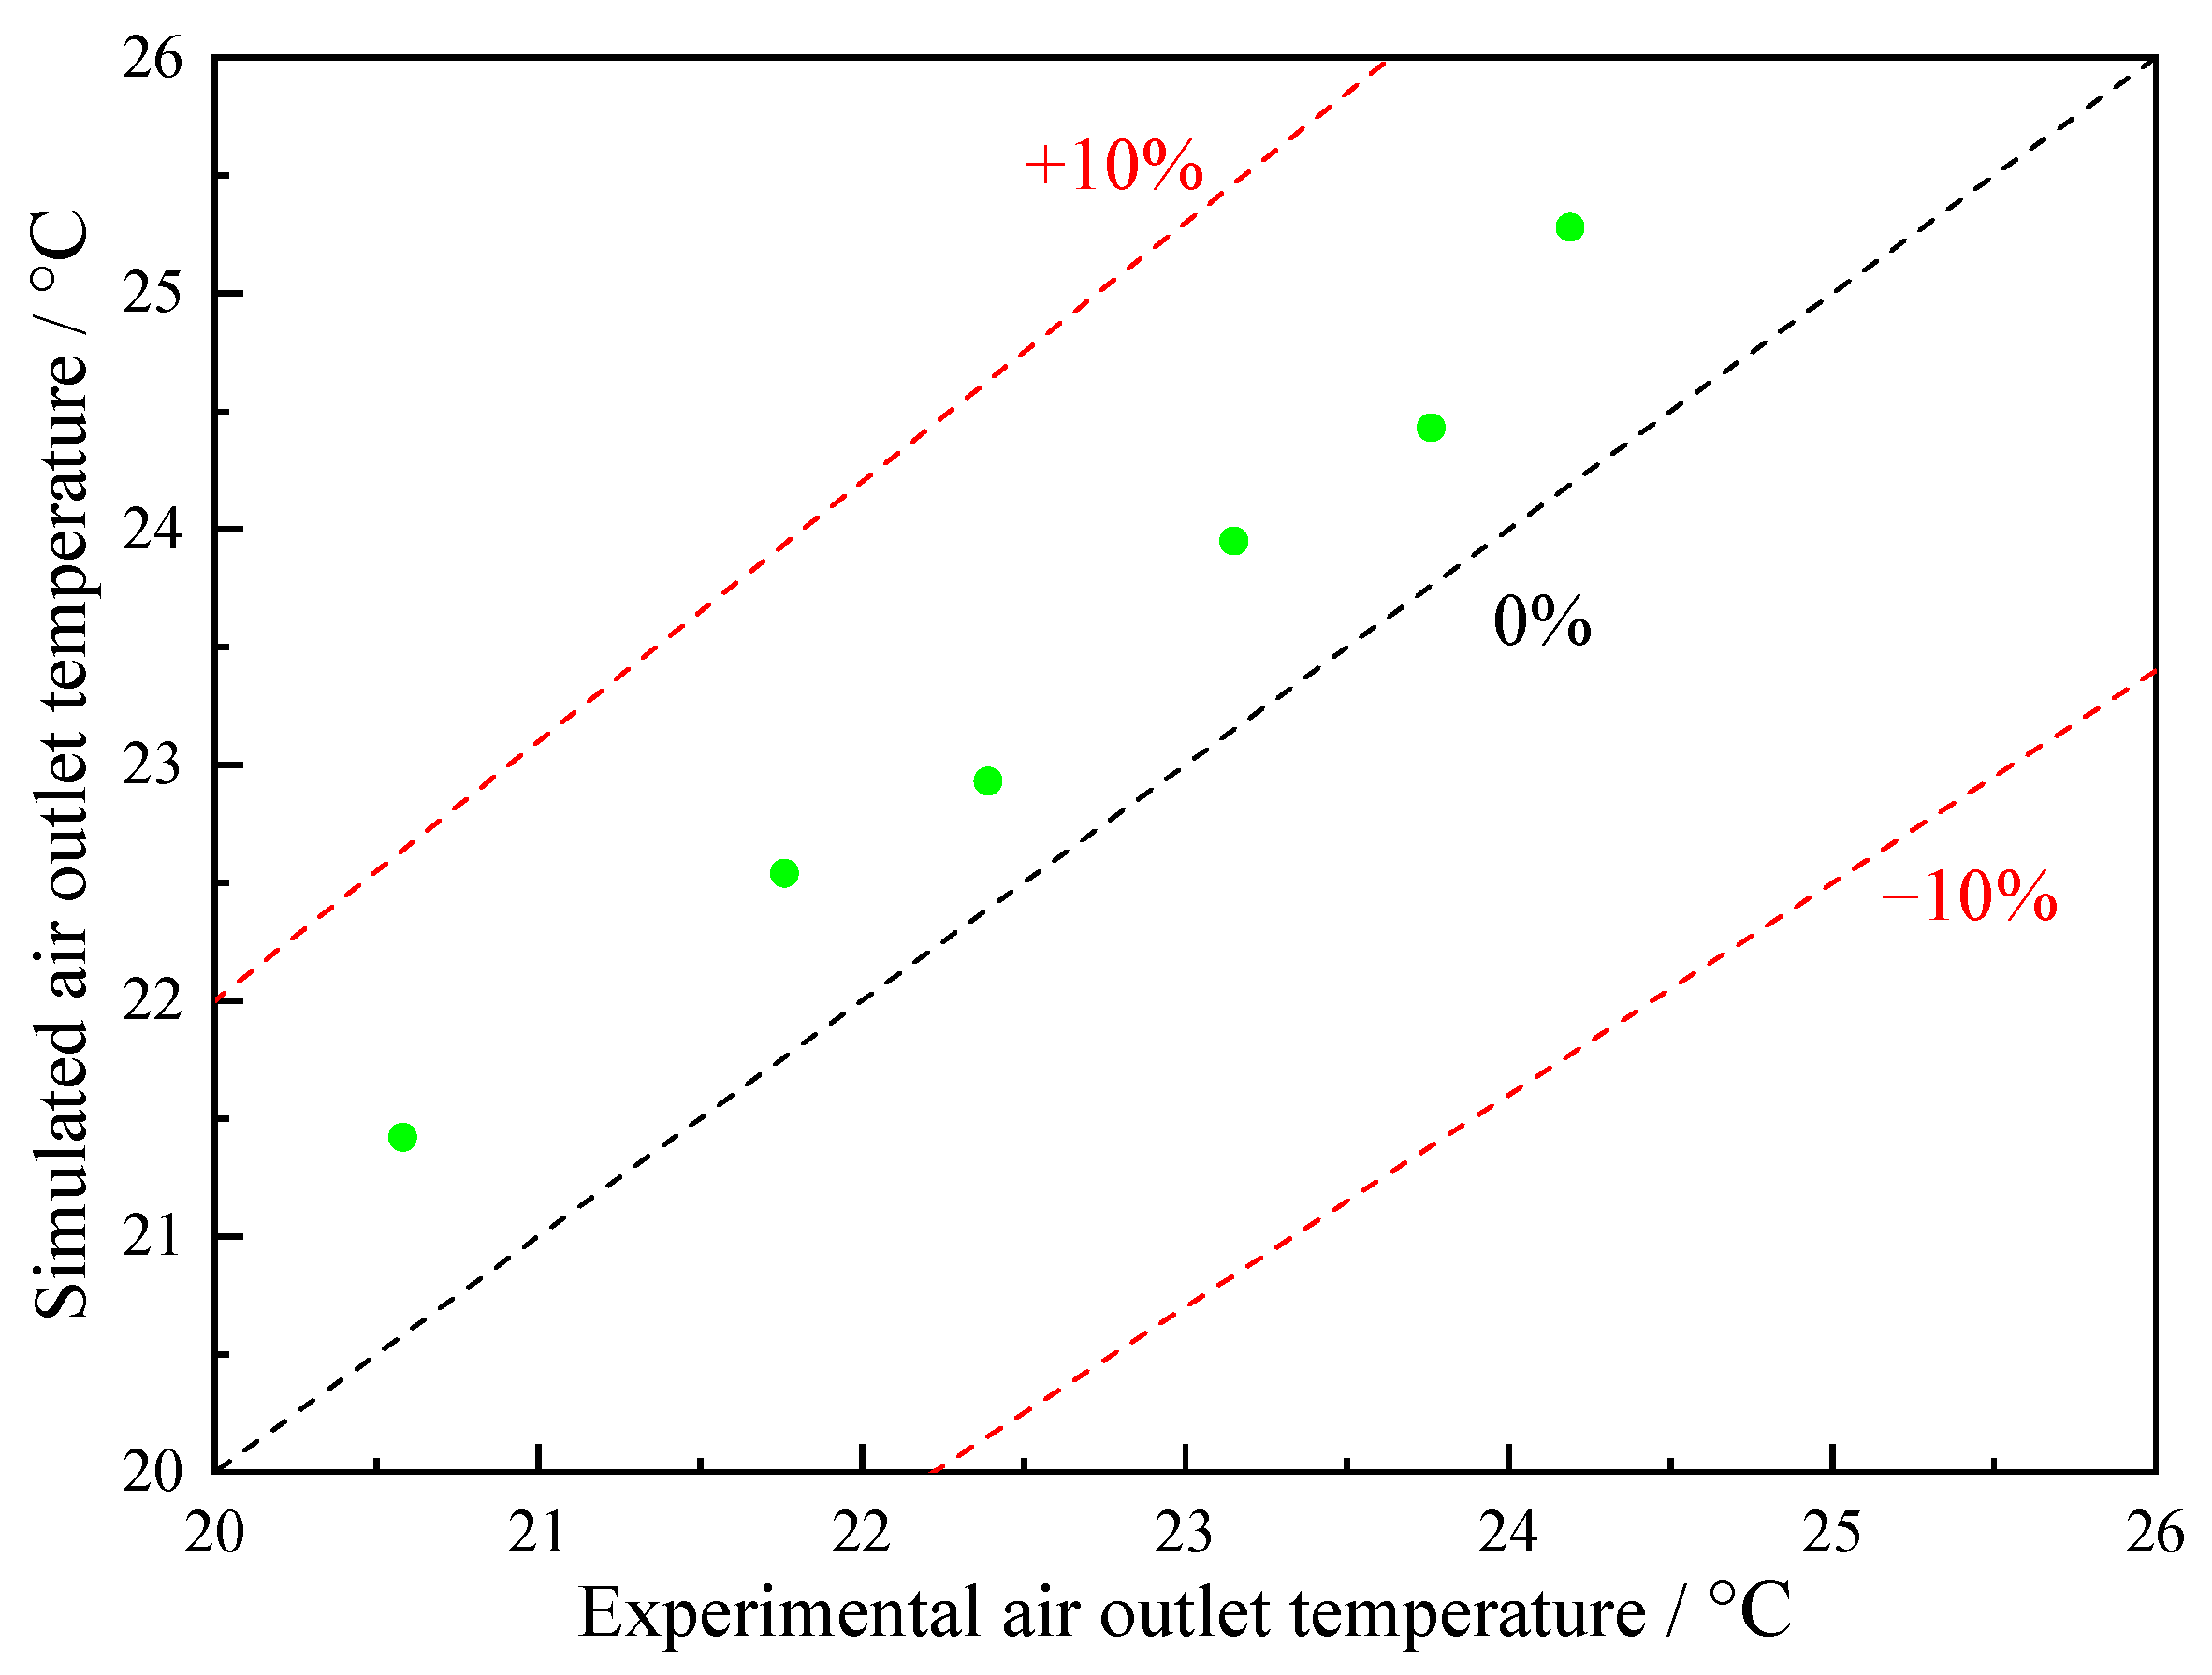
To confirm that the model can reproduce the outlet air state of the evaporative cooler, independent verification is conducted using the experimental conditions given in reference [36], and the boundary parameters are shown in Table 6. Figure 3 compares the experimental outlet temperature with the simulated value within the range of 20.6–24.2 °C for the imported dry-bulb temperature. All data points are within the ±10% error band, with a maximum relative deviation of 4.5%, and no expansion of error with increasing inlet temperature is observed. It should be noted that this 4.5% accuracy is demonstrated only over the validated 20.6–24.2 °C range, whereas the annual simulation includes pre-cooling inlet temperatures as high as 32.8–34.0 °C. The model is nevertheless built from the first-principles heat- and mass-balance equations (Equations (2)–(7)), whose coefficients are thermodynamic properties (specific heat, latent heat, and the saturation-humidity relation) rather than constants fitted over the validation band, and the outlet RH iteration is always bounded by the local saturation curve. Raising the inlet temperature therefore changes the magnitude of the handled load and the converged state, but not the governing equations. Therefore, the validated component model is used for system-level annual calculations, with its valid range made explicit.
Table 6.
Model Verification Conditions for Evaporative Coolers.
Figure 3.
Error between experimental air outlet temperature and simulated air outlet temperature at different inlet dry-bulb temperatures.
3. System Performance Evaluation Method
To distinguish the boundary of equipment selection from conventional operation optimization, a two-stage analysis is used for simulation. The evaluation of each stage uses continuous single-parameter scans and then evaluates the selected combination. Under full load (load rate 1.0), airflow is first varied at a fresh/return air ratio of 0.80 and a spray setting of 90.0% (Figure 4). Then, the ratio is varied at 2.1 × 10⁵ kg/h airflow and 90.0% spray (Figure 5), followed by the spray setting at 2.1 × 10⁵ kg/h airflow and a ratio of 0.80 (Figure 6). Each scan holds the other two nominal settings fixed. Figure 7 evaluates the selected full-load combination over the annual sequence. Section 4.2.2, Section 4.2.3 and Section 4.2.4 compare individual operating parameters at a load rate of 0.6, and Table 7 summarizes the candidate combinations at the tested loads. This design separates the observed thermal and resource use responses to support a practical operating sequence. It does not search the joint parameter space or establish a global or Pareto optimum. Interactions between parameters are not comprehensively quantified. Candidate combinations are screened against a nominal room-temperature upper limit of 27.0 °C. Resource use is compared within the tested candidate combinations subject to this criterion. The reported room temperature is a system-level variable and does not establish the maximum server inlet temperature. PUE (power usage effectiveness), WUE (water usage effectiveness), and CUE (carbon usage effectiveness) are defined below [37,38]:
Figure 4.
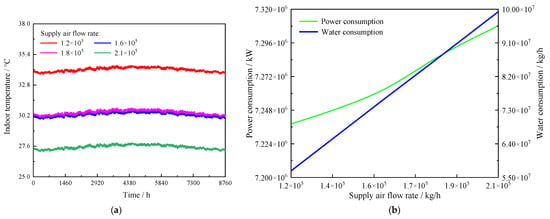
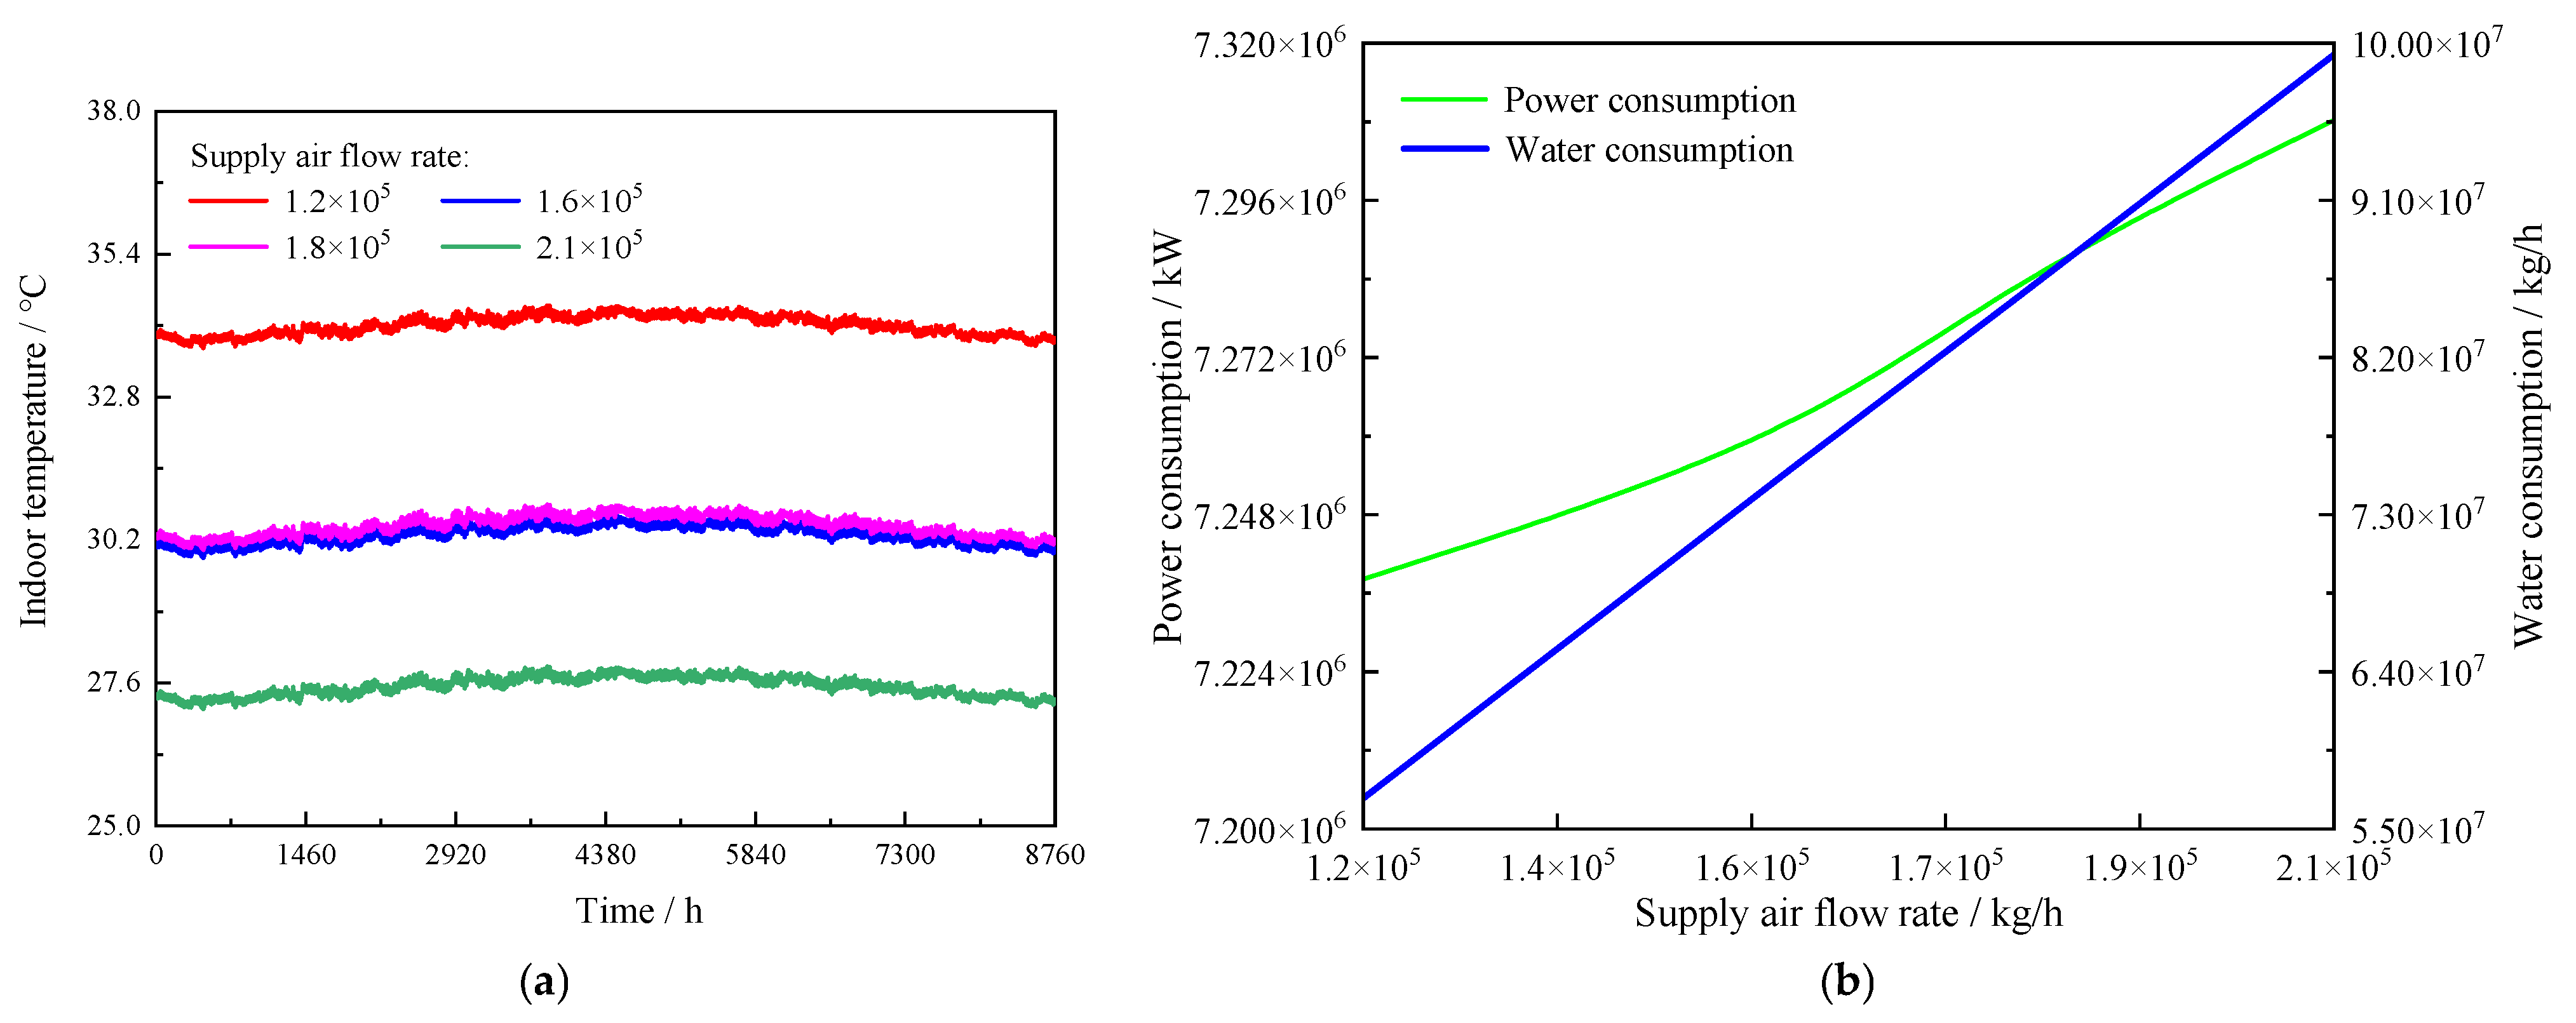
The changes in key response parameters within the system under different air supply flow rates. (a) Annual temperature; (b) annual electricity and water consumption.
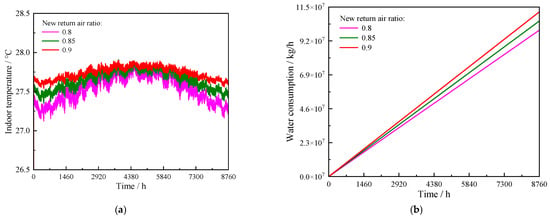
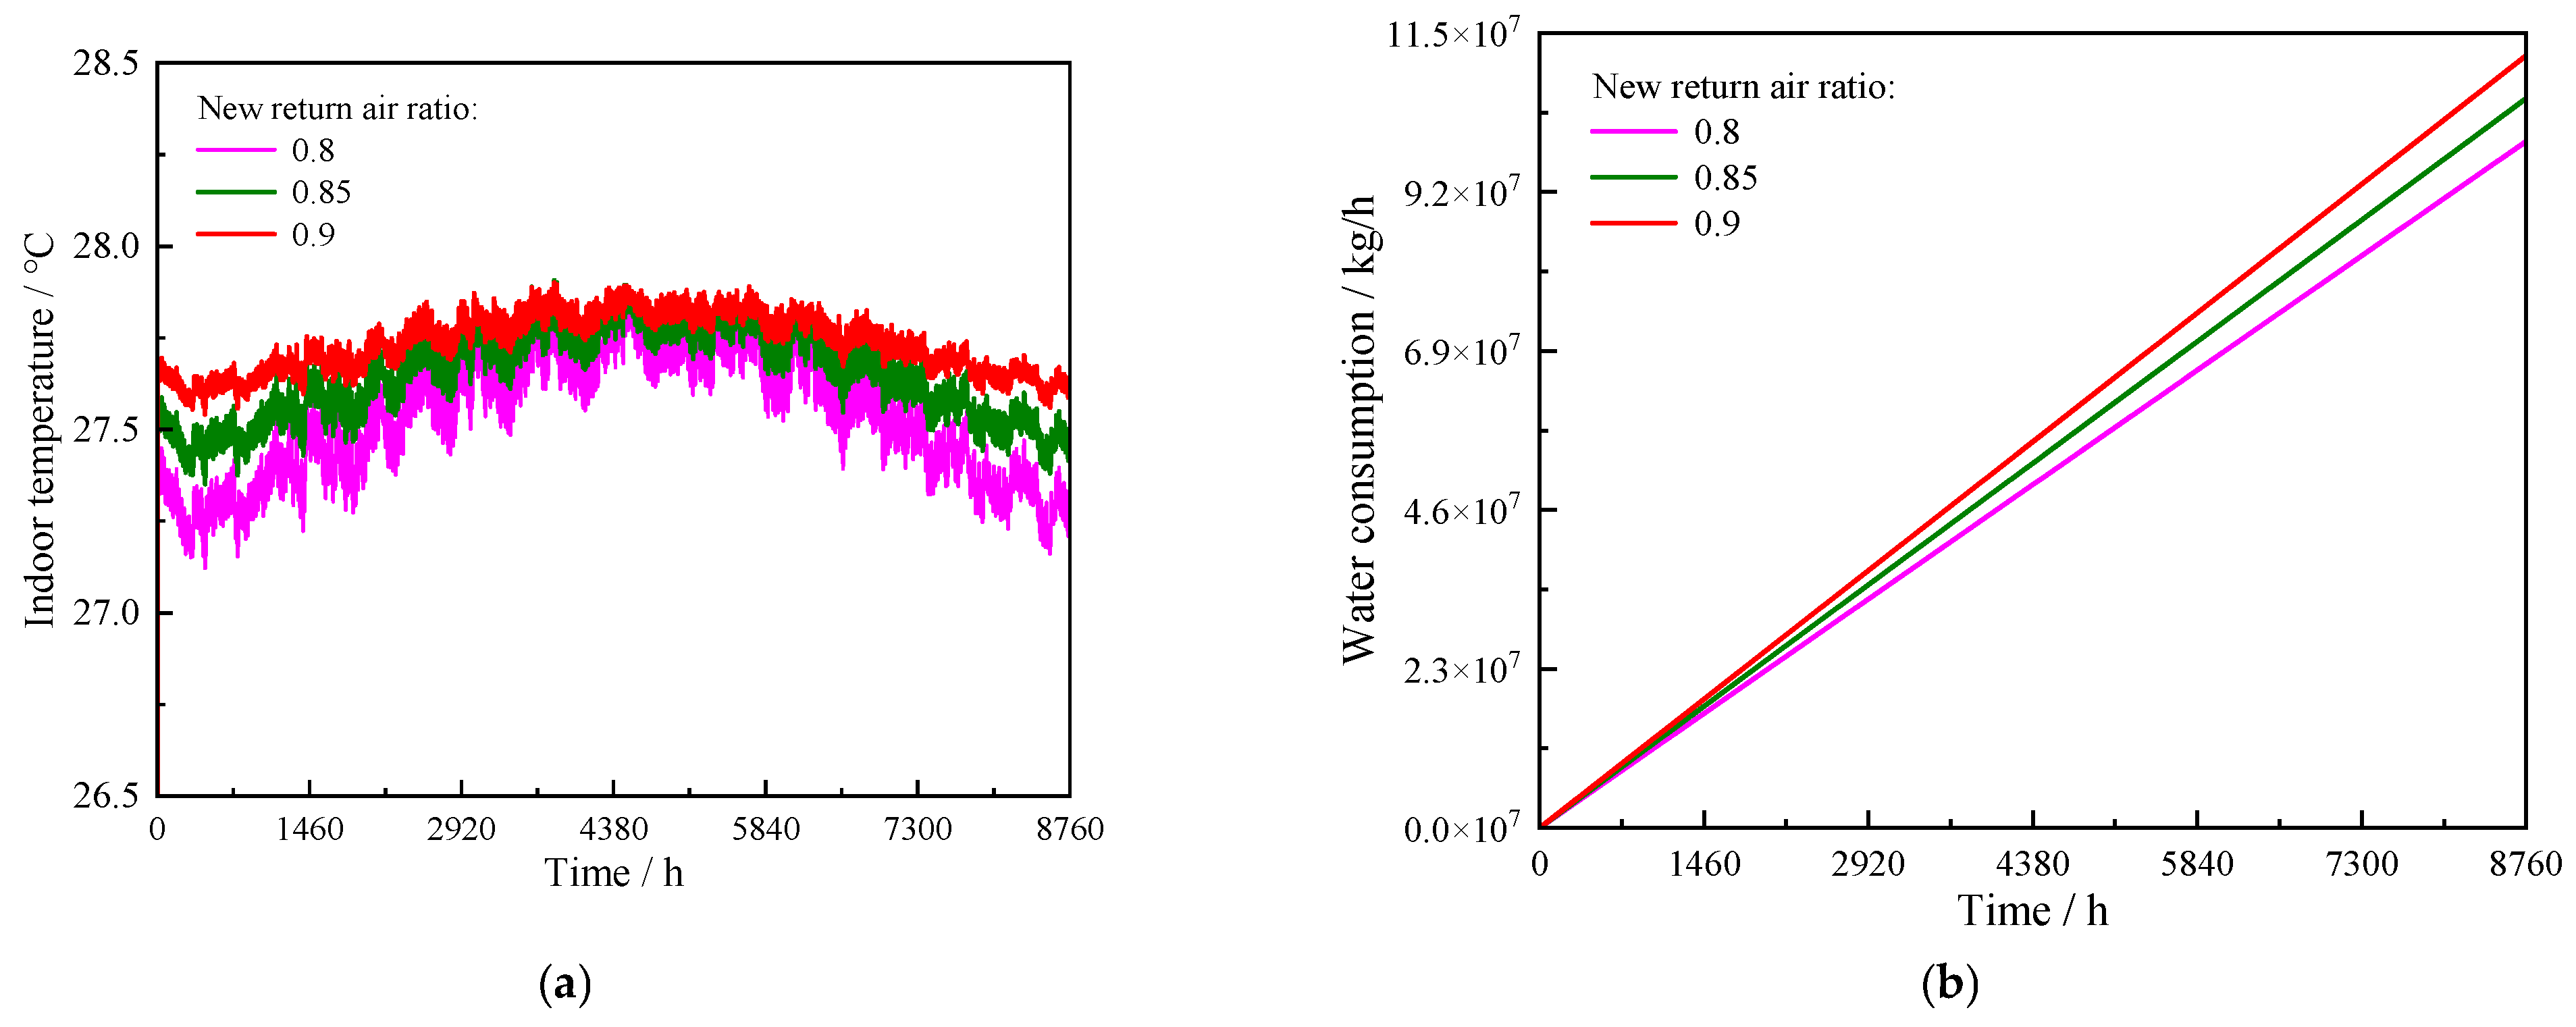
Figure 5.
The changes in key response parameters within the system under different fresh/return air ratios. (a) Annual temperature; (b) annual water consumption.
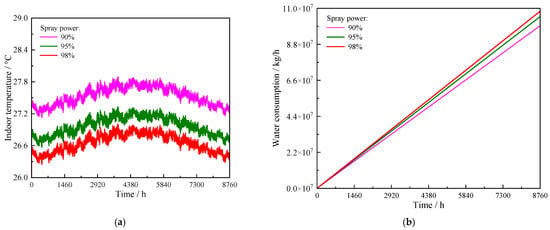
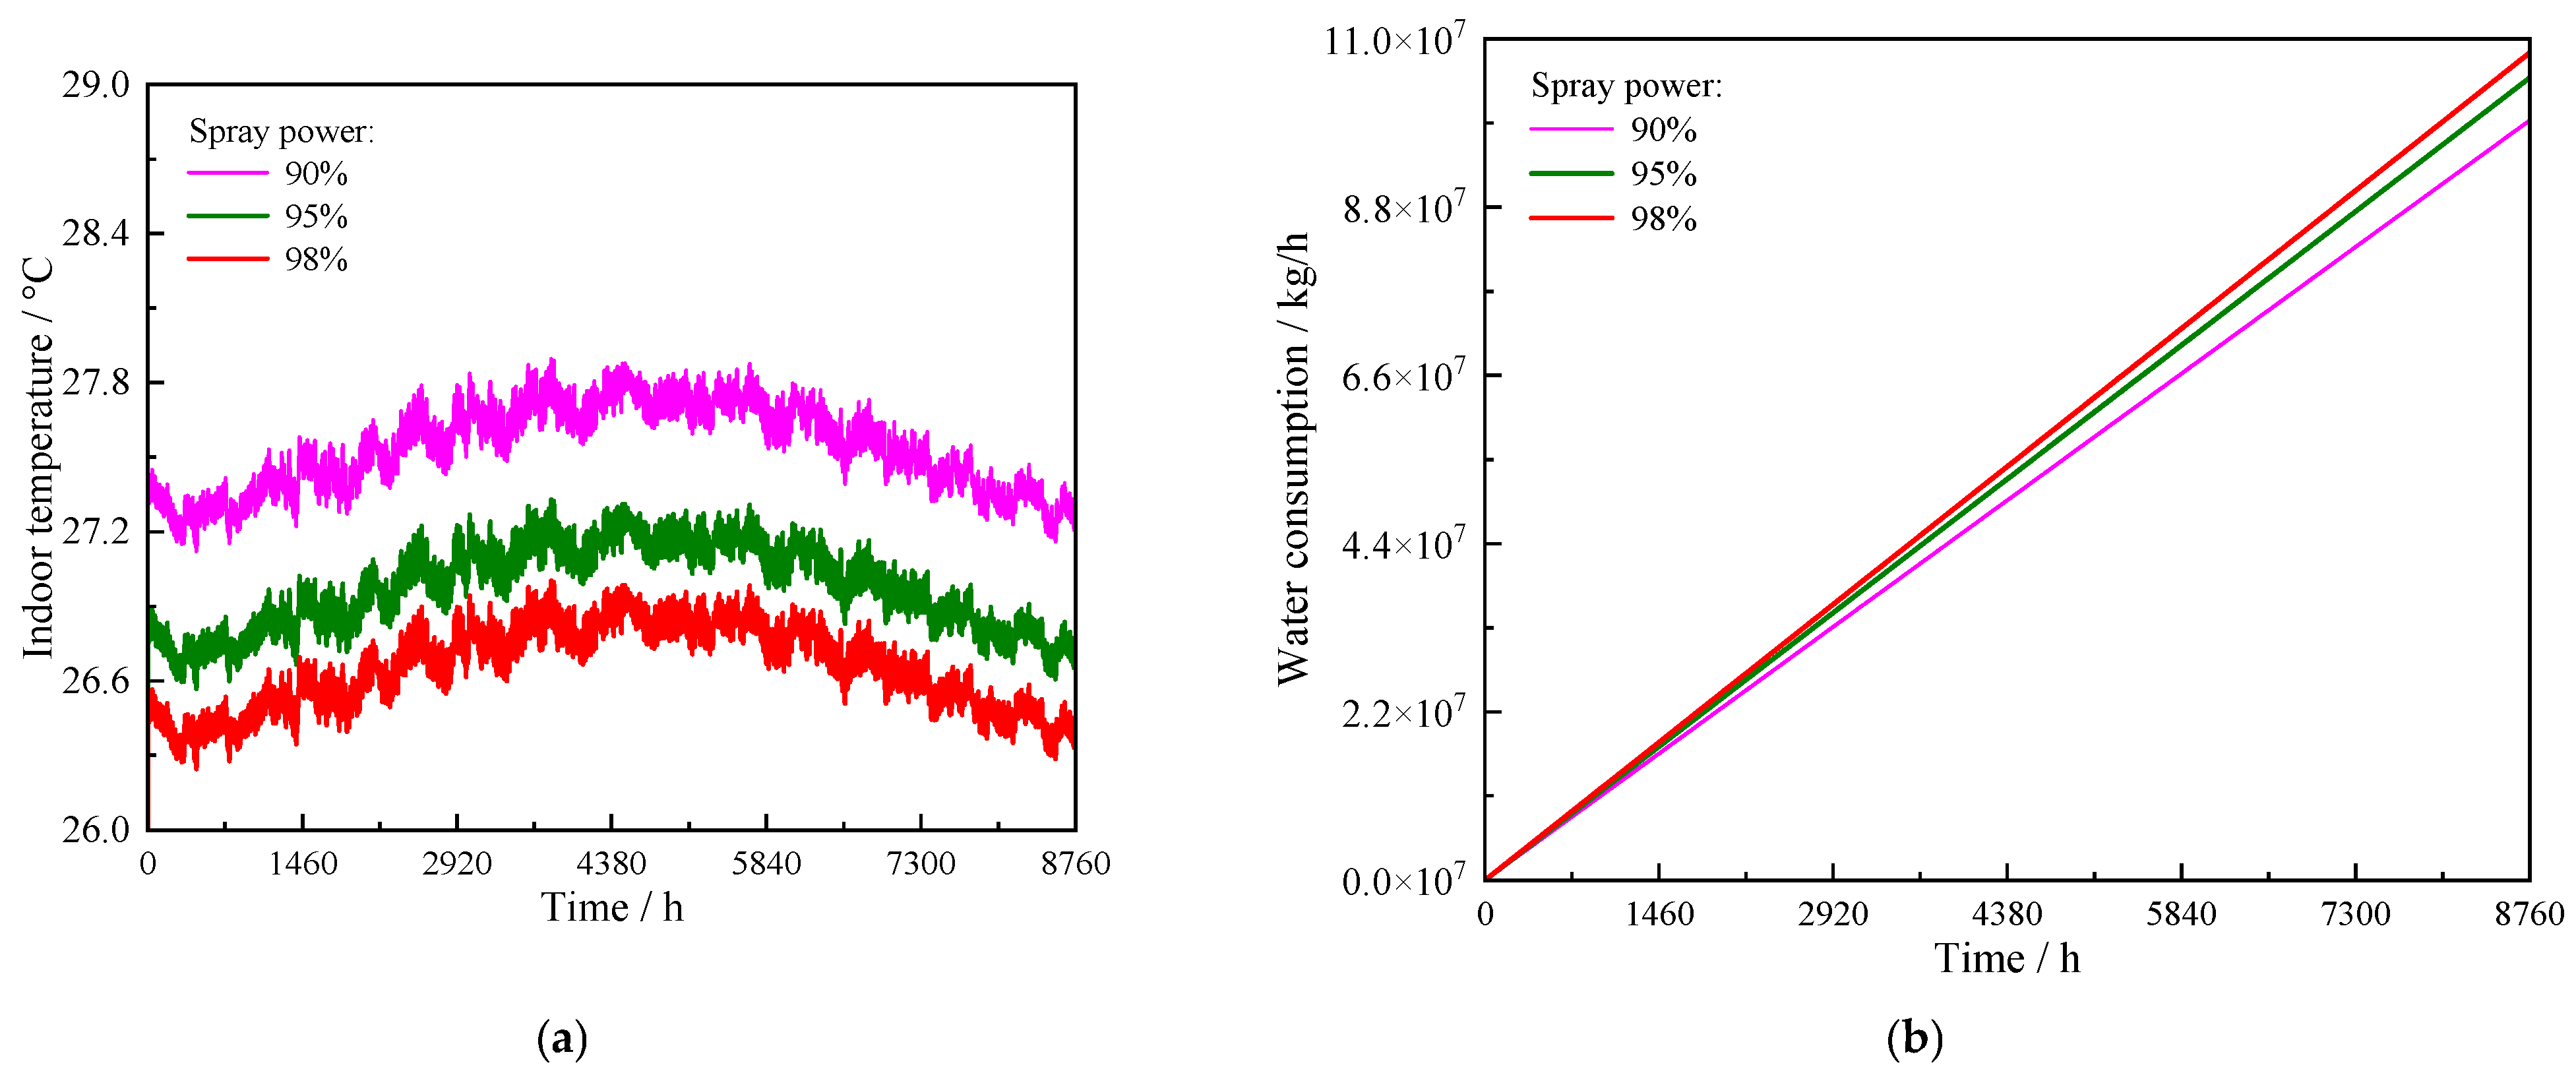
Figure 6.
The changes in key response parameters within the system under different spray efficiencies. (a) Annual temperature; (b) annual water consumption.
Figure 7.
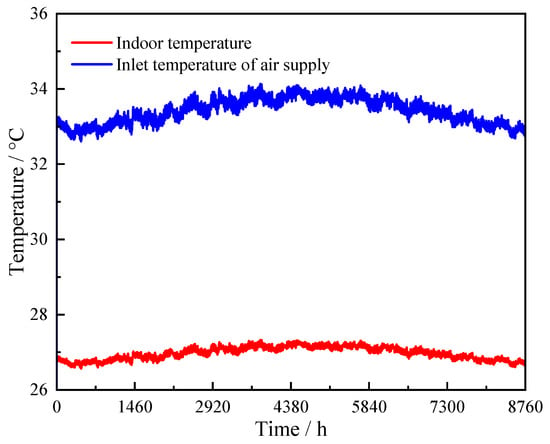
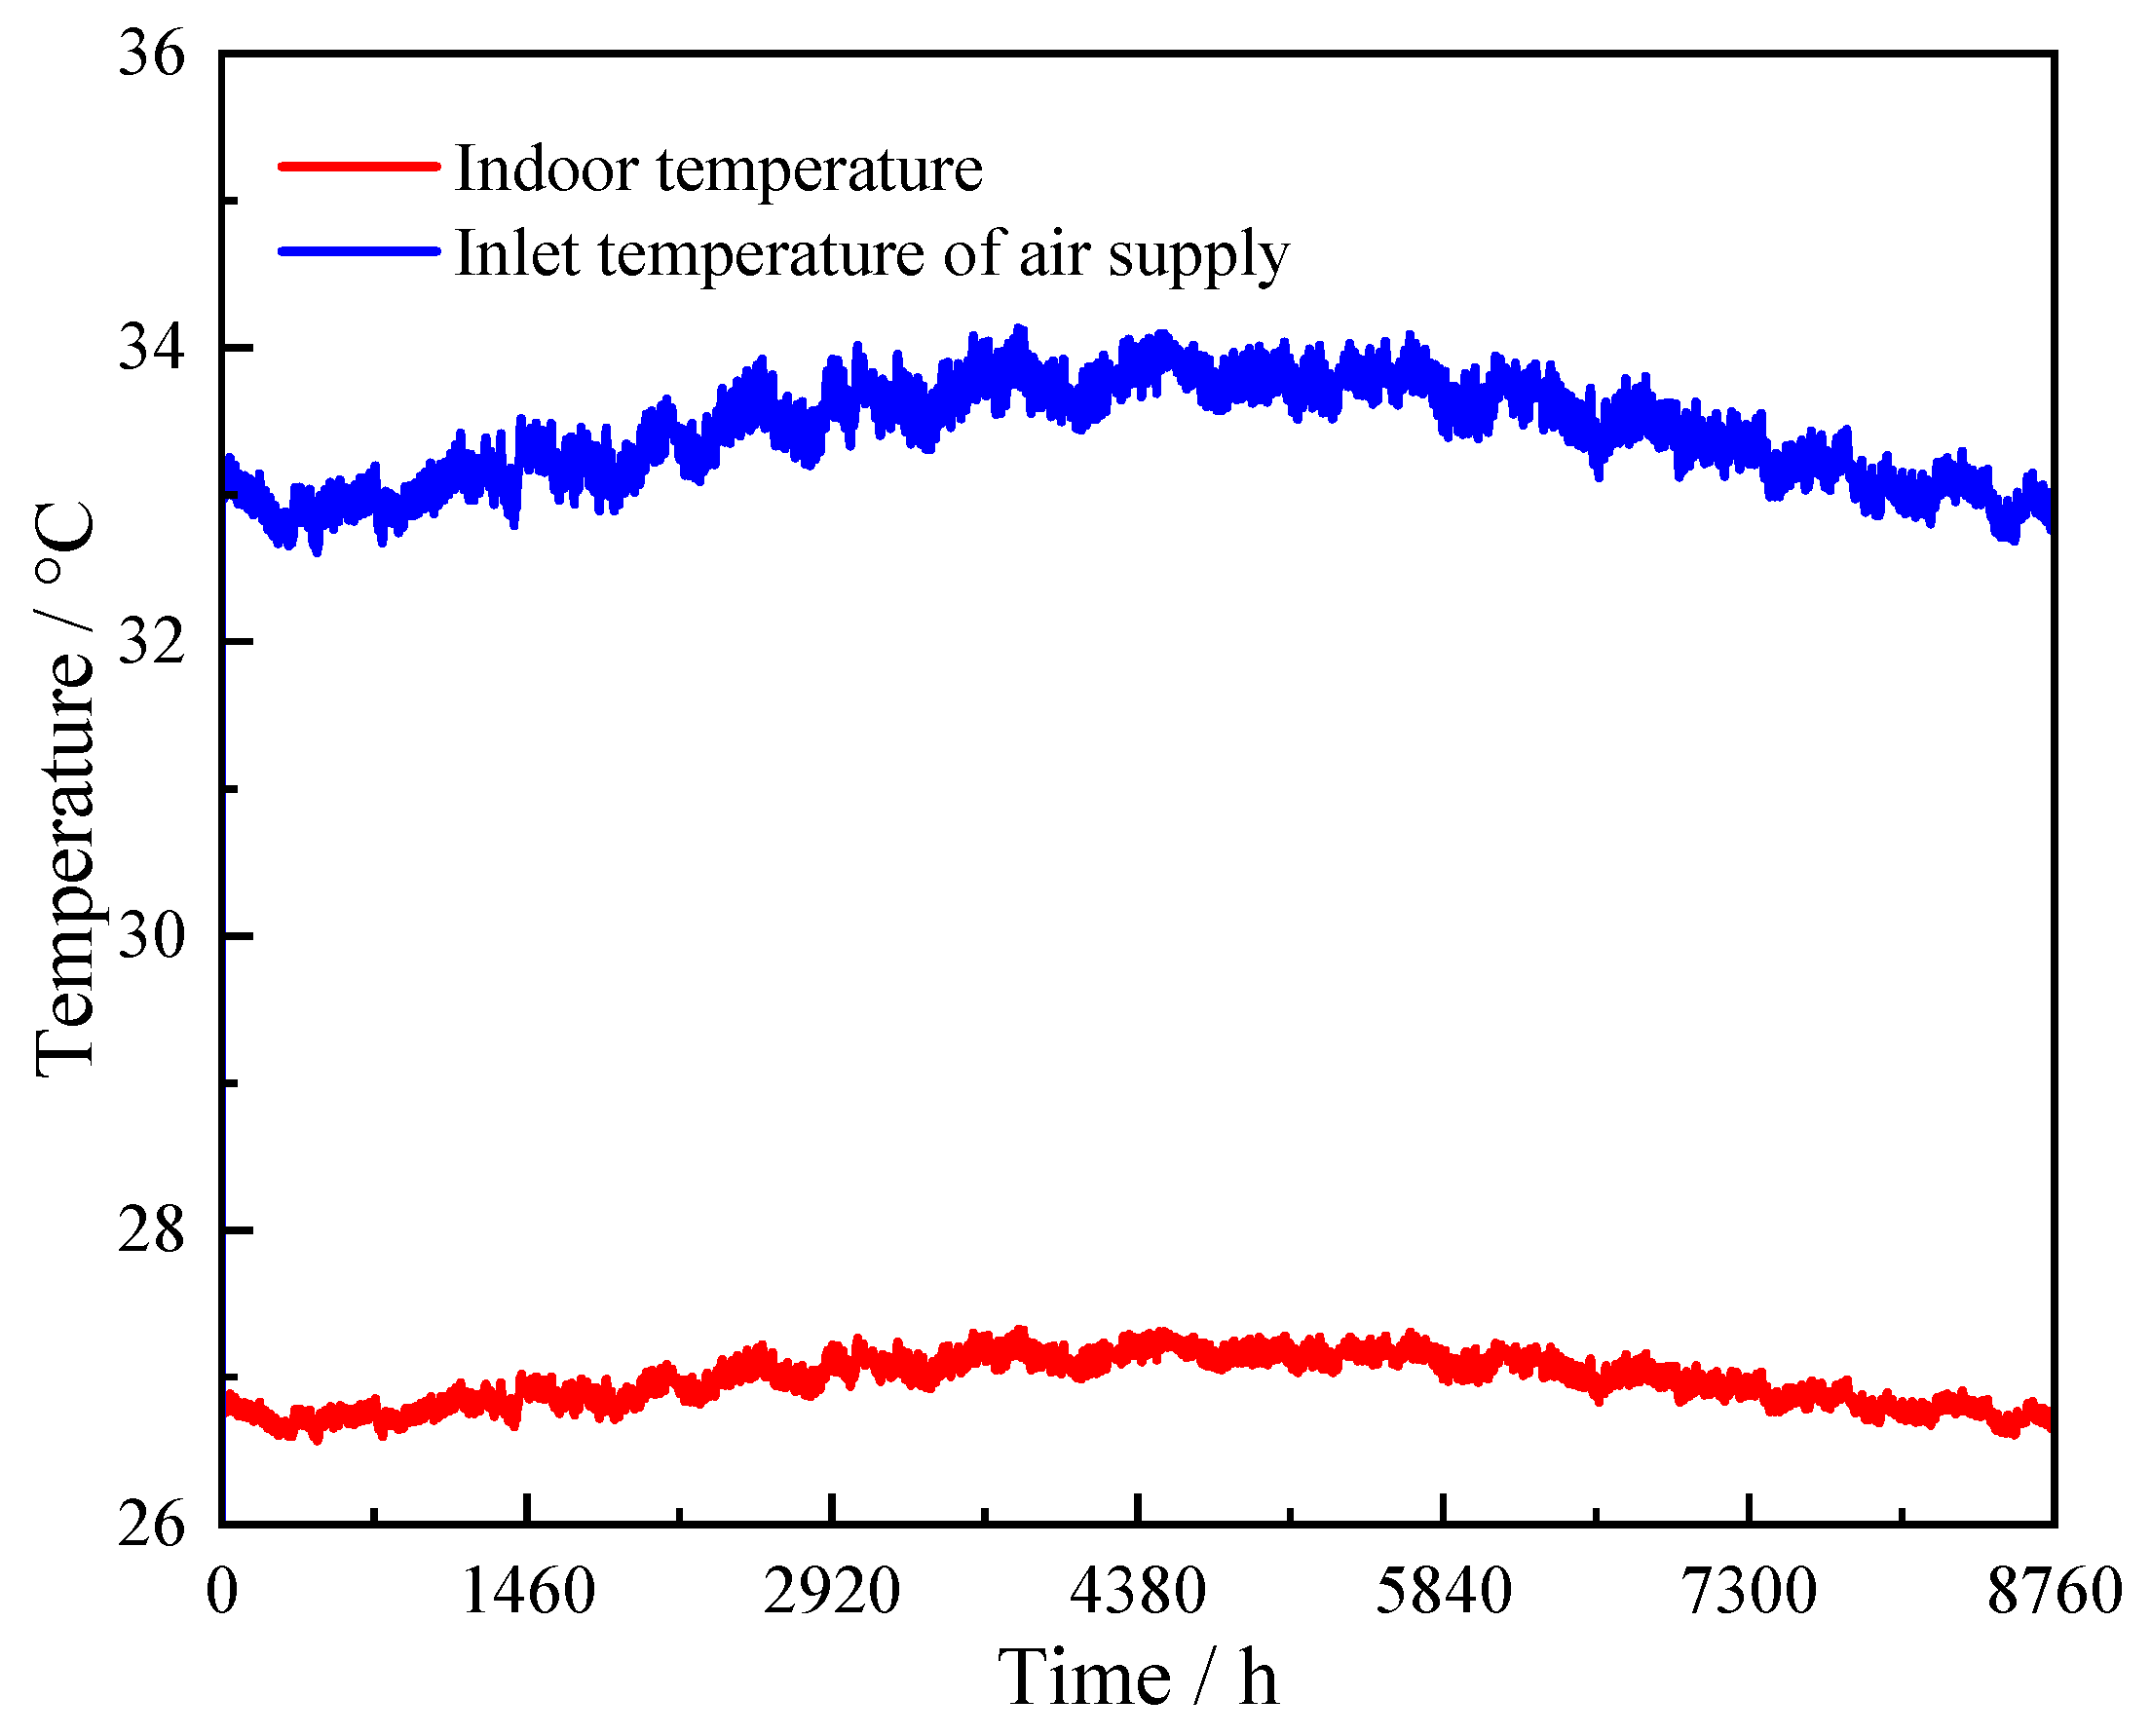
Indoor and supply air inlet temperature regulation throughout the year under non-optimized full load rates.
Table 7.
Control parameters and annual energy consumption under different load rates.
- PUE: It is an indicator for evaluating the energy efficiency of data centers, which is the ratio of all energy consumed by data centers to the energy consumed by IT loads. PUE = total energy consumption of data center/IT equipment energy consumption, where the total energy consumption of the data center includes IT equipment energy consumption and energy consumption of cooling, power distribution, and other systems. Its value is greater than 1, and the closer it is to 1, the less energy consumption of non-IT equipment.
- WUE: It is an indicator for evaluating the water usage status of data centers, defined as the ratio of the annual consumption of water resources in data centers to the annual consumption of IT equipment in data centers (L/kW·h).
- CUE: It refers to the ratio of the total CO2 emissions of a data center to the energy consumption of IT loads (kg/kWh). The smaller the CUE value, the lower the carbon emission intensity of the data center.
4. Results and Discussion
4.1. The Optimal Design Condition Under Full Load Operation
4.1.1. Analysis of the Impact of Control Parameters
To determine the airflow required for thermal safety under full load, the fresh/return air ratio and spray efficiency are fixed at 0.8 and 90.0%, respectively. Supply airflow rates from 1.2 × 10⁵ to 2.1 × 10⁵ kg/h are evaluated. Figure 4a presents the annual room temperature response. It is worth noting that it is a calculated system-level room temperature. Its limited annual variation is conditional on the prescribed heat load, airflow path, and component/control boundaries. The results show that the room temperature decreases continuously from approximately 34.5 to 27.4 °C as the airflow rate increases within the tested range. It is worth noting that the transported heat is the product of the air mass flow rate, air specific heat, and room-to-supply temperature difference for approximately steady sensible exchange. At a given supply temperature and airflow, a higher room temperature therefore increases the heat carried by the air. A stable result above 27.0 °C can represent heat balance at an unacceptable room temperature. These cases fail the selected temperature constraint. The curve alone does not establish an inability to balance the imposed load at any temperature. Figure 4b compares annual electricity and water consumption. Across the same airflow range, annual electricity consumption increases by 1.0%, whereas annual water consumption increases by 74.8%. A plausible explanation is that increasing the air volume enhances the sensible heat transport on the air side but also increases the mass flow of air being treated, which can increase evaporation demand, making the amount of makeup water more sensitive than the total power consumption. Therefore, 2.1 × 10⁵ kg/h is interpreted as the air volume required to approach the thermal safety boundary under current full load operation, rather than the energy-saving optimal value under all loads throughout the year.
To analyze the impact of the fresh/return air ratio on system performance, the supply airflow rate and spray efficiency are fixed at 2.1 × 10⁵ kg/h and 90.0%, respectively. Fresh/return air ratios of 0.80, 0.85, and 0.90 are compared. Figure 5a shows that the annual maximum room temperature remains 27.9 °C when the ratio decreases from 0.90 to 0.80. The annual minimum temperature, however, decreases from 27.5 to 27.1 °C. Therefore, the mixing ratio changes the lower part of the temperature range more than the annual peak under the specified airflow and spray conditions. Figure 5b shows that annual water consumption at ratios of 0.80 and 0.85 is 11.1% and 5.6% lower than that at 0.90, respectively. A lower outdoor-air fraction reduces the mixed-air treatment load and the evaporation required in the cooler. Nevertheless, ratio adjustment alone does not reduce the annual maximum below 27.0 °C. Therefore, a ratio of 0.80 is prioritized to limit water consumption, while the remaining cooling deficit is addressed through spray efficiency adjustment.
To analyze the impact of spray efficiency on system performance, the supply airflow rate and fresh/return air ratio are fixed at 2.1 × 10⁵ kg/h and 0.80. Spray efficiencies of 90.0%, 95.0%, and 98.0% are evaluated. Figure 6a shows that the entire annual room temperature curve shifts downward as spray efficiency increases. The 90.0% case remains above 27.0 °C for a clear part of the year. The 95.0% case approaches the 27.0 °C boundary, while the 98.0% case produces a further temperature reduction. Figure 6b shows the associated water consumption. With the 98.0% case as the reference, annual water consumption decreases by 8.2% at 90.0% and by 3.0% at 95.0%. This is because enhanced spraying can increase the heat and mass transfer intensity between the water film and the air, exchanging more evaporation for lower air supply temperature. Therefore, 95% provides greater cooling capacity than 90%, while avoiding 98% of additional water consumption, and can be used as a routine setting for full load conditions.
4.1.2. Determination of Optimal Design Operating Condition Parameters
To verify the annual feasibility of the selected parameters, Figure 7 presents the temperature response with a supply airflow rate of 2.10 × 10⁵ kg/h, a fresh/return air ratio of 0.80, and a spray efficiency of 95.0%. The inlet temperature before cooling is 32.8–34.0 °C. The room temperature is maintained between 26.6 and 27.2 °C. This is the predicted temperature response at an inlet condition outside the validation range. This indicates that the system can stably reduce sensible heat load at higher inlet temperatures. The annual maximum remains 0.2 °C above the nominal 27.0 °C limit. Therefore, the selected combination does not satisfy a strict 27.0 °C upper bound and cannot be assigned a positive thermal safety margin. The stated range does not establish exceedance duration or magnitude at individual server inlets. The proposed staging should be interpreted as a candidate operating sequence rather than verified all-year compliance.
4.2. Optimization of Operating Parameters Under Normal Working Conditions
4.2.1. Load Rate
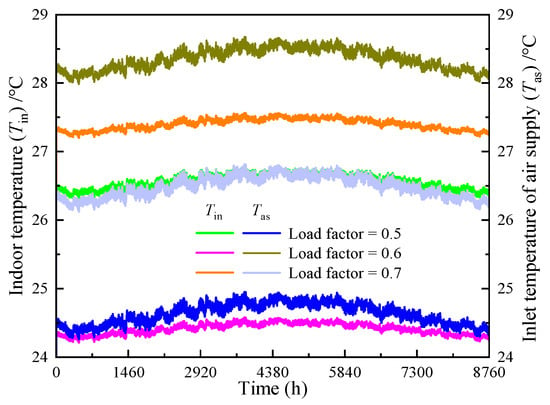
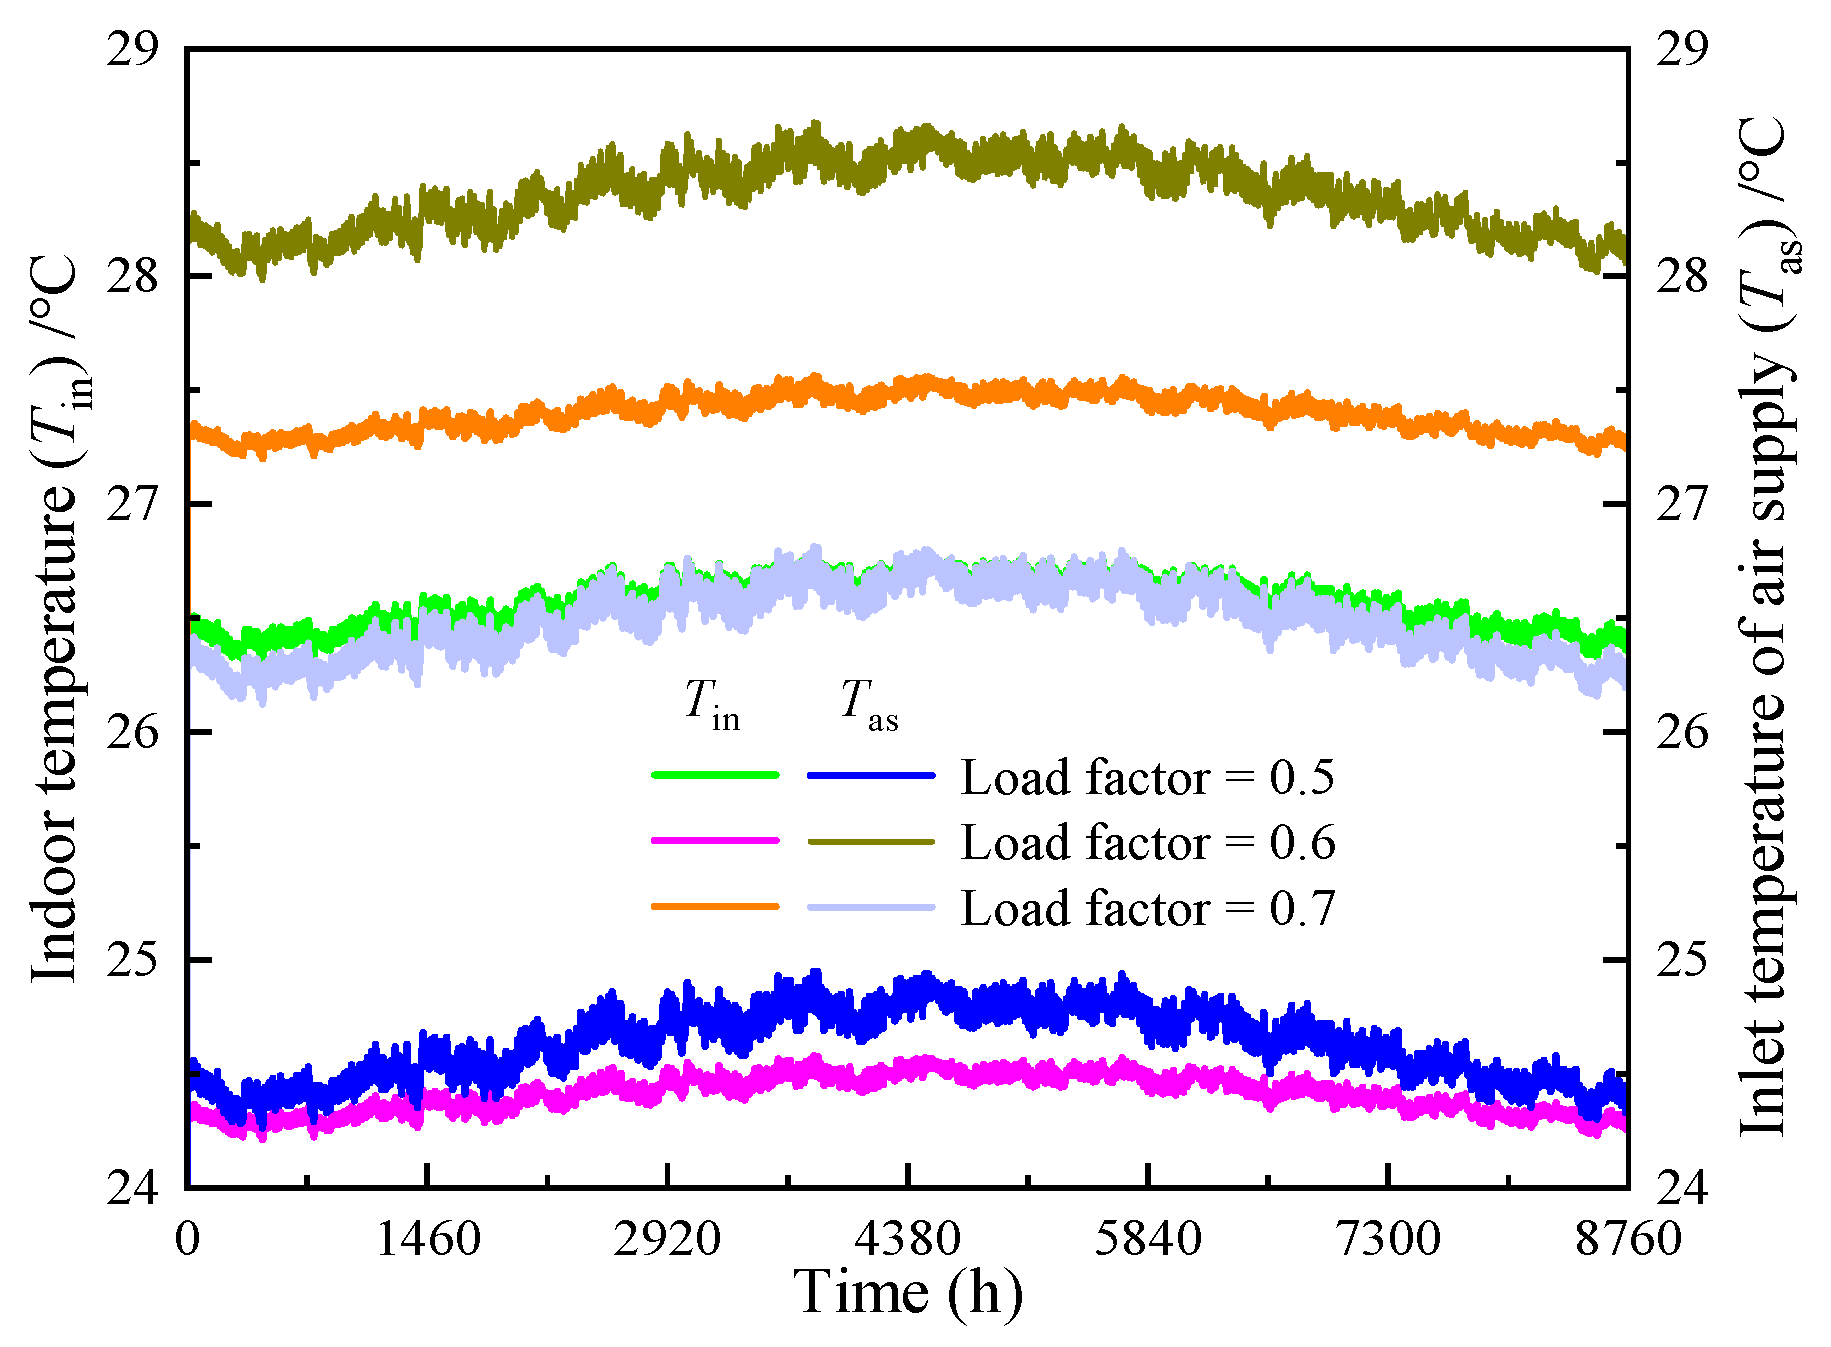
To define representative partial-load conditions, load rates of 0.5–0.7 are examined because the project normally operates within this range. Figure 8 compares the annual variation of room temperature and inlet temperature before cooling treatment under different load rates. The results indicate that the relative fluctuations of room temperature and pre-cooling inlet temperature remain below 2.0% and 3.0% at a fixed load rate, respectively. However, the maximum differences reach 11.8% and 18.2% across the different load rates. The room temperature at a load rate of 0.7 is closest to the 27.0 °C upper limit. It is worth noting that the temperature level does not show a simple proportional change with the load rate. This indicates that room temperature is not only determined by the load rate but also influenced by the air supply and spray parameters within the corresponding load range. Therefore, in engineering control, parameters should be selected based on the load rate, and the highest room temperature throughout the year should be checked. The room temperature should be further used to verify whether an increase in air volume or spray intensity is needed.
Figure 8.
Annual variation of room temperature and inlet temperature before cooling treatment under different load rates.
4.2.2. Supply Airflow Rate
To compare fan and spray pump responses without distortion from their different absolute power levels, a device relative power index is introduced. For device j, the index is defined as follows:
where is relative power index of equipment j under supply airflow rate , %; is the corresponding device power, kW; is the reference air supply, representing the power of the same device, kW; the reference air supply is taken as 9.0 × 10⁴ kg/h; and j is fans or spray pumps.
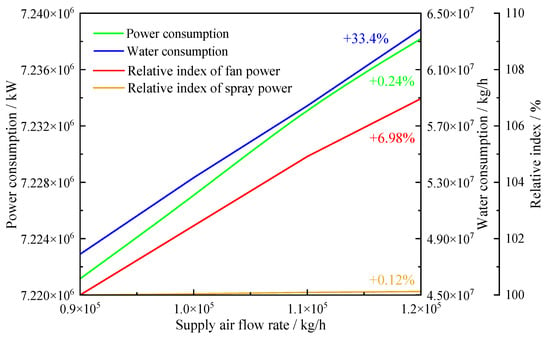
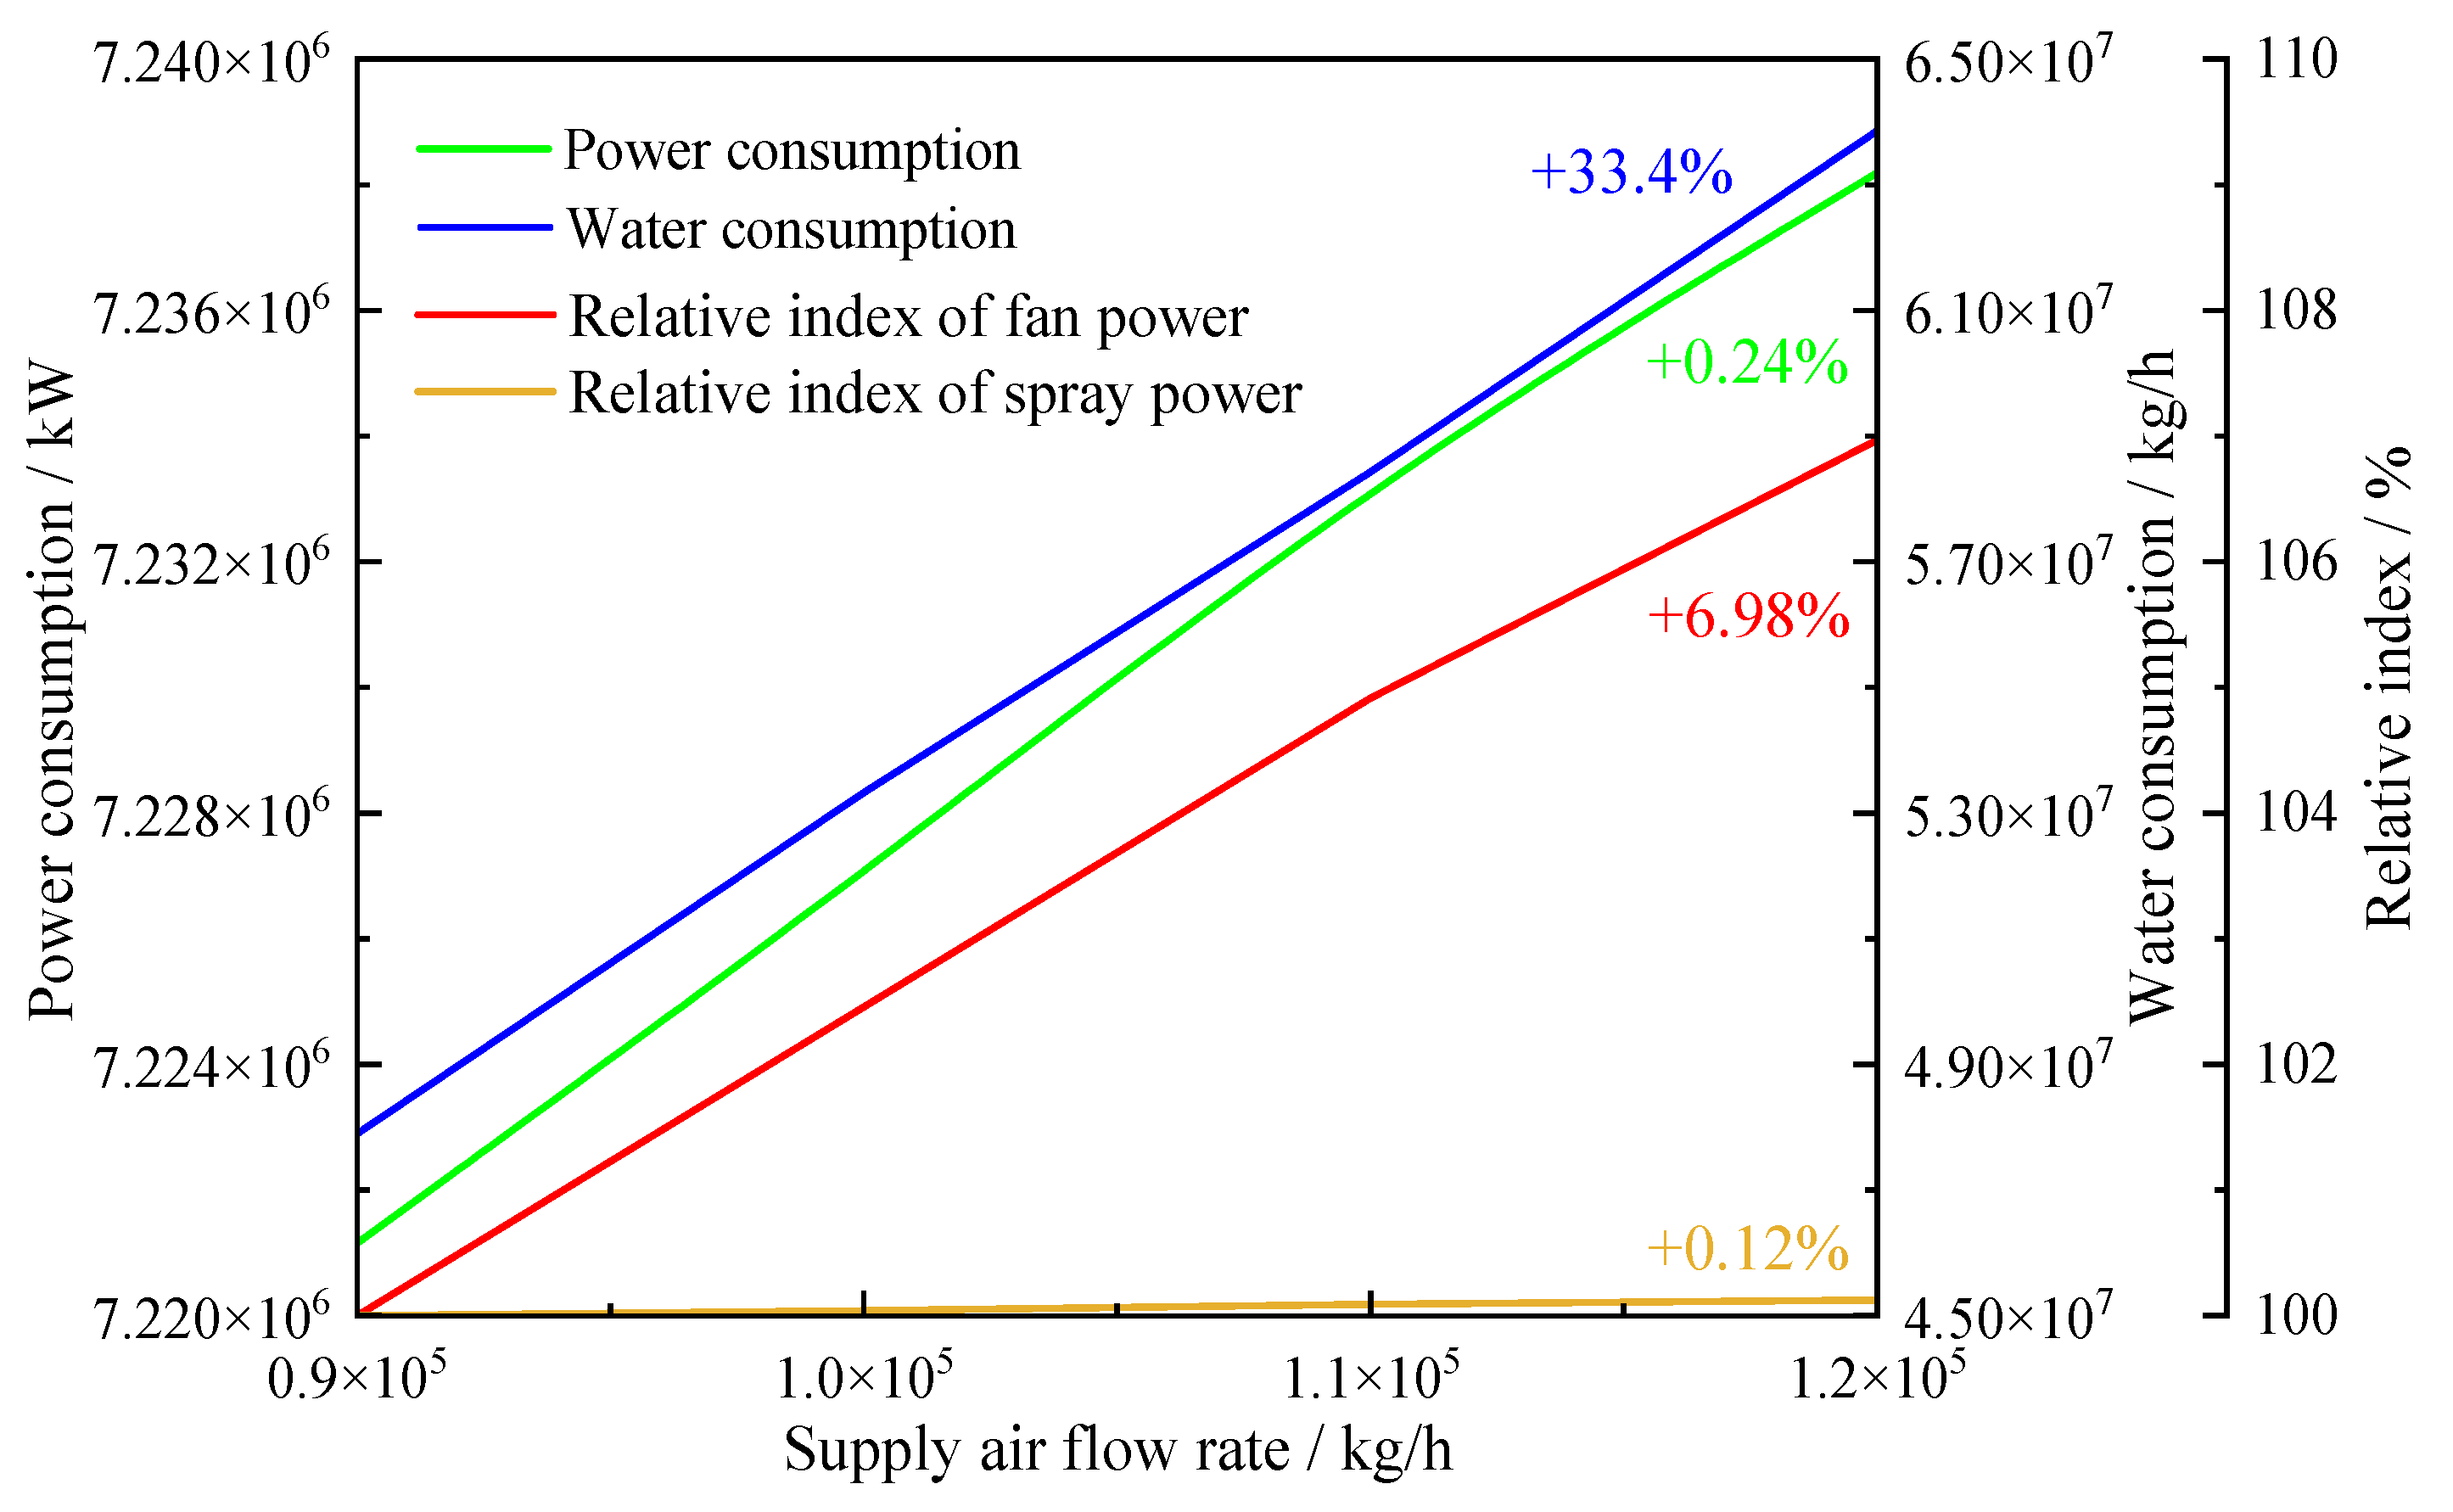
According to the above analysis, the inlet temperature of air supply and indoor temperature are both greater than 27 °C when the load rate is 0.7. Therefore, a load rate of 0.6 is used to isolate the effects of the three operating parameters. Figure 9 shows a joint comparison of annual electricity consumption, water consumption, and equipment power relative indices under different air supply flow rates. The results show that the annual electricity consumption increases by 0.2% when the supply airflow rate increases from 9.0 × 10⁴ to 1.2 × 10⁵ kg/h. The annual water consumption increases by 33.4%. The relative index of fan power increases by 7.0%, while the spray relative index rises by only 0.1%. The change in equipment power mainly comes from the fan, and the power of the spray pump remains basically stable. This may be due to the increase in air mass flow through the cooler, which requires evaporating more water to maintain the air treatment process. In other words, under the condition of constant electricity consumption and carbon emission factors, PUE and CUE will slightly increase with annual electricity consumption. WUE will increase with annual water consumption. Therefore, it is not advisable to continue relying on increasing air volume to obtain an excessive cooling margin after meeting the requirement of 27 °C at room temperature.
Figure 9.
Joint impact of supply airflow rate on annual electricity consumption, on-site water consumption, and equipment power.
4.2.3. Fresh/Return Air Ratio
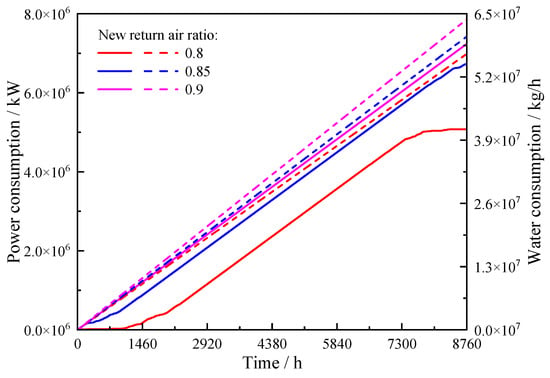
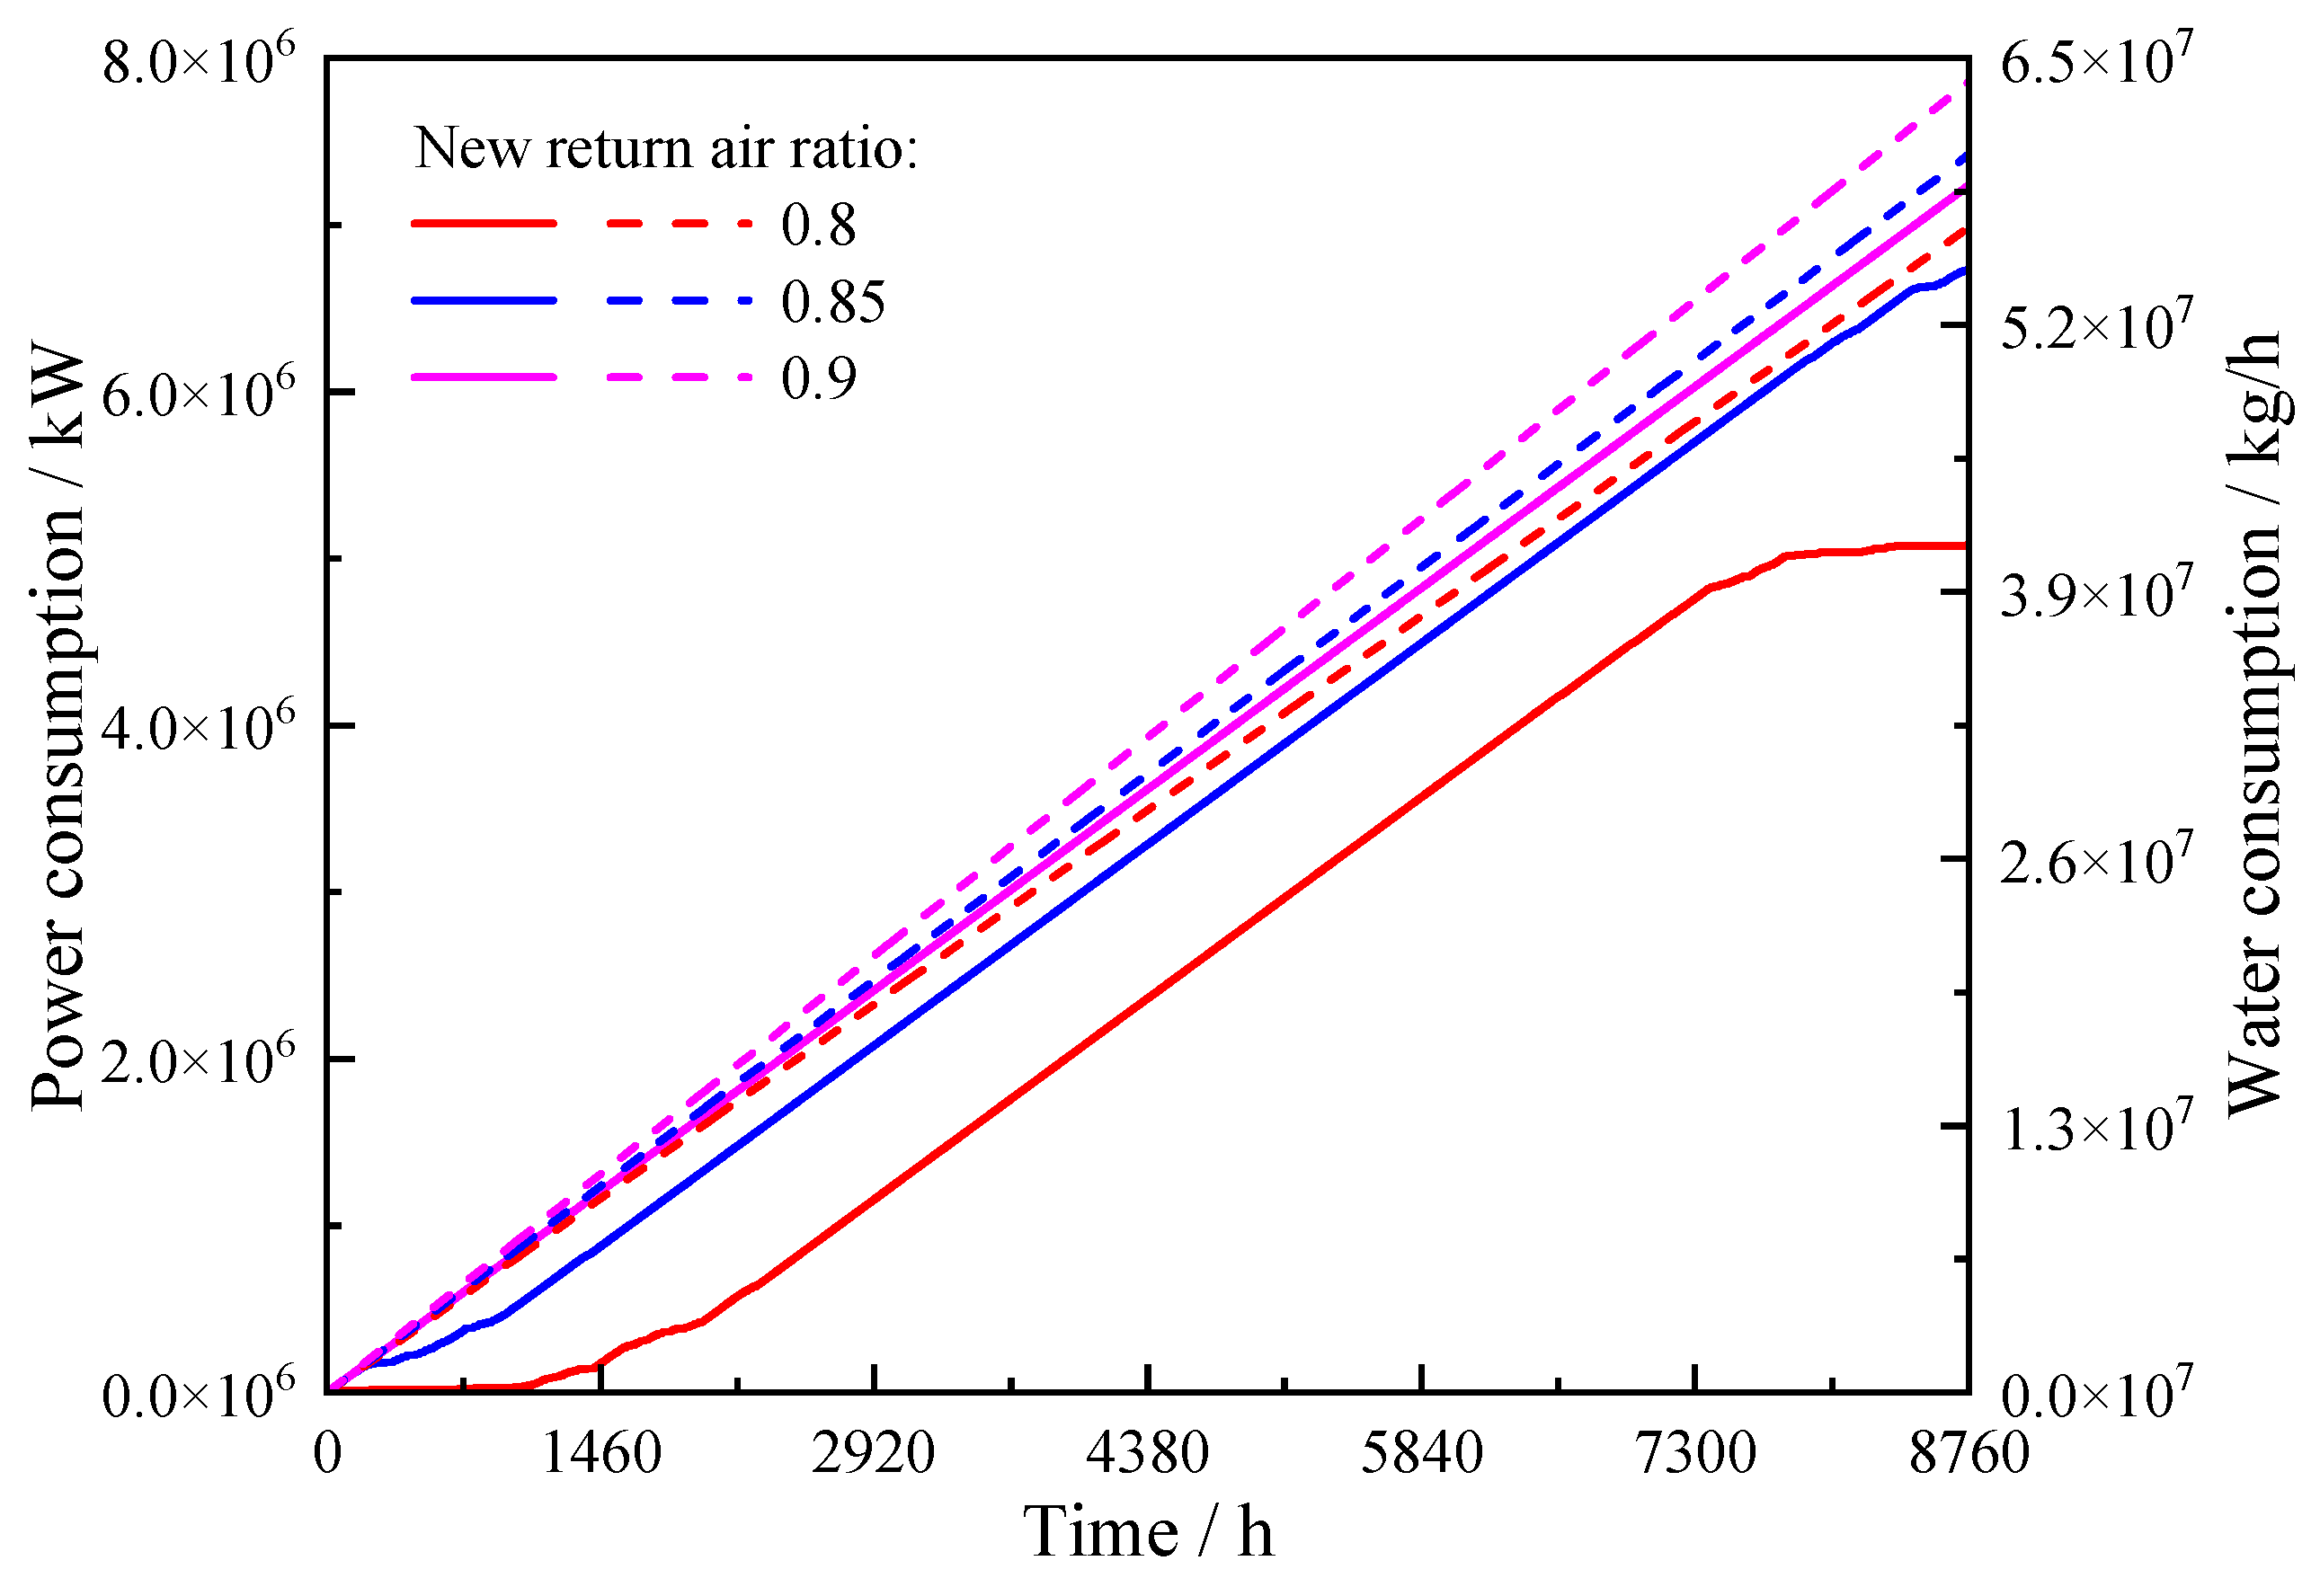
Figure 10 compares the annual cumulative power and water consumption of three fresh/return air ratios. It can be observed that both electricity and water consumption increase as the ratio rises. Relative to the 0.90 case, annual electricity consumption decreases by 29.8% at 0.80 and by 6.9% at 0.85. Annual water consumption decreases by 12.5% and 5.9%, respectively. The 0.8 operating condition maintains the lowest cumulative power and water consumption throughout the year. This indicates that reducing the fresh/return air ratio can simultaneously reduce electricity and water resource consumption. This may be due to the lower mixed air treatment load entering the evaporative cooling section, which is caused by smaller outdoor air resistance. The operating duration or intensity of spraying is consequently reduced, and less makeup water is required. Under a constant carbon emission factor, the reduction in annual electricity consumption lowers both PUE and CUE. The reduction in annual water consumption lowers WUE. Therefore, 0.80 is selected as the preferred ratio when room temperature, room pressure difference, and minimum fresh air demand are satisfied.
Figure 10.
The impact of fresh/return air ratio on annual electricity consumption and on-site water consumption.
4.2.4. Spray Efficiency
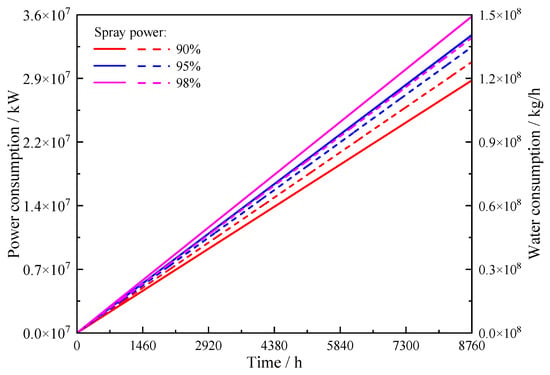
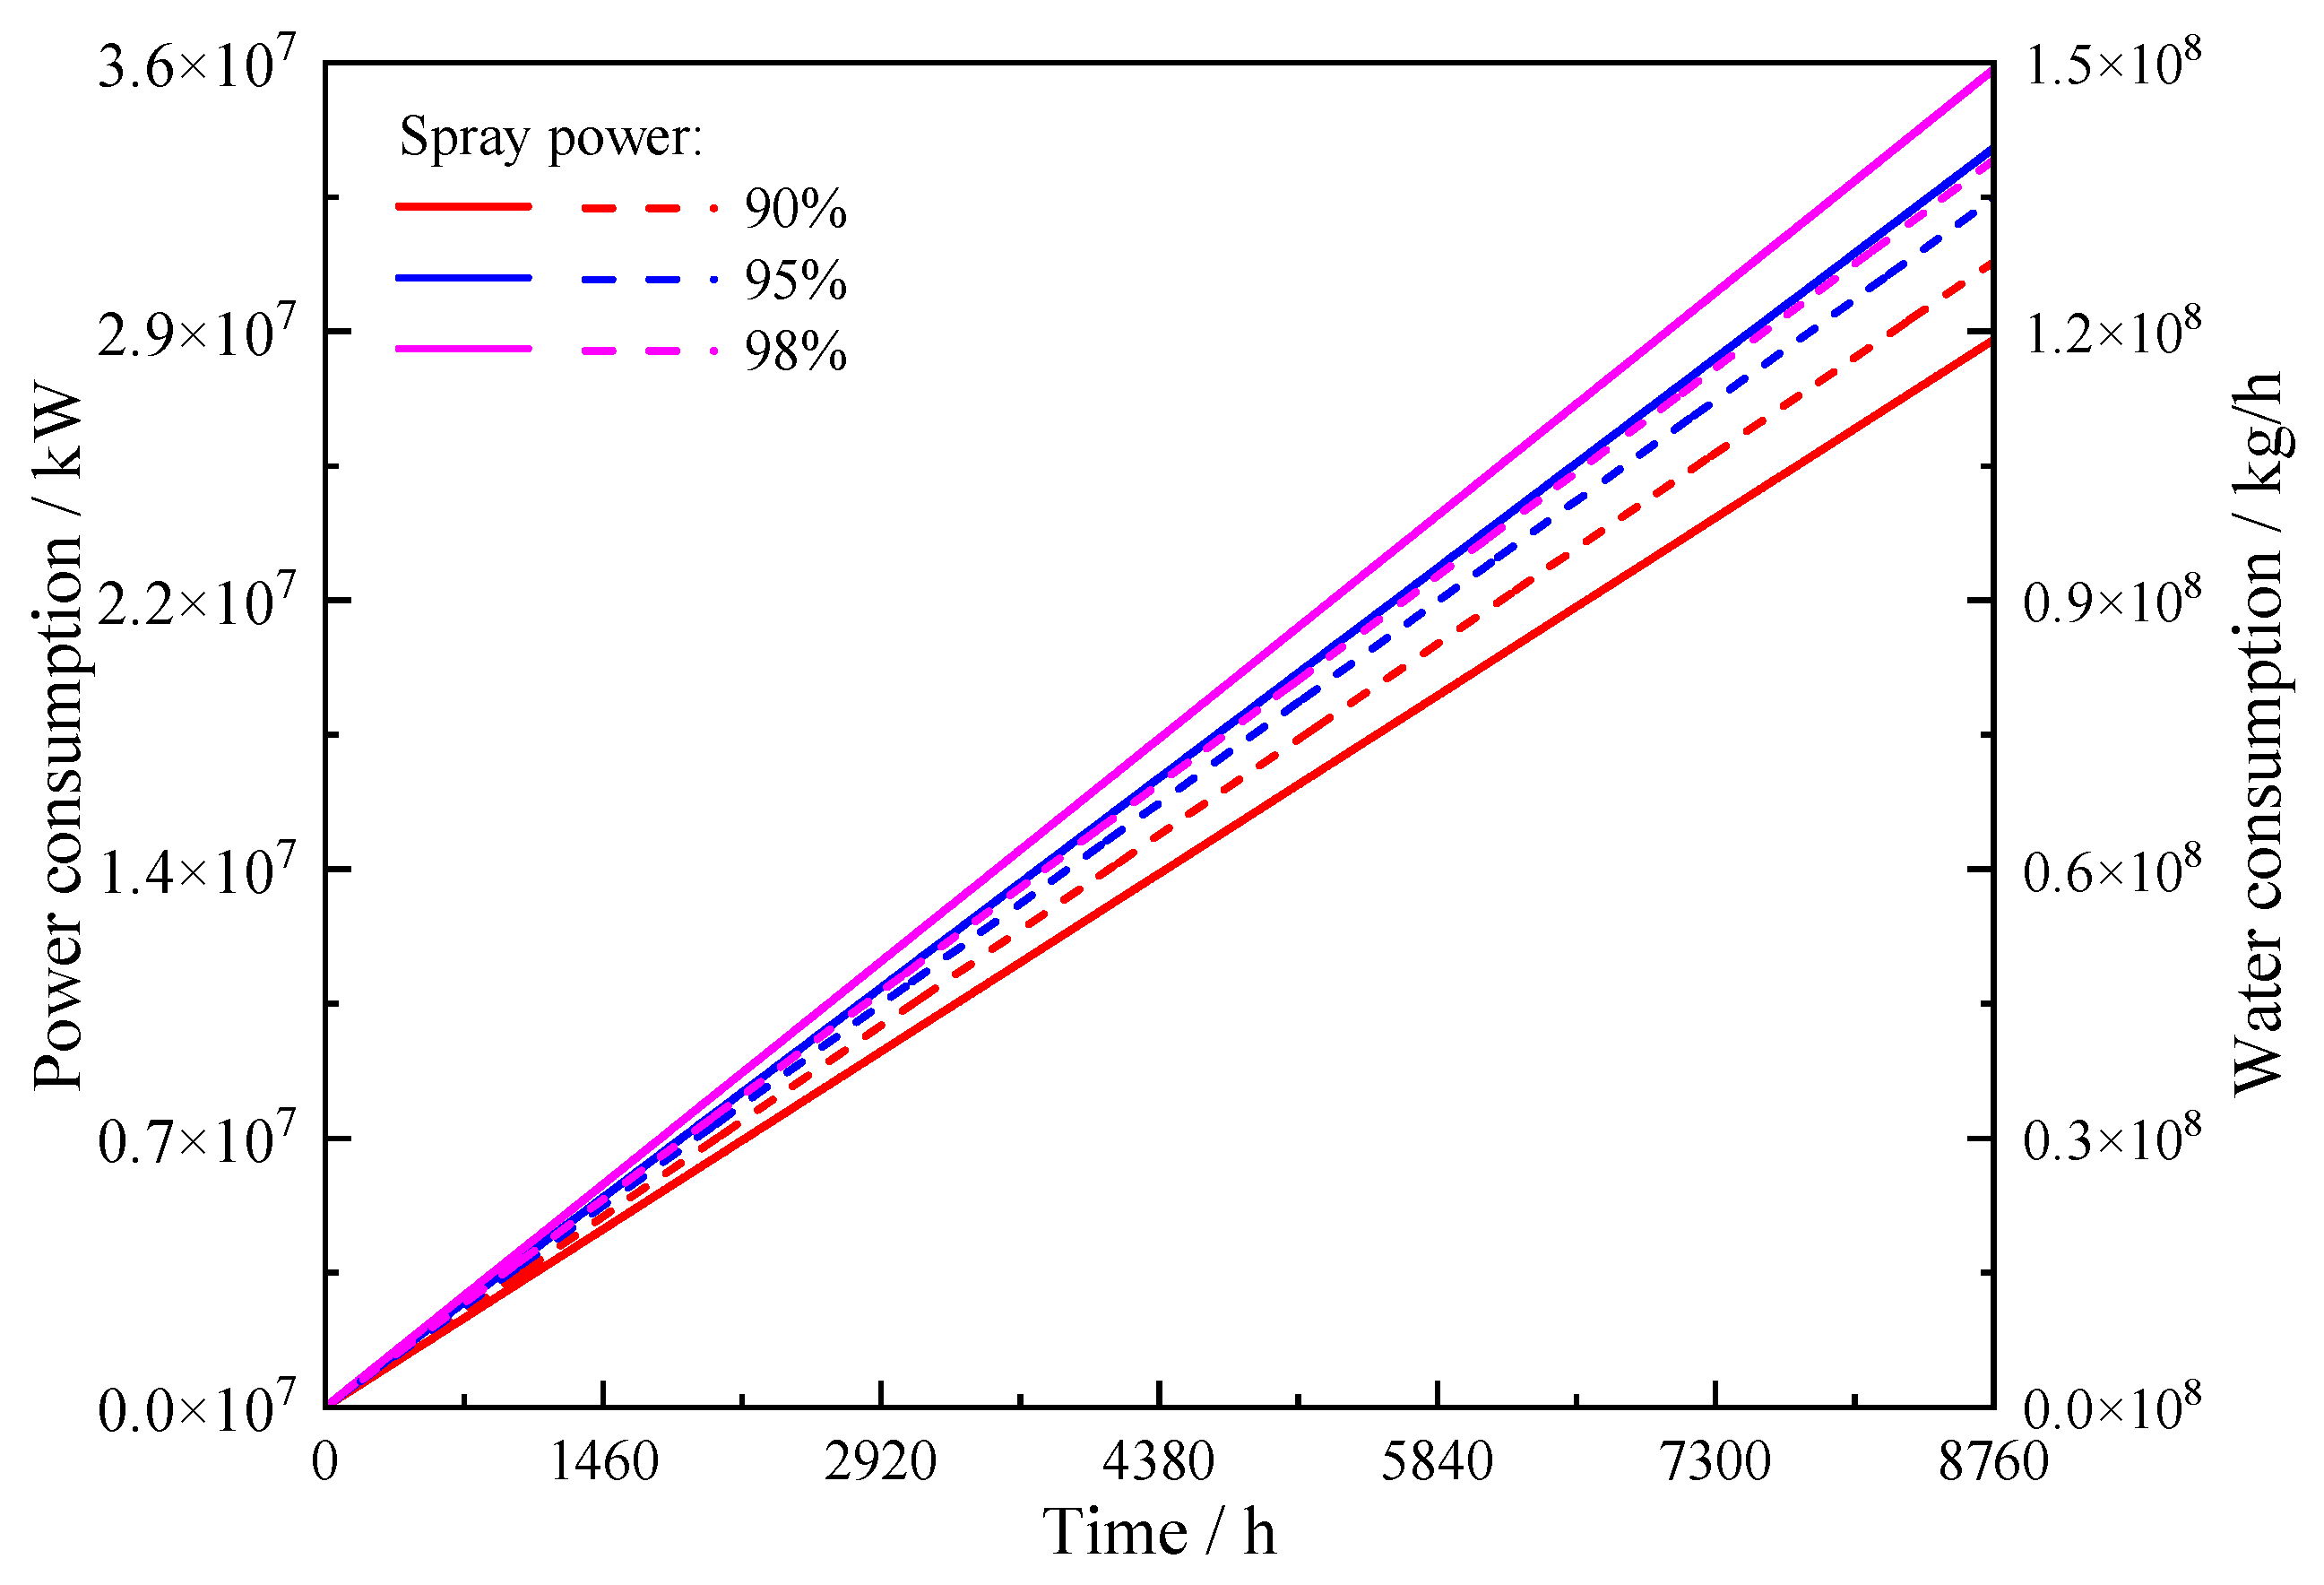
Figure 11 shows the annual cumulative power and water consumption of three spray efficiencies. The results show that as the spraying efficiency increases, both cumulative curves gradually shift upwards. Based on 98% operating conditions, the annual electricity consumption of 90% and 95% operating conditions decreases by 25.3% and 6.3%, respectively. The annual water consumption decreased by 8.9% and 3.2%, respectively. This indicates that although improving spray efficiency can enhance the heat and mass transfer between air and water, it requires higher spray input. Under a constant carbon emission factor, the electricity increase raises PUE and CUE. The increase in water improves WUE. Therefore, a low spray level is preferred whenever it maintains the room temperature limit.
Figure 11.
The impact of spray efficiency on annual electricity consumption and on-site water consumption.
4.3. Determination of Optimal Regulation Method
4.3.1. Parameter Control Strategies at Different Loads
To convert the parameter sensitivities into a control strategy, Table 7 summarizes the parameter combinations and annual energy consumption under different load rates. The results indicate that the load rates of 0.5 and 0.6 are both set at 9.0 × 10⁴ kg/h, 0.8, and 90%. When the load rate reaches 0.7, the supply airflow rate is first increased 1.20 × 10⁵ kg/h, while keeping the fresh/return air ratio and spray efficiency unchanged. Only at a load rate of 1.0 can the air supply be increased to 2.10 × 10⁵ kg/h and the spray efficiency be increased to 95% simultaneously. From 0.5 to 1.0, the annual electricity consumption increases by 72.0%. The annual water consumption increases by 133.1%. PUE, WUE, and CUE increase from 1.21, 1.10, and 1.35 to 1.31, 2.37, and 1.46, respectively. Therefore, in the project, the supply air volume should be selected based on the load rate first, and the fresh/return air ratio should be prioritized at 0.8. If the room temperature is still close to the upper limit of 27 °C at this airflow rate, the spray efficiency should be increased from 90% to 95%.
4.3.2. Energy Consumption Analysis at Different Loads
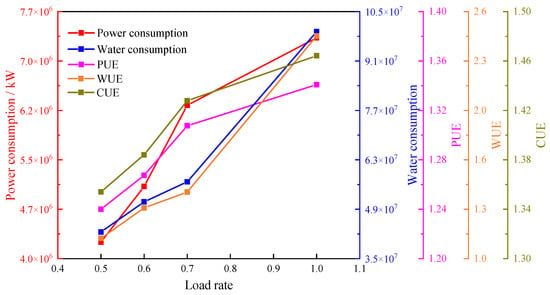
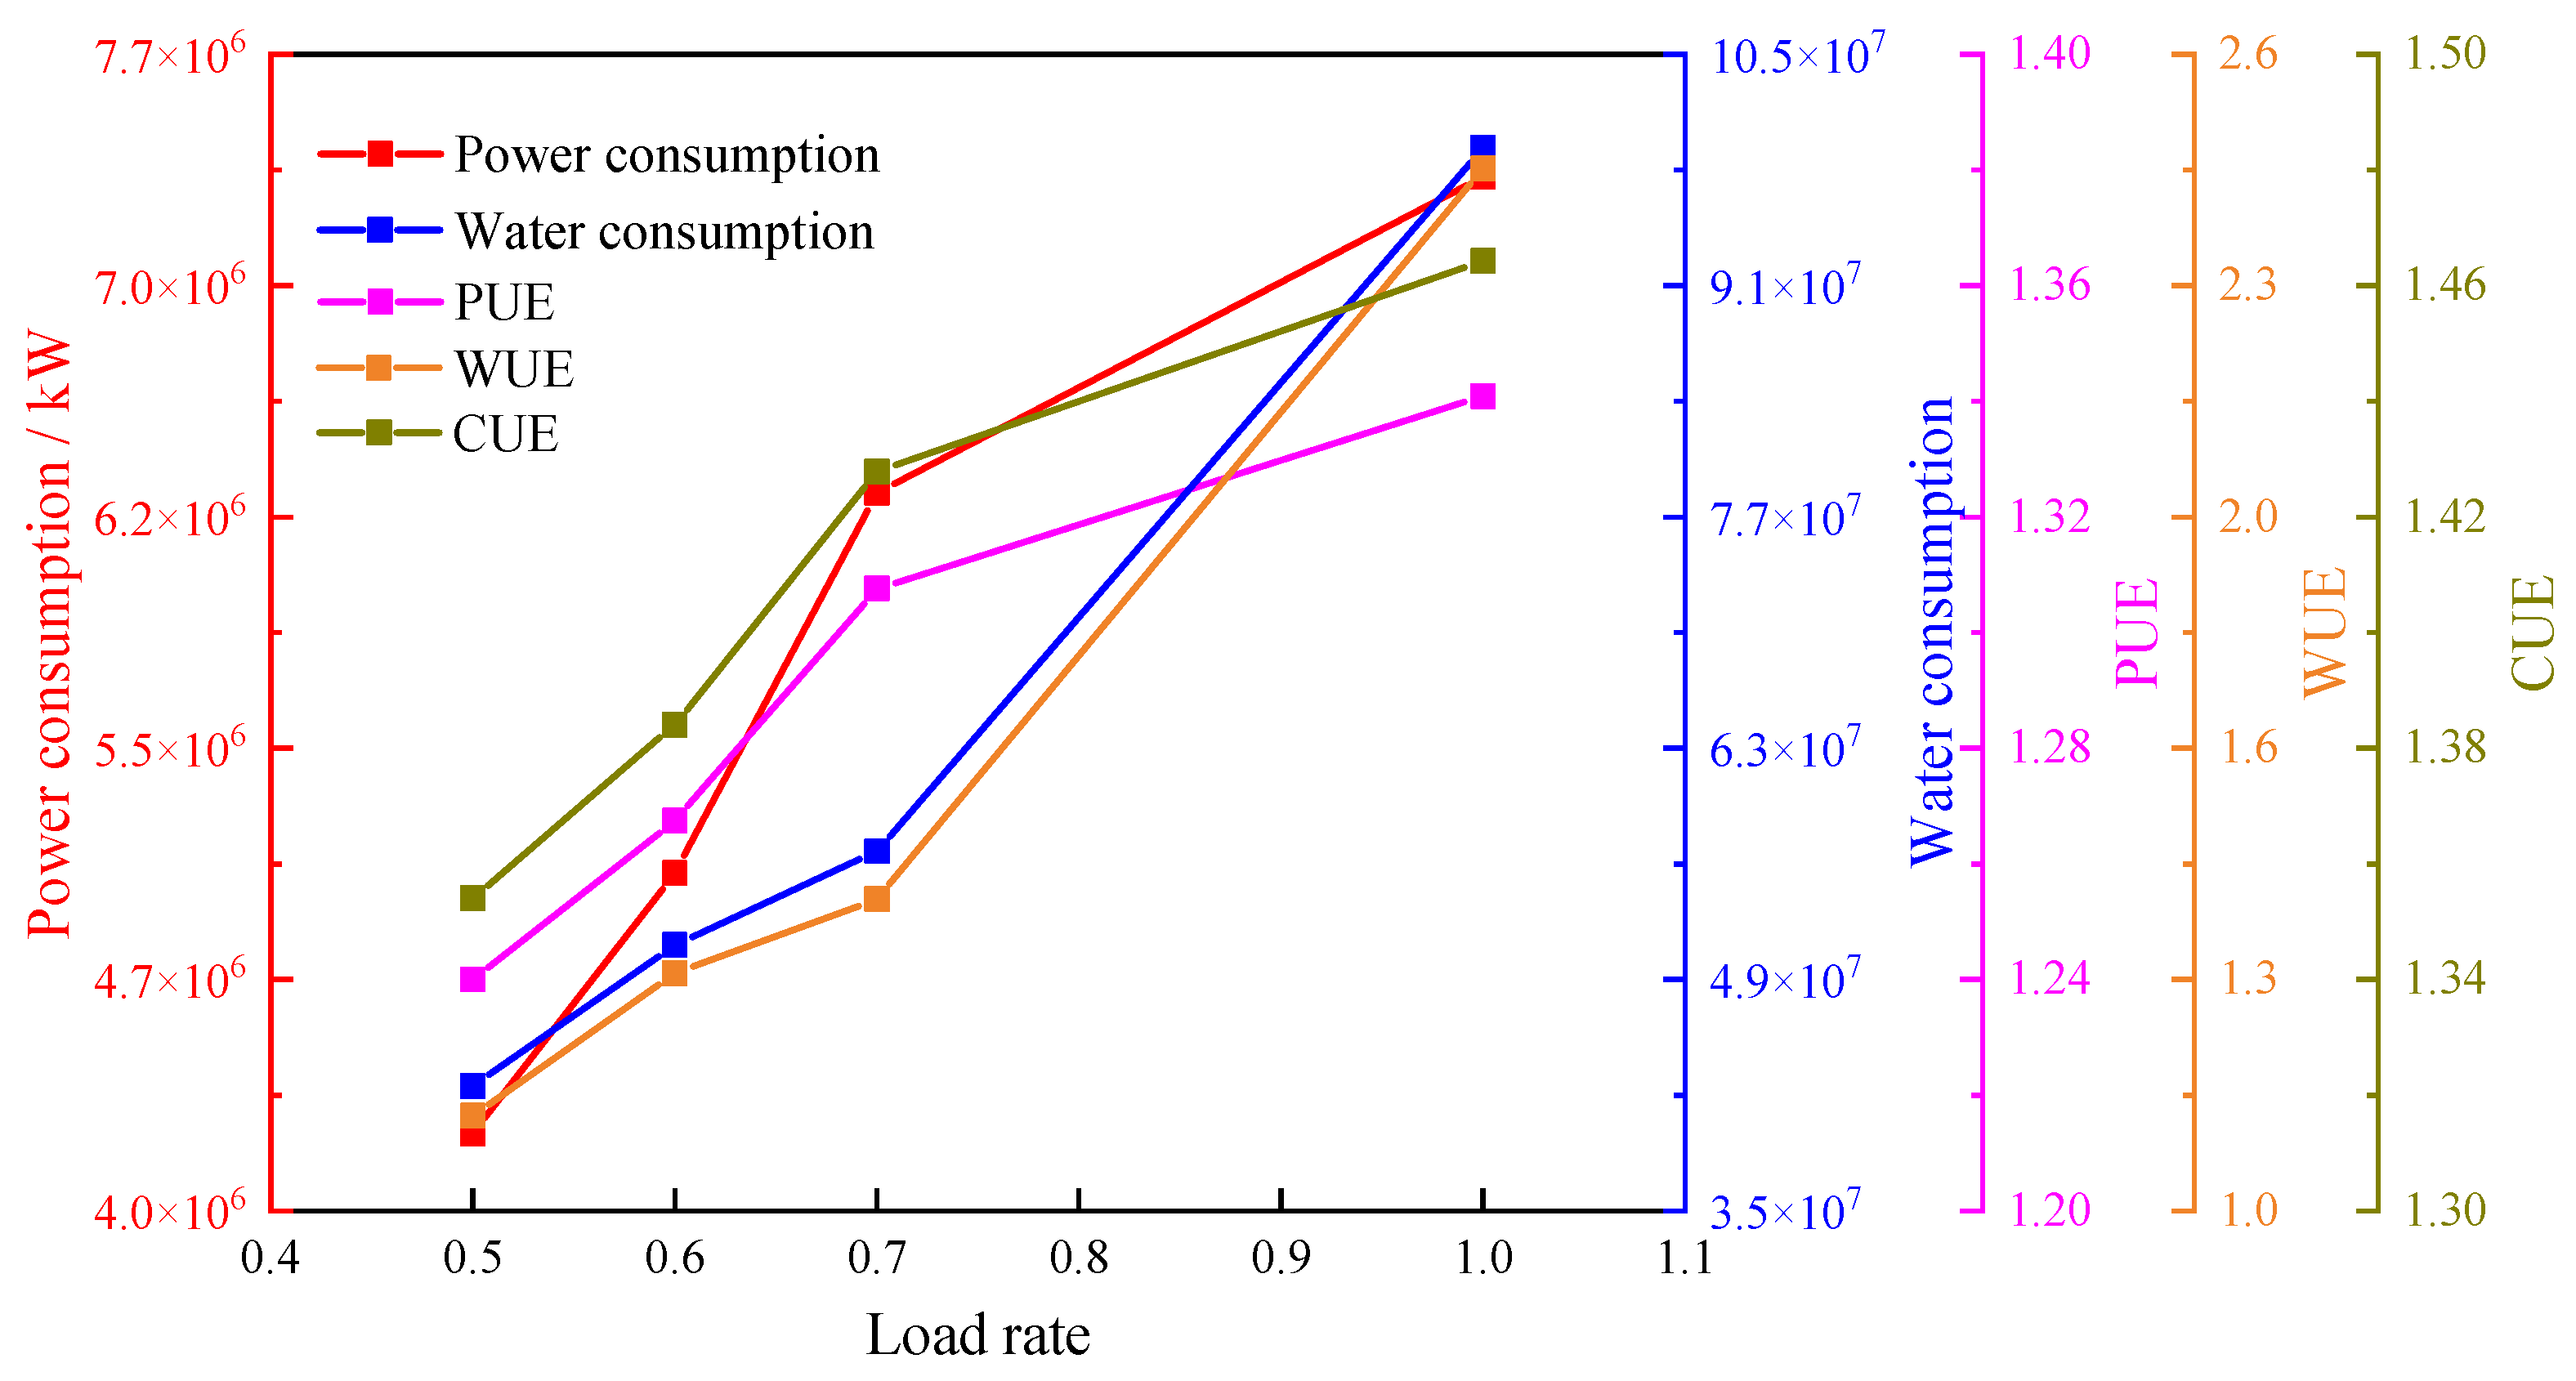
To evaluate the energy consumption behavior of the staged strategy, Figure 12 displays the annual electricity consumption, annual water consumption, PUE, WUE, and CUE. The results show that annual electricity and water consumption increase by 48.0% and 33.3% when the load rate increases from 0.5 to 0.7, respectively. PUE, WUE, and CUE increase by 5.6%, 26.5%, and 5.9%. The annual electricity consumption increases by 16.2% when the load rate increases further from 0.7 to 1.0. The annual water consumption increases by 74.8%. PUE, WUE, and CUE increase by 2.3%, 70.6%, and 2.1%, respectively. Therefore, the 0.7–1.0 load interval causes a much larger increase in water use and WUE, although the relative increases in electricity use, PUE, and CUE are smaller. This may be due to the simultaneous increase in handled airflow and spray intensity at full load. Therefore, the low load level is assigned to load rates of 0.5 and 0.6, and the medium load level is assigned to 0.7. The full load level is enabled only when the load approaches 1.0 and room temperature requires additional cooling. When the load is reduced, the spray efficiency should be reduced to 90% first after rechecking the room temperature, and then the air supply should be reduced according to the load rate. It should also be noted that the tested load rates (0.5, 0.6, 0.7, and 1.0) reflect the actual operating modes of the project: the IT load normally resides in the 0.5–0.7 band, while 1.0 represents the full-load condition. A sustained 0.8–0.9 operating regime does not occur in this deployment, so sampling intermediate points there would not correspond to representative operating conditions. Nevertheless, because the water/WUE rise is concentrated precisely in this 0.7–1.0 transition, the staged strategy treats this interval conservatively. One or two additional load points within this interval are identified as future work.
Figure 12.
Coordinated changes in annual electricity consumption, water consumption, PUE, WUE, and CUE driven by regulation strategies under different load rates.
Several limitations should be noted. The present conclusions are derived for one modular data center using the Hebei typical-year weather file, with the cooler model validated only through outlet temperature comparison over a restricted inlet temperature range. Although the need to balance airflow, evaporative water demand, and electricity use is general, the magnitude and ordering of annual savings depend on climate, rack heat density, water quality, equipment characteristics, and the control boundary. The 0.80 mixing setting and 90–95% spray efficiency are therefore case-specific candidates rather than transferable thresholds.
5. Conclusions
An annual TRNSYS model is established for a modular data center in northern Hebei Province, and a heat and mass transfer model is developed for the indirect evaporative cooler. The cooler model is validated against experimental data. Then, the effects of supply airflow rate, fresh/return air ratio, and spray efficiency are evaluated under full and partial loads. Thermal feasibility is assessed before annual electricity use, water use, PUE, WUE, and CUE are compared. Finally, a parameter control strategy is derived. The main conclusions are as follows:
- (1)
- Under full load, a supply air volume of 2.10 × 10⁵ kg/h, a fresh/return air ratio of 0.8, and a spray efficiency of 95% can constrain the room temperature between 26.6 and 27.2 °C. Annual electricity and water consumption are 7.308 × 10⁶ kWh and 9.93 × 10⁷ kg, respectively. PUE and WUE are 1.3 and 2.4. The annual maximum exceeds the nominal 27.0 °C criterion by 0.2 °C. This combination is a near-limit candidate and does not satisfy a strict annual 27.0 °C upper bound.
- (2)
- Supply airflow primarily restores thermal safety, but it imposes a pronounced water penalty. Under full load, increasing the airflow rate from 1.2 × 10⁵ to 2.1 × 10⁵ kg/h increases annual electricity consumption by 1.0% and annual water consumption by 74.8%. Under partial load, increasing the airflow rate from 9.0 × 10⁴ to 1.2 × 10⁵ kg/h increases these quantities by 0.2% and 33.4%. The fan and spray pump relative power indices increase by 7.0% and 0.1%, respectively. Therefore, the minimum airflow that satisfies the room temperature requirement is selected at each load rate.
- (3)
- Lower fresh/return air ratios and spray efficiencies reduce both electricity and water use when the temperature constraint is satisfied. Relative to a ratio of 0.90, a ratio of 0.80 reduces annual electricity and water consumption by 29.8% and 12.5%. Relative to a spray efficiency of 98.0%, an efficiency of 90.0% reduces the two quantities by 25.3% and 8.9%. Therefore, a ratio of 0.80 and a spray efficiency of 90.0% are used as partial load basis settings, while 95.0% spray efficiency supplies full load compensation.
- (4)
- Water use growth differs markedly among load intervals. The annual electricity consumption increases by 16.2% when the load rate increases from 0.7 to 1.0. The annual water consumption and WUE increase by 74.8% and 70.6%. Accordingly, supply airflow rate is first selected from the load rate, and spray efficiency is then determined from room temperature. The high airflow and high spray full load combination is exited promptly when the load decreases.
Author Contributions
Software, X.C.; formal analysis, C.D.; investigation, C.D., X.C., L.Z., D.Z., L.Q., J.S., J.G. and H.M.; writing—original draft preparation, C.D.; writing—review and editing, H.M.; supervision, C.D., X.C., L.Z., D.Z., L.Q., J.S., J.G. and H.M. All authors have read and agreed to the published version of the manuscript.
Funding
This research was funded by the Natural Science Research Project of Jiangsu Higher Education Institutions, grant number 23KJD470011; the Yancheng City Policy-Guided Plan (Intelligence Introduction) Special Fund Project, grant number Ycyz005; and the Jiangsu Provincial Education Science Planning Project, grant number B/2022/02/57.
Data Availability Statement
The original contributions presented in this study are included in the article. Further inquiries can be directed to the corresponding authors.
Conflicts of Interest
Author D.Z. was employed by the company Thermal Power Research Institute. The remaining authors declare that the research was conducted in the absence of any commercial or financial relationships that could be construed as a potential conflict of interest.
Abbreviations
The following abbreviations are used in this manuscript:
| A | Heat/mass transfer area, m2 |
| cp,a | The specific heat of air at constant pressure, kJ·kg−1·K−1 |
| cp,w | The specific heat of water at constant pressure, kJ·kg−1·K−1 |
| Ga | The air mass flow rate in the local heat and mass transfer equation, kg·s−1 |
| Gw | The water mass flow rate in the local heat and mass transfer equation, kg·s−1 |
| Gws | Spray/water supply branch water quality flow rate, kg·s−1 |
| Gwb | The quality flow rate of the bypass water branch, kg·s−1 |
| ha,in | The specific enthalpy of the air at the inlet of the device, kJ·kg−1 |
| ha,out | The specific enthalpy of the air at the outlet of the device, kJ·kg−1 |
| IP,j | The relative power index of device j, % |
| i | Discrete grid number |
| j | Equipment Type Index (fan or spray pump) |
| ṁa | The air quality flow rate in the annual system analysis and equipment relative index, kg·h−1 |
| ṁw | Water quality flow rate, kg·s−1 |
| ṁu | User-side water quality flow rate, kg·s−1 |
| ṁhx | The water mass flow rate of the air–water heat exchanger, kg·s−1 |
| n | Discrete mesh number |
| Pj(ṁa) | The power of equipment j at a specified air quality flow rate, kW |
| Pj(ṁa,ref) | The power of device j at the reference air quality flow rate, kW |
| Q̇a | The heat gain or loss rate of air in an evaporative cooler, kJ·h−1 |
| r0 | The latent heat of vaporization of water, kJ·kg−1 |
| ta | Air temperature, °C |
| tw | Water temperature, °C |
| Ta,out | The outlet air temperature of the air–water heat exchanger, °C |
| Tw,r | Return water temperature, °C |
| Tw,out | The outlet water temperature of the air–water heat exchanger, °C |
| ta,bout | The outlet temperature of the air bypass branch, °C |
| tw,s | Spray/water supply branch water temperature, °C |
| tw,bout | The outlet temperature of the bypass water branch, °C |
| ωa | Air moisture content, kg·kg−1 |
| ωwa | Saturated air moisture content at water film temperature, kg·kg−1 |
| a | Air |
| w | Water |
| in | Inlet |
| out | Outlet |
| s | Saturation state |
| bout | Bypass branch outlet |
| IT | Information technology equipment |
| CUE | Carbon usage effectiveness |
| DDC | Direct digital control |
| PUE | Power usage effectiveness |
| WUE | Water usage effectiveness |
References
- Cao, K.; Li, Z.; Luo, H.; Jiang, Y.; Liu, H.; Xu, L.; Gao, P.; Liu, H. Comprehensive Review and Future Prospects of Multi-Level Fan Control Strategies in Data Centers for Joint Optimization of Thermal Management Systems. J. Build. Eng. 2024, 94, 110021. [Google Scholar] [CrossRef] [Scilit]
- Liu, Y.; Yang, X.; Li, J.; Zhao, X. Energy Savings of Hybrid Dew-Point Evaporative Cooler and Micro-Channel Separated Heat Pipe Cooling Systems for Computer Data Centers. Energy 2018, 163, 629–640. [Google Scholar] [CrossRef] [Scilit]
- Manaserh, Y.M.; Tradat, M.I.; Bani-Hani, D.; Alfallah, A.; Sammakia, B.G.; Nemati, K.; Seymour, M.J. Machine Learning Assisted Development of IT Equipment Compact Models for Data Centers Energy Planning. Appl. Energy 2022, 305, 117846. [Google Scholar] [CrossRef] [Scilit]
- Zhang, D.; Cheng, X.; Dong, C.; Qu, L.; Shen, J.; Ma, H. A Fast Reduction Prediction Method for Saturation Boiling Characteristics of Finned Heat Sink in Submerged Servers Based on POD-Surrogate Model. Int. J. Therm. Sci. 2027, 232, 111321. [Google Scholar] [CrossRef] [Scilit]
- Guo, H.; Yu, H.; Zhao, S.; Chen, H.; Li, C. Improving the Local Thermal Environment in Data Centers via Supply–Demand Matching. Energy Build. 2025, 347, 116350. [Google Scholar] [CrossRef] [Scilit]
- Xie, Y.; Ji, P.; Xia, J.; Zhang, Y.; Ma, H.; Weschler, L.B.; Zhang, Y. Optimizing Building Solar Hybrid Combined Cooling, Heating and Power Systems: Inverse Problem Method with an Illustrative Example. Build. Environ. 2026, 298, 114616. [Google Scholar] [CrossRef] [Scilit]
- Ma, H.; Xie, Y.; Wang, S.; Liu, Y.; Ding, R. Exergy Analysis of a New Spray Cooling System-Based PV/T and Heat Recovery with Application in Sow Houses. Sol. Energy 2023, 262, 111828. [Google Scholar] [CrossRef] [Scilit]
- Han, Z.; Ji, Q.; Wei, H.; Xue, D.; Sun, X.; Zhang, X.; Li, X. Simulation Study on Performance of Data Center Air-Conditioning System with Novel Evaporative Condenser. Energy 2020, 210, 118521. [Google Scholar] [CrossRef] [Scilit]
- Han, Z.; Xue, D.; Wei, H.; Ji, Q.; Sun, X.; Li, X. Study on Operation Strategy of Evaporative Cooling Composite Air Conditioning System in Data Center. Renew. Energy 2021, 177, 1147–1160. [Google Scholar] [CrossRef] [Scilit]
- Alkrush, A.A.; Salem, M.S.; Abdelrehim, O.; Hegazi, A.A. Data Centers Cooling: A Critical Review of Techniques, Challenges, and Energy Saving Solutions. Int. J. Refrig. 2024, 160, 246–262. [Google Scholar] [CrossRef] [Scilit]
- Du, Y.; Zhou, Z.; Yang, X.; Yang, X.; Wang, C.; Liu, J.; Yuan, J. Dynamic Thermal Environment Management Technologies for Data Center: A Review. Renew. Sustain. Energy Rev. 2023, 187, 113761. [Google Scholar] [CrossRef] [Scilit]
- Yan, W.; Cui, X.; Zhao, M.; Meng, X.; Yang, C.; Zhang, Y.; Liu, Y.; Jin, L. Multi-Objective Optimization of Dew Point Indirect Evaporative Coolers for Data Centers. Appl. Therm. Eng. 2024, 241, 122425. [Google Scholar] [CrossRef] [Scilit]
- Shi, W.; Ma, X.; Min, Y.; Yang, H. Feasibility Analysis of Indirect Evaporative Cooling System Assisted by Liquid Desiccant for Data Centers in Hot-Humid Regions. Sustainability 2024, 16, 2011. [Google Scholar] [CrossRef] [Scilit]
- Jing, Y.; Xie, L.; Li, F.; Zhan, Z.; Wang, Z.; Yang, F.; Fan, J.; Zhu, Z.; Zhang, H.; Zhao, C.; et al. Field Test of Cooling Systems in Two Air-Cooled Data Centers: Various Regions, Air Distributions and Evaporative Cooling Technologies. Appl. Therm. Eng. 2024, 248, 123189. [Google Scholar] [CrossRef] [Scilit]
- Karimi, L.; Shinh, R.; Laisure-Pool, C.; Green, M.; Yacuel, L.; Ashby, J.; Hickenbottom, K.L. Energy and Water Dynamics in Data Center Cooling: Insights from a Modeling Study in Hot-Arid Climates. Appl. Therm. Eng. 2025, 276, 126802. [Google Scholar] [CrossRef] [Scilit]
- Liao, Y.; Liao, F.; Huang, G.; Fan, C. Investigating the Impact of Operating Parameters on the Energy Efficiency of Evaporative Precooling Systems in Data Centers in Hot and Humid Climates. J. Build. Eng. 2025, 104, 112353. [Google Scholar] [CrossRef] [Scilit]
- Zhou, J.; Kanbur, B.B.; Le, D.V.; Tan, R.; Duan, F. Multi-Criteria Assessments of Increasing Supply Air Temperature in Tropical Data Center. Energy 2023, 271, 127043. [Google Scholar] [CrossRef] [Scilit]
- Cui, D.; Zhou, C.; Luo, Y.; Lei, Q.; Tian, Z.; Zhang, S.; Fan, J.; Zhang, L. Multi-Scale Modeling and Fast Inference for Thermal Environment Analysis of Air-Cooled Data Center. J. Build. Eng. 2023, 78, 107722. [Google Scholar] [CrossRef] [Scilit]
- Lan, J.; Zhang, Z.; Liang, X.; Wu, H.; Wang, G.; Mao, R. Experimental and Numerical Investigation on Thermal Performance of Data Center via Fan-Wall Free Cooling Technology. Appl. Therm. Eng. 2023, 228, 120467. [Google Scholar] [CrossRef] [Scilit]
- Karimi, L.; Yacuel, L.; Johnson, J.D.-; Ashby, J.; Green, M.; Renner, M.; Bergman, A.; Norwood, R.; Hickenbottom, K.L. Water-Energy Tradeoffs in Data Centers: A Case Study in Hot-Arid Climates. Resour. Conserv. Recycl. 2022, 181, 106194. [Google Scholar] [CrossRef] [Scilit]
- Jin, Y.; Bai, X.; Xu, X.; Mi, R.; Li, Z. Climate Zones for the Application of Water-Side Economizer in a Data Center Cooling System. Appl. Therm. Eng. 2024, 250, 123450. [Google Scholar] [CrossRef] [Scilit]
- Koot, M.; Wijnhoven, F. Usage Impact on Data Center Electricity Needs: A System Dynamic Forecasting Model. Appl. Energy 2021, 291, 116798. [Google Scholar] [CrossRef] [Scilit]
- Aili, A.; Long, W.; Cao, Z.; Wen, Y. Radiative Free Cooling for Energy and Water Saving in Data Centers. Appl. Energy 2024, 359, 122672. [Google Scholar] [CrossRef] [Scilit]
- Wang, P.; Sun, J.; Yoon, S.; Zhao, L.; Liang, R. A Global Optimization Method for Data Center Air Conditioning Water Systems Based on Predictive Optimization Control. Energy 2024, 295, 130925. [Google Scholar] [CrossRef] [Scilit]
- Cherqi, O.; Idouanaou, A.; Malha, M.; Kardellass, S. Numerical Modeling and Experimental Study of SiO2 Radiative Cooling Coatings on Aluminum Substrate in Humid Conditions: A Case Study in Morocco Mediterranean Climate. Energy Build. 2025, 339, 115771. [Google Scholar] [CrossRef] [Scilit]
- De Antonellis, S.; Joppolo, C.M.; Liberati, P.; Milani, S.; Romano, F. Modeling and Experimental Study of an Indirect Evaporative Cooler. Energy Build. 2017, 142, 147–157. [Google Scholar] [CrossRef] [Scilit]
- Lin, J.; Bui, D.T.; Wang, R.; Chua, K.J. On the Fundamental Heat and Mass Transfer Analysis of the Counter-Flow Dew Point Evaporative Cooler. Appl. Energy 2018, 217, 126–142. [Google Scholar] [CrossRef] [Scilit]
- Xie, Y.; Ma, H.; Wang, J.; Chen, Y. Study on the Optimal Operation Scheme of a Spray Cooling System in a Pig House. Int. Commun. Heat Mass Transf. 2024, 159, 108169. [Google Scholar] [CrossRef] [Scilit]
- Katramiz, E.; Al Jebaei, H.; Alotaibi, S.; Chakroun, W.; Ghaddar, N.; Ghali, K. Sustainable Cooling System for Kuwait Hot Climate Combining Diurnal Radiative Cooling and Indirect Evaporative Cooling System. Energy 2020, 213, 119045. [Google Scholar] [CrossRef] [Scilit]
- Zhao, J.; Hou, J.; Yang, Z.; Liu, D.; Xu, B.; Zhang, W.; Yao, M.; Cui, J.; Liu, S.; Qi, X.; et al. Collaborative Model Predictive Control for Indirect Evaporative Cooling Systems in Data Centers Based on Dynamic Hot-Spot Tracking. Energy 2026, 344, 139888. [Google Scholar] [CrossRef] [Scilit]
- Zhao, L.; Cheng, X.; Wu, J.; Ma, H.; Wang, S.; Wang, J. Influence of Rooftop Photovoltaic on Campus Thermal and Humid Environment and Optimization of Building Configurations. Sol. Energy 2026, 305, 114235. [Google Scholar] [CrossRef] [Scilit]
- Ma, H.; Liu, Y.; Hou, C.; Wang, G.; Luo, X. Numerical Investigation on the Thermal-Flow Performance of Humid Air-Water in the Interspace Outside Staggered Tube Bundles. Int. J. Heat Mass Transf. 2021, 166, 120784. [Google Scholar] [CrossRef] [Scilit]
- Xie, Y.; Min, K.; Ma, H.; Ding, R.; Wang, S.; Liu, Y. Performance and Economic Comparison of Three Annual Air-Conditioning Systems in Sow Houses. Appl. Therm. Eng. 2024, 239, 122114. [Google Scholar] [CrossRef] [Scilit]
- Xie, Y.; Ma, H.; Zhuang, W.; Wang, J. Numerical Study on the Heat and Mass Transfer Characteristics of Pig-Water-Wet Air in Pig Houses. Int. J. Thermophys. 2025, 47, 14. [Google Scholar] [CrossRef] [Scilit]
- Ma, H.; Han, X.; Ding, R.; Wang, L.; Liu, Y. Study on Gas-Liquid Flow and Separation Characteristics in the Interspace of Complex Parallel Perforated Wavy Plate Deflectors. Int. Commun. Heat. Mass. Transf. 2023, 140, 106498. [Google Scholar] [CrossRef] [Scilit]
- Li, R.; Zhou, W.; Wu, J.; Li, J.; Dong, X.; Zhao, J. Numerical Method and Analysis of a Tube Indirect Evaporative Cooler. Therm. Sci. 2022, 26, 375–387. [Google Scholar] [CrossRef] [Scilit]
- Feng, X.; Zhang, Z.; Zhang, Y.; Zhang, Y.; Yao, Y.; Wang, X. Investigating Thermal Performance and Energy Efficiency in Under-Floor Air Distribution Data Centers: A Case Study. Therm. Sci. Eng. Prog. 2024, 54, 102823. [Google Scholar] [CrossRef] [Scilit]
- Lua, K.B.; Wang, C.-C. Single-Phase Immersion Cooling for Data Centers and HPC: Recent Advances and System-Level Challenges. Renew. Sustain. Energy Rev. 2026, 232, 116786. [Google Scholar] [CrossRef] [Scilit]

Disclaimer/Publisher’s Note: The statements, opinions and data contained in all publications are solely those of the individual author(s) and contributor(s) and not of MDPI and/or the editor(s). MDPI and/or the editor(s) disclaim responsibility for any injury to people or property resulting from any ideas, methods, instructions or products referred to in the content. |
© 2026 by the authors. Licensee MDPI, Basel, Switzerland. This article is an open access article distributed under the terms and conditions of the Creative Commons Attribution (CC BY) license.