


Abstract
U-shaped steel strengthening can substantially enhance the mechanical performance of reinforced concrete (RC) beams while having minimal impact on their cross-sectional dimensions and self-weight. However, the influence of strengthening RC beams with U-shaped steel casing on the overall seismic performance of frame joints remains insufficiently investigated through experimental studies. To address this gap, four exterior beam-column joint specimens were tested under quasi-static cyclic loading without column axial load. The specimens comprised one reference specimen and three specimens with U-shaped steel-strengthened RC beams, with the U-shaped steel plate thickness as the primary variable. The failure modes, hysteretic behavior, load-carrying capacity, deformation response, stiffness degradation and energy dissipation performance were evaluated. The results showed that all specimens exhibited plastic-hinge-dominated failures at the beam ends, while U-shaped steel strengthening provided only limited improvement in the overall lateral load-carrying capacity. Compared with the reference specimen, the strengthened specimens exhibited fuller hysteretic loops and improved energy dissipation performance at large drift ratios. At a drift ratio of 6%, the energy dissipated per hysteretic loop by specimens SJ1, SJ2, and SJ3 increased by 6.5%, 14.3%, and 8.1%, respectively, compared with the reference specimen NJ1. The corresponding equivalent viscous damping coefficients increased by 15.4%, 16.5%, and 8.9%, respectively. The average test-termination-based displacement ratios of the strengthened specimens exceeded 3.2, indicating considerable deformation capacity up to the prescribed termination drift ratio of 8%.
1. Introduction
Over the past decade, U-shaped steel–concrete composite beams (USCCBs) have been widely used in civil engineering due to their advantages of high load-carrying capacity, superior stiffness, good ductility, and reduced temporary formwork requirements. Significant research advances have been made in their flexural performance [1,2,3], shear resistance [4], fire behavior [5], seismic behavior under cyclic loading [6], and the seismic performance of beam–column joints [7,8,9]. In view of the excellent mechanical performance of USCCBs, and inspired by their design and detailing, some researchers have recently proposed a strengthening technique for reinforced concrete (RC) beams using U-shaped steel casing. This technique has demonstrated promising strengthening effectiveness.
Xu et al. [10,11] conducted a series of tests on fire-damaged RC beams strengthened with thin-walled U-shaped steel casings, where the annular gaps between the steel casings and the RC beams were fully filled with non-shrink grout. They investigated the influences of U-shaped steel plate thickness and fire exposure time on the flexural behavior of the strengthened beams, as well as the effects of U-shaped steel plate thickness and shear-span ratio on the shear behavior. The results demonstrated that the U-shaped steel strengthening technique substantially increased both the flexural and shear capacities of the RC beams. Jin et al. [12,13] proposed a U-shaped steel and concrete composite anchorage system, which was successfully applied to more than 50 prefabricated hollow slab bridges in China. This technique can both enhance the transverse connections between slabs and improve the load-carrying capacity of individual beams, achieving remarkable strengthening effects. Subsequently, Jin et al. [14] conducted further experimental studies on the flexural behavior of RC beams strengthened with a U-shaped steel and concrete composite anchorage system. The results demonstrated significant improvements in both the load-carrying capacity and the deformation capacity. The extent of pre-existing damage had a negligible effect on the ultimate load-carrying capacity of the strengthened beams, but a notable effect on their ductility. Zhou et al. [15] implemented the U-shaped steel casing technique in a practical strengthening project and conducted a comparative study with the conventional angle-steel-and-batten strengthening technique. Their findings showed that U-shaped steel casing can significantly improve the load-carrying capacity of frame beams while having little effect on the cross-sectional dimensions and appearance of the members. Its overall strengthening effect is superior to that of the angle-steel-and-batten technique. During the nearly two years following their return to service, the strengthened beams showed no abnormal behavior, indicating that the intended strengthening objectives had been achieved. Lin et al. [16] proposed a technique for strengthening RC beams with U-shaped steel using a composite anchorage of through bolts and steel-bonding adhesive. It was found that the initial loading level had little effect on the flexural behavior of the strengthened beams. With an increase in the thickness of the U-shaped steel bottom plate and the height of the steel box, the flexural behavior of the strengthened beams was significantly improved, with the increasing height of the steel box having a more pronounced effect. Lin et al. [17] further carried out experimental studies on the flexural fatigue performance of RC beams strengthened with U-shaped steel casing. It was found that with an increase in the height of the steel box or the thickness of the U-shaped steel bottom plate, the fatigue life of the strengthened beams increased substantially, far exceeding that of the unstrengthened reference beams.
The above studies demonstrate that the U-shaped steel strengthening technique can rapidly and substantially enhance the mechanical properties of RC beams, with its effectiveness verified in practical engineering applications. Moreover, this strengthening technique has a relatively small impact on the cross-sectional dimensions of RC beams and adds very little extra self-weight. In general, the initial damage has little or even negligible influence on the strengthening effect. These advantages indicate that this strengthening technique has considerable potential for widespread application in engineering practice.
Beam–column frame joints are subjected to the combined action of axial forces, bending moments, and shear forces transferred from the columns, together with bending moments and shear forces transferred from the beams, resulting in very complex stress states. Joint failure can lead to the loss of load-carrying capacities of both the connected beams and columns, while it is generally difficult to repair damaged joints. Therefore, frame joints must be designed with sufficient strength, stiffness, ductility, and energy dissipation capacity. Over the past decade or more, several studies have investigated the seismic performance of joints connecting USCCBs and RC columns. Park et al. [18] developed beam–column joints by directly welding USCCBs to the longitudinal reinforcement of RC columns using diagonal rebars and stirrups to form the joint connections. Quasi-static tests showed that plastic hinges formed at the beam ends and that the inter-story drift ratio exceeded 4%, indicating excellent energy dissipation capacity. Both shear slip and bond slip at the joints were limited, and the joint shear capacity was greater than the corresponding shear demand. To prevent joint failure caused by concrete crushing, no axial load was applied to the column during testing. Hwang et al. [19] proposed a type of joint connection USCCBs and RC columns externally strengthened with angle steel. In this type of joint, the U-shaped steel webs were designed to extend continuously through the joints, while the valgus top flanges and bottom plates were cut off to facilitate construction and concrete casting. The results showed that the specimens failed due to the tensile fracture of the webs following local buckling. The inter-story drift ratio reached 4% for interior joints and 3% for exterior joints. The seismic shear capacity of the joints was 1.53 to 2.22 times the corresponding shear demand, indicating that joint shear failure was unlikely to occur. During the quasi-static tests, as sufficiently large axial loads could not be applied to the columns, the effect of the axial compression ratio was not considered. Kim et al. [20] experimentally investigated the seismic performance of a novel joint between a USCCB and an RC column. The testing results indicated that failure occurred at the beam end support (the bottom connection plate) and both the flexural capacity of the composite beam and the shear capacity of the joint exceeded their corresponding nominal design values. To prevent the shear failure of the bolts on the beam side, it is recommended to increase the thickness of the connection plate or the edge distance of the bolt at the joint, and at the same time extend the length of the bottom connection plate beneath the beam.
To sum up, previous studies primarily focused on the mechanical performance of individual RC beams strengthened with U-shaped steel casing [10,11,12,13,14,15,16,17] and the seismic performance of joints connecting USCCBs to RC columns [18,19,20]. However, the influence of strengthening existing RC beams with U-shaped steel casing on the seismic behavior of the original beam–column joint system remains insufficiently investigated [21]. Strengthening RC beams with U-shaped steel casing may alter the relative strength between the beam and the column. Under seismic loading, this change may cause plastic hinge relocation and even lead to joint shear failure, thereby altering the hysteretic characteristics of the beam–column joints. Such changes could potentially compromise the seismic design principles of “strong joint, weak member” and “strong column, weak beam”. Previous studies on the seismic performance of joints connecting USCCBs to RC columns have shown that with appropriate detailing and construction, these joints exhibit good energy dissipation capacity with plastic hinges forming at the beam ends. These findings can provide a useful theoretical basis for investigating the seismic performance of joints connecting RC columns to U-shaped steel-strengthened RC beams. However, RC beams strengthened with U-shaped steel casing are formed after the original structure has been constructed, which differs fundamentally from monolithically constructed USCCBs in terms of construction and connection details with RC columns. Consequently, the seismic behavior observed in previously studied USCCB- RC column connections cannot be directly extended to existing RC beam–column joints after beam strengthening. Therefore, a systematic investigation of the seismic performance of joints between RC columns and U-shaped steel-strengthened RC beams, and clarification of the influence of beam strengthening on the mechanical behavior of the original beam–column joint system, are of considerable theoretical significance and high practical engineering value.
Under this research background, a total of four exterior beam–column joint specimens, consisting of one reference specimen and three strengthened specimens, were designed in this paper. A systematic quasi-static cyclic test program was conducted to investigate the seismic behavior of joints between RC columns and U-shaped steel-strengthened RC beams. Special emphasis was placed on clarifying the influence mechanism of the thickness of the U-shaped steel plate on the hysteretic performance of the joints. The outcomes of this study are expected to facilitate the wider application of the U-shaped steel strengthening technique for RC beams, and provide a foundation for developing a comprehensive beam–column joint strengthening system in the future.
2. Experimental Program
2.1. Specimen Details
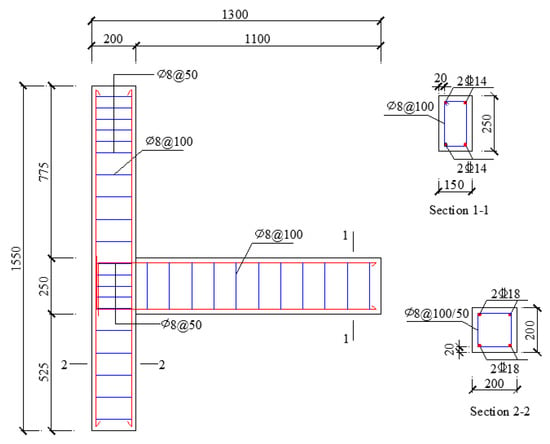
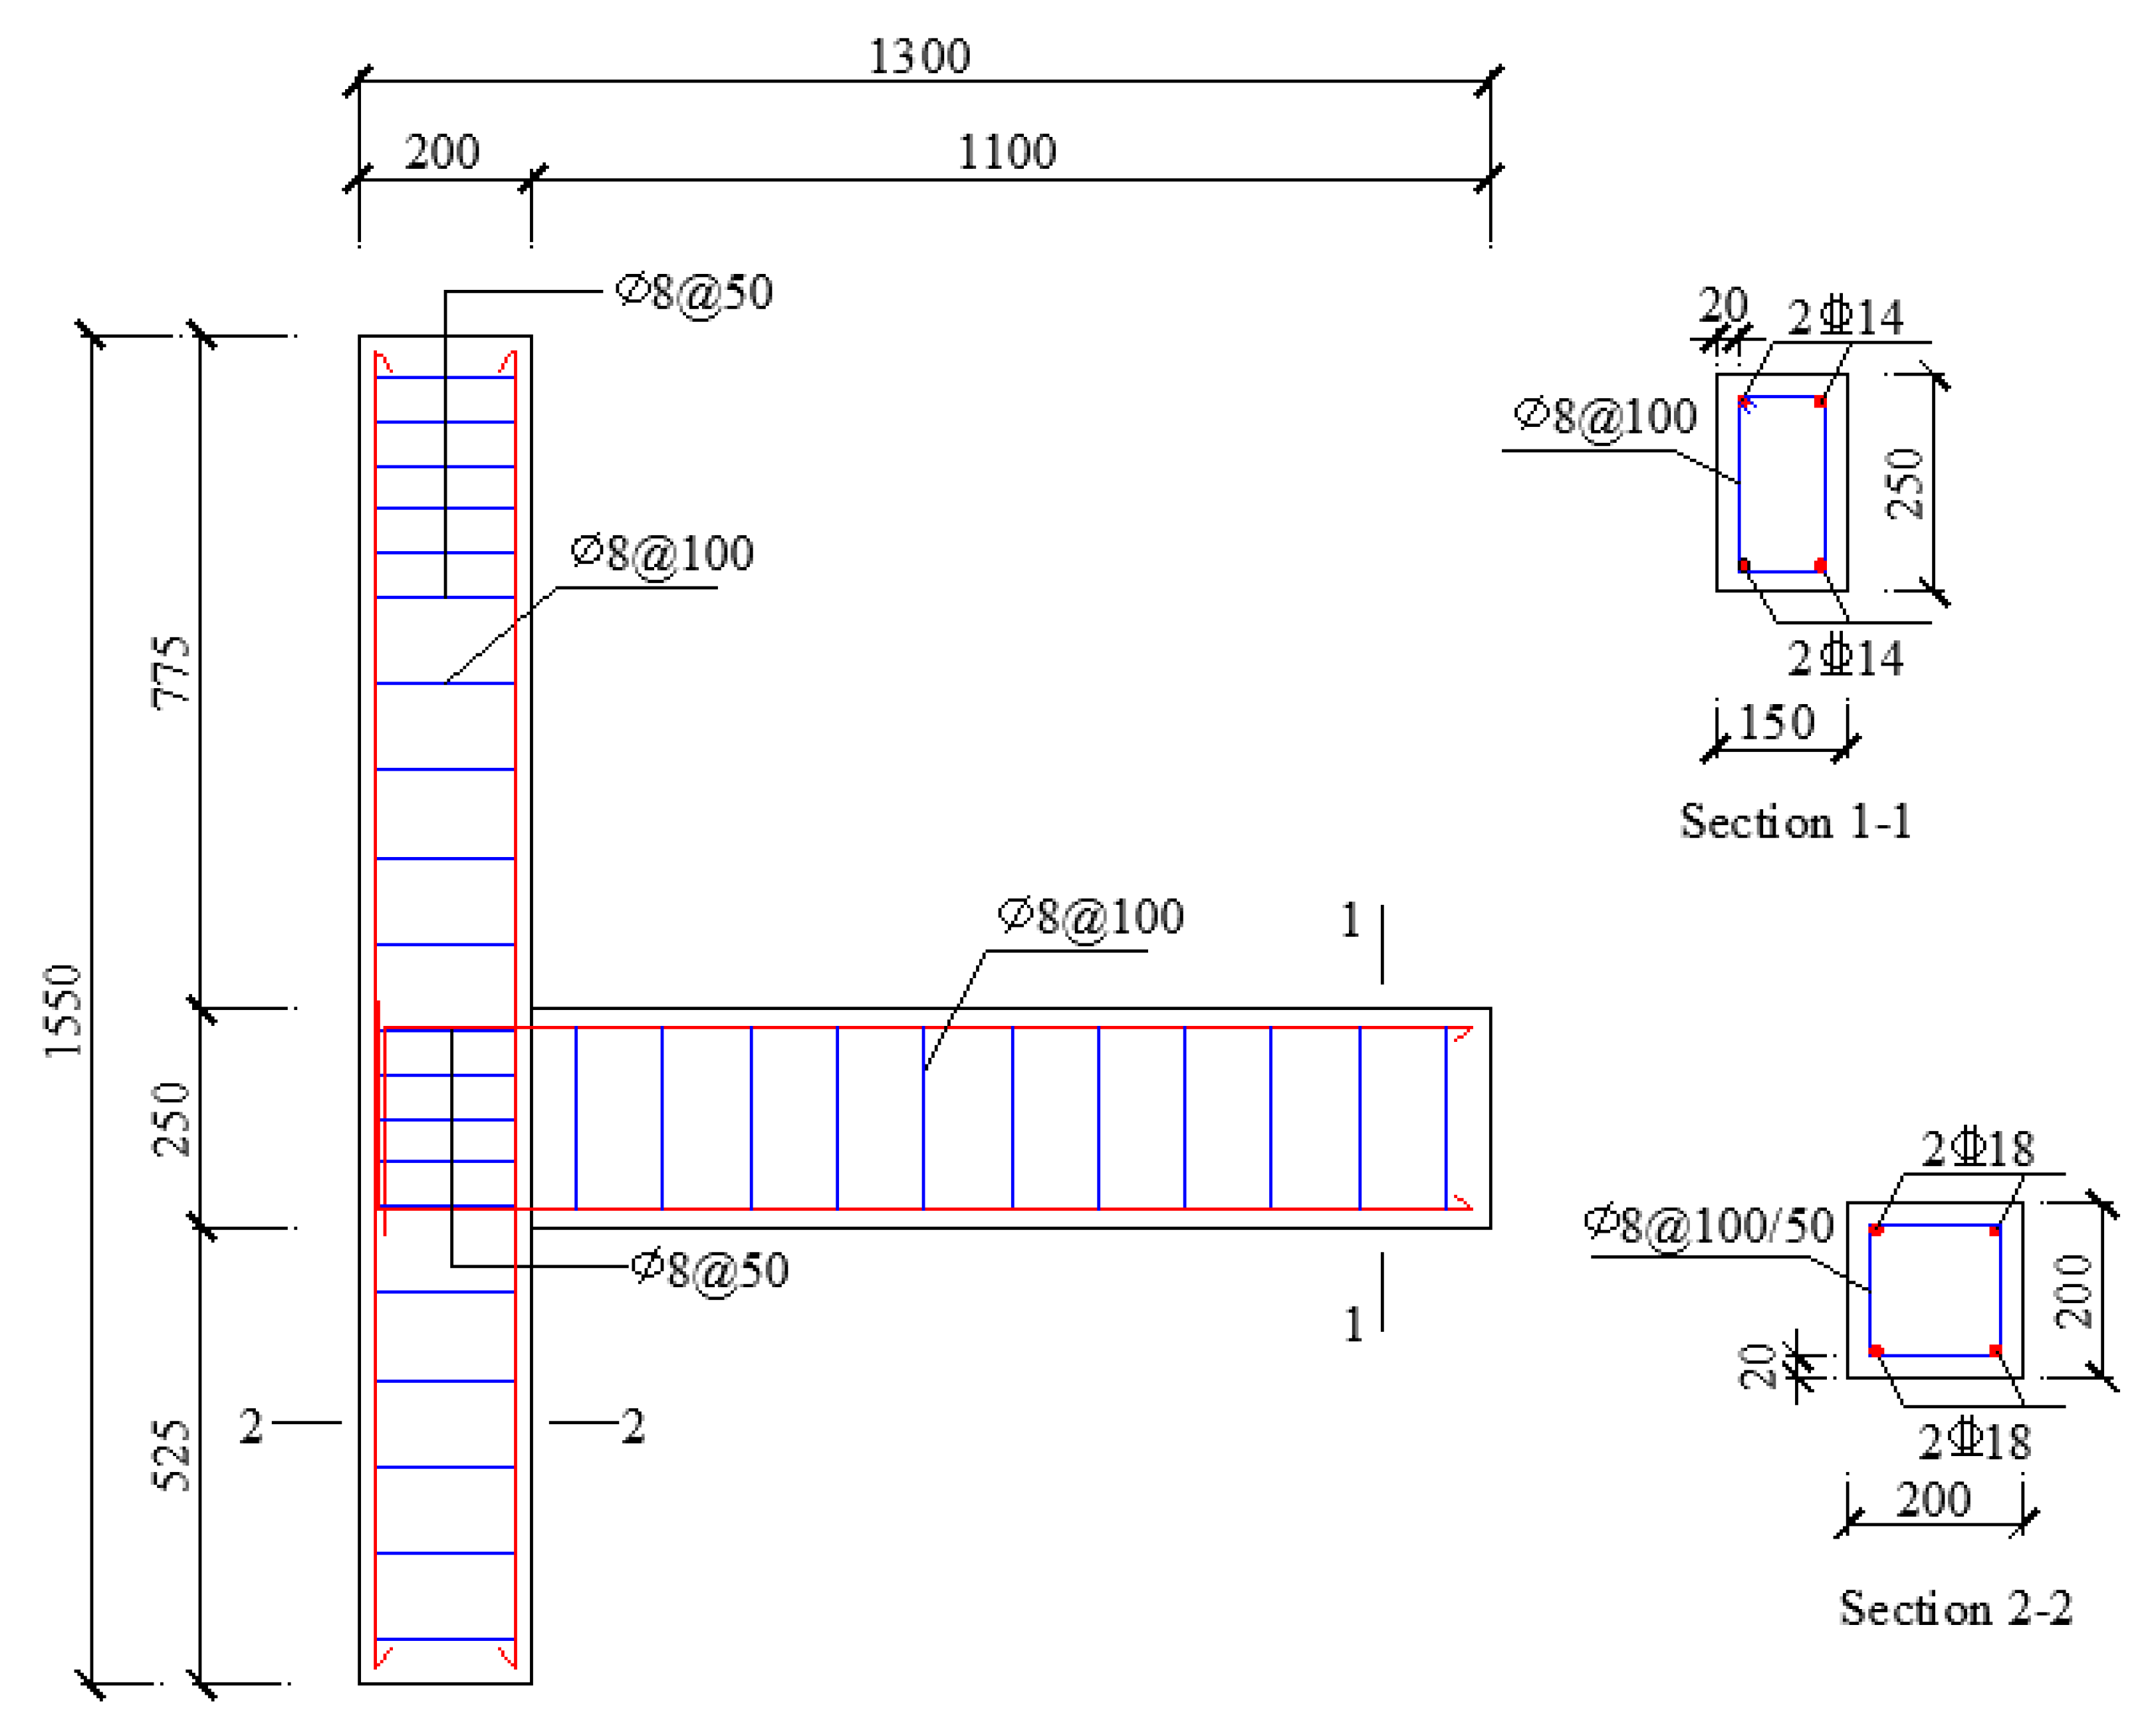
A total of four exterior beam–column joint specimens were designed and fabricated in this experimental program, including one reference specimen and three strengthened specimens. The key design parameters of the specimens are summarized in Table 1. The cross-sectional dimensions and reinforcement details of the unstrengthened specimens are shown in Figure 1. All specimens were cast with C40-grade commercial ready-mixed concrete supplied by Henan Sanjun Environmental Protection Technology Co., Ltd., Zhengzhou, Henan, China. In addition, three standard concrete cubic blocks with dimensions of 150 mm × 150 mm × 150 mm were fabricated. After 28 days of standard curing under the conditions specified in GB/T 50081-2019 [22], the cubic compressive strength of the concrete was measured following the standard test method, with the results presented in Table 2. According to the standard test procedures specified in GB/T 228.1-2021 [23] and GB/T 28900-2022 [24], standard tensile specimens for longitudinal reinforcement (manufactured by Qinyang Hongda Steel Co., Ltd., Qinyang, Henan, China), transverse stirrups (manufactured by Huaxinyuan Iron & Steel Group Co., Ltd., Hejin, Shanxi, China), and U-shaped steel plates (manufactured by Shanxi Taigang Stainless Steel Co., Ltd., Taiyuan, Shanxi, China) were prepared. The mechanical properties of the respective steel materials were measured and presented in Table 3.
Table 1.
Design parameters of specimens.
Figure 1.
Cross-sectional dimensions and reinforcement details. (Units: mm).
Table 2.
Mechanical Properties of Concrete.
Table 3.
Mechanical properties of steel.
2.2. Strengthening Scheme
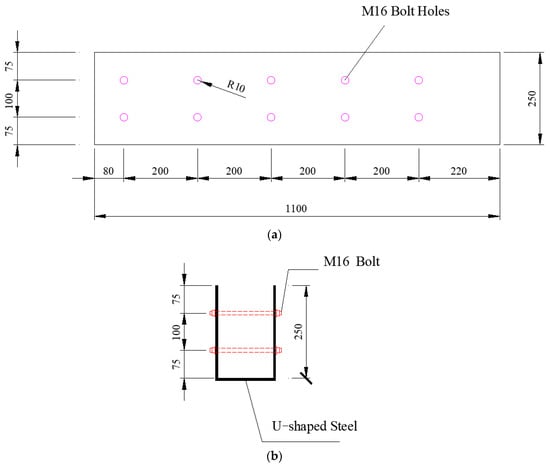
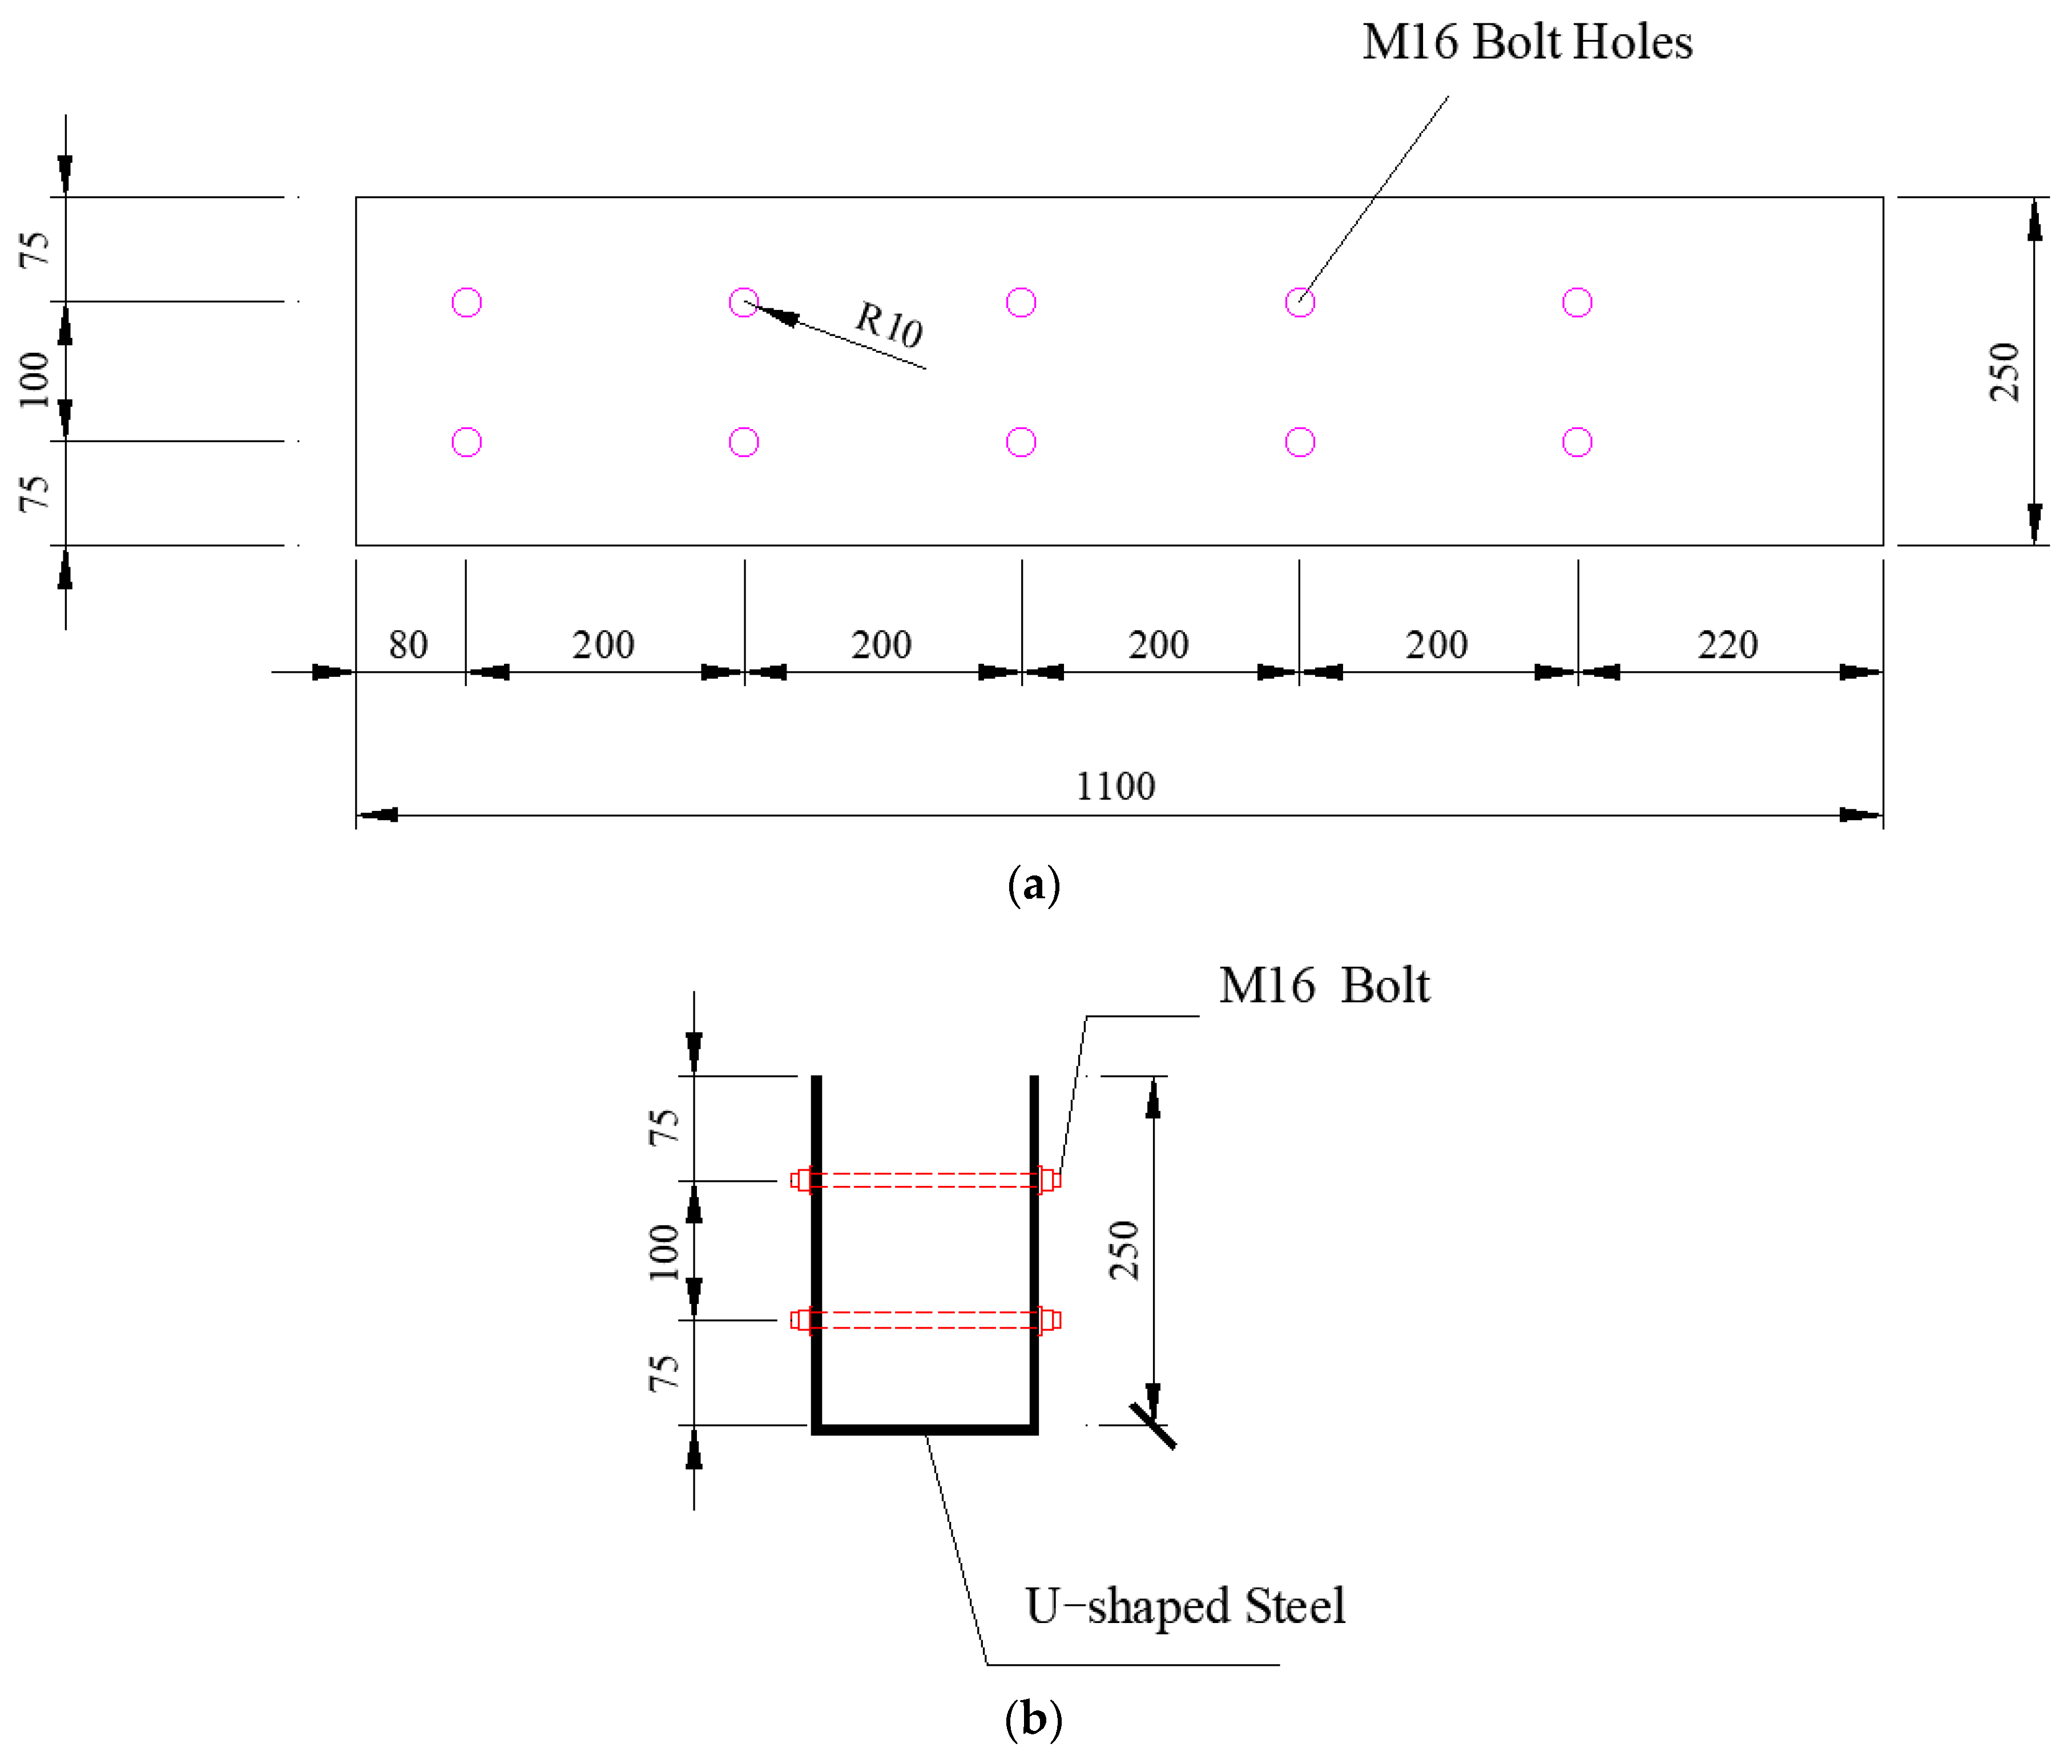
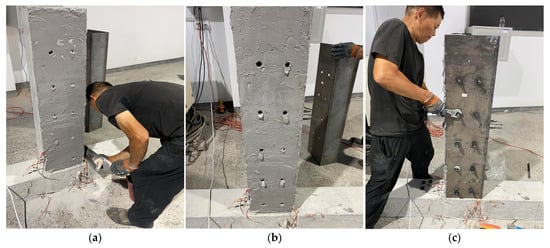
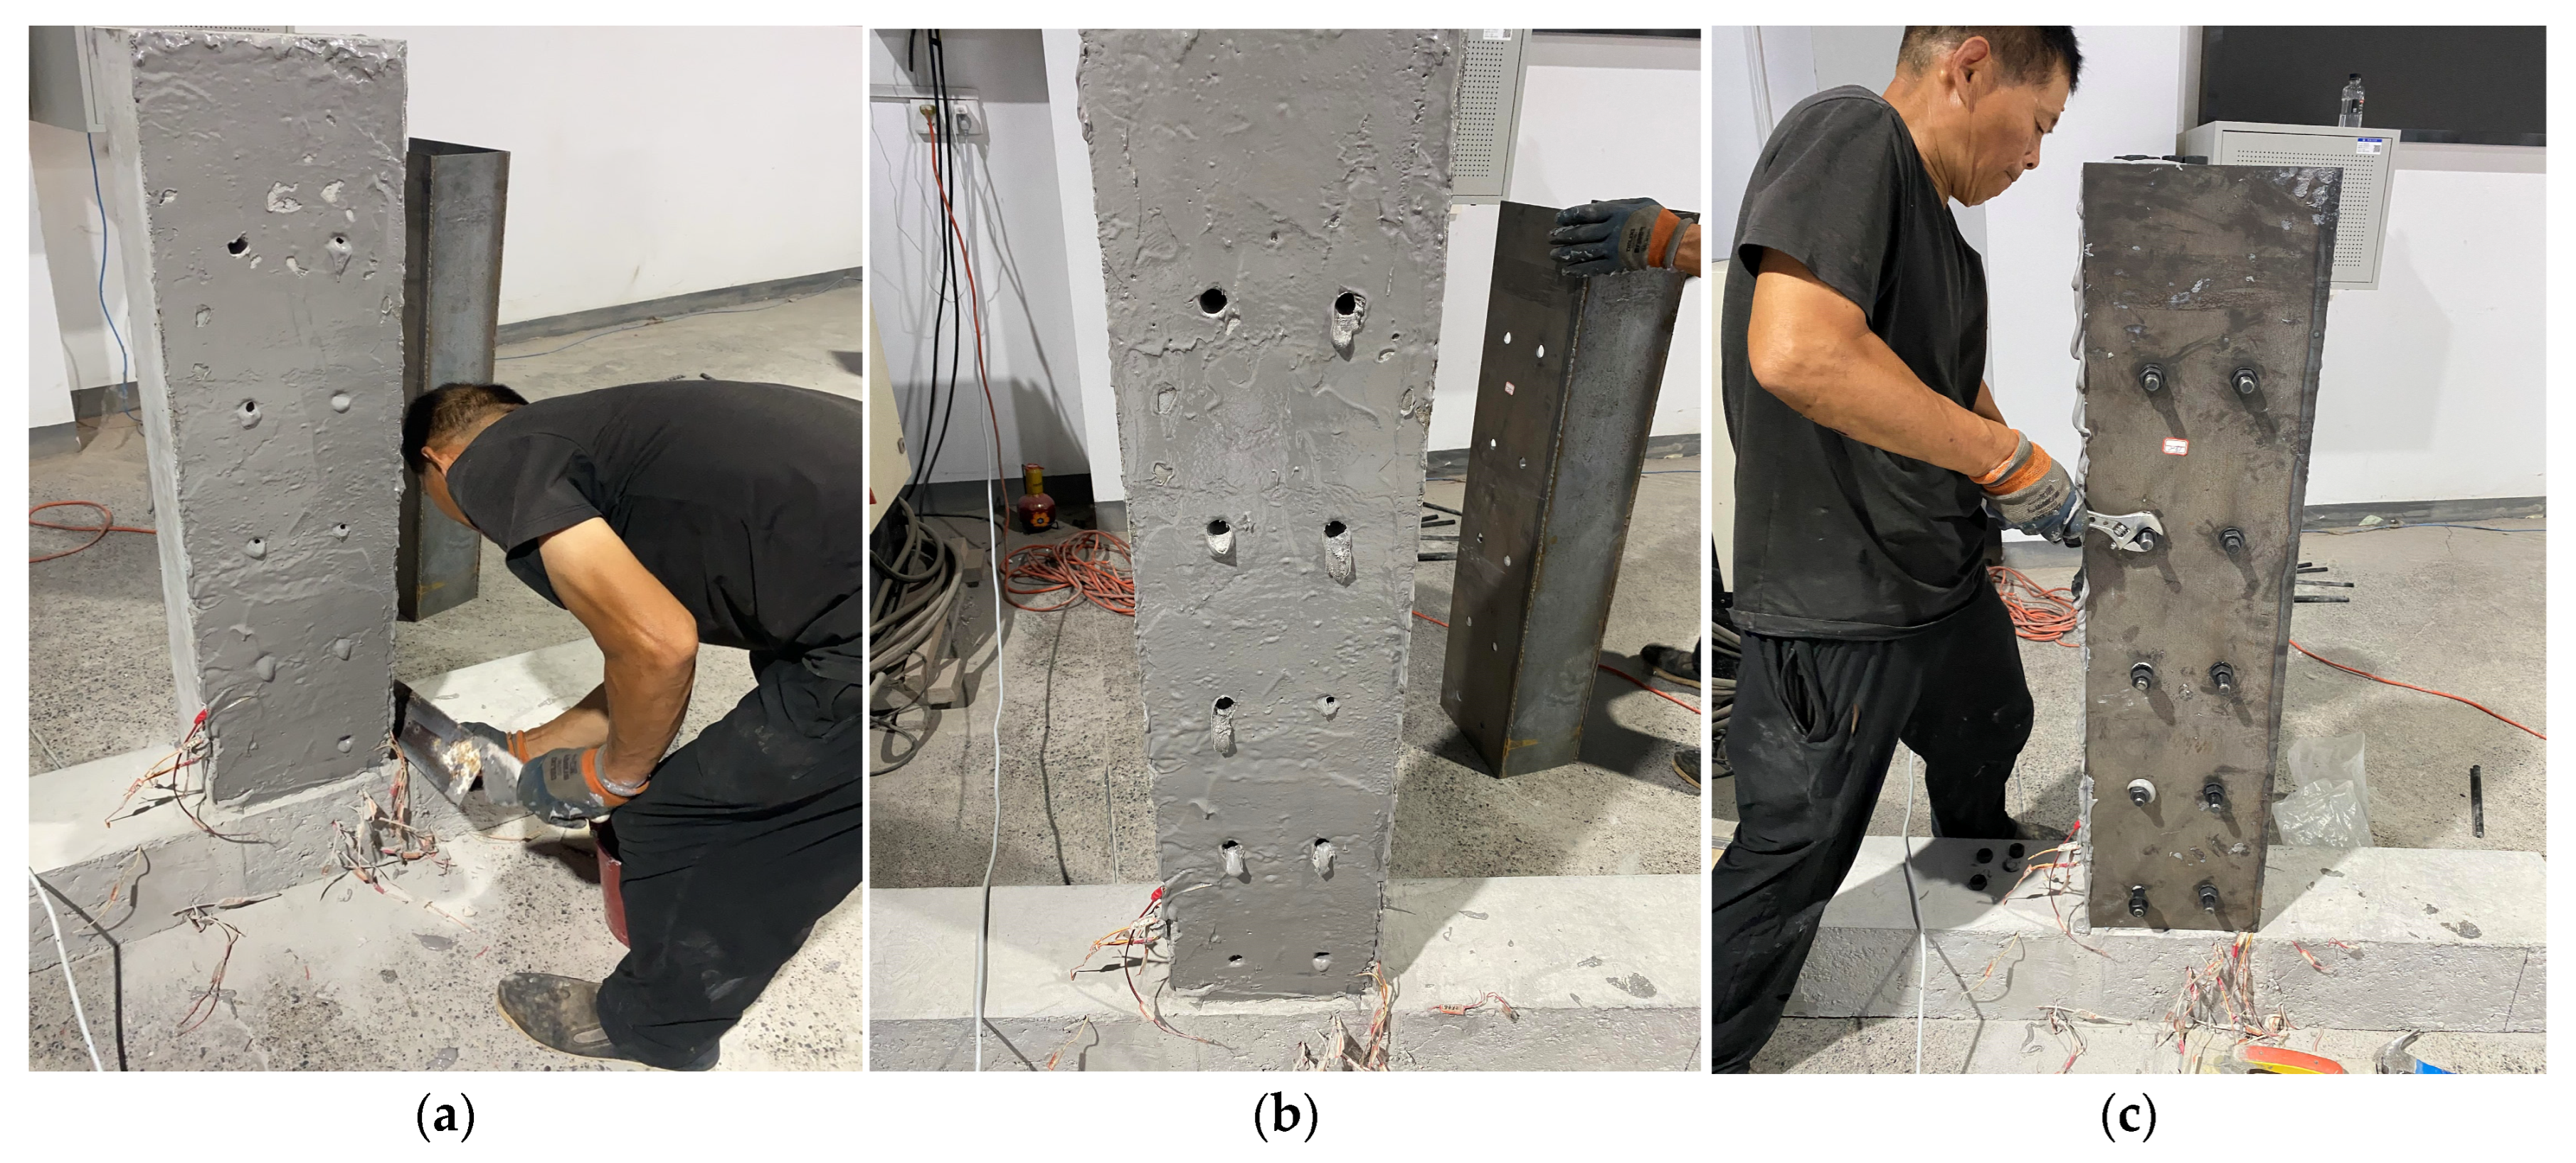
First, the U-shaped steel was prefabricated to precisely match the cross-sectional dimensions of the RC beam, and bolt holes were predrilled in the steel plate. The detailed design parameters are shown in Figure 2. Corresponding bolt holes were then drilled in the RC beam, with their positions precisely aligned with those in the prefabricated steel casing and their nominal diameters kept essentially identical. Subsequently, the surface of the RC beam was cleaned to remove dust and roughened to improve bonding, and a 3 to 5 mm-thick layer of steel adhesive manufactured by Jiagu Boshi (Shanghai) Building Technology Co., Ltd., Shanghai, China was uniformly applied to the prepared surface. At the same time, the inner contact surface of the U-shaped steel plate was polished. The U-shaped steel plate was subsequently positioned and installed accurately. M16 high-strength through bolts (nominal strength grade 8.8), purchased from a local fastener supplier in Zhengzhou, Henan, China, were then inserted, with flat washers installed on both sides of the beam before the nuts were tightened to the design preload. The strengthening procedure is illustrated in Figure 3. During the strengthening process, several small shallow grooves were precut on the surface of the RC beam or adjacent to the joint core region using an angle grinder. The lead wires of the strain gauges were embedded in these grooves and routed to the exterior to prevent mechanical damage during installation and avoid obstruction by the U-shaped steel.
Figure 2.
Design parameters of the U-shaped steel (Units: mm). (a) Elevation view; (b) Section view.
Figure 3.
Construction procedure for RC beams strengthened with U-shaped steel casing. (a) Apply steel adhesive; (b) Install the U-shaped steel; (c) Tighten the nuts.
2.3. Test Setup and Procedure
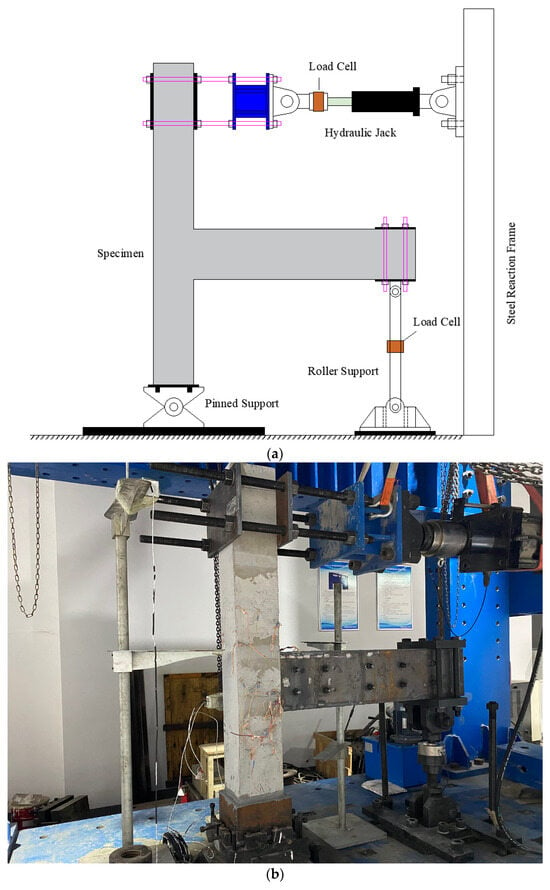
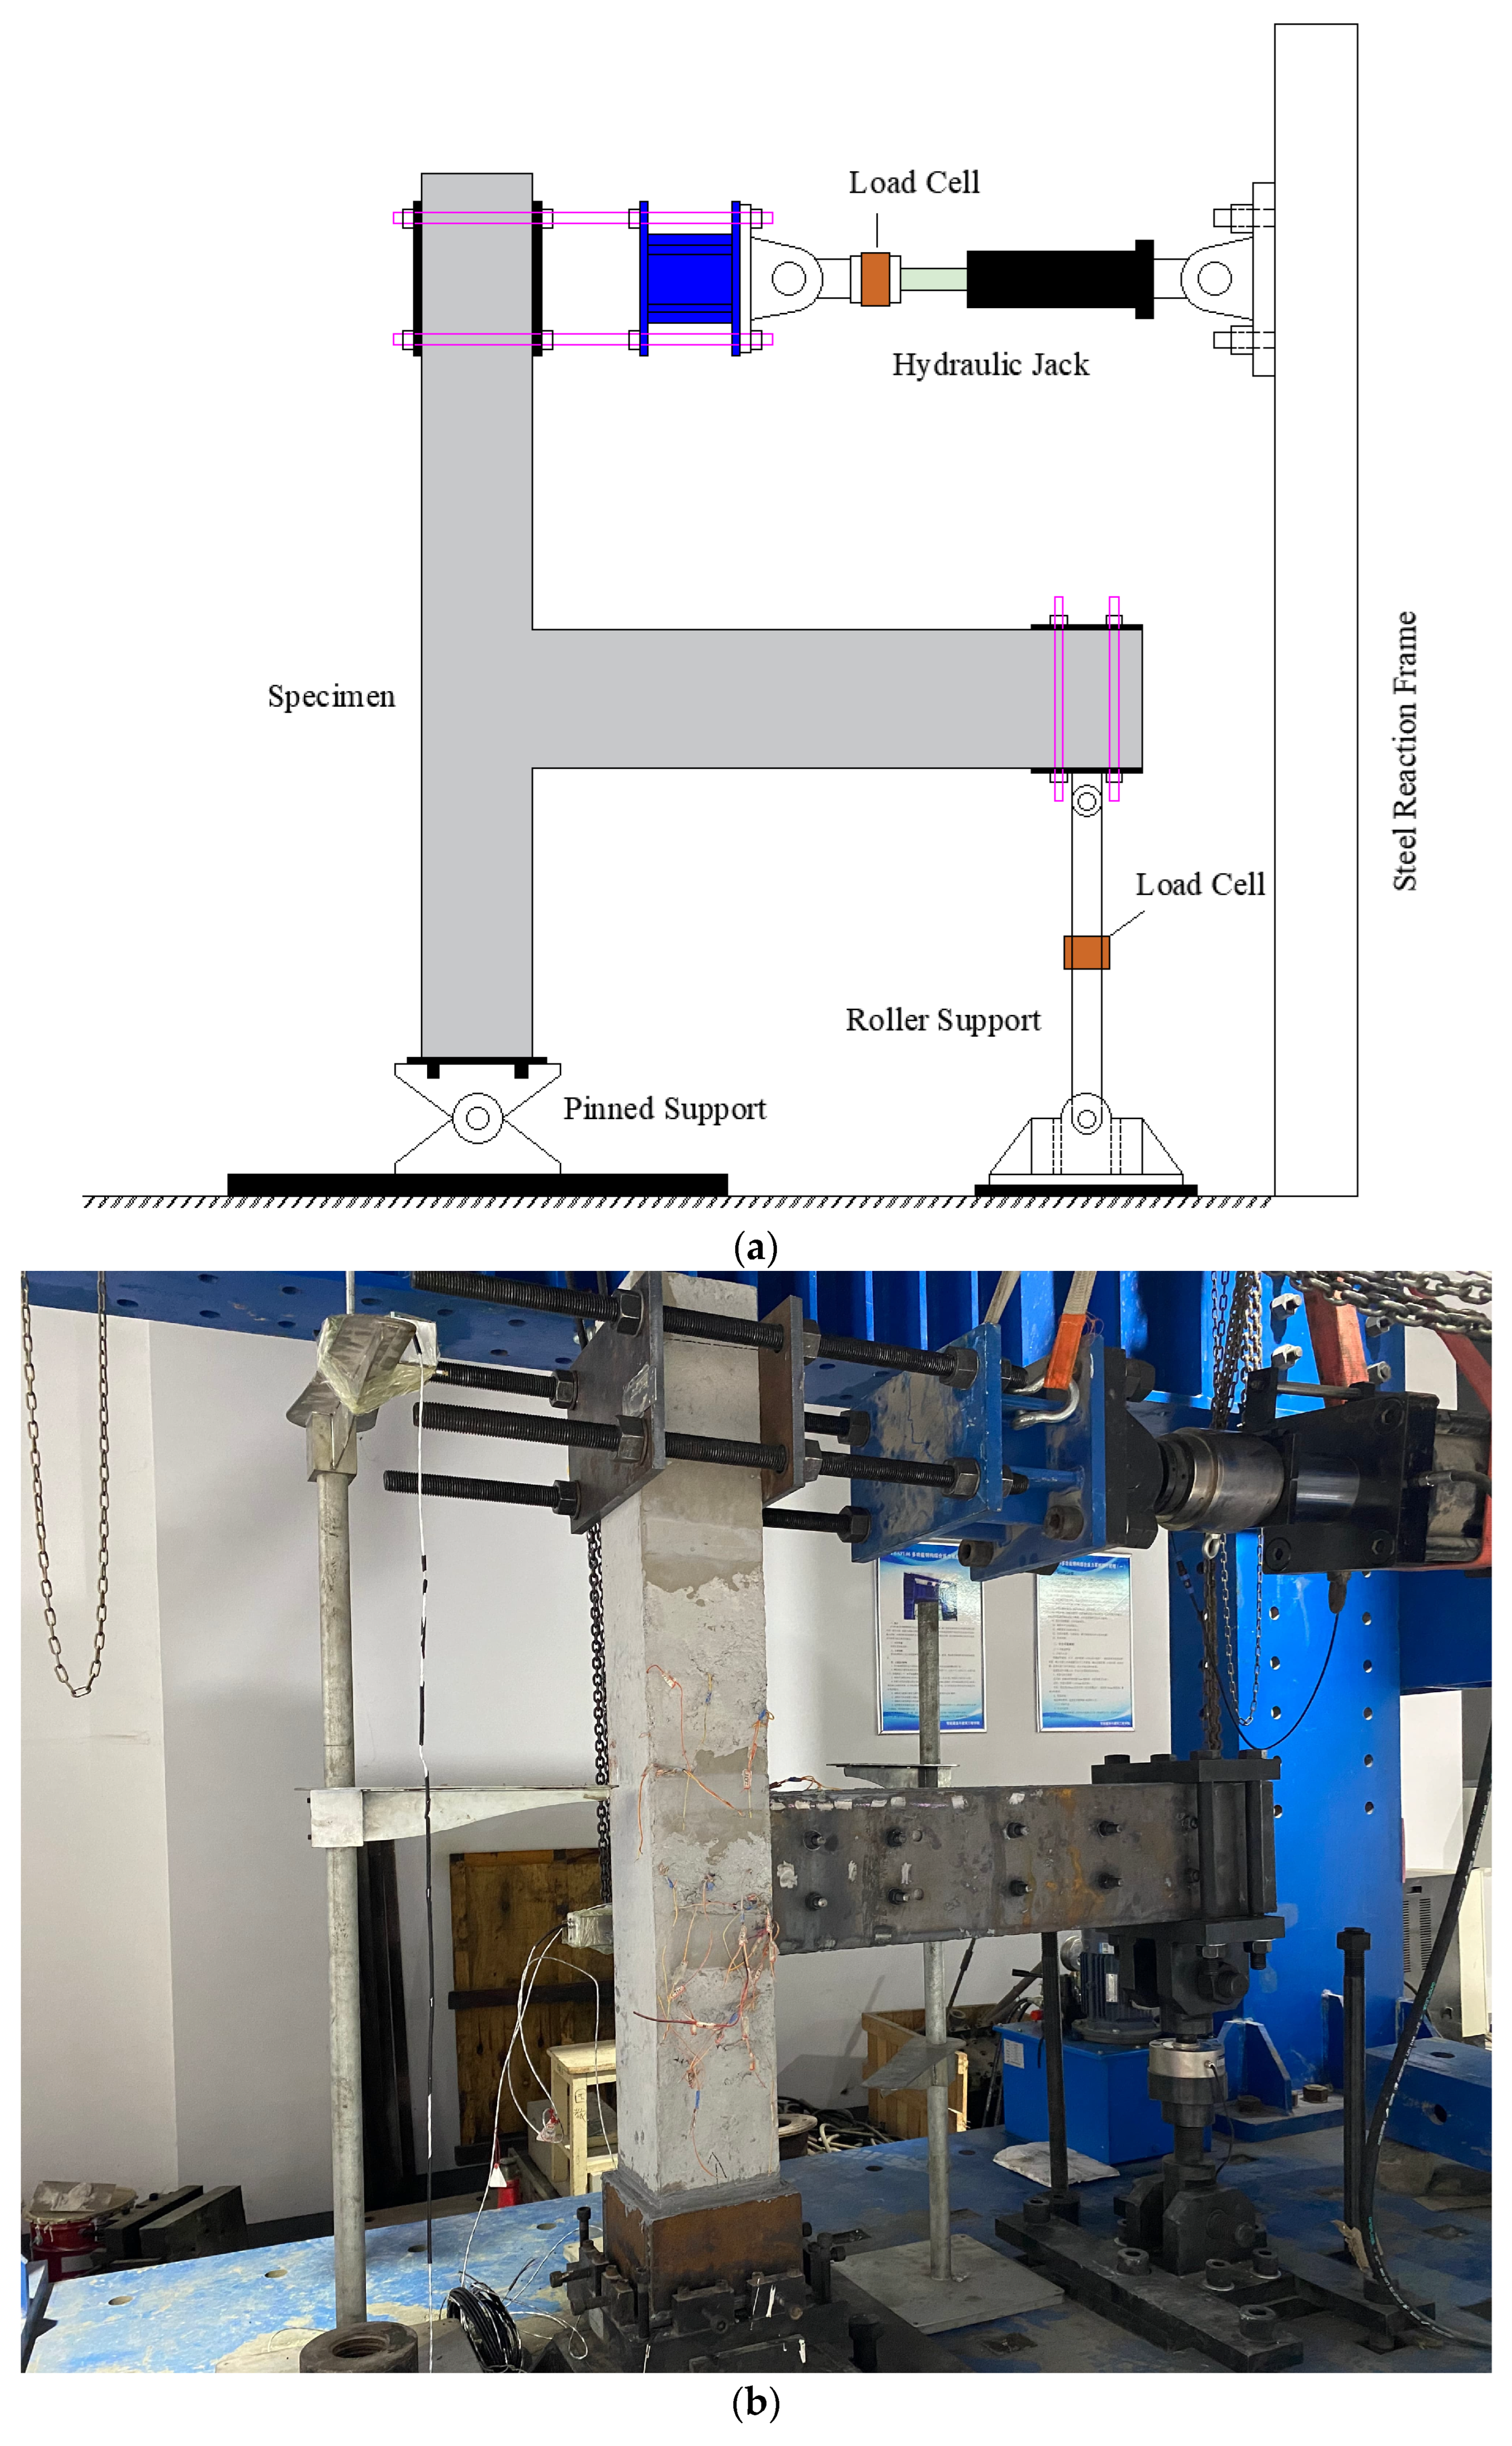
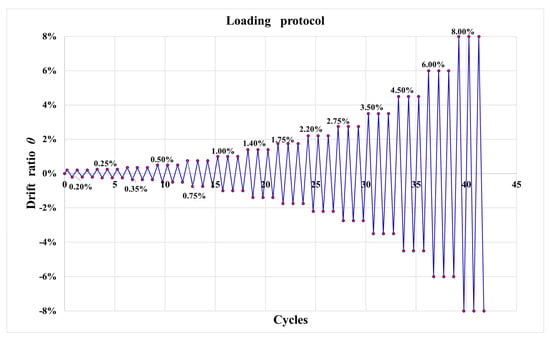
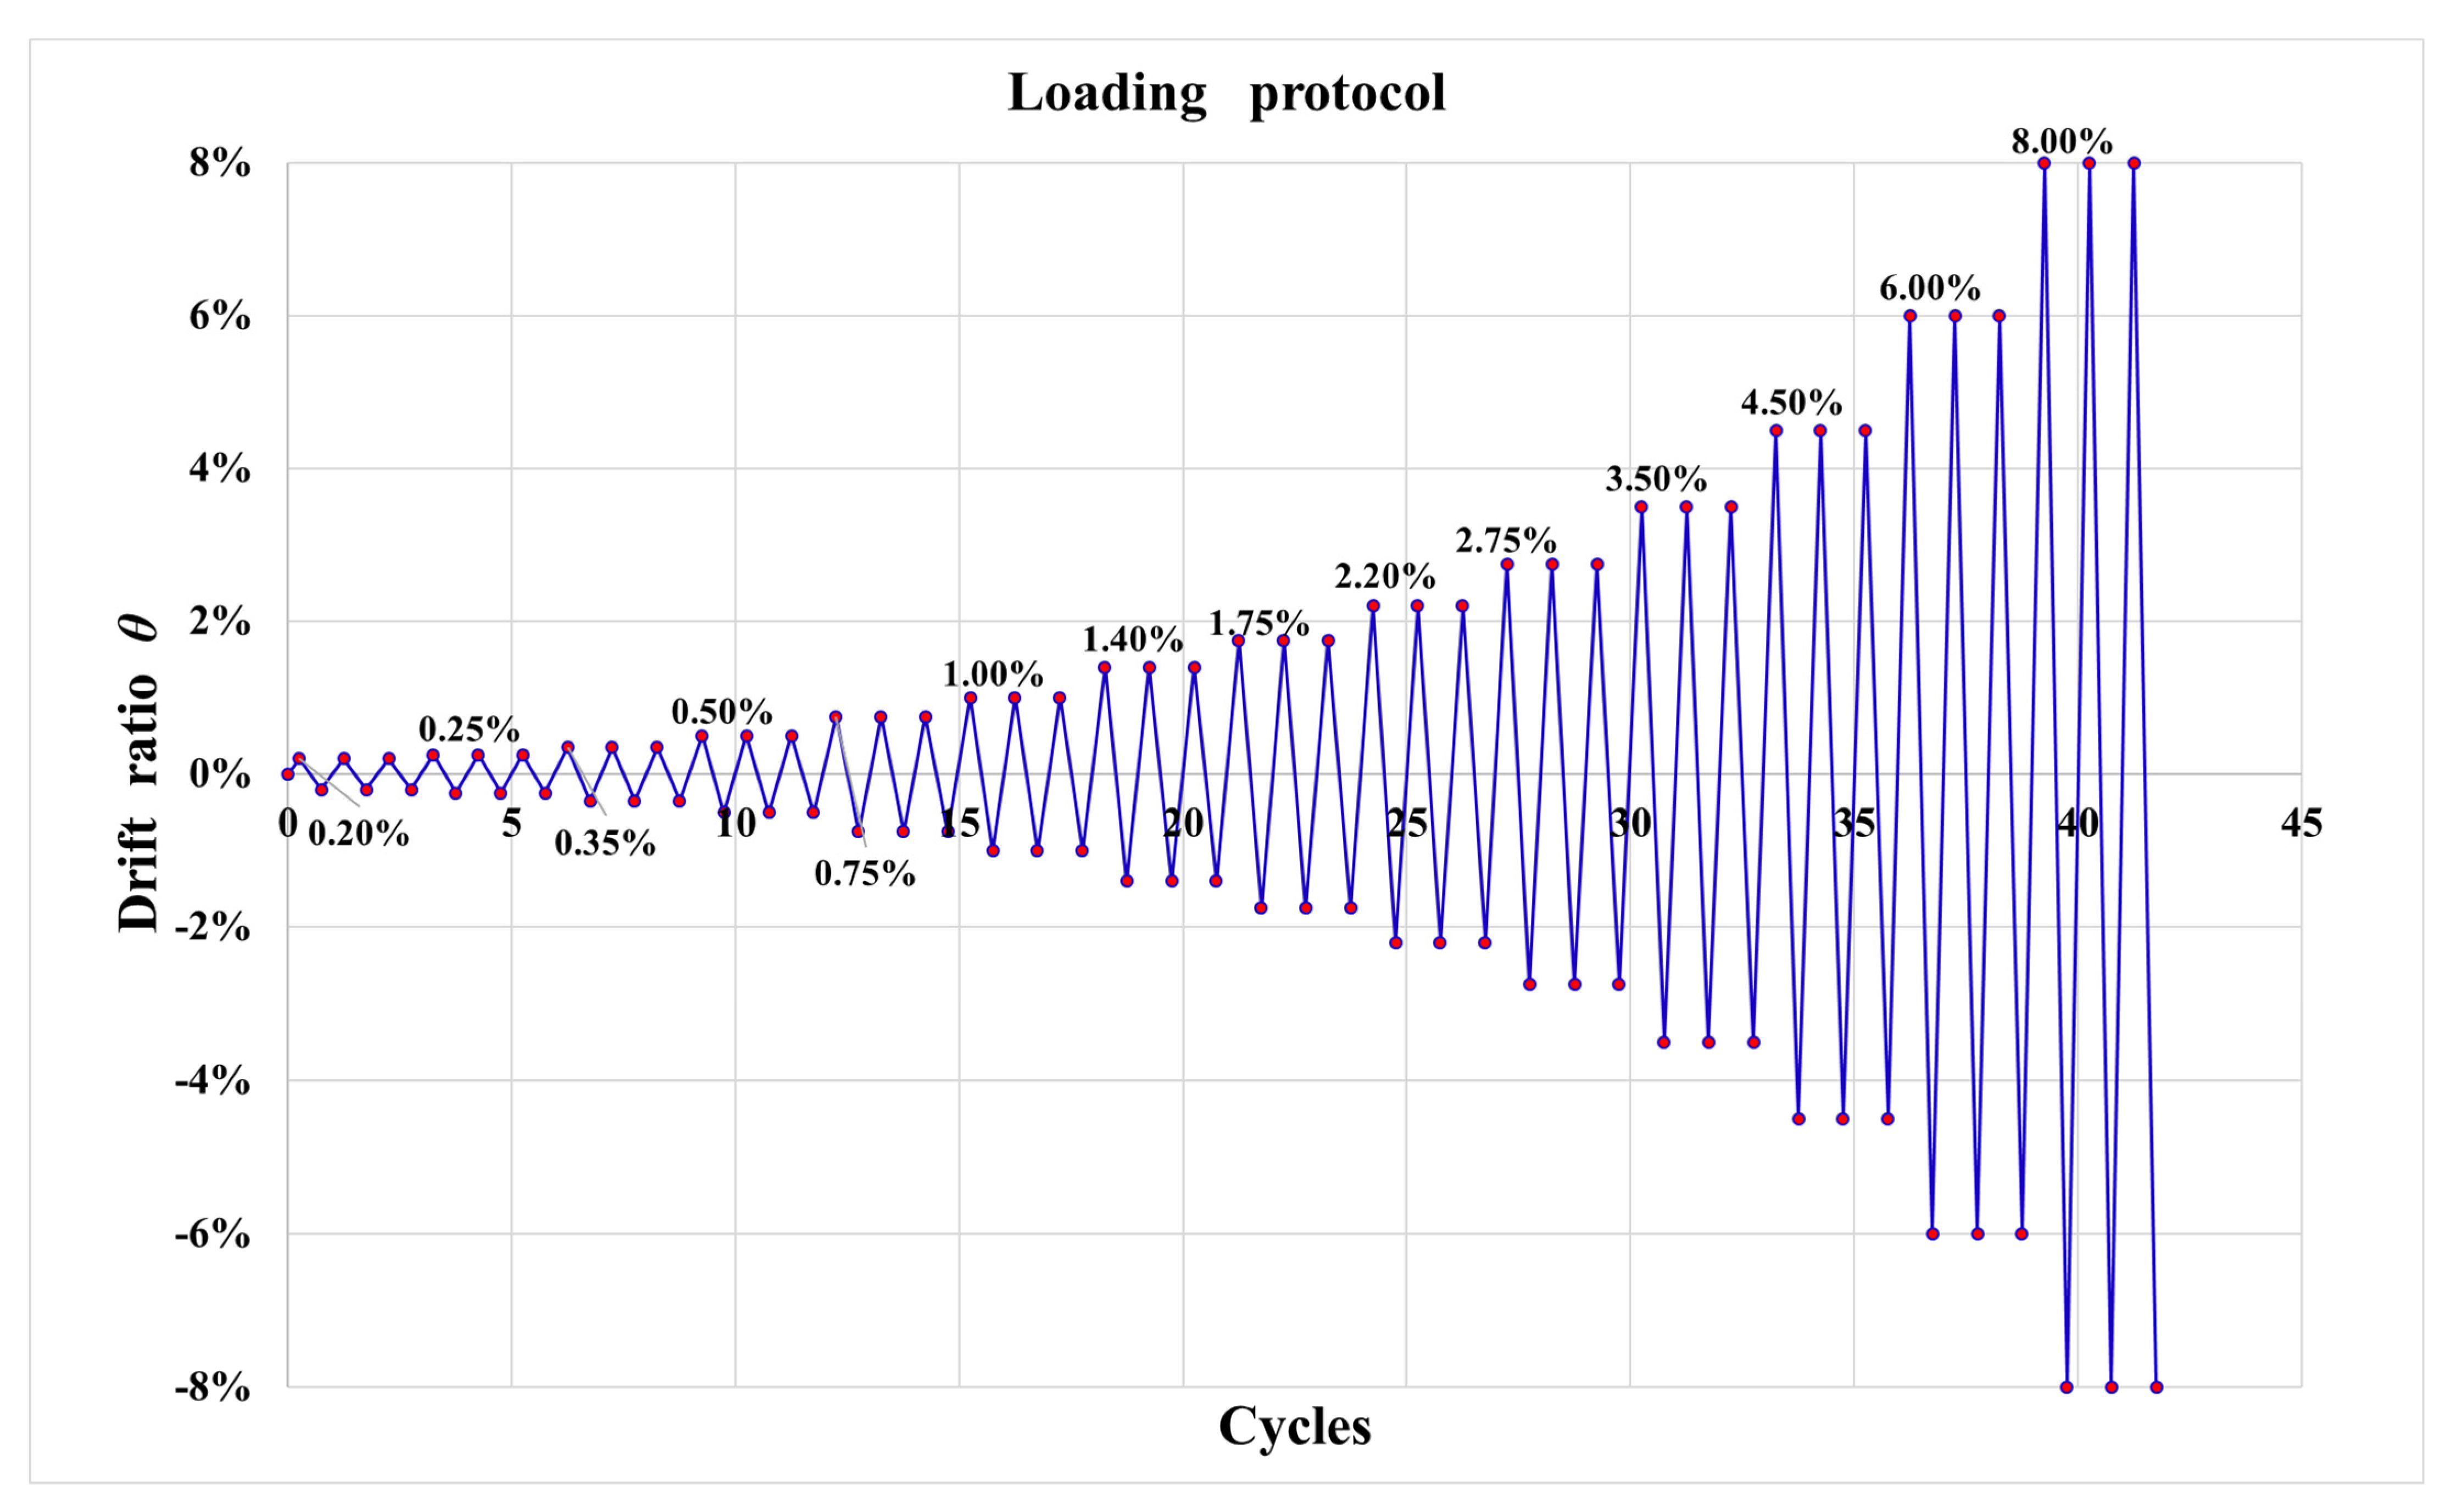
The quasi-static tests were conducted using a multifunctional steel reaction frame system (manufactured by Shanghai Zhubang Measurement and Control Technology Co., Ltd., Shanghai, China). A schematic of the test setup is shown in Figure 4a, and the on-site loading condition is presented in Figure 4b. Cyclic horizontal displacements were applied at the top of the column using an electro-hydraulic servo loading system controlled by WinTest2.0 software (both provided by Shandong Mochen Testing Equipment Co., Ltd., Jinan, Shandong, China). The loading protocol was established in accordance with ACI 374.1-05 [25]. The corresponding drift ratios θ, calculated according to Equation (1) at each loading level, are 0.2%, 0.25%, 0.35%, 0.5%, 0.75%, 1%, 1.4%, 1.75%, 2.2%, 2.75%, 3.5%, 4.5%, 6% and 8%, as shown in Figure 5. Due to the limitations of the test setup, a sufficiently large axial load could not be applied at the top of the column. Consequently, all specimens were tested without an applied column axial load. It should be noted that the observed seismic responses in the present experimental program may differ from those of exterior beam–column joints subjected to column axial compression. Accordingly, the findings of this study are limited to the tested zero-axial-load condition.
where Δ denotes the applied horizontal displacement, and Hc is the distance from the point of horizontal force application to the hinge point at the column base. In this study, Hc is taken as 1460 mm.
Figure 4.
Test setup. (a) Schematic of the test setup; (b) On-site loading condition.
Figure 5.
Loading protocol.
The horizontal load and corresponding displacement at the top of the column were synchronously recorded by the electro-hydraulic servo loading system and used for the subsequent evaluation of the seismic performance of the specimens. However, due to an unexpected malfunction of the strain acquisition system during testing, reliable strain data for the steel components could not be obtained. Therefore, the relevant data were excluded from the subsequent analysis. This limitation restricted the quantitative evaluation of the steel response and the verification of the proposed strengthening mechanisms.
3. Experimental Results and Discussion
3.1. Observations and Failure Patterns
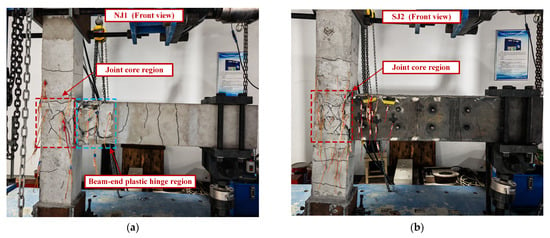
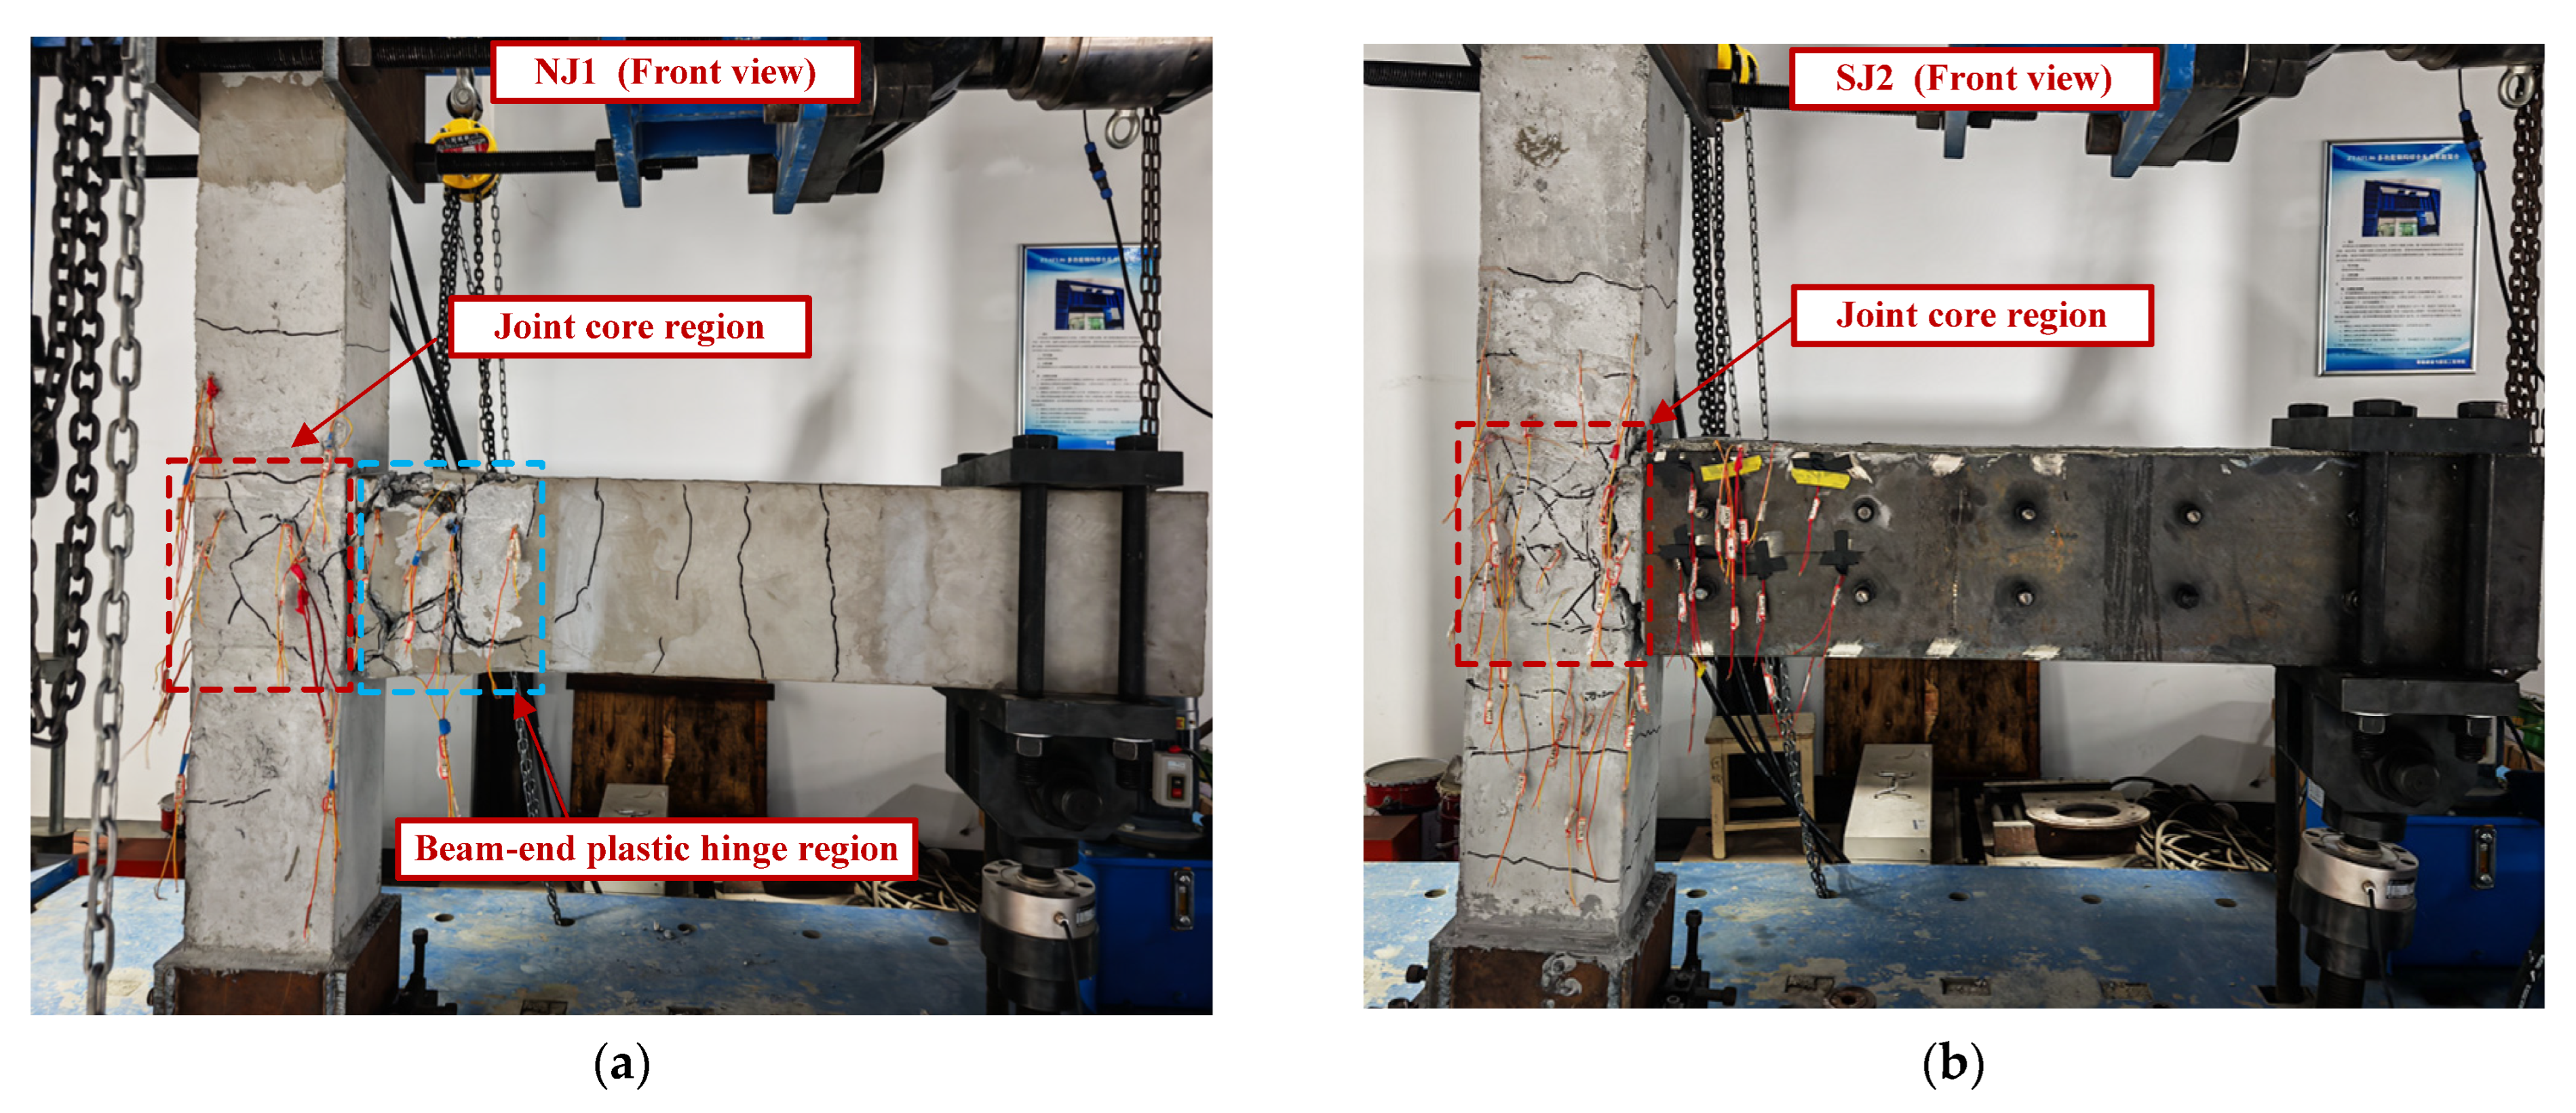
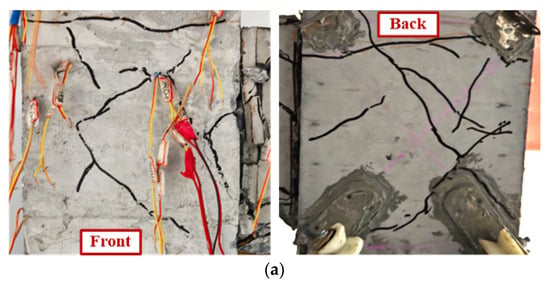
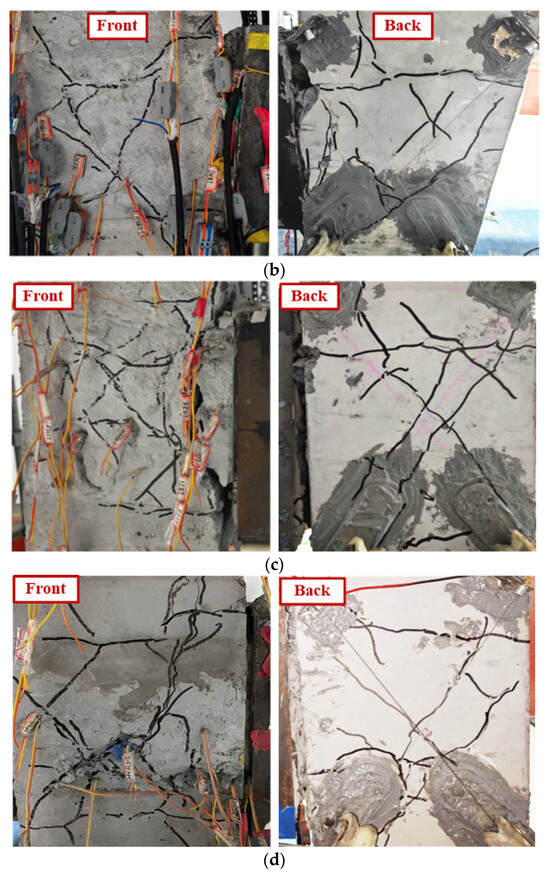
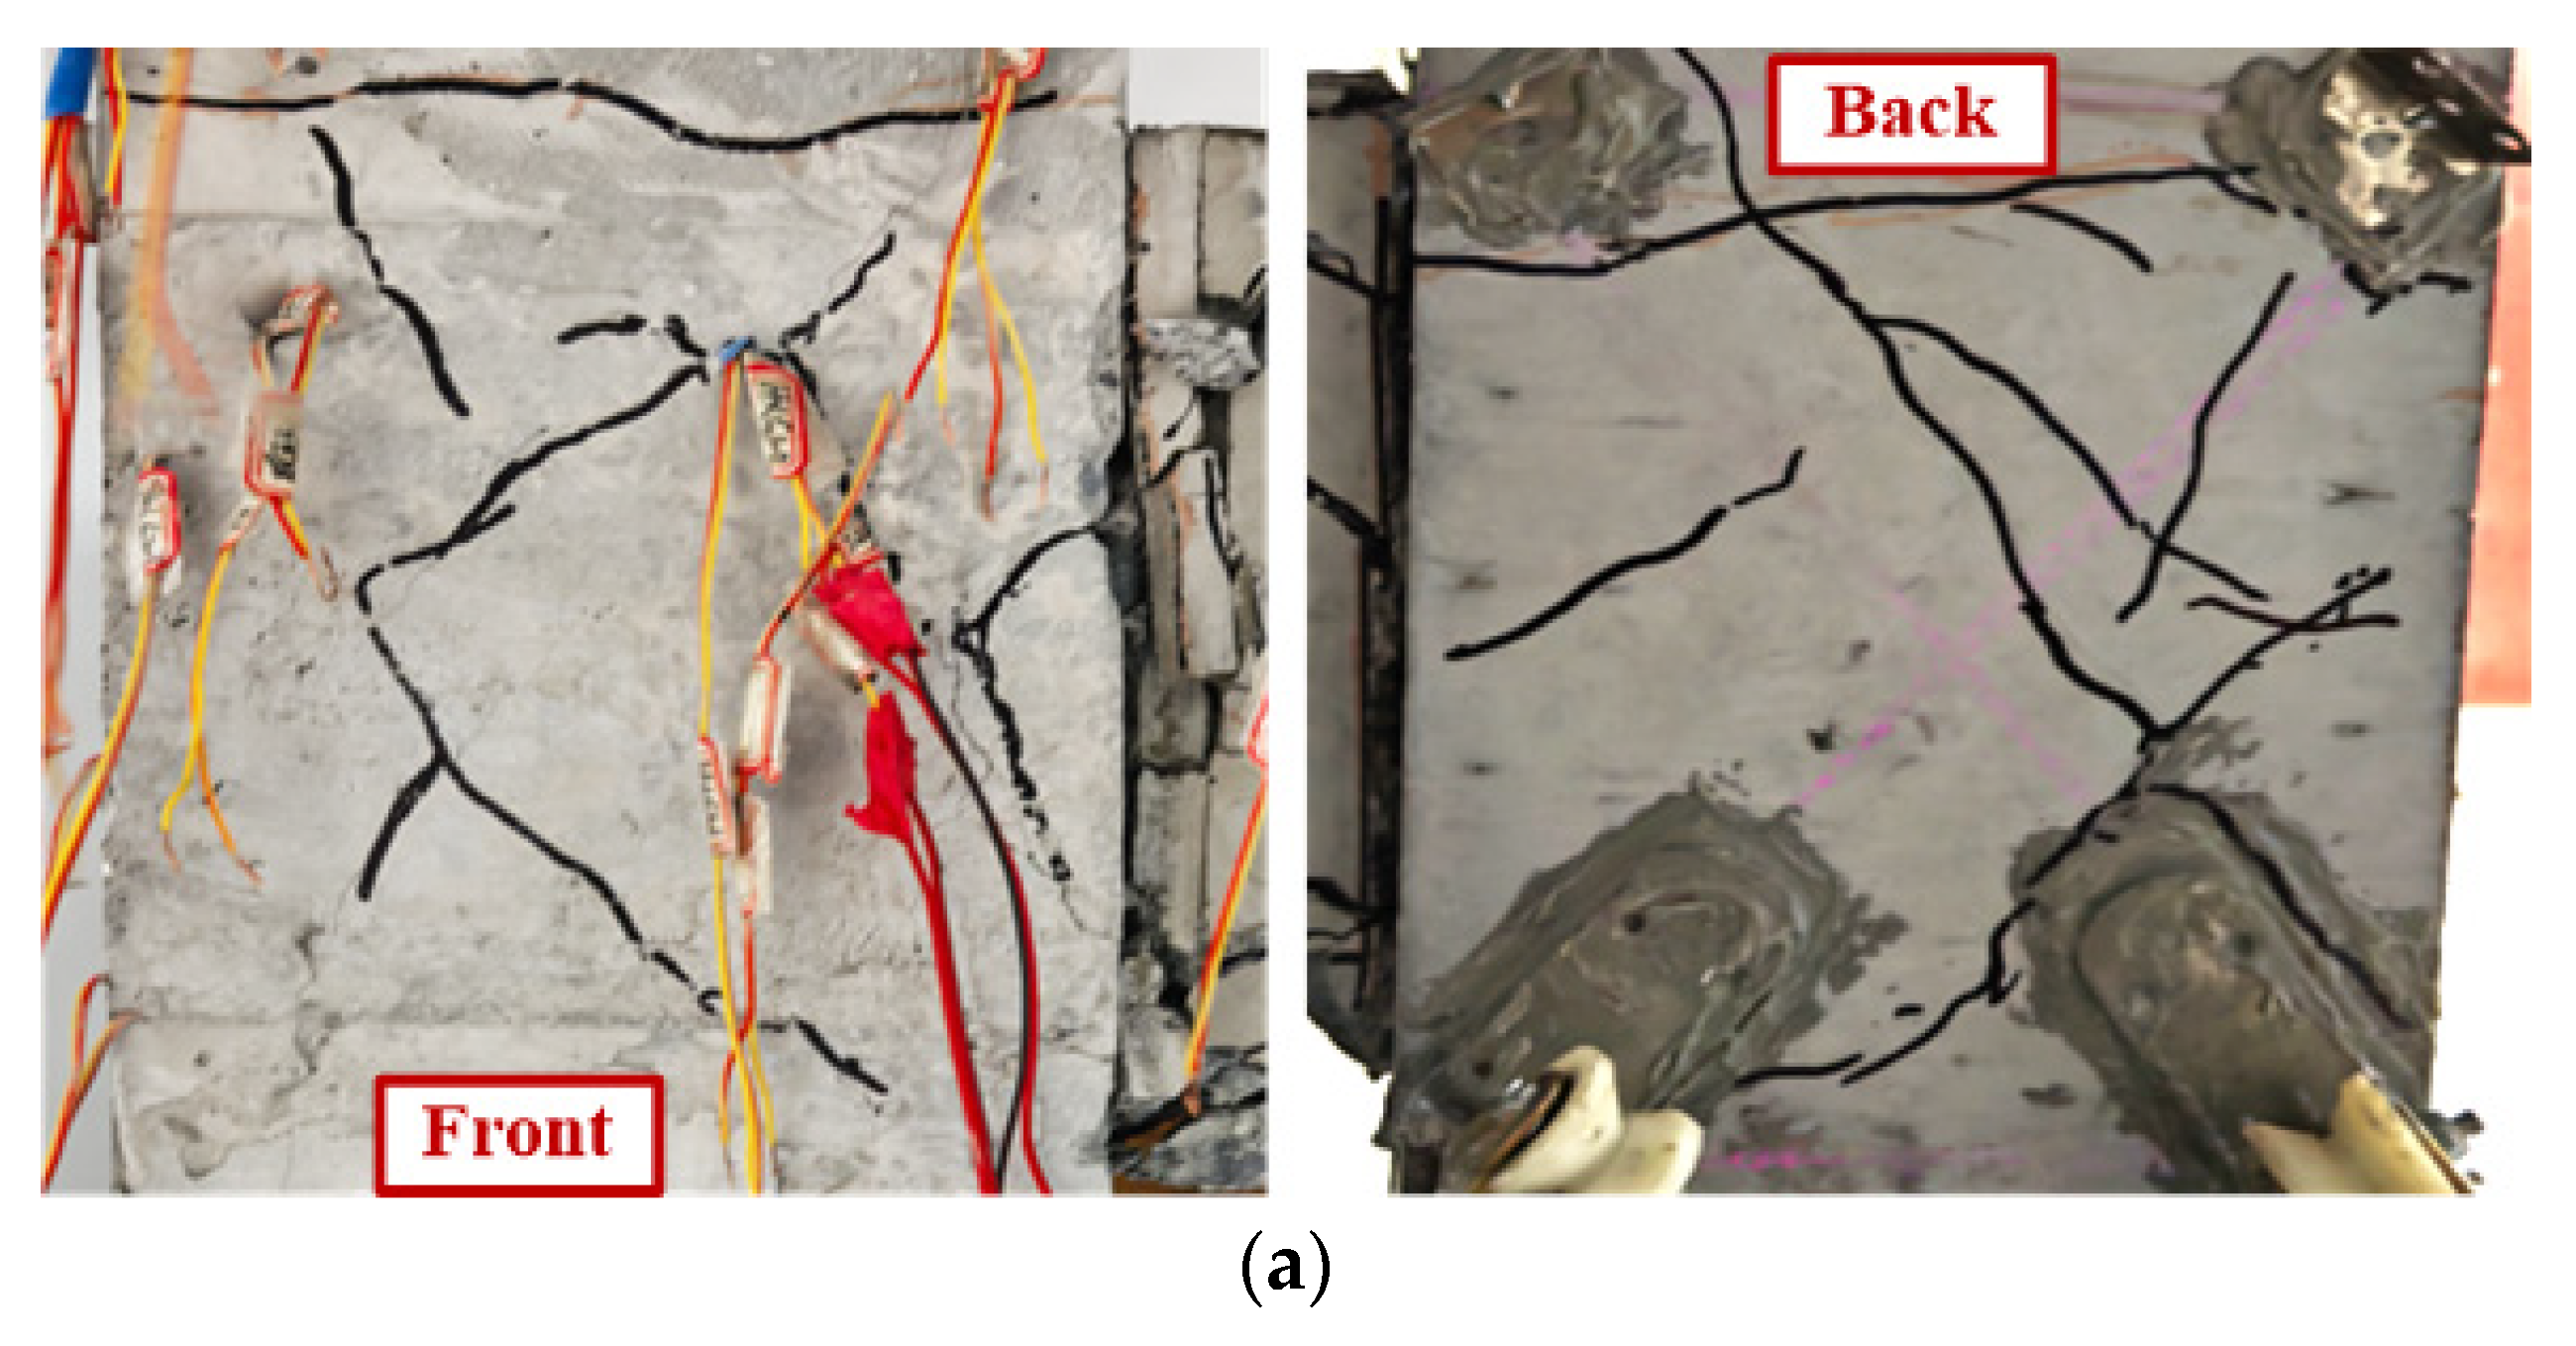
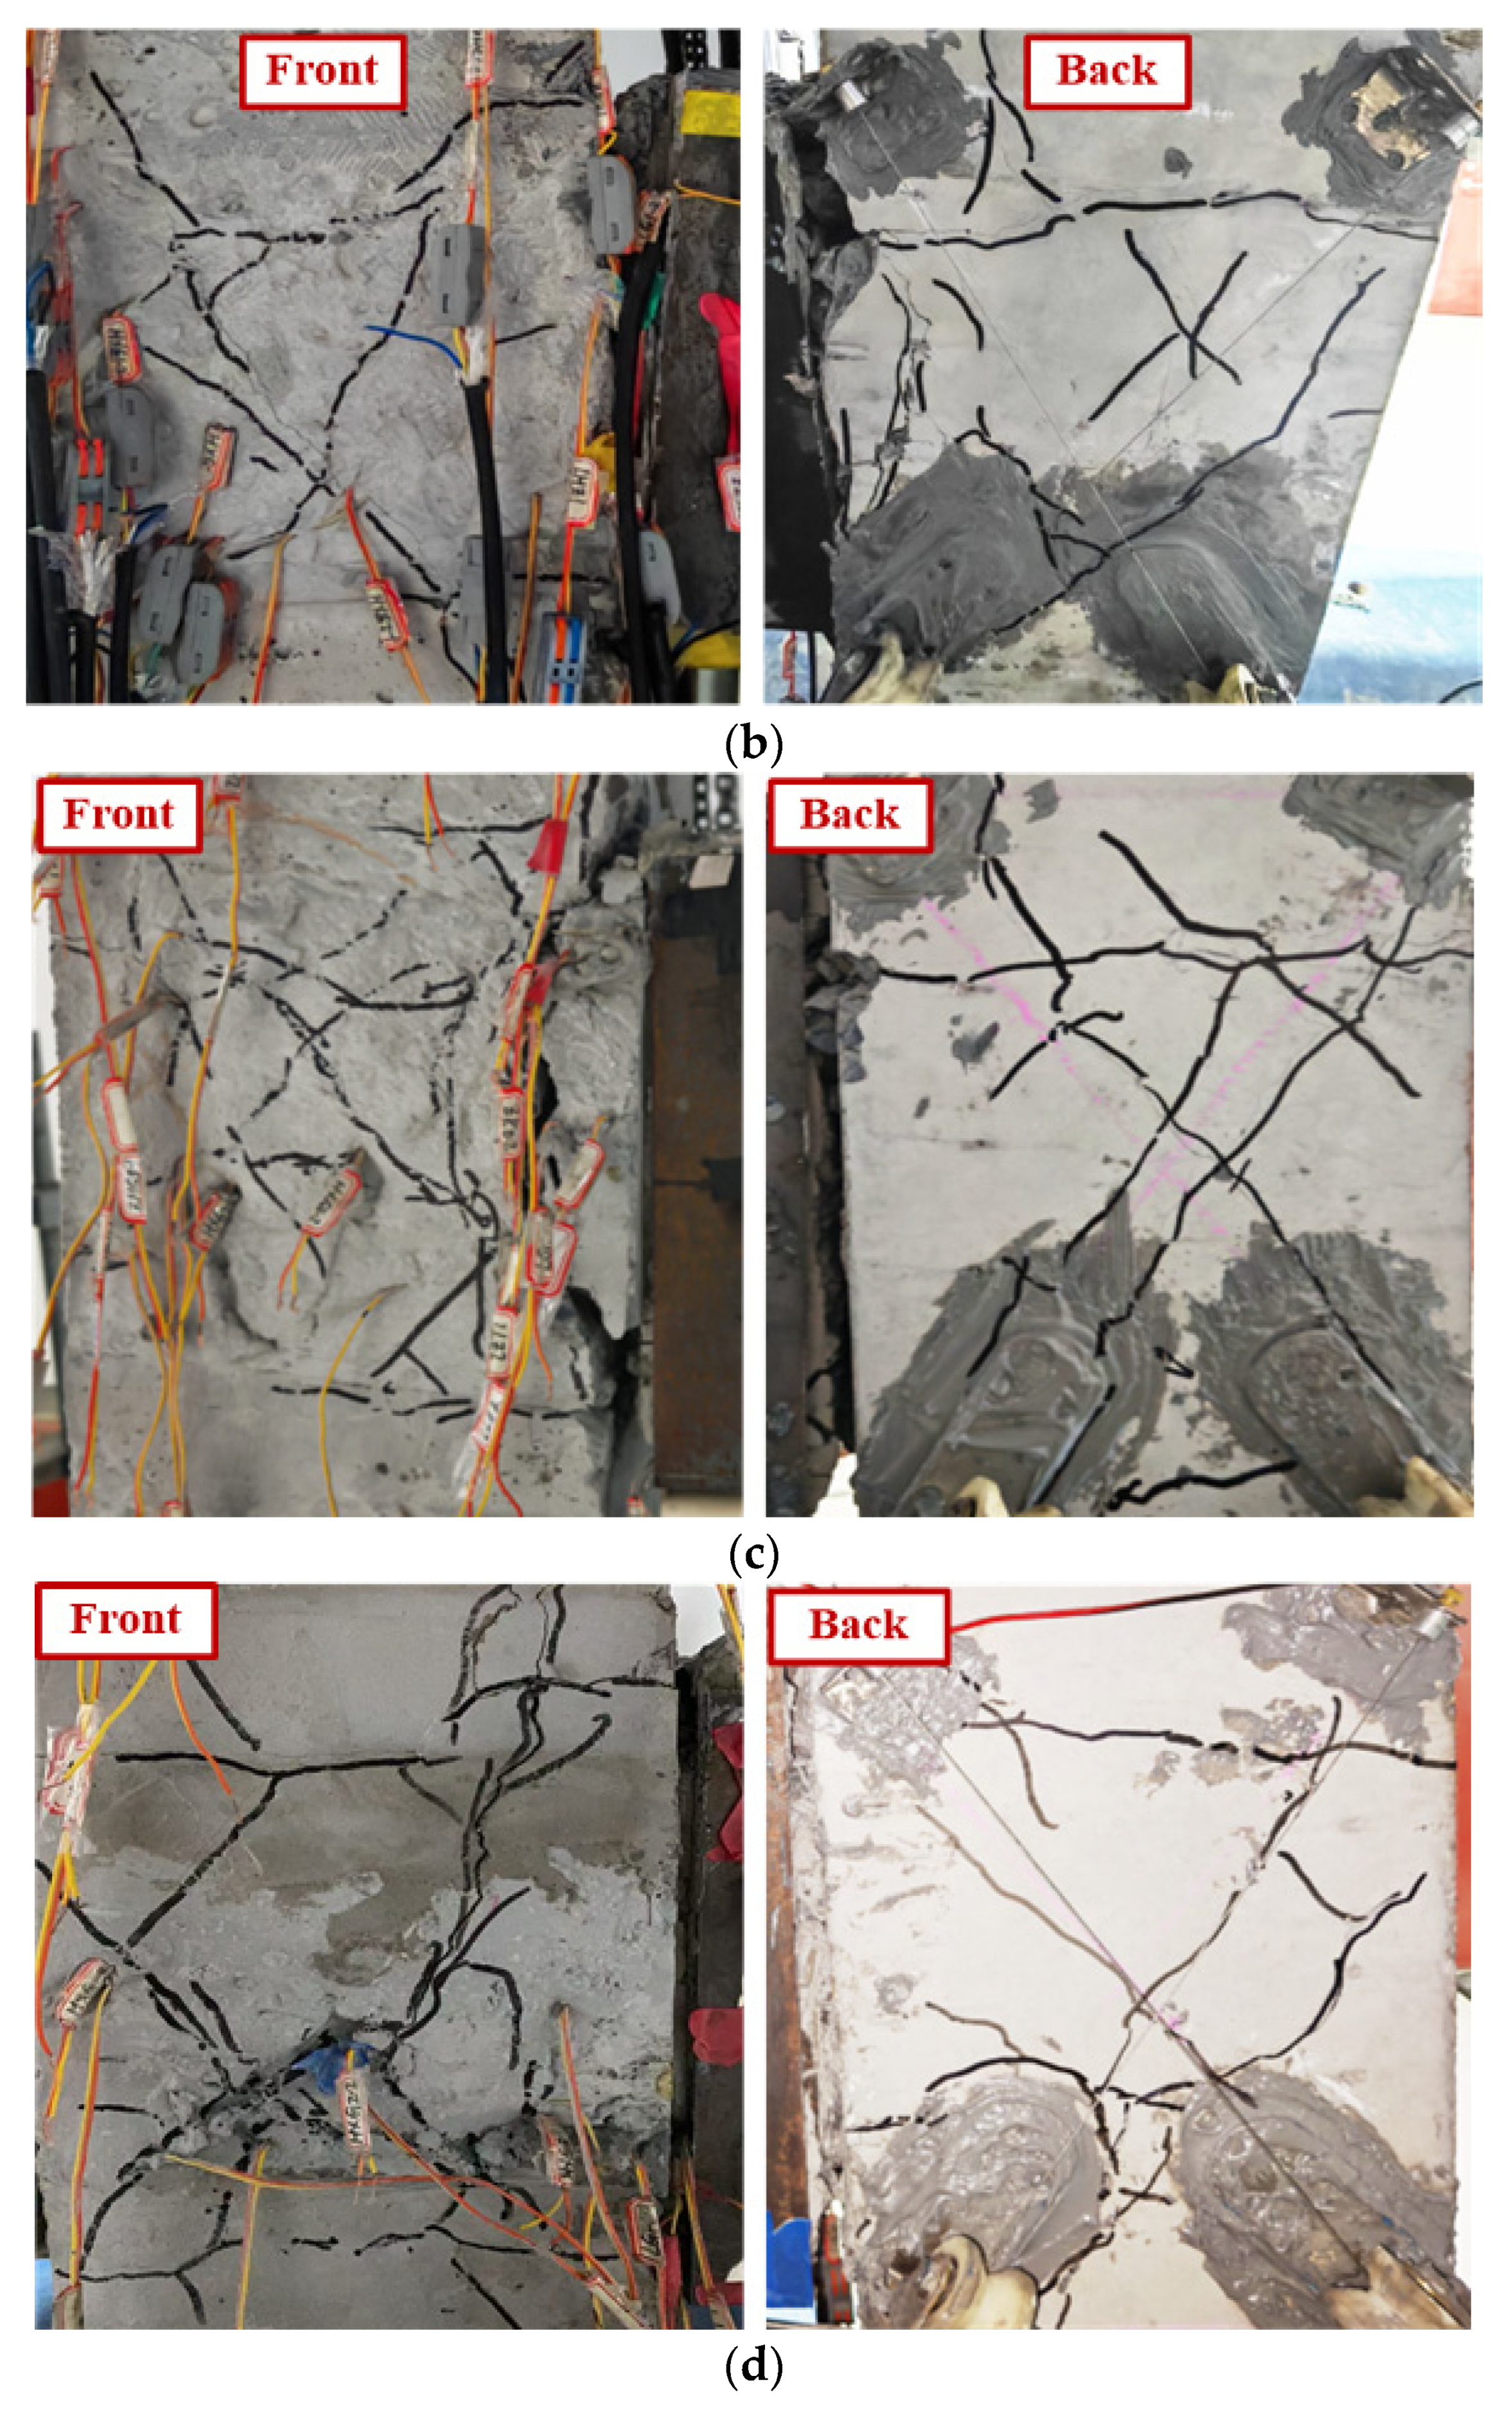
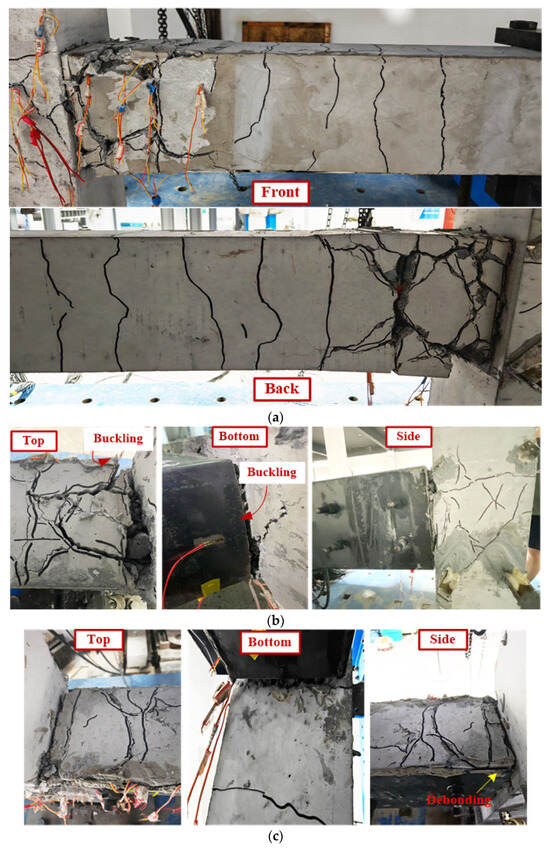
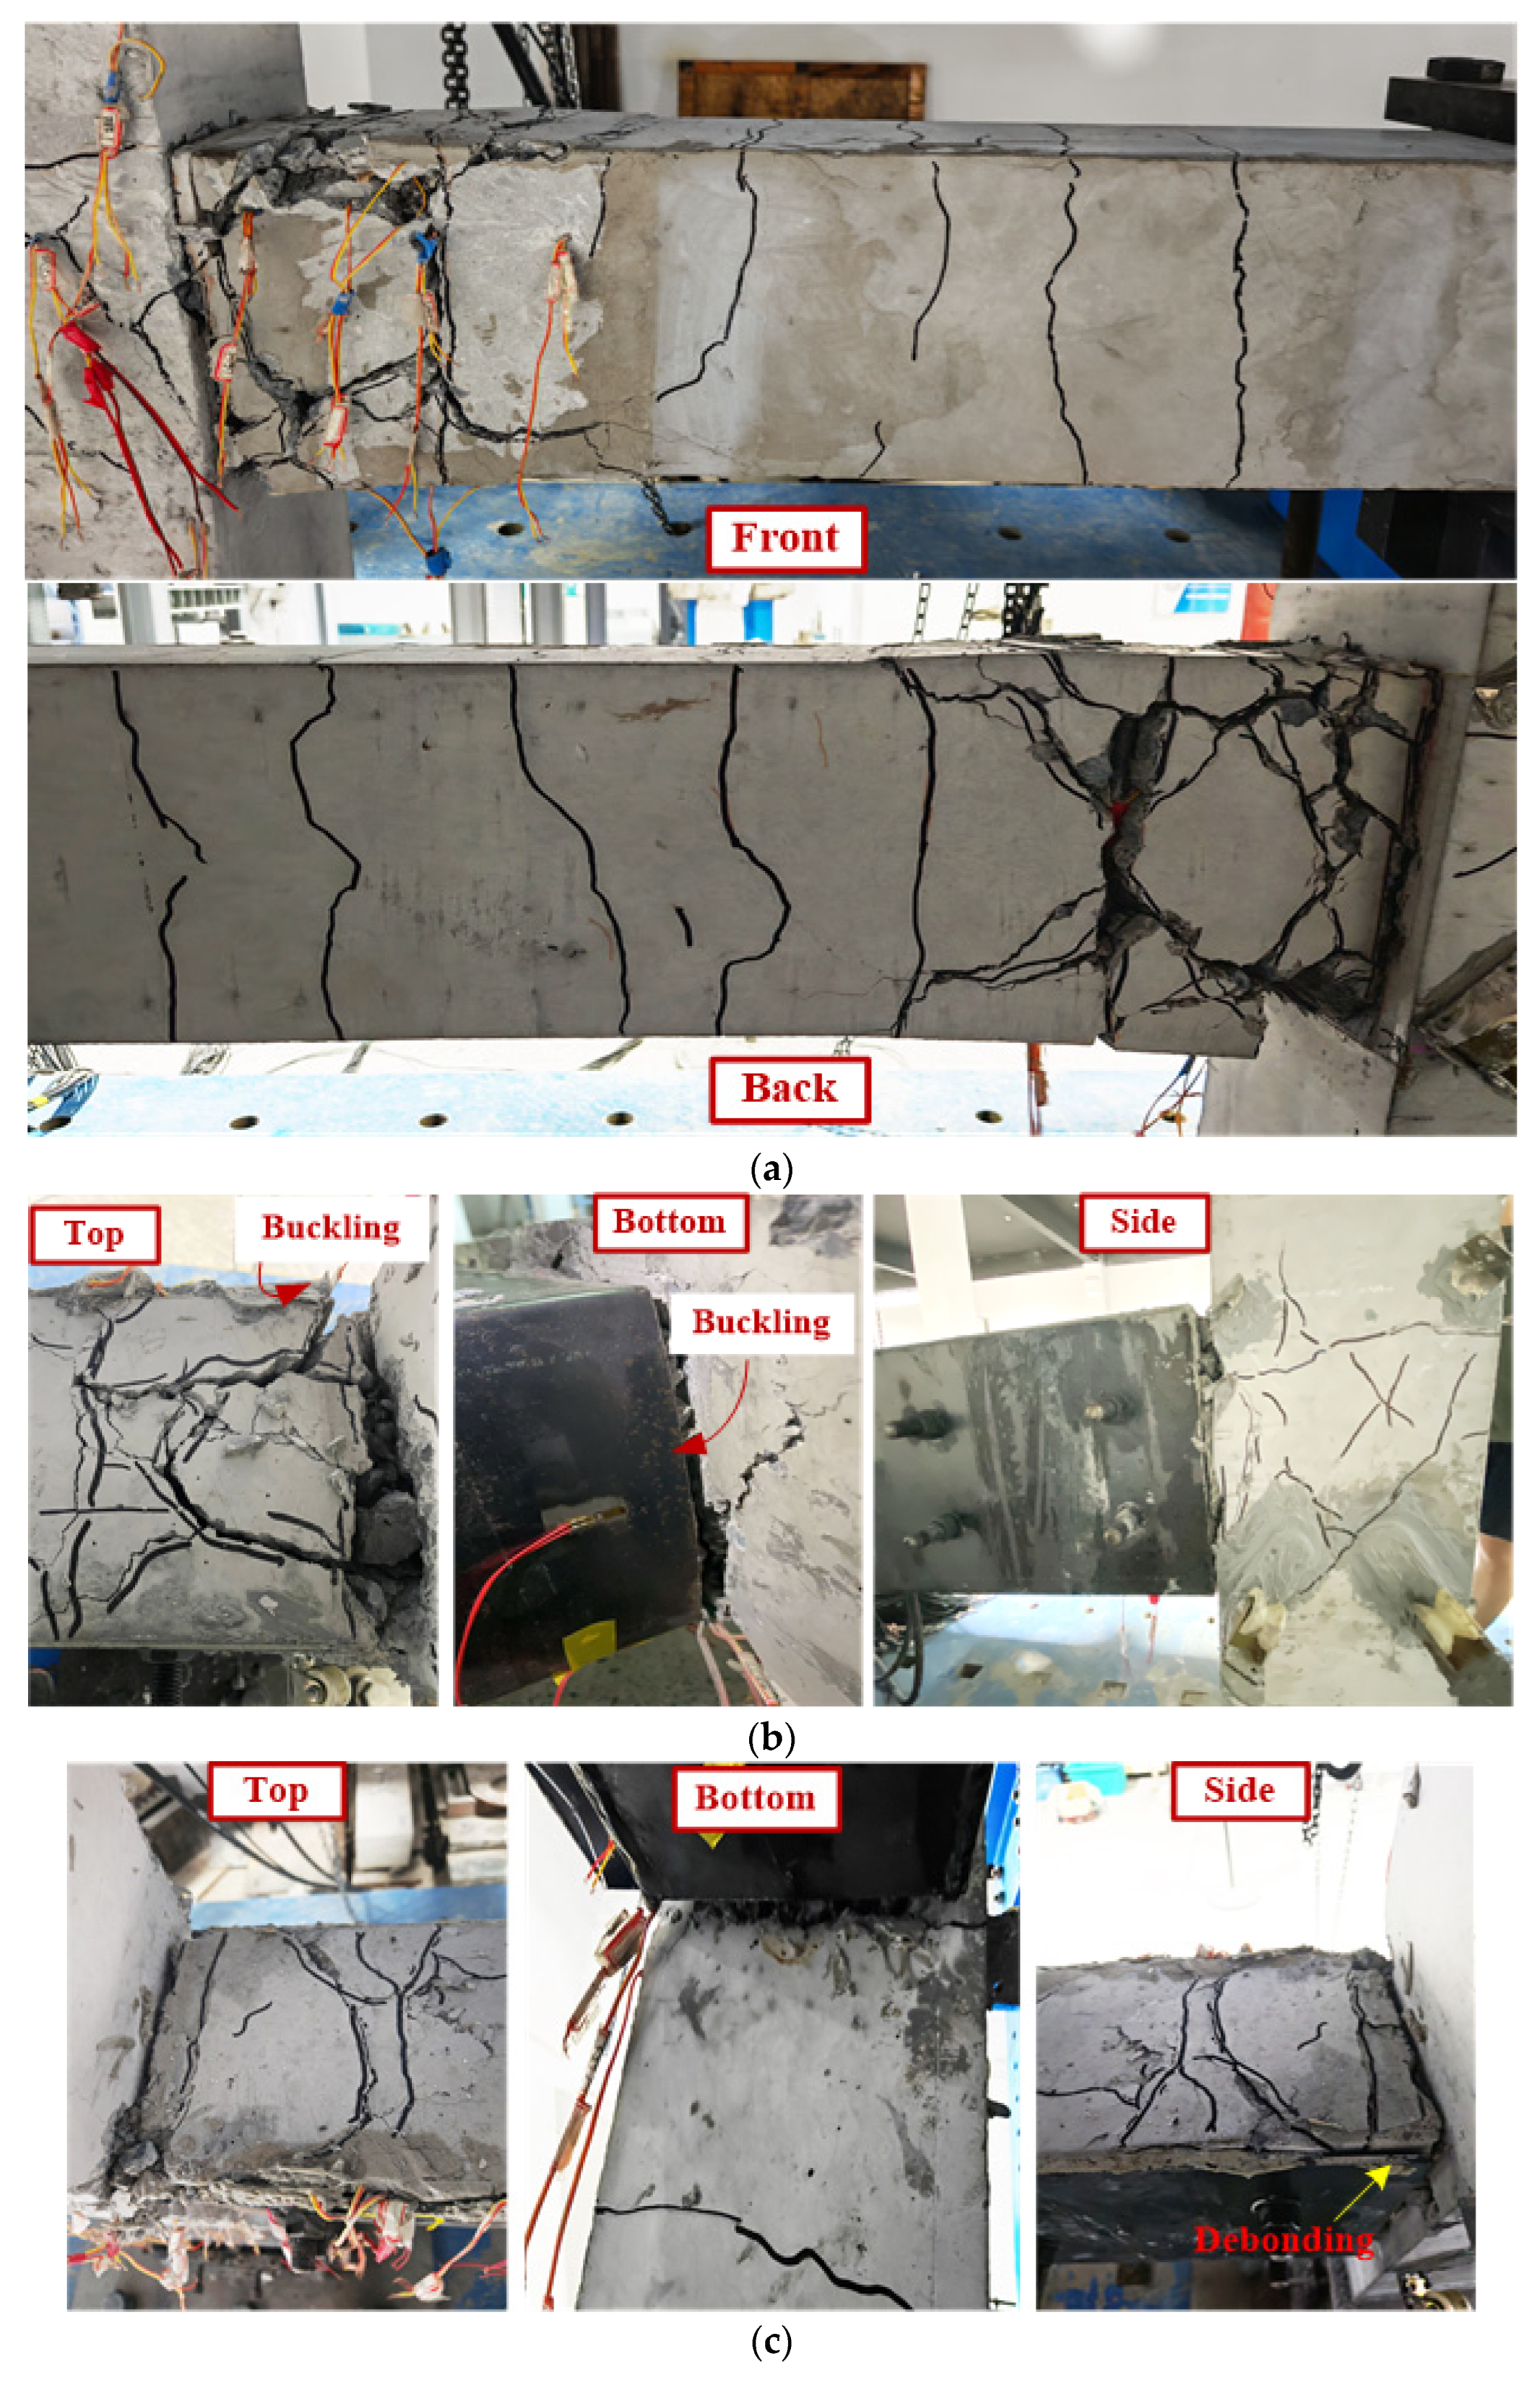
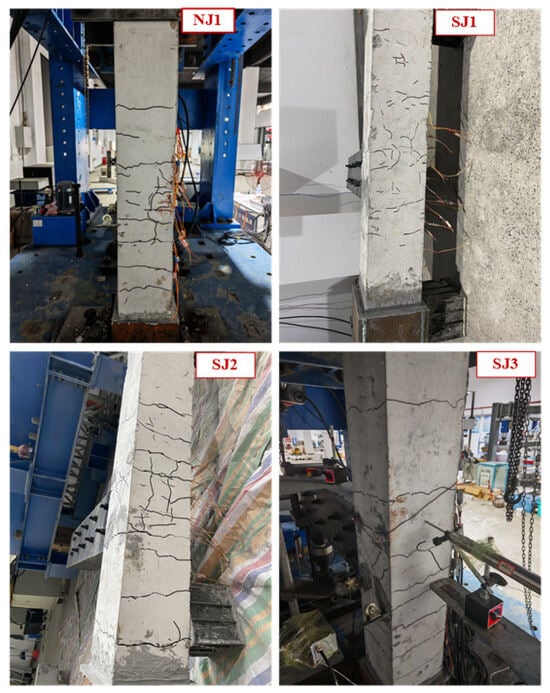
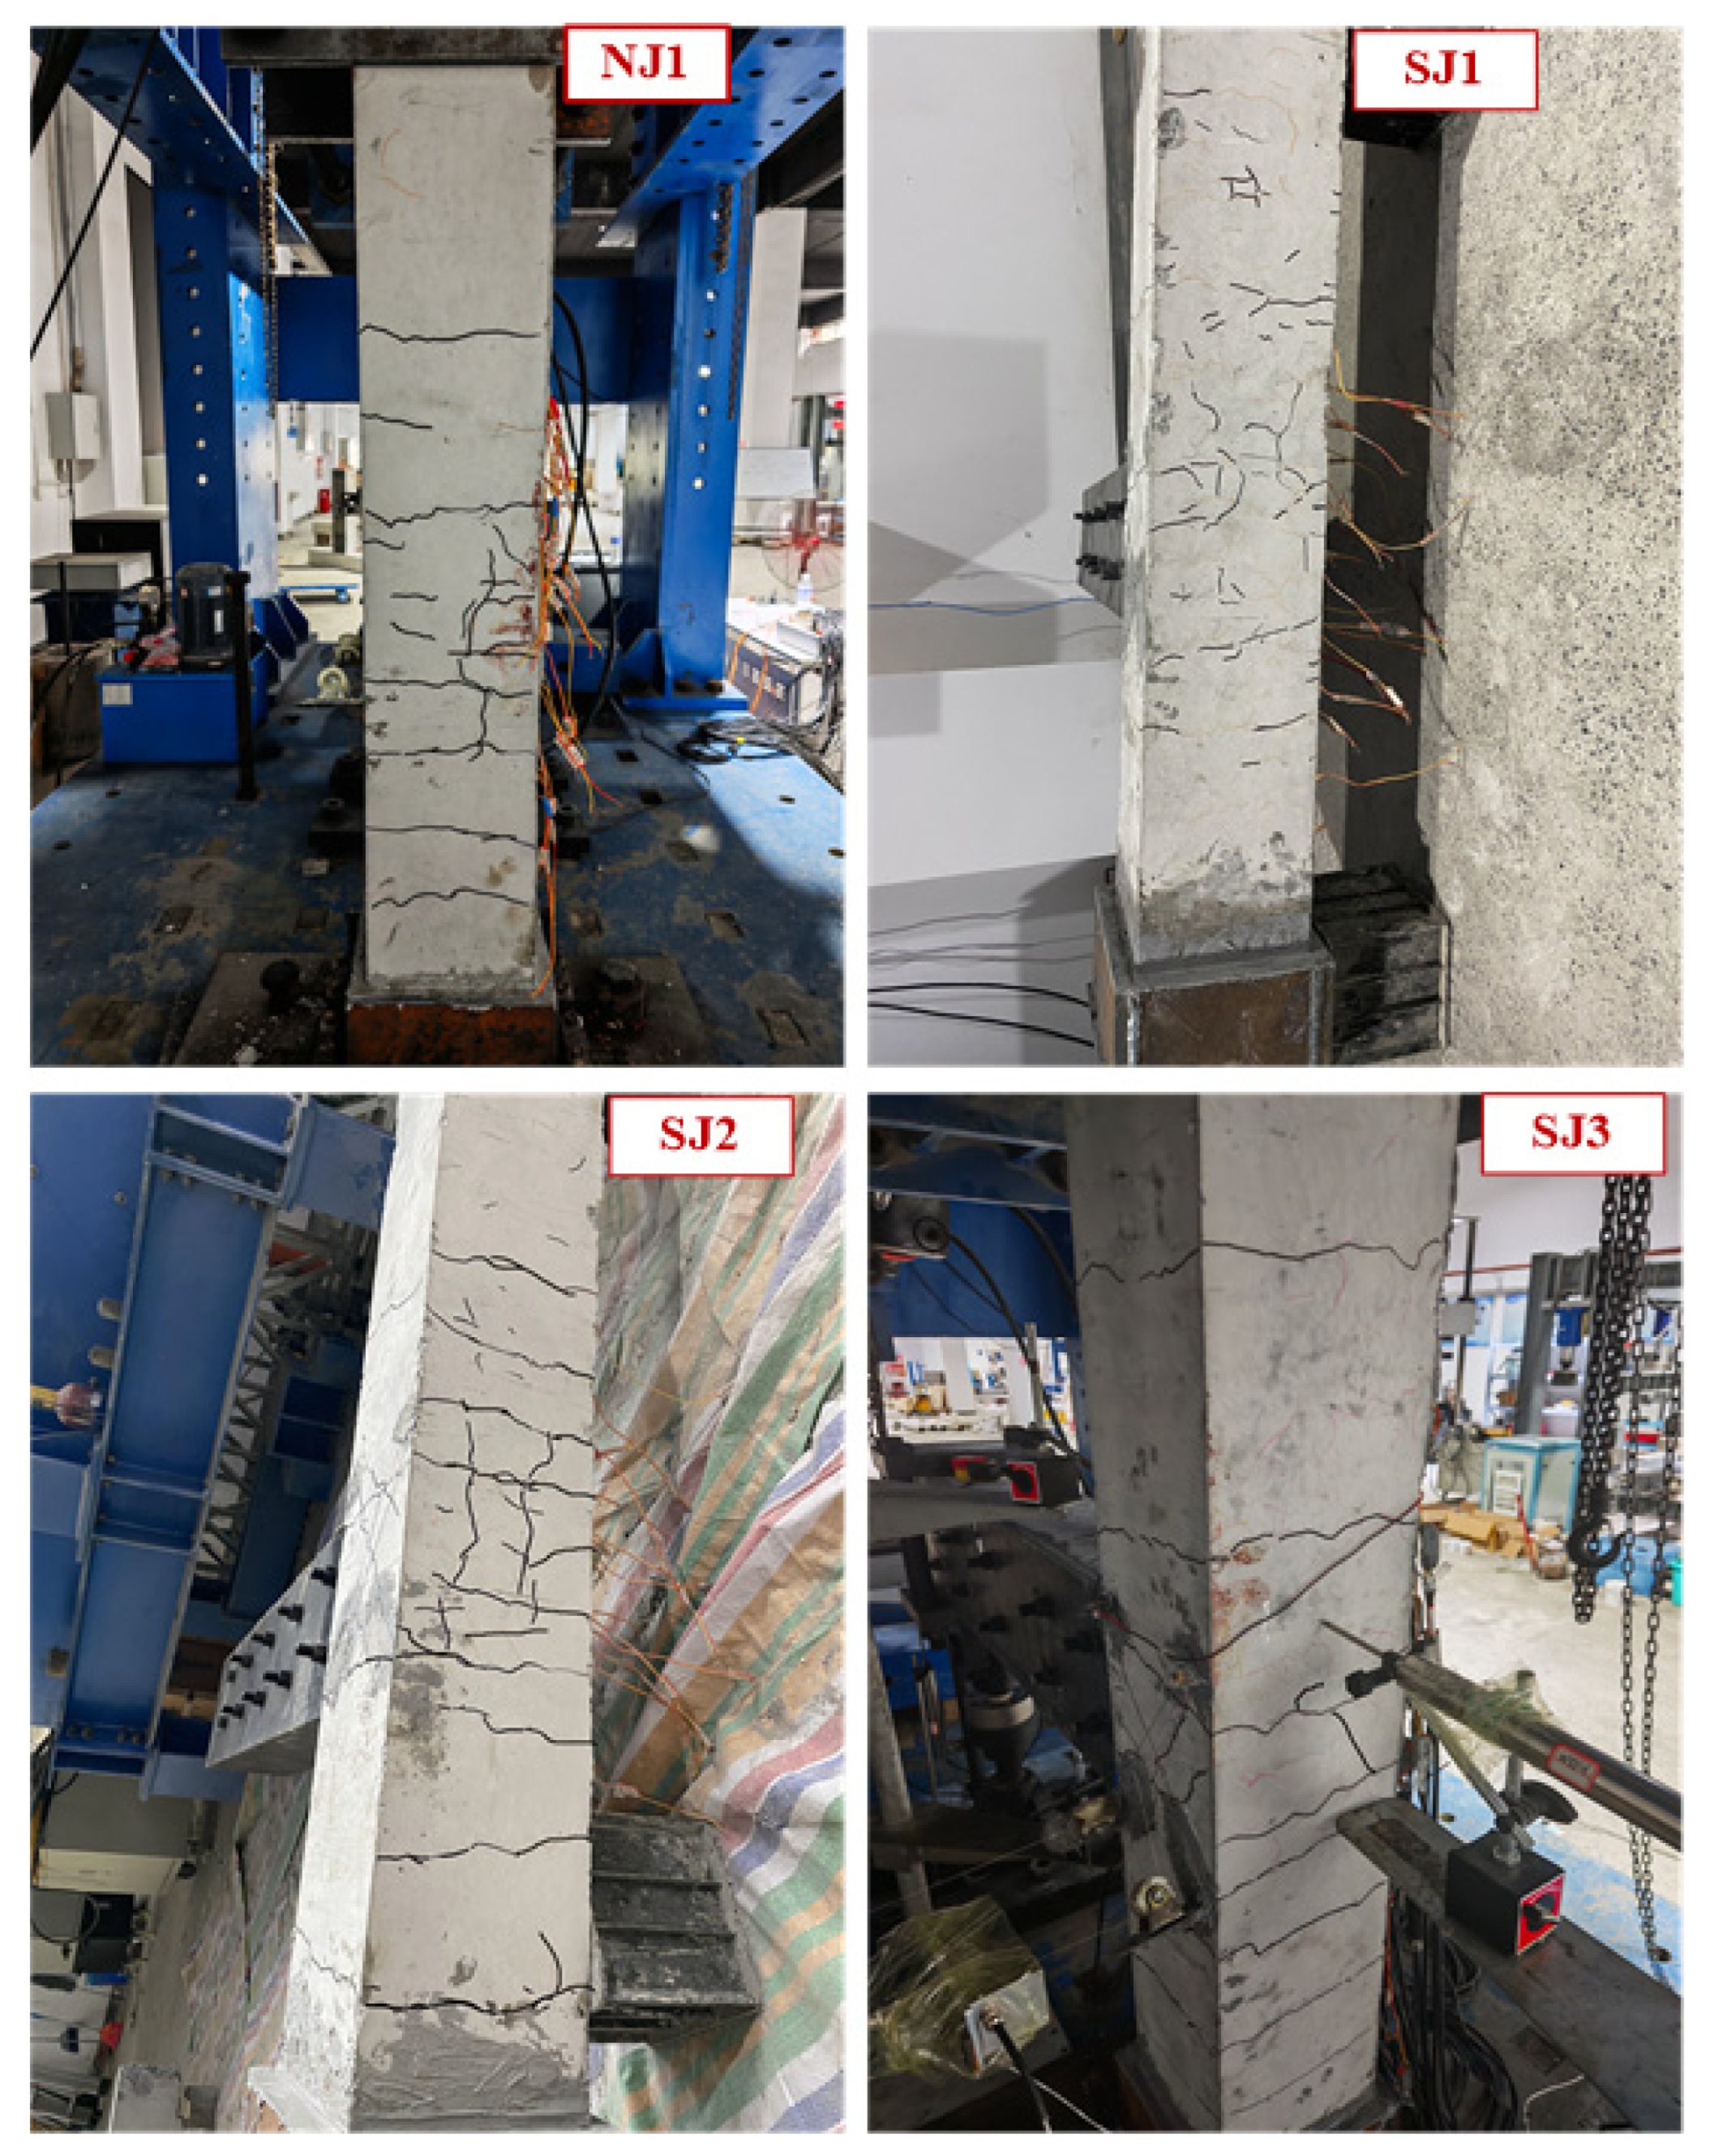
Figure 6, Figure 7, Figure 8 and Figure 9 show the failure patterns of the joint specimens. Overall, the reference specimen NJ1 and the strengthened specimens SJ1 to SJ3 exhibited essentially similar failure modes, which were predominantly characterized by plastic hinge formation and damage at the beam ends. In contrast, the damage in the joint core region and at the upper and lower column ends remained relatively limited. For specimen NJ1, when the drift ratio was below 0.5%, fine transverse cracks mainly developed in the joint core region and the outer core region of the joint, while several fine transverse cracks also appeared at the beam end. As the drift ratio increased to 0.75~1.0%, the transverse cracks in the outer core region of the joint ran through. At the same time, the transverse cracks at the beam end and approximately 120 mm away from the column face propagated across the entire beam cross-section, forming collar-shaped cracks. In addition, several new transverse cracks developed at the beam end, and the initial transverse cracks at the lower column end extended through to the outer face. At a drift ratio of 1.4%, a short diagonal crack appeared on the rear face of the joint core region. A collar-shaped crack also developed at the beam end, approximately 450 mm away from the column face, while the transverse cracks at the column end continued to propagate. When the drift ratio increased to 1.75%, a new diagonal crack developed in the joint core region, accompanied by several irregular inclined cracks. A collar-shaped crack also formed at the top of the joint core region. In addition, another collar-shaped crack developed at the column end, approximately 195 mm above the joint core region. At a drift ratio of 2.75%, several short inclined cracks newly developed in the joint core region and intersected the existing diagonal cracks. Meanwhile, the collar-shaped crack at the beam end widened noticeably, indicating increasing local damage. When the drift ratio reached 3.5%, the inclined cracks in the joint core region propagated significantly. Inclined cracks also began to develop at the beam end, while concrete crushing and spalling occurred near the beam root, indicating the progressive development of a plastic hinge. As the drift ratio increased to 4.5%, concrete spalling at the beam end became more severe, and the cracks at the beam root increased in both width and depth. Several additional wide transverse cracks also developed at the beam end. At a drift ratio of 6%, severe concrete cracking and spalling occurred in the plastic hinge region at the beam end under the combined flexural and shear actions. The crack width at the beam root reached approximately 10 mm, while the transverse crack at the top of the beam, located 140 mm away from the column face, reached a width of about 5 mm. As the drift ratio reached 8%, extensive cracking and spalling caused severe fragmentation of the concrete in the beam end plastic hinge region, exposing the reinforcing bars and causing them to buckle. Both the beam and column experienced substantial deformation, making the joint specimen unsuitable for further loading. Consequently, only one loading cycle was completed at this drift level. Nevertheless, the load-carrying capacity continued to increase in the pulling direction, while no obvious strength degradation was observed in the pushing direction.
Figure 6.
Overall failure patterns of representative specimens: (a) NJ1; (b) SJ2.
Figure 7.
Shear cracks in the joint core regions. (a) NJ1; (b) SJ1; (c) SJ2; (d) SJ3.
Figure 8.
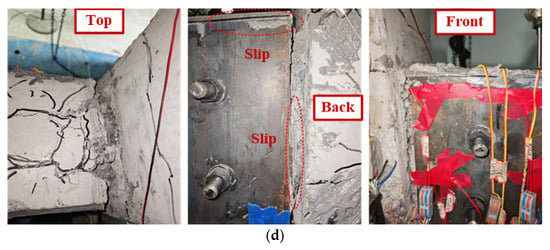
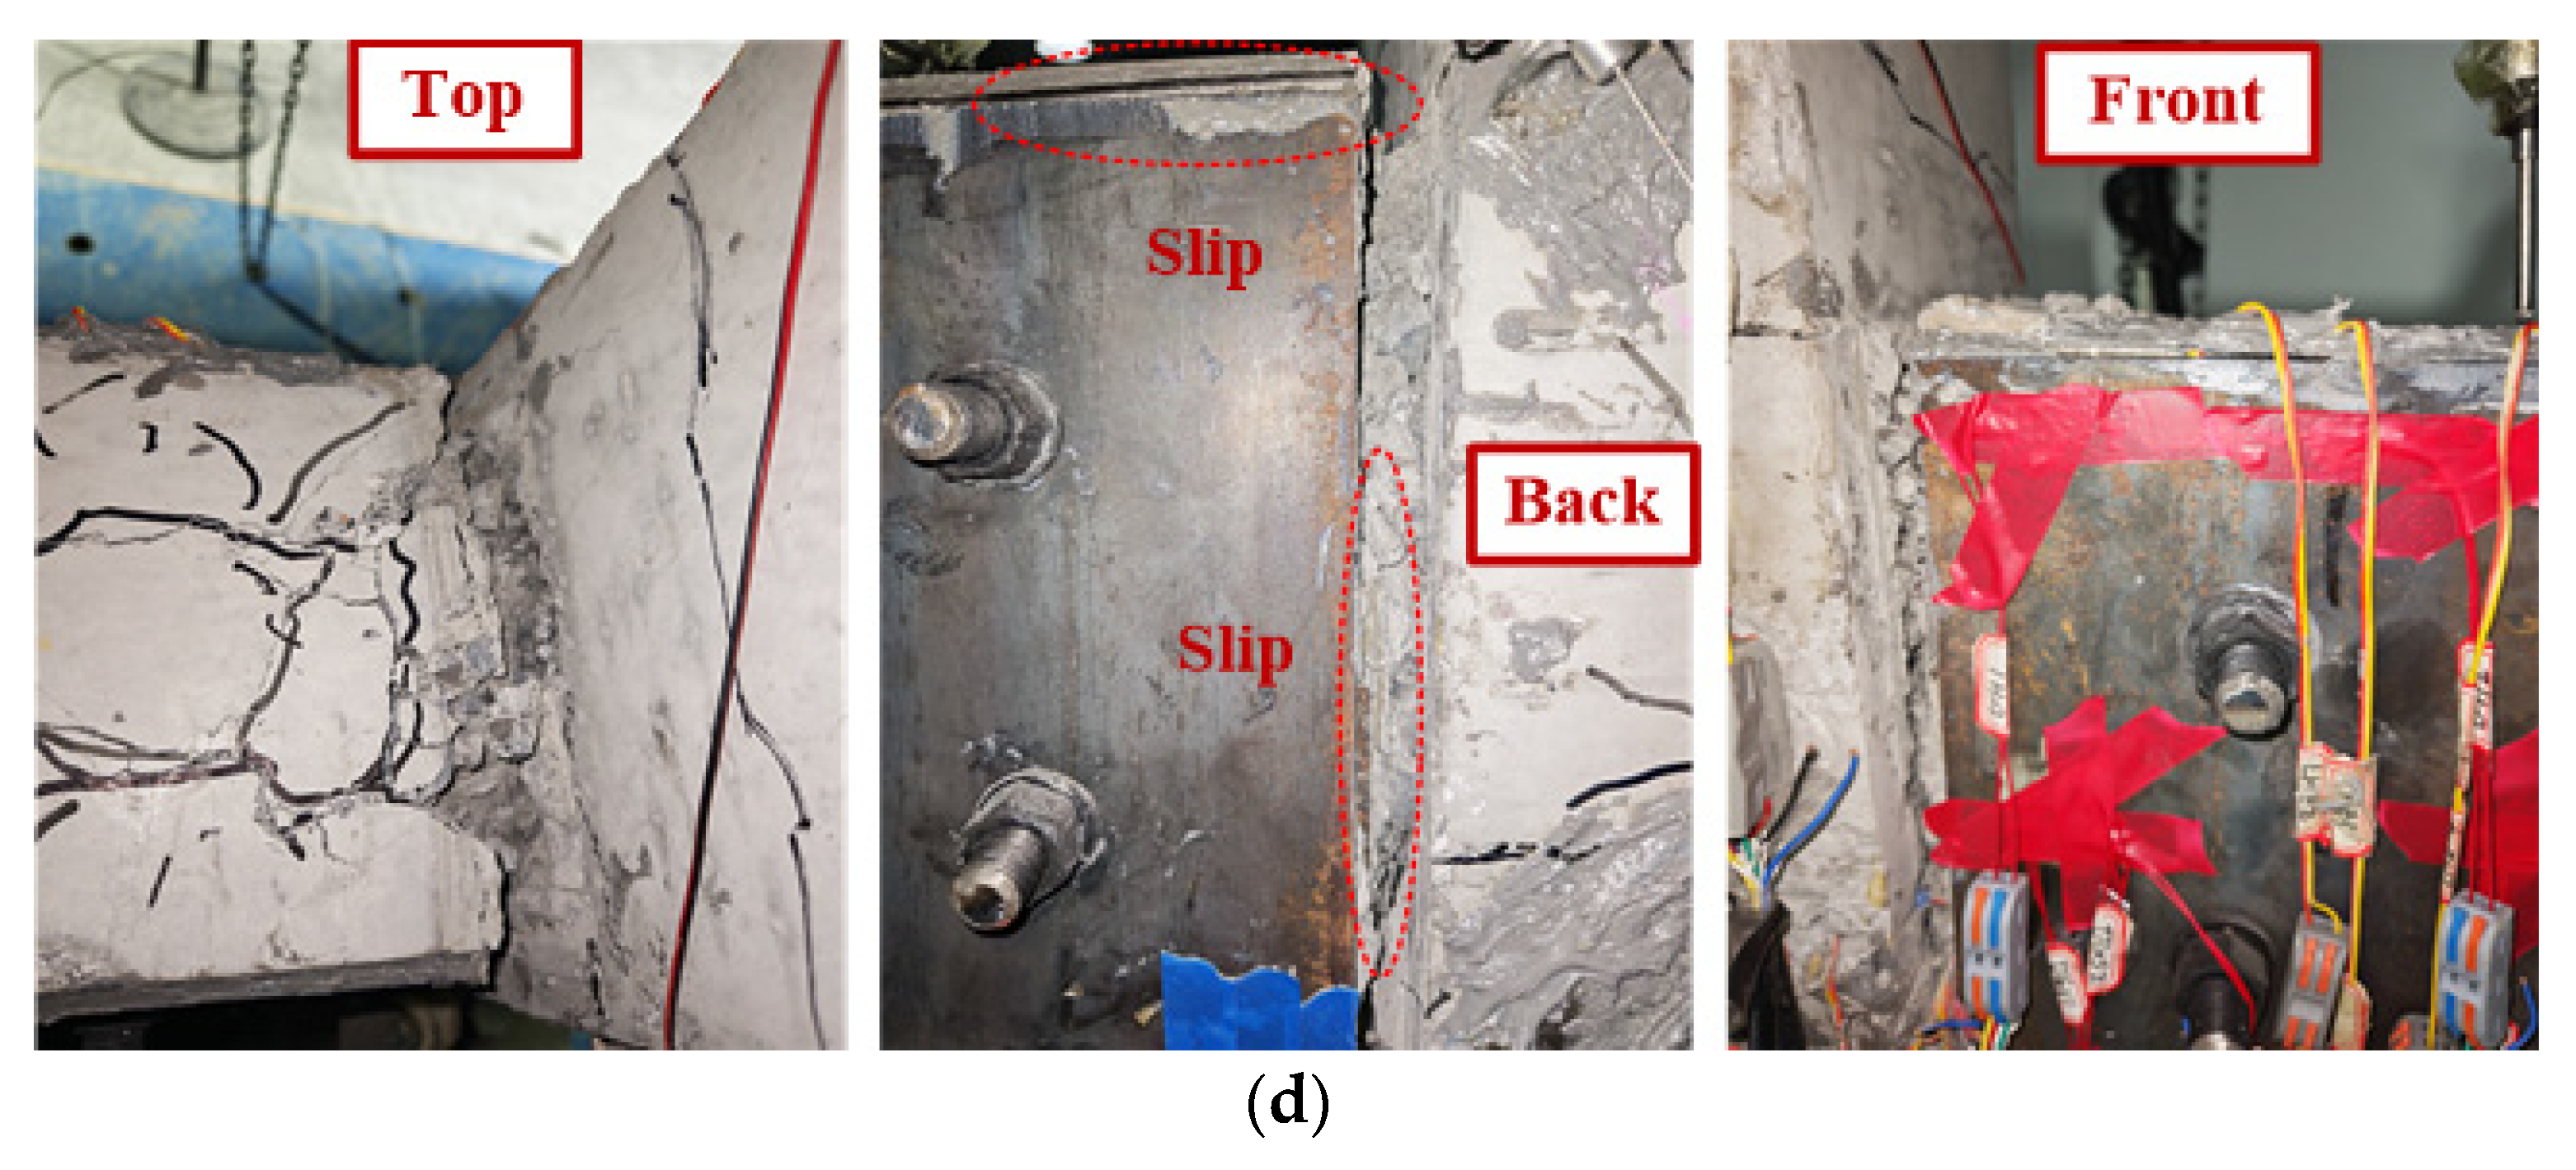
Plastic hinge failure at the beam ends. (a) NJ1; (b) SJ1; (c) SJ2; (d) SJ3.
Figure 9.
Cracking patterns of the column.
The failure processes of the strengthened specimens SJ1, SJ2, and SJ3 were generally similar to that of the reference specimen NJ1. At drift ratios below 0.5%, the primary observations included the initiation of new microcracks, predominantly transverse cracks, in the joint core region, the surrounding outer core region, and at the beam and column ends, as well as the propagation of initial microcracks. As the drift ratio increased, the transverse cracks at the beam root propagated across the top surface of the beam and extended towards both side faces. Diagonal cracks developed in the joint core region, while collar-shaped cracks appeared in the joint core region and at the column ends. Meanwhile, concrete crushing and fragmentation occurred at the top of the beam near the beam end root, indicating the progressive formation of a plastic hinge. As the drift ratio continued to increase, collar-shaped cracks also developed at the beam root, with the cracks progressively widening and deepening. Subsequently, inclined cracks appeared on the top surface of the beam. Under the combined flexural and shear actions, the concrete at the beam top and near the column face underwent progressive crushing, fragmentation, and spalling, accompanied by further development of the plastic hinge. Meanwhile, the inclined cracks in the joint core region continued to propagate and eventually formed intersecting diagonal cracks in two directions. Transverse cracks at different heights of the upper and lower column ends also propagated, forming multiple collar-shaped cracks. However, these collar-shaped cracks remained relatively fine. At the final failure stage, the plastic hinge region at the beam end was fully developed, with the crack width at the beam root exceeding 20 mm. The concrete was severely fragmented, accompanied by exposed and buckled reinforcing bars, while both the beam and column experienced substantial deformation. Consequently, the tests were terminated. At this stage, the load-carrying capacities of specimens SJ1 and SJ2 decreased markedly in the pushing direction, whereas specimen SJ3 exhibited a relatively smaller reduction. In contrast, the load-carrying capacities of all three strengthened specimens continued to increase in the pulling direction.
Compared with specimen NJ1 under the same loading levels, the strengthened specimens exhibited less severe and delayed crack development at the beam ends, attributable to the confinement provided by the U-shaped steel casing. At the final failure stage, severe damage was mainly concentrated at the beam top and near the beam root, where a wide collar-shaped crack formed around the beam root. This failure pattern differed from that of the unstrengthened specimen NJ1, in which collar-shaped cracks developed at multiple locations along the beam end. Due to the adoption of U-shaped steel plates with different thicknesses, the failure processes of these specimens presented certain differences, which are described as follows:
(1) For specimen SJ1, no obvious debonding between the U-shaped steel casing and the RC beam was observed throughout the entire loading process. However, due to the relatively small thickness of the U-shaped steel plate, pronounced buckling occurred in the bottom plate of the U-shaped steel near the beam root. The upper part of the U-shaped steel, which remained bonded to the fragmented concrete, also exhibited noticeable out-of-plane buckling. For specimen SJ2, debonding between the U-shaped steel casing and the RC beam was observed at the beam end during the later loading stage, resulting in relative slip between the two components. A certain degree of buckling also occurred in the bottom plate of the U-shaped steel near the beam root. In contrast, due to the larger steel plate thickness, no buckling occurred in the bottom plate of the U-shaped steel for specimen SJ3. However, relative slip between the U-shaped steel casing and the RC beam at the beam end was the most pronounced in this specimen.
It should be noted that the interfacial behavior between the U-shaped steel casing and the RC beam plays an important role in their composite action. However, the present study primarily focused on the overall seismic response of the exterior beam–column joints and did not directly measure steel–concrete interfacial slip, adhesive bond stresses, or bolt forces. Consequently, interfacial debonding, relative slip, and local buckling of the steel plates were evaluated qualitatively based on visual observations during testing. Their specific influences on composite action and overall seismic response could not be quantified from the available experimental data. The underlying interfacial force-transfer mechanisms therefore warrant further investigation.
(2) With the increase in the thickness of the U-shaped steel plates, shear damage in the joint core region became more pronounced. The unstrengthened reference specimen exhibited relatively few irregular inclined cracks, with the cracking pattern dominated by diagonal cracks oriented primarily in one direction. For specimen SJ1, the number of irregular inclined cracks increased, and intersecting diagonal cracks developed on the front face of the joint core region. In addition, on the rear surface, the column face near the beam end sustained relatively severe damage, with small fragments of concrete spalling off. For specimen SJ2, the number of irregular inclined cracks increased significantly. Intersecting diagonal cracks also formed on the rear face of the joint core region, with two parallel diagonal cracks developing in one of the two directions. On the front face near the beam end, inclined cracks divided the concrete on the column surface into isolated blocks. For specimen SJ3, intersecting diagonal cracks formed on both the front and rear faces of the joint core region. Although the column surface near the beam end remained largely intact, the diagonal cracks reached their greatest observed width among the specimens, at approximately 1.5 mm.
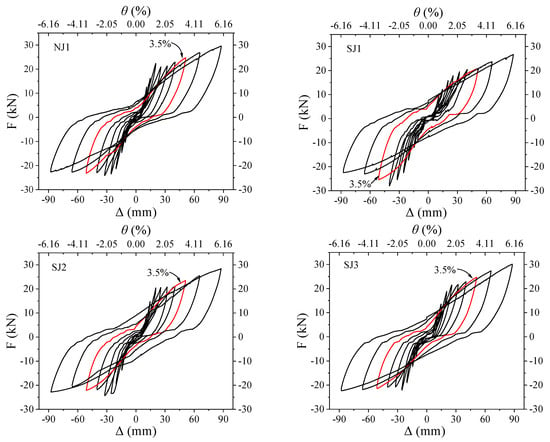
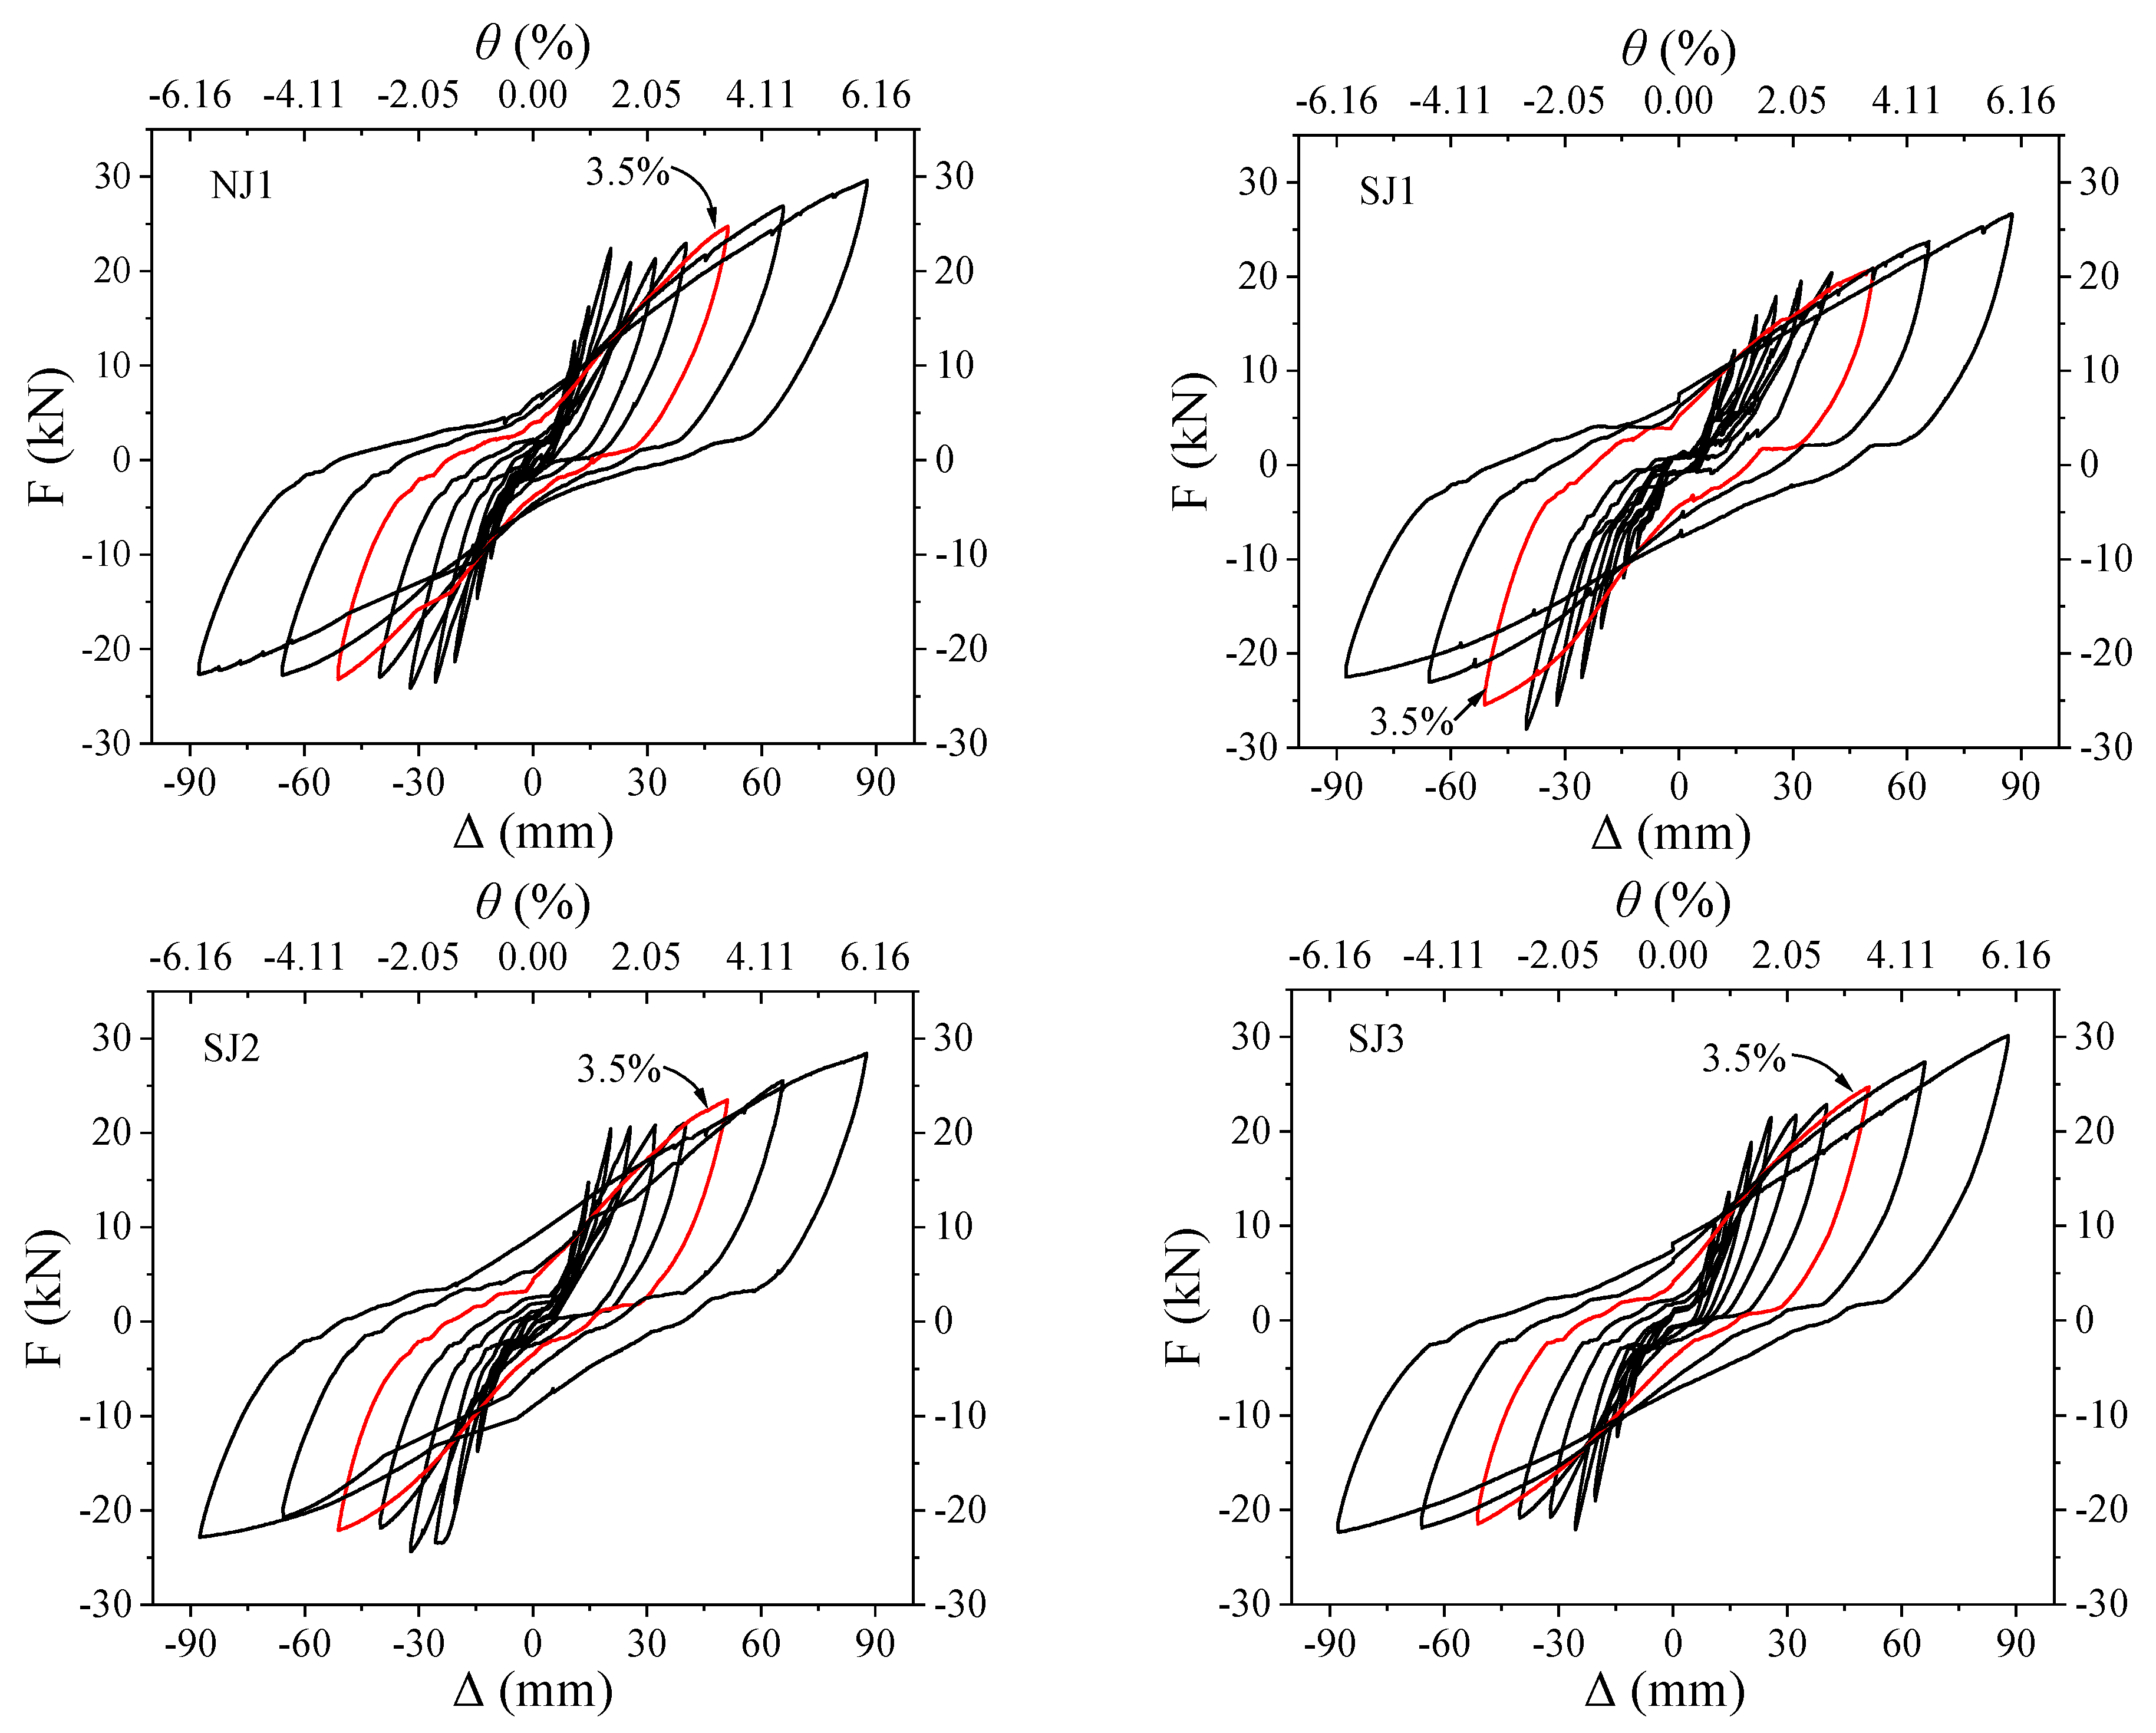
3.2. Hysteretic Curves
For specimens NJ1, SJ1, and SJ2, only one loading cycle was completed at a drift ratio of 8% because the excessive deformation and extensive cracking made further loading inappropriate. In addition, the hysteretic responses of the specimens were relatively unstable at drift ratios of 0.2%~0.5%, potentially due to initial clearance at the supports, minor slip in the actuator and loading fixtures, and measurement errors. Therefore, the hysteretic curves were plotted using data from the third loading cycle at each drift ratio level from 0.75% to 6%, as shown in Figure 10. The hysteretic curves corresponding to a drift ratio of 3.5% are highlighted in red, as this drift level is specified as a minimum drift level for cyclic performance acceptance evaluation in ACI 374.1-05 [25]. In general, at relatively small drift ratios, the hysteretic curves of all specimens exhibited slender reverse S-shaped profiles, with narrow loops and very small enclosed areas. No obvious pinching effect was observed near the zero displacement point. Instead, the curves showed slight outward bulging, which may be attributed to aggregate interlocking during crack closure. As the drift ratio increased, the hysteretic curves gradually developed into fuller reverse S-shaped loops with larger enclosed areas, while the pinching effect emerged near the zero displacement point. This indicates the onset of longitudinal reinforcement yielding, progressive development of plastic hinges, and a certain degree of bond slip between the reinforcing bars and the surrounding concrete. When the drift ratio reached 3.5%, the hysteretic curves became fuller and approached a bow-shaped profile. Under the combined action of bond slip and crack closure, the pinching effect became increasingly pronounced. It is worth noting that all specimens reached their peak load in the pushing direction, whereas their load-carrying capacities in the pulling direction continued to increase monotonically up to a drift ratio of 6%.
Figure 10.
Hysteretic curves. The red curves highlight the hysteretic loops corresponding to a drift ratio of 3.5%.
The main difference between specimens SJ1~SJ3 and specimen NJ1 is that, when the drift ratio exceeds 4.5%, the hysteretic curves of specimens SJ1~SJ3 gradually develop into a relatively ideal flag-shaped profile, resembling a parallelogram. This characteristic became particularly evident at the 6% drift ratio, at which the hysteretic loops were the fullest. During the initial unloading stage, the strengthened specimens exhibited a rapid reduction in load. Subsequently, the unloading path became approximately linear and inclined, maintaining this trend towards the reverse peak displacement. Pinching near zero displacement was no longer evident. Except for the initial rapid unloading stage, the loading and unloading paths were approximately parallel. In contrast, although the hysteretic loops of specimen NJ1 became fuller, they still retained a predominantly bow-shaped profile. This behavior may be attributed to the slip between the reinforcing bars and concrete, together with the repeated opening and closing of the cracks. At a drift ratio of 6%, the transverse confinement effect of the U-shaped steel appeared to be fully activated. This confinement may have effectively restrained the propagation of inclined cracks and limited the widening of transverse cracks at the beam end, thereby reducing severe fragmentation of the concrete surrounding the longitudinal reinforcement. By preserving the bond strength between the reinforcing bars and concrete, the U-shaped steel may also have effectively suppressed their relative slip and contributed to the observed changes in the hysteretic behavior. Differences in U-shaped steel plate thickness also influenced the development of the hysteretic curves of specimens SJ1~SJ3. Specifically, the hysteretic curve of specimen SJ1 retained a slender reverse S-shaped profile until the drift ratio reached 2.75%, while those of specimens SJ2 and SJ3 became relatively fuller at a drift ratio of 2.2%. This difference may be attributed to the relatively small plate thickness and low out-of-plane stiffness of the casing in specimen SJ1. At a drift ratio of 2.75%, the transverse confinement provided by the U-shaped steel remained relatively weak, and the interfacial gaps at the interface between the U-shaped steel and the RC beam may not have been fully closed, which led to a delay in the development of fuller hysteretic loops.
3.3. Skeleton Curves and Deformation Capacity
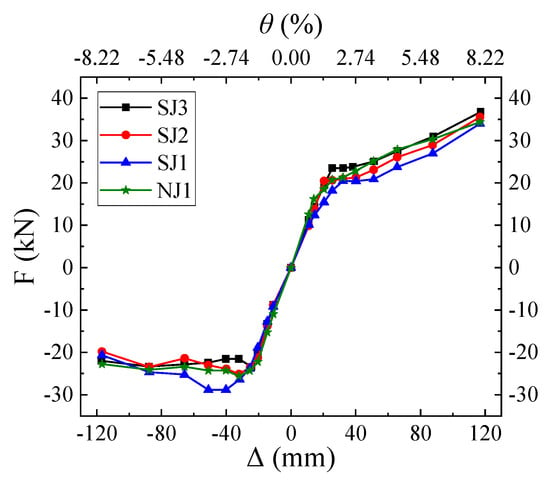
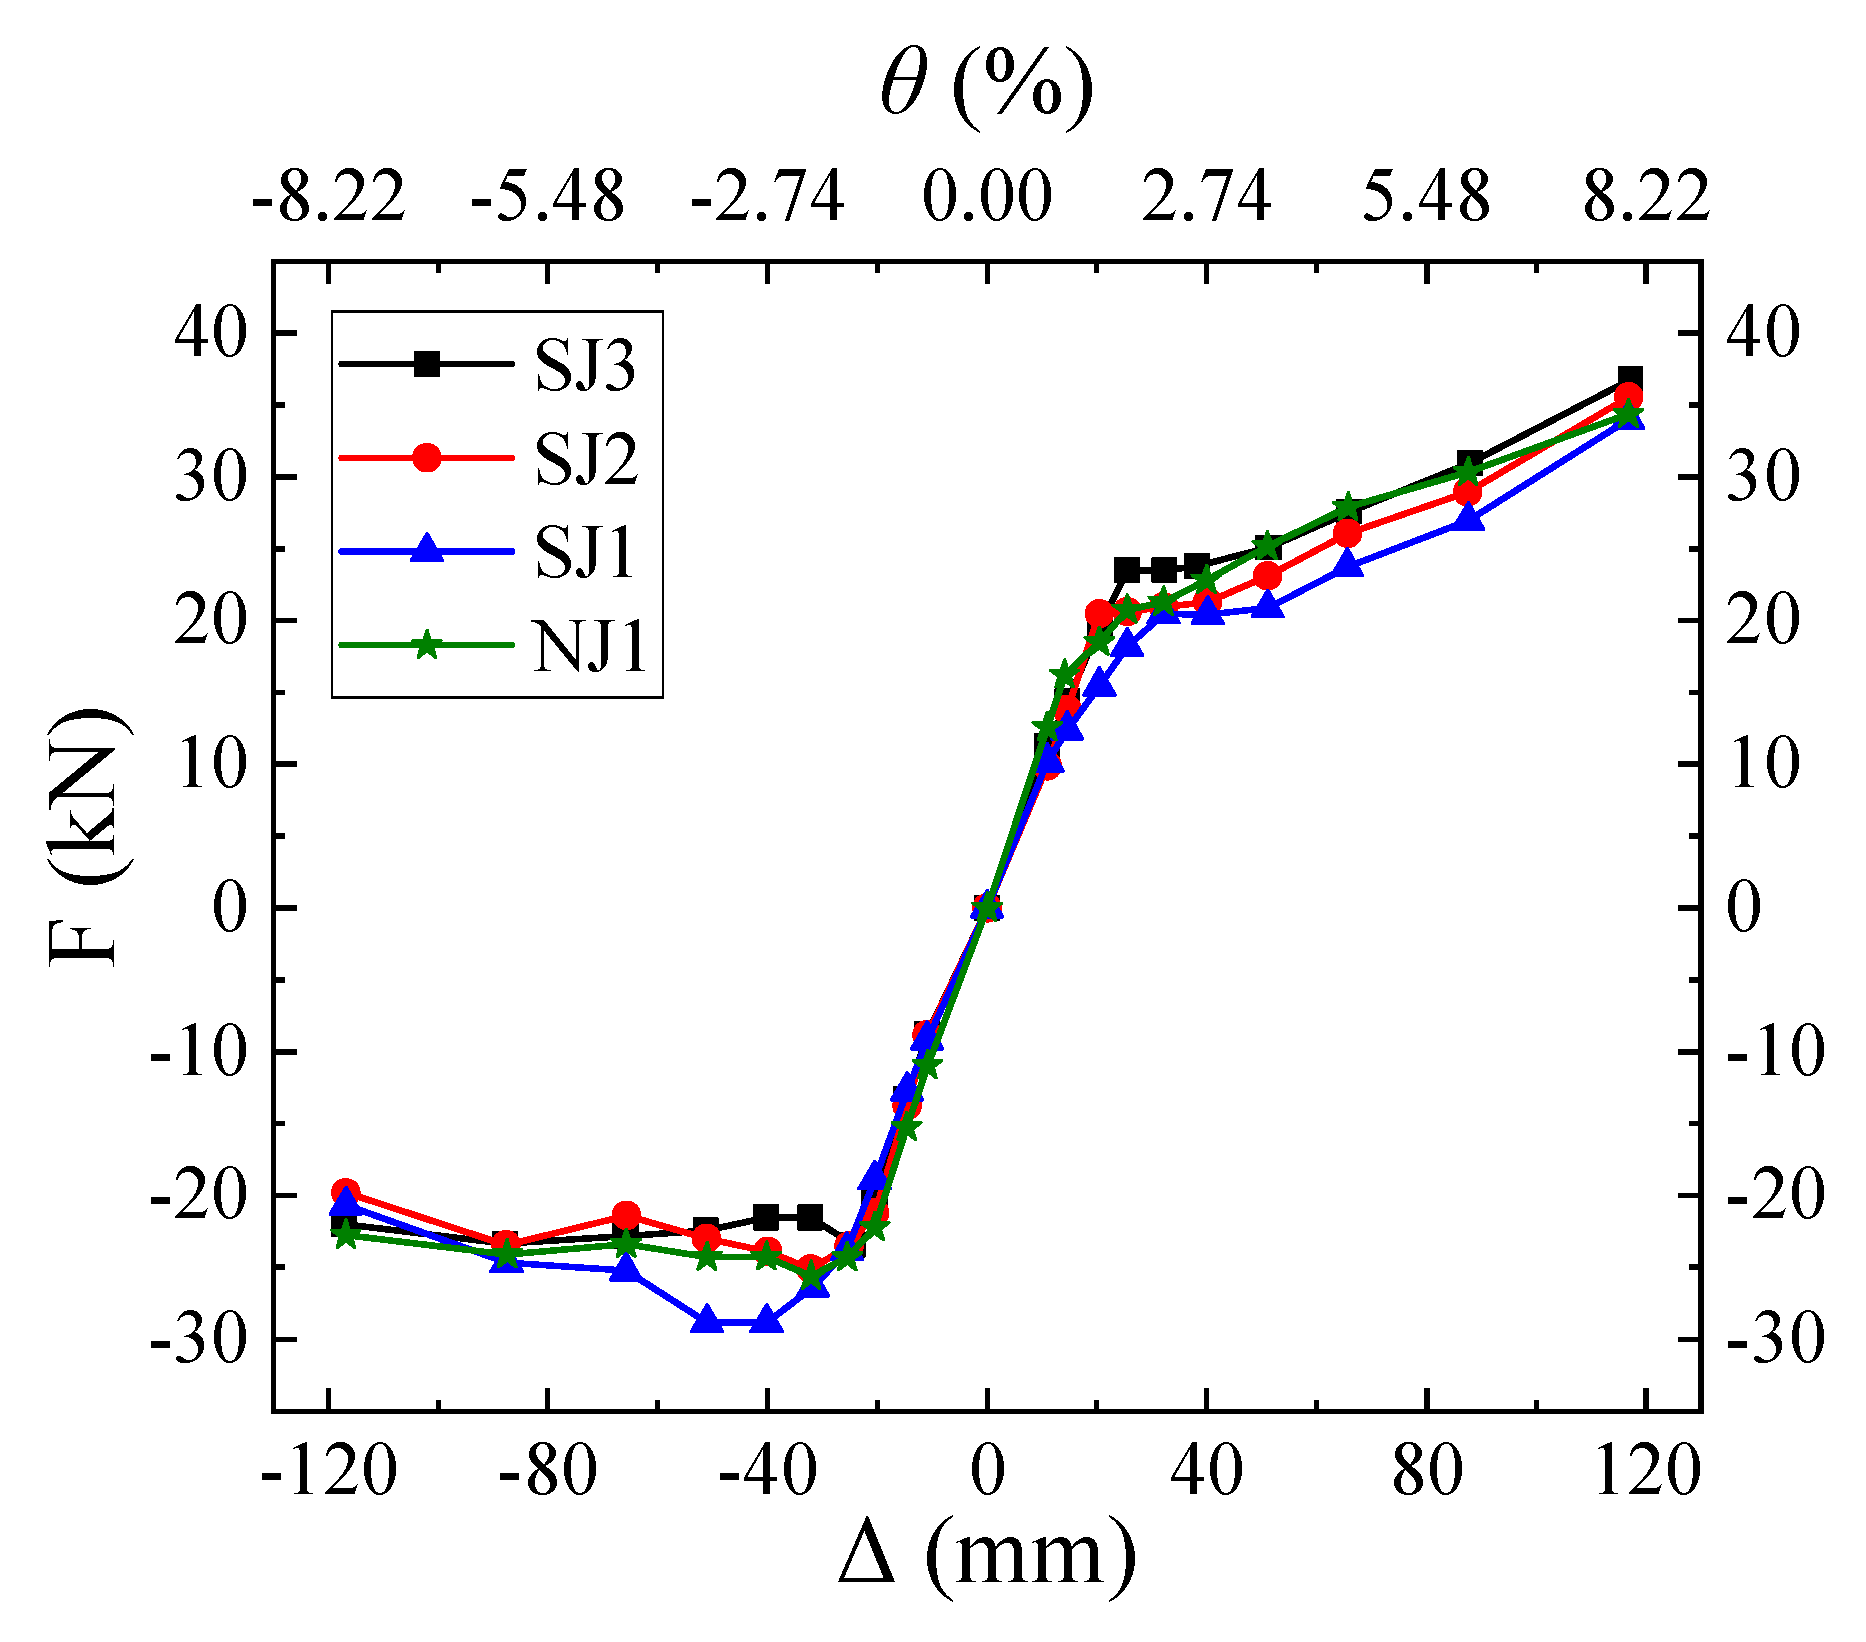
Figure 11 shows the skeleton curves of all specimens, which were obtained by connecting the peak points of the first hysteretic loop at each drift ratio loading level. In general, the skeleton curves of all specimens were approximately linear at small drift ratios, indicating predominantly elastic behavior. As the drift ratio increased, progressive crack development and the onset of longitudinal reinforcement yielding reduced the slopes of the skeleton curves, indicating a transition toward the elastoplastic stage. In the pulling direction, the load-carrying capacity of each specimen increased monotonically with the increase in the drift ratio. In contrast, in the pushing direction, the load-carrying capacity of the specimens reached its peak value at a certain drift ratio and subsequently decreased. It is worth noting that some specimens exhibited a second peak load, which was lower than the initial peak load, followed by a further reduction in load-carrying capacity. This phenomenon may be caused by the combined effects of strain hardening in the longitudinal reinforcement and the local confinement provided by the U-shaped steel casing. In addition, compared with specimen NJ1, specimens SJ1~SJ3 exhibited a distinct yield plateau in the pulling direction, followed by a gradual increase in load-carrying capacity of the specimens. This response may reflect the yielding and subsequent strain-hardening behavior of the strengthening system. However, no comparable yield plateau was observed for specimens SJ1~SJ3 in the pushing direction. This phenomenon is closely related to the characteristics of the U-shaped steel strengthening technique, which wraps the bottom and two side surfaces of the RC beam, while leaving the top surface unwrapped, consistent with the configuration of specimen NJ1.
Figure 11.
Skeleton curves.
With the variation in the thickness of U-shaped steel plates, the skeleton curves of the strengthened specimens exhibited differences. Specifically, a thicker U-shaped steel plate corresponded to a higher yield plateau in the pulling direction. The yield loads of specimens SJ3, SJ2 and SJ1 were approximately 23.60 kN, 20.84 kN and 20.58 kN, respectively. In contrast, in the pushing direction, specimens strengthened with thicker U-shaped steel plates generally exhibited lower peak load-carrying capacities within the investigated range of plate thicknesses. Furthermore, more pronounced shear cracking was observed in the joint core region of specimens strengthened with thicker steel plates, although plastic hinge formation at the beam ends remained the predominant overall failure mode. These observations suggest that the thickness of the U-shaped steel plate influences the local damage characteristics in the joint core region, but the underlying mechanisms require further investigation.
Considering the asymmetry of the skeleton curves and the distinct responses in the positive and negative loading directions, the R. Park method [26] was adopted to calculate the equivalent yield point displacement of each specimen in the pulling and pushing directions, respectively. The reference point was consistently determined according to the criterion that the deviation between the secant stiffness and the initial elastic stiffness was no more than 10%. Since the specimens did not necessarily reach their actual ultimate states at the prescribed termination drift ratio of 8%, the displacement corresponding to this drift ratio was defined as the test-termination displacement rather than the ultimate displacement. Accordingly, the test-termination-based displacement ratio, μt, of each specimen was calculated using Equation (2), and the calculation results are listed in Table 4.
where Δt denotes the test-termination displacement corresponding to a drift ratio of 8%, and Δy denotes the equivalent yield point displacement.
Table 4.
Characteristic load values and test-termination-based displacement ratios.
As shown in Table 4, specimen NJ1 exhibits the smallest equivalent yield point displacement and the largest test-termination-based displacement ratio, whereas specimen SJ1 exhibits the smallest ratio. The average test-termination-based ratios of specimens SJ2 and SJ3 are very close. It should be noted that interfacial gaps may exist between the U-shaped steel and the RC beam at the initial loading stage. In particular, the gaps between the bottom plate of the U-shaped steel and the bottom surface of the RC beam may reduce the initial stiffness of the specimens, which correspondingly increases the equivalent yield point displacement Δy.
In addition, the specimens exhibited different strength evolution characteristics in the pulling and pushing directions. At the termination drift ratio of 8%, the load-carrying capacities of all specimens continued to increase in the pulling direction. In contrast, the load-carrying capacities of all specimens in the pushing direction had decreased to approximately 88.9%, 71.6%, 78.9%, and 93.8% of their respective peak values for specimens NJ1, SJ1, SJ2, and SJ3. Therefore, if the ultimate displacement is defined as the displacement at which the load-carrying capacity decreases to 85% of its peak value, the corresponding ultimate displacements can be estimated only for specimens SJ1 and SJ2 in the pushing direction, but not for the specimens NJ1 and SJ3. In addition, the ultimate displacements of all specimens cannot be determined in the pulling direction within the tested displacement range.
Furthermore, at a drift ratio of 8%, severe concrete cracking, crushing, and spalling occurred in the beam end plastic hinge regions, accompanied by the exposure and local buckling of the longitudinal reinforcement. Given the substantial specimen deformation and the potential safety risks associated with further loading, the tests were terminated at this drift level. Accordingly, the displacement corresponding to a drift ratio of 8% represents the test-termination displacement rather than the actual ultimate displacement. As further illustrated in Figure 10, the strengthened specimens exhibit improved cyclic deformation behavior under large drift ratios, as evidenced by their fuller hysteretic loops. Therefore, it would be inappropriate to conclude that the strengthened specimens have lower plastic deformation capacity than the reference specimen based solely on the test-termination-based displacement ratios. Moreover, the comparison depends on the adopted displacement definition, as defining the ultimate displacement based on strength degradation could yield different ratios and specimen rankings. Nevertheless, the average test-termination-based displacement ratios of all strengthened specimens exceed 3.2, indicating that they maintain considerable deformation capacity up to the prescribed termination drift ratio of 8%.
3.4. Stiffness Deterioration
The secant stiffness of each specimen is calculated using Equation (3) [27]. For consistency, the peak-point data from the first hysteretic loop at each drift ratio are adopted in the calculations. The secant stiffness at a drift ratio of 0.75% is defined as the initial stiffness of each specimen.
where Ki denotes the secant stiffness at the i-th drift ratio loading level, +Fi and −Fi represent the loads at the positive and negative peak points at the i-th drift ratio loading level, respectively, +Xi and −Xi represent the displacement values of the positive and negative peak points at the i-th drift ratio loading level, respectively.
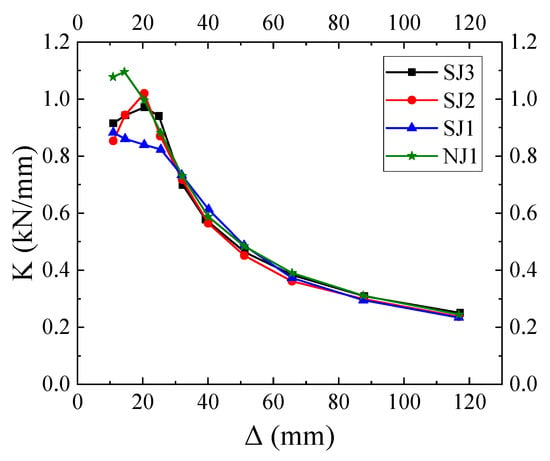
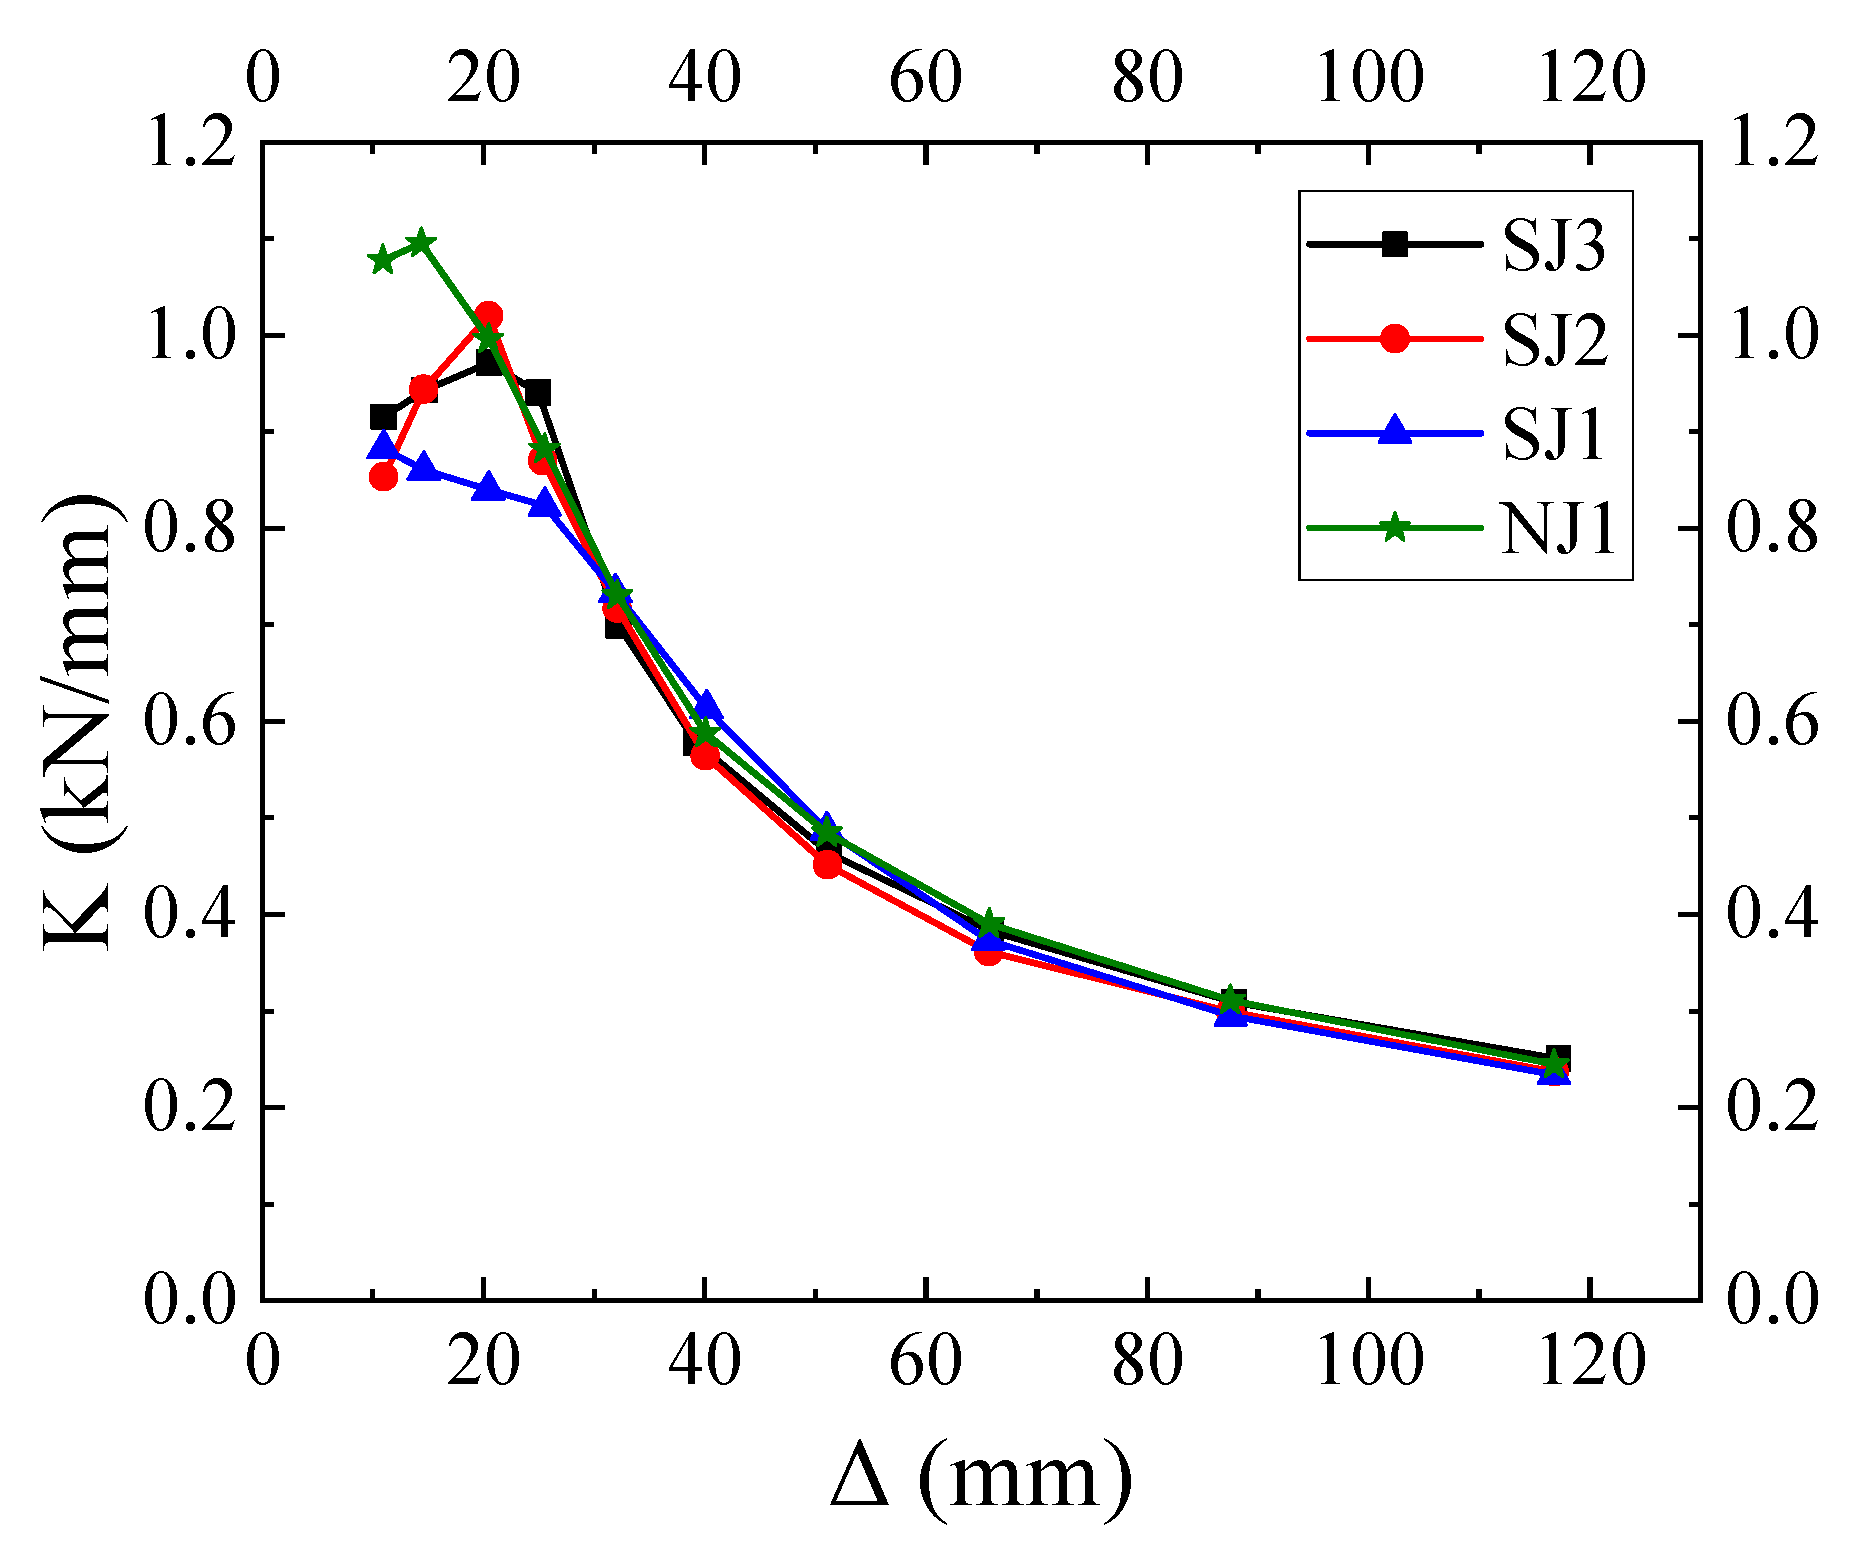
Figure 12 presents the stiffness degradation curves of all specimens. It can be observed that within the drift ratio range of 0.75~1%, specimen NJ1 exhibits the highest secant stiffness, with its secant stiffness at a drift ratio of 1% slightly higher than that at 0.75%. This behavior may be attributed to the interfacial gaps between the U-shaped steel casing and the RC beam, which have not been fully compacted at small drift ratios. Consequently, effective composite action between the two components has not yet been fully mobilized, resulting in considerably lower secant stiffness in the strengthened specimens than in the referenced specimen over this drift ratio range. In addition, aggregate interlocking and the compaction of concrete may contribute to a slight increase in secant stiffness at the small drift ratios. For specimens SJ2 and SJ3, the secant stiffness also increases progressively within the drift ratio range of 0.75~1.4%. This trend may be attributed to the gradual closure and compaction of the interfacial gaps between the U-shaped steel casing and the RC beam, which enable the U-shaped steel casing to participate more effectively in resisting deformation. The resulting confinement effect helps restrain and delay crack propagation and contributes to the increase in secant stiffness. The secant stiffness does not begin to decrease rapidly until the longitudinal reinforcement yields. In contrast, specimen SJ1 exhibits a gradual decrease in secant stiffness throughout the initial loading stage. This behavior is related to the relatively lower sectional stiffness of the thinner U-shaped steel plate, which delays the mobilization of the steel casing. Consequently, the interfacial gaps remain incompletely closed, while crack development at the beam end is more severe than that of specimens SJ2 and SJ3. Overall, among the strengthened specimens, specimen SJ3 has the highest secant stiffness over the drift ratio range of 0.75~1.75%, which is slightly larger than that of specimen SJ2, while specimen SJ1 has the lowest secant stiffness. However, this ranking changes at intermediate drift ratios of 2.2–3.5%, where specimen SJ1 exhibits the highest secant stiffness, exceeding those of specimens NJ1, SJ2, and SJ3. As the drift ratio increases to 4.5%, stiffness degradation of all specimens slows down significantly, and the secant stiffness values of all specimens converge. In particular, the stiffness degradation curves of specimens NJ1 and SJ3 almost overlap, as do those of specimens SJ1 and SJ2, with the former pair exhibiting slightly higher secant stiffness than the latter pair.
Figure 12.
Stiffness degradation curves.
3.5. Strength Deterioration
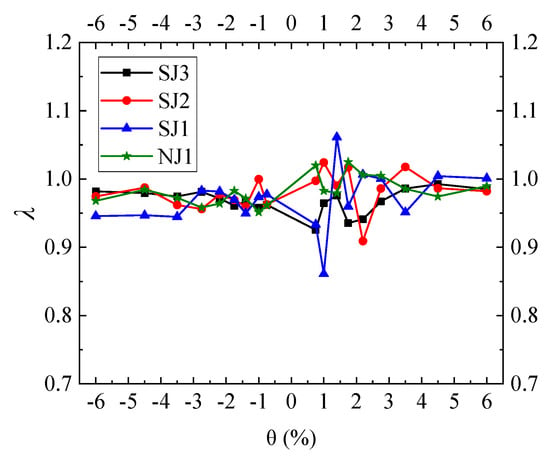
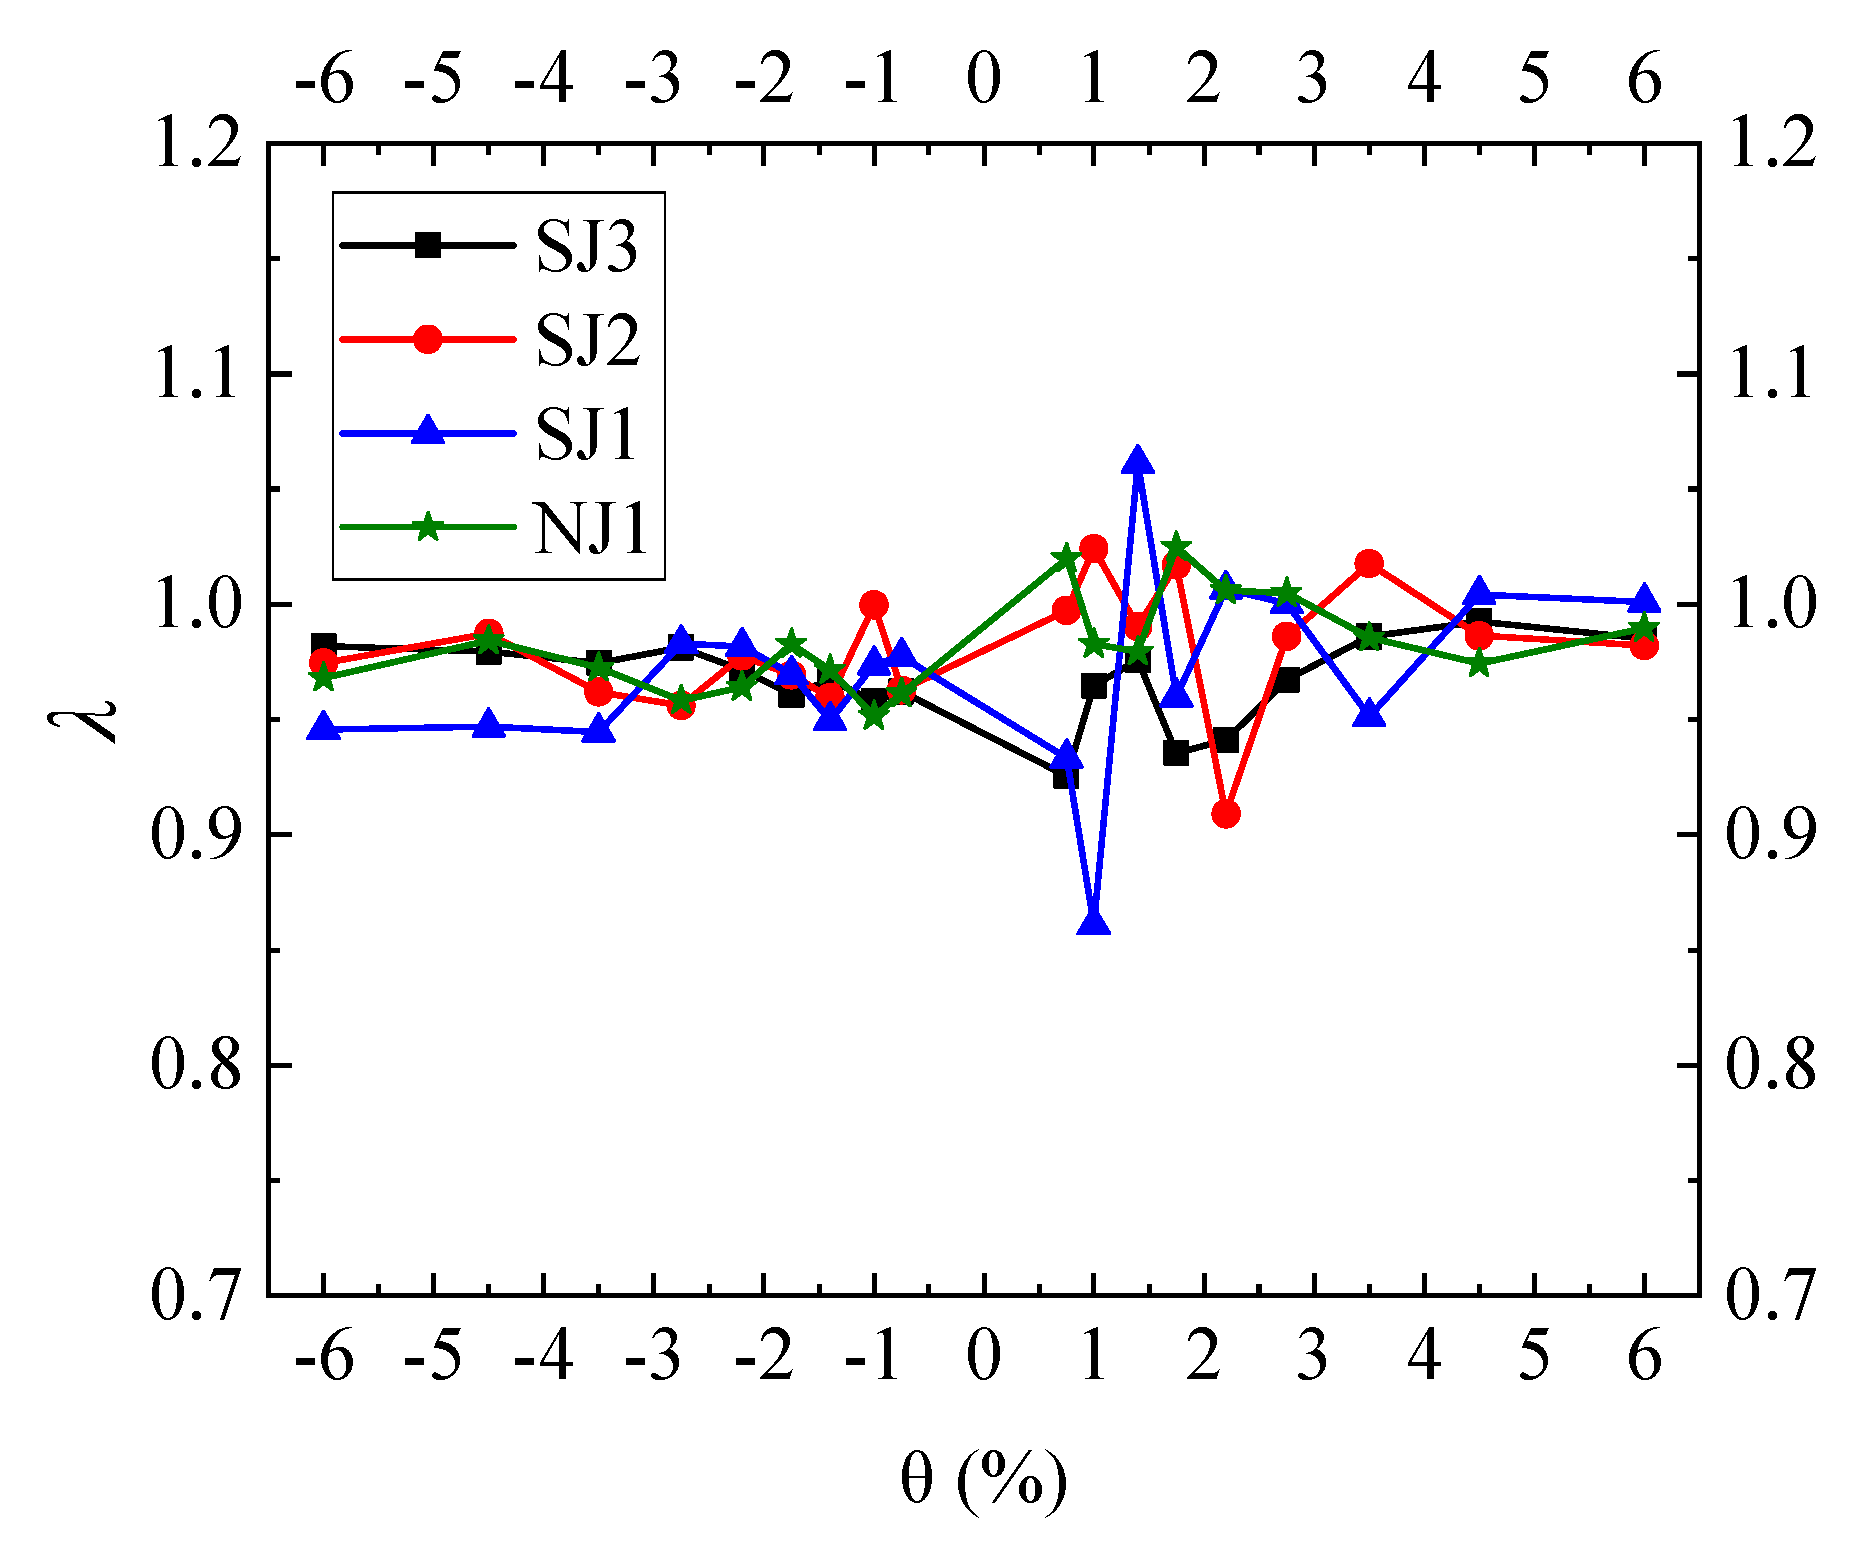
The strength degradation coefficient λi of each specimen is calculated using Equation (4) [27,28,29]. For consistency, the ratio of the peak load of the second hysteretic loop to that of the peak load of the first hysteretic loop at each drift ratio loading level is adopted to calculate the strength degradation coefficient. The resulting strength degradation curves are shown in Figure 13.
where denotes the peak load in the i-th loading cycle at the j-th drift ratio loading level, denotes the peak load in the (i − 1)-th loading cycle at the j-th drift ratio loading level.
Figure 13.
Strength degradation curves.
As shown in Figure 13, with the exception of two data points for specimen SJ1, which exhibit relatively large deviations (strength degradation coefficients of 0.861 and 1.061 at drift ratios of 1% and 1.4%, respectively), all the remaining data points fall within the range of 0.91~1.03. This indicates that the load-carrying capacities of the specimens remain relatively stable across the drift ratio loading levels, with no significant fluctuations even at large drift ratios. As mentioned in the previous section, the relatively thin U-shaped steel plate in specimen SJ1 leads to low sectional stiffness and less stable mechanical behavior at small drift ratios, which likely explains the relatively large deviations in these two data points.
3.6. Energy Dissipation
The energy dissipation capacity of each specimen is evaluated using the energy dissipation coefficient E and the equivalent viscous damping coefficient ζeq [27,30], which are calculated from Equations (5) and (6), respectively.
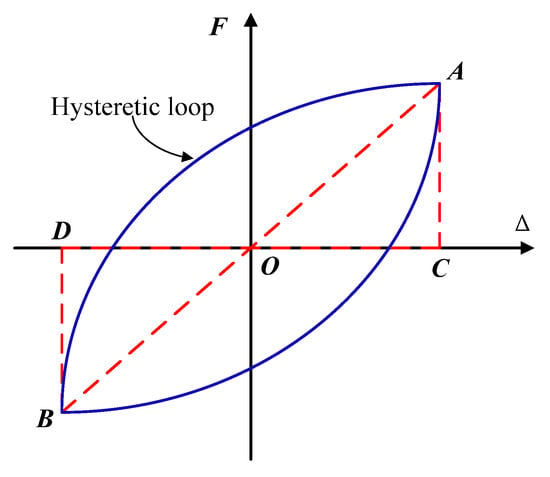
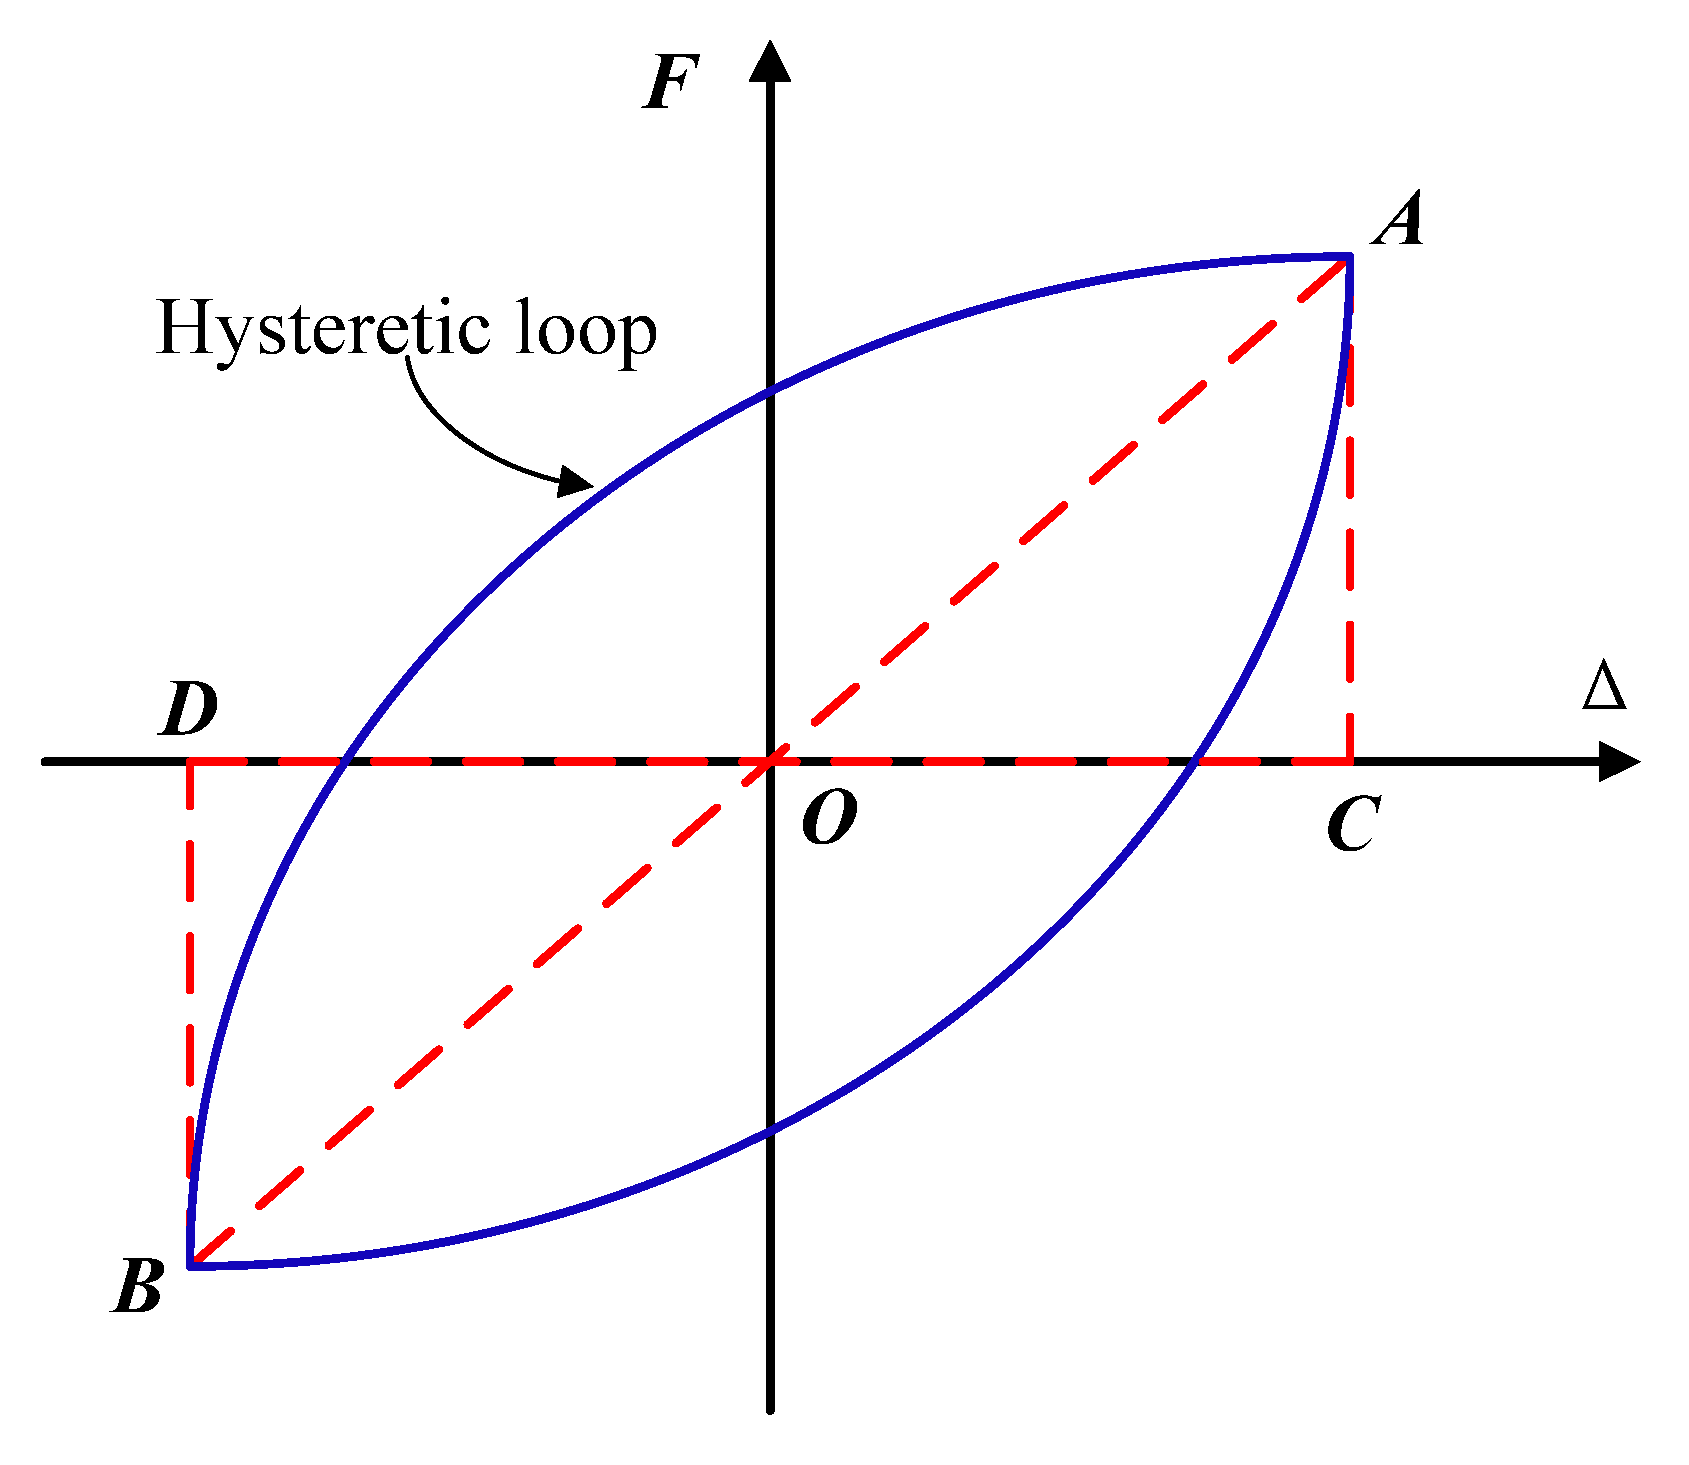
where S1 denotes the area enclosed by the entire hysteretic loop, while S2 represents the sum of the areas of the two triangles OAC and OBD, which are formed by the origin O, and the positive and negative peak points A and B of the hysteretic curve, as illustrated in Figure 14.
Figure 14.
Calculation of equivalent viscous damping coefficient.
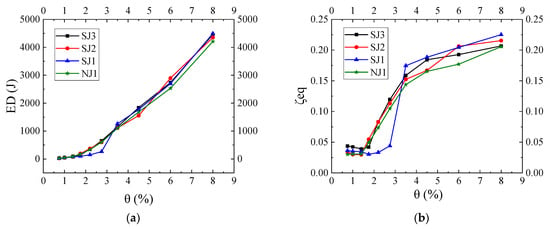
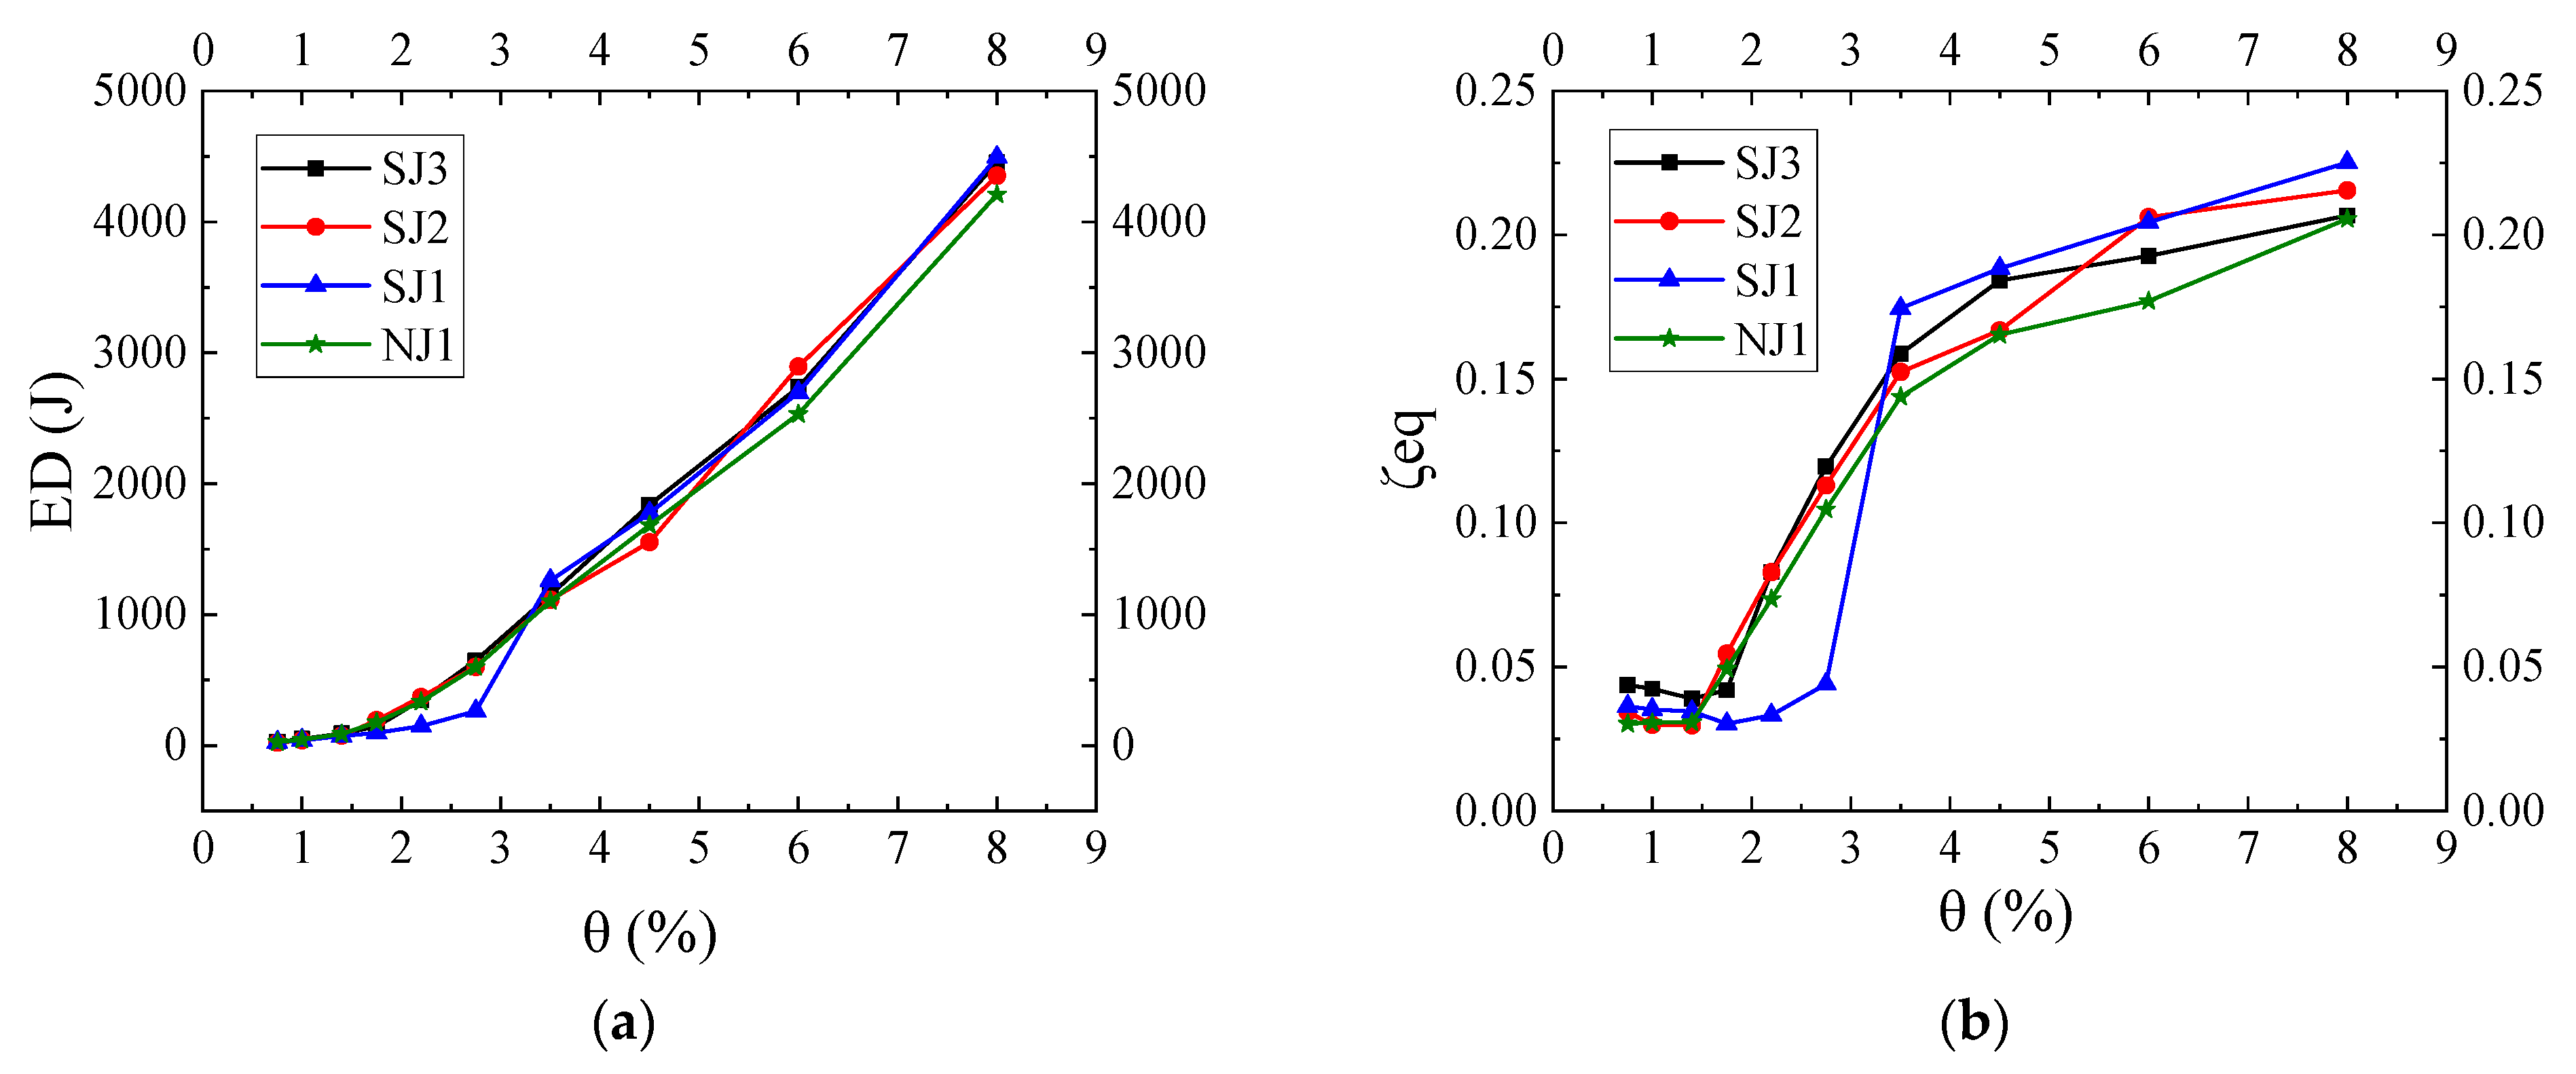
In this study, the equivalent viscous damping coefficient ζeq and the energy dissipated over the entire hysteretic loop Ed (i.e., S1) are selected to evaluate the energy dissipation capacity of the joint specimens, as shown in Figure 15a and Figure 15b, respectively. As mentioned previously, specimens SJ1, SJ2, and NJ1 were only loaded for one cycle at a drift ratio of 8%. Accordingly, the first hysteretic loop at each drift ratio loading level is adopted to calculate the corresponding energy dissipation indexes for consistency, so as to characterize the energy dissipation capacity of the joint specimens at the final failure stage.
Figure 15.
Energy dissipation. (a) Energy dissipated by the entire hysteretic loop; (b) Equivalent viscous damping coefficient.
As shown in Figure 15a, at drift ratios not exceeding 2.75%, the hysteretic loop energy dissipation of specimens NJ1, SJ2 and SJ3 remained at a broadly similar level. In contrast, specimen SJ1 exhibited substantially lower energy dissipation than the other specimens over the drift ratio range of 1.75~2.75%. This phenomenon is closely related to the delayed improvement in the fullness of the hysteretic curve of specimen SJ1 as discussed in Section 3.2. The main reason is that the relatively thin U-shaped steel plates in SJ1 provided less effective force transfer across the steel–concrete interface, delaying the development of effective composite action between the U-shaped steel and the RC beam. As loading continued and the interface contact conditions evolved, the hysteretic loops of SJ1 became fuller at drift ratios exceeding 3.5%, accompanied by increased energy dissipation. When the drift ratio exceeded 3.5%, the strengthened specimens generally exhibited greater hysteretic energy dissipation than the reference specimen NJ1. The exception was specimen SJ2 at a drift ratio of 4.5%, for which the dissipated energy was slightly lower than that of specimen NJ1. This enhancement is particularly pronounced at a drift ratio of 6%, at which the hysteretic energy dissipation of specimens SJ3, SJ2, and SJ1 was increased by 8.1%, 14.3%, and 6.5%, respectively, compared with that of specimen NJ1. Furthermore, the hysteretic energy dissipation of all specimens increased at an accelerating rate as the drift ratio increased.
As shown in Figure 15b, within the drift ratio range of 0.75~1.4%, the equivalent viscous damping coefficients of the strengthened specimens decreased slightly, while that of specimen NJ1 remained nearly constant. This indicates that the specimens were still primarily in the elastic stage with very limited plastic deformation. Within the drift ratio range of 1.75~3.5%, the equivalent viscous damping coefficients of specimens SJ2, SJ3 and NJ1 increased rapidly, whereas that of SJ1 increased more gradually and remained the lowest among the specimens. At a drift ratio of 3.5%, however, the equivalent viscous damping coefficient of specimen SJ1 increased markedly and exceeded those of all other specimens. This change coincided with the development of fuller hysteretic loops and may indicate more effective composite action between the U-shaped steel casing and the RC beam at large drift ratios. The observed differences may also be associated with the condition of the steel–concrete interface and the extent of joint-core damage. Visual observations indicated that no obvious interfacial slip or debonding occurred between the U-shaped steel casing and the RC beam of specimen SJ1 at the later loading stages, while obvious interfacial slip was observed in specimens SJ2 and SJ3. In addition, more pronounced joint-core shear cracking was observed in specimens with thicker U-shaped steel plates, which also led to a reduction in energy dissipation capacity. Within the drift ratio range of 1.75~2.75%, the equivalent viscous damping coefficients of specimens SJ2 and SJ3 were both slightly larger than that of specimen NJ1, except that the value for specimen SJ3 was smaller than that of specimen NJ1 at a drift ratio of 1.75%. At larger drift ratios, ranging from 3.5% to 8%, the strengthened specimens exhibited substantially higher equivalent viscous damping coefficients than the reference specimen. At a drift ratio of 6%, the equivalent viscous damping coefficients of the strengthened specimens SJ3, SJ2 and SJ1 were increased by 8.9%, 16.5% and 15.4%, respectively, compared with that of specimen NJ1. Furthermore, when the drift ratio exceeded 3.5%, the growth rate of the equivalent viscous damping coefficients of all specimens decreased significantly. Overall, the results indicated that U-shaped steel strengthening enhanced the energy dissipation performance of the joint specimens, particularly when entering the large deformation stage.
3.7. Simplified Mechanical Analysis
To further investigate the mechanical behavior of the exterior beam–column joint specimens, a simplified mechanical model was developed in this section. The model was used to provide a mechanics-based interpretation of the experimental observations, particularly the more pronounced shear cracking in the joint core region with increasing U-shaped steel plate thickness and the limited improvement in overall load-carrying capacity.
3.7.1. Nominal Joint Shear Force
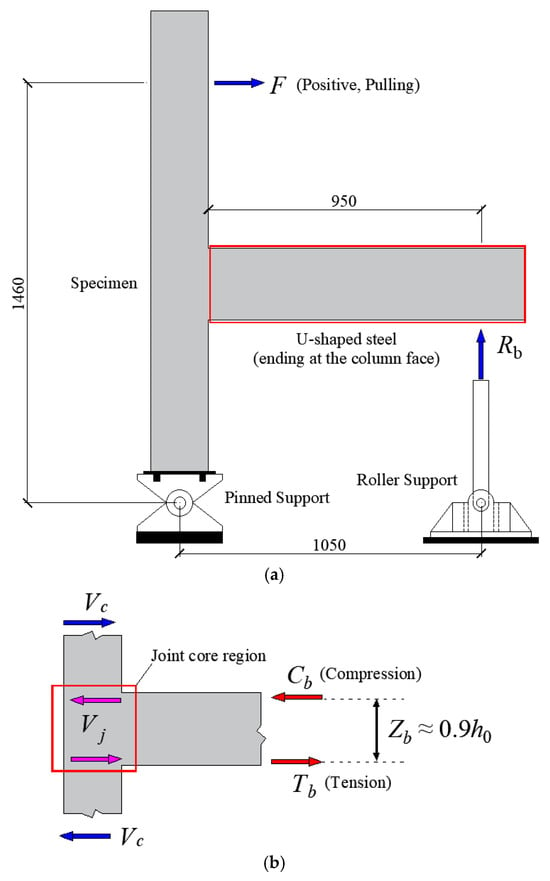
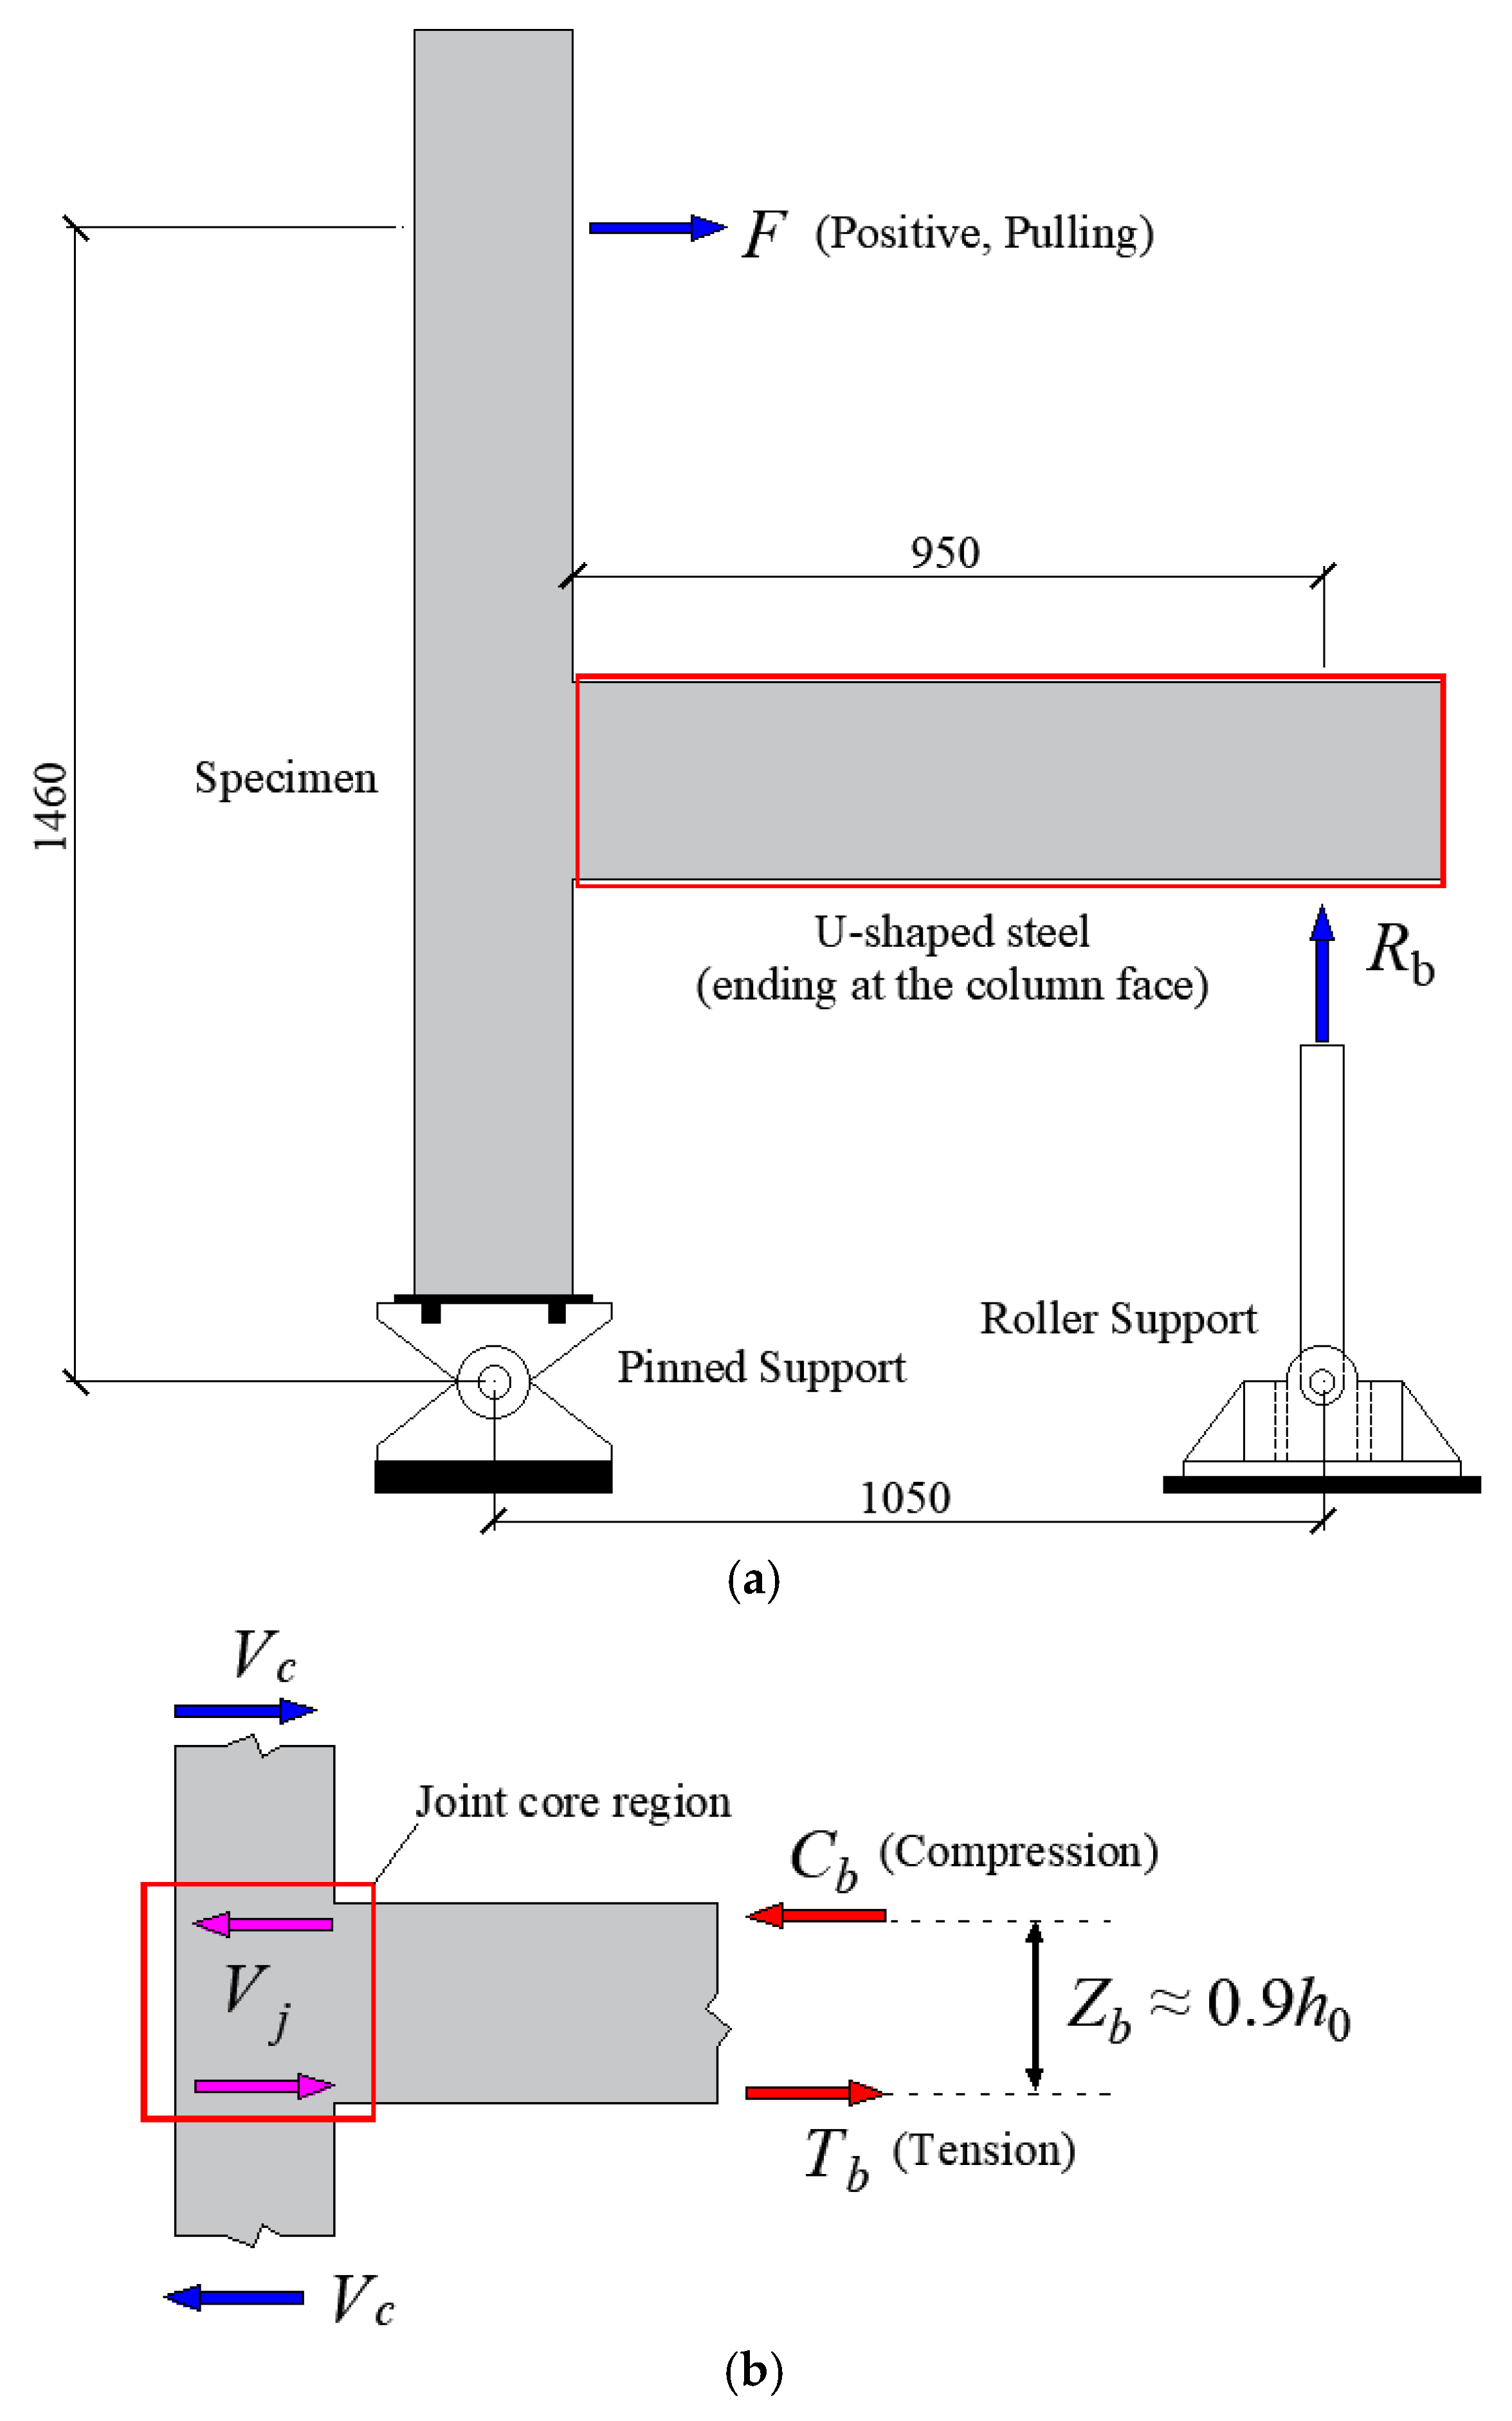
Figure 16 illustrates the simplified mechanical model of the exterior beam–column joint specimen. Based on Figure 16a, the overall moment equilibrium of the specimen can be expressed as follows:
where Hc is the distance from the point of application of the horizontal force F to the center of the pinned support at the column base, taken as 1460 mm, Ls is the horizontal distance from the line of action of the beam end support reaction Rb to the center of the pinned support at the column base, taken as 1050 mm.
Figure 16.
Simplified mechanical model of the exterior beam–column joint specimen (Units: mm). (a) Overall equilibrium of the specimen; (b) Forces acting on the joint core region.
Accordingly, the beam end moment at the column face, Mb, can be calculated using Equation (8):
where Lb is the distance from the line of action of Rb to the column face, taken as 950 mm. Here, the unit of Mb is set to kN·m while that of F is set to kN.
Based on the joint shear calculation method using the equivalent internal forces at the beam end and the column shear force (Figure 16b) [31], the nominal joint shear force can be estimated as follows:
where h0 is the effective depth of the beam cross-section, taken as 215 mm. For the column segment above the joint, the column shear force Vc is taken as F in the simplified analysis. When Vc, F, and Vj are expressed in kN, the nominal joint shear force can be obtained as follows:
The nominal joint shear forces of the four specimens were calculated at representative drift ratios of 3.5%, 4.5%, 6%, and 8%, with the results presented in Table 5. The results indicate that the nominal joint shear demand does not exhibit a consistent monotonic relationship with the U-shaped steel plate thickness, and the observed trends differ between the positive and negative loading directions. At certain drift ratios, the reference specimen NJ1 exhibits a higher nominal joint shear demand than some of the strengthened specimens. Therefore, the more pronounced shear cracking observed in the joint core region with increasing steel plate thickness cannot be simply attributed to an increase in nominal joint shear demand.
Table 5.
Nominal joint shear forces at different drift ratios (Units: kN).
3.7.2. Nominal Shear Rigidity of the Strengthened Beam Cross-Section
Based on a simplified elastic stiffness superposition approach, partial composite action between the U-shaped steel casing and the RC beam is assumed, while the direct contribution of the U-shaped steel bottom plate to the shear resistance is neglected. The nominal shear rigidity of the strengthened beam cross-section can be estimated using the following Equations (11)–(13).
where SRC and Ss denote the nominal shear rigidity contributions of the RC beam section and the U-shaped steel, respectively; κc and κs are the shear correction factors for the RC beam and the U-shaped steel, respectively, both taken as 5/6, Gc and Gs are the shear moduli of concrete and steel, respectively; Ac is the cross-sectional area of the RC beam; ts and hs are the thickness and height of the U-shaped steel side plates, respectively, with hs = 250 mm; η is the effective participation factor of the U-shaped steel; Ec and Es are the elastic moduli of concrete and steel, taken as 32,500 MPa and 206,000 MPa, respectively; and νc and νs are the Poisson’s ratios of concrete and steel, taken as 0.20 and 0.30, respectively.
By substituting the above parameters into Equation (11), the nominal shear rigidity of the strengthened beam section can be expressed as follows:
where Sb is expressed in MN and ts in mm.
Table 6 presents the calculated results for the four specimens, assuming an effective participation factor η of 0.75 for the U-shaped steel. It should be noted that this value was adopted as an assumption and was not calibrated against the experimental measurements. Compared with the reference specimen NJ1, the nominal shear rigidity of the strengthened beam cross-sections in specimens SJ1, SJ2, and SJ3 increased by approximately 9.9%, 27.5%, and 33.3%, respectively. Under the adopted simplified elastic assumptions, these results indicate that the nominal shear rigidity of the strengthened beam section increased with U-shaped steel plate thickness, suggesting an enhancement in its potential shear restraint.
Table 6.
Nominal shear rigidity of the beam cross-sections in different specimens.
Since the U-shaped steel casing terminates at the column face without extending into the joint core region, increasing the steel plate thickness may increase the local stiffness contrast between the strengthened beam segment and the joint core region. This contrast could affect stress transfer and deformation compatibility near the column face. Such changes may be associated with the more pronounced shear cracking observed in the joint core region. However, the underlying mechanism requires further verification.
It should be noted that the above analysis is based on simplified assumptions of elastic composite action and does not account for concrete cracking, interfacial slip, or stiffness degradation under cyclic loading. Therefore, the calculated results are intended primarily to evaluate the influence of steel plate thickness on the nominal shear rigidity of the strengthened beam cross-section, rather than to predict the actual stiffness or extent of joint damage at large deformation levels.
4. Conclusions
To investigate the influence of strengthening existing RC beams with U-shaped steel casing on the seismic performance of exterior beam–column joints, four exterior joint specimens were tested under quasi-static cyclic loading without column axial compression. The thickness of the U-shaped steel plate was taken as the primary test variable. Based on the results obtained under the tested zero-axial-load condition, the following conclusions are drawn:
(1) Both the reference specimen and the strengthened specimens exhibited failure dominated by plastic hinges at the beam ends, while damage in the joint core region and at the column ends remained comparatively limited. Within the investigated parameter range, strengthening RC beams with U-shaped steel casing did not alter the predominant failure mode of the exterior beam–column joints. However, more pronounced shear cracking was observed in the joint core region as the thickness of the U-shaped steel plate increased.
(2) At large drift ratios, the strengthened specimens exhibited fuller, approximately parallelogram-shaped hysteretic loops with less pronounced pinching than the reference specimen, indicating improved hysteretic behavior. For specimen SJ1, which was strengthened with the thinnest U-shaped steel plate, the improvement became evident only at relatively large drift ratios.
(3) Strengthening with U-shaped steel casing improved the energy dissipation performance of the joint specimens at large drift ratios. At a drift ratio of 6%, the single-cycle hysteretic energy dissipation of specimens SJ1, SJ2, and SJ3 increased by 6.5%, 14.3%, and 8.1%, respectively, compared with that of specimen NJ1. Their corresponding equivalent viscous damping coefficients increased by 15.4%, 16.5%, and 8.9%, respectively. However, the improvement in energy dissipation performance did not increase monotonically with increasing steel plate thickness.
(4) At the termination drift ratio of 8%, the load-carrying capacities of all specimens continued to increase in the pulling direction, while varying degrees of strength degradation were observed in the pushing direction. Strengthening the RC beams with U-shaped steel casing provided only limited improvement in the peak lateral load-carrying capacity of the joint specimens. This may be partly attributable to the termination of the U-shaped steel casing at the column face. The average test-termination-based displacement ratios of all strengthened specimens exceeded 3.2, indicating that they sustained considerable deformation capacity up to the termination drift ratio of 8%.
The present study was limited to only four joint specimens, with only one specimen for each strengthening configuration. All specimens were tested under the zero-axial-load condition without considering the contribution of floor slabs, and the beams possessed sufficient shear capacity at their ends. Consequently, the observed differences and trends in seismic response should be interpreted within the scope of the present experimental program. Further studies involving a larger number of specimens and varying column axial load ratios, floor slab effects, and beam end shear capacity levels are needed to verify these observed trends and assess the broader applicability of the findings.
Author Contributions
Writing—original draft, Q.L.; conceptualization, Q.L., J.W. and C.F.; investigation, Q.L., J.W., C.F., W.H., T.L. and Y.W.; writing—review and editing, Q.L.; methodology and visualization, Q.L.; data curation, Q.L.; funding acquisition, Q.L. and Y.W. All authors have read and agreed to the published version of the manuscript.
Funding
This research was supported by the Key Research Project of Higher Education Institution in He-nan Province (Grant No. 24A560025), the International Science and Technology Cooperation Project of Henan Province (Grant No. 241111521200), and the Open Research Fund of the Key Laboratory of Water Engineering Materials of Ministry of Water Resources, China Institute of Water Resources and Hydropower Research (Grant No. EMF202513).
Data Availability Statement
The data that support the findings of this study are available from the corresponding author upon reasonable request.
Conflicts of Interest
The authors declare no conflicts of interest.
Abbreviations
The following abbreviations are used in this manuscript:
| USCCBs | U-shaped steel-concrete composite beams |
| RC | Reinforced concrete |
References
- Zhao, Y.; Zhou, X.H.; Yang, Y.L.; Chen, Y.F.; Gurupackiam, S. Stiffness and Cracking Behavior of New U-Shaped Steel and Concrete Composite Beam under Negative Bending. J. Struct. Eng. 2020, 146, 04020046. [Google Scholar] [CrossRef] [Scilit]
- Lee, J.S.; Haroon, M.; Kang, S.H.; Shin, K.J.; Lee, H.D. Flexural behavior of large-scale U-shaped steel-concrete infilled composite beams with flat and embossed webs. Structures 2023, 55, 1949–1959. [Google Scholar] [CrossRef] [Scilit]
- Liu, J.P.; Chen, G.P.; Chen, Y.F.; Xu, T.X. Experimental study on the flexural behavior of cold-formed U-shaped steel-encased confined prestressed RC beam. J. Constr. Steel Res. 2021, 182, 106656. [Google Scholar] [CrossRef] [Scilit]
- Zhao, Y.; Zhou, X.H.; Yang, Y.L.; Liu, J.P.; Chen, Y.F. Shear behavior of a novel cold-formed U-shaped steel and concrete composite beam. Eng. Struct. 2019, 200, 109745. [Google Scholar] [CrossRef] [Scilit]
- Yang, W.Q.; Yang, Y.L.; Wang, G.J.; Liu, F.Q.; Chen, Y.F. Experimental research on fire performance of U-shaped steel-concrete composite beam under uniformly distributed loading. Thin-Walled Struct. 2023, 186, 110700. [Google Scholar] [CrossRef] [Scilit]
- Liu, J.C.; Cheng, R.; Hu, C.; Wang, Y.H.; Yu, Y.L. Experimental and numerical study on seismic behavior and width-to-thickness ratio limits of U-shaped steel-concrete composite beams under cyclic loading. Thin-Walled Struct. 2026, 220, 114397. [Google Scholar] [CrossRef] [Scilit]
- Heng, P.; Lepourry, C.; Somja, H.; Palas, F. Behaviour of a joint between a U-shaped steel-concrete beam and a concrete-filled steel tubular column. J. Constr. Steel Res. 2020, 175, 106322. [Google Scholar] [CrossRef] [Scilit]
- Xu, X.; Cheng, R.; Yang, P.; Yu, Y.L. Experimental and numerical investigations on square CFST column to U-shaped steel-concrete composite beam joints with internal T-shaped diaphragms. J. Build. Eng. 2022, 60, 105172. [Google Scholar] [CrossRef] [Scilit]
- Xu, X.; Cheng, R.; Yang, P.; Zhang, J.D.; Liu, J.C. Experimental study of U-shaped steel-concrete composite beam to square CFST column joints. J. Constr. Steel Res. 2022, 192, 107220. [Google Scholar] [CrossRef] [Scilit]
- Xu, Y.Y.; Zheng, S.Y.; Dong, Y.L.; Luo, Q. Mechanical performance of reinforced concrete beams after fire and strengthened with thin-walled U-shaped steel plate. J. Build. Struct. 2017, 38, 58–66. [Google Scholar]
- Xu, Y.Y.; Si, J.S.; Zheng, S.Y.; Luo, Q. Numerical simulation of thin-walled U-shaped steel strengthened fire damage reinforced concrete beams. J. Basic Sci. Eng. 2020, 28, 366–375. [Google Scholar] [CrossRef]
- Jin, H.; Xu, Y.; Zheng, Q.C.; Shao, G.T. Application of shaped steel and concrete composite reinforcement technique to hollow slab bridge. Bridge Constr. 2017, 47, 114–118. [Google Scholar]
- Jin, H.; Jiang, H.W.; Jiang, R.N.; Zhan, H.Y.; Xu, Y. Strengthening Hollow Core Concrete Bridges with Deficient Transverse Hinge Joints with a Steel and Concrete Composite Anchorage System. Transp. Res. Rec. J. Transp. Res. Board 2020, 2674, 68–78. [Google Scholar] [CrossRef] [Scilit]
- Jin, H.; Xu, Y.; Jiang, F.H.; Cheng, J.X. Bending behavior experiment of RC beams with U-shaped steel and concrete composite Reinforcement. China J. Highw. Transp. 2020, 33, 206–214. [Google Scholar]
- Zhou, C.L.; Sun, J.K.; Zeng, Z.R.; Liu, J. Studies on the RC Beam Strengthened by Using the Exterior-Wrapping U-Shaped Steel Plate and Its Application. Adv. Civ. Eng. 2019, 2019, 2396764. [Google Scholar] [CrossRef] [Scilit]
- Lin, Q.L.; Lu, Y.Y.; Tang, W.S.; Lei, D.S. Experimental study on flexural strengthening of reinforced concrete beams with U-shaped steel under secondary load. Adv. Struct. Eng. 2021, 24, 3759–3777. [Google Scholar] [CrossRef] [Scilit]
- Lin, Q.L.; Lu, Y.Y.; Hu, L.; Zhao, X.B. Experimental and Numerical Study on Fatigue Behavior of RC Beams Strengthened with U-Shaped Steel Casing. Int. J. Steel Struct. 2022, 22, 514–538. [Google Scholar] [CrossRef] [Scilit]
- Park, H.G.; Hwang, H.J.; Lee, C.H.; Park, C.H.; Lee, C.N. Cyclic loading test for concrete-filled U-shaped steel beam–RC column connections. Eng. Struct. 2012, 36, 325–336. [Google Scholar] [CrossRef] [Scilit]
- Hwang, H.J.; Eom, T.S.; Park, H.G.; Lee, S.H.; Kim, S.H. Cyclic Loading Test for Beam-Column Connections of Concrete-Filled U-Shaped Steel Beams and Concrete-Encased Steel Angle Columns. J. Struct. Eng. 2015, 141, 04015020. [Google Scholar] [CrossRef] [Scilit]
- Kim, S.B.; Lee, E.T.; Kim, J.R.; Kim, S.S. Experimental study on bending behavior and seismic performance of hybrid composite beam with new shape. Int. J. Steel Struct. 2016, 16, 477–488. [Google Scholar] [CrossRef] [Scilit]
- Lin, Q.L.; Yu, F.L.; Han, W.X.; Zhang, L.; Wang, J.Y. Research Advances in U-Shaped Steel−Concrete Composite Beams: State of the Art. Buildings 2026, 16, 1040. [Google Scholar] [CrossRef] [Scilit]
- GB/T 50081-2019; Standard for Test Methods of Concrete Physical and Mechanical Properties. Ministry of Housing and Urban-Rural Development of the People’s Republic of China (MOHURD): Beijing, China, 2019.
- GB/T 228.1-2021; Metallic Materials—Tensile Testing—Part 1: Method of Test at Room Temperature. National Standardization Administration (NSA): Beijing, China, 2021.
- GB/T 28900-2022; Test Methods of Steel for Reinforcement of Concrete. National Standardization Administration (NSA): Beijing, China, 2022.
- ACI 374.1-05; Acceptance Criteria for Moment Frames Based on Structural Testing (ACI 374.1-05) and Commentary. American Concrete Institute (ACI): Farmington Hills, MI, USA, 2019.
- Fan, G.X.; Dou, Z.C.; Wang, D.B.; Zhang, Q.Y. Study on mechanical performance of reinforced concrete exterior beam-column joint combination under different loading rates or variable column axial forces. J. Build. Struct. 2022, 43, 106–115. [Google Scholar]
- JGJ/T 101-2015; Specification for Seismic Test of Buildings. Ministry of Housing and Urban-Rural Development of the People’s Republic of China (MOHURD): Beijing, China, 2015.
- Bai, J.L.; He, J.; Li, C.; Jin, S.S.; Yang, H. Experimental investigation on the seismic performance of a novel damage-control replaceable RC beam-to-column joint. Eng. Struct. 2022, 267, 114692. [Google Scholar] [CrossRef] [Scilit]
- Zhang, J.X.; Yuan, W.T.; Rong, X. Experimental study on seismic performance of bearing-double energy dissipation prefabricated concrete frame joint. J. Build. Struct. 2025, 46, 86–97. [Google Scholar]
- Li, C.Y.; Tong, C.; Wu, J.; Zhang, J.Y. Experimental study on seismic performance of precast concrete frame with replaceable energy dissipating connectors. J. Build. Struct. 2022, 43, 69–76. [Google Scholar] [CrossRef] [Scilit]
- Kim, C.G.; Park, H.G.; Eom, T.S.; Kim, T.W. Effect of reinforcement on seismic performance of RC beam-column joints. In Proceedings of the Tenth Pacific Conference on Earthquake Engineering Building an Earthquake-Resilient Pacific, Sydney, Australia, 6–8 November 2015. [Google Scholar]

Disclaimer/Publisher’s Note: The statements, opinions and data contained in all publications are solely those of the individual author(s) and contributor(s) and not of MDPI and/or the editor(s). MDPI and/or the editor(s) disclaim responsibility for any injury to people or property resulting from any ideas, methods, instructions or products referred to in the content. |
© 2026 by the authors. Licensee MDPI, Basel, Switzerland. This article is an open access article distributed under the terms and conditions of the Creative Commons Attribution (CC BY) license.