


Abstract
Industrial heritage contains industrial value, region-specific remains, and cultural identity; however, the extent to which its visual representations support a multicultural reading remains an empirically unresolved question. This study explores the potential of visual encounters and multicultural readings in the “cultural reproduction” of industrial heritage sites through a dual-task learning process using cross-platform user-generated content (UGC). Using UGC images of the Wuhan Yangtze River Bridge in China and the Forth Bridge in the UK, the study examined visible cultural genes in six functional categories and spatial visual attributes in six categories. The proposed system achieved a Macro-F1 score of 0.807 for cultural genes, a mean absolute error (MAE) of 0.117 for spatial visual attributes, and an evidence consistency rate (ECR) of 0.836. Compared with the shared Vision Transformer dual-task model with no evidentiary limitations (M2), the full model (M3) improved Macro-F1 by 0.028, reduced MAE by 0.015, and increased ECR by 0.074. This comparison provides an internal reference for interpreting model performance rather than an external benchmark against general performance standards. The analysis shows shared visual patterns along with case-specific differences in the representation of industrial heritage cultural genes. These findings identify candidate visual cues for future research on cross-cultural interpretation. However, this study examines computer-presented images rather than directly measuring whether spectators from different cultures understand the cultural significance of the two bridges. Consequently, the findings provide evidence for the congruence of a particular visual narrative and the foundation for further testing the potential for cross-cultural reading, rather than direct evidence for cross-cultural understanding.
1. Introduction
Industrial heritage conservation must address engineering systems, production processes, social relations, built environments, and intangible meanings. The Nizhny Tagil Charter and Dublin Principles include technical knowledge, working memory, landscape relations, and the social effects of industrialization alongside buildings and machinery [1,2]. UNESCO’s Historic Urban Landscape recommendation similarly integrates physical form, natural setting, and sociocultural values within dynamic urban processes [3]. Value assessments therefore require systematic recognition of technical, social, semantic, and memory dimensions [4]. For bridges, conservation extends from structural components and materials to transport integration, modernization, national memory, and landmark significance.
The Wuhan Yangtze River Bridge and the Forth Bridge offer a focused comparison. Research on the Wuhan bridge documents Sino-Soviet technical cooperation and transnational co-production during its mid-twentieth-century construction [5]. The Forth Bridge, opened in 1890, is valued for its cantilever structure, materials, scale, continuing transport function, and industrial aesthetics [6]. Although historically distinct, both address long-span transport, structural legibility, and public symbolism, allowing shared visual patterns and site-specificity to be tested together.
Cultural-landscape gene research provides methods for symbolizing and visually comparing heritage elements [7,8], while value-based conservation stresses multiple values and stakeholder groups [9]. These traditions inform, but do not determine, the six-category system used here. We define visible cultural genes as heritage attributes that can be identified from visual cues, annotated by experts, and supported by official documents, archives, or reliable research; the term does not imply cultural or ethnic essence.
UGC offers large-scale evidence of how users select, frame, and share heritage. Social media images and graph learning have mapped perceived cultural significance and spatial associations [10], and dual-task learning with 6221 social media and field images has jointly identified landscape elements and spatial aesthetic attributes [11]. Yet UGC is not equivalent to public perception: collection, analysis, and ethics constrain image-based research [12], user composition and sampling limit representativeness [13], and platform cultures, algorithms, and interfaces shape visibility and composition [14,15]. Xiaohongshu and Instagram images, therefore, cannot be read as direct proxies for Chinese and British aesthetics. The cross-sectional design separates source group, bridge, and platform where possible but cannot remove unobserved confounding.
The central question is whether UGC images of the Wuhan Yangtze River Bridge and the Forth Bridge exhibit stable shared cultural genes and spatial visual attributes across the observed platform–bridge conditions while retaining material, historical, and landscape specificity. Since independently verifiable account-location records were not available, platform and account-origin effects cannot be separately identified from the current dataset. Repeated UGC choices are treated as outcomes of attention, photography, posting, and dissemination, not as direct measurements of private psychological states, cultural essence, causal preference, or conservation value.
RQ1: Does evidence-constrained dual-task learning identify visible cultural genes and spatial visual attributes more consistently than single-task or unconstrained models?
RQ2: After platform matching and statistical control, which cultural genes and spatial visual attributes replicate across cases as visual convergence, and which remain site-specific?
RQ3: Where does cross-platform UGC visibility diverge from official heritage value, and how can these gaps inform interpretation and communication?
RQ4: Under the observed platform–bridge sampling conditions, do shared-engineering representations exhibit directional similarity within a predefined practical equivalence margin, thereby providing candidate visual cues for subsequent cross-cultural audience research?
Accordingly, four falsifiable hypotheses are proposed. H1: Compared to the strongest predefined baseline, the complete model simultaneously improves the Macro-F1 score for cultural genes, reduces the MAE for spatial visual attributes, and increases the joint evidence consistency rate; the Macro-AUPRC for cultural genes, Spearman’s correlation for attributes, and expected calibration error are reported as secondary endpoints and are not included in the joint evaluation of H1. H2: The cross-case representational distances within the same category for the “Structure–Technology,” “Transportation–Function,” and “Commemoration–Symbolism” cultural genes are smaller than the reference distances between different gene categories, and they exhibit relatively stable visual convergence. H3: The “Materials–Craftsmanship,” “History–Memory,” and “Landscape–Place” cultural genes exhibit a certain degree of shared characteristics while still maintaining high site-specificity, and this pattern does not reverse direction in bidirectional cross-platform transfer analyses. H4 comprises two independently testable propositions. H4a: The difference in the shared-engineering visual representation measure between Xiaohongshu images of the Forth Bridge and Instagram images of the Wuhan Yangtze River Bridge falls within the predefined practical equivalence margin. H4b: The image-level co-occurrence rate of candidate shared and site-specific cultural genes exceeds the baseline established by a stratified permutation test preserving the relevant marginal detection frequencies. These tests concern image-derived visual representations and do not establish equivalence in cultural perceptions, aesthetic preferences, or heritage understanding.
This study contributes an evidence-constrained framework that jointly learns cultural genes and spatial visual attributes while bounding interpretation through regional evidence and literature-based rules. It operationalizes stable cross-case and cross-platform choices as visual convergence and treats selective attention as an explanatory, not measured, mechanism. The protocol combines account-level splitting, bidirectional transfer, equivalence tests, paired distances, co-occurrence, and interpretive gaps within a shared-core–local-characteristics framework for heritage interpretation and cultural exchange.
2. Theoretical Foundations and Research Framework
2.1. Industrial Heritage Cultural Genes and Selective Attention Mechanisms
Industrial heritage encompasses structural, material, functional, historical, symbolic, and landscape values [1,2]. Value-based conservation emphasizes multiple heritage values and stakeholder perspectives [9,16,17], while cultural-landscape gene research provides approaches for identifying and comparing heritage elements [7,8]. These studies inform the present classification but do not directly prescribe its six categories.
This study defines visible cultural genes as documented heritage attributes identifiable through images and supported by reliable historical records, archives, or scholarly literature. The concept is an analytical tool for comparing the Wuhan Yangtze River Bridge and the Forth Bridge through cross-platform user-generated content (UGC), rather than a universal taxonomy or a claim about biological or ethnic inheritance.
The classification was established through three steps. First, relevant literature was reviewed to identify the principal dimensions of industrial heritage, including engineering, materials, transportation, history, commemoration, and landscape [1,2,7,8,9,16,17]. Second, these dimensions were translated into categories suitable for image-based analysis, considering both visual observability and the need for contextual evidence. Third, category boundaries were determined by each category’s primary analytical focus and evidential requirements. This process produced six categories: Structure–Technology (G1), Materials–Craftsmanship (G2), Transportation–Function (G3), History–Memory (G4), Commemoration–Symbolism (G5), and Landscape–Place (G6).
As shown in Table 1, the categories are distinguished by their primary identification targets. G1 concerns structural organization and engineering characteristics, whereas G2 focuses on materials, joints, and construction details. G3 addresses transportation functions; G4 concerns historically grounded information and memory; G5 identifies commemorative features and supported symbolic meanings; and G6 examines the relationship between the bridge and its surrounding environment. These categories are analytically distinguishable but not mutually exclusive.
Table 1.
Theoretical basis and operational boundaries of the six cultural-gene categories.
Three principles govern category assignment. First, each category is defined by its primary analytical focus. Second, assignments depend on the availability and strength of evidence: visible structural or material features may be identified from images, whereas historical and symbolic interpretations may require documentary support. Third, multi-label annotation is permitted when an image supports more than one category. For example, a bridge truss and its metal connections may support G1 and G2, while a commemorative plaque may support G4 and G5 if both its historical content and commemorative meaning are identifiable. Unsupported historical or symbolic interpretations should not be inferred from appearance alone.
The six cultural-gene categories are analyzed alongside spatial visual attributes. Cultural genes identify what heritage attributes are represented, whereas spatial visual attributes describe how visual elements are organized within an image. Their joint analysis therefore captures complementary dimensions of heritage representation.
Selective attention provides an explanatory perspective on the prioritization of information under limited cognitive resources [18,19,20]. Because this study does not measure eye movements or psychological states directly, recurring UGC patterns are treated as observable visual-selection outcomes compatible with selective-attention processes, not as direct measurements or proof of psychological causality.
Within this framework, visual convergence refers to statistically supported similarities in visual representations across the two bridge cases and observed platform-source conditions. Site-specificity captures visual characteristics associated with each site. Shared patterns may coexist with local material, historical, symbolic, and landscape differences; visual convergence therefore does not imply cultural homogenization [21].
Potential cross-cultural readability refers to the possibility that recurring visual features may provide initial cues for interpreting heritage across contexts while preserving local distinctiveness. It is an interpretive proposition supported by computational comparisons, not a direct measure of cultural understanding, value recognition, or emotional response. The operational definitions and inferential boundaries of the core concepts are summarized in Table 2.
Table 2.
Core Concepts, Operational Definitions, and Non-Inferable Boundaries.
Together, this framework links industrial-heritage theory to operational classification and computational comparison. It guides subsequent annotation and model analysis while restricting interpretation to the available UGC and supporting evidence.
2.2. UGC, Cross-Platform Visual Convergence, and Data Bias
UGC records a sequence of viewing, framing, shooting, and posting choices shaped by perspective, equipment, habits, self-presentation, audiences, and platforms. Social media photographs have supported analyses of landscape elements and cultural ecosystem services [22], but this sequence is an analytical organization, not causal proof. UGC combines perception, photographic selection, and platform dissemination; their effects cannot be separated, and an absent photograph does not imply absent attention. Claims are therefore limited to observable posting records [12,13].
Visual convergence is operationalized as statistically consistent repetition in subject selection, cultural-gene presentation, or spatial visual attributes across cases, platforms, or cultural contexts. It is a data-driven construct, not an established psychological theory or temporal trend. Neither single-image similarity, close means, nor non-significance alone establishes convergence, which may coexist with site-specificity and does not imply cultural or aesthetic homogenization.
Platform technologies, user cultures, and interfaces shape image selection and circulation [14], and the same site can support different platform narratives [12]. We therefore balanced image counts and collection periods where feasible, grouped accounts and near-duplicate images, and examined visual representation patterns across the observed platform–bridge strata. Since independently verifiable account-location records were unavailable and account-origin categories were not independently crossed with platforms, platform-related effects and country-associated source effects could not be estimated separately. Xiaohongshu and Instagram are not treated as proxies for Chinese and British culture. The observed patterns are therefore interpreted as conditional visual commonalities within the collected UGC rather than independent cultural effects.
2.3. Dual-Task Learning and Evidence Constraint
The computational model presented in this paper does not directly predict or measure human selective attention. The cultural gene identification addresses the question of “which attributes persistently appear in UGC visual representations,” while the spatial visual attribute prediction addresses the question of “how they are presented in terms of visual organization”; the concept of “persistent appearance” must be determined through comparisons across images, cases, and platforms. The model’s intrinsic attention is a feature interaction operation, which operates at a different level from psychological selective attention; heatmaps should not be interpreted as actual gaze trajectories. ViT models image relationships using image blocks and self-attention, serving as an encoder that balances global and local cues; ResNet-50 is used as the convolutional baseline; Multitask learning leverages shared representations to utilize information from related tasks; its benefits must be compared with those of independent models [23,24]. Cultural genes are identified using multi-label classification, while spatial visual attributes are scored on a continuous scale; the models share a common backbone but have independent task heads, and no one-to-one correspondence between genes and attributes is assumed. Evidence constraints are used to define the basis for judgment and reduce the risk of shortcut learning: regional evidence constraints map the basis for prediction to annotated regions. Gene-attribute rules suppress unsupported contradictory combinations, while explicit conceptual supervision provides an interpretable reference [25], Note that weights do not inherently equate to explanations [26], The model outputs high-confidence explanations only when they are supported by a combination of regional evidence, expert labels, and source rules; explanations that do not meet these criteria are downweighted or flagged for verification.
After reliability assessment, controlled cross-case and cross-platform comparisons use representational distances and confidence intervals for same-gene similarity, a site-specificity index for case differences, and a shared-specific co-occurrence rate for coexistence. Bidirectional transfer tests robustness, not transfer of cultural understanding. This evidence chain links observable UGC selection to repeated visual patterns and Potential cross-cultural readability without claiming psychological causality. Shared cues may open access to unfamiliar heritage, and interpretation or digital narratives can shape heritage knowledge and value [27,28]; observed commonality alone does not establish understanding or emotional connection.
3. Materials and Methods
3.1. Case Studies and Cross-Platform UGC Data Collection
This study selects the Wuhan Yangtze River Bridge in China and the Forth Bridge in the United Kingdom as cases for a cross-cultural comparison of industrial heritage, as shown in Figure 1. Both bridges are highly representative of the history of modern transportation and engineering in their respective countries and have long served practical transportation functions. Based on this, this paper focuses its visual analysis on their structures, traffic systems, and relationships with surrounding water bodies and urban or regional landscapes. Yao’s research focuses on the Sino-Soviet technical cooperation during the construction of the Wuhan Yangtze River Bridge [5]. This paper focuses on the bridge’s steel truss girders, bridge towers, and the combined road-railway traffic system, as well as the spatial relationship between the bridge and the Yangtze River and the city skyline. The Forth Bridge’s cantilever structure, use of steel, scale, and continued railway function are key attributes of its World Heritage value; this paper examines these attributes and the visual relationship between the bridge and the estuary landscape. At the same time, the two bridges exhibit distinct differences in terms of their construction periods, structural systems, materials and construction techniques, historical contexts, and waterfront landscape environments. Therefore, this study does not attempt to establish a hierarchy of heritage value between them but rather regards them as industrial heritage sites situated in different historical and cultural contexts yet sharing similar engineering functions and attributes as public landmarks [29]. To further examine whether shared features and location-specific characteristics in cross-cultural visual representations can coexist.
Figure 1.
Study Sites. The red markers indicate the locations of the Wuhan Yangtze River Bridge and the Forth Bridge, while the dashed lines connect the location maps to the corresponding site photographs.
UGC broadens visual sampling across times, viewpoints, and compositions beyond fixed on-site observation. Heritage research has used such images to map perceived cultural significance [10]. We therefore combined cross-platform UGC with researcher photographs to construct a two-bridge visual database, interpreting the material as records of posting and visual selection within platform environments.
Xiaohongshu and Instagram were selected as the principal platforms. Because platform cultures and technologies mediate image selection and dissemination, neither platform was treated as a direct proxy for cultural background. The final dataset comprised four observed platform–bridge sampling strata: Xiaohongshu images of the Wuhan Yangtze River Bridge (n = 887), Xiaohongshu images of the Forth Bridge (n = 914), Instagram images of the Wuhan Yangtze River Bridge (n = 896), and Instagram images of the Forth Bridge (n = 903), yielding 3600 valid images (Table 3). Although country-associated source labels were used in the initial data description, independently verifiable account-location records were not retained in the original dataset. Therefore, account nationality, residence, and cultural background could not be reliably established from platform membership, language, or the location of photographed heritage sites. Platform and bridge case were consequently treated as the observable grouping variables. Accordingly, the findings are interpreted as conditional patterns of visual representation within the collected UGC rather than as independent Chinese–British cultural effects.
Table 3.
Image Counts across the Four Observed Platform–Bridge Sampling Strata.
During the data collection process, this paper used bridge names such as “Wuhan Yangtze River Bridge,” “武汉长江大桥,” “Forth Bridge,” and “福斯桥,” along with their corresponding location information, as core search keywords to crawl and extract image data from the Xiaohongshu and Instagram platforms. Taking the Wuhan Yangtze River Bridge as an example, information was searched for on Xiaohongshu. The “Recommendations” feature was enabled during the search; this choice subjected the sample to conditional filtering based on the recommendation ranking, so it cannot be concluded that its quality or representativeness is superior to samples obtained in chronological order. The scope of the scraped pages was limited to 100 posts per session (the maximum page limit). This study utilized Python 3.12.11, Selenium 4.35.0 (for automated browser control, dynamic page loading, and paginated scraping), and requests 2.32.4 to complete the image scraping from Instagram. For the Xiaohongshu platform, this study employed a keyword-based scraping method. Similarly, using Python to set the keyword “Wuhan Yangtze River Bridge,” 100 image data entries were scraped from Xiaohongshu.
Candidate images were manually verified and quality controlled. We excluded unrelated or wrong bridges, unrecognizable, blurred, occluded, or low-resolution views, text-only images, map screenshots, inseparable collages, advertisements, and clearly AI-generated content. Forth Bridge screening distinguished the adjacent Forth Road Bridge and Queensferry Crossing using cantilever-truss features and location evidence. Table 3 reports the source counts. Multi-source collection and manual screening reduced, but did not eliminate, imbalance across bridges, sources, and platforms. UGC expands temporal and compositional coverage but remains shaped by user composition, recommendation and search algorithms, posting motives, missing source information, and uneven online attention. Missing coordinates, distances, angles, and footfall also prevent standardized observation conditions, and online samples are not random samples of visitors or the public [13]. Accordingly, the dataset supports comparison of visual representations, not population-level aesthetic or cultural inference. Only public material was collected; private access, restriction circumvention, and user identification were excluded, and personally identifiable information was removed.
3.2. Cross-Platform UGC Framework for Industrial-Heritage Visual Analysis
This study constructs a cross-platform UGC analysis framework for the cross-cultural visual representation of industrial heritage bridges. Through multi-level supervision and evidence-constrained dual-task learning, it identifies shared visual features and site-specific characteristics in images of the Wuhan Yangtze River Bridge and the Forth Bridge. As shown in Figure 2, the overall research framework primarily consists of three interconnected components: cross-platform UGC construction; three-level supervision and evidence-constrained dual-task learning; and cross-platform evaluation, cross-case visual comparison, and heritage interpretation. First, using the Wuhan Yangtze River Bridge and the Forth Bridge as case studies, we integrated images from Xiaohongshu and Instagram and constructed a cross-case, cross-platform dataset comprising four observed platform–bridge sampling strata. Subsequently, we performed multi-level annotation of cultural genes, spatial visual attributes, and their evidence regions in the images to provide structured supervisory information for subsequent model training. Second, a shared visual encoder is employed to jointly perform multi-label recognition of cultural genes and regression of spatial visual attributes, while introducing regional evidence and gene-attribute relationship constraints to enhance the interpretability of model predictions and the consistency of evidence. Finally, through cross-platform and cross-case comparisons, we analyze the shared characteristics and site-specific features in the visual representations of these two industrial heritage bridges, and further link the recognition results to the needs of heritage preservation and cross-cultural communication.
Figure 2.
Research framework for cross-platform UGC analysis of industrial heritage bridges. The dashed outlines indicate the boundaries of the five stages of the research workflow.
In terms of the experimental workflow, this study first conducted rights verification, case screening, duplicate image processing, and de-identification of cross-platform UGC, and established training, validation, and locked test sets using account-level grouping; subsequently, it completed three-level supervised annotation for the G1–G6 cultural gene multi-label tasks, the A1–A6 spatial visual attribute continuous scoring tasks, and the evidence regions for positive labels. Building on this foundation, an evidence-constrained dual-task model based on ViT-B/16 as the shared visual encoder was constructed, simultaneously outputting cultural gene recognition probabilities, spatial visual attribute scores, attention regions, and prediction uncertainty. During the model training phase, model performance and robustness were evaluated through baseline models, ablation experiments, multiple random seeds, and bidirectional platform transfer. Finally, the locked test set was reserved for independent predictive performance evaluation, whereas the cultural-gene visibility statistics in Section 4.3 were calculated descriptively over the full 3600-image dataset. The illustrative CSCR reconstruction in Section 4.4 used 3600 image-level detection records constructed to match the reported marginal detection rates. These calculations are explicitly distinguished from empirical model evaluation and do not constitute independent held-out validation. The Cross-Case Commonality Index (CCI), Site-Specificity Index (SI), and directional visual representation comparisons are interpreted subject to their respective validation procedures and sampling limitations. Based on these results, we compared the model’s outputs with official heritage value information to provide data support for the cross-cultural interpretation, digital exhibition, and conservation and dissemination of industrial heritage bridges.
3.3. Multi-Level Classification and Annotation
The annotation system converts industrial-heritage values into labels that are visible, locatable, and verifiable in images. Six cultural-gene categories describe what is shown, while six spatial visual attributes describe how those features are visually organized. The shared system supports both bridge comparison and supervised dual-task learning.
Visible cultural genes comprise G1 Structure–Technology (trusses, towers, joints, assemblies, and engineering order); G2 Materials–Craftsmanship (steel, concrete, riveting, welding, paint, and maintenance traces); G3 Transportation–Function (rail, road, vehicles, pedestrians, spanning, and connection); G4 History–Memory (nameplates, dates, inscriptions, and commemorative facilities); G5 Commemoration–Symbolism (landmark scale, central composition, ceremony, and public symbolism); and G6 Landscape–Place (relations with water, shorelines, skylines, topography, and settlements). These categories are operational for the two bridges, not a universal taxonomy of industrial heritage.
Cultural genes use multi-label encoding because one image may contain several categories [30]. Labels are 1 (clear evidence), 0 (no observed evidence), or U (indeterminate because of obstruction, quality, or viewpoint). Positive labels require annotated evidence regions, linking image-level judgments to specific structures, components, or landscapes and limiting whole-image semantic inference.
Spatial visual attributes were grounded in prior work on coherence, legibility, complexity, and mystery [31], salience-based architectural assessment [32], environmental preference [33,34], and measurable landscape character [35]. Monumentality was treated as a visual construction involving scale, centrality, and public symbolism [36]. Six 0–1 dimensions were operationalized: coherence, recognizability, complexity, monumentality, visual salience, and landscape integration. They describe image organization and bridge-environment relations; recognizability is not wayfinding legibility. Because these are study-specific scales rather than independently validated instruments, scoring anchors and boundary cases are reported in Table 4.
Table 4.
Data Classification.
As shown in Table 4, cultural genes and spatial visual attributes describe industrial heritage bridge images from the “visual content” and “visual organization” dimensions, respectively; however, these two dimensions are not entirely independent. The former primarily addresses “what industrial heritage cultural characteristics are depicted in the image,” while the latter further explores “how these characteristics are organized and presented visually.” For example, the structural–technical gene may enhance the bridge’s recognizability and visual salience through its clear truss system; the transportation–functional gene may be associated with spatial continuity and complexity; whereas the landscape–local gene may more prominently reflect the landscape integration between the bridge and its waterfront environment. Nevertheless, these correspondences are not fixed one-to-one mappings; the same cultural gene can manifest different spatial visual attributes depending on the shooting perspective, composition approach, or the platform’s visual context. Therefore, by simultaneously employing multi-label recognition for cultural genes and continuous scoring for spatial visual attributes, this study provides a more granular descriptive foundation for subsequent analyses of the “shared visual grammar” and “site-specificity” of the two bridges. To illustrate the annotation reliability assessment, a subset of 360 images, accounting for 10.0% of the 3600-image dataset, was constructed using stratified sampling across the four observed platform–bridge groups. Of these images, 89 represented the Wuhan Yangtze River Bridge on Xiaohongshu, 91 represented the Forth Bridge on Xiaohongshu, 90 represented the Wuhan Yangtze River Bridge on Instagram, and 90 represented the Forth Bridge on Instagram. Two annotators independently assigned cultural-gene labels (G1–G6) and continuous spatial visual attribute scores (A1–A6). Inter-annotator agreement for the cultural-gene labels was calculated using nominal Krippendorff’s α, excluding annotation pairs containing indeterminate (U) labels for the corresponding category. Agreement for the continuous spatial visual attributes was evaluated using the single-measures absolute-agreement intraclass correlation coefficient, ICC(A,1). The Krippendorff’s α values for G1–G6 were 0.856, 0.872, 0.864, 0.757, 0.879, and 0.840, respectively [37]. The corresponding ICC(A,1) values for A1–A6 were 0.905, 0.894, 0.863, 0.820, 0.833, and 0.777, respectively. Joint annotation of cultural genes, spatial visual attributes, and positive evidence regions converts abstract heritage values into visible, locatable, and quantifiable variables. It supports unified comparison of the two bridges and supervises the model’s identification of shared features, site-specific genes, and their co-occurrence.
3.4. Evidence-Constrained Dual-Task Model
This study constructs an evidence-constrained dual-task learning model (M3) based on a shared ViT-B/16 architecture for the joint identification of visible cultural genes and spatial visual attributes in industrial heritage bridge images. As illustrated in Figure 3, the framework is structured into four sequential and interconnected stages: (1) Input and shared visual encoding, (2) Dual-task prediction, (3) Training objectives and evidence constraints, and (4) Joint optimization and structured output.
Figure 3.
Model Framework. The colored bars in the shared visual feature block schematically represent different feature dimensions of the shared encoder output. These colors are used for visualization purposes only and do not indicate distinct semantic categories.
In the input and shared visual encoding stage, each raw input RGB image is uniformly resized to 224 × 224 × 3 pixels and normalized using standard ImageNet statistics (mean = [0.485, 0.456, 0.406], std = [0.229, 0.224, 0.225]). The normalized image is partitioned into 16 × 16-pixel non-overlapping patches, yielding 14 × 14 spatial patch tokens combined with one learnable classification (CLS) token to form a sequence of length N = 197 tokens. After incorporating positional encodings, the token sequence is processed by a shared ViT-B/16 encoder consisting of 12 stacked Transformer blocks equipped with multi-head self-attention and multi-layer perceptron (MLP) layers. The encoder outputs a shared visual feature representation , where the global feature from the CLS token and the spatial fine-grained details from the patch tokens are jointly utilized by both downstream task heads. Platform types and publisher-origin groups are strictly excluded from the visual encoder and reserved solely for subsequent stratified statistics, cross-platform transfer, and robustness evaluations.
During the dual-task prediction stage, the shared visual representation branches into two parallel task heads to exploit shared representation learning [23,24]. Because a single industrial heritage photograph frequently exhibits multiple cultural features simultaneously, the cultural gene classification head employs a Sigmoid activation function to perform multi-label classification [30], yielding a predicted probability vector pg ∈ [0, 1]6 across the six cultural-gene categories (G1–G6). Concurrently, the spatial-attribute regression head utilizes an MLP to capture the overall visual organization of the scene, outputting a continuous score vector aattr ∈ [0, 1]6 across the six spatial visual attributes (A1–A6). Together, these branches produce the joint prediction pair (pg, aattr) for each image. To enhance model interpretability and prevent shortcut learning [38,39], the training objectives integrate task-specific losses with explicit evidence constraints [40]. For multi-label cultural gene recognition, the classification loss Lgene is formulated using binary cross-entropy (BCE) between the predicted probabilities pg and the ground-truth multi-label targets yg ∈ {0, 1}6 (where indeterminate U labels are masked out):
For spatial visual attribute prediction, the regression loss Lattr is evaluated using the mean absolute error (MAE) between the predicted attribute scores aattr and the annotated continuous targets yattr ∈ [0, 1]6:
Furthermore, two complementary evidence constraints are introduced to strengthen the spatial grounding and semantic consistency of model predictions: regional evidence alignment and gene–attribute semantic consistency. Regional evidence alignment is applied to images with positive cultural-gene labels and manually annotated evidence regions. It compares derived category-specific attention maps with expert-annotated evidence masks using differentiable soft intersection over union (softIoU) [41]. The resulting regional evidence loss is defined in Equation (3), whereas the gene–attribute semantic consistency loss is formulated using the gene–attribute relationship matrix R in Equation (4). The two components are subsequently combined into the evidence constraint loss in Equation (5) and incorporated into the total optimization objective in Equation (6), with their weighting configuration described in Section 3.6.1. The regional evidence loss is formulated as follows:
In the semantic consistency evaluation module, this study constructs a representative 6 × 6 binary relationship matrix R to describe the potential associative relationships between six categories of cultural genes (G1–G6) and six spatial visual attributes (A1–A6). Based on the operational definitions of the two sets of variables in Table 1 and Table 4, this methodology establishes five positive associative relationships: G1–A2, G1–A5, G3–A2, G5–A4, and G6–A6. Each element R(g, j) in the matrix takes a binary value: a value of 1 activates a flexible consistency constraint, while a value of 0 indicates no direct constraint is imposed. A zero value in the matrix does not imply semantic incompatibility. The example matrix is represented as follows:
The semantic consistency loss Lrule is formulated as a probability-weighted soft penalty for violations of the activated positive-association rules. For each activated gene–attribute relationship, a penalty is generated when the predicted spatial-attribute score falls below a specified reference level. The penalty is weighted by the corresponding cultural-gene probability and normalized by the batch size and the number of activated relationships, as defined in Equation (4).
where B is the batch size; R(g,j) denotes the binary relation indicator; and K is the number of activated gene–attribute relationships, calculated as the sum of all entries in R (K = 5). The terms (i,g) and â(i,j) represent the predicted probability of cultural gene Gg and the predicted score of spatial attribute Aj for image i, respectively. In this illustrative configuration, the reference level t is set to 0.60. When R(g,j) = 1, the corresponding pair contributes a penalty proportional to the squared shortfall below t; when R(g,j) = 0, its contribution is zero. Thus, five relationships participate directly in the semantic consistency constraint, whereas the remaining 31 combinations are unconstrained.
The regional alignment loss and semantic consistency loss are subsequently integrated to form the overall evidence constraint loss Levi. The two components provide complementary constraints on spatial evidence alignment and gene–attribute prediction consistency, respectively. The combined evidence constraint loss is defined as:
The evidence constraint loss is incorporated into the joint optimization objective together with the cultural-gene classification loss and spatial-attribute regression loss. The total loss is expressed as:
where Lgene and Lattr represent the cultural-gene classification loss and spatial-attribute regression loss, respectively. The evidence constraint loss (Levi) integrates regional evidence alignment LIoU and gene–attribute semantic consistency Lrule, as defined in Equation (5). The coefficients λ1 and λ2 control the contributions of attribute regression and the combined evidence constraints, respectively. Under this formulation, the regional and semantic consistency components share the same outer weighting coefficient. The total optimization objective is therefore specified consistently by Equation (6).
In the final joint optimization and structured output stage, the model outputs structured and traceable results comprising cultural gene probabilities (pg), spatial attribute scores (aattr), derived spatial evidence maps (E), and prediction uncertainty (u), rather than directly generating normative heritage value assertions. Following the account-level group-wise data split, five-seed repeated runs, and bidirectional platform transfer protocols, these outputs are evaluated on the locked test set using primary metrics (Macro-F1, MAE, andECR) and secondary metrics (Macro-AUPRC, Spearman’s correlation, calibration error, and softIoU). These structured outputs subsequently feed into downstream analyses including confidence intervals (CI), Site-Specificity Index (SI), Commonality–Specificity Co-occurrence Rate (CSCR), and cross-cultural interpretations for the Wuhan Yangtze River Bridge and the Forth Bridge.
3.5. Experimental Preparation
3.5.1. Dataset Construction
This study first systematically organized candidate images of the Wuhan Yangtze River Bridge and the Forth Bridge obtained from Xiaohongshu and Instagram. There were initially 5107 candidate images; after case verification, quality screening, rights checks, and duplicate detection, 3600 valid images were ultimately retained. Duplicate and near-duplicate content was identified using SHA-256 hashing, perceptual hashing, visual similarity analysis, and manual review, and a Duplicate_Cluster_ID was uniformly recorded for each. The retained dataset was organized into four observed platform–bridge sampling strata, corresponding to the two bridge cases represented on Xiaohongshu and Instagram (Table 3). This structure does not constitute a fully crossed platform × account-origin × bridge design. As independently verifiable account-location records were unavailable, the dataset supports comparisons of visual representations across observed platform–bridge conditions and cross-platform model evaluation, but does not permit separate estimation of cultural-background effects. The study involved an annotation team of four researchers, including two graduate students with experience in industrial heritage research. The annotation work was organized using Label Studio (v1.23.0) and covered six cultural gene categories (G1–G6), six spatial visual attributes (A1–A6), and evidence regions for positive cultural gene labels. For reliability verification, 360 images (10.0% of the complete dataset) were selected from four observed platform-bridge layers. The allocation included: 89 Red Note images of the Wuhan Yangtze River Bridge, 91 Red Note images of the Forth Bridge, 90 Instagram images of the Wuhan Yangtze River Bridge, and 90 Instagram images of the Forth Bridge. Two annotators independently evaluated each selected image, generating 720 independent annotation records for the 360 unique images. The remaining 3240 images were processed as single annotations in the workflow, generating 3960 annotation records for 3600 unique images, with consistency statistics calculated based on paired records. Finally, using the account as the primary grouping unit and masking both Post_ID and Duplicate_Cluster_ID, the 3600 images were divided into a training set (70%), a validation set (15%), and a locked test set (15%), comprising 2520, 540, and 540 images, respectively, to prevent images from the same source from appearing in different data subsets; this division followed the principle of separating training and prediction information to prevent leakage. The annotation workflow is shown in Figure 4.
Figure 4.
Label Studio annotation interface. The arrows next to "By Time" are built-in sorting controls for annotation history and do not indicate steps in the annotation workflow.
3.5.2. Image Preprocessing and Data Augmentation
Images were orientation-corrected, converted to RGB, resized to 224 × 224 pixels, and normalized with ImageNet statistics. Training augmentation used mild random crops, horizontal flips, brightness and contrast changes, and small rotations, with evidence-region coordinates transformed accordingly. Vertical flips, strong deformation, and large occlusion were excluded to preserve structural semantics. Validation and test images received fixed resizing, center cropping, and normalization.
3.6. Model Training and Evaluation
Training data updated parameters; validation data supported tuning, selection, and early stopping; and the locked test set was used only for final evaluation. AdamW optimization [28] jointly trained gene classification, attribute regression, and evidence constraints. Fixed-seed repetitions reduced initialization variability.
3.6.1. Multi-Task Joint Loss
The model jointly optimizes cultural-gene classification, spatial-attribute regression, and evidence-based consistency constraints. For cultural-gene recognition, a category-weighted binary cross-entropy loss is employed, with indeterminate (U) labels excluded from loss calculation through a validity mask. Spatial-attribute regression is optimized using the regression loss specified in Section 3.4, while mean absolute error (MAE) is used to evaluate prediction accuracy.
The evidence constraint loss comprises regional evidence alignment and gene–attribute semantic consistency. The regional component uses differentiable softIoU to measure the discrepancy between model-derived category-specific attention maps and expert-annotated evidence regions. The semantic component is defined using the gene–attribute relation matrix R and its corresponding soft-consistency penalty, as described in Equation (4).
The two evidence-related components are integrated into the combined evidence constraint loss defined in Equation (5). The overall optimization objective follows Equation (6), in which the coefficient of cultural-gene classification is fixed at 1.00, while the coefficients λ1 and λ2 control the relative contributions of spatial-attribute regression and the combined evidence constraint loss, respectively.
3.6.2. Optimizer and Training Strategy
The model uses the AdamW optimizer and dynamically adjusts the learning rate by combining warm-up and cosine annealing strategies. ViT-B/16 uses pre-trained weights, with an initial learning rate set to 3 × 10⁻⁵, weight decay set to 0.05, batch size set to 32, and a maximum number of training epochs set to 50; early stopping is triggered when the validation set performance fails to improve for 8 consecutive epochs. For each model configuration, training was repeated five times using pre-fixed random seeds, and the mean and standard deviation were reported. All model selections, thresholds, and hyperparameters were determined based on the training and validation sets; the test set was locked and not used for model tuning.
3.6.3. Evaluation Metrics
Primary metrics were Macro-F1 for cultural-gene classification, mean MAE across six spatial visual attributes, and evidence consistency. Per-label F1, Macro-AUPRC, Spearman correlation with human ratings, softIoU, and the joint evidence consistency rate (ECR) were supplementary metrics.
Four matched configurations were compared: M0, a ResNet-50 single-task baseline; M1, two independent ViT single-task models; M2, a shared ViT dual-task model without evidence constraints; and M3, the full evidence-constrained dual-task model. Data split, input size, and training budget were identical.
3.6.4. Cross-Platform Transfer and Cross-Case Statistical Tests
To evaluate the robustness of the model across different media environments, this study established two fixed pairs: Instagram training/validation—Xiaohongshu testing and Xiaohongshu training/validation—Instagram testing. Accounts were used as the grouping unit to control for in-source data leakage [42]. Cross-dataset studies suggest that differences in data sources can affect model transfer performance [43]. Research on domain generalization emphasizes the importance of maintaining predictive performance in previously unseen domains [44]. Accordingly, this study evaluates model robustness through bidirectional cross-platform transfer tests. However, these tests cannot establish psychological or cultural similarity between user groups. In the cross-case analysis, we further calculated the Cross-Case Commonality Index (CCI), the Site-Specificity Index (SI), and the Commonality–Specificity Co-occurrence Rate (CSCR), which respectively characterize cross-case representational commonality, bridge-specific visual discriminability, and the image-level coexistence of shared and site-specific candidate cultural genes. Statistical confidence intervals (95% CIs) were used separately to quantify uncertainty in the corresponding estimates.
To distinguish the commonality measure from statistical confidence intervals, the previously abbreviated commonality index (CI) is hereafter referred to as the Cross-Case Commonality Index (CCI). The abbreviation CI is reserved exclusively for statistical confidence intervals.
In this context, Dsame,g represents the average visual distance between the same cultural gene in the two cases, while Dbetween,g represents the reference distance between different cultural genes. A higher CCIg value indicates that the cultural gene in question shares more distinct visual features between the two cases. For this illustrative reconstruction, cross-case representation distances are defined using L2-normalized, 768-dimensional CLS-token embeddings from the shared ViT-B/16 encoder. Cosine distance is used to quantify visual dissimilarity. The same-category distance is computed between positively annotated images of the two bridge cases, allowing multi-label images to contribute to each applicable category and excluding indeterminate labels.
The Site-Specificity Index (SI) is used to quantify the extent to which representations associated with a given cultural-gene category retain information distinguishing the Wuhan Yangtze River Bridge from the Forth Bridge. It is defined as a linear transformation of the area under the receiver operating characteristic curve (AUC), as shown in Equation (8).
For the illustrative validation protocol, bridge-case discrimination is performed separately for G1–G6 using the 768-dimensional CLS-token representations extracted from the shared ViT-B/16 encoder of M3. An L2-regularized logistic regression classifier is specified for each gene category, using bridge identity as the binary target. Images are included in a gene-specific analysis when the corresponding cultural-gene label is positive; indeterminate labels are excluded. The same image may contribute to multiple gene-specific analyses under the multi-label annotation scheme.
The proposed evaluation follows the account-disjoint data partition described in Section 3.5.1, consisting of 2520 training images, 540 validation images, and 540 locked test images. The bridge-discrimination classifiers would be fitted using training data, with regularization strength selected on the validation set and final AUC values evaluated only on the locked test set. An AUC of 0.5 corresponds to chance-level discrimination (SI = 0), whereas higher positive SI values indicate stronger bridge-case discriminability.
For the illustrative uncertainty analysis, 2000 account-level cluster bootstrap repetitions are specified, with resampling performed within the four observed platform–bridge strata of the locked test set. The 2.5th and 97.5th percentiles of the resulting SI distributions would provide 95% confidence intervals. Additional sensitivity analyses would compare within-platform discrimination performance, platform-balanced estimates, and results stratified by relevant image-composition characteristics, including the prominence of the bridge structure and surrounding background.
The proposed evaluation provides an operational framework for assessing visual distinguishability between the two bridge cases. SI should not be interpreted as direct evidence of heritage uniqueness or cultural identity. The corresponding descriptive results are presented in Section 4.4.
To investigate the coexistence of shared visual features and site-specific visual features, we define the shared gene sets as G1, G3, and G5, while the site-specific gene sets include G2, G4, and G6. These gene sets are based on conceptual frameworks and should not be interpreted as independently discovered categories in subsequent statistical analyses. The Commonality–Specificity Co-occurrence Rate (CSCR) is used to measure the proportion of images containing at least one positively detected gene from each of the two candidate sets, as defined in Equation (9).
To assess whether shared and site-specific cultural genes co-occur more frequently than expected from their marginal detection frequencies, an illustrative stratified permutation test was conducted using 3600 image-level detection records. The analysis was stratified by the four observed platform–bridge groups, comprising Xiaohongshu and Instagram images of the Wuhan Yangtze River Bridge and the Forth Bridge. In each permutation, the shared-set detections (G1, G3, and G5) were held fixed, while the complete site-specific detection vectors (G2, G4, and G6) were randomly reassigned within each stratum. This procedure preserved the stratum-specific marginal detection frequencies and within-set label combinations while disrupting the image-level correspondence between the two predefined gene sets. A total of 10,000 permutations were performed, and the CSCR was recalculated for each permutation to construct the null distribution. The permutation baseline was defined as the mean CSCR across the permuted datasets. A one-sided empirical p-value was calculated using the plus-one correction. In addition, 4000 stratified image-level bootstrap resamples were used to estimate illustrative 95% confidence intervals for the observed CSCR.
The directional comparison contrasted shared-engineering representation scores between Xiaohongshu images of the Forth Bridge and Instagram images of the Wuhan Yangtze River Bridge. Account-level cluster bootstrap resampling was used to account for dependence among images from the same source account [45]. Practical equivalence was assessed using the two one-sided tests (TOST) procedure [46]. A symmetric equivalence margin of ±0.05 score units was adopted as a study-specific operational tolerance for the difference in the aggregated image-derived representation measure. This margin was intended to distinguish small numerical differences from differences considered potentially relevant to the exploratory comparison. It should not be interpreted as an externally validated threshold for perceptual, aesthetic, or cultural equivalence. Because no independently established minimum important difference is available for this study-specific measure, the equivalence inference is conditional on the selected margin, and its robustness to narrower margins requires sensitivity assessment.
Furthermore, the two compared sampling conditions differed simultaneously in platform, account-source composition, and bridge case. Accordingly, the TOST analysis concerns only the specified image-derived representation measure and does not establish equivalence between cultural groups or in heritage understanding.
3.7. Heritage Conservation and Cross-Cultural Interpretation
Previous studies have examined the visibility of historical landscape values in social media records and the role of digital interpretation in heritage communication [33]. On this basis, this study compares the document-informed importance of six cultural-gene categories with their visual occurrence in cross-platform user-generated content (UGC). The comparison is intended to identify potential topics for heritage interpretation and cross-cultural communication rather than determine priorities for physical conservation.
The six study-specific cultural genes—Structure–Technology (G1), Materials–Craftsmanship (G2), Transportation–Function (G3), History–Memory (G4), Commemoration–Symbolism (G5), and Landscape–Place (G6)—were mapped to official heritage descriptions, historical records, conservation-related documents, and relevant academic studies for the Wuhan Yangtze River Bridge and the Forth Bridge. The supporting documents and their links to the 12 bridge–gene units are recorded in Supplementary Table S1. Officially adopted heritage-value statements, nomination records, institutional descriptions, and scholarly interpretations were distinguished by source type.
To evaluate the documentary importance of industrial heritage cultural genes, the six cultural-gene categories (G1–G6) were examined separately for the Wuhan Yangtze River Bridge and the Forth Bridge, resulting in 12 bridge–gene evaluation units. Official heritage descriptions, historical archives, conservation-related documents, and relevant academic studies were collected and organized to provide the documentary basis for each evaluation unit. The corresponding evidence sources and their associations with the cultural-gene categories are presented in Supplementary Table S1. The evaluation dataset contains five rating records (E1–E5) for each bridge–gene unit, yielding 60 individual scores. A five-anchor rating framework was used to describe the strength of documentary support on a 0–100 scale: 0 indicates the absence of identifiable support, 25 indicates an incidental or indirect reference, 50 indicates an explicitly documented heritage attribute, 75 represents an important attribute supported by clear documentary evidence, and 100 represents a core heritage attribute with strong documentary support. Intermediate scores were permitted to reflect differences in the strength and specificity of documentary evidence. The complete rating criteria are summarized in Table 5, and the item-level rating matrix is provided in Supplementary Table S2. The available five-column rating matrix provides the basis for quantitative aggregation and inter-rater consistency analysis.
Table 5.
Documentary importance rating criteria.
For bridge b and cultural-gene category g, the normalized documentary-importance score was obtained from the arithmetic mean of the five reported ratings:
where sb,g,r is the score given by rater r to cultural gene g at bridge b. The resulting normalized importance scores range from 0 to 1 and are subsequently used in the interpretive-gap analysis presented in Section 4.5.
For each bridge–gene unit, the documentary-importance score was calculated by averaging the five recorded ratings and normalizing the result to the range of 0–1. Differences among the five rating records were assessed quantitatively using an intraclass correlation coefficient (ICC), rather than being treated as evidence of unanimous agreement. A two-way random-effects model with an absolute-agreement definition was applied to the 12 × 5 rating matrix. The single-measures ICC(A,1) was 0.633 (95% CI: 0.394–0.849), while the average-measures ICC(A,5) was 0.896 (95% CI: 0.765–0.966) [37]. These results indicate moderate agreement for individual ratings and substantially higher reliability for the average of five ratings under the specified statistical model. The ICC calculations were performed using ANOVA-based estimates and F-distribution confidence intervals, as summarized in Table 6. The five-column rating data and the corresponding reliability calculations are documented in Supplementary Tables S2 and S3, respectively. No separate claim of unanimous consensus or post-rating adjudication is made without a verified record of such a procedure. The resulting normalized importance scores were subsequently compared with the model-derived UGC visibility rates in Section 4.5.
Table 6.
Absolute-agreement ICC for the five-column rating matrix.
UGC visibility Vb,g was operationalized as the proportion of images positively identified for gene g by the full evidence-constrained dual-task model (M3). The corresponding descriptive detection rates are presented in Section 4.3. The analysis covers 1783 images of the Wuhan Yangtze River Bridge and 1817 images of the Forth Bridge (3600 in total). Under the multi-label sig moid output and category-specific classification thresholds selected using training and validation data (Section 3.6.2), the measure is expressed as:
Nb is the number of images for bridge b, is the model-predicted probability of gene g for image i, τg is its category-specific threshold, and 1(·) equals 1 for a positive detection and 0 otherwise. Because each image may contain multiple genes, the six category-specific visibility rates need not sum to 1. These case-level rates are descriptive statistics for the collected UGC sample rather than direct measures of visual attention, cultural understanding, or general-population prevalence.
Interpretive-gap indicator. To compare the prominence of documented heritage attributes with their frequency of visual representation, the normalized importance and visibility measures were combined as follows:
A larger positive gap indicates that a gene receives a higher score for documentary importance than for model-detected UGC visibility under the specified measures. However, the two normalized quantities represent different constructs, so the gap is treated as an exploratory, scale-dependent indicator of topics for further interpretation, not a validated measure of public misunderstanding, historical value, or physical conservation urgency. The observed interpretive-gap values and their case-specific patterns are presented in Section 4.5. Shared engineering features may provide initial visual entry points for digital exhibitions and tours, while site-specific material, historical, symbolic, and landscape meanings require supporting documentary context. Consistent with values-based heritage conservation, the gaps do not establish physical intervention priorities. Whether such interpretation improves cross-cultural understanding requires direct audience-based validation.
4. Results
This study builds the evidence-constrained dual-task ViT-B/16 model using the PyTorch 2.1.2 deep learning framework. Experiments were run on a 64-bit Windows 11 operating system with hardware consisting of an Intel Core i7-11800H processor, 16 GB of RAM, and an NVIDIA GeForce RTX 3060 Laptop GPU (6 GB VRAM); model training was accelerated using the CUDA 12.1 runtime. The model uses a ViT-B/16 pre-trained on the ImageNet-1K dataset as a shared visual encoder. Input images are uniformly resized to 224 × 224 pixels and divided into 16 × 16-pixel image patches. The shared encoded features are fed into two task branches: the cultural gene classification branch outputs multi-label probabilities for the six cultural gene categories (G1–G6) via a Sigmoid function, while the spatial visual attribute regression branch outputs continuous attribute scores for the six attributes (A1–A6). The model further incorporates manually defined evidence region constraints and rules governing the relationship between cultural genes and spatial visual attributes. It uses a softIoU loss to ensure spatial consistency between the attention regions and the expert-annotated regions and employs a semantic rule loss to suppress contradictory prediction combinations. The optimizer used was AdamW, with weight decay set to 0.05 and a batch size of 32. The training process employed a linear warm-up and cosine-annealed learning rate strategy, with a maximum of 50 training epochs; training was terminated early if no improvement in validation performance was observed for 8 consecutive epochs. To reduce result variability caused by random initialization, all experiments were repeated five times using fixed random seeds, and the mean and 95% confidence interval are reported. The dataset comprises a total of 3600 curated and deduplicated cross-platform UGC images, divided by publisher account into a training set (70%), a validation set (15%), and a locked test set (15%), containing 2520, 540, and 540 images, respectively. This approach prevents highly similar content from the same publisher from leaking across sets.
4.1. Model Performance Evaluation
Training and validation losses declined rapidly and then stabilized (Figure 5a), with the best validation performance at epoch 38 and early stopping at epoch 46 after eight unimproved epochs. Gene Macro-F1 rose and stabilized (Figure 5b), spatial-attribute MAE declined (Figure 5c), and training and validation ECR increased before plateauing (Figure 5d). The absence of sustained loss divergence indicates stable convergence rather than marked overfitting.
Figure 5.
(a) Total loss curves for the training and validation sets; (b) Macro-F1 curve for the cultural gene recognition task; (c) MAE curve for the spatial visual attribute prediction task; (d) Evidence Consistency Rate (ECR) curve. In all four subfigures, the vertical dashed lines at epochs 38 and 46 indicate the best validation checkpoint and the early-stopping epoch, respectively.
Epoch 38 was selected by validation performance; final generalization was assessed only on the locked test set. M3 achieved a Gene Macro-F1 of 0.807, Macro-AUPRC 0.829, Attr MAE 0.117, Attr Spearman 0.618, and ECR 0.836 (Table 7), giving the most balanced performance across recognition, regression, and evidence consistency.
Table 7.
Comparison of the Performance of the M0–M3 Main Models.
4.2. Ablation Experiments and Evidence-Based Constraints
Matched ablations tested shared dual-task learning, regional evidence constraints, and gene-attribute semantic rules under identical splits, training parameters, and selection criteria.
Figure 6 compares the performance of different model configurations on the cultural gene identification and spatial visual attribute prediction tasks. M1 achieved a Gene Macro-F1 of 0.752 and an Attr MAE of 0.143; after adopting the shared ViT dual-task architecture, M2’s Macro-F1 improved to 0.779, and the MAE decreased to 0.132; further incorporating regional evidence and semantic rules, M3’s Macro-F1 increased to 0.807, Attr Spearman reached 0.618, and MAE decreased to 0.117. The results show that both shared task representations and evidence constraints contribute to prediction performance.
Figure 6.
Comparison of dual-task predictive performance across different ablation configurations. Blue bars represent Gene Macro-F1, orange bars represent Attr Spearman, and teal bars represent Attr MAE. Gene Macro-F1 and Attr Spearman correspond to the left y-axis (higher is better), whereas Attr MAE corresponds to the right y-axis (lower is better).
Figure 7 further compares the evidence consistency across different model configurations. The Region softIoU of the full model M3 is 0.641, and its ECR is 0.836; after removing the regional evidence constraint, the Region softIoU drops to 0.512; after removing the gene-attribute semantic rules, the ECR drops to 0.774. This indicates that the regional evidence constraint primarily improves the spatial consistency between the model’s focus regions and the manually annotated evidence regions, while the semantic rules primarily reduce inconsistent predictions between cultural genes and spatial visual attributes.
Figure 7.
Comparison of Evidence Consistency Across Different Ablation Configurations.
In addition to the quantitative results, Figure 8 compares the manually annotated evidence regions with the model’s attention distributions. In the G1 structural-technical sample of the Wuhan Yangtze River Bridge, the model primarily focused on the steel trusses, piers, and load-bearing structures; in the G2 material-process sample of the Forth Bridge, the model’s attention was mainly concentrated on steel components and details of related materials. The overlap between the model’s attention regions and the manually annotated evidence regions further demonstrates that evidence constraints can guide the model to focus on visual regions that support the identification of cultural genes.
Figure 8.
Qualitative comparison of manually annotated evidence regions and M3 attention maps for representative cultural genes: (a) G1 Structure–Technology of the Wuhan Yangtze River Bridge; (b) G2 Materials–Craftsmanship of the Forth Bridge. Each example shows the original image, human-annotated evidence region, and M3 attention map from left to right.
Relative to M1, M3 increased Gene Macro-F1 by 0.055 and reduced Attr MAE by 0.026. Regional constraints increased softIoU by 0.129, and semantic rules increased ECR by 0.062 (Table 8). Thus, shared learning improved cross-task feature use, while the two constraints improved spatial and semantic consistency; M3 was used thereafter.
Table 8.
Ablation Experiments and Contributions of Evidence Constraints.
4.3. Industrial Heritage Visual Representation Results
The complete model (M3) was applied to the full dataset of 3600 images, comprising 1783 images of the Wuhan Yangtze River Bridge and 1817 images of the Forth Bridge. Cultural-gene visibility was quantified using category-specific positive detection rates, while spatial visual attributes were summarized using their predefined 0–1 scales. The resulting full-sample statistics are presented in Figure 9 and Table 9 and provide a descriptive account of the visual representations observed in the collected UGC dataset. Because the full dataset includes images used for model training and validation, these descriptive statistics should not be interpreted as independent out-of-sample validation results. The full-sample cultural-gene detection rates are retained as the UGC visibility measure (V) in the interpretive-gap analysis in Section 4.5, ensuring consistency between the two descriptive analyses. The stability of these patterns under independent prediction requires a separate evaluation using the 540-image locked test set.
Figure 9.
(a) Comparison of the visibility rates of positive cultural genes between the Wuhan Yangtze River Bridge and the Forth Bridge; (b) Comparison of average scores for spatial visual attributes between the Wuhan Yangtze River Bridge and the Forth Bridge; (c) Distribution of scores for spatial visual attributes of the two bridges. In subfigure (c), the orange horizontal lines within the boxes indicate the median values. For each attribute, the left and right boxplots represent the Wuhan Yangtze River Bridge and the Forth Bridge, respectively.
Table 9.
Positive Rates for G1–G6 and Descriptive Statistics for A1–A6 at the Wuhan Yangtze River Bridge and the Forth Bridge.
Figure 9a shows the positive detection rates of cultural genes G1–G6 for the two bridges. The positive rates for G1 (Structure–Technology) were 0.785 and 0.812 for the Wuhan Yangtze River Bridge and the Forth Bridge, respectively, while those for G3 (Transportation–Function) were 0.698 and 0.674, respectively; the differences between the two were relatively small. In contrast, G2 (Materials–Craftsmanship) and G4 (History–Memory) exhibit more pronounced differences between the two cases: the G2 score for the Forth Bridge is 0.741, higher than the Wuhan Yangtze River Bridge’s 0.612; the G4 score for the Wuhan Yangtze River Bridge is 0.421, higher than the Forth Bridge’s 0.356. Figure 9b further compares the spatial visual attributes of the two cases. Both bridges received high scores for A2 (Recognizability) and A5 (Visual Salience), while the case-specific differences in A1 (Coherence), A2 (Recognizability), A4 (Monumentality), and A5 (Visual Salience) were relatively small. More pronounced differences were observed primarily in A3 (Complexity) and A6 (Landscape Integration), with a mean difference of 0.064 for A6 and 0.041 for A3. Figure 9c further illustrates the distribution of the spatial visual attributes (A1–A6) for the two bridges. While there is significant overlap across most attributes, the distribution centers and ranges for some attributes still differ. Therefore, the two bridges do not exhibit completely distinct visual patterns in UGC, nor are all their spatial visual attributes entirely consistent.
Table 9 reports gene visibility, attribute means and medians, and account-clustered 95% bootstrap intervals. G1 and G3 were similar across bridges; G2 and G4 differed more, as did A3 Complexity and A6 Landscape Integration.
To illustrate the sensitivity of the full-sample descriptive results, a 540-image hold-out subset was examined, comprising 268 images of the Wuhan Yangtze River Bridge and 272 images of the Forth Bridge. The subset was stratified across the four observed platform–bridge groups, and its estimates were compared with the full-sample statistics reported in Table 9, as illustrated in Figure 10.
Figure 10.
(a) Cultural-gene positive detection rates for the Wuhan Yangtze River Bridge and the Forth Bridge. Reported full-sample values (n = 3600) are compared with an illustrative 540-image hold-out subset (Wuhan: n = 268; Forth: n = 272). Hatched bars denote subset estimates; (b) Mean spatial visual attribute scores for the Wuhan Yangtze River Bridge and the Forth Bridge. Reported full-sample values are compared with the illustrative 540-image hold-out subset. All attributes are measured on a 0–1 scale.
For cultural-gene detection, the illustrative subset rates for G1–G6 were 0.776, 0.604, 0.675, 0.399, 0.657, and 0.687 for the Wuhan Yangtze River Bridge, compared with 0.812, 0.750, 0.684, 0.364, 0.717, and 0.750 for the Forth Bridge. The difference in G2 (Materials–Craftsmanship) remained positive at 0.146, with an illustrative 95% bootstrap interval of 0.067–0.223. In contrast, the G3 (Transportation–Function) difference changed from −0.024 in the full sample to 0.008 in the subset, while the G4 (History–Memory) difference decreased from −0.065 to −0.035. For spatial visual attributes, the illustrative subset means for A1–A6 were 0.719, 0.782, 0.625, 0.706, 0.766, and 0.684 for Wuhan, compared with 0.741, 0.812, 0.662, 0.737, 0.788, and 0.749 for the Forth Bridge. The corresponding differences in A3 (Complexity) and A6 (Landscape Integration) were 0.038 and 0.066, with illustrative 95% bootstrap intervals of 0.014–0.061 and 0.045–0.087, respectively. These results demonstrate how the stability of cross-case visual representation patterns may be examined through subset sensitivity analysis. They do not constitute an actual independent validation of M3. Empirical verification requires the original predictions from the 540-image locked test set and uncertainty estimation that accounts for the dependence structure of the observed data.
The full-sample results characterize descriptive differences in cultural-gene visibility and spatial visual attributes between the two bridge cases. However, positive detection rates and attribute means alone cannot determine whether these differences reflect robust cross-case commonality or site-specific characteristics. Section 4.4 therefore further examines cross-platform transfer performance, the Cross-Case Commonality Index (CCI), the Site-Specificity Index (SI), and shared–specific co-occurrence patterns, while distinguishing descriptive representation statistics from independent predictive evidence.
4.4. Cross-Platform and Cross-Case Visual Comparison
Section 4.4 tests platform robustness and cross-case commonality and site-specificity. Because platform and publisher source are coupled, results are limited to joint platform-source conditions and are not interpreted as independent cultural effects.
Figure 11a illustrates M3’s bidirectional cross-platform transfer performance. The Macro-F1 for the Instagram → Xiaohongshu direction is 0.756, with a 95% confidence interval of 0.742–0.770; for the Xiaohongshu → Instagram direction, Macro-F1 is 0.770, with a 95% confidence interval of 0.756–0.784; the average Macro-F1 for both directions is 0.763, with a directional difference of 0.014. The results indicate that no significant performance reversal occurred between the two transfer directions, and the model maintains a certain level of stability under varying platform conditions. Figure 11b presents the Cross-Case Commonality Index (CCI) and Site-Specificity Index (SI) for the six cultural-gene categories, together with their corresponding 95% confidence intervals. The CCI values for G1 (Structure–Technology), G3 (Transportation–Function), and G5 (Commemoration–Symbolism) are 0.427, 0.386, and 0.331, respectively, indicating comparatively stronger cross-case representational commonality. The SI values for G2 (Materials–Craftsmanship), G4 (History–Memory), and G6 (Landscape–Place) are 0.574, 0.662, and 0.551, respectively, indicating comparatively stronger bridge-case discriminability. Figure 11c presents a directional comparison of shared-engineering representations under two observed platform–bridge conditions. The mean representation score was 0.522 for Xiaohongshu images of the Forth Bridge and 0.498 for Instagram images of the Wuhan Yangtze River Bridge, yielding a directional difference of 0.024 (95% CI: −0.006 to 0.048). The reported TOST-adjusted q-value was 0.031 under the adopted equivalence margin of ±0.05. This result supports practical equivalence of the specified image-derived representation measure under that operational criterion. Nevertheless, because the upper endpoint of the reported 95% confidence interval (0.048) is close to the positive equivalence boundary (0.05), the conclusion is potentially sensitive to the margin selected. Therefore, the finding should be interpreted as conditional evidence of equivalence under the adopted tolerance rather than as a margin-independent demonstration of identical visual representations. Under the adopted statistical criterion, these results support practical equivalence of the specified image-derived representation measure. However, the compared groups differ simultaneously in platform, source composition, and bridge case. The result therefore reflects conditional similarity in shared-engineering visual representations and cannot establish independent cultural-background effects or equivalent aesthetic preferences and heritage understanding among Chinese and British audiences. These shared features are instead treated as candidate visual cues for subsequent cross-cultural audience validation. Figure 11d illustrates the co-occurrence of candidate shared and site-specific cultural genes within individual images. In the reconstruction, the CSCR values were 0.920 for the Wuhan Yangtze River Bridge and 0.939 for the Forth Bridge, yielding an overall value of 0.930. The corresponding stratified permutation baseline was approximately 0.930, with an observed-minus-baseline difference close to zero and a one-sided empirical p-value of 0.751. Although the two candidate gene sets frequently co-occurred in the images, the observed co-occurrence was not significantly greater than expected under the permutation null model. This finding illustrates the distinction between frequent descriptive coexistence and statistically significant excess co-occurrence.
Figure 11.
Cross-platform robustness and cross–case visual representation analysis: (a) bidirectional cross–platform transfer performance of M3; (b) Cross–Case Commonality Index (CCI) and Site–Specificity Index (SI) for the six cultural−gene categories, with 95% confidence intervals; (c) directional comparison of shared−engineering visual representations and TOST equivalence testing; (d) Shared–Specific Cultural–Gene Co-occurrence and Stratified Permutation Baseline. In subfigure (b), blue dots represent the estimated CCI and SI values for the six cultural-gene categories (G1–G6), and horizontal and vertical error bars indicate their corresponding 95% confidence intervals. The dotted lines at CCI = 0.30 and SI = 0.50 serve as visual reference guides rather than statistically validated thresholds. In subfigure (c), the solid vertical line at zero indicates no directional difference, while the two dotted vertical lines at −0.05 and +0.05 represent the predefined equivalence bounds. The shaded area indicates the equivalence region, the blue dot represents the estimated directional difference, and the horizontal error bar indicates its 95% confidence interval.
Table 10 summarizes the same-category cross-case representation distances, Cross-Case Commonality Index (CCI), Site-Specificity Index (SI), and their corresponding 95% confidence intervals for the six cultural-gene categories. G1 (Structure–Technology), G3 (Transportation–Function), and G5 (Commemoration–Symbolism) exhibit comparatively higher cross-case representational commonality, with CCI values of 0.427, 0.386, and 0.331, respectively. In contrast, G2 (Materials–Craftsmanship), G4 (History–Memory), and G6 (Landscape–Place) show relatively stronger bridge-case discriminability, with SI values of 0.574, 0.662, and 0.551, respectively. These findings indicate that the six cultural-gene categories exhibit different degrees of visual commonality and site-specificity under the observed cross-platform and cross-case sampling conditions. However, these indices characterize image-derived representations and do not independently establish cultural equivalence or differences in heritage understanding.
Table 10.
Cross-Case Commonality Index (CCI), Site-Specificity Index (SI), and Statistical Comparison Results for the Six Cultural-Gene Categories.
Table 11 summarizes the bidirectional cross-platform transfer performance, directional visual representation equivalence, and shared–specific cultural-gene co-occurrence. The reported transfer results indicate comparable predictive performance across the two platform directions, while the directional equivalence test supports practical equivalence of the specified image-derived representation measure within the predefined margin. In the illustrative CSCR reconstruction, candidate shared and site-specific genes frequently co-occur within individual images; however, the observed co-occurrence does not exceed the stratified permutation baseline to a statistically significant degree. These findings distinguish descriptive coexistence from statistical evidence of additional association between the predefined gene sets.
Table 11.
Bidirectional Cross-Platform Transfer, Directional Visual Representation Equivalence, and Shared–Specific Co-occurrence Analysis.
The illustrative 540-image subset analysis was further used to examine the stability of the cross-case descriptive contrasts. As shown in Figure 12a,b.
Figure 12.
(a) Sensitivity of cross–bridge differences in cultural–gene detection rates. Diamonds represent reported full–sample contrasts; circles and horizontal intervals represent subset contrasts and their illustrative 95% bootstrap intervals, calculated using 4000 stratified image–level resamples.; (b) Sensitivity of cross-bridge differences in spatial visual attribute means. Diamonds represent reported full-sample contrasts; circles and horizontal intervals represent subset contrasts and illustrative 95% bootstrap intervals.
The Forth Bridge retained a higher G2 (Materials–Craftsmanship) detection rate than the Wuhan Yangtze River Bridge, with a difference of 0.146 and an illustrative 95% bootstrap interval of 0.067–0.223. The differences in A3 (Complexity) and A6 (Landscape Integration) remained positive, at 0.038 (95% CI: 0.014–0.061) and 0.066 (95% CI: 0.045–0.087), respectively.
Other contrasts were less stable. The G3 detection-rate difference changed direction between the full dataset and the subset, while the G4 difference decreased in magnitude to −0.035 (95% CI: −0.116 to 0.049). These results illustrate the importance of examining the stability of smaller category-level contrasts.
This sensitivity exercise addresses cultural-gene detection rates and spatial-attribute summaries only. It does not independently reproduce the CCI, SI, CSCR, or their associated permutation-test results. As the subset predictions were generated, they cannot establish the empirical robustness of the reported model. A corresponding analysis using the original 540-image locked test set is required.
Overall, the cross-platform and cross-case analyses suggest a layered visual pattern in which candidate shared representations coexist with bridge-specific characteristics. G1 (Structure–Technology), G3 (Transportation–Function), and G5 (Commemoration–Symbolism) show comparatively stronger cross-case representational commonality in the reported CCI analysis, whereas G2 (Materials–Craftsmanship), G4 (History–Memory), and G6 (Landscape–Place) exhibit relatively stronger bridge-case discriminability according to the SI estimates. These interpretations remain conditional on the representation-distance calculations, the site-discrimination validation procedure, and the predefined shared–specific gene partition. The full-sample results provide descriptive evidence, but the independence and stability of these patterns require separate validation. Accordingly, the observed commonalities are interpreted as candidate visual representations rather than direct evidence of equivalent aesthetic preferences, cultural understanding, or heritage identity.
4.5. The Interpretive Gap Between Official Value and UGC Visibility
Building on the preceding analysis of visual commonality and site-specificity, this section compares document-informed importance scores (Og) with UGC visibility (Vg) to identify potential interpretive gaps between documented heritage values and public visual representations. As described in Section 3.7, Og was calculated from the five-rater documentary assessment, whereas Vg was derived from the positive detection rates reported in Section 4.3. The interpretive gap was defined as Gapg = Og − Vg, with larger positive values indicating greater differences between documentary importance and observed UGC visibility.
Figure 13a shows that History–Memory (G4) exhibits the largest interpretive gap for the Wuhan Yangtze River Bridge (0.451), with a documentary importance score of 0.872 and UGC visibility of 0.421. This is followed by Transportation–Function (G3; 0.174) and Materials–Craftsmanship (G2; 0.148). In contrast, Landscape–Place (G6) shows the smallest gap (0.031), indicating a relatively close correspondence between the two measures. Figure 13b reveals a similar pattern for the Forth Bridge, where G4 also presents the largest gap (0.456), followed by G3 (0.188) and Structure–Technology (G1; 0.146). The overall ranking in Figure 13c confirms that G4 accounts for the two largest interpretive gaps across both bridge cases, while other categories exhibit smaller descriptive differences.
Figure 13.
(a) Relationship between document-informed importance and UGC visibility for the Wuhan Yangtze River Bridge; (b) relationship between document-informed importance and UGC visibility for the Forth Bridge; (c) ranking of the interpretive gaps between documentary importance and UGC visibility across the two bridges. In subfigures (a) and (b), the blue diagonal lines indicate zero interpretive gap, while the dashed lines indicate reference values for documentary importance and UGC visibility. In subfigure (c), the dashed line indicates a reference gap of 0.30. These reference values are illustrative.
Table 12 summarizes the document-informed importance scores, UGC visibility rates, and corresponding interpretive gaps for the six cultural-gene categories of both bridges. The visibility rates of Structure–Technology (G1) are 0.785 and 0.812 for the Wuhan Yangtze River Bridge and the Forth Bridge, respectively, while those of Landscape–Place (G6) reach 0.723 and 0.768. By comparison, the visibility rates of History–Memory (G4) are relatively low, at 0.421 and 0.356, despite documentary importance scores of 0.872 and 0.812. These differences indicate that the prominence of cultural genes in documented heritage narratives does not necessarily correspond to their frequency of visual representation in the collected UGC images.
Table 12.
Document-Informed Importance, UGC Visibility, and interpretive gaps for the Wuhan Yangtze River Bridge and the Forth Bridge.
Overall, the results presented in Figure 13 and Table 12 indicate that discrepancies between document-informed importance and model-derived UGC visibility vary across cultural-gene categories and bridge cases. History–Memory (G4) exhibits the largest positive gap for both bridges, whereas the remaining categories show smaller descriptive differences. These gaps represent comparisons between two distinct operational measures rather than direct evidence of insufficient public understanding. Therefore, the interpretation strategies presented in Table 12 should be regarded as provisional topics for professional review and communication design, rather than validated priorities for physical conservation or engineering intervention.
5. Discussion
5.1. Visual Convergence and Potential Cross-Cultural Readability
The cross-case analyses reveal a layered pattern of visual representation in which Structure–Technology (G1), Transportation–Function (G3), and Commemoration–Symbolism (G5) exhibit comparatively stronger representational commonality, whereas Materials–Craftsmanship (G2), History–Memory (G4), and Landscape–Place (G6) retain greater bridge-case discriminability. The illustrative CSCR reconstruction indicates that the candidate shared and site-specific cultural genes frequently coexist within individual images. However, their co-occurrence does not significantly exceed the stratified permutation baseline (p = 0.751). This non-significant result provides no statistical support, within the illustrative reconstruction, for an additional association between the two candidate gene sets beyond their marginal detection frequencies. Therefore, the proposed shared-core–local-characteristics pattern should be understood as a descriptive framework rather than evidence of an integrated shared cultural schema. Selective-attention research suggests that visual salience, task goals, and experience influence information prioritization [18,19,20], while semantic and cultural effects depend on sampling and viewing conditions [47,48,49]. Engineering structures, transportation functions, and commemorative compositions may therefore be relatively prominent in UGC visual selection, whereas material details, historical narratives, and local landscape relationships may require additional contextual interpretation. This interpretation remains a plausible explanation of the observed representation patterns rather than evidence of a causal attentional mechanism.
Visual convergence is understood here as conditional statistical proximity in cultural-gene and spatial-attribute representations across the observed cases and sampling conditions. The partial convergence of engineering-related features alongside material, historical, and landscape specificity suggests that shared visual patterns can coexist with local distinctiveness without implying cultural homogenization. The directional comparison further indicates practical equivalence of the specified shared-engineering visual representation measure within the predefined margin. However, this result is limited to the observed composite platform–bridge conditions and identifies candidate visual cues rather than actual potential cross-cultural readability. Whether audiences from different cultural backgrounds recognize and interpret these cues similarly remains an empirical question [14,50].
The proposed shared-core–local-evidence–interpretive-gap framework connects visual commonality, bridge-specific characteristics, and discrepancies between documentary importance and UGC visibility as distinct analytical dimensions. History–Memory (G4) exhibits the largest positive interpretive gap for both the Wuhan Yangtze River Bridge (0.451) and the Forth Bridge (0.456). In contrast, Materials–Craftsmanship (G2) shows smaller gaps of 0.148 and 0.135, respectively, despite its relatively strong site-specificity. Landscape–Place (G6) similarly retains local distinctiveness while exhibiting limited gaps of 0.031 and 0.068. Transportation–Function (G3), although characterized by comparatively stronger cross-case commonality, presents the second-largest gap in both cases (0.174 and 0.188). These findings demonstrate that representational commonality, bridge-case discriminability, and documentary–visibility discrepancies capture different aspects of industrial heritage representation and should not be treated as interchangeable measures.
From the perspective of heritage interpretation, shared engineering features may provide initial visual entry points for heritage tours, digital exhibitions, and educational communication, while archival records, construction histories, material craftsmanship, and landscape contexts can supplement locally embedded meanings. Social media images provide evidence of visual feature visibility [51], whereas interpretation and digital narratives can connect observable forms with documented heritage significance [27,28]. Accordingly, the framework offers an exploratory basis for identifying communication themes that combine shared visual characteristics with site-specific heritage evidence. Its practical application should be supported by documentary verification and professional interpretation rather than assumptions about audiences’ existing cultural understanding.
5.2. Limitations and Future Research
First, the study did not directly measure individual visual attention. The collected UGC images contain no fixation, saccade, or controlled viewing-task data, and the self-attention mechanism of the Vision Transformer (ViT) cannot substitute for measurements of human attention. Consequently, the observed visual representation patterns cannot establish how individual viewers allocate attention to industrial heritage features.
Second, UGC does not constitute a random sample of visitors or the general public. In particular, the “Recommendations” feature was enabled during Xiaohongshu data collection, making retrieval conditional on the platform’s recommendation ranking. This procedure may influence the exposure and collection of posts, potentially affecting the frequency and composition of visual features in the dataset. The direction and magnitude of this bias cannot be determined from the available data. Although manual screening and multi-source collection improved data relevance and coverage, they could not eliminate selection bias associated with recommendation algorithms, user composition, posting behavior, platform norms, or time-location conditions. The findings are therefore restricted to the collected UGC rather than population-level estimates of aesthetic preferences or cultural perceptions.
Third, the sampling design did not independently cross platform and account-origin categories. The dataset comprised four observed platform–bridge strata (Table 3), but independently verifiable account-location records were unavailable. Consequently, platform-related differences could not be separated from account-origin effects. Moreover, the directional representation comparison involved different bridge cases, preventing the independent attribution of observed similarities to platform, source composition, or heritage-site characteristics. The reported practical equivalence therefore applies only to the specified image-derived representation measure under the observed sampling conditions and cannot establish equivalence in cultural perception or heritage understanding.
Fourth, the analysis was limited to the Wuhan Yangtze River Bridge and the Forth Bridge. The six cultural-gene categories (G1–G6) constitute a study-specific analytical framework whose generalizability to other industrial heritage sites and heritage types remains to be established. In addition, the candidate shared and site-specific gene sets were conceptually predefined, and their co-occurrence statistic is sensitive to marginal detection frequencies and image-sampling composition. The illustrative synthetic reconstruction demonstrates the importance of accounting for these factors but cannot replace empirical co-occurrence testing using the original image-level records and account-aware uncertainty estimation. Therefore, the statistical significance and robustness of shared–specific cultural-gene associations in the original UGC dataset remain unverified.
Fifth, the interpretive-gap indicator combines document-informed importance scores and model-derived UGC visibility rates, which represent distinct constructs despite their common 0–1 scale. UGC visibility reflects the frequency of positive cultural-gene detections rather than the recognition or understanding of heritage values by actual audiences. Furthermore, documentary coverage, expert judgments, classification errors, and the selected normalization procedures may influence the estimated gap magnitudes and rankings. Although the importance scores were assessed for inter-rater reliability, agreement among raters does not independently establish the construct validity of the interpretive-gap indicator. The resulting gaps should therefore be interpreted as exploratory differences between documentary emphasis and observed visual representation, rather than validated measures of public misunderstanding or conservation priorities.
Future research should adopt more systematic and repeatable UGC collection procedures, combining chronological and recommendation-based retrieval while documenting sampling conditions and comparing repeated collection sessions. Where feasible, platform-independent reference datasets and independently verified account-origin samples should be incorporated across platforms and heritage cases to distinguish source-related effects from site-specific characteristics. The shared–specific cultural-gene associations should be reassessed using original image-level detections, stratified permutation testing, and account-aware uncertainty estimation. Additional sensitivity analyses should examine the stability of interpretive-gap rankings across alternative documentary sources, independent raters, and classification thresholds. Finally, controlled viewing experiments and eye-tracking measurements, combined with participant questionnaires and interviews across different cultural backgrounds, are needed to examine whether the identified visual cues are actually attended to, recognized, and interpreted in comparable ways. Such triangulation would distinguish UGC-based visual selection, individual attentional behavior, and cross-cultural heritage understanding, providing independent evidence for evaluating the proposed Potential cross-cultural readability.
6. Conclusions
Using user-generated content (UGC) images of the Wuhan Yangtze River Bridge and the Forth Bridge, this study developed an evidence-constrained dual-task learning framework for identifying visible cultural genes and spatial visual attributes. The full model (M3) achieved a Macro-F1 of 0.807, an MAE of 0.117, and an evidence consistency rate (ECR) of 0.836, providing an internal basis for evaluating the proposed computational framework.
The cross-case analysis identified comparatively stronger representational commonality in Structure–Technology (G1), Transportation–Function (G3), and Commemoration–Symbolism (G5), whereas Materials–Craftsmanship (G2), History–Memory (G4), and Landscape–Place (G6) exhibited stronger bridge-case discriminability. These results suggest that shared visual representations may coexist with locally distinctive characteristics. However, the illustrative co-occurrence reconstruction did not establish an association beyond that expected from marginal detection frequencies, and the corresponding association in the original image-level dataset remains to be independently verified. Accordingly, the proposed shared-core–local-characteristics framework remains a descriptive interpretation of recurring visual patterns, while the existence of a statistically supported joint shared–specific cultural schema requires further verification using the original image-level data.
The directional comparison satisfied the predefined practical equivalence criterion for the specified image-derived representation measure. Nevertheless, the sampling conditions did not independently separate platform, account-source composition, and bridge-case effects. Therefore, the observed visual similarities should not be interpreted as evidence of cultural equivalence, shared cultural cognition, or actual cross-cultural understanding. These outcomes require independent validation through audience-based recognition and interpretation studies.
The interpretive-gap analysis identified History–Memory (G4) as having the largest discrepancy between documentary importance and UGC visibility in both cases. The proposed shared-core–local-evidence–interpretive-gap framework may therefore inform exploratory heritage interpretation and communication design. Its application should remain grounded in documentary evidence and professional assessment, while future controlled viewing experiments and participant-based evaluations are needed to determine whether the identified visual cues facilitate cross-cultural heritage understanding.
Supplementary Materials
The following supporting information can be downloaded at https://www.mdpi.com/article/10.3390/buildings16214373/s1: The supplementary materials provide supporting documentation and statistical details for the documentary-importance assessment and interpretive-gap analysis described in Section 3.7. Table S1 presents the documentary evidence mapping for the twelve bridge–gene evaluation units, including the corresponding sources and interpretation boundaries. Table S2 reports the five-rater scoring matrix, normalized documentary-importance scores, model-derived UGC visibility rates, and corresponding interpretive gaps. Table S3 provides the analysis of variance (ANOVA) components and intraclass correlation coefficient (ICC) estimates used to assess inter-rater agreement. Together, these materials support the transparency and reproducibility of the documentary-importance assessment. The documentary sources supporting the Wuhan Yangtze River Bridge and the Forth Bridge are listed in References [52,53,54,55,56,57,58,59,60,61,62,63], respectively. Additional scholarly sources are provided in References [5,6].
Author Contributions
Conceptualization, J.T.; methodology, J.T.; software, F.W.; validation, F.W. and M.Y.; formal analysis, F.W. and Y.W.; investigation, J.T.; resources, Q.Z.; data curation, J.T. and Y.W.; writing—original draft preparation, J.T.; writing—review and editing, J.T.; visualization, J.T.; supervision, Y.W.; project administration, Q.Z.; funding acquisition, Q.Z. All authors have read and agreed to the published version of the manuscript.
Funding
This research was funded by the Wuhan Federation of Social Sciences (Grant No. WHSKL2025053).
Data Availability Statement
The original contributions presented in this study are included in the article. Further inquiries can be directed to the corresponding author.
Conflicts of Interest
The authors declare no conflicts of interest.
Abbreviations
The following abbreviations are used in this manuscript:
| AdamW | Adam optimizer with decoupled weight decay |
| AUC | Area under the receiver operating characteristic curve |
| AUPRC | Area under the precision–recall curve |
| BCE | Binary cross-entropy |
| CCI | Cross-Case Commonality Index |
| CI | Confidence interval |
| CLS | Classification token |
| CSCR | Commonality–Specificity Co-occurrence Rate |
| ECR | Evidence Consistency Rate |
| F1 | Harmonic mean of precision and recall |
| ICC | Intraclass correlation coefficient |
| MAE | Mean absolute error |
| MLP | Multilayer perceptron |
| ResNet-50 | 50-layer residual network |
| SI | Site-Specificity Index |
| softIoU | Soft intersection over union |
| TOST | Two one-sided tests |
| UGC | User-generated content |
| ViT | Vision Transformer |
References
- The International Committee for the Conservation of the Industrial Heritage (TICCIH). The Nizhny Tagil Charter for the Industrial Heritage; The International Committee for the Conservation of the Industrial Heritage (TICCIH): Edinburgh, UK, 2003. [Google Scholar]
- ICOMOS; TICCIH. Joint ICOMOS–TICCIH Principles for the Conservation of Industrial Heritage Sites, Structures, Areas and Landscapes (The Dublin Principles); ICOMOS: Charenton-le-Pont, France; TICCIH: Edinburgh, UK, 2011. [Google Scholar]
- UNESCO. Recommendation on the Historic Urban Landscape, Including a Glossary of Definitions; UNESCO: Paris, France, 2011. [Google Scholar]
- Taher Tolou Del, M.S.; Saleh Sedghpour, B.; Kamali Tabrizi, S. The Semantic Conservation of Architectural Heritage: The Missing Values. npj Herit. Sci. 2020, 8, 70. [Google Scholar] [CrossRef] [Scilit]
- Yao, L. Transnational Co-Production of Technology: Sino-Soviet Cooperation in the Construction of the Wuhan Yangtze River Bridge, 1950–1957. Hist. Technol. 2024, 40, 73–88. [Google Scholar] [CrossRef] [Scilit]
- Sooman, D.; Andrew, J. Forth Bridge: The Restoration Challenge. Proc. Inst. Civ. Eng.-Bridge Eng. 2015, 168, 150–162. [Google Scholar] [CrossRef] [Scilit]
- Hu, Z.; Strobl, J.; Min, Q.; Tan, M.; Chen, F. Visualizing the Cultural Landscape Gene of Traditional Settlements in China: A Semiotic Perspective. npj Herit. Sci. 2021, 9, 115. [Google Scholar] [CrossRef] [Scilit]
- Liu, S.; Wu, L.; Xiang, C.; Dai, W. Revitalizing Rural Landscapes: Applying Cultural Landscape Gene Theory for Sustainable Spatial Planning in Linpu Village. Buildings 2024, 14, 2396. [Google Scholar] [CrossRef] [Scilit]
- De La Torre, M. Values and Heritage Conservation. Herit. Soc. 2013, 6, 155–166. [Google Scholar] [CrossRef] [Scilit]
- Bai, N.; Nourian, P.; Luo, R.; Cheng, T.; Pereira Roders, A. Screening the Stones of Venice: Mapping Social Perceptions of Cultural Significance through Graph-Based Semi-Supervised Classification. ISPRS J. Photogramm. Remote Sens. 2023, 203, 135–164. [Google Scholar] [CrossRef] [Scilit]
- Zhang, C.; Wang, Y.; Li, L.; Zhao, J.; Peng, S. Decoding Tourists’ Landscape Perception Preferences in Historical and Cultural Heritage Parks Through Social Media Images: A Dual-Task Deep Learning Framework. Buildings 2026, 16, 2918. [Google Scholar] [CrossRef] [Scilit]
- Chen, Y.; Sherren, K.; Smit, M.; Lee, K.Y. Using Social Media Images as Data in Social Science Research. New Media Soc. 2023, 25, 849–871. [Google Scholar] [CrossRef] [Scilit]
- Ruths, D.; Pfeffer, J. Social Media for Large Studies of Behavior. Science 2014, 346, 1063–1064. [Google Scholar] [CrossRef] [Scilit] [PubMed]
- Pearce, W.; Özkula, S.M.; Greene, A.K.; Teeling, L.; Bansard, J.S.; Omena, J.J.; Rabello, E.T. Visual Cross-Platform Analysis: Digital Methods to Research Social Media Images. Inf. Commun. Soc. 2020, 23, 161–180. [Google Scholar] [CrossRef] [Scilit]
- López-Chao, V.; Lopez-Pena, V. Aesthetical Appeal and Dissemination of Architectural Heritage Photographs in Instagram. Buildings 2020, 10, 225. [Google Scholar] [CrossRef] [Scilit]
- Poulios, I. Moving Beyond a Values-Based Approach to Heritage Conservation. Conserv. Manag. Archaeol. Sites 2010, 12, 170–185. [Google Scholar] [CrossRef] [Scilit]
- Fredheim, L.H.; Khalaf, M. The Significance of Values: Heritage Value Typologies Re-Examined. Int. J. Herit. Stud. 2016, 22, 466–481. [Google Scholar] [CrossRef] [Scilit]
- Desimone, R.; Duncan, J. Neural Mechanisms of Selective Visual Attention. Annu. Rev. Neurosci. 1995, 18, 193–222. [Google Scholar] [CrossRef] [PubMed]
- Itti, L.; Koch, C. Computational Modelling of Visual Attention. Nat. Rev. Neurosci. 2001, 2, 194–203. [Google Scholar] [CrossRef] [Scilit] [PubMed]
- Awh, E.; Belopolsky, A.V.; Theeuwes, J. Top-down versus Bottom-up Attentional Control: A Failed Theoretical Dichotomy. Trends Cogn. Sci. 2012, 16, 437–443. [Google Scholar] [CrossRef] [Scilit] [PubMed]
- Muehlebach, A. The Body of Solidarity: Heritage, Memory, and Materiality in Post-Industrial Italy. Comp. Stud. Soc. Hist. 2017, 59, 96–126. [Google Scholar] [CrossRef] [Scilit][Green Version]
- Huai, S.; Chen, F.; Liu, S.; Canters, F.; Van De Voorde, T. Using Social Media Photos and Computer Vision to Assess Cultural Ecosystem Services and Landscape Features in Urban Parks. Ecosyst. Serv. 2022, 57, 101475. [Google Scholar] [CrossRef] [Scilit]
- Caruana, R. Multitask Learning. Mach. Learn. 1997, 28, 41–75. [Google Scholar] [CrossRef] [Scilit]
- Vandenhende, S.; Georgoulis, S.; Van Gansbeke, W.; Proesmans, M.; Dai, D.; Van Gool, L. Multi-Task Learning for Dense Prediction Tasks: A Survey. IEEE Trans. Pattern Anal. Mach. Intell. 2021, 44, 3614–3633. [Google Scholar] [CrossRef] [Scilit] [PubMed]
- Sawada, Y.; Nakamura, K. Concept Bottleneck Model With Additional Unsupervised Concepts. IEEE Access 2022, 10, 41758–41765. [Google Scholar] [CrossRef] [Scilit]
- Jain, S.; Wallace, B.C. Attention Is Not Explanation. In Proceedings of the 2019 Conference of the North American Chapter of the Association for Computational Linguistics: Human Language Technologies; Association for Computational Linguistics: Minneapolis, MN, USA, 2019; Volume 1, pp. 3543–3556. [Google Scholar]
- Costa, M.; Carneiro, M.J. The Influence of Interpretation on Learning about Architectural Heritage and on the Perception of Cultural Significance. J. Tour. Cult. Change 2021, 19, 230–249. [Google Scholar] [CrossRef] [Scilit]
- Shim, H.; Oh, K.T.; O’Malley, C.; Jun, J.Y.; Shi, C.-K. Heritage Values, Digital Storytelling, and Heritage Communication: The Exploration of Cultural Heritage Sites in Virtual Environments. Digit. Creat. 2024, 35, 171–197. [Google Scholar] [CrossRef] [Scilit]
- Addis, B. Briefing: Engineering History, Conservation and Heritage. Proc. Inst. Civ. Eng.-Eng. Hist. Herit. 2017, 170, 3–6. [Google Scholar] [CrossRef] [Scilit]
- Zhang, M.-L.; Zhou, Z.-H. A Review on Multi-Label Learning Algorithms. IEEE Trans. Knowl. Data Eng. 2014, 26, 1819–1837. [Google Scholar] [CrossRef] [Scilit]
- Stamps, A.E. Mystery, Complexity, Legibility and Coherence: A Meta-Analysis. J. Environ. Psychol. 2004, 24, 1–16. [Google Scholar] [CrossRef] [Scilit]
- Dupont, L.; Ooms, K.; Antrop, M.; Van Eetvelde, V. Testing the Validity of a Saliency-Based Method for Visual Assessment of Constructions in the Landscape. Landsc. Urban Plan. 2017, 167, 325–338. [Google Scholar] [CrossRef] [Scilit]
- Kaplan, R.; Kaplan, S.; Brown, T. Environmental Preference: A Comparison of Four Domains of Predictors. Environ. Behav. 1989, 21, 509–530. [Google Scholar] [CrossRef] [Scilit]
- Lindal, P.J.; Hartig, T. Architectural Variation, Building Height, and the Restorative Quality of Urban Residential Streetscapes. J. Environ. Psychol. 2013, 33, 26–36. [Google Scholar] [CrossRef] [Scilit]
- Ode, Å.; Tveit, M.S.; Fry, G. Capturing Landscape Visual Character Using Indicators: Touching Base with Landscape Aesthetic Theory. Landsc. Res. 2008, 33, 89–117. [Google Scholar] [CrossRef] [Scilit]
- Adams, D.; Larkham, P. Contesting Urban Monuments: Future Directions for the Controversial Monumental Landscapes of Civic Grandeur. Int. J. Herit. Stud. 2022, 28, 891–906. [Google Scholar] [CrossRef] [Scilit]
- Koo, T.K.; Li, M.Y. A Guideline of Selecting and Reporting Intraclass Correlation Coefficients for Reliability Research. J. Chiropr. Med. 2016, 15, 155–163. [Google Scholar] [CrossRef] [Scilit] [PubMed]
- Ross, A.S.; Hughes, M.C.; Doshi-Velez, F. Right for the Right Reasons: Training Differentiable Models by Constraining Their Explanations. In Proceedings of the Twenty-Sixth International Joint Conference on Artificial Intelligence; International Joint Conferences on Artificial Intelligence Organization: Melbourne, Australia, 2017; pp. 2662–2670. [Google Scholar]
- Geirhos, R.; Jacobsen, J.-H.; Michaelis, C.; Zemel, R.; Brendel, W.; Bethge, M.; Wichmann, F.A. Shortcut Learning in Deep Neural Networks. Nat. Mach. Intell. 2020, 2, 665–673. [Google Scholar] [CrossRef] [Scilit]
- Von Rueden, L.; Mayer, S.; Beckh, K.; Georgiev, B.; Giesselbach, S.; Heese, R.; Kirsch, B.; Walczak, M.; Pfrommer, J.; Pick, A.; et al. Informed Machine Learning—A Taxonomy and Survey of Integrating Prior Knowledge into Learning Systems. IEEE Trans. Knowl. Data Eng. 2021, 35, 614–633. [Google Scholar] [CrossRef] [Scilit]
- Milletari, F.; Navab, N.; Ahmadi, S.-A. V-Net: Fully Convolutional Neural Networks for Volumetric Medical Image Segmentation. In Proceedings of the 2016 Fourth International Conference on 3D Vision (3DV); IEEE: Stanford, CA, USA, 2016; pp. 565–571. [Google Scholar]
- Kaufman, S.; Rosset, S.; Perlich, C.; Stitelman, O. Leakage in Data Mining: Formulation, Detection, and Avoidance. ACM Trans. Knowl. Discov. Data 2012, 6, 1–21. [Google Scholar] [CrossRef] [Scilit]
- Moreno-Torres, J.G.; Raeder, T.; Alaiz-Rodríguez, R.; Chawla, N.V.; Herrera, F. A Unifying View on Dataset Shift in Classification. Pattern Recognit. 2012, 45, 521–530. [Google Scholar] [CrossRef] [Scilit]
- Wang, J.; Lan, C.; Liu, C.; Ouyang, Y.; Qin, T.; Lu, W.; Chen, Y.; Zeng, W.; Yu, P. Generalizing to Unseen Domains: A Survey on Domain Generalization. IEEE Trans. Knowl. Data Eng. 2022, 35, 8052–8072. [Google Scholar] [CrossRef] [Scilit]
- Harden, J.J. A Bootstrap Method for Conducting Statistical Inference with Clustered Data. State Politics Policy Q. 2011, 11, 223–246. [Google Scholar] [CrossRef] [Scilit]
- Lakens, D. Equivalence Tests: A Practical Primer for t Tests, Correlations, and Meta-Analyses. Soc. Psychol. Personal. Sci. 2017, 8, 355–362. [Google Scholar] [CrossRef] [Scilit] [PubMed]
- Chua, H.F.; Boland, J.E.; Nisbett, R.E. Cultural Variation in Eye Movements during Scene Perception. Proc. Natl. Acad. Sci. USA 2005, 102, 12629–12633. [Google Scholar] [CrossRef] [Scilit] [PubMed]
- Henderson, J.M.; Hayes, T.R. Meaning-Based Guidance of Attention in Scenes as Revealed by Meaning Maps. Nat. Hum. Behav. 2017, 1, 743–747. [Google Scholar] [CrossRef] [Scilit] [PubMed]
- Čeněk, J.; Halámková, D.; Caha, J.; Lacko, D.; Kalenská, P.; Stachoň, Z.; Tsai, J.-L.; Ahenkan, A.; Dresler, T.; Lüdtke, J.; et al. Cross-Cultural Analysis of Eye-Movement Patterns in Visual Scene Perception: A Comparison of Seven Cultural Samples. Sci. Rep. 2025, 15, 28574. [Google Scholar] [CrossRef] [Scilit] [PubMed]
- McMullen, M. Let’s See the Whole Picture: A Multi-Platform Visual Analysis of Historic Mission San José on Instagram, Pinterest, Flickr, and TripAdvisor. J. Herit. Tour. 2024, 19, 365–379. [Google Scholar] [CrossRef] [Scilit]
- Ginzarly, M.; Pereira Roders, A.; Teller, J. Mapping Historic Urban Landscape Values through Social Media. J. Cult. Herit. 2019, 36, 1–11. [Google Scholar] [CrossRef] [Scilit]
- Wuhan Municipal People’s Government. Wuhan Yangtze River Bridge. Available online: https://english.wuhan.gov.cn/bridge/wuhanyangtze/index.shtml (accessed on 19 October 2026).
- Hubei Provincial Department of Culture and Tourism. The Wuhan Yangtze River Bridge Standing Tall. 2014. Available online: https://wlt.hubei.gov.cn/bmdt/ztzl/zshb/201912/t20191226_1799521.shtml (accessed on 19 October 2026). (In Chinese).
- Changjiang Daily. A "Signature Silk" Signed by Hundreds Displayed at the Bridge Museum, Recreating the Opening of the Wuhan Yangtze River Bridge. 2025. Available online: https://www.wuhan.gov.cn/sy/whyw/202510/t20251015_2660669.shtml (accessed on 19 October 2026). (In Chinese).
- Yang, Y. The Yangtze River Bridge as a City Symbol. 2019. Available online: https://fgw.wuhan.gov.cn/xwzx/mtgz/202001/t20200116_864888.html (accessed on 19 October 2026). (In Chinese).
- Changjiang Daily. First Restoration Since Construction: Wuhan Yangtze River Bridge Towers to Be Restored to Their Original Appearance. 2022. Available online: https://www.wuhan.gov.cn/sy/whyw/202212/t20221212_2114209.shtml (accessed on 19 October 2026). (In Chinese).
- Zhou, Z. Remembering the Transformation of the Yangtze Crossing. 2019. Available online: https://www.ndrc.gov.cn/xwdt/gdzt/cl70zn/201909/t20190930_1197745_ext.html (accessed on 19 October 2026). (In Chinese).
- UNESCO World Heritage Committee. Decision 39 COM 8B.33: The Forth Bridge, United Kingdom. 2015. Available online: https://whc.unesco.org/en/decisions/6383 (accessed on 19 October 2026).
- Historic Environment Scotland. The Forth Bridge. Available online: https://www.historicenvironment.scot/protect-and-care/protected-historic-places/world-heritage-sites/the-forth-bridge/ (accessed on 19 October 2026).
- Forth Bridges Forum. The Forth Bridge: Nomination for Inclusion in the World Heritage List. 2014. Available online: https://www.theforthbridges.org/media/rvrb40ql/forth-bridge-world-heritage-nomination-document.pdf (accessed on 19 October 2026).
- Forth Bridges Forum. Building the Forth Bridge. Available online: https://www.theforthbridges.org/about-the-forth-bridges/forth-bridge/forth-bridge-history/building-the-forth-bridge/ (accessed on 19 October 2026).
- Forth Bridges Forum. The Forth Bridge: Management Plan 2014–2019. 2014. Available online: https://www.theforthbridges.org/media/wb4n15vs/forth-bridge-world-heritage-nomination-management-plan.pdf (accessed on 19 October 2026).
- Historic Environment Scotland. Forth Bridge (LB40370). Available online: https://portal.historicenvironment.scot/apex/f?p=1505:300:::::VIEWTYPE,VIEWREF:designation,LB40370 (accessed on 19 October 2026).
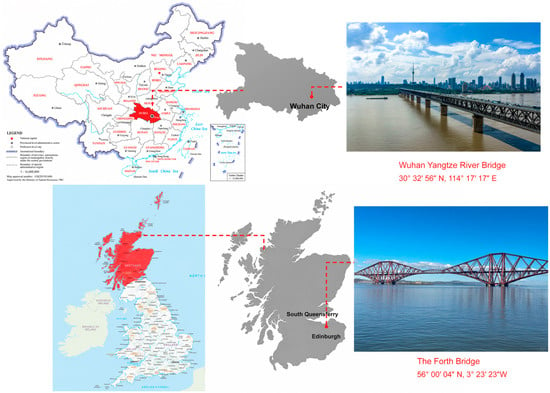
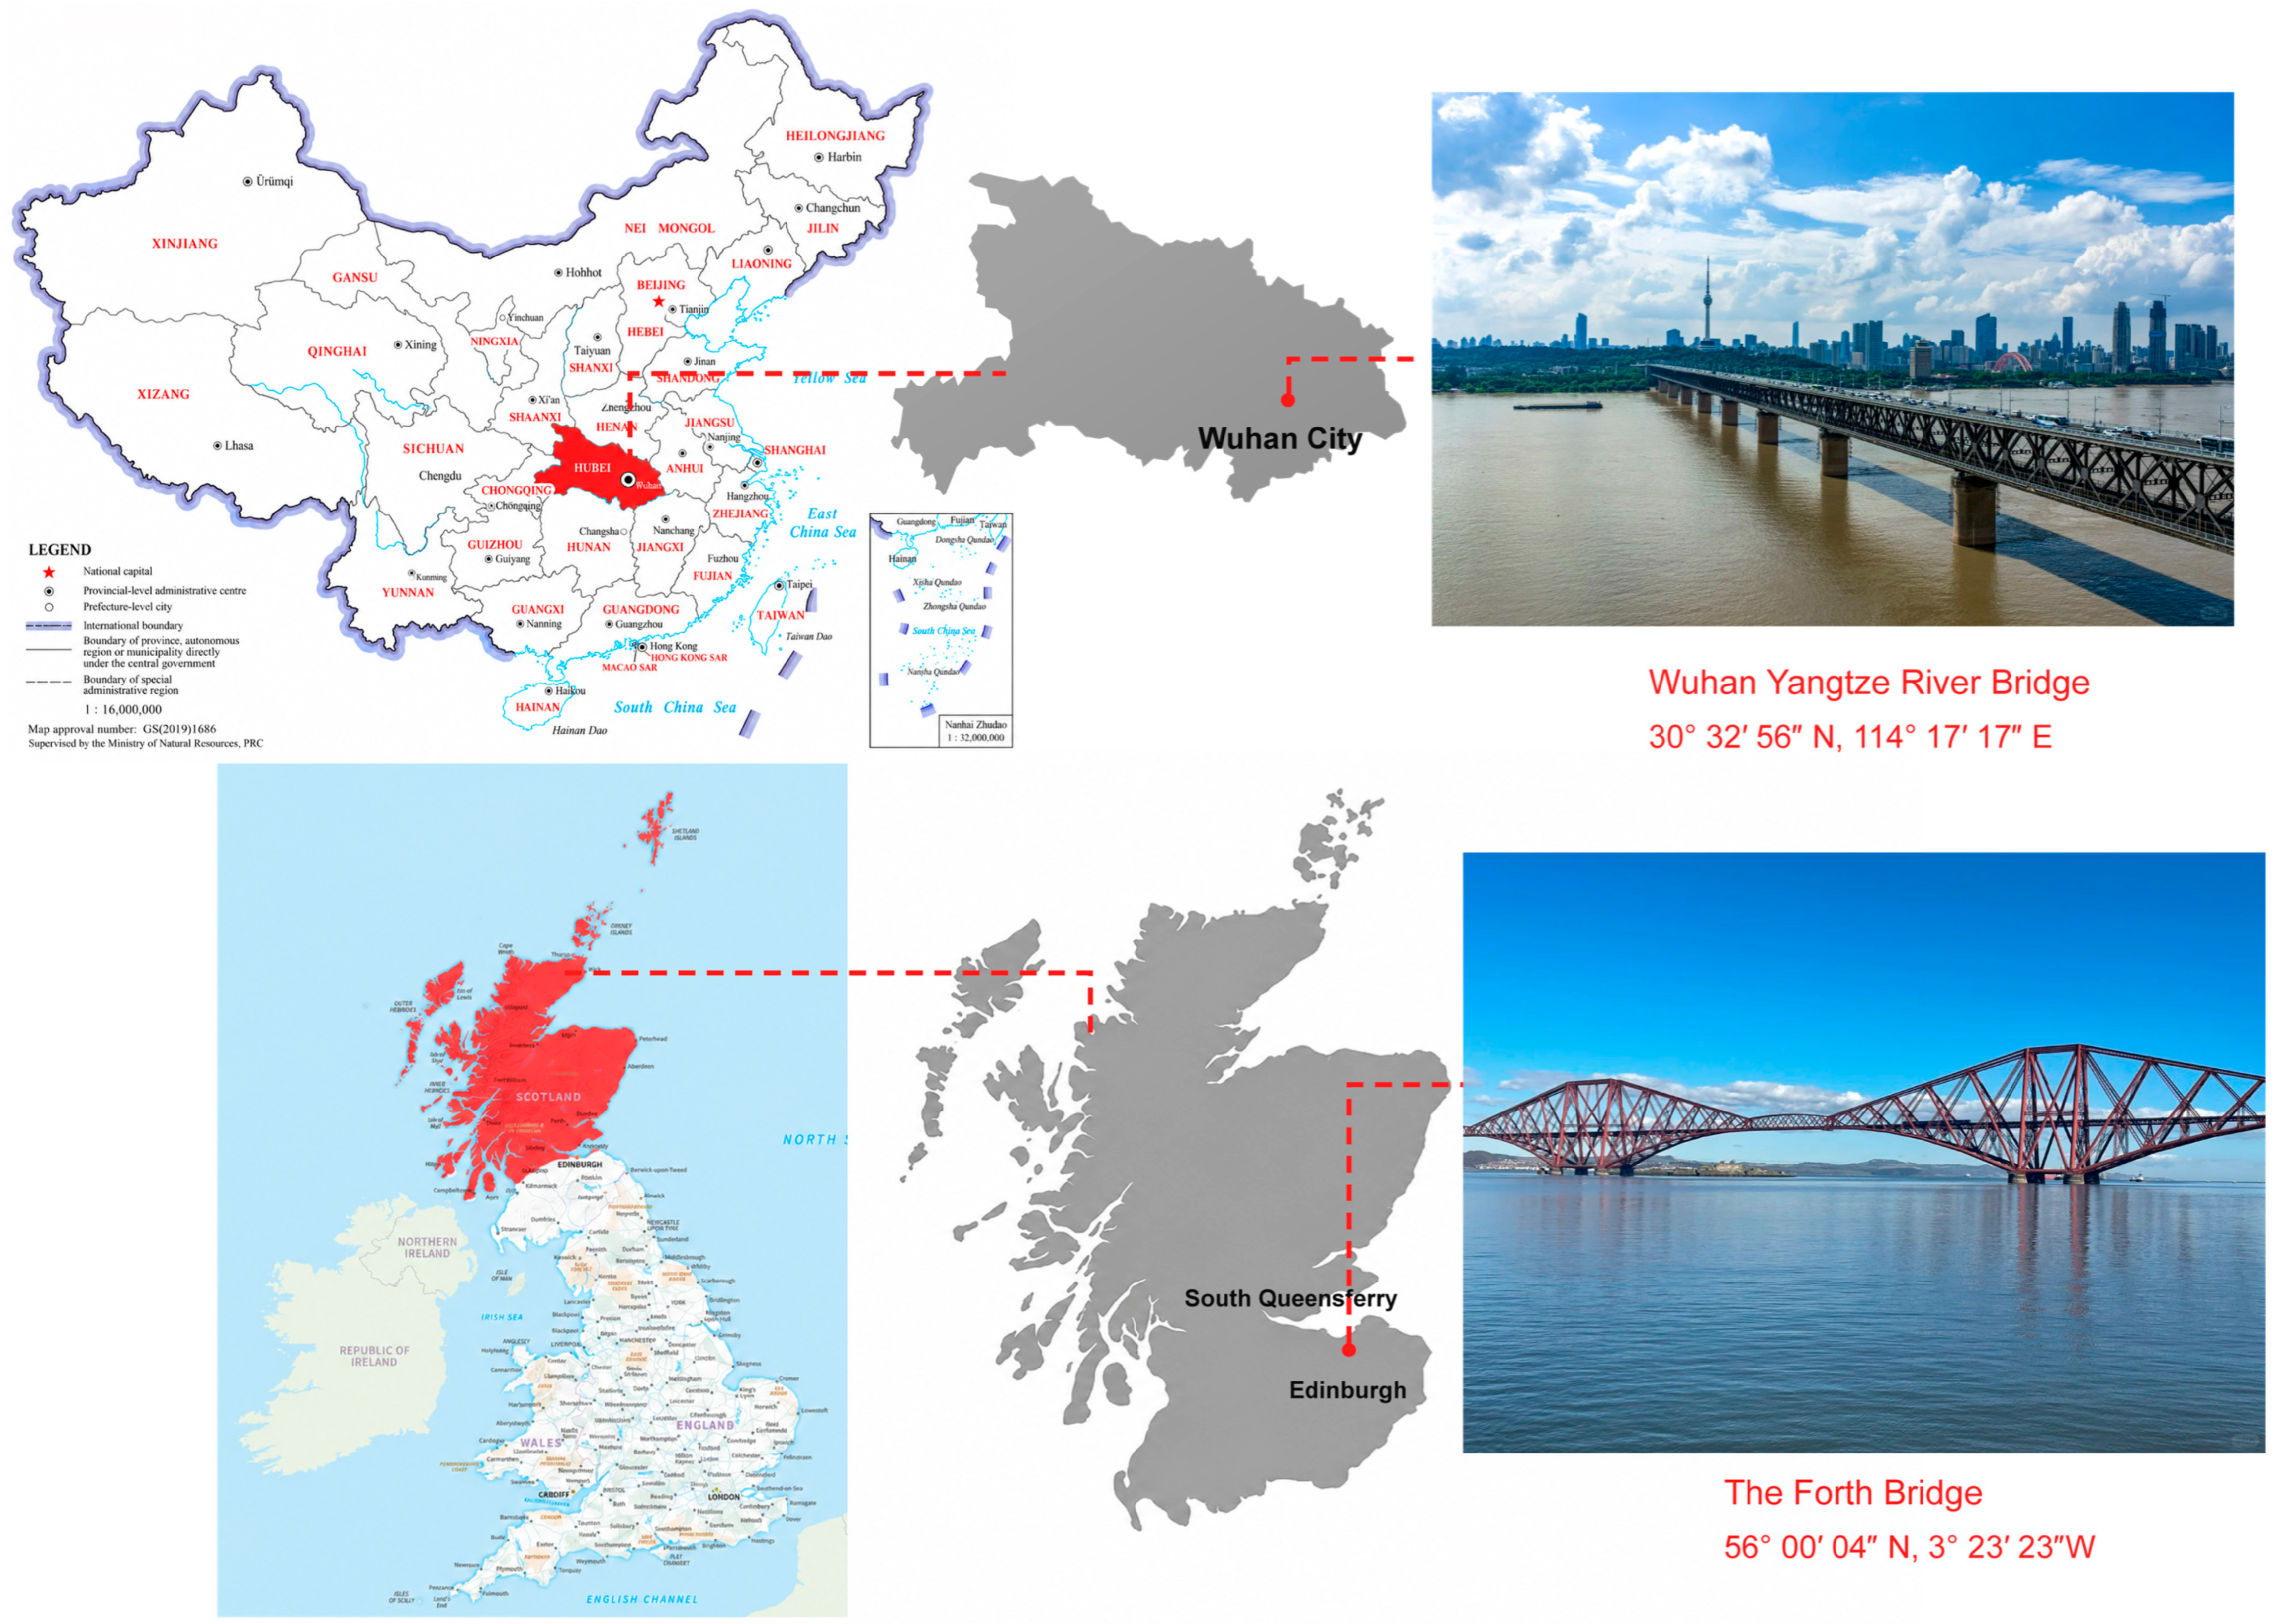
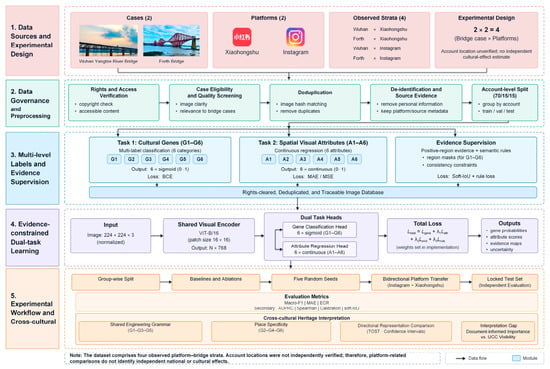
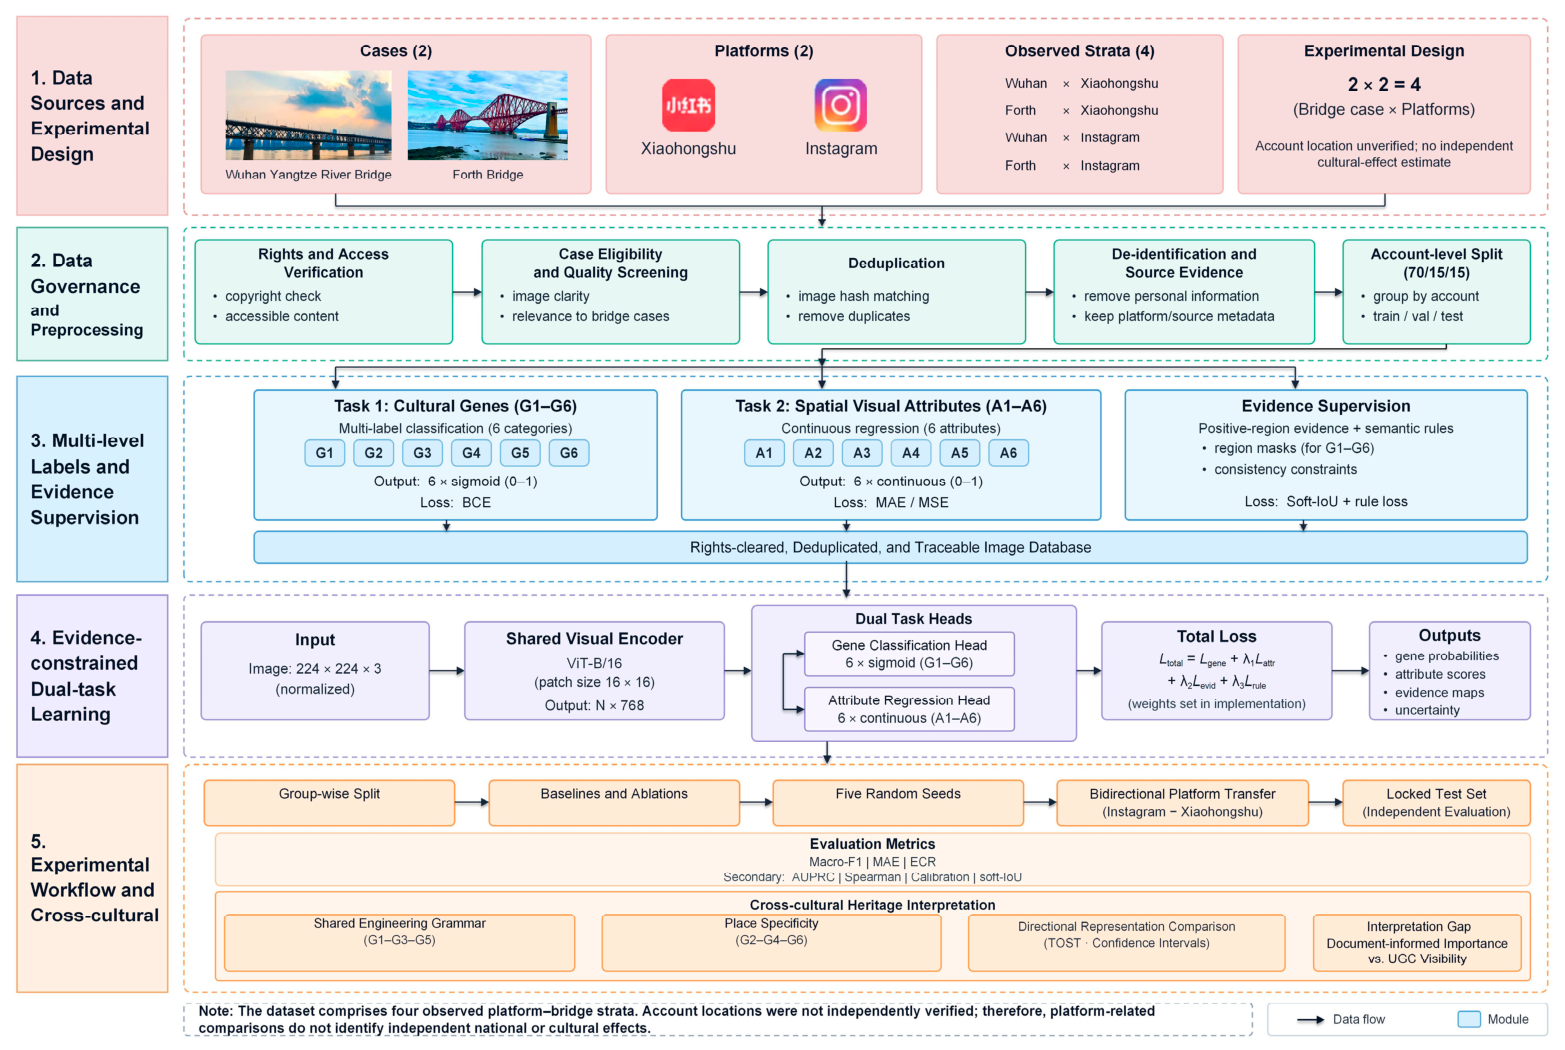
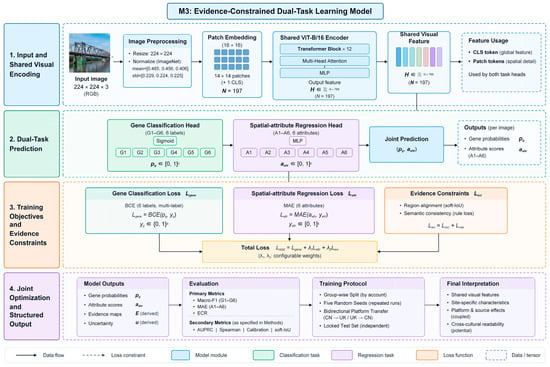
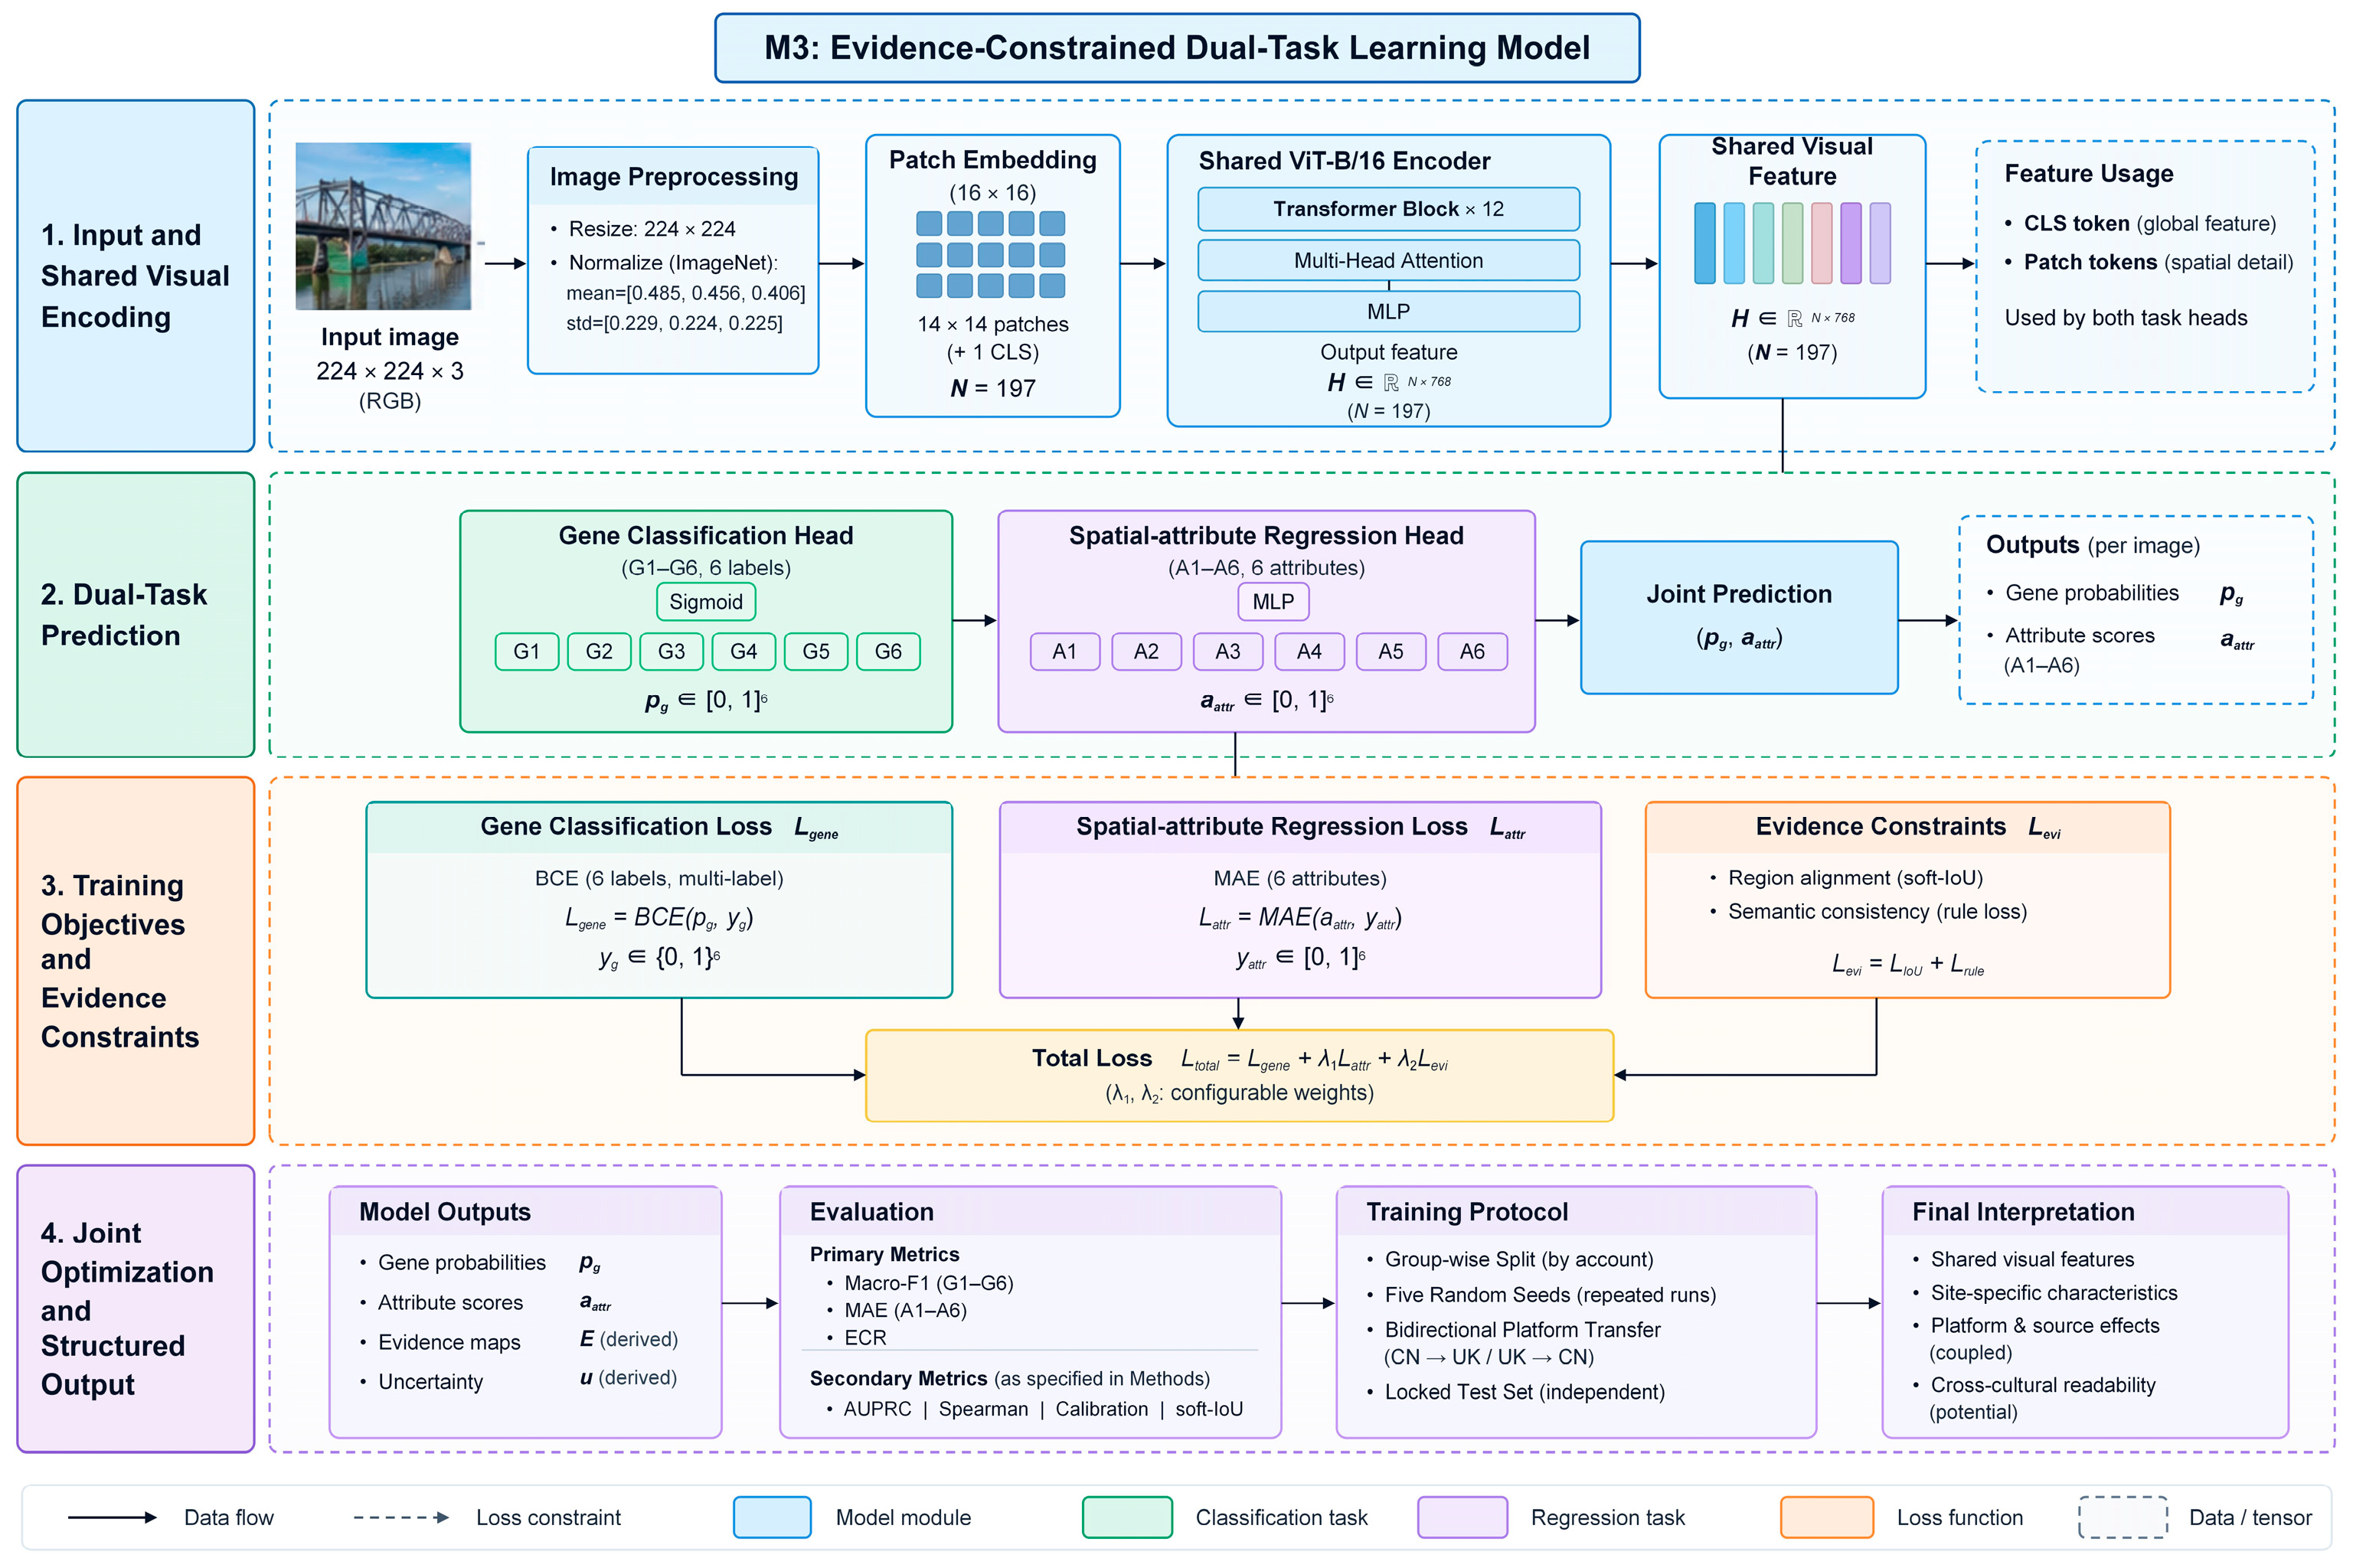


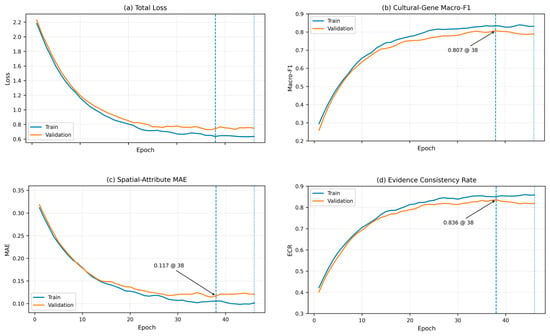
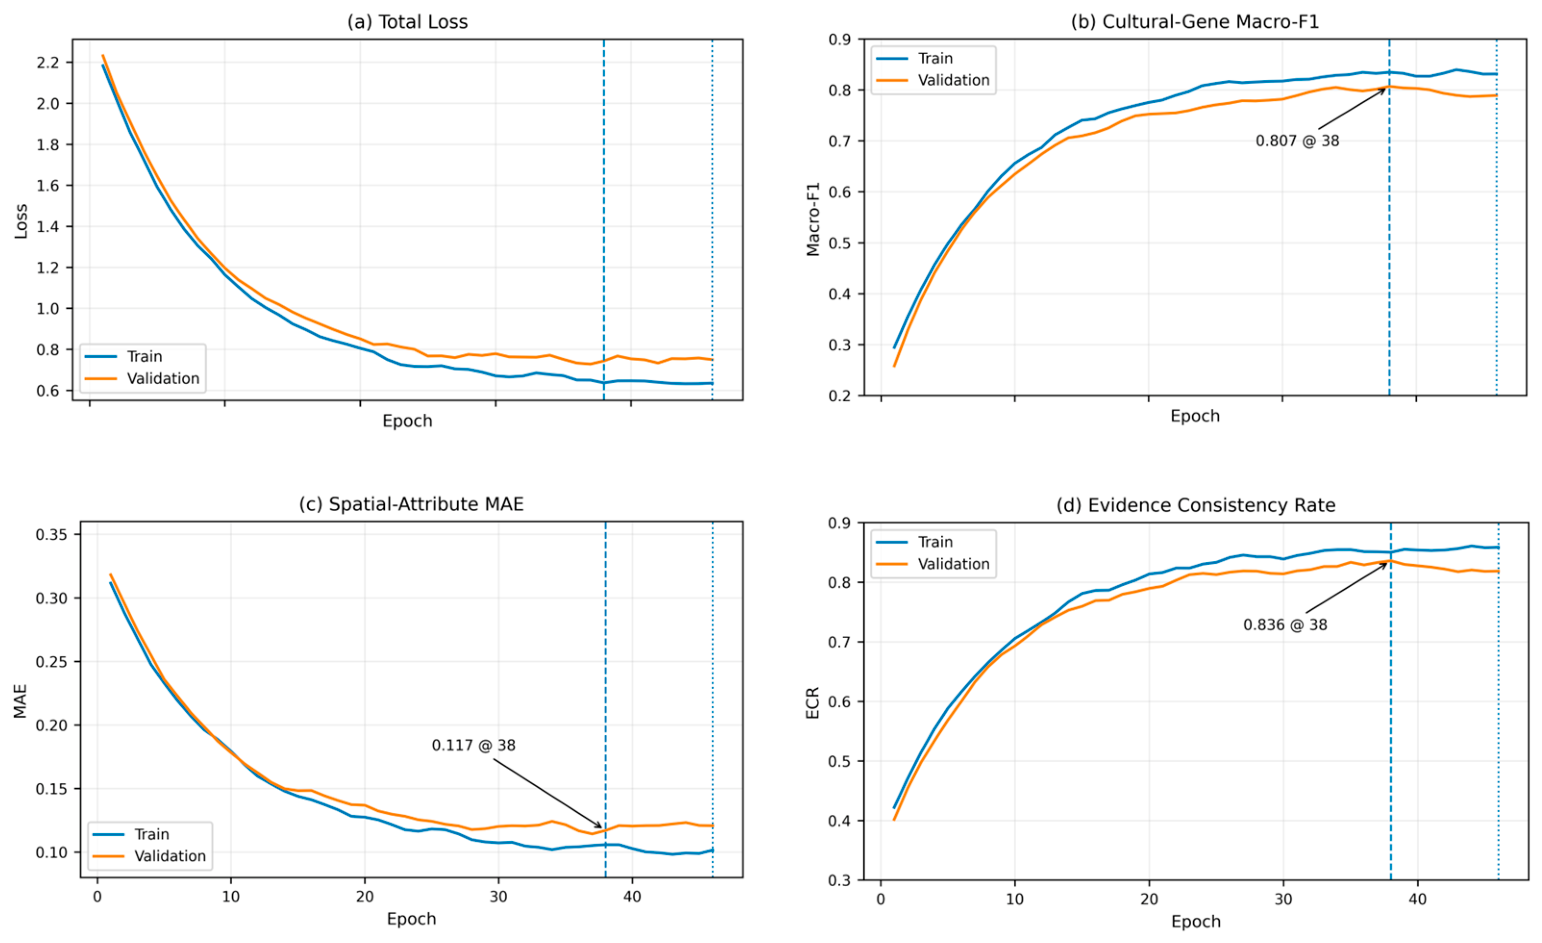
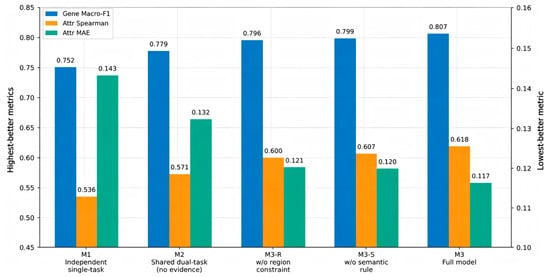
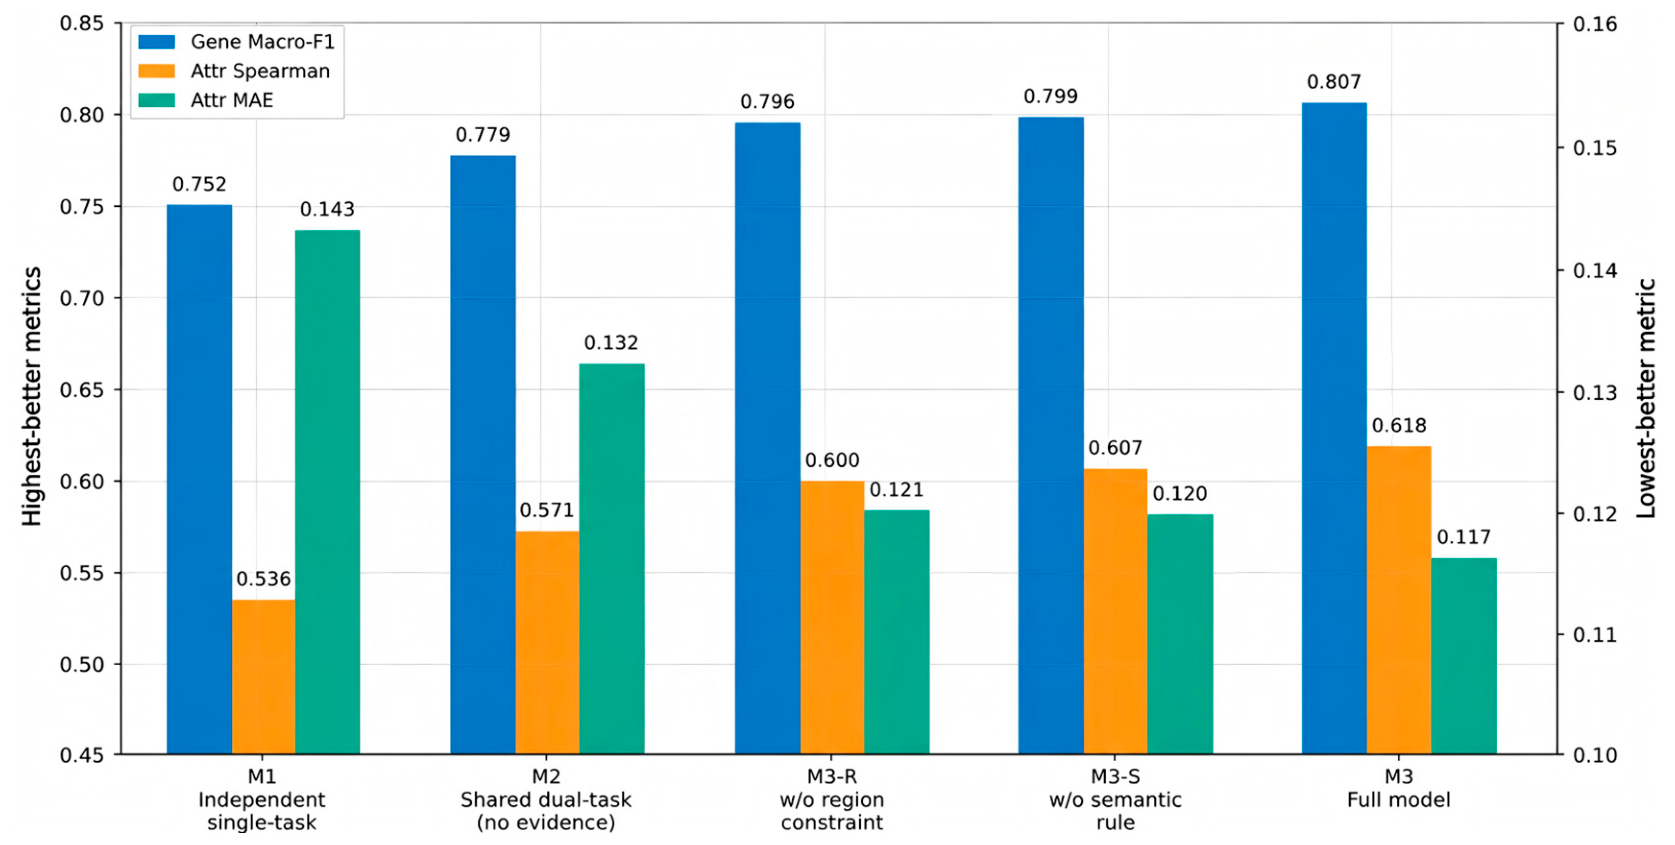
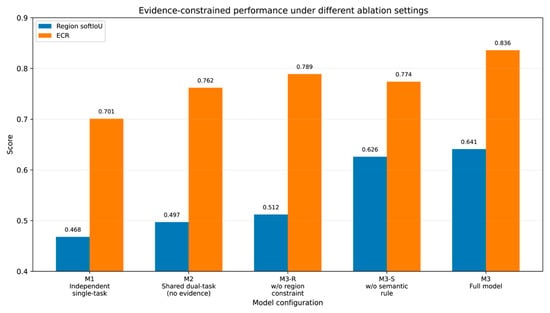
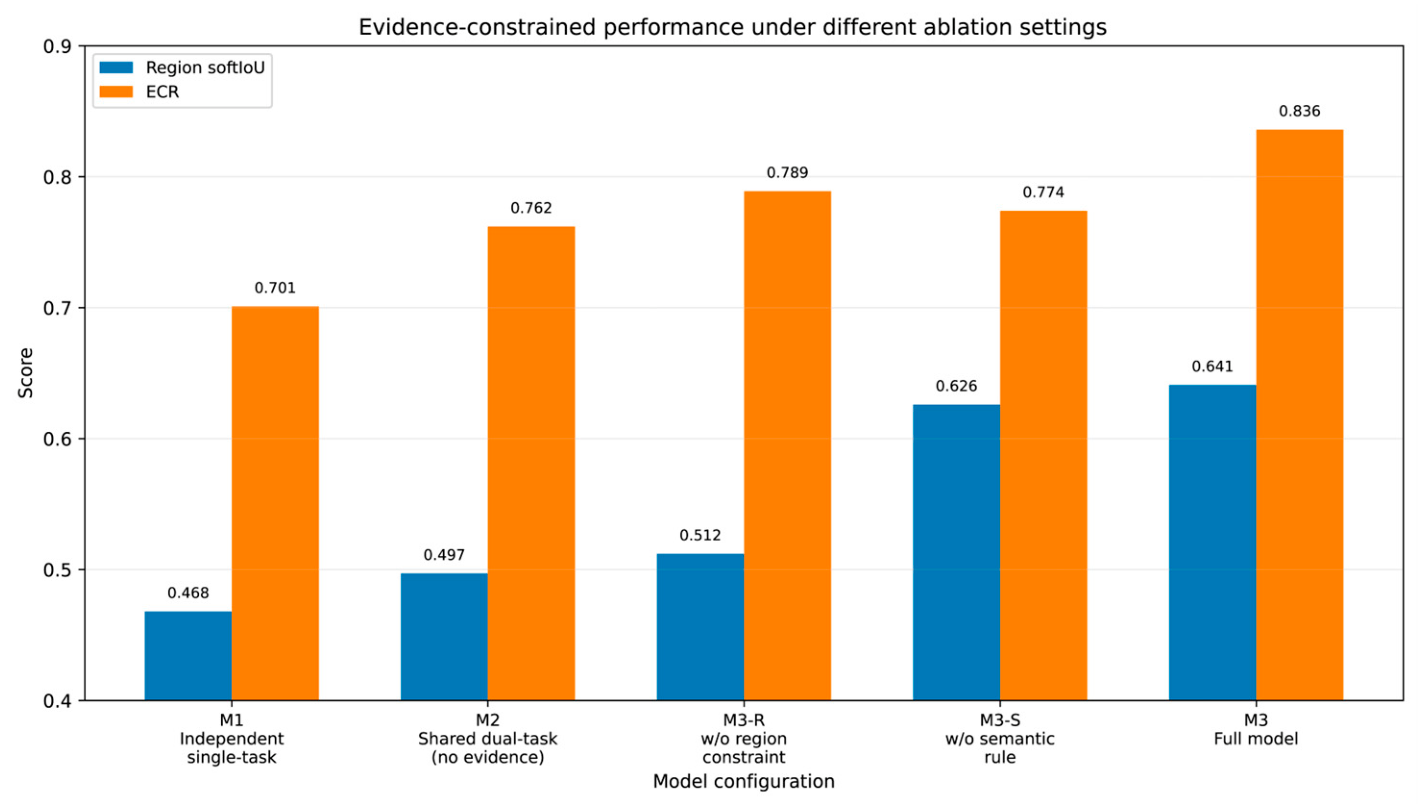
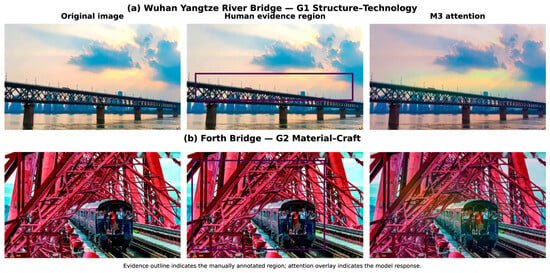
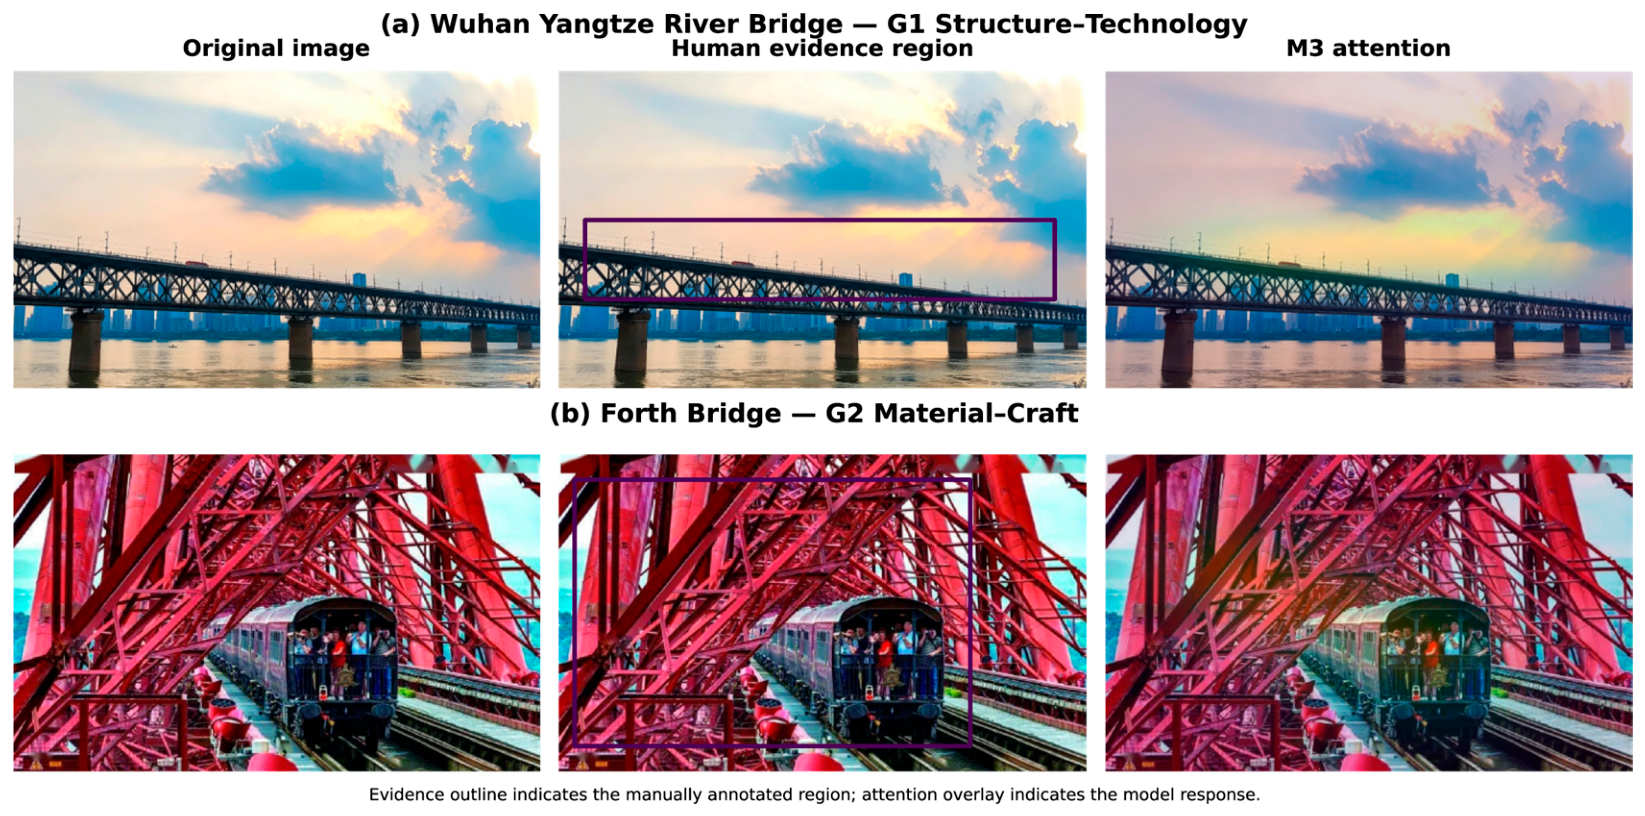
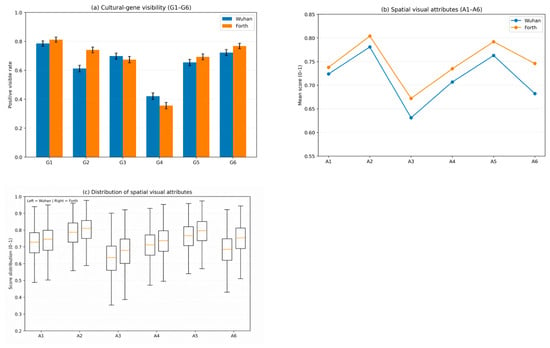
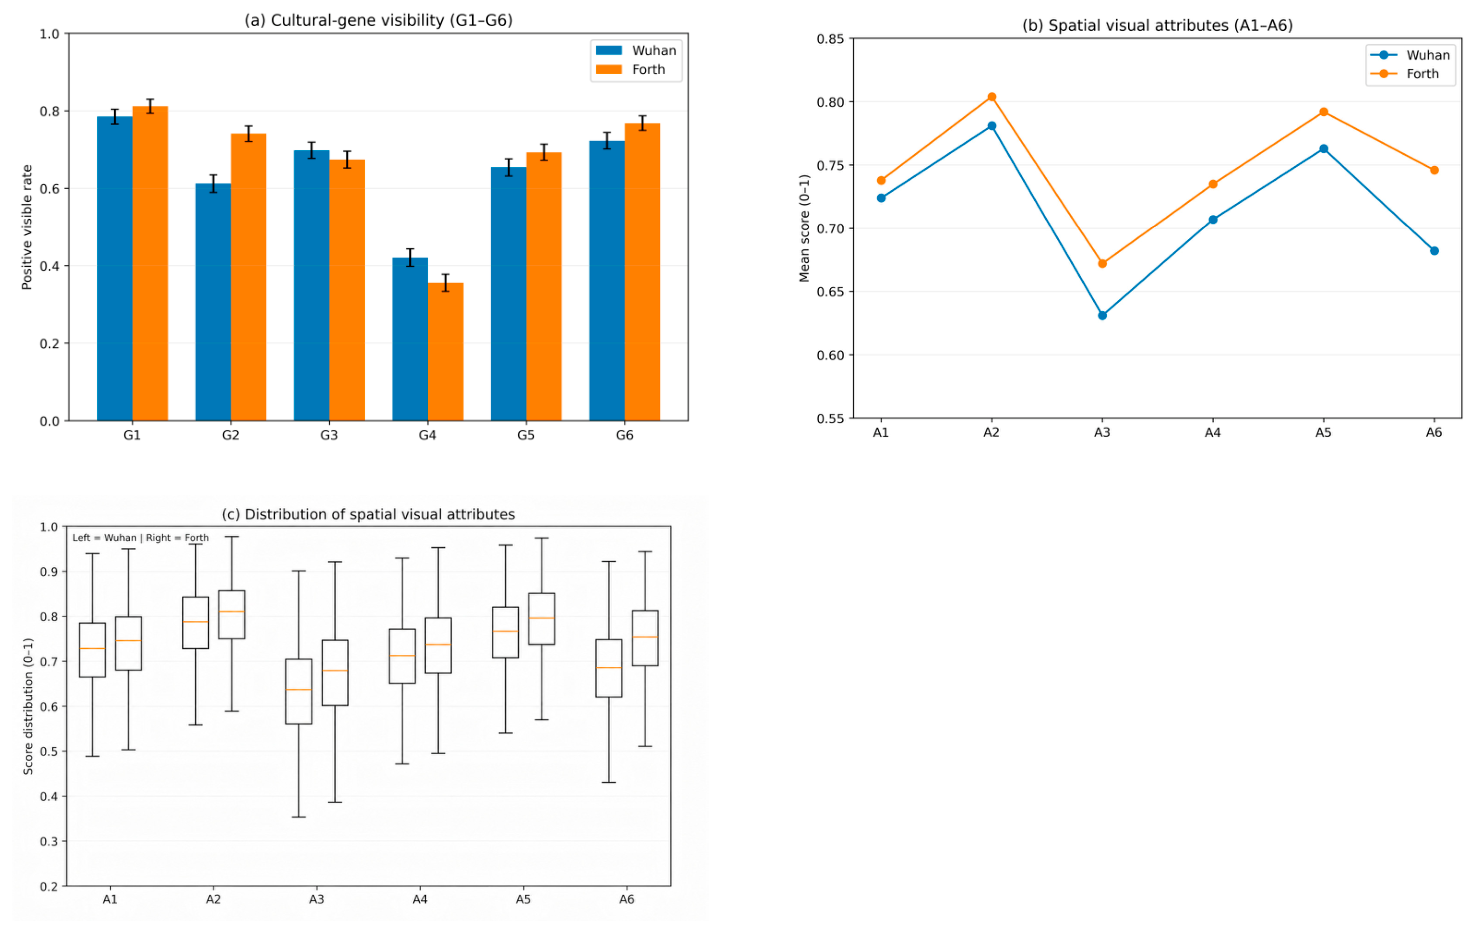
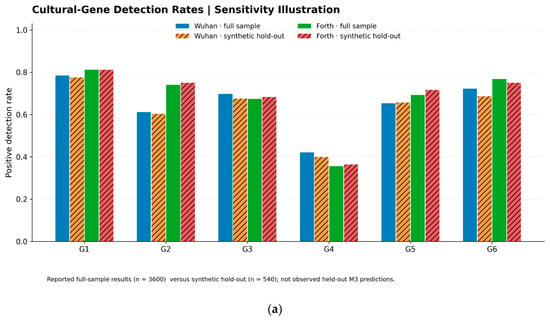
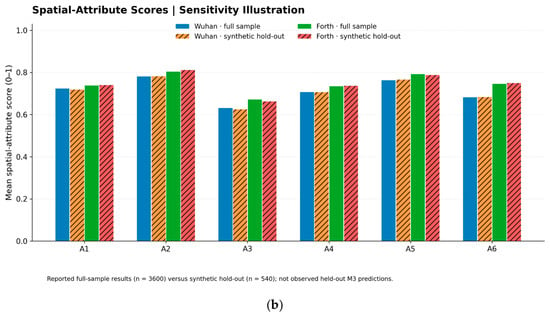
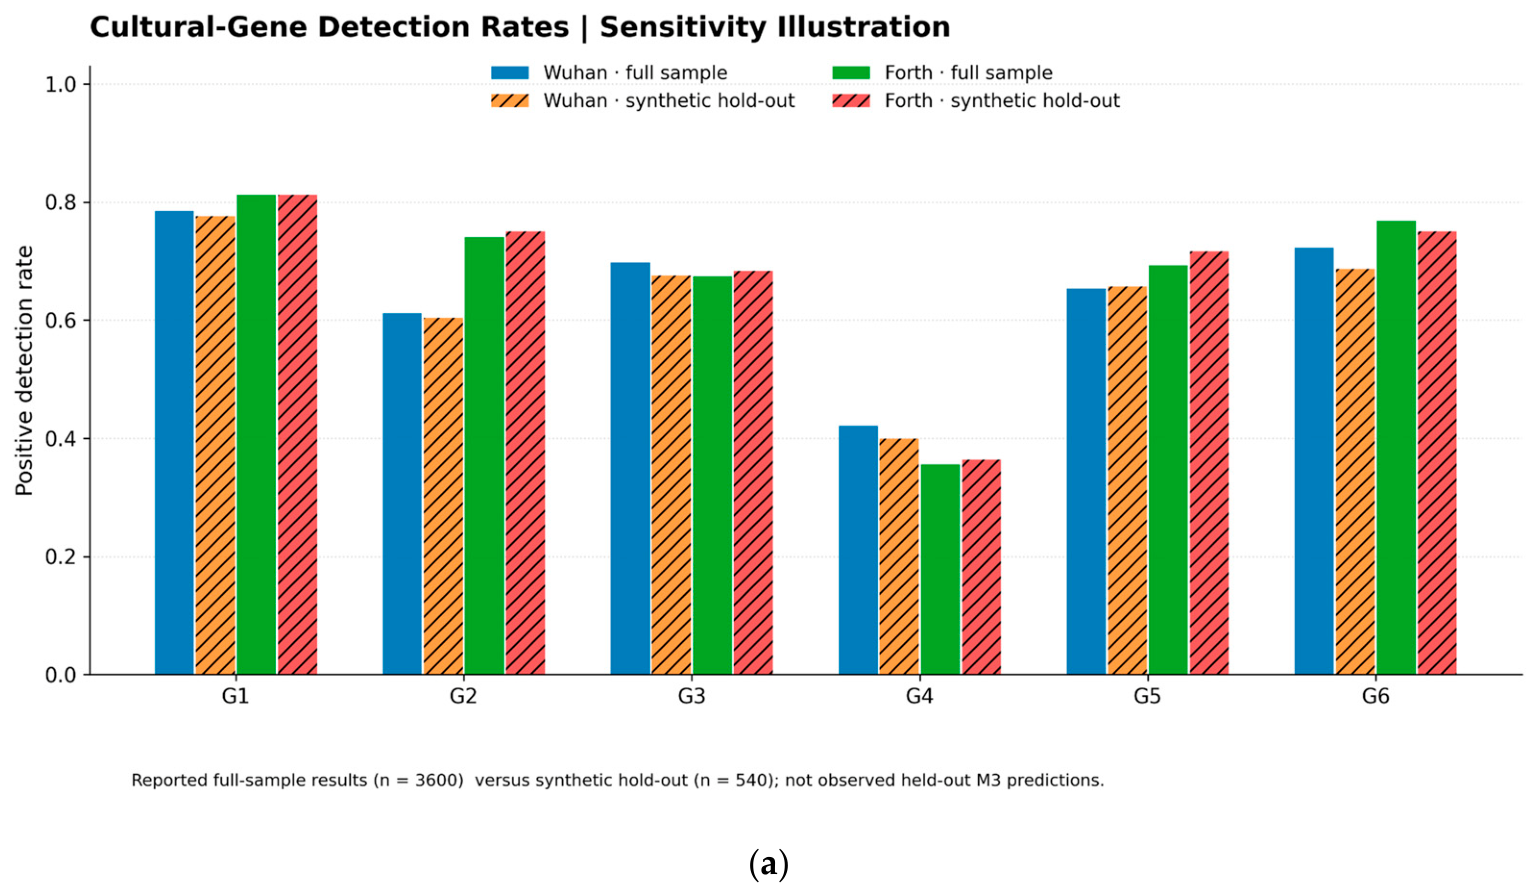
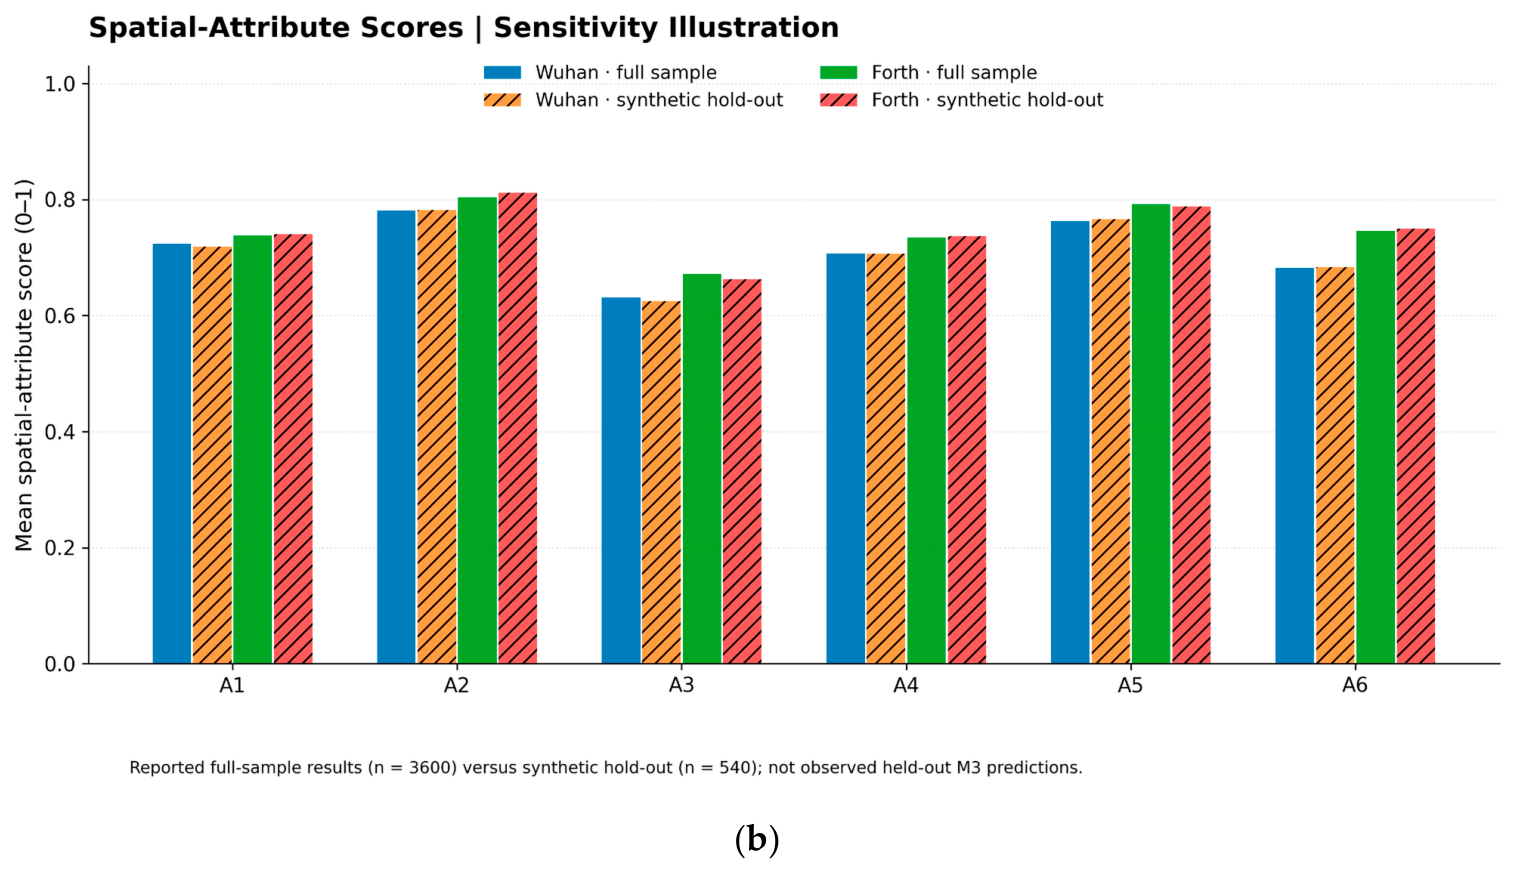
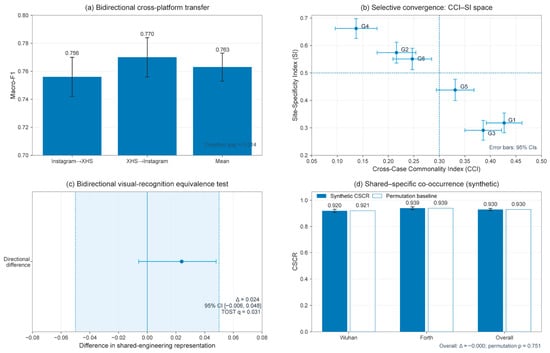
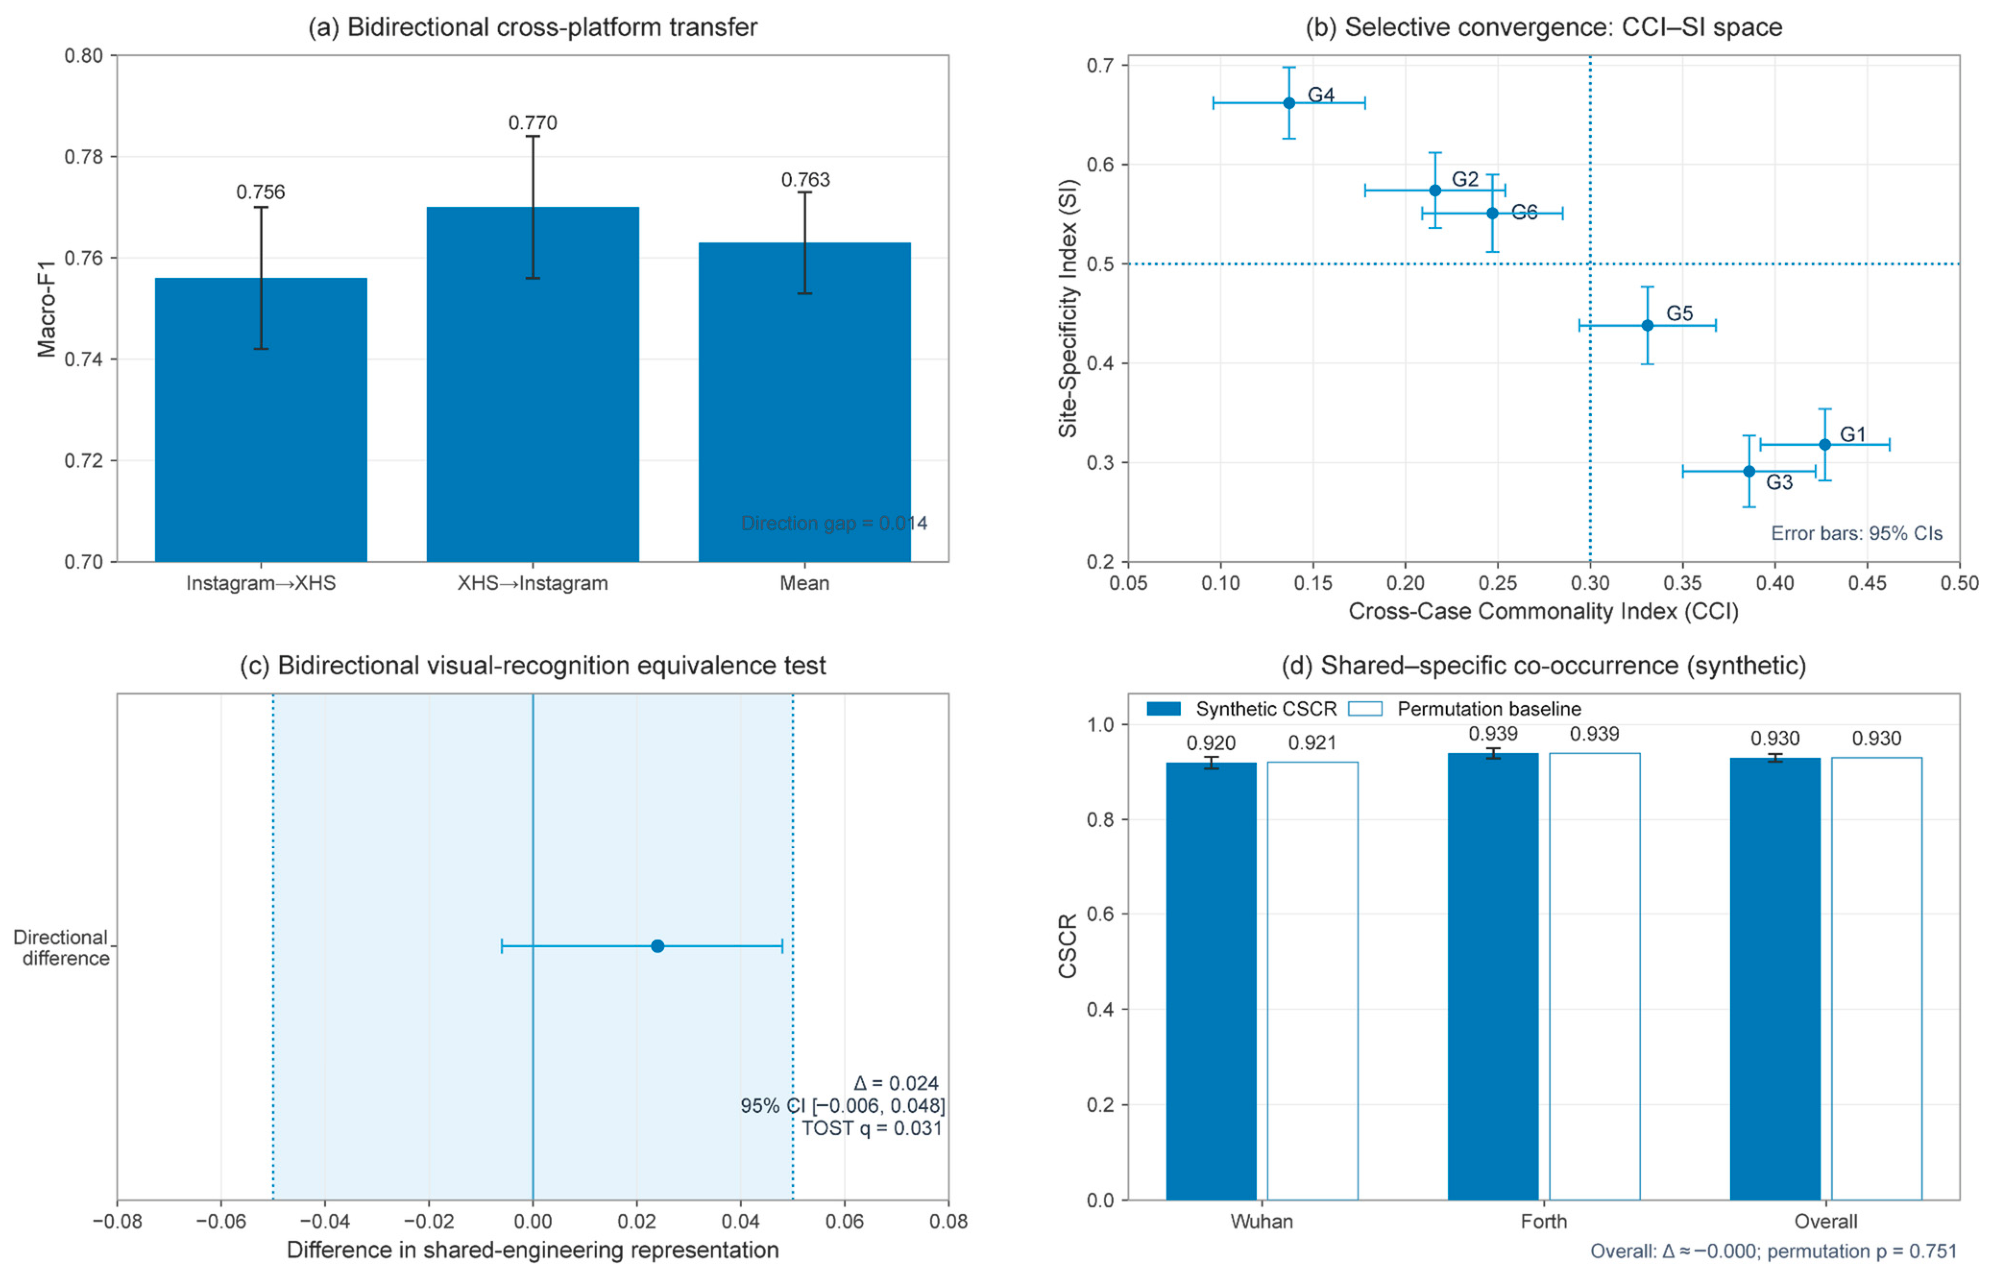
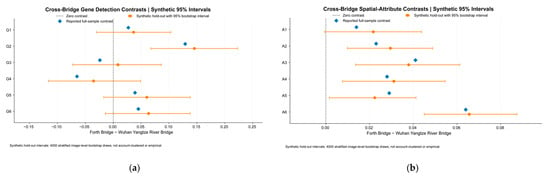
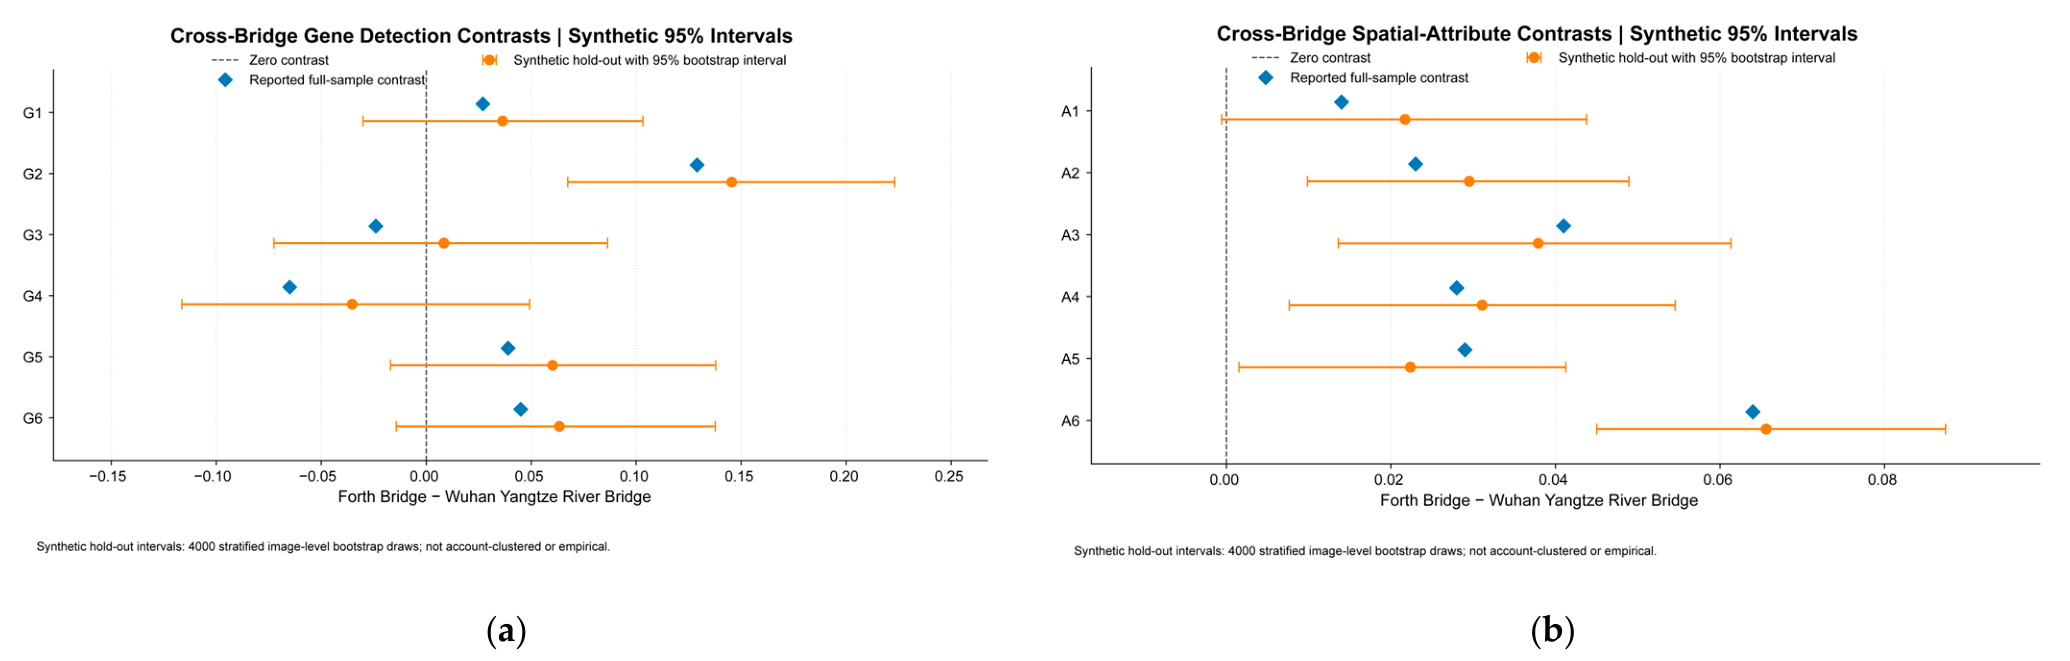
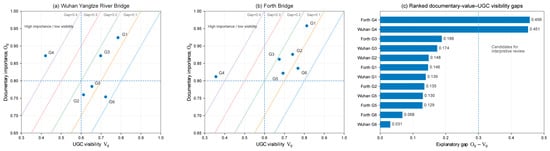
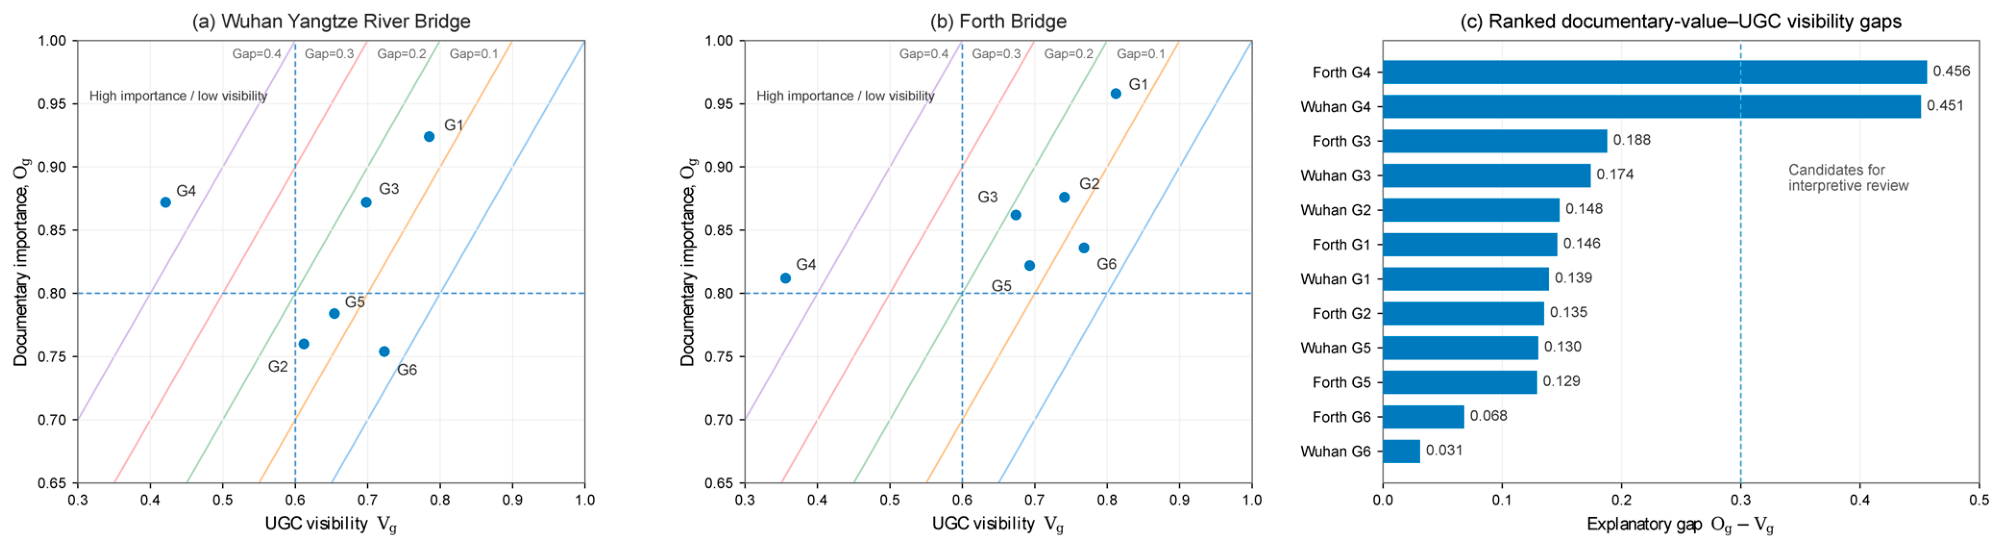


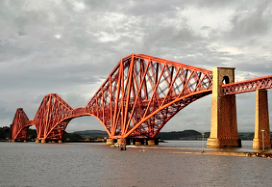

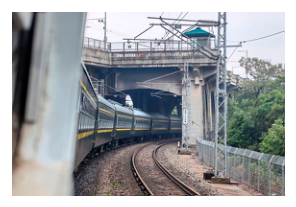

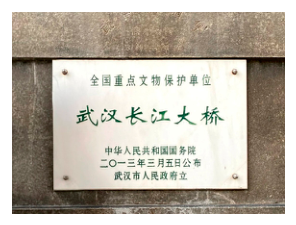
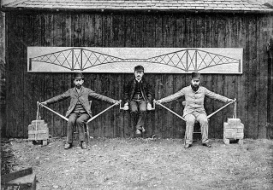
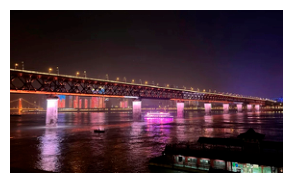




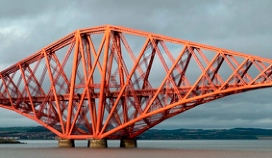

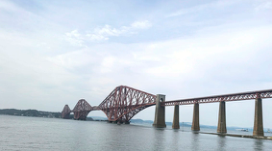
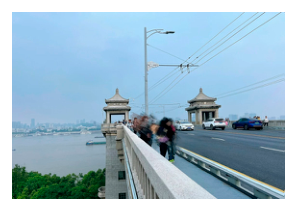
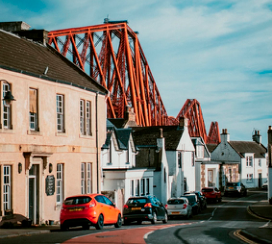
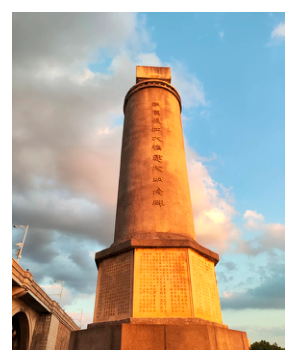





Disclaimer/Publisher’s Note: The statements, opinions and data contained in all publications are solely those of the individual author(s) and contributor(s) and not of MDPI and/or the editor(s). MDPI and/or the editor(s) disclaim responsibility for any injury to people or property resulting from any ideas, methods, instructions or products referred to in the content. |
© 2026 by the authors. Licensee MDPI, Basel, Switzerland. This article is an open access article distributed under the terms and conditions of the Creative Commons Attribution (CC BY) license.