


Abstract
Professional service robots are being deployed into interior environments dimensioned around the human body, yet no framework relates their physical envelopes to architectural parameters. This paper introduces robopometry—the systematic study of robot dimensions in relation to the built environment—as a conceptual framework bridging construction automation, interior architecture, and human–robot coexistence and illustrates it with a source-verified dimensional characterisation of 36 commercially deployed platforms. Width ranges from 275 to 1025 mm, height from 300 to 1780 mm, and weight from 5.5 to 748 kg, the last spanning 2.13 orders of magnitude (). Weight differs significantly across functional categories (Kruskal–Wallis , ); width and height are not distinguishable at this sample size. All three parameters are positively correlated, most strongly width with weight (, ). A common deployment zone (CDZ) spans 384–630 mm in width and 1046–1520 mm in height. It was derived by density-based clustering and confirmed by an independently fitted Gaussian mixture with identical membership. The zone contains 47% of the sample, with a width CV of 12.2% against 30.9% for the sample as a whole. Its upper width bound is invariant across the clustering parameters tested and under leave-one-out resampling. However, the zone is not recovered when hospitality delivery platforms are excluded, as they supply ten of its seventeen members. Fourteen candidate platforms were excluded because they failed the screening criteria or because no verifiable dimensional specification is published—a reporting gap that is itself an obstacle to robot-inclusive design. Sixteen design guidelines are proposed on the basis of the CDZ envelope and are compared against documented deployment conflicts reported in the literature.
1. Introduction
The global professional service robot market has entered sustained expansion, with the International Federation of Robotics reporting approximately 200,000 units sold in 2024—a nine percent year-over-year increase [1]. Transportation and logistics robots accounted for 102,900 units, hospitality robots for 42,000, cleaning robots for 25,000 (a 34% increase), and medical robots for 16,700 (a 91% increase). The robot-as-a-service (RaaS) fleet model expanded by 31%. Projections indicate that the market will exceed USD 98 billion by 2029 [2]. These machines are being introduced into interior spaces that were originally dimensioned around the human body, and their dimensions vary enormously—from a 5.5 kg humanoid social robot measuring 275 mm in width to a 748 kg industrial autonomous scrubber spanning 938 mm (Table 1; manufacturer sources [3,4,5,6,7]). Such robots now operate in corridors, lobbies, dining rooms, hospital wards, and retail floors that were designed and constructed exclusively for human occupancy, which raises fundamental questions about the dimensional compatibility between these machines and the architectural elements they must navigate.
Despite this deployment, a fundamental disciplinary gap exists: there is no unified framework for systematically analysing how the physical dimensions of service robots interact with interior architectural elements. Research in human–robot interaction has examined proxemic distances [8,9] and social acceptance [10] but not the dimensional interface between robot bodies and building components. Safety standards (ISO 13482:2014 [11]; ISO 3691-4 [12]) address operational safety rather than dimensional compatibility. Building codes such as the ADA Accessibility Guidelines [13] and the International Building Code (IBC) [14] establish minimum spatial dimensions for human accessibility but do not account for robotic co-occupants. The dimensional ranges of service robots differ fundamentally from those of the human body and the mobility aids that accessibility standards address: an industrial floor scrubber at 938 mm width exceeds the body width of even the largest powered wheelchair, while a 748 kg cleaning robot imposes point loads that approach the design limits of standard raised-floor systems. Prior work on robot-inclusive spaces has proposed design principles for residential environments [15] but has not extended to a systematic dimensional framework. This gap falls at the intersection of construction engineering, interior architecture, facilities management, robotics, and human factors, without being fully addressed by any single discipline.
This paper proposes robopometry as a systematic analytical framework, defined as the systematic study of the physical dimensions, proportions, volumetric envelopes, and spatial requirements of service robots as they relate to human-occupied interior built environments. The term combines robo- (from robota, labour [16]) with -pometry (from metron, measure, paralleling anthropometry [17]). The primary contribution is the framework itself and the design guidance derived from it; the dimensional survey reported here serves to demonstrate and calibrate the framework rather than to provide a definitive census of the robot population. The research objectives are fourfold: (1) to establish the conceptual foundation for robopometry; (2) to provide a source-verified dimensional characterisation of commercially deployed professional service robots; (3) to conduct an exploratory statistical analysis of the resulting dataset, including distributional properties, inter-category differences, and correlational structures; and (4) to derive sixteen design propositions for interior spaces in which professional service robots operate.
The novelty of the approach lies in three specific moves, each of which distinguishes it from the robot-inclusive spaces literature reviewed in Section 2.2. The first is a systematic, source-verified dimensional characterisation of a defined population of commercially deployed platforms, where that literature has proceeded from single-platform case studies. The second is the identification of a common deployment zone. This is an empirically bounded envelope that contains a substantial proportion of the human-proximate platforms. This zone converts a heterogeneous population into a single design target. The third is a tiered set of dimensional propositions, given as numerical values that can be written into a design brief. The earlier frameworks provide qualitative design principles or index-based performance metrics, and these metrics require dimensional inputs that the frameworks themselves do not provide. Section 5.5 sets out this relationship in full.
The need for such a framework is underscored by the practical consequences of dimensional incompatibility. Each of the following cases is documented in the deployment literature and is not hypothesised here. In hospitals, corridor congestion and lift-lobby bottlenecks are among the most frequently reported causes of delivery-robot failure. One field study logged 107 human interventions across a cobot deployment, of which 72 concerned lift ingress and egress and 20 concerned passage through doorways [18]. Another study attributed eight of fourteen delivery failures to passengers and doorway-adjacent cargo that reduced the lateral clearance available to the platform [19]. A third study identified narrow hallways and the lack of any programmatic interface to lifts and doors as the main obstacles to fleet operation [20]. In hospitality and food service, raised thresholds and changes in floor level are a routine screening criterion before deployment. Stairs, plateaux and high doorsteps require building work before a platform can be installed [21]. In aged care, accommodating a robot fleet required corridor widening, door automation, lift upgrading and the construction of dedicated charging bays as physical retrofit works [22]. These scenarios, which are becoming increasingly common as deployment scales, motivate the development of a systematic dimensional analysis framework that can prevent such conflicts at the design stage rather than remediate them after deployment.
2. Literature Review and Theoretical Context
2.1. Anthropometric Foundations and Human–Robot Spatial Interaction
Anthropometry has provided the dimensional foundation for architectural design for over a century. Dreyfuss [17] and Tilley [23] codified human body dimensions into standards for doorways, corridors, and workstations. Building codes worldwide mandate minimum corridor widths (1118–1220 mm [14]), door clear widths (813 mm under the ADA, Section 404.2.3 [13]), and elevator cab dimensions [24]. The universal design movement extended anthropometric thinking to accommodate the full range of human physical variation, including mobility aids [25]. The introduction of autonomous robotic co-occupants, however, represents a qualitatively different spatial challenge that existing anthropometric frameworks do not address. Where anthropometry provides the dimensional foundation for designing spaces around the human body, no corresponding discipline provides the foundation for designing spaces that accommodate robotic occupants alongside human users.
Research on human–robot spatial interaction has expanded significantly. Takayama and Pantofaru [8] demonstrated that people maintain greater personal distances from larger robots. Mumm and Mutlu [9] found that physical proximity preferences in human–robot interaction are mediated by perceived likeability and familiarity, with people accepting closer distances from robots they perceived positively. Mead and Matarić [26] developed computational models of human–robot proxemics for socially assistive robots. Rios-Martinez et al. [27] provided a comprehensive survey of proxemic models for robot navigation, synthesising approaches from sociology, cognitive science, and robotics into computational frameworks for socially aware path planning. These studies establish that robot size directly influences human spatial behaviour, but they address the perception of space rather than the physical dimensional interface between robot bodies and architectural elements. No study has systematically quantified how the range of robot dimensions interacts with standard architectural parameters.
2.2. Robot-Inclusive Spaces
The concept of robot-inclusive spaces (RIS) provides the closest antecedent to the robopometric framework proposed here. A foundational study using a Roomba cleaning robot inductively derived four design principles—observability, accessibility, activity, and safety—for interior environments in which robots operate [15]. A subsequent framework introduced the Robot Space Index (RSI) and Robot Complexity Index (RCI) as quantitative metrics linking space design to robot performance, finding that well-designed robot-inclusive spaces enable less complex robots to achieve functionality similar to that of more complex robots operating in poorly adapted spaces [28]. This insight has direct economic implications: optimising spatial design reduces the technological complexity, and therefore the cost, of the robot systems required for successful deployment. Research on reconfigurable cleaning robots has further demonstrated that spatial coverage performance is directly determined by the match between robot morphology and environmental geometry [29].
The present study extends the RIS framework in two respects. First, it provides a dimensional characterisation across seven functional categories—the kind of empirical grounding that robot-inclusive design principles require for implementation. Second, whereas the RIS literature addresses the question “how should spaces be designed for robots?” from a general design perspective, robopometry addresses the prior question “what are the dimensional characteristics of the robot population that spaces must accommodate?” Section 5.5 states this relationship explicitly, setting the robopometric framework against the antecedent frameworks on which it builds.
2.3. Theoretical Foundations
The robopometric framework draws on affordance theory, which originates in Gibson’s ecological psychology [30]. It provides the conceptual lens through which robot–building dimensional compatibility can be understood. Gibson defined affordances as the action possibilities that an environment offers to an agent, determined by the relationship between the agent’s physical properties and the environment’s structural features. A doorway affords passage to an agent whose width does not exceed the clear opening; a floor surface affords traversal to an agent whose weight does not exceed the structural load capacity. Norman [31] extended the affordance concept to design, arguing that designed objects and environments should make their affordances perceptible. Maier, Fadel, and Battisto [32] applied affordance-based reasoning directly to architectural theory and practice, demonstrating that the affordance framework enables systematic analysis of the relationship between building elements and user capabilities. In the robopometric context, each architectural element—a corridor, a doorway, an elevator cab—affords or constrains robotic passage according to the dimensional relationship between the robot’s physical envelope and the element’s spatial parameters. The robopometric framework formalises this relationship by supplying the empirical dimensional data that affordance-based design requires: without knowing the dimensional distribution of the robot population, designers cannot evaluate what their buildings afford to robotic occupants.
This study is not framed as design science research. That methodology requires the constructed artefact to be evaluated against the problem it was designed to solve, and no such evaluation is performed here. Invoking design science research without completing its evaluative step would therefore misdescribe what this study does. The propositions derived in Section 6 are offered for validation and have not yet been validated (Section 6.6). Affordance theory alone provides the theoretical basis that the framework requires. It explains why dimensional compatibility is the right object of study and what must be known about a building before its affordances for a robotic occupant can be evaluated.
2.4. Construction Automation and Safety Standards
Within construction automation, Bock and Linner [33] proposed robot-oriented design for construction and maintenance. Pan et al. [34] developed an integrated scenario approach for structuring the context of construction robot development, identifying the technological and organisational conditions that shape adoption. Ohueri et al. [35] examined human–robot collaboration for building deconstruction, emphasising the need for comprehensive design frameworks that support safe and efficient human–robot coexistence in built environments. Safety standards including ISO 13482:2014 [11] and UL 3300 [36] address operational safety parameters but do not prescribe dimensional compatibility requirements. These studies focus predominantly on construction-phase robots or on general safety frameworks, rather than providing the dimensional analysis of operational service robots that facility designers and construction professionals require. While a multidimensional taxonomy for human–robot interaction in construction has recently been proposed on the basis of literature synthesis [37], no comparable dimensional framework has been established across robot categories using verified specification data, and no design guidelines have been derived from robot dimensional data.
2.5. Positioning Accuracy in Construction and the Built Environment
The dimensional compatibility of a robot with a building depends not only on the platform’s envelope, but also on how accurately it can be placed within that envelope. A platform that occupies 630 mm but may be anywhere within ±200 mm of its intended line requires a much wider corridor than one held to ±25 mm. Accuracy is therefore a dimensional parameter in its own right, and this section establishes what the literature reports.
Accuracy relative to manual methods: Where paired comparisons exist, robotic execution is generally more accurate than the manual practice it replaces. Brosque and Fischer [38] evaluated ten construction robots on live projects. They report that drilling accuracy improved from 6.35 mm manually to 3.17 mm robotically, layout point placement from a 50 mm traditional tolerance to 15 mm with 1.5 mm repeatability, and roof inspection from 300 mm to 30 mm. Kam et al. [39] compared robotic and traditional layout on an eight-storey medical office building and report robot layout achieving 1.6 mm against a manual requirement of 3.2 mm. Wu et al. [40] report an on-site measuring robot agreeing with manual instruments to within 1 mm on alignment, evenness and corner angle across two building projects. These figures should be read with care. In several cases the manual value is a specified tolerance and not a measured deviation, and the authors of [39] state explicitly that manual deviations were not measured on their project.
Accuracy of navigation, as distinct from task execution: The figures above describe accuracy at a stationary work point, achieved with external referencing. Navigation accuracy, that is, how well the platform knows its position while it moves, is a different and much weaker quantity. Yarovoi and Cho [41] evaluated open-source simultaneous localisation and mapping (SLAM) algorithms on a construction dataset. Only one of the algorithms tested maintained tracking across all sequences, with translational root-mean-square errors of 95 to 311 mm. The others accumulated errors of the order of metres and repeatedly lost tracking. Reducing the sensor update rate from 10 Hz to 2 Hz degraded the best performer from 311 mm to complete failure. Nair et al. [42] report a benchmark challenge conducted on two real construction sites. The best entries achieved a trajectory error of 33 to 51 mm in single-session operation, and this error increased to approximately 300 mm across sessions. Husemann et al. [43] deployed a building-information-model-referenced platform in an occupied three-room building and achieved end-task positioning of only 200 to 500 mm.
Computer vision and positioning systems: The spread above is governed mainly by the sensing and referencing strategy, not by the platform itself. Where external infrastructure is available, accuracy is high. Laser-tracker referencing achieves 5 mm waypoint repeatability over a 30 m radius [44], and guided platforms following predefined paths deviate by a maximum of approximately ±25 mm [45]. Fiducial markers offer a low-cost form of the same external referencing. Kallwies et al. [46] reduced the median corner-localisation error of AprilTag detection from 0.17 to 0.017 pixels by refining the tag edges. Abbas et al. [47] showed that the resulting pose error depends mainly on the viewing angle. At a target distance of 70 cm, their corrections reduced the error along the x-axis from 4.4 cm to 0.8 cm, and at a strongly oblique viewing angle the uncorrected error reached about 16 cm. The same difference between static and moving accuracy is observed outdoors. RTK-GNSS receivers are now compact enough to be carried by small mobile robots [48]. Blesing et al. [49] measured a low-cost RTK receiver at a few millimetres of scatter when stationary. When the robot was moving, the mean error was 69 mm at 1.1 m s−1, rising to 226 mm at 4.1 m s−1. Where no such infrastructure is available, accuracy depends on onboard perception. Khoshrangbaf et al. [50] compared wireless indoor localisation in a 431 m2 building. They report maximum errors of 131 mm for ultra-wideband, 1917 mm for Bluetooth low energy and 6087 mm for Wi-Fi, and all systems degraded by roughly a factor of two once the platform moved. Huang et al. [51] report the same static-to-dynamic degradation for ultrasonic positioning, from 12 mm to 62 mm. Vision- and LiDAR-based SLAM lies in the middle of this range and is the approach used by most commercial service platforms. For this reason, the construction SLAM results above are directly relevant to the present framework.
Two findings with direct dimensional consequences: First, localisation degrades at exactly the geometric features from which clearances are derived. Husemann et al. report that “in some places, especially while driving through a door, the LiDAR localisation has large errors” [43]. Yarovoi and Cho report that on one sequence every algorithm tested “lost track of the robot’s pose within the first 5 s and could not recover due to starting in a confined space” [41]. A clearance computed from open-corridor accuracy is therefore not conservative at a doorway. Second, path deviation depends on the locomotion system. Tarulescu and Tarulescu [52] measured linear and angular deviation for six platforms over a 1.8 m run. They report 19 mm for a tracked platform and 22 to 52 mm for wheeled platforms, against 91 and 112 mm for the two legged platforms. Deviation grew linearly with distance for the wheeled and tracked platforms and exponentially for the legged ones. This connects the form-factor classification of Table 1 directly to a clearance-relevant quantity, and it is developed in Section 4.10.
No published work was identified that derives a building clearance or dimensional tolerance from a stated robot positioning accuracy. The robot-inclusive design literature, including recent reviews of autonomous mobile robot provision in facilities management [53], sizes the built environment from robot body dimensions and obstacle geometry, without accounting for positioning uncertainty. The derivation in Section 4.10 is therefore presented as novel and with the caution that this requires.
2.6. Research Gap
The autonomous cleaning robot sector illustrates the dimensional challenge compellingly. LionsBot International produces robots ranging from the compact R3 Vac (482 mm wide, 655 mm tall, 53 kg) to the industrial R12 Rex CS (938 mm wide, 1473 mm tall, 748 kg) [3,4,5,6,7]—a 14.1:1 weight ratio within a single product line. The Avidbots Neo 2, at 935 mm wide and 688 kg in operating condition [54], exceeds the clear width of a standard single-leaf door. While anthropometry provides a well-established model for human-to-building dimensional analysis, and the RIS literature provides qualitative design principles, no analogous framework exists for robot-to-building analysis. Manufacturer specification sheets exist in isolation, unconnected to architectural standards, and—as Section 4.2 documents—a substantial minority of manufacturers publish no usable dimensional data at all. Recent framework studies in the built environment have demonstrated the value of organising fragmented domain knowledge into structured frameworks; Gasparri et al. [55], for example, developed a seven-dimensional conceptual framework for the circular economy in construction through systematic review. The robopometric framework proposed here adopts a comparable approach.
3. Materials and Methods
The research design is cross-sectional, exploratory and document-based. The unit of analysis is the commercially available robot platform. The data are secondary specification data published by manufacturers and independently verified against their sources. The analysis is descriptive and exploratory but not confirmatory. No experimental manipulation, human participation or field measurement is involved, and the study makes no causal claims. This design was selected because the research question asks what dimensional range interior environments must accommodate. The question therefore concerns the characteristics of an existing population of robot platforms and not the effect of an intervention.
This study employs a mixed-method approach comprising systematic data collection with source verification, descriptive and exploratory statistical analysis, and comparative dimensional assessment against architectural standards. The research follows a three-phase structure: platform identification and screening; dimensional data collection with independent verification and statistical analysis; and comparative analysis against architectural parameters in order to derive design guidelines [56,57]. Figure 1 sets out the three phases, the decision points at which candidate platforms were excluded, and the sequence in which the analyses were performed.
Figure 1.
Three-phase research design, showing platform identification and screening, dimensional data collection and two-stage verification, and statistical analysis and guideline derivation. Exclusion counts are itemised in Section 4.2.
3.1. Platform Identification and Screening
An initial pool of 50 candidate platforms was assembled through a search of the IFR World Robotics database, manufacturer directories, and industry deployment reports (2023–2026). Screening applied four criteria: the platform must be a mobile robot, capable of autonomous locomotion (excluding fixed installations and stationary manipulators); it must be a professional or commercial product rather than a consumer device; it must be commercially available for purchase or lease, excluding prototypes; and it must be functionally relevant to interior environments.
A fifth criterion was applied at the verification stage described in Section 3.2: the platform must have a dimensional specification that can be traced to a citable source. Fourteen of the 50 candidates failed one or more of these criteria and were excluded; the exclusions are itemised in Section 4.2, since the pattern of exclusions is itself a finding. The final sample comprises 36 platforms.
Humanoid form factors are within scope and are represented in the sample. The sample includes three wheeled humanoid platforms and one bipedal humanoid, identified as such in the form-factor column of Table 1. The bipedal humanoid population is small for a reason that concerns the scope of the framework, not its method. Of the bipedal platforms currently prominent in the literature and the trade press, one can be purchased openly, but it is sold as a research and development platform and not as a service robot. Two have genuine commercial deployments, but they are marketed explicitly for logistics and factory work, are supplied under negotiated agreements instead of being sold, and publish no dimensional specification. The remainder cannot be purchased at the time of writing. The one bipedal humanoid that is both openly sold and marketed for occupied interiors is included. The absence of other platforms reflects the state of the market and not a screening decision.
The study population comprises professional service robots that operate autonomously inside finished, human-occupied interiors. It excludes industrial robots that operate within guarded cells, outdoor and field platforms such as pavement delivery robots and agricultural machinery, construction-phase robots that work on unfinished sites, consumer domestic products, and medical robots that are surgical instruments instead of mobile occupants of a building. The framework is intended to apply within that boundary, and the dimensional distributions reported below should not be extrapolated beyond it.
The retained platforms are products of 21 manufacturers headquartered in eight countries across three continents: China (14 platforms), the United States (7), Singapore (5), the Republic of Korea (3), Japan (3), Denmark (2), Spain (1) and Canada (1). The sample is therefore not bounded by a single national market. This affects the transferability of the findings, as discussed in Section 5.7.
Platforms were assigned to eight functional categories: hospitality delivery, social/concierge, security/patrol, floor cleaning, healthcare logistics, legged inspection, telepresence, and material transport. Seven of these categories are represented in the final sample; telepresence is not, for the reasons given in Section 4.2. Category sizes are unequal, reflecting both the unequal market distribution of robot types and unequal dimensional reporting practice between sectors. Non-parametric statistical methods are used throughout to accommodate this imbalance.
3.2. Dimensional Data Collection and Verification
Six parameters were sought for each platform: length, width, and height (mm); weight and payload capacity (kg); and form factor.
Weight is not a dimension, and its inclusion therefore requires justification. The framework addresses the physical interface between a robot and a building, and this interface is governed by mass as well as by size. Floor point loading, ramp traction and lift rated capacity are building parameters in the same sense as corridor width. Each of them is determined by the mass of the platform and not by its envelope. Anthropometry includes body mass for the same reason, and the accessibility standards derived from it specify structural as well as spatial provision. The framework is therefore described here as covering both the dimensional and the mass properties of the platform. The guidelines derived from weight are identified in Section 6.
Data collection followed a two-stage protocol. In the first stage, values were compiled from manufacturer product pages, technical specification brochures, and user manuals. In the second stage, every value was independently re-checked against the manufacturer’s own published source, and three specific hazards were addressed explicitly:
- Axis order: Manufacturers publish dimension strings in inconsistent orders—, , , and all occur in the sample, and several publish an unlabelled triple. Each value was matched to the manufacturer’s own axis labelling rather than to position within the string, and platforms whose labelling could not be resolved were flagged.
- Model identity: Where a manufacturer sells several variants under a shared family name, the specific model designation was recorded and figures were taken only from that model’s documentation.
- Weight basis: Manufacturers differ in whether a published weight is empty, dry, net, or operating. Where both a transport and an operating weight are published, the operating weight was recorded, since it is the operating condition that governs floor point-loading, ramp traction, and lift capacity. Where a manufacturer publishes a single unqualified figure, that figure was recorded as published. The weight column is therefore basis-heterogeneous, and this is a limitation of the underlying disclosure practice rather than of the compilation.
Thirty-four of the 36 platforms have all three primary dimensions published by the manufacturer. For two platforms (Diligent Robotics Moxi and the UVD Robot Model C), the manufacturer publishes no dimensional specification and figures were taken from documented third-party technical sources; these rows are marked in Table 1 and were retained because both platforms are widely deployed in the healthcare category. All dimensions represent static envelopes; dynamic operational envelopes, including turning radius, sensor sweep width, and deceleration distance, are discussed qualitatively where relevant. Two platforms have variable height—the PAL Robotics TIAGo has a 350 mm torso lift and is recorded at its maximum extension.
3.3. Statistical Analysis
Analyses are exploratory and descriptive in intent. They comprised Shapiro–Wilk normality tests [58]; non-parametric Kruskal–Wallis H-tests for inter-category comparison [59], with Dunn’s post hoc test under Bonferroni correction; Spearman rank correlation coefficients; logarithmic transformation of the weight distribution; and common deployment zone (CDZ) identification. Effect sizes are reported as . All analyses were performed in Python (version 3.12) using SciPy (version 1.18.0) for the statistical tests and scikit-learn (version 1.7) for the clustering and Gaussian mixture analyses.
Kruskal–Wallis testing was restricted to the five categories containing at least three platforms (floor cleaning, hospitality delivery, legged inspection, material transport, and social/concierge; ). Security/patrol and healthcare logistics are described but not tested, since two observations cannot support inference. Given the sample size and the number of categories, inferential results should be read as indicative rather than confirmatory.
Two further analyses were planned at the outset and are reported in Section 4. The first is a cluster analysis of the joint width–height distribution, used to establish whether the sample contains a dimensionally coherent subpopulation and, if so, to locate its boundaries empirically instead of by inspection. The method is density-based spatial clustering (DBSCAN), with a Gaussian mixture fitted independently as a cross-check, and the procedure is described in Section 4.6. The second is a within-manufacturer variance analysis of the one manufacturer represented by five models in the sample. It tests whether dimensional variation within a single product line is small as compared to the variation between functional categories, and it is reported in Section 4.7.
Dimensional data were compared against IBC 2021 corridor widths (Section 1020.3 and Table 1020.3) [14], ADA door clearances (Section 404.2.3) [13], ASME A17.1 elevator dimensions [24], and standard floor load ratings. Section 4.8 extends this comparison to the statutory accessibility minimums of four further jurisdictions.
4. Results
4.1. Dimensional Inventory
Table 1 presents the dimensional inventory of the 36 verified platforms, listing width, length, height, weight, payload capacity, and form factor for each.
4.2. Dimensional Reporting Gaps
Fourteen of the 50 candidate platforms were excluded during screening and verification. The reasons are informative in their own right and are summarised in Table 2. Four failed the autonomous-mobility criterion, one the professional-product criterion, two could not be identified as products offered by the named manufacturer, and seven published no traceable dimensional specification.
Two features of this pattern bear on the framework’s central argument.
First, dimensional disclosure is markedly uneven between sectors. Hospitality delivery and floor cleaning manufacturers publish complete dimension strings almost universally; healthcare logistics, telepresence, and security vendors frequently publish none. Six of the seven exclusions for missing specifications fall in these three sectors. Several of these platforms are sold on robot-as-a-service contracts, under which hardware specifications are not treated as public product information.
Table 1.
Dimensional inventory of 36 verified professional service robots. W = width; L = length (front-to-back depth); H = height; Wt = weight; Pay = payload capacity. Dimensions are given in mm and weights in kg; “—” denotes a parameter that the manufacturer does not publish or that does not apply to the platform. Unless otherwise noted, all values are taken from the manufacturer’s own published specification and matched to the manufacturer’s stated axis labelling. † denotes a platform for which the manufacturer publishes no dimensional specification and whose figures are taken from documented third-party technical sources. Six manufacturers publish no length.
Table 2.
Candidate platforms excluded during screening and verification, with the criterion each failed.
Second, and consequentially for this study, no telepresence platform surveyed has a manufacturer-published width. Double Robotics and OhmniLabs publish height and weight but not width or depth. The telepresence category therefore cannot be characterised dimensionally from manufacturer sources at all and is absent from the analysis that follows.
This is not merely a limitation of the present survey. A facility manager specifying corridors, doorways, or lift capacity for a telepresence deployment faces exactly the same evidentiary vacuum. The reporting gap is an obstacle to robot-inclusive design in practice, and it motivates the first standardisation pathway proposed in Section 7.
4.3. Distributional Properties
Shapiro–Wilk tests reject normality for width (, ) and weight (, ), but not for height (, ). Weight exhibits strong positive skewness (2.60) and a leptokurtic distribution (excess kurtosis = 5.45), reflecting a population dominated by lightweight platforms with a small number of very heavy outliers. Its coefficient of variation (CV) of 145.8% exceeds the CV of human body weight in any demographic population by roughly an order of magnitude. Weight spans 2.13 orders of magnitude (5.5–748 kg), with a geometric mean of 71.2 kg. The median (60.0 kg) lies well below the mean (128.0 kg), and 90% of platforms weigh less than 246 kg. Logarithmic transformation reduces the skewness of the weight distribution from 2.60 to 0.43 and brings it substantially closer to symmetry. A Shapiro–Wilk test on the log-transformed values does not reject normality, but only marginally (, ), and the result is sensitive to single observations. The transformation is reported because it clearly improves symmetry and stabilises the spread, not because log-normality is established for this sample.
These distributional properties have methodological and practical implications. The non-normality of width and weight means that parametric tests would be unreliable, which motivates the non-parametric approach adopted here. More importantly for design, the skew in the weight distribution means that standards based on mean values would be inadequate: the mean weight of 128.0 kg is exceeded by only eight of the 36 platforms, yet the upper tail reaches 748 kg. Percentile-based thresholds are the more appropriate basis for dimensional requirements. The contrast between width (CV = 30.9%), height (CV = 35.6%), and weight (CV = 145.8%) shows that weight is by far the most heterogeneous parameter, with implications for which design requirements are hardest to standardise (Figure 2).
Figure 2.
Weight distribution across the 36 verified platforms: (left) raw values, showing strong positive skewness (2.60, CV = 145.8%); (right) log-transformed values, which are substantially more symmetric (skewness 0.43); a Shapiro–Wilk test on the log-transformed values does not reject normality, but only marginally (, ).
4.4. Inter-Category Differences
Table 3 summarises descriptive statistics for the seven categories represented in the sample.
Table 3.
Descriptive statistics by functional category. W = width; H = height; Wt = weight. Dimensions are given in mm and weights in kg. Categories with fewer than three platforms are reported descriptively but were excluded from inferential testing.
Kruskal–Wallis tests across the five categories with () find a significant difference for weight (, , , ) but not for width (, , , ) or height (, , , ). Dunn’s post hoc tests with Bonferroni correction identify no significant pairwise differences for any parameter, which is unsurprising given the group sizes; the omnibus weight result should therefore be read as evidence that the categories differ in weight overall, without support for any specific pairwise contrast.
The weight difference is driven by floor cleaning (mean 264 kg, SD = 309 kg) and material transport (mean 169 kg) at one end, against legged inspection (mean 36 kg) and social/concierge (mean 42 kg) at the other. Floor cleaning also shows the largest within-category variability of any group, with weights spanning 35–748 kg—a range wider than that between most category means, and a caution against treating category membership as a proxy for dimensional requirements.
Width and height did not differ significantly between categories. Given five groups totalling 32 platforms, this is a result of low statistical power as much as of any underlying similarity. It must not be read as evidence that the categories do not differ on these parameters, because the effect sizes for width () and height () are not negligible, and the observed mean widths span a 420–702 mm band. The correct statement is that no category difference in plan dimensions was detectable at this sample size. Therefore, no inference is drawn here that functional category is a weak predictor of plan dimensions, or that the categories converge on a common footprint. The dimensional clustering reported in Section 4.6 is established directly from the observed distribution, and it does not depend on these non-significant tests.
4.5. Correlation Structure
Spearman rank correlation reveals significant positive relationships between all three dimensional parameters. Width and weight are strongly correlated (, ; Figure 3), reflecting the physical reality that wider robots carry larger assemblies and greater structural mass. Height and weight are moderately correlated (, ), as are width and height (, ).
Figure 3.
Width–weight correlation across the 36 verified platforms. Scatter plot with linear regression line and 95% confidence interval (, ).
The strong width–weight relationship provides a useful design simplification: platforms that require wider corridors also tend to require stronger floors, so width-driven spatial upgrades partially address weight-driven structural requirements at the same time. Width is consequently the single most informative parameter for first-order robopometric screening.
The width–height relationship requires more careful reading. It is statistically significant, but means that roughly four-fifths of the variance in height is unexplained by width. The sample contains both tall narrow platforms (the UVD Robot at 550 mm wide and 1780 mm tall) and wide low ones (the Fetch Freight 500 at 1025 mm wide and 356 mm tall). Width is therefore a useful predictor of height on average but an unreliable one for any individual platform, and overhead clearance still warrants independent verification rather than being inferred from plan dimensions.
4.6. Common Deployment Zone
In this section, the CDZ boundaries are derived by two independent methods, and their stability is tested.
Density-based spatial clustering (DBSCAN) was first applied to the joint width–height distribution of the 36 verified platforms, with the neighbourhood radius mm and a minimum of five points per cluster. The radius was set at 150 mm because this is the order of the lateral clearance increments that matter architecturally, roughly the difference between adjacent standard door leaf widths. Two platforms closer than this distance are therefore dimensionally interchangeable for design purposes. DBSCAN was chosen instead of a partitioning method because it does not require the number of clusters to be specified, it allows points that belong to no cluster, and it does not assume that clusters are spherical.
The procedure returns a primary cluster of 17 platforms (47% of the sample) spanning 384–630 mm in width and 1046–1520 mm in height. It also returns a secondary cluster of five low platforms (275–482 mm wide, 574–655 mm tall) and 14 points that are assigned to no cluster. The CDZ is defined here as the primary cluster: mm and mm (Figure 4). Within it the mean width is 520 mm with a standard deviation of 63 mm—a CV of 12.2%, against 30.9% for the sample as a whole, and 10.2% in height against 35.6%.
Figure 4.
Common deployment zone across the 36 verified platforms. Points are shaded by DBSCAN membership at mm and MinPts : the primary cluster (17 platforms, 47%), the secondary cluster of five low platforms, and 14 points assigned to no cluster. The dashed rectangle is the resulting CDZ boundary, 384–630 mm in width by 1046–1520 mm in height. Within the cluster the width CV is 12.2% against 30.9% for the sample as a whole. A Gaussian mixture fitted independently returns identical membership. Marker area is proportional to weight.
As a cross-check, a Gaussian mixture model was fitted independently to the same two variables, with the number of components selected by the Bayesian information criterion. At the BIC-optimal solution, the component membership is identical to the DBSCAN cluster, with the same 17 platforms and no disagreement. At every smaller number of components the 17 platforms remain together, contained within a broader component. Two methods with unrelated assumptions therefore recover the same grouping. The BIC continues to decline as components are added. This is the usual behaviour of the criterion at this sample size. For this reason, the relevant evidence is the stability of the cluster across solutions and not the optimum alone.
The sensitivity of the boundaries to the clustering parameters was then tested. Nine combinations were tested, with from 100 to 150 mm and the minimum cluster size from four to six points. These return a primary cluster of between 12 and 21 platforms. In every one of these combinations, the upper width bound is 630 mm. The ceiling is therefore not an artefact of the parameter choice. The lower width bound is less stable, moving between 384 and 440 mm as the radius tightens, and the upper height bound between 1350 and 1520 mm. At mm the cluster begins absorbing the 700 mm Gausium Scrubber 50 and the boundary dissolves. The design guidelines in Section 6 are derived from the upper width bound, and this bound is invariant across the tested range. The guidance therefore does not depend on where the parameters are set within this range.
Parameter stability is necessary but not sufficient, because a cluster that survives every parameter choice may still be an artefact of the platforms that happen to be in the sample. Three resampling tests were therefore performed to examine the sensitivity of the cluster to the composition of the sample.
Under leave-one-out refitting, each of the 36 platforms was removed in turn and the clustering repeated. The primary cluster persisted in every refit, containing between 14 and 17 platforms, and the upper width bound remained 630 mm in 35 of the 36 refits. The only exception is the refit that removes the 630 mm platform itself, the UBTECH Cruzr. In this case, the bound falls to 610 mm. The ceiling is therefore robust to the removal of any platform except the one that defines it. This is the most that can be expected of an extreme-value bound. Fifteen of the 17 cluster members were retained in at least 34 of the 36 refits. The two exceptions, the LG CLOi GuideBot and the Diligent Robotics Moxi, lie near the upper height boundary and were retained in 31 refits.
Under bootstrap resampling, with 2000 samples of 36 platforms drawn with replacement, a primary cluster was recovered in every resample. The upper width bound was exactly 630 mm in 62% of resamples and 700 mm or less in 99.8%, with a 95% interval of 537–630 mm. The location of the bound is therefore reliable, but its exact value depends on whether the widest cluster member is present. Bootstrap resampling sometimes omits this platform. A design value of 630 mm therefore lies at the upper end of what the sample supports and not at its centre.
Under leave-one-category-out refitting, however, the result is less favourable, and it qualifies the claim that the CDZ cuts across functional categories. Removing floor cleaning, legged inspection, security, healthcare logistics or material transport leaves the cluster essentially intact, at 14 to 17 members with the ceiling at 630 mm. When hospitality delivery is removed, the cluster is not recovered. The primary cluster becomes the five-platform low group, and no cluster resembling the CDZ is found. This is a direct result of the composition of the CDZ, in which ten of the 17 platforms are hospitality delivery robots. In this sample, the CDZ is therefore mainly a hospitality-delivery phenomenon, and the statement that it “cuts across functional categories” must be read with this in mind. The zone does contain platforms from five of the seven represented categories, but it does not survive the removal of the category that provides most of its members. Whether the envelope would persist in a sample with a different functional balance is not answerable from these data and is a question for the larger sample that Section 5.7 identifies as necessary.
Hartigan’s dip test finds no evidence against unimodality in the width distribution taken alone () or the height distribution taken alone (). The clustering is a property of the joint distribution, not of either margin, and no claim is made here that robot widths are bimodally distributed. The analysis therefore establishes a narrower result. Within the joint space of width and height, the sample contains one dimensionally coherent group of 17 platforms. The internal dispersion of this group is roughly a third of that of the whole sample, its boundaries are recovered by two independent methods, and its upper width bound is invariant under the clustering parameters. The analysis does not, however, establish that architecture causes this grouping. That interpretation is advanced in Section 5 as the most plausible reading of the cluster’s composition, not as a result of the clustering itself.
The cluster’s composition is what makes the architectural reading plausible and also what limits it. Its 17 members consist of all ten hospitality delivery platforms, four of the six social/concierge robots, one security platform, one healthcare logistics platform and one material transport AMR. These cover five of the seven functional categories represented in the sample. Platforms built for conversation, for patrolling and for moving 600 kg loads occupy the same footprint band as platforms built for carrying plates. Function does not explain this, and the likely explanation is the shared need to pass through human-scale doorways and corridors. As shown above, hospitality delivery provides ten of the seventeen members, so the cross-category evidence rests on seven platforms from four categories and not on a balanced distribution. This interpretation is therefore offered as plausible, but it is not demonstrated. The heaviest cluster member weighs 154 kg, so the whole group falls below the 200 kg structural threshold identified in Section 4.8.
Seven platforms exceed the 630 mm CDZ width ceiling: the Knightscope K5, five floor-cleaning machines, and the Fetch Freight 500. These typically operate in back-of-house areas or during off-peak hours, a deployment pattern with implications for temporal robopometric planning. The CDZ provides a practical design target: facilities designed to CDZ specifications—minimum 900 mm doors, 1200 mm corridors, and flush thresholds—will accommodate the 47% of the sample that falls within the cluster, and in fact every platform up to the 630 mm ceiling, which is 81% of the sample.
4.7. Within-Manufacturer Dimensional Variance
The planned within-manufacturer analysis (Section 3.3) addresses a question that the category analysis cannot answer. The question is whether standardising on a single supplier limits the dimensional range that a facility must accommodate. One manufacturer, LionsBot International, is represented by five models. This is the largest single-vendor representation in the sample and the only one large enough for the comparison. The five LionsBot models span widths of 450–938 mm (CV = 34.7%), heights of 655–1473 mm (CV = 37.7%), and weights of 53–748 kg (CV = 109.5%) (Figure 5). The resulting 14.1:1 weight ratio is the largest intra-manufacturer span in the sample and demonstrates that a single vendor’s product line can cover most of the robopometric spectrum. The R3 Vac, at 655 mm tall, passes beneath standard desk height (720 mm), whereas the R12 Rex, at 1473 mm tall, requires door heights exceeding 1600 mm with clearance. For comparison, the entire hospitality delivery category—ten platforms from seven manufacturers—spans a weight ratio of only 2.15:1 (34–73 kg). A single vendor’s product range can therefore exhibit greater dimensional diversity than an entire functional category, which has direct consequences for facilities that standardise on one supplier in the expectation of dimensional consistency.
Figure 5.
LionsBot intra-manufacturer dimensional diversity. The five-model product line spans 450–938 mm in width and 53–748 kg in weight, representing a 14.1:1 weight ratio.
4.8. Architectural Compliance
Comparative analysis against standard architectural parameters shows that three platforms (8%) exceed the 900 mm door clear width; seven (19%) exceed the 630 mm CDZ width ceiling and therefore require corridors wider than the 1200 mm minimum proposed in Guideline 1; four (11%) exceed 1500 mm in height; and four (11%) reach or exceed 200 kg and therefore require floor load assessment. No platform in the verified sample exceeds 1200 mm in width.
These conflicts affect between 8% and 19% of the sample, depending on the parameter, and they call for targeted design accommodation and not for wholesale change. The platforms exceeding these thresholds are concentrated in floor cleaning and material transport—categories that are experiencing rapid market growth [1]—which suggests that dimensional conflicts will become more prevalent as deployment scales in these sectors.
The comparison above is made against United States standards. These standards, however, apply neither to most of the manufacturers in the sample nor to most of the markets in which these platforms are sold. Table 4 therefore sets the principal proposed values against the statutory accessibility minimums of four jurisdictions. Two observations follow. First, the 1200 mm single-direction corridor proposed here is identical to the mandatory accessible-route width in Singapore, the Republic of Korea and Japan. The 1800 mm bidirectional figure also matches both the Japanese guideline standard and the Singaporean primary accessible route for most use classes. The values derived from robot dimensions therefore coincide with minimums already in force in three East Asian jurisdictions, and they exceed the United States minimums of 914 mm and 1118 mm. Second, the jurisdictions differ considerably in how they treat level changes, from a tolerated 20 mm in the Republic of Korea to a requirement of no level difference at all in Japan. A threshold specification that complies in one jurisdiction may not comply in another. The robopometric threshold recommendation is therefore expressed as a performance requirement instead of a single figure.
European practice is not directly comparable in tabular form. EN 17210:2021 [60] states functional requirements for the accessibility and usability of the built environment, but it does not prescribe dimensions. The corresponding numerical examples appear in CEN/TR 17621:2021, an informative technical report with no obligation at national level. The absence of a binding European dimensional minimum is itself relevant to the standardisation pathways proposed in Section 7.
Table 4.
Principal proposed robopometric values compared against statutory accessibility minimums in four jurisdictions. All values in mm. Where a jurisdiction distinguishes a mandatory minimum from a higher voluntary or certification standard, both are given.
4.9. Dynamic Operational Envelopes
The inventory in Table 1 records static envelopes. A platform in motion occupies more space than its footprint. This difference depends on three parameters, namely the envelope swept when the platform turns, the lateral extent of its sensor field, and the distance it needs to decelerate. These parameters are not included in the inventory of Table 1. The reason is itself a finding, as described below.
Each of the 36 manufacturers was checked for three dynamic parameters. No manufacturer in the sample publishes a turning radius, and none states that its platform turns in place. Two publish a related but distinct figure, namely a minimum aisle turnaround or U-turn width (Avidbots Neo 2, 3050 mm; Gausium Scrubber 50, 1100 mm). This is an operational clearance recommendation, and not a geometric property. One manufacturer publishes a quantified navigation or docking accuracy (Mobile Industrial Robots, mm marker docking and mm positional), and one further publishes an unquantified claim of “centimetre level”. None of the manufacturers publish a deceleration distance or a sensor sweep width. By contrast, 30 of 36 publish a maximum travel speed and 30 of 36 publish a length.
The locomotion system itself is also poorly disclosed. Five of the 36 platforms name a drive configuration. These are one omnidirectional three-wheel base, one platform offered in differential or omnidirectional variants, and three quadrupeds. A sixth platform is described by its manufacturer as humanoid, but the description does not state a bipedal configuration, so it is not counted. Degrees of freedom are published only for the two platforms carrying manipulators. Most importantly for the guidelines derived here, only one platform in the sample publishes any wheel diameter. Mobile Industrial Robots gives a 200 mm drive wheel and a 125 mm caster. No other manufacturer publishes either value. Guideline 2 specifies threshold profiles using caster diameter, and Guideline 12 specifies drainage slot widths using wheel diameter. Both guidelines therefore depend on a parameter that only one vendor in the surveyed population discloses. For this reason, wheel geometry is added to the reporting standard proposed in Section 7.
Gradeability is disclosed more often, and it can be used. Sixteen of the 36 platforms publish either a maximum gradient or a maximum obstacle-crossing height, but the units are inconsistent. Ten use degrees, two use percent, one uses both, another gives an inch measure in prose, and one gives a figure labelled as a grade that is actually a step height. Among the wheeled platforms, the published maxima are tightly grouped, with five platforms at 5°, one at 4.6°, one at 10° and one at 0.28° for scrubbing. In contrast, the three quadrupeds report 30° or more. The 3.5° maximum gradient proposed in Guideline 4 sits below the lowest wheeled maximum other than the ride-on scrubbing figure, with margin. It is therefore a value derived from the disclosed population and not an assumption.
Taken together, these counts show a consistent pattern of disclosure. Static extent and speed are published routinely. In contrast, the geometry of motion (turning radius, wheel diameter, sensor sweep and deceleration distance) and the precision of positioning are almost never published, except in the industrial autonomous mobile robot segment. Clearance requirements that depend on these parameters cannot at present be specified from manufacturer data. This extends the reporting gap of Section 4.2 from a subset of platforms to a whole class of parameters.
However, one dynamic parameter can be derived from the published data. For a platform with a rectangular footprint of width W and length L rotating about the centroid of that footprint, the swept circle has diameter . This is the minimum swept envelope, because a differential-drive platform whose wheel axis is offset from the centroid sweeps a larger circle. The values below are therefore a lower bound on the space that a turn actually requires. Length is published for 30 of the 36 platforms, and the swept diameter was computed for those.
Across the 30 platforms the swept diameter ranges from 415 to 1955 mm, and its median is 1.50 times the platform width (range 1.27 to 2.64). A platform therefore requires, on the median, half again its own width in order to turn. Ten of the 30 platforms sweep more than the 900 mm doorway clear width proposed in Guideline 2, and five sweep more than the 1200 mm single-direction corridor of Guideline 1. These platforms can pass through an opening while travelling forward, but they cannot turn around within it. Table 5 lists those exceeding the 1200 mm corridor.
Table 5.
Platforms whose minimum swept turning envelope exceeds the 1200 mm corridor width of Guideline 1. Swept diameter is , the diameter of the circle swept by a rectangular footprint rotating about its centroid. A platform rotating about an offset axis sweeps more. All values in mm.
Two consequences follow. The first result supports the common deployment zone. Of the 17 CDZ platforms, 14 publish a length. Their swept diameters range from 605 to 1082 mm, with a mean of 779 mm, and only two exceed 900 mm. The circulation propositions therefore hold, for turning as well as for straight-line passage, across most of the envelope they were derived from.
The second result requires a correction to the guidance proposed in this study. Guideline 12 proposes a turn-around zone of 1500 × 1500 mm at route endpoints. Three platforms, namely the Avidbots Neo 2 and both LionsBot R12 Rex models, sweep between 1781 and 1955 mm and cannot reverse within that zone. The proposed value is adequate for CDZ platforms and for the sample’s legged and social platforms, but not for industrial cleaning machines. Guideline 12 therefore specifies a larger turn-around zone, of 2000 × 2000 mm, for platforms above the CDZ. This shows the value of the dynamic analysis, because a proposition derived from static envelopes alone understated a requirement by up to 30%.
The locomotion system also bears on how far a platform strays from its intended line. Tarulescu and Tarulescu [52] measured path deviation over a 1.8 m run for six platforms and report a clear ordering by locomotion type. The deviation was 19 mm for the tracked platform, 22 to 52 mm for the three wheeled platforms, and 91 and 112 mm for the two legged platforms. This is a factor of four to five between wheeled and legged platforms. Angular deviation followed the same ordering, from 5.5° to 24.5°. Expressed as a rate, the wheeled platforms deviated by 12 to 29 mm per metre travelled and the legged platforms by 51 to 62 mm per metre. The platforms tested were small educational and hobby machines without localisation correction, so the absolute values describe uncorrected dead reckoning and not the performance of a modern service platform. However, the ordering by locomotion type is a property of the drive geometry and not of the specific machines. The three legged platforms in the present sample can therefore be expected to hold a line less accurately than the wheeled majority. Section 4.10 develops the consequence for clearance.
Sensor sweep width and deceleration distance remain outside the analysis, because neither can be derived from published dimensions and neither is disclosed. Both are added to the minimal reporting standard proposed in Section 7, together with turning geometry and positioning accuracy.
4.10. Positioning Accuracy and Clearance Tolerance
Section 2.5 established that no published work derives a building clearance from a robot’s positioning accuracy. This section does so because the relationship determines how much of the clearance proposed in Section 6 is a property of the robot’s body and how much is a property of its navigation.
The proposed clearance model is as follows. A platform of width W and length L, commanded along a nominal line, occupies a lateral band wider than W. This excess is governed by two terms. The first is the positional error e of the platform’s own pose estimate. The second is the lateral excursion caused by heading error. A platform yawed by from its commanded heading presents its corner instead of its side, and this adds . The lateral clearance requirement is therefore
and the corridor width required for a platform and a pedestrian to pass is
where g is a separation allowance and a pedestrian body width. The model is deliberately simple. It treats the footprint as rectangular, takes the errors as independent worst cases instead of combining them in quadrature, and omits dynamic sway, because no manufacturer in the sample discloses it. The first two choices make the model conservative. Omitting dynamic sway does not, and the computed widths should therefore be read as minimum values in that respect.
Table 6 applies the model to the CDZ platforms, whose published lengths span 425 to 960 mm, across four classes of localisation performance drawn from Section 2.5. The pedestrian allowance is taken as 400 mm and the separation as 50 mm. Both are stated assumptions and are identified as such in Section 6.
The model gives three results, of which the first is the most useful.
The 1200 mm corridor and 900 mm doorway proposed in Guidelines 1 and 2 are reproduced exactly by the second row. The same values can be obtained by adding a 150 mm lateral buffer without a stated basis. The model shows what this buffer represents. It corresponds to a platform held to approximately the positioning accuracy declared by the one manufacturer in the sample that publishes such a figure. The proposed values are therefore not arbitrary, but they are conditional on the positioning accuracy of the platform.
Second, it follows that the proposed clearances are inadequate for platforms that navigate less accurately. A free-navigating platform relying on open-source SLAM of the quality reported for real construction environments requires a 1500 mm corridor and a 1300 mm doorway—a fifth more corridor and nearly half again the door width. The same platform in a building specified to Guideline 1 would be operating with no margin. For a facility manager, this means that clearance cannot be specified without knowing how accurately the platform navigates.
Third, the relationship works in both directions, and this is the practical contribution of the model. A facility deploying infrastructure-guided platforms on fixed routes needs only 1113 mm of corridor according to this model. In this case, the governing constraint becomes the building code instead of the robot, and accuracy has been substituted for space. Conversely, a facility unwilling or unable to widen its corridors can achieve compliance by procuring platforms with better declared accuracy. Space and positioning accuracy are interchangeable within the range this table spans, and a building that cannot afford one can buy the other. Guideline 16 makes this substitution explicit as a specification and procurement requirement.
The model has four limitations. The manufacturer-declared row rests on the single platform in the sample that publishes a quantified positioning accuracy, and generalising one vendor’s figure to a class is an assumption, not a measurement. The SLAM figures are localisation errors and not lateral tracking errors. They are used here because a platform that misjudges its own position by 300 mm will contact a wall whether or not it tracks its incorrect estimate accurately. The two quantities are, however, not identical. The open-loop row extrapolates linearly from a 1.8 m measurement to a 5 m run. The source supports this for wheeled platforms but explicitly not for legged ones. Finally, the whole table assumes that accuracy is constant along a route. The evidence in Section 2.5 shows that accuracy degrades at doorways, and this is exactly where the doorway column applies. The doorway figures should therefore be read as lower bounds.
5. Discussion
5.1. Tiered Robopometric Classification and Implications for Building Codes
The findings characterise the robopometric spectrum as a range whose extreme right tail in weight creates disproportionate accommodation challenges, while plan dimensions cluster far more tightly than functional diversity would suggest. By analogy with the design vehicle concept in transportation engineering [65], spaces could be classified into three tiers: CDZ-compatible (up to 630 mm width and 200 kg), extended-compatible (up to 940 mm and 700 kg), or full-spectrum-compatible (up to 1030 mm and 750 kg). The finding that 90% of platforms weigh less than 246 kg while the upper tail reaches 748 kg supports this tiered approach, with CDZ-compatible design covering the majority of human-proximate deployments at modest incremental cost.
The extreme weight CV (145.8%) indicates that floor structural capacity is the most variable—and the costliest to remediate—design requirement. Because width and weight are non-normally distributed, standards based on mean or median values would fail to accommodate the upper tail of the distribution, where the most demanding platforms are found. Percentile-based thresholds—for example, designing for the 90th-percentile platform in a given category—provide a more robust approach that accommodates most current and near-future platforms, while acknowledging that full-spectrum accommodation may not be economically justified for all facility types.
These findings raise a broader question for the building regulation community: should robopometric parameters be incorporated into building codes for facility types with high robot deployment? Current codes [13,14] mandate minimum spatial dimensions exclusively for human accessibility. As cleaning and healthcare robot deployments grow [1], the dimensional conflicts identified in this study will become increasingly prevalent. Just as post-occupancy evaluation has become an established methodology for assessing building performance against design intent [66,67], a robopometric pre-deployment audit could systematically evaluate dimensional compatibility before robot systems are procured. A pragmatic first step would be to introduce optional robopometric annexes for hospital, hospitality, and logistics facility classifications, specifying CDZ-compatible minimums as recommended rather than mandatory thresholds. Such annexes could be developed through collaboration between ISO/TC 184 [68], ISO/TC 299 (Robotics), and the national bodies responsible for building code development.
Table 7 sets out a prioritised sequence for such annexes. Priority is based on three criteria: the proportion of the sample that the provision affects, the strength of the deployment evidence that supports it (Section 5.6), and the difference in cost between specifying the provision at the design stage and retrofitting it after occupancy. The first tier contains provisions that are cheap at the design stage, expensive later, and supported by the strongest evidence. The third tier contains provisions that are desirable, but for which the present evidence is weakest. The table is offered as a starting point for discussion and not as a settled recommendation. This is consistent with the status of the propositions set out in Section 6.
Table 7.
Prioritised sequence of proposed robopometric code provisions for high-deployment facility classes. Provisions are recommended for optional annexes and not for mandatory articles, pending the validation programme of Section 6.6.
5.2. Robopometry as an Extension of Universal Design
The strong width–weight correlation (, Section 4.5) has a practical consequence: corridor-widening interventions that accommodate the largest CDZ platforms also address a substantial portion of the structural load requirements, because the heaviest robots tend to be the widest. This correlation structure simplifies the design task by reducing the number of independent parameters that facility planners must optimise simultaneously.
More broadly, the robopometric guidelines exhibit substantial overlap with existing universal design and accessibility standards [25,71]. Flush thresholds ( mm) benefit both wheeled robots and wheelchair users. Wider corridors (1800 mm for bidirectional robot–pedestrian traffic) exceed ADA minimums and improve accessibility for all users. Barrier-free continuous routes, generous elevator dimensions, and level floor transitions serve both populations simultaneously. This convergence is not coincidental: both wheelchair users and wheeled robots are ground-contact agents whose mobility is constrained by the same architectural features—thresholds, steps, narrow doorways, and heavy self-closing doors. The robopometric framework thus extends the universal design tradition by adding a new class of non-human agents whose dimensional requirements overlap with those of the human users that accessibility standards were designed to accommodate.
Recent evaluations of universal design in practice have highlighted the persistent gap between design intent and built outcome [72], as well as the challenges that building professionals face in implementing inclusive design [73]; robopometric specifications, by providing explicit dimensional targets, may help to close this gap for both robotic and human users. In affordance-theoretic terms [30,32], the built environment’s affordances for robotic agents substantially overlap those for mobility-impaired human agents: a space that affords passage to a 630 mm wide, 200 kg service robot will generally afford passage to a powered wheelchair of comparable width. Facility managers and building owners may therefore find that robopometric upgrades yield a dual return on investment, simultaneously improving accessibility compliance and enabling robot deployment.
5.3. The Temporal Dimension of Robopometric Planning
Unlike human anthropometry, which changes slowly across generations, the robot population evolves rapidly through product cycles. Eight of the 50 candidate platforms identified for this study were discontinued or superseded during the survey period, and one vendor had ceased operations. The LionsBot case study further challenges the assumption that vendor standardisation simplifies spatial planning, since the 14.1:1 weight ratio within a single product line exceeds the weight variation of most entire categories. Robots may also be redeployed or replaced over a facility’s life, which argues for a “robopometric margin” in spatial design that accommodates not only current platforms but a reasonable range of future ones.
The front-of-house versus back-of-house deployment distinction introduces a temporal complexity that is not present in static anthropometric design. CDZ platforms in public-facing spaces during normal hours present different requirements from industrial machines operating in restricted areas during off-hours. Robopometric compliance is therefore not a binary property of a building but a time-varying function of which robots occupy which zones at which hours. Facility operational planning must consequently incorporate temporal robopometric scheduling alongside spatial design. The robopometric audit concept proposed in Section 7 provides a practical methodology for addressing this complexity.
These temporal dynamics also have implications for building lifecycle costing and facilities management practice [74]. A building designed today to minimum code dimensions will face increasingly costly retrofits as robot deployments scale over its 30–60-year service life. Conversely, specifying CDZ-compatible dimensions at the design stage—1800 mm corridors, 900 mm doors, flush thresholds, and adequate floor loads—incurs marginal additional construction cost but avoids the substantially higher costs of structural modification after occupancy. This asymmetry between design-stage and retrofit costs argues strongly for proactive robopometric specification in new construction, even for facilities that do not yet plan robot deployment.
5.4. Multi-Parameter Assessment and Economic Implications
Although all three dimensional parameters are positively correlated, the correlations are moderate for the pairs involving height, and robopometric compliance cannot be reduced to a single metric. Width predicts weight well () but height only weakly (). In practical terms, a facility that has verified corridor width has thereby gained good assurance about floor loading but little about overhead clearance, and the two must still be assessed separately. Compliance also depends on the environmental factors addressed in Guidelines 9–15—acoustics, lighting, and connectivity—which are not dimensional at all.
From an economic perspective, the sixteen guidelines vary substantially in implementation cost. Threshold modifications (Guideline 2), mat anchoring (Guideline 12), and lighting specification (Guideline 11) are low-cost interventions achievable during routine maintenance. Corridor widening (Guideline 1) and elevator modification (Guidelines 3 and 14) represent major capital expenditures that are best addressed during initial construction or major renovation. Network infrastructure (Guideline 15) and charging provisions (Guideline 6) fall between these extremes. A cost-tiered implementation strategy—addressing low-cost interventions first to enable CDZ robot deployment, then progressively upgrading to extended- and full-spectrum compatibility as deployment scales and budgets permit—provides a practical pathway for existing buildings. Future research should quantify these cost differentials through lifecycle cost–benefit analysis, enabling evidence-based prioritisation of robopometric investments.
5.5. Theoretical and Practical Contributions
This work makes two contributions, one theoretical and one practical.
Theoretically, the study extends affordance-based reasoning about the built environment [30,31,32] from human to non-human agents. Affordance theory holds that what an environment offers is determined by the relationship between an agent’s physical properties and the environment’s structural features. In buildings, it has so far been applied only to human agents, whose dimensional properties are provided by anthropometry. The robopometric framework provides the equivalent input for a second class of agent, namely robots. In doing so, it makes the affordance relation computable for robots, because a doorway’s affordance for a robotic occupant can be evaluated only when the dimensional distribution of the robot population is known. This is the sense in which robopometry stands to robot-inclusive design as anthropometry stands to universal design, and Table 8 sets out that relationship against the specific frameworks on which the present study builds. The second theoretical contribution is negative, but it is important. The reporting gap documented in Section 4.2 shows that the affordance relation cannot currently be evaluated for some robot categories, because one of its terms is not disclosed.
Table 8.
Positioning of the robopometric framework relative to antecedent frameworks for dimensional design in the built environment.
Practically, this study offers four things that facility designers, architects and facility managers can act on. The first is the common deployment zone. It reduces a heterogeneous population to a single design target that covers 47% of the platforms in the sample. The second is the tiered classification of Section 5.1. It allows a building to be specified for a stated level of robot compatibility instead of an undifferentiated notion of robot-readiness, and it makes the cost of each tier explicit. The third is the set of sixteen design propositions of Section 6, each expressed as a dimensional specification that can be written into a brief. The fourth is the proposed minimal dimensional reporting standard of Section 7. It addresses the disclosure gap at its source, and on the evidence presented here, it is the intervention with the highest ratio of benefit to cost.
5.6. Retrospective Comparison Against Documented Deployments
The design propositions in Section 6 are derived from the dimensional data reported above. Assessing whether they correspond to the conflicts that arise in practice requires evidence from outside that dataset. No such evidence is generated in this study. Instead, the published record of service-robot deployments in operational buildings was examined for documented dimensional and architectural conflicts. This record is limited, and only six studies were identified that report a real deployment in a finished interior together with at least one concrete architectural obstacle, which are summarised below.
Two of the six studies report measured dimensions. Schulze et al. [70] deployed a mobile manipulator in a German elderly care facility and in a university office building. They report that the lift in the care facility left less than 40 mm of clearance at the robot’s tail during turning and that the lift doors remained open for only six seconds. In addition, mirrored and reflective surfaces in the lift car degraded depth perception enough to cause a failed transit. Lee et al. [19] report 122 medication-delivery trials in a Korean tertiary hospital, of which 14 failed. Eight of these failures were caused by lift blockage, in which passengers and cargo near the doorway reduced the lateral clearance available to the platform. Other failures were caused by trolleys obstructing corridors and by loss of wireless coverage at the moment of lift boarding.
The remaining four studies report conflicts qualitatively. Birkhoff et al. [18] logged 107 human interventions during a cobot deployment in a 900-bed acute-care hospital. Of these, 72 concerned entering and leaving lifts, and 20 concerned the inability to open or pass through doors, including cases in which automatic doors closed before the platform had cleared the opening. Valner et al. [20] report narrow-corridor congestion, the absence of any programmatic interface to lifts and doors, and wireless dead zones as the principal obstacles to fleet deployment in an Estonian university hospital. Macalupu et al. [22] document an Australian residential aged care facility that carried out physical retrofit works to accommodate a robot fleet. These works included corridor widening, door automation, lift upgrading, wireless improvement and dedicated charging bays. Mutlu and Forlizzi [69] conducted a fifteen-month ethnography in a hospital. They describe a delivery platform that was repeatedly blocked by beds and wheelchairs left in corridors, conflict between robot and pedestrian traffic in busy areas, and complaints about the platform’s audible announcements in occupied areas.
When compared with the sixteen propositions, this record is consistent with eight of them. Corridor width, doorway clear width and dwell behaviour, threshold and level change, lift sizing and integration, floor surface behaviour, vertical clearance of the lift envelope, network coverage, charging provision and acoustic emission all appear as reported causes of failure. The record contains nothing relating to three of the propositions, since no study in the set reports a floor structural-load failure, an overhead-clearance collision, or a ramp-gradient failure. This absence does not show that such conflicts do not occur. It more likely shows that they are not reported, since a structural or overhead conflict is typically identified and remedied before a deployment and not during it. In either case, the observation supports the reporting standard proposed in Section 7.
A seventh study is included for completeness, but it is given less weight. Karlsen et al. [21] report that stairs, raised plateaux and high doorsteps must be rebuilt before restaurant deployment and that an onsite assessment of the physical environment is standard commercial practice before installation. However, the restaurant they observed was selected because it required no modification. The study therefore shows that dimensional screening is routine, but it does not document an observed failure.
This comparison has three limitations. The six studies were not designed to test these propositions, so the correspondence is interpretive and is not a test. They are subject to publication bias, in that deployments which proceeded without conflict are unlikely to be written up. Finally, they are heavily concentrated in healthcare, with a single aged-care facility and a single office setting between them. This exercise establishes that the categories of conflict addressed by the propositions are those that practitioners actually encounter. However, it does not establish that the specific numerical thresholds are correct. The latter requires the programme described in Section 6.6.
5.7. Limitations
Several limitations should be acknowledged, and they bear directly on how the quantitative results should be read.
The sample of 36 platforms is a purposive selection of commercially deployed products, not a probability sample of the robot population. It is bounded by what manufacturers disclose, and that boundary is not random: as Section 4.2 shows, disclosure varies systematically by sector, so the sample under-represents healthcare logistics, security, and telepresence platforms and over-represents hospitality delivery and floor cleaning. Descriptive statistics computed on it describe the disclosed population, not the deployed one.
Two categories (security/patrol and healthcare logistics) contain two platforms each and are reported descriptively only. Telepresence is absent entirely. The five categories that could be tested contain 32 platforms between them, which limits statistical power; the non-significant width and height results should not be read as evidence that categories do not differ on those parameters, only that any difference is not detectable at this sample size. To make that constraint concrete, a resampling calculation was performed in which the observed category distributions were treated as the population and samples of increasing size were drawn. On that basis, approximately 80 platforms, or roughly two and a half times the present tested sample, would be required to detect between-category width and height differences of the observed magnitude with 95% power at . In comparison, the weight difference is already detected with approximately 94% power. This figure is offered as a sampling target for future studies and not as a post hoc power estimate, because a post hoc estimate would not be informative about the present result. Dunn’s post hoc tests identified no significant pairwise contrasts, so the omnibus weight result cannot be attributed to any specific pair of categories.
The weight column is basis-heterogeneous. Manufacturers differ in whether they publish empty, dry, net, or operating weights, and most publish a single unqualified figure. Two platforms rely on third-party rather than manufacturer figures. Dimensional data are limited to static envelopes; dynamic operational parameters such as turning radii, sensor sweep widths, and deceleration distances are discussed qualitatively but not systematically measured. Two platforms have variable height and are recorded at maximum extension.
The composition of the sample also affects the central finding. The common deployment zone is recovered robustly under leave-one-out and bootstrap resampling but not when hospitality delivery platforms are removed (Section 4.6). Ten of the zone’s seventeen members belong to that one category. This category is also the best-disclosed sector in the survey, as every hospitality delivery manufacturer approached publishes complete dimensions, while healthcare, security and telepresence vendors often publish none. The zone may therefore reflect the dimensional convergence of the sector that discloses most and not that of the deployed population as a whole. To distinguish between these two interpretations, a sample is needed in which the categories are more evenly represented. This in turn requires the reporting practice proposed in Section 7. This is the clearest instance in the study of the disclosure gap constraining not merely the survey’s coverage but the interpretation of its principal result.
Another limitation concerns geographic transferability. The sample is international, and the dimensional envelope it describes is therefore not specific to any one market. The architectural side of the comparison is not transferable in the same way. Corridor, doorway and threshold minimums differ considerably between jurisdictions, as Table 4 shows, and the compliance proportions reported in Section 4.8 are computed against United States standards. Researchers and practitioners applying the framework elsewhere should retain the robot-side envelope and recompute the compliance analysis against their local building codes. The framework is designed so that this substitution is straightforward.
Finally, the sixteen design propositions are derived analytically from the dimensional data and from comparative assessment against existing building standards. They have not been validated through practitioner evaluation—structured expert surveys or Delphi panels—or through empirical field testing in real deployment settings, and the retrospective comparison in Section 5.6 is an interpretive reading of six studies not designed to test them. They should therefore be regarded as analytically derived propositions offered for validation and not as validated recommendations. They should not be adopted as mandatory requirements on the basis of this study alone. Practitioner validation and post-occupancy evaluation of robopometrically designed facilities constitute priority directions for future research and are specified in Section 6.6.
6. Proposed Design Guidelines
Sixteen guidelines are derived from comparative analysis of robot dimensions against architectural parameters. Each specifies the relevant element, the dimensional requirement with its stated justification, and implementation considerations.
The sixteen propositions do not all stand in the same relation to the dimensional data, and the reader is entitled to know which is which without reconstructing it. The sixteen propositions can be classified into three groups, as follows. Dimensionally derived propositions follow from the distributions reported in Section 4. Guidelines 1, 2, 3, 7, 8, 12 and 14 are obtained from the CDZ width ceiling, the maximum height, the swept envelope or the 200 kg threshold, and they would change if the underlying data changed. Standard-adopted propositions restate an existing requirement in a form relevant to robots. Guidelines 4, 5 and 11 take their main values from accessibility and lighting standards, cited at the relevant clause. Operational-context propositions (Guidelines 6, 9, 10, 13 and 15, covering charging provision, acoustics, wayfinding, safety zones and network infrastructure) are not derived from the dimensional data at all. They address conditions that determine whether a dimensionally compatible building is also one in which robots can operate. They are included because the deployment record shows these conditions failing (Section 5.6). They are, however, conclusions of the framework only in a limited sense, namely that a building which satisfies the dimensional propositions but fails these will still not work. A reader interested solely in the dimensional contribution may confine attention to the first group.
These are analytically derived propositions, not empirically validated recommendations. Each is obtained from the dimensional distribution reported in Section 4, from an existing standard adopted by reference, or from an engineering assumption stated here. None of them has been tested in the built environment that it is intended to govern. Table 9 states which of these three bases underlies each numerical value, so that a reader can distinguish a figure that follows from the data from one that has been adopted or assumed. Table 10 reports the proportion of the sample that each dimensional proposition accommodates. This shows internal consistency with the dataset from which the propositions are derived, but it is not an external validation.
Table 9.
Provenance of the principal numerical values in the sixteen propositions. Derived denotes a value obtained from the dimensional distribution reported in Section 4. Adopted denotes a value taken from a named standard, cited at the relevant clause. Assumed denotes an engineering assumption made by the authors, for which no source is claimed.
Table 10.
Proportion of the 36 verified platforms accommodated by each dimensional proposition. These figures show consistency between the propositions and the dataset from which they are derived. They are not an external test of the propositions.
The guidelines are organised into five thematic clusters: (A) spatial circulation, addressing the plan-level dimensions that govern robot movement through floor plates; (B) vertical access and structural capacity, addressing elevation-level and load-bearing considerations; (C) operational infrastructure, addressing the mechanical, electrical, and data systems that support robot operation; (D) sensory and environmental compatibility, addressing the perceptual conditions of shared human–robot spaces; and (E) safety, accessibility, and integration, addressing barrier-free mobility, operational safety zones, differentiated lift strategies, and network connectivity. Schematic illustrations (Figure 6, Figure 7, Figure 8, Figure 9, Figure 10, Figure 11, Figure 12, Figure 13, Figure 14, Figure 15, Figure 16, Figure 17, Figure 18, Figure 19 and Figure 20) accompany each guideline.
6.1. Spatial Circulation (Guidelines 1 and 2)
Guidelines 1 and 2 address the plan-level spatial dimensions that determine whether robots can physically traverse a building’s horizontal circulation network. Both derive from the CDZ envelope (Section 4.6), and both are qualified by the swept-envelope analysis of Section 4.9, which shows that passage through an opening and reversal within it are different requirements.
6.1.1. Guideline 1: Corridor and Aisle Width
The widest CDZ platform measures 630 mm. Three allowances are added to this width: the lateral positioning tolerance of 118 mm derived in Section 4.10 for a platform held to manufacturer-declared accuracy, a separation allowance of 50 mm, and a minimum pedestrian body width of approximately 400 mm. This gives 1198 mm, and hence a minimum single-direction corridor width of 1200 mm (Figure 6). The same figure can be obtained by adding an undifferentiated 150 mm buffer. The decomposition is given here for two reasons. It makes the accuracy assumption in the value visible, and it allows facilities that deploy platforms of different navigational accuracy to recompute the width from Table 6, instead of adopting a figure derived for a class of platform that they may not be procuring. Bidirectional robot–pedestrian traffic requires 1800 mm, which exceeds both the IBC minimum (1118 mm, Table 1020.3) [14] and the ADA minimum (914 mm, Section 403.5.1) [13]. Table 6 shows that 1800 mm corresponds to two platforms passing each other with open-loop wheeled accuracy. The figure falls to 1600 mm for platforms held to declared accuracy and rises to 2000 mm for free-navigating platforms. Because functional category is a weak predictor of plan dimensions (Section 4.4), corridor provision should be specified against the dimensional envelope of the platforms actually deployed rather than against their functional type. In new construction, 1800 mm primary corridors should be specified for multi-robot facilities; in existing buildings, selective corridor widening at pinch points and the designation of robot-priority corridors may be more cost-effective than facility-wide modifications. Restaurant aisles require a minimum of 900 mm between items of furniture, which accommodates the narrowest hospitality platform in the sample (384 mm) with 258 mm of clearance per side and the widest (570 mm) with 165 mm per side.
Figure 6.
Guideline 1: corridor and aisle width. Design requirements showing 1200 mm single-direction and 1800 mm bidirectional corridors with lateral clearance zones.
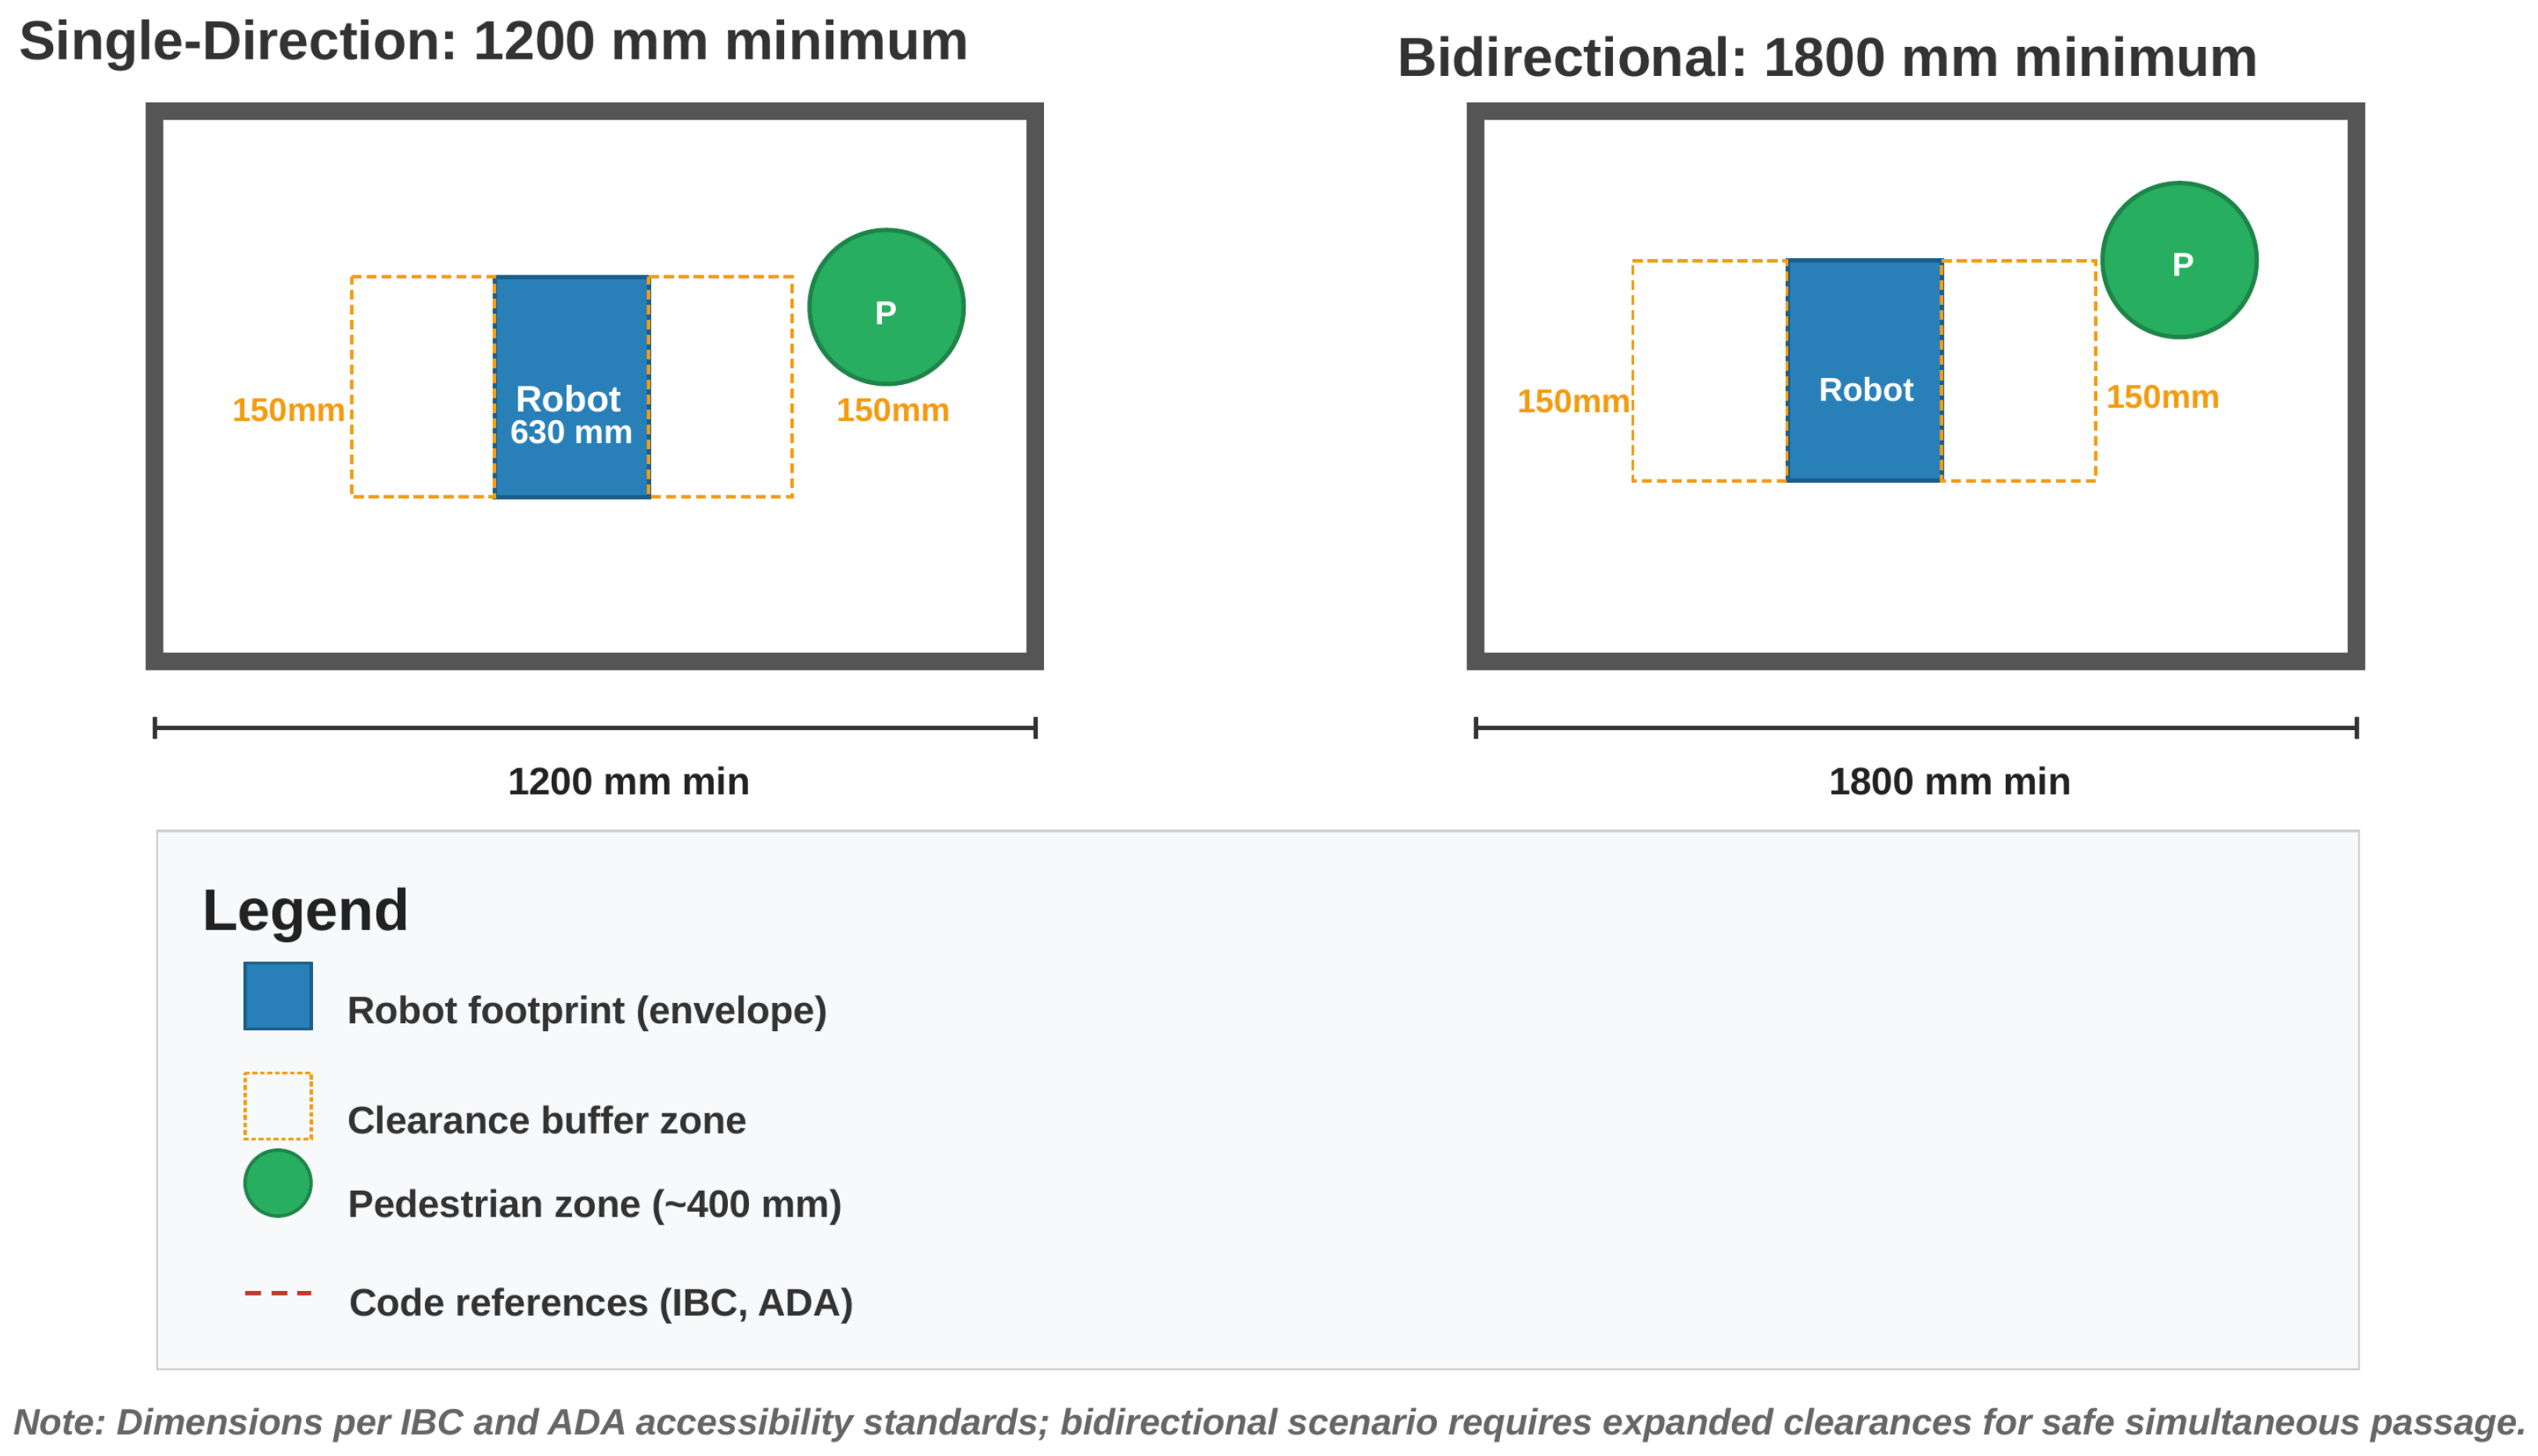
6.1.2. Guideline 2: Doorway Clear Width and Threshold Profiles
All CDZ platforms pass through 900 mm doorways with at least 135 mm of clearance per side (Figure 7). That margin corresponds to the manufacturer-declared accuracy class of Table 6. It is not adequate for a free-navigating platform, which requires a 1300 mm opening by the same model. In addition, the evidence in Section 2.5 shows that localisation degrades specifically at doorways [41,43]. The 900 mm figure should therefore be treated as conditional on the declared accuracy of the platforms to be deployed, as set out in Guideline 16. The critical issue is the threshold profile: small-diameter caster wheels (75–125 mm) are sensitive to vertical discontinuities. Thresholds must therefore be flush or recessed. Under the ADA [13], a vertical change in level of up to 6.4 mm (one quarter of an inch, Section 303.2) requires no treatment; between 6.4 and 13 mm the portion above 6.4 mm must be bevelled at a slope no steeper than 1:2 (Section 303.3); and any change exceeding 13 mm requires a ramp (Section 303.4) at a maximum 1:12 running slope (Section 405.2). Fire-rated assemblies with raised thresholds require automatic drop-seal or magnetic smoke-seal alternatives that maintain the fire rating without permanent barriers. Door closers should accommodate robot transit speeds of 0.5–1.2 m/s, which are slower than human walking speed. Robot-compatible doorways also benefit wheelchair users and patients on gurneys [15], exemplifying the synergy between robopometric and universal design. Threshold modifications are among the lowest-cost spatial interventions, as they involve replacing door hardware rather than making structural modifications. Fire-rated assemblies, however, are regulated by local fire codes, and any threshold modification must maintain the assembly’s fire rating.
Figure 7.
Guideline 2: doorway clear width and thresholds. Requirements for a 900 mm minimum clear opening (1000 mm preferred) and flush threshold profiles.
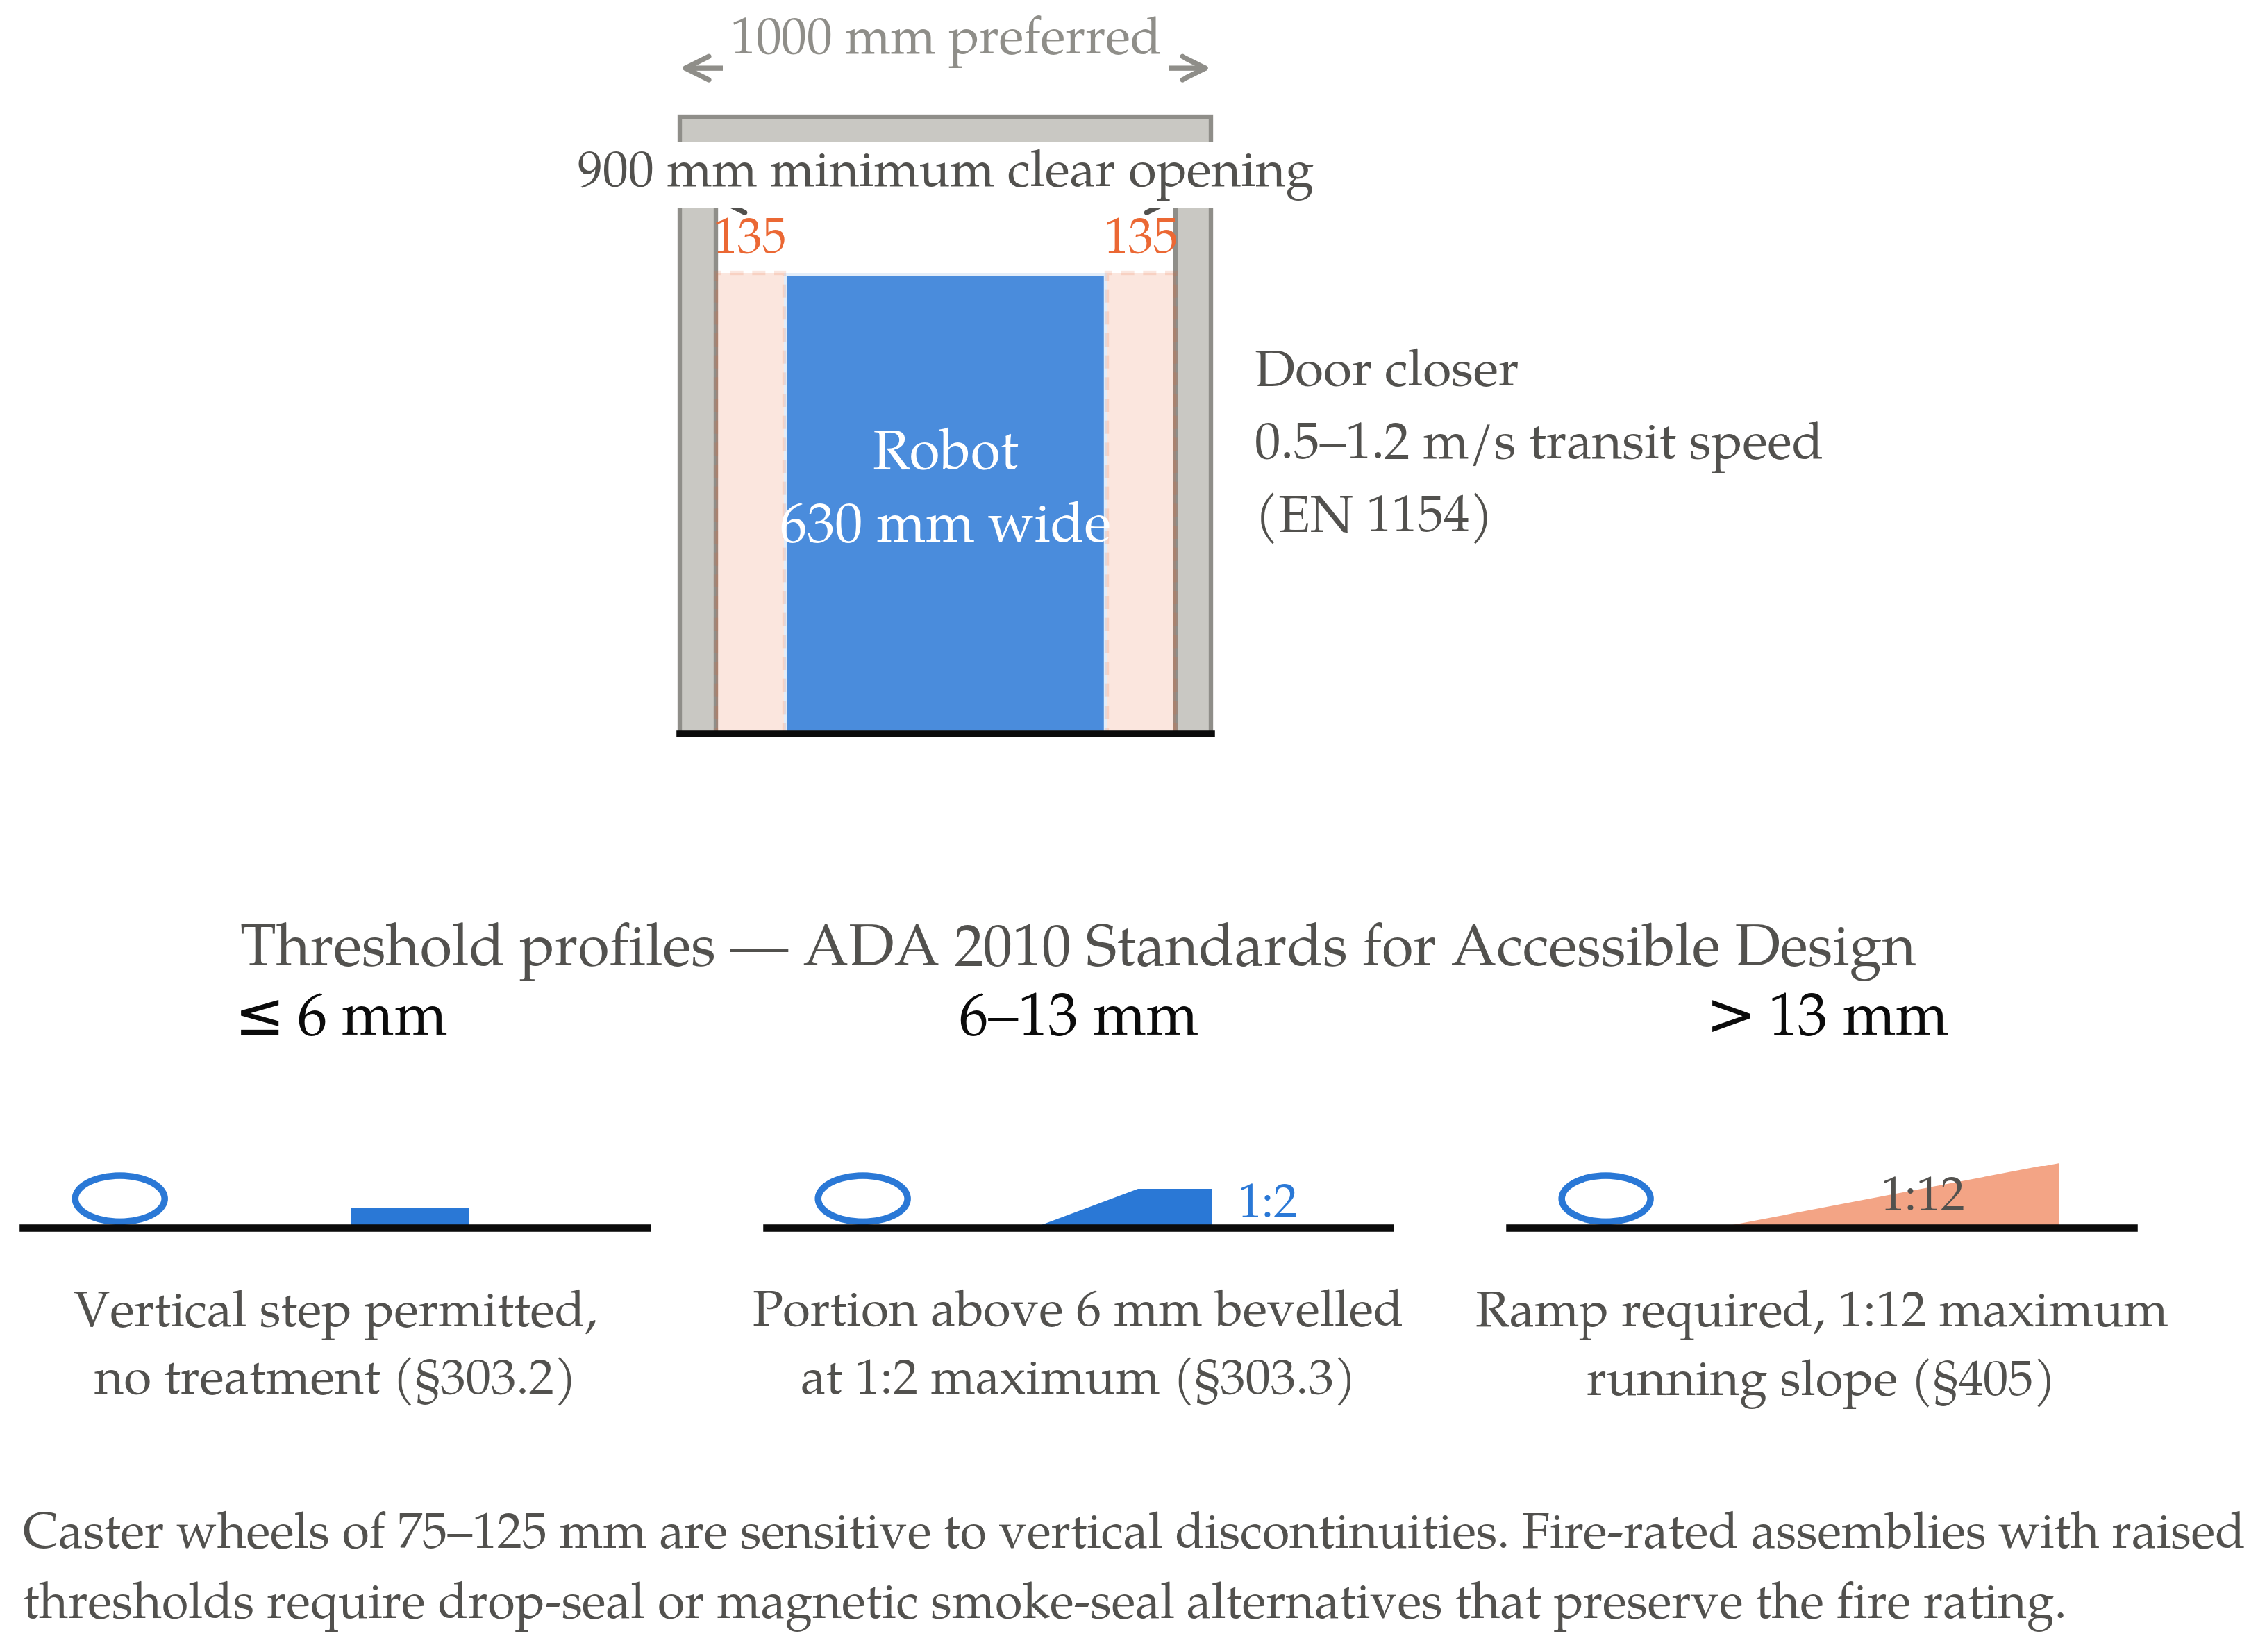
6.2. Vertical Access and Structural Capacity (Guidelines 3–5)
Guidelines 3, 4, and 5 address the vertical and structural dimensions of robot–building compatibility: elevator access, ramp traversal, and floor load capacity. These guidelines draw primarily on the height distribution, the strong width–weight correlation (), and the extreme weight heterogeneity (CV = 145.8%) identified in Section 4.
6.2.1. Guideline 3: Elevator Cab Sizing and Integration
The largest CDZ platform (630 mm) plus one human co-occupant requires a minimum cab interior of 1370 × 1524 mm, with a door clear opening of at least 1067 mm (Figure 8). Integration requires an electronic application programming interface (API) between the robot fleet management system and the elevator controller. In new construction, standardised robot–elevator interfaces should be specified (ISO/TC 184 [68]). Elevator modifications are among the most expensive interventions, involving the elevator manufacturer, building management systems, and safety certifications. In multi-tenant buildings, peak-hour conflicts require fleet management scheduling, and hospital applications may require dedicated elevator access for time-sensitive medication delivery. The two healthcare logistics platforms in the sample are the tallest in the study (mean 1650 mm), which—while too small a group to generalise from—is consistent with the vertical form factor typical of UV disinfection and mobile manipulation platforms and reinforces the need for generous elevator cab dimensions in medical facilities.
Figure 8.
Guideline 3: elevator cab sizing and integration. Minimum cab interior dimensions (1370 × 1524 mm) for simultaneous robot–human occupancy.
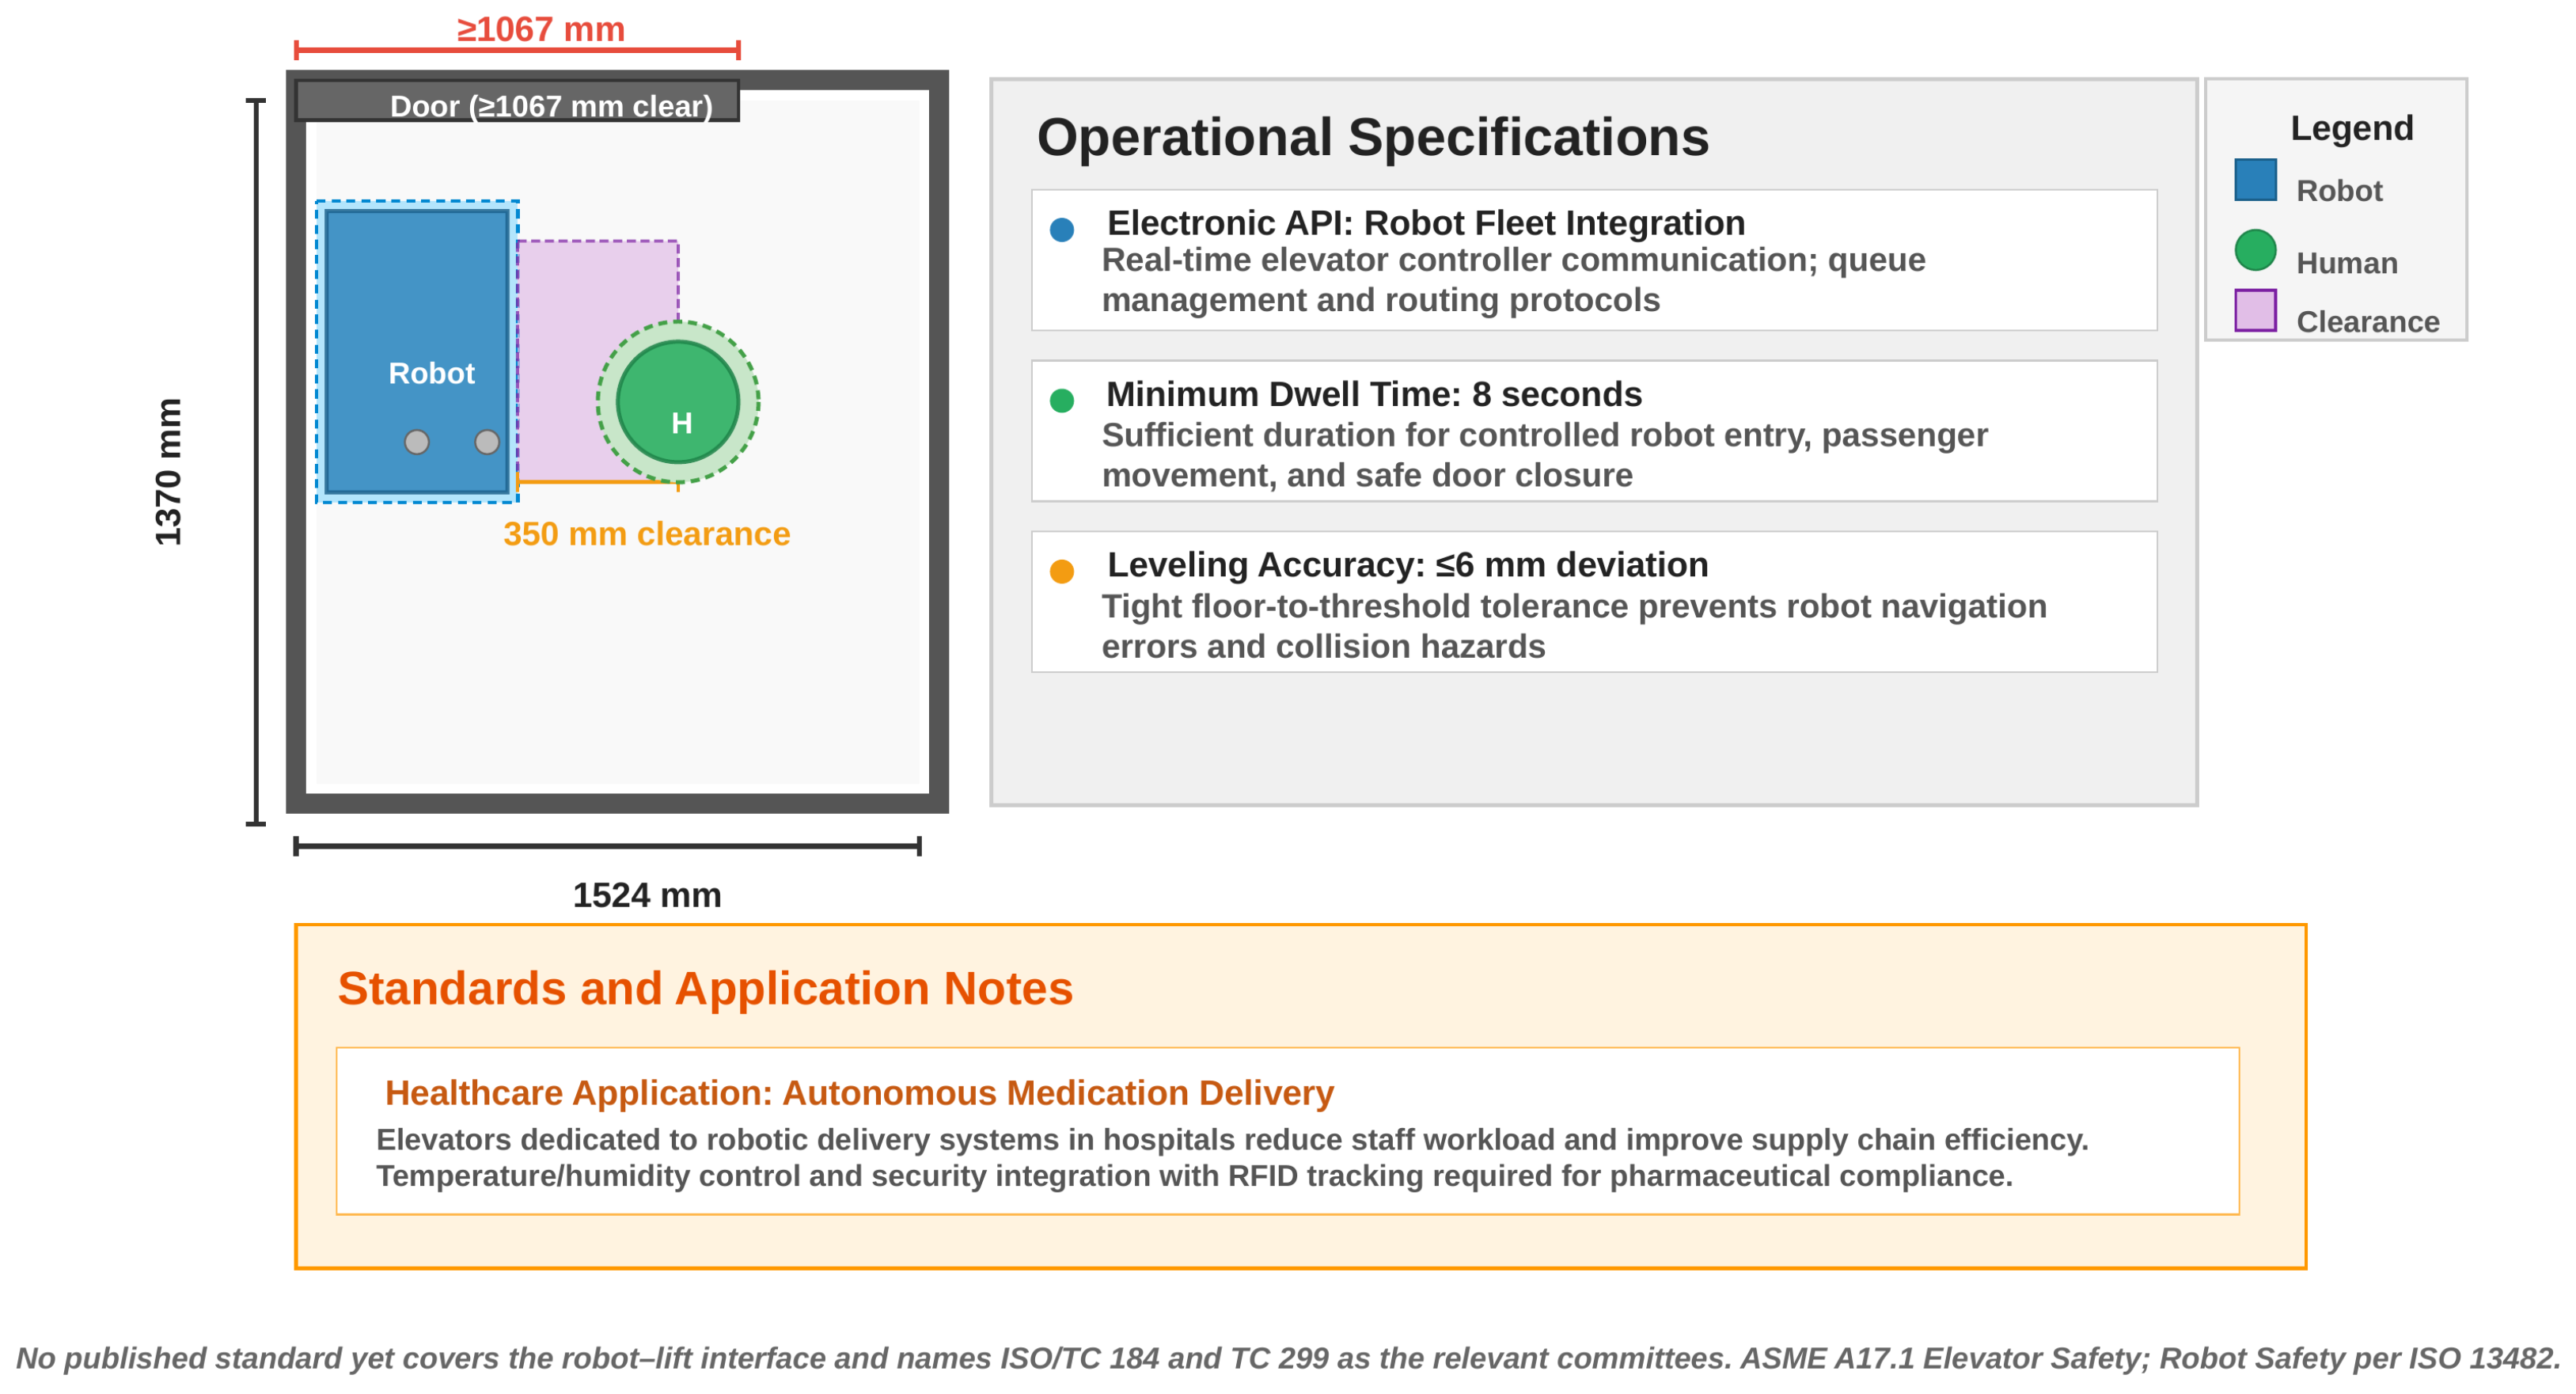
6.2.2. Guideline 4: Ramp Gradients and Vertical Transitions
Most wheeled robots traverse gradients of up to 5°, but robots carrying liquid tanks or loaded trays experience payload shift on inclines. The strong width–weight correlation () implies that the widest platforms are also the heaviest and therefore face the greatest traction challenges. The recommended maximum gradient is 3.5° (approximately a 6% slope), with level landing pads of at least 1500 mm at both ends (Figure 9). Floor-surface transitions must maintain a height differential of no more than 6.4 mm, with bevelled profiles no steeper than a 1:2 slope, consistent with ADA ramp requirements [13] and adequate for all wheeled platforms in the dataset. A systematic survey of all floor transitions in the robot’s planned operating zone should precede deployment, with non-compliant transitions remediated through bevelled inserts or ramped threshold plates.
Figure 9.
Guideline 4: ramp gradients and vertical transitions. Maximum slope requirements with landing pads and transition tolerances.
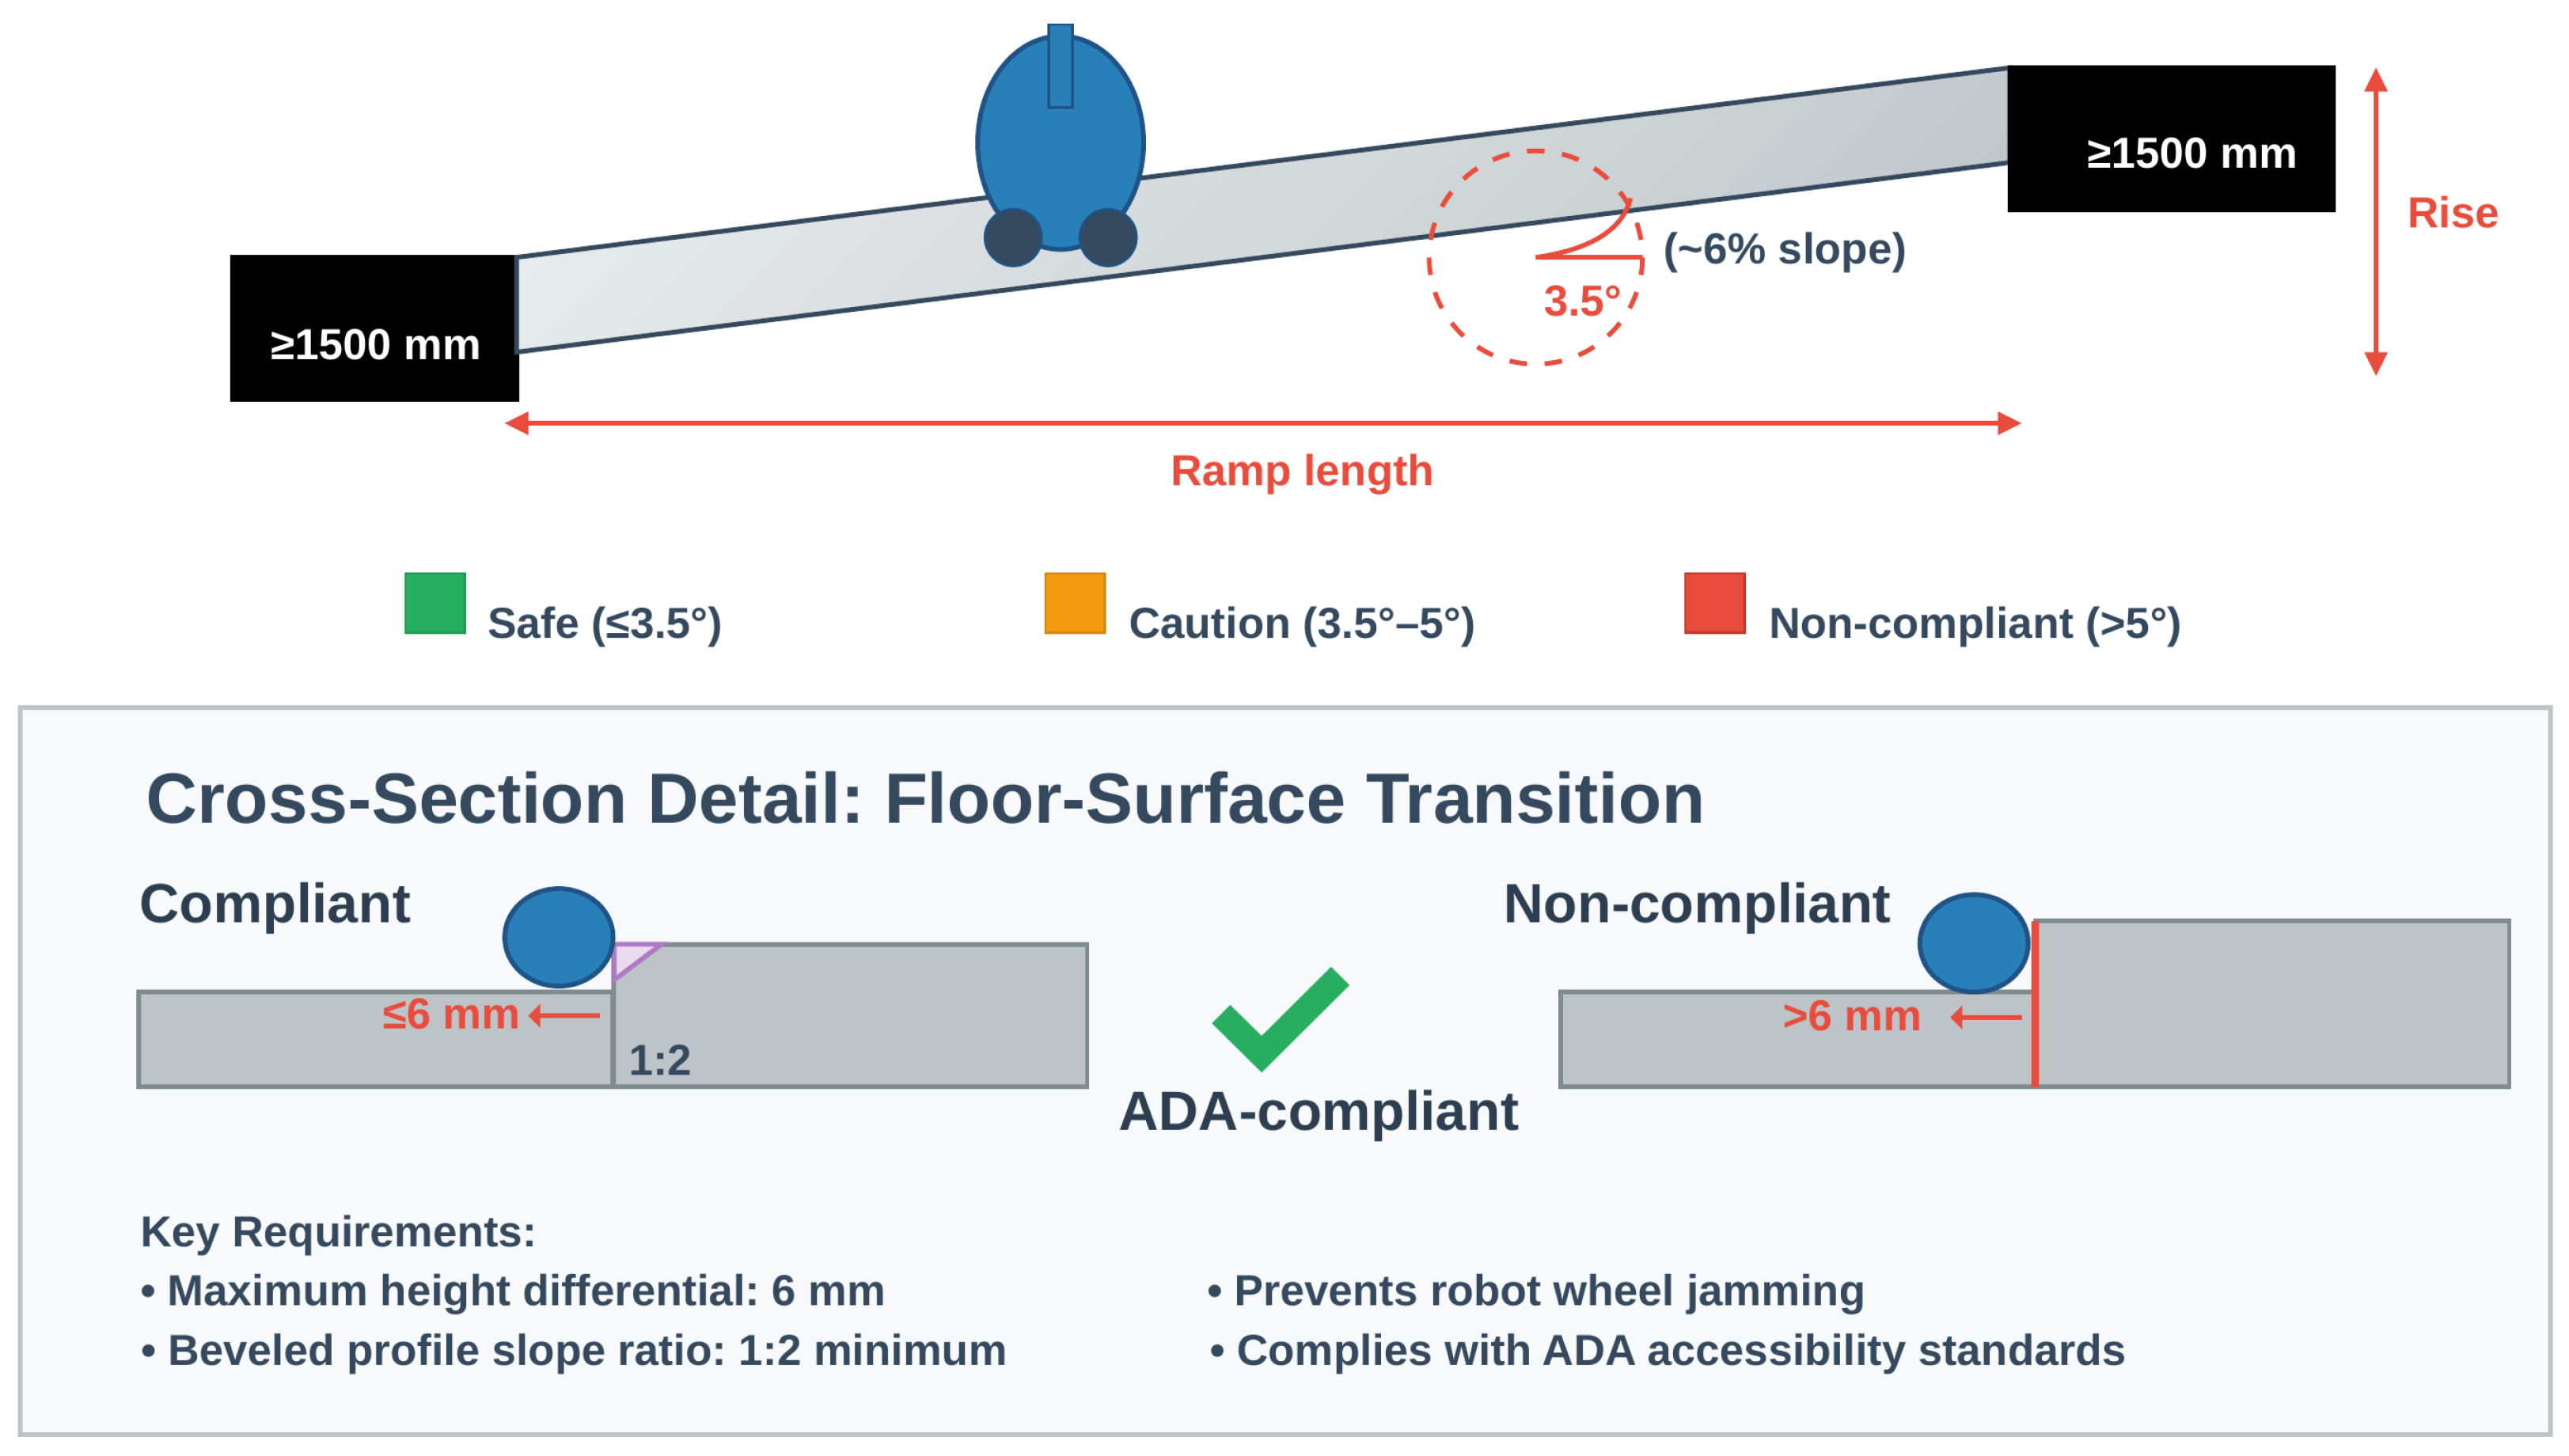
6.2.3. Guideline 5: Floor Surface Material and Structural Capacity
Floor surfaces must satisfy three robopometric criteria (Figure 10). First, coefficient of friction: a COF of 0.4–0.6 is required for reliable wheel traction, and polished marble and wet-mopped tile may fall below this range. Second, point-load structural capacity: platforms exceeding 200 kg concentrate 180–370 kg per wheel over small contact patches, requiring structural engineering assessment. Third, surface reflectivity: specular finishes produce phantom LiDAR returns that cause path-planning failures, so matte or satin finishes with diffuse reflectance are preferred. Deep-pile carpet (>10 mm) creates excessive rolling resistance. Structural assessments should be conducted during the facilities’ management due-diligence phase before robot procurement, not afterwards. Only 11% of platforms in the sample reach or exceed 200 kg, so structural load concerns affect a minority of deployments—but those deployments involve the largest and most expensive machines (industrial scrubbers and heavy logistics AMRs), which makes proactive assessment cost-effective.
Figure 10.
Guideline 5: floor surface material and structural capacity. Classification with suitability ratings, coefficient of friction requirements, and structural thresholds.
6.3. Operational Infrastructure (Guidelines 6–8)
Guidelines 6, 7, and 8 address the infrastructure systems and spatial provisions that support robot operation beyond basic circulation: energy supply, overhead clearance for tall platforms, and traffic management in multi-robot facilities.
6.3.1. Guideline 6: Charging and Docking Infrastructure
Each robot requires 0.5–1.0 m2 for charging and docking (Figure 11). A fleet of five delivery robots therefore needs approximately 4 m2 of dedicated space. Cleaning robots with refuel stations (for example, LionsBot platforms) require plumbing connections for clean water supply and waste drainage—MEP coordination comparable to a washroom fit-out. Charging zones should be located in low-traffic areas with adequate ventilation for lithium-ion thermal management (15–35 °C), away from fire exits and primary egress routes. New construction should include dedicated “bot bay” specifications with a 50–100% growth margin, given the market’s expansion trajectory [1,2].
6.3.2. Guideline 7: Vertical Clearance
Four platforms (11%) exceed 1500 mm in height, and the tallest in the sample—the UVD Robot Model C at 1780 mm—requires a minimum vertical clearance of 2000 mm in all robot-trafficked zones, leaving 220 mm for sensor modules and antennas (Figure 12). Because tall platforms are concentrated in categories whose manufacturers disclose least (Section 4.2), the 1780 mm figure should be treated as a lower bound on the tallest platform a facility may encounter, and a 2000 mm clearance standard is correspondingly prudent rather than generous. Pendant light fixtures, overhead signage below 2000 mm, exposed ductwork, sprinkler head projections, and low-clearance service doors may obstruct tall robots or trigger false obstacle detection, even where they comply with human-occupancy codes requiring a minimum headroom of 2032 mm [14]. Overhead obstacles that interfere with robot sensor fields of view degrade environmental perception and cause navigation failures [15]. A systematic overhead clearance survey documenting all projections below 2000 mm should therefore be conducted before robot deployment in any new operating zone.
Figure 11.
Guideline 6: charging and docking infrastructure. Spatial allocation and infrastructure requirements for charging zones.
Figure 12.
Guideline 7: vertical clearance. Requirements showing 2000 mm minimum overhead clearance and conflict elements (signage, fixtures, and ductwork).
6.3.3. Guideline 8: Multi-Robot Spatial Planning
When multiple robot types share a facility, the widest platform determines the minimum clearance while the most frequent determines the optimisation target. Designated passing zones ( mm) should be provided every 20–30 m along primary corridors (Figure 13). Queue staging areas ( m2) are needed at elevator lobbies, kitchen pass-throughs, and pharmacy stations. Where dimensionally disparate platforms coexist (for example, LionsBot R3-class and R12-class machines), zoning strategies should designate specific routes and time windows per size class, analogous to weight-restricted roadways. Fleet management software coordinates traffic, but the physical infrastructure must provide spatial buffers for simultaneous multi-robot operation. Because width does not differ significantly between functional categories (Section 4.4), size classes for zoning purposes should be defined on measured dimensions rather than on robot function—two platforms performing quite different tasks may impose identical clearance requirements, while two machines from the same category may not.
Figure 13.
Guideline 8: multi-robot spatial planning. Corridor design with passing zones, staging areas, and traffic separation strategies.
6.4. Sensory and Environmental Compatibility (Guidelines 9–11)
Guidelines 9, 10, and 11 address the perceptual environment of shared human–robot spaces: acoustic conditions, wayfinding for both human and robotic navigators, and lighting compatibility with robot sensor systems.
6.4.1. Guideline 9: Acoustic and Vibration Management
Acoustic emission is inconsistently disclosed. Of the ten floor-cleaning platforms in the sample, eight publish a sound level: LionsBot reports 57–65 dB for the R3 Scrub, 61.7 dB for the R3 Vac, 71 dB for the R3 Scrub Pro, 70–75.1 dB for the R12 Rex Scrub, and 71 dB for the R12 Rex CS [3,4,5,6,7]; Avidbots reports 72 dBA for the Neo [54]; Gausium reports 59–70 dB(A) for the Scrubber 50 [80]; and Pudu specifies below 70 dB(A) for the CC1 [81] (Figure 14). None of these manufacturers state a measurement distance, microphone position, or test standard, and weighting is applied inconsistently across them, so the figures are indicative rather than strictly comparable. The remaining two cleaning platforms publish no acoustic figure at all.
For occupied-hours operation, a target of no more than 50 dB(A) at 1 m is recommended, consistent with the NC/RC design guidelines for offices—NC/RC 30 for private offices and conference rooms, and NC/RC 40 for open-plan offices [75]. No cleaning platform in the sample publishes a figure at or below that target. On the disclosed evidence, cleaning during occupied hours is therefore not achievable with the platforms surveyed and should be scheduled for off-hours, with occupied-hours cleaning treated as a procurement requirement to be demonstrated rather than assumed. Heavy platforms ( kg) with rigid polyurethane wheels generate floor-borne vibration that may interfere with sensitive equipment in healthcare settings (MRI suites and operating theatres) and laboratories, requiring vibration-isolated floor assemblies such as floating floors or resilient mounts in adjacent zones.
Because manufacturers do not declare acoustic emission on a common basis, sound pressure level at 1 m, declared against a named test standard such as EN 60335-2-72, should be a mandatory procurement criterion and is a further candidate for the minimal reporting standard proposed in Section 7.
Figure 14.
Guideline 9: acoustic and vibration management. Manufacturer-published sound levels for the floor-cleaning platforms in the sample, against the 50 dB(A) occupied-hours target. Platforms publishing no acoustic figure are omitted.
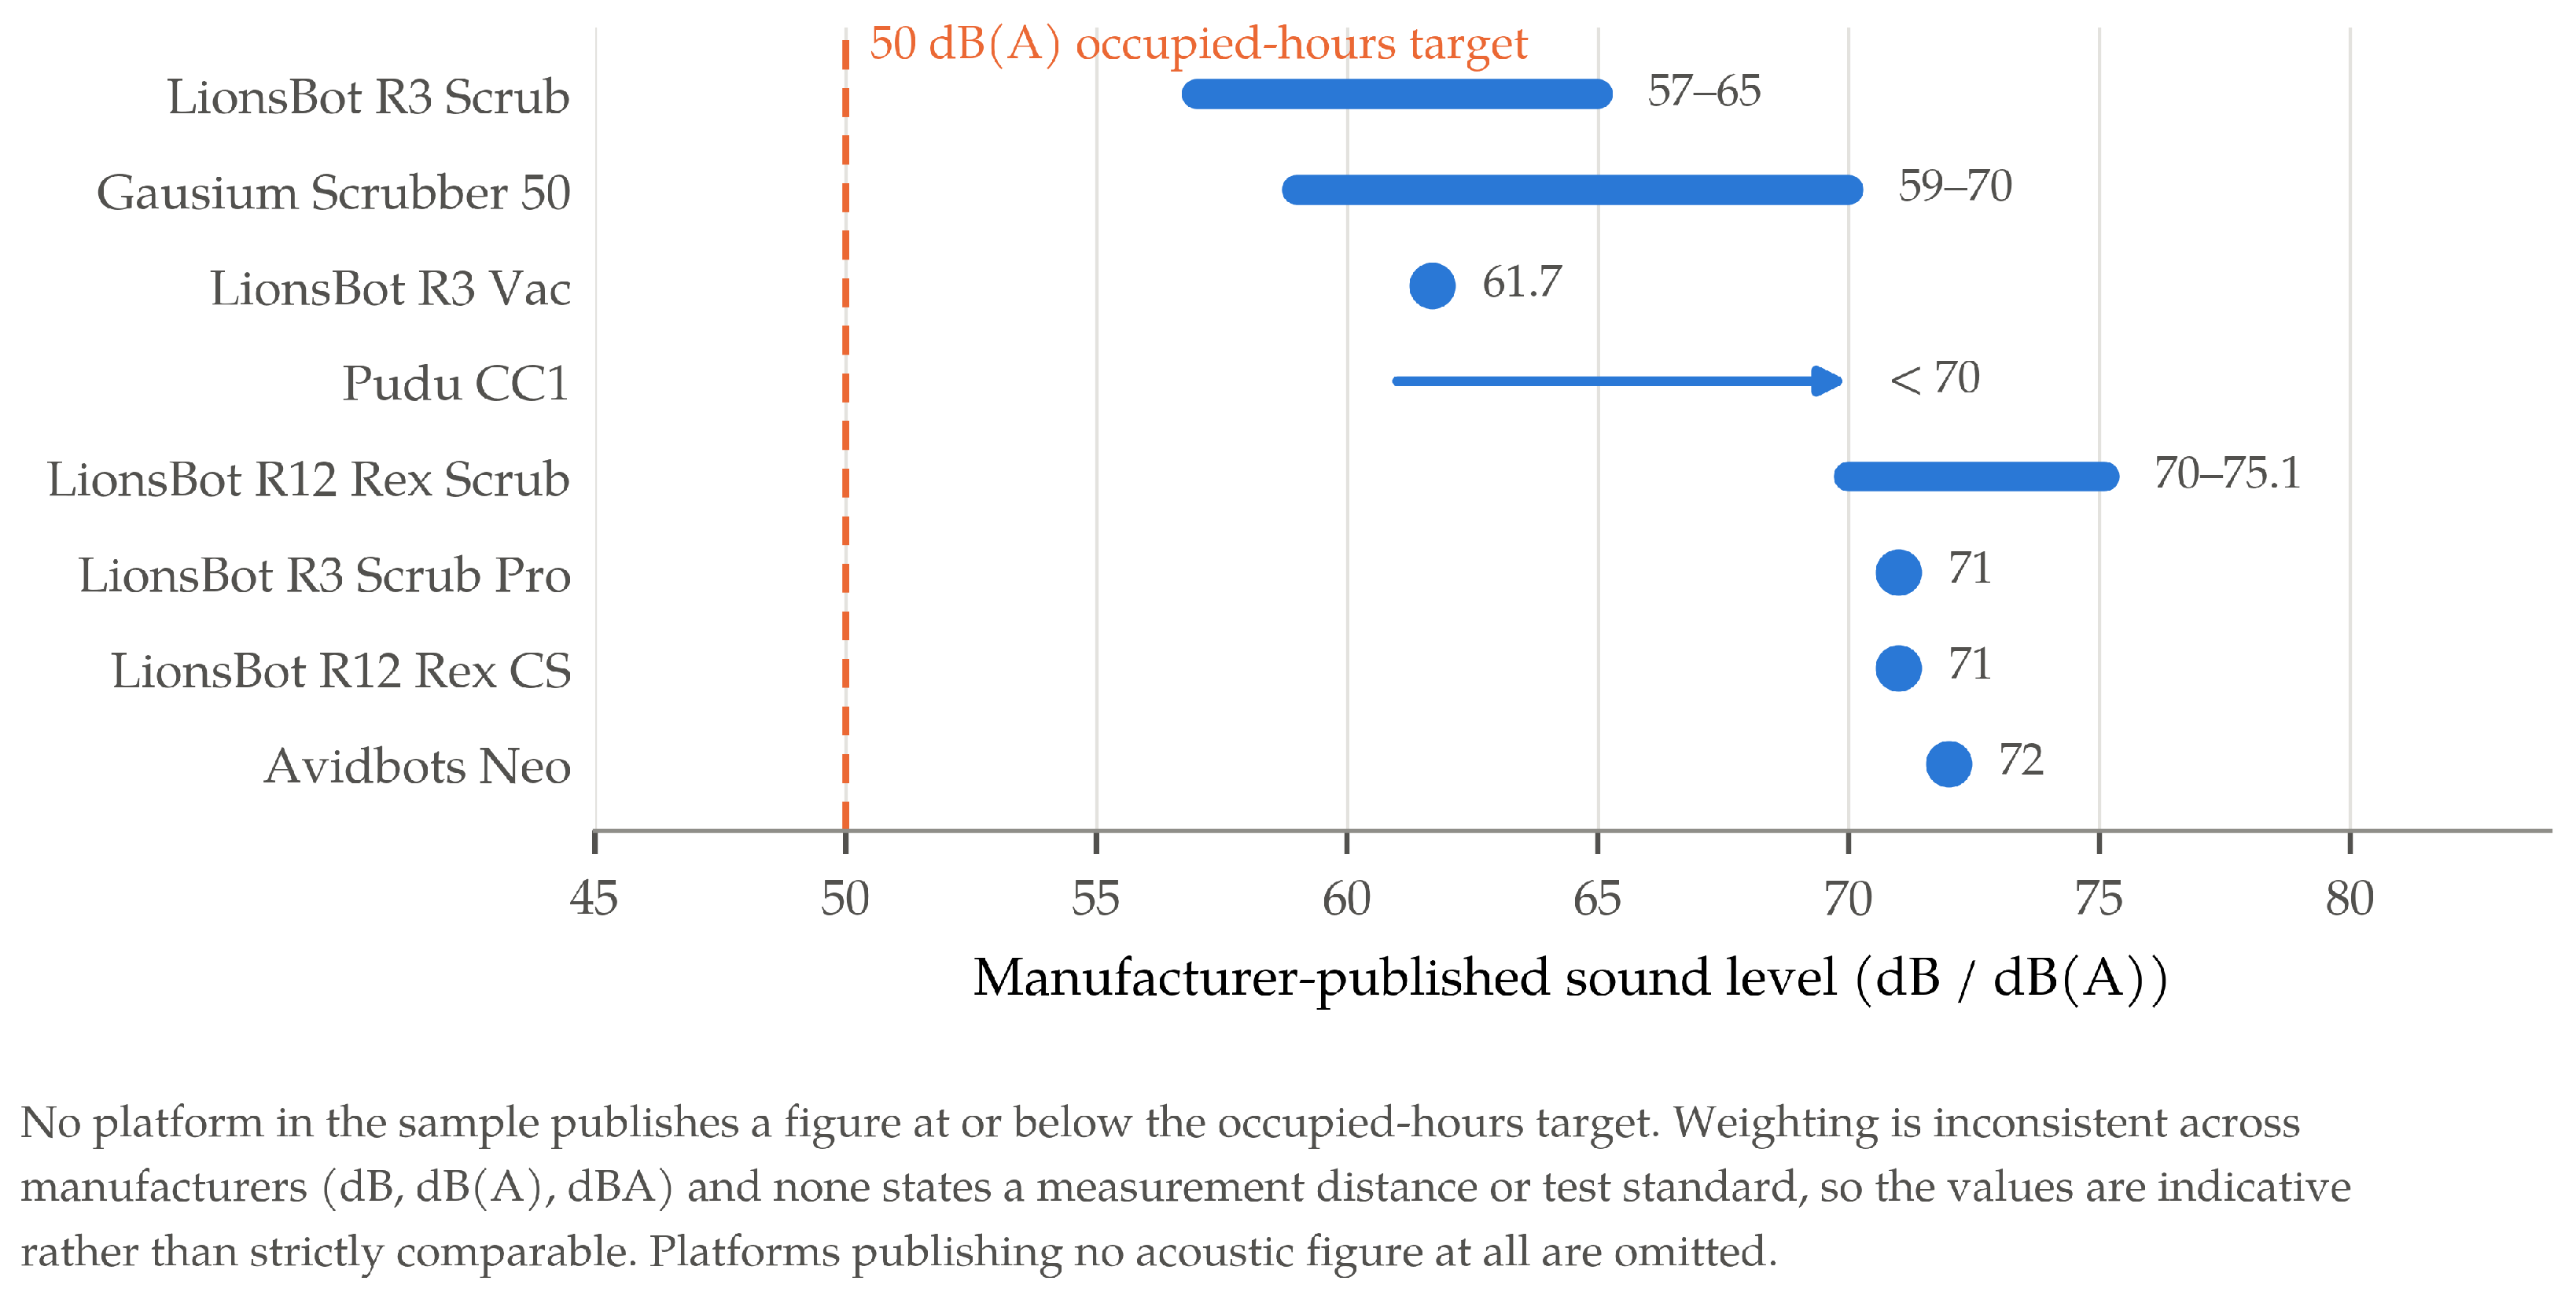
6.4.2. Guideline 10: Dual Wayfinding
Robot integration requires dual wayfinding systems serving both human occupants and robotic navigators (Figure 15). For humans, this means clear zone signage, convex safety mirrors at blind intersections, and real-time robot position displays. For robots, it means consistent floor finishes without sudden reflectivity transitions, LiDAR-detectable wall surfaces (avoiding full-height glass at the 100–500 mm sensor height), and clear sightlines with minimum 1.5 m visibility triangles at corners. The RIS observability principle [15] provides the theoretical foundation: spaces should be observable by robot sensors, not merely visible to human eyes. Emerging floor-level tactile wayfinding systems that serve both robot navigation sensors and visually impaired human users demonstrate the synergistic potential of human–robot co-inclusive design.
Figure 15.
Guideline 10: dual wayfinding. Design at a corridor intersection for simultaneous human and robot navigation.
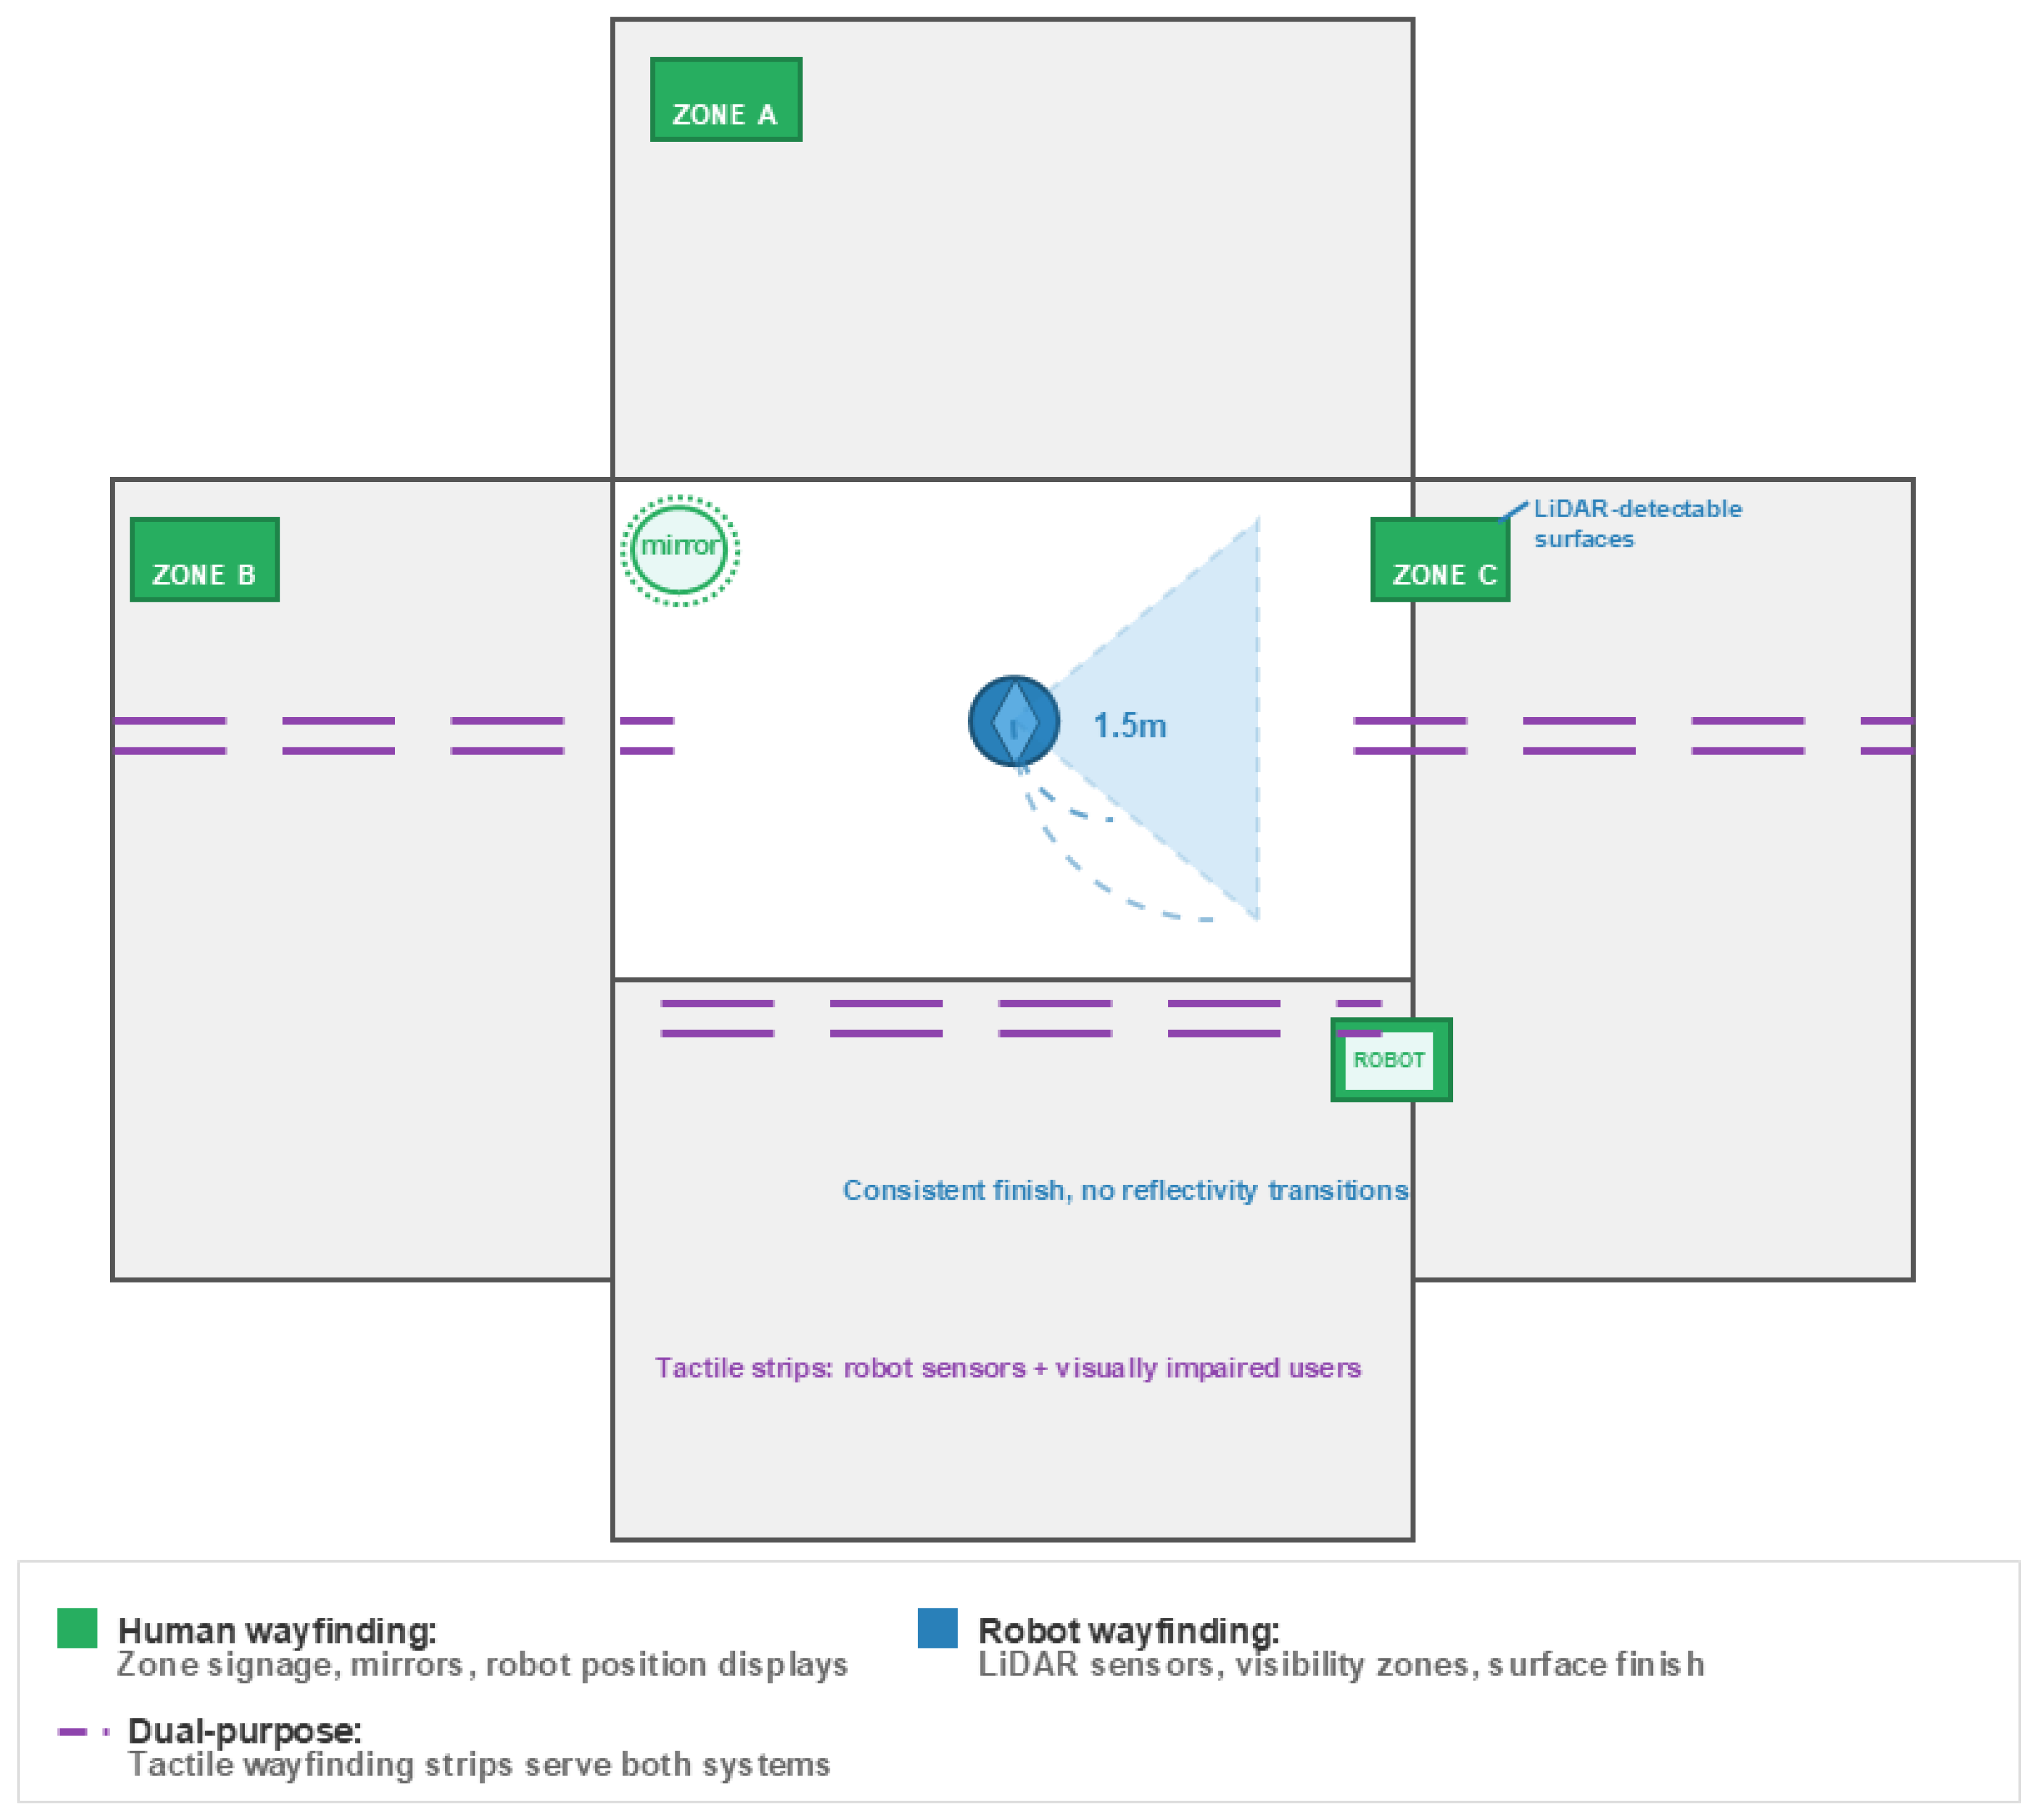
6.4.3. Guideline 11: Lighting for Robot Sensor Compatibility
Vision-based and LiDAR-equipped robots are sensitive to lighting conditions that do not affect human occupants (Figure 16). Directional downlights casting hard shadows on floor surfaces create false obstacle detections in depth cameras and structured-light sensors. High-contrast boundaries between illuminated and shadowed zones are particularly problematic, as many robots interpret these as physical edges or drop-offs. Specular floor reflections produce sensor saturation, and unshielded halogen or infrared lamps interfere with the near-infrared depth sensors used by most delivery and healthcare robots. Recommended conditions include diffuse, even illumination at 300–500 lux at floor level, a colour temperature of 3000–5000 K, and non-stroboscopic LED drivers (flicker-free above 300 Hz), consistent with standard office lighting (EN 12464-1 [76]). Transition zones between interior and exterior lighting, such as entrances and loading docks, require particular attention, as dramatic changes in illuminance can temporarily blind vision-based systems. These requirements demand no additional energy expenditure—only informed luminaire selection and positioning during the lighting design phase. In facilities with mixed natural and artificial lighting, automated dimming systems that maintain consistent floor-level illuminance reduce the frequency of robot sensor recalibration. The cost of specifying robot-compatible lighting at the design stage is negligible compared with that of retrofitting problematic luminaires after robot deployment.
Figure 16.
Guideline 11: lighting for robot sensor compatibility. Design requirements for robot vision and LiDAR sensor compatibility.
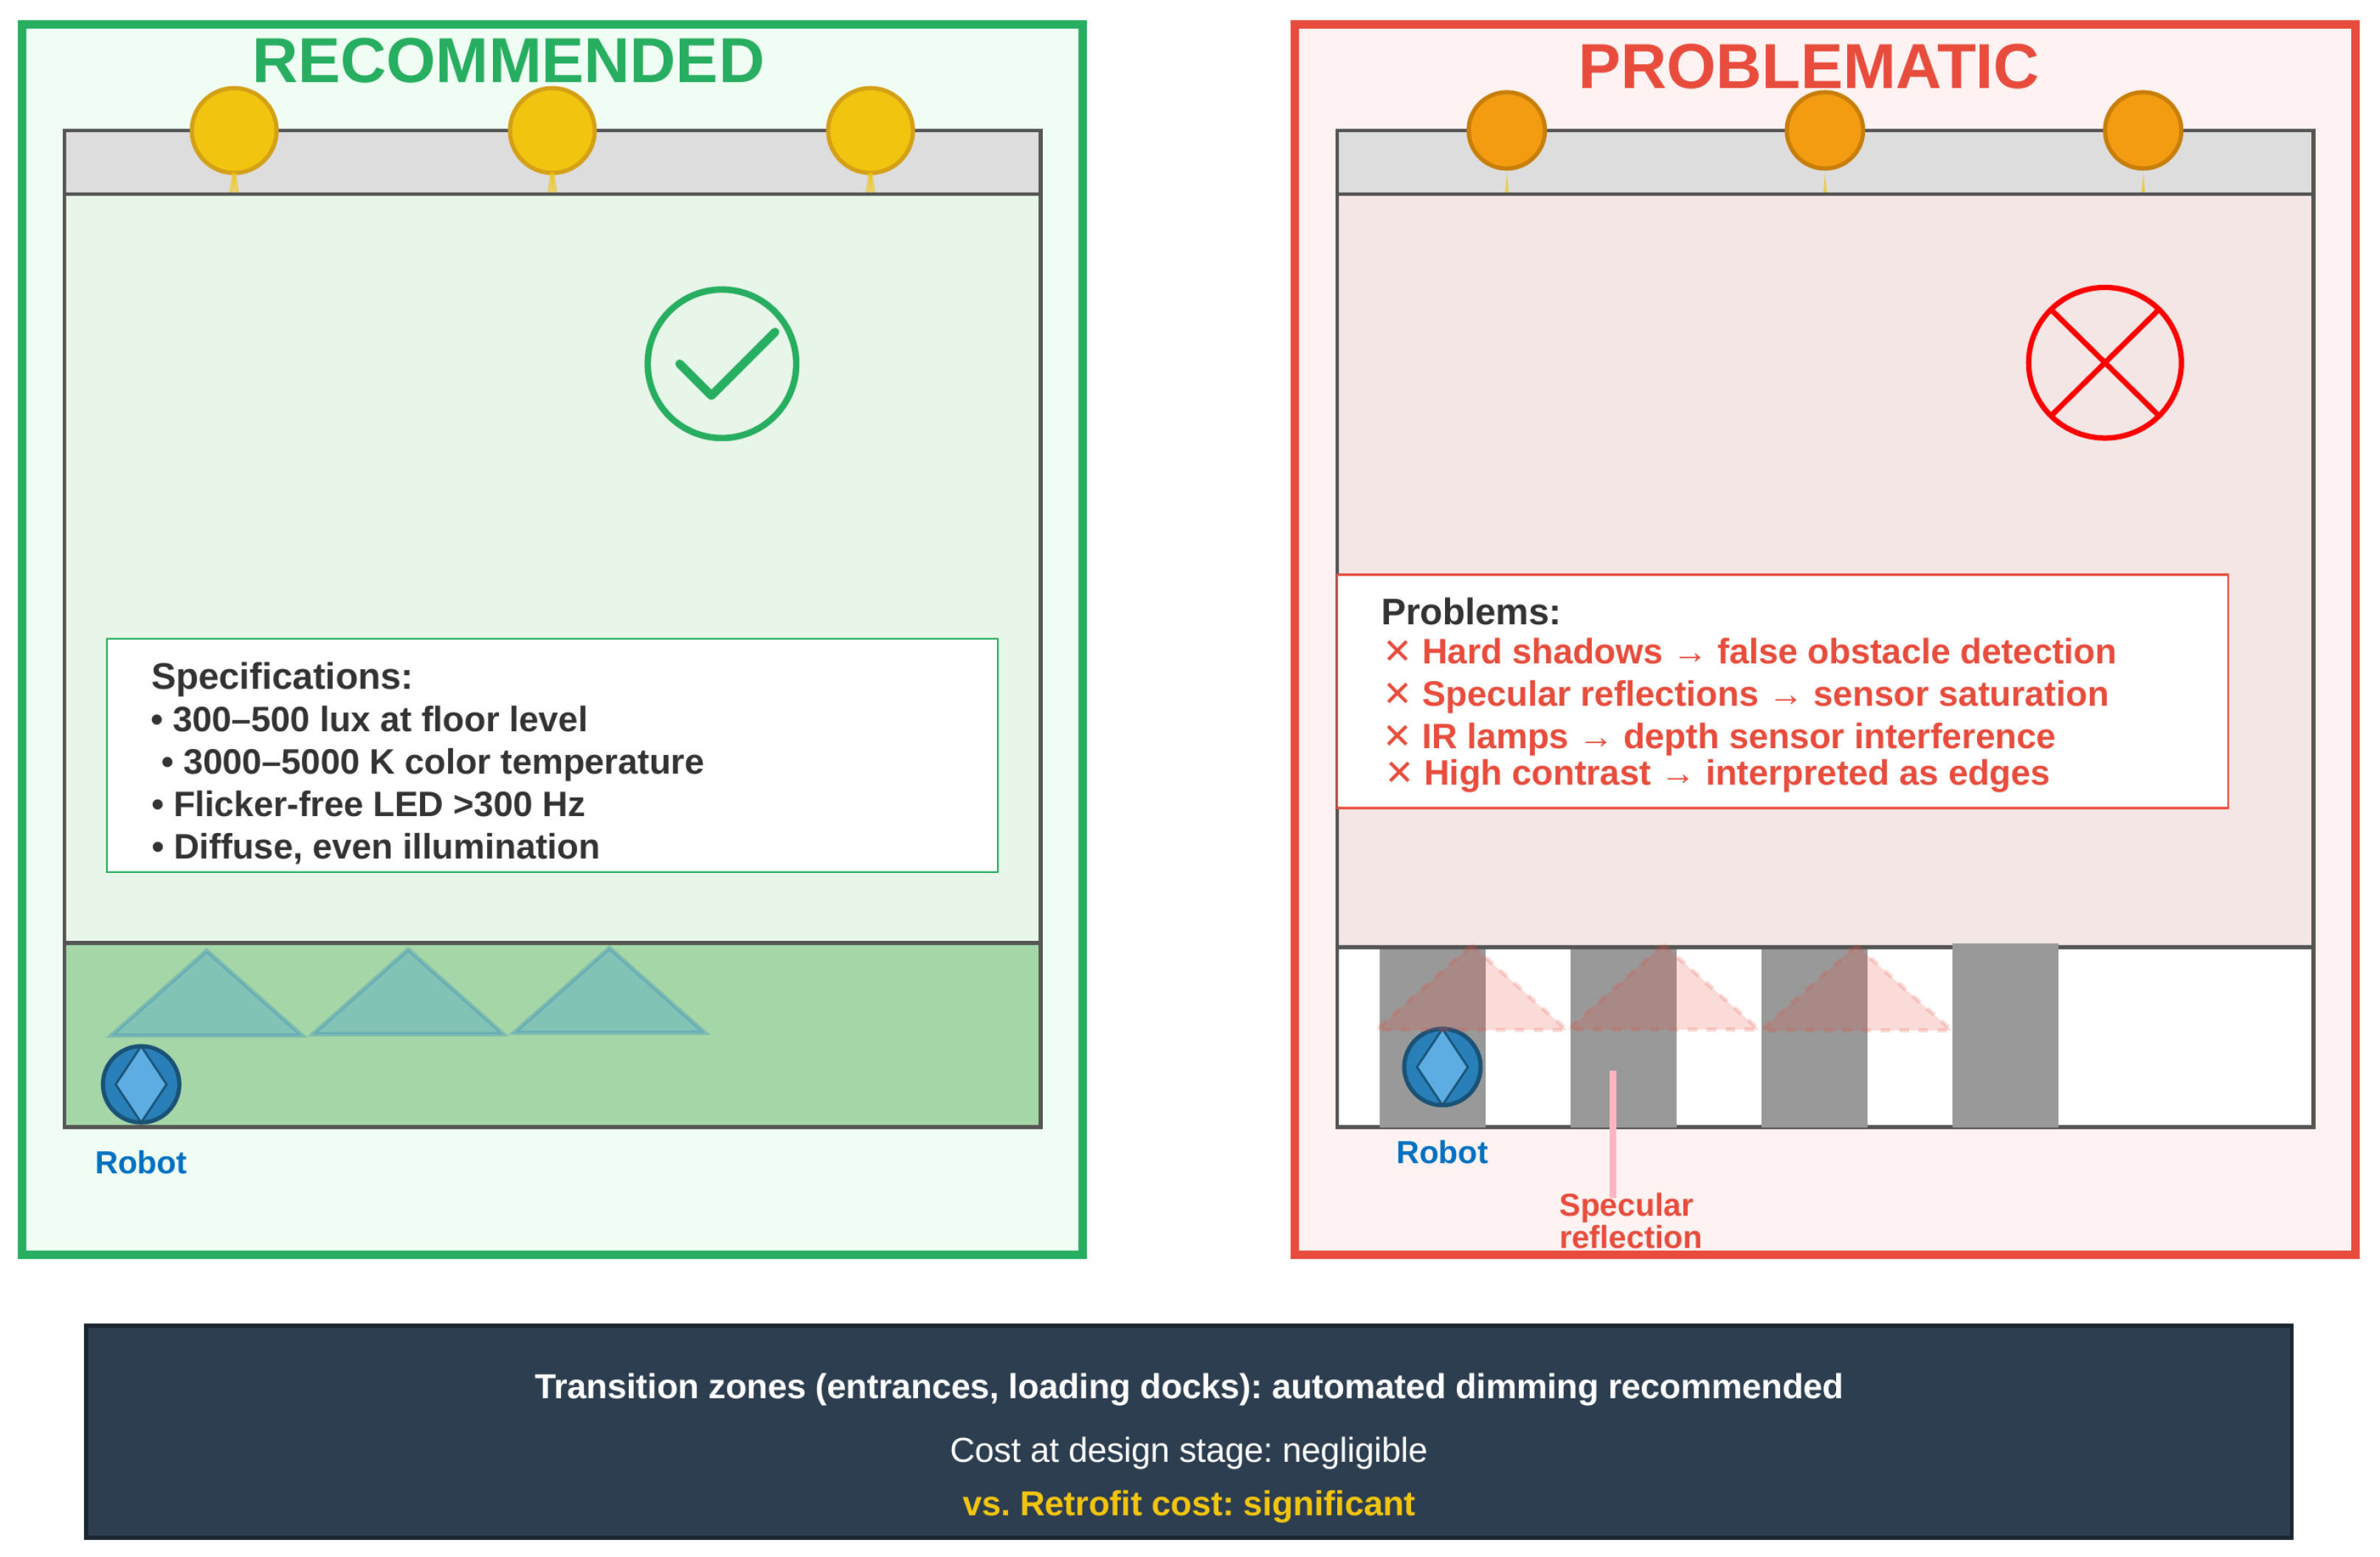
6.5. Safety, Accessibility, and Integration (Guidelines 12–16)
Guidelines 12, 13, 14, 15 and 16 address the complementary requirements for barrier-free robot mobility, operational safety in shared spaces, differentiated lift access across the weight spectrum, the network connectivity that underpins autonomous operation, and the positioning accuracy on which the dimensional propositions themselves are conditional.
6.5.1. Guideline 12: Barrier-Free Access and Continuous Routes
Wheeled service robots require continuous level surfaces throughout their operating zones (Figure 17). Common barriers include floor-level steps and lips exceeding 6.4 mm; heavy self-closing fire doors without hold-open mechanisms; drainage gratings with slot widths exceeding the smallest fleet wheel diameter; loose entrance mats and unsecured carpet edges; and cable management channels that create hazards for both robots and pedestrians. A formal barrier audit should map the entire robot route before deployment, documenting every discontinuity with measurements verified against the specific wheel diameter and ground clearance of the intended robot models. Turn-around zones should be sized from the platform’s swept envelope instead of its footprint (Section 4.9). For platforms within the common deployment zone, 1500 × 1500 mm is sufficient, because the largest swept diameter among the CDZ platforms is 1082 mm. For platforms above the CDZ, and for industrial cleaning machines in particular, 2000 × 2000 mm is required. The three widest-sweeping platforms in the sample require between 1781 and 1955 mm, and they cannot turn around within a 1500 mm zone. Where the platform’s length is not published, the zone should be sized on a measured footprint, and not on the manufacturer’s width alone. Remediation typically involves bevelled threshold inserts, ramped transition plates, door hold-open modifications, and mat anchoring—relatively low-cost interventions that significantly improve operational reliability. These requirements align with and extend wheelchair accessibility standards, demonstrating the co-benefit principle of robopometric design. The barrier audit methodology parallels existing accessibility audits and can be integrated into the same assessment framework, thereby reducing the compliance burden.
Figure 17.
Guideline 12: barrier-free access and continuous routes. Requirements with common robot mobility obstacles.
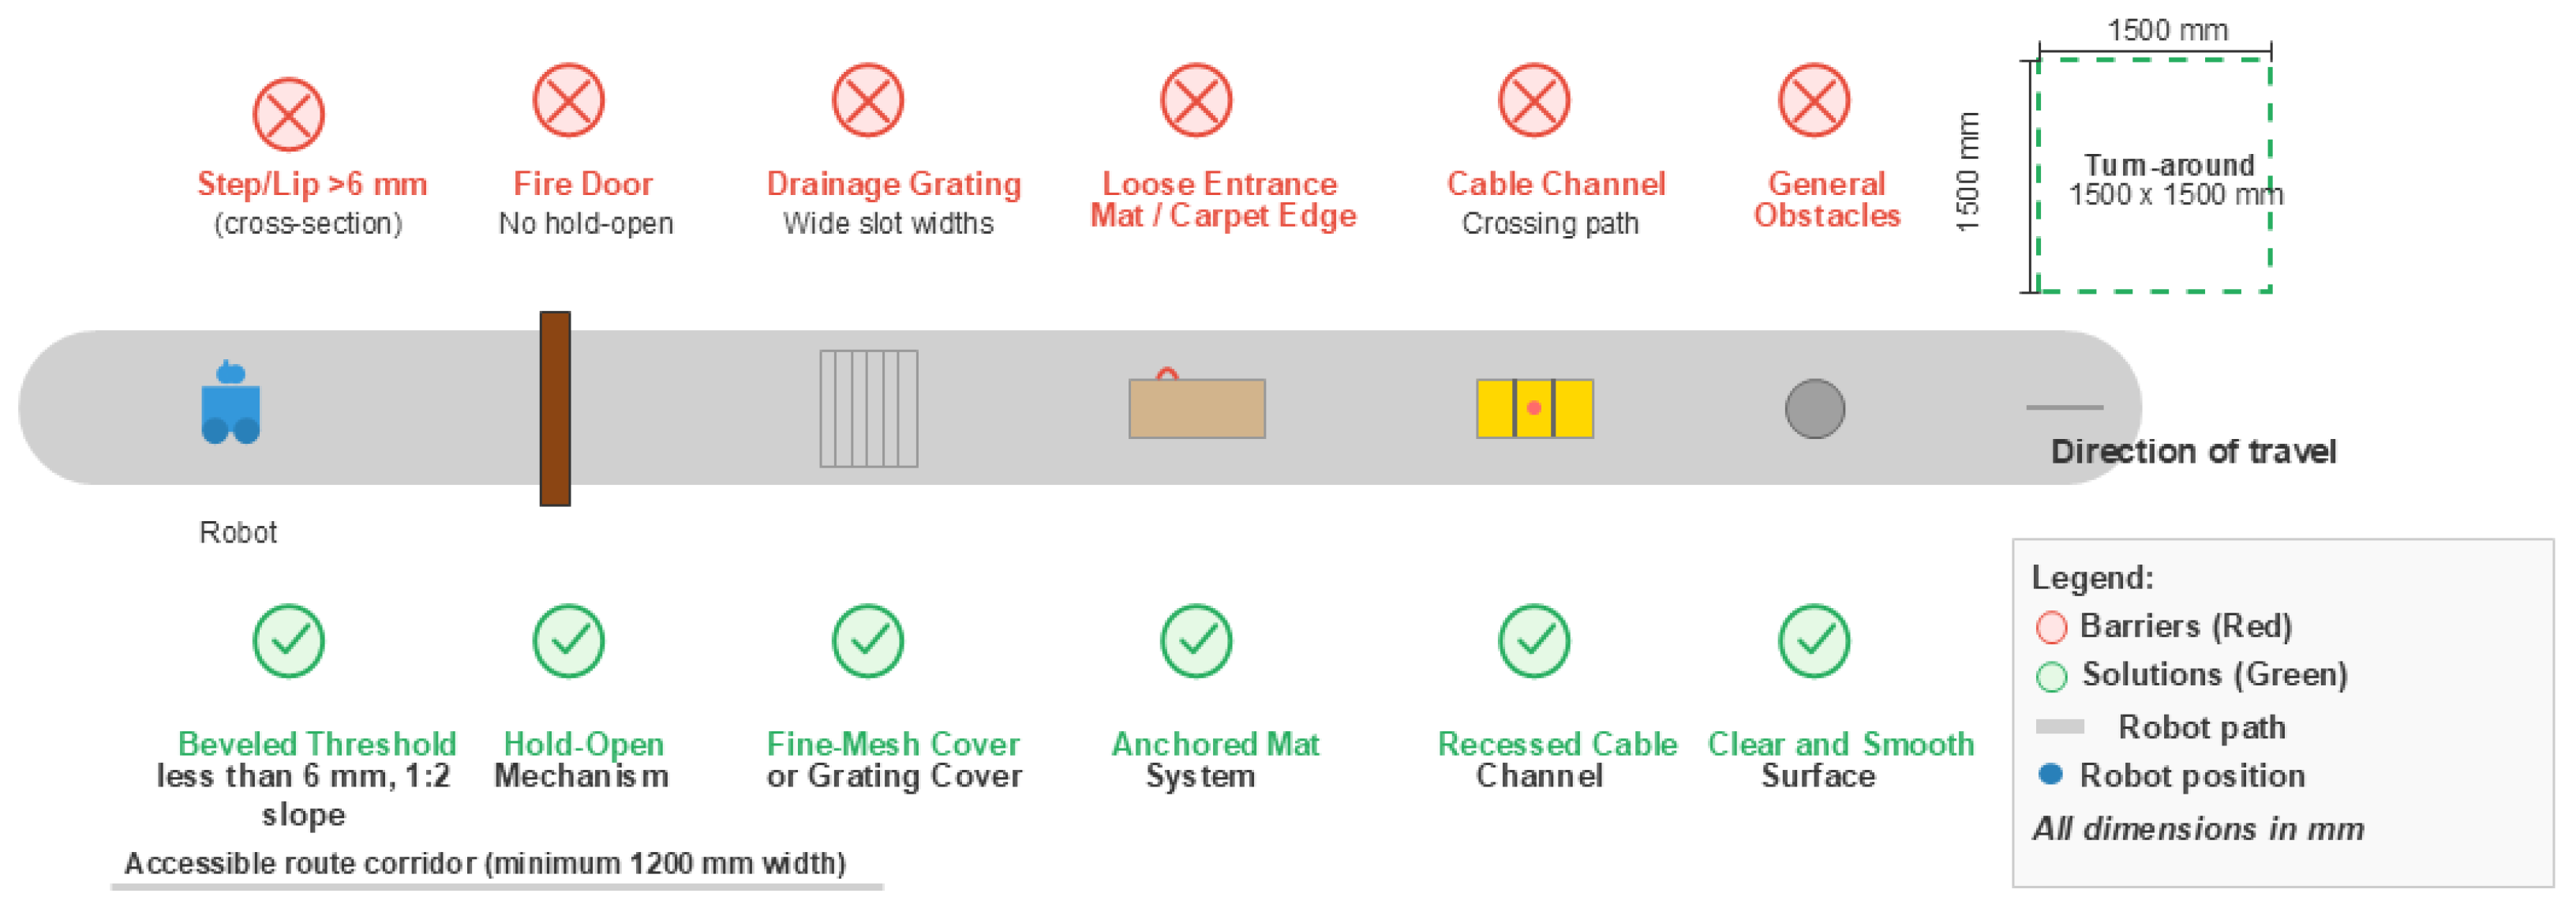
6.5.2. Guideline 13: Operational Safety Zones
The relevant standards impose the following requirements. ISO 3691-4:2023 [12] covers autonomous mobile robots as well as automated guided vehicles. For a wheeled mobile platform, it requires that personnel-detection means be designed so that the platform stops before its rigid parts, or its load, make contact with a stationary person. The detection and braking functions must achieve Performance Level d in accordance with ISO 13849-1 [77]. However, no standard prescribes a fixed zone geometry. The safety-rated protective field is not a fixed value. It is derived for each application from the platform’s stopping distance (the braking distance plus the sensor and controller response distance), together with supplements for measurement tolerance, ground clearance and application-specific hazards. ISO 13855 [78] provides the method and the human approach-speed parameters. It specifies the minimum separation distance as , where mm s−1 for a walking approach, T is the overall system response time, and and Z are supplements that depend on the device and the application. IEC 61496-3 [82] applies to the safety laser scanners generally used for this purpose, and it expressly does not specify detection-zone dimensions.
The arrangement recommended here has three zones: an outer warning field, an intermediate deceleration field and an inner protective field. This arrangement is therefore an integrator convention and not a standardised requirement, and it is presented as such. Only the innermost field is safety-rated. The outer two fields improve availability and predictability. For a platform travelling at 1.0 m s−1, a reasonable default is a warning field of 1500–2000 mm, a deceleration field of 500–1500 mm in which the speed is reduced to no more than 0.5 m s−1, and a protective field below 500 mm (Figure 18). These distances depend on travel speed, latency and braking performance, so a protective field that is adequate at 0.3 m s−1 is inadequate at 1.5 m s−1. Any fixed distance quoted independently of speed should be treated as illustrative. Where a standard does constrain speed, it does so for specific narrow-clearance conditions and not as a general deceleration-field requirement.
Emergency stop actuators should comply with ISO 13850 [79]. This standard recommends mounting hand-operated actuators between 600 and 1700 mm above the access level. This range is wider than the reach of a seated wheelchair user. Designers serving mixed populations should therefore also follow the reach ranges of the ADA [13], which set a maximum unobstructed forward or side reach of 1220 mm and a minimum of 380 mm. A mounting height of 800–1100 mm satisfies both and is recommended here as a proposition of this study and not as a standardised value. Contact surfaces should be padded or compliant to limit contact force. This is an inherently safe design measure in the sense of ISO 12100 [83] and not a requirement of any mobile-robot standard. ISO/TS 15066 [84] is not applied here, because it specifies biomechanical contact limits for collaborative industrial robot systems and expressly does not apply to non-industrial robots. The spatial design implication is significant: a 500 mm wide robot with 1500 mm deceleration zones on each side requires 3500 mm of corridor width for unrestricted pedestrian passage—exceeding standard corridor dimensions and necessitating either wider corridors in high-traffic zones or operational speed reductions in narrow passages. Staff training covering emergency stop procedures, robot right-of-way conventions, and incident reporting should be mandatory in all facilities deploying autonomous robots. The spatial implications of safety zones extend beyond the basic width requirements of Guideline 1, since the deceleration envelope effectively increases the robot’s spatial footprint during operation.
Figure 18.
Guideline 13: operational safety zones. Three-zone geometry with warning, deceleration, and emergency stop zones.
6.5.3. Guideline 14: Differentiated Lift Integration
While Guideline 3 addresses passenger elevator sizing, facilities deploying robots across the weight spectrum require a differentiated lift strategy (Figure 19). Heavy platforms ( kg—cleaning and material transport machines) should use service or goods lifts rated at 2000 kg or above with door openings of at least 1200 mm, thereby avoiding peak-hour competition with human passengers. CDZ platforms ( kg) may share passenger lifts with API-based scheduling, preferably at off-peak times. All lifts serving robots require car-to-floor levelling accuracy of 6.4 mm or better (matching the threshold tolerance in Guideline 2), a minimum eight-second dwell time for robot entry and exit, and pit-level sensors to detect robot presence. In fire emergency mode, robots should automatically return to a designated base floor and yield lift priority to human evacuation. Heavy-duty lift access is among the most expensive and disruptive retrofits, requiring structural shaft modifications and recertification; facilities anticipating heavy robot deployment should therefore specify goods-lift capacity during the design phase, where marginal costs are substantially lower. The distinction between CDZ and heavy robot lift strategies should be documented in the facility’s robopometric management plan.
Figure 19.
Guideline 14: differentiated lift integration. Strategy showing a service lift for heavy robots versus a shared passenger lift for CDZ robots.
6.5.4. Guideline 15: Network and Data Infrastructure
Autonomous service robots require continuous wireless connectivity for fleet management, real-time mapping updates, and emergency communication (Figure 20). Wi-Fi coverage should maintain a signal strength of at least dBm throughout all robot operating zones, with seamless access point handoff ( ms transition) to prevent navigation interruption during corridor traversal. A dedicated SSID and VLAN should isolate robot traffic from guest and enterprise networks for reasons of both performance and cybersecurity, with WPA3 and certificate-based authentication recommended. Healthcare and security robots performing critical functions should have 5G/LTE fallback connectivity. Network planning should be integrated into the building’s MEP specification during design, as Wi-Fi dead zones in service corridors, lift shafts, and charging rooms are among the most common causes of robot deployment failure—inexpensive to prevent through proper access point placement during construction, but costly to remediate after occupancy because of ceiling access and aesthetic constraints. Fleet management servers should be provisioned with sufficient bandwidth for simultaneous telemetry from all deployed robots.
Figure 20.
Guideline 15: network and data infrastructure. Requirements for continuous robot connectivity and wireless coverage.
6.5.5. Guideline 16: Positioning Accuracy Declaration and Clearance Tolerance
The preceding fifteen propositions specify dimensions. This proposition specifies the condition under which those dimensions are valid. It is placed last because it qualifies the other propositions.
Section 4.10 showed that the clearances proposed in Guidelines 1, 2 and 3 contain an assumption about how accurately the platform navigates. This assumption corresponds to the positioning accuracy that manufacturers of autonomous mobile robots declare, in the few cases where they declare one. Section 4.9 showed that one platform in the 36 surveyed publishes such a figure. The gap between what the guidelines assume and what the market discloses is the subject of this proposition.
Specification requirement: Facilities should specify a maximum lateral positioning tolerance for the platforms to be deployed, as well as size circulation from that figure using Table 6, instead of adopting a single corridor or doorway width. A platform declared to ±118 mm lateral tolerance is compatible with 1200 mm corridors and 900 mm doorways. One declared to ±330 mm requires 1500 mm and 1300 mm, respectively. A platform whose accuracy is not declared cannot be dimensioned for and should be treated as belonging to the least accurate class until demonstrated otherwise.
Procurement requirement: Positioning accuracy should be a stated procurement criterion. It should be declared as a lateral tolerance at a stated confidence level, measured under the conditions of intended use and not at a docking station, and accompanied by the heading tolerance from which the lateral excursion of a long platform is computed. Manufacturers disclose docking repeatability more readily, but it is not a substitute. The accuracy of a platform at a charging station with marker referencing has no relation to its accuracy in the middle of a corridor. Where a platform navigates by simultaneous localisation and mapping, the declared figure should state whether it applies within a single mapping session or across sessions. The evidence in Section 2.5 shows a difference of roughly an order of magnitude between the two [42].
Design consequence: Positioning accuracy and corridor space can be traded against each other. A facility that cannot widen its corridors can specify more accurate platforms, and a facility that uses platforms of modest accuracy must provide more space. This substitution is the practical content of the proposition, and it is available at the design stage in a way that neither term is available afterwards. Where routes are fixed and traffic is predictable, infrastructure-guided navigation reduces the lateral tolerance to approximately 33 mm and returns the governing constraint to the building code instead of the robot [45].
Verification: The declared tolerance should be verified on the installed route, instead of being accepted from the specification sheet. This is because the evidence shows that localisation degrades at the narrow points that govern clearance, namely doorways and confined spaces [41,43]. The audit procedure in Section 6.6 provides the method, and the measurement it prescribes at corridor pinch points is the relevant one.
6.6. Validation Roadmap
The propositions above are derived from the data and have not yet been validated. Therefore, the programme required to test them is specified in this section.
Propositions 1, 2, 3, 7, 12 and 14 are the circulation and vertical-access propositions with dimensional thresholds. These should be tested by a focused deployment study. The method is a measured audit of a defined robot route in an operating facility. The audit records clear widths at corridor pinch points, measured between permanent projections and not between wall centrelines, doorway clear widths with the leaf at 90°, threshold heights by gauge, lift cab and door dimensions, levelling error, ramp gradients over a straight-edge, and overhead clearances. The audit is then paired with observation of the platform in operation over repeated runs, logging every stoppage, hesitation, reversal, re-plan, contact and human intervention against the point at which it occurred. The success metric is the proportion of observed conflicts that the thresholds correctly anticipate, reported together with the conflicts they fail to anticipate. A single facility and a single route are sufficient to produce this figure. The threshold values must not be adjusted after the data are seen, because this would turn the exercise back into derivation.
Propositions 4, 5, 6, 8, 9, 10, 11, 13 and 15 address gradients, surfaces, infrastructure, acoustics, and perception and are less amenable to a route audit, so they should be tested by structured practitioner evaluation. The instrument is a questionnaire administered to architects, facility managers and robot integrators with deployment experience, rating each proposition for clarity, technical feasibility, implementation cost and perceived necessity, with free-text justification. The analysis uses a content validity index for each proposition and a consensus statistic across respondents. Propositions on which practitioners do not agree are as informative as those on which they agree.
Across the whole set, longitudinal replication is required. The dimensional distribution reported here describes platforms marketed in 2023–2026, and Section 5.3 argues that this population turns over rapidly. Periodic recomputation of the CDZ with an updated sample would show whether the envelope is stable or changing over time. The long-term validity of every proposition depends on this question.
7. Toward Robopometric Standardisation
Five pathways toward standardisation are proposed. They are presented in order of the strength of the evidence that this study provides for each. The treatment of each pathway is in proportion to this evidence and not to its ultimate importance. The first rests on a direct and repeated finding. The second and fourth follow from the compliance analysis. The third and fifth are advanced on general grounds and are stated as such.
First, and most urgently on the evidence of this study, manufacturers should adopt standardised dimensional reporting. Section 4.2 documented that seven of 50 candidate platforms could not be characterised because no traceable dimensional specification is published, that disclosure varies systematically by sector, and that no telepresence platform surveyed publishes a width at all. Section 4.9 documented a second and more complete gap. Of the 36 platforms analysed, none publish a turning radius and only one published a quantified positioning accuracy, while 30 publish a maximum speed. The parameters that govern clearance in motion are exactly those that manufacturers do not disclose. Among those that do publish, at least five distinct axis orderings are in use, several manufacturers publish unlabelled dimension strings, and weight is variously reported as empty, dry, net, or operating without qualification. A minimal reporting standard—explicitly labelled length, width, and height; a stated weight basis; the model designation to which the figures apply; dynamic operational parameters including turning radius or an explicit statement that the platform turns in place, sensor sweep width, deceleration distance, drive-wheel and caster diameter, and a quantified lateral positioning tolerance declared at a stated confidence and measured under the conditions of intended use and not at a docking station; and acoustic emission declared at a stated distance against a named test standard—would cost manufacturers little and would remove a real obstacle from the path of facility designers. Robot-as-a-service vendors, who currently disclose the least, have the strongest commercial interest in their platforms being specifiable at the building design stage.
Second, building codes should incorporate robopometric parameters for high-deployment facility types. The compliance analysis of Section 4.8 provides the basis for this. Between 8% and 19% of the surveyed population exceeds at least one of the thresholds that current codes set for human occupancy alone, and these platforms are concentrated in the two fastest-growing categories. Table 7 sets out a prioritised sequence of provisions by facility class, distinguishing those whose values follow from the present data from those that remain assumptions. Optional annexes are recommended instead of mandatory articles, because the propositions have not been validated (Section 6.6). An optional annex can be drafted, consulted on and revised as validation accumulates, whereas a mandatory article cannot easily be withdrawn.
Third, architectural education should incorporate robopometry alongside anthropometry. This pathway is advanced on general grounds and not on evidence generated in this study. In practice, this would require little. The dimensional envelope reported in Section 4 is a single table and one scatter plot, and it could be added to the anthropometric reference material already used in studio teaching without replacing anything. The argument for doing so is the cost difference described in Section 5.3. A designer who has never seen the robot envelope will not design for it, and this omission is cheap to prevent but expensive to correct.
Fourth, facility managers should conduct formal robopometric audits before deployment. This pathway has the most immediate application, because the audit can be performed on an existing building with a tape and a laser measure and requires no new standard to exist first. Its content is specified in Section 6.6. It covers clear widths at corridor pinch points, measured between permanent projections and not between wall centrelines, doorway clear widths with the leaf at 90°, threshold heights by gauge, lift cab and door dimensions, levelling error, ramp gradients and overhead clearances. Each of these is compared against the envelope of the platforms actually specified. The deployment record shows why this is important. The conflicts reported in Section 5.6 were discovered after the platforms had been procured, and several required building work whose cost an audit before procurement would have revealed.
Fifth, digital twin research [85,86] offers automated compliance assessment integrated into building information modelling (BIM) workflows, enabling architects to identify robot-to-building dimensional conflicts during the design phase rather than after construction; integrating robopometric parameters into BIM object libraries would allow automated clash detection between robot operational envelopes and architectural elements. The envelope that such a library would need to encode is now partly specified. It includes the static footprint, the swept turning envelope derived in Section 4.9, and the mass. It cannot yet encode the sensor field or the deceleration distance, because no manufacturer in the sample publishes them. This last pathway depends on the first: a BIM object library can only be as reliable as the manufacturer data it encodes.
These five pathways are complementary and mutually reinforcing, and progress on any one facilitates the others. The International Association for Automation and Robotics in Construction (IAARC) is well positioned to advance robopometric standardisation through its existing working groups on robotics in the built environment. Collaboration with ISO/TC 184 (Automation systems and integration) [68] and ISO/TC 299 (Robotics) could produce international standards for robot-to-building dimensional compatibility, analogous to the dimensional standards that anthropometry has produced for human-to-building compatibility over the past century.
8. Conclusions
This paper has introduced robopometry as a framework for analysing the dimensional interface between professional service robots and interior built environments and has calibrated it against a source-verified survey of 36 commercially deployed platforms.
The framework’s central empirical finding is the common deployment zone: 47% of platforms fall within a 384–630 mm width and 1046–1520 mm height envelope, at a width CV of 12.2% against 30.9% for the sample as a whole. The zone is derived from the data, and density-based clustering and an independently fitted Gaussian mixture return identical membership. Furthermore, the upper width bound of 630 mm, from which the circulation guidelines follow, is invariant across the clustering parameters tested. CDZ membership cuts across functional categories, spanning five of the seven represented, although hospitality delivery supplies ten of the seventeen members and the zone is not recovered when that category is excluded. Width and height did not differ significantly between the five categories that could be tested. However, with 32 platforms in five groups, this reflects limited statistical power, and it is not evidence that category is unrelated to plan dimensions. It is this envelope from which the design propositions derive.
Weight behaves quite differently. It is the one parameter that differs significantly between categories (Kruskal–Wallis , ), it spans 2.13 orders of magnitude with a CV of 145.8%, and logarithmic transformation reduces its skewness from 2.60 to 0.43 without establishing log-normality. Width predicts weight strongly () but height only weakly, so plan and section must still be assessed separately. A single manufacturer’s product line was found to span a 14.1:1 weight ratio—wider than most entire functional categories.
A second disclosure finding concerns the parameters that govern clearance in motion. Of the 36 platforms analysed, none publish a turning radius, one publishes a quantified positioning accuracy and one publishes any wheel diameter, while 30 publish a maximum travel speed and 30 publish a length. Static extent and speed are disclosed routinely, but the geometry of motion is not. The swept turning envelope derived here from width and length is, at the median, 1.5 times the platform’s own width. It is the only dynamic parameter that could be obtained, and it revealed that one of the propositions of this study understated a requirement by up to 30%.
A further finding concerns the evidence base itself. Seven of 50 candidate platforms could not be characterised because their manufacturers publish no traceable dimensional specification, and the gaps are concentrated in healthcare logistics, security, and telepresence—sectors where robot-as-a-service commercial models predominate. No telepresence platform surveyed publishes a width. Facility designers specifying buildings for these platforms face the same evidentiary vacuum that constrained this study, which makes standardised dimensional reporting the most immediately actionable of the five standardisation pathways proposed.
Sixteen design propositions are derived, addressing corridors, doorways, elevators, ramps, floors, charging, vertical clearance, multi-robot planning, acoustics, wayfinding, lighting, barrier-free access, safety zones, lift integration, network infrastructure, and the positioning accuracy on which the dimensional propositions are conditional. The provenance of every numerical value is stated in Table 9, distinguishing values derived from the present data, values adopted from named standards, and engineering assumptions. The propositions are consistent with the categories of conflict documented in six published deployment studies (Section 5.6), but their specific thresholds have not been tested. They provide practical specifications for architects, facility managers and construction professionals, but they remain propositions until the validation programme in Section 6.6 has been carried out.
This study builds upon the robot-inclusive spaces literature [15,28] by providing the dimensional characterisation and statistical grounding that RIS design principles require for implementation. Future research directions include the validation programme of Section 6.6; dynamic envelope modelling via digital twins; lifecycle cost–benefit analysis of robopometric building modifications; BIM integration enabling automated clash detection; longitudinal studies tracking the evolution of robot dimensions over product generations; and investigation of how reconfigurable robot morphologies [29] may partially mitigate dimensional conflicts through adaptive form factors. As deployment continues to scale, robopometry provides the framework for ensuring that interior spaces are dimensionally prepared for robotic co-occupancy.
Author Contributions
Conceptualization, K.E.H. and M.R.E.; methodology, K.E.H.; formal analysis, K.E.H.; investigation, K.E.H.; data curation, K.E.H.; visualization, K.E.H.; writing—original draft preparation, K.E.H.; resources, M.R.E.; supervision, M.R.E.; writing—review and editing, M.R.E. All authors have read and agreed to the published version of the manuscript.
Funding
This research was funded by the Ministry of Land, Infrastructure and Transport (MOLIT) and the Korea Agency for Infrastructure Technology Advancement (KAIA), funded by the Korean government, grant number RS-2025-02532980; by Kyung Hee University in 2024, grant number KHU-20241106; and by A*STAR under its National Robotics Programme (NRP) LEO 1.0: A New Class of Bed Making Robot, No. M25N4N202.
Institutional Review Board Statement
Not applicable.
Informed Consent Statement
Not applicable.
Data Availability Statement
All data underlying the findings of this study are contained within the manuscript. The dimensional inventory of the 36 verified platforms is provided in Table 1, the excluded candidates in Table 2, and aggregate descriptive statistics by functional category in Table 3. All values were compiled from publicly available manufacturer specifications, except where marked as third-party sourced; no proprietary or restricted datasets were used.
Acknowledgments
The authors thank the LionsBot International engineering team, and the wider Singapore robotics community, for access to product specification data and for helpful technical discussions. The authors also thank colleagues at Kyung Hee University and the Singapore University of Technology and Design for constructive feedback during the development of the robopometric framework. During the preparation of this manuscript, the authors used Anthropic Claude (Claude Opus 5) and OpenAI ChatGPT (GPT-5) for the purposes of language editing, grammar correction, and improvement of readability. These tools were not used to generate scientific content, to design the study, or to produce figures. The authors have reviewed and edited the output and take full responsibility for the content of this publication.
Conflicts of Interest
The authors declare no conflict of interest.
Abbreviations
The following abbreviations are used in this manuscript:
| ADA | Americans with Disabilities Act |
| AMR | Autonomous Mobile Robot |
| API | Application Programming Interface |
| BIC | Bayesian Information Criterion |
| BIM | Building Information Modelling |
| CDZ | Common Deployment Zone |
| DBSCAN | Density-Based Spatial Clustering of Applications with Noise |
| COF | Coefficient of Friction |
| CV | Coefficient of Variation |
| IAARC | International Association for Automation and Robotics in Construction |
| IBC | International Building Code |
| IFR | International Federation of Robotics |
| LiDAR | Light Detection and Ranging |
| MEP | Mechanical, Electrical and Plumbing |
| RaaS | Robot-as-a-Service |
| RCI | Robot Complexity Index |
| RIS | Robot-Inclusive Spaces |
| RSI | Robot Space Index |
| SD | Standard Deviation |
| UV | Ultraviolet |
References
- International Federation of Robotics. World Robotics 2025—Service Robots. 2025. Available online: https://ifr.org/worldrobotics/ (accessed on 11 August 2026).
- MarketsandMarkets. Service Robotics Market—Global Forecast to 2029. Report SE 2714. December 2024. Available online: https://www.marketsandmarkets.com/Market-Reports/service-robotics-market-681.html (accessed on 11 August 2026).
- LionsBot International. R3 Scrub Product Specifications. 2025. Available online: https://www.lionsbot.com/r3-scrub/ (accessed on 25 September 2026).
- LionsBot International. R3 Scrub Pro Product Specifications. 2025. Available online: https://www.lionsbot.com/r3-scrub-pro/ (accessed on 25 September 2026).
- LionsBot International. R3 Vac Product Specifications. 2025. Available online: https://www.lionsbot.com/r3-vac/ (accessed on 25 September 2026).
- LionsBot International. R12 Rex Scrub Product Specifications. 2025. Available online: https://www.lionsbot.com/us/news/r3-vac-r3-scrub-pro-magictag? (accessed on 25 September 2026).
- LionsBot International. R12 Rex CS Product Specifications. 2025. Available online: https://www.lionsbot.com/news/r12-rex-cs-launch? (accessed on 25 September 2026).
- Takayama, L.; Pantofaru, C. Influences on Proxemic Behaviors in Human–Robot Interaction. In Proceedings of the 2009 IEEE/RSJ International Conference on Intelligent Robots and Systems (IROS), St. Louis, MO, USA, 11–15 October 2009; pp. 5495–5502. [Google Scholar] [CrossRef] [Scilit]
- Mumm, J.; Mutlu, B. Human–Robot Proxemics: Physical and Psychological Distancing in Human–Robot Interaction. In Proceedings of the 6th ACM/IEEE International Conference on Human–Robot Interaction (HRI ’11), Lausanne, Switzerland, 6–9 March 2011; pp. 331–338. [Google Scholar] [CrossRef] [Scilit]
- Bartneck, C.; Kulić, D.; Croft, E.; Zoghbi, S. Measurement Instruments for the Anthropomorphism, Animacy, Likeability, Perceived Intelligence, and Perceived Safety of Robots. Int. J. Soc. Robot. 2009, 1, 71–81. [Google Scholar] [CrossRef] [Scilit]
- ISO 13482:2014; Robots and Robotic Devices—Safety Requirements for Personal Care Robots. International Organization for Standardization: Geneva, Switzerland, 2014.
- ISO 3691-4:2023; Industrial Trucks—Safety Requirements and Verification—Part 4: Driverless Industrial Trucks and Their Systems, 2nd ed. International Organization for Standardization: Geneva, Switzerland, 2023.
- U.S. Department of Justice. 2010 ADA Standards for Accessible Design. 2010. 28 CFR Part 36, Subpart D; Effective 15 March 2012. Available online: https://www.ada.gov/law-and-regs/design-standards/2010-stds/ (accessed on 25 September 2026).
- International Code Council. 2021 International Building Code; International Code Council: Country Club Hills, IL, USA, 2020. [Google Scholar]
- Mohan, R.E.; Rojas, N.; Chua, A. Design Principles for Robot Inclusive Spaces: A Case Study with Roomba. In Proceedings of the 2014 IEEE International Conference on Robotics and Automation (ICRA), Hong Kong, China, 31 May–7 June 2014; pp. 5593–5599. [Google Scholar] [CrossRef] [Scilit]
- Čapek, K. R.U.R. (Rossum’s Universal Robots); Aventinum: Prague, Czechoslovakia, 1920. [Google Scholar]
- Dreyfuss, H. The Measure of Man: Human Factors in Design; Whitney Library of Design: New York, NY, USA, 1960. [Google Scholar]
- Birkhoff, S.S.; Merring, P.; Spence, A.; Bassett, W.; Roth, S.C. Integrating Collaborative Robots into a Complex Hospital Setting: A Qualitative Descriptive Study. Del. J. Public Health 2024, 10, 20–27. [Google Scholar] [PubMed] [PubMed Central]
- Lee, Y.; Kim, S.E.; Kim, J.S.; Son, H.G.; Lee, S.H.; Lee, H.j.; Jeong, H.; Lim, J.W.; Park, S.Y.; Lee, Y.J.; et al. Feasibility of autonomous medication delivery robots considering elevator utilization in high-traffic hospital environments. Digit. Health 2026, 12, 20552076261437181. [Google Scholar] [CrossRef] [Scilit]
- Valner, R.; Masnavi, H.; Rybalskii, I.; Põlluäär, R.; Kõiv, E.; Aabloo, A.; Kruusamäe, K.; Singh, A.K. Scalable and heterogenous mobile robot fleet-based task automation in crowded hospital environments—A field test. Front. Robot. AI 2022, 9, 922835. [Google Scholar] [CrossRef] [Scilit]
- Karlsen, A.S.T.; Andersen, B.; Elverum Heirsaunet, S.; Indergård, E.; Nevstad, K.; Aarseth, W. Digital transformation in restaurants: Key aspects of service robot deployment from project initiation to evaluation. Front. Robot. AI 2026, 13, 1793138. [Google Scholar] [CrossRef] [Scilit]
- Macalupu, V.; Miller, E.; Martin, L.; Caldwell, G. Human–robot interactions and experiences of staff and service robots in aged care. Sci. Rep. 2025, 15, 2495. [Google Scholar] [CrossRef] [Scilit]
- Tilley, A.R.; Henry Dreyfuss Associates. The Measure of Man and Woman: Human Factors in Design, revised ed.; John Wiley & Sons: New York, NY, USA, 2002. [Google Scholar]
- ASME A17.1-2019/CSA B44:19; Safety Code for Elevators and Escalators. ASME: New York, NY, USA, 2019.
- Preiser, W.F.E.; Smith, K.H. (Eds.) Universal Design Handbook, 2nd ed.; McGraw-Hill: New York, NY, USA, 2011. [Google Scholar]
- Mead, R.; Matarić, M.J. Autonomous Human–Robot Proxemics: Socially Aware Navigation Based on Interaction Potential. Auton. Robot. 2017, 41, 1189–1201. [Google Scholar] [CrossRef] [Scilit]
- Rios-Martinez, J.; Spalanzani, A.; Laugier, C. From Proxemics Theory to Socially-Aware Navigation: A Survey. Int. J. Soc. Robot. 2015, 7, 137–153. [Google Scholar] [CrossRef] [Scilit]
- Tan, N.; Mohan, R.E.; Watanabe, A. Toward a Framework for Robot-Inclusive Environments. Autom. Constr. 2016, 69, 68–78. [Google Scholar] [CrossRef] [Scilit]
- Lakshmanan, A.K.; Mohan, R.E.; Ramalingam, B.; Le, A.V.; Veerajagadeshwar, P.; Tiwari, K.; Ilyas, M. Complete Coverage Path Planning Using Reinforcement Learning for Tetromino Based Cleaning and Maintenance Robot. Autom. Constr. 2020, 112, 103078. [Google Scholar] [CrossRef] [Scilit]
- Gibson, J.J. The Ecological Approach to Visual Perception; Houghton Mifflin: Boston, MA, USA, 1979. [Google Scholar]
- Norman, D.A. The Design of Everyday Things, revised and expanded ed.; Basic Books: New York, NY, USA, 2013. [Google Scholar]
- Maier, J.R.A.; Fadel, G.M.; Battisto, D.G. An Affordance-Based Approach to Architectural Theory, Design, and Practice. Des. Stud. 2009, 30, 393–414. [Google Scholar] [CrossRef] [Scilit]
- Bock, T.; Linner, T. Robot-Oriented Design: Design and Management Tools for the Deployment of Automation and Robotics in Construction; The Cambridge Handbooks in Construction Robotics; Cambridge University Press: Cambridge, UK, 2015. [Google Scholar] [CrossRef] [Scilit]
- Pan, M.; Linner, T.; Pan, W.; Cheng, H.; Bock, T. Structuring the Context for Construction Robot Development through Integrated Scenario Approach. Autom. Constr. 2020, 114, 103174. [Google Scholar] [CrossRef] [Scilit]
- Ohueri, C.C.; Masrom, M.A.N.; Noguchi, M. Human–Robot Collaboration for Building Deconstruction in the Context of Construction 5.0. Autom. Constr. 2024, 167, 105723. [Google Scholar] [CrossRef] [Scilit]
- ANSI/CAN/UL 3300; Standard for Safety for Service, Communication, Information, Education and Entertainment Robots, 1st ed. Underwriters Laboratories: Northbrook, IL, USA, 2024.
- Rodrigues, P.B.; Singh, R.; Oytun, M.; Adami, P.; Woods, P.J.; Becerik-Gerber, B.; Soibelman, L.; Copur-Gencturk, Y.; Lucas, G.M. A Multidimensional Taxonomy for Human–Robot Interaction in Construction. Autom. Constr. 2023, 150, 104845. [Google Scholar] [CrossRef] [Scilit]
- Brosque, C.; Fischer, M. Safety, quality, schedule, and cost impacts of ten construction robots. Constr. Robot. 2022, 6, 163–186. [Google Scholar] [CrossRef] [Scilit]
- Kam, A.; Tanaka, Y.; Brosque, C.; Roedel, H.; Lau, T.; Fischer, M. Comparison of dusty robotics and traditional layout methods. Constr. Robot. 2025, 9, 23. [Google Scholar] [CrossRef] [Scilit]
- Wu, H.; Ma, M.; Yang, Y.; Han, L.; Wu, S. On-Site Measuring Robot Technology for Post-Construction Quality Assessment of Building Projects. Buildings 2024, 14, 3085. [Google Scholar] [CrossRef] [Scilit]
- Yarovoi, A.; Cho, Y.K. Review of simultaneous localization and mapping (SLAM) for construction robotics applications. Autom. Constr. 2024, 162, 105344. [Google Scholar] [CrossRef] [Scilit]
- Nair, A.D.; Kindle, J.; Levchev, P.; Scaramuzza, D. Hilti SLAM Challenge 2023: Benchmarking Single + Multi-Session SLAM Across Sensor Constellations in Construction. IEEE Robot. Autom. Lett. 2024, 9, 7286–7293. [Google Scholar] [CrossRef] [Scilit]
- Husemann, J.; Kunz, M.; Suiker, M.; Berns, K. From BIM to Autonomous Navigation: Using BIM Models to Enable Autonomous Navigation and Localization in Construction Environments. In Proceedings of the 42nd International Symposium on Automation and Robotics in Construction (ISARC 2025), Montreal, QC, Canada, 28–31 July 2025; pp. 143–150. [Google Scholar]
- Wang, Z.; Liang, M.; Maropoulos, P.G. High accuracy mobile robot positioning using external large volume metrology instruments. Int. J. Comput. Integr. Manuf. 2011, 24, 484–492. [Google Scholar] [CrossRef] [Scilit][Green Version]
- Bostelman, R.; Hong, T.; Cheok, G. Navigation performance evaluation for automatic guided vehicles. In Proceedings of the 2015 IEEE International Conference on Technologies for Practical Robot Applications (TePRA); IEEE: New York, NY, USA, 2015; pp. 1–6. [Google Scholar] [CrossRef] [Scilit]
- Kallwies, J.; Forkel, B.; Wuensche, H.J. Determining and Improving the Localization Accuracy of AprilTag Detection. In Proceedings of the 2020 IEEE International Conference on Robotics and Automation (ICRA), Paris, France, 31 May–31 August 2020; pp. 8288–8294. [Google Scholar] [CrossRef] [Scilit]
- Abbas, S.M.; Aslam, S.; Berns, K.; Muhammad, A. Analysis and Improvements in AprilTag Based State Estimation. Sensors 2019, 19, 5480. [Google Scholar] [CrossRef] [Scilit]
- Lee, S.J.; Kim, B.; Yang, D.W.; Kim, J.; Parkinson, T.; Billingham, J.; Park, C.; Yoon, J.; Lee, D.Y. A Compact RTK-GNSS Device for High-Precision Localization of Outdoor Mobile Robots. J. Field Robot. 2024, 41, 1349–1365. [Google Scholar] [CrossRef] [Scilit]
- Blesing, C.; Finke, J.; Hoose, S.; Schweigert, A.; Stenzel, J. Accuracy Evaluation of a Low-Cost Differential Global Positioning System for Mobile Robotics. arXiv 2023, arXiv:2306.12826. [Google Scholar]
- Khoshrangbaf, M.; Khalilpour Akram, V.; Challenger, M.; Dagdeviren, O. An Experimental Evaluation of Indoor Localization in Autonomous Mobile Robots. Sensors 2025, 25, 2209. [Google Scholar] [CrossRef] [Scilit]
- Huang, J.; Junginger, S.; Liu, H.; Thurow, K. Indoor Positioning Systems of Mobile Robots: A Review. Robotics 2023, 12, 47. [Google Scholar] [CrossRef] [Scilit]
- Tarulescu, R.; Tarulescu, S. Measurement Methods for the Path Deviation of Mobile Robots: Determination of Linear and Angular Deviation. In Proceedings of the ECAI 2015—7th International Conference on Electronics, Computers and Artificial Intelligence, Bucharest, Romania, 25–27 June 2015; pp. 91–94. [Google Scholar]
- Lim, Z.Q.; Shah, K.W.; Gupta, M. Autonomous Mobile Robots Inclusive Building Design for Facilities Management: Comprehensive PRISMA Review. Buildings 2024, 14, 3615. [Google Scholar] [CrossRef] [Scilit]
- Avidbots. Neo 2 Autonomous Floor Scrubber Technical Specifications. 2025. Available online: https://avidbots.com/neo-2/ (accessed on 25 September 2026).
- Gasparri, E.; Arasteh, S.; Kuru, A.; Stracchi, P.; Brambilla, A. Circular Economy in Construction: A Systematic Review of Knowledge Gaps towards a Novel Research Framework. Front. Built Environ. 2023, 9, 1239757. [Google Scholar] [CrossRef] [Scilit]
- Prieto, S.A.; Xu, X.; García de Soto, B. A Guide for Construction Practitioners to Integrate Robotic Systems in Their Construction Applications. Front. Built Environ. 2024, 10, 1307728. [Google Scholar] [CrossRef] [Scilit]
- Castro-Lacouture, D. Construction Automation. In Springer Handbook of Automation; Nof, S.Y., Ed.; Springer: Berlin/Heidelberg, Germany, 2009; pp. 1063–1078. [Google Scholar] [CrossRef] [Scilit]
- Shapiro, S.S.; Wilk, M.B. An Analysis of Variance Test for Normality (Complete Samples). Biometrika 1965, 52, 591–611. [Google Scholar] [CrossRef] [Scilit]
- Kruskal, W.H.; Wallis, W.A. Use of Ranks in One-Criterion Variance Analysis. J. Am. Stat. Assoc. 1952, 47, 583–621. [Google Scholar] [CrossRef]
- EN 17210:2021; Accessibility and Usability of the Built Environment—Functional Requirements. European Committee for Standardization (CEN): Brussels, Belgium, 2021.
- Building and Construction Authority. Code on Accessibility in the Built Environment 2025; Technical Report; Building and Construction Authority: Singapore, 2025.
- Ministry of Health and Welfare, Republic of Korea. Enforcement Rule of the Act on Guarantee of Convenience Promotion for Persons with Disabilities, the Elderly, Pregnant Women and Nursing Mothers, Annex 1. Amended 11 December 2023. Available online: https://www.law.go.kr (accessed on 25 September 2026).
- Government of Japan. Order for Enforcement of the Act on Promotion of Smooth Transportation, etc. of Elderly Persons, Disabled Persons, etc., Cabinet Order No. 379 of 2006; Building Movement Facilitation Standards, Article 19. Available online: https://laws.e-gov.go.jp/law/418CO0000000379 (accessed on 25 September 2026).
- Ministry of Land, Infrastructure, Transport and Tourism, Japan. Ordinance Prescribing Guidance Standards for Building Movement Facilitation, Ministerial Ordinance No. 114 of 2006. Available online: https://laws.e-gov.go.jp/law/418M60000800114 (accessed on 25 September 2026).
- AASHTO. A Policy on Geometric Design of Highways and Streets, 7th ed.; AASHTO: Washington, DC, USA, 2018. [Google Scholar]
- Bordass, B.; Leaman, A. Making Feedback and Post-Occupancy Evaluation Routine 1: A Portfolio of Feedback Techniques. Build. Res. Inf. 2005, 33, 347–352. [Google Scholar] [CrossRef] [Scilit]
- Lizana, J.; Wheeler, S.; Azizi, E.; Halloran, C.; Wheeler, J.; Wallom, D.C.H.; McCulloch, M. Integrated Post-Occupancy Evaluation and Intervention That Achieve Real-World Zero-Carbon Buildings. Energy Build. 2024, 303, 113766. [Google Scholar] [CrossRef] [Scilit]
- International Organization for Standardization. ISO/TC 184 Automation Systems and Integration, 2023. Available online: https://www.iso.org/committee/54110.html (accessed on 11 August 2026).
- Mutlu, B.; Forlizzi, J. Robots in organizations: The role of workflow, social, and environmental factors in human-robot interaction. In Proceedings of the 3rd ACM/IEEE International Conference on Human–Robot Interaction (HRI ’08), Amsterdam, The Netherlands, 12–15 March 2008; pp. 287–294. [Google Scholar] [CrossRef] [Scilit]
- Schulze, P.R.; Müller, S.; Müller, T.; Gross, H.M. On realizing autonomous transport services in multi story buildings with doors and elevators. Front. Robot. AI 2025, 12, 1546894. [Google Scholar] [CrossRef] [Scilit]
- Steinfeld, E.; Maisel, J. Universal Design: Creating Inclusive Environments; John Wiley & Sons: Hoboken, NJ, USA, 2012. [Google Scholar]
- Watchorn, V.; Hitch, D.; Tucker, R.; Frawley, P.; Aedy, K.; Grant, C. Evaluating Universal Design of Built Environments: An Empirical Study of Stakeholder Practice and Perceptions. J. Hous. Built Environ. 2023, 38, 1491–1510. [Google Scholar] [CrossRef] [Scilit]
- Zallio, M.; Clarkson, P.J. A Study to Depict Challenges and Opportunities Building Industry Professionals Face When Designing Inclusive and Accessible Buildings. Archit. Sci. Rev. 2024, 67, 268–279. [Google Scholar] [CrossRef] [Scilit]
- Osei Assibey Antwi, A.D.; Afful, A.E.; Ayarkwa, J.; Dodoo, A.; Osei-Tutu, S.; Danso, A.K. Sustainable Facilities Management in the Built Environment: A Bibliometric Review. J. Facil. Manag. 2024, 23, 352–371. [Google Scholar] [CrossRef] [Scilit]
- ASHRAE. 2023 ASHRAE Handbook—HVAC Applications, Chapter 49: Noise and Vibration Control; ASHRAE: Peachtree Corners, GA, USA, 2023. [Google Scholar]
- EN 12464-1:2021; Light and Lighting—Lighting of Work Places—Part 1: Indoor Work Places. European Committee for Standardization (CEN): Brussels, Belgium, 2021.
- ISO 13849-1:2023; Safety of Machinery—Safety-Related Parts of Control Systems—Part 1: General Principles for Design. International Organization for Standardization: Geneva, Switzerland, 2023.
- ISO 13855:2024; Safety of Machinery—Positioning of Safeguards with Respect to the Approach of the Human Body, 3rd ed. International Organization for Standardization: Geneva, Switzerland, 2024.
- ISO 13850:2015; Safety of Machinery—Emergency Stop Function—Principles for Design. International Organization for Standardization: Geneva, Switzerland, 2015.
- Gausium. Scrubber 50 Autonomous Floor Scrubber: Specifications. 2025. Available online: https://gausium.com/specs/scrubber50/ (accessed on 12 August 2026).
- Pudu Robotics. PUDU CC1 Commercial Cleaning Robot: Product Specifications. 2025. Available online: https://www.pudurobotics.com/en/products/puduCC1 (accessed on 12 August 2026).
- IEC 61496-3:2025; Safety of Machinery—Electro-Sensitive Protective Equipment—Part 3: Particular Requirements for Active Opto-Electronic Protective Devices Responsive to Diffuse Reflection (AOPDDR), 4th ed. International Electrotechnical Commission: Geneva, Switzerland, 2025.
- ISO 12100:2010; Safety of Machinery—General Principles for Design—Risk Assessment and Risk Reduction. International Organization for Standardization: Geneva, Switzerland, 2010.
- ISO/TS 15066:2016; Robots and Robotic Devices—Collaborative Robots. International Organization for Standardization: Geneva, Switzerland, 2016.
- Lu, Q.; Parlikad, A.K.; Woodall, P.; Don Ranasinghe, G.; Xie, X.; Liang, Z.; Konstantinou, E.; Heaton, J.; Schooling, J. Developing a Digital Twin at Building and City Levels: Case Study of West Cambridge Campus. J. Manag. Eng. 2020, 36, 05020004. [Google Scholar] [CrossRef] [Scilit]
- Khajavi, S.H.; Motlagh, N.H.; Jaribion, A.; Werner, L.C.; Holmström, J. Digital Twin: Vision, Benefits, Boundaries, and Creation for Buildings. IEEE Access 2019, 7, 147406–147419. [Google Scholar] [CrossRef] [Scilit]
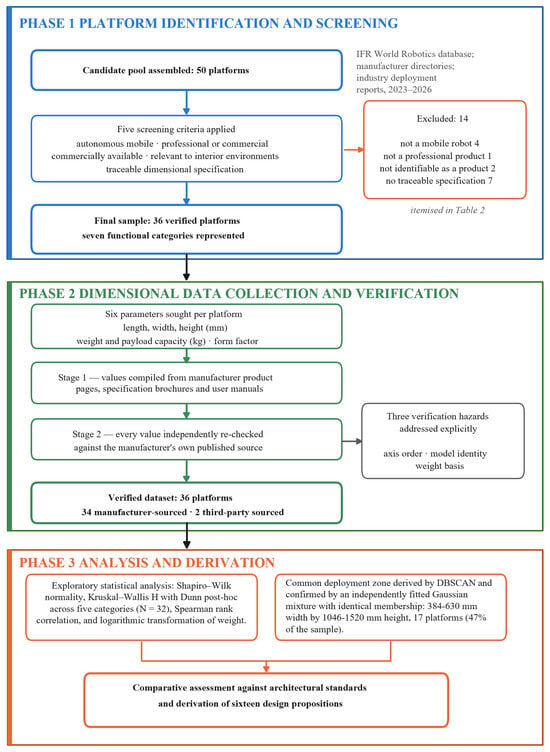
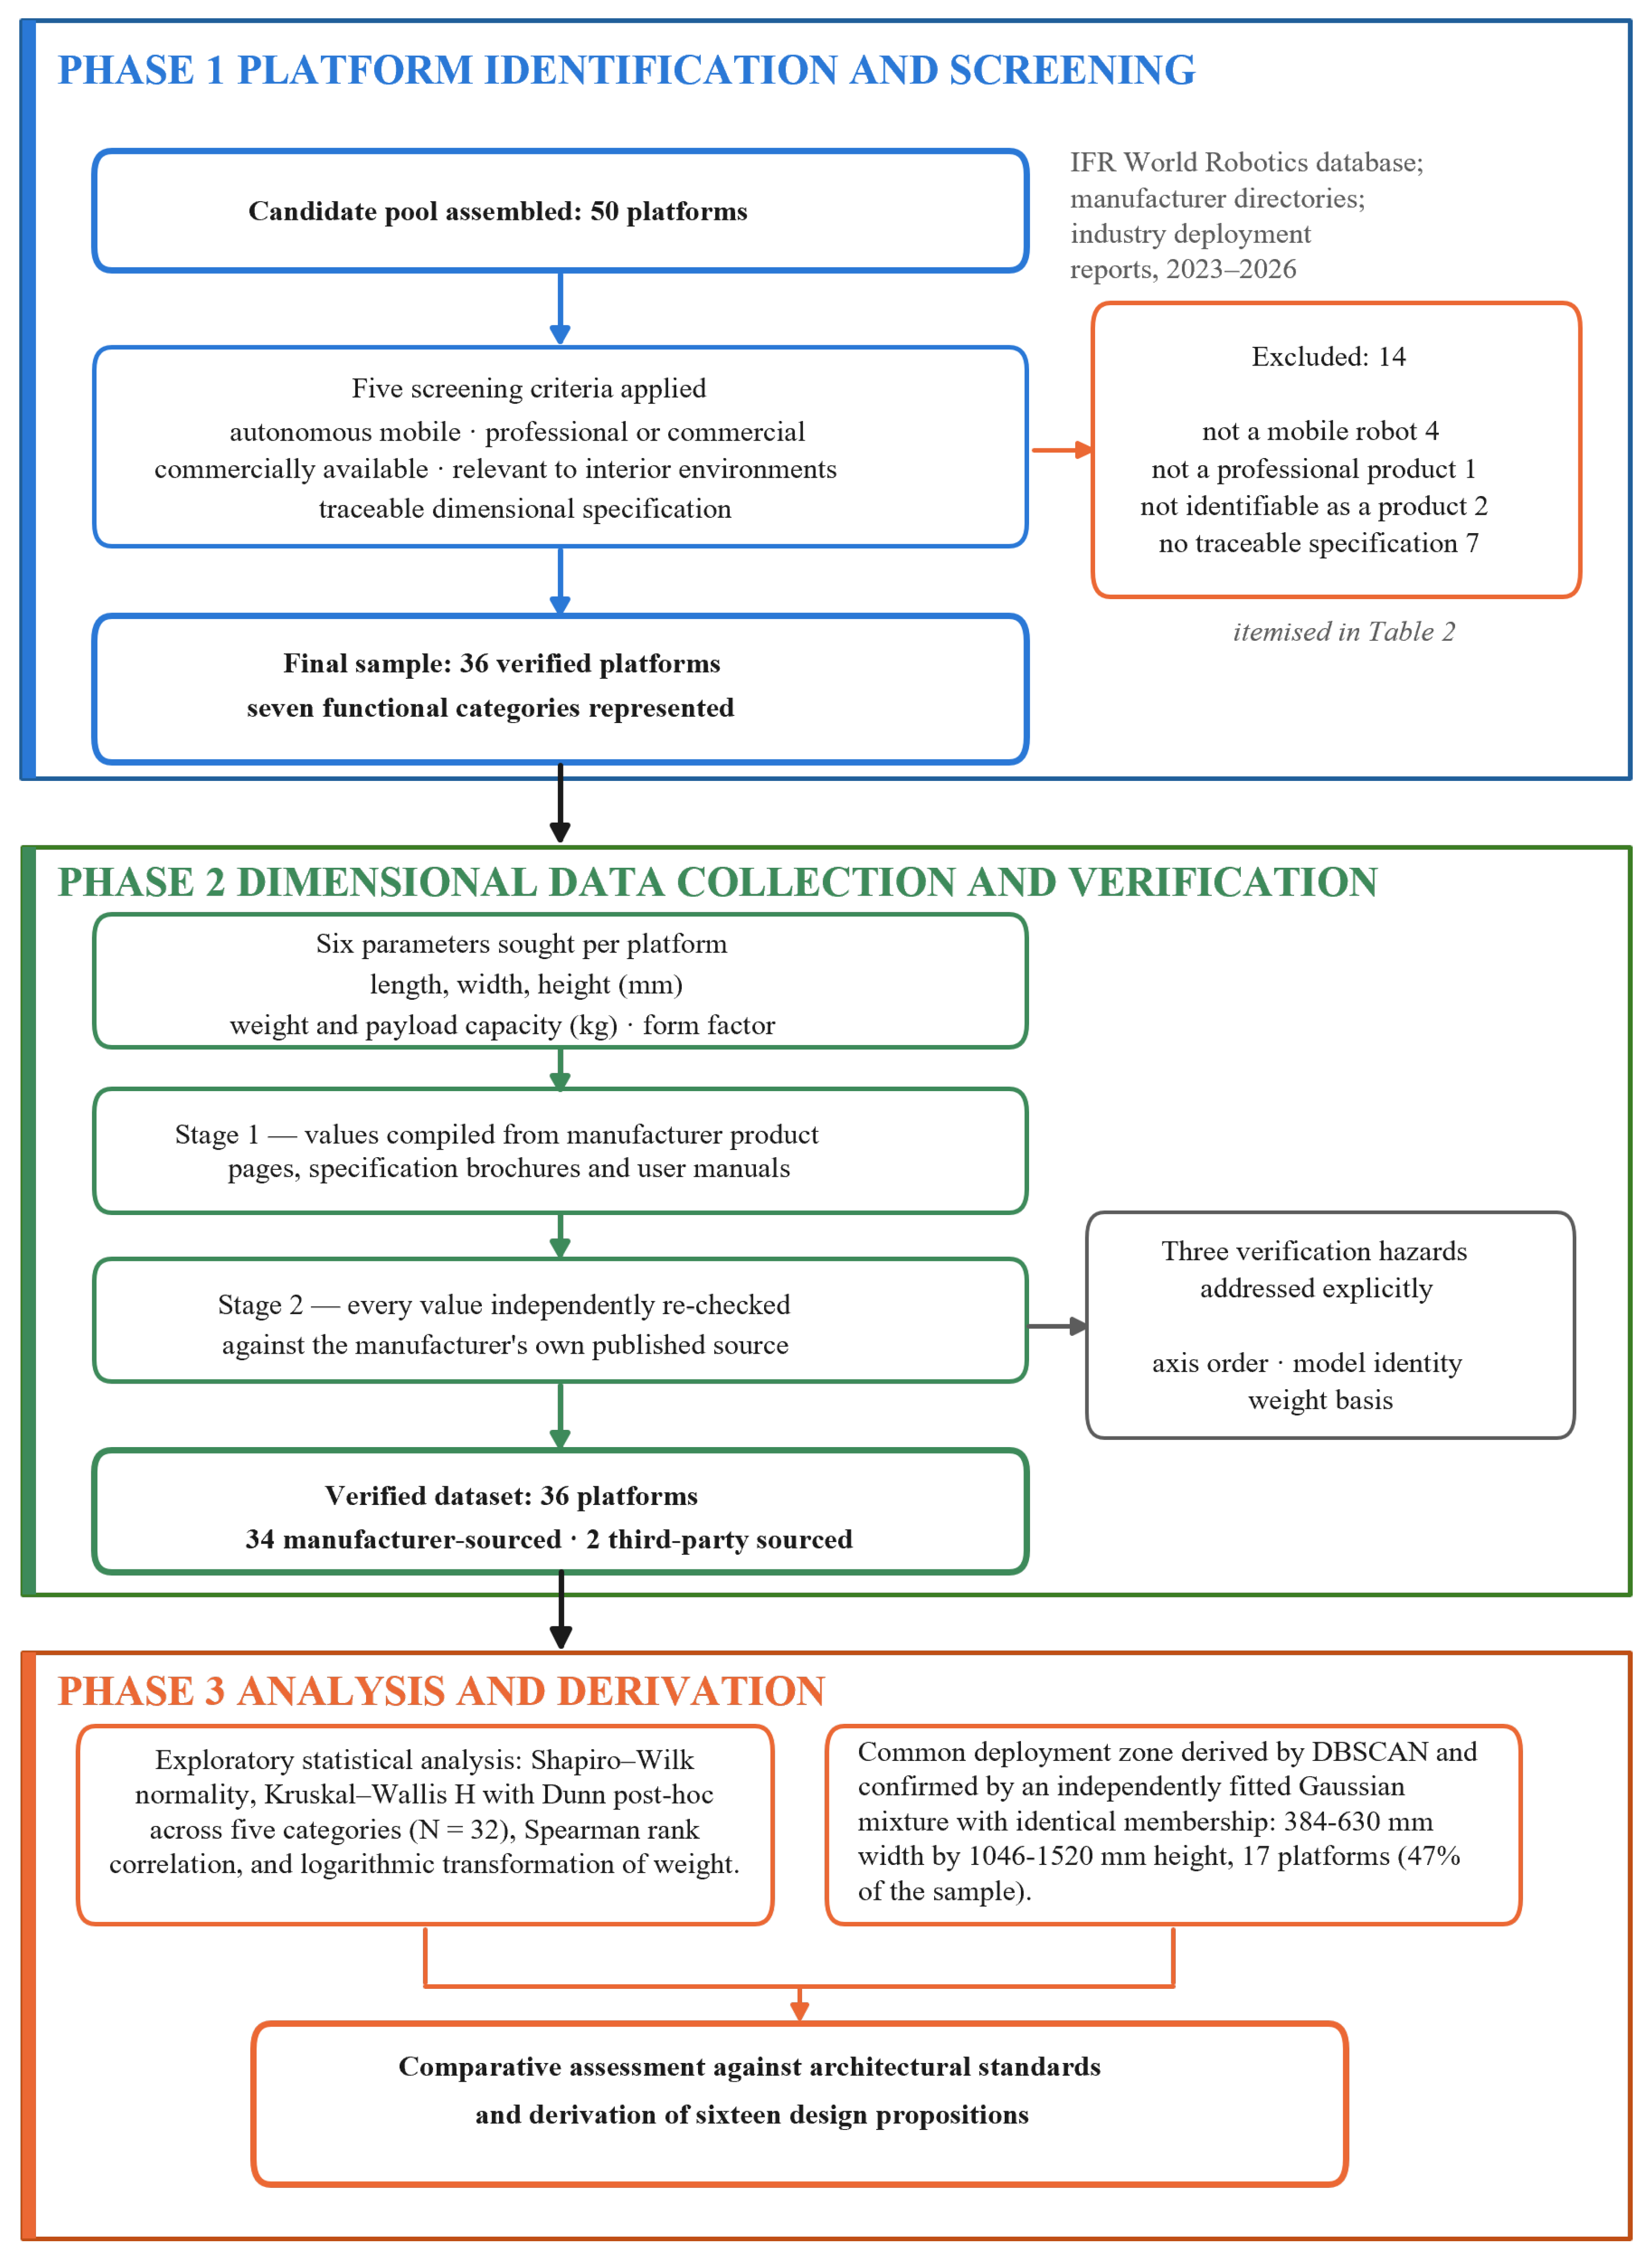
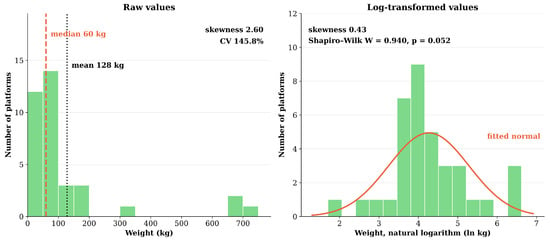
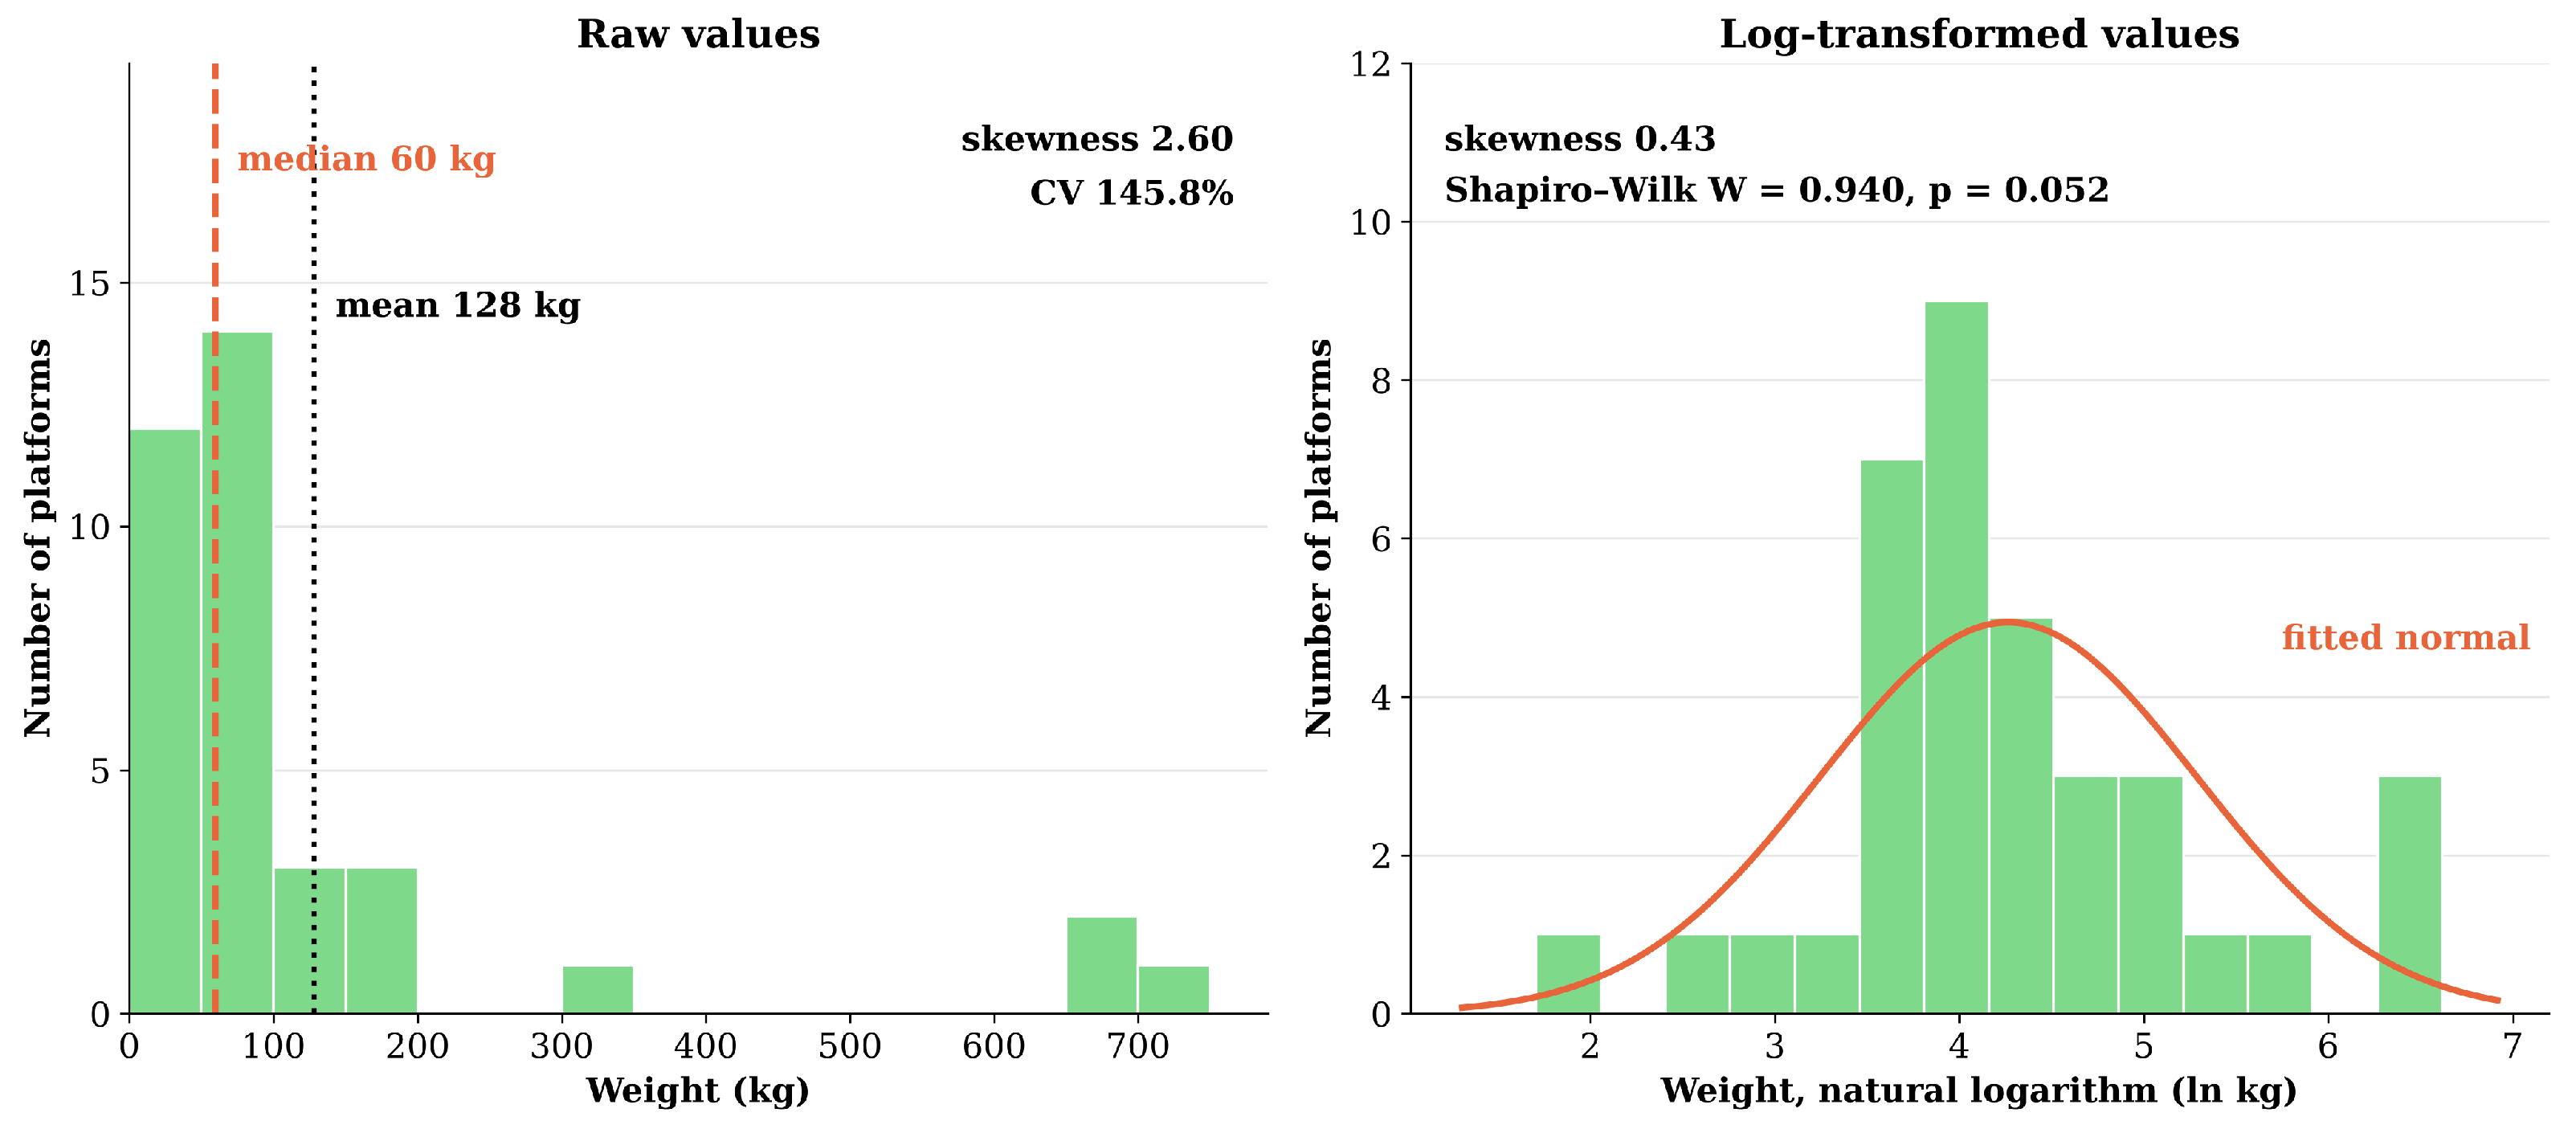
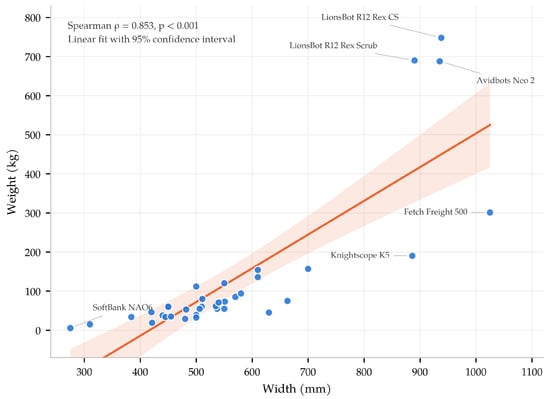
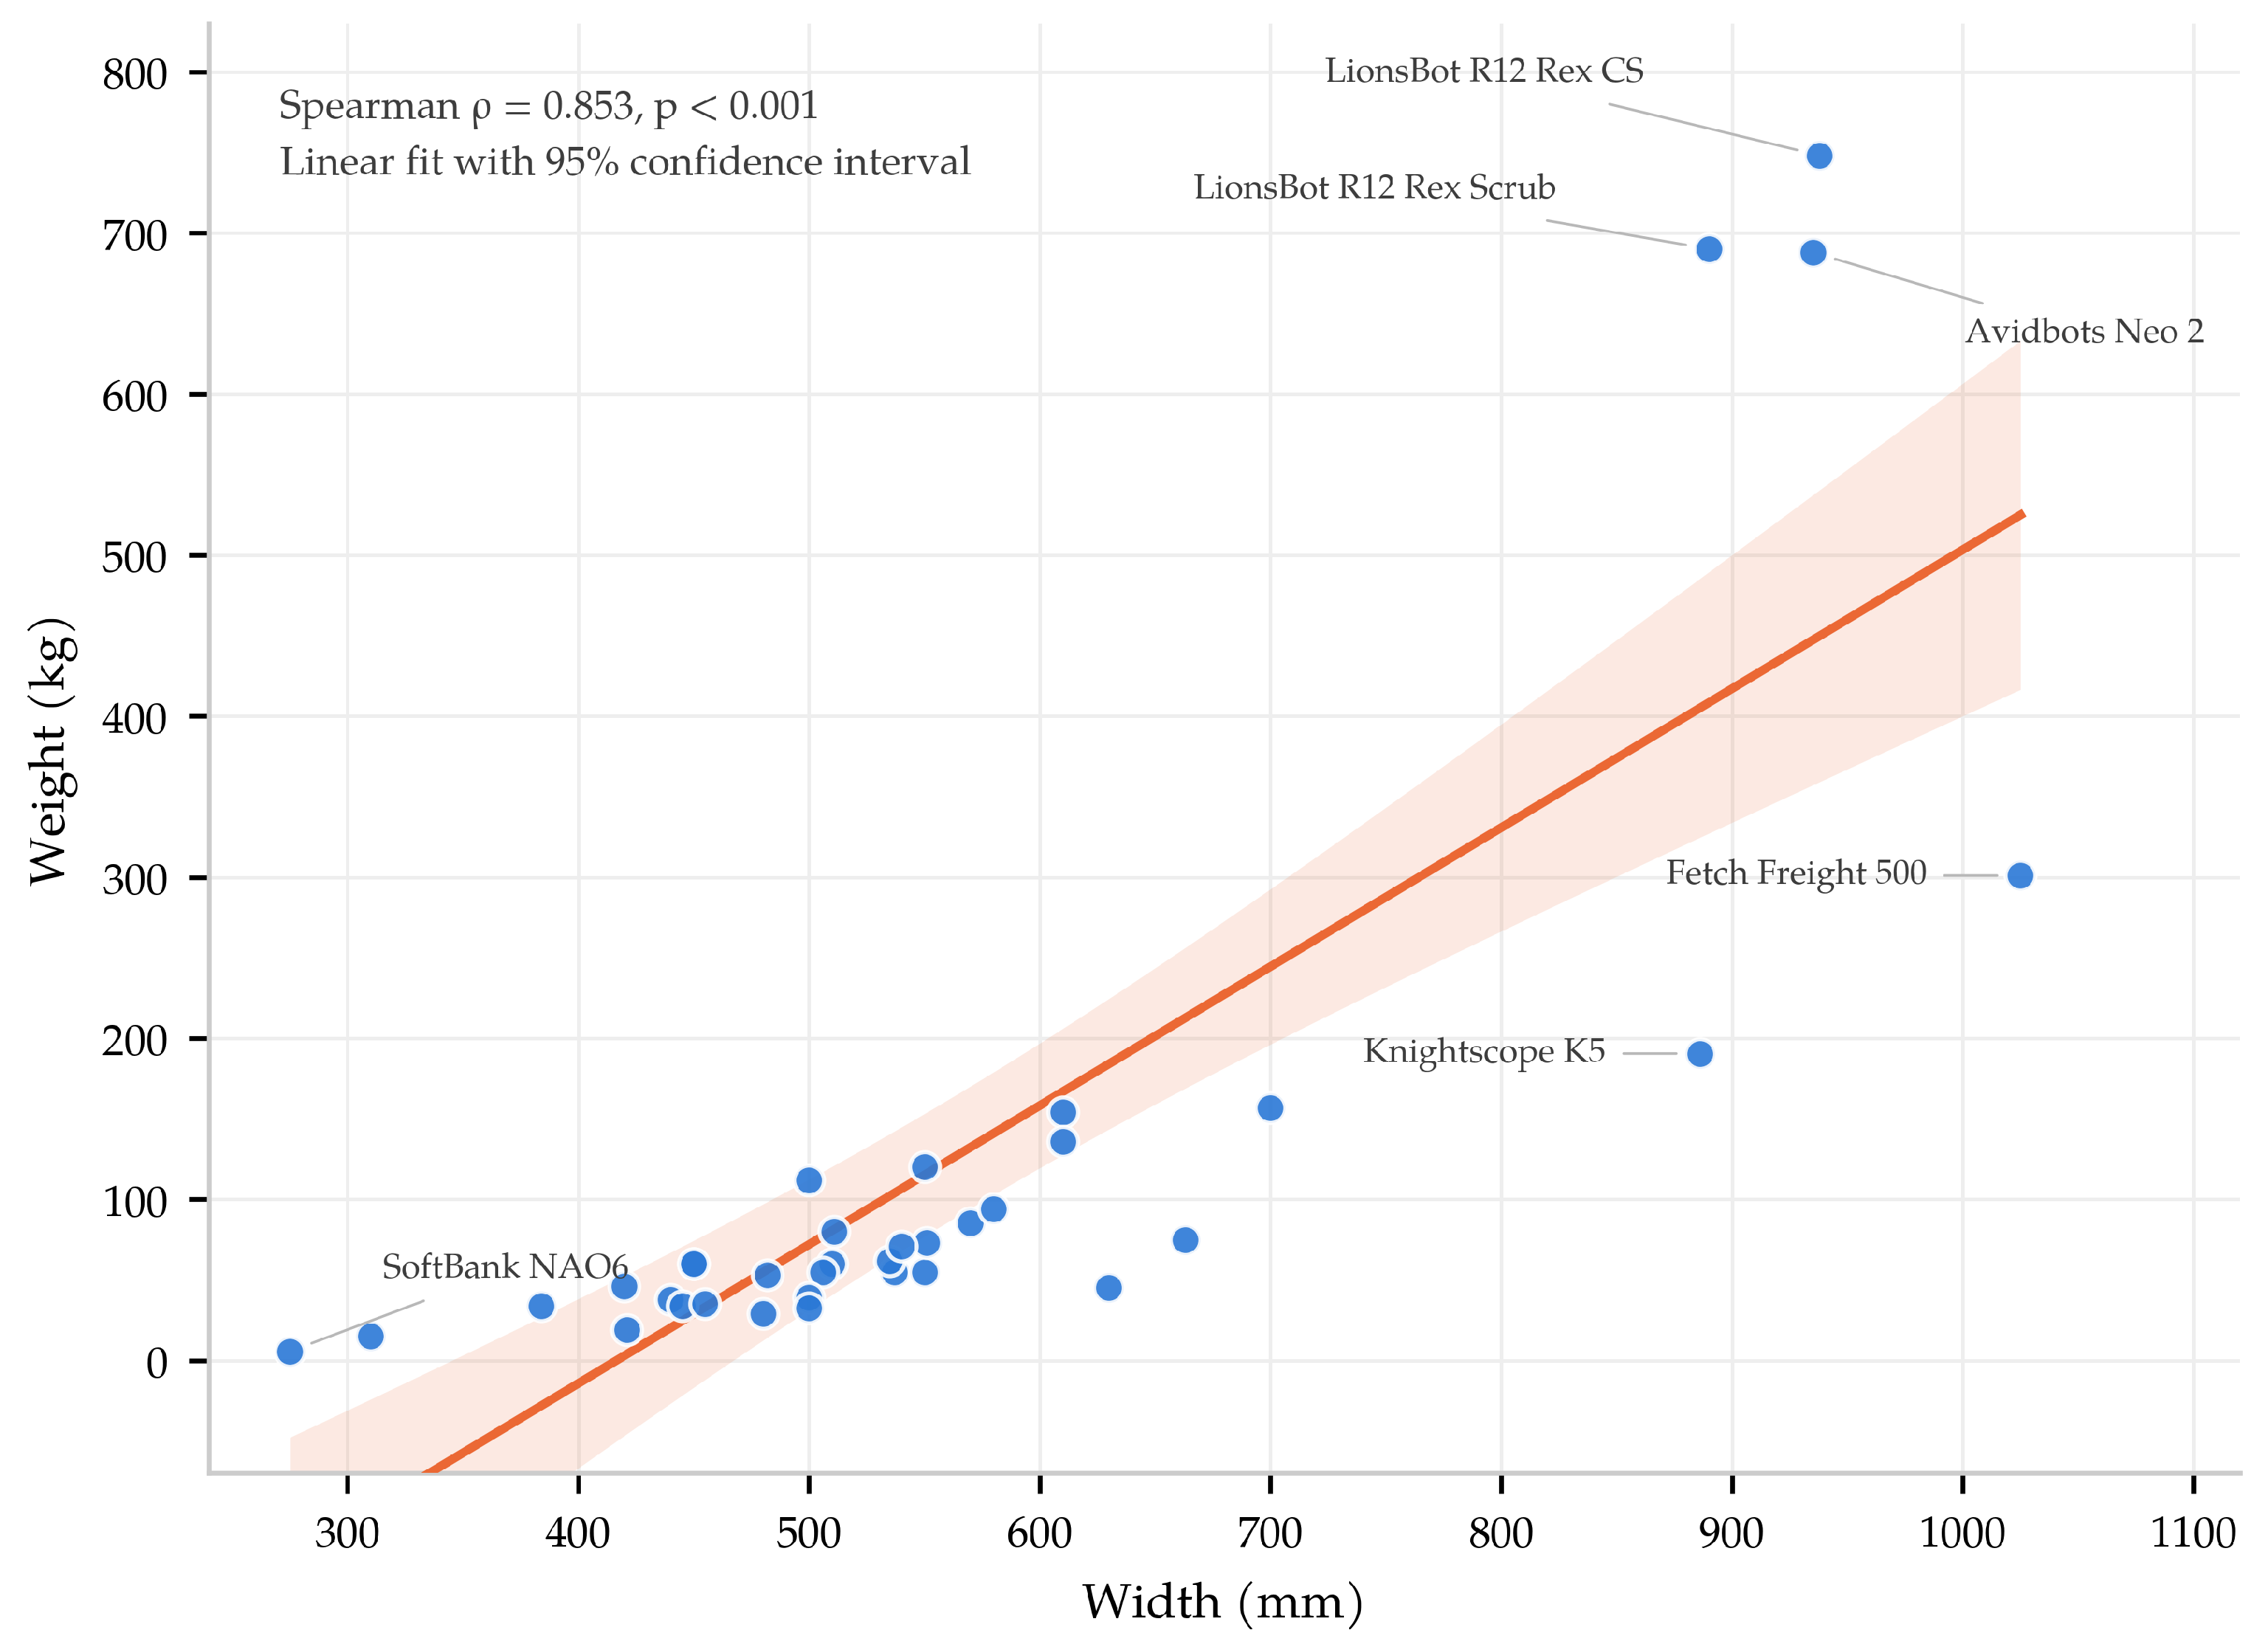
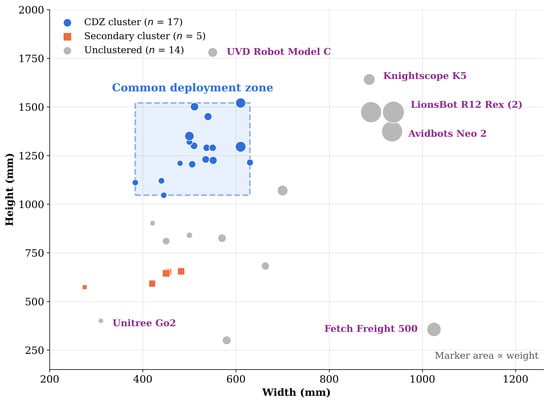
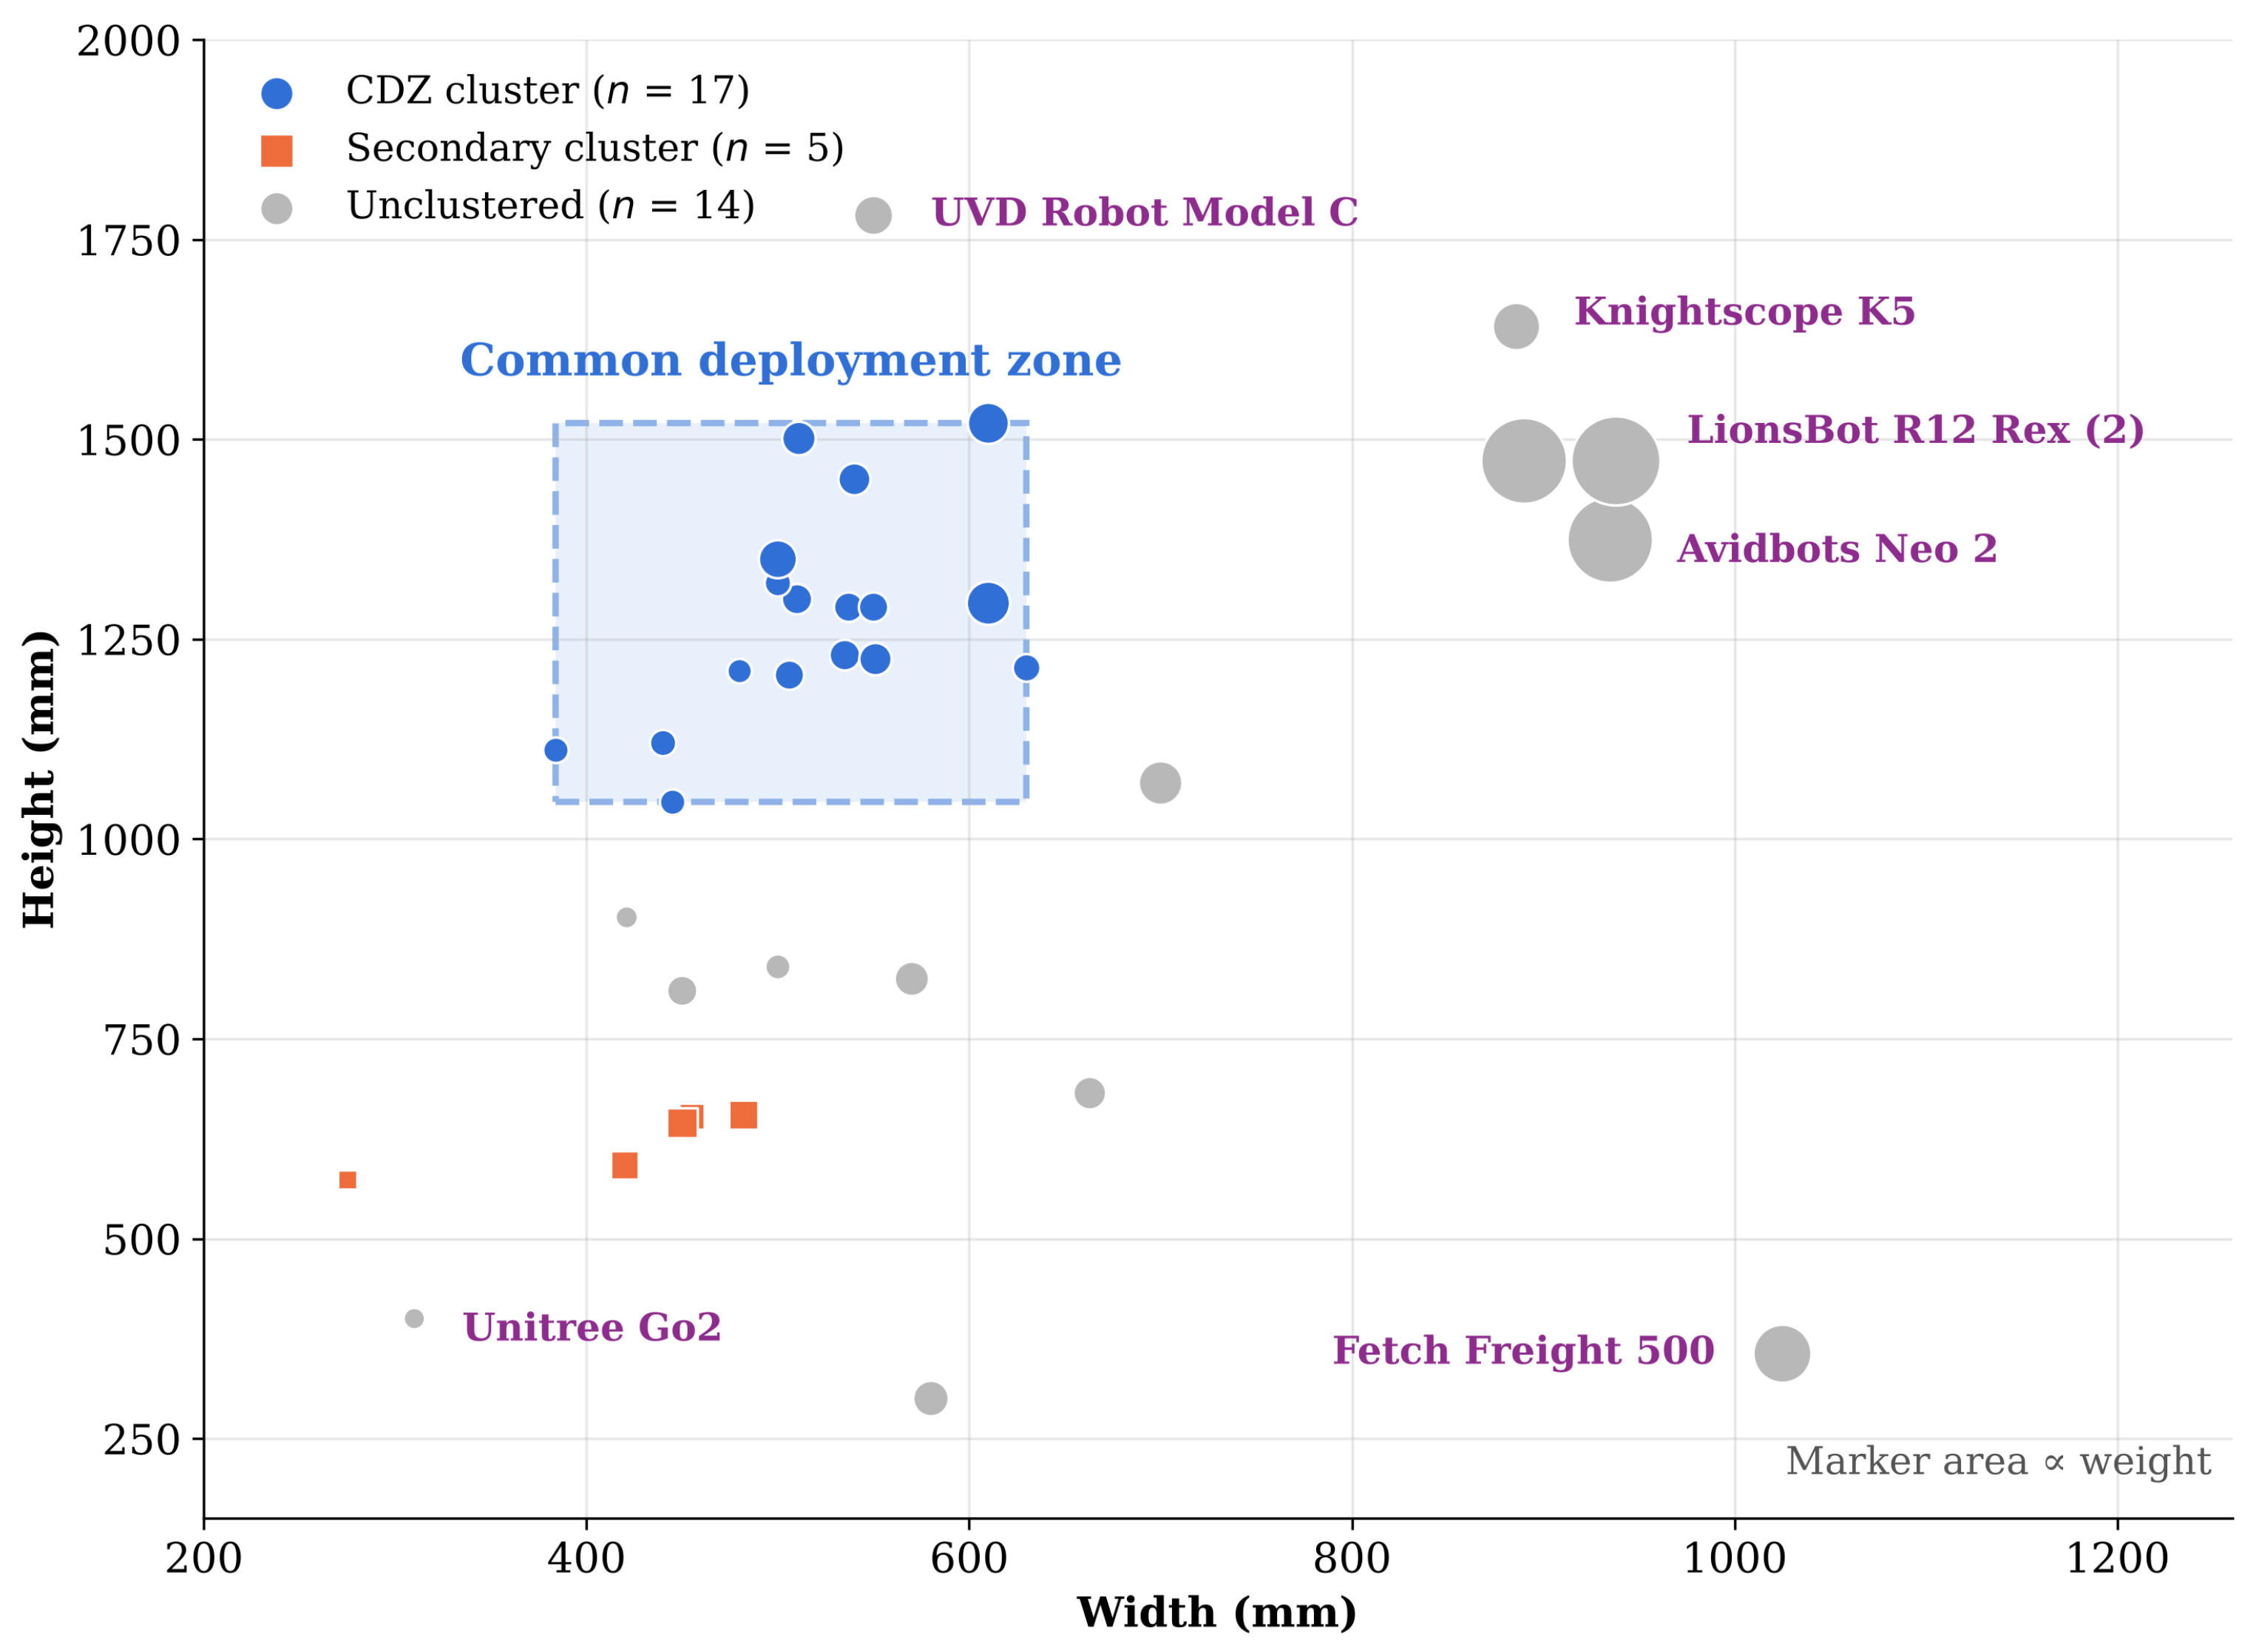
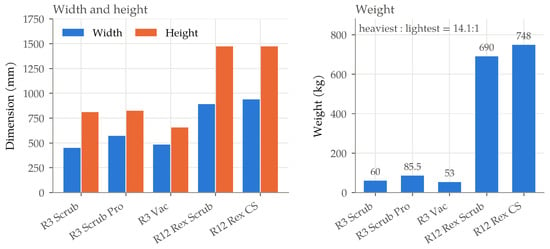
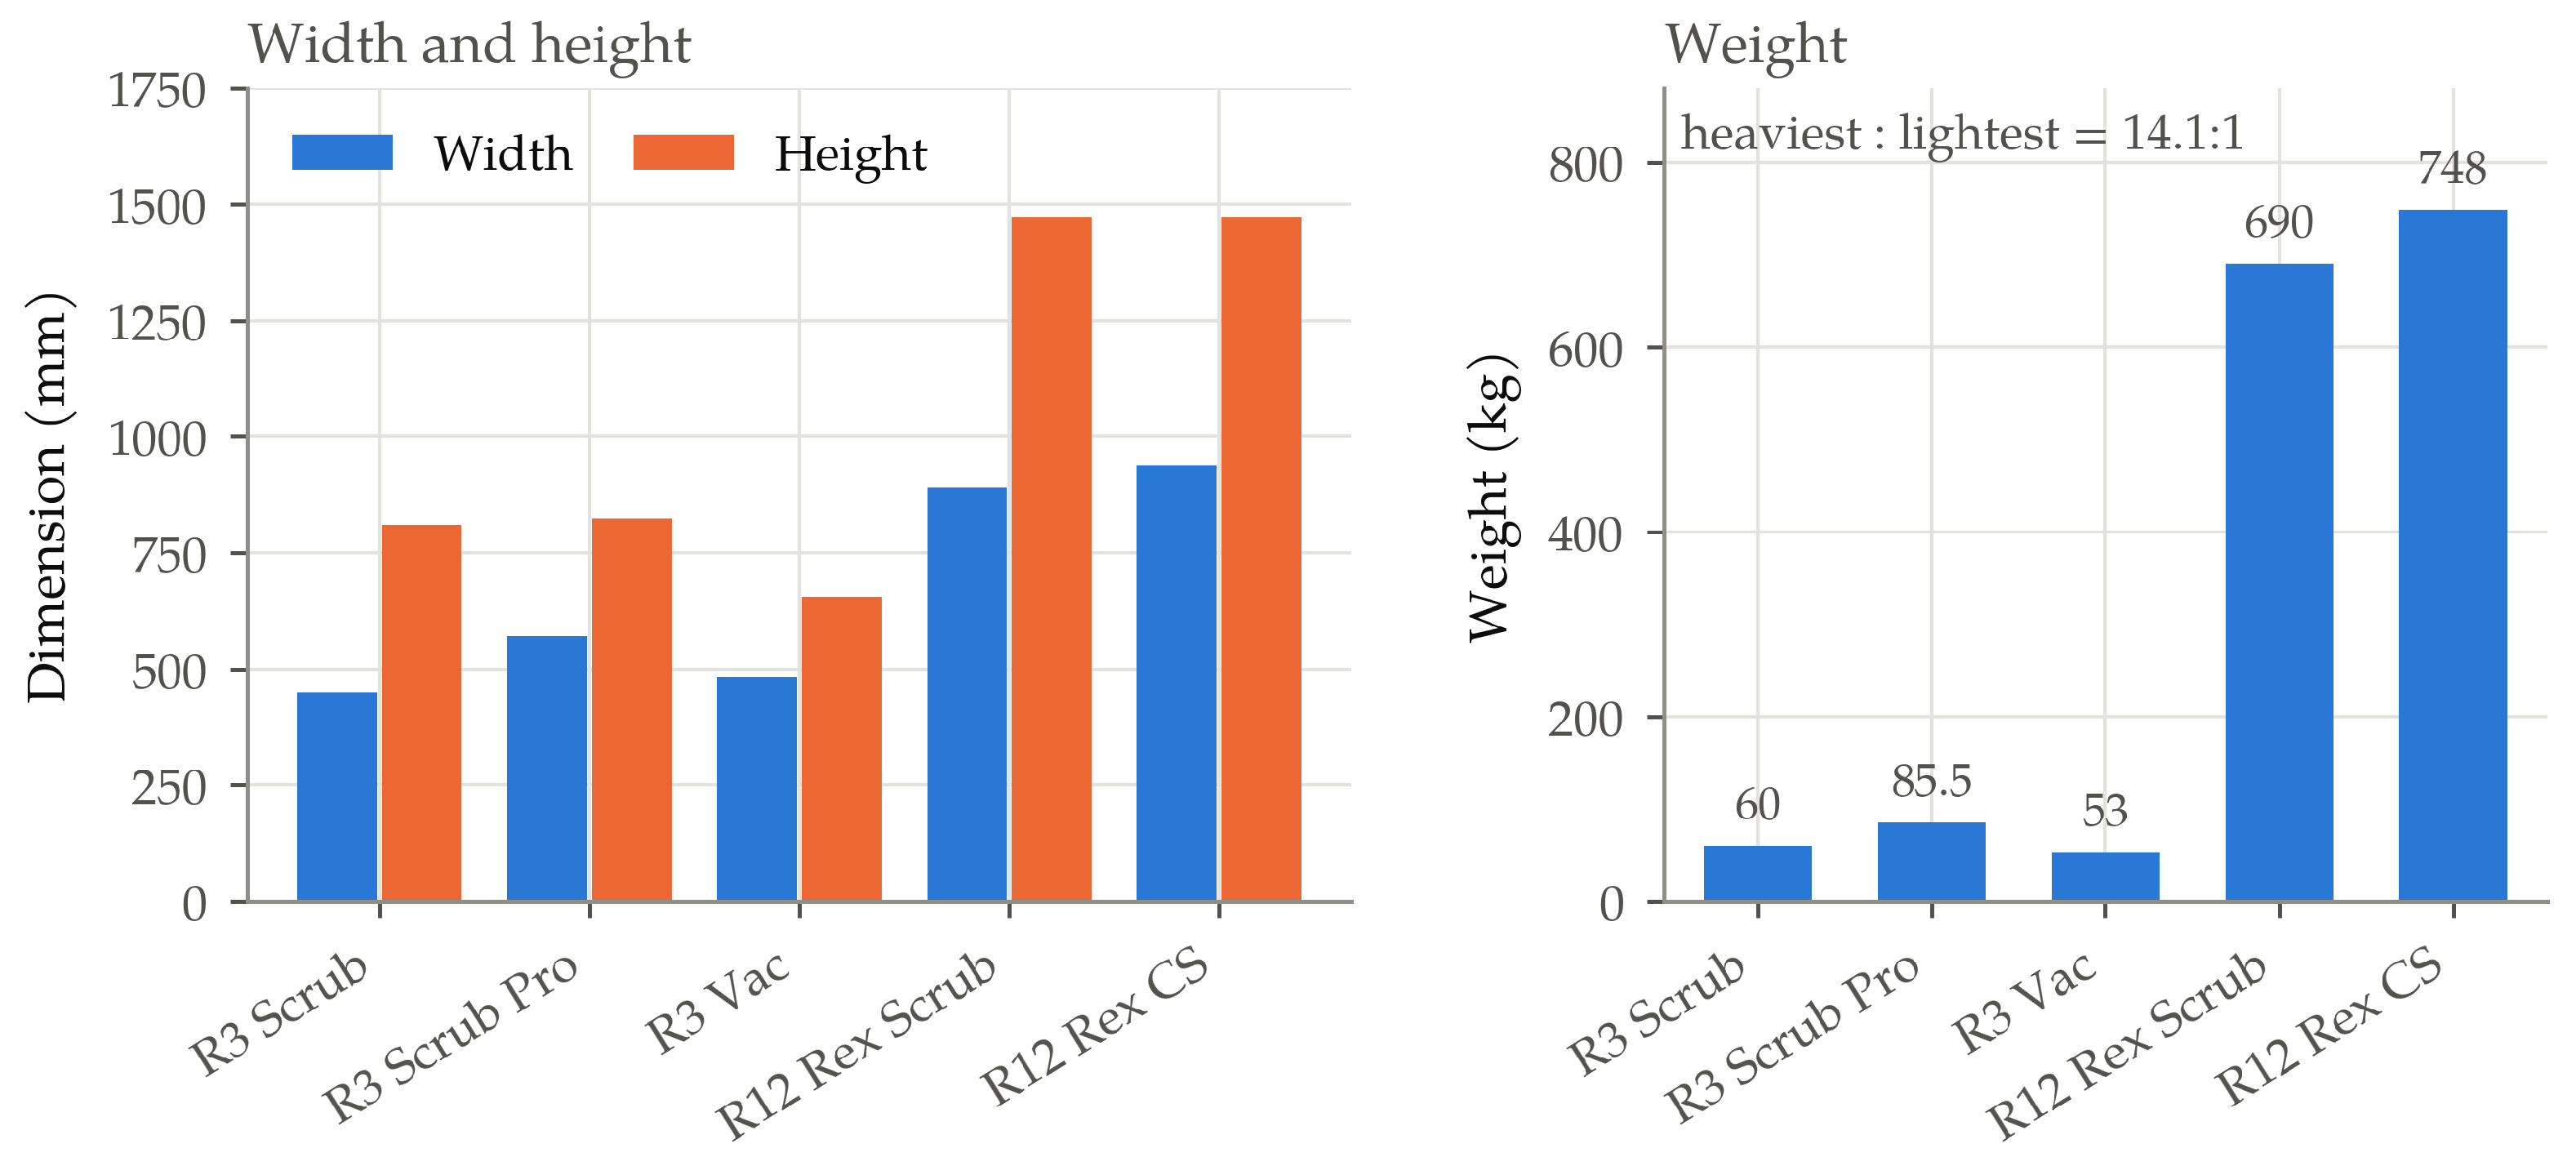

Disclaimer/Publisher’s Note: The statements, opinions and data contained in all publications are solely those of the individual author(s) and contributor(s) and not of MDPI and/or the editor(s). MDPI and/or the editor(s) disclaim responsibility for any injury to people or property resulting from any ideas, methods, instructions or products referred to in the content. |
© 2026 by the authors. Licensee MDPI, Basel, Switzerland. This article is an open access article distributed under the terms and conditions of the Creative Commons Attribution (CC BY) license.