


Abstract
To investigate the influence characteristics of building materials on the indoor radiation environment in practical applications and to quantitatively evaluate the regulatory effects of architectural design parameters on the indoor γ dose rate, a three-dimensional calculation model for the absorbed dose rate in air in a standard room was established using the Monte Carlo method, and the indoor dose field distribution was analyzed. The results show that the absorbed dose rate in air in a standard enclosed room exhibits a gradient distribution characterized by lower values at the center and higher values at the edges, with dose peaks appearing in corners and edge regions due to the superposition of multiple near-field sources. Sensitivity studies on building geometric parameters indicate that, when the room height is fixed, the central dose rate changes non-monotonically with the room volume: as the room volume expands from 2.8 m3 to approximately 25.2 m3, the central dose rate decreases, whereas it gradually increases compared to the standard room when further expanded to 280 m3. With a fixed floor area, the central dose rate shows a monotonically decreasing trend with increasing room height. After introducing realistic asymmetric openings such as doors and windows, the dose field presents significant asymmetric distribution characteristics. The influences of window size and position on the dose were analyzed, and a typical residential layout with an off-center door and a centered window was established. It is found that low-dose channels are formed in the extension areas of the openings, causing the indoor extreme dose points to deviate from the geometric center.
1. Introduction
In recent years, with the significant growth in global construction engineering demand, cement, as the main building material, has been applied in human life on a scale of several hundred million tons every year, and people spend most of their time in various buildings made of cement [1]. Therefore, as the second most widely used substance in the world after water, the waste materials used in cement raw materials and the natural radioactivity hazards of cement products cannot be ignored [2,3].
The natural radioactivity of building materials mainly originates from naturally occurring radionuclides that are widely present in their raw materials, such as rock, soil, and industrial waste slag. Among these nuclides, the uranium series of 226Ra, the thorium series of 232Th, and 40K are listed as key concerns because they contribute most significantly to public radiation doses [4]. The impact of nuclides in these decay chains on human health occurs mainly through two pathways: external exposure and internal exposure [5]. External exposure refers to the radiation received by the human body from strongly penetrating γ rays originating outside the body. 40K, uranium series progeny (such as 214Pb and 214Bi), and thorium series progeny (such as 228Ac and 208Tl) in building materials are the main sources of indoor γ radiation, which can cause continuous whole-body irradiation to indoor occupants.
In the assessment system for converting building material radioactivity sources into actual human exposure doses, early studies mostly relied on specific standard geometric assumptions and empirical formulas. Hando Tohver et al. [6] calculated doses from building materials in less conservative setups by focusing on materials with a potential for recycling NORM residues. It was observed that proper consideration of building material geometry strongly affected the indoor dose rate. Given the time individuals spend indoors, Le Quang Vuong et al. [7] carried out a crucial assessment of the external radiation dose from commonly used construction materials. A room model with dimensions of 5 × 4 × 2.8 m and walls 20 cm thick was developed to simulate radiation doses from materials such as cement, brick, sand, and rock collected from suppliers. Scholars such as Mohammademad Adelikhah et al. [8] carried out residential scenario simulations to estimate the long-term effective dose rate of three different cases of basic building materials utilized in walls, floors and ceilings. Their results revealed that 232Th and 40K contribute the most and least to the indoor dose, respectively. Nugraha Eka Djatnika et al. [9] investigated the radionuclide content of building materials used in Jakarta and its surrounding areas. The annual effective dose received by an adult living in a typical room constructed with the studied building materials was assessed. From their assessment results, although the building materials in Jakarta and its surrounding areas do not pose significant concerns regarding radiological hazards, the higher contribution of 222Rn suggests the need for a large-scale indoor 222Rn survey in the study area. The European Commission’s Radiation protection 112(RP112) proposed a standard room model (dimensions 5 m × 4 m × 2.8 m, wall thickness 20 cm) and introduced the currently widely used activity concentration screening index [10]. However, such simple indicators can only provide rough macro-level safety estimates, and it is difficult to accurately characterize the spatial heterogeneity of radiation in real residential environments.
In the field of analytical calculations, Markkanen developed an analytical calculation model based on the Point-Kernel Method and the gamma-ray buildup factor. This model can efficiently calculate the direct and scattered contributions of gamma radiation from wall materials in rectangular rooms, and is capable of evaluating the shielding effect of additional surface coverings such as double-layer walls [11]. To verify and extend the application of this model, Righi et al. [12] redesigned part of the subroutines using FORTRAN77, focusing on the assessment of γ dose contributions from double-layer structures composed of walls and ceramic tile coverings. The results were well validated through comparison with experimental measurements and other literature data. However, as an analytical algorithm, the traditional Markkanen model has certain limitations in dealing with complex spatial geometry topologies and non-uniform materials.
In response to these limitations, subsequent scholars have carried out extensive improvements from the perspectives of geometric adaptability, parameter optimization, and energy spectrum expansion. In terms of methodology, Mirza et al. [13] proposed a shape- and grid-adaptive calculation method suitable for volumetric source gamma doses, providing a new approach for overcoming the limitations of traditional analytical models in handling complex geometries. Regarding parameter sensitivity and structural influence, Risica et al. [14] conducted an in-depth discussion on the effects of wall thickness, density, and room geometric parameters on the absorbed dose rate, emphasizing the importance of improving model prediction accuracy through the optimization of key parameters. For energy spectrum and complex scenario expansion, Croymans et al. [15] greatly expanded Markkanen’s original limited γ energy set to 1845 emission lines and developed an Extended Gamma Dose Assessment (EGDA) model, significantly improving the dose calculation accuracy under non-standard room conditions and non-uniform material parameters. In addition, Olarinoye et al. [16], when assessing the radiation dose of special building materials (such as mineral tailings concrete blocks), constructed a theoretically extended model applicable to arbitrary room configurations, effectively enhancing the generalization ability and practical industrial applicability of the model when dealing with non-standard spatial sizes and heterogeneous materials.
It can be seen that at the current stage, while the radioactivity testing of building materials is being conducted, research on radioactivity distribution models for practical indoor application scenarios is also progressively advancing. These models ultimately aim to assess the potential external exposure of occupants, and previous studies have converted indoor absorbed dose rates into occupant effective doses using indoor occupancy factors and dose conversion coefficients. This study focuses on the indoor absorbed dose rate in air as the physical basis for such occupant-dose assessments. Most of the current mainstream models are improvements based on the Markkanen model, and the analytical calculation methods are relatively complex. Although Monte Carlo simulations are limited by geometric simplification, material homogenization, and computational cost when modelling real buildings, and such simplifications may introduce deviations from real structures, the Monte Carlo method and software such as MCNP and OpenMC have developed rapidly and possess powerful functions. Therefore, it is highly necessary to establish relevant models using the Monte Carlo method to conduct fast and accurate simulation studies on radioactive dose distribution.
2. Modeling and Verification of Indoor Gamma Dose Rate Calculation
2.1. Geometric Model and Material Settings
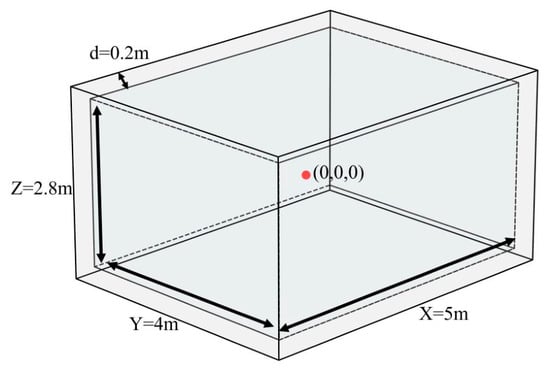
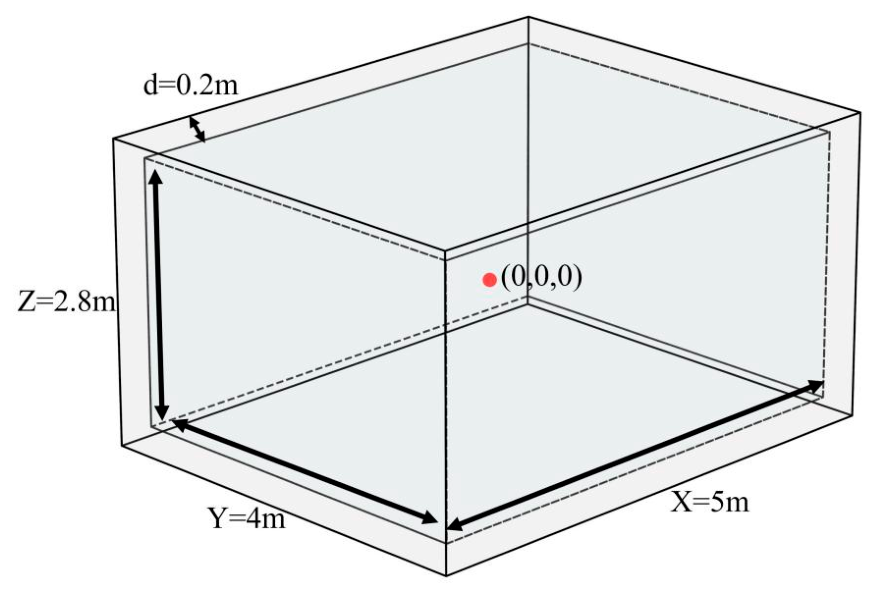
In the technical guidance document RP-112 published in 1999, the European Commission Radiation Protection Committee proposed the use of the Activity Concentration Index (ACI) in building materials as a preliminary screening indicator to quickly determine whether building materials might cause indoor radiation doses to exceed standard limits; this index is based on a hypothetical standard room model measuring 500 cm × 400 cm × 280 cm with a wall thickness of 20 cm. In this study, the initial room dimensions were constructed using the aforementioned standard dimensional parameters, as shown in Figure 1. For convenience of analysis, X, Y, and Z are defined to represent the length, width, and height of the room, respectively, and the coordinates of the center position of the room are set as (0, 0, 0). The walls are assumed to be homogeneous concrete with a density of 2350 kg/m3, and the indoor air density is taken as 1.205 kg/m3; the elemental compositions of the model materials are defined in Table 1 [17]. These standard room dimensions and material properties are widely used in building material dose assessment and represent typical dense concrete, allowing comparison with published studies.
Figure 1.
Schematic diagram of the geometric structure of the dose model.
Table 1.
Composition of material elements and their mass fractions (%).
2.2. Source Term Definition and Dose Calculation
The dose calculation model in this study is based on the following typical physical assumptions: (1) The radioactive sources are assumed to be uniformly distributed within the walls, ceiling, and floor, and emit isotropic photons only; (2) 226Ra and 232Th are used to represent the uranium-series and thorium-series decay chains, respectively; their major decay progeny are assumed to be in long-term equilibrium; (3) This study focuses primarily on the contribution of gamma rays to the indoor absorbed dose in air, neglecting the internal exposure dose caused by radon exhalation; (4) Other types of radiation, such as α and β particles, are excluded from the model due to their weak penetrating capabilities and relatively minor contributions to the indoor radiation dose.
All simulations in this study were performed with MCNP6. In the dose calculation module, the F5 point detector in MCNP is selected to efficiently calculate the photon fluence (cm−2/source particle) passing through the target spatial point. By setting the energy card, the photon fluence energy spectrum at the detection point can be obtained. Combined with the DE/DF dose energy card and the dose function card, the dose conversion function is defined, thereby enabling the conversion from photon fluence to absorbed dose. The relevant conversion coefficients are taken from Publication 74 of the International Commission on Radiological Protection (ICRP) [18]. To ensure the statistical reliability of the calculation results, the number of transported particles for all simulation tasks is set to 106–108 to satisfy the condition that the statistical error of the calculation results does not exceed 1%. Consequently, the average absorbed dose in air at the target location contributed by a single source particle in the decay chain of the nuclide of interest can be calculated. Combined with the source mass, the specific activity of the nuclide of interest, and the average number of gamma rays emitted per decay, the actual absorbed dose rate in air can be calculated as follows:
where Di is the absorbed dose rate in air of the nuclide of interest, in units of nGy/h; Φ is the photon fluence at the target position, in units of cm−2/source particle; Ka/Φ is the air kerma conversion coefficient per unit fluence for monoenergetic photons, in units of Gy cm2; Pi is the average number of γ rays released per decay of the nuclide of interest; m is the mass of the radiation source, in units of kg; Ci is the specific activity of the radionuclide, in units of Bq/kg. In Equation (1), Φ(Ka/Φ) is the air kerma per source particle obtained from the F5 tally and the ICRP-74 coefficients; multiplying by Pi gives the air kerma per decay, and further multiplying by the total activity mCi gives the absorbed dose rate in Gy/s; the factor 3600 × 109 converts Gy/s to nGy/h.
To make the simulation results universally applicable and to facilitate standardized comparisons with other research achievements both domestically and internationally, this study introduces the dose rate conversion factor (DCF). Its physical significance represents the absorbed dose rate in air contributed per unit specific activity of a specific radionuclide in building materials under specific geometric models, materials, and detection point conditions, with the unit of (nGy·h−1)/(Bq·kg−1) [19]. The calculation formula for DCF is as follows:
where DCFi is the dose rate conversion factor of nuclide i, in units of (nGy·h−1)/(Bq·kg−1).
2.3. Verification of the Indoor Gamma Dose Rate Calculation Model
To verify the accuracy and reliability of the established MCNP model in this study, the calculation results of the model were systematically compared with international authoritative reports and publicly published literature. All comparisons were conducted under the conditions of the standard room model (5 m × 4 m × 2.8 m, wall thickness 0.2 m, wall density 2350 kg/m3), using the dose rate conversion factor (DCF) at the geometric center of the room (0, 0, 0) as the core comparative index.
- (1)
- Baseline Comparison with the European Commission RP-112 Report
The Report No. 112 published by the European Commission is a recognized authoritative reference document in the field of building material radioactivity assessment. In this study, the simulated DCF values were first directly compared with the standard values provided in the RP-112 report. As shown in Table 2, the calculation errors for all nuclides are within 10%.
Table 2.
Verification of the accuracy of indoor γ dose models.
- (2)
- Comparison with Other Published Literature Results
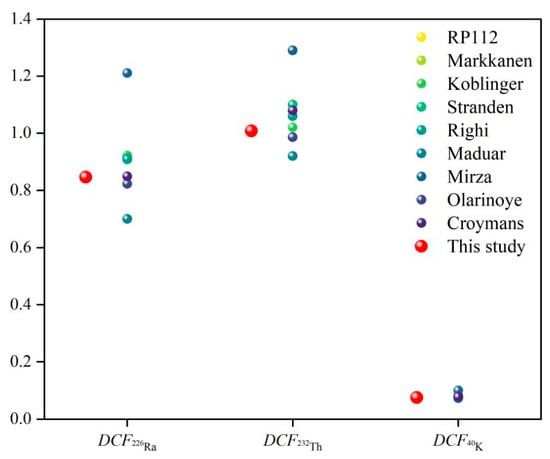
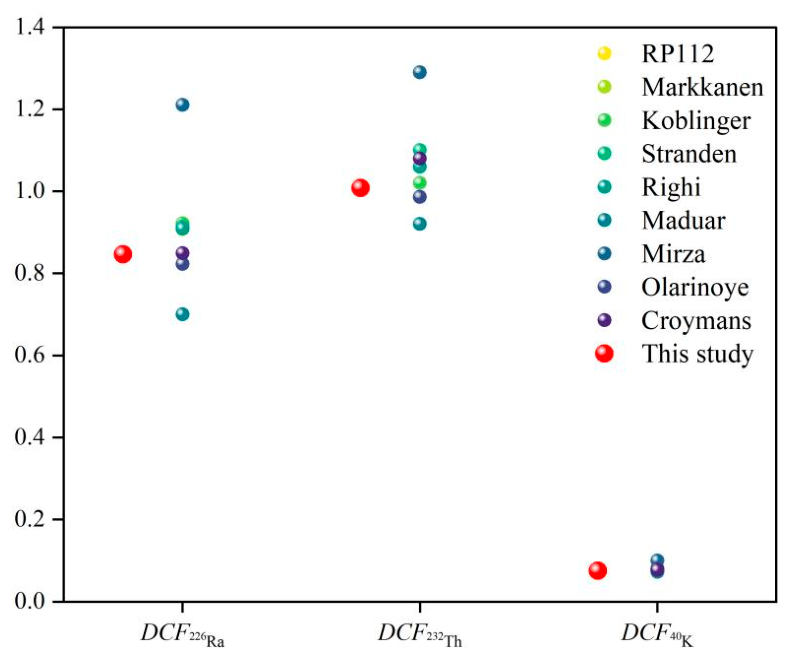
To further evaluate the validity of the results in this study, we compared our calculation results with the research findings obtained by several international scholars using similar geometric models, as shown in Figure 2 and Table 3. Although deviations exist among different models due to differences in calculation methods, simplifying assumptions, the gamma lines included in the source term, and the wall density, the results of this study still fall within a reasonable range. In summary, through quantitative baseline comparisons with authoritative reports and horizontal comparisons with multiple published studies, the accuracy of the MCNP calculation model established in this study has been fully validated.
Figure 2.
Comparison of results from different computational models.
Table 3.
Comparison of results from different computational models.
This section focuses on model establishment and verification. The relative deviation index used in the following sensitivity analysis is defined here for clarity. To quantitatively describe the gradient changes in the dose field, this study introduces the index of relative deviation of the dose rate. This index is defined as the ratio of the difference between the dose rate at the target point calculated under specific parameters and the dose rate at the geometric center of the standard model, to the dose rate at the geometric center of the standard model. This index eliminates the influence of the absolute specific activity and allows dose rates under different geometric parameters to be compared on a relative basis.
3. Results and Discussion
In a real residential environment, the indoor gamma radiation field is not absolutely uniform. Based on the standard room model described in Section 2 and the measured source-term parameters below, this section presents the indoor dose distribution and sensitivity analysis. The specific activities of 226Ra, 232Th, and 40K in the measured building materials are 28.710, 17.555, and 235.044 Bq/kg, respectively, and are used as the input for the radioactive source term.
3.1. Calculation of Dose Rate Gradient Distribution in the Standard Room Model
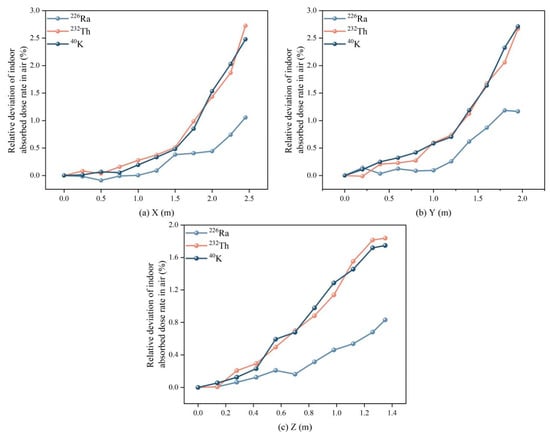
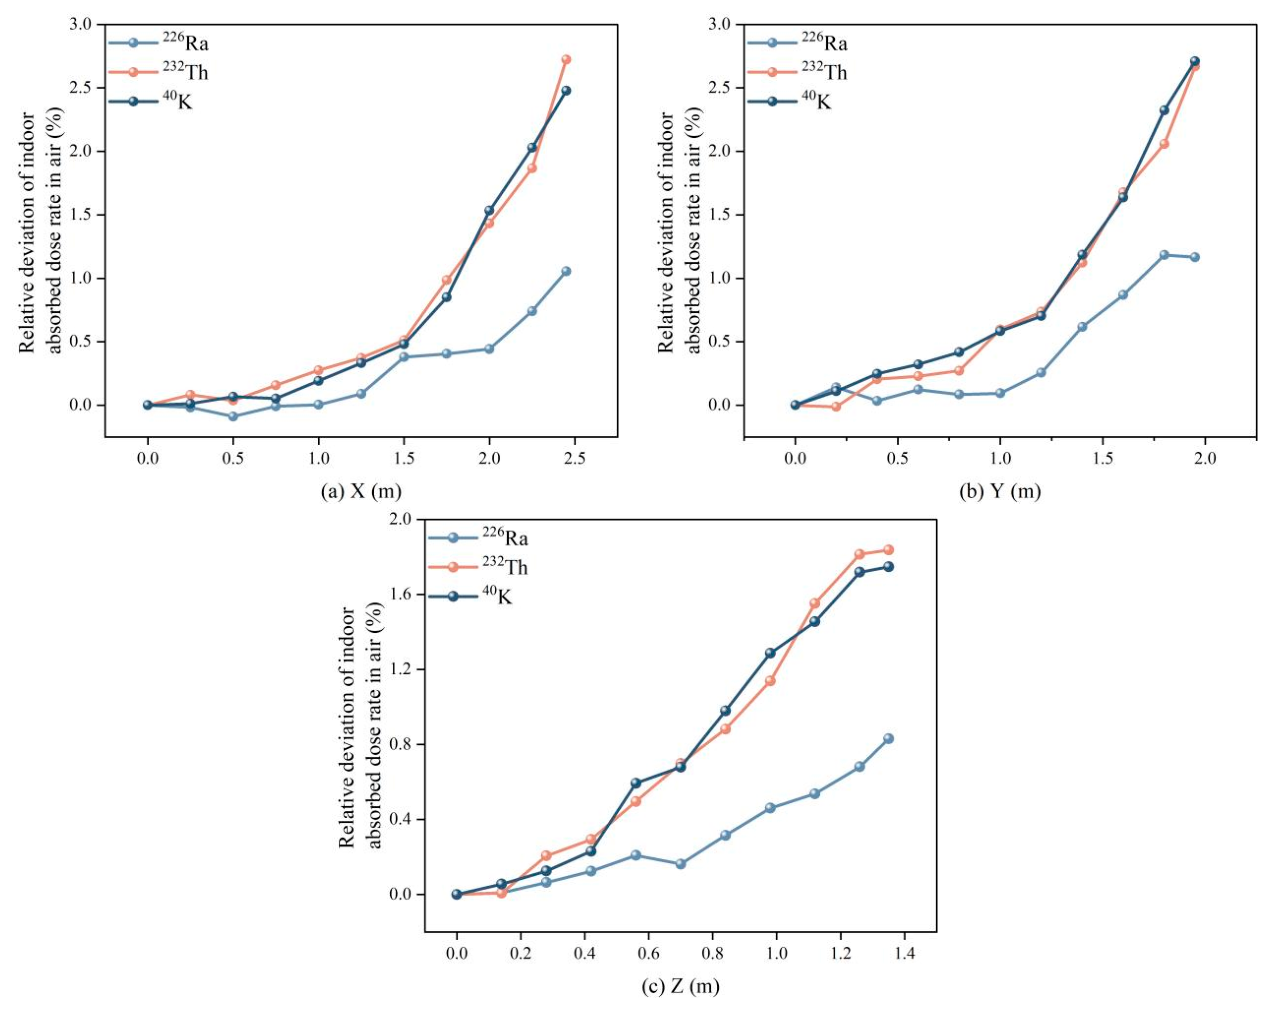
This section first examines the spatial dose distribution within the fixed standard room model (5 m × 4 m × 2.8 m, wall thickness 0.2 m). Figure 3 shows the variation in the relative deviation of the absorbed dose rate caused by the decay series of three nuclides (226Ra, 232Th, 40K) as the detection point moves from the center toward the walls along the X, Y, and Z axes.
Figure 3.
Relative deviation of dose rate in the (a) X direction (b) Y direction (c) Z direction.
It can be observed from the figure that the overall dose field in all directions exhibits a non-uniform distribution pattern characterized by lower values at the center and higher values at the edges. Within a range of 1.5 m and 1 m from the room center in the X and Y directions, the fluctuation of the dose rate is small. As the measurement point approaches the surrounding walls, the dose rate exhibits a non-linear, accelerated upward trend. In the Z direction, because the room’s height is smaller than its length and width dimensions, the spatial gradient variation in the vertical direction is more compact.
This non-uniform distribution pattern occurs because as the measurement point shifts toward a certain wall, the solid angle subtended by that wall with respect to the measurement point increases rapidly. The unscattered and small-angle scattered photon flux from this nearest source plane increases sharply, and its incremental contribution to the total dose far exceeds the attenuation caused by the increased distance from the opposite wall.
Simultaneously, it can be seen that different nuclides exhibit certain differences in spatial gradients, which are essentially determined by the energy spectrum characteristics of the γ rays released during their decay. 40K itself emits high-energy monoenergetic γ photons of 1460.8 keV, and the main dose contribution of the 232Th decay series also comes from high-energy photons such as 2614.5 keV emitted by its progeny 208Tl. These photons have long mean free paths and strong penetrating capabilities in building materials, so they can escape from deeper wall layers and contribute significantly to the indoor dose. When the measurement point approaches a source plane, the enhancement effect of the direct radiation of high-energy photons from that plane is particularly sensitive, leading to a higher peak relative deviation. In contrast, the γ rays emitted by the 226Ra decay series are predominantly in the medium-to-low energy region, such as 351.9 keV and 609.3 keV. Low-energy photons have larger attenuation cross-sections in building materials, so they are strongly self-absorbed, and only a thin layer near the inner wall surface contributes significantly to the indoor dose. Consequently, when the detection point approaches the wall, the flux increase in low-energy rays is smaller than that of high-energy rays.
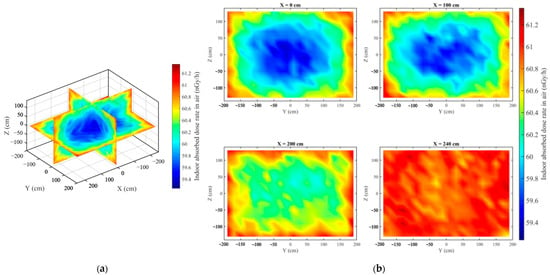
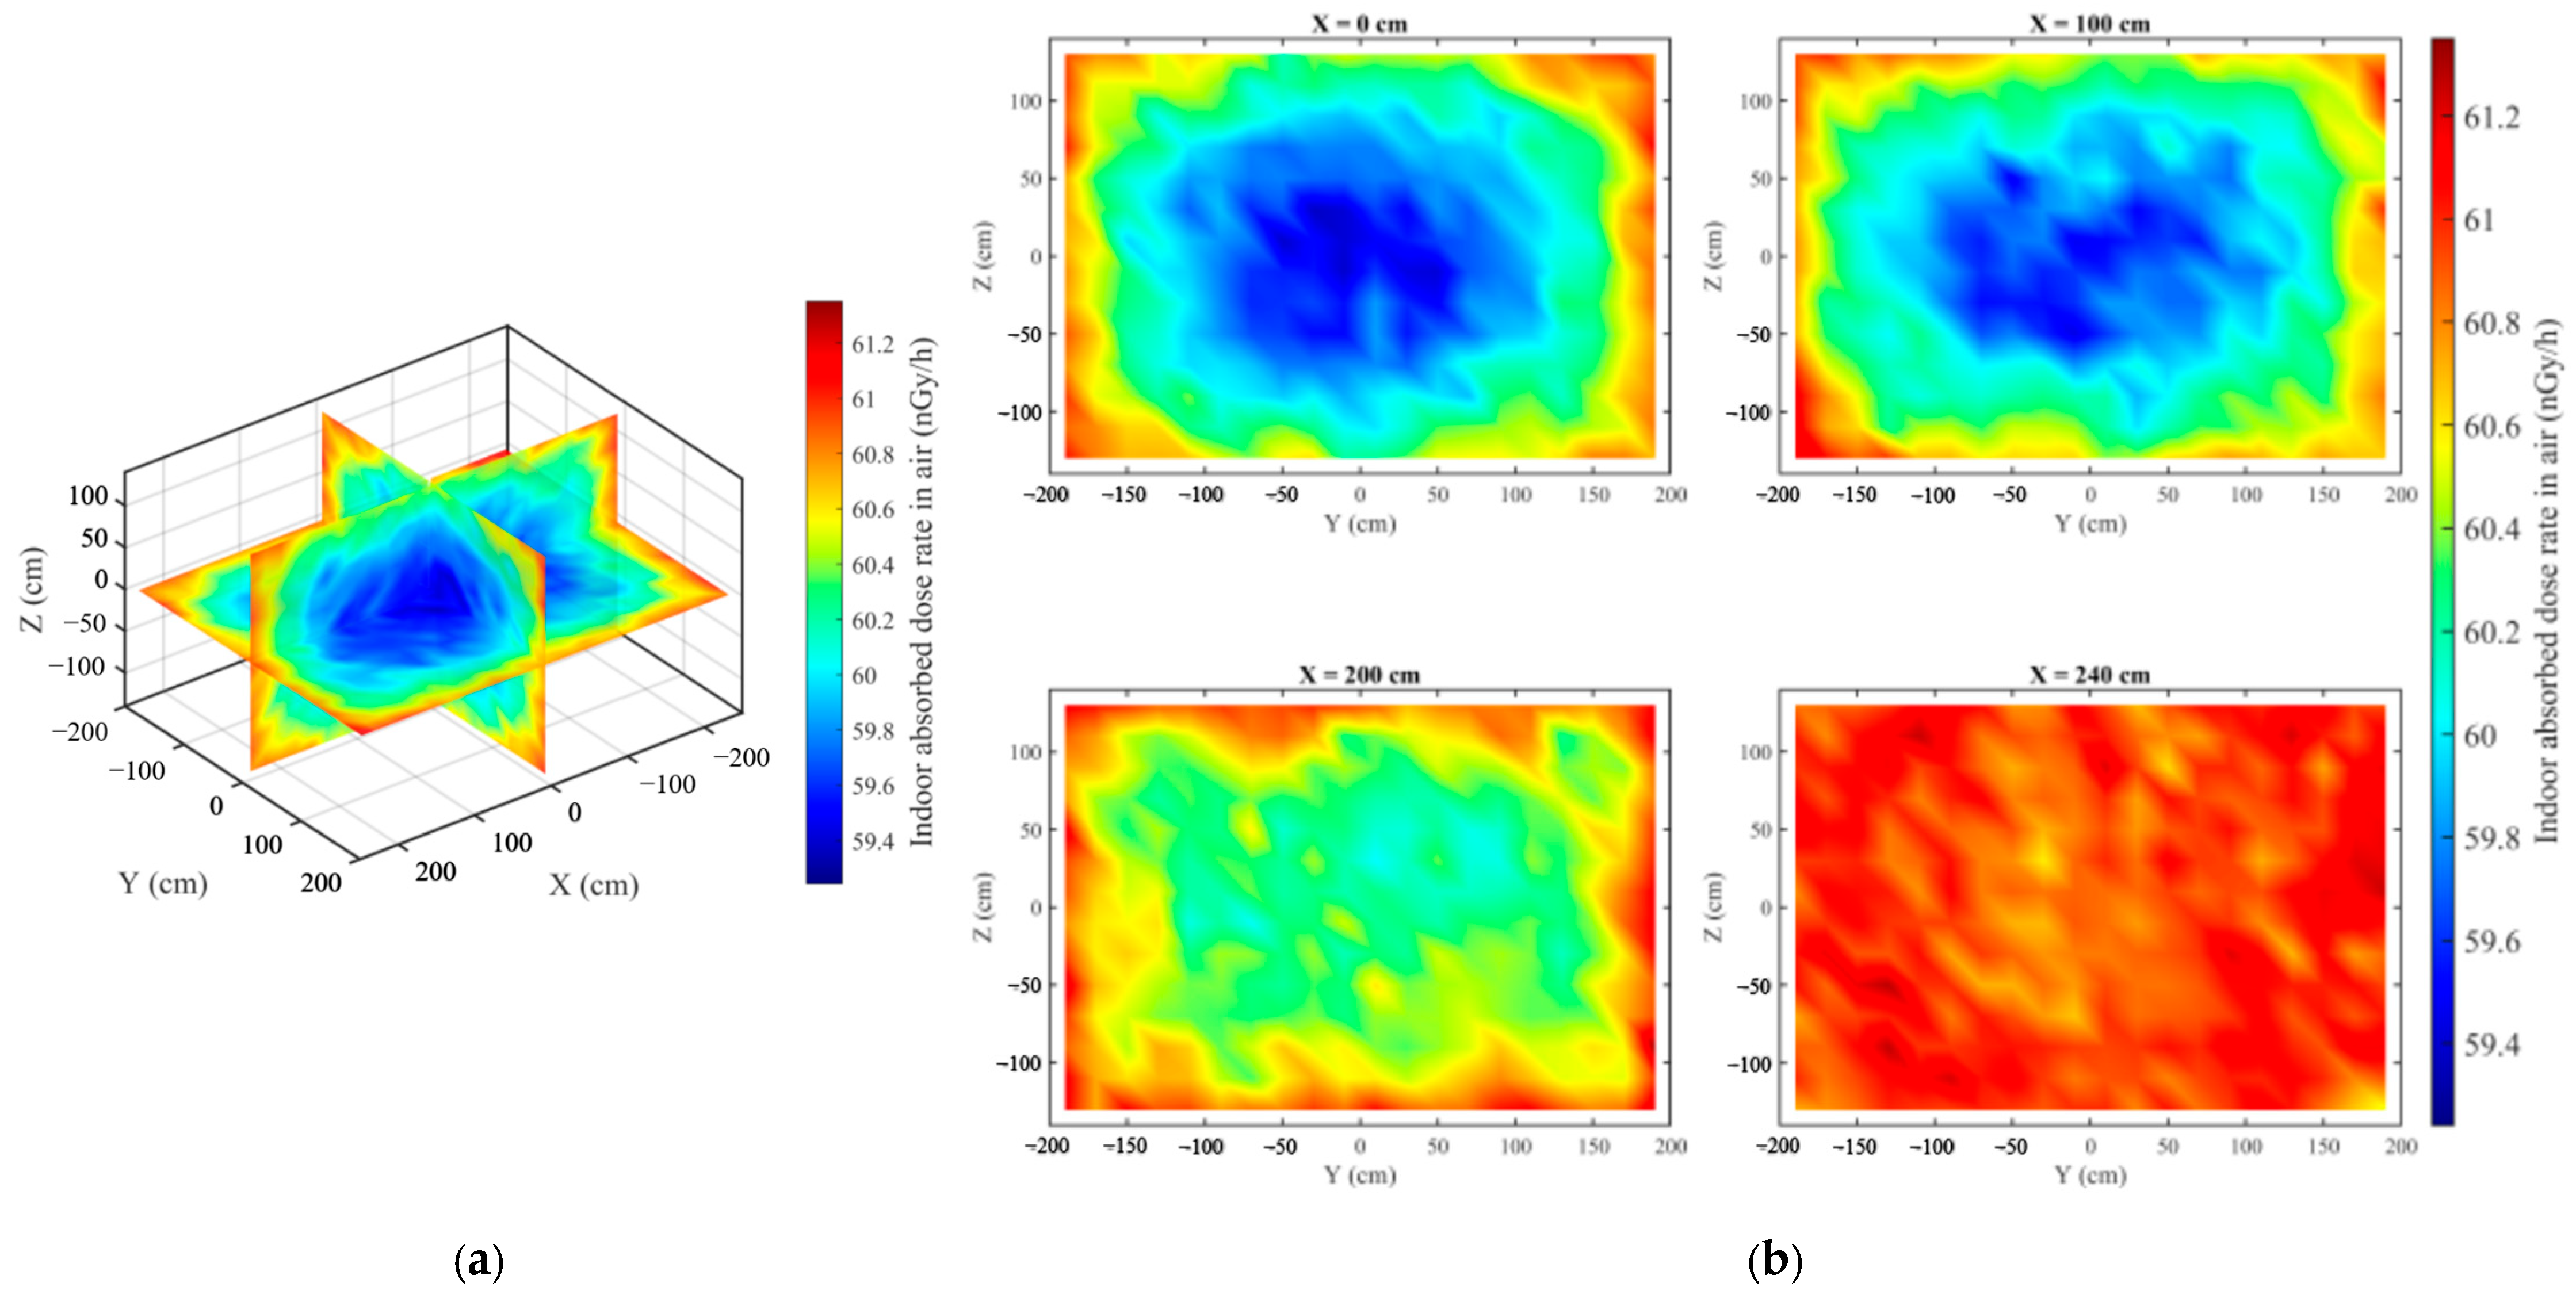
To intuitively display the indoor dose distribution, the three-dimensional network slices of the indoor total absorbed dose rate are shown in Figure 4. Under the measured building material activity levels mentioned above, the absorbed dose rate in air in the enclosed room ranges from 59.4 nGy/h to 61.2 nGy/h. The indoor dose field presents a typical gradient distribution of lower values at the center and higher values at the edges. The dose rate in the geometric central region of the room is at the lowest level throughout the domain. In areas close to corners and edges, due to simultaneous exposure to multiple mutually orthogonal surface sources, the spatial vector superposition of multiple high-intensity radiation sources within the near field causes the dose rate in the edge areas to reach localized peaks.
Figure 4.
Distribution map of indoor absorbed dose rate in air (a) Orthogonal thermal distribution map of indoor absorbed dose rate in air; (b) Thermal cross-sectional map of indoor absorbed dose rate in air.
3.2. Sensitivity Analysis of Room Size
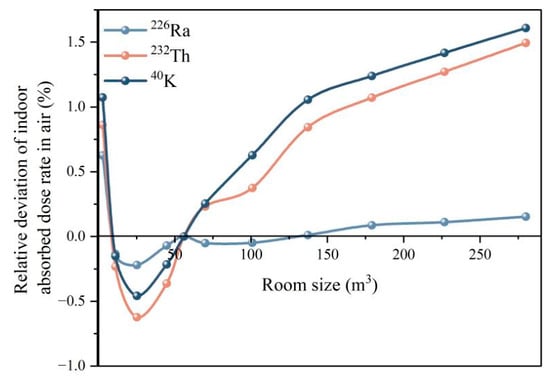
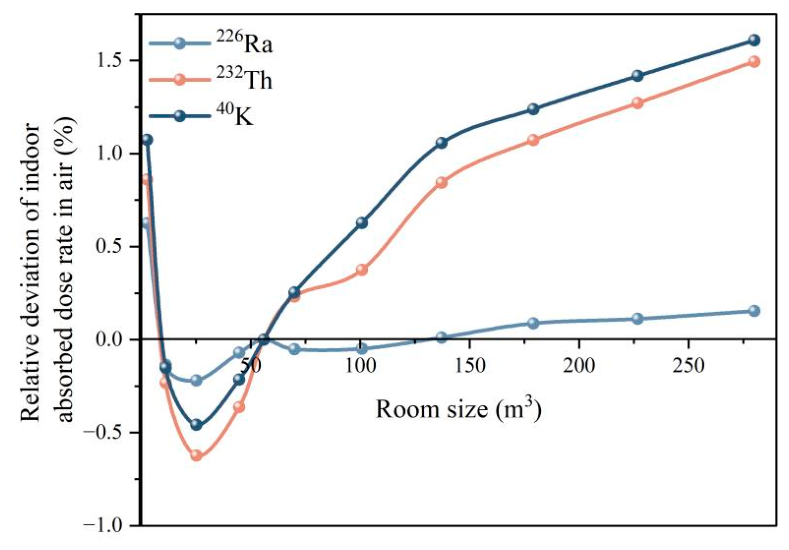
In actual building environments, the plane dimensions of rooms vary significantly. To evaluate the impact of room geometric dimensions on indoor radiation levels, this section constructs a series of square-plane room models under the conditions of a fixed clear room height of H = 2.8 m, wall thickness of 20 cm, and density of 2350 kg/m3. Their horizontal side lengths increase from 1 m to 10 m in 1 m steps, corresponding to room volumes ranging from 2.8 m3 to 280 m3. Taking the volume of 56 m3 of the standard 5 m × 4 m × 2.8 m room model as the baseline, this section calculates the percentage deviation of the dose rate at the geometric center for models of various sizes relative to this baseline value. The results are shown in Figure 5.
Figure 5.
Relative deviation of indoor absorbed dose rate in air due to room dimensions.
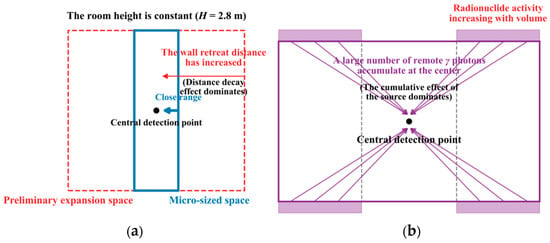
Figure 5 displays the curves of the relative deviation of dose rates caused by the three nuclides varying with room volume. The curves exhibit a non-monotonic variation characteristic of initially decreasing and then increasing, which is the result of a dynamic game between the geometric attenuation effect in radiation transport and the increase in source strength, as illustrated in Figure 6.
Figure 6.
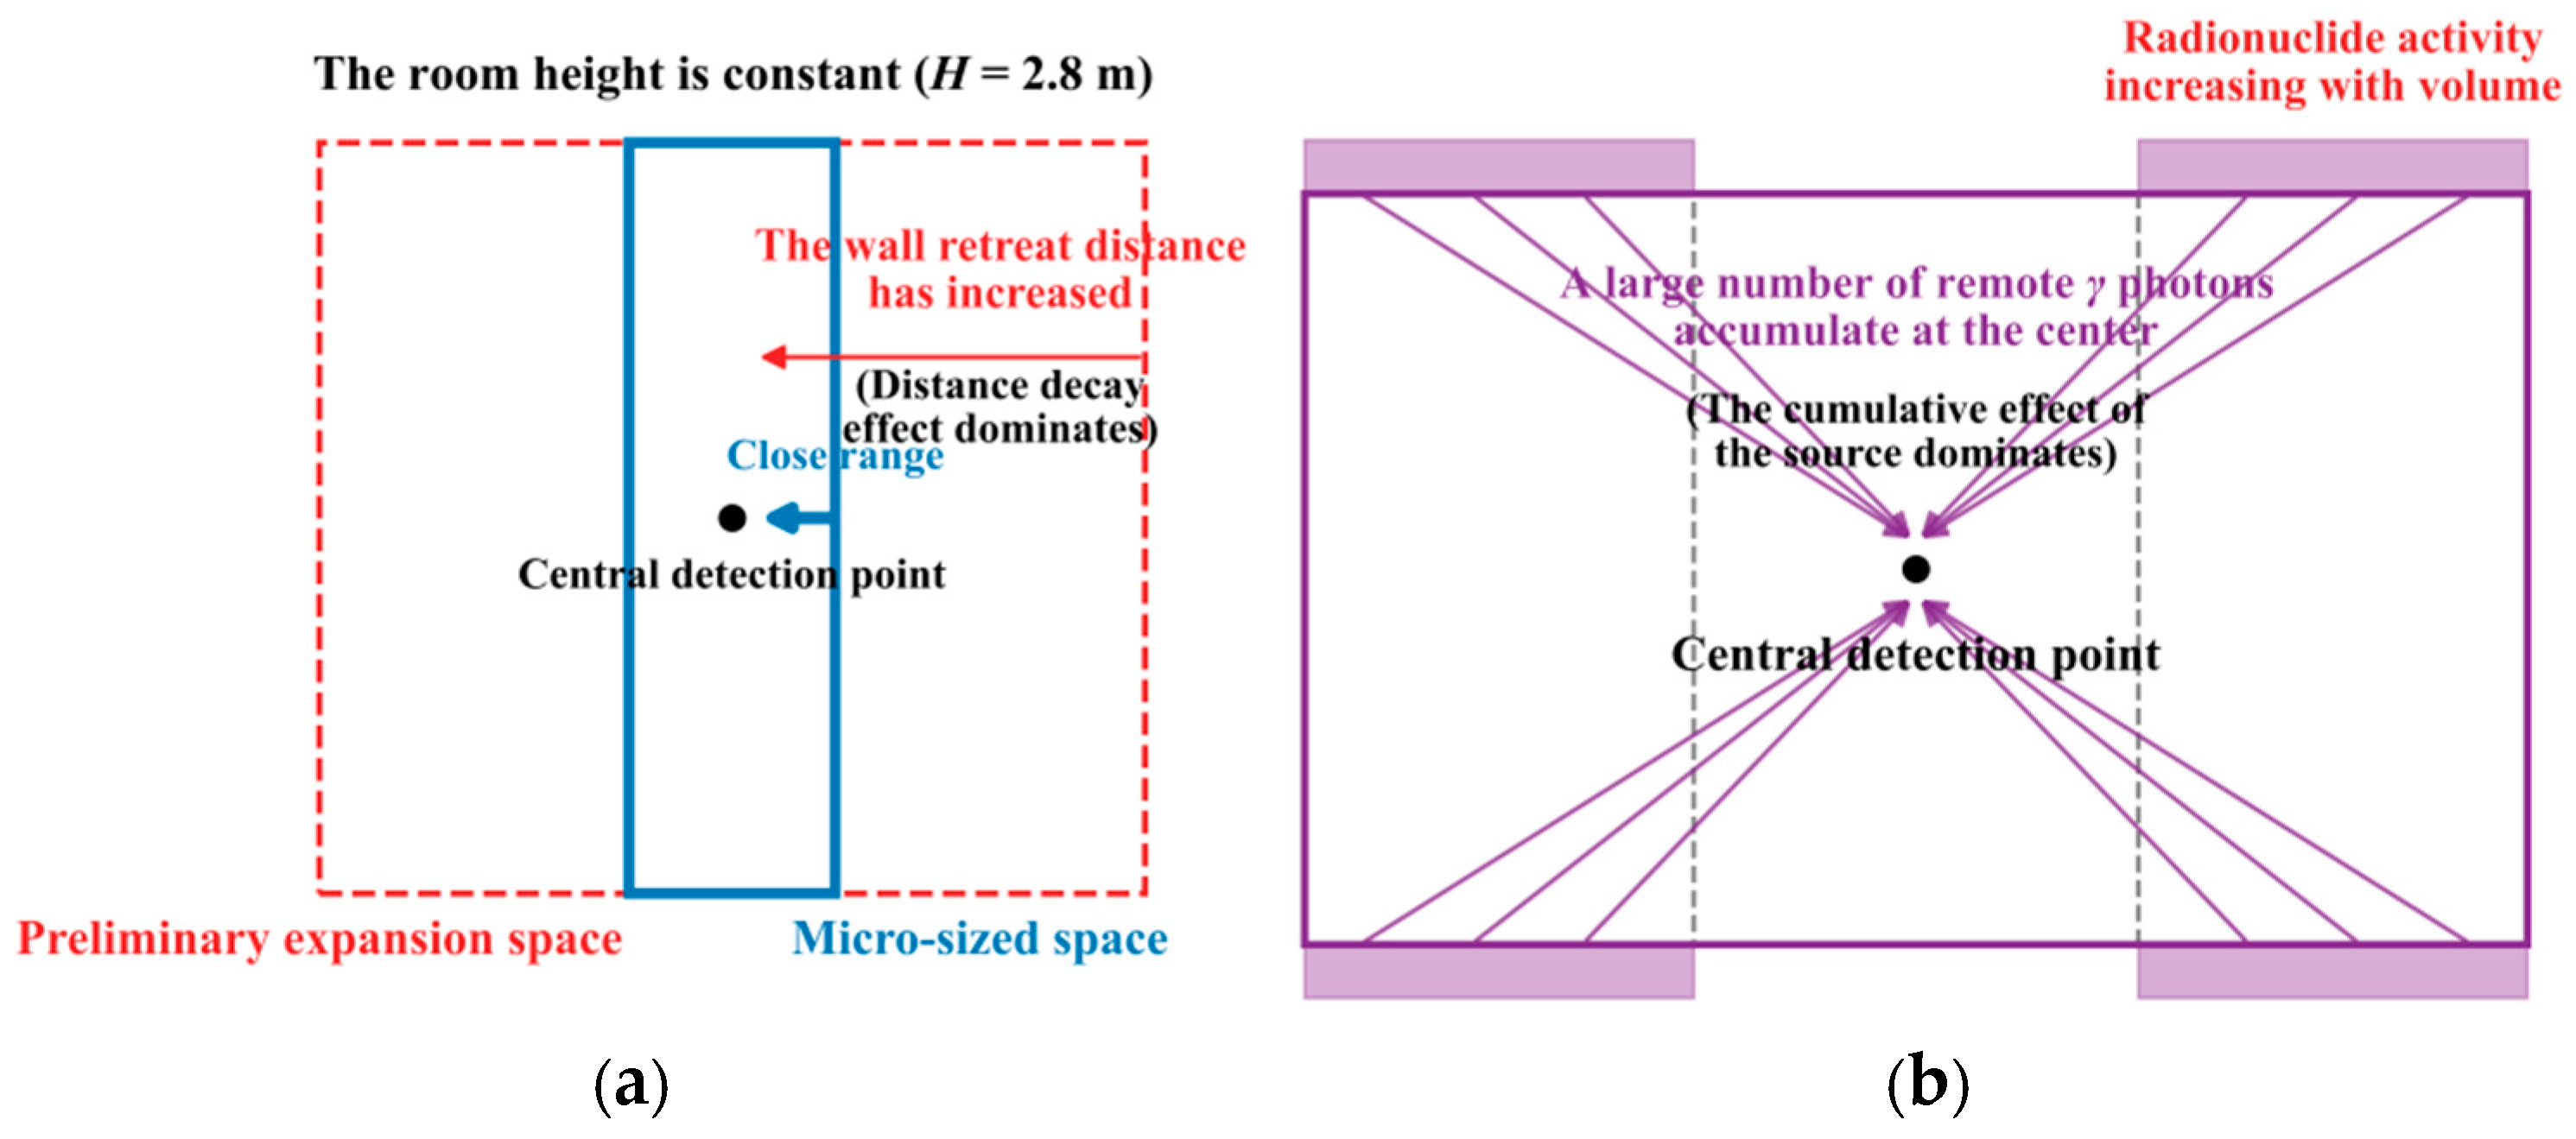
Schematic diagram of (a) radiation geometric attenuation and (b) source volume increase mechanism.
The decreasing trend is dominated by the geometric attenuation effect in small-scale spaces. In a small space, the four side walls are very close to the central detection point (only 0.5 m away), and the short radiation distance results in a higher radiation flux received at the center. As the room plane dimensions initially expand, the four side walls are pushed outward, and the rays undergo significant geometric divergence in space, causing the dose contribution of the side walls to the central point to drop rapidly, as shown in Figure 6a. At this stage, although the volumes of the ceiling and floor are increasing simultaneously, the newly added radioactive sources are distributed in the edge zones far from the center. Their inefficient dose contribution is insufficient to offset the substantial loss caused by the receding of the side walls, resulting macroscopically in a rapid decrease in the total dose rate.
The positive cumulative trend is dominated by the source strength effect in large-scale spaces. As the plane dimensions expand, the receding of the side walls weakens the impact of the geometric attenuation effect. Given a fixed wall thickness, the expansion of the room plane dimensions directly leads to the expansion of the ceiling and floor areas and an increase in the total length of the four walls. This means an increase in the total volume and consequently the mass of the building envelope, leading to an increase in the total activity of the radionuclides. The increased radioactive source strength will emit more photons into the indoor space, as shown in Figure 6b, thereby increasing the total dose rate.
Specifically, geometric attenuation dominates in small rooms and causes the central dose rate to decrease, whereas the increase in source volume and total activity dominates in large rooms and causes the central dose rate to rise again.
3.3. Sensitivity Analysis of Room Height
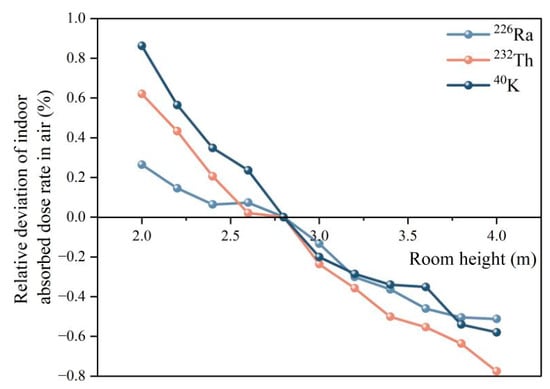
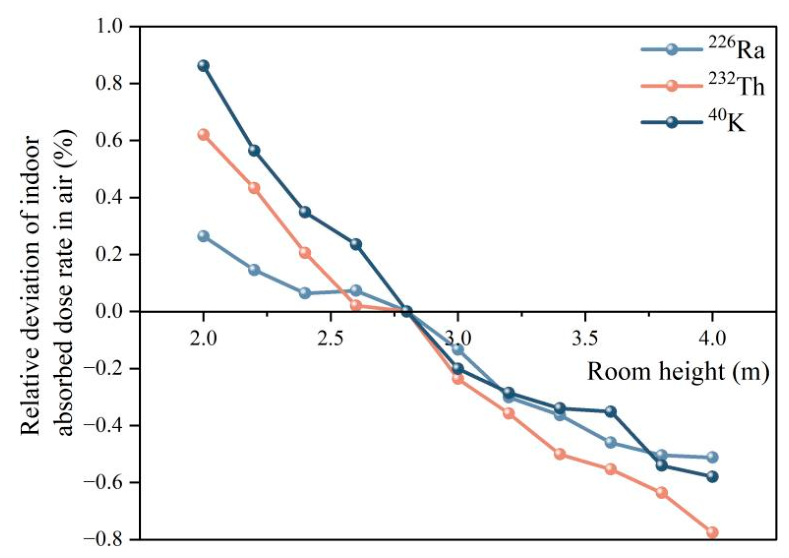
The vertical spatial scale of a room determines the action distance of the radiation sources at the upper and lower boundaries, directly affecting the overall indoor radiation background. To explore the independent influence mechanism of room height, the simulation maintained a constant floor area of 5 m × 4 m and gradually increased the room height H from 2.0 m to 4.0 m in 0.2 m steps. This height range covers a variety of typical architectural application scenarios: from low underground storage rooms or equipment mezzanines (H = 2.0 m), to the standard floor height of general residential buildings in China (H = 2.8 m), to commercial single-story spaces, public building lobbies, or double-height living rooms in villas (H = 4.0 m). To accurately reflect the compressing or stretching effect of spatial morphological changes on the overall radiation field, the observation point is set at the geometric center of the room (0, 0, 0). The calculation takes the standard room model with H = 2.8 m as the baseline reference. The relative deviations of the absorbed dose rate in air caused by the decay chains of the three nuclides varying with height are shown in Figure 7.
Figure 7.
Relative deviation of indoor absorbed dose rate in air due to room height.
From the results in Figure 7, it can be seen that for a given floor area, the relative deviations of the absorbed dose rate generated by the three nuclides all show a significant negative correlation trend with room height. Specifically, in low spaces with a height of 2.0 m, the dose rates contributed by 40K, 232Th and 226Ra increased by approximately 0.86%, 0.62%, and 0.26%, respectively, compared to the standard 2.8 m floor height. However, in the 4.0 m height space, the dose rates of 232Th, 40K, and 226Ra decreased by approximately 0.78%, 0.58%, and 0.51%, respectively.
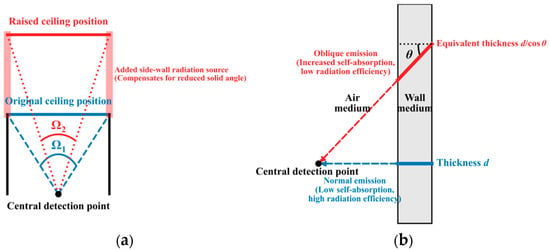
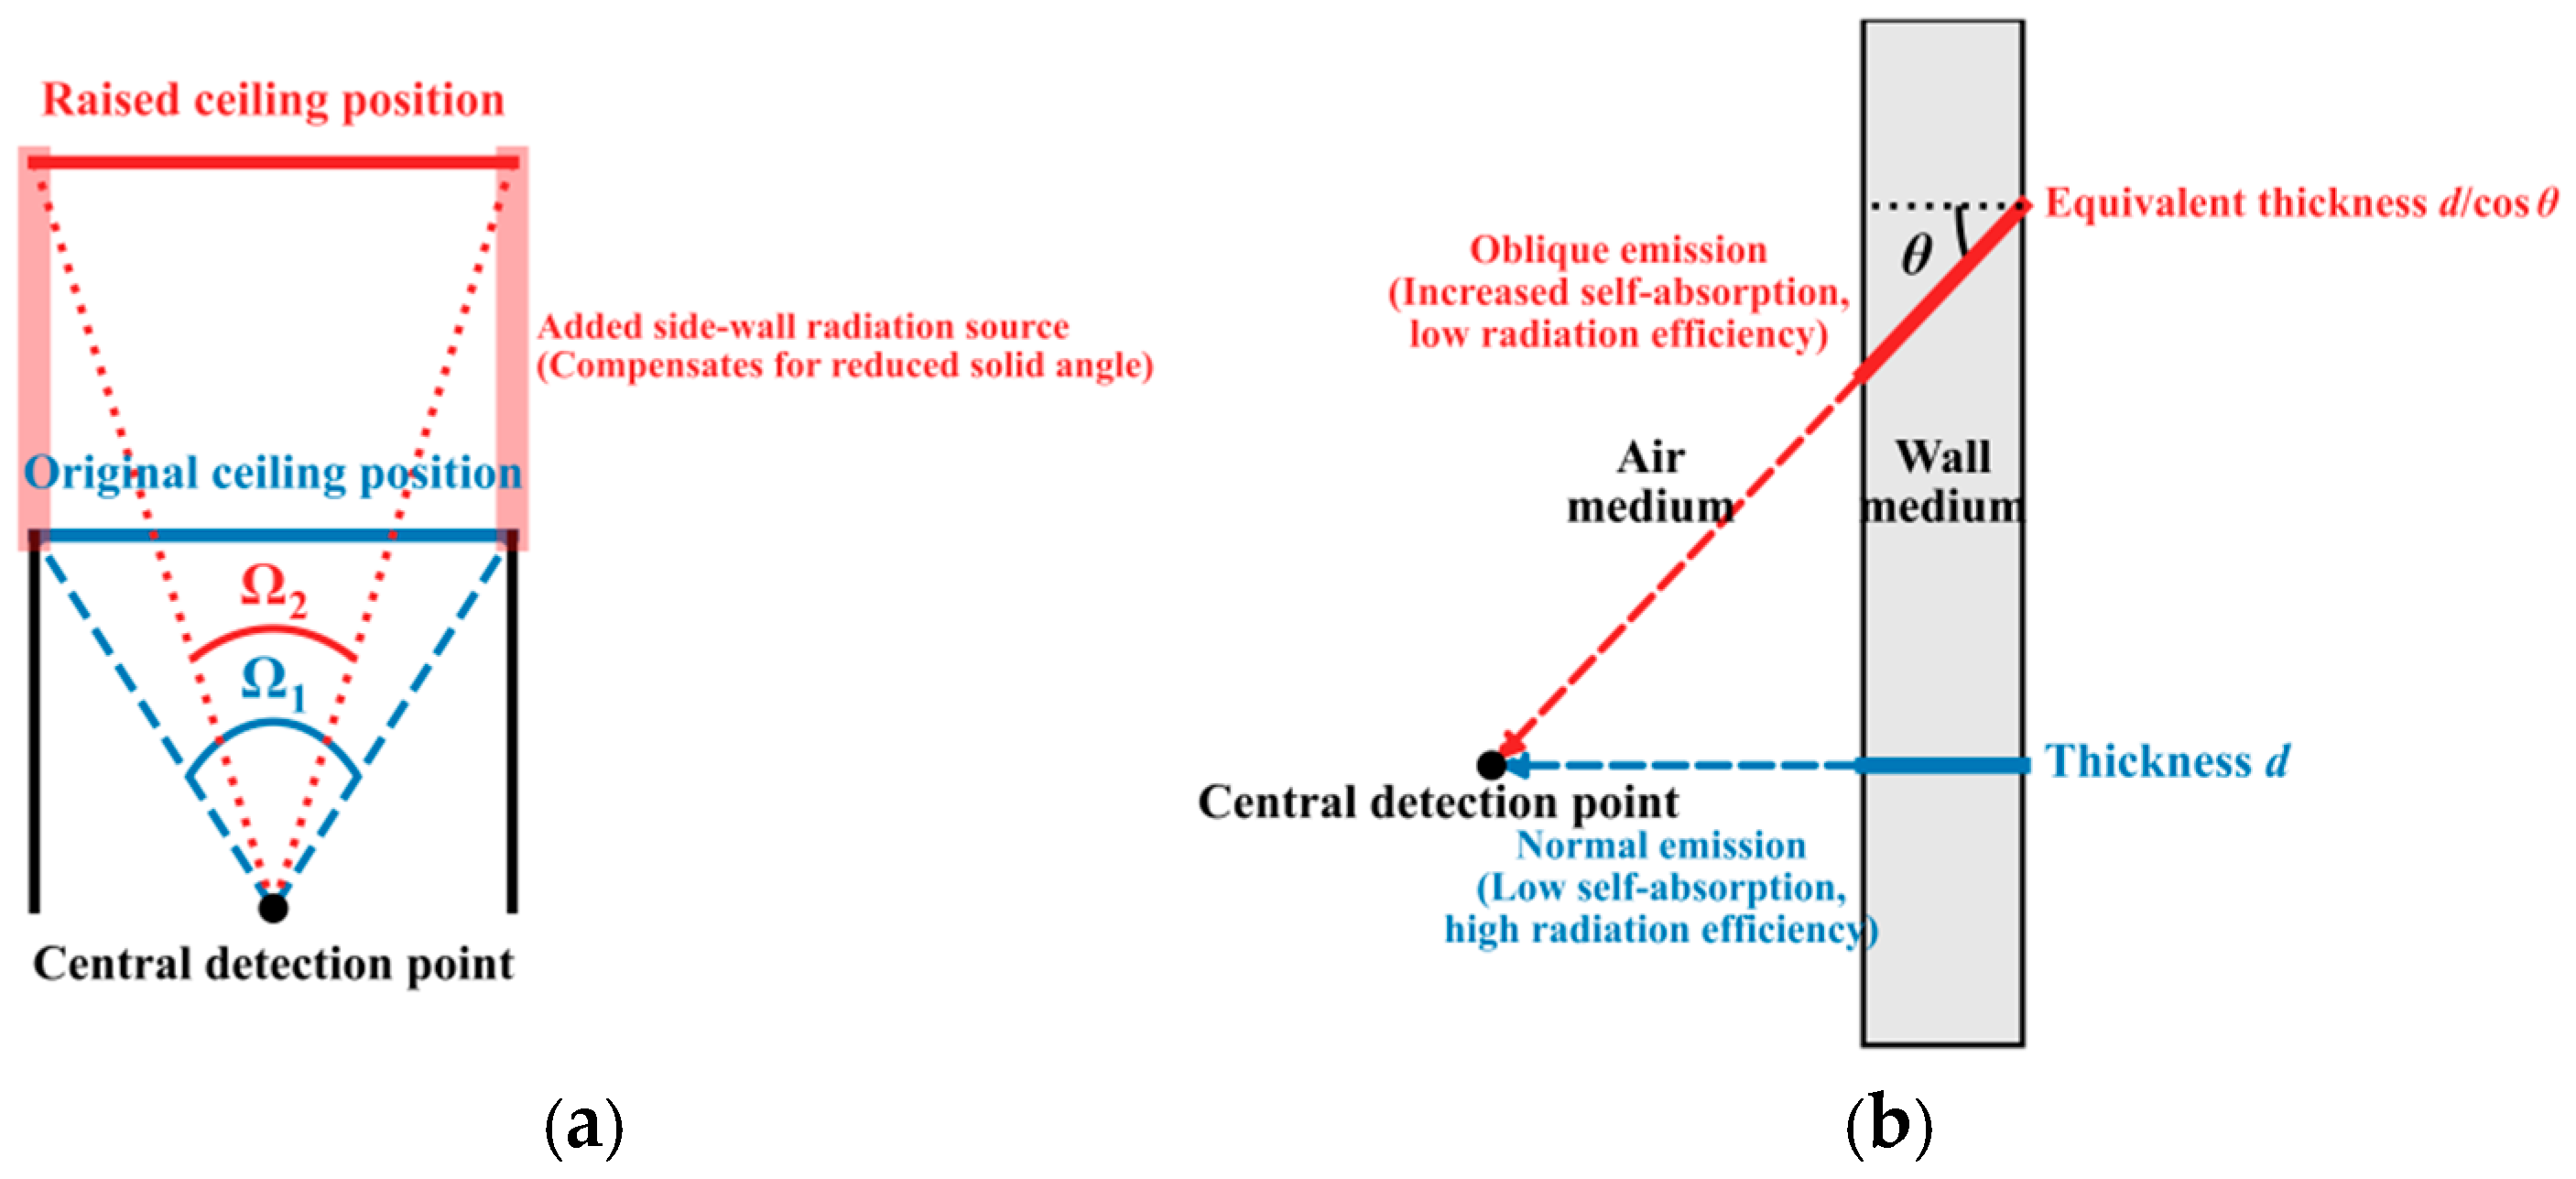
The underlying physical mechanism driving this negative correlation trend includes, in addition to changes in source volume, the synergistic effects of spatial solid angle redistribution and radiation source self-absorption. As shown in Figure 8, although the increase in wall volume caused by an increase in room height H leads to a rise in total nuclide activity, this geometric stretching simultaneously triggers attenuation in two aspects:
Figure 8.
Schematic diagram of (a) solid angle redistribution of radiation and (b) synergistic mechanism of wall self-absorption.
Increase in average radiation distance. As the ceiling moves further away and the newly added effective radiation areas of the side walls become marginalized (as shown in Figure 8a), the average transmission path of γ rays in the air medium becomes longer, which enhances geometric spreading and slightly increases air attenuation and scattering. Under the premise that the total solid angle of the walls is conserved, the aforementioned spatial redistribution leads to a decrease in radiation effectiveness, ultimately manifesting as a monotonically decreasing characteristic of the total dose rate at the center point as height increases.
Intensification of wall self-absorption induced by oblique incidence, as shown in Figure 8b. The newly added solid angles of the side walls are mainly distributed in the distal edge areas near the ceiling and floor. The γ rays emitted from these distal side walls and reaching the center of the room have a larger exit inclination angle. Due to oblique transmission, photons need to penetrate a longer equivalent physical thickness within the building material before exiting the wall into the air (i.e., d/cosθ > d in Figure 8b), which causes certain self-absorption attenuation. The radiation contribution efficiency of the newly added solid angle of the side wall and the positive effect of the source strength increase are weaker than the negative effects caused by the wall self-absorption induced by oblique incidence and the increase in average radiation distance. Therefore, it exhibits an overall decreasing law.
3.4. Sensitivity Analysis of Room Openings
As openings in the building envelope, windows represent both missing parts of the radiation source and escape channels for the indoor radiation field; their presence significantly affects indoor dose levels. To quantitatively evaluate this effect, this study set openings of different sizes (1 m × 1 m, 1 m × 2 m, 2 m × 2 m) and at different positions (including the center of the wall and the corners) on various walls (the 4 m × 2.8 m YZ plane, the 5 m × 2.8 m XZ plane) and the ceiling (the 5 m × 4 m XY plane) of the standard room model to simulate windows, and calculated their relative impact on the absorbed dose rate at the indoor central reference point. Table 4 systematically presents the percentage of negative deviation of the dose rate at the indoor center point relative to the windowless standard model when windows are placed on different walls, with varying sizes, and at different positions.
Table 4.
Relative deviation of indoor absorbed dose rate in air due to respect to window opening size and position.
From the table, it can be seen that the presence of windows significantly reduces the indoor absorbed dose rate in air, and the degree of reduction is proportional to the window area. This is primarily because the window area itself is no longer a radiation source, directly reducing the total activity of that wall; second, the window opening provides a direct escape channel for γ rays from the wall to exit the room, reducing their contribution to the center point. Under the conditions of the same wall and the same position, the larger the window area, the more pronounced the dose rate reduction effect.
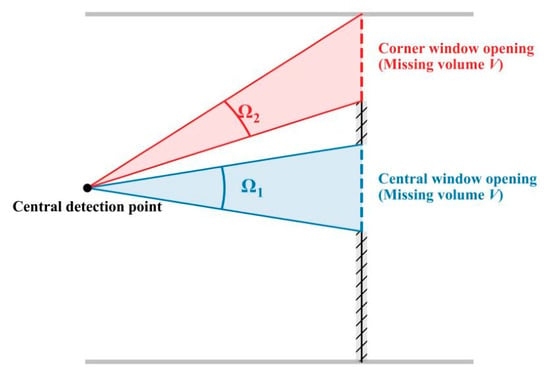
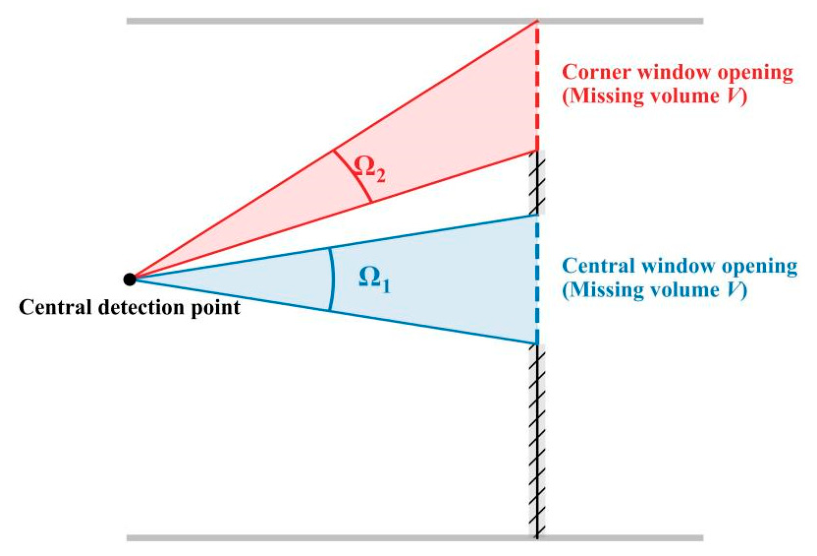
The window position has a significant impact on the dose rate reduction effect. Through the above investigation, it is found that placing a window at the center of the wall is more effective in reducing the dose rate at the indoor center point than placing it in a corner. For example, when opening a 2 m × 2 m window on a 5 m × 2.8 m wall, if placed at the wall center, the dose rate of 226Ra is reduced by 6.55%; however, if it is moved to the corner, the reduction effect weakens to 4.25%. As shown in Figure 9, the detector at the center of the room is most sensitive to the central area of the wall that is directly facing it and closest to it. Opening a window at the center of the wall occupies the largest solid angle, precisely removing the radiation source that contributes most to it; conversely, moving the window to the corner removes the same volume of source, but the removed region subtends a smaller solid angle to the center point (i.e., Ω2 < Ω1), resulting in a weaker overall reduction effect.
Figure 9.
Schematic diagram of the effect of window opening position on indoor absorbed dose rate in air.
The dose rate reduction effect is also related to the wall on which the window is opened. By comparing the effects of opening windows of the same size (e.g., 1 m × 1 m) at the center of different walls, it can be found that opening a window on the ceiling (XY plane) has the strongest reduction effect on the 226Ra dose rate at the center point, at 3.36%, followed by the long side wall (XZ plane) at 1.95%, and finally the short side wall (YZ plane) at 1.42%. This is similarly determined by geometric factors: as a large-area source closest to the measurement point, the central area of the ceiling contributes the most to the detection point directly below, making the effect of opening a window here the most significant.
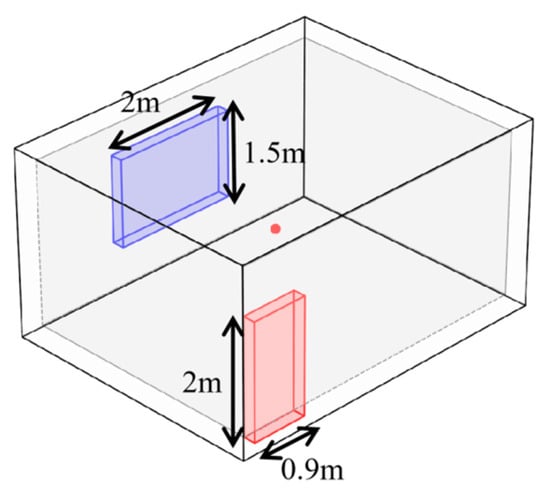
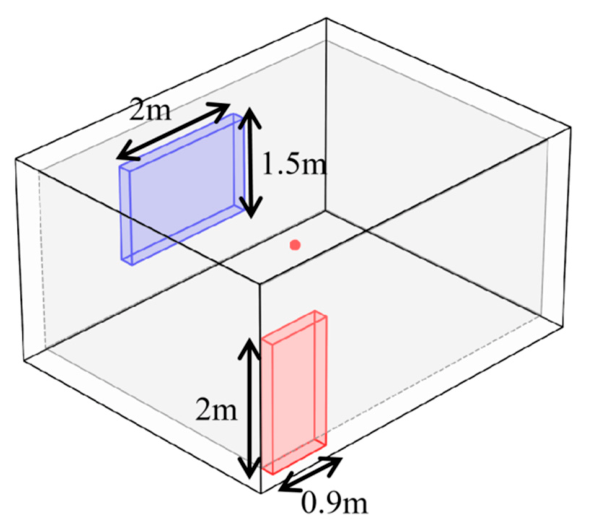
In real residential environments, doors and windows, as physical absences in the building envelope, not only cause a reduction in local radiation source terms but also disrupt the symmetric radiation field of the enclosed space, providing a direct escape channel to the outdoors for indoor rays. To quantitatively evaluate this impact, based on the standard room model and in accordance with the “Design Code for Residential Buildings” (GB 50096-2011) [23], a three-dimensional physical model including door and window openings was constructed. The size of a single bedroom door is set to the standard specification of 0.9 m × 2 m. According to the regulation that the window-to-floor area ratio of a bedroom should not be less than 1/7, combined with the room’s floor area of 20 m2, a daylighting window measuring 2.0 m × 1.5 m is set at the center of the opposite exterior wall, as shown in Figure 10.
Figure 10.
Schematic diagram of actual door and window structure.
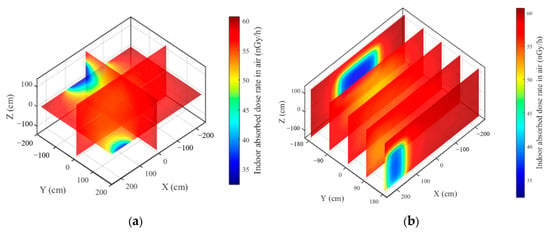
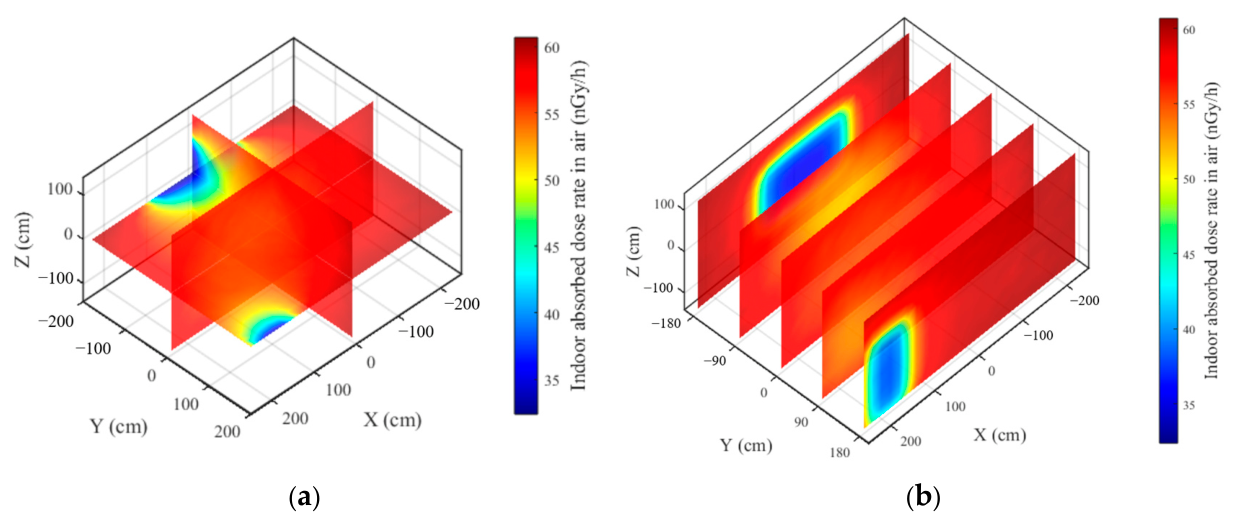
A comparison between the ideal enclosed model and the asymmetric door and window model reveals that the door and window opening areas directly sever the wall source term contributions of the corresponding areas. In the side wall areas containing doors and windows, deep blue low-dose regions penetrating the walls appear in the 3D thermal map, as shown in Figure 11a. The local minimum dose rate directly in front of the window and in the extension area of the doorway can significantly drop to below 35 nGy/h. This not only embodies the source strength weakening effect due to the reduction in source volume but also intuitively reflects the escape effect of the openings on indoor rays. Secondly, spatial gradient distortion occurs due to the missing solid angles. Observing the 2D dose distributions of different cross-sections, as shown in Figure 11b, when approaching the wall with the window, the center of the cross-section clearly presents a rectangular low-dose area corresponding to the window size. The resulting radiation cold spots will also extend inward into the room along the axis perpendicular to the window surface, forming a low-dose gradient channel with the doorway.
Figure 11.
Dose distribution diagrams of (a) three-dimensional and (b) sectional view with a 1.8 m2 door and a 3 m2 window.
The off-center, asymmetric setting of the door, located close to the floor and the corner, further enhances the non-uniformity of the indoor dose field. The low-dose cold spot in the doorway region extends from the floor up to a height of 2 m and is skewed toward one side of the room, while the intact solid wall on the other side maintains a higher radiation contribution. This asymmetric gradient distribution causes the indoor extreme dose points to deviate from the geometric center to some extent.
In summary, traditional calculation models based on standard windowless rooms, because they simplify the 3D radiation field to a single geometric point and ignore the solid angle loss and radiation escape effects caused by door and window openings, often tend to somewhat overestimate the indoor dose level in real environments. The 3D dose evaluation model established in this study can more accurately characterize spatial heterogeneity, providing a quantitative basis for the safe layout of high-occupancy areas indoors.
4. Conclusions
This study established and verified an indoor γ dose rate calculation model, and then analyzed the three-dimensional dose distribution and the sensitivity to key building parameters. The main conclusions are as follows:
- (1)
- The spatial distribution patterns of centripetal attenuation and near-field superposition of the indoor radiation field were revealed. In a standard enclosed room, γ rays emitted by the walls are affected by spatial transmission distance and air medium attenuation, causing the indoor dose field to exhibit a gradient characteristic of being lower at the center and higher at the edges. In regions close to corners and edges, due to the near-field superposition of multiple orthogonal radiation sources, the dose rate reaches the global peak.
- (2)
- The geometric reshaping mechanism of floor area and room height on the dose rate was elucidated. For the floor area, the dose rate initially declines due to geometric attenuation; as the source volume expands, the enhanced source strength leads to a gradual increase in the later stage. With a fixed floor area, the central dose rate decreases monotonically with room height because the negative effects of the increased average radiation distance and oblique-incidence self-absorption are greater than the positive effect of the increased source volume.
- (3)
- Door and window structures, serving as radiation escape channels, produce a local remodeling of the indoor dose distribution. Opening doors and windows removes the corresponding volume of the radiation source and provides a direct escape path for indoor rays, thereby disrupting the symmetry of the enclosed dose field. This creates low-dose regions in the extension areas of the door and window openings and causes the extreme dose points to deviate from the geometric center.
The findings of this study can provide some reference for radiation protection and room layout optimization. Future work may carry out further in-depth analysis in combination with experiments.
Author Contributions
Conceptualization, F.W. and S.G.; methodology, F.W. and S.G.; formal analysis, S.G. and C.W.; data curation, S.G., C.W. and G.W.; writing—original draft preparation, S.G.; writing—review and editing, F.W. and C.W.; supervision, F.W. and G.W.; project administration, F.W. All authors have read and agreed to the published version of the manuscript.
Funding
This research was funded by Chongqing Radiation Environment Supervision and Management Station, grant number H20230742; Key project of Chongqing Natural Science Foundation Innovation and Development Joint Fund, grant number CSTB2024NSCQ-LZX0158; Chongqing technology innovation and application demonstration project, grant number CSTB2022TIAD-DEX0015.
Institutional Review Board Statement
Not applicable.
Informed Consent Statement
Not applicable.
Data Availability Statement
The data presented in this study are available on reasonable request from the corresponding author. Further inquiries can be directed to the corresponding author.
Conflicts of Interest
The authors declare no conflicts of interest.
References
- Miller, S.A.; Juenger, M.; Kurtis, K.E.; Weiss, J. Cement and Alternatives in the Anthropocene. Annu. Rev. Environ. Resour. 2024, 49, 309–335. [Google Scholar] [CrossRef] [Scilit]
- Wang, F.; Huang, T.; Geng, S.; Wu, C.; Wang, G. Analysis of Radioactivity Levels in Finished Cement in Chongqing. Materials 2026, 19, 4125. [Google Scholar] [CrossRef] [Scilit] [PubMed]
- Wang, F.; Geng, S.; Wu, C.; Du, H.; Zhang, X.; Song, Y.; Chen, Y.; Wang, M.; Wang, G.; Huang, T.; et al. Analysis of cement raw materials radioactivity in Chongqing. Appl. Radiat. Isotopes. 2025, 220, 111756. [Google Scholar] [CrossRef] [Scilit] [PubMed]
- Zheng, C. Health risk assessment of natural radioactivity in building materials to residents in Dandong City. Nucl. Electron. Detect. Technol. 2023, 43, 256–261. [Google Scholar]
- Garba, N.N.; Gusau, M.B.; Rabiu, N.; Kankara, U.M.; Usman, J.; Ahmadu, U.; Vatsa, A.M.; Musa, J. Evaluation of natural radioactivity and radiological hazards in concrete aggregates for radiation shielding applications. Sci. Rep. 2025, 15, 45077. [Google Scholar] [CrossRef] [Scilit] [PubMed]
- Tohver, H.; Salupere, S. Breaking the cycle of excessive conservatism: Evaluating the γ-radiation dose from building materials. J. Environ. Radioact. 2023, 268–269, 107250. [Google Scholar] [CrossRef] [Scilit] [PubMed]
- Vuong, L.Q.; Ngoc, T.T.B.; Van, L.T.A.; Thanh, T.T.; Van Tao, C. An Assessment of External Dose From Natural Radioactivity in Building Materials by Using Simulation Monte Carlo. IEEE Trans. Nucl. Sci. 2025, 72, 1516–1524. [Google Scholar] [CrossRef] [Scilit]
- Adelikhah, M.; Imani, M.; Hegedűs, M.; Kovács, T. Modelling of indoor external and internal exposure due to different building materials containing NORMs in the vicinity of a HNBRA in Mahallat, Iran. Heliyon 2022, 8, e08909. [Google Scholar] [CrossRef] [Scilit] [PubMed]
- Nugraha, E.D.; Modibo, O.B.; Wahyudi; Pradana, R.; Merdekawati, R.A.; Megagasri, K.; Topandi, A.; Rachman, A.N.; Kurniawan, R.; Fajrianshah, E.A.; et al. Radon exhalation rate and natural radioactivity in the building materials used in metropolitan Jakarta and its surrounding areas, Indonesia. Front. Public Health 2025, 13, 1539957. [Google Scholar] [CrossRef] [Scilit] [PubMed]
- European Commission. Radiation Protection 112, Radiological Protection Principles Concerning the Natural Radioactivity of Building Materials; Nuclear Safety and Civil Protection: Luxemburg, 1999. [Google Scholar]
- Markkanen, M. Radiation Dose Assessments for Materials with Elevated Natural Radioactivity; Säteilyturvakeskus (STUK): Vantaa, Finland, 1995. [Google Scholar]
- Righi, S.; Verità, S.; Rossi, P.L.; Maduar, M.F. A dose calculation model application for indoor exposure to two-layer walls gamma irradiation: The case study of ceramic tiles. Radiat. Prot. Dosim. 2016, 171, 545–553. [Google Scholar] [CrossRef] [Scilit] [PubMed]
- Mirza, N.; Ali, B.; Mirza, S.; Tufail, M.; Ahmad, N. A shape and mesh adaptive computational methodology for gamma ray dose from volumetric sources. Radiat. Prot. Dosim. 1991, 38, 307–314. [Google Scholar] [CrossRef] [Scilit]
- Risica, S.; Bolzan, C.; Nuccetelli, C. Radioactivity in building materials: Room model analysis and experimental methods. Sci. Total Environ. 2001, 272, 119–126. [Google Scholar] [CrossRef] [Scilit] [PubMed]
- Croymans, T.; Leonardi, F.; Trevisi, R.; Nuccetelli, C.; Schreurs, S.; Schroeyers, W. Gamma exposure from building materials—A dose model with expanded gamma lines from naturally occurring radionuclides applicable in non-standard rooms. Constr. Build. Mater. 2018, 159, 768–778. [Google Scholar] [CrossRef] [Scilit]
- Olarinoye, I.; Kolo, M.; Shittu, H.; Anumah, A. Estimation of indoor gamma radiation dose rate from concrete blocks constructed from tin mine tailings. J. Build. Eng. 2023, 66, 105934. [Google Scholar] [CrossRef] [Scilit]
- Detwiler, R.; Mcconn, R.; Grimes, T.; Upton, S.; Engel, E. Compendium of Material Composition Data for Radiation Transport Modeling; Pacific Northwest National Laboratory (PNNL): Richland, WA, USA, 2021. [Google Scholar]
- International Commission on Radiological Protection. Conversion Coefficients for Use in Radiological Protection Against Extemal Radiation; ICRP Publication 74; Pergamon Press: Oxford, UK, 1996. [Google Scholar]
- de Jong, P.; van Dijk, W. Modeling gamma radiation dose in dwellings due to building materials. Health Phys. 2008, 94, 33–42. [Google Scholar] [CrossRef] [Scilit] [PubMed]
- Koblinger, L. Calculation of exposure rates from gamma sources in walls of dwelling rooms. Health Phys. 1978, 34, 459–463. [Google Scholar] [CrossRef] [Scilit] [PubMed]
- Máduar, M.F.; Hiromoto, G. Radioactivity of building materials and the gamma radiation in dwellings. Phys. Med. Biol. 1979, 24, 921–930. [Google Scholar] [CrossRef] [Scilit] [PubMed]
- Maduar, M.F.; Hiromoto, G. Evaluation of indoor gamma radiation dose in dwellings. Radiat. Prot. Dosim. 2004, 111, 221–228. [Google Scholar] [CrossRef] [Scilit] [PubMed]
- GB 50096-2011; Design Code for Residential Buildings. National Standard of the People’s Republic of China: Beijing, China, 2011.

Disclaimer/Publisher’s Note: The statements, opinions and data contained in all publications are solely those of the individual author(s) and contributor(s) and not of MDPI and/or the editor(s). MDPI and/or the editor(s) disclaim responsibility for any injury to people or property resulting from any ideas, methods, instructions or products referred to in the content. |
© 2026 by the authors. Licensee MDPI, Basel, Switzerland. This article is an open access article distributed under the terms and conditions of the Creative Commons Attribution (CC BY) license.