


Abstract
Concrete exhibits a pronounced size effect, but the influence of small eccentricity on the size dependence of compressive strength remains insufficiently understood. In particular, systematic experimental evidence for geometrically similar plain-concrete specimens under different small-eccentricity ratios is still limited. To address this gap, compression tests were conducted on C-shaped specimens under concentric loading (NA) and small-eccentricity compression with e0/h = 0.08 (NB) and 0.14 (NC). The effective cross-sectional dimensions were 50, 100, and 150 mm. A finite-element model based on the concrete damaged plasticity (CDP) constitutive law was established in Abaqus and calibrated against the test results, after which the numerical sizes were extended to 300–900 mm. The results show that nominal compressive strength decreases with increasing specimen size and that the size effect is more pronounced under eccentric compression than under concentric compression. As the effective cross-sectional dimension increased from 50 to 150 mm, the mean nominal compressive strengths of the NA, NB, and NC series decreased by 7.2%, 12.0%, and 11.7%, respectively. However, the similar normalized strength reductions in the NB and NC series indicate that increasing e0/h from 0.08 to 0.14 does not produce a clearly distinguishable further amplification of the size effect within the investigated range. The numerical results further indicate that nominal strength decreases rapidly at small sizes, whereas the rate of reduction gradually diminishes with increasing size. The three size-effect models capture the overall decreasing strength trend, but their fitting performance depends on the loading condition. The Carpinteri model provides the closest fit for concentric compression, whereas the Bažant compression relation based on the h−2/5 asymptotic scaling gives the best agreement for the two small-eccentricity series. These findings show that small-eccentricity compression produces a more pronounced size effect than concentric compression, while the influence of further increasing eccentricity on the normalized size-effect magnitude remains limited within the investigated range.
1. Introduction
Concrete is a heterogeneous quasibrittle material whose nominal strength generally decreases as the characteristic specimen size increases, i.e., it exhibits a size effect. This phenomenon directly affects the extrapolation of laboratory-scale test results to full-scale structural members and the assessment of their load-carrying capacity. For quasibrittle structures, the observed scaling reflects the transition from strength-criterion control toward fracture-mechanics control, with contributions from energy release, a finite fracture-process zone, and the statistical distribution of material defects [1,2,3,4,5,6].
The manifestation and magnitude of the concrete size effect depend strongly on the loading mode, specimen geometry, boundary restraint, and failure mechanism. Tests on high-strength concrete in flexure, splitting tension, and torsion have shown different degrees of size sensitivity for different failure modes [7]. Under uniaxial compression, stable post-peak tests and localization analyses have demonstrated that softening deformation concentrates within a finite failure zone and that the measured response is affected by specimen length, slenderness, and end restraint [8,9,10,11,12]. Tests on cylinders, cubes, and prisms have further confirmed that compressive strength varies with specimen size and shape [13,14,15,16,17,18]. Recent numerical and mesoscopic studies have related this behavior to aggregate size, interface-transition-zone properties, strain localization, and discrete cracking processes [19,20,21,22,23,24].
At the member level, size effects under combined compression and bending were first demonstrated by scaled tests on eccentrically loaded columns and were subsequently interpreted through splitting-crack-band and microplane-based finite-element models [25,26,27]. Later investigations on axially and eccentrically loaded reinforced-concrete columns showed that nominal compressive strength, post-peak response, and deformation capacity depend on member size, eccentricity, concrete strength, slenderness, and transverse confinement [28,29,30,31,32,33,34,35,36,37,38,39]. However, reinforcement, confinement, bond, and steel-concrete interaction also contribute to the measured response. A systematic comparison of different small eccentricity ratios for geometrically similar plain-concrete C-shaped specimens therefore remains limited, particularly when laboratory results are extrapolated to larger engineering scales.
Several size-effect models are available. Bažant and Xiang developed a compression-fracture framework in which the large-size behavior is associated with the propagation of splitting-crack bands and a characteristic h−2/5 asymptotic scaling [26]. Kim’s modified size-effect law was developed for the axial and flexural compressive strength of concrete members [40]. Carpinteri’s multifractal scaling model relates apparent strength to material disorder and fractal or multifractal scaling characteristics [41,42]. Because these models embody different assumptions regarding the large-size asymptote, their applicability to the nominal strength of concrete under small-eccentric compression should be assessed using a consistent experimental and numerical database.
Accordingly, this study aims to investigate the size-dependent mechanical behavior and failure characteristics of plain concrete under small-eccentricity compression. The significance of the study lies in isolating the size effect of plain concrete from the additional influences of reinforcement, confinement, bond, and steel–concrete interaction that are present in reinforced-concrete members. The main novelty is the systematic comparison of geometrically similar specimens under concentric loading and two small-eccentricity ratios, combined with numerical extension to larger scales and comparative evaluation of different size-effect models.
Specifically, a concentrically loaded series (NA) and two small-eccentricity series with e0/h = 0.08 (NB) and 0.14 (NC) were tested at effective section sizes of 50, 100, and 150 mm. The effects of specimen size and eccentricity ratio on nominal compressive strength and failure mode were first examined experimentally. A concrete damaged-plasticity finite-element model was then validated against the tests and extended to section sizes of 300–900 mm. Finally, Bažant’s, Kim’s, and Carpinteri’s size-effect models were fitted to the combined experimental and numerical results. The study distinguishes the effects of eccentricity on the absolute strength level and on normalized size dependence, with particular attention to whether increasing eccentricity merely reduces the nominal strength or also produces a further amplification of the size effect.
2. Experimental Program
2.1. Experimental Design
2.1.1. Specimen Design
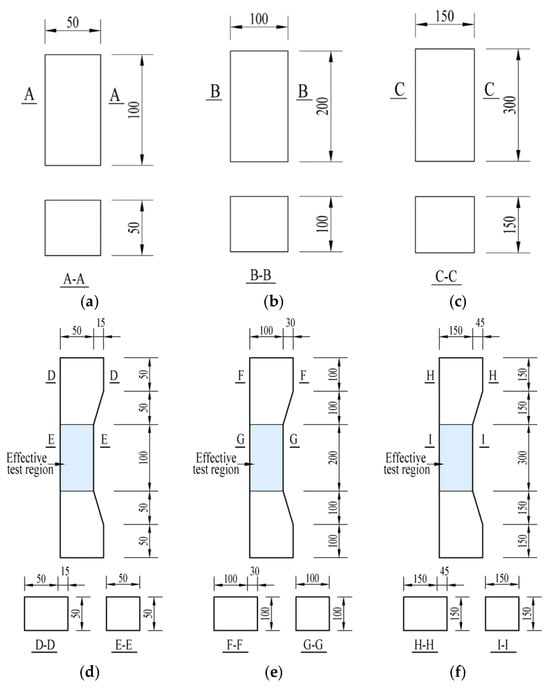
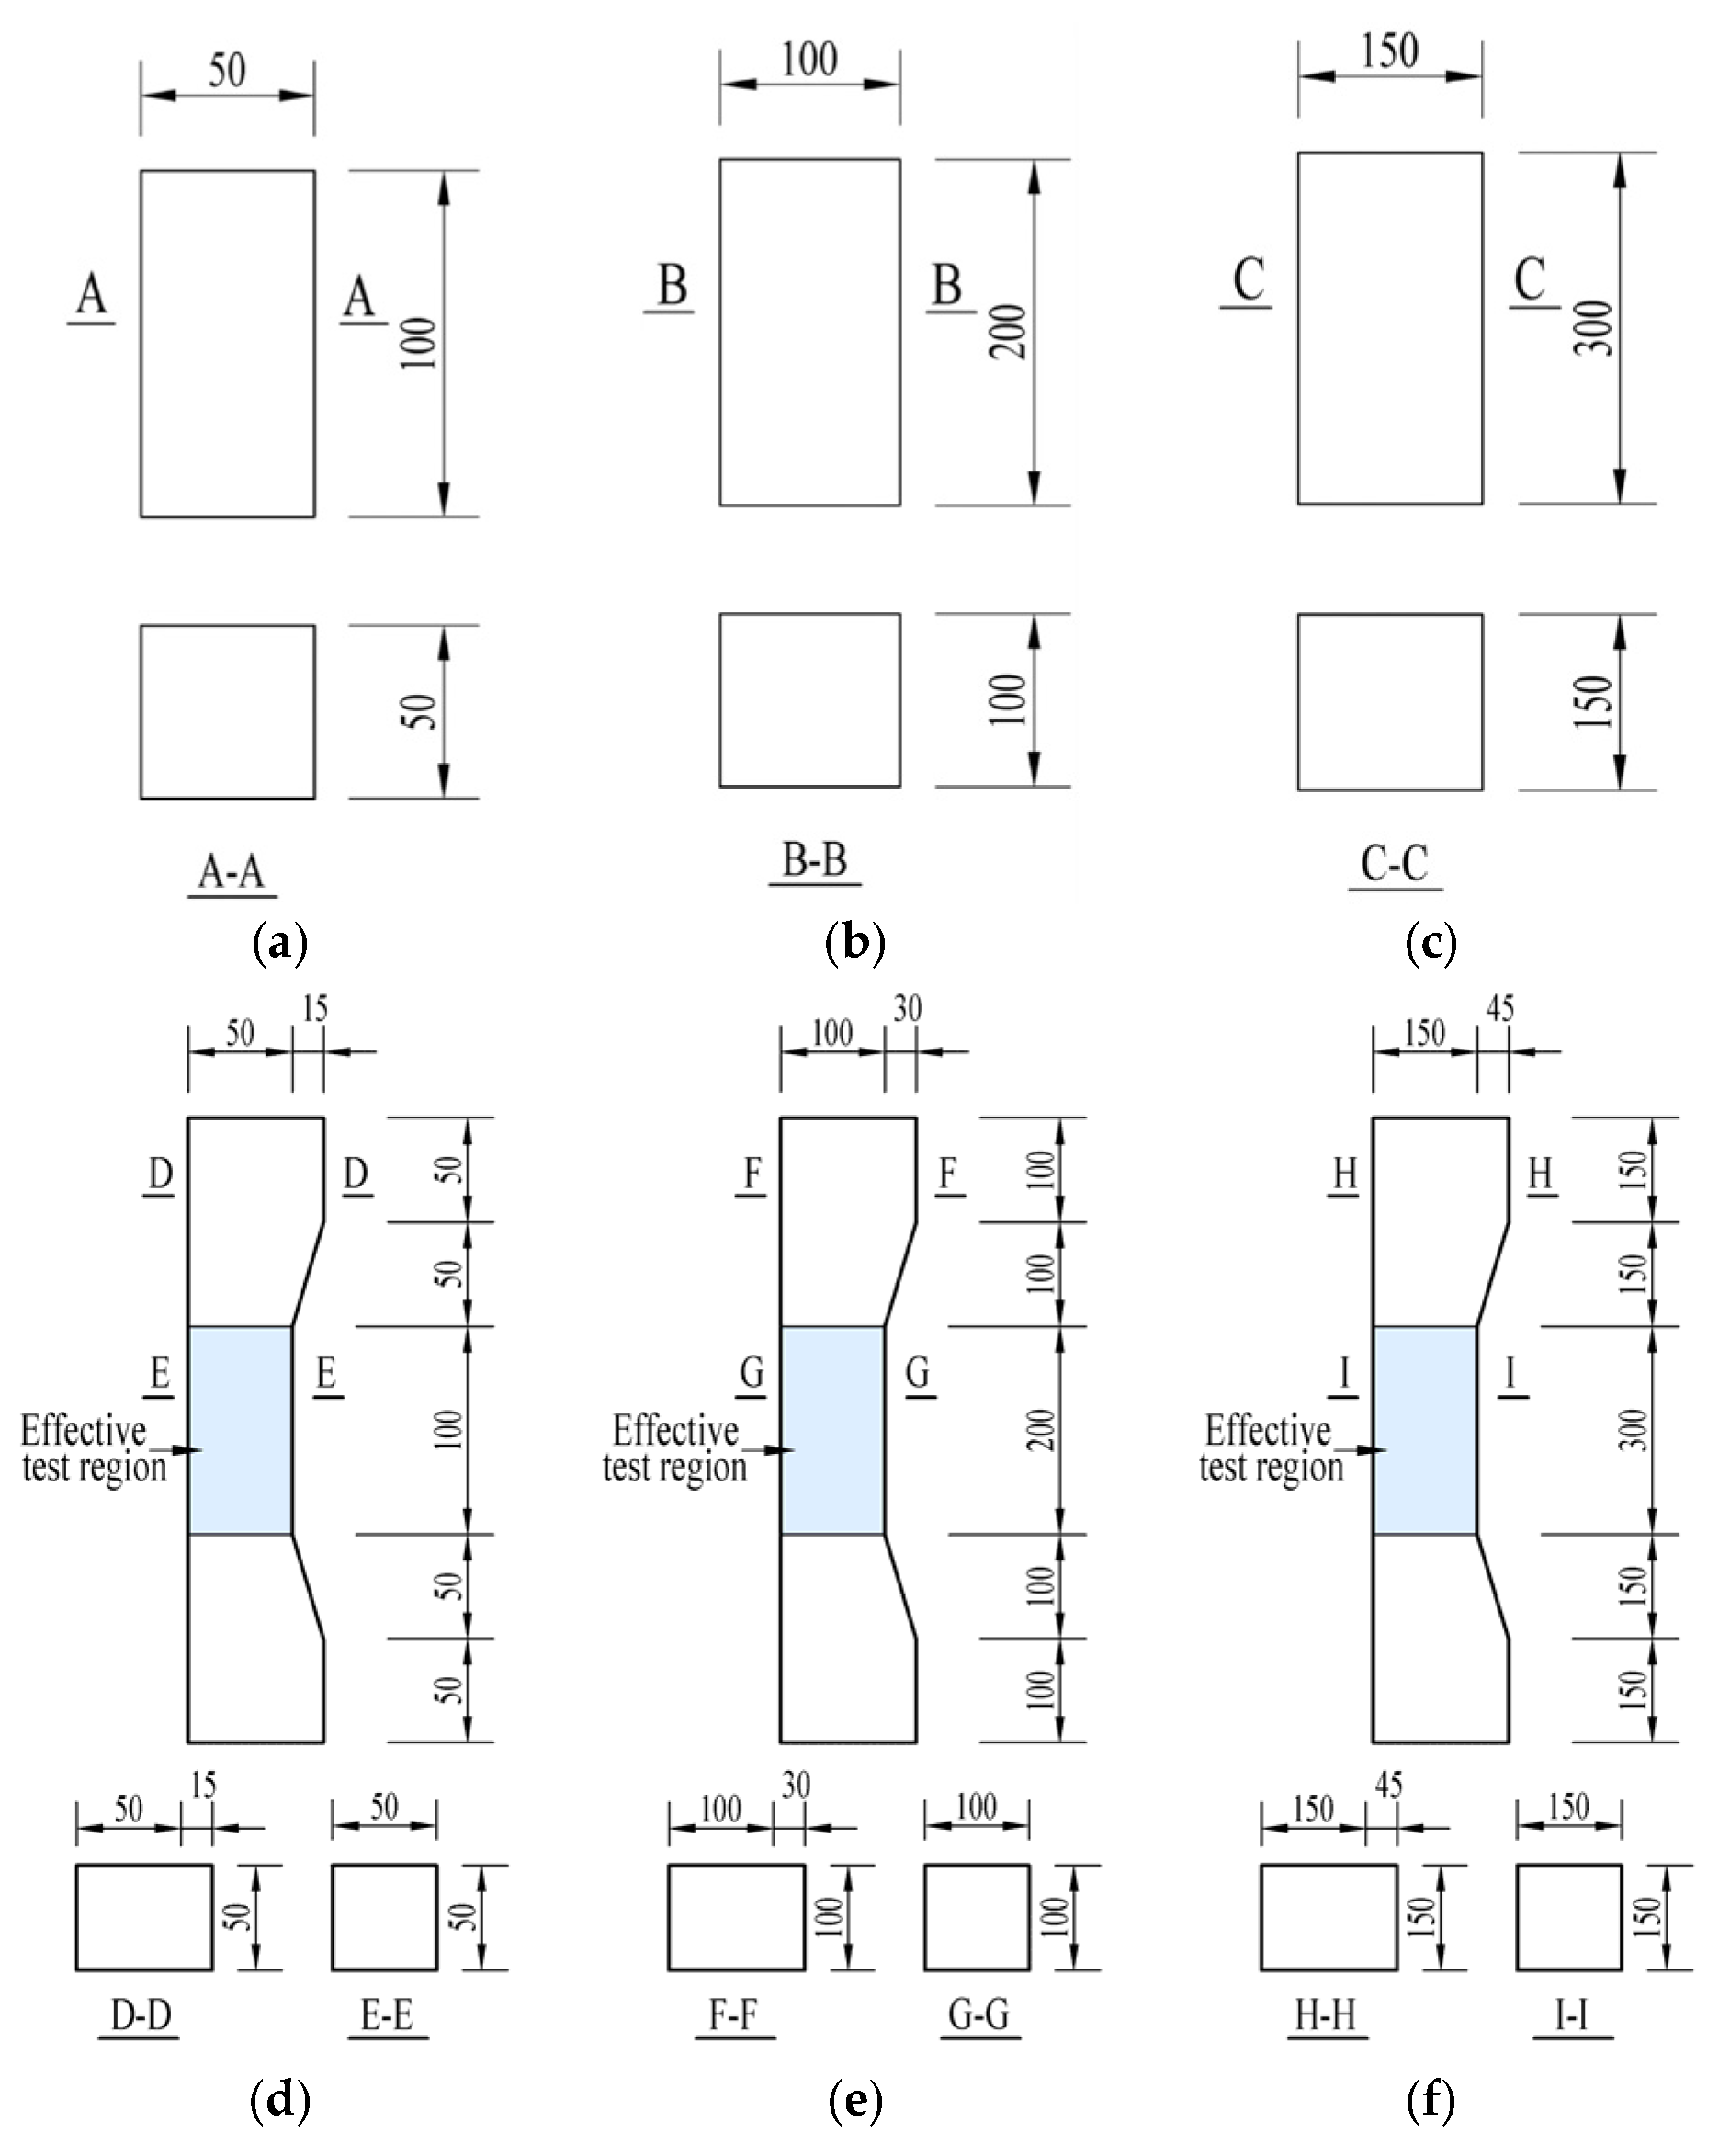
One series of concentrically loaded prisms of different sizes and two series of C-shaped specimens subjected to eccentric compression with different eccentricities were tested. The specimen configurations and dimensions are shown in Figure 1, and the test matrix is summarized in Table 1. The effective test region had a constant height-to-depth ratio of l0/h = 2, and two nominally identical specimens were tested for each configuration. Owing to the limited number of replicate specimens, the experimental results are used primarily to identify the overall trends associated with specimen size and eccentricity rather than to establish statistically representative population parameters. Accordingly, the mean values reported herein should be interpreted as descriptive averages of the two replicate measurements, and the inherent variability of concrete cannot be fully quantified from the present dataset. Here, b and h are the section width and depth of the effective test region, respectively; l is the total specimen height; l0 is the height of the effective test region; and e0 is the distance from the axial load line to the centroid of the effective region.
Figure 1.
Geometries and dimensions of specimens for concentric and small-eccentricity compression tests (unit: mm). The blue-shaded regions indicate the effective test regions of the NB- and NC-series specimens. For the NA-series specimens, which have a uniform prismatic geometry without a reduced section, the entire uniform prismatic region was regarded as the effective test region. (a) NA50. (b) NA100. (c) NA150. (d) NB50 or NC50. (e) NB100 or NC100. (f) NB150 or NC150.
Table 1.
Specimen groups and dimensions.
2.1.2. Specimen Preparation and Curing
All specimens were produced from the same batch of ready-mixed concrete. The concrete was prepared using P.O. 52.5 ordinary Portland cement, manufactured sand, crushed stone with a maximum aggregate size of 20 mm, ground granulated blast-furnace slag, water, and a polycarboxylate-based high-performance water-reducing admixture. The mix proportion by mass was cement:sand:coarse aggregate:ground granulated blast-furnace slag:water:superplasticizer = 1:1.51:2.93:0.15:0.34:0.016. All specimens were cast simultaneously using concrete from the same batch and, after demolding, were cured under identical conditions for 28 days. The cured specimens are shown in Figure 2.
In addition to the size-effect specimens listed in Table 1, six 150 × 150 × 300 mm prism specimens and six 150 × 150 × 150 mm cube specimens were prepared for material characterization. The prism and cube specimens listed in Table 2 and Table 3 were auxiliary material-property specimens and were independent of the NA, NB, and NC test series. The labels “Group 1” and “Group 2” in Table 2 and Table 3 were used only to organize the replicate material tests and do not correspond to the specimen groups in Table 1.
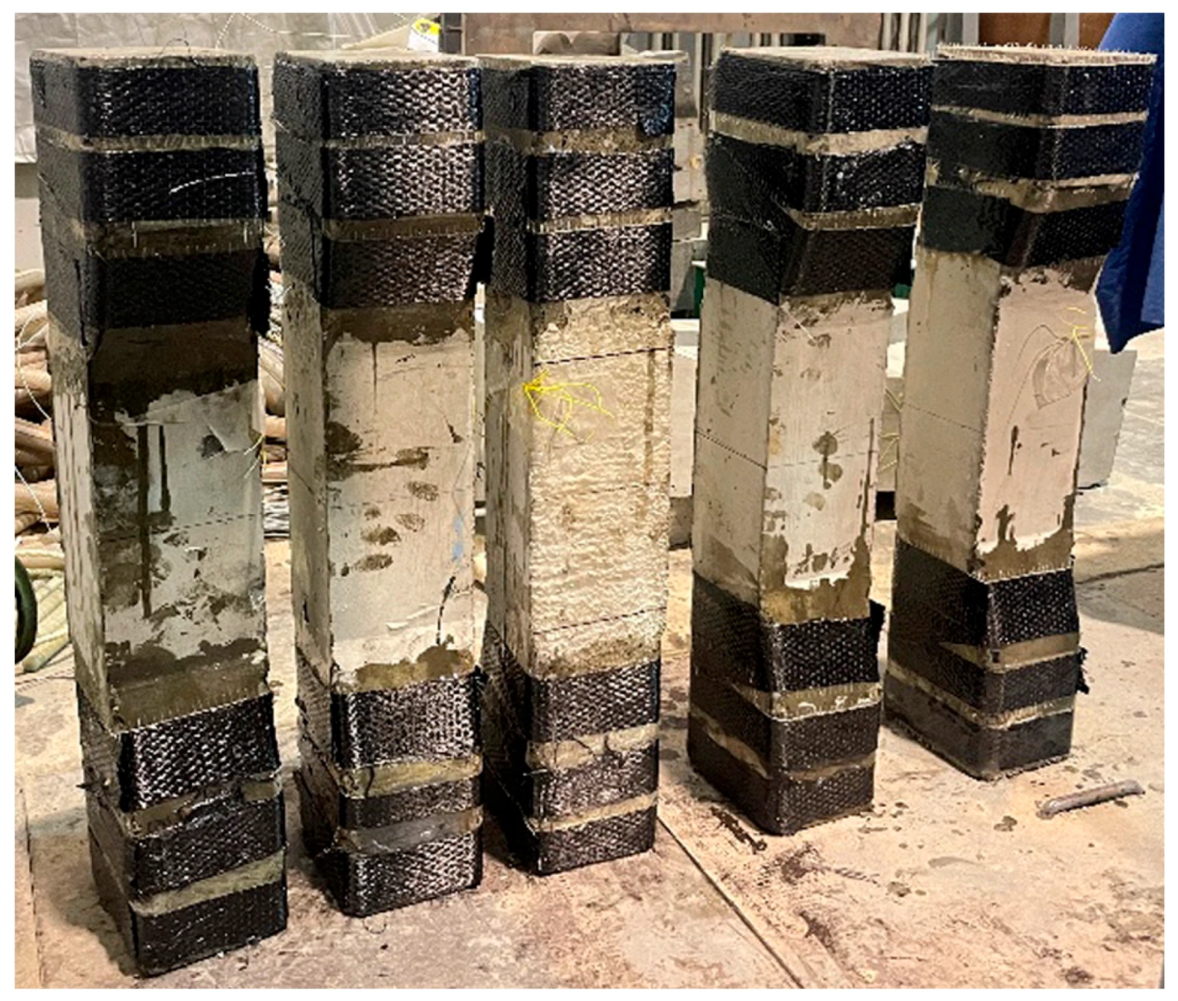
To prevent premature failure of the haunches outside the effective test region of the C-shaped specimens, the haunch regions at both ends were wrapped with carbon-fiber-reinforced polymer (CFRP) before testing.
As shown in Figure 3, the CFRP wrapping was confined to the haunch regions outside the effective test region and was introduced only to prevent premature local failure at these locations. Nevertheless, the additional confinement may have caused some local stress redistribution near the transition between the haunch and the effective test region. Since the influence of the CFRP confinement was not independently quantified in the present study, the interpretation of the results is focused primarily on the behavior within the effective test region.
Figure 2.
Cured specimens.
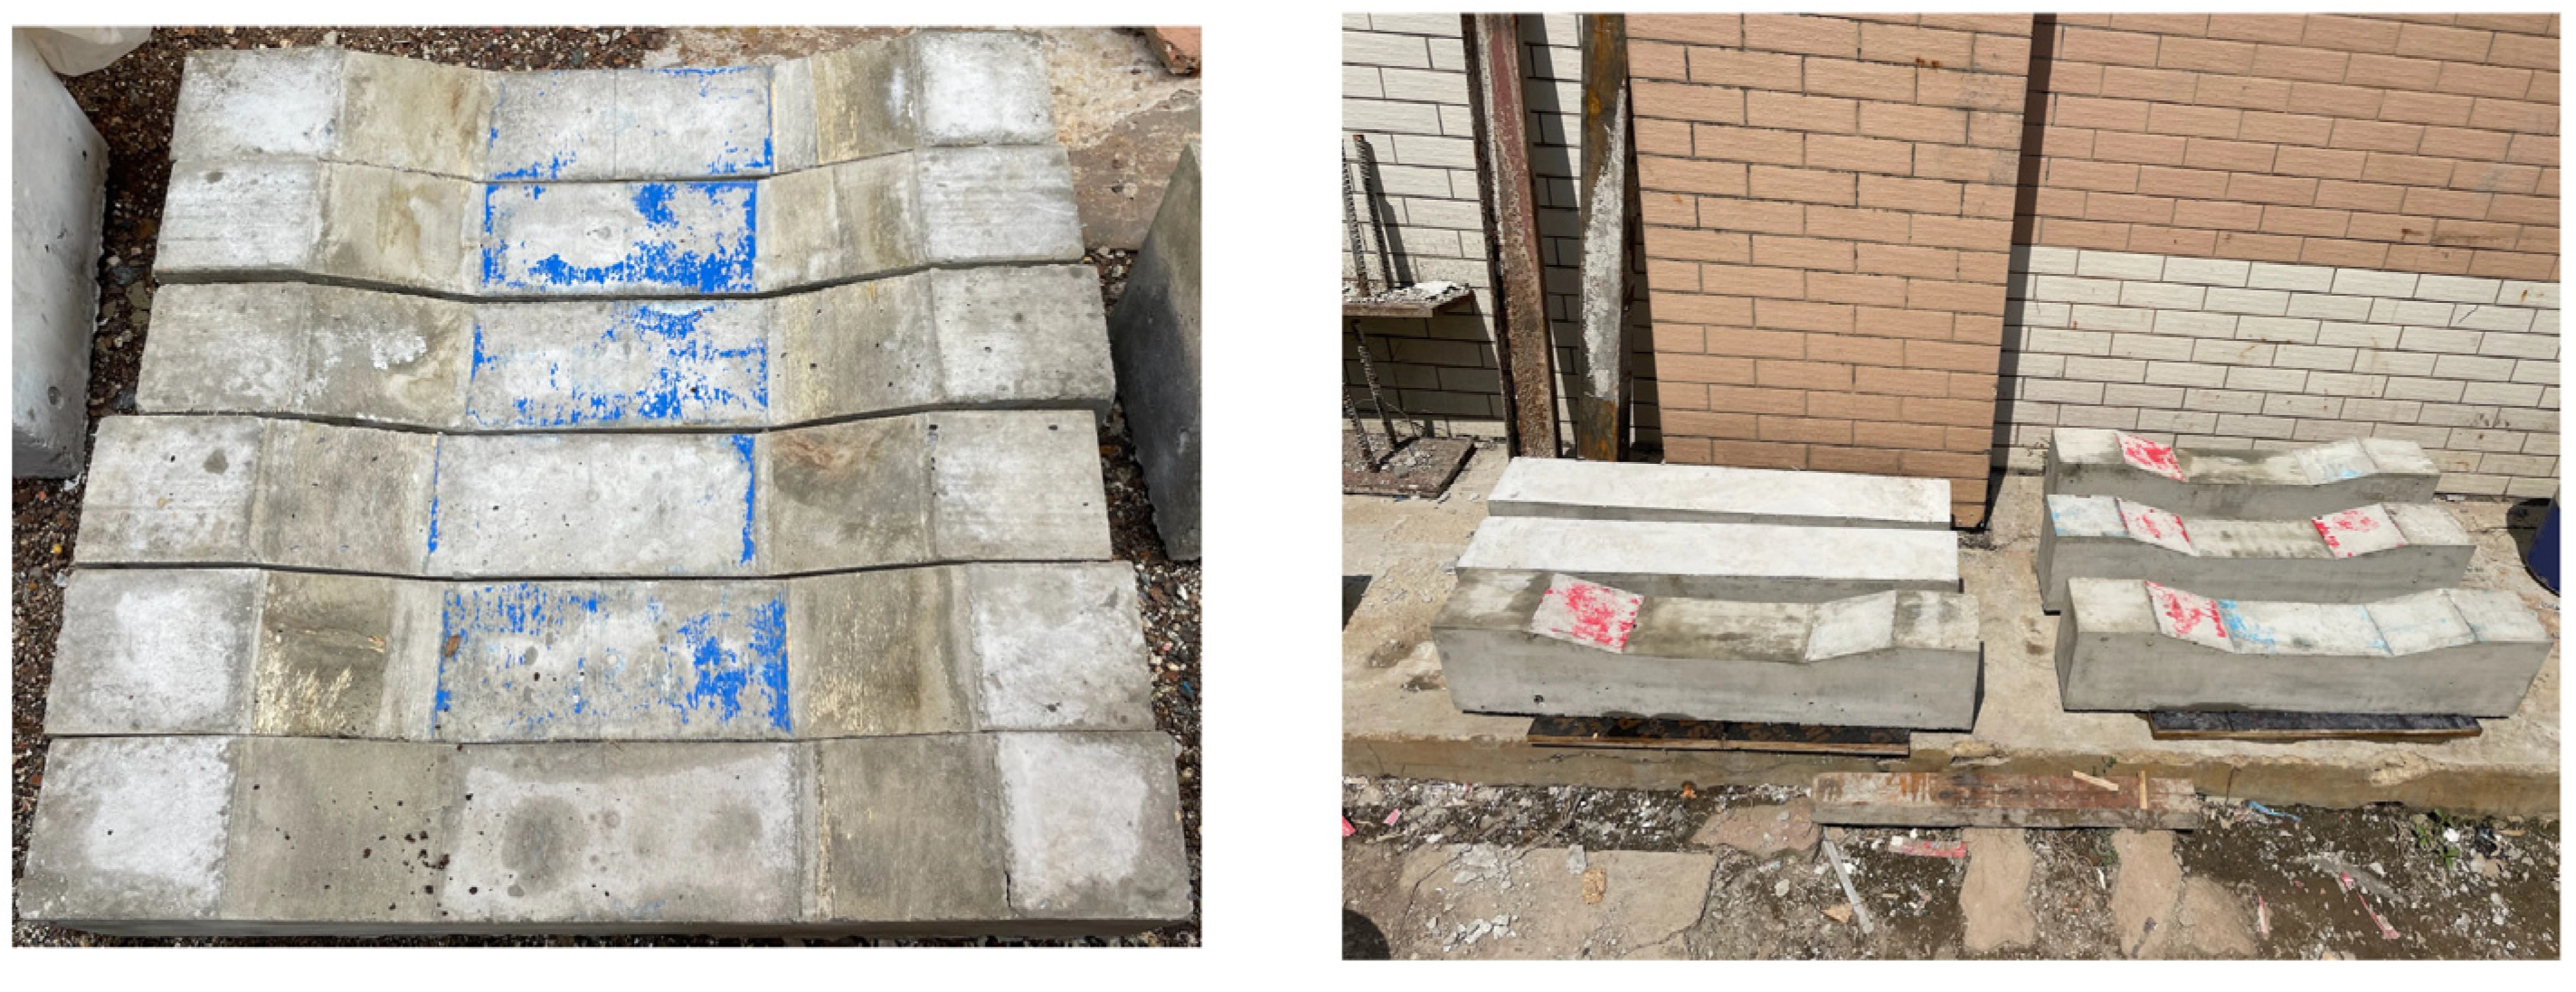
Table 2.
Elastic modulus results from auxiliary prism specimens.
Table 3.
Compressive-strength results from auxiliary cube specimens.
Figure 3.
CFRP-wrapped haunch regions.
2.1.3. Loading Protocol
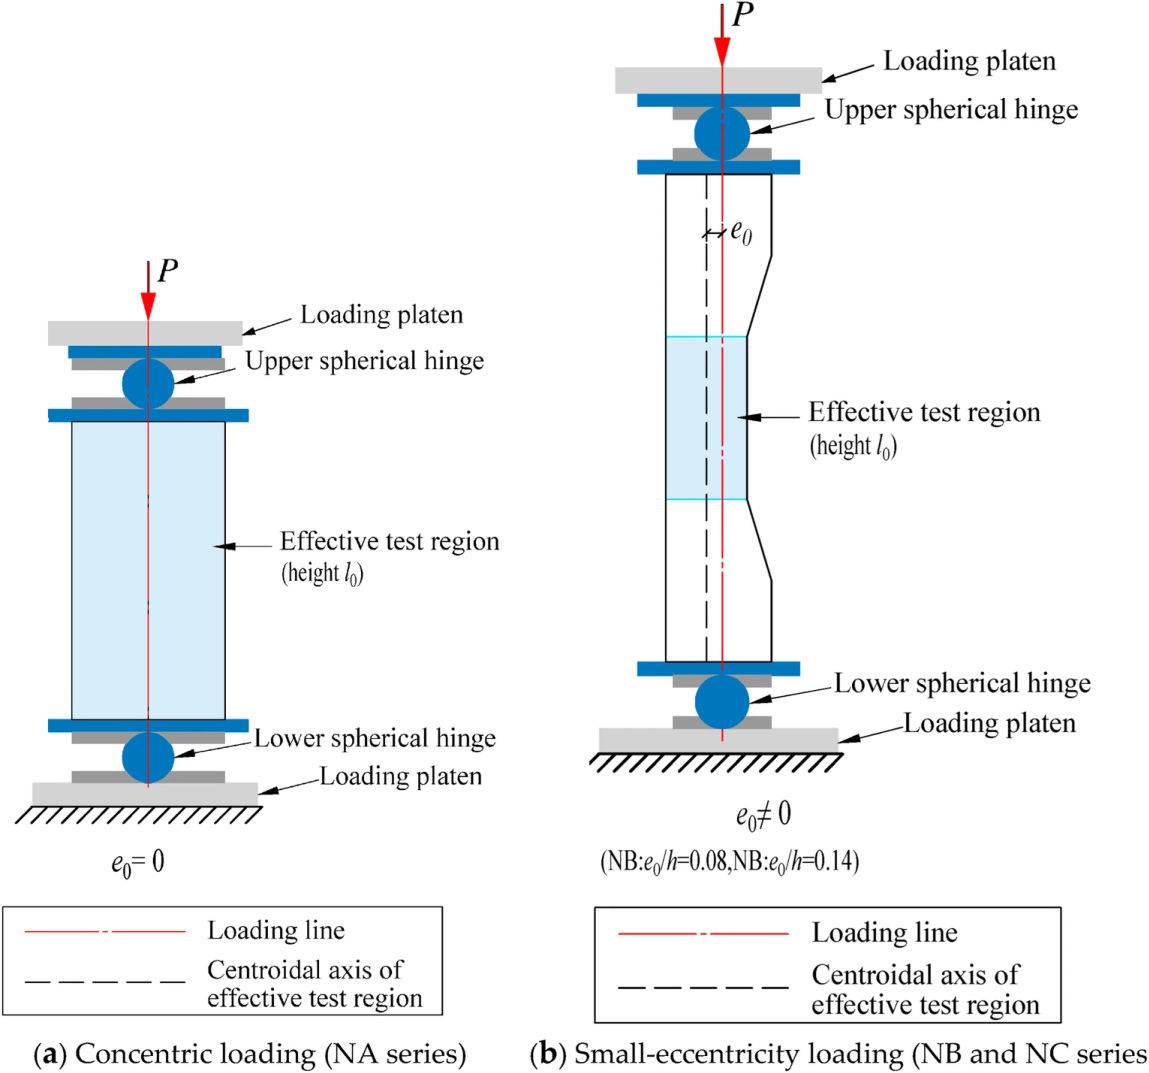
The loading configurations and support conditions are illustrated in Figure 4. The NA specimens were subjected to concentric compression, with the loading line passing through the centroidal axis of the effective test region. For the NB and NC specimens, the loading line was offset from the centroidal axis by the prescribed eccentricity e0, corresponding to e0/h = 0.08 and 0.14, respectively. Rigid spherical-hinge supports were installed at the loading ends of all specimens.
Before formal loading, a preload was applied to verify the normal operation of all instruments. The failure load of each specimen was initially estimated from the measured concrete compressive strength and the effective cross-sectional area, and the estimate was further adjusted based on the research group’s previous experience with similar concrete compression tests. The same estimation procedure was applied consistently to all specimen configurations. The estimated failure load was used only to determine the stepwise loading levels during testing and was not used in the calculation of the experimentally measured ultimate load or nominal strength.
The load was then increased in increments of 10% of the estimated failure load, with a 10 min hold at each level. After approximately 80% of the estimated ultimate load had been reached, the load increment was reduced to 5%. Loading was continued until specimen failure.
The loading protocol was designed primarily to determine the ultimate load, nominal compressive strength, and macroscopic failure mode of each specimen. Because force-controlled loading does not permit stable tracing of the complete post-peak softening response, the post-peak load-deformation behavior and stable crack-propagation process were not quantitatively evaluated in the present study.
Figure 4.
Loading configurations and support conditions for the compression tests: (a) concentric loading of the NA series; (b) small-eccentricity loading of the NB and NC series.
2.2. Experimental Results and Discussion
2.2.1. Nominal Strength
The test results are summarized in Table 4. Pu denotes the failure load, and the nominal strength σu was calculated as Pu/(bh), where b and h are the cross-sectional dimensions of the effective test region.
Table 4.
Test results.
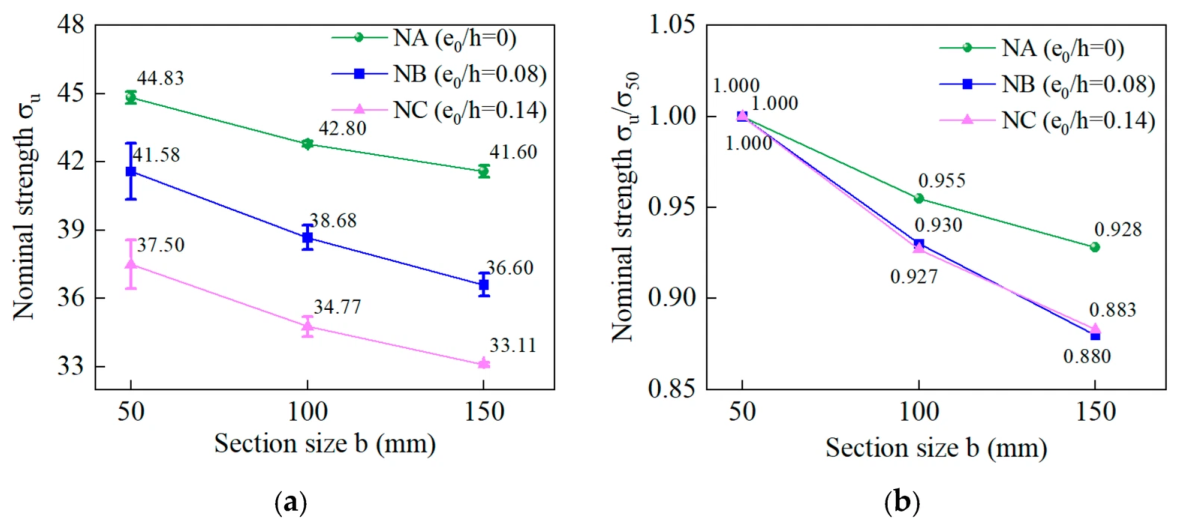
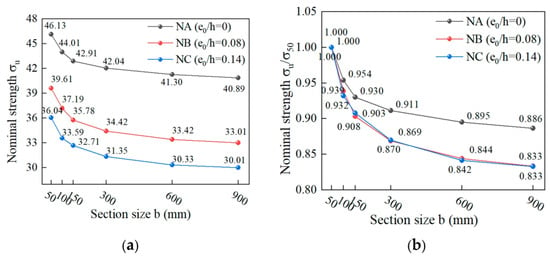
Figure 5 shows the variation in nominal strength with specimen size. The nominal strength decreases with increasing section size, demonstrating a clear size effect; increasing eccentricity further reduces strength. When the section size increased from 50 to 150 mm, the descriptive mean nominal strength of the NA series decreased from 44.83 to 41.60 MPa (7.2%). The corresponding decreases were from 41.58 to 36.60 MPa (12.0%) for NB and from 37.50 to 33.11 MPa (11.7%) for NC. At h = 150 mm, the normalized strengths relative to the 50 mm specimens were 0.928, 0.880, and 0.883 for NA, NB, and NC, respectively, indicating that small-eccentricity compression exhibits a more pronounced size effect than concentric compression.
Under small-eccentricity compression, the section stress distribution changes from relatively uniform compression to nonuniform compression, and a pronounced strain gradient develops across the effective section. Consequently, one side of the section reaches high compressive strain and damage earlier than the other, promoting localized crushing and crack development in the highly compressed zone. The deformation and damage therefore become concentrated within a finite localized region rather than being distributed uniformly over the whole section.
From a fracture-localization perspective, the characteristic width of the localized damage zone may not increase proportionally with specimen size, which could contribute to the observed size dependence. The localized zone therefore occupies a relatively smaller fraction of the specimen, and the influence of material heterogeneity, internal defects, aggregate-scale variability, and localized energy dissipation becomes more pronounced [8,9,10,11,19,20,21,22,23,25,26,32,33,34,35]. This provides a physical explanation for the stronger observed size dependence under small-eccentricity compression than under concentric compression.
However, although the absolute nominal strength decreases as e0/h increases from 0.08 to 0.14, the normalized strength reductions in the NB and NC series are very similar. Therefore, within the investigated range, increasing eccentricity mainly reduces the strength level rather than producing a further clearly distinguishable increase in the magnitude of the size effect.
Figure 5.
Size effect on nominal strength at different eccentricity ratios: (a) nominal strength; (b) normalized nominal strength. The symbols represent the mean values of two replicate specimens, and the error bars indicate the range between the two measured values rather than a statistically estimated standard deviation.
2.2.2. Failure Modes
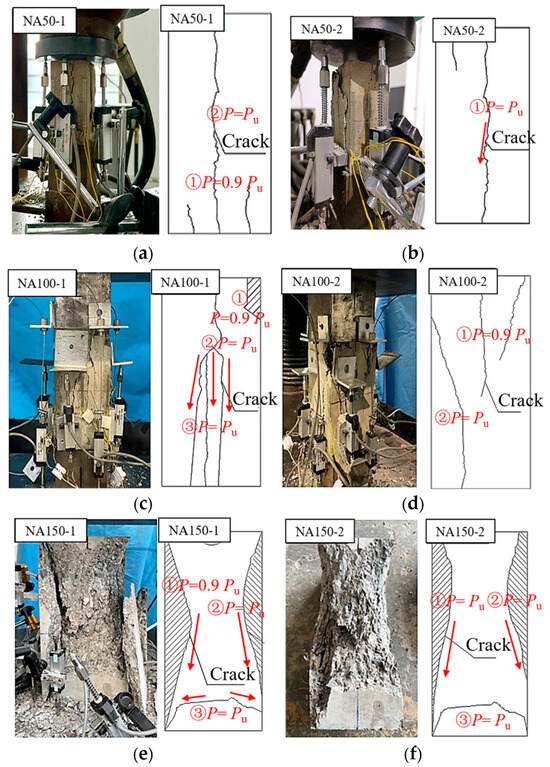
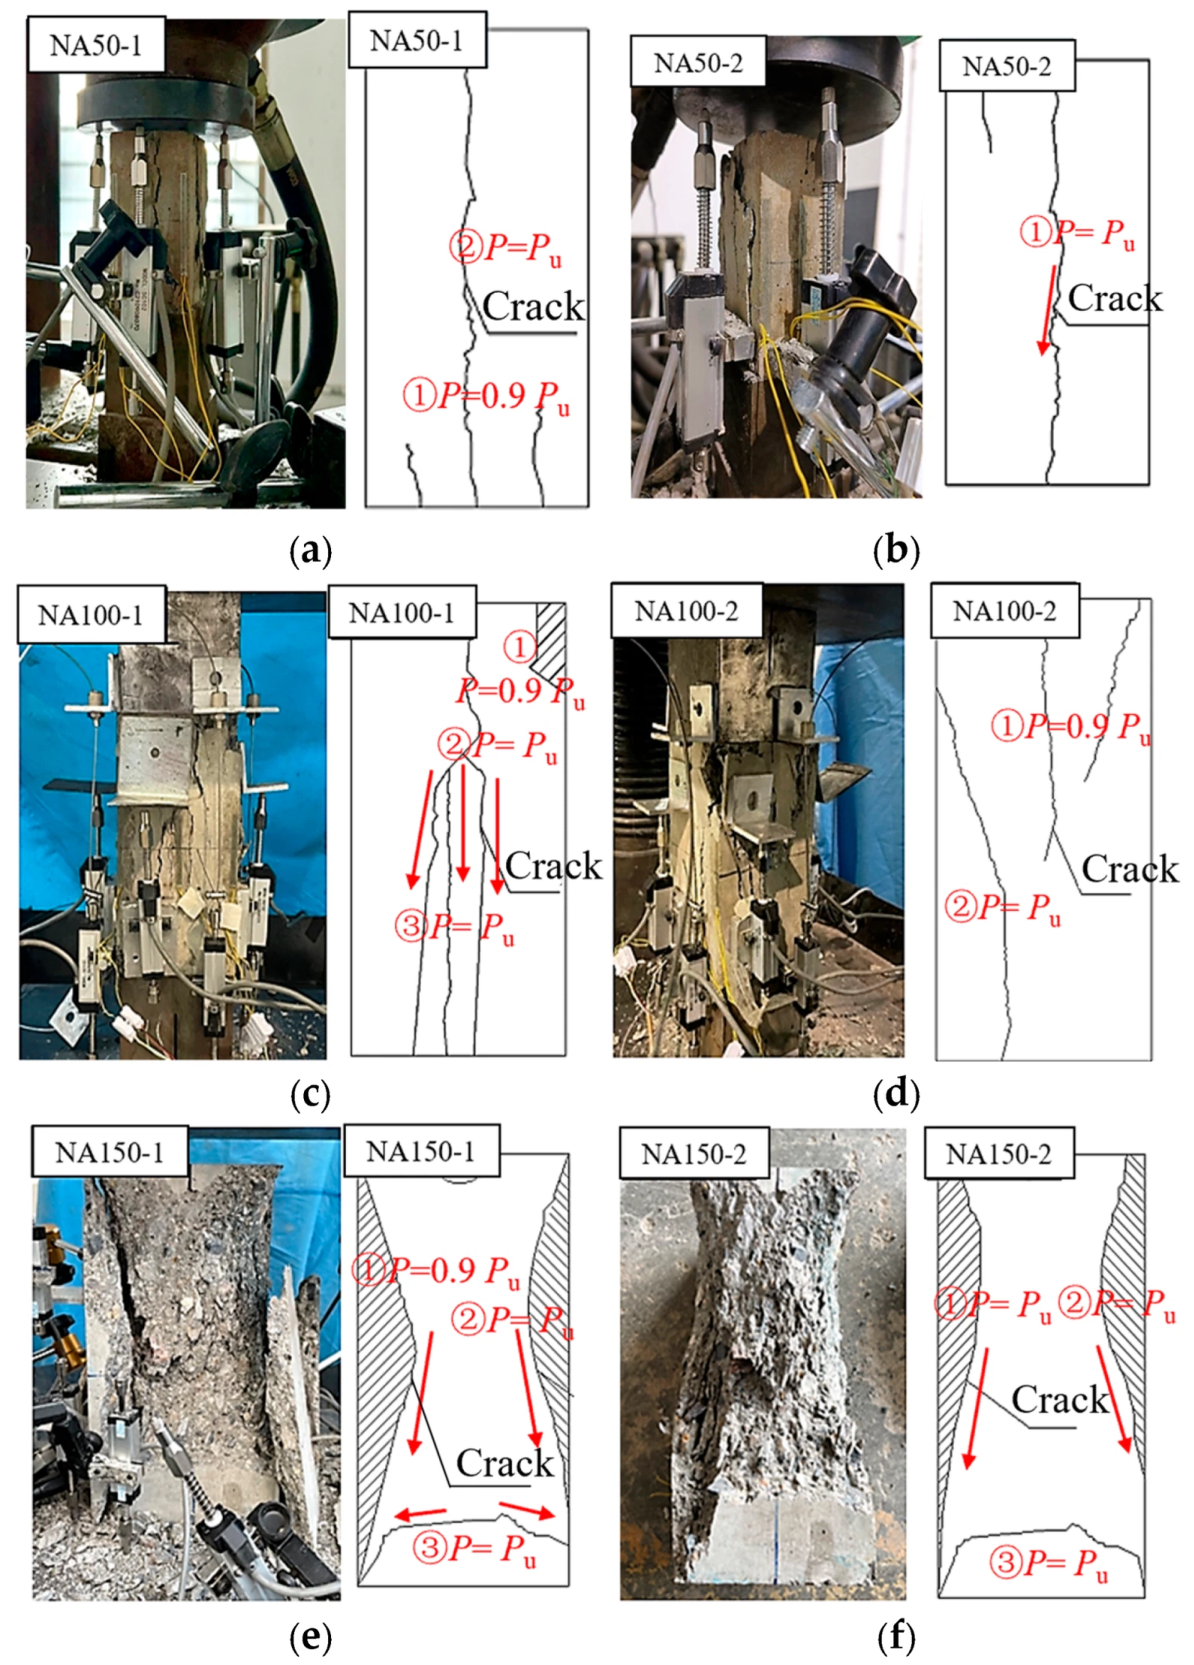
The crack development and failure modes of the concentrically loaded NA specimens are shown in Figure 6. Their principal features were vertical splitting cracks and local concrete crushing and spalling. For the concentrically loaded NA specimens, visible surface cracking was generally observed at approximately 0.9Pu. Continued loading caused rapid crack extension, local crushing, and final failure. This value should be interpreted as the load level at which cracks became visually detectable rather than as a precisely measured crack-initiation threshold. Small specimens more often developed through-going vertical cracks, whereas local crushing and lateral spalling became more pronounced with increasing specimen size.
Figure 6.
Crack development and failure modes of NA-series specimens. The red arrows indicate the observed crack propagation directions during the experiments.(a) NA50-1. (b) NA50-2. (c) NA100-1. (d) NA100-2. (e) NA150-1. (f) NA150-2.
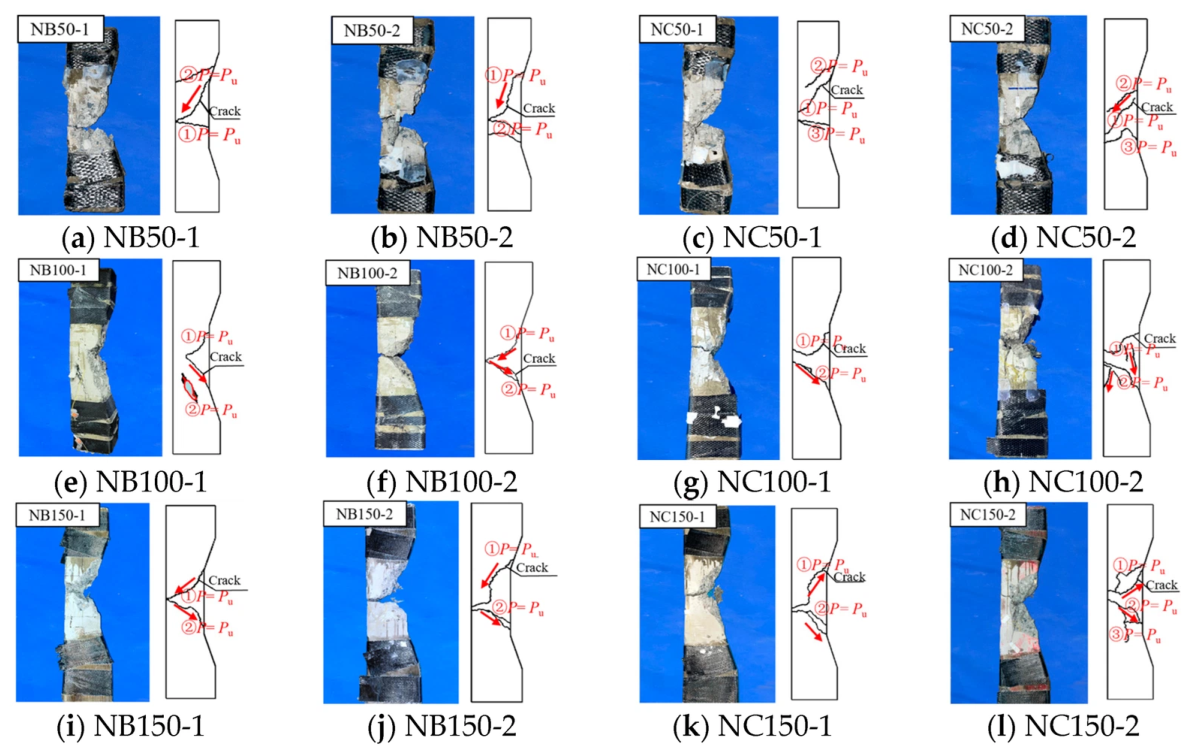
Figure 7 shows the failure modes of the eccentrically loaded NB and NC specimens. Compared with the NA specimens, their damaged regions were more localized and their crack orientations were more distinct. All eccentrically loaded specimens exhibited typical small-eccentric-compression failure: concrete in the compressed zone of the effective test region first underwent local crushing, after which inclined cracks propagated rapidly and coalesced. The final failure mode was governed by crushing in the compression zone and inclined-crack propagation. Several specimens developed evident inclined or X-shaped crack bands. These more localized damage patterns are consistent with the nonuniform stress distribution and pronounced strain gradient induced by small-eccentricity compression, providing experimental support for the localization-based explanation of the stronger size dependence observed under eccentric loading.
As e0/h increased from 0.08 to 0.14, the width of the compression zone decreased and local compressive-stress concentration increased. Consequently, the NC specimens exhibited more pronounced local crushing and crack concentration. This is consistent with the strength results: small-eccentricity compression changes failure from relatively uniform compression to localized damage, while increasing size magnifies the influence of material heterogeneity and local damage propagation.
Figure 7.
Crack development and failure modes of NB- and NC-series specimens.The red arrows indicate the observed crack propagation directions during the experiments. (e) The red circle indicates local concrete spalling.
3. Numerical Simulation of the Size Effect Under Eccentric Compression
To investigate the size effect on the nominal strength of larger specimens, finite-element models of concentrically and eccentrically compressed specimens were established in Abaqus. The nominal strengths under both loading conditions were then analyzed.
3.1. Finite-Element Model and Mesh
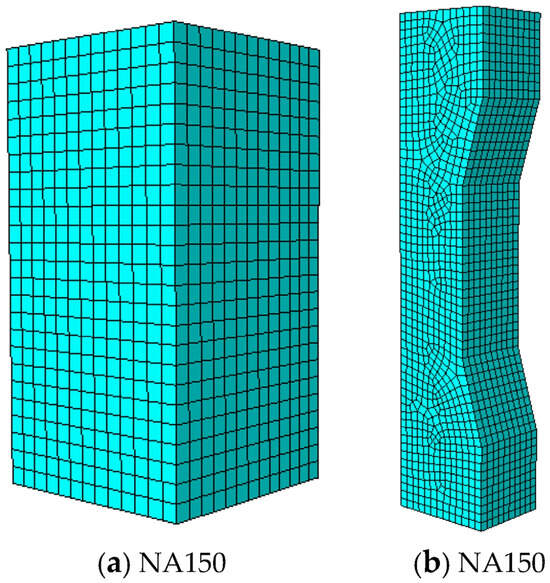
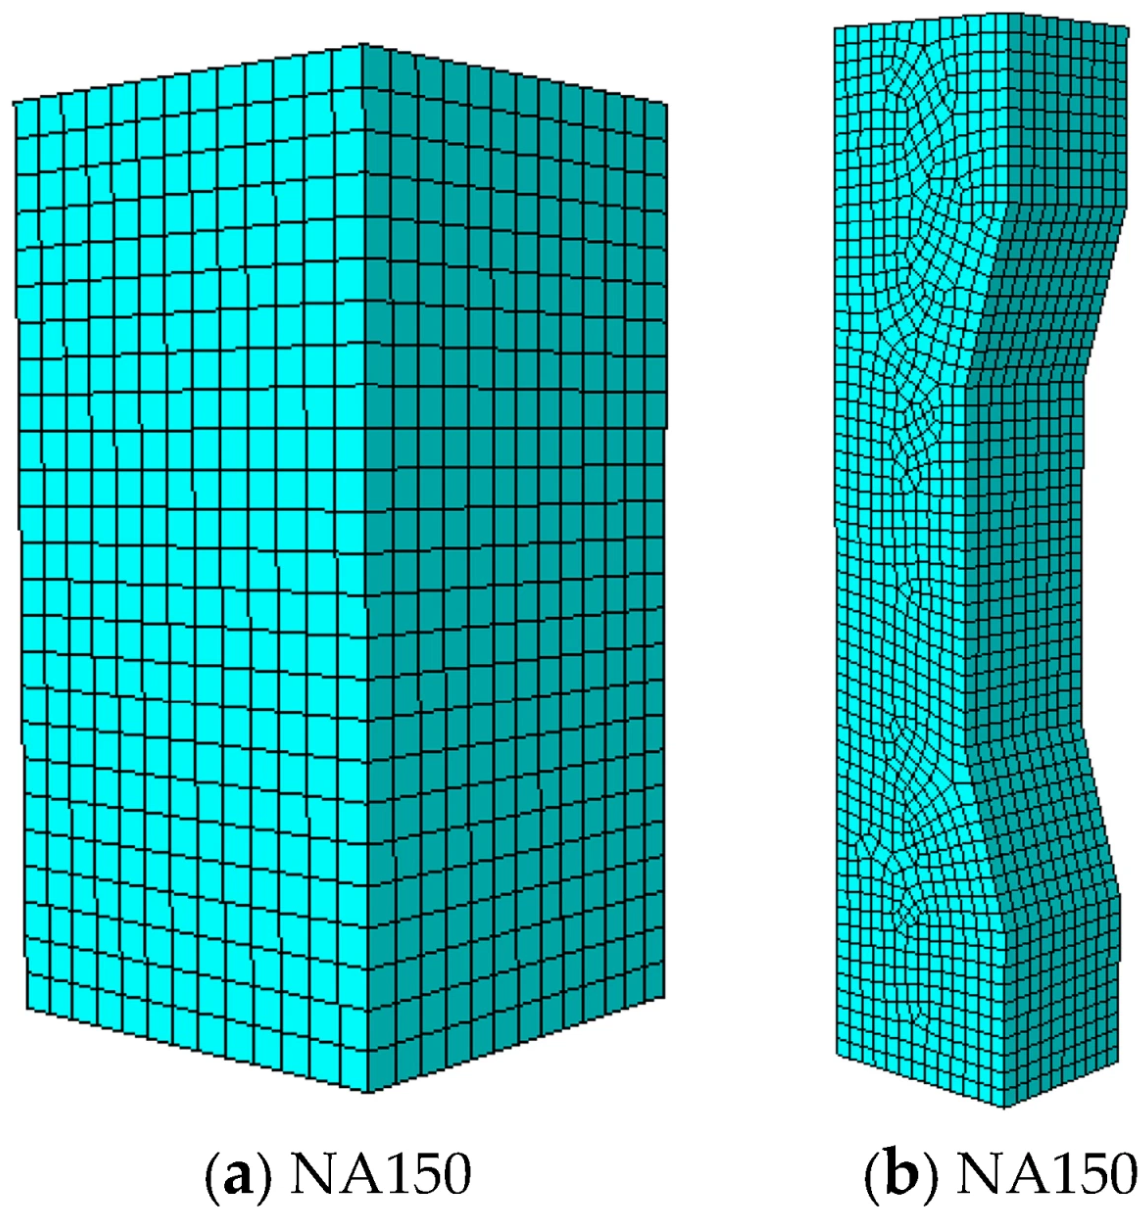
Figure 8 presents the meshes of typical 150 mm specimens. The concrete domain was discretized using eight-node linear brick elements with reduced integration (C3D8R). A concrete damaged-plasticity (CDP) formulation was used to represent compressive damage, tensile cracking, plastic deformation, and stiffness degradation in the inelastic regime. The formulation follows the plastic-damage framework established by Lubliner et al. and Lee and Fenves [43,44]; subsequent damage-plasticity and regularization studies have further addressed multiaxial response, mesh dependence, and the evolution of tensile and compressive damage variables [45,46,47,48]. The concrete elastic modulus was determined from the experimental measurements, while the uniaxial compressive and tensile constitutive relationships were defined according to the CEB-FIP Model Code 2010 [49]. The plastic-flow parameters listed in Table 5 were selected with reference to established CDP formulations and previous numerical studies of concrete [43,44,45,46,47,48,50]. The adopted values are consistent with parameter ranges commonly used in concrete CDP simulations. Considering the potential influence of damage localization in CDP simulations, a mesh sensitivity analysis was additionally performed to evaluate the stability of the predicted global response.
Figure 8.
Finite-element meshes of typical specimens: (a) NA150 prism specimen; (b) NB150/NC150 small-eccentricity compression specimen. The concrete domain was discretized using C3D8R elements.
Table 5.
Parameters used for the concrete damaged-plasticity model.
The loading process was simulated using rigid loading plates coupled with reference points. Displacement-controlled loading was applied through the reference points to ensure stable numerical convergence. For concentric compression models, the loading position coincided with the centroidal axis of the effective test region. For small-eccentricity compression models, the loading position was shifted relative to the centroidal axis according to the prescribed eccentricity ratios (e0/h = 0.08 and 0.14). The bottom surface of the specimen was fully constrained in all translational directions, while displacement was applied at the upper loading plate. Hard contact was adopted between the loading plates and the concrete surface to transfer the compressive load.
The mesh size was selected considering both numerical accuracy and computational efficiency. To evaluate the influence of mesh size on the finite-element results, a mesh sensitivity analysis was conducted using the NC150 specimen as a representative case. The NC150 specimen was selected because it corresponds to the largest experimentally tested size and exhibits a typical small-eccentricity compression failure mode.The results of the mesh sensitivity analysis are summarized in Table 6.
Table 6.
Mesh sensitivity analysis of the NC150 specimen.
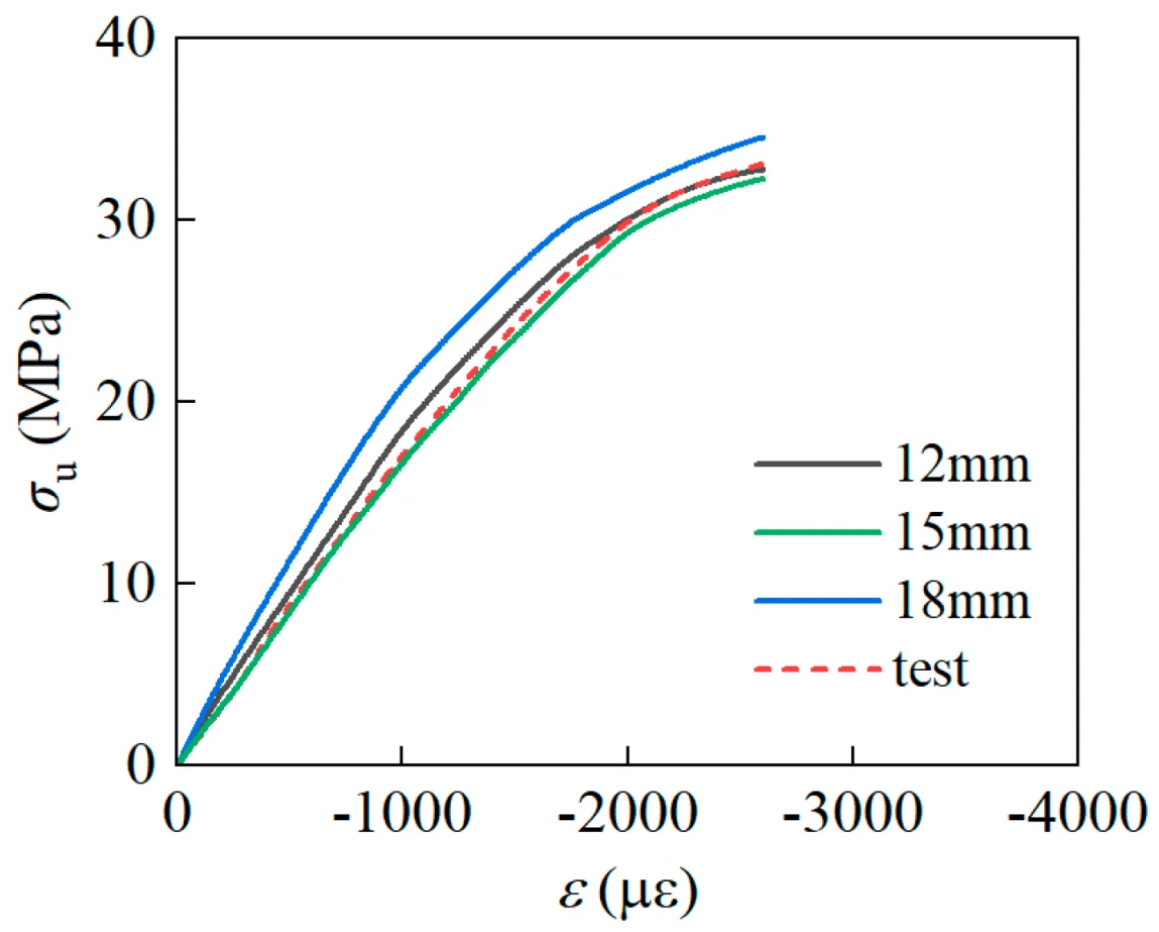
Three mesh sizes of 12 mm, 15 mm, and 18 mm were considered, and the corresponding stress–strain responses are compared in Figure 9. The predicted nominal strengths obtained with the 12 mm, 15 mm, and 18 mm meshes were 32.8 MPa, 32.3 MPa, and 34.6 MPa, respectively, while the experimental value was 33.1 MPa. The deviations from the experimental result were −0.9%, −2.4%, and 4.5%, respectively.
The stress–strain curves obtained from the three mesh densities show similar overall trends, although the coarser 18 mm mesh slightly overestimates the peak strength. The results indicate that mesh refinement has a limited influence on the global response when an appropriate mesh density is adopted. Considering that the 12 mm and 15 mm meshes provide comparable predictions with relatively small deviations from the experimental result, while further refinement increases the computational cost, the 15 mm mesh size was selected for subsequent simulations as a balance between numerical accuracy and computational efficiency.
Figure 9.
Mesh sensitivity analysis of the NC150 specimen based on stress−strain responses with different mesh sizes.
3.2. Experimental Validation of the Finite-Element Model
3.2.1. Failure Load
The above model was used to simulate the tests. A comparison of calculated and measured failure loads is given in Table 7. The ratios of test to calculated values are mostly within 0.97–1.05, indicating that the finite-element model provides a reasonable prediction of the failure loads within the experimentally investigated size range.
Table 7.
Comparison between experimental and calculated failure loads.
3.2.2. Failure Mode
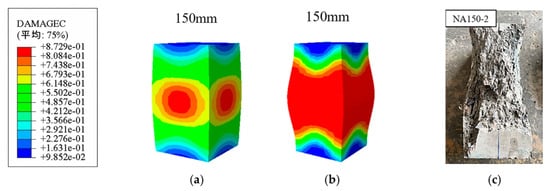
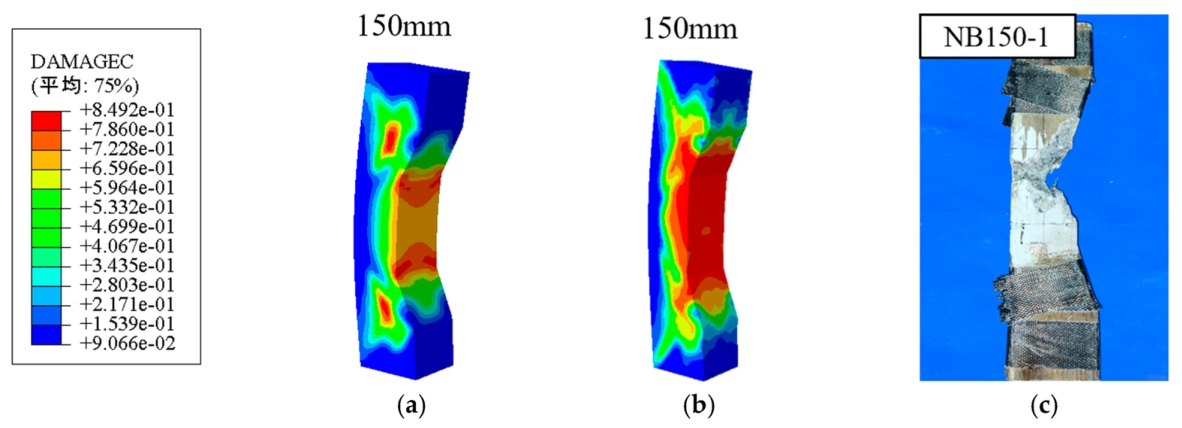
Figure 10, Figure 11 and Figure 12 compare damage contours from the simulations with the observed failure modes of 150 mm specimens under concentric and small-eccentric compression. Figure 10a,b show the NA specimen at damage factors of 0.30 and 0.87, respectively. Damage first appears near the specimen mid-height; with increasing load, the damaged zone expands into a broad band. This pattern agrees with the severe crushing observed in the middle of the tested specimen.
Figure 10.
Comparison of damage contours and observed failure modes for NA−series specimens. (a) d = 0.3. (b) d = 0.87. (c) Experimental failure mode. The Chinese term “平均” is generated by the software and means “Average”.
Figure 11.
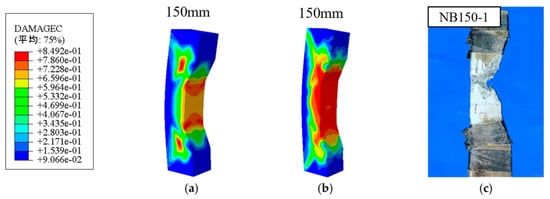
Comparison of damage contours and observed failure modes for NB−series specimens. (a) d = 0.3. (b) d = 0.87. (c) Experimental failure mode. The Chinese term “平均” is generated by the software and means “Average”.
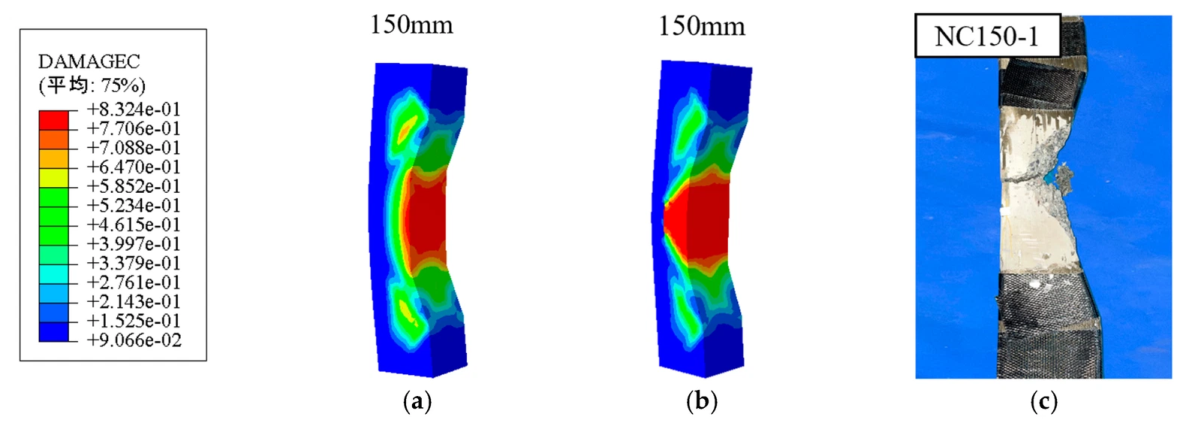
Figure 12.
Comparison of damage contours and observed failure modes for NC−series specimens. (a) d = 0.3. (b) d = 0.87. (c) Experimental failure mode. The Chinese term “平均” is generated by the software and means “Average”.
Figure 11a,b and Figure 12a,b show the failure patterns under small-eccentric compression with e0/h = 0.08 and 0.14, respectively, at damage factors of 0.30 and approximately 0.85. At a damage factor of 0.30, stress on the compression side near the loading end increased continuously and damage localized on that side. At a damage factor of about 0.85, severe damage developed in the compression zone near the loading end. The simulated damage distributions agree well with the observed failure modes, in which the concrete near the loading end was severely crushed on the compression side.
The numerical damage contours provide additional quantitative evidence of damage-zone development. For the NA specimen, a compressive damage variable of d = 0.30 corresponds to the emergence of a localized damaged region near mid-height, whereas at d = 0.87 this region expands into a broad damage band. For the NB and NC specimens, damage is already concentrated on the compression side at d = 0.30, and severe localized damage develops in this region when the damage variable reaches approximately 0.85–0.87.
The observed damage localization is also qualitatively consistent with recent numerical studies on quasi-brittle compression and structural size effects. Pathirage et al. [21], using a discrete modeling approach, emphasized that the development and localization of the fracture process zone play an important role in the size-dependent failure of concrete. Similarly, Barbat et al. [6] showed that strain localization and the characteristic fracture length are closely related to the structural size effect of quasi-brittle materials. Although the present CDP-based continuum model does not explicitly resolve aggregate-scale cracking or discrete crack paths, the concentration of compressive damage observed in the simulations reflects a similar localization tendency. In particular, the transition from a broader damaged region under concentric compression to strongly localized damage on the compression side under small-eccentricity loading is consistent with the general localization mechanisms reported in these studies.
Overall, the failure modes predicted by the finite-element model are consistent with the experimental observations, and the simulated damage localization is qualitatively consistent with the mechanisms reported in recent studies of quasi-brittle fracture and structural size effects. These results support the use of the present model for investigating the size-dependent response within the range considered in this study.
3.3. Numerical Analysis of the Size Effect at Larger Scales
To further investigate the size effect on concrete strength under eccentric compression, larger prism and C-shaped specimens were analyzed using the validated finite-element approach. Models with section sizes of 300, 600, and 900 mm were established. The 300–900 mm concentrically loaded prisms are denoted NA300, NA600, and NA900. The C-shaped specimens retained eccentricity ratios of e0/h = 0.08 and 0.14 and are denoted NB300-NB900 and NC300-NC900, respectively.
Nonlinear finite-element analyses were performed for all models. The calculated failure loads Pu and the corresponding nominal strengths σu are listed in Table 8.
Table 8.
Finite-element results for the enlarged specimens.
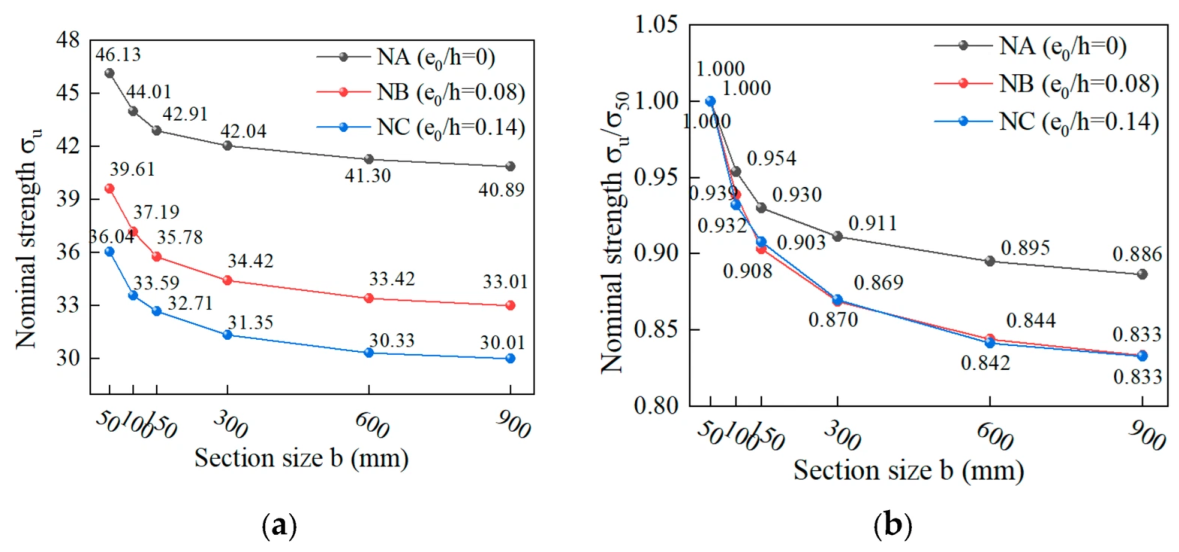
As shown in Figure 13, the simulations further confirm a distinct size effect under both concentric and eccentric compression, with a more pronounced effect under eccentric compression. Nominal strength decreases as section size increases; the decrease is larger at small sizes and gradually levels off. From 50 to 150 mm, the normalized strengths of NA, NB, and NC decreased to 0.930, 0.903, and 0.908, respectively. From 600 to 900 mm, they decreased only from 0.895, 0.844, and 0.842 to 0.886, 0.833, and 0.833, respectively. Thus, the size effect develops more rapidly at small scales and tends to stabilize at larger scales, consistent with large-range compression tests and discrete or mesoscopic simulations reported in the literature [15,19,20,21,22,23].
Figure 13.
Numerical size effect on nominal strength at different eccentricity ratios: (a) nominal strength; (b) normalized nominal strength.
4. Size-Effect Modeling and Analysis
4.1. Size-Effect Models
4.1.1. Bažant Compression Size-Effect Relation
Bažant and Xiang [26] investigated the size effect associated with compression fracture governed by the propagation of axial splitting-crack bands (CSER). Their analysis showed that, in the large-size asymptotic regime, the size-dependent component of nominal compressive strength follows a power-law scaling proportional to h−2/5. Based on this compression-specific asymptotic behavior, the following relation is adopted in the present study:
where σu is the nominal compressive strength, h is the characteristic section size of the effective test region, C1 is a regression coefficient governing the size-dependent contribution, and C0 represents the non-zero asymptotic strength. As h → ∞, the term C1h−2/5 vanishes and the nominal strength approaches C0.
σu = C1h−2/5 + C0
4.1.2. Kim Modified Size-Effect Law
Kim proposed a modified size-effect law (MSEL) for predicting the size effect of concrete strength with or without initial and similar cracks [40]. The expression used in this study is given below.
Here, α, β, and λ0 are regression parameters; λ0 was set to 2; da is the maximum aggregate size (da = 20 mm in this study); and fc is the reference compressive strength of concrete, taken as the mean measured compressive strength of the 150 mm cube specimens (fc = 51.47 MPa in this study).
4.1.3. Carpinteri Multifractal Scaling Model
Carpinteri’s multifractal scaling law (MFSL) is a two-parameter size-effect model that describes the reduction in apparent strength of disordered materials with increasing size [41,42]. Its expression is given below.
In this equation, lch is the internal characteristic length of the material; D is the characteristic specimen dimension, taken as the section depth h of the effective test region; fc is the characteristic compressive strength of a standard prism; and C and D are constants.
The fitted parameters of the Carpinteri model should be interpreted as phenomenological scaling parameters rather than intrinsic material constants. They characterize the strength level and the rate of size-dependent strength reduction within the present dataset and therefore reflect the combined influence of material properties, specimen geometry, loading condition, and eccentricity.
4.2. Comparison of Fitted Size-Effect Models
For consistency, all three size-effect models were fitted using one representative strength value at each size level. For the experimentally tested sizes of 50, 100, and 150 mm, the descriptive mean of the two replicate test results was used. The corresponding finite-element results at these sizes were retained only for numerical-model validation and were not treated as additional independent fitting observations. For the enlarged sizes of 300, 600, and 900 mm, for which experimental results were unavailable, the finite-element predictions were used. Thus, six equally weighted size levels were used for each loading series. Model performance was evaluated using the coefficient of determination (R2) and the root-mean-square error (RMSE). A higher (R2) together with a lower RMSE indicates closer agreement between the fitted model and the experimental–numerical dataset.
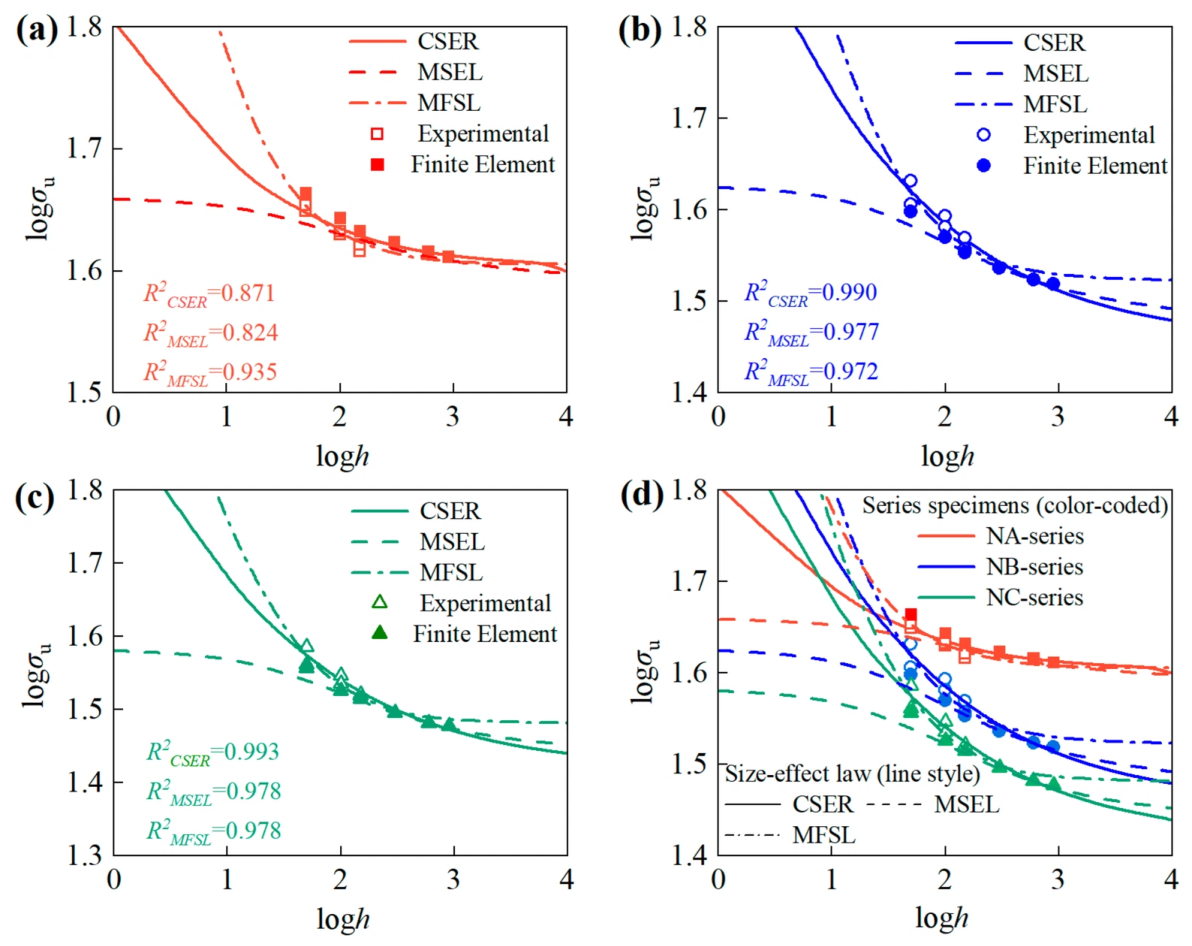
The experimental and finite-element results were fitted to Bažant’s compression relation, Kim’s modified law, and Carpinteri’s multifractal scaling model. The fitted parameters are summarized in Table 9. The corresponding fitting curves and experimental−numerical data are presented in Figure 14.
All three models captured the overall decreasing trend of compressive strength with increasing specimen size, although their fitting accuracy varied with loading condition. For the concentrically loaded NA series, the Carpinteri model yielded the closest agreement, with R2 = 0.935 and RMSE = 0.333 MPa, compared with R2 = 0.871 and RMSE = 0.468 MPa for the Bažant compression relation and R2 = 0.824 and RMSE = 0.545 MPa for the Kim model. For the small-eccentricity NB series, the Bažant compression relation provided the best fit, with R2 = 0.990 and RMSE = 0.303 MPa, compared with R2 = 0.977 and RMSE = 0.461 MPa for Kim’s model and R2 = 0.972 and RMSE = 0.511 MPa for the Carpinteri model. For the NC series, the Bažant compression relation again gave the closest agreement, with R2 = 0.993 and RMSE = 0.220 MPa, while the Kim and Carpinteri models gave similar R2 values of approximately 0.978, with RMSE values of 0.392 and 0.389 MPa, respectively.
Overall, the relative fitting performance depends on the loading condition. The Carpinteri model provides the closest fit for the concentrically loaded NA series, whereas the Bažant compression relation gives the best agreement for the two small-eccentricity series. The Kim model also reproduces the overall decreasing trend but does not provide the best statistical fit for any of the three loading conditions. Therefore, the present results do not support the selection of a single universally superior size-effect model for all loading conditions considered in this study. It should also be noted that the enlarged-size results at 300–900 mm were obtained from the validated finite-element model rather than from independent experiments. Accordingly, the fitted parameters and goodness-of-fit indices should be interpreted as describing the combined experimental–numerical trend within the investigated range rather than as independent experimental validation of the three size-effect laws. Extrapolation beyond this range and a broader assessment of model applicability require further experimental verification.
Table 9.
Fitting results of the size-effect models.
Figure 14.
Fitting of the CSER, MSEL, and MFSL models to the experimental and numerical size-effect data. (a) NA-series (concentric loading); (b) NB-series (e0/h = 0.08); (c) NC-series (e0/h = 0.14); (d) combined comparison of all three series. Open symbols denote experimental data (h = 50, 100, 150 mm); filled symbols denote CDP finite-element results (h = 50, 100, 150, 300, 600, 900 mm).
5. Conclusions
Experimental and finite-element analyses were combined to investigate the effects of effective section size and eccentricity ratio on the size effect of nominal concrete compressive strength under concentric and small-eccentric compression. The applicability of Bažant’s law, Kim’s modified law, and Carpinteri’s model was also compared. The main conclusions are as follows.
- (1)
- Within the experimental size range, nominal concrete compressive strength decreases as the effective section size increases. When the section size increased from 50 to 150 mm, the mean strengths of NA, NB, and NC decreased by 7.2%, 12.0%, and 11.7%, respectively. The larger reductions observed for the NB and NC series, compared with the NA series, indicate that small-eccentricity compression produces a more pronounced size effect than concentric compression.
- (2)
- At a given specimen size, increasing e0/h from 0.08 to 0.14 reduces nominal compressive strength, confirming that greater eccentricity weakens compressive resistance. However, the normalized-strength reductions in NB and NC over the 50–150 mm range are similar (12.0% and 11.7%). Thus, within the investigated eccentricity range, eccentricity mainly reduces nominal strength and does not produce a further clearly distinguishable increase in the size-effect magnitude.
- (3)
- The finite-element model reproduced the measured failure loads and observed damage localization, with Pexp/Pcal ranging from approximately 0.97 to 1.05. The numerical extension to section sizes of 300–900 mm indicated that strength reduction was more rapid at small sizes and gradually diminished at larger sizes. These large-size results should nevertheless be regarded as numerical predictions rather than independent experimental evidence.
- (4)
- The three size-effect models exhibit different fitting performance under different loading conditions. The Carpinteri model provides the closest fit for the concentrically loaded NA series, with R2 = 0.935 and RMSE = 0.333 MPa. In contrast, the Bažant compression relation based on the h−2/5 asymptotic scaling provides the best agreement for the NB and NC series, with R2 = 0.990 and 0.993 and RMSE values of 0.303 and 0.220 MPa, respectively. These results indicate that the applicability of the size-effect models depends on the loading condition and associated failure mechanism rather than on a universally superior formulation. The fitted models describe the combined experimental–numerical trend within the investigated range, but their extrapolation beyond this range requires further experimental verification.
These conclusions are limited to the concrete mixture, the prismatic and C-shaped specimen geometries, experimental range of 50–150 mm, numerical extension of 300–900 mm, and the limited replication of two specimens per configuration considered in this study. Therefore, the experimental results should be interpreted primarily in terms of the observed size-dependent trends rather than as a statistically representative characterization of concrete variability. In addition, because the tests were conducted under force-controlled loading, the complete post-peak softening response and stable crack-propagation process were not captured. Further work should include a larger number of replicate specimens, employ displacement- or deformation-controlled loading for a more rigorous investigation of post-peak behavior and fracture localization, and examine the effects of aggregate size, concrete-strength class, and a wider range of eccentricity ratios.
Author Contributions
H.Z.: Writing—original draft, Project administration. Y.C.: Supervision, Funding acquisition. X.L.: Formal analysis, Methodology. Y.Z.: Writing—review & editing, Data curation. J.Z.: Investigation, Data curation. All authors have read and agreed to the published version of the manuscript.
Funding
This research received no external funding.
Data Availability Statement
The raw data supporting the conclusions of this article will be made available by the authors on request.
Conflicts of Interest
Author Xiaotong Liu was employed by the company Beijing TENSAM Wind Power Equipment Co., Ltd. Author Yongheng Zhang was employed by the company Rizhao Architectural Design and Research Institute Co.,Ltd. The remaining authors declare that the research was conducted in the absence of any commercial or financial relationships that could be construed as a potential conflict of interest.
References
- Bažant, Z.P. Size effect. Int. J. Solids Struct. 2000, 37, 69–80. [Google Scholar] [CrossRef] [Scilit]
- Bažant, Z.P. Size effect in blunt fracture: Concrete, rock, metal. J. Eng. Mech. 1984, 110, 518–535. [Google Scholar] [CrossRef] [Scilit]
- Bažant, Z.P. Scaling theory for quasibrittle structural failure. Proc. Natl. Acad. Sci. USA 2004, 101, 13400–13407. [Google Scholar] [CrossRef] [Scilit] [PubMed]
- Bažant, Z.P.; Yavari, A. Is the cause of size effect on structural strength fractal or energetic-statistical? Eng. Fract. Mech. 2005, 72, 1–31. [Google Scholar] [CrossRef]
- Weibull, W. A statistical distribution function of wide applicability. J. Appl. Mech. 1951, 18, 293–297. [Google Scholar] [CrossRef] [Scilit]
- Barbat, G.B.; Cervera, M.; Chiumenti, M.; Espinoza, E. Structural size effect: Experimental, theoretical and accurate computational assessment. Eng. Struct. 2020, 213, 110555. [Google Scholar] [CrossRef] [Scilit]
- Zhou, F.P.; Balendran, R.V.; Jeary, A.P. Size effect on flexural, splitting tensile, and torsional strengths of high-strength concrete. Cem. Concr. Res. 1998, 28, 1725–1736. [Google Scholar] [CrossRef] [Scilit]
- Markeset, G.; Hillerborg, A. Softening of concrete in compression-localization and size effects. Cem. Concr. Res. 1995, 25, 702–708. [Google Scholar] [CrossRef] [Scilit]
- Jansen, D.C.; Shah, S.P. Effect of length on compressive strain softening of concrete. J. Eng. Mech. 1997, 123, 25–35. [Google Scholar] [CrossRef] [Scilit]
- van Vliet, M.R.A.; van Mier, J.G.M. Experimental investigation of concrete fracture under uniaxial compression. Mech. Cohesive-Frict. Mater. 1996, 1, 115–127. [Google Scholar] [CrossRef]
- van Mier, J.G.M.; Shah, S.P.; Arnaud, M.; Balayssac, J.P.; Bascoul, A.; Choi, S.; Dasenbrock, D.; Ferrara, G.; French, C.; Gobbi, M.E.; et al. Strain-softening of concrete in uniaxial compression. Mater. Struct. 1997, 30, 195–209. [Google Scholar] [CrossRef] [Scilit]
- RILEM Technical Committees. Test Method for Measurement of the strain-softening behaviour of concrete under uniaxial compression. Mater. Struct. 2000, 33, 347–351. [Google Scholar] [CrossRef] [Scilit]
- Yi, S.T.; Yang, E.I.; Choi, J.C. Effect of specimen sizes, specimen shapes, and placement directions on compressive strength of concrete. Nucl. Eng. Des. 2006, 236, 115–127. [Google Scholar] [CrossRef] [Scilit]
- del Viso, J.R.; Carmona, J.R.; Ruiz, G. Shape and size effects on the compressive strength of high-strength concrete. Cem. Concr. Res. 2008, 38, 386–395. [Google Scholar] [CrossRef] [Scilit]
- Muciaccia, G.; Rosati, G.; Di Luzio, G. Compressive failure and size effect in plain concrete cylindrical specimens. Constr. Build. Mater. 2017, 137, 185–194. [Google Scholar] [CrossRef] [Scilit]
- Li, M.; Hao, H.; Shi, Y.; Hao, Y. Specimen shape and size effects on the concrete compressive strength under static and dynamic tests. Constr. Build. Mater. 2018, 161, 84–93. [Google Scholar] [CrossRef] [Scilit]
- Gyurkó, Z.; Nemes, R. Specimen size and shape effect on the compressive strength of normal strength concrete. Period. Polytech. Civ. Eng. 2020, 64, 276–286. [Google Scholar] [CrossRef] [Scilit]
- De La Rosa, A.; Ruiz, G. A new approach to the study of the size and the geometry effect on compressive strength in concrete. Results Eng. 2025, 25, 104261. [Google Scholar] [CrossRef] [Scilit]
- Jin, L.; Yu, W.; Li, D.; Du, X. Numerical and theoretical investigation on the size effect of concrete compressive strength considering the maximum aggregate size. Int. J. Mech. Sci. 2021, 192, 106130. [Google Scholar] [CrossRef] [Scilit]
- Wan-Wendner, L.; Di Luzio, G. Discrete modeling of deterministic size effect of normal-strength and ultra-high performance concrete under compression. Constr. Build. Mater. 2022, 342, 127791. [Google Scholar] [CrossRef] [Scilit]
- Pathirage, M.; Tong, D.; Thierry, F.; Cusatis, G.; Grégoire, D.; Pijaudier-Cabot, G. Discrete modeling of concrete failure and size-effect. Theor. Appl. Fract. Mech. 2023, 124, 103738. [Google Scholar] [CrossRef] [Scilit]
- Wang, Y. A damage constitutive model for concrete under uniaxial compression capturing strain localization. Cem. Concr. Res. 2024, 178, 107457. [Google Scholar] [CrossRef] [Scilit]
- Yang, L.; Li, K.; Hu, X.; Peng, Z.; Liu, Q.F.; Shi, C. Mesoscopic discrete modeling of compression and fracture behavior of concrete: Effects of aggregate size distribution and interface transition zone. Cem. Concr. Compos. 2024, 147, 105411. [Google Scholar] [CrossRef] [Scilit]
- Abadel, A.A. Investigation on size effects of ultra-high-performance concrete: Experimental and numerical study. J. Asian Archit. Build. Eng. 2025, 24, 5347–5364. [Google Scholar] [CrossRef] [Scilit]
- Bažant, Z.P.; Kwon, Y.W. Failure of slender and stocky reinforced concrete columns: Tests of size effect. Mater. Struct. 1994, 27, 79–90. [Google Scholar] [CrossRef] [Scilit]
- Bažant, Z.P.; Xiang, Y. Size effect in compression fracture: Splitting crack band propagation. J. Eng. Mech. 1997, 123, 162–172. [Google Scholar] [CrossRef] [Scilit]
- Brocca, M.; Bažant, Z.P. Size effect in concrete columns: Finite-element analysis with microplane model. J. Struct. Eng. 2001, 127, 1382–1390. [Google Scholar] [CrossRef] [Scilit]
- Şener, S.; Barr, B.I.G.; Abusiaf, H.F. Size effect in axially loaded reinforced concrete columns. J. Struct. Eng. 2004, 130, 662–670. [Google Scholar] [CrossRef] [Scilit]
- Němeček, J.; Bittnar, Z. Experimental investigation and numerical simulation of post-peak behavior and size effect of reinforced concrete columns. Mater. Struct. 2004, 37, 161–169. [Google Scholar] [CrossRef] [Scilit]
- Yi, S.T.; Kim, M.S.; Kim, J.K.; Kim, J.H.J. Effect of specimen size on flexural compressive strength of reinforced concrete members. Cem. Concr. Compos. 2007, 29, 230–240. [Google Scholar] [CrossRef] [Scilit]
- Li, D.; Jin, L.; Du, X.; Fu, J.; Lu, A. Size effect tests of normal-strength and high-strength RC columns subjected to axial compressive loading. Eng. Struct. 2016, 109, 43–60. [Google Scholar] [CrossRef] [Scilit]
- Xu, C.; Jin, L.; Ding, Z.; Li, D.; Du, X. Size effect tests of high-strength RC columns under eccentric loading. Eng. Struct. 2016, 126, 78–91. [Google Scholar] [CrossRef] [Scilit]
- Jin, L.; Li, D.; Du, X.; Lu, A.; Ding, Z. Experimental and numerical study on size effect in eccentrically loaded stocky RC columns. J. Struct. Eng. 2017, 143, 04016170. [Google Scholar] [CrossRef] [Scilit]
- Du, M.; Jin, L.; Du, X.; Li, D. Size effect tests of stocky reinforced concrete columns confined by stirrups. Struct. Concr. 2017, 18, 454–465. [Google Scholar] [CrossRef] [Scilit]
- Jin, L.; Ding, Z.; Li, D.; Du, X. Experimental and numerical investigations on the size effect of moderate high-strength reinforced concrete columns under small-eccentric compression. Int. J. Damage Mech. 2018, 27, 657–685. [Google Scholar] [CrossRef] [Scilit]
- Jin, L.; Zhang, S.; Han, J.; Li, D.; Du, X. Effect of cross-section size on flexural compressive failure of RC columns: Monotonic and cyclic tests. Eng. Struct. 2019, 186, 456–470. [Google Scholar] [CrossRef] [Scilit]
- Jin, L.; Li, P.; Wang, Z.; Du, X. Effect of size on eccentric compression behavior of CFRP-confined RC columns: Experimental and numerical investigation. J. Compos. Constr. 2021, 25, 04021032. [Google Scholar] [CrossRef] [Scilit]
- Si, J.; Li, K.; Zeng, Z.; Liu, Z.; Hu, J. Effect of size on the eccentric compression performance of damaged square RC columns strengthened with CFRP: An experimental study. Adv. Struct. Eng. 2023, 26, 168–182. [Google Scholar] [CrossRef] [Scilit]
- Li, P.; Jin, L.; Zhang, J.; Du, X. Size effect tests on axial compressive behavior of BFRP-reinforced concrete columns. Eng. Struct. 2023, 281, 115785. [Google Scholar] [CrossRef] [Scilit]
- Kim, J.K.; Yi, S.T. Application of size effect to compressive strength of concrete members. Sādhanā 2002, 27, 467–484. [Google Scholar] [CrossRef] [Scilit]
- Carpinteri, A.; Chiaia, B. Multifractal scaling laws in the breaking behaviour of disordered materials. Chaos Solitons Fractals 1997, 8, 135–150. [Google Scholar] [CrossRef] [Scilit]
- Carpinteri, A.; Chiaia, B. Embrittlement and decrease of apparent strength in large-sized concrete structures. Sādhanā 2002, 27, 425–448. [Google Scholar] [CrossRef] [Scilit]
- Lubliner, J.; Oliver, J.; Oller, S.; Oñate, E. A plastic-damage model for concrete. Int. J. Solids Struct. 1989, 25, 299–326. [Google Scholar] [CrossRef] [Scilit]
- Lee, J.; Fenves, G.L. Plastic-damage model for cyclic loading of concrete structures. J. Eng. Mech. 1998, 124, 892–900. [Google Scholar] [CrossRef] [Scilit]
- Grassl, P.; Jirásek, M. Damage-plastic model for concrete failure. Int. J. Solids Struct. 2006, 43, 7166–7196. [Google Scholar] [CrossRef] [Scilit]
- Grassl, P.; Xenos, D.; Nyström, U.; Rempling, R.; Gylltoft, K. CDPM2: A damage-plasticity approach to modelling the failure of concrete. Int. J. Solids Struct. 2013, 50, 3805–3816. [Google Scholar] [CrossRef] [Scilit]
- Xenos, D.; Grassl, P. Modelling the failure of reinforced concrete with nonlocal and crack band approaches using the damage-plasticity model CDPM2. Finite Elem. Anal. Des. 2016, 117–118, 11–20. [Google Scholar] [CrossRef] [Scilit]
- Alfarah, B.; López-Almansa, F.; Oller, S. New methodology for calculating damage variables evolution in Plastic Damage Model for RC structures. Eng. Struct. 2017, 132, 70–86. [Google Scholar] [CrossRef] [Scilit]
- Fédération Internationale du Béton (fib). Model Code 2010—First Complete Draft; fib: Lausanne, Switzerland, 2010; Volume 1, fib Bulletin No. 55. [Google Scholar]
- Amirkhani, S.; Lezgy-Nazargah, M. Nonlinear finite element analysis of reinforced concrete columns: Evaluation of different modeling approaches for considering stirrup confinement effects. Struct. Concr. 2022, 23, 2820–2836. [Google Scholar] [CrossRef] [Scilit]

Disclaimer/Publisher’s Note: The statements, opinions and data contained in all publications are solely those of the individual author(s) and contributor(s) and not of MDPI and/or the editor(s). MDPI and/or the editor(s) disclaim responsibility for any injury to people or property resulting from any ideas, methods, instructions or products referred to in the content. |
© 2026 by the authors. Licensee MDPI, Basel, Switzerland. This article is an open access article distributed under the terms and conditions of the Creative Commons Attribution (CC BY) license.