


Abstract
Unsafe behaviors by construction personnel are the primary cause of construction accidents. How to rationally allocate management resources within limited constraints is a core challenge in construction safety management. This study develops and validates a workflow framework integrating Large Language Models (LLMs) and Agent-Based Modeling (ABM), termed LLM-ABM, aimed at achieving intelligent focusing of management strategies and automated interpretation of simulation results. First, an ABM model was constructed in the context of petroleum engineering to analyze the association between different management resource allocations and the evolutionary outcomes of unsafe behaviors under this specific engineering scenario. Second, a complete response surface comprising 231 combinations with a step size of 0.05 was constructed as an evaluation benchmark. On this basis, a manually designed search framework-guided two-round iterative search flow of the LLM-ABM was developed, and ten rounds of independent comparative experiments were conducted against random search to evaluate its strategy-focusing capability. Subsequently, the simulation results were fed into the LLM, and three experts were invited to evaluate the quality of the generated reports from the perspectives of data fidelity, logical coherence, and recommendation actionability. The comparison of the four typical strategies showed that, under the current model settings, active management was associated with a lower mean unsafe personnel ratio ( = 8.05%) and a lower peak unsafe personnel ratio ( = 10.43%), while the balanced strategy was associated with maintaining late-stage average safe personnel ratio ( = 60.63%). In terms of strategy focusing, under the current discrete grid with a step size of 0.05 and fixed ABM model settings, the Top-10% hit rate of LLM-ABM reached 20.00%, numerically higher than the 9.50% of random search. Moreover, the final selected strategies exhibit better global rankings on the discrete grid with lower variance. Although this difference did not reach statistical significance due to the limited number of trials, the large effect size preliminarily suggests that LLM-ABM has the potential to focus search resources on high-quality strategy regions. Regarding report generation, expert evaluations yielded scores of 0.95 for data fidelity, 0.87 for logical coherence, and 0.85 for recommendation actionability. This study preliminarily demonstrates that the LLM-ABM workflow possesses the potential to focus search on high-quality strategy regions under a limited budget, as well as the feasibility of transforming structured simulation data into traceable management recommendations, providing a complete technical pathway of “generation–evaluation–feedback–interpretation” for construction safety management in petroleum engineering.
1. Introduction
Due to the complexity, high risk, and uncertainty of their work environments, large-scale engineering projects have become high-incidence areas for industrial safety accidents [1,2]. Extensive accident investigations indicate that the unsafe behavior of construction personnel is the most direct and critical cause of accidents [3]. To effectively curb unsafe behavior, managers typically adopt different resource allocation strategies for managing such behavior. In theory, a rational combination of these strategies can achieve synergistic suppression of unsafe behaviors [4]. However, in practice, resources are always limited. How to identify the optimal combination of management strategies under given resource constraints to maximize safety performance remains a core challenge to be addressed in the field of construction safety management.
In recent years, Agent-Based Modeling (ABM) has been widely applied to simulate the dynamic evolution of construction personnel behavior [5,6,7]. ABM can capture individual heterogeneity, social interactions, and environmental feedback, providing a powerful computational experimental tool for evaluating the effectiveness of different management strategies. However, existing research still has three significant shortcomings. First, the coverage of the strategy space is incomplete. In most studies, management scenarios are predetermined based on expert experience and are limited in number, failing to systematically explore the entire strategy parameter space. Consequently, researchers find it difficult to grasp the global structure of strategy effectiveness and are prone to judgments that fall into local optima [8]. Second, result interpretation relies heavily on manual effort. The massive volume of data output from simulations is typically analyzed statistically and summarized qualitatively by humans. This process is not only inefficient but also susceptible to subjective bias, making it difficult to achieve large-scale, automated, and reproducible strategy evaluation [9]. Third, there is a lack of systematic evaluation of the strategy search process. Existing research mostly focuses on “whether a particular strategy is effective”, while overlooking the more practically valuable question of “how to efficiently find a good strategy within a limited budget” [10].
Large Language Models (LLMs), with their powerful natural language understanding and generation capabilities, have demonstrated great potential in knowledge reasoning, solution design, and other domains [11,12]. Theoretically, an LLM can serve as a “strategy generator”, iteratively proposing new candidate strategies based on historical feedback. However, the output of an LLM is essentially semantic inference, lacking precise numerical validation of complex system behaviors [13]. In contrast, while ABM can provide reliable quantitative evaluation, it lacks an automated mechanism for strategy generation and result interpretation. Therefore, combining the semantic generation capability of LLMs with the numerical evaluation capability of ABM to construct a workflow framework of “generation–evaluation–feedback” holds significant theoretical value and practical promise. Nevertheless, existing research has yet to establish a verifiable closed-loop workflow, with two key gaps remaining. First, there is a lack of empirical studies that quantitatively evaluate the strategy-focusing capability of the LLM. Second, there is insufficient assessment of whether an LLM can generate explanatory reports based on structured simulation results. To address these challenges, this study aims to answer the following three core research questions:
RQ1: Under a fixed risk environment, what dynamic evolution of unsafe behavior among construction personnel corresponds to different management resource allocations?
RQ2: Can the LLM-ABM workflow, synergistically constituted by human-designed search rules and LLM semantic reasoning, focus search on high-quality strategy regions through iterative feedback?
RQ3: Can the LLM generate numerically accurate and traceable explanatory reports and management recommendations based on structured simulation results?
The main contributions of this study are as follows:
(1) Theoretical contribution: This study proposes a dual role for LLMs within a workflow framework—serving as a “candidate strategy generator” for strategy focusing and as a “simulation result interpreter” for generating explainable reports. The former reveals the internal mechanism by which, under the guidance of a human-designed search framework, the LLM achieves strategy focusing through semantic understanding and simulation feedback, distinguishing it from traditional numerical optimization methods. The latter validates the feasibility of an LLM transforming structured simulation data into traceable management recommendations. The contribution of this study lies not in “optimization efficiency surpassing numerical methods,” but in the fact that “the LLM can achieve strategy focusing through semantic understanding and simulation feedback alone, under conditions of zero training and zero hyperparameter tuning”—a fundamentally different paradigm from numerical methods that require extensive parameter tuning or training.
(2) Methodological contribution: This study constructs a workflow framework integrating LLMs and ABM (LLM-ABM), realizing a workflow ranging from strategy generation to report generation, and establishes a dual-dimensional evaluation system encompassing focusing process indicators and explanation quality indicators.
(3) Practical contribution: This study provides a deployable decision support tool for engineering safety management. It validates the effectiveness of the proposed framework in rapidly focusing on high-quality strategy regions under limited computational budgets and automatically generating traceable simulation explanation reports, offering a complete technical pathway of “generation–evaluation–feedback–interpretation” for construction safety management in the field of petroleum engineering.
It should be made clear that the research objective of this study is not to propose a more efficient numerical optimization algorithm than genetic algorithms (GAs) and Bayesian optimization (BO), but rather to explore a lightweight search paradigm centered on semantic understanding. The core hypothesis of this paradigm is that, under conditions of limited budget, zero training, and zero tuning, the LLM can leverage its semantic understanding of domain problems and its natural language parsing of simulation feedback to achieve directional and interpretable strategy search. This paradigm fundamentally differs from classical numerical optimization methods in philosophy—the former relies on semantic reasoning, while the latter depends on mathematical optimization; the former pursues interpretability and human–machine collaboration, while the latter pursues convergence speed and precision. Each paradigm has its own applicable scenarios, rather than a simple substitution relationship. This study adopts random search as the baseline precisely to examine, under the cleanest conditions, the core proposition of “whether semantic understanding can bring incremental value beyond uninformed search.”
2. Literature Review
2.1. Construction Risks and Unsafe Behavior
Construction activities typically take place in open, dynamic, and highly coupled working environments, where factors such as geological conditions, climate change, and personnel turnover collectively amplify the uncertainty of safety management [14,15]. Existing research generally agrees that unsafe behavior of construction personnel is a significant direct cause of construction accidents. However, its formation is not determined by a single factor but results from the interplay of organizational systems, safety training, equipment and environmental conditions, and individual cognition [16,17,18]. These studies indicate that construction safety behavior exhibits significant agent heterogeneity and contextual dependence, making it difficult for any single management measure to stably explain or control unsafe behavior.
From the perspective of management mechanisms, construction safety measures can be categorized into different types. Based on the point at which safety measures intervene in the behavioral chain, current safety management measures are mainly classified into three categories, namely passive, preventive, and active. For example, passive measures primarily rely on supervision and inspection, penalty for violations, and post-accident correction, which can constrain explicit violations in the short term, but their effectiveness often depends on enforcement intensity and inspection frequency. Preventive measures mainly include safety training, equipment maintenance, work permits, risk pre-control, and digital monitoring, functioning to reduce the probability of unsafe behavior by improving knowledge, skills, equipment, and site conditions [19,20]. Active measures enhance workers’ self-discipline and safety participation awareness through safety culture, incentive mechanisms, leadership, and peer communication [21,22]. These three types of measures differ significantly in their mechanisms of action, timeliness, and resource consumption. Passive measures take effect quickly but address symptoms rather than root causes; preventive measures require long-term investment but can fundamentally reduce risks; active measures produce lasting effects by changing the organizational culture. How to achieve a rational allocation of these three types of measures under limited resource constraints remains a core challenge to be addressed in the field of construction safety management.
2.2. Application of ABM in Construction Safety Research
ABM provides a suitable computational experimental tool for analyzing unsafe behavior of construction personnel. ABM starts from micro-level individual behaviors by representing workers, managers, site conditions, and interaction rules as heterogeneous agents and their behavioral mechanisms, thereby simulating how individual decision-making, social interactions, and environmental feedback collectively generate macro-level safety performance. In recent years, ABM has been employed to analyze the impact of construction safety management behaviors, on-site risk environments, and intervention strategies on worker safety behavior [23,24,25]. However, existing ABM studies still face the challenge of insufficient exploration of the strategy space. Most ABM studies on construction safety typically predetermine a small number of management scenarios based on expert experience and then compare the simulation results of these scenarios. While this approach helps to elucidate the mechanisms of typical strategies, it makes it difficult to grasp the global structure of the complete strategy space. When there are many strategy variables, the number of parameter combinations expands rapidly as the number of dimensions increases, making exhaustive enumeration prohibitively costly. Therefore, how to identify key parameter combinations and locate high-performance strategy regions within a limited simulation budget has become an important issue in ABM research [26].
Beyond strategy search, the interpretation and validation of ABM results also pose key challenges in construction safety applications [27]. The output of ABM typically consists of numerical sequences and evolution diagrams. Although these outputs offer the advantages of reproducibility and quantifiability, their managerial implications often still require manual summarization. Furthermore, the heterogeneity of agents and the complex parameter structure further increase the difficulty of model interpretation [28,29,30].
2.3. Application of LLMs in Engineering Management
LLMs have demonstrated strong capabilities in natural language understanding, text generation, knowledge extraction, and decision support, providing new tools for processing unstructured data in engineering management [31,32,33]. In the Architecture, Engineering and Construction (AEC) domain, LLMs have been applied to tasks such as construction text classification, specification question answering, risk identification, and accident report analysis [34,35,36,37]. These studies indicate that the strengths of LLMs lie primarily in semantic understanding, knowledge organization, and human–computer interaction, rather than directly replacing numerical modeling of complex engineering systems. At the application level, LLMs have begun to enter construction safety and risk management tasks. For example, relevant studies have employed GPT or lightweight LLMs for construction safety training, accident report classification, and personalized safety knowledge dissemination, demonstrating that LLMs can assist engineering managers in processing unstructured text, generating management recommendations, and improving information acquisition efficiency [38,39,40,41].
Despite the outstanding performance of LLMs in text processing, their deep integration with simulation models remains in its infancy [42,43]. Existing work can be broadly divided into two categories. One category primarily uses LLMs to generate text reports but fails to form a linkage with the operation, feedback, and optimization processes of numerical simulations, resulting in insufficient quantitative verification of strategy effectiveness [44]. The other category attempts to embed LLMs into the simulation workflow, or even use them to replace certain modeling or decision-making components. However, such approaches still face issues including physical consistency, numerical reliability, reproducibility, and insufficient validation standards [45]. At present, relevant research has not yet established a complete and verifiable closed loop encompassing LLM-based strategy generation, simulation evaluation, result feedback, and iterative optimization, and few studies have incorporated ABM simulation to conduct the aforementioned examination [46].
2.4. Research Gaps and This Study’s Positioning
Although existing studies have made certain progress, shortcomings remain in the following aspects. First, the resource allocation of construction safety management strategies lacks a systematic optimization basis. Previous studies have recognized the differences in mechanisms and timeliness among passive, preventive, and active measures, but most remain at the level of qualitative discussion or validation of individual strategies, without conducting systematic evaluation and optimization of different resource allocation combinations within a unified simulation framework. Second, ABM faces the dual challenge of strategy space exploration and result interpretation in construction safety research. On the one hand, existing studies mostly rely on expert experience to preset a small number of scenarios, making it difficult to locate high-performance regions within the complete strategy space. On the other hand, the managerial implications of ABM outputs still require manual summarization, lacking an automated and traceable result interpretation mechanism. These two constraints hinder the transformation of ABM from a research tool to a decision support tool. Third, the deep integration of LLMs with simulation models remains in its infancy. Current applications of LLMs in engineering management are primarily focused on text analysis and knowledge-based question answering, without forming a collaborative closed loop with numerical simulation, and there is a particular lack of empirical research on strategy search efficacy and result interpretability.
To address the aforementioned research gaps, this study proposes and validates an LLM-ABM framework integrating ABM simulation and LLM. This study takes a petroleum pipeline engineering project in Abu Dhabi as the case background and conducts simulation experiments under fixed risk factor weights. Therefore, the conclusions drawn from this study are applicable to this specific engineering scenario and similar static risk environments. When extending these findings to other construction scenarios, a comprehensive assessment incorporating site-specific conditions is necessary. Furthermore, it should be noted that the purpose of introducing LLM-ABM for strategy search in this study is not to compete with classical numerical optimization methods such as GAs or Reinforcement Learning (RL) in terms of optimization efficiency, but rather to explore an intelligent decision-making paradigm endowed with semantic understanding and generation capabilities. Methods such as GAs and RL possess advantages in numerical search within parameter spaces, but they remain essentially black-box optimization approaches, lacking the ability to semantically understand strategies and integrate domain knowledge, and their outputs are difficult to directly translate into executable management plans. In contrast, LLM-ABM can comprehend high-level strategic semantics such as “strengthening active management” or “increasing preventive investment,” integrate domain knowledge to generate interpretable plans, and possess the potential for human interaction, laying the foundation for human–machine collaborative decision-making. Therefore, this study adopts random search as the baseline method, aiming to validate the knowledge-guided strategy-focusing capability of LLM-ABM, rather than pursuing extreme numerical optimization efficiency.
3. Methodology
3.1. Overall Research Framework
This study takes a petroleum pipeline engineering project in Abu Dhabi as the case background and proposes an LLM-ABM workflow framework designed to achieve intelligent focusing of management strategies and interpretable output of simulation results. As shown in Figure 1, the framework comprises four progressive phases. The first phase establishes domain understanding; the second phase provides a global reference; the third phase validates the focusing capability, and the fourth phase examines the explanatory capability. The overall framework balances the reliability of the simulation model, the semantic flexibility of the LLM, and the rigor of evaluation, providing a complete technical pathway for the intelligent generation and interpretation of construction safety management strategies.
Figure 1.
Research framework.
(1) Typical Strategy ABM Simulation. Under a fixed environment, four strategies—balanced management, passive management, preventive management, and active management—are selected for simulation. First, the dynamic evolution curves of unsafe behavior of construction personnel in a typical single simulation are presented to reveal the micro-level behavioral characteristics under different strategies. Subsequently, each strategy is repeated 30 times, and the mean and standard deviation of key metrics are calculated to eliminate randomness and uncover systematic patterns. This phase aims to validate the behavioral rationality of the model, reveal the relationship between resource allocation and behavioral evolution, and provide a domain knowledge benchmark for subsequent LLM experiments.
(2) Complete Response Surface Construction. All management combinations are traversed with a step size of 0.05. Each combination is run under 30 random seeds, and evaluation metrics are recorded, thereby constructing a complete mapping database of “management strategies and risk outcomes,” known as the complete response surface. This response surface serves a dual function. First, it reveals the global mapping relationship between management resource allocation and risk levels, identifying optimal strategy regions and key trade-offs on the discrete grid. Second, it serves as a gold-standard reference for evaluating the LLM’s strategy-focusing capability, providing a ground truth benchmark for computing key evaluation metrics.
(3) LLM-ABM Closed-Loop Strategy Search. Under fixed risk conditions and fixed management budget constraints, the closed-loop interaction between the LLM and ABM is initiated. First, the LLM is provided with a model mechanism description, risk weights, budget constraints, and optimization objectives, and the LLM generates 10 candidate management combinations. After format validation, ABM performs simulation evaluation on these 10 strategies, and the results are fed back to the LLM in semantic form. Based on this feedback, the LLM generates 10 revised strategies, which again undergo validation and simulation evaluation. This search process involving a total of 20 strategies is repeated 10 times and compared against random search with an equivalent budget. This phase aims to quantitatively evaluate the strategy-focusing capability of the LLM within the closed-loop feedback—that is, whether it can concentrate search resources on high-quality strategy regions defined based on the current ABM model and discrete grid.
(4) LLM-Generated Simulation Result Interpretation Report. The simulation results of the 20 representative strategies generated by the LLM in Phase Three undergo structured preprocessing. These structured data are then input into the LLM under strict prompt constraints to generate natural language management analysis reports. This phase aims to evaluate the reliability of the LLM as a “simulation result interpreter” by quantifying the quality of the generated reports through metrics.
3.2. ABM of Unsafe Behavior of Construction Personnel
3.2.1. Theoretical Model of Risk Evolution
The evolution process of construction engineering risks can be divided into three stages, namely risk formation, risk amplification, and risk control. In the risk formation stage, risk sources exist at the construction site, such as equipment defects, lack of protective measures, and hazardous working environments. If managers fail to intervene in a timely manner, unsafe states will accumulate and trigger construction risk events. In the risk amplification stage, the unsafe behavior of construction personnel further exacerbates risk diffusion, producing a chain reaction. In the risk control stage, managers need to adopt both preventive and corrective measures to prevent the continued deterioration of risk events and restore the construction safety state.
To quantitatively characterize the level of construction risk, this study classifies the behavioral states of construction personnel into four types. Safe state, indicating that the construction personnel strictly comply with safety regulations; Transitional state, indicating that the construction personnel are influenced by unsafe factors at the organizational system level and exhibit a tendency toward unsafe behavior; Potentially unsafe state, indicating that under the influence of unsafe factors at the equipment management level, the construction personnel may engage in unsafe behavior; and Unsafe state, indicating that the construction personnel are currently engaging in unsafe behavior. The level of construction risk is characterized by the number of construction personnel in the unsafe state.
3.2.2. Influencing Factors of Unsafe Behavior of Construction Personnel
Based on the analysis of construction personnel characteristics, statistics of 156 petroleum engineering safety accidents, and attribution analysis of seven typical accident cases, this study identified 17 factors influencing the unsafe behavior of construction personnel from three criterion layers, as shown in Table 1. The weight of each factor was determined using the entropy weight method based on scoring data from 10 experts. The weights of the three criterion layers—organizational system, equipment management, and construction personnel—were 0.2174, 0.4907 and 0.2919, respectively. Throughout all experiments in this study, the weights of these 17 factors remained fixed to ensure that all management strategy evaluations were conducted under the same risk environment.
Table 1.
Influencing factors and weights of unsafe behavior of construction personnel.
3.2.3. Construction of the Multi-Agent Simulation Model
This study employed AnyLogic as the modeling platform and took a pipeline project in Abu Dhabi as the engineering background. Simulation experiments were conducted under fixed risk factor weights to construct a multi-agent simulation model of unsafe behavior of construction personnel. The ABM model constructed in this study is a theory-driven simulation experiment platform, rather than an exact replica of actual construction sites. The four-state classification and risk weights in the model were determined based on statistics from 156 accident cases, analysis of 7 typical incident cases, and ratings from 10 experts, reflecting the risk structure characteristics specific to a particular engineering context. However, these parameters have not yet been calibrated or validated against observational data from real construction sites. Therefore, the function of this model is to provide a controlled computational experiment environment for comparing the relative effectiveness of different management strategies under fixed assumptions, rather than directly predicting the absolute levels of unsafe behaviors in the real world. The core objective of this study is to validate the feasibility of the LLM-ABM workflow framework in strategy focusing and result interpretation, rather than to establish an accurate simulation of real-world construction safety behaviors.
- (1)
- Three Types of Management Strategies
According to the different nodes at which prevention and control measures intervene in the risk evolution process, this study classified management strategies into three types:
Passive Management (): Focuses on establishing a sound safety organization, safety systems, and safety meetings, carrying out risk prevention and control at the organizational system level.
Preventive Management (): Focuses on strengthening equipment inspection and maintenance and standardizing equipment operation, carrying out risk prevention and control at the equipment management level.
Active Management (): Focuses on safety education and training and individual safety reward and punishment systems, carrying out risk prevention and control at the construction personnel level.
The intensity of each of the three management strategies ranges from , and they satisfy the constraint = 1, representing the budget constraint under limited management resources.
- (2)
- State Evolution Mechanism
The behavioral states of construction personnel evolve under the combined influence of organizational system factors, equipment management factors, personnel factors, and the three types of management measures. The evolution mechanism is illustrated in Figure 2. This mechanism characterizes the state transition process under the interaction of multi-layer risk factors and management measures, reflecting the dynamic nature and agent heterogeneity in the formation of unsafe behavior.
Figure 2.
State evolution mechanism of construction personnel.
Safe State (): Initially, all personnel are in the safe state. After being influenced by risk factors at the organizational system level, they face two decision directions—remaining in the safe state or transitioning to the transitional state. The decision is determined by the weight of the organizational system-level factors.
Transitional State (): Personnel in the transitional state, after being influenced by risk factors at the equipment management level and passive management, face three decision directions—remaining in the transitional state, transitioning to the potentially unsafe state, or returning to the safe state. The decision is determined jointly by the weight of the equipment management level factors and the intensity of passive management.
Potentially Unsafe State (): Personnel in the potentially unsafe state, after being influenced by their own risk factors and preventive management, face three decision directions—remaining in the potentially unsafe state, transitioning to the unsafe state, or returning to the safe state. The decision is determined jointly by the weight of the construction personnel factors and the intensity of preventive management.
Unsafe State (): Personnel in the unsafe state, after being influenced by active management, face two decision directions—remaining in the unsafe state or returning to the safe state. The decision is determined by the intensity of active management.
The correspondence between the above three types of management measures and behavioral states is not arbitrarily preset but established based on the theoretical framework of construction safety management. Passive management mainly functions at the organizational system level to form behavioral norms and constraint frameworks, thereby acting on the transition state in the model, the initial stage when individuals start deviating from norms under a safe state. Preventive management targets risks related to equipment and operating environments to cut off material prerequisites for unsafe behaviors, and thus applies to the potential unsafe state, the stage where individuals possess conditions for unsafe behaviors yet have not carried them out. Active management directly focuses on construction personnel’s behavioral decisions, driving the transition from unsafe behaviors back to safe status via education, incentives and supervision, and accordingly exerts direct effects on the unsafe state. This hierarchical matching aligns with the core notion in Reason’s Swiss cheese model [47] and Heinrich’s domino theory [48] that multi-layered defenses function at different segments of the accident chain. It also matches the common classification of management measures adopted in contemporary construction safety practices [49].
- (3)
- State transition mechanism in the simulation model
The construction personnel agents include four behavioral states, namely Safe state (), Transitional state (), Potentially unsafe state (), and Unsafe state (). The model adopts the rate transition mechanism from the AnyLogic statechart, and state transitions are controlled by continuous-time transition rates.
Risk factors are categorized into three comprehensive influencing dimensions including organizational system, equipment management, and construction personnel, with corresponding transition rates as follows:
Among them, controls , controls , and controls . Three types of management variables control the transition of personnel from risk states back to the safe state:
For multiple competitive transitions from state , let:
Then, within the time interval , the probability of transitioning to state is:
The probability of remaining in the current state is:
For example, starting from the transitional state , there are two competitive transitions, and , simultaneously existing.
Therefore:
Accordingly:
Similarly, starting from the potentially unsafe state :
Active management acts on the recovery from the unsafe state:
The time unit for the simulation in this study is days, so the units of the management parameters and risk impact parameters are both . All construction personnel are initially in the safe state, the total number of agents in the model is 1200, and the simulation runs for 100 days. Furthermore, it should be noted that this study varied management parameters under a fixed risk environment, rather than conducting randomized interventions in actual construction sites. Therefore, the results reflect conditional simulated relationships under given risk weights, initial states, state transition rules, and simulation durations, and are not equivalent to causal effects in real-world engineering.
- (4)
- Statistical Metrics
To scientifically evaluate the performance of each management strategy in the multi-agent simulation, this study selected three core statistical metrics to quantitatively measure the simulation results, namely the mean unsafe personnel ratio (), the peak unsafe personnel ratio (), and the late average safe personnel ratio (). This study sets as the primary evaluation objective, and uses and as auxiliary diagnostic indicators to identify peak risk and late-stage safety status. These three metrics can be directly calculated from the time-series data of the “number of personnel in the safe state” and the “number of personnel in the unsafe state” output by the AnyLogic 8.9.9 simulation platform. The specific meaning and optimization direction of each metric are shown in Table 2.
Table 2.
Implications of ABM simulation results.
The specific calculation methods are as follows:
Mean Unsafe Personnel Ratio ()
where represents the number of personnel in the unsafe state on day . represents the total number of construction personnel. represents the simulation duration.
Peak Unsafe Personnel Ratio ()
It reflects the risk at the most severe moment. A certain strategy may have a low average risk, but if a very high-risk peak occurs midway, it is still unacceptable in engineering management.
Late Average Safe Personnel Ratio ()
This study calculates the average value of the last 20 days:
where is the number of personnel in the safe state on day .
3.3. Management Strategy Space and Response Surface Construction
3.3.1. Management Parameter Definition
Based on the three management strategies defined in Section 3.2.3, this study formalizes the management strategy space as a ternary parameter combination. Let the passive management intensity be , the preventive management intensity be , and the active management intensity be , which satisfy the following constraints:
Among them, represents the budget constraint under limited management resources, meaning that managers cannot simultaneously raise all three types of management intensities to the highest level, and must make trade-offs among them.
To enable the complete enumeration of the strategy space and facilitate parameter mapping in the subsequent AnyLogic model, this study performs discrete sampling of the three parameters with a step size of 0.05. Under the constraint that the sum is 1, there are a total of 231 discrete combinations. Therefore, the management strategy space can be expressed as:
The selection of this resolution is based on the following considerations. If the step size is too large, key strategy regions may be missed; if the step size is too small, the number of combinations will increase sharply, leading to excessively high computational costs. A step size of 0.05 achieves a reasonable balance between precision and computational feasibility, effectively revealing the global structure of the management strategy space.
3.3.2. Full Strategy Grid Simulation
To obtain the strategy effects of each management combination, this study conducted grid simulations for all 231 combinations. In the response surface pre-calculation phase, the construction risk factors and their weights were fixed, and the risk environment was not altered; only the management strategy parameters were changed. Meanwhile, the total number of construction personnel, simulation duration, initial system state, and other model parameters were kept consistent to ensure that the differences in results between different strategies originated solely from the management resource allocation methods. For each set of strategies , 30 mutually independent random seeds were used for repeated simulations in the AnyLogic multi-agent model. The simulation results of , and under the -th random seed were statistically aggregated, and the mean and 95% confidence interval (CI) of each indicator were calculated. Since each set of strategies used the same number of random repeated simulations, the impact of single-simulation randomness on strategy comparison results could be reduced.
3.3.3. Response Surface Construction
After completing the grid simulation operations for the 231 sets of management strategies, the strategy parameters and simulation statistical results of each set were integrated to construct a “management strategy-risk result” mapping database, namely the management strategy response surface. Based on the mean value of the mean unsafe personnel ratio , all strategies were sorted globally in ascending order, and the top 10% of strategies, consisting of 23 groups, were screened out to construct a Top 10% high-quality strategy set. This response surface mainly includes two roles. First, it reveals the global structure, relying on visualization methods to present the mapping correlation between management resource allocation and risk levels, accurately defining the global optimal strategy and the Top 10% high-quality strategy regions on the discrete grid, and clarifying the trade-off relationships between strategies. Second, it provides a ground truth benchmark. By taking the globally optimal value and the top 10% strategy set on the discrete grid as references, and comparing them with the LLM’s strategy search results, the strategy-focusing capability of the LLM is quantitatively evaluated.
It should be particularly noted that the response surface constructed in this study is a performance mapping based on a discrete grid with a step size of 0.05 and fixed ABM model parameters. Therefore, the so-called “global optimal strategy” is limited to the optimal solution on this discrete grid, rather than the theoretical optimum in a continuous parameter space, let alone the optimal management resource allocation in a real engineering environment. Similarly, the definition of the top 10% high-quality strategy region is entirely dependent on the current discrete grid and ABM model settings. This benchmark provides a reproducible reference for comparing the relative performance of different search methods within the same framework, but cannot be directly extrapolated as a high-quality strategy region in the real world.
3.4. LLM-ABM Strategy Generation Module
3.4.1. Core Workflow of LLM-ABM
This section proposes a strategy generation framework based on the collaboration between LLM and ABM, aiming to leverage the semantic understanding and reasoning capabilities of the LLM, in conjunction with the quantitative simulation feedback from ABM, to iteratively optimize management resource allocation strategies. As shown in Figure 3, the framework comprises six core steps:
Figure 3.
Core workflow of the LLM-ABM framework.
(1) LLM Strategy Generation: The LLM outputs candidate management parameter combinations based on a prompt containing task descriptions and constraints.
(2) Parameter Validation: Automatic validation of the format, value range, and constraint conditions of the strategies output by the LLM.
(3) ABM Simulation: The validated strategies are input into the pre-built ABM model, which executes grid simulations and calculates risk metrics.
(4) Result Feedback: The simulation results of all strategies from the previous round are fed back to the LLM as contextual information.
(5) LLM Revision: The LLM adjusts its approach based on the feedback information and generates a new round of improved strategies.
(6) Final Evaluation: All candidate strategies are aggregated, and the optimal strategy on the discrete grid is selected based on the metric values.
3.4.2. Two-Round Candidate Strategy Generation
At this stage, DeepSeek V4 Pro is adopted as the strategy generation model. Developed by DeepSeek Company, this model adopts a Mixture of Experts architecture, with a total of 1.6 trillion parameters, 49 billion activated parameters, and supports a maximum context length of 1 million tokens. Since the strategy search phase requires higher output diversity to explore a wider strategy space, the decoding temperature is set to 0.8, the nucleus sampling parameter is set to 0.9, and the presence penalty and frequency penalty are both set to 0.1, so as to balance exploration efficiency and generation quality. In each independent trial, the LLM generates a total of 20 sets of candidate strategies, completed in two rounds, and no duplication of strategies is allowed between the two rounds.
(1) First Round (Initial Exploration): In the first round, 10 sets of candidate management strategies are generated. This round is mainly used to explore the management strategy space, and the LLM can propose various candidate combinations. Each set of candidate strategies undergoes parameter validation and then enters ABM evaluation to obtain the corresponding , and .
(2) Second Round (Feedback Correction): Before the second round of generation, the parameters and simulation results of the first-round candidates are fed back to the LLM. The feedback information includes the strategy ID, three management parameters, , and . The LLM is required to summarize the experience from the first round and generate 10 new candidate combinations. The strategies generated in the second round should attempt to improve the poorly performing areas from the first round and explore uncovered potential intervals. The total simulation budget for the entire process is 20 strategies.
To ensure that the LLM’s output can be correctly executed by the AnyLogic model, this study sets four types of automated validation rules. First, duplication validation. Candidate strategies must not be duplicated with those already retained in the same round, and strategies in the second round must not be duplicated with those evaluated in the first round. Second, range validation. The three management parameters , and are required to be within the [0, 1] interval. Third, step size validation. The three parameters are required to be on a 0.05 discrete grid. Fourth, sum validation. The sum of the three management parameters is required to be 1.
3.4.3. Prompt Design for LLM
To achieve effective interaction between the LLM and ABM, this study designed two rounds of structured prompts for the LLM, corresponding to the first-round initial strategy generation and the second-round feedback-driven revision strategy generation. Table 3 summarizes the core design elements of the two rounds of prompts. The focus of the first-round prompt lies in initialization exploration. Without any prior simulation results, the LLM is required to leverage its semantic understanding of the management mechanism to generate candidate strategies covering different regions, providing diverse starting points for subsequent iterations. The second-round prompt emphasizes feedback-driven focusing. The LLM must strictly adhere to the actual simulation results of the 10 first-round strategies, identify parameter regions with good performance, conduct refined searches in their neighborhoods.
Table 3.
Comparison of two-round prompt design.
The prompt set out a basic framework for two rounds of search, which provides structural guidance for the search direction of the LLM. Within this framework, however, the LLM undertakes the critical tasks of semantic understanding and transformation. It needs to parse the numerical results returned by the ABM simulation along with their implied management implications, comprehend the specific semantic information, and translate these into concrete management parameter combinations for the next round of candidate strategies. This ability to map from semantic feedback to parameter generation is something that mere rule execution does not possess. Therefore, the strategy focusing phenomenon observed in this study is the synergistic result of the deliberately designed search framework and the semantic reasoning capability of the LLM. The core contribution of this study lies in validating the overall effectiveness of this integrated workflow, rather than proving that the LLM possesses a focusing capability independent of the search framework.
3.4.4. Random Search Baseline
To quantify the advantage of the LLM-ABM workflow in guiding strategy generation, random search was set as the baseline comparison method. Random search also generated 20 candidate strategies but did not include any feedback mechanism. The three parameters of each strategy were uniformly randomly drawn from the discrete space satisfying the constraints, and each draw was mutually independent. Random search and LLM-ABM workflow used the same ABM simulation environment and evaluation metrics, with the sole difference being whether the strategy generation relied on semantic information and iterative feedback.
This study selects random search as the baseline, rather than methods such as GAs and BO, based on the following methodological considerations. First, the core characteristic of the paradigm advocated in this study is “zero training, zero tuning, relying solely on semantic understanding and limited simulation feedback.” In contrast, GAs require designing fitness functions and selecting crossover and mutation operators, while BO requires constructing surrogate models—all of which introduce additional hyperparameters and training costs, placing them in a different category from the lightweight positioning of this study. Second, as an uninformed, parameter-free naive strategy, random search can most purely measure the incremental effect brought by the LLM-ABM through semantic understanding and feedback—any performance improvement beyond the random level can be attributed to semantic guidance. In comparison, if compared with GAs or BO, even if the LLM-ABM performs better, it would be difficult to determine whether the advantage stems from the semantic capability of the LLM-ABM or from differences in search framework design. Therefore, the experimental design of this study aims to answer the question of “whether the LLM-ABM can achieve strategy focusing superior to uninformed search through semantic understanding alone, without training or tuning,” rather than “whether the LLM-ABM outperforms classical numerical optimization methods”. The latter is an independent and important research question that requires fair and systematic comparison under the same budget, and future research can conduct systematic comparisons with more optimization methods under equivalent budgets.
3.5. LLM Report Generation Module
To convert multi-agent simulation results into understandable construction safety management information, this study set up an LLM report generation module after the LLM-ABM strategy generation. DeepSeek V4 Pro was also selected as the core generative model for this module. The model possesses capabilities in structured data parsing, professional long-text generation, and engineering scenario logical reasoning, enabling it to meet the specialized and standardized output requirements of construction safety management reports. In this study, inference was conducted via the official API, with the decoding temperature set to 0.3, the nucleus sampling parameter set to 0.8, the presence penalty set to 0.2, and the frequency penalty set to 0.2, ensuring that the output remained faithful to the original data while allowing for moderate diversity in the results.
The processing workflow of the module is as follows. First, the simulation results of the 20 strategies generated in the LLM-ABM are received, and structured data preprocessing is completed with the assistance of Python 3.12, encapsulating the simulation results in JSON format. Second, the structured simulation data together with the prompt are input into DeepSeek V4 Pro, driving the model to automatically output a natural language construction safety analysis and management report. Finally, three experts with backgrounds in construction safety management or engineering management are invited to independently score the report quality from three dimensions—data fidelity, logical coherence, and recommendation actionability—to ensure the reliability and practicality of the generated report.
3.5.1. Data Preprocessing
Each independent LLM-ABM strategy generation run serves as one reporting unit. Each run contains 20 candidate management strategies generated in the first and second rounds. The data fields for each strategy include the strategy ID, the three management parameters, the mean values and 95% confidence intervals of , and , the global ranking among the 231 response surface combinations, and whether it falls within the global Top 10% strategy region. The above computed results are encapsulated in a structured JSON format as input to the LLM.
3.5.2. Prompt Design and Output Format
To guide the LLM in generating structured and traceable management analysis reports, this study designed a dedicated prompt. The LLM receives a JSON file as input containing the complete data of the 20 strategies. The prompt explicitly requires the LLM to generate the report based solely on the input data, without recalculating or adding external information. The full prompt is shown in Table 4.
Table 4.
LLM report generation prompt.
3.5.3. Quality Evaluation of LLM-Generated Reports
To systematically evaluate the quality of management reports generated by DeepSeek V4 Pro, this study adopts an expert subjective scoring method. Three experts with backgrounds in construction safety management or engineering management were invited to form an evaluation panel. Each expert independently reviewed the full text of the LLM-generated report and the corresponding input data, and rated the report on three dimensions: data fidelity, logical coherence, and recommendation actionability. The specific evaluation criteria are shown in Table 5. To accommodate expert scoring habits while facilitating subsequent statistical analysis, a two-level conversion mechanism was employed for the scoring. Experts first assign an independent score on a 0–100 scale for each dimension, after which the raw scores are normalized to a continuous [0, 1] interval and rounded to two decimal places. The final score for each dimension is the arithmetic mean of the scores from the three experts. It should be emphasized that the expert evaluation in this study focused on the internal quality of the reports within the scope of the given simulation data, including data fidelity, logical coherence, and recommendation actionability. Since the input data originated from a simplified ABM model and was generated under a fixed risk environment, the evaluation results do not represent the practical effectiveness of the LLM-generated reports in real-world engineering contexts. The experts’ judgment of “recommendation actionability” was inevitably influenced by the degree to which they accepted the assumptions of the ABM model, which constitutes an inherent limitation of this evaluation framework.
Table 5.
Expert evaluation criteria.
4. Results
4.1. Analysis of Typical Management Strategies
This subsection simulates the evolutionary patterns of unsafe behaviors corresponding to different management resource allocations under a fixed risk environment, demonstrating the correlational relationships between management parameters and simulation outputs under the current ABM model settings. It should be noted that the findings in this subsection reflect the parameter-output mapping patterns within the model, rather than serving as direct inferences of causal effects in real-world construction environments. The experiment set the total number of construction workers at 1200 and the simulation duration at 100 days. Four typical strategies were compared, namely the balanced state, passive, preventive, and active strategies. The analysis is conducted at two levels. At the first level, single simulation results are selected to plot the dynamic evolution curves of construction personnel unsafe behaviors and to analyze the corresponding unsafe behavior evolution patterns under different management parameter configurations. In the personnel state evolution diagram, construction personnel are represented by dots. Green dots denote the safe state; yellow dots denote the transitional state; orange dots denote the potentially unsafe state; and red dots denote the unsafe state. At the second level, each strategy was replicated 30 times, and the key indicators of each metric were statistically aggregated to eliminate the randomness of a single simulation and reveal systematic patterns. Furthermore, although the ABM model specifies that all 1200 personnel are in the safe state at , agents begin evolving immediately according to the state transition rules once the simulation starts. Since data recording begins from the first simulation step and the figure only plots line charts for the safe and unsafe states, the first sampling point already captures the early dynamic state transitions. Consequently, the number of agents in the safe state is less than 1200, with the remaining agents in the transitional or potentially unsafe states. This phenomenon is entirely consistent with the model specification and does not represent a data anomaly.
4.1.1. Balanced Management Strategy
The balanced management strategy allocates management resources approximately equally to passive, preventive, and active management, with parameters set to . As shown in Figure 4, in the first 10 days of the simulation, the number of safe personnel rapidly decreased from nearly 1000 to about 700, while the number of unsafe personnel increased from nearly 0 to about 120, indicating that the system entered a stable phase after obvious adjustments. Thereafter, the number of safe personnel stabilized at around 690 to 750, and the number of unsafe personnel remained within [110, 160]. Under this strategy, was 10.55%, was 14.00%, corresponding to about 168 people. was 61.10%, corresponding to about 733 people. In the state distribution diagram, safe personnel accounted for a large proportion, while unsafe personnel were dispersed, showing no obvious group aggregation or diffusion trends, which indicates that the behavior pattern is jointly constrained by multiple management methods and does not shift in a single direction. The above results show that the balanced configuration corresponds to a low level of unsafe behavior and a high level of safety in the later stage in a fixed-risk environment, with good coordination among the three indicators.
Figure 4.
Simulation results for the balanced management strategy.
4.1.2. Passive Management Dominance Strategy
The parameter settings for the passive management dominance strategy were set to . As shown in Figure 5, the number of safe personnel continuously decreased in the early stage of the simulation, while the number of unsafe personnel rapidly increased. The system entered a high-unsafe-level plateau period after approximately day 20. Safe personnel remained at around 570 to 630, and unsafe personnel stayed in a relatively high interval of around 330 to 400 for a long time. Individuals in the unsafe state significantly increased compared with the balanced strategy. Compared with the balanced strategy, the , and of this strategy worsened by 17.45, 19.58, and 10.68 percentage points, respectively. After reaching a high level, the number of unsafe personnel did not show a continuous decline, but remained volatile throughout the late simulation stage. The results indicated that, under the current model settings, concentrating most management resources on passive measures corresponded to a sustained accumulation of unsafe behaviors. Although passive management has a necessary institutional constraint effect, its control effect as a sole dominant strategy is limited when the investment in preventive and active management is insufficient.
Figure 5.
Simulation results of the passive management dominance strategy.
4.1.3. Preventive Management Dominance Strategy
The parameter settings for the preventive management strategy were set to and . As shown in Figure 6, in the first 20 days of the simulation, the number of safe personnel decreased from nearly 1000 to about 600, and the number of unsafe personnel gradually increased to about 250. In the mid-to-late stage, safe personnel remained at around 570 to 630, and unsafe personnel generally fluctuated between 250 and 310, still showing an upward trend at the end of the simulation. Under this strategy, was 21.19%, was 26.00%, and was 49.53%. A considerable number of individuals in unsafe states and other non-safe states could still be observed in the state distribution diagram. Compared with the passive strategy, preventive management reduced by 6.81% and by 7.58%, indicating that, under this model condition, preventive resource input was associated with a lower unsafe behavior burden and peak risk. However, compared with the balanced strategy, its was still 10.64% higher, was 12.00% higher, and was 11.57% lower. Therefore, although preventive measures are superior to the passive dominance configuration, concentrating 80% of management resources on the prevention link has not yet formed an ideal overall control effect, indicating that preventive management needs to be collaboratively allocated with active behavior intervention and institutional constraints.
Figure 6.
Simulation results of the preventive management dominance strategy.
4.1.4. Active Management Dominance Strategy
The parameter settings for the active management dominance strategy were set to . As shown in Figure 7, the number of safe personnel rapidly decreased to about 600 in the first approximately 6 days of the simulation, and then stabilized at around 560 to 630. Unlike other strategies, the number of unsafe personnel increased to about 100 in the early stage but did not continue to rise. Instead, it remained at a low interval of about 80 to 120 during most of the simulation period. Under this strategy, was 8.17% and was 10.92%, with both risk indicators being the lowest among the four typical strategies. Compared with the balanced strategy, this strategy reduced by 2.38% and by 3.08%. The results showed that, under the current model conditions, increasing active management input was associated with lower unsafe states. It should be noted that the of this strategy was 50.35%, which is 10.75% lower than that of the balanced strategy. This result reflected that active management tended to be associated with controlling the primary objective , while the balanced strategy was associated with maintaining late-stage safety status.
Figure 7.
Simulation results of the active management dominance strategy.
4.1.5. Comparison of 30 Independent Simulation Results
To reduce the contingency of single random simulation results, this study conducted 30 independent repeated simulations for the four strategies, under fixed conditions, obtaining a total of 120 sets of valid simulation results. Figure 8 summarizes and displays the mean values and 95% confidence intervals of the three core indicators. In terms of , the active strategy had the lowest mean at 8.05%. The balanced strategy was 10.43%, the preventive strategy was 21.51%, and the passive dominance strategy was the highest at 28.02%. The 95% confidence intervals of the four strategies are essentially completely separated, indicating that, under the current ABM model settings, the simulation outputs corresponding to different management strategies are distinguishable within the model. This distinguishability arises from the structural relationship between management parameters and state transition rates embedded in the model rules, reflecting the internal consistency of the model, rather than serving as a direct inference of strategy effectiveness in the real world. showed a ranking relationship basically consistent with . The active strategy had the lowest at 10.43%; the balanced strategy was 13.12%; the preventive dominance strategy was 26.16%; and the passive strategy was 33.66%. This result reflected that increasing active management intensity was associated with reducing the cumulative level and peak magnitude of unsafe states during the simulation process. In contrast, the balanced strategy had the highest with a mean of 60.63%, and its 95% confidence interval was 60.40–60.86%. The means of the active, passive, and preventive strategies were 50.13%, 49.80%, and 49.69%, respectively, all of which were significantly lower than the balanced strategy. Among them, the confidence intervals of the latter three overlapped, indicating limited differences in their ability to maintain the safety state in the later stage. Under the current model settings, the active management strategy yields the lowest values of and , while the balanced strategy has an advantage in maintaining late-stage safety status. This ranking reflects the correlation pattern between management parameters and output indicators under the model rules, and its generalization to real-world construction environments requires further validation with field data.
Figure 8.
Comparison of three core indicators for four management strategies under 30 independent simulations.
To further understand the sources of the above differences, it is necessary to examine the relationship between management intensity allocation and simulation results. If the rankings of and are completely determined by the direct action relationship between active management and the unsafe state in the model structure, the effects of different strategies should converge under identical active management intensity. However, the comparison results in Figure 8 do not support this inference. The preventive-dominated strategy and passive-dominated strategy adopt exactly the same active management intensity, with . Nevertheless, the former yields a value of 21.51%, while the latter reaches 28.02%, representing a difference of 6.51 percentage points and their 95% confidence intervals are essentially completely separated. Their values differ by approximately 7.50 percentage points. This result reflected that, even when active management input remained unchanged, the resource allocation trade-off between preventive and passive management was still associated with changes in the simulation results. Therefore, under the current model settings, the ranking differences among the four strategies in terms of and were associated not only with the effect of active management intensity, but also with the interaction effect between preventive and passive management.
4.2. LLM-ABM-Based Simulation Strategy Focusing
This section takes the complete management strategy response surface as the reference standard to analyze the strategy-focusing capability of the LLM under a limited candidate budget, and to examine whether ABM simulation feedback can guide the LLM to progressively focus on high-quality management strategy regions. The complete response surface is used to describe the performance distribution of all feasible management resource allocations; the spatial positions of the LLM’s two-round candidate strategies are used to illustrate the changes in search direction; and the results of 10 independent trials are used to quantify the stability and focusing capability of the strategy search in the LLM-ABM workflow.
4.2.1. Complete Response Surface Display
Under the conditions of fixed risk factors, 1200 construction personnel, and a 100-day simulation duration, 231 sets of discrete strategies satisfying the budget constraints were simulated 30 times each, resulting in a total of 6930 sets of simulation records. Figure 9a shows the ternary heatmap of the 231 strategies, where the color on the response surface represents . Colors closer to yellow indicate a lower , and colors closer to purple indicate a higher . The low- regions are concentrated in combinations of high active, low passive, and moderate preventive management, indicating that this configuration has a superior overall control effect. The parameter configuration of the global optimal strategy on the discrete grid is , with its at 7.46%, at 9.66%, and at 51.07%. The top 23 strategies in this study’s ranking are defined as the Top 10% high-quality region, with the at the ranking boundary being approximately 8.03%. Therefore, the Top 10% strategies are mainly concentrated in the local region of high active management and low passive management. Compared with the strategy with the lowest , the recommended compromise strategy configuration is , which ranks 5th in while maintaining a higher .
Figure 9.
Complete response surface ternary heatmap and top 10% strategy distribution.
Figure 9b further demonstrates the performance of the Top 10% strategies in terms of and . The results show that even in the low− region, there is still a certain trade-off between different strategies in terms of peak risk and the safety state in the later stage. The complete response surface not only provides a global benchmark for candidate strategy evaluation but also offers a reference standard for verifying the ability of LLM-ABM to focus on high-quality strategy regions.
4.2.2. LLM-ABM Strategy Focusing Results
To demonstrate the search evolution of the LLM under the feedback of ABM, this study selected the 10th round of experiments as a representative case (Table 6). In the first iteration of this round, the optimal strategy had a value of 7.94%, ranking 19th globally. In the second iteration, the optimal strategy’s value decreased to 7.46%, corresponding to the global 1st rank in the complete response surface. Therefore, the 10th round illustrated both the performance improvement and the strategy space focusing process from the first to the second iteration. Figure 10 visualizes the data from Table 6. As shown in Figure 10a, the 10 candidate strategies in the first iteration were widely distributed, with an average configuration of . Their values ranged from 7.94% to 16.49%, and only one strategy fell within the global Top 10% region. The optimal strategy in the first iteration had a configuration of . Based on the ABM simulation feedback, the LLM adjusted its management intensities in the second iteration. The candidate strategies notably converged toward the high-active, low-passive region, with the average configuration shifting to . The active management intensities of the 10 candidate strategies in the second iteration all fell between 0.50 and 0.70, and the value range narrowed to 7.46−9.82%. The number of strategies entering the Top 10% region increased from one in the first iteration to five in the second iteration. The optimal strategy in the second iteration had parameters of .
Table 6.
Simulation results of strategies generated by LLM-ABM in the 10th round.
Figure 10.
Ternary heatmap of the LLM-ABM method and distribution of Top 10% strategies.
The spatial distribution changes described above indicate that the first iteration primarily undertook broad exploration, while the second iteration narrowed down the search scope based on ABM feedback and converged toward the low- region. It should be noted that this figure is merely a representative visualization of a single round, intended primarily to illustrate the search trajectory of the LLM. The overall performance of the LLM should be evaluated based on the statistical results of the 10 independent trials.
4.2.3. Quantitative Assessment of Focusing Capability
To eliminate the randomness of single-round test results, this study carries out 10 rounds of independent comparative experiments. For the LLM-ABM method, each experimental round includes two candidate generation cycles. Ten strategies are generated per cycle, resulting in a total of 20 candidate strategies evaluated per round. For the random search baseline, 20 strategies are directly sampled from the pool of 231 budget-feasible strategies per round, with no feedback adjustment mechanism. Both methods are assigned exactly the same single-round candidate evaluation budget.
Figure 11 demonstrates the results of the two search methods from the cross-round distribution perspective. The average final and of LLM-ABM are slightly lower than those of random search, while LLM-ABM performed better in terms of and Top-10% strategy hit rate. Meanwhile, LLM-ABM showed smaller result fluctuation, proving it has reliable ability to focus on high-quality strategy regions under limited candidate budgets. As shown in Table 7, LLM-ABM achieved , lower than obtained for random search. The of LLM-ABM was , versus of random search, which is consistent with the performance trend of . The of LLM-ABM was , higher than obtained for random search.
Figure 11.
Comparison of results between LLM-ABM and random search over 10 independent trials.
Table 7.
Comparative results of 10 independent trials between LLM-ABM and random search.
A further analysis was conducted on the performance comparison of the Top-10% strategy hit rate between the two methods, as shown in Table 8. The Top-10% strategy hit rate is defined as the ratio of the number of candidate strategies that fall into the global Top-10% region of the complete response surface to the total number of candidate strategies in each independent trial. The statistical comparison was conducted based on independent trial rounds, with both LLM-ABM and random search comprising 10 rounds of trials. Results are expressed as mean ± standard deviation. The 95% confidence interval was calculated for the mean difference in hit rates between the two methods, with values derived from LLM-ABM minus random search. Between-group differences were examined using a two-sided Welch’s -test, and exact permutation tests were performed to obtain permutation -values. Hedges’ was also reported as a standardized effect size for robustness verification under small sample conditions.
Table 8.
Comparison of Top-10% strategy hit rates between LLM-ABM and random search.
In the 10 independent trials, the Top-10% strategy hit rate for LLM-ABM was 20.00% ± 14.53%, compared with 9.50% ± 9.26% for random search, with an observed mean difference of 10.50 percentage points. The Welch’s two-sided test, using trial rounds as the statistical unit, did not show a significant difference (); the results of the two-sided exact permutation test also did not reach the statistical significance level (). The 95% confidence interval for the mean difference was −1.10 to 22.10 percentage points, with Hedges’ = 0.83. Although statistical significance did not reach the conventional threshold and the confidence interval was wide, the large effect size combined with the point estimate increase in hit rate preliminarily suggests that this method may have the potential to focus search resources on high-quality regions. However, limited by the number of trials, the current results should be regarded as preliminary experimental observations under a limited budget, which are insufficient to support a definitive conclusion that its hit rate is significantly higher than that of random search, and further validation through larger-scale trials in the future is warranted.
4.3. LLM-Generated Simulation Result Interpretation Report
4.3.1. Representative LLM-Generated Interpretation Report Example
To verify the LLM’s ability to generate interpretable management analysis reports based on simulation results, this section took the 10th round of the experiment as an example and used the simulation results of the 20 candidate strategies generated by the LLM as input. The input data included the information from Table 6 and Table 9. After being encapsulated in a structured JSON format, the aforementioned data were fed into the LLM. The representative analysis report output by the LLM is shown in Table 10. The report accurately identified the optimal strategy as R2-09 and pointed out its key information. The key findings section summarized the common characteristics of the top 3 strategies and the typical characteristics of the poorly performing strategies, while the management recommendations suggested prioritizing increased investment in active management resources accordingly. The entire report was logically clear and accurate in data citation, demonstrating that the LLM possesses the ability to extract patterns from multi-dimensional simulation data and generate structured and highly readable decision support information.
Table 9.
The 95% confidence intervals of simulation indicators for strategies generated in the 10th round.
Table 10.
LLM-generated management strategy analysis report (representative output from the 10th round).
4.3.2. Expert Evaluation
To assess the quality of the management reports generated by the LLM, this study adopted an expert subjective scoring method. Three experts with backgrounds in construction safety management or engineering management were invited to form an evaluation panel. Experts A and C were researchers in engineering management, while Expert B was an industry engineer with frontline construction safety management experience. Each expert independently read the full LLM-generated report and the corresponding input data, and scored the report on three dimensions: data fidelity, logical coherence and recommendation actionability. A two-level conversion mechanism was adopted for scoring, and the results are shown in Table 11. In terms of data fidelity, the scores from the three experts were 0.95, 0.92 and 0.97, with an arithmetic mean of 0.95, indicating that the numerical values and strategy IDs in the report were consistent with the input JSON data, with no fabrication, tampering, or omission detected. In terms of logical coherence, the expert scores were 0.87, 0.84 and 0.90, with an arithmetic mean of 0.87, suggesting that the logical relationships among the report sections were clear and the findings and conclusions were reasonable. In terms of recommendation actionability, the scores were 0.85, 0.82 and 0.88, with an arithmetic mean of 0.85, reflecting that the management recommendations were specific, actionable, and supported by data. In summary, the average scores of the LLM-generated reports across the three evaluation dimensions were no less than 0.85, validating the reliability of the generated content in terms of data accuracy, logical reasonableness, and practical applicability.
Table 11.
Expert evaluation results.
5. Discussion
5.1. Theoretical Contributions
The theoretical contributions of this study are mainly reflected in the following three aspects. First, this study proposes the role of LLMs as candidate strategy generator and evaluates the concept of strategy-focusing capability. Unlike numerical optimization methods such as GAs and RL, LLMs generate candidate strategies by leveraging semantic understanding capabilities and self-correct through iterative feedback without relying on gradients or population evolution. This study introduces for the first time the concept of “strategy-focusing capability” to characterize the mechanism by which, under the synergistic effect of a human-designed search framework and LLM semantic reasoning, the LLM-ABM closed-loop feedback process concentrates search resources on high-potential strategy regions. It should be emphasized that “focusing” here does not refer to competing with numerical optimization methods in terms of search efficiency, but rather refers to the ability of the LLM-ABM to achieve directed search superior to uninformed random search under conditions of zero training, zero tuning, and reliance solely on semantic understanding and limited simulation feedback. This capability holds unique value in the following scenarios. When the optimization objective is difficult to formulate mathematically, the LLM can understand high-level semantic goals and generate corresponding parameters. When domain knowledge needs to be integrated, the LLM can incorporate empirical rules into the search process. When an interpretable search process is required, the LLM can provide natural language justifications for strategy adjustments. Therefore, the “focusing” validated in this study represents a semantically driven search paradigm, rather than an improvement in numerical efficiency. The experimental results show that, under the discrete grid with a step size of 0.05 and the current ABM model settings, the LLM-ABM framework achieves a Top-10% strategy hit rate of 20.00%, which is numerically higher than the 9.50% achieved by random search. This preliminarily demonstrates the framework’s potential to focus search resources on high-quality strategy regions defined based on the discrete grid and the model under a limited budget. It should be noted that the “high-quality strategy region” here is defined based on the ranking of the metric derived from the current ABM model, reflecting the model’s internal risk assessment criteria rather than the absolute level of safety performance in the real world. Although this difference did not reach the conventional threshold for statistical significance, the large effect size provides valuable clues for subsequent research. Second, validating the feasibility of using the LLM as an interpreter of simulation results. Addressing the bottleneck where ABM outputs are rich in information but difficult to distill into management insights, this study applies the LLM to the automatic interpretation of structured simulation data for the first time. An LLM-based automated report generation framework is proposed, along with a three-dimensional evaluation system encompassing data fidelity, logical coherence, and recommendation actionability. Through expert evaluation, the framework’s ability to generate logically coherent reports with actionable recommendations within the scope of simulation data is validated. This framework offers a feasible pathway for converting simulation results into structured decision-support text, though its applicability in real-world engineering contexts warrants further investigation. Third, this study constructs a closed-loop paradigm spanning strategy generation, simulation evaluation, result feedback, iterative optimization, and report generation. Existing research on the integration of LLMs and simulation models predominantly features unidirectional applications, lacking bidirectional feedback. This study realizes a verifiable closed-loop interaction between LLMs and ABM for the first time, and establishes a dual-dimensional evaluation system encompassing strategy focusing and interpretation quality. This paradigm provides a referable technical pathway and evaluation framework for subsequent research, and contributes to expanding the application direction of “AI for Engineering Management.”
5.2. Key Findings and Managerial Implications
Through systematic experiments, this study obtained the following three key findings. First, under the fixed risk environment defined by this model, different management resource allocations correspond to different evolutionary patterns of unsafe behaviors. Comparison of the four typical strategies showed that the active management strategy corresponded to the best performance in controlling the average proportion of unsafe personnel and peak risk, while the balanced strategy corresponded to an advantage in maintaining late-stage safety status. Both the passive and prevention strategies were inferior to the balanced strategy across all indicators. This result reflected that shifting management resources toward active measures was associated with lower cumulative levels of unsafe behaviors, but completely neglecting certain types of measures was associated with degradation of late-stage safety status. Second, under the current discrete grid and ABM model settings, the LLM-ABM demonstrates a certain potential for strategy focusing under a limited budget. Over 10 independent trials, the Top-10% strategy hit rate of LLM-ABM was 20.00%, which was numerically higher than the 9.50% of random search, and the final selected strategies achieved better global rankings with smaller fluctuations. In the case of the 10th round, after broad exploration in the first round, the LLM focused its search on high-active, low-passive regions in the second round based on simulation feedback, reducing the value of the optimal strategy from 7.94% to 7.46%. This case preliminarily demonstrates that the LLM can achieve strategy focusing within a manually designed two-round search framework by leveraging semantic understanding of simulation feedback. The concentration of second-round strategies toward regions with high active measures and low passive measures benefits both from the directional guidance of the search framework and from the LLM’s ability to semantically parse feedback information and transform it into parameter adjustments. It should be noted that the aforementioned difference in hit rates did not reach statistical significance. The current results should be regarded as preliminary observations under a limited number of trials, warranting further validation through larger-scale experiments. Third, LLMs can generate high-quality, traceable management analysis reports based on structured simulation data. Expert evaluation showed that the reports achieved high scores across all three dimensions of data fidelity, logical coherence, and recommendation actionability, accurately identifying the optimal strategy, summarizing key findings, and proposing specific recommendations without fabricated values or logical contradictions, demonstrating that LLMs can transform abstract simulation data into decision-making references with engineering insight.
Based on the above findings, this study proposes the following managerial implications. First, based on the current model results, under similar fixed risk environments, it is recommended to prioritize increasing active management resource input. Both the typical strategy analysis and the full response surface analysis consistently indicate that increasing active management intensity is associated with reducing both the burden of unsafe behaviors and peak risk. With limited resources, managers can prioritize active measures while maintaining moderate preventive inputs, so as to balance risk control and late-stage safety maintenance. Second, leverage the LLM-ABM framework to assist strategy decision-making. Traditional decision-making often relies on experience and intuition, making it difficult to locate optimal configurations within the complete strategy space. This framework can rapidly explore the strategy space, focus on high-quality regions, and generate interpretable reports within a limited budget, providing data-driven references for managers. In project contexts characterized by resource constraints and tight schedules, the strategy formulation approach supported by this framework corresponds to higher efficiency and stronger scientific rigor. Third, emphasize the interpretability of simulation results. Complex simulation outputs are often difficult for frontline managers to directly understand. This study demonstrates that LLMs can serve as a “translation bridge” between simulation models and managers, converting numerical results into structured and traceable management recommendations. This holds significant reference value for advancing simulation tools from research toward engineering practice.
5.3. Limitations
Although this study has achieved preliminary results, the following limitations remain. First, insufficient validation of the model’s empirical validity. The ABM model in this study was constructed based on statistics from 156 accident cases, analysis of 7 typical incident cases, and ratings from 10 experts, and its numerical stability was demonstrated through 30 repeated simulations. However, this stability reflects the internal consistency of the model, rather than its alignment with the real world. The four-state classification, risk weights, and state transition rates in the model have not yet been calibrated or validated against observational data from real construction sites. Therefore, the patterns identified in this study are strictly confined to the current model assumptions and parameter settings, and should not be directly inferred as causal effects in real-world construction environments. These findings should be regarded as quantitative regularities generated under specific model conditions, providing theoretical hypotheses for subsequent empirical validation, rather than definitive conclusions about the effectiveness of real-world management strategies. Second, the limitation of the baseline method. This study only employed random search as the baseline for comparison and did not conduct systematic comparisons with classical numerical optimization methods. Although the theoretical positioning of this study was not to compete with these methods in terms of search efficiency, and random search effectively reflected the incremental effect of LLM’s semantic guidance, the lack of comparison with mainstream optimization methods limited the comprehensive evaluation of the relative performance of the LLM-ABM framework. Therefore, the current findings should be understood as preliminary evidence of the LLM-ABM’s performance relative to uninformed search under a limited budget, and its positioning among a broader range of optimization methods remains to be investigated in future research. Third, the limited number of trials and the limitations of statistical inference. This study conducted only 10 independent trials when evaluating the strategy-focusing capability of LLM-ABM. Although the Top-10% strategy hit rate of LLM-ABM was numerically higher than that of random search, neither the Welch’s -test nor the exact permutation test reached the conventional threshold for statistical significance. The small sample size limited the statistical power, preventing definitive conclusions regarding the direction and magnitude of this difference. Therefore, the current results should be regarded as preliminary experimental observations under a limited budget, rather than confirmatory evidence of the LLM-ABM’s focusing ability. Future research should increase the number of independent trials and adopt a more rigorous statistical inference framework to more reliably evaluate the performance advantage of LLM-ABM over random search. Fourth, the limitations of the expert evaluation metrics. The evaluation of “recommendation actionability” in the LLM-generated reports in this study relies on the experts’ subjective judgment of the simulation text. Since the prompt constrains the LLM to use only the input data, the “actionability” of the reports is essentially co-determined by the assumptions of the ABM model, the subjective perceptions of the experts, and the language quality of the LLM. Therefore, the evaluation results reflect the internal consistency of the reports within the simulation framework, rather than their practical effectiveness in real-world engineering contexts. Future research should incorporate field cases or expert interviews to evaluate LLM-generated reports within authentic decision-making scenarios. Fifth, the impact of the structural correspondence between management measures and state transitions on the conclusions. This study assigns three types of management measures to act on different behavioral states based on safety management theory. Although this design has a theoretical basis, it objectively grants active management a more direct pathway to the unsafe state. Therefore, the conclusion that “active management performs best in controlling and ” is, to some extent, influenced by the model structure. Future research could consider adopting more flexible mechanisms for the interaction between management measures and state transitions, or conduct robustness tests under multiple alternative structures, to further validate the robustness of the findings. Sixth, the inseparability of LLM capability and the search framework. In this study, the search behavior of the LLM was guided by explicit search rules specified in the prompt. Therefore, the observed strategy focusing phenomenon cannot be fully attributed to the intrinsic reasoning ability of the LLM alone, but rather results from the synergistic effect of the search framework and the LLM’s semantic understanding. The current experimental design is unable to disentangle the independent contributions of these two components. Future research could clarify this through ablation experiments. For example, the LLM could be replaced with simple heuristic rules while keeping the search framework unchanged to compare focusing performance, or the explicit search rules in the prompt could be removed, retaining only the “generate strategies” instruction, to test whether the LLM can autonomously form focusing behavior. Such experiments would quantify the marginal contribution of LLM semantic reasoning, providing finer-grained guidance for method design.
5.4. Future Research
Based on the above limitations, future research can be pursued in the following directions. First, introduce a dynamic risk environment. Integrate real-time monitoring data from the Internet of Things with the proposed framework to build a dynamic decision-making system that supports online updating of the risk environment. When risk factors change, the LLM can regenerate candidate strategies based on the updated environmental parameters, enabling dynamic adjustment and adaptive optimization of management strategies. Second, conduct systematic comparisons with classical numerical optimization methods. Future research should conduct comprehensive comparisons between the LLM-ABM framework and methods such as GAs, BO, and RL under identical experimental conditions, evaluating the overall performance of each method across three dimensions of strategy search efficiency, result quality, and interpretability. Such comparisons will provide empirical evidence for method selection across different application scenarios, and also help clarify the unique advantages and applicable boundaries of LLMs in search tasks. Third, conduct ablation experiments to disentangle the contributions of the LLM and the search framework. Future research should design controlled experiments in which, while keeping the search framework unchanged, the LLM is replaced with non-semantic heuristic strategies, or the LLM is operated under open prompts without explicit search rules. By comparing the focusing performance across different configurations, the marginal contribution of LLM semantic reasoning relative to the search framework can be quantified, thereby providing a more precise answer to the core question of “to what extent does the LLM independently contribute to strategy focusing”. Fourth, expand the scale and dimensions of expert evaluation. Invite more engineering management experts with diverse backgrounds to participate in the evaluation, and add additional evaluation dimensions to obtain a more comprehensive and robust assessment of report quality. Fifth, extend the application scenarios. This study is based on the specific context of a petroleum pipeline project in Abu Dhabi, with risk factor weights held constant throughout the simulation process. Meanwhile, the correspondence between management measures and state transitions carries structural presuppositions. Therefore, the research findings are strictly confined to this particular engineering context, fixed risk environment, and current model settings. Different project types, risk environments, or model structures may lead to different conclusions. Future research should conduct validation across multiple construction sites, under dynamic risk environments, and with alternative model structures to assess the robustness and generalizability of the findings. Sixth, conduct model calibration and empirical validity verification. Future research should calibrate model parameters using field data, enabling the model to more accurately reflect real management intervention mechanisms, thereby upgrading the current conditional conclusions into more generalizable management recommendations. Only after the model passes empirical validity verification can its output strategy recommendations be directly applied to practical engineering decision-making.
6. Conclusions
This study constructed and validated an LLM-ABM closed-loop decision-making framework that integrates LLMs with ABM for the intelligent generation and evaluation of construction safety management strategies in the field of petroleum engineering. The experimental results demonstrated that, under the current ABM model settings and fixed risk environment, the active management strategy corresponded to the lowest and , while the balanced strategy had an advantage in maintaining the in the later stage, with no single strategy dominating across all indicators. In terms of strategy search, under the experimental conditions based on a discrete grid with a step size of 0.05 and fixed ABM model settings, the LLM-ABM achieved a higher Top-10% strategy hit rate than random search in point estimates, and the final selected strategies exhibited better global rankings on the discrete grid with lower variance. This preliminarily suggests that the LLM-ABM workflow has the potential to focus search on high-quality strategy regions defined under this discrete grid and model within a limited budget. It should be emphasized that the above conclusions are strictly confined to the current discrete grid resolution and ABM model assumptions, and do not equate to discovering optimal management strategies in the real world. In terms of result interpretation, the management reports generated by the LLM achieved high scores across all three dimensions of data fidelity, logical coherence, and recommendation actionability, indicating that LLMs can transform structured simulation data into traceable management recommendations. Within the context of the petroleum pipeline project investigated in this study, the LLM-ABM workflow framework demonstrated the capability of strategy focusing and automated report generation under a limited budget, providing a data-driven reference tool for safety management decision-making in this type of engineering project. Its applicability to broader construction safety management scenarios requires further validation.
Author Contributions
Conceptualization, K.H. and C.W.; methodology, K.H., X.X. and C.W.; formal analysis, K.H., X.X. and C.W.; writing—original draft preparation, K.H.; writing—review and editing, K.H., X.X. and C.W.; Supervision, C.W. All authors have read and agreed to the published version of the manuscript.
Funding
This research was funded by the National Social Science Foundation of China (grant 22&ZD135) and supported by the BUPT Excellent Ph.D. Students Foundation (CX20260003).
Data Availability Statement
The related data used to support the findings of this study are included within the article.
Acknowledgments
During the preparation of this manuscript, the authors used ChatGPT (GPT-5.5) and DeepL (26.2.1) for the purposes of language polishing and translation. The authors have reviewed and edited the output and take full responsibility for the content of this publication.
Conflicts of Interest
Author Xuefeng Xia was employed by the company China National Logging Corporation. The remaining authors declare that the research was conducted in the absence of any commercial or financial relationships that could be construed as a potential conflict of interest.
Abbreviations
The following abbreviations are used in this manuscript:
| LLMs | Large Language Models |
| ABM | Agent-Based Modeling |
| AEC | Architecture, Engineering and Construction |
| GA | Genetic Algorithm |
| BO | Bayesian Optimization |
| RL | Reinforcement Learning |
References
- Vilibić, K.; Sigmund, Z.; Završki, I. Intelligent risk identification in construction projects: A case study of an AI-based framework. Buildings 2026, 16, 409. [Google Scholar] [CrossRef] [Scilit]
- Pan, Z.; Guo, F.; Higham, J.; Hao, J.; Dai, L.; Xu, Z. A systematic risk identification framework based on digital twin. Int. J. Constr. Manag. 2026, 1–25. [Google Scholar] [CrossRef] [Scilit]
- Zhu, L.; He, P.; Yu, J.; Yan, W.; Cao, X. Temporal dynamics of the relationship between cognitive ability and unsafe behavior in construction workers. Buildings 2026, 16, 1960. [Google Scholar] [CrossRef] [Scilit]
- Zhao, H.; Wang, C.; Zheng, Q.; Xia, X.; Ouyang, Y. Research on the evolutionary control of unsafe behavior of construction personnel based on multi-field coupled-homogeneous analysis model. PLoS ONE 2024, 19, e0302263. [Google Scholar] [CrossRef] [Scilit]
- Li, Z.; Lv, X.; Zhu, H.; Sheng, Z. Analysis of complexity of unsafe behavior in construction teams and a multiagent simulation. Complexity 2018, 2018, 6568719. [Google Scholar] [CrossRef] [Scilit]
- Nwagbala, D.C.; Park, J.Y. A study of the foremen’s influence on the safety behavior of construction workers based on cognitive theory. Buildings 2023, 13, 1792. [Google Scholar] [CrossRef] [Scilit]
- Meng, Q.; Zhao, J.; Li, Z.; Chong, H. Navigating unsafe behavioral decision-making in workplaces: An agent-based simulation for intervention and management. WORK 2026, 84, 491–510. [Google Scholar] [CrossRef] [Scilit] [PubMed]
- Gao, C.; Lan, X.; Li, N.; Yuan, Y.; Ding, J.; Zhou, Z.; Xu, F.; Li, Y. Large language models empowered agent-based modeling and simulation: A survey and perspectives. Humanit. Soc. Sci. Commun. 2024, 11, 1259. [Google Scholar] [CrossRef] [Scilit]
- Antelmi, A.; Caramante, P.; Cordasco, G.; D’Ambrosio, G.; De Vinco, D.; Foglia, F.; Postiglione, L.; Spagnuolo, C. Reliable and efficient agent-based modeling and simulation. J. Artif. Soc. Soc. Simul. 2024, 27, 1–28. [Google Scholar] [CrossRef] [Scilit]
- Choi, M.; Crooks, A.; Wan, N.; Brewer, S.; Cova, T.J.; Hohl, A. Addressing equifinality in agent-based modeling: A sequential parameter space search method based on sensitivity analysis. Int. J. Geogr. Inf. Sci. 2024, 38, 1007–1034. [Google Scholar] [CrossRef] [Scilit]
- Kumar, P. Large language models (LLMs): Survey, technical frameworks, and future challenges. Artif. Intell. Rev. 2024, 57, 260. [Google Scholar] [CrossRef] [Scilit]
- Yang, S.; Ceferino, L.; Zhang, Y.; Gu, C.; Guo, T.; Kondo, G. When agents learn to think: Large language model-enhanced agent-based modeling for crowd evacuation in disaster scenarios. Reliab. Eng. Syst. Saf. 2026, 269, 112056. [Google Scholar] [CrossRef] [Scilit]
- Flandre, N.Y.; Giabbanelli, P.J. Distilling the complexity of agent-based simulations into textual explanations via large language models. Big Data Cogn. Comput. 2026, 10, 121. [Google Scholar] [CrossRef] [Scilit]
- Zhang, Z.; Li, H.; Guo, H.; Wu, Y.; Luo, Z. Causal inference of construction safety management measures towards workers’ safety behaviors: A multidimensional perspective. Saf. Sci. 2024, 172, 106432. [Google Scholar] [CrossRef] [Scilit]
- Wang, Y.; Cui, J.; Zhang, Y.; Geng, X. Study and action plan on the key factors influencing unsafe behaviors by construction workers. Buildings 2024, 14, 1973. [Google Scholar] [CrossRef] [Scilit]
- Kim, M.-J.; Ahn, S.-P.; Shin, S.-H.; Kang, M.-G.; Won, J.-H. Comparison of influencing factors on safety behavior and perception between contractor managers and subcontractor workers at Korean construction sites. Buildings 2025, 15, 963. [Google Scholar] [CrossRef] [Scilit]
- Deng, S.; Zhu, H.; Cai, Y.; Pan, Y. Group cognitive characteristics of construction workers’ unsafe behaviors from personalized management. Saf. Sci. 2024, 175, 106492. [Google Scholar] [CrossRef] [Scilit]
- Man, S.S.; Xie, Y.; Chen, Y.; Chan, A.H.S.; Liu, L. Role of safety supervision, coworker support and safety training in shaping the safety behaviour of construction workers. Saf. Sci. 2025, 192, 106998. [Google Scholar] [CrossRef] [Scilit]
- Guo, N.; Liu, Y.; Yu, S.; Xia, B.; Cong, W. Examining the role of psychological symptoms and safety climate in shaping safety behaviors among construction workers. Behav. Sci. 2025, 15, 66. [Google Scholar] [CrossRef] [Scilit] [PubMed]
- Senthamizh Sankar, S.; Anandh, K.S. Navigating leadership styles through qualitative exploration for enhanced safety in the construction sector. Saf. Sci. 2024, 175, 106495. [Google Scholar] [CrossRef] [Scilit]
- Zhang, F.; Wu, Z.; Zhang, Y.; Wang, Y. The effect mechanism of construction workers’ emotion on unsafe behavior: Mediating role of safety attitude and moderating role of emotional intelligence. J. Saf. Res. 2025, 95, 318–329. [Google Scholar] [CrossRef] [Scilit] [PubMed]
- Almaskati, D.; Kermanshachi, S.; Pamidimukkala, A.; Loganathan, K.; Yin, Z. A review on construction safety: Hazards, mitigation strategies, and impacted sectors. Buildings 2024, 14, 526. [Google Scholar] [CrossRef] [Scilit]
- Zhang, Z.; Guo, H.; Li, H.; Fang, Y. Agent-based simulation approach to analyzing the impact of construction safety management behaviors on workers’ safety behaviors. J. Constr. Eng. Manag. 2025, 151, 04025106. [Google Scholar] [CrossRef] [Scilit]
- Mazzetto, S. Interdisciplinary perspectives on agent-based modeling in the architecture, engineering, and construction industry: A comprehensive review. Buildings 2024, 14, 3480. [Google Scholar] [CrossRef] [Scilit]
- Li, C.; Fang, Q.; Chen, K.; Bao, Z.; Jiang, Z.; Liu, W. Adaptive pandemic management strategies for construction sites: An agent-based modeling approach. Front. Eng. Manag. 2024, 11, 288–310. [Google Scholar] [CrossRef] [Scilit]
- Olukan, D.; Ward, J.; Malleson, N.; Ge, J. Heterogeneity in agent-based models. J. Artif. Soc. Soc. Simul. 2026, 29, 5. [Google Scholar] [CrossRef] [Scilit]
- Collins, A.; Koehler, M.; Lynch, C. Methods that support the validation of agent-based models: An overview and discussion. J. Artif. Soc. Soc. Simul. 2024, 27, 11. [Google Scholar] [CrossRef] [Scilit]
- Kulkarni, P.; Krejci, C.; Chen, V.C.P. Mapping complex agent-based model parameter spaces using metamodels and mixed adaptive sampling. J. Artif. Soc. Soc. Simul. 2026, 29, 6. [Google Scholar] [CrossRef] [Scilit]
- Li, K.; Ge, J.; Lomax, N.; Polhill, J.G. Calibrating a global trade agent-based model with an HPC–ABC–SMC framework. J. Artif. Soc. Soc. Simul. 2026, 29, 5. [Google Scholar] [CrossRef] [Scilit]
- Huang, J.; Cui, Y.; Zhang, L.; Tong, W.; Shi, Y.; Liu, Z. An Overview of Agent-Based Models for Transport Simulation and Analysis. Journal of Advanced Transportation 2022, 2022, 1252534. [Google Scholar] [CrossRef] [Scilit]
- Gao, Z.; Jing, S.; Zhang, L. A study on the application of large language models based on LoRA fine-tuning and difficult-sample adaptation for online violence recognition. Symmetry 2025, 17, 1310. [Google Scholar] [CrossRef] [Scilit]
- Zhang, Z.; Ding, R.; Liu, Y.; Ma, H. Research on large language model-based automatic knowledge extraction for coal mine equipment safety. Symmetry 2025, 17, 1490. [Google Scholar] [CrossRef] [Scilit]
- Zhang, X.; Zheng, X.; Li, Z.; Ma, M.; Liang, X.; Ren, X.; Zhang, M. A fine-tuning multimodal large language model for endoscopic report generation. Biomed. Signal Process. Control 2026, 118, 109737. [Google Scholar] [CrossRef] [Scilit]
- Kampelopoulos, D.; Tsanousa, A.; Vrochidis, S.; Kompatsiaris, I. A review of LLMs and their applications in the architecture, engineering and construction industry. Artif. Intell. Rev. 2025, 58, 250. [Google Scholar] [CrossRef] [Scilit]
- Erfani, A.; Mansouri, A. Applications of multimodal large language models in construction industry. Adv. Eng. Inform. 2026, 69, 103909. [Google Scholar] [CrossRef] [Scilit]
- Memon, S.A.; Shehata, W.; Rowlinson, S.; Sunindijo, R.Y. Generative artificial intelligence in architecture, engineering, construction, and operations: A systematic review. Buildings 2025, 15, 2270. [Google Scholar] [CrossRef] [Scilit]
- Li, H.; Zhang, Y.; Cao, Y.; Zhao, J.; Zhao, Z. Applications of artificial intelligence in the AEC industry: A review and future outlook. J. Asian Archit. Build. Eng. 2024, 24, 1672–1688. [Google Scholar] [CrossRef] [Scilit]
- Sarathchandra, T.; George, G.; Ranasinghe, U.; Wijewickrama, M.K.C.S.; Edwards, D.J. Role of generative artificial intelligence in transforming construction safety training. Buildings 2026, 16, 2686. [Google Scholar] [CrossRef] [Scilit]
- Chaudhary, N.; Uddin, S.M.J.; Chandra, S.S.; Ovid, A.; Albert, A. Prompt to protection: A comparative study of multimodal LLMs in construction hazard recognition. IEEE Access 2026, 14, 70565–70580. [Google Scholar] [CrossRef] [Scilit]
- Wang, Y.; Luo, H.; Fang, W. An integrated approach for automatic safety inspection in construction: Domain knowledge with multimodal large language model. Adv. Eng. Inform. 2025, 65, 103246. [Google Scholar] [CrossRef] [Scilit]
- de Marco, G.; Niederwieser, E.; Siegele, D. Exploring a multimodal conversational agent for construction site safety: A low-code approach to hazard detection and compliance assessment. Buildings 2025, 15, 3352. [Google Scholar] [CrossRef] [Scilit]
- Elbasheer, M.; Laili, Y.; Longo, F.; Solina, V.; Tao, Y.; Veltri, P.; Zhang, Y.; Zhang, L. Natural language-driven production planning: Integrating large language models with automatic simulation model generation in manufacturing systems. J. Intell. Manuf. 2025, 37, 4431–4458. [Google Scholar] [CrossRef] [Scilit]
- Dehghani, M. SimGPT: Unlocking potentials of generative AI in simulation via Simio and LLM integration. Comput. Ind. Eng. 2026, 218, 112104. [Google Scholar] [CrossRef] [Scilit]
- Zhu, W.; Li, X.; Wang, L.; Wang, J.; Wei, Y. TM-RAG: A tree-mapped retrieval-augmented generation framework for construction claim report generation. Adv. Eng. Inform. 2026, 69, 104092. [Google Scholar] [CrossRef] [Scilit]
- Park, D.; Moon, H.; Ryu, S. A self-correcting multi-agent LLM framework for language-based physics simulation and explanation. npj Artif. Intell. 2026, 2, 10. [Google Scholar] [CrossRef] [Scilit]
- Kuo, T.C.; Zulkarnain, I.; Rahmat, D.A.; Rumanti, A.A.; Pulungan, M.A. Large language model integration in agent-based modeling for the simulation and recycling system. Resour. Conserv. Recycl. 2026, 232, 108968. [Google Scholar] [CrossRef] [Scilit]
- Reason, J. Managing the Risks of Organizational Accidents; Ashgate: Aldershot, UK, 1997. [Google Scholar]
- Heinrich, H.W. Industrial Accident Prevention: A Scientific Approach; McGraw-Hill: New York, NY, USA, 1931. [Google Scholar]
- Lingard, H.; Rowlinson, S. Occupational Health and Safety in Construction Project Management; Routledge: London, UK, 2005. [Google Scholar]
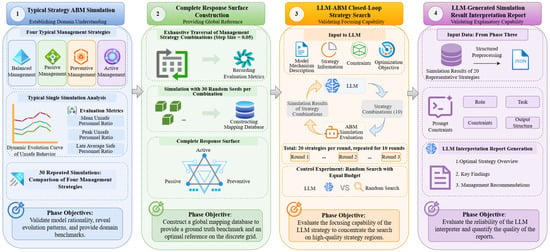
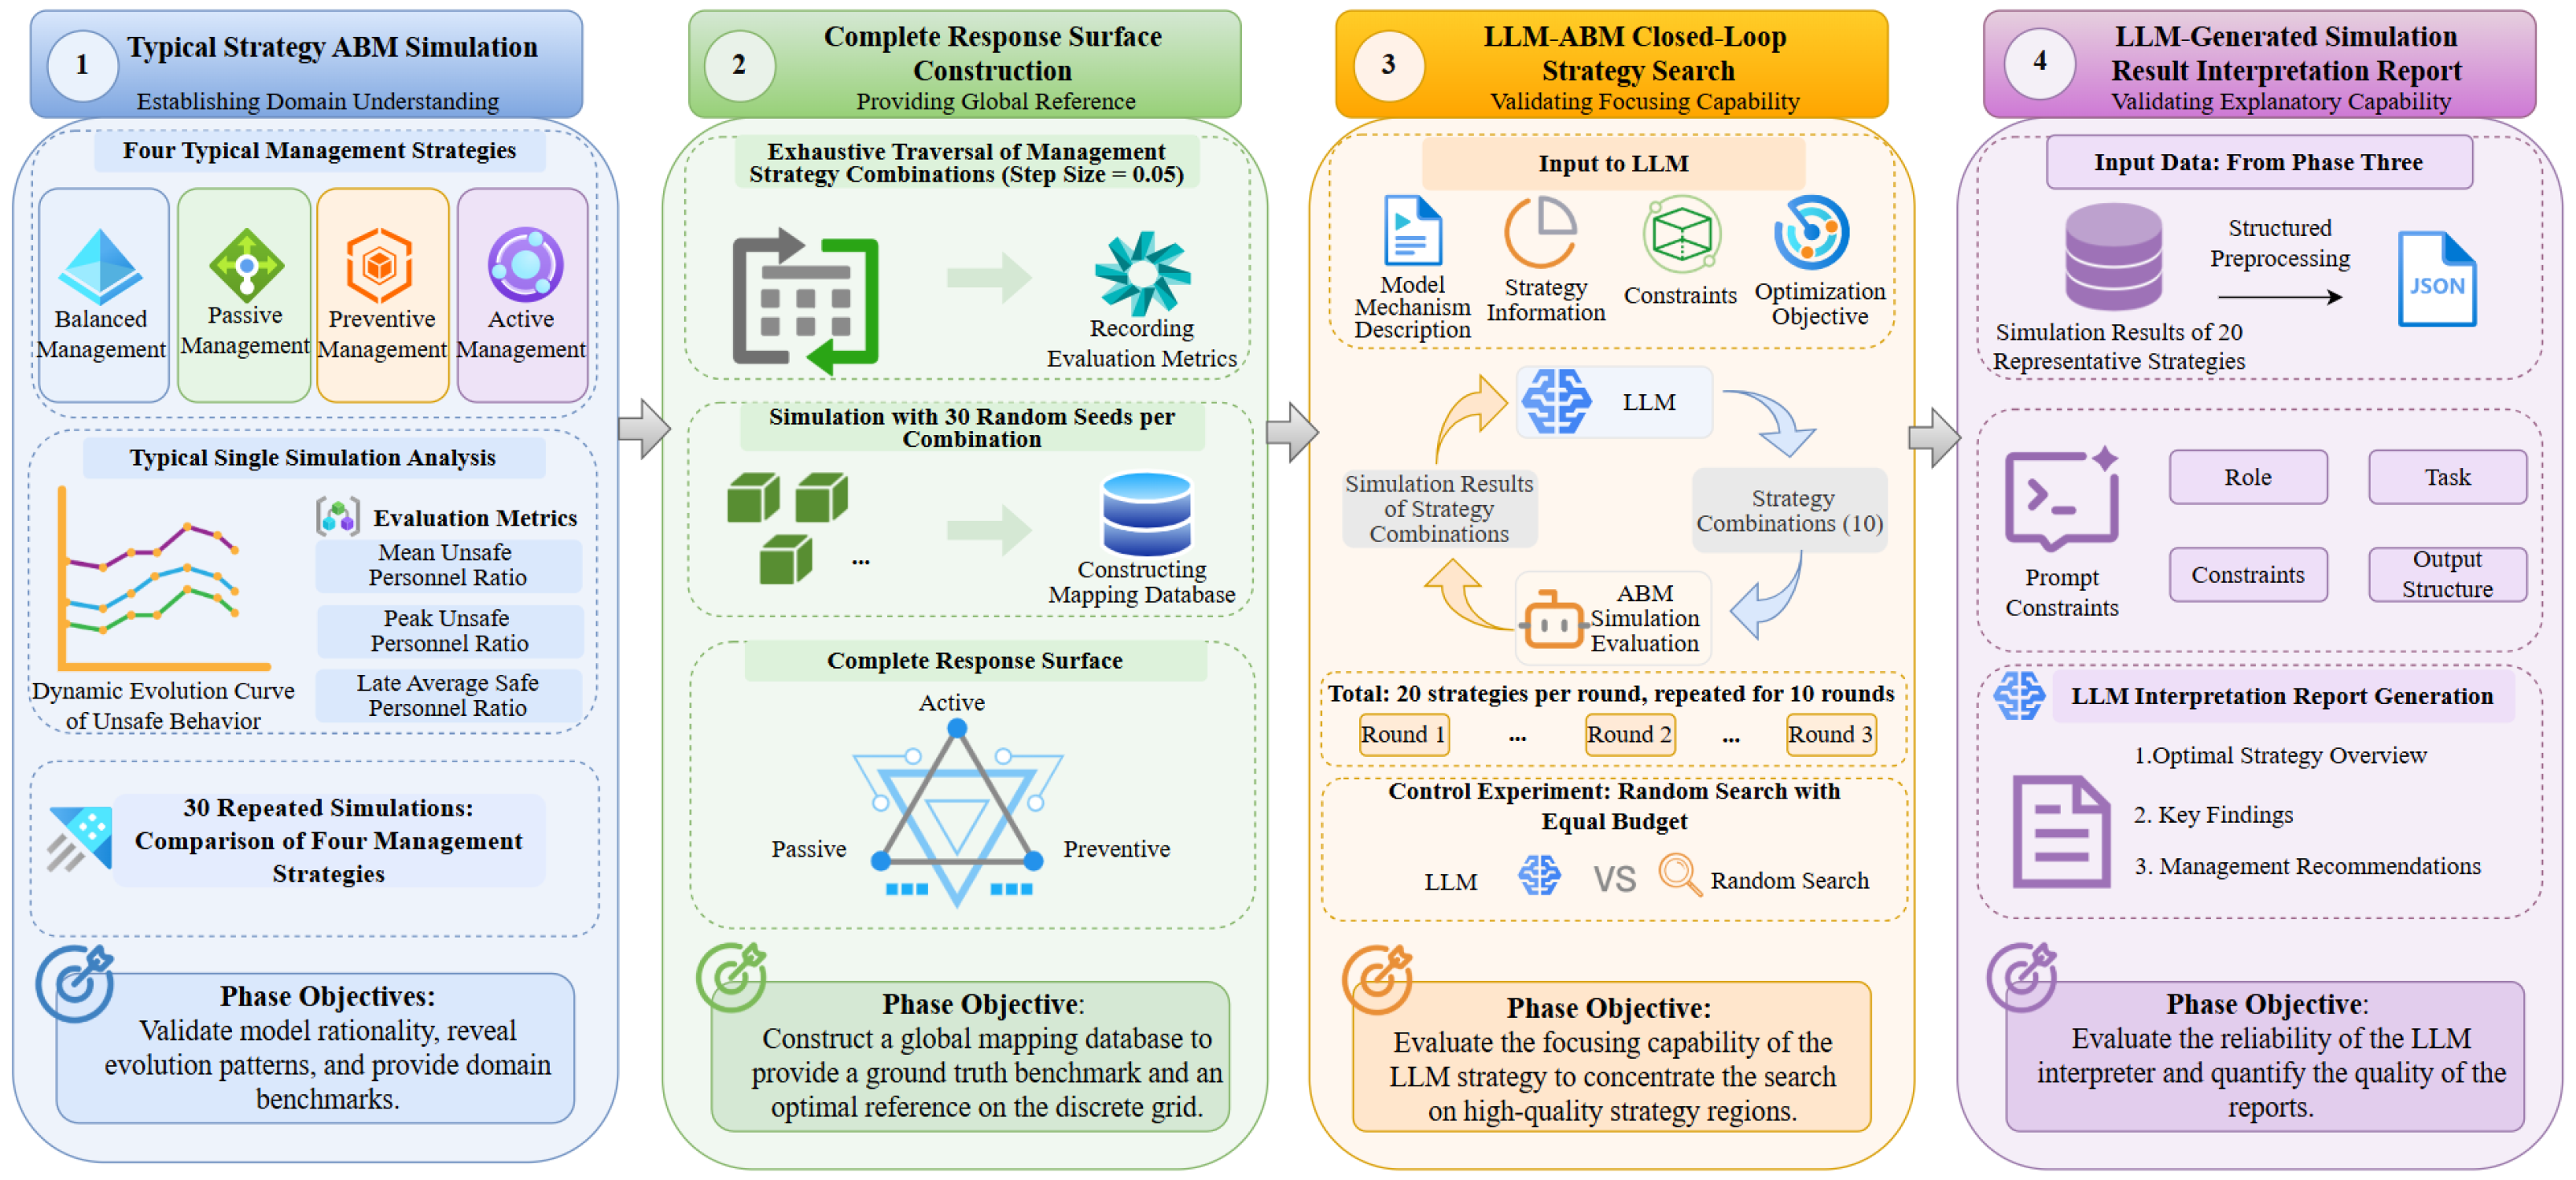
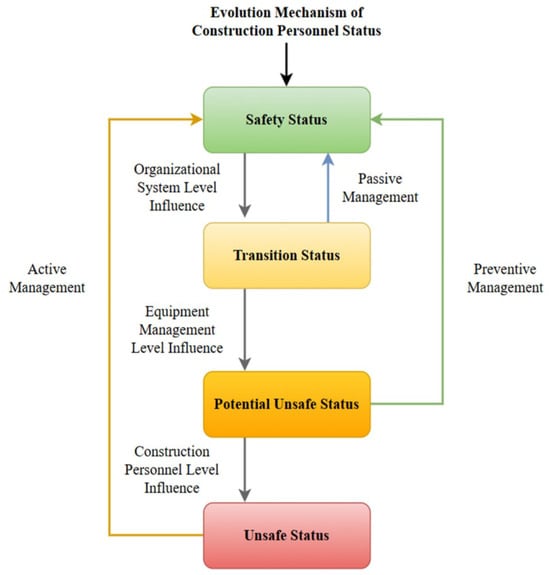
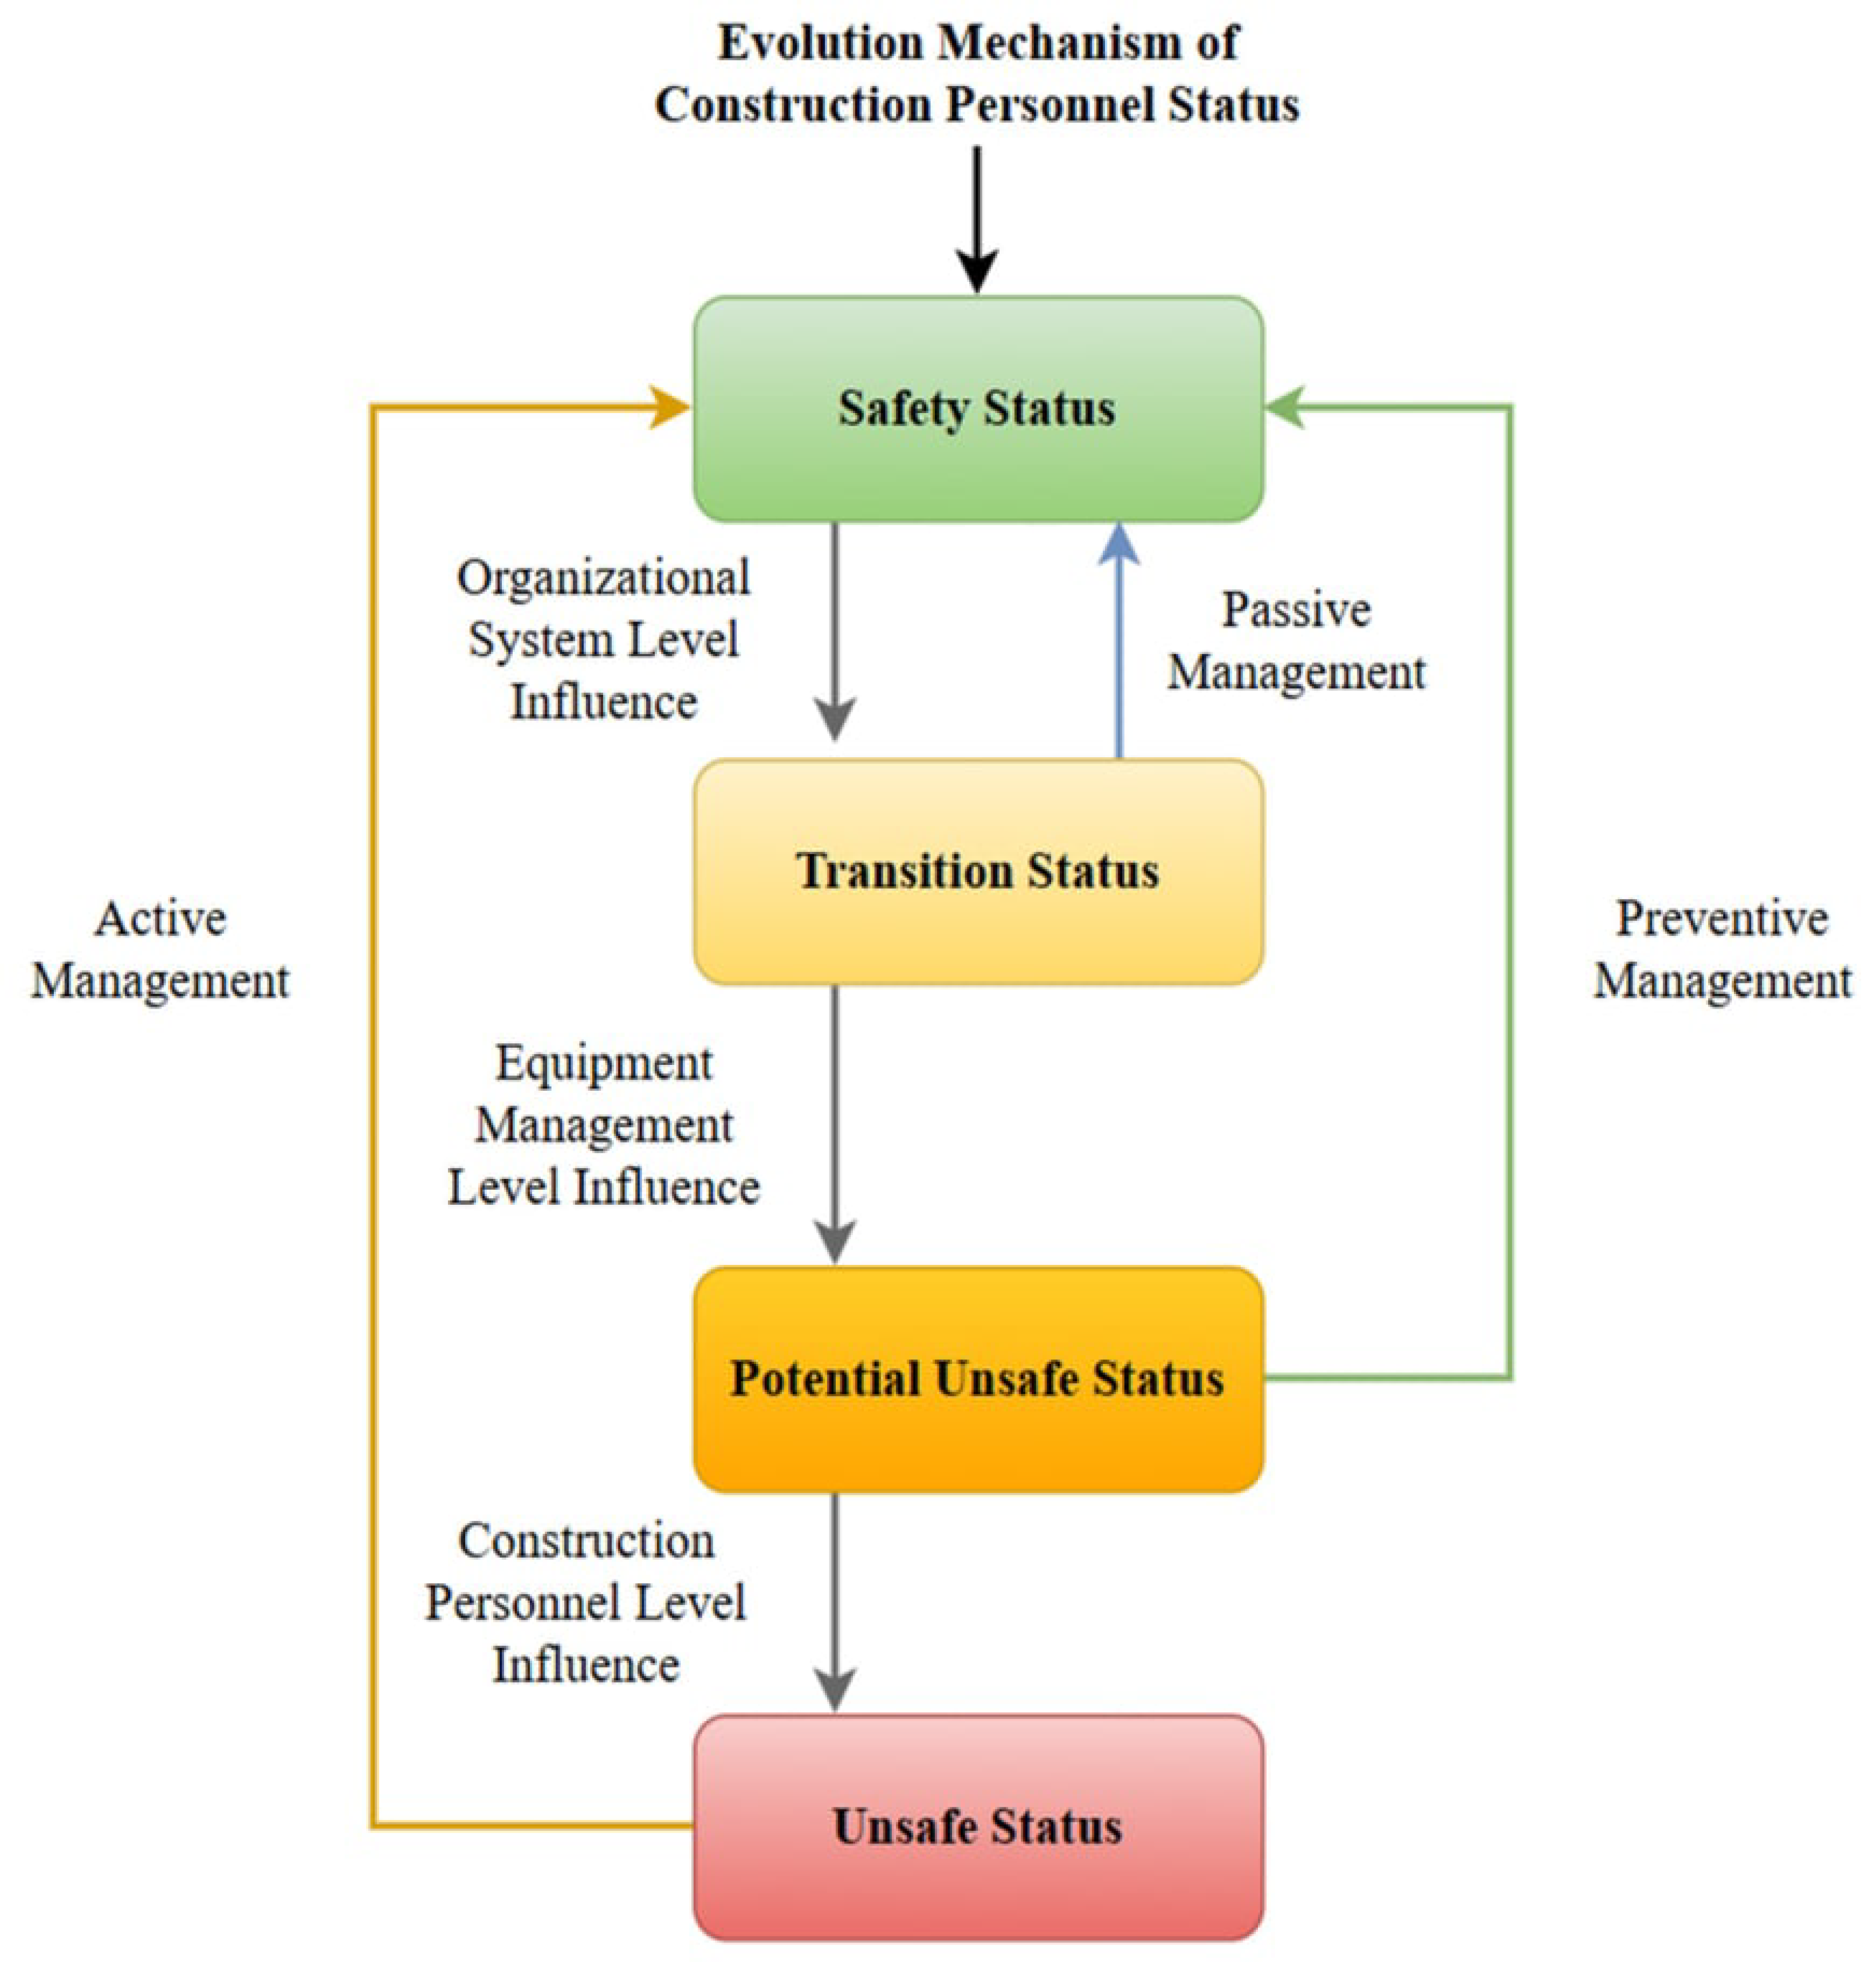
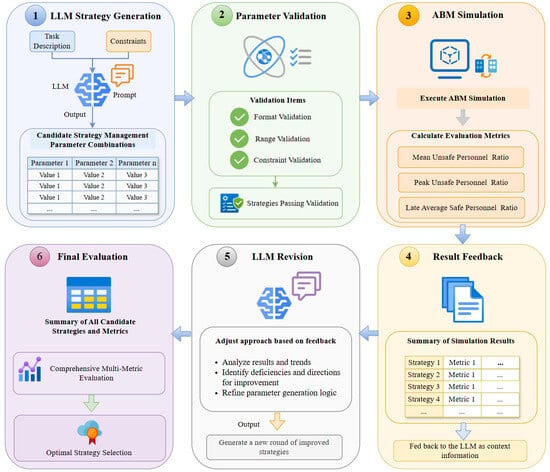
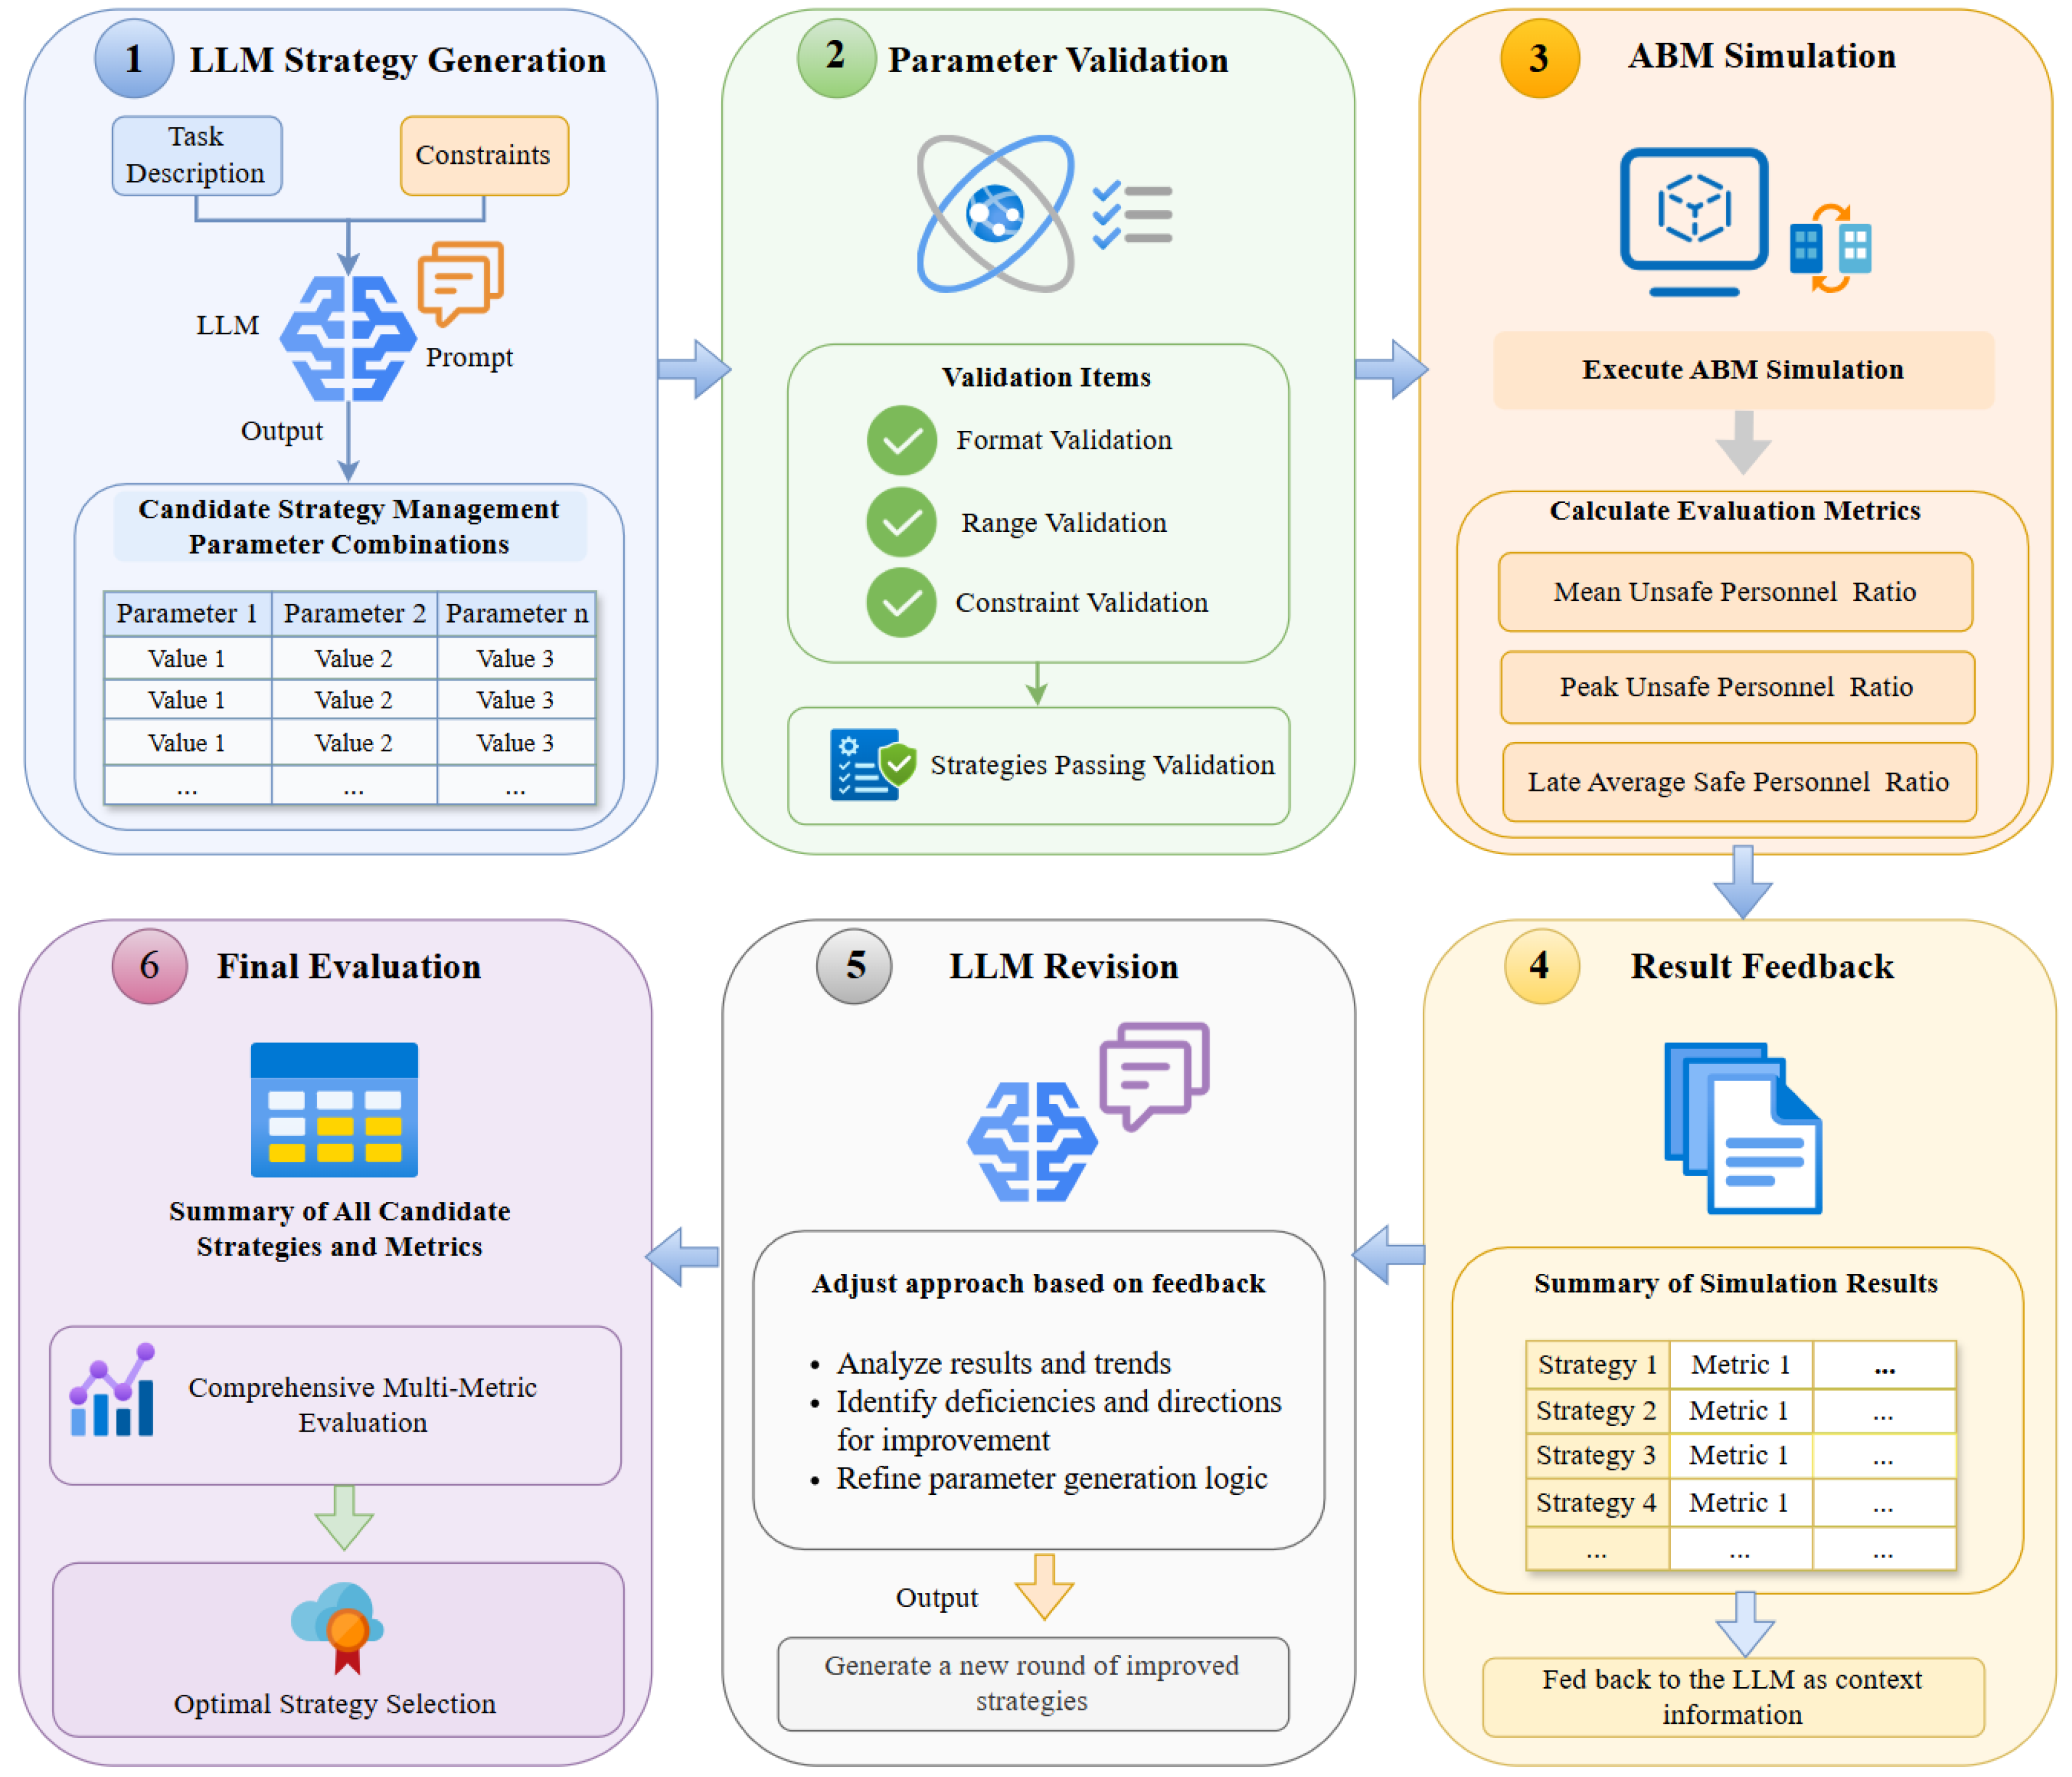
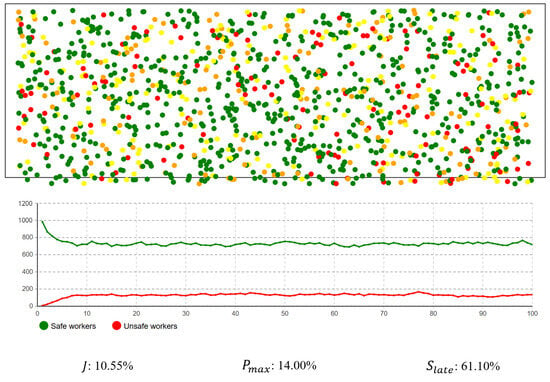
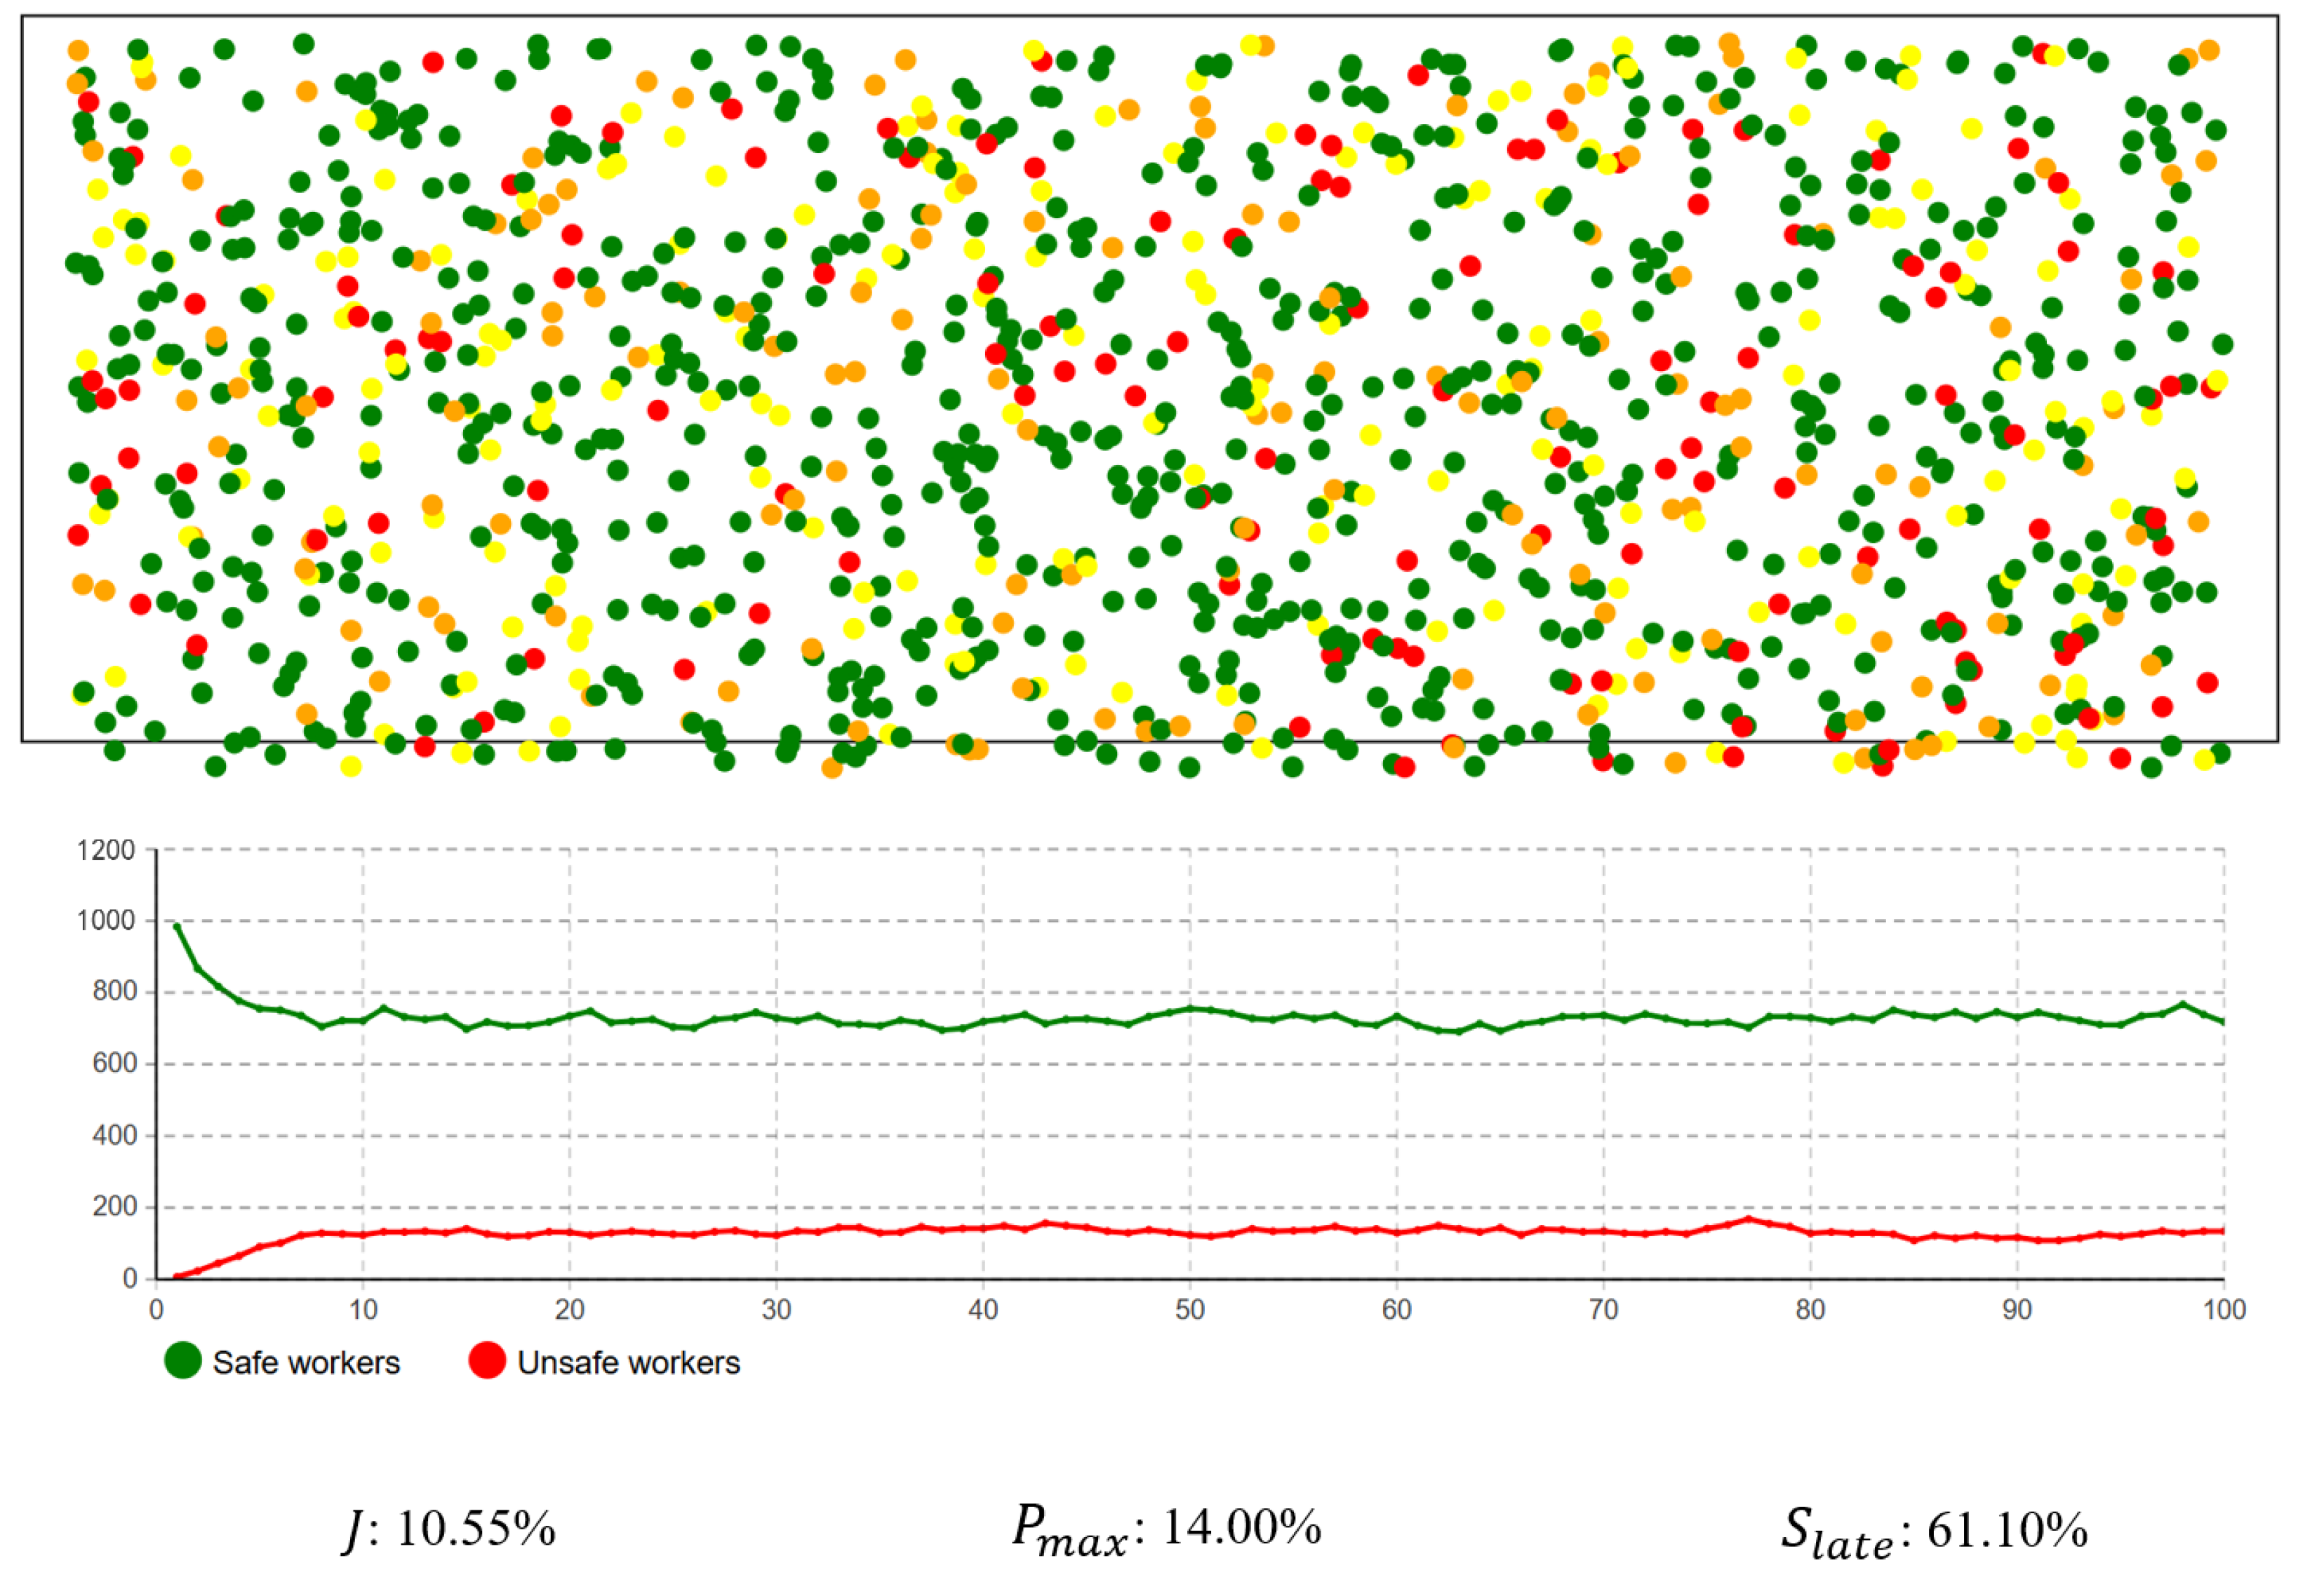
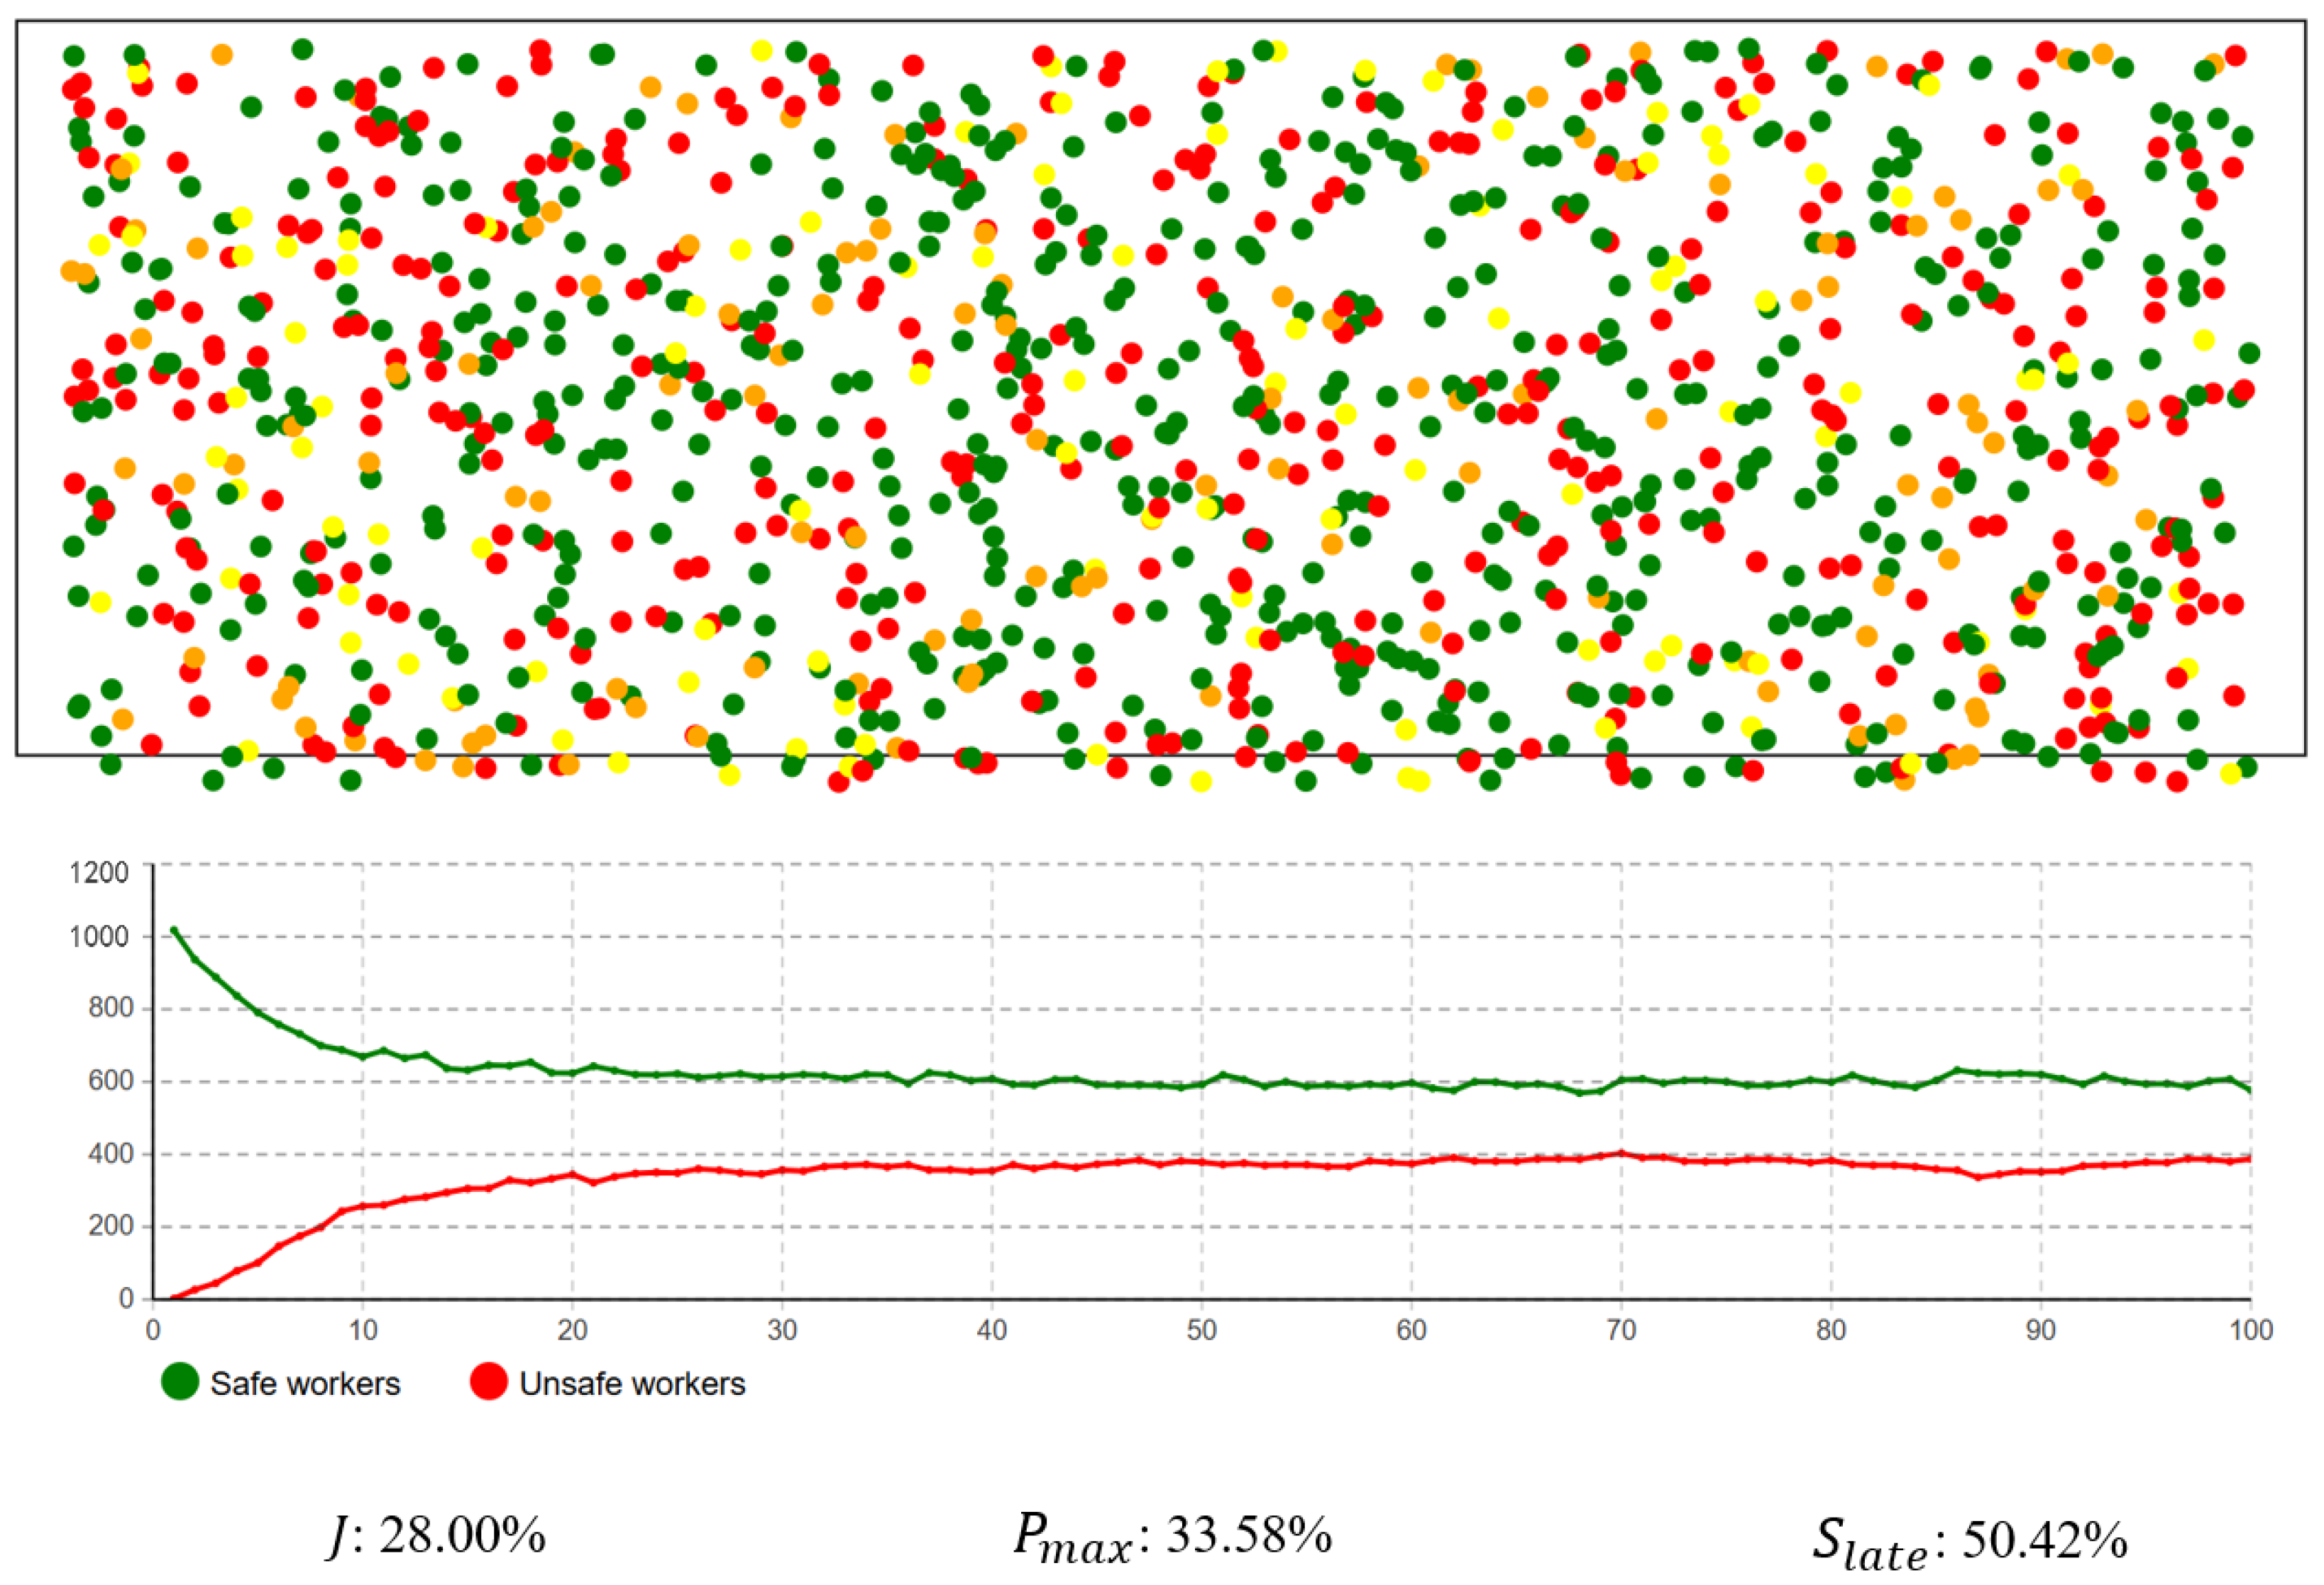
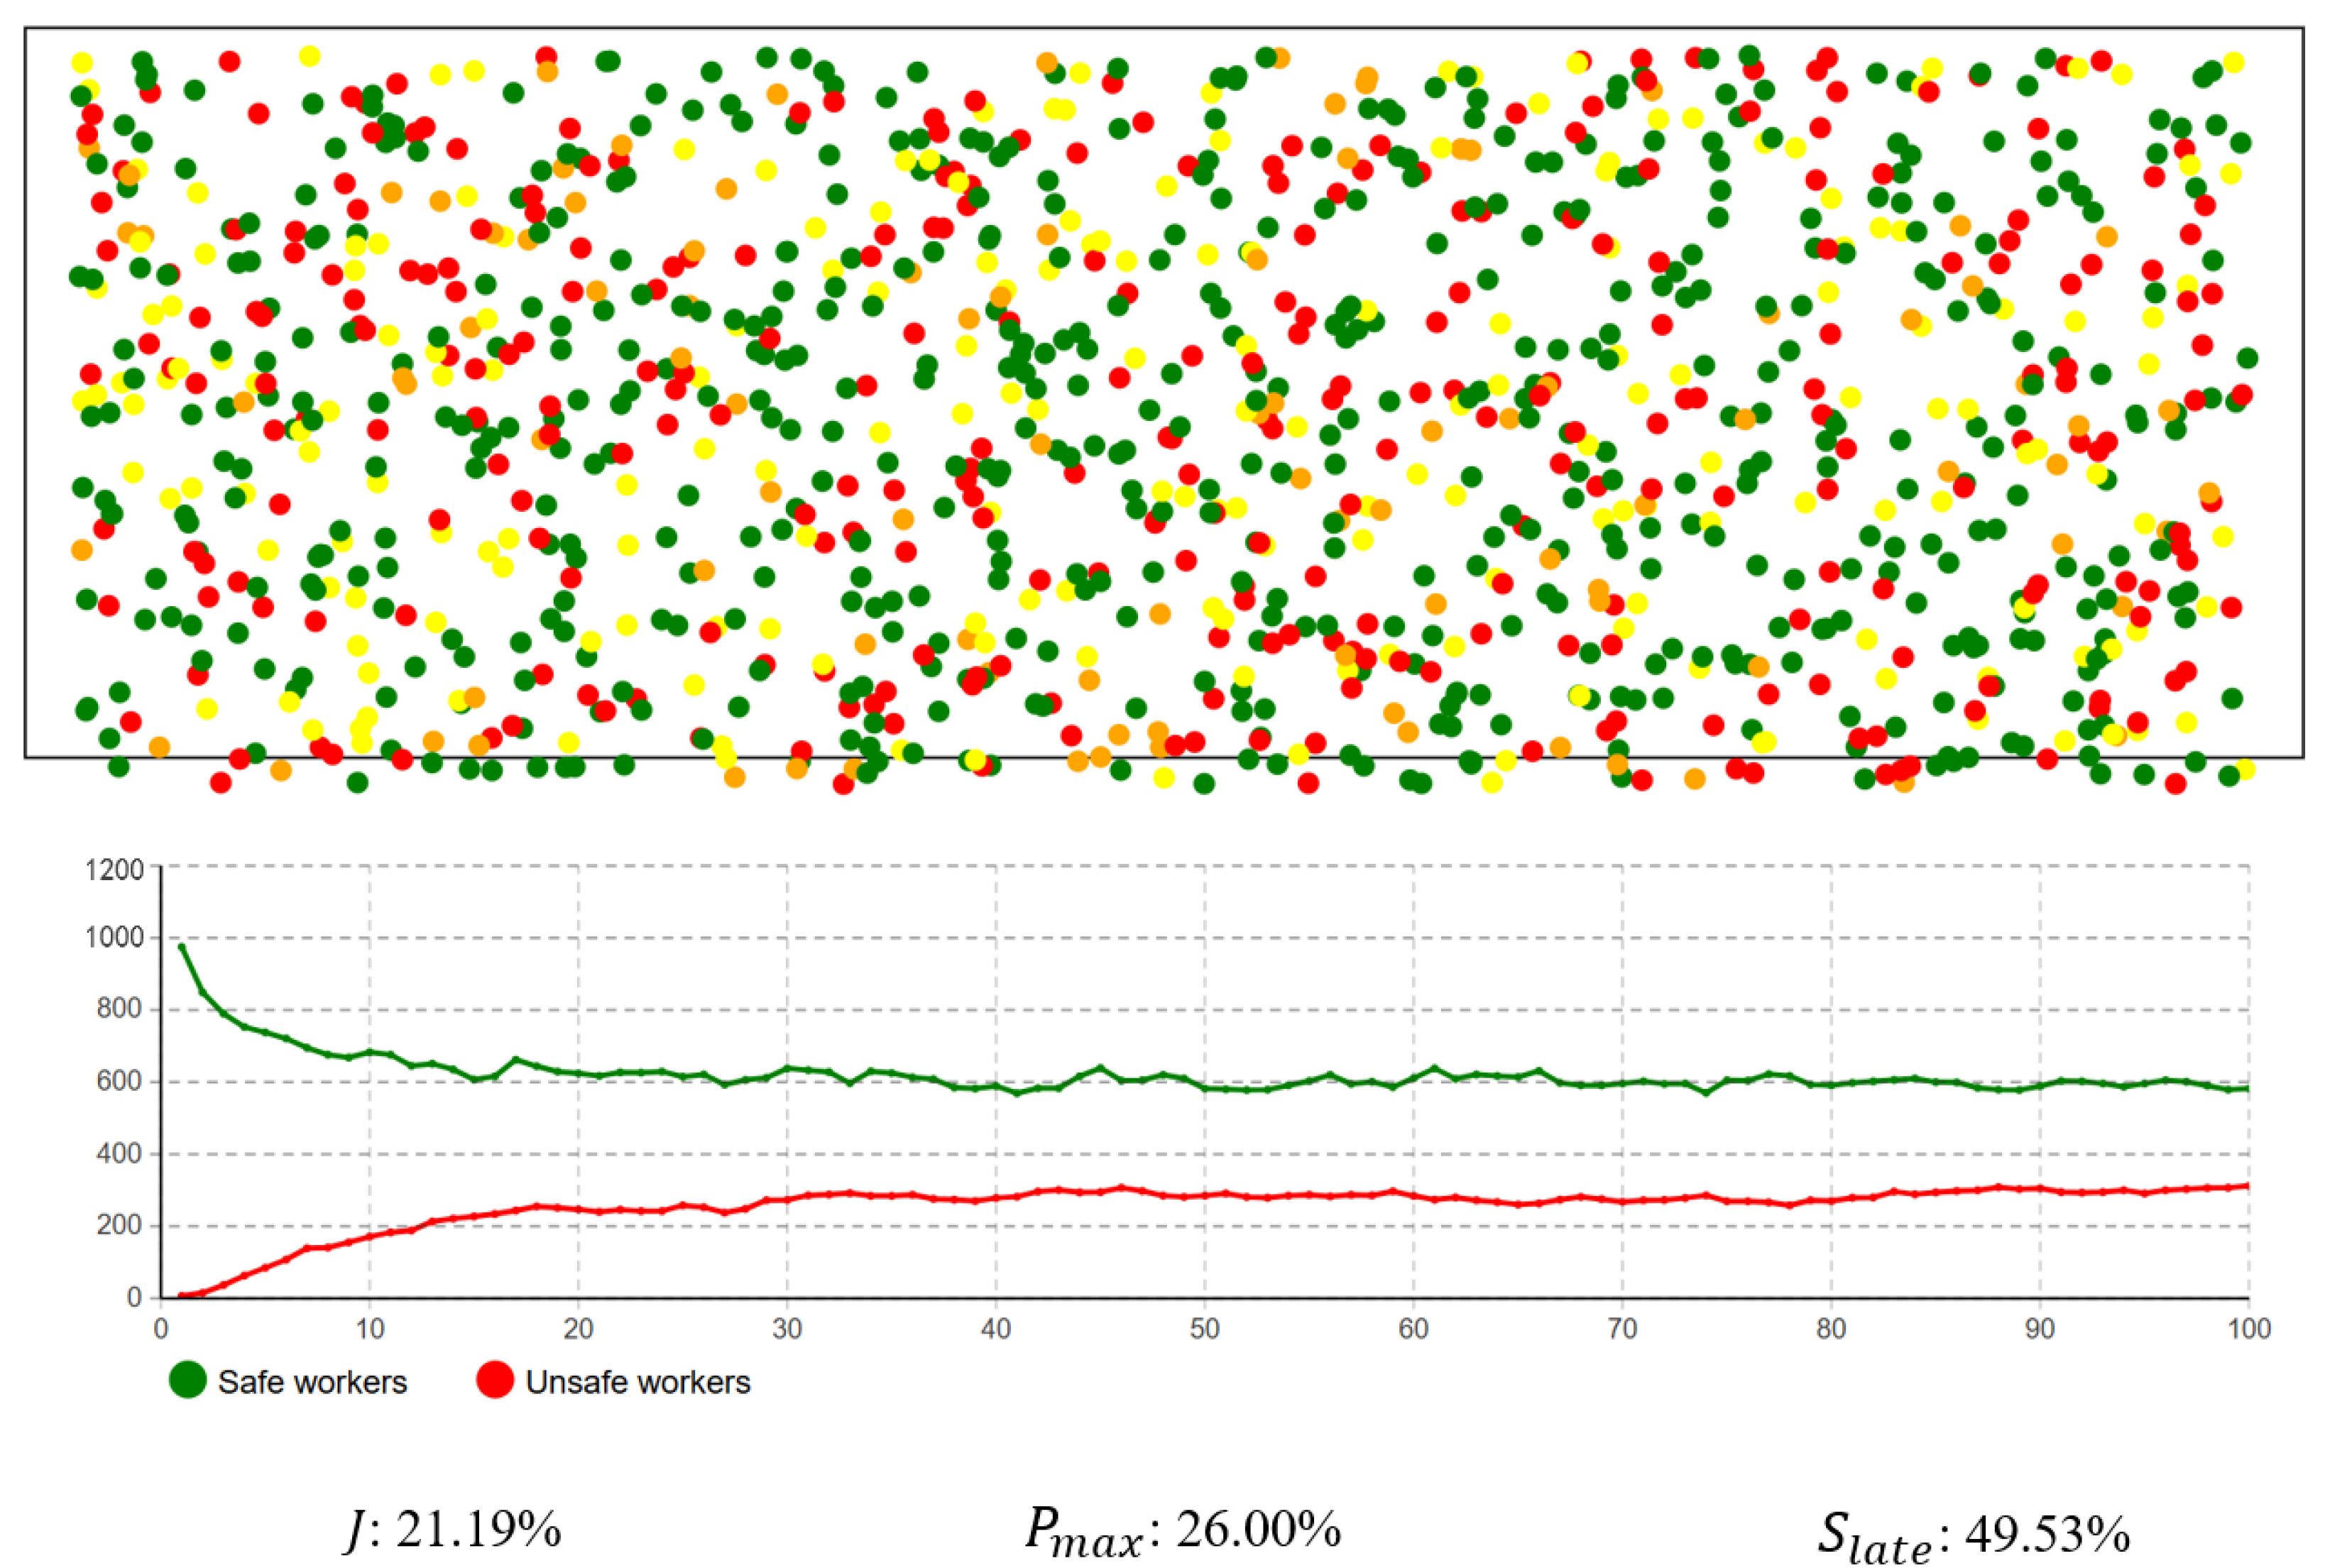
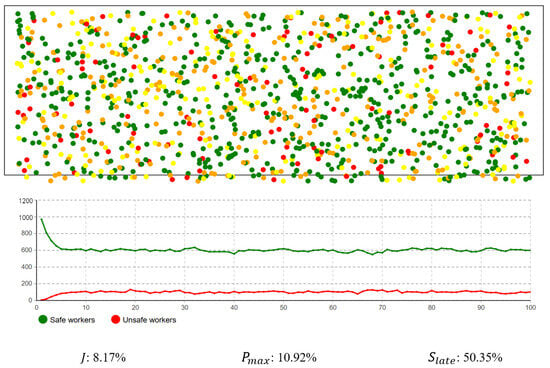
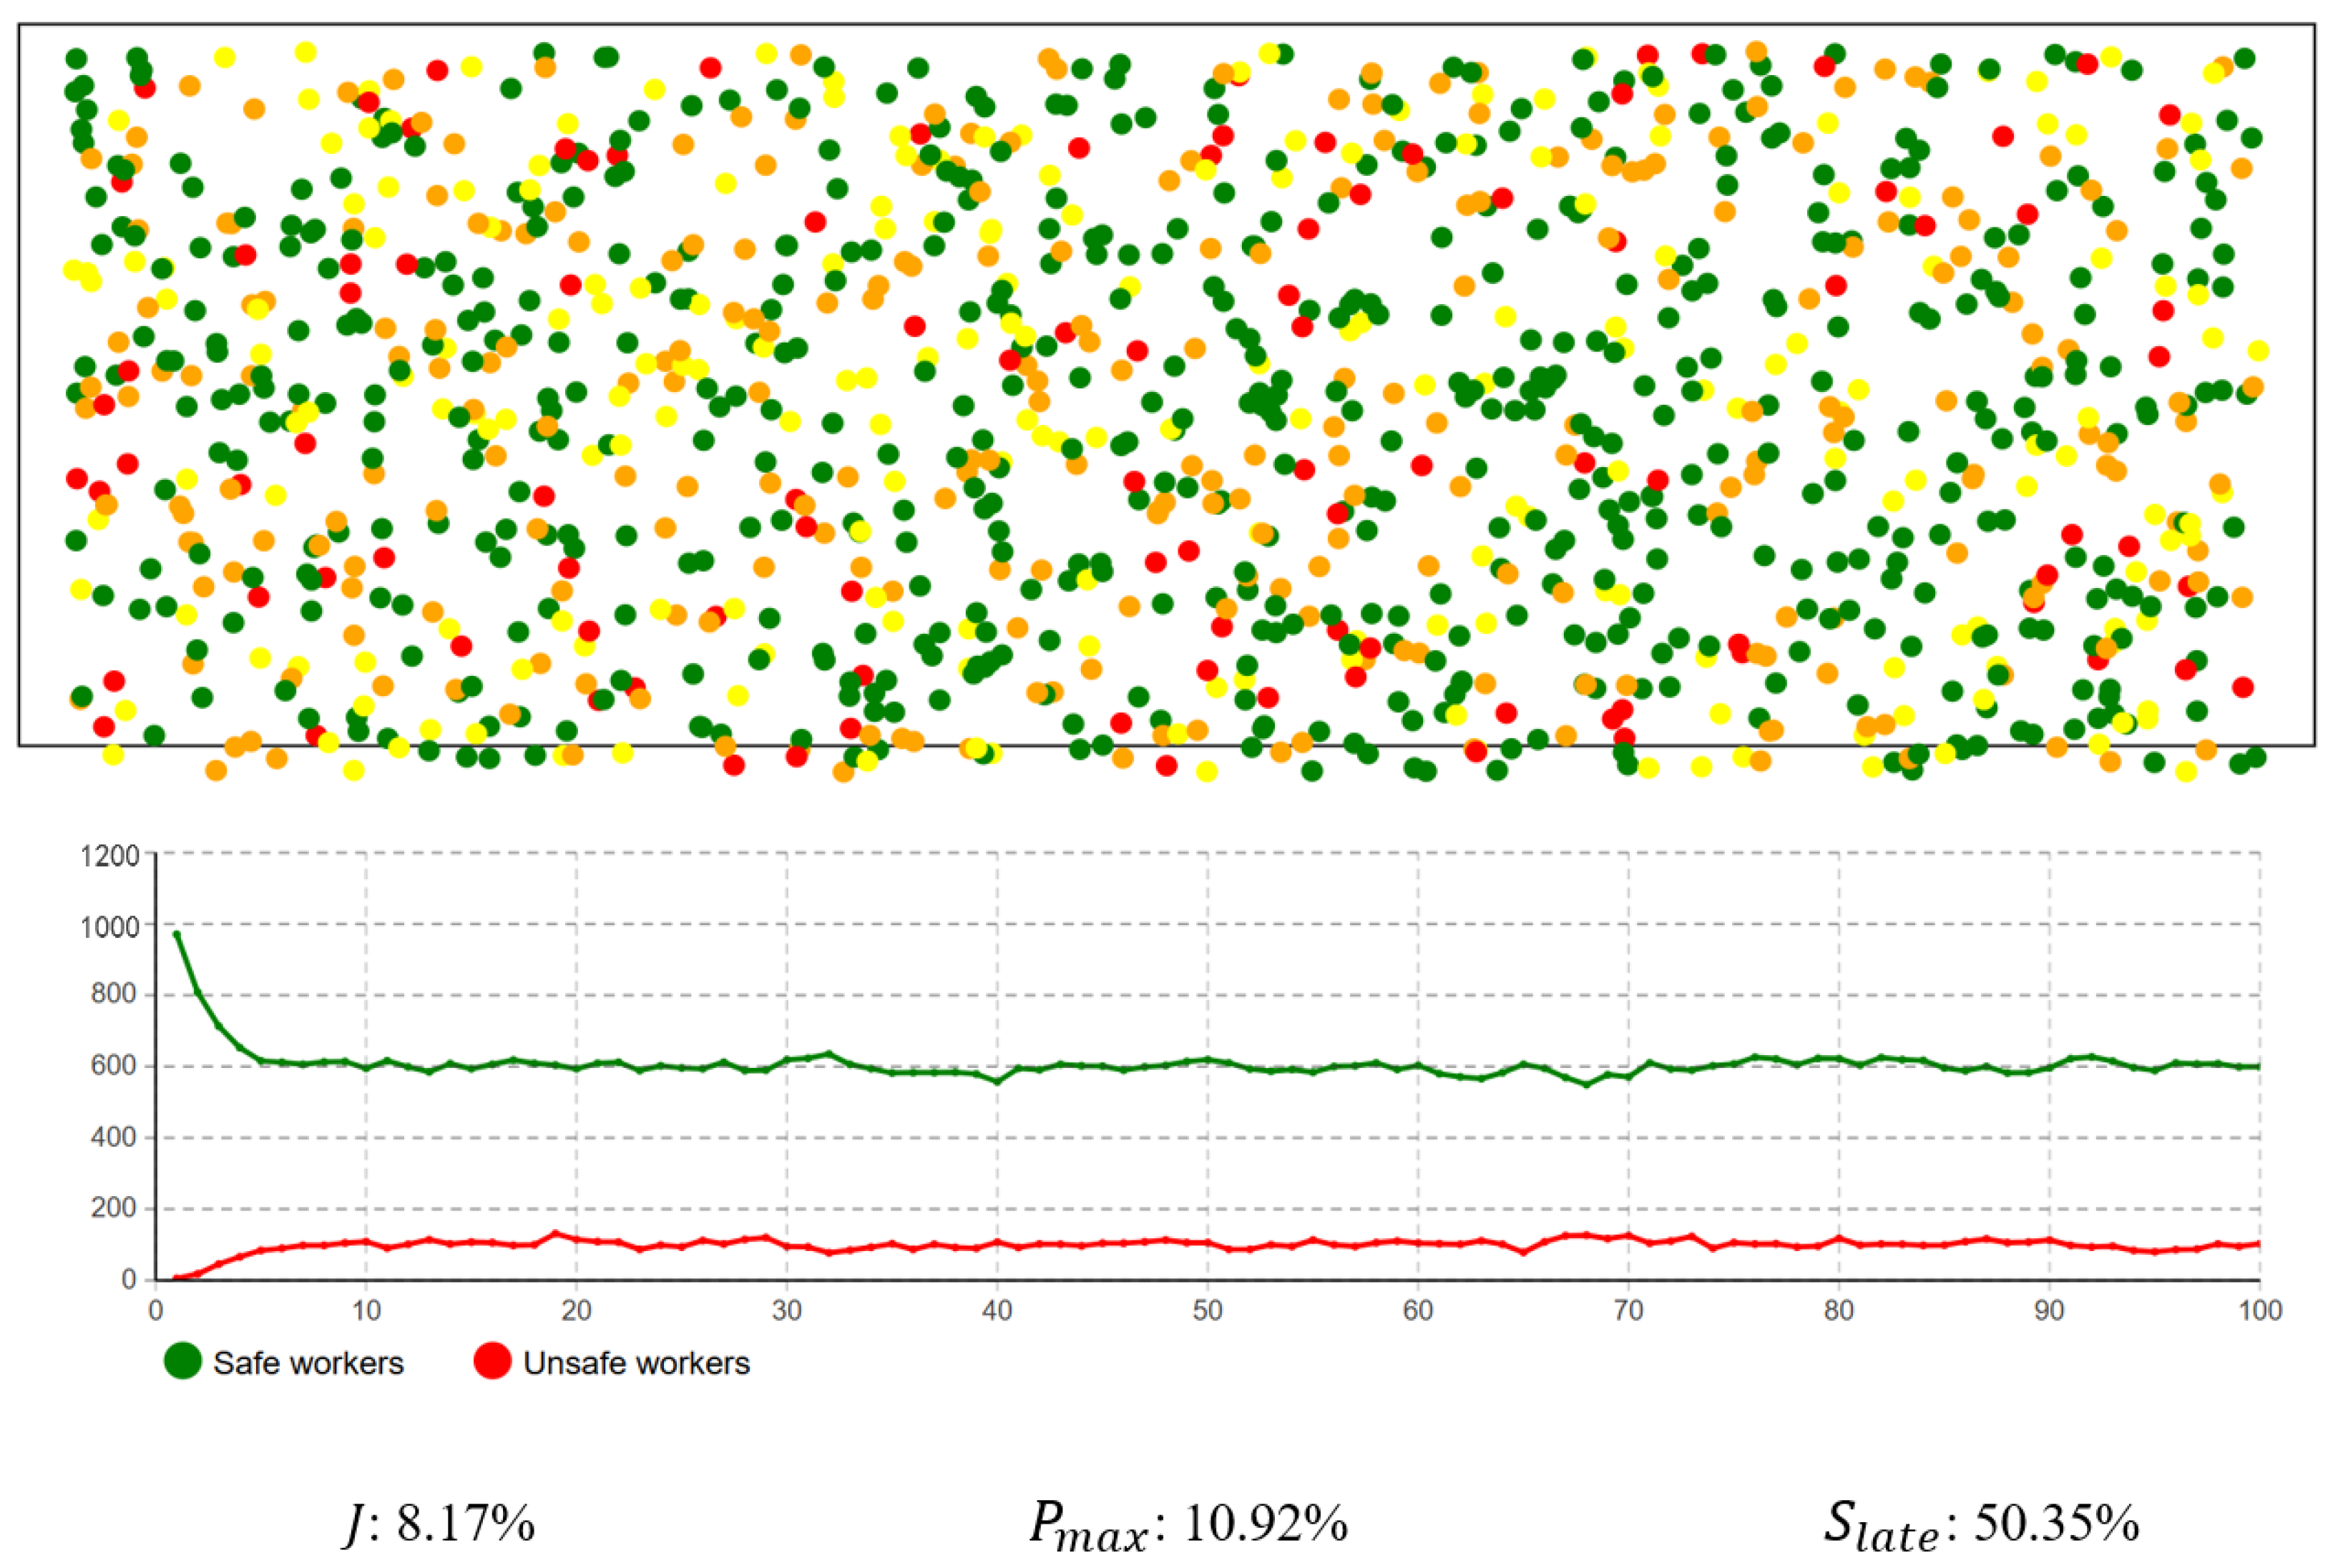
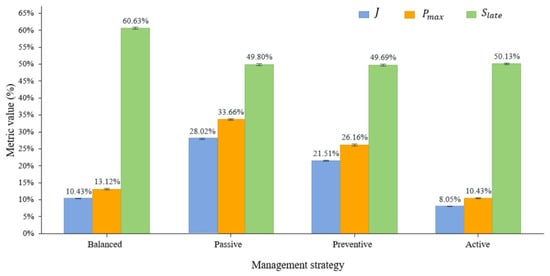
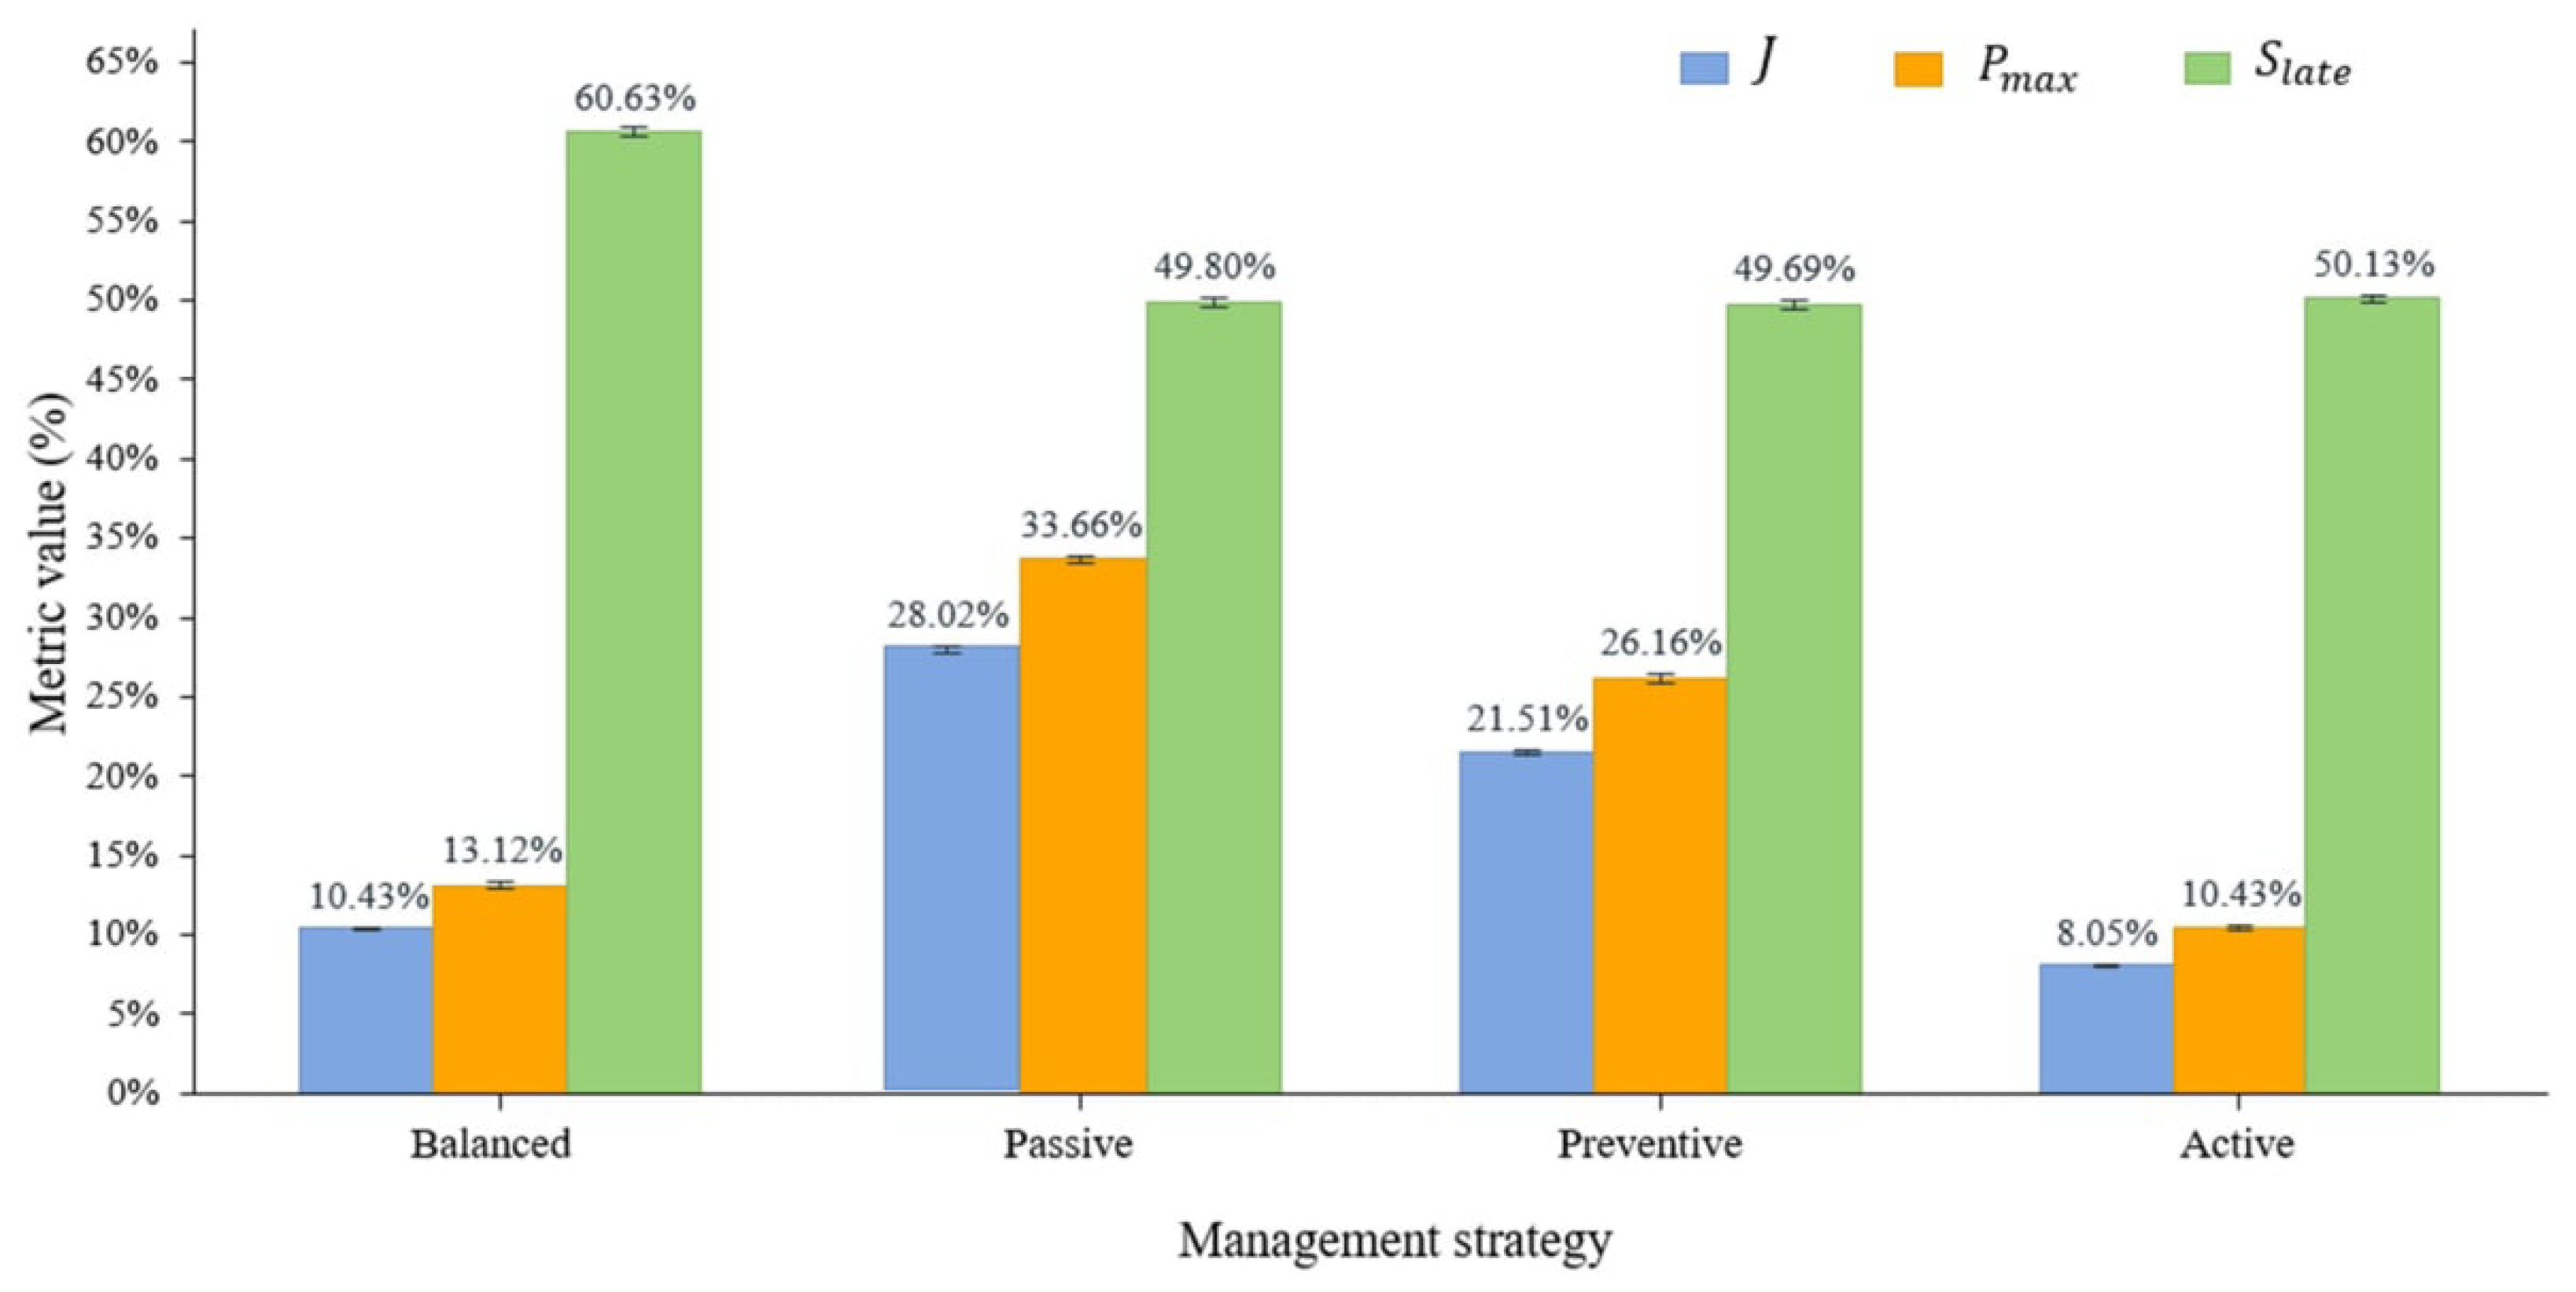
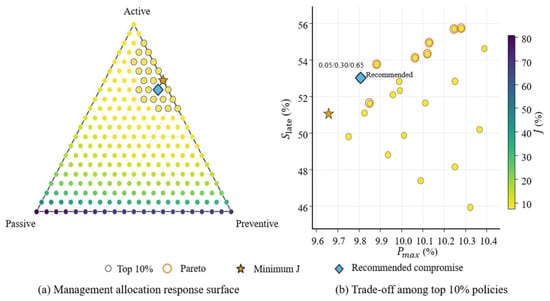
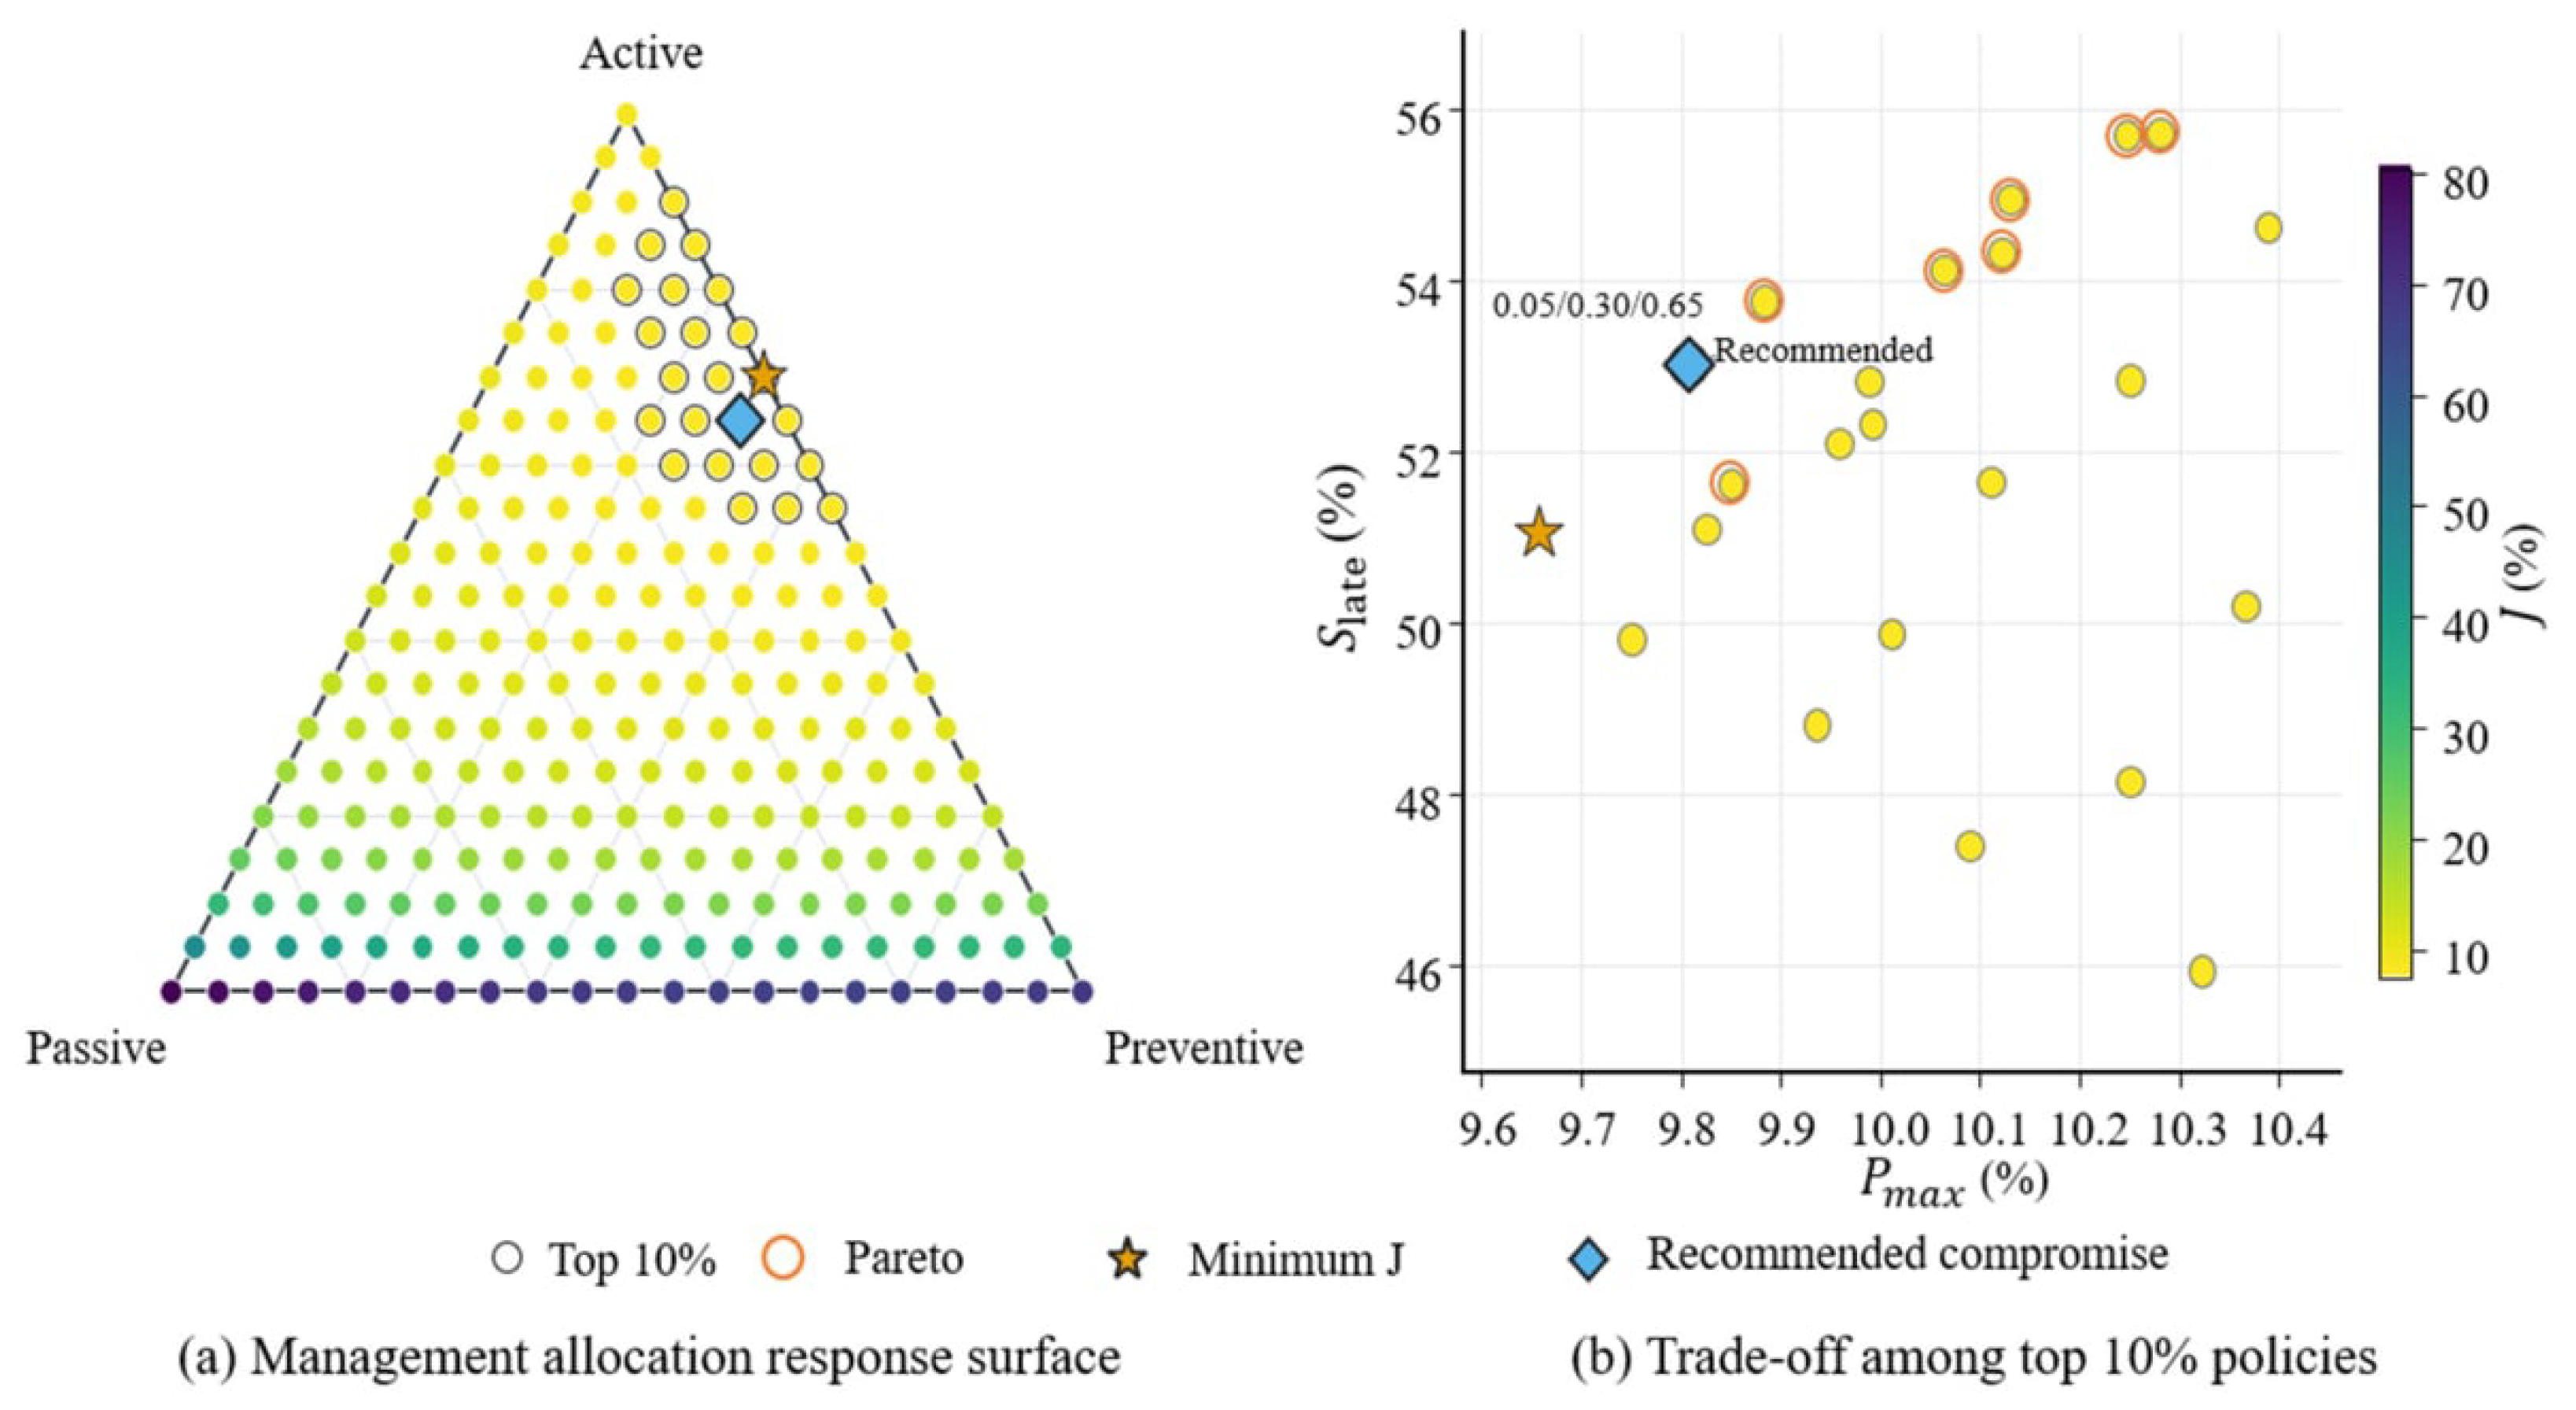
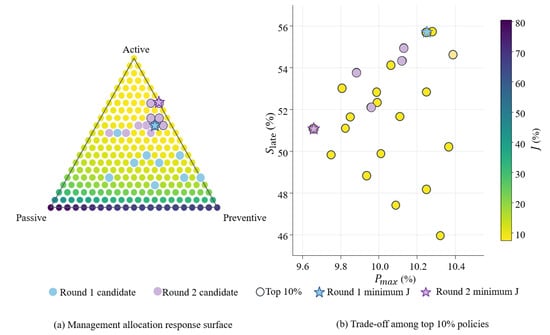
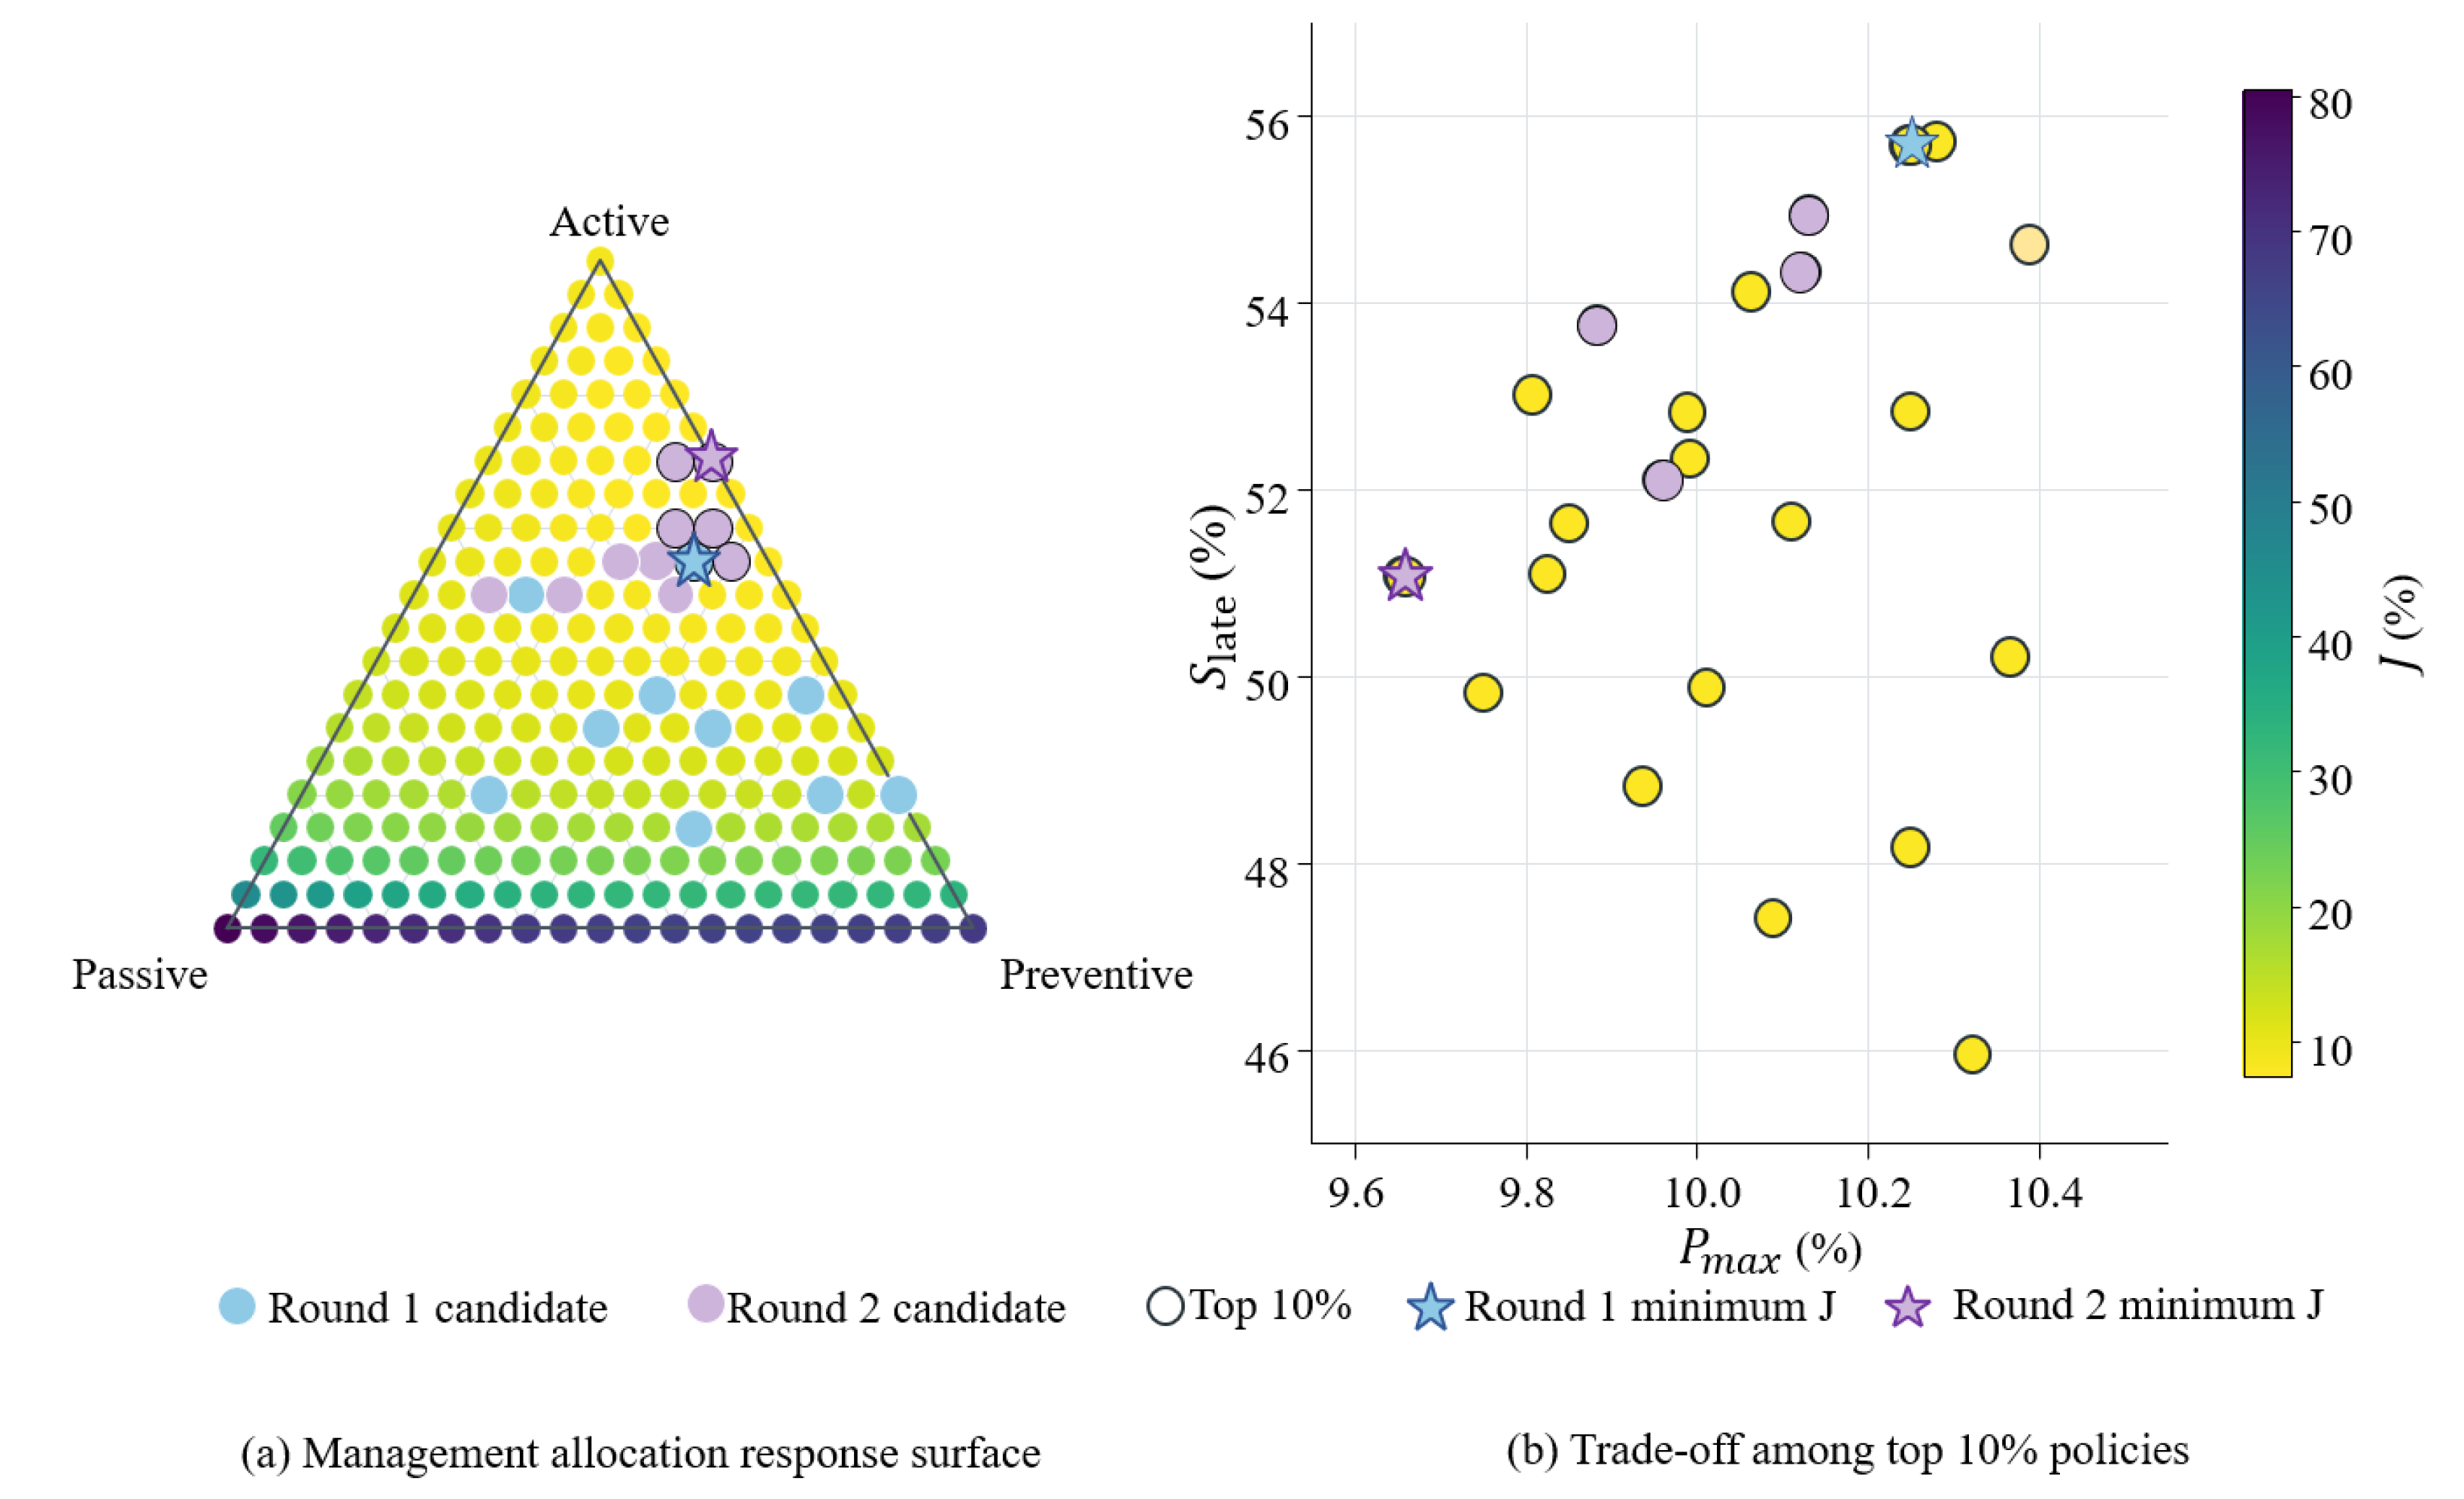
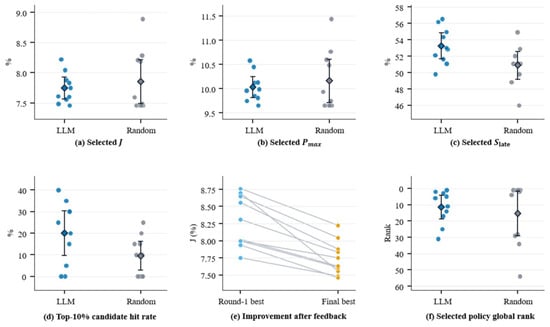
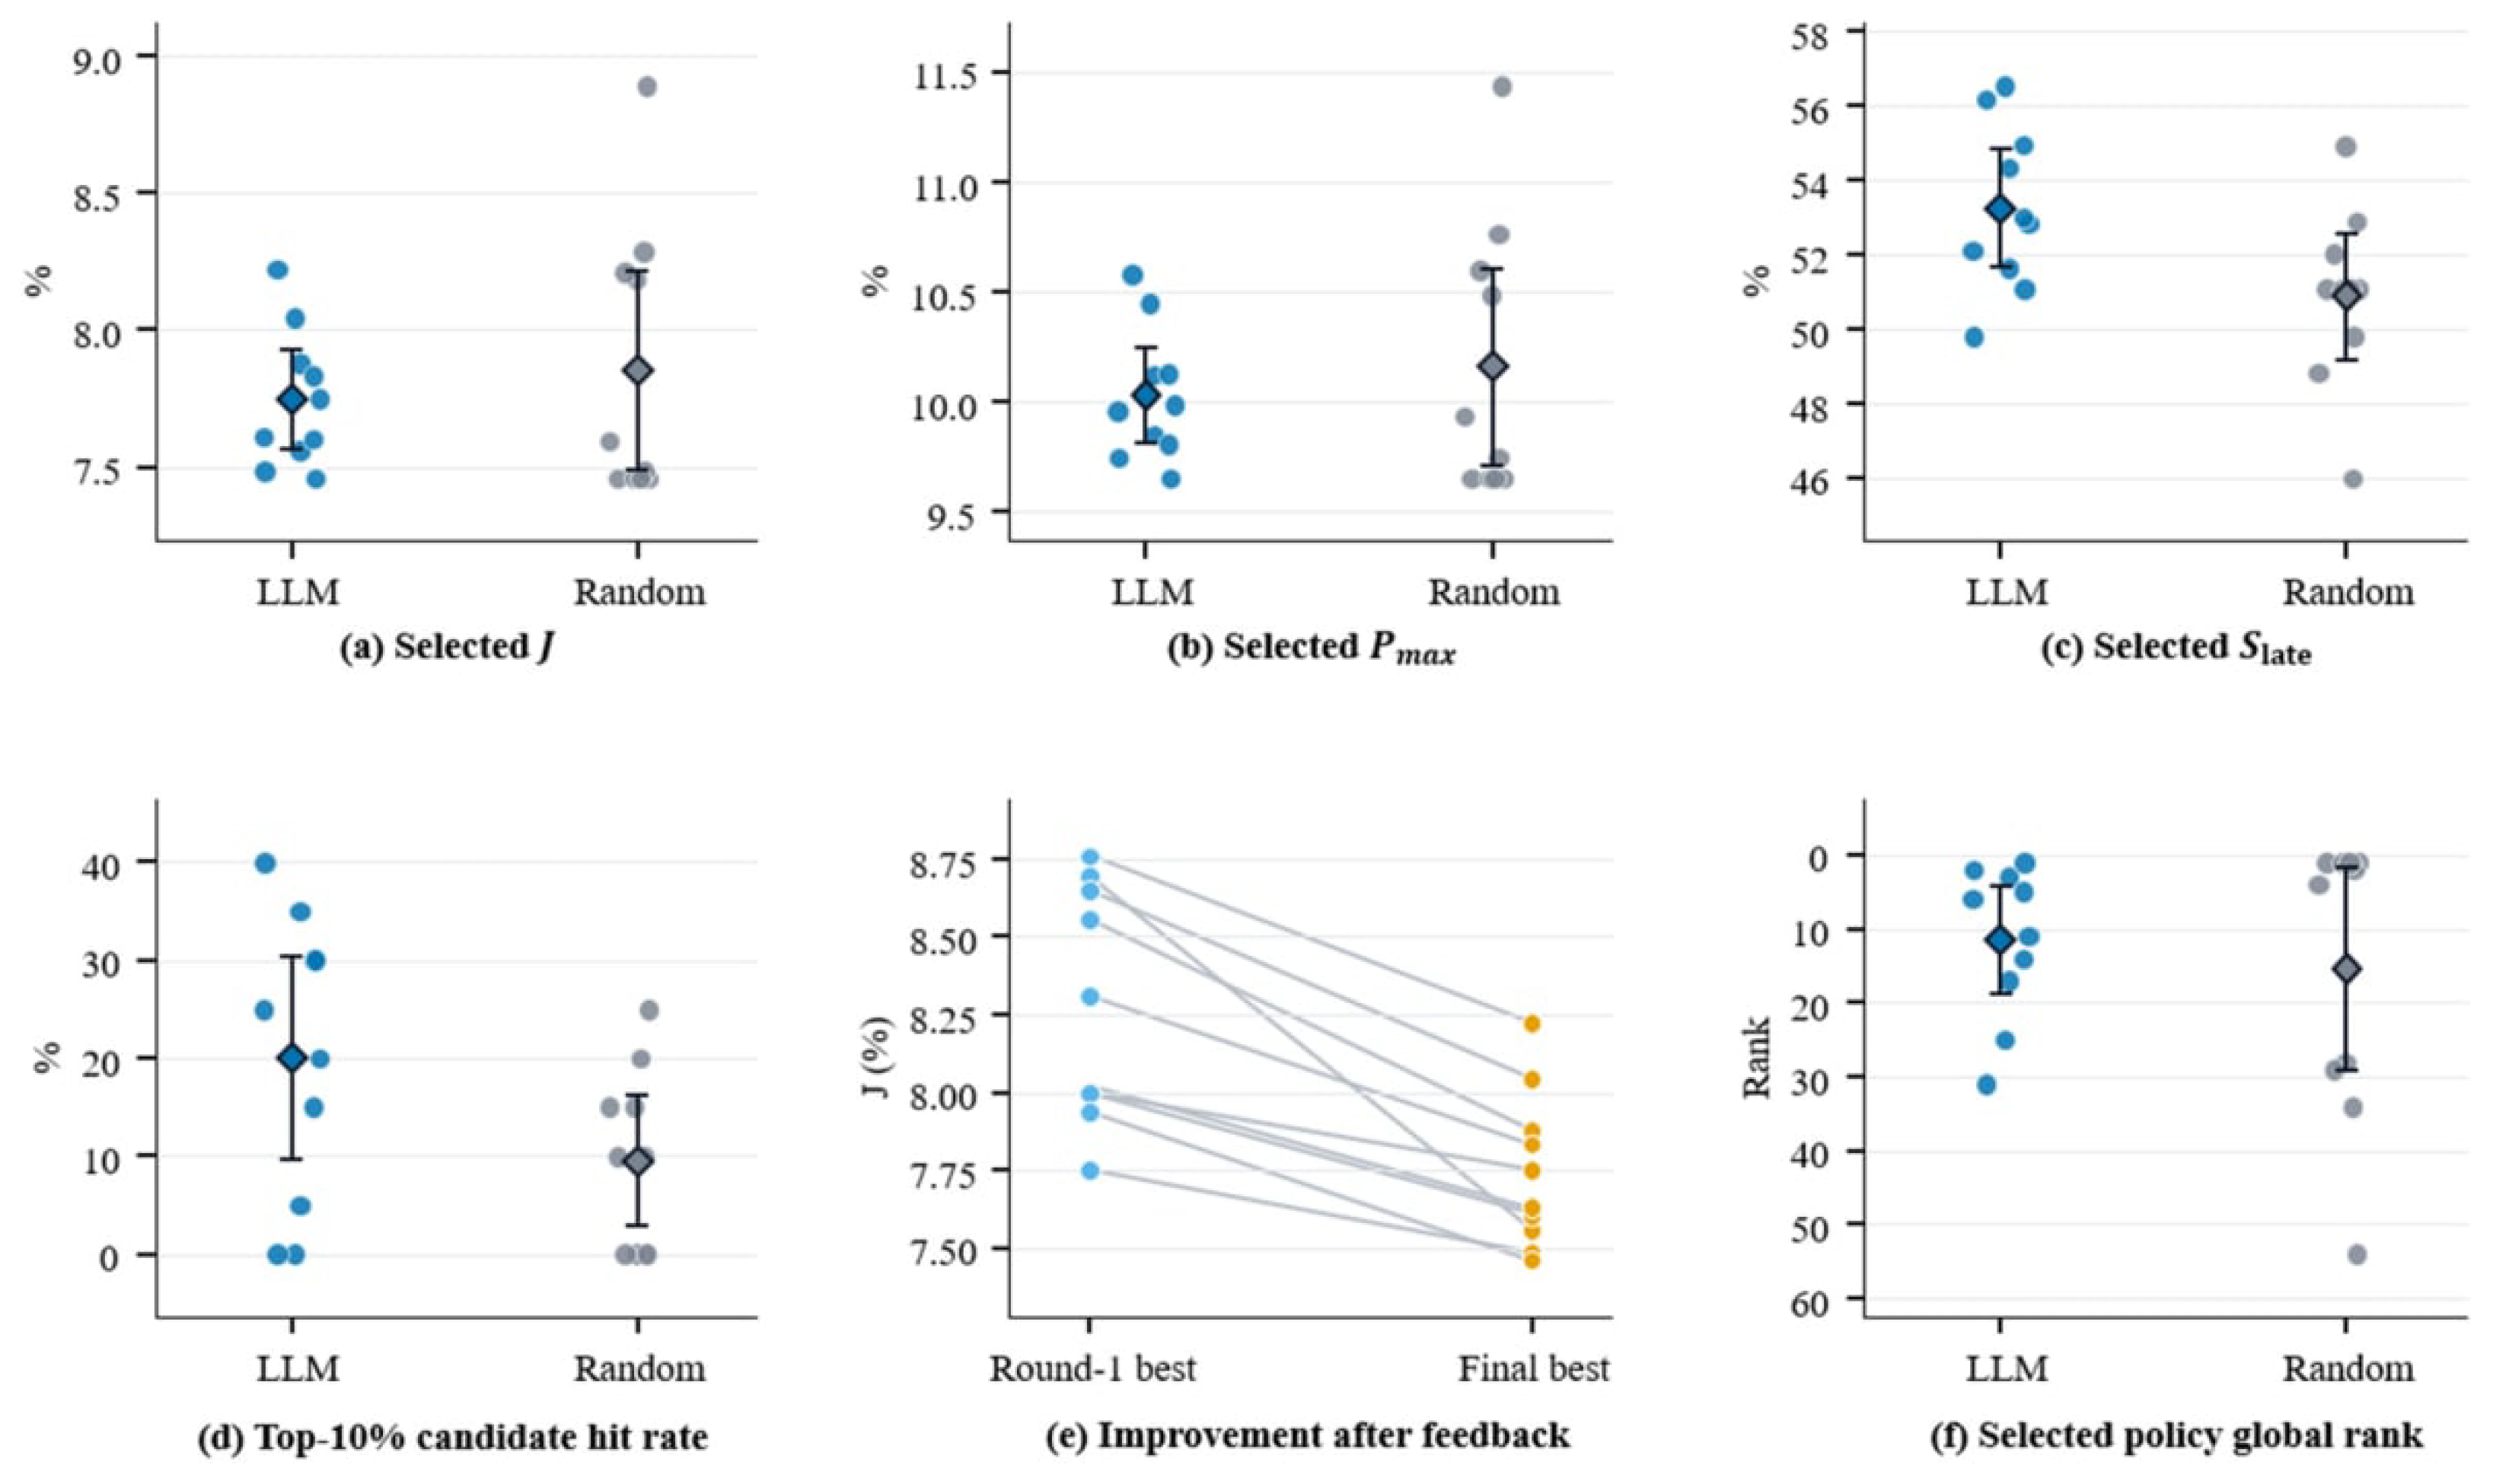

Disclaimer/Publisher’s Note: The statements, opinions and data contained in all publications are solely those of the individual author(s) and contributor(s) and not of MDPI and/or the editor(s). MDPI and/or the editor(s) disclaim responsibility for any injury to people or property resulting from any ideas, methods, instructions or products referred to in the content. |
© 2026 by the authors. Licensee MDPI, Basel, Switzerland. This article is an open access article distributed under the terms and conditions of the Creative Commons Attribution (CC BY) license.