


Abstract
Aiming to address the universal challenge that conventional phase-change material (PCM) walls for cold-climate rural buildings have low overall thermal resistance, causing rapid nocturnal heat loss and poor latent-heat utilization, this work develops composite specimens combining aerogel insulation coating and microencapsulated-PCM mortar for rural residences in Northern China. Experimental measurements and COMSOL Multiphysics®6.3 (COMSOL)-calibrated numerical simulations are adopted to investigate the coupled heat-transfer mechanism and multi-dimensional trade-offs among thermal regulation performance, mechanical properties and PCM cyclic-utilization efficiency. The results reveal that rising PCM dosage reduces the density and thermal conductivity of mortar; the specimen with a 30% PCM sand-replacement ratio plus 5 mm aerogel coating reaches a thermal conductivity of 0.116 W/(m·K). Owing to synergistic effects, aerogel mitigates external thermal disturbances to optimize PCM melting–solidification cycles while PCM buffers indoor temperature swings, delivering improved temperature-attenuation performance. Parametric analysis demonstrates that 30% PCM replacement and 23.0 °C phase-change temperature form a multi-objective equilibrium balancing thermal regulation, mechanical durability and PCM utilization, instead of a thermal-only optimum. Since these parameters are obtained under Dalian meteorological conditions and cannot be generalized, the proposed material–climate matching principle offers analytical references for low-carbon retrofitting of rural building envelopes in other high-latitude cold regions.
1. Introduction
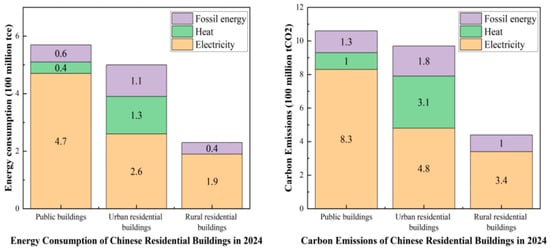
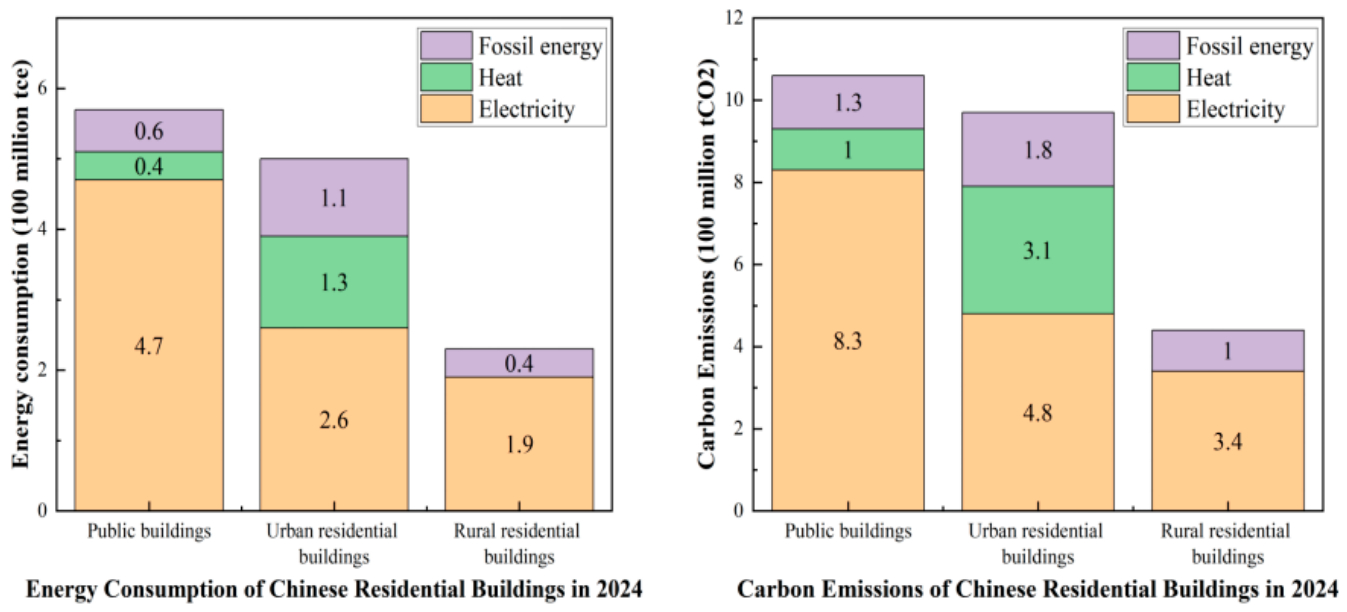
As an important prerequisite for improving the ecological environment and advancing the development of a green economy, the “Dual-Carbon” initiative urgently requires low-carbon development across various sectors [1]. In 2024, the operational energy consumption of civil buildings in China reached 1.30 billion tonnes of coal equivalent (tce), accounting for 21.8% of total energy consumption, with carbon emissions of 2.47 billion tonnes of carbon dioxide (tCO2), representing 22.1% of national energy-related carbon emissions, as shown in Figure 1 [2]. Among these, energy consumption and carbon emissions in rural areas have become increasingly prominent. From 2000 to 2018, both total and per capita residential carbon emissions in rural China exhibited a rapid upward trend, with rural residential carbon emissions contributing 3.0–4.0% to the national total carbon emissions [3]. In 2022, commercial energy consumption of rural residential buildings amounted to 201 million tons of standard coal, accounting for 18% of the total building-sector energy consumption [4]. These data indicate that energy consumption and carbon emissions in rural regions pose a critical challenge to the national “Dual-Carbon” goal and constitute an urgent issue to be addressed for its realization.
Figure 1.
National energy consumption and carbon emissions from civil buildings in 2024 [2].
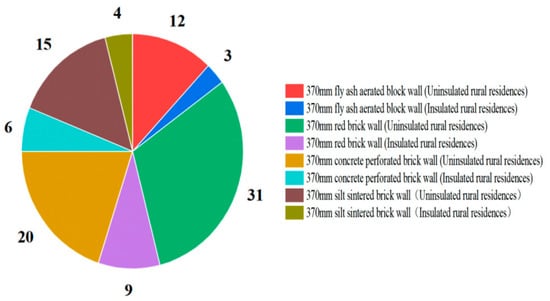
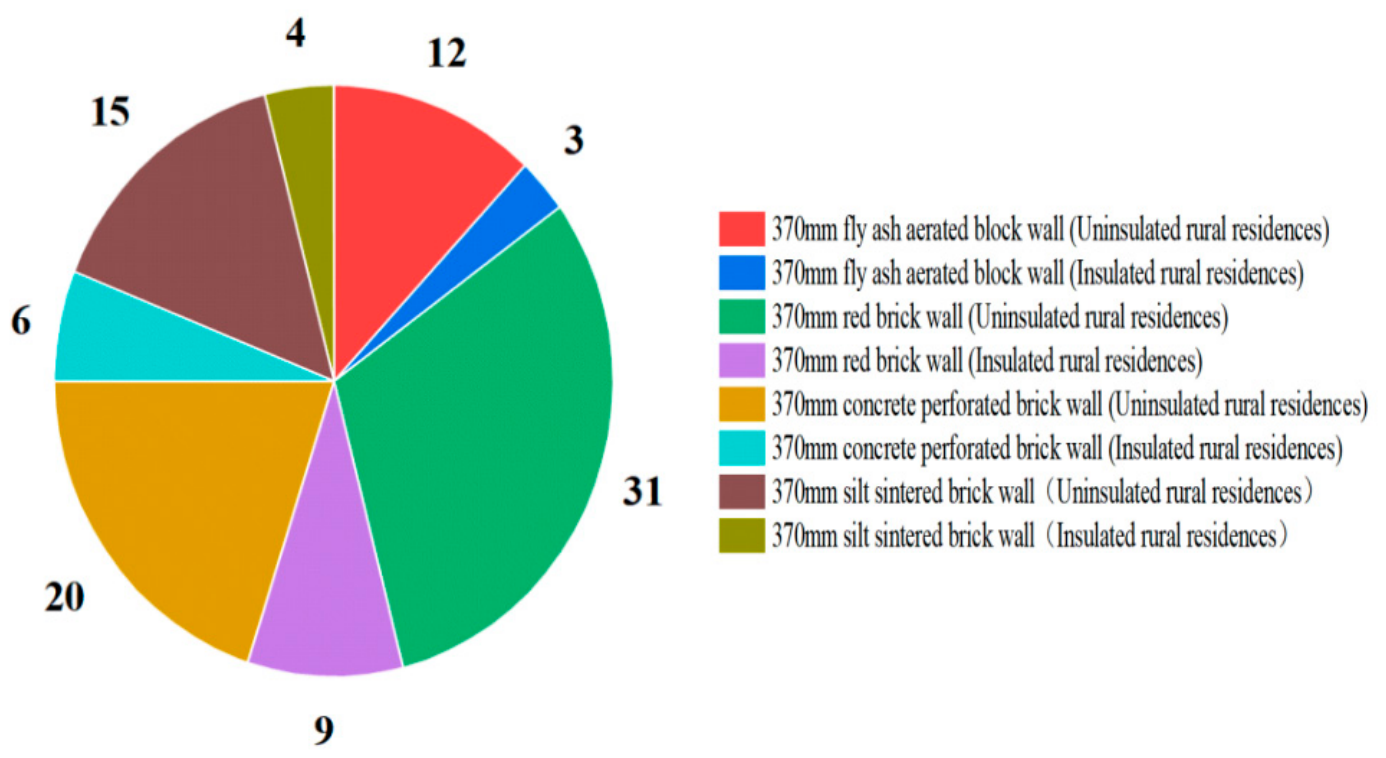
The building envelope of rural residential buildings constitutes one of the core factors affecting building energy consumption. Among its components, the thermal insulation performance of the external envelope exerts a decisive influence on heating and cooling energy consumption [5]. Most rural dwellings in China are self-built, and the wall types of these rural houses are illustrated in Figure 2. It should be noted that the 370 mm in the figure is the standard nominal thickness of solid brick walls in northern rural China, which is the nominal thickness of the wall blocks; the actual construction thickness including the mortar joints is about 380 mm. Restricted by low-level architectural design and construction practices, rural residences suffer from prominent drawbacks such as poor construction quality and unsatisfactory indoor thermal comfort. The vast majority of rural building envelopes lack thermal insulation treatments, featuring thin external walls as well as doors and windows with inferior thermal performance and air-tightness. Consequently, the heating load of rural residential buildings reaches 2–3 times that of urban buildings in the same region [4]. In this context, T. Cheng et al. [6] conducted field investigations on rural housing in cold regions and identified poor thermal performance of building envelopes as the primary cause of high energy consumption. Deng Qinqin et al. [7] focused on optimizing the thermal performance parameters of building envelopes to reduce the energy consumption of rural dwellings. Taking the Hetao area of Inner Mongolia as the research object, Ding Yuxian et al. [8] adopted orthogonal tests, energy-consumption simulation and multiple regression methods, and ranked the primary and secondary influencing factors of building spatial structure as sunspace depth, insulation-layer thickness, and a transparent envelope, in sequence. According to the investigation by Yang Tao et al. [9], the overall thermal performance of existing building envelopes for rural houses in Henan Province is unsatisfactory, which results in substantial heating and cooling energy consumption. Typical rural residential buildings were selected for envelope retrofitting design. The PKPM 2026PLUS software was employed to analyze and calculate the energy-efficiency improvement rate and economic performance, and an energy-efficiency upgrading roadmap for rural residential buildings was proposed with the priority order of roof, external walls, and external doors–windows. Taking central Liaoning Province as a case study, Xueyan Zhang et al. [10] established a thermal-performance optimization model for the heat transfer of rural building envelopes in this severe-cold zone. The NSGA-II algorithm integrated with Rhino + Grasshopper and the EnergyPlus simulation kernel was adopted. The recommended insulation-layer thicknesses for room floors, roofs and external walls were approximately 70 mm, 50 mm and 40 mm respectively, which enabled a 20% reduction in heating energy consumption. Existing academic consensus confirms that insufficient insulation performance of building envelopes acts as a core bottleneck restricting low-carbon heating in rural areas. Without improving the thermal performance of building envelopes, merely relying on clean energy or heating-system upgrading cannot achieve substantial energy-efficiency enhancement. Therefore, improving the thermal insulation capacity of external building envelopes represents an essential approach to saving energy in rural residential buildings in Northern China.
Figure 2.
Proportion of wall types used in rural residential buildings [8].
In the exploration of novel building-envelope technologies, the application of passive thermal energy storage (TES) in building envelopes offers an innovative pathway for improving energy efficiency and cutting energy consumption as well as carbon emissions [11]. Among relevant technologies, latent heat storage employing phase-change material (PCM) is highly attractive owing to its high thermal-storage density under isothermal conditions. When PCMs are integrated into external walls, the thermal inertia of building envelopes increases, which in turn reduces space heating and cooling energy consumption as well as space-cooling energy demand [12,13,14,15,16,17,18,19,20]. Over the past two decades, PCMs have been implemented in building envelopes. Al-Absi et al. [21] proposed a new type of panel incorporating PCM into foamed concrete (FC). Experiments were carried out on scaled test units mounted in different orientations under real-weather conditions. The results demonstrated that the PCM-FC panel significantly decreased the inner-surface temperature and indoor-air temperature of test units by 6.75 °C and 5.50 °C, respectively. Chenglong Luo et al. [22] presented a dual-channel solar PCM thermal-storage wall system with intermediate thermal insulation. Measured data from comparative tests on a hot-box test platform were analyzed. It was found that in winter, both the maximum and average temperatures of the experimental room increased considerably compared with ambient temperature and the reference room, indicating satisfactory heating performance. In an experimental study on heated-floor systems in Auckland, New Zealand, Devaux et al. [23] observed that incorporating PCM with a relatively high melting point into the heated-floor system yielded obvious peak-load shifting. Numerical results revealed that heating energy consumption was reduced by 32% and costs decreased by 42% over a ten-day continuous period. Mathis et al. [24] evaluated the performance of artificial wallboards incorporating PCM under cold-climate conditions. The results showed that the efficiency of PCM wallboards rose as weather became warmer during the heating season, achieving a maximum heating-energy-consumption reduction of 41% in May.
Existing research on integrating PCMs into building walls mainly focuses on heat-capacity enhancement and phase-change-kinetics optimization. Nevertheless, the inherent low-thermal-resistance drawback of PCM systems and the consequent weak thermal insulation of building envelopes have long been overlooked. In heating-dominated climate zones (e.g., rural areas in Northern China), heat stored in walls during daytime tends to dissipate rapidly at night due to insufficient thermal insulation, so the actual energy-saving efficiency is remarkably lower than its theoretical value. In addition to Northern China, rural residential buildings in high-latitude regions such as Northern Europe and Canada are confronted with common challenges in envelope retrofitting under severe cold climates. Ref. [25] argues that phase-change-modified masonry walls in cold climates have demonstrated that the phase-change component can provide considerable latent heat-storage capacity to dampen indoor temperature fluctuations. However, existing solutions generally suffer from a prominent challenge: the phase-change material itself has limited thermal resistance. Even if the phase-change material stores sufficient solar-radiation heat during the daytime, insufficient overall wall insulation causes the stored heat to rapidly dissipate outward at night, significantly reducing the actual utilization rate of the latent heat and weakening the practical energy-saving benefits of the phase-change wall. Ref. [26] features comparative studies on building codes for cold climates in multiple countries, showing that the inherent thermal resistance of the building envelope for a large number of existing rural dwellings in this region is inherently low. Simply adding a phase-change layer inside the wall cannot fundamentally resolve the contradiction between heat-storage capacity and thermal insulation. Such technical imbalance, characterized by “emphasizing heat storage while neglecting thermal insulation”, urgently requires collaborative solutions and reinforcing materials that feature high thermal resistance and favorable structural compatibility.
Aerogels integrate multiple attractive physical properties, including ultra-low density, ultra-high porosity, an ultra-high specific surface area and excellent mass-transfer performance [27]. Silica features low density, high porosity and a large specific surface area [28]; accordingly, silica aerogel is regarded as the best solid thermal-insulation material to date, and possesses extensive research significance and application value in the field of building thermal insulation. Yang et al. [29] conducted a comparative investigation on the thermal performance of aerogel insulation panels (AIPs) against two conventional insulating materials, namely expanded polystyrene (EPS) and glass felt (GF). Experiments were performed to evaluate the critical time when the indoor-air temperature reaches its peak value. The results revealed that AIPs yielded the longest time, exceeding 10 h. Furthermore, the authors predicted the thermal performance of typical external walls with insulation layers placed at different positions. AIPs outperformed the other materials once again, with the predicted temperature fluctuation amplitude reduced by 20% and heat-flux amplitude decreased by 40%. Ibrahim et al. [30] studied the application of aerogel blankets in two thermal-insulation systems: an external thermal insulation composite system (ETICS) and an internal thermal-insulation multilayer system (ITI). The aerogel layer maintained favorable thermal performance even under relatively high relative-humidity conditions. Kosny et al. [31] carried out field comparative thermal-performance tests on aerogel radiant barriers under the climatic conditions of Albuquerque, New Mexico, USA. This composite material reduced ceiling heat flux by 36% on average and attic temperature by 10–12 °C. Simulation data under diverse climatic conditions demonstrated that aerogel-insulated boxes could lower temperatures by at least 10 °C, with the maximum temperature difference (15 °C) observed in Riyadh, Saudi Arabia. Therefore, the lightweight nature and superior thermal-insulation characteristics make aerogels promising building thermal-insulation materials.
In addition, regarding the design of synergistic effects between aerogels and phase-change materials, hierarchical core–shell aerogel frameworks have attracted substantial attention. Liao et al. fabricated nickel foam–kapok fiber core–shell aerogel composite phase-change materials. The carbon nanotube-modified kapok shell achieves efficient light absorption and leakage-suppression confinement, and the nickel foam core constructs rapid internal heat transfer pathways. By virtue of the synergism of the genuine core–shell structure, the performance limitations of single supporting matrices are overcome [32]. Peng et al. adopted a hydrothermal–freeze-drying route to fabricate montmorillonite–carbon aerogel/stearic acid composite phase-change materials. The three-dimensional interconnected network of montmorillonite–carbon aerogel delivers synergistic gains for latent heat storage and heat conduction and favorable cycling stability. This work verifies the application potential of low-cost, clay-based aerogels in energy storage [33]. Wen et al. reported beehive-inspired self-assembled phase-change aerogels, in which phase-change wax particles directly participate in constructing the aerogel network walls. The material simultaneously achieves high latent heat, mechanical toughness and leakage resistance [34].
At present, phase-change materials, as high-efficiency energy-storage and energy-saving materials, have achieved satisfactory effectiveness in energy-saving retrofits of urban buildings. Nevertheless, prominent adaptability barriers emerge when extending such materials to rural residential buildings in Northern China. First, existing designs for PCM-integrated walls are mostly developed for urban-building working conditions, without targeted optimization for the structural drawbacks of rural dwellings in Northern China, such as insufficient wall thickness, simple insulation configurations and substantial heat losses. Second, most existing studies adopt PCMs with a single phase-change temperature, without fully accounting for the local climate characterized by cold winters, hot summers and remarkable seasonal temperature differences. Consequently, the full-cycle thermal-environment regulation requirements of rural residences cannot be met. Meanwhile, aerogel materials exhibit promising application prospects in building thermal insulation owing to their light weight and ultra-low thermal conductivity. However, most existing studies focus on specimen preparation, performance testing and single-point parameter optimization. Few investigations integrate such composite phase-change materials into building envelope components to conduct combined experimental–numerical analysis on practical building thermal regulation performance. The synergistic effect of “basic thermal insulation + phase-change thermal energy storage” has not been realized, and the synergistic energy-saving potential of their combination has not been fully exploited.
To address the aforementioned research gaps, this study investigates an aerogel–phase-change mortar composite wall to meet the envelope-retrofitting needs of existing rural farmhouses in severe-cold regions. Distinct from prior engineering-oriented work that emphasized specimen preparation and parametric trial-and-error, the core scientific contributions of this study are summarized as follows:
- (1)
- Quantitative analysis of the coupled heat-transfer mechanism between the aerogel coating and the phase-change mortar under heating-dominated cold-climate conditions is conducted. This reveals how the externally applied aerogel insulation layer alters the thermal boundary perturbations of the inner-side PCM, thereby regulating the phase-change melting–solidification time window and elucidating the suppression mechanism of nighttime heat dissipation from the PCM-stored heat under cold operating conditions.
- (2)
- The multi-dimensional trade-off relationship among thermal regulation performance, mechanical strength, and phase-change utilization efficiency is revealed. The inherent constraints of mutual growth-and-decline among these three factors under different blending ratios and phase-change temperatures are clarified, avoiding the pursuit of thermal performance alone at the expense of mechanical durability or effective phase-change utilization.
- (3)
- A material–climate matching approach is proposed for the retrofitting of existing rural buildings in severe-cold regions. Rather than being limited to a single set of optimal specimen parameters under the present climate condition, the applicable parameter boundaries of this composite wall are identified, providing a transferable analytical framework for rural envelope retrofitting in other high-latitude cold regions.
On this basis, this study combines specimen experiments and numerical simulation to analyze and evaluate the thermal behavior of the composite wall.
2. Design and Thermal-Parameter Testing of Aerogel–PCM Composite Specimens
In this chapter, microencapsulated PCM (n-octadecane) is first selected as the core material for temperature regulation, and aerogel coating is adopted as the outer thermal-insulation functional layer. Step-by-step experiments are further carried out to investigate the influence of different PCM dosages on the thermal-conductivity performance of mortar. An aerogel thermal-insulation coating is applied onto the mortar matrix, so as to quantify its synergistic enhancement mechanism and the potential thermal performance of composite walls.
2.1. Material Selection of Test-Block Specimens
2.1.1. Selection of PCM
The types of PCMs are listed in Table 1. The core screening criteria for the phase-change material adopted in this study are as follows:
Table 1.
Classification of phase-change materials.
Suitability of phase-change temperature: The phase-change temperature range of the selected PCM shall match well with the indoor thermal comfort range of buildings (20–28 °C), so as to effectively regulate indoor temperature fluctuations induced by diurnal temperature differences.
Favorable thermophysical properties: The material should possess a latent-heat value higher than 160 kJ/kg during phase transition, accompanied by a solid-to-liquid volume-change ratio below 10%, to guarantee its energy-storage density and structural stability.
Therefore, paraffin phase-change material (n-octadecane) is adopted in this study, and microencapsulation is selected as the encapsulation form for the PCM. Microencapsulated PCM is blended with cement mortar to fabricate phase-change mortar. The microencapsulation approach overcomes the leakage problem of PCM in the cement matrix through a core–shell isolation mechanism, and achieves reliable long-term thermal-cycling stability at the cost of a controllable loss of mechanical strength.
2.1.2. Selection of Aerogel
Among numerous advanced and high-efficiency building thermal-insulation materials, aerogels are known as “the world’s lightest solid” and “super thermal-insulation materials” owing to their disruptive nanoporous structure and ultra-low thermal conductivity [35], and exhibit enormous application potential in the field of building energy conservation.
Despite the outstanding performance of aerogel insulation boards, challenges remain concerning their relatively high cost, large-scale production and construction adaptability. In contrast, incorporating nano-/micro-sized aerogel particles as functional fillers into the matrix of building coatings to develop aerogel thermal-insulation coatings has become a highly attractive application strategy. Therefore, comprehensively considering the performance merits of aerogels, application convenience, cost-effectiveness and specific adaptability for energy-saving building retrofits, aerogel thermal-insulation coating is selected as the research object in this paper.
2.2. Specimen Preparation Scheme
The objective of this subsection is to prepare phase-change mortar specimens with varying PCM contents by incorporating different proportions of microencapsulated PCM into cement mortar, and further prepare aerogel–PCM composite specimens on the basis of these phase-change mortar specimens.
2.2.1. Fabrication of Cement Mortar Specimens
In accordance with the requirements for plastering mortar specified in the national standard Technical Specification for Plastering Mortar (JGJ/T 220-2010) [36], an M15-grade cement mortar mix proportion is adopted for the plastering mortar prepared in this study. The detailed mix proportions are presented in Table 2.
Table 2.
Amount of cement plastering mortar material [33].
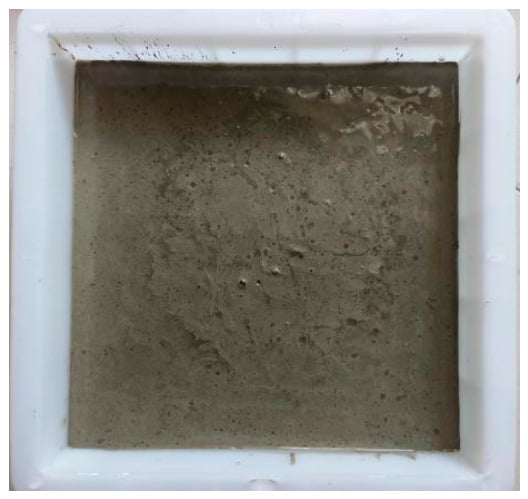
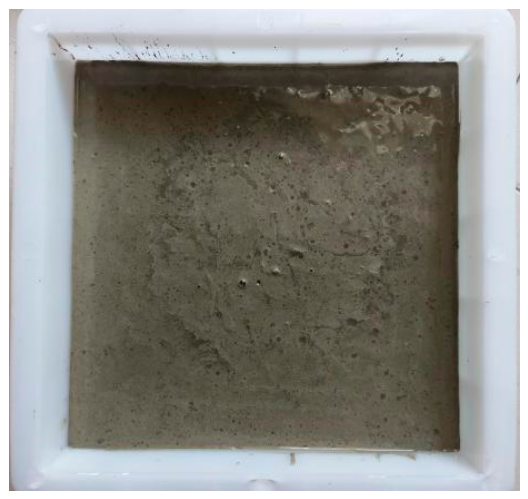
The cement mortar was prepared by manual mixing. Specimens were fabricated using molds. According to the test requirements of the subsequent thermal-conductivity measuring instrument, all specimens in this study are scaled-down small specimens with a uniform dimension of 200 mm × 200 mm × 20 mm (length × width × thickness). Cement and sand were weighed respectively and mixed to obtain dry-mixed mortar. A certain mass of water was then added into the dry-mixed mortar in batches. After thorough stirring and blending, the mixture was poured into molds, as illustrated in Figure 3.
Figure 3.
Cement-mortar preparation.
2.2.2. Fabrication of Phase-Change Mortar Specimens
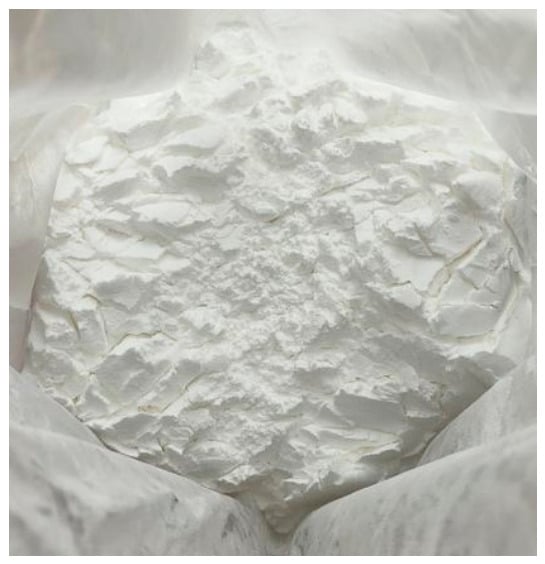
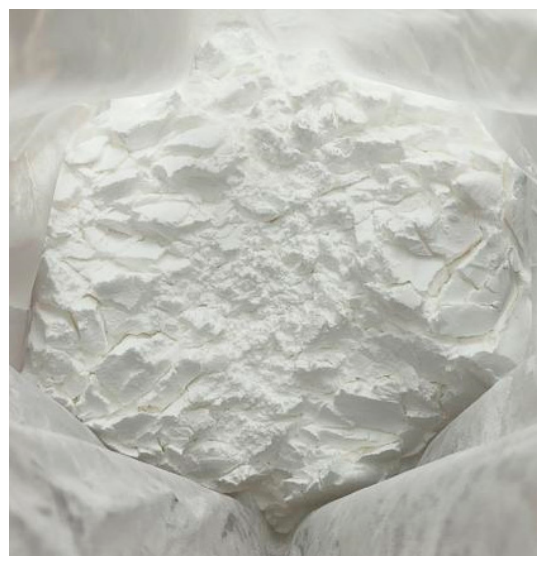
For the preparation of phase-change mortar, microencapsulated PCM was used to replace sand at different proportions on the basis of cement-mortar preparation. The microencapsulated PCM adopted in this experiment is 22.0 °C microencapsulated phase-change powder manufactured by Shanghai Xinya New Material Technology Co., Ltd., Shanghai, China. It appears as white powder, as shown in Figure 4.
Figure 4.
Appearance of microencapsulated phase-change material.
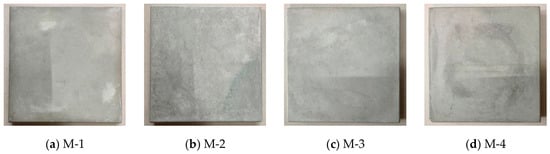
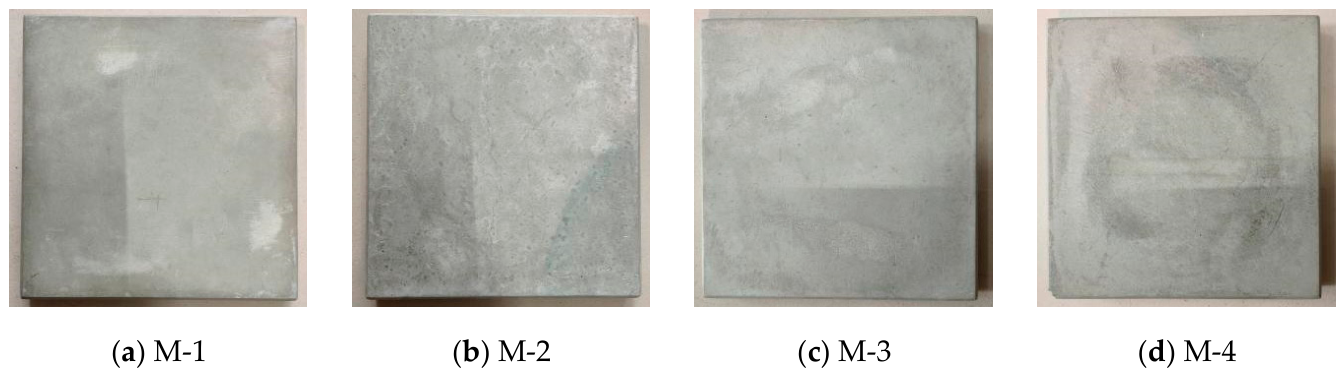
The mortar specimens fabricated in this study are displayed in Figure 5, including: ordinary cement mortar, coded M-1; phase-change mortar with a ratio of 10% sand replaced by PCM, coded M-2; phase-change mortar with a ratio of 20% sand replaced by PCM, coded M-3; and phase-change mortar with a ratio of 30% sand replaced with PCM, coded M-4.
Figure 5.
Mortar test block.
Mortar poured into molds was covered with plastic cling film. After approximately 48 h of setting at room temperature, the specimens were demolded, followed by 28-day curing under standard environmental conditions. Subsequent experiments were conducted only after the specimens satisfied the structural-strength requirements.
2.2.3. Fabrication of Aerogel–PCM Composite Specimens
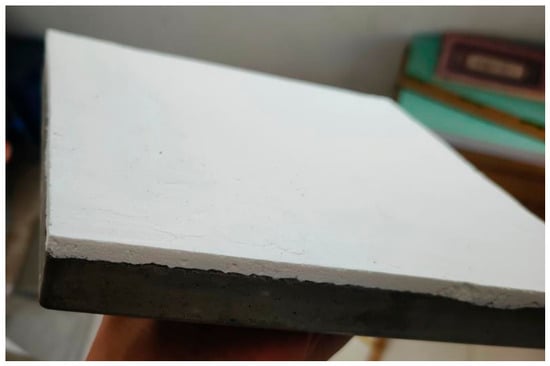
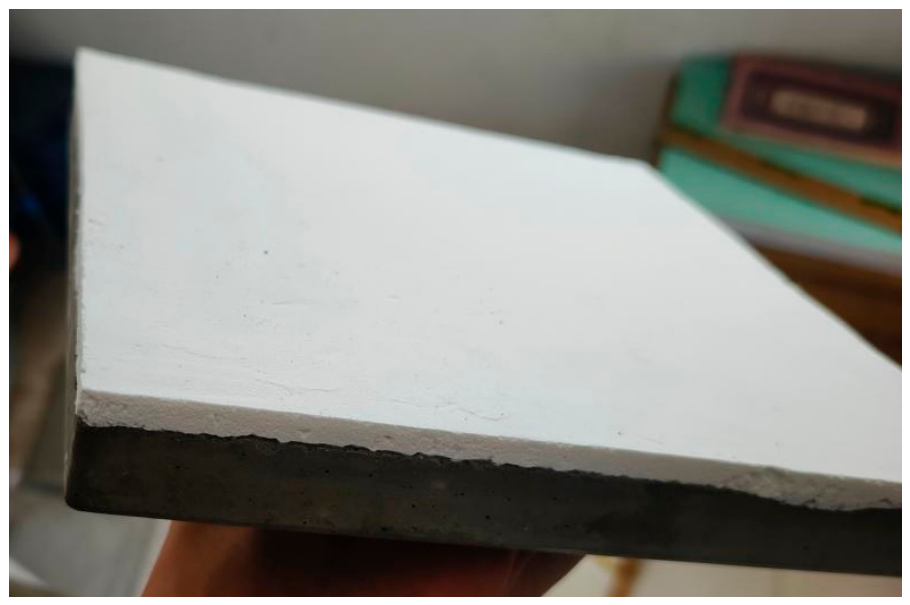
The aerogel coating adopted in this study was produced by Guangdong Senate New Material Technology Co., Ltd., Shaoguan, Guangdong Province, China, with a thermal-conductivity coefficient of 0.035 W/(m·K). The designed coating thickness in this work is 5 mm. According to construction requirements, the coating was applied in two passes: the first pass with a thickness of 3 mm, and the second pass after an interval of more than 24 h. The finished specimens after coating are shown in Figure 6. In accordance with the manufacturer’s construction instructions, the specimens were cured at room temperature for 3 days before subsequent experimental tests. Prior to thermal-performance testing, all specimens were placed in an environmental chamber under constant conditions (20 ± 0.5 °C, relative humidity (RH) = 50 ± 3%) for 14 days for preconditioning. This preconditioning procedure aimed to stabilize the internal moisture state of cement mortar and silica aerogel coating and eliminate the influence of residual curing water on thermal measurement. After preconditioning, the surface moisture of specimens was confirmed to reach equilibrium before installation in the test rig.
Figure 6.
Aerogel coating.
2.3. Thermal-Parameter Testing Methods
(1) Test instrument
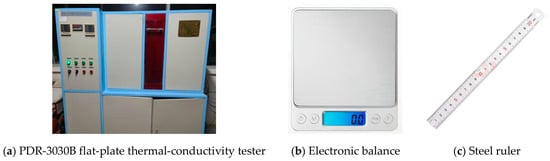
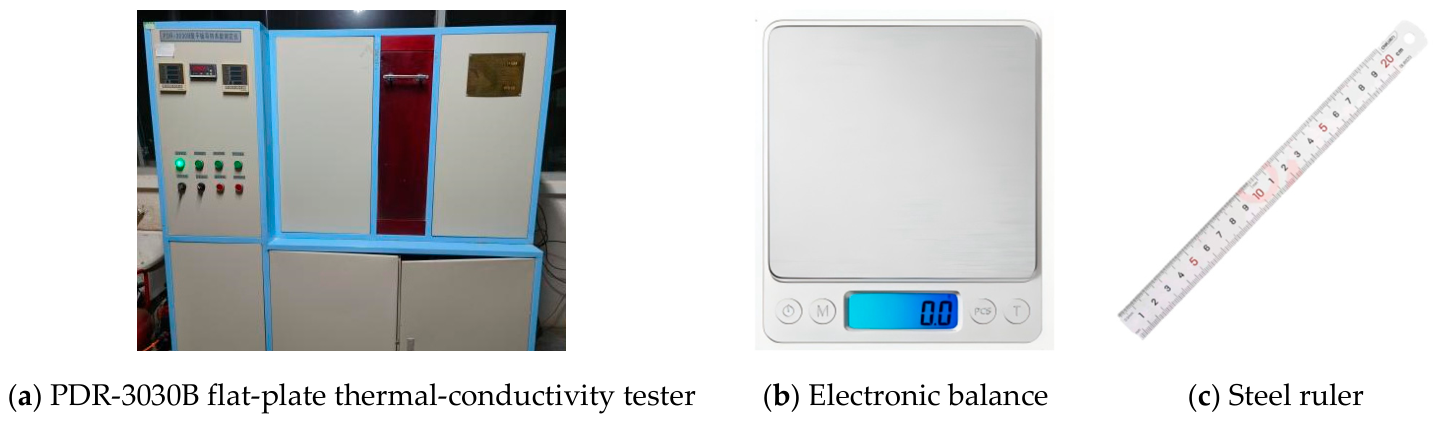
The thermal-conductivity coefficient of mortar specimens was measured using the PDR-3030B plate thermal-conductivity tester (Beijing Newlead Technology Co., Ltd., Beijing, China), as shown in Figure 6. Its detailed technical specifications are summarized in Table 3.
Table 3.
PDR—3030B flat-plate thermal-conductivity tester main performance parameters.
The density of specimens was indirectly calculated by measuring their mass and volume using an electronic balance and a steel ruler. Photographs of the electronic balance and steel ruler are presented in Figure 7, and their detailed specifications are listed in Table 4.
Figure 7.
Diagram of experimental apparatus.
Table 4.
Experimental instrument information.
(2) Density measurement
The density of mortar specimens was determined by an indirect-measurement method, and the specimen density was calculated according to Equation (1).
where ρ is the specimen density, kg/m3; M is the specimen mass, kg; V is the specimen volume, m3.
(3) Thermal-conductivity-coefficient measurement
The prepared specimens were placed into the PDR-3030B flat-plate thermal-conductivity tester. The cold-plate temperature was set to 15 °C, the hot-plate temperature to 30 °C, and specimen thickness to 0.02 m. This temperature range covers the actual temperature-variation range (15–30 °C) inside walls during the transition season in Dalian, which can reflect the real thermal-conductivity performance of materials under the target working conditions of this study. Meanwhile, this temperature range also covers the phase-change interval (22–23 °C) of the phase-change material, and can characterize the thermal-conductivity characteristics of the matrix before and after phase change. The total test duration was 6 h, among which the first 3 h was for system stabilization and the subsequent 3 h served as the metering period. After 6 h, the thermal-conductivity coefficient of the specimen was automatically calculated by the system.
According to the experimental error-reduction method, each set of data involved above was measured three times, and the final average value was adopted.
2.4. Test Results of Specimen Thermal-Parameters
In accordance with the density and thermal-conductivity coefficient test methods described in Section 2.3, the density parameters of the four specimens are shown in Table 5, and the thermal-conductivity coefficients of phase-change mortar specimens are listed in Table 6. Thermal-conductivity coefficient tests were carried out on the four specimens with aerogel coating, and the test results are presented in Table 7.
Table 5.
Density testing of test blocks.
Table 6.
Thermal-conductivity coefficient of phase-change mortar specimens.
Table 7.
Thermal-conductivity coefficient of aerogel–PCM composite specimens.
The test results indicate that the density of phase-change mortar decreases with the increase in the ratio of sand replaced by microencapsulated PCM, which helps reduce the dead-weight of walls. Nevertheless, the mechanical strength of mortar should still satisfy relevant requirements. According to existing studies, the compressive strength can meet standard requirements when the ratio of sand replaced by PCM in cement mortar does not exceed 30% [37]. Therefore, a maximum sand-replacement ratio of 30% is adopted in this study.
Since the actual dimensions of the specimens for volume calculation were measured using a steel ruler, rather than the nominal mold dimension (200 mm × 200 mm × 20 mm), the volumes listed in Table 5 show a certain deviation from the theoretical volume (0.0008 m3) described earlier.
It can be concluded from the measurement results in Table 6 that, compared with the ordinary mortar specimen M-1, the thermal conductivity of other phase-change mortar specimens incorporating microencapsulated phase-change material decreases by more than 65%. Moreover, the thermal-conductivity coefficient of specimens declines with the increase in the doping ratio, which effectively improves the thermal-insulation performance of mortar.
From the test results in Table 7, owing to the adiabatic property of the aerogel thermal-insulation coating, the thermal conductivity of mortar specimens can be further reduced. Among all groups, the ordinary mortar specimen M-1 achieves the largest reduction of 73.2% after applying the aerogel coating compared with its original value (0.9120 W/(m∙K)). The thermal conductivity reduction ratios of phase-change mortar specimens are 61.9%, 59.5% and 57.8%, respectively. It can be concluded that aerogel coating has a remarkable effect on reducing the thermal-conductivity coefficient of walls, which lays a foundation for the subsequent performance optimization of composite walls.
3. Study on Thermal Performance of Aerogel–PCM Composite Specimens
On the basis of the prepared phase-change mortar specimens, an experimental platform was built in this chapter to comparatively analyze the temperature response of specimens to outdoor temperature variations under the combined effects of aerogel and phase-change materials.
3.1. Experimental Method
3.1.1. Experimental Objectives
Adding phase-change materials into building envelopes can reduce the amplitude of indoor temperature fluctuation and delay the time when indoor temperature reaches its peak, so as to improve indoor thermal comfort. Nevertheless, inappropriate configuration of phase-change materials may conversely degrade indoor thermal comfort and bring adverse effects. Therefore, this experiment was designed to investigate the combined effects of aerogel and phase-change materials on the inner-surface temperature of building envelopes.
3.1.2. Experimental Design
(1) Test specimens
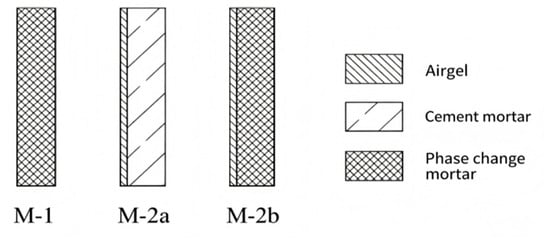
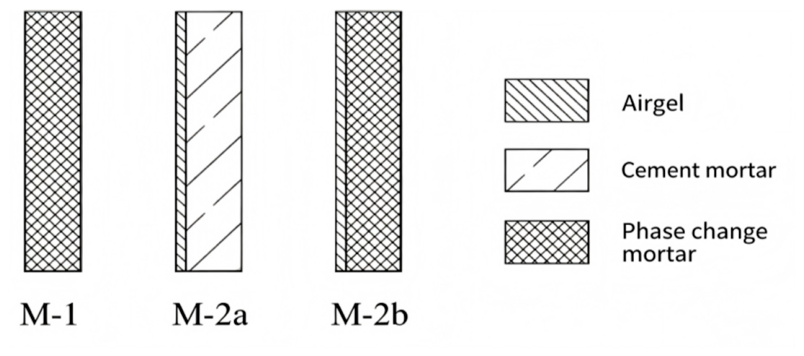
Three types of test specimens were selected in the experiment, namely phase-change mortar, aerogel-coated cement mortar, and aerogel-coated phase-change mortar. The specimen structures are shown in Figure 8, and their configurations and codes are summarized in Table 8. By pairwise comparison among the three groups of specimens, the respective effects of aerogel and phase-change materials on mortar blocks can be analyzed, and further the influencing mechanism of the two materials on the heat-transfer characteristics of walls can be obtained.
Figure 8.
Structure of test block.
Table 8.
Test block numbering and construction.
(2) Experimental procedures
- (i)
- Test-rig construction: The specimens were fixed on the window frame with extruded polystyrene (XPS) thermal-insulation boards. Temperature sensors and heat-flux sensors were arranged, and the data-acquisition equipment was installed and debugged to guarantee normal operation of the instruments.
- (ii)
- Data measurement and recording: The recording interval of the data logger was set to 10 min, and continuous measurement was performed for 7 days. After the experiment, the data were transmitted to a computer for subsequent data analysis. Repeated parallel specimen tests were not carried out in the present work due to the limitation of the test mold and material preparation workload. To reduce random measurement error, each specimen was kept undisturbed after installation, and measurements were only started after thermal equilibrium. Parallel repeated tests on replicated specimens will be conducted in follow-up research to further verify the reproducibility of the observed synergistic thermal performance. Before the formal 7-day transient thermal cycle test, a pre-test was conducted to reach a thermal steady state. The steady-state convergence criterion was defined as: the fluctuation of measured inner- and outer-surface temperatures within consecutive 30 min less than ±0.2 °C. When this criterion was satisfied, the formal transient data acquisition was initiated.
- (iii)
- Data processing and analysis: The obtained temperature and heat-flux data were presented in the form of charts. Evaluation indices for building thermal performance, such as attenuation multiple and time lag, were adopted to calculate the performance of the three kinds of specimens, and the calculated results were further discussed and analyzed.
3.1.3. Test-Rig Construction
The test room is a student dormitory and the window for this test faces due south. Neither heating nor air-conditioning equipment is operated during the transition season, and the indoor space maintains natural room-temperature conditions. The data-acquisition system synchronously records the hourly indoor-air temperature. Since solar radiation was not a dominant influencing factor in this experiment, the solar radiation on specimen surfaces was not measured directly. This study adopted the public hourly solar radiation data from the local meteorological station in Dalian for the same period as a reference. Solar radiation sensors will be installed in subsequent relevant tests to obtain direct irradiation data.
- (1)
- Specimen fixation: XPS thermal-insulation boards were adopted in this experiment. Three holes of 200 mm × 200 mm were cut on the insulation boards to fix the test specimens (Figure 9). The surrounding gaps were filled with foam sealant.
- (2)
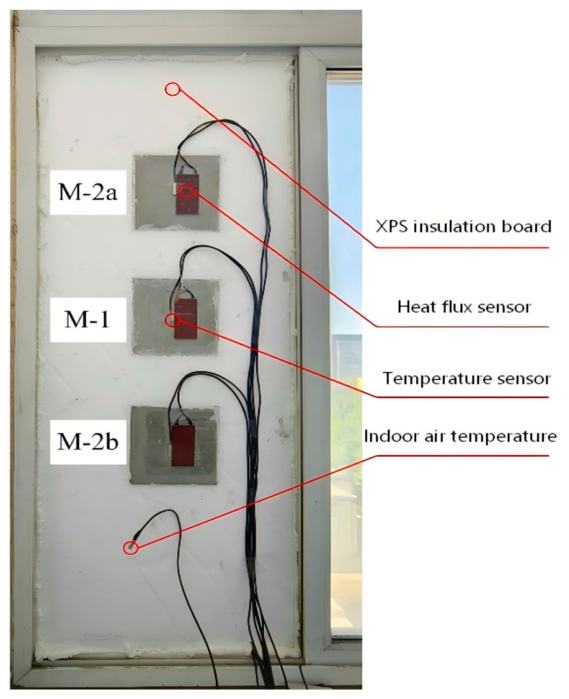
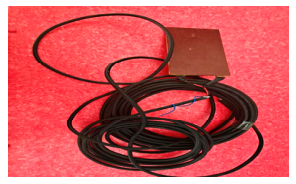
- Measuring-point arrangement: In this experiment, the inner- and outer-surface temperatures as well as the inner-surface heat-flux density of specimens needed to be measured. One temperature sensor was arranged at the central point of both inner and outer surfaces for each specimen, and one heat-flux density sensor was mounted on the inner surface simultaneously. A schematic diagram and on-site photograph of the measuring-point layout are shown in Figure 10 and Figure 11, and the sensor parameters for each measuring point are listed in Table 9.
- (3)
- Specimen installation: The assembled XPS insulation board with measuring points installed was fixed onto the window frame. The peripheral gaps were sealed with foam adhesive to prevent air infiltration.
- (4)
- Instrument installation: Eight cables of temperature sensors and three cables of heat-flux sensors were connected to the temperature channels T1-T8 and heat-flux channels Q1–Q2 of the data logger, respectively. The data-recording interval was set to 10 min.
Figure 9.
Test block fixation. (a) Outer surface of XPS thermal-insulation board; (b) inner surface of XPS thermal-insulation board.
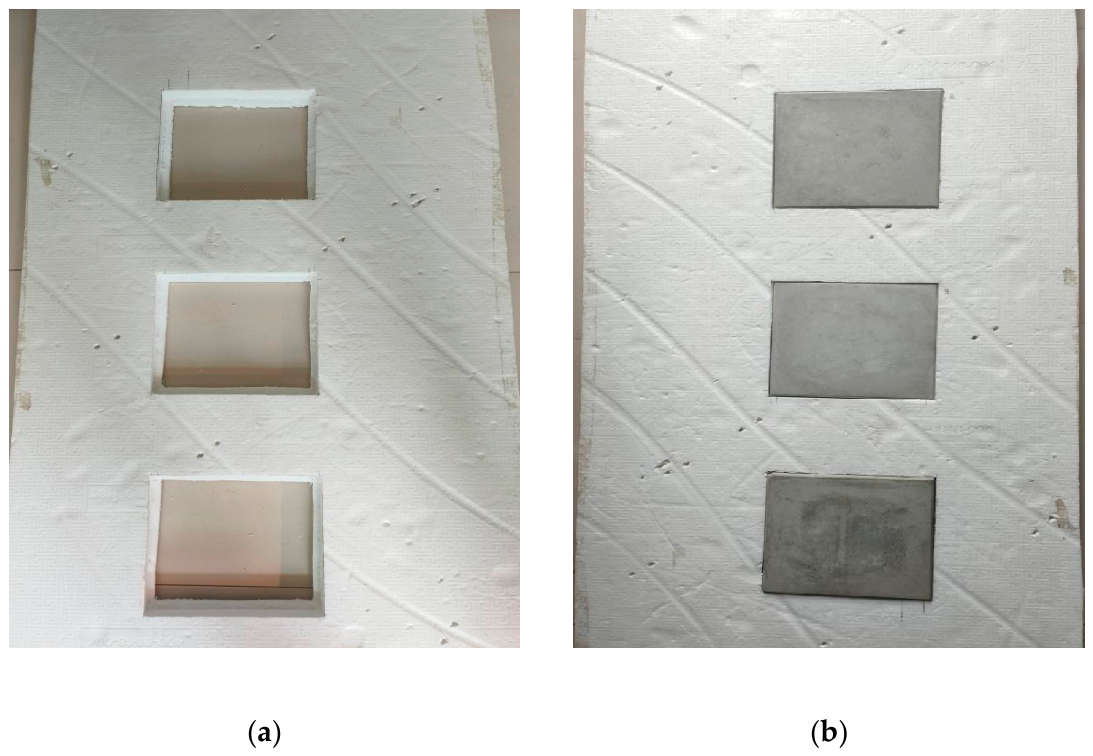
Figure 10.
Schematic layout of measurement points.
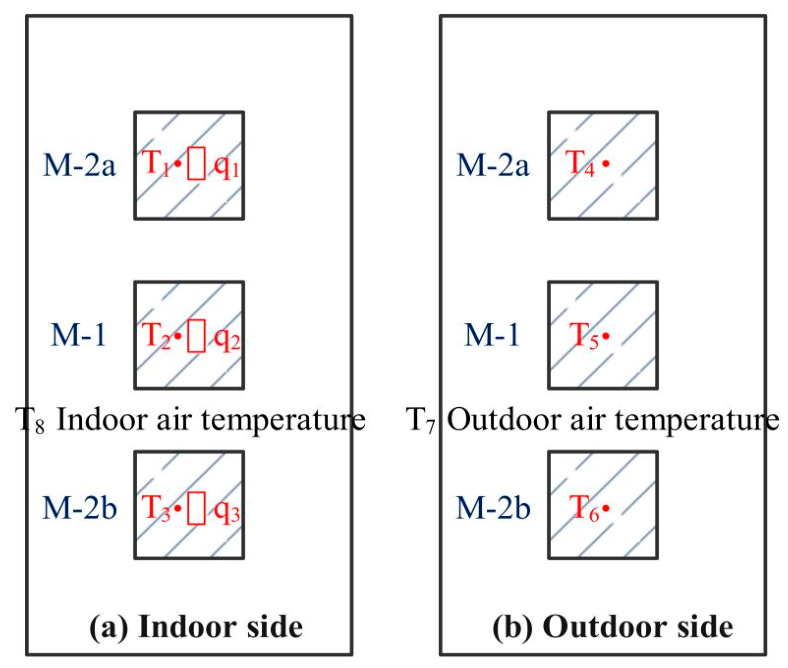
Table 9.
Measurement point sensor parameters.
Figure 11.
Test specimen experiment diagram.
3.1.4. Test Method
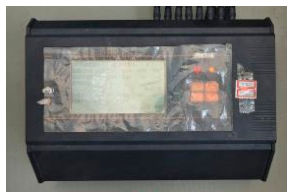
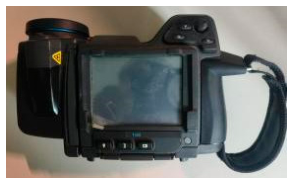
The instruments adopted in this experiment include the JTNT-A (Beijing Zhongheng Rixin Technology Co., Ltd., Beijing, China) field tester for the heat-transfer coefficient of building envelopes and the FLIR T420 (FLIR Systems, Wilsonville, OR, USA) infrared thermal imager. The relevant parameters are listed in Table 10. It should be noted that all inner- and outer-surface temperatures in this experiment were obtained from single-point sensor readings at the geometric center of the specimens, and spatial averaging was not performed.
Table 10.
Laboratory instruments and equipment.
3.1.5. Error Propagation Budget
The combined standard uncertainty of temperature measurement was evaluated by error propagation according to JCGM 100 [38]. The individual uncertainty sources are listed below:
- (1)
- T-type thermocouple: Calibrated accuracy ±0.2 K (B-type uncertainty, rectangular distribution, divisor ).
- (2)
- Data logger resolution: 0.01 K, which contributes negligible uncertainty compared with thermocouple error.
- (3)
- Heat-flux sensor: The sensor was pre-calibrated before the test, with relative uncertainty of ±3%.
- (4)
- Contact thermal resistance: Thermal contact resistance between the thermocouple/heat-flux sensor and specimen surface introduces extra unknown temperature deviation. This error source cannot be fully quantified in the present setup and is treated as a dominant unevaluated uncertainty.
The calculation formula is expressed as follows:
where uc(T) is the combined standard uncertainty of temperature measurement, K; uthermocouple is the standard uncertainty introduced by thermocouples (Type B); ulogger is the standard uncertainty caused by the resolution of the data logger (Type B).
The calculation yields are expressed as follows:
uc(T) = 0.115 K
The expanded uncertainty with a coverage factor k = 2 (95% confidence interval) is U = 0.23 K. For the temperature differences below 1 K observed in this study, the ratio of temperature expanded uncertainty to the measured value cannot be neglected. Therefore, interpretation of such small temperature differences requires caution. The temperature variation trends and relative comparison among specimens remain reliable; however, the absolute values of temperature differences smaller than 1 K are affected by the contact thermal resistance.
3.2. Evaluation Indices
As key indices for evaluating the thermal performance of phase-change walls, the temperature attenuation multiple (ν) and thermal time lag (τ) are adopted in this study to quantitatively characterize the attenuation and hysteresis effects of walls on external temperature fluctuations. Their physical definitions and calculation methods are given as follows:
The temperature attenuation multiple is a dimensionless parameter that characterizes the amplitude attenuation degree of temperature waves after passing through the wall, which is expressed as [39]:
where Θe is the amplitude of outdoor comprehensive temperature or air-temperature fluctuation, K; Θi is the amplitude of inner-surface temperature fluctuation of building envelopes under the influence of outdoor comprehensive temperature or air temperature, K.
The thermal time lag is defined as the time difference required for the peak of external temperature to propagate to the inner surface, which is expressed as [39]:
where Text,peak is the time when the outdoor comprehensive temperature or air temperature reaches its peak, h; Tint,peak is the time when the inner-surface temperature of building envelopes reaches its peak under the influence of outdoor comprehensive temperature or air temperature, h.
τ = Tint, peak − Text, peak
A larger value of ν indicates stronger attenuation capacity of the wall against temperature fluctuations, while τ reflects the hysteresis of heat transfer within the wall. These two evaluation indices can be used to reveal the action mechanism of different materials on various thermal performances of walls.
3.3. Experimental Results and Analysis
The experimental data were collected from 26 May 2025 to 4 June 2025. The weather in Dalian was mostly cloudy with ambient temperature ranging from 16 °C to 25 °C. The complete measured data during the acquisition period were retained, and the full-set temperature variation data of test specimens from 27 May 2025 to 3 June 2025 were finally obtained.
3.3.1. Thermal Response Analysis of Specimens
(1) Variation curves of inner-surface temperature of specimens
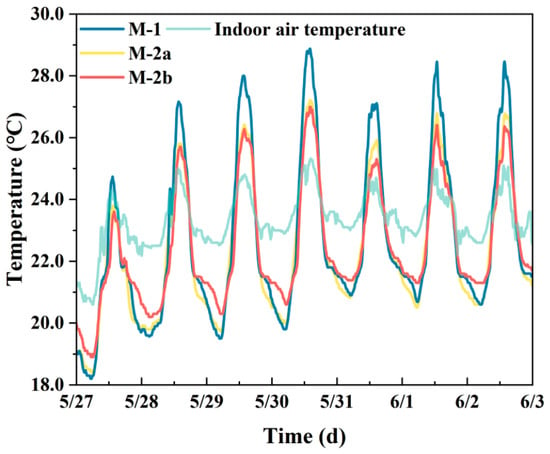
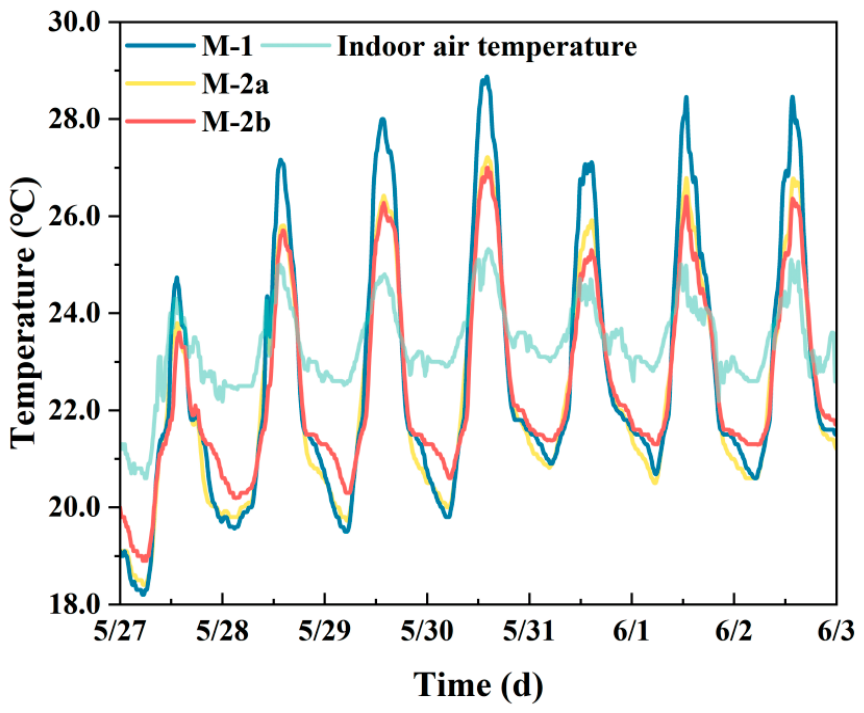
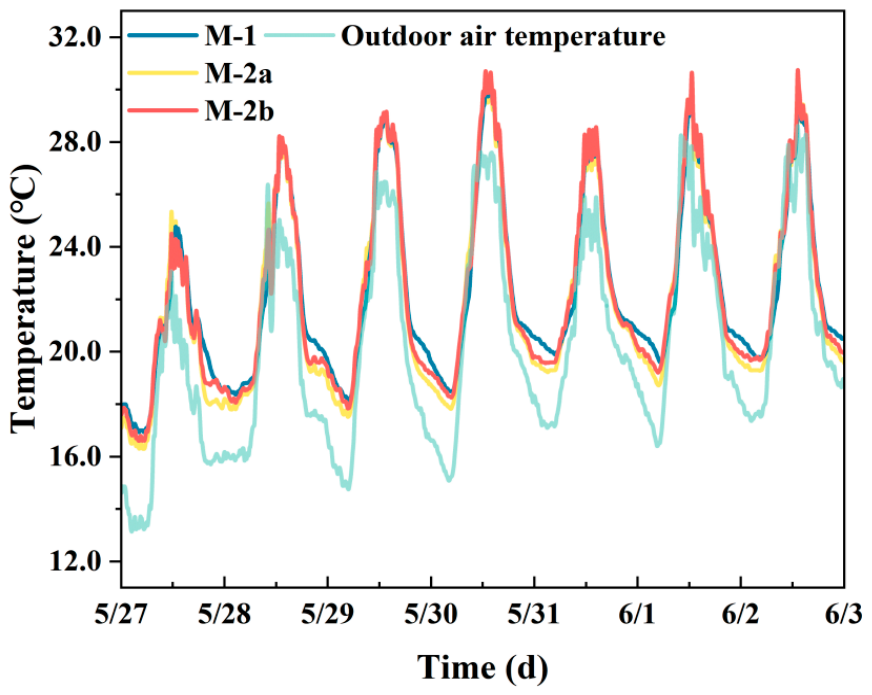
The curves of inner-surface temperature versus time for different specimens M-1, M-2a and M-2b are plotted in Figure 12. As shown in Figure 12, the peak temperature of M-2b is consistently lower than that of M-1, while its minimum nighttime temperature is always higher than that of M-1 by comparing M-1 with M-2b. It can be concluded that the aerogel can significantly improve the thermal insulation performance of specimens, reduce the peak temperature of walls, and effectively cut down the heat entering the specimens. The comparison between M-2a and M-2b indicates that the phase-change material in M-2b enhances the heat-storage capacity, further reducing the fluctuation amplitude of inner-surface temperature. Meanwhile, the incorporation of phase-change material also improves the thermal insulation performance, so that the overall thermal performance of M-2b outperforms M-2a.
Figure 12.
Temperature of the inner surface of the test block.
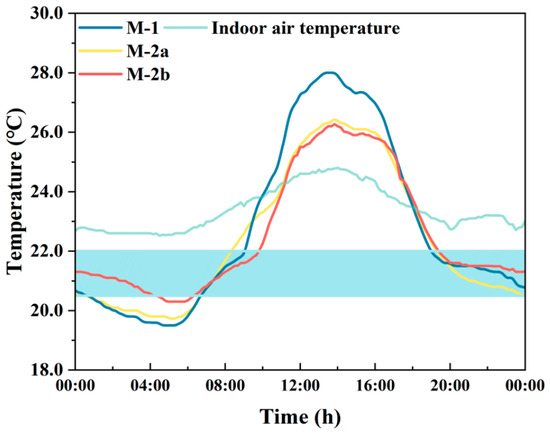
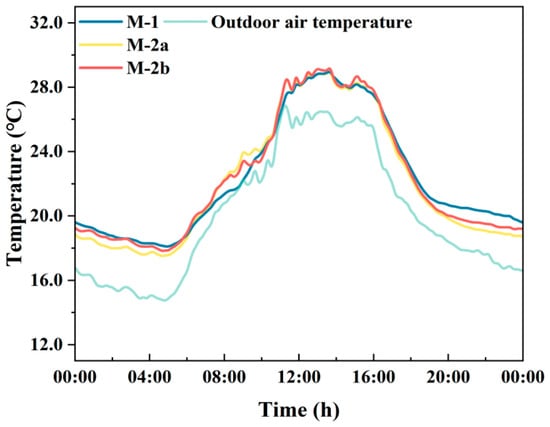
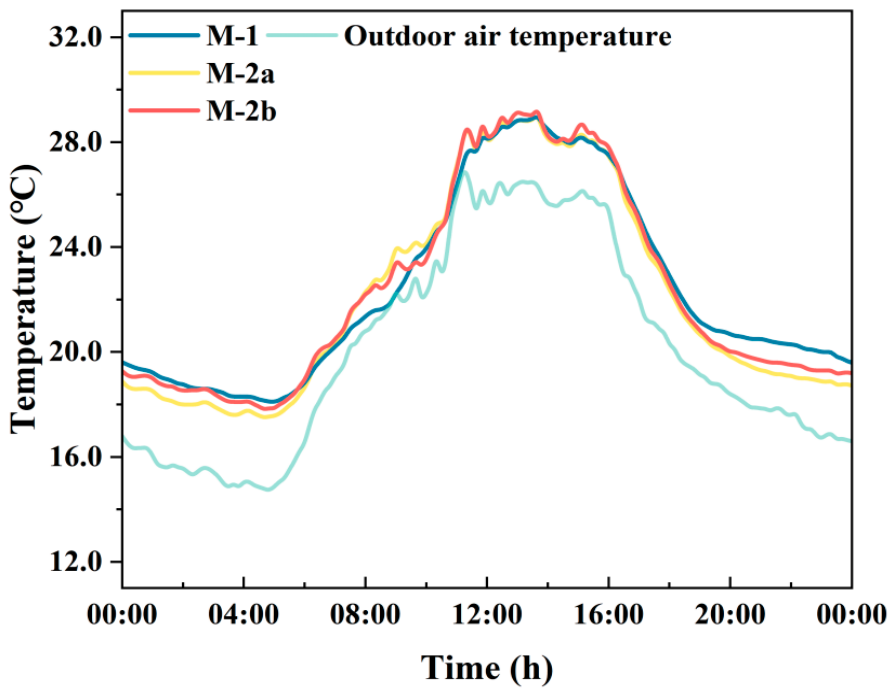
The data on 29 May are separately plotted in Figure 13, where the filled region represents the actual phase-change interval of the incorporated phase-change material. It should be distinguished from the nominal melting point of 22 °C. It can be observed that within this phase-change interval, both the temperature rising rate and cooling rate of phase-change-incorporated specimens M-1 and M-2b are evidently lower than those of specimen M-2a without phase-change material. This demonstrates that the phase-change material inside the specimens functions effectively, storing incoming heat and slowing down the temperature variation rate. Nevertheless, the specimens in this experiment are of small size with limited dosage of phase-change material, leading to a relatively fast phase-transition process. After complete melting, the heat-storage effect of phase-change material weakens; consequently, the inner-surface temperature variations of M-1 and M-2b become similar to that of M-2a.
Figure 13.
Inner-surface temperature of test block on 29 May.
(2) Variation curves of outer-surface temperature of specimens
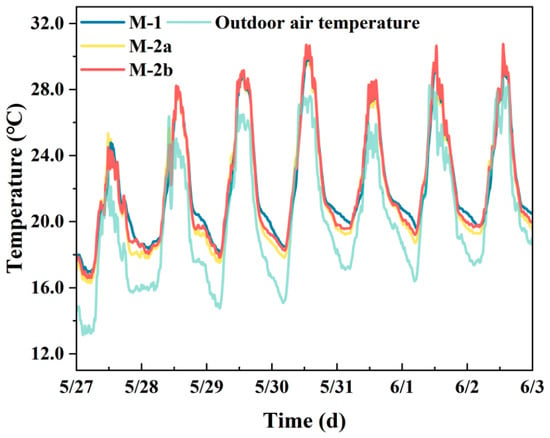
Based on the experimental data, the outer-surface temperature variations of specimens against time are plotted in Figure 14, and the detailed temperature variations on 29 May are presented in Figure 15.
Figure 14.
Temperature of the outer surface of the test block.
Figure 15.
Outer-surface temperature of test block on 29 May.
It can be seen from the outer-surface temperature curves in Figure 14 and Figure 15 that, similar to the inner-surface temperature, little difference exists among the three specimens in daytime temperature. Owing to the small dimension of specimens and low content of phase-change material, their heat-storage capacity is weak. The melting process in the daytime is short and proceeds rapidly; hence, the phase-change material hardly takes effect for most of the daytime.
From about 19:00 at night to 05:00 in the early morning, the outer-surface temperatures of M-1 and M-2b are higher than that of M-2a. This is attributed to the phase-change material doped in M-1 and M-2b releasing the energy stored in the daytime. During the solidification process, the phase-change material continuously releases heat outwards and maintains the temperature stability on the outer surface of specimens. It indicates that the phase-change material reduces the temperature fluctuation of specimens through the melting–solidification phase-change cycle and plays a vital role in heat balance.
3.3.2. Analysis of Specimen Evaluation Indices
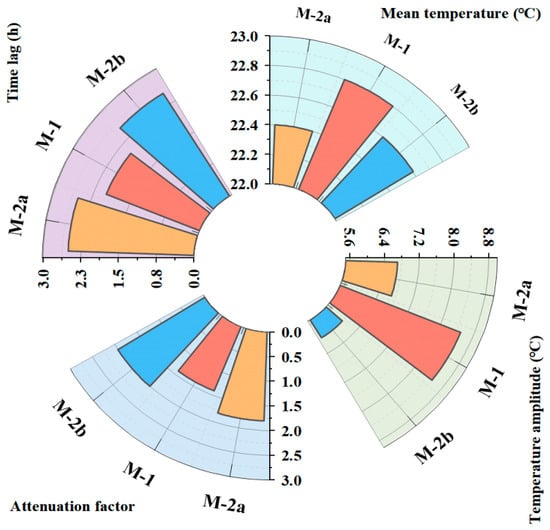
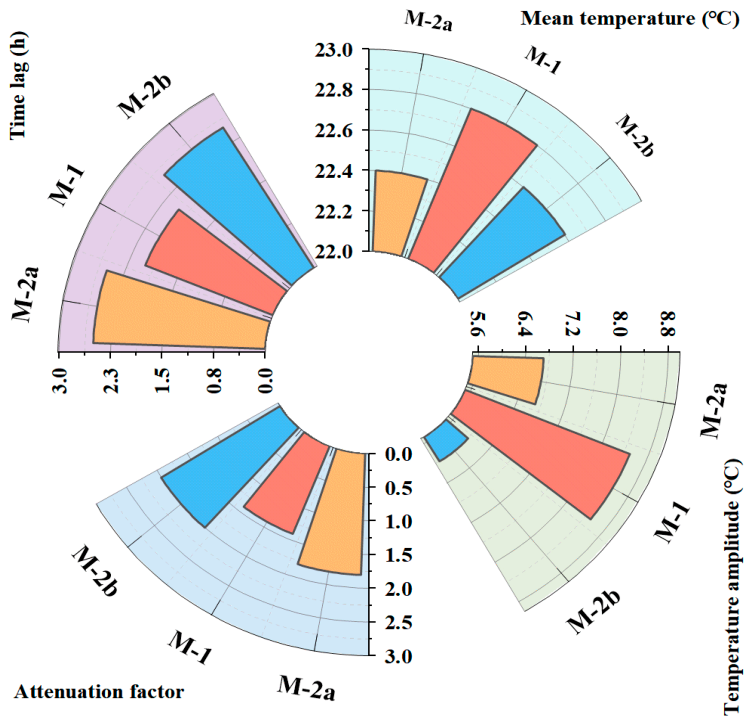
According to the calculation method for evaluation indices proposed above, the temperature data of 29 May are adopted to calculate the attenuation multiple and time lag of specimens. The calculation results are shown in Figure 16 and Table 11.
Figure 16.
Performance indexes of different test blocks.
Table 11.
Performance indexes of different test blocks.
Comparative analysis on the thermal performance of the three specimens from Figure 16 and Table 11 reveals that M-2b (phase-change mortar + aerogel coating) achieves the best comprehensive performance, with the minimum inner-surface temperature amplitude (6.0 °C), the largest attenuation multiple (2.0), and a time lag comparable to that of M-2a (2.5 h). Compared with single phase-change mortar (M-1), M-2b demonstrates the synergistic advantage of phase-change material and aerogel: aerogel effectively blocks external thermal disturbance, while phase-change material buffers internal temperature variation. Their combination can improves the dynamic thermal stability of the wall. As the control group, M-2a (ordinary mortar + aerogel coating) exhibits better attenuation performance than M-1 but inferior performance to the composite system M-2b, which further verifies the superposition effect of functional materials.
4. Discussion: Numerical Model for Two-Dimensional Heat Transfer of Specimens and Optimization of PCM Content
4.1. Two-Dimensional Heat-Transfer Numerical Model of Specimens
Due to the limitations of experimental conditions, COMSOL Multiphysics numerical simulation is introduced in this chapter for the thermal analysis of specimens. The main objectives are as follows: first, to further reveal the heat-transfer and phase-change mechanisms of composite specimens; second, to provide guidance for parameter optimization and synergistic design of composite materials.
4.1.1. Assumptions
Given the complexity of practical working conditions and various uncertain factors, several simplifying assumptions are proposed in this study to reduce model complexity and reasonably simplify the heat-transfer model of specimens:
- (1)
- All layers of materials in the specimen are assumed to be isotropic and uniformly distributed;
- (2)
- The variations in volume and density during the PCM phase-change process are neglected;
- (3)
- Heat conduction dominates the heat-transfer process inside the specimen, and the thermal conductivity of PCM is assumed to be constant;
- (4)
- The natural-convection effect during solid–liquid phase change is ignored, and only the heat-conduction process is considered;
- (5)
- The top and bottom cross-sections of the specimen are treated as adiabatic boundaries.
The numerical model in this paper assumes that the materials are isotropic. Only solid heat conduction is considered, and natural convection of the liquid phase inside phase-change microcapsules is neglected. The microcapsules are encapsulated by cement mortar, and the flow space for the internal liquid phase is restricted, so the heat transfer enhancement induced by natural convection is limited. Weak convection occurs after the PCM is fully melted, increasing the local equivalent thermal conductivity. Considering heat conduction alone slightly delays the onset of PCM melting and introduces deviations, which are acceptable under the working conditions of this test.
In addition, moisture migration and hygrothermal coupling are not considered in the model. This study focuses on analyzing temperature evolution and phase-change heat storage and release characteristics of the composite wall, and long-term durability, freeze–thaw and high-humidity service behaviors are not involved. The specimens were standard-cured and preconditioned under constant temperature and humidity prior to thermal testing. The variation in wall moisture content can be ignored during the short-period tests in the transition season. Under long-term high-humidity freeze–thaw conditions in severe-cold regions, moisture migration will alter the thermal properties of mortar and aerogel, and hygrothermal coupling cannot be neglected. At this point, the present model is no longer applicable. Hygrothermally coupled simulation and parameter sensitivity analysis will be included in future research.
Measured outer-surface temperature was adopted as the boundary condition for model validation. This setup aims to reproduce the indoor test conditions, eliminate uncertainties such as solar radiation, the surface heat-transfer coefficient and humidity fluctuations, achieve a clean comparison of temperature responses between simulation and measurement, and complete model calibration. For regional climatic performance prediction, convective boundaries coupled with solar radiation from the typical meteorological year can be substituted. These two types of boundaries serve model validation and climatic performance evaluation, respectively.
4.1.2. Initial and Boundary Conditions
(1) Initial temperature of specimens
The top and bottom cross-sections of the specimen are set as adiabatic boundary conditions. The initial temperature condition of the specimen is expressed as Equation (8):
where T(x, y, τ) represents the temperature at coordinate (x, y) at time τ, K; Tinit denotes the initial temperature of the wall specimen, K.
T(x,y,τ)|τ=0 = Tinit
(2) Outer surface of specimen
The outer surface of the specimen is assigned the first-kind boundary condition, where the outer-surface temperature adopts the experimentally measured value. The boundary-condition equation for the outer surface of the specimen is expressed as Equation (9):
where T(0, y, τ) is the temperature at coordinate (0, y) at time τ, K; Tout(τ) is the measured outer-surface temperature of the wall specimen, K.
T(0,y,τ) = Tout(τ)
(3) Inner surface of specimen
The inner-surface boundary of the specimen is set as the third-kind boundary condition, namely the convective heat-transfer boundary condition.
where k is the thermal conductivity of the specimen, W/(m∙K); hin is the inner-surface convective heat-transfer coefficient of the specimen, W/(m2∙K); Tin is the indoor-air temperature, K; Tw is the surface temperature of the specimen, K.
In this study, the inner-surface convective heat-transfer coefficient is determined according to Appendix B.4.1 of the Chinese national standard GB 50176-2016 Code [39] for thermal design of civil buildings, and the value is taken as 8.7 W/(m2∙K).
4.2. Reliability Verification of the Numerical Model
4.2.1. Model Accuracy Validation
In this section, the accuracy of the established heat-transfer model for specimens is verified by comparing the COMSOL numerical simulation results with the experimental measurements.
The relative error analysis method is adopted for error evaluation. The calculation formulas for the Relative Maximum Error (RME) and Relative Average Error (RAE) are presented as follows.
where Si denotes the numerically simulated value, °C; Ei denotes the experimentally measured value, °C.
Root Mean Square Error (RMSE) is a statistical indicator used to quantify the discrepancy between predicted (or simulated) values and observed (or experimental) values, representing the standard deviation of prediction errors. When RMSE equals 0, the simulation results are in perfect agreement with experimental data. Its mathematical expression is given by:
where n is the number of samples, dimensionless; is the simulated value at the i-th data point, °C; is the experimental value at the i-th data point, °C.
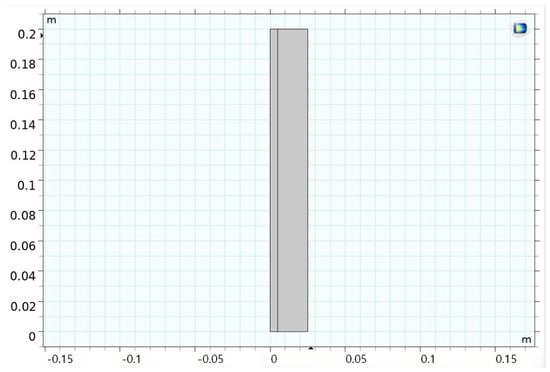
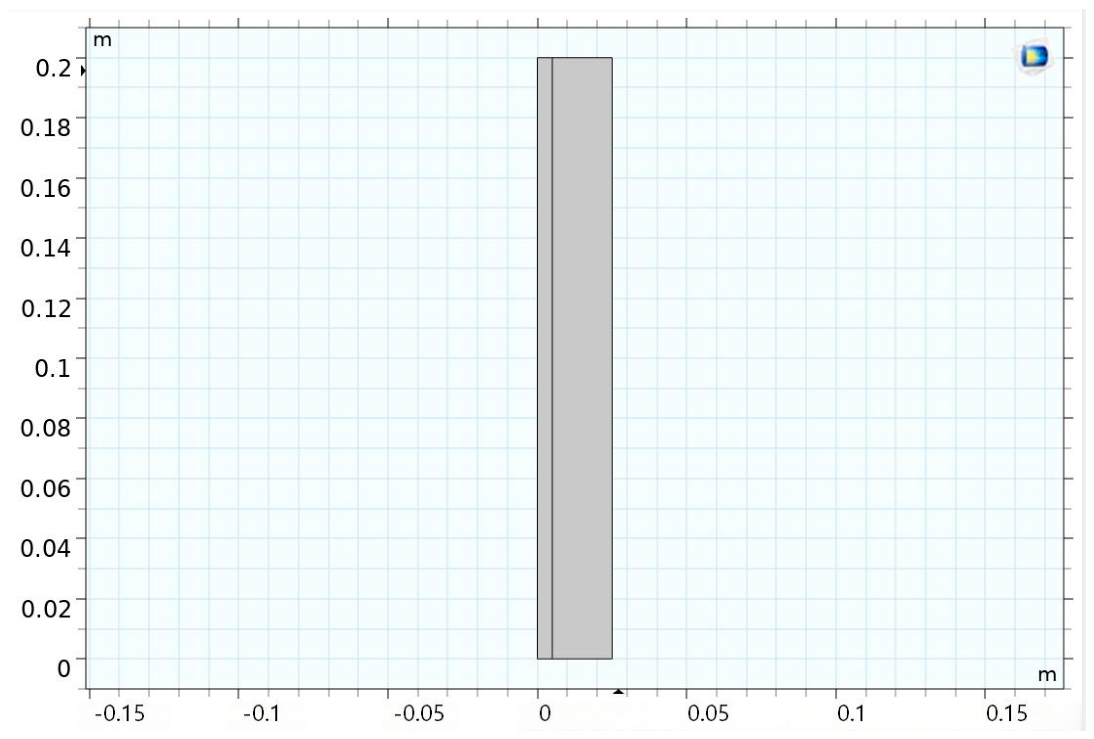
In this study, a numerical heat-transfer model for specimen M-2b (phase-change mortar + aerogel coating) is established, as illustrated in Figure 17. The physical properties of each layer are listed in Table 12.
Figure 17.
COMSOL model.
Table 12.
Physical parameters of each structure of the wall.
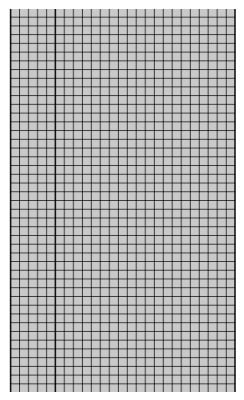
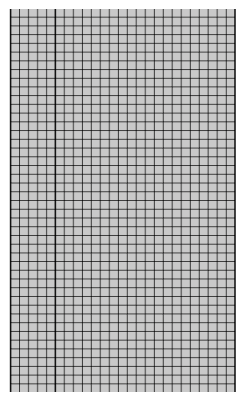
The model is meshed in COMSOL using mapped meshing. The total number of mesh elements is 5000 with an average mesh quality of 1.0. The local mesh division is shown in Figure 18.
Figure 18.
Schematic diagram of model meshing.
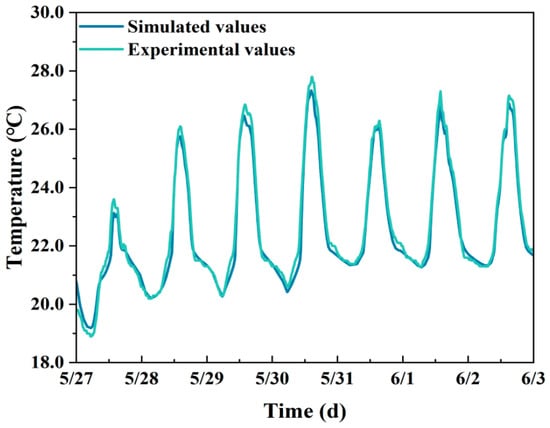
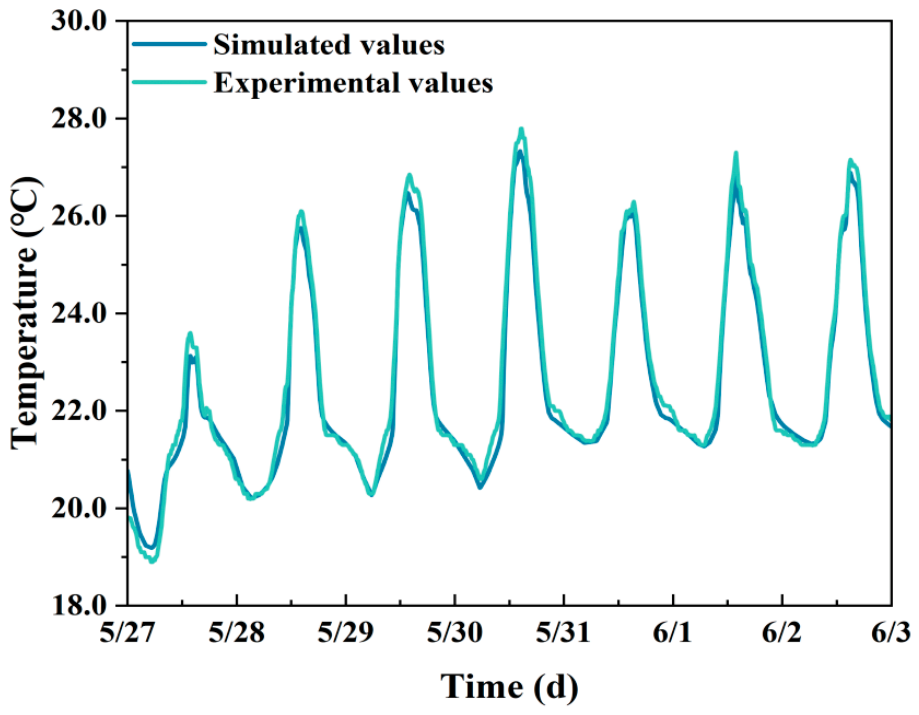
The experimentally measured outer-surface temperature variation data of the specimen are imported as the outer first-kind boundary condition for the COMSOL model. The inner boundary is set as the third-kind convective heat-transfer boundary condition, and the indoor-air temperature adopts experimental measured values. The simulation time step is 10 min and the total simulation duration is 192 h. The comparison between simulated and measured inner-surface temperature of the specimen is presented in Figure 19.
Figure 19.
Comparison of simulated and experimental values.
The time-dependent simulated inner-surface temperature of the specimen is compared with experimental measurements. The Relative Maximum Error, Relative Average Error and Root Mean Square Error are calculated accordingly: the Relative Maximum Error of inner-surface temperature is 6.02%, the Relative Average Error is 1.04%, and the RMSE is 0.31 °C. To sum up, the numerical model in this study satisfies the 15% error requirement specified in ASHRAE guideline 14 [40], and this model can be adopted for subsequent investigations.
4.2.2. Mesh Independence Verification
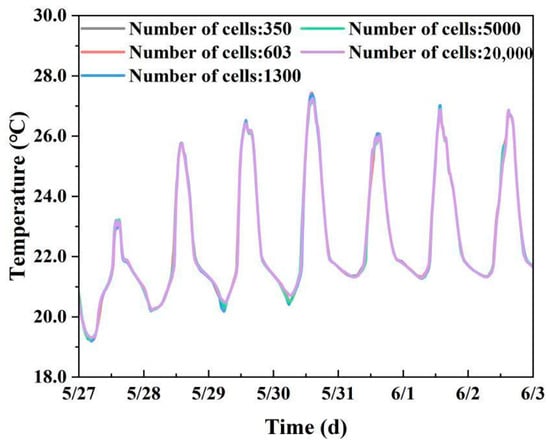
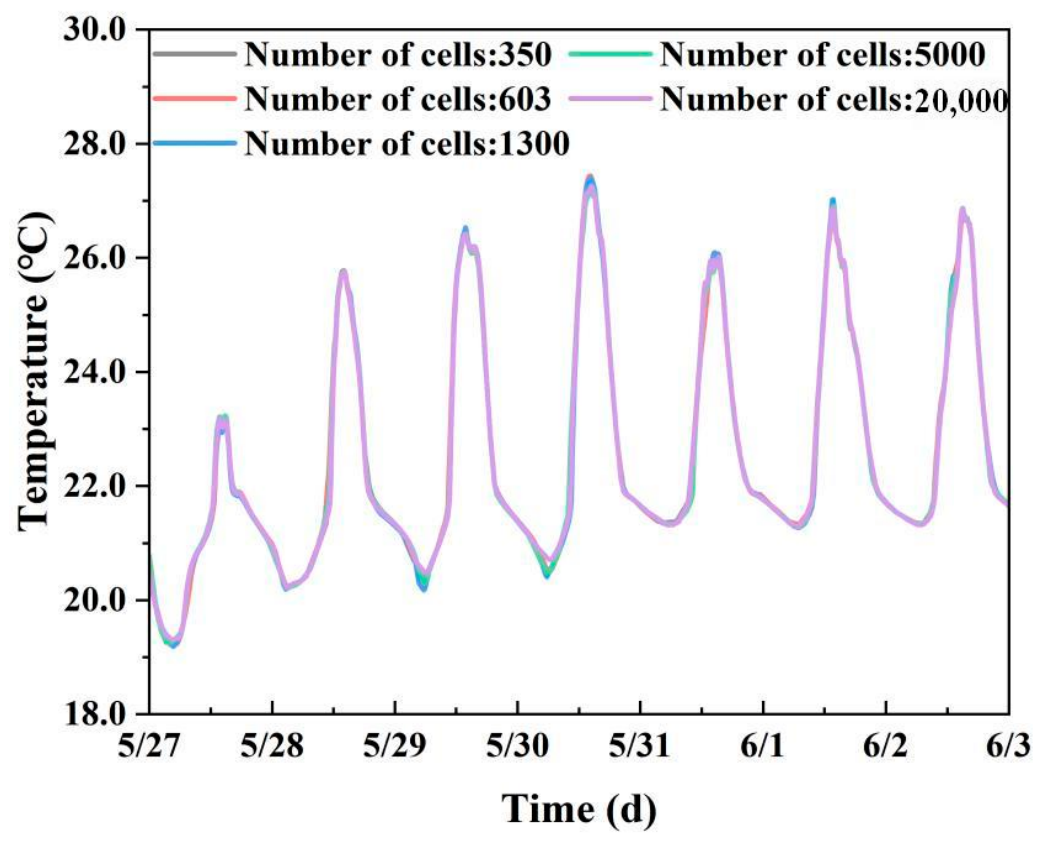
Meshes with different element quantities are generated for the model to investigate the relative error among meshes of varying densities. The time-history curves of temperature at the central point inside the specimen under different mesh densities are obtained, as shown in Figure 20.
Figure 20.
Temperature variation curves for different number of meshes.
It can be observed from the figure that the discrepancies between simulation results obtained under different mesh densities are all within 1%. The model accuracy meets the requirements. Considering the computer configuration and computational-time constraints, the mesh element number of approximately 5000 is adopted in this study, which is sufficient to satisfy the accuracy requirement for the present investigation.
4.3. Numerical Study on PCM Content of Specimens
4.3.1. Analysis of Phase-Change State Under Experimental Working Conditions
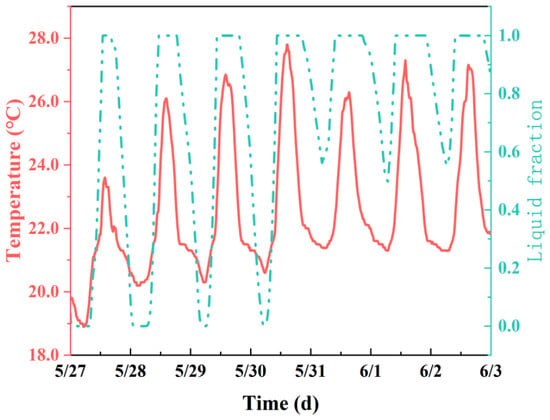
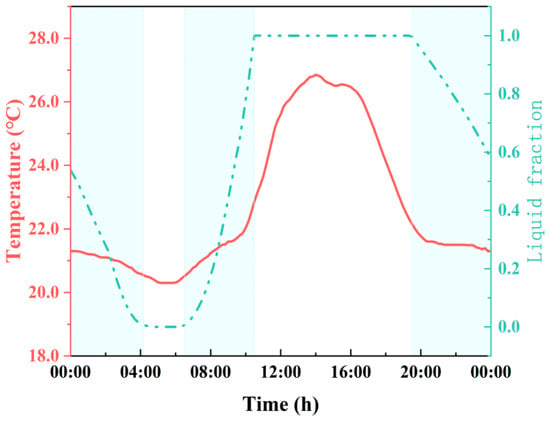
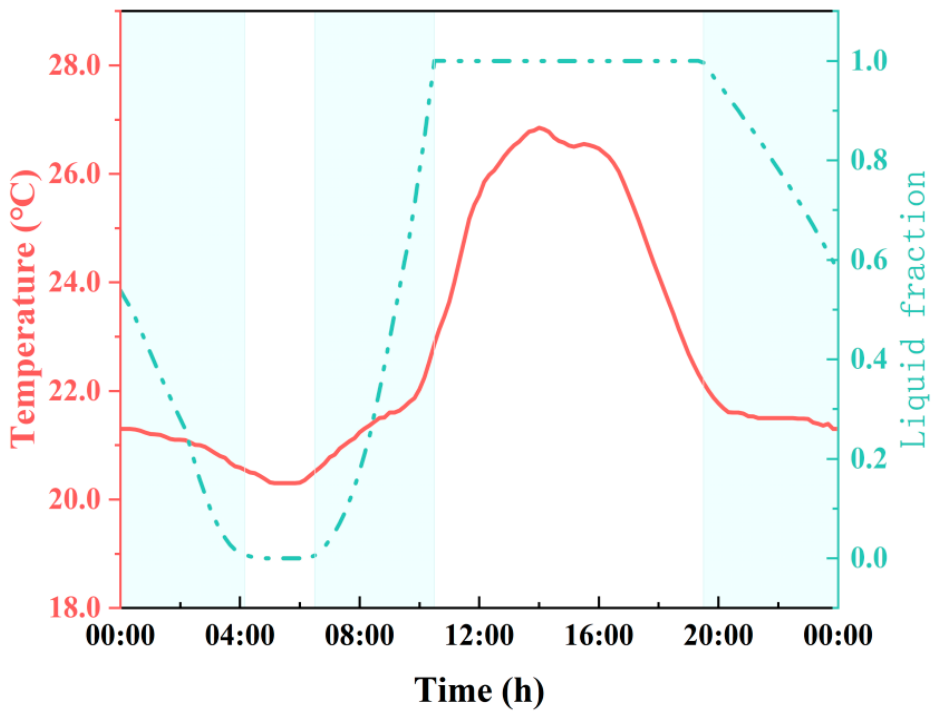
The physical model and boundary conditions of the simulation are configured to be exactly consistent with experimental conditions. The melting–solidification evolution of PCM is computed for the experimental working scenario. Figure 21 shows the temporal evolution of the PCM liquid fraction, while Figure 22 provides the detailed liquid-fraction profile on 29 May.
Figure 21.
Liquid phase fraction of phase-change materials under experimental conditions.
Figure 22.
Phase-change materials’ liquid phase fractions on 29 May.
It can be concluded from Figure 22 that PCM starts to absorb heat in the morning and melts as temperature rises. Accordingly, the inner-surface temperature of the specimen rises slowly with a small slope. As the ambient temperature increases further, the PCM is fully melted. Once completely melted, PCM loses its heat-storage capacity, and the inner-surface temperature variation of the specimen becomes identical to that of the specimen without PCM. This indicates that PCM can improve the thermal performance of the specimen and effectively reduce the heat penetrating through the specimen into its interior.
4.3.2. Optimization of PCM Content in Phase-Change Mortar
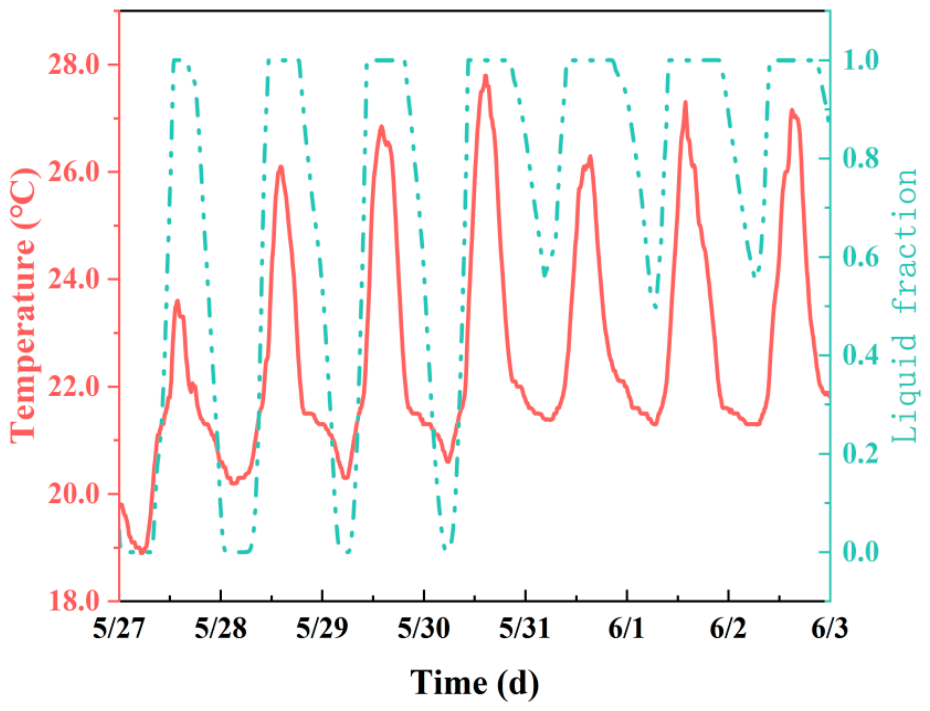
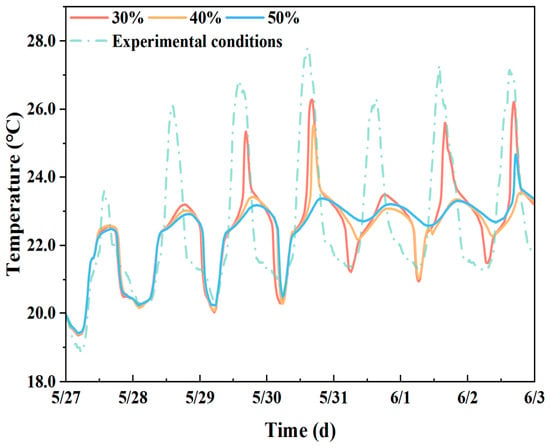
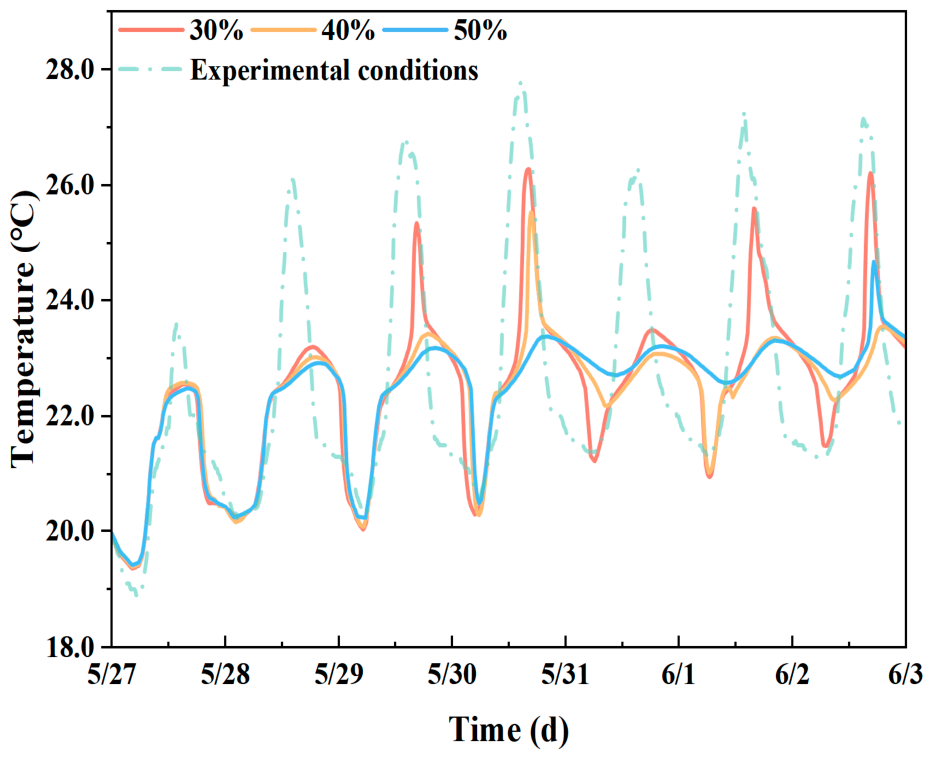
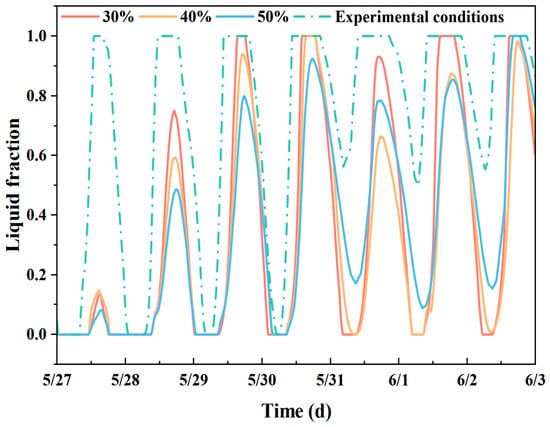
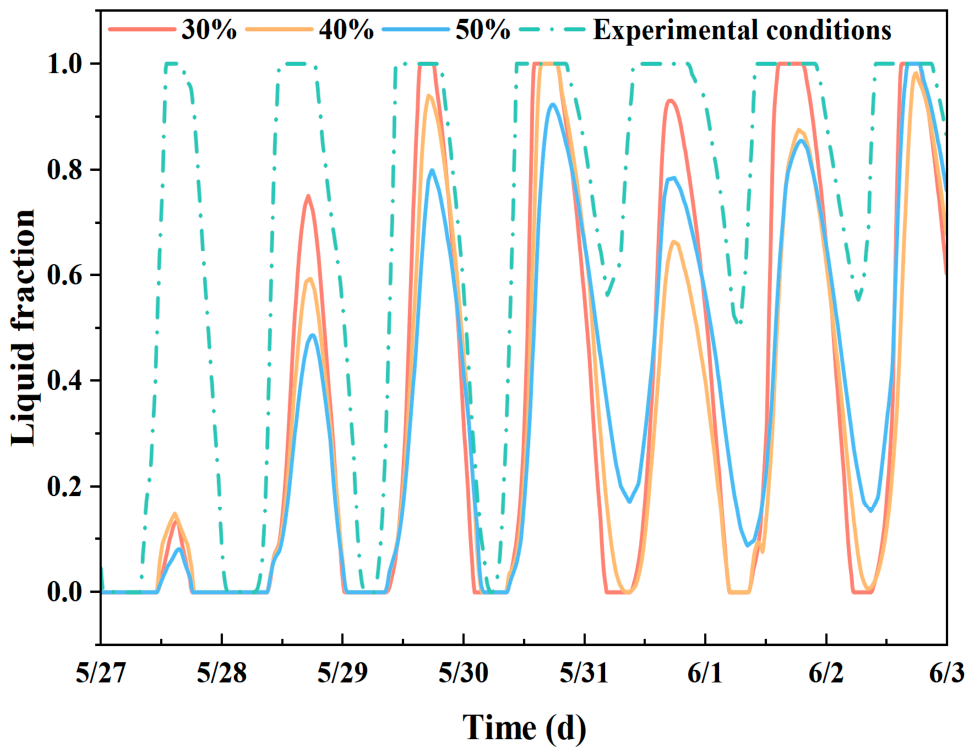
In this section, the phase-change temperature of PCM is set to 23.0 °C, and all other conditions remain consistent with the experimental working conditions. Simulations are carried out under three PCM sand-replacement ratios of 30%, 40% and 50% by altering the PCM content in mortar specimens. The inner-surface temperature variations of specimens are shown in Figure 23, and the evolution of the PCM liquid fraction is presented in Figure 24.
Figure 23.
Temperature change of the inner surface of the specimen under different PCM sand substitutions.
Figure 24.
Changes in PCM liquid phase fraction under different PCM sand substitutions.
It can be observed from the simulation data that the temperature fluctuation on the inner surface of specimens gradually decreases as the PCM sand-replacement ratio increases. Nevertheless, the liquid-fraction curves reveal that the utilization rate of PCM declines continuously with the rising sand-replacement ratio. To balance the mechanical strength and PCM utilization efficiency of phase-change mortar, the sand-replacement ratio of 30% for PCM is finally selected as the optimal value.
4.3.3. Analysis of Variation in PCM Phase-Change Temperature
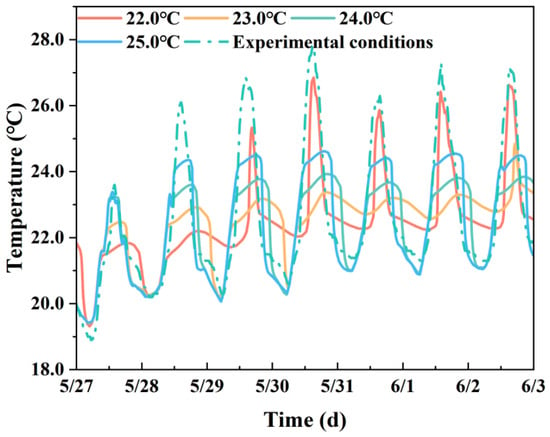
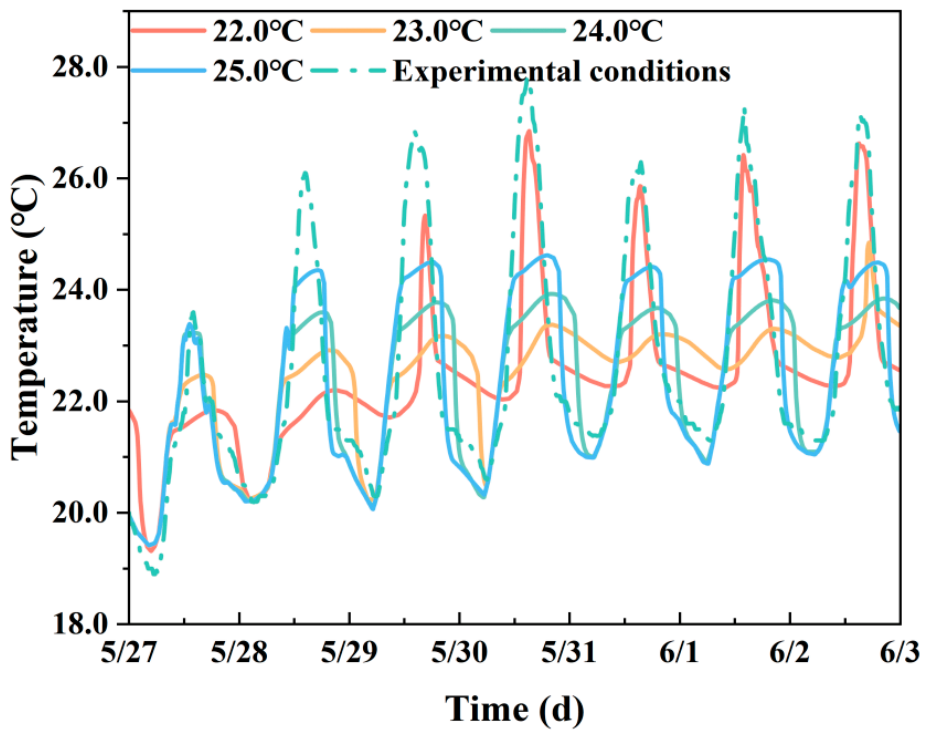
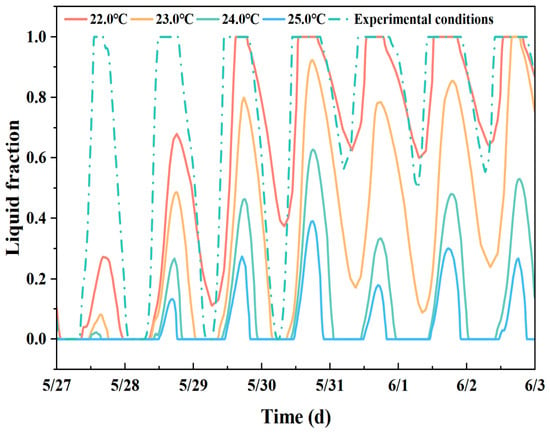
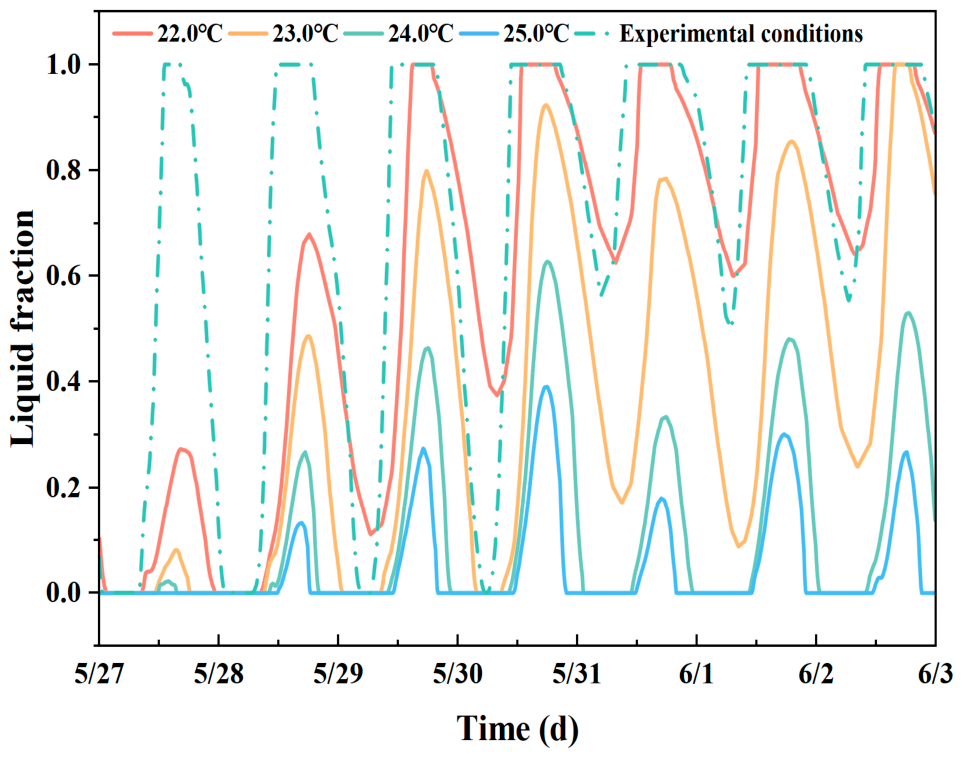
In this subsection, the ratio of sand replaced by phase-change mortar is fixed at 30%, and all other conditions are kept identical to the experimental working conditions. The influence of different phase-change temperatures on the inner-surface temperature of the specimen is investigated by varying the phase-change temperature. Four groups of phase-change temperatures (22.0 °C, 23.0 °C, 24.0 °C and 25.0 °C) are adopted for simulation. The inner-surface temperature variations of specimens are shown in Figure 25, and the evolution of the liquid fraction is illustrated in Figure 26.
Figure 25.
Variation in inner-surface temperature at different phase transition temperatures.
Figure 26.
Variation in liquid phase fraction at different phase transition temperatures.
As depicted in Figure 25, when the phase-change temperature is set to 22.0 °C, PCM stores and releases heat only within a narrow time window because both indoor and outdoor temperatures are higher than this threshold for most of the time. Accordingly, its capacity for mitigating temperature fluctuation is limited. With the increase in phase-change temperature, the effective operating range of PCM gradually shifts toward higher-temperature regions. The minimum amplitude of inner-surface temperature fluctuation is achieved at the phase-change temperature of 23.0 °C, which corresponds to the optimal thermal regulation performance. Herein, 23 °C is the optimal phase-change temperature obtained from simulation optimization analysis, which differs from the nominal melting point of 22 °C mentioned above and the actual melting range of 20.5–22 °C. Further analysis of liquid-fraction curves indicates that different phase-change temperatures lead to distinct heat-storage/release behaviors of PCM.
At a relatively low phase-change temperature (e.g., 22.0 °C), PCM can be fully melted yet cannot be sufficiently solidified.
At a relatively high phase-change temperature (above 23.0 °C), PCM can be completely solidified but fails to melt thoroughly.
Only at the optimal phase-change temperature (23.0 °C) can the liquid fraction vary cyclically between 0 and 1 (periodic solid–liquid phase-change cycles), so that the highest heat-storage efficiency and optimal temperature-regulation performance can be realized.
5. Conclusions
In this paper, aerogel-insulating-coating microcapsule phase-change mortar composite specimens are fabricated through material selection, specimen preparation and thermal-performance testing, and key thermophysical parameters of the system are obtained. A reduced-scale specimen test platform is established for dynamic thermal-response measurements. A two-dimensional transient phase-change heat-transfer numerical model validated against experimental data is built using COMSOL Multiphysics. The synergistic heat-transfer mechanism between the aerogel coating and phase-change mortar is analyzed, and the influences of the PCM sand-replacement ratio and phase-change temperature on the thermal regulation performance of the wall are investigated. The main conclusions are summarized as follows:
- (1)
- With the increase in PCM content, the density of phase-change mortar decreases from 1956 kg/m3 to 1492 kg/m3, and its thermal conductivity drops from 0.912 W/(m·K) to 0.274 W/(m·K). After applying a 5 mm thick aerogel coating, the thermal conductivity of specimen M-4 with a 30% PCM sand-replacement ratio decreases to 0.116 W/(m·K). This verifies the synergistic thermal-insulation enhancement effect of “microcapsule PCM reducing matrix thermal conductivity plus aerogel coating strengthening thermal insulation”.
- (2)
- Three groups of comparative specimens, namely phase-change mortar M-1, ordinary mortar with aerogel M-2a, and phase-change mortar with aerogel M-2b, are designed for the Dalian climate, which are measured for inner- and outer-surface temperatures as well as heat-flux density. The results show that composite specimen M-2b achieves the optimal overall thermal performance, with an inner-surface temperature amplitude of 6.0 °C, which is 10.4% and 29.4% lower than that of M-1 and M-2a, respectively, and the temperature attenuation multiple reaches 2.0.
- (3)
- Parametric analysis reveals that the specimen obtains the maximum heat-storage efficiency under a 30% PCM sand-replacement ratio and a phase-change temperature of 23.0 °C, where the liquid fraction completes a full phase-change cycle of 0→1→0 and the inner-surface temperature amplitude is minimized. This set of parameters represents a multi-objective equilibrium solution. Deviation of phase-change temperature from the optimal range or excessive PCM content will lead to incomplete phase transition or degradation of mechanical performance, impairing the thermal-control effect.
This study takes rural residential buildings in Dalian in Northern China as a case study. Nevertheless, the proposed material–climate matching analytical framework, which adopts external aerogel coating to regulate boundary thermal disturbance, improve PCM melting–solidification cycles and balance thermal performance, mechanical properties and phase-change utilization efficiency, possesses cross-regional reference value. Rural dwellings in high-latitude cold regions such as Northern Europe and Canada share similar problems: low inherent thermal resistance of original walls, and low phase-change utilization caused by daytime heat storage followed by rapid nighttime heat loss when PCM is simply incorporated. However, it should be emphasized that the multi-objective equilibrium parameters of a 30% sand-replacement ratio and 23.0 °C phase-change temperature are obtained only under the meteorological conditions of Dalian’s transition season. These parameters are not universal and cannot be directly applied to other climate zones. For rural wall retrofits in different cold regions, the following parameter-matching methodology can be adopted: (1) acquire the hourly outdoor temperature and solar radiation data of the typical meteorological year for the target region; (2) select the suitable phase-change temperature range with the objective that the PCM can complete a full 0–1–0 liquid–solid cycle; (3) determine the upper limit of the PCM sand-replacement ratio constrained by the mechanical properties of mortar; (4) simulate different aerogel coating thicknesses and evaluate their suppression effect on external thermal disturbance; (5) obtain locally multi-objective balanced parameter combinations by comprehensively considering thermal regulation performance, phase-change cycle utilization efficiency and mechanical durability.
Although experiments and simulations demonstrate the promising dynamic thermal-regulation potential of the aerogel–PCM composite wall, several clear limitations remain in the present research. First, during the test, all specimens in this study were scaled-down small samples with uniform dimensions of 200 mm × 200 mm × 20 mm and were embedded in openings cut on XPS thermal-insulation boards. The four peripheral boundaries of specimens are approximately adiabatic, which introduces certain boundary effects. Since the specimen thickness is much smaller than that of real-world engineering walls, size effects exist. These small-scale specimens are mainly used to reveal the thermal-variation law of the materials themselves. The changing trends of indices obtained from the tests are of reference significance, but cannot be directly equated to the absolute thermal performance of full-scale engineering walls. For practical full-scale engineering walls, engineering problems such as drying-shrinkage of mortar, drying-shrinkage cracking and coating peeling at the interface between aerogel coating and the phase-change mortar matrix may easily occur. Such phenomena cannot be reproduced by small-specimen tests, and further full-scale component tests are required for engineering implementation. Second, only short-term steady-state thermal tests and transient thermal response experiments were carried out in this study. Long-term durability characterizations such as hygrothermal coupling, freeze–thaw cycles and thermal-cycling aging have not yet been performed for the composite walls. Under the alternating temperature and humidity environment during long-term building service, the shells of phase-change microcapsules are continuously subjected to thermal expansion and contraction as well as water vapor erosion, which brings potential risks of shell rupture and paraffin leakage of core materials. Once leakage occurs, it will not only cause an irreversible reduction in the heat-storage capacity of the material, but the exuded phase-change core material will also weaken the interfacial bonding performance between the aerogel coating and phase-change mortar matrix and increase the risk of interface delamination. Meanwhile, aerogel achieves low thermal conductivity relying on its nanoporous structure. After water vapor invades the pores in high-humidity environments, it replaces the air inside the pores, markedly increasing the equivalent thermal conductivity of the aerogel coating, impairing the thermal insulation capacity of the building envelope and ultimately altering the annual thermal regulation performance of the wall. Therefore, multi-field coupled durability aging tests are urgently required in subsequent research to systematically evaluate the integrity of phase-change microcapsules under cyclic temperature and humidity, the evolution law of interfacial cracking in composite layers, and the degradation characteristics of aerogel thermal insulation performance under high-humidity conditions. An evaluation method for the long-term service performance of this composite building envelope should be established to provide durability data support for practical engineering applications.
In summary, compared with single-material specimens, the aerogel–PCM composite specimens exhibit remarkably reduced thermal conductivity and temperature fluctuation amplitude, as well as obviously improved temperature attenuation and time-lag performance. The deficiencies of conventional PCM walls in structural adaptability and climate compatibility for northern rural residences are alleviated. The material–climate-matching paradigm proposed in this paper provides ideas and technical references for low-carbon envelope retrofitting of rural buildings in severe-cold regions including Northern China, Northern Europe and Canada. Constrained by specimen scale, durability and climate boundaries, future work should focus on full-scale component tests, long-term hygro-thermal and freeze–thaw cyclic experiments, as well as parametric sensitivity analysis for diverse cold-climate zones, so as to promote the engineering implementation of this composite wall.
Author Contributions
B.Z.: Writing—review and editing, methodology, formal analysis, conceptualization. J.S.: Writing—original draft, validation, software, formal analysis, data curation. X.P.: Formal analysis, resource support. W.W.: Data curation, conceptualization. All authors have read and agreed to the published version of the manuscript.
Funding
This research was funded by the National Key R&D Program of China (grant number [2025YFE0115600]).
Data Availability Statement
The original contributions presented in this study are included in the article.
Conflicts of Interest
The authors declare that they have no known competing financial interests or personal relationships that could have appeared to influence the work reported in this paper.
References
- Zhang, Y.K.; Yao, G.; Qian, Z.J. Research on energy-saving renovation of rural building sunrooms in Zhangbei area based on orthogonal test simulation. Chin. Overseas Archit. 2024, 70–76. [Google Scholar] [CrossRef]
- Special Committee on Building Energy Consumption and Carbon Emission Data of China Association of Building Energy Efficiency. Research Report on Carbon Emissions in China’s Urban-Rural Construction Sector (2025); China Association of Building Energy Efficiency: Beijing, China, 2025. [Google Scholar]
- Zhang, B.L.; Lü, L.H.; Wu, J.; Wang, S.; Wang, S.; Luo, H. Pathways and countermeasures for carbon peaking of rural residents’ living carbon emissions. Res. Environ. Sci. 2021, 34, 2065–2075. [Google Scholar] [CrossRef]
- Building Energy Conservation Research Center of Tsinghua University. Annual Development Research Report on Building Energy Efficiency in China 2024: Special Topic on Rural Residential Buildings; China Architecture & Building Press: Beijing, China, 2024; ISBN 978-7-112-29663-7. [Google Scholar]
- Xu, L.X.; Liang, N.; Zhang, Y. Energy consumption analysis of building envelope for rural residential buildings in severe cold northwest China. Gansu Sci. Technol. 2024, 40, 15–19, 24. [Google Scholar] [CrossRef]
- Cheng, T.; Wang, N.; Liu, C. Research on Energy Consumption of Building Layout and Envelope for Rural Housing in the Cold Region of China. IOP Conf. Ser. Earth Environ. Sci. 2019, 238, 012059. [Google Scholar] [CrossRef] [Scilit]
- Deng, Q.; Zhang, S.; Shan, M.; Li, J. Research on Envelope Thermal Performance of Ultra-Low Energy Rural Residential Buildings in China. Sustainability 2023, 15, 6931. [Google Scholar] [CrossRef] [Scilit]
- Ding, Y.X.; Li, Y.C.; Ding, C.; Liu, H.W. Energy-saving sensitivity analysis on envelope renovation of rural residential buildings: A case of Hetao area in Inner Mongolia. Sci. Technol. Eng. 2024, 24, 9998–10007. [Google Scholar] [CrossRef]
- Yang, T.; Li, J.; Liu, Q.S.; Du, J.; Du, J.; Geng, L.; Yu, S.; Huang, B. Energy-efficiency improvement renovation of rural buildings in Henan Province. Heat. Vent. Air Cond. 2024, 54, 8–13. [Google Scholar] [CrossRef]
- Zhang, X.; Zhang, X.; Chen, B.; Zhao, J.R.; Sun, J.; Zhao, J.; Wei, B.; Zhu, J. Thermal Performance Optimization of Building Envelopes in a Low-Cost and Energy-Saving Rural Dwelling in Severe Cold Region-Taking Central Area of Liaoning as an Example. Buildings 2024, 14, 2505. [Google Scholar] [CrossRef] [Scilit]
- Kuznik, F.; David, D.; Johannes, K.; Roux, J.-J. A review on phase change materials integrated in building walls. Renew. Sustain. Energy Rev. 2011, 15, 379–391. [Google Scholar] [CrossRef] [Scilit]
- Young, A.B.; Falzone, G.; Wei, Z.; Sant, G.; Pilon, L. Reduced-scale experiments to evaluate performance of composite building envelopes containing phase change materials. Constr. Build. Mater. 2018, 162, 584–595. [Google Scholar] [CrossRef] [Scilit]
- Saikia, P.; Azad, S.A.; Rakshit, D. Thermodynamic analysis of directionally influenced phase change material embedded building walls. Int. J. Therm. Sci. 2018, 126, 105–117. [Google Scholar] [CrossRef] [Scilit]
- Pandey, A.; Hossain, M.; Tyagi, V.; Rahim, N.A.; Selvaraj, J.A.; Sari, A. Novel approaches and recent developments on potential applications of phase change materials in solar energy. Renew. Sustain. Energy Rev. 2018, 82, 281–323. [Google Scholar] [CrossRef] [Scilit]
- D’Alessandro, A.; Pisello, L.A.; Fabiani, C.; Ubertini, F.; Cabeza, L.F.; Cotana, F. Multifunctional smart concretes with novel phase change materials: Mechanical and thermo-energy investigation. Appl. Energy 2018, 212, 1448–1461. [Google Scholar] [CrossRef] [Scilit]
- Cascone, Y.; Capozzoli, A.; Perino, M. Optimisation analysis of PCM-enhanced opaque building envelope components for the energy retrofitting of office buildings in Mediterranean climates. Appl. Energy 2018, 211, 929–953. [Google Scholar] [CrossRef] [Scilit]
- Saffari, M.; Gracia, D.A.; Ushak, S.; Cabeza, L.F. Passive cooling of buildings with phase change materials using whole-building energy simulation tools: A review. Renew. Sustain. Energy Rev. 2017, 801, 239–255. [Google Scholar] [CrossRef] [Scilit]
- Song, M.; Niu, F.; Mao, N.; Hu, Y.; Deng, S. Review on building energy performance improvement using phase change materials. Energy Build. 2018, 158, 776–793. [Google Scholar] [CrossRef] [Scilit]
- Kong, X.F.; Yao, C.Q.; Jie, P.F.; Liu, Y.; Qi, C.; Rong, X. Development and thermal performance of an expanded perlite-based phase change material wallboard for passive cooling in building. Energy Build. 2017, 152, 547–557. [Google Scholar] [CrossRef] [Scilit]
- Sun, X.; Zhang, Q.; Medina, A.M.; Lee, K.O. Energy and economic analysis of a building enclosure outfitted with a phase change material board (PCMB). Energy Convers. Manag. 2014, 83, 73–78. [Google Scholar] [CrossRef] [Scilit]
- Al-Absi, Z.A.; Hafizal, M.I.M.; Ismail, M. Innovative PCM-incorporated foamed concrete panels for walls’ exterior cladding: An experimental assessment in real-weather conditions. Energy Build. 2023, 288, 113003. [Google Scholar] [CrossRef] [Scilit]
- Luo, C.; Xu, L.; Ji, J.; Liao, M.; Sun, D. Experimental study of a modified solar phase change material storage wall system. Energy 2017, 128, 224–231. [Google Scholar] [CrossRef] [Scilit]
- Zhou, S.Q.; Song, M.J.; Shan, K.; Razaqpur, A.G.; Huang, J.J. Parametric and optimization analyses of a dynamic trombe wall incorporating PCM to save heating energy under cold climate zones. Renew. Energy 2024, 237, 121537. [Google Scholar] [CrossRef] [Scilit]
- Mathis, D.; Blanchet, P.; Lagière, P.; Landry, V. Performance of wood-based panels integrated with a bio-based phase change material: A full-scale experiment in a cold climate with timber-frame huts. Energies 2018, 11, 3093. [Google Scholar] [CrossRef] [Scilit]
- Huynh, A.; Dias Barkokebas, R.; Al-Hussein, M.; Cruz-Noguez, C.; Chen, Y. Energy-Efficiency Requirements for Residential Building Envelopes in Cold-Climate Regions. Atmosphere 2021, 12, 405. [Google Scholar] [CrossRef] [Scilit]
- Albelwi, N.; Ltifi, M.; Alkhatib, O.J.; Singh, P.K.; Mahariq, I.; Hassan, R.; Rahmani, Y.; Dahari, M. CFD investigation of PCM/PMMA enhanced CMUs with dual hollow sections for improved thermal performance in cold and freezing climates. Sci. Rep. 2026, 16, 17480. [Google Scholar] [CrossRef] [Scilit] [PubMed]
- Rahmanian, V.; Pirzada, T.; Wang, S.; Khan, S.A. Cellulose-based hybrid aerogels: Strategies toward design and functionality. Adv. Mater. 2021, 33, 2102892. [Google Scholar] [CrossRef] [Scilit] [PubMed]
- Zhao, S.; Siqueira, G.; Drdova, S.; Norris, D.; Ubert, C.; Bonnin, A.; Galmarini, S.; Ganobjak, M.; Pan, Z.; Brunner, S.; et al. Additive manufacturing of silica aerogels. Nature 2020, 584, 387–392. [Google Scholar] [CrossRef] [Scilit] [PubMed]
- Yang, J.; Wu, H.; Xu, X.; Huang, G.; Xu, T.; Guo, S.; Liang, Y. Numerical and experimental study on the thermal performance of aerogel insulating panels for building energy efficiency. Renew. Energy 2019, 138, 445–457. [Google Scholar] [CrossRef] [Scilit]
- Ibrahim, M.; Nocentini, K.; Stipetic, M.; Dantz, S.; Caiazzo, F.G.; Sayegh, H.; Bianco, L. Multi-field and multi-scale characterization of novel super insulating panels/systems based on silica aerogels: Thermal, hydric, mechanical, acoustic, and fire performance. Build. Environ. 2019, 151, 30–42. [Google Scholar] [CrossRef] [Scilit]
- Kosny, J.; Fontanini, A.D.; Shukla, N.; Fallahi, A.; Watts, A.; Trifu, R.; Ganapathysubramanian, B. Thermal performance analysis of residential attics containing high performance aerogel-based radiant barriers. Energy Build. 2018, 158, 1036–1048. [Google Scholar] [CrossRef] [Scilit]
- Liao, W.; Wang, R.; Wang, X.; Chen, L.; Zhao, X.; Xing, J.; Wang, J.; Xie, H. Thermal energy management and utilization of high-heat-capacity nickel foam/kapok Core-Shell aerogel composite phase change materials. Appl. Therm. Eng. 2026, 298, 131156. [Google Scholar] [CrossRef] [Scilit]
- Peng, K.; Ran, Y.; Ye, J.; Guo, X.; Chen, H.; Wang, H.; Su, L.; Niu, M.; Lu, D.; Li, X. Montmorillonite aerogel-based phase change composites with efficient thermal energy storage. J. Energy Storage 2025, 132, 117711. [Google Scholar] [CrossRef] [Scilit]
- Wen, B.; Zuo, L.; Jian, N.; Song, X.; Miao, B.; Zhao, L.; Zhao, Y.; Zhang, K. Beehive-Inspired Aerogels with Self-Assembled Phase Change Walls for Thermal Regulation. ACS Energy Lett. 2025, 10, 6197–6206. [Google Scholar] [CrossRef] [Scilit]
- Liu, P.; Chen, X.; Li, Y.; Cheng, P.; Tang, Z.; Lv, J.; Aftab, W.; Wang, G. Aerogels Meet Phase Change Materials: Fundamentals, Advances, and Beyond. ACS Nano 2022, 16, 15586–15626. [Google Scholar] [CrossRef] [Scilit] [PubMed]
- JGJ/T 220-2010; Technical Specification for Plastering Mortar. China Architecture & Building Press: Beijing, China, 2010.
- Xu, E.T. Preparation and Properties of Phase-Change Energy-storage Mortar; Harbin Institute of Technology: Harbin, China, 2011. [Google Scholar]
- JCGM 100:2008; Evaluation of Measurement Data—Guide to the Expression of Uncertainty in Measurement. BIPM: Sèvres, France, 2008.
- GB 50176-2016; Code for Thermal Design of Civil Building. China Architecture & Building Press: Beijing, China, 2016.
- American Society of Heating; Refrigerating and Air-Conditioning Engineers. ASHRAE Guideline 14-2014: Measurement of Energy, Demand and Water Savings; ASHRAE: Atlanta, GA, USA, 2014. [Google Scholar]

Disclaimer/Publisher’s Note: The statements, opinions and data contained in all publications are solely those of the individual author(s) and contributor(s) and not of MDPI and/or the editor(s). MDPI and/or the editor(s) disclaim responsibility for any injury to people or property resulting from any ideas, methods, instructions or products referred to in the content. |
© 2026 by the authors. Licensee MDPI, Basel, Switzerland. This article is an open access article distributed under the terms and conditions of the Creative Commons Attribution (CC BY) license.