


Abstract
Large-diameter hinged-bolt connectors markedly reduce the early slip caused by bolt-to-hole clearance in conventional bolted connectors while avoiding welding-related problems associated with large-diameter headed studs in steel–ultra-high-performance concrete (UHPC) composite beams. However, their internal load-transfer mechanism cannot be directly quantified through push-out tests. A three-dimensional nonlinear finite element model was developed and validated against twelve push-out specimens. For the UHPC specimens, the model provided quantitatively reliable predictions of peak shear resistance and ultimate slip, and accurately captured the governing bolt shear fracture failure mode. The validated model was used to quantify the distributions of shear force, axial force, and bending moment along the hinged bolt. After excluding the specimens strongly affected by concrete crushing or severe steel-flange deformation, the remaining specimens exhibited maximum bolt shear forces of approximately 68–83% of the corresponding pure-shear resistance and maximum axial forces of approximately 10–20% of the pure-tension resistance. For the investigated specimens, the effective concrete-reaction length averaged 1.53 times the smooth-shank diameter. Parametric analyses showed that increasing the bolt grade from 4.6 to 12.9 raised the peak shear resistance by approximately 131%, while progressively shifting the governing response from bolt shear fracture toward UHPC crushing. Bolt aspect ratios of 2.6–4.0 produced similar bolt-fracture-controlled responses, whereas an aspect ratio of 1.0 caused UHPC pry-out. Increasing the steel grade from Q355 to Q690 and the longitudinal bolt spacing from four to seven nominal bolt diameters raised the peak resistance by only 7.3% and 4.0%, respectively. These findings provide a mechanical basis for the rational design of large-diameter hinged-bolt connectors.
1. Introduction
Steel–concrete composite beams efficiently utilize the complementary structural roles of steel and concrete—the concrete primarily resists compression and the steel resists tension, with shear connectors enabling the two materials to work together to achieve their respective material advantages—and have therefore been extensively employed in bridge and building structures. With the advent of ultra-high-performance concrete (UHPC), replacing conventional concrete slabs with UHPC slabs offers significant advantages, owing to the material’s superior compressive strength, tensile resistance, toughness, and durability [1,2]. These exceptional properties allow for the use of thinner concrete slabs and reduced structural self-weight while maintaining or even enhancing the load-carrying capacity of composite members [2,3]. Consequently, steel–UHPC composite beams have attracted increasing attention as an efficient structural system, particularly in bridge engineering and prefabricated construction. Full-scale beam tests have confirmed the feasibility of both welded and demountable UHPC deck systems [4], and the flexural response of such beams varies notably with the connector type [3]. However, the enhanced load-carrying capacity of steel–UHPC composite beams also results in increased longitudinal shear demand at the steel–UHPC interface. Shear connectors are therefore critical components for developing composite action, as they transfer longitudinal shear forces and restrain relative slip and separation between the steel beam and the UHPC slab. Their shear resistance, stiffness, and deformation capacity significantly influence the overall mechanical behavior of steel–UHPC composite beams [2].
Headed studs are the most widely used shear connectors in conventional steel–concrete composite structures due to their simple configuration and satisfactory shear performance [5,6]. For steel–UHPC composite beams subjected to relatively high interfacial shear demand, the shear resistance of the connection can generally be enhanced by increasing either the number or the diameter of the studs. Nevertheless, a dense arrangement of studs may induce interaction among adjacent connectors, commonly referred to as the group-stud effect, and can also increase fabrication complexity [7,8,9,10]. Increasing the stud diameter is a viable alternative for reducing the required number of connectors, and previous studies have demonstrated the considerable shear resistance of large-diameter studs embedded in both conventional concrete and UHPC [7,8,9,11]. However, as the stud diameter increases, the reliability of the welded connection becomes increasingly critical, and weld-related failures may prevent the full utilization of the mechanical properties of large-diameter studs. Previous push-out tests on large studs in steel–UHPC composite members have indeed shown that the governing failure mode can shift from stud-shank fracture to weld failure when the stud diameter becomes excessively large [7,12]. Moreover, conventional welded studs permanently connect the steel beam and concrete slab, making dismantling, replacement, and reuse of deteriorated components difficult. Perfobond leiste (PBL) connectors, which transfer interface shear through concrete dowels and end bearing, have also been widely adopted in steel–UHPC composite structures owing to their high stiffness and deformation tolerance [13,14,15]. Nevertheless, their fabrication requires additional welding of rib plates and their behavior is sensitive to rib geometry. These limitations motivate the development of welding-free shear connectors capable of providing high shear resistance while retaining favorable construction and maintenance characteristics.
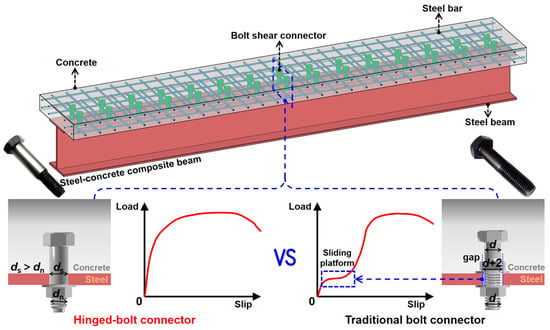
Bolted shear connectors present a promising alternative to welded studs by eliminating welding operations and facilitating the assembly, dismantling, and replacement of individual components in composite structures [16,17,18]. Various demountable and high-strength bolted connectors have consequently been developed and investigated through experimental and numerical studies [19,20,21]. However, conventional bolted connectors generally require a clearance between the bolt shank and the preformed hole to facilitate installation. Once the interfacial friction is overcome, this bolt-to-hole clearance produces an evident early-slip or slip-plateau stage in the load–slip response, thereby reducing the initial shear stiffness and weakening composite action under service conditions [12,20,22]. To address this limitation while retaining the advantages of bolted construction, Chen et al. [12] proposed several novel bolted connectors by modifying the fit between the bolt shank and the steel hole, among which the hinged-bolt connector exhibited the most favorable overall shear performance. As illustrated in Figure 1, the enlarged smooth shank of the hinged bolt closely fits the corresponding hole in the steel flange, whereas the smaller threaded portion facilitates installation and connection with the nut. This interference fit reduces the significant bolt-to-hole clearance associated with conventional bolted connectors and therefore markedly reduces the early slip. Previous push-out tests demonstrated that removing this clearance had a limited influence on the ultimate shear resistance but substantially increased the initial shear stiffness; for instance, the stiffness of the M24 hinged-bolt connector was approximately 4.1 times that of the corresponding conventional bolted connector [12]. These characteristics indicate that large-diameter hinged-bolt connectors have considerable potential for transferring the high interfacial shear forces developed in steel–UHPC composite beams.
Figure 1.
Performance comparison between the proposed hinged-bolt connector and a conventional bolted connector.
In a previous experimental study by the authors [23], push-out tests were conducted on twelve specimens considering the effects of concrete strength, slab thickness, bolt diameter, bolt aspect ratio, steel-section type, and steel-flange thickness. Two predominant failure modes, namely bolt shear fracture and concrete crushing, were identified, and the influences of the investigated parameters on shear resistance, load–slip response, slip capacity, and uplift deformation were evaluated. Based on the observed deformation and failure characteristics, the total interfacial slip was attributed primarily to local concrete deformation, bearing deformation of the steel bolt hole, and shear/bending deformation of the bolt. A preliminary mechanical interpretation further suggested that the hinged bolt is subjected simultaneously to shear force, axial tension, and bending moment rather than pure shear [23]. Nevertheless, these interpretations were mainly derived from macroscopic experimental observations. Because the bolt is embedded within the concrete slab and passes through the steel flange, the development of internal stresses, strains, and local deformations in the bolt, UHPC, and steel flange cannot be measured directly during push-out testing. More importantly, the distributions and evolution of the shear force, axial force, and bending moment along the hinged bolt have not yet been quantitatively established. Previous numerical studies on other bolted shear connectors have demonstrated that experimentally validated finite element (FE) models can effectively reveal internal stress transfer, local deformation, bolt fracture, and combined force mechanisms that are difficult to identify experimentally [21,22,24,25]. Beyond mechanics-based modeling, data-driven techniques are also increasingly integrated into structural assessment and health monitoring, as reflected in recent reviews of machine learning for structural health monitoring [26,27] and vibration-data-driven damage prediction with hybrid-optimized models [28]. Once validated, an FE model—such as the one developed in this study—can serve as a virtual data source for data-driven approaches. However, for large-diameter hinged-bolt connectors in steel–UHPC composite beams, the detailed load-transfer path, coupled shear–tension–bending behavior, effective concrete-reaction length along the embedded shank, and the mechanisms governing transitions among bolt fracture, UHPC crushing, and pry-out failure remain insufficiently understood. In addition, the effects of several important variables, including bolt grade, a wider range of bolt aspect ratios, steel-beam strength, and longitudinal bolt spacing, require further investigation. Recent beam-level tests have further demonstrated the feasibility of hinged-bolt connectors in high-strength castellated steel–UHPC composite beams; however, those tests focused on the global flexural response and did not quantify the connector-level internal force distributions or detailed shear-transfer mechanism [29].
The present study uses three-dimensional nonlinear FE analysis to clarify the shear-transfer mechanism and internal force characteristics of large-diameter hinged-bolt connectors in steel–UHPC composite beams. A bolt material model is established from tensile and double-shear tests and incorporated into FE models of the twelve previously tested push-out specimens. The models are validated against the measured load–slip responses, peak shear resistances, ultimate slips, and failure modes, and are then used to examine stress development and load transfer among the steel beam, hinged bolt, concrete slab, and reinforcement. The distributions of shear force, axial force, and bending moment along the bolt are quantified to assess the coupled shear–tension–bending action and the effective concrete-reaction length. Finally, parametric analyses are conducted to examine the effect of bolt grade, bolt aspect ratio, steel-beam strength, and longitudinal bolt spacing.
2. Overview of Push-Out Tests
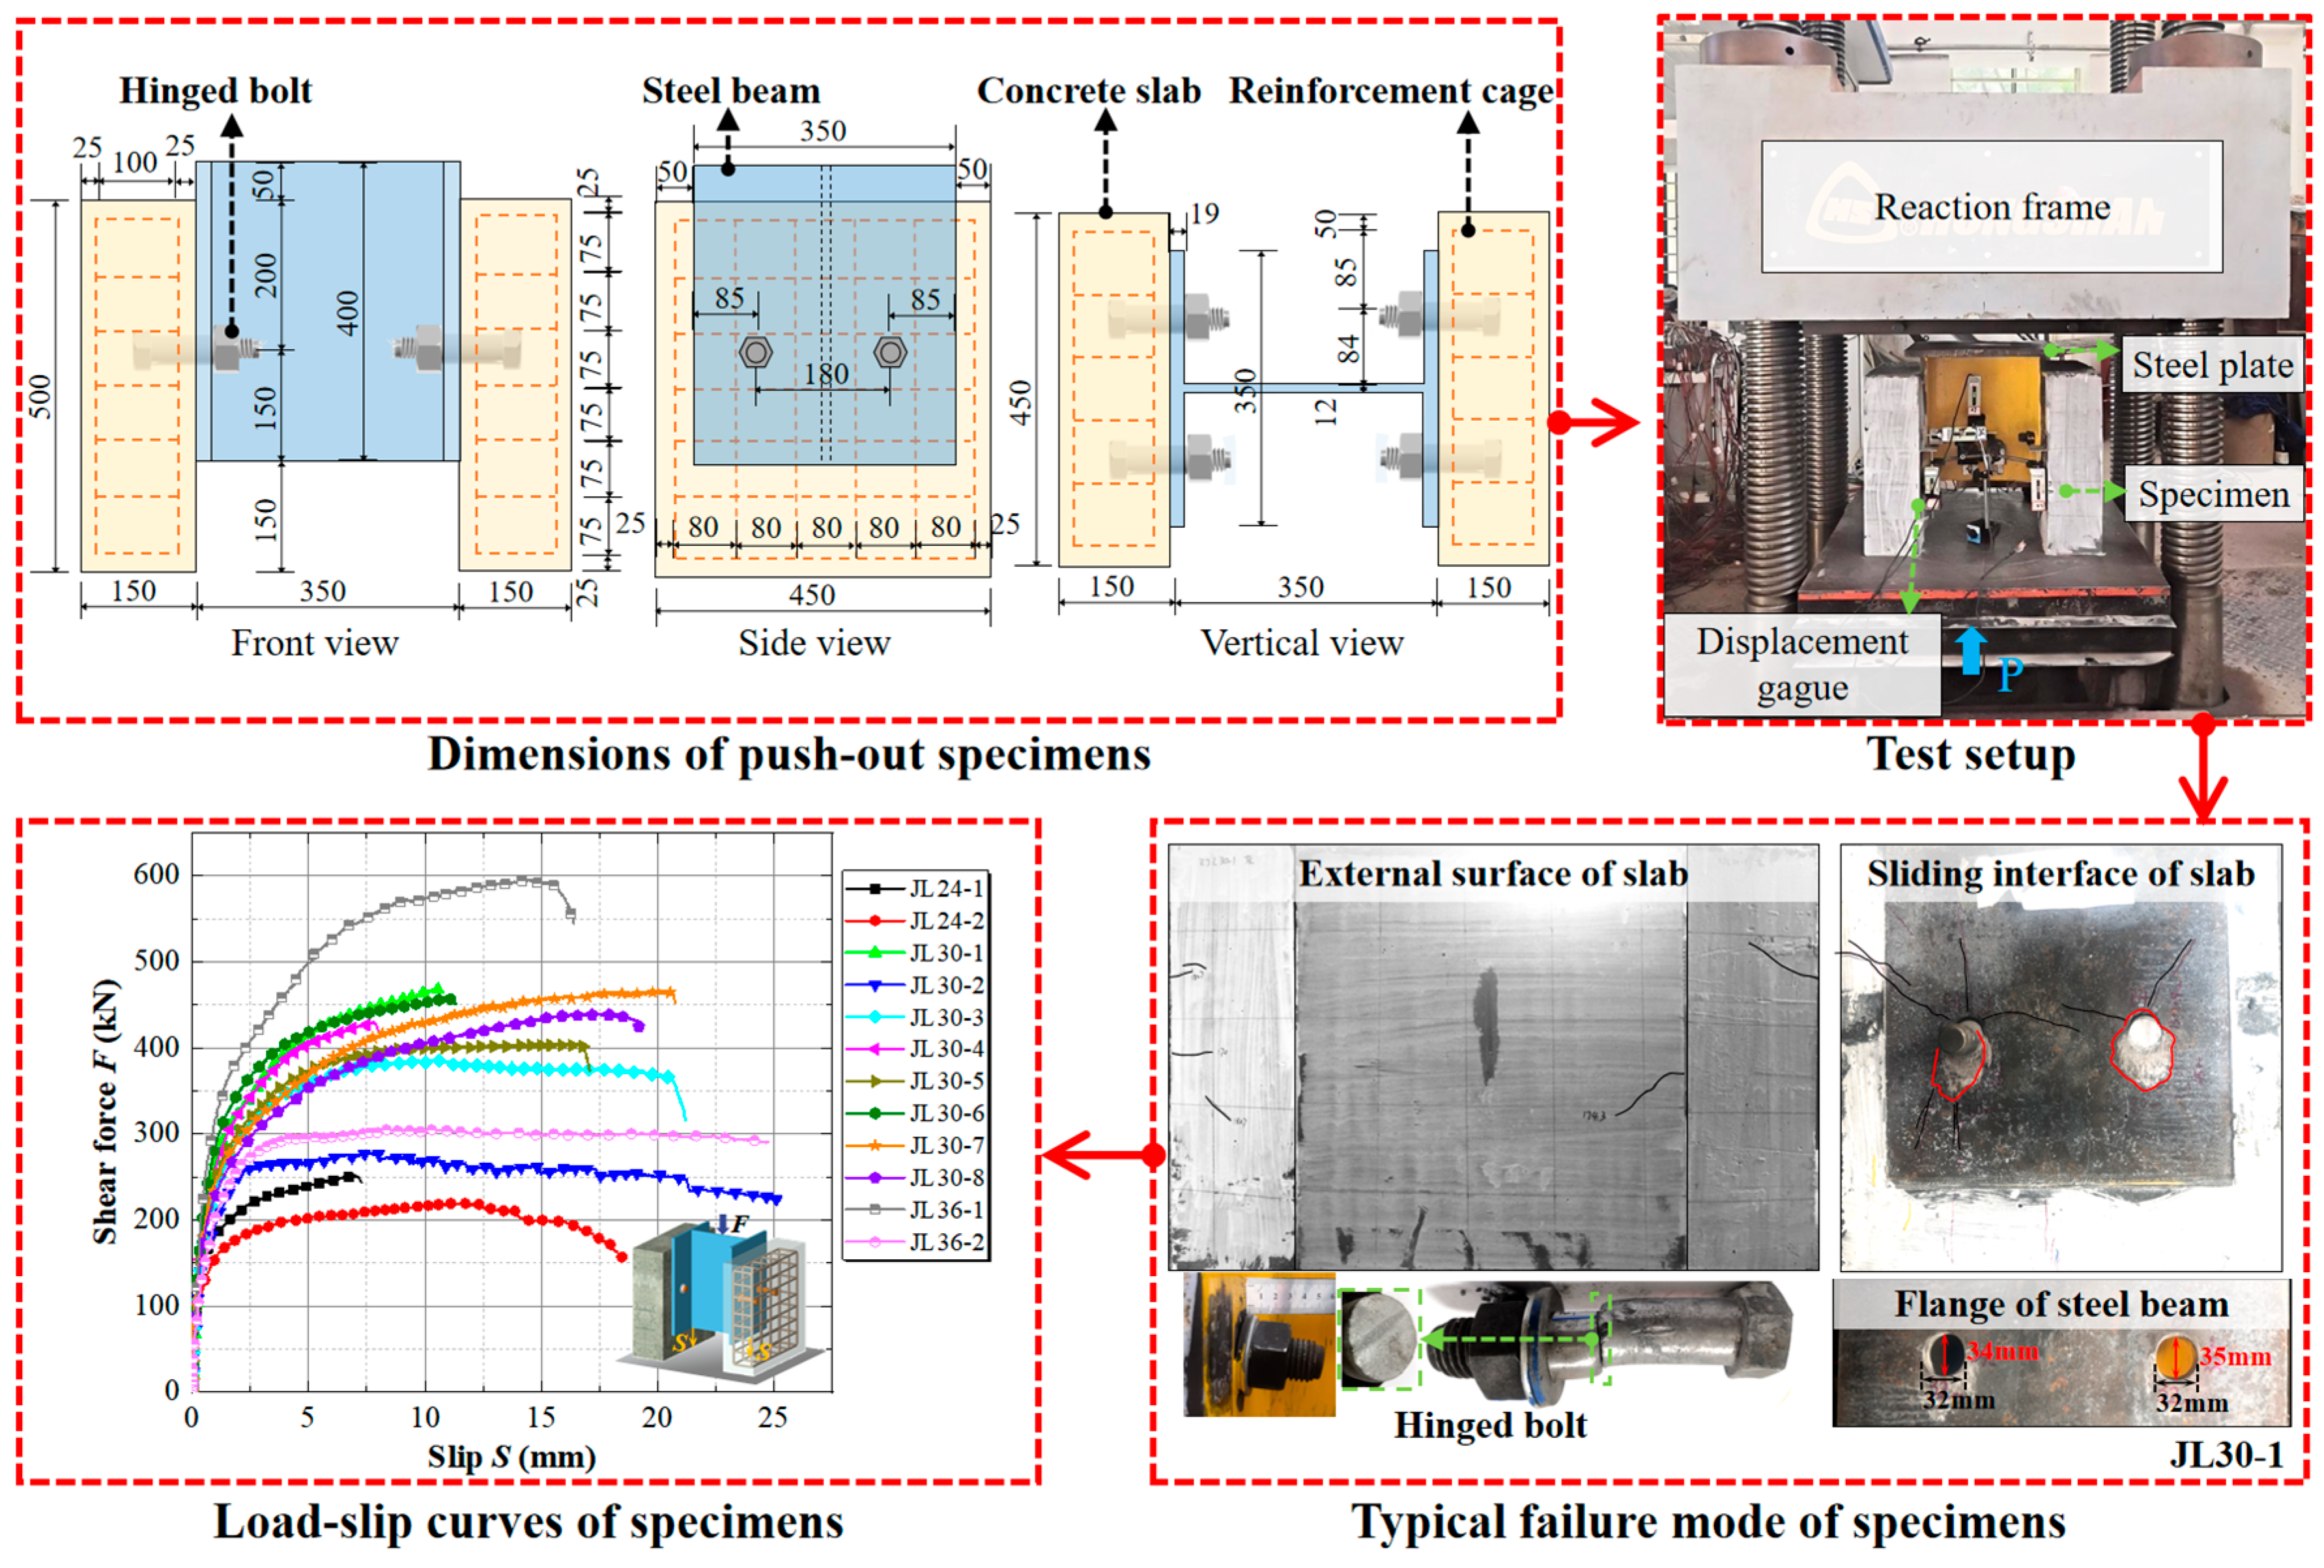
The experimental data used for the development and validation of the present FE model were obtained from the previous push-out test program reported by the authors [23]. Only the experimental information required for FE model definition and validation is summarized herein, while comprehensive details are available in [23]. Each specimen consisted of a central H-shaped steel section, two concrete slabs, hinged-bolt connectors, and reinforcement cages. The twelve push-out specimens, designated as JLDD-n (where JL is the acronym of the Chinese term for the hinged bolt, retained from the companion experimental study [23] for consistency of specimen identification; DD denotes the nominal bolt diameter in millimeters; and n is the serial number of the specimen within each diameter group), were designed to investigate the effects of bolt specification, concrete type, bolt aspect ratio, slab thickness, steel-beam flange thickness, and steel-beam type by varying these parameters in turn, as summarized in Table 1. Three nominal bolt sizes, M24, M30, and M36, were adopted, with nominal diameters dn of 24 mm, 30 mm, and 36 mm and corresponding smooth-shank diameters ds of 25 mm, 32 mm, and 38 mm, respectively. The bolt aspect ratio Rb, defined as the ratio of the embedded bolt length in the concrete to the smooth-shank diameter, ranged from 1.8 to 3.0 in the experimental program.
Table 1.
Main parameters of the push-out specimens used for FE validation, adapted from [23].
Grade 8.8 hinged bolts, Q355B steel sections, and HPB300 reinforcement were used in all specimens. The rolled steel section was HW350 × 350 × 12 × 19, while welded steel sections with flange thicknesses of 20 mm, 14 mm, and 10 mm were also investigated. The measured yield and ultimate tensile strengths of Q355B steel were 373 MPa and 566 MPa, respectively, while those of the 10-mm-diameter HPB300 reinforcement were 387 MPa and 428 MPa. The grade 8.8 hinged-bolt material exhibited a measured yield strength of 492 MPa, an ultimate tensile strength of 713 MPa, and an elastic modulus of 190 GPa. The concrete strength tests were conducted at an age of 28 days on specimens cured under natural conditions, following GB/T 31387-2015 [30] for the UHPC and GB/T 50081-2019 [31] for the C60 concrete. The measured cube and uniaxial compressive strengths of UHPC were 128.2 and 114.2 MPa, respectively, while those of the C60 concrete were 58.1 and 48.0 MPa. The push-out tests were conducted using a 5000 kN electro-hydraulic servo-controlled testing machine. Vertical linear variable differential transformers (LVDTs) were installed on both sides of each specimen at the connector level to measure the relative slip between the steel section and concrete slabs. After the specimens were preloaded to 50 kN, displacement-controlled loading was applied at a rate of 0.2 mm/s until the applied load decreased to approximately 80% of the peak shear resistance or obvious failure occurred.
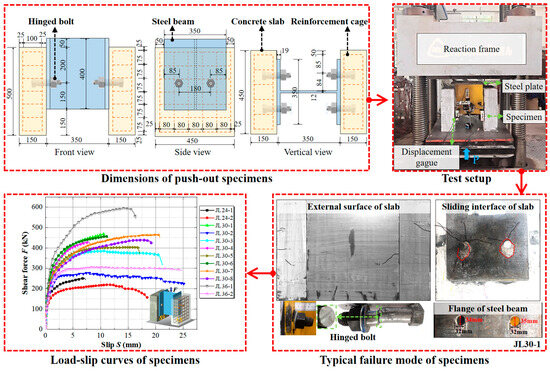
The experimental program exhibited two predominant failure modes. The UHPC specimens were generally governed by bolt shear fracture, whereas the C60 specimens were governed by concrete crushing before the bolt shear resistance was fully mobilized. Representative failure characteristics, together with the corresponding load–slip responses and test setup, are presented in Figure 2.
Figure 2.
Overview of the previous experimental study, adapted from [23]: specimen configuration, test setup, typical failure mode, and load–slip curves.
3. Finite Element Modeling
3.1. Geometry, Element Types and Meshing
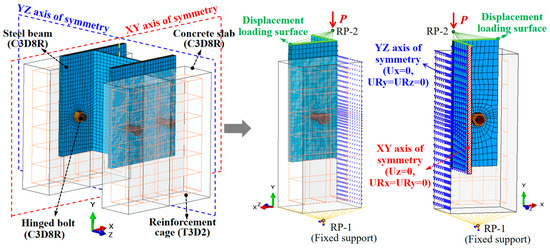
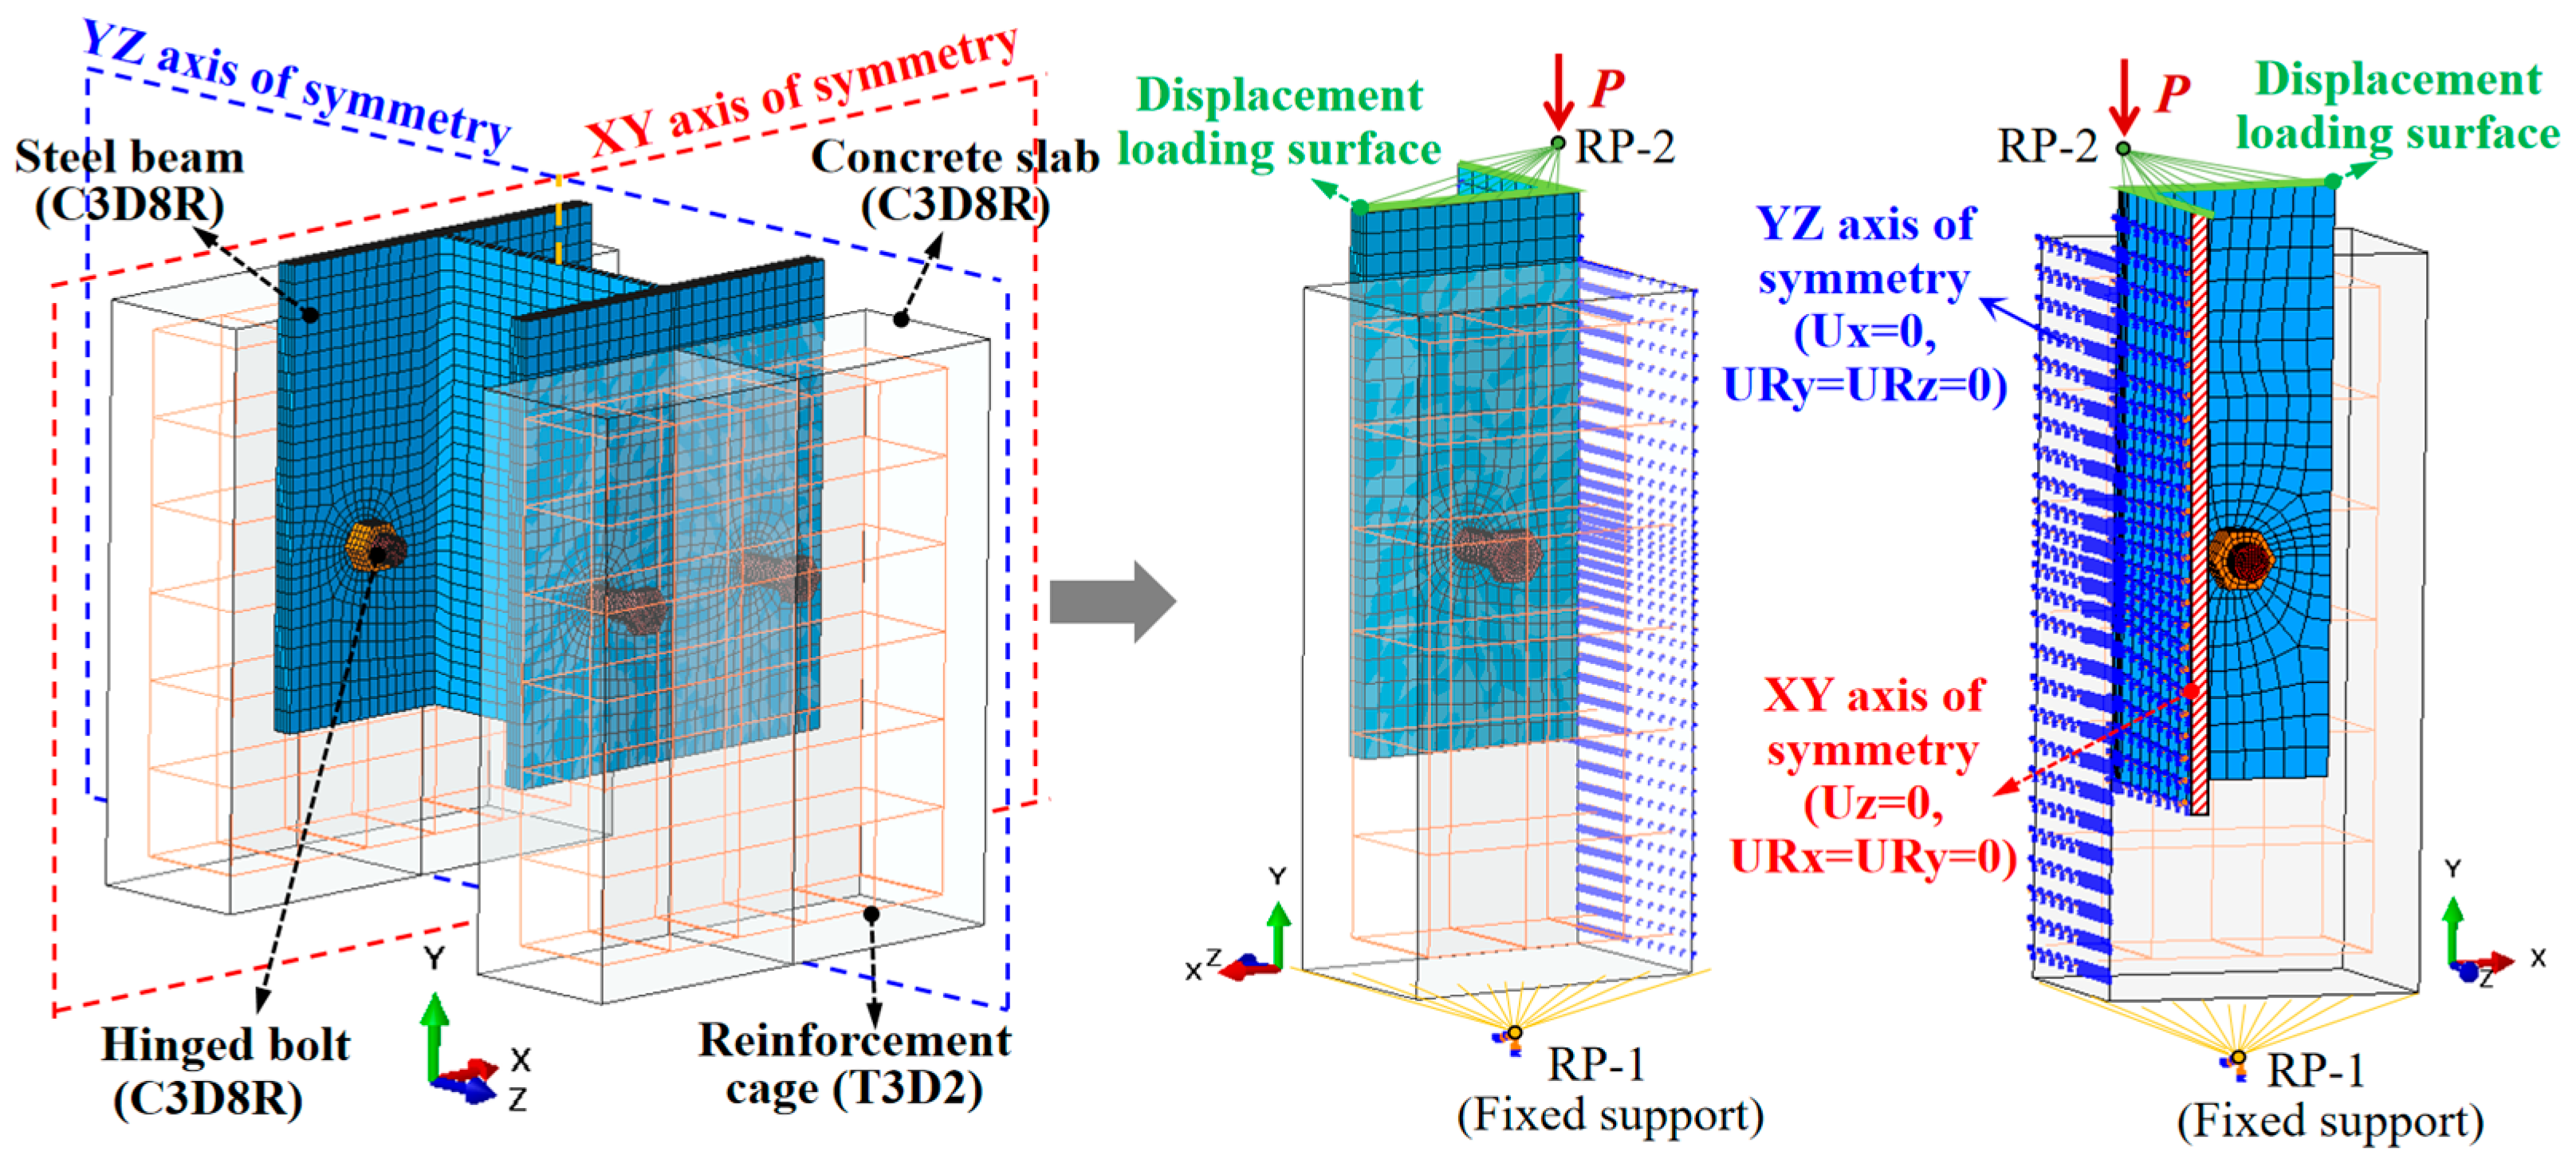
A three-dimensional nonlinear FE model was developed in ABAQUS to simulate the push-out tests and further investigate the shear behavior of the hinged-bolt connectors, following modeling strategies validated for bolted connectors in UHPC [22,24]. Considering the geometric, material, and loading symmetry of the specimens, only one quarter of the push-out specimen was modeled to reduce computational cost. As illustrated in Figure 3, the numerical model included all critical components involved in load transfer, namely the hinged bolts, nuts, steel beam, concrete slab, and reinforcement cage.
Figure 3.
FE model of the push-out specimen.
All components except the reinforcement were discretized using eight-node linear brick elements with reduced integration (C3D8R). This element type was adopted for the concrete slab, steel beam, hinged bolts, and nuts because it provides a suitable balance between computational efficiency and accuracy for nonlinear analyses involving material nonlinearity and complex contact interactions. The longitudinal and transverse reinforcing bars were represented by two-node linear three-dimensional truss elements (T3D2), since bending of the individual reinforcement bars was not of primary interest in the present push-out analysis.
A locally refined meshing strategy was employed to capture the pronounced stress concentrations, contact deformations, and localized nonlinear response in the vicinity of the hinged bolts and the steel–concrete interface. Consequently, relatively fine meshes were assigned to the hinged bolts, the regions surrounding the bolt holes, and the adjacent concrete, whereas progressively coarser meshes were used away from the connector region to improve computational efficiency. The characteristic element size was approximately 3 mm for the hinged bolts, while the maximum element size in the remote regions of the concrete slab was approximately 20 mm. Structured hexahedral sweep meshing was preferentially adopted for the solid components, with appropriate mesh control techniques applied around the circular bolt-hole regions to maintain satisfactory element quality. Based on a mesh sensitivity assessment (detailed in Appendix A), the adopted mesh configuration was used in all subsequent analyses.
3.2. Contact Interactions, Boundary Conditions and Loading Protocol
The interaction between the reinforcement cage and the concrete slab was modeled using the embedded-region constraint, with the reinforcement defined as the embedded region and the concrete slab as the host region. The inner surface of the nut was tied to the corresponding outer surface of the hinged bolt. In the physical specimens, a nominal geometric interference of 0.1 mm existed between the smooth bolt shank and the steel bolt hole to ensure a tight fit. To improve numerical convergence, this small geometric interference was not explicitly modeled. The bolt-hole interface was modeled using a zero-clearance surface-to-surface contact to allow for local bearing and separation. The other interfaces among the concrete slab, steel beam, and hinged bolt were also modeled using surface-to-surface contact. The tangential behavior was described using a penalty friction formulation with a friction coefficient of 0.3 [32], while the normal behavior was defined as hard contact, allowing separation after contact. A static implicit analysis procedure was adopted to simulate the quasi-static push-out tests. A single static analysis step was employed, and displacement-controlled loading was applied throughout the analysis.
Given the double symmetry of the specimen geometry and loading, symmetry boundary conditions were imposed on the two symmetry planes of the quarter model, as shown in Figure 3. Specifically, the YZ symmetry plane was restrained against translation in the X-direction and rotations about the Y- and Z-axes (Ux = URy = URz = 0), while the XY symmetry plane was restrained against translation in the Z-direction and rotations about the X- and Y-axes (Uz = URx = URy = 0). To reproduce the experimental support and loading conditions, a reference point (RP-1) was coupled to the bottom surface of the concrete slab and fully restrained. Another reference point (RP-2) was coupled to the top surface of the steel beam, and a prescribed displacement was applied to RP-2 in the negative Y-direction, consistent with the loading direction used in the experiments.
3.3. Material Constitutive Models
3.3.1. Concrete
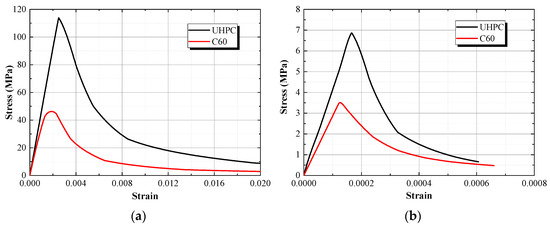
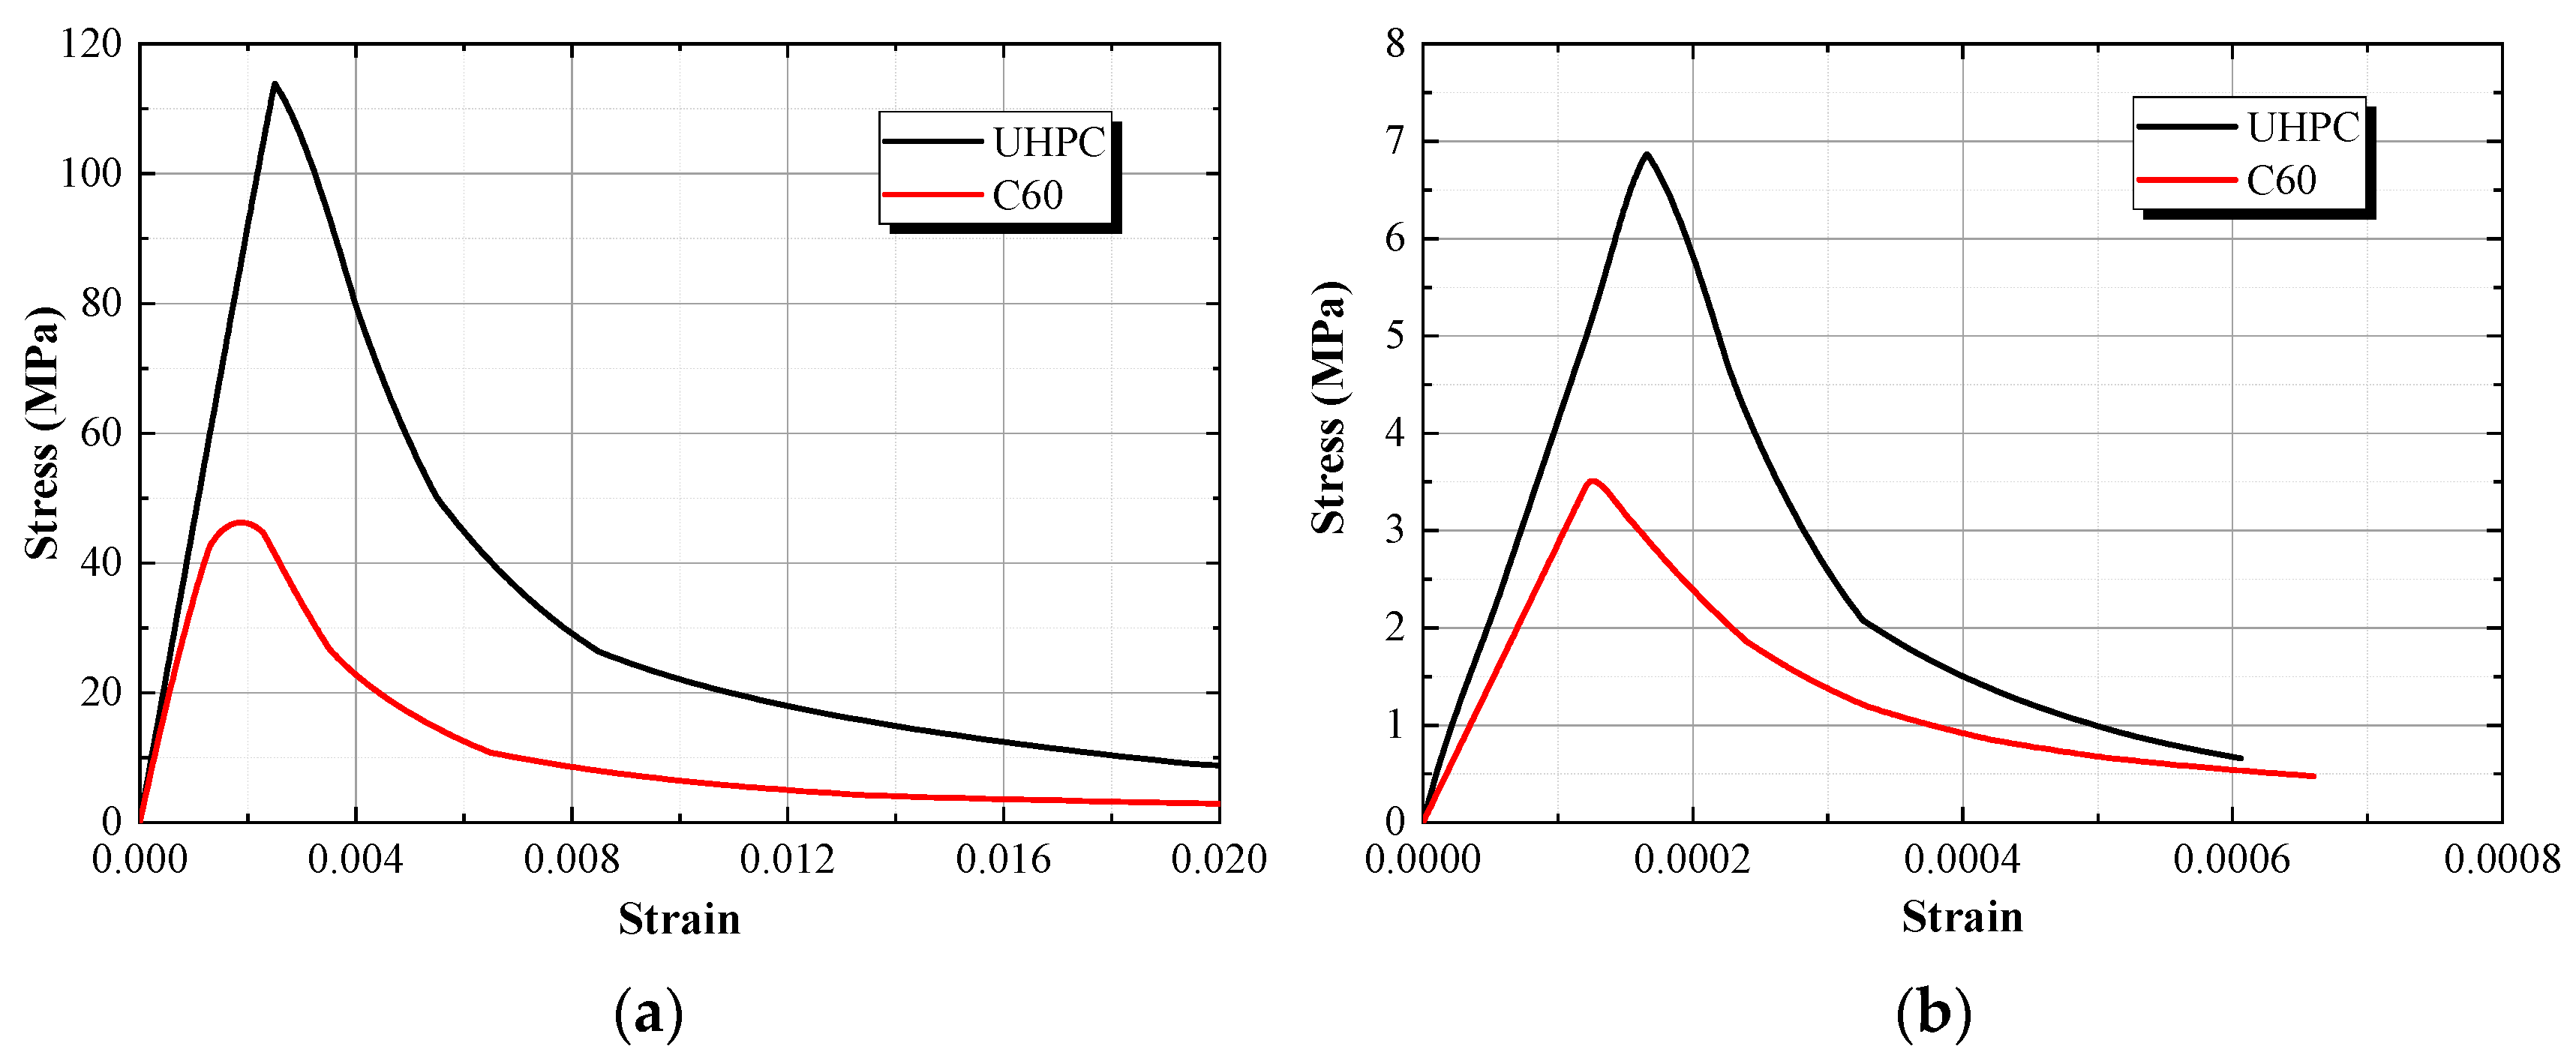
The concrete damaged plasticity (CDP) model [33,34] available in ABAQUS was employed to represent the nonlinear behavior of both UHPC and C60 concrete under compression and tension. The tensile and compressive damage variables of the CDP model were not specified because the experimental and numerical loading was strictly monotonic, with no unloading/reloading. These variables only govern the reduction in the unloading stiffness from E0 to (1–d)E0; under monotonic loading, the post-peak concrete response is governed by the softening branches of the adopted uniaxial stress–strain relationships. The uniaxial compressive stress–strain relationship proposed by Ding et al. [35], which is applicable to concrete with compressive strengths ranging from 10 MPa to 140 MPa, was adopted for both UHPC and C60 concrete. The resulting uniaxial constitutive relationships implemented in the FE analysis are illustrated in Figure 4. The compressive constitutive relationship is expressed as
where σc and εc are the uniaxial compressive stress and strain, respectively; fc and fcu are the uniaxial compressive strength and the compressive cube strength [36], respectively; xc is the compressive strain ratio; εcp is the strain at peak uniaxial compression; E0 and Esec are the initial elastic modulus and the secant modulus at the peak compressive stress, respectively; A is the ratio of the initial elastic modulus to the secant modulus; and B is a parameter governing the shape of the ascending branch of the compressive stress–strain relationship. The parameter α1, which controls the descending branch, was taken as 2.0 [9].
xc = εc/εcp
A = E0/Esec
B = 5(A − 1)2/3
Esec = fc/εcp
Figure 4.
Uniaxial concrete stress–strain relationships of UHPC and C60 concrete: (a) Compression; (b) Tension.
The tensile response was assumed linear elastic up to the peak tensile strength [37,38], followed by a nonlinear softening branch proposed by Ding et al. [35]. The tensile stress–strain relationship was defined as:
where σt and εt are the uniaxial tensile stress and strain, respectively; ft is the uniaxial tensile strength; xt is the tensile strain ratio; εtp is the strain at peak uniaxial tension.
xt = εt/εtp
In addition to the uniaxial constitutive relationships, several parameters were specified to characterize the multiaxial plastic response of concrete in the CDP model. The dilation angle, flow-potential eccentricity, and ratio of biaxial to uniaxial compressive strength were set to 38°, 0.1, and 1.16, respectively [39,40]. The ratio of the second stress invariant on the tensile meridian to that on the compressive meridian was set to 2/3. A viscosity parameter of 0.0005 was adopted to improve numerical convergence in the implicit analysis.
3.3.2. Hinged-Bolt Material Model and Fracture Criterion
- (1)
- Tensile constitutive model
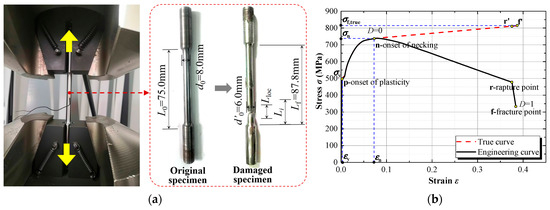
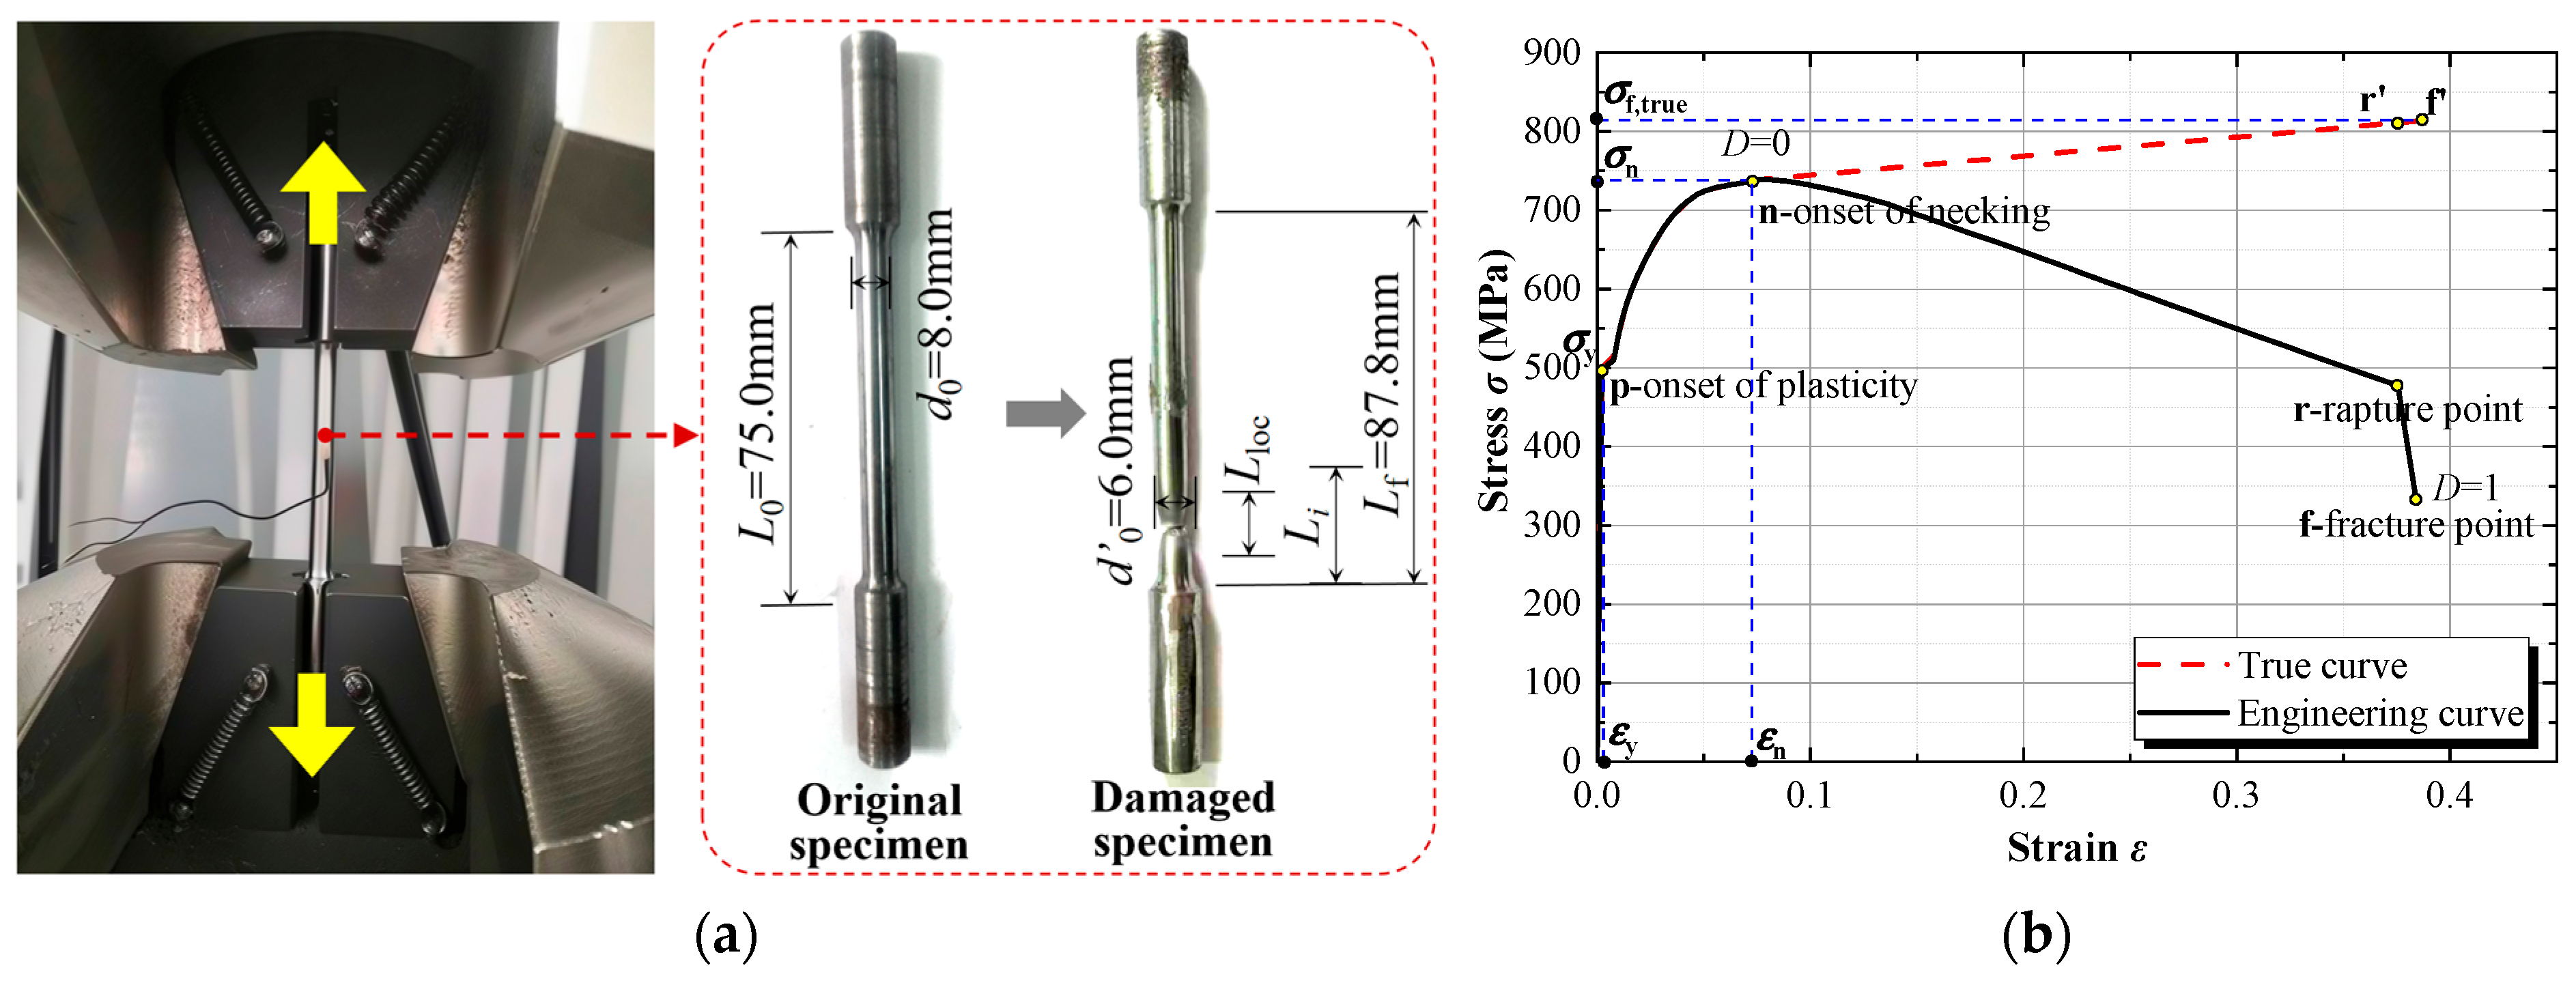
The material behavior of the grade 8.8 hinged bolt was characterized using tensile tests on machined coupon specimens, as shown in Figure 5a. The experimentally measured load–displacement response was first converted into an engineering stress–strain relationship. Before the onset of necking, deformation was assumed to remain uniformly distributed over the initial gauge length, and the true stress and true strain were calculated from the engineering quantities as:
σi,true = σi,eng(1 + εi,eng)
εi,true = ln(1 + εi,eng)
Figure 5.
Tensile response of the hinged bolt: (a) Tensile test and failure mode; (b) Engineering and reconstructed true stress–strain curves.
After the onset of necking, the uniform-deformation assumption is no longer applicable because the additional longitudinal deformation becomes progressively localized within the necking region. Following the strain-localization approach of Pavlović et al. [16], a variable effective gauge length Li was introduced to account for this localization:
where L0 is the initial gauge length, Lloc is the average length of the localized necking region, αL is the localization coefficient, and ΔLn and ΔLf are the measured elongations at the onset of necking and fracture, respectively. For the tested grade 8.8 bolt material, L0 = 75 mm, Lloc = 4 mm, αL = 0.3, ΔLn = 3.8 mm, and ΔLf = 10.5 mm.
The post-necking true strain was then obtained incrementally as:
The post-necking true stress was assumed to increase linearly from the necking point to the fracture point. The measured diameter of the fractured coupon was 6.0 mm, and the corresponding true fracture stress was calculated as σf,true = 815.6 MPa. Accordingly, the post-necking true stress was reconstructed as:
Finally, the corresponding plastic strain used in the ABAQUS metal plasticity model was calculated as:
where Eb is the measured elastic modulus of the bolt material, taken as 190 GPa. The resulting engineering and reconstructed true stress–strain relationships of the hinged-bolt material are shown in Figure 5b.
- (2)
- Shear-damage model
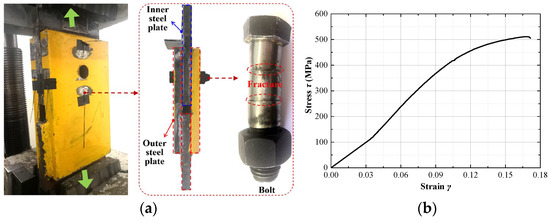
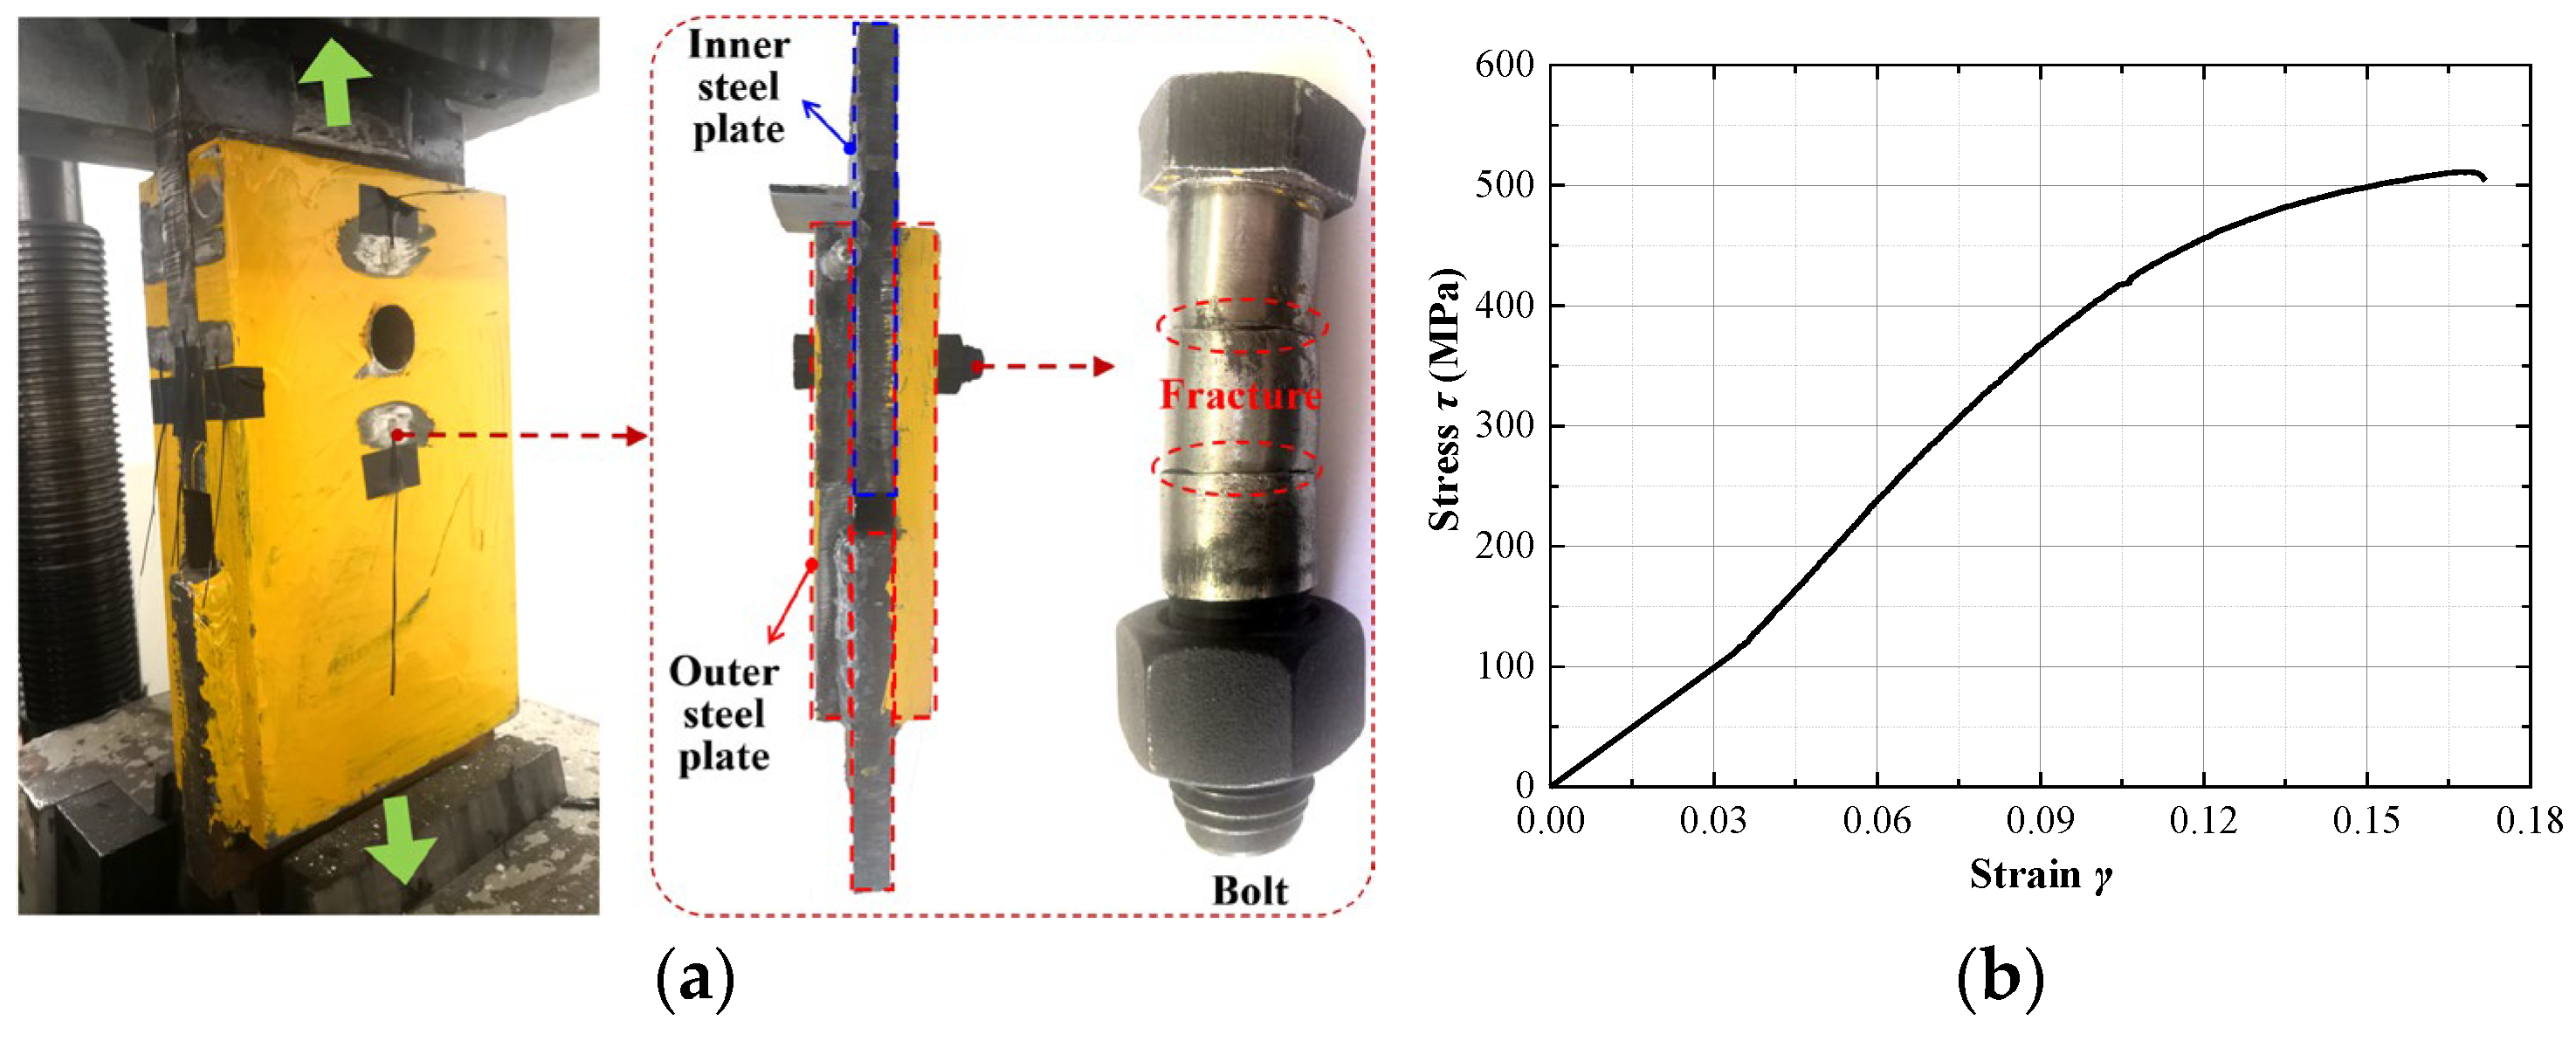
To reproduce the shear fracture observed in the push-out tests, the metal plasticity model described above was supplemented by a shear-damage initiation and evolution model. The required shear response was characterized using a double-shear test on an M24 hinged bolt. The test specimen involved two shear planes through the smooth shank, and the measured maximum load was approximately 502 kN, corresponding to a shear resistance of 251 kN per shear plane. Based on the smooth-shank cross-sectional area of 491 mm2, the nominal shear strength was calculated as 511.6 MPa. The M24, M30, and M36 hinged bolts were manufactured from the same batch of grade 8.8 bolt material, so that the tensile and shear properties entering the material model are identical at the material level. In addition, the shear-damage parameters are defined in stress–strain space and therefore do not explicitly involve the bolt diameter. Shear fracture in the push-out tests occurred along the smooth shank for all three bolt sizes, so the governing shear plane is geometrically self-similar, and the nominal shear strength of the ductile bolt material is governed primarily by plastic flow. The material model calibrated from the M24 tensile and double-shear tests was therefore adopted for the M30 and M36 hinged bolts. It should be acknowledged that the shear response was characterized only by the M24 double-shear test, and possible size effects on the nominal shear response of the larger-diameter bolts were not independently evaluated; this approximation is indirectly supported by the validation results in Section 4, in which the mean numerical-to-experimental peak resistance ratios of the bolt-shear-fracture specimens remained essentially unchanged across the three bolt diameters. The apparent shear strain γ was evaluated from the measured relative slip sr and the thickness of the inner steel plate as:
γ = sr/tip
The resulting nominal shear stress–apparent shear strain relationship is shown in Figure 6. The response was approximately linear during the initial stage, followed by nonlinear development and a short post-peak plateau before abrupt shear fracture.
Figure 6.
Double-shear response of the hinged bolt: (a) Double-shear test and failure mode; (b) Nominal shear stress–apparent shear strain curve.
The shear-damage initiation criterion was defined in terms of the equivalent plastic strain at damage initiation, the shear stress ratio, and the equivalent plastic strain rate. The equivalent plastic strain at shear-damage initiation was taken as 0.171 based on the calibrated double-shear response. Following the calibration procedure adopted in the FE model, the measured yield strength fby of 492 MPa and the nominal shear strength τu of 511.6 MPa were used to determine the shear stress ratio θs as:
The resulting damage-initiation parameters, namely the equivalent plastic strain at damage initiation (0.171), shear stress ratio (0.962), and equivalent plastic strain-rate parameter (0.006), were used to define shear-damage initiation in the hinged-bolt material.
After damage initiation, a displacement-based damage-evolution law with tabular softening and the maximum-degradation option was adopted. The equivalent plastic displacement was used as the damage-evolution measure to reduce mesh dependence and was defined as:
where Lch is the characteristic element length, and the equivalent plastic strain
denotes the plastic strain accumulated after damage initiation. For the adopted bolt mesh, the characteristic element length in the damage region was approximately 2.8 mm. The damage variable progressively increased with the equivalent plastic displacement until complete material degradation was reached.
Additionally, element deletion was activated to reproduce the local shear fracture of the hinged bolt. Once the material damage variable reached unity, the corresponding failed elements were removed from the analysis. This treatment enabled the FE model to reproduce the progressive loss of bolt resistance and localized shear-fracture behavior observed in the push-out tests.
3.3.3. Steel Beam and Reinforcement
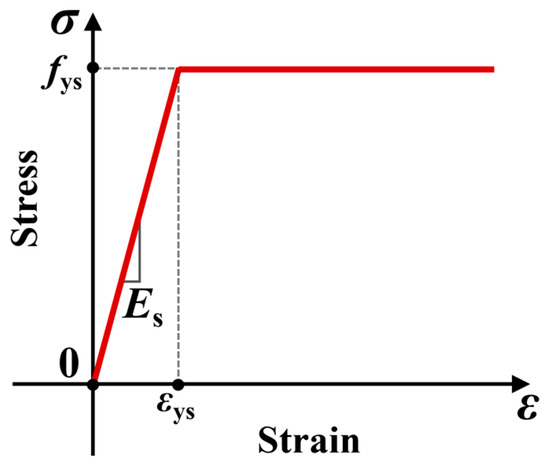
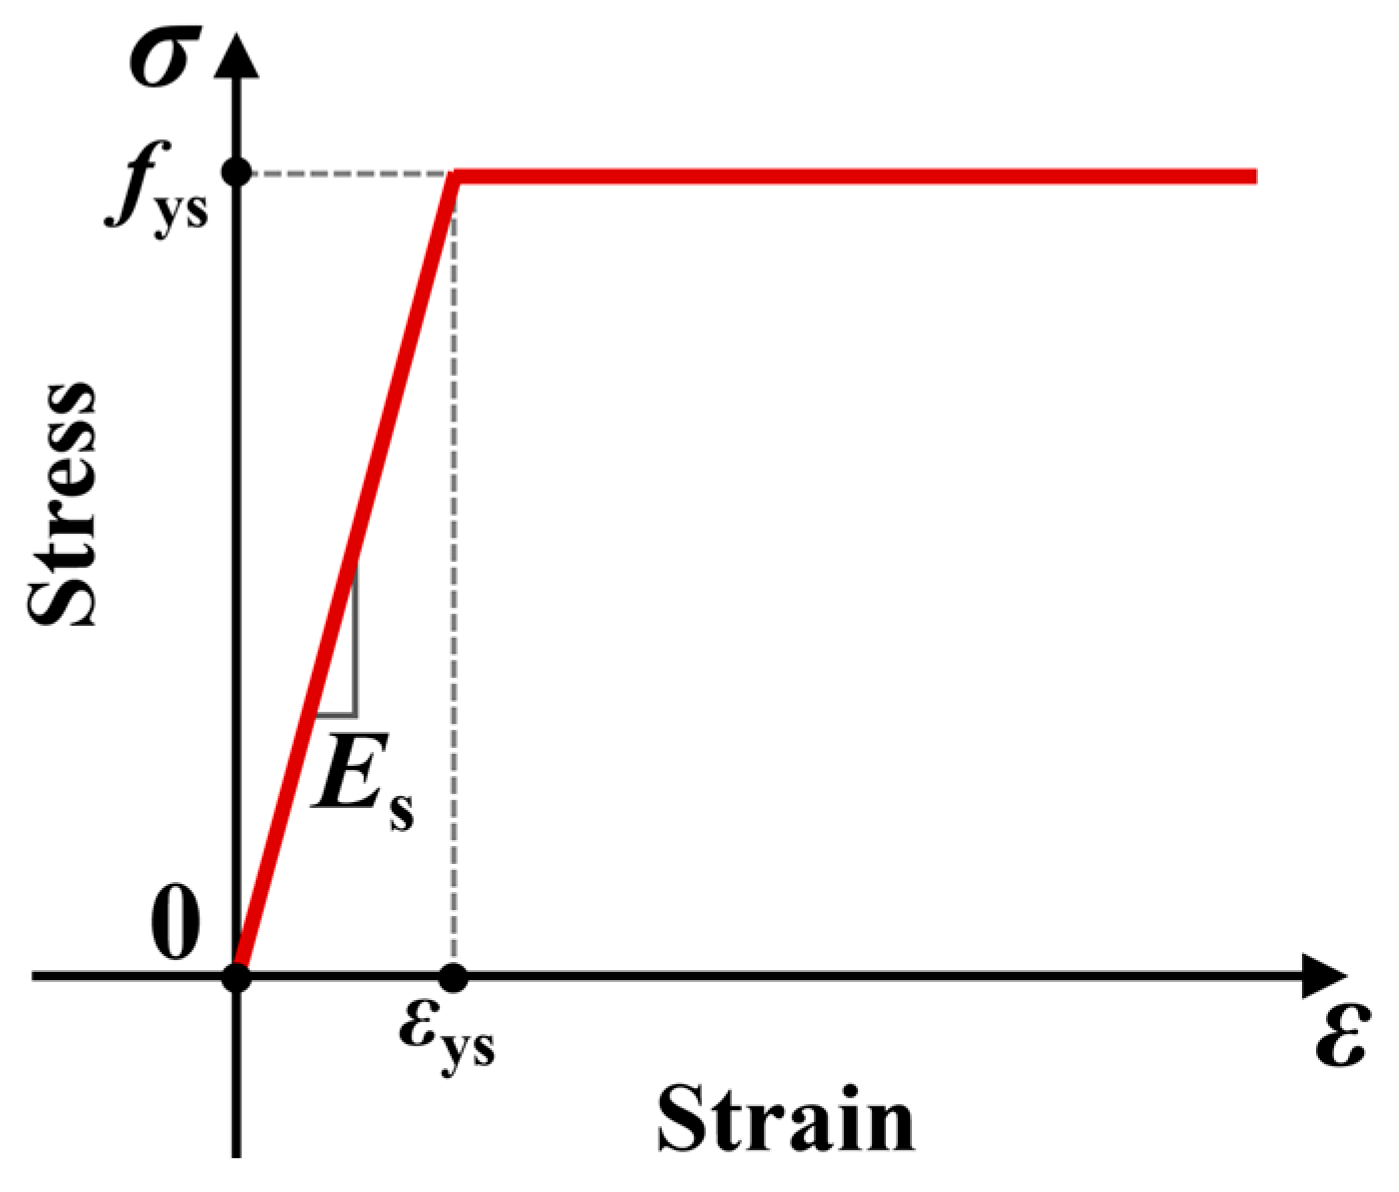
The HPB300 reinforcement and Q355B steel beam were modeled using elastic–perfectly plastic constitutive relationships. An elastic modulus of 206 GPa and a Poisson’s ratio of 0.3 were assigned to both materials, while the measured yield strengths of the HPB300 reinforcement and Q355B steel were taken as 387 and 373 MPa, respectively. The corresponding constitutive relationships adopted in the FE model are illustrated in Figure 7.
Figure 7.
Idealized stress–strain relationships of the steel beam and reinforcement.
4. Validation of the Finite Element Model
4.1. Load–Slip Response
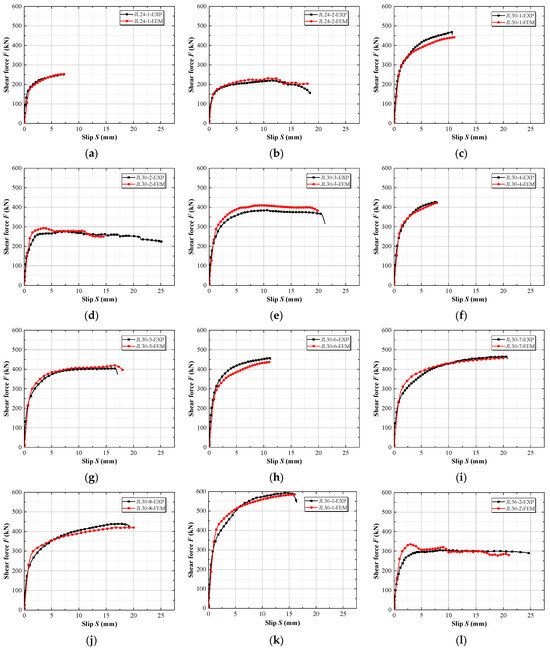
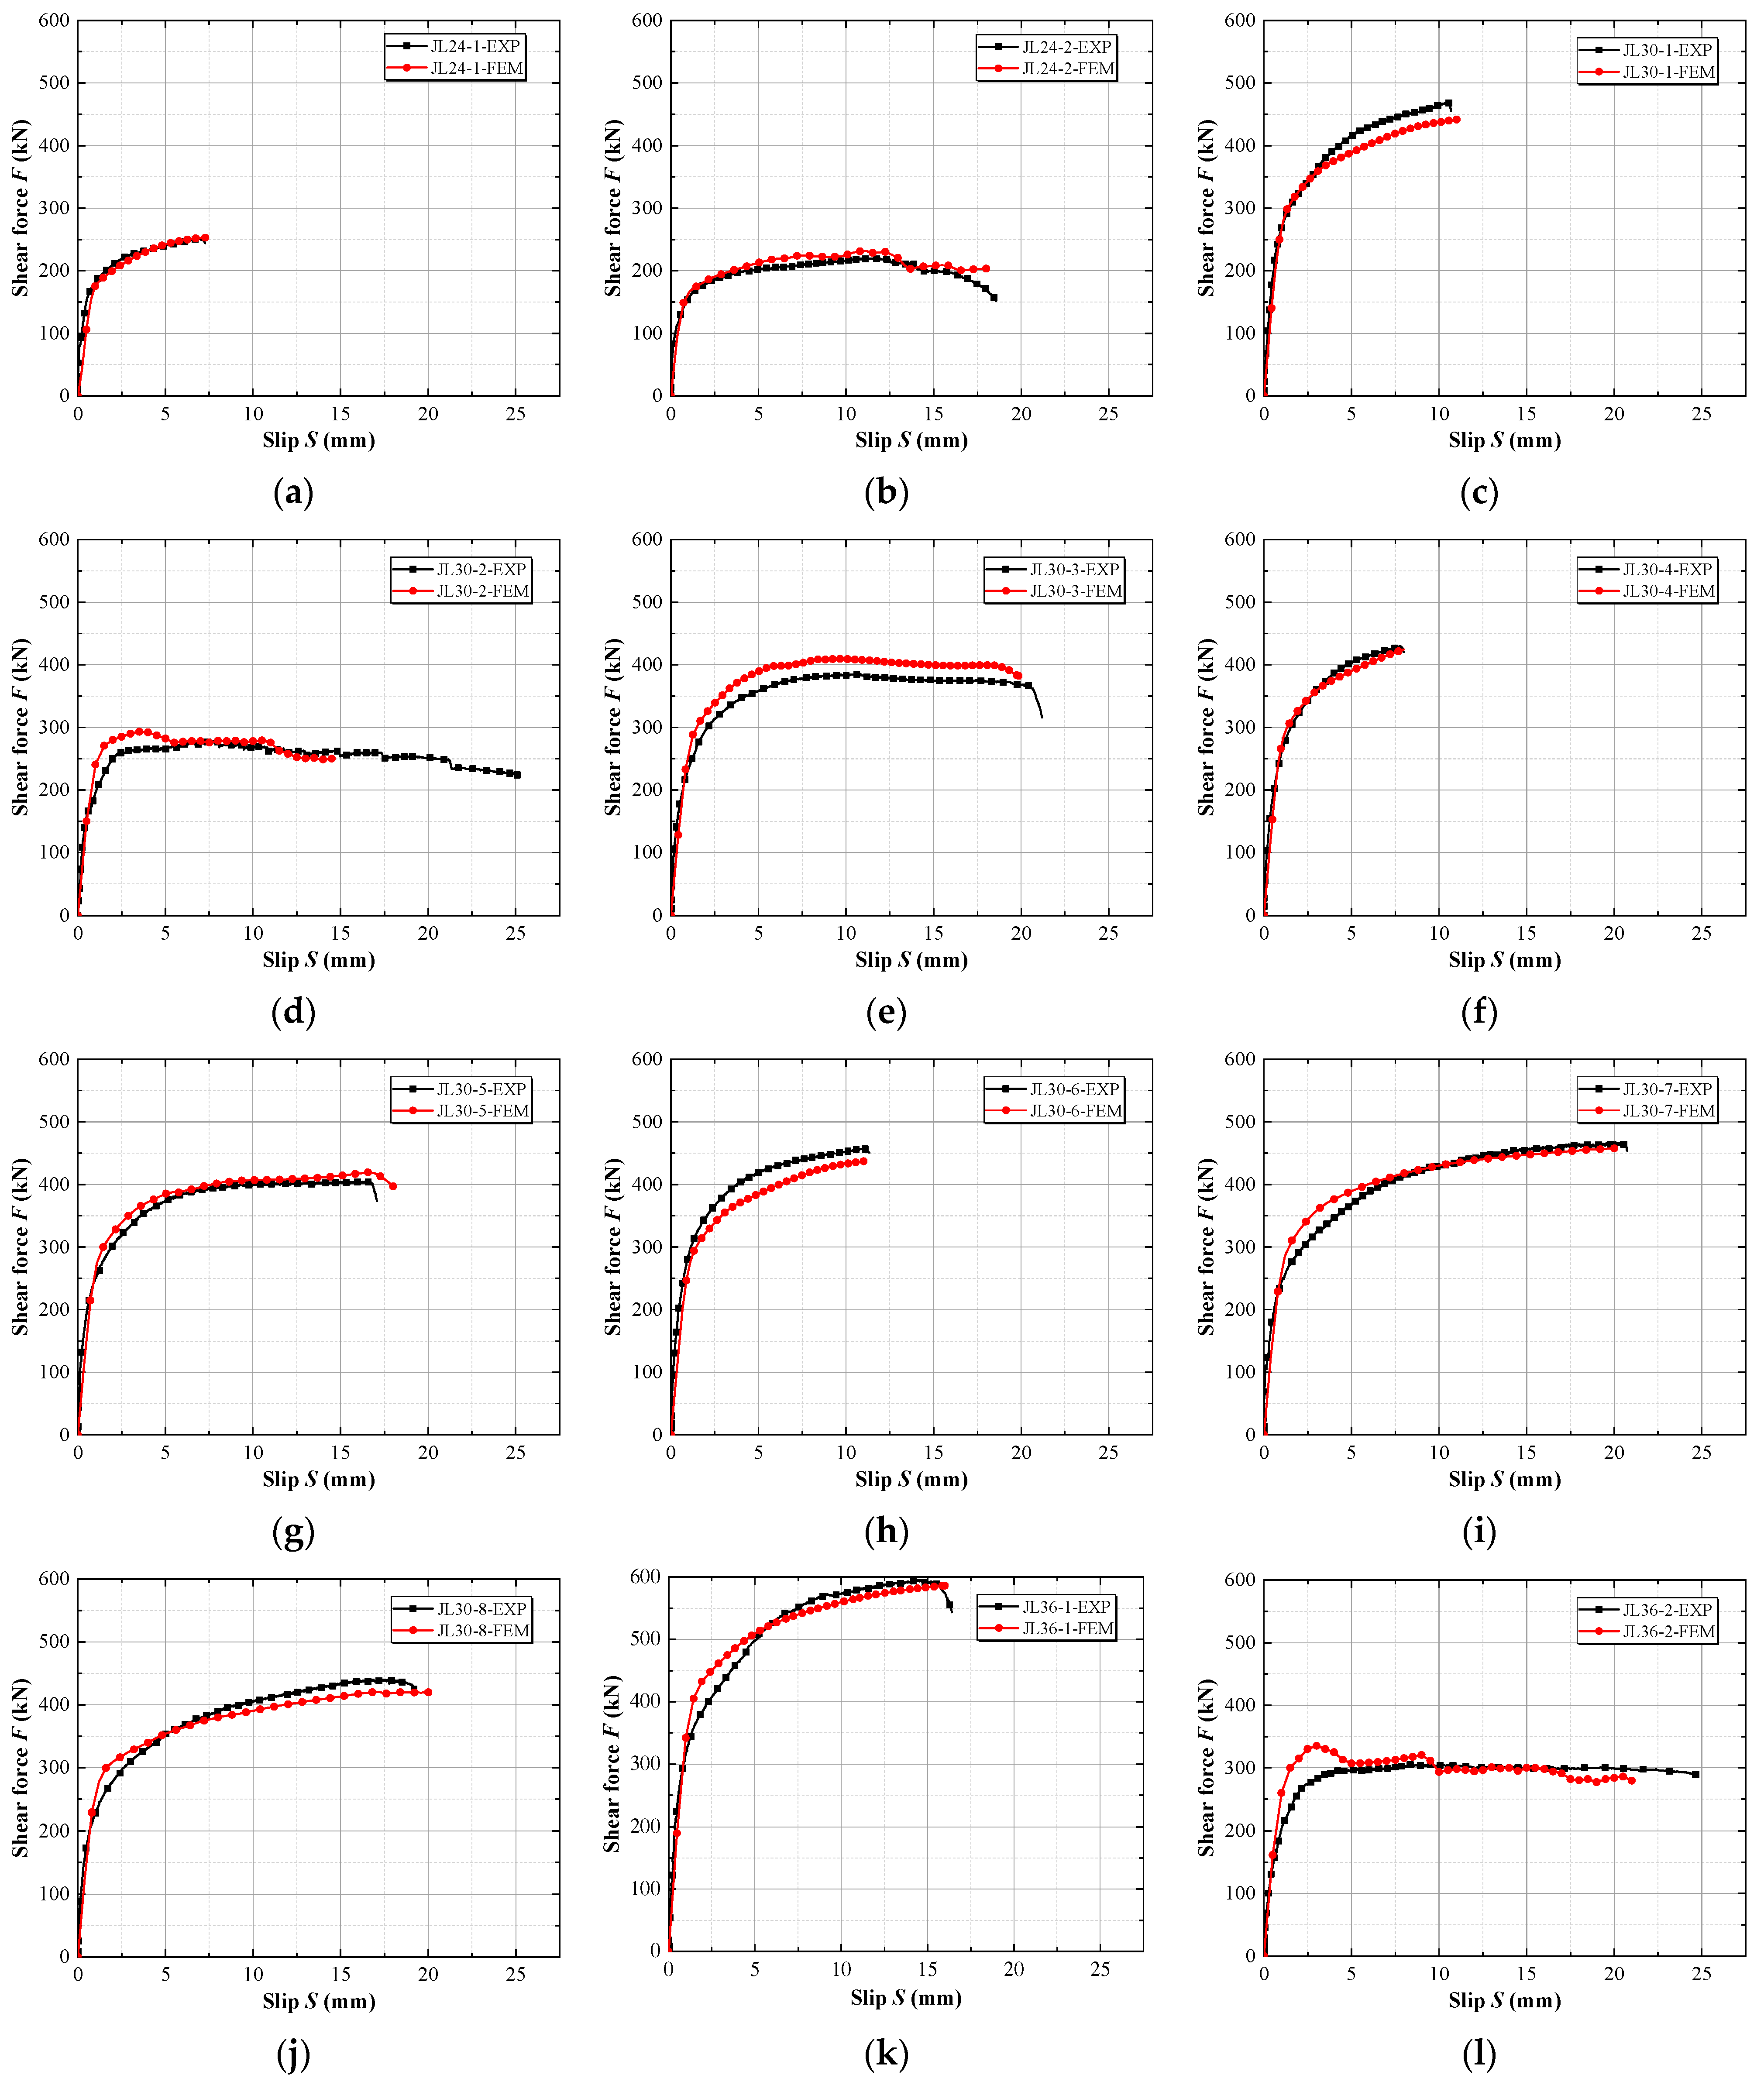
The numerical load–slip responses of the twelve push-out specimens are compared with the corresponding experimental results in Figure 8. The initial stiffness, peak shear resistances, and ultimate slips obtained from the tests and FE analyses are summarized in Table 2. The numerical curves generally captured the rapid increase in load during the initial loading stage, the subsequent nonlinear development, and, where present, the post-peak degradation. Good agreement was observed across specimens with varying bolt diameters, bolt aspect ratios, concrete strengths, slab thicknesses, and steel-section configurations. Overall, the numerical curves reproduced the main features of the experimental load–slip responses over the investigated range of specimen parameters.
Figure 8.
Comparison of experimental and numerical load–slip curves: (a) JL24-1; (b) JL24-2; (c) JL30-1; (d) JL30-2; (e) JL30-3; (f) JL30-4; (g) JL30-5; (h) JL30-6; (i) JL30-7; (j) JL30-8; (k) JL36-1; (l) JL36-2.
Table 2.
Comparison between numerical and experimental results.
The initial stiffness was defined as the secant stiffness corresponding to the load range of 0.1Fp to 0.4Fp (where Fp denotes the peak shear resistance) [41]. The numerical initial stiffness (kif) was slightly lower than the experimental value (kie), with a mean kif/kie ratio of 0.82 and a coefficient of variation (COV) of 0.18. This lower initial stiffness was primarily attributed to two modeling simplifications: the absence of the bolt pre-tightening force applied in the physical tests, and the omission of the 0.1 mm geometric interference at the bolt-hole contact interface. For the peak shear resistance, the ratio of the numerical prediction Fpf to the experimental value Fpe ranged from 0.94 to 1.10, with a mean value of 1.01 and a COV of 0.05. These results indicate good agreement between the numerical and experimental peak shear resistances over the investigated range of specimen parameters. Notably, for the nine specimens governed by bolt shear fracture, the mean Fpf/Fpe ratio was approximately 1.01 for the M24 specimen, 0.99 for the seven M30 specimens, and 0.99 for the M36 specimen; the ratio remained essentially unchanged with increasing bolt diameter, indicating that any size effect, if present, is smaller than the scatter of the validation results.
Additionally, the predictions of ultimate slip exhibited greater scatter than those of peak shear resistance, and this prediction accuracy was found to be highly dependent on the failure mode. The overall numerical-to-experimental ultimate slip ratios (Suf/Sue) for all twelve specimens ranged from 0.57 to 1.06, with a mean value of 0.95 (COV = 0.14). For the nine UHPC specimens governed by bolt shear fracture, the Suf/Sue ratio ranged from 0.94 to 1.06, and the numerical-to-experimental peak slip ratios ranged from 0.91 to 1.11, indicating that the deformation capacity of the target application was predicted as accurately as the peak resistance. However, the noticeable deviations were mainly concentrated in specific C60 control specimens governed by concrete crushing. For these specimens, both the peak slip and the ultimate slip were underestimated. This is primarily because low-strength concrete exhibits pronounced brittle behavior in the FE model, leading to a rapid post-peak degradation once the peak capacity is reached. In the actual tests, however, the crushed concrete at the bolt root was laterally confined by the adjacent steel flange, which prevented a complete loss of strength and resulted in a more gradual descending branch of the load-slip curve. Nevertheless, it should be noted that the numerical-to-experimental peak-resistance ratio for JL30-2 was 1.05, and its pre-peak load–slip response was reproduced reasonably well. Therefore, these discrepancies mainly concern the deformation capacity and do not materially affect the subsequent analyses focused on stress states at Fp and load-transfer mechanisms. Overall, for the large-diameter hinged-bolt connectors in steel–UHPC composite beams evaluated in this study, the developed FE models were considered sufficiently accurate for the subsequent investigation of failure modes, shear-transfer mechanisms, and parametric effects. However, the deformation predictions (including both peak slip and post-peak ultimate slip) for the C60 control specimens were treated as indicative.
4.2. Failure Modes
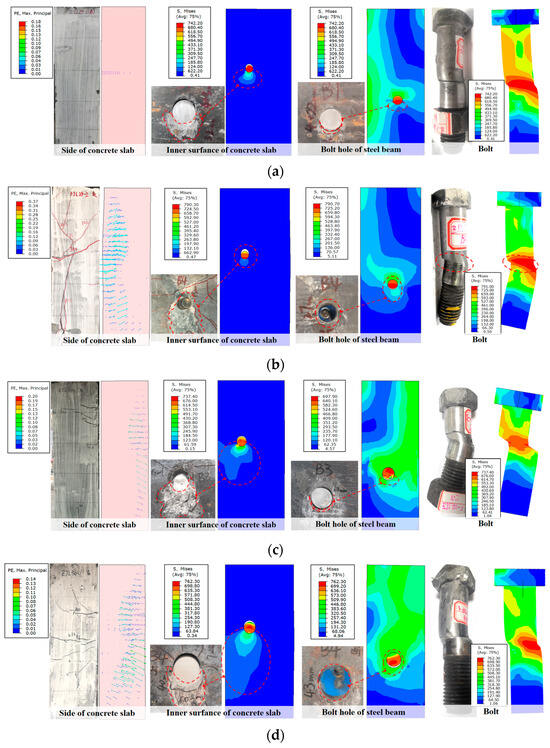
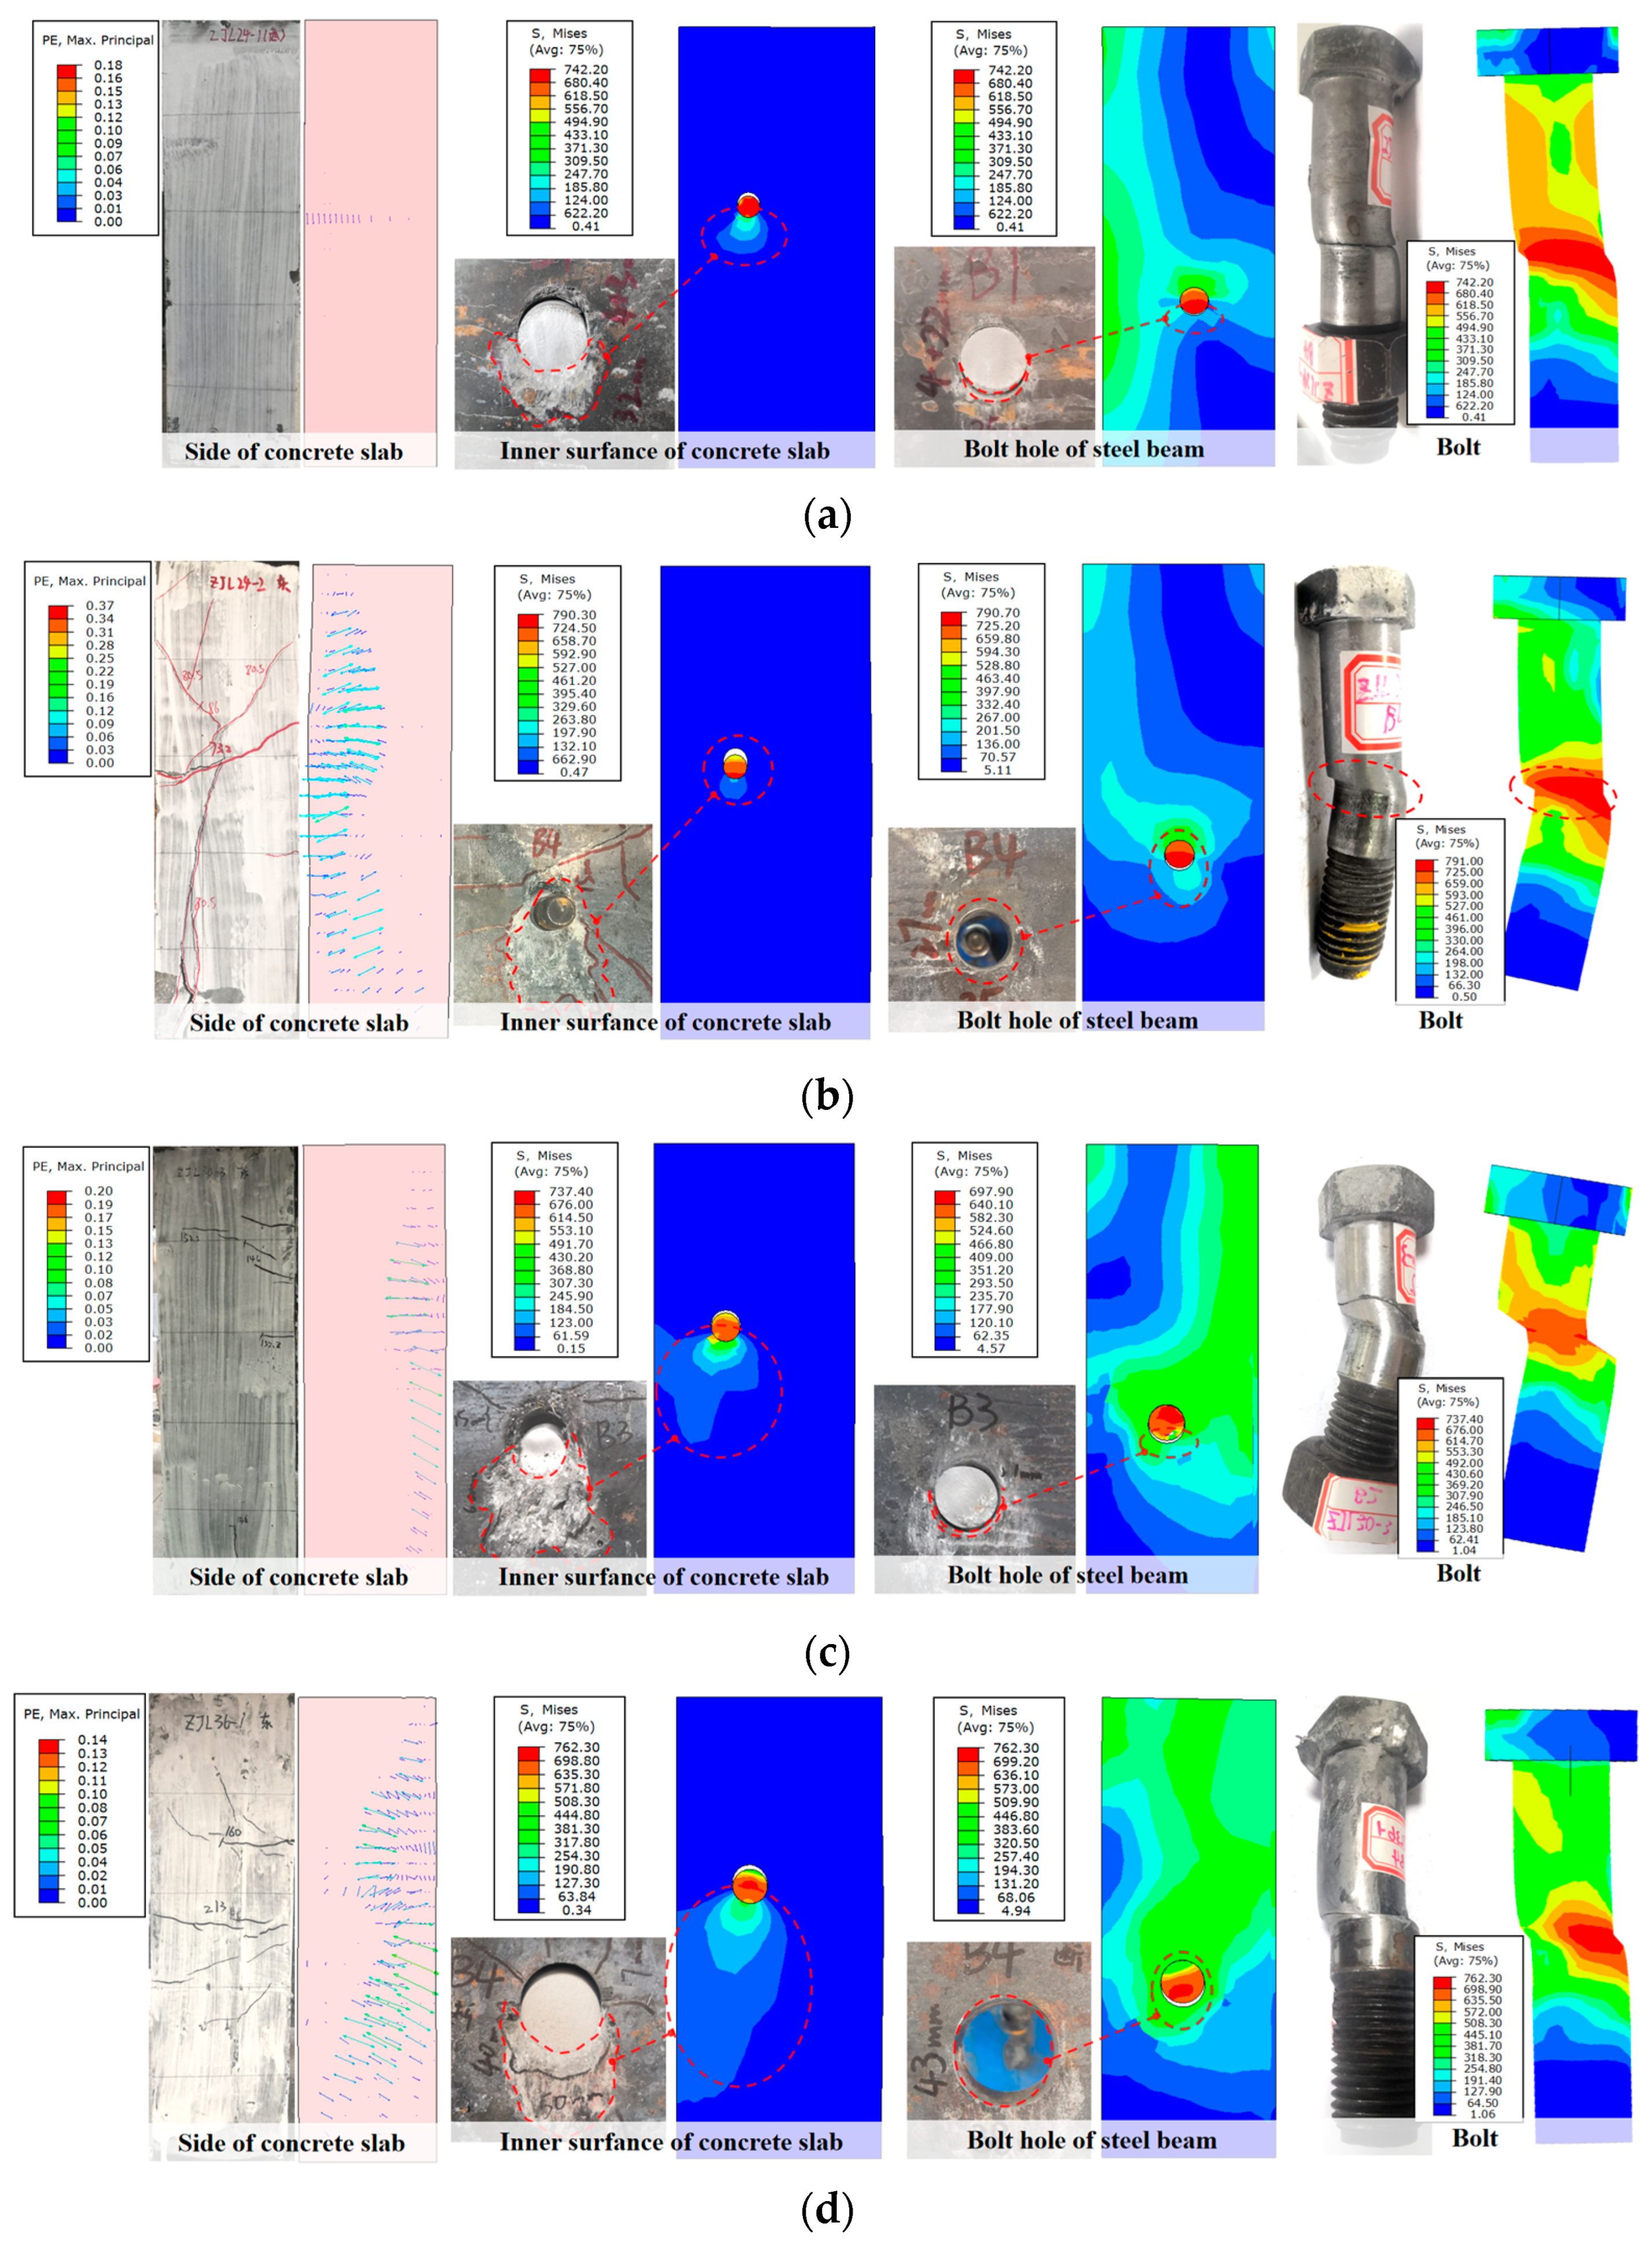
To further assess the reliability of the FE model, the failure modes observed experimentally were compared with the corresponding numerical results. The predicted failure modes were generally consistent with the experimental observations. Four representative specimens—JL24-1, JL24-2, JL30-3, and JL36-1—were selected to cover different bolt diameters, bolt aspect ratios, and governing failure modes. JL24-1, JL30-3, and JL36-1 were governed by bolt shear fracture, whereas JL24-2 exhibited concrete-crushing failure. As shown in Figure 9, the comparison includes the deformation and stress distributions of the concrete slab, the steel bolt-hole region, and the hinged bolt. The maximum principal strain vectors on the side surface of the concrete slab were also extracted to identify the predicted cracking tendency, with cracks expected to develop perpendicular to the direction of the maximum principal tensile strain.
Figure 9.
Comparison of experimental and numerical failure modes: (a) JL24-1; (b) JL24-2; (c) JL30-3; (d) JL36-1.
For the three bolt-fracture specimens, the FE models reproduced local load-transfer mechanisms and failure characteristics similar to those observed experimentally. Pronounced compressive stresses developed in the concrete immediately beneath the hinged bolt and gradually dissipated away from the steel–concrete interface, forming a localized bearing zone around the connector. Concurrently, high stresses concentrated around the upper edge of the steel bolt hole due to the direct bearing action between the steel flange and the bolt shank. As relative slip increased, separation progressively developed between the opposite side of the bolt shank and the bolt-hole surface, creating a local gap analogous to that observed in the tested specimens. The numerical hinged bolts also exhibited distinct shear and bending deformations, with peak stresses concentrated near the steel–concrete interface; this was consistent with the shear-fracture locations observed experimentally. The predicted deformation patterns for JL24-1, JL30-3, and JL36-1 generally agreed with the fractured bolt configurations shown in Figure 9. Regarding the concrete slabs, the predicted principal strain fields were broadly consistent with the experimentally observed cracking regions. Minor discrepancies in individual surface cracks were anticipated, as the continuum FE model did not explicitly represent discrete steel-fibre bridging or local material heterogeneity in UHPC. For specimen JL24-2, the lower concrete strength resulted in a substantially larger local compression zone beneath the bolt. The numerical model reproduced the localized concrete-crushing behavior observed experimentally, while the predicted principal-strain field was consistent with the extensive cracking around the connector. The hinged bolt remained unfractured, and the predicted bolt deformation and local yielding around the steel bolt hole were also consistent with the experimental observations.
It should be noted that complete geometric separation of the bolt shank was not always achieved in the numerical simulations. Once heavily damaged elements near the critical shear plane reached the limiting damage state and were deleted, severe local deformation and abrupt changes in structural stiffness developed, resulting in convergence difficulties in the implicit analysis. Consequently, the analysis occasionally terminated before all elements across the critical bolt section were removed. Despite this limitation, the numerical model captured the location of bolt-damage concentration, the characteristic bolt deformation, and the associated local deformations of the concrete and steel. Together with the load–slip comparisons in Section 4.1, these results support the use of the model for the subsequent mechanism and parametric analyses.
5. Shear Transfer Mechanism
5.1. Load Transfer Path and Stress Development
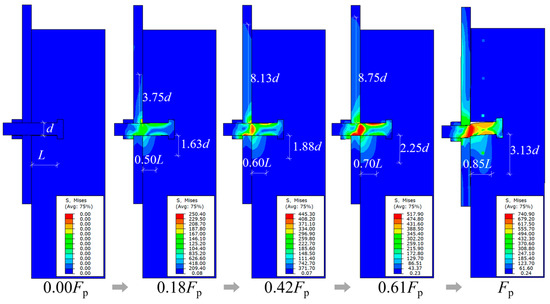
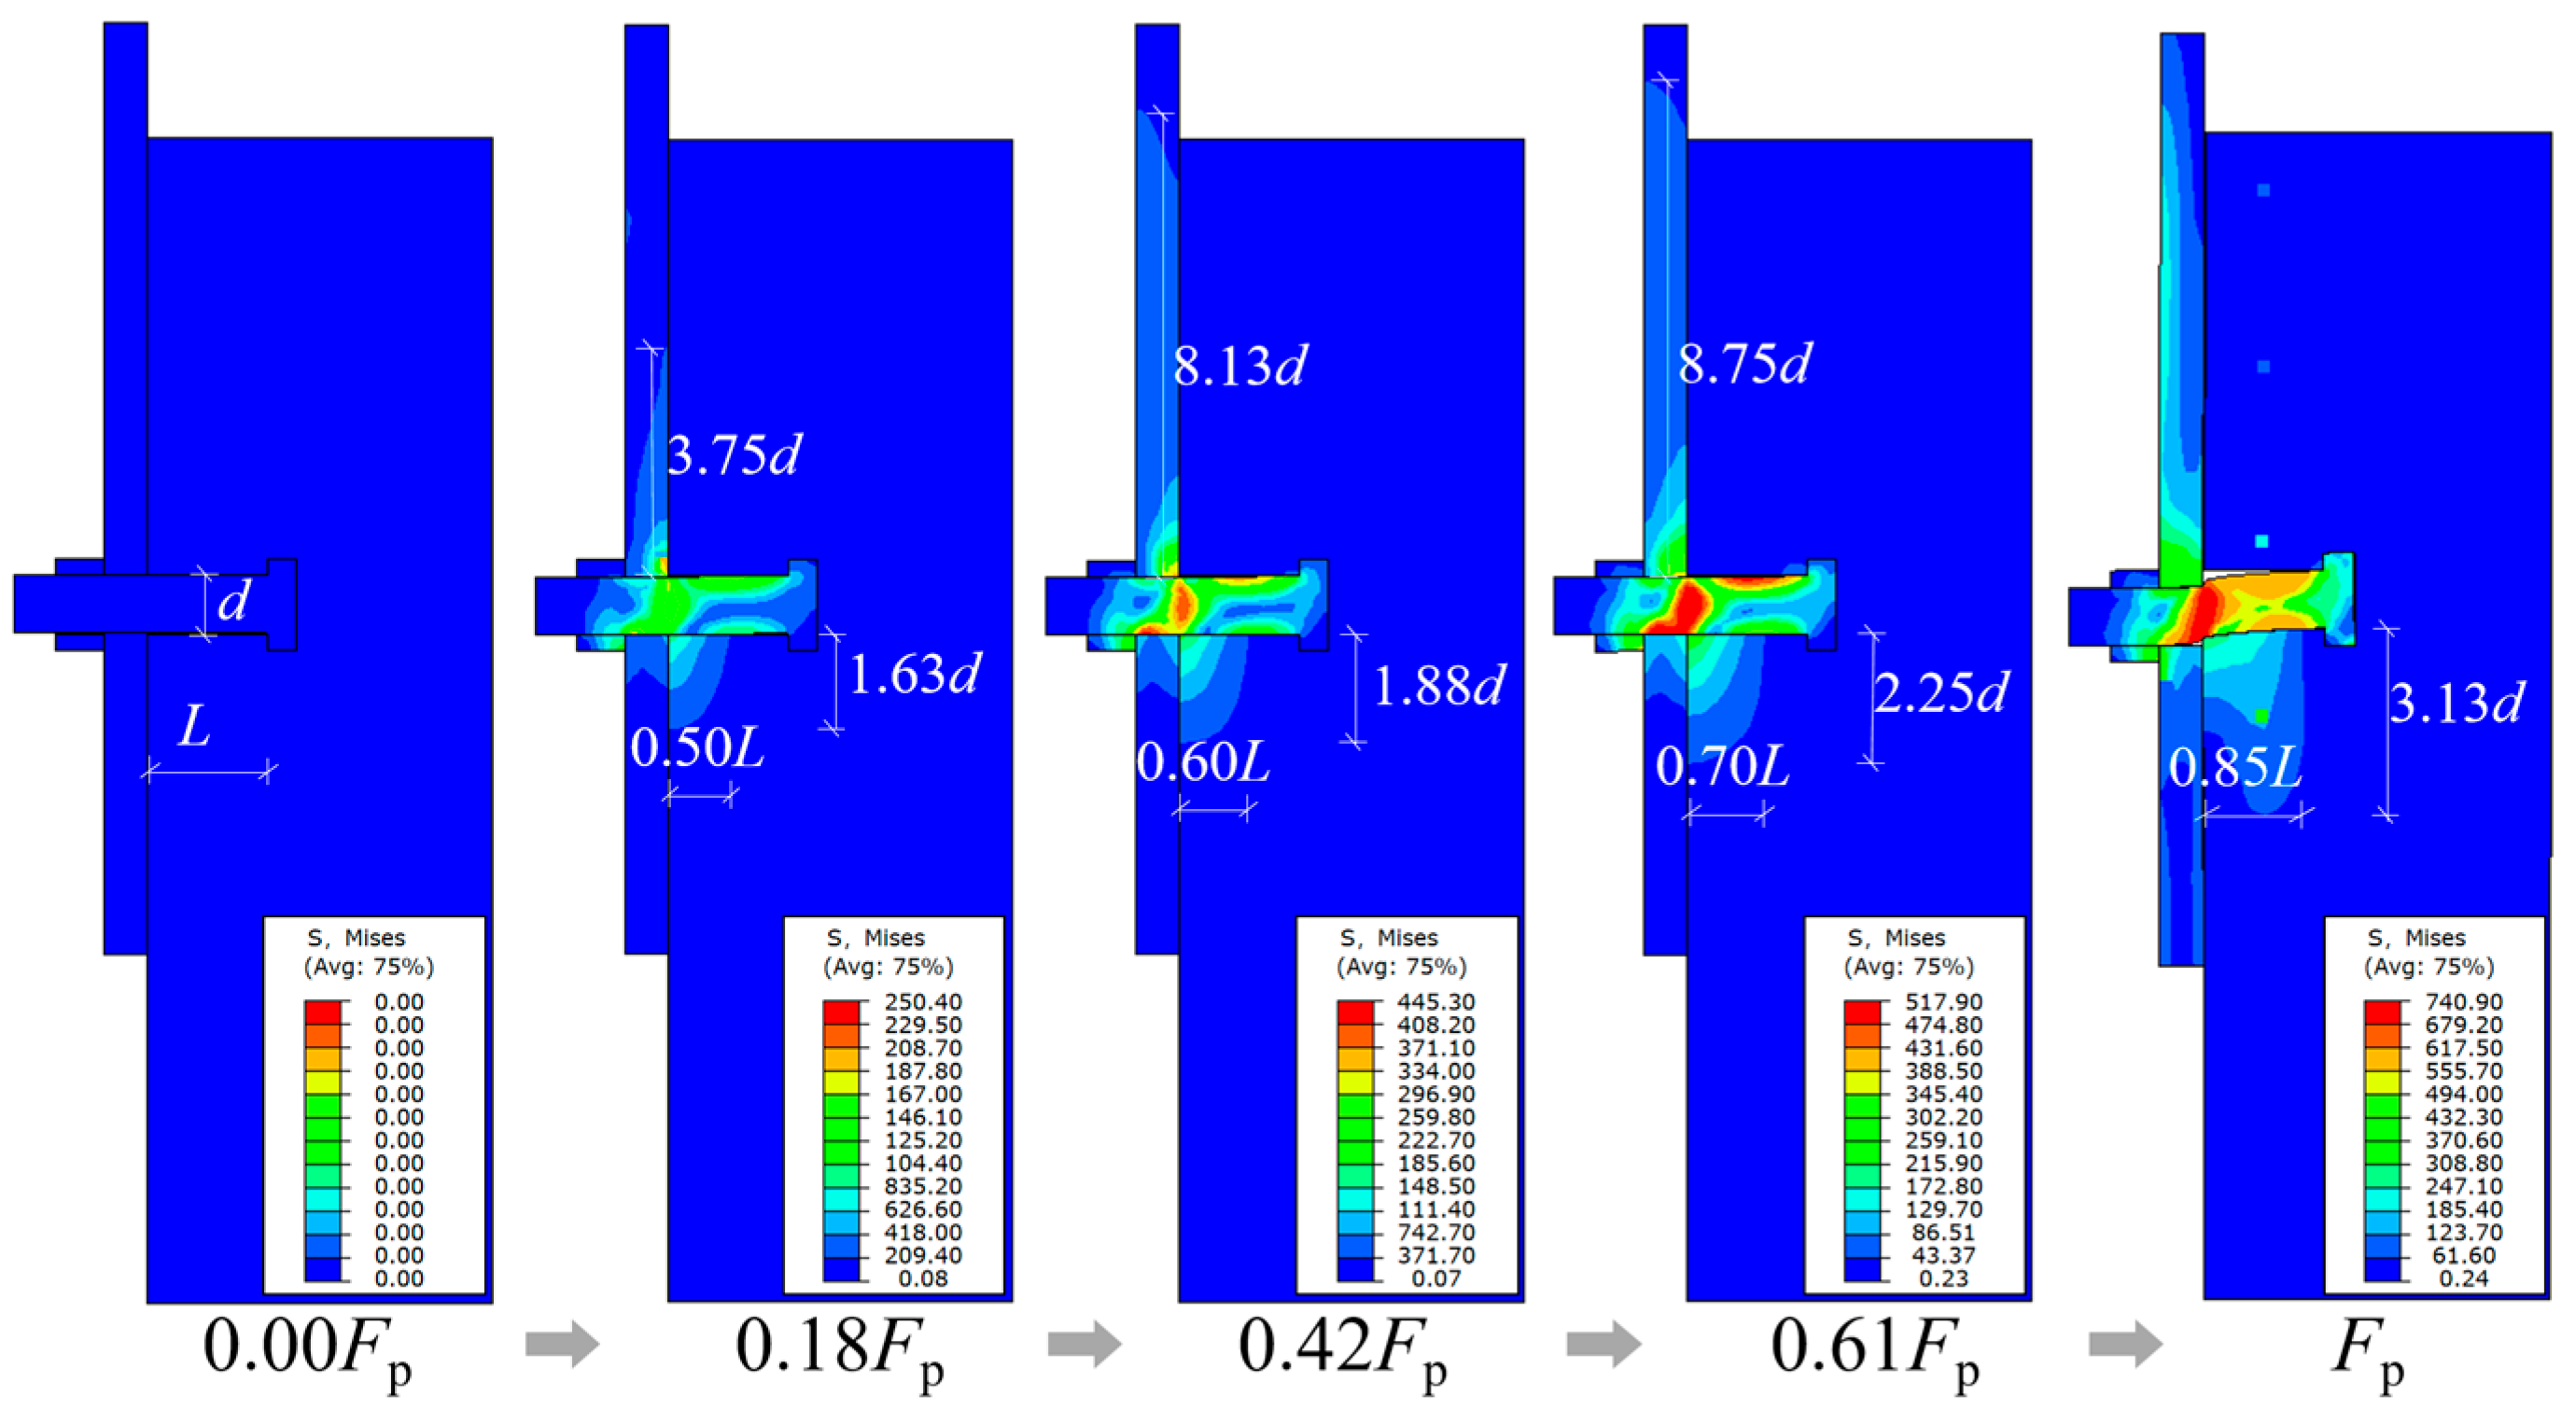
To elucidate the load-transfer mechanism of the hinged-bolt connector, the Mises stress distributions along the longitudinal section through the bolt axis were examined at different loading stages. As specimens governed by bolt shear fracture exhibited similar stress-evolution patterns, specimen JL24-1 was selected as a representative case for analysis, as shown in Figure 10.
Figure 10.
Stress development of specimen JL24-1 at different loading stages.
During the initial loading stage, the applied load was transferred from the steel flange to the hinged bolt through local bearing at the upper surface of the bolt hole and was subsequently transmitted to the surrounding concrete via local compression. The concrete stress was concentrated near the steel–concrete interface and gradually dissipated toward the bolt head. With increasing load, the stressed regions in the bolt, steel flange, and concrete expanded, while the maximum bolt stress remained concentrated near the steel–concrete interface. Progressive bolt rotation also generated tensile and compressive stresses on opposite sides of the shank, indicating an increase in bending action. According to the von Mises yield criterion—a region was considered to have yielded when its von Mises equivalent stress reached the measured yield strength of the corresponding material—local yielding developed around the steel bolt hole at approximately 0.42Fp, whereas the hinged bolt remained essentially elastic. Subsequently, the bolt yielded and entered the plastic range, accompanied by a noticeable reduction in the slope of the load–slip response. At higher load levels, the concrete beneath the bolt approached its peak compressive stress, and the reinforcement was progressively mobilized through the deformation of the surrounding concrete. At Fp, pronounced shear and bending deformations developed in the bolt, with localized shear damage concentrated near the steel–concrete interface.
Consequently, the load-transfer path can be summarized as progressing from steel-flange bearing through hinged-bolt shear/bending and local concrete bearing to the surrounding concrete and reinforcement. For the validated push-out specimens, the governing failure mode was determined by the relative resistance of the bolt and surrounding concrete, resulting primarily in either bolt shear fracture or concrete crushing.
5.2. Internal Force Distribution of the Hinged Bolt
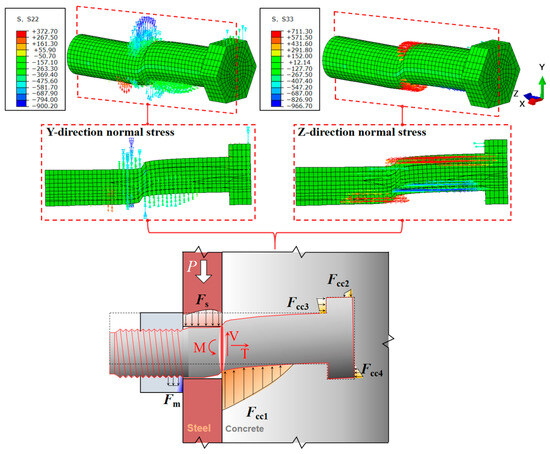
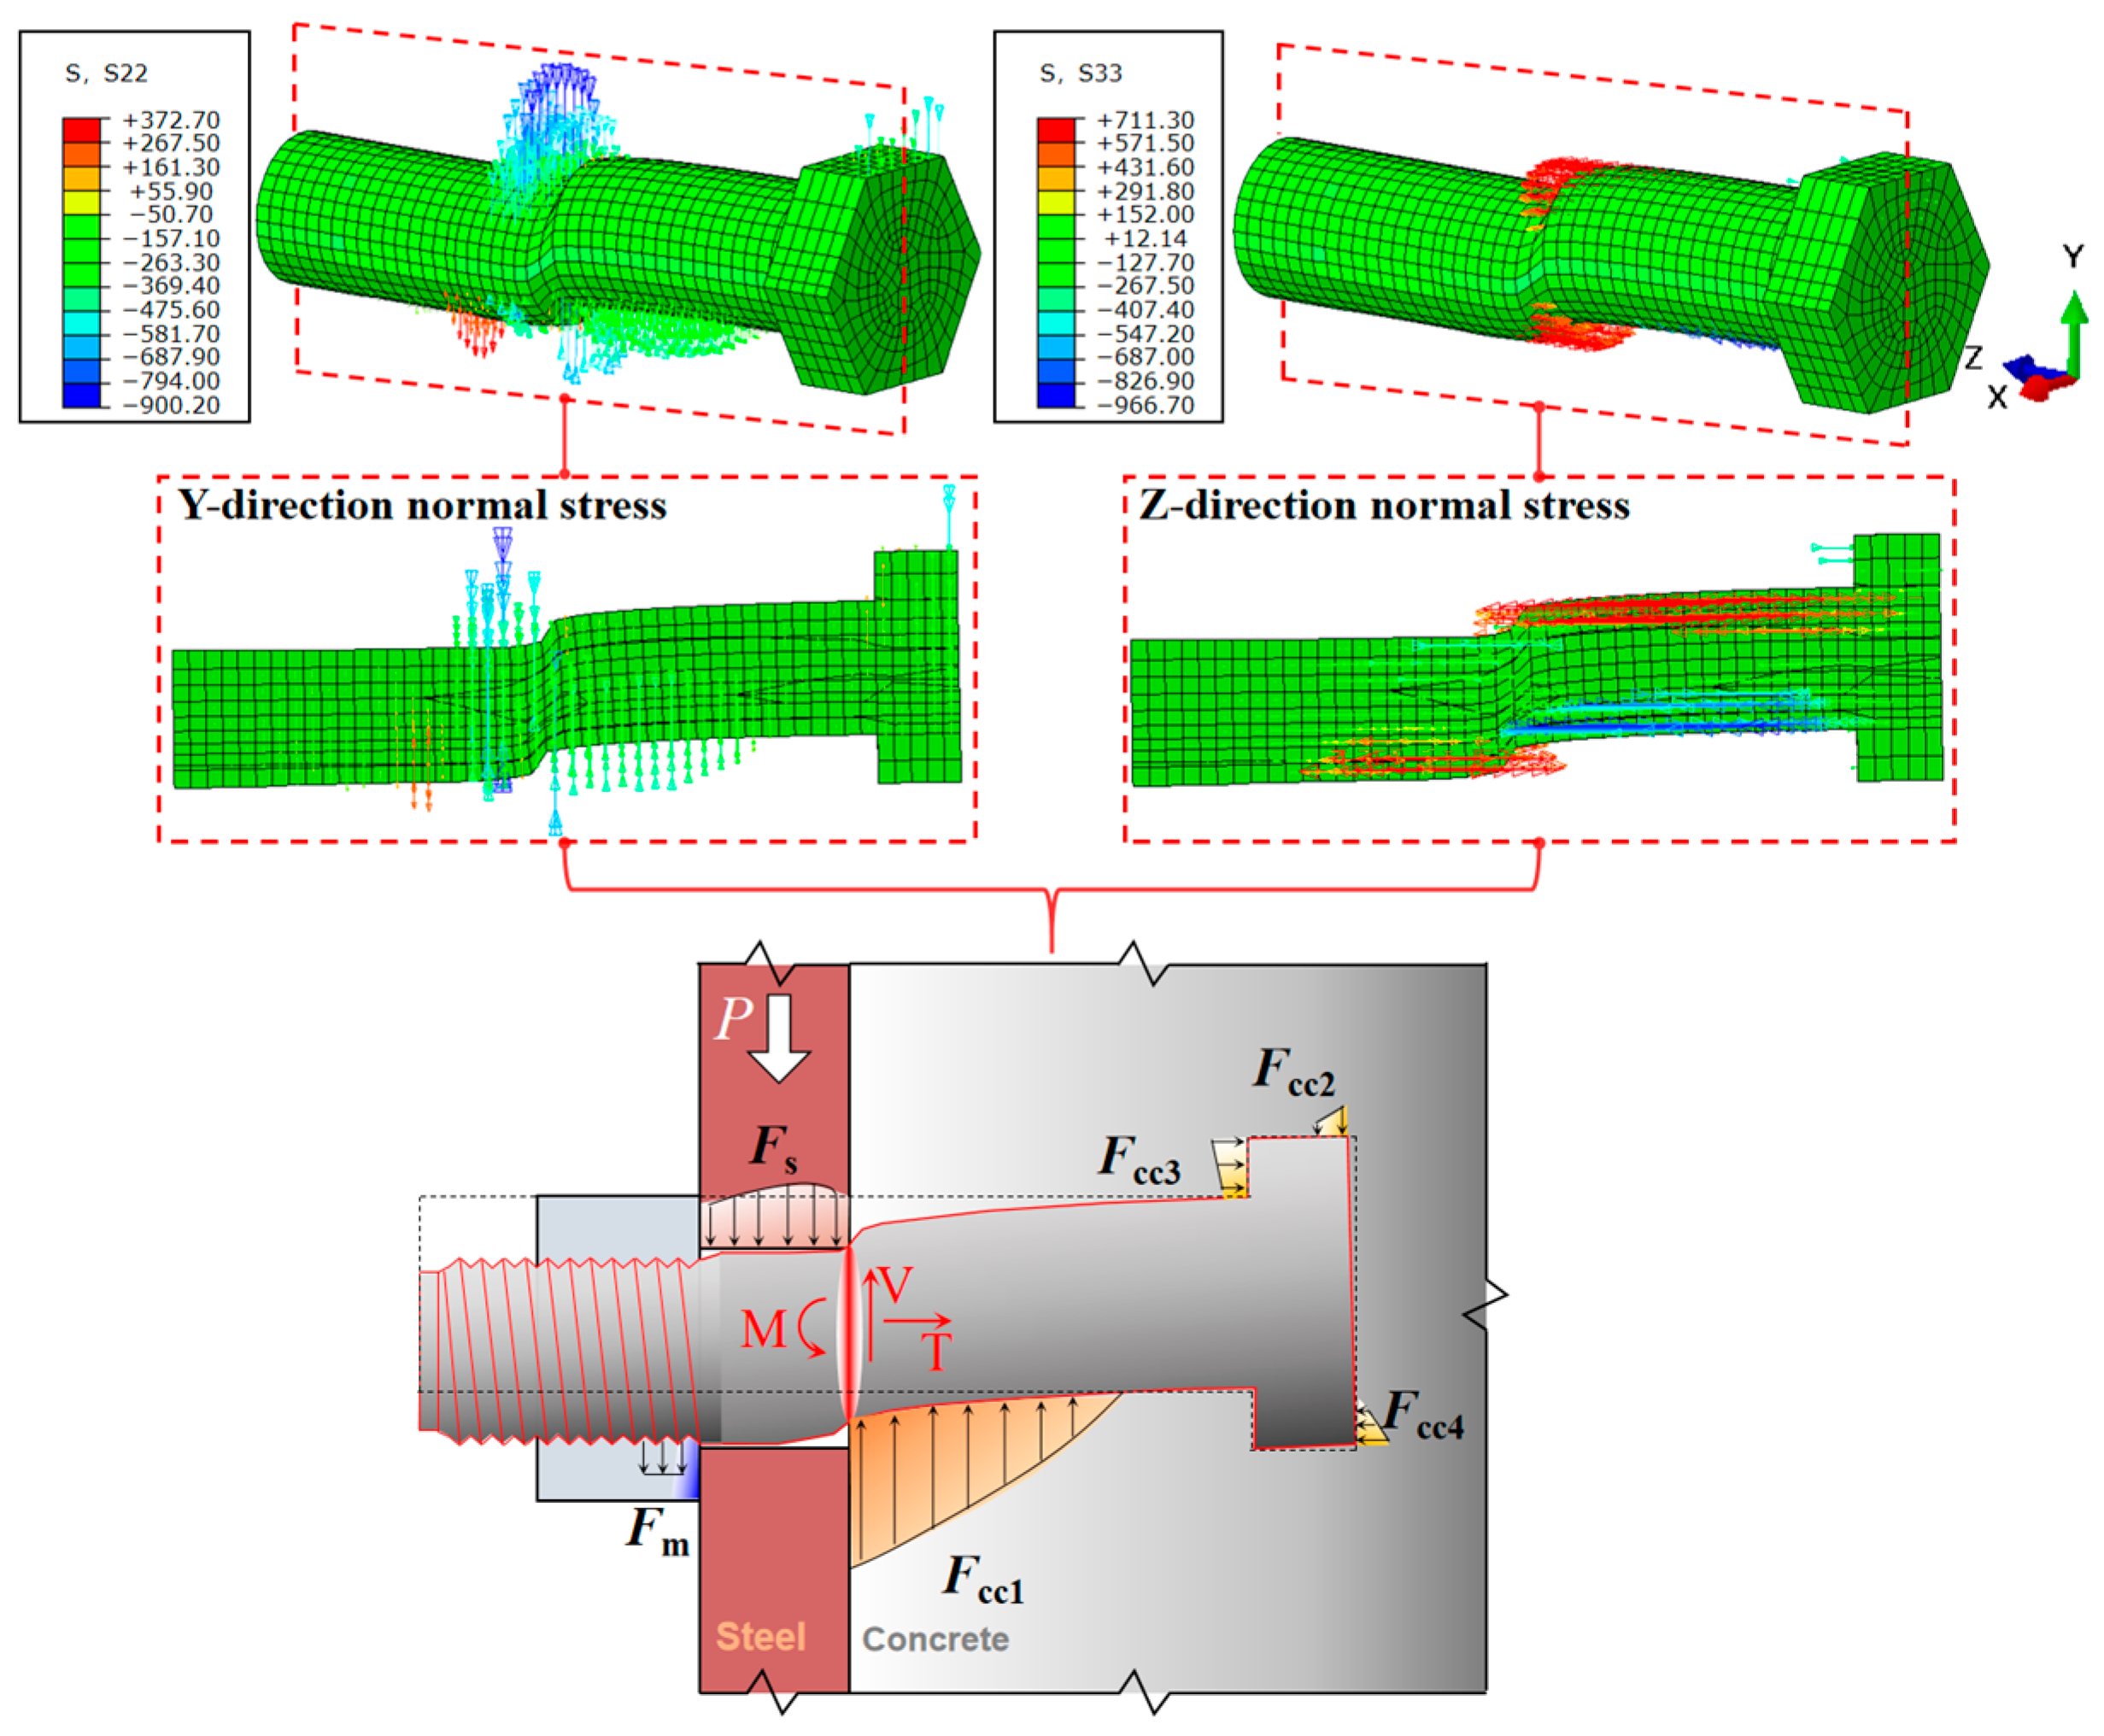
The stress contours presented above represent local material stresses but cannot directly quantify the resultant forces acting on a complete bolt cross-section. Therefore, the tangential and axial stress distributions of the hinged bolt at Fp were first examined, as illustrated in Figure 11. The steel flange applies a concentrated bearing force Fs to the bolt within the steel bolt-hole region, while the surrounding concrete provides a distributed reaction Fcc1 along the embedded shank. Additional smaller reactions develop around the bolt head and nut because bolt rotation is restrained by the surrounding components. These non-collinear reactions result in a combination of shear force V, axial tensile force T, and bending moment M within the bolt.
Figure 11.
Stress state and simplified force-transfer model of the hinged bolt.
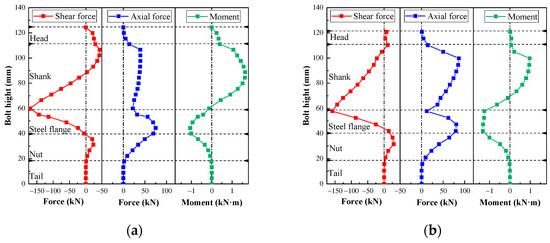
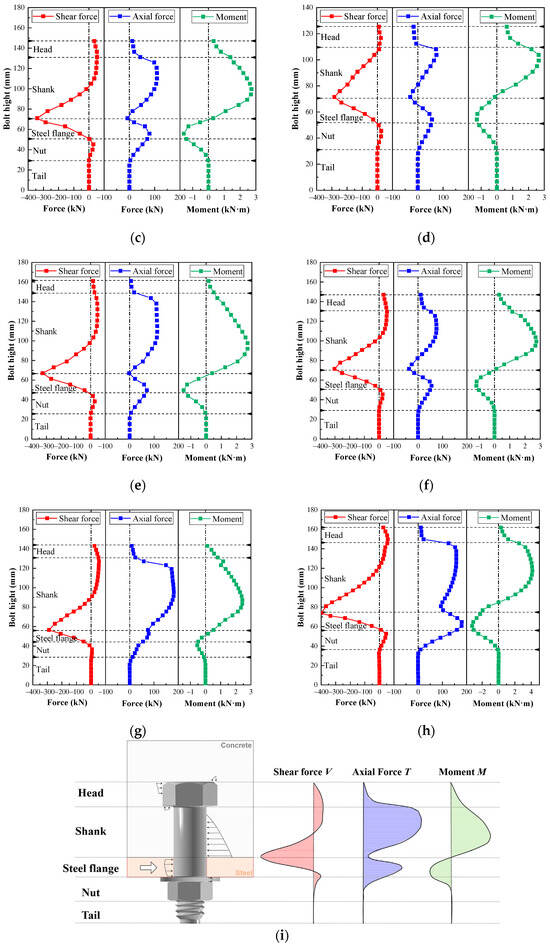
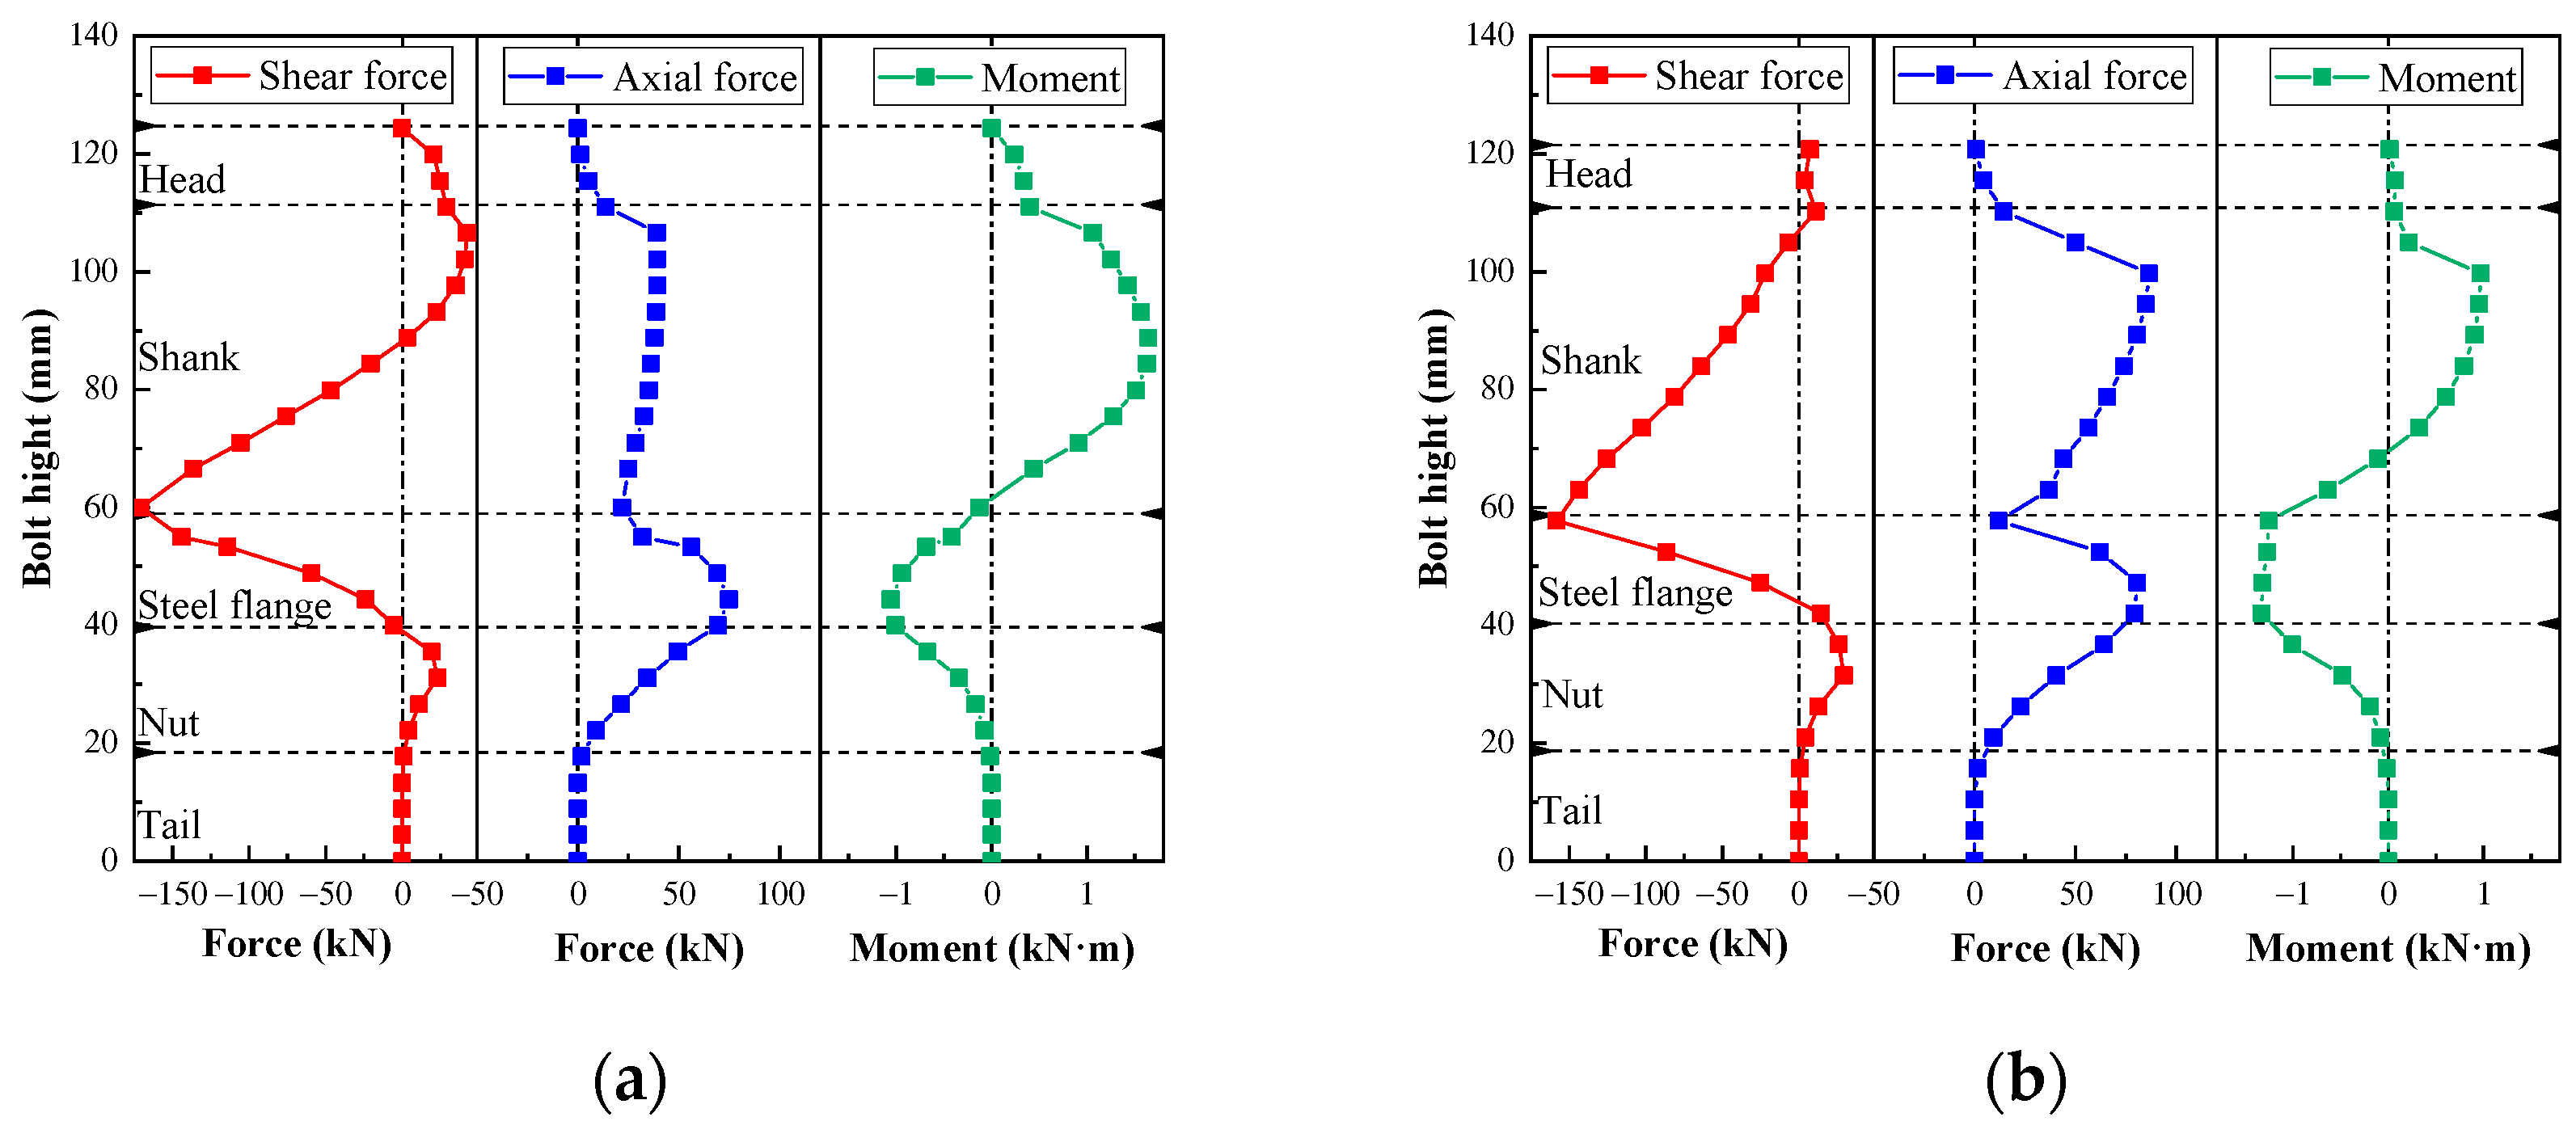
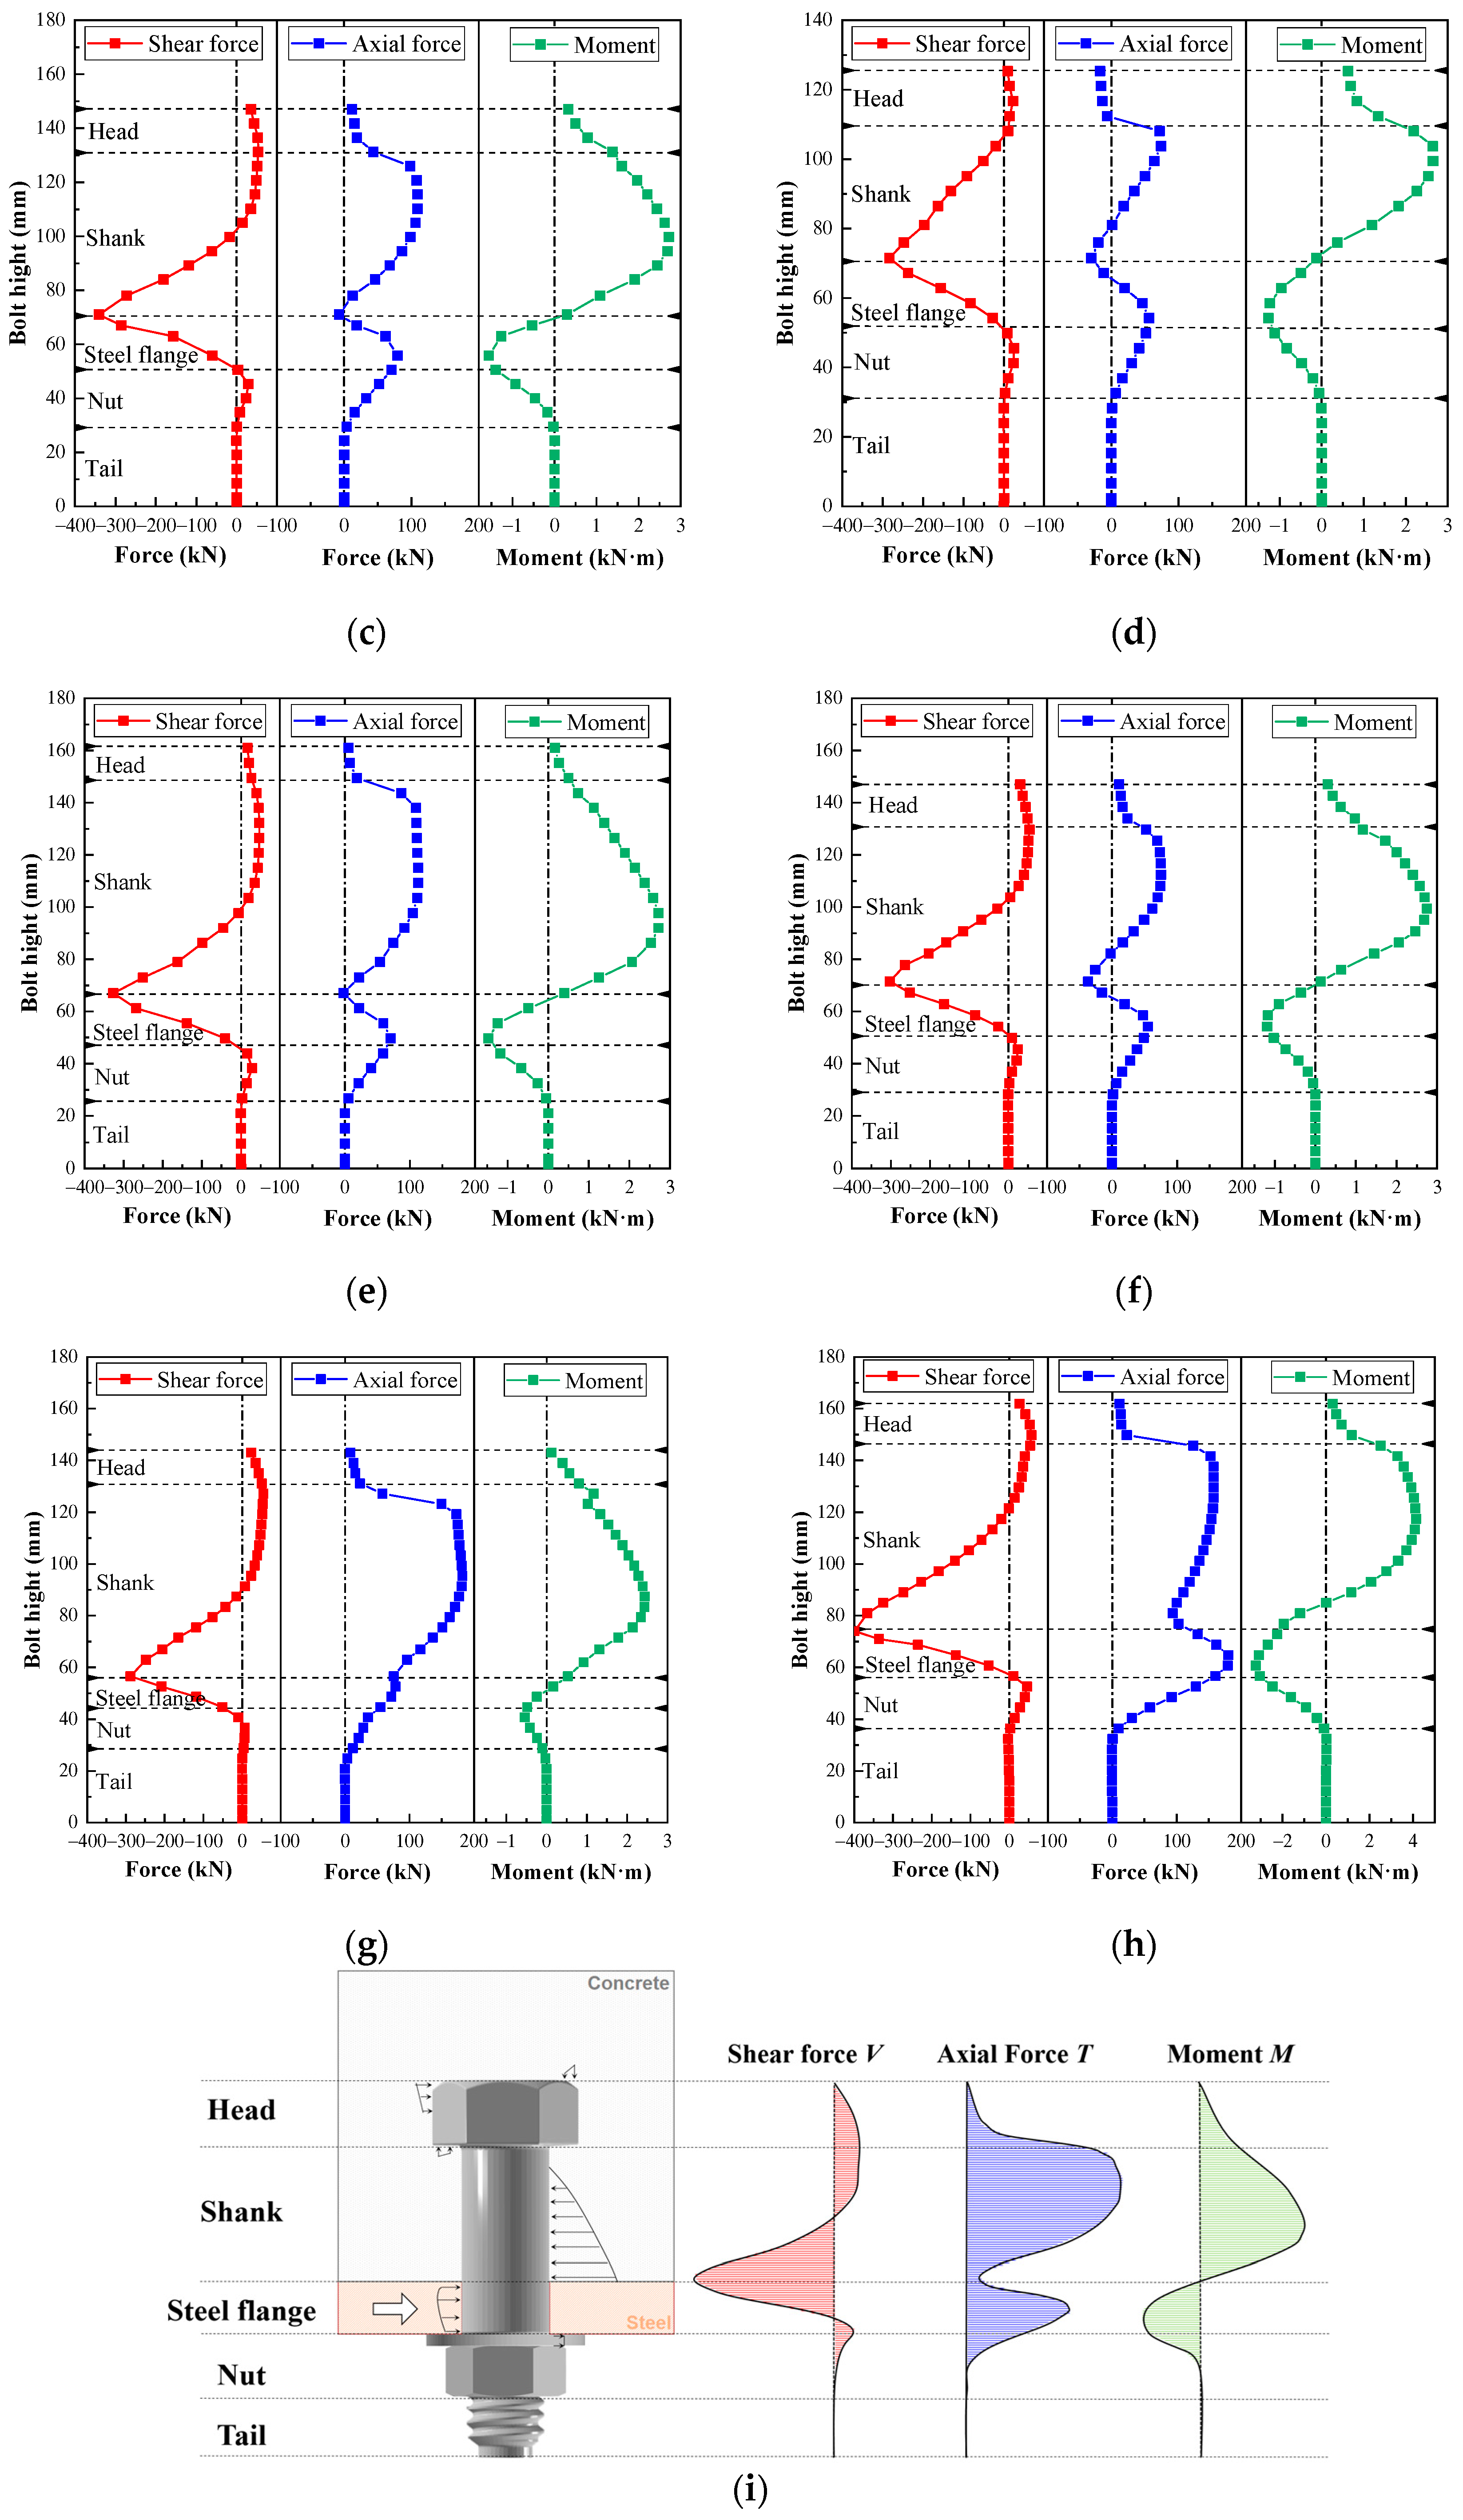
To quantify these coupled actions, transverse sections were created at different positions along the bolt axis, and the resultant sectional shear force V, axial force T, and bending moment M were extracted at Fp. Sectional resultants were extracted in ABAQUS using the free-body cut function. Parallel planes perpendicular to the initial bolt axis were defined along the bolt; for each plane, forces and moments were obtained by summing nodal forces on one side in the global coordinate system. Because the bolt axis is aligned with the global Z-axis and the loading acts along the global Y-axis, the sectional shear force V, axial force T, and bending moment M correspond directly to the global resultants Fy, Fz, and Mx, respectively. Eight representative specimens covering the range of bolt diameters, aspect ratios, and governing failure modes were selected for the internal-force analysis. As shown in Figure 12, the shear force varies significantly along the bolt and reaches its maximum within the embedded shank close to the region affected by concrete bearing. The axial force is smaller but remains non-negligible; it is primarily induced by bolt rotation and the associated separation tendency between the steel flange and concrete slab. The bending moment increases rapidly within the embedded shank, changes sign in the steel-flange region, and gradually decreases toward the bolt root. These distributions demonstrate that the hinged bolt behaves as a short embedded member subjected to combined shear, tension, and bending rather than pure shear.
Figure 12.
Internal force distributions along the hinged bolt: (a) JL24-1; (b) JL24-2; (c) JL30-1; (d) JL30-3; (e) JL30-4; (f) JL30-5; (g) JL30-8; (h) JL36-1; (i) Schematic distributions of V, T, and M.
The characteristic internal forces are summarized in Table 3. The pure shear resistance Vps and the pure tensile resistance Tpt of the hinged bolt were calculated based on the measured material strengths as follows:
where fu is the measured ultimate tensile strength of the grade 8.8 bolt material, taken as 713 MPa; τu is the nominal shear strength; and As is the cross-sectional area of the bolt’s smooth shank. The smooth-shank diameters of the M24, M30, and M36 hinged bolts were 25, 32, and 38 mm, respectively. The measured nominal shear strength of the M24 bolt was adopted for all three bolt sizes, and the pure-shear resistances of the M30 and M36 bolts were obtained by scaling with their corresponding smooth-shank cross-sectional areas.
Vps = τuAs
Tpt = fuAs
Table 3.
Characteristic internal forces of the hinged bolts.
With the exception of JL24-2, which was significantly influenced by concrete crushing, and JL30-8, which exhibited pronounced deformation of the thin steel flange, the ratio Vmax/Vps ranged from approximately 68% to 83%. For specimens governed by bolt shear fracture, the ratio Tmax/Tpt was approximately 10–20%, showing that axial tension forms a non-negligible component of the bolt internal-force state. In contrast, Tmax/Tpt increased to approximately 25% for JL24-2 and 53% for JL30-8 because larger concrete or steel-flange deformations intensified bolt rotation and tensile action.
The effective concrete-reaction length Le was identified as the length of the embedded shank over which the sectional shear force varied appreciably. Beyond the position where the sectional shear force became approximately constant, the concrete reaction was considered negligible. For the investigated specimens, the normalized effective concrete-reaction length Le/ds ranged from approximately 1.28 to 2.08, with an average value of 1.53. For the M30 specimens, Le remained within approximately 41–47 mm despite variations in bolt aspect ratio, slab thickness, and steel-flange thickness. These results suggest that the smooth-shank diameter provides an important geometric scale for the effective concrete-reaction region, although concrete deformation and bolt rotation can modify the detailed reaction distribution. Overall, the numerical results confirm that the shear resistance of the hinged-bolt connector is governed by a coupled shear–tension–bending mechanism. While shear remains the dominant internal action under bolt-fracture-controlled conditions, axial tension and bending alter the stress state at the critical section and contribute to the initiation of bolt damage.
6. Parametric Study
Following validation of the FE model, a parametric study was conducted to investigate the effects of bolt grade, bolt aspect ratio, steel-beam strength, and longitudinal bolt spacing on the shear behavior of the hinged-bolt connectors. For each parameter, the baseline model was selected from the twelve validated FE models so that the effect of the investigated parameter could be fully manifested and unambiguously attributed to that single parameter. The reference configurations and investigated parameters are summarized in Table 4.
Table 4.
Parameters of the numerical models.
The baseline models for the four groups were selected as follows. Groups A (bolt grade) and B (bolt aspect ratio) both used the validated JL24-1 model as their baseline, in which bolt-shear-fracture-controlled response allowed the bolt-related parameters to act directly on the governing response rather than being masked by concrete crushing. Group C (steel-beam strength) was based on the validated JL30-8 model with a 10 mm flange, because steel-beam strength affects the connector behavior primarily through local flange deformation around the bolt hole, an effect that is pronounced in this thin-flange specimen. Group D (longitudinal bolt spacing) was developed by modifying the validated JL30-1 model into a two-row configuration, since none of the tested specimens contained multiple bolt rows; the single-row JL30-1 model served as the reference. Within each group, only the investigated parameter was varied, and all baseline models were derived from the validated FE models in Section 4.
6.1. Effect of Bolt Grade
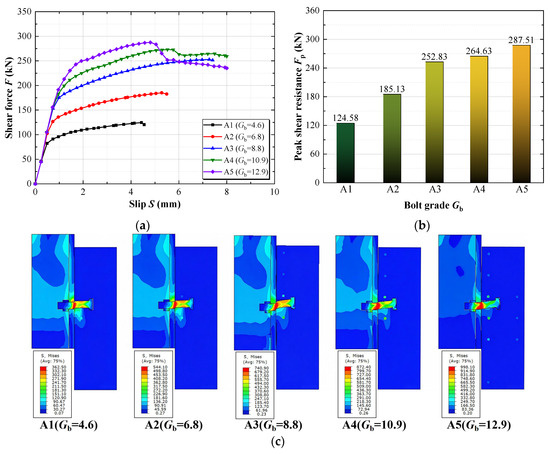
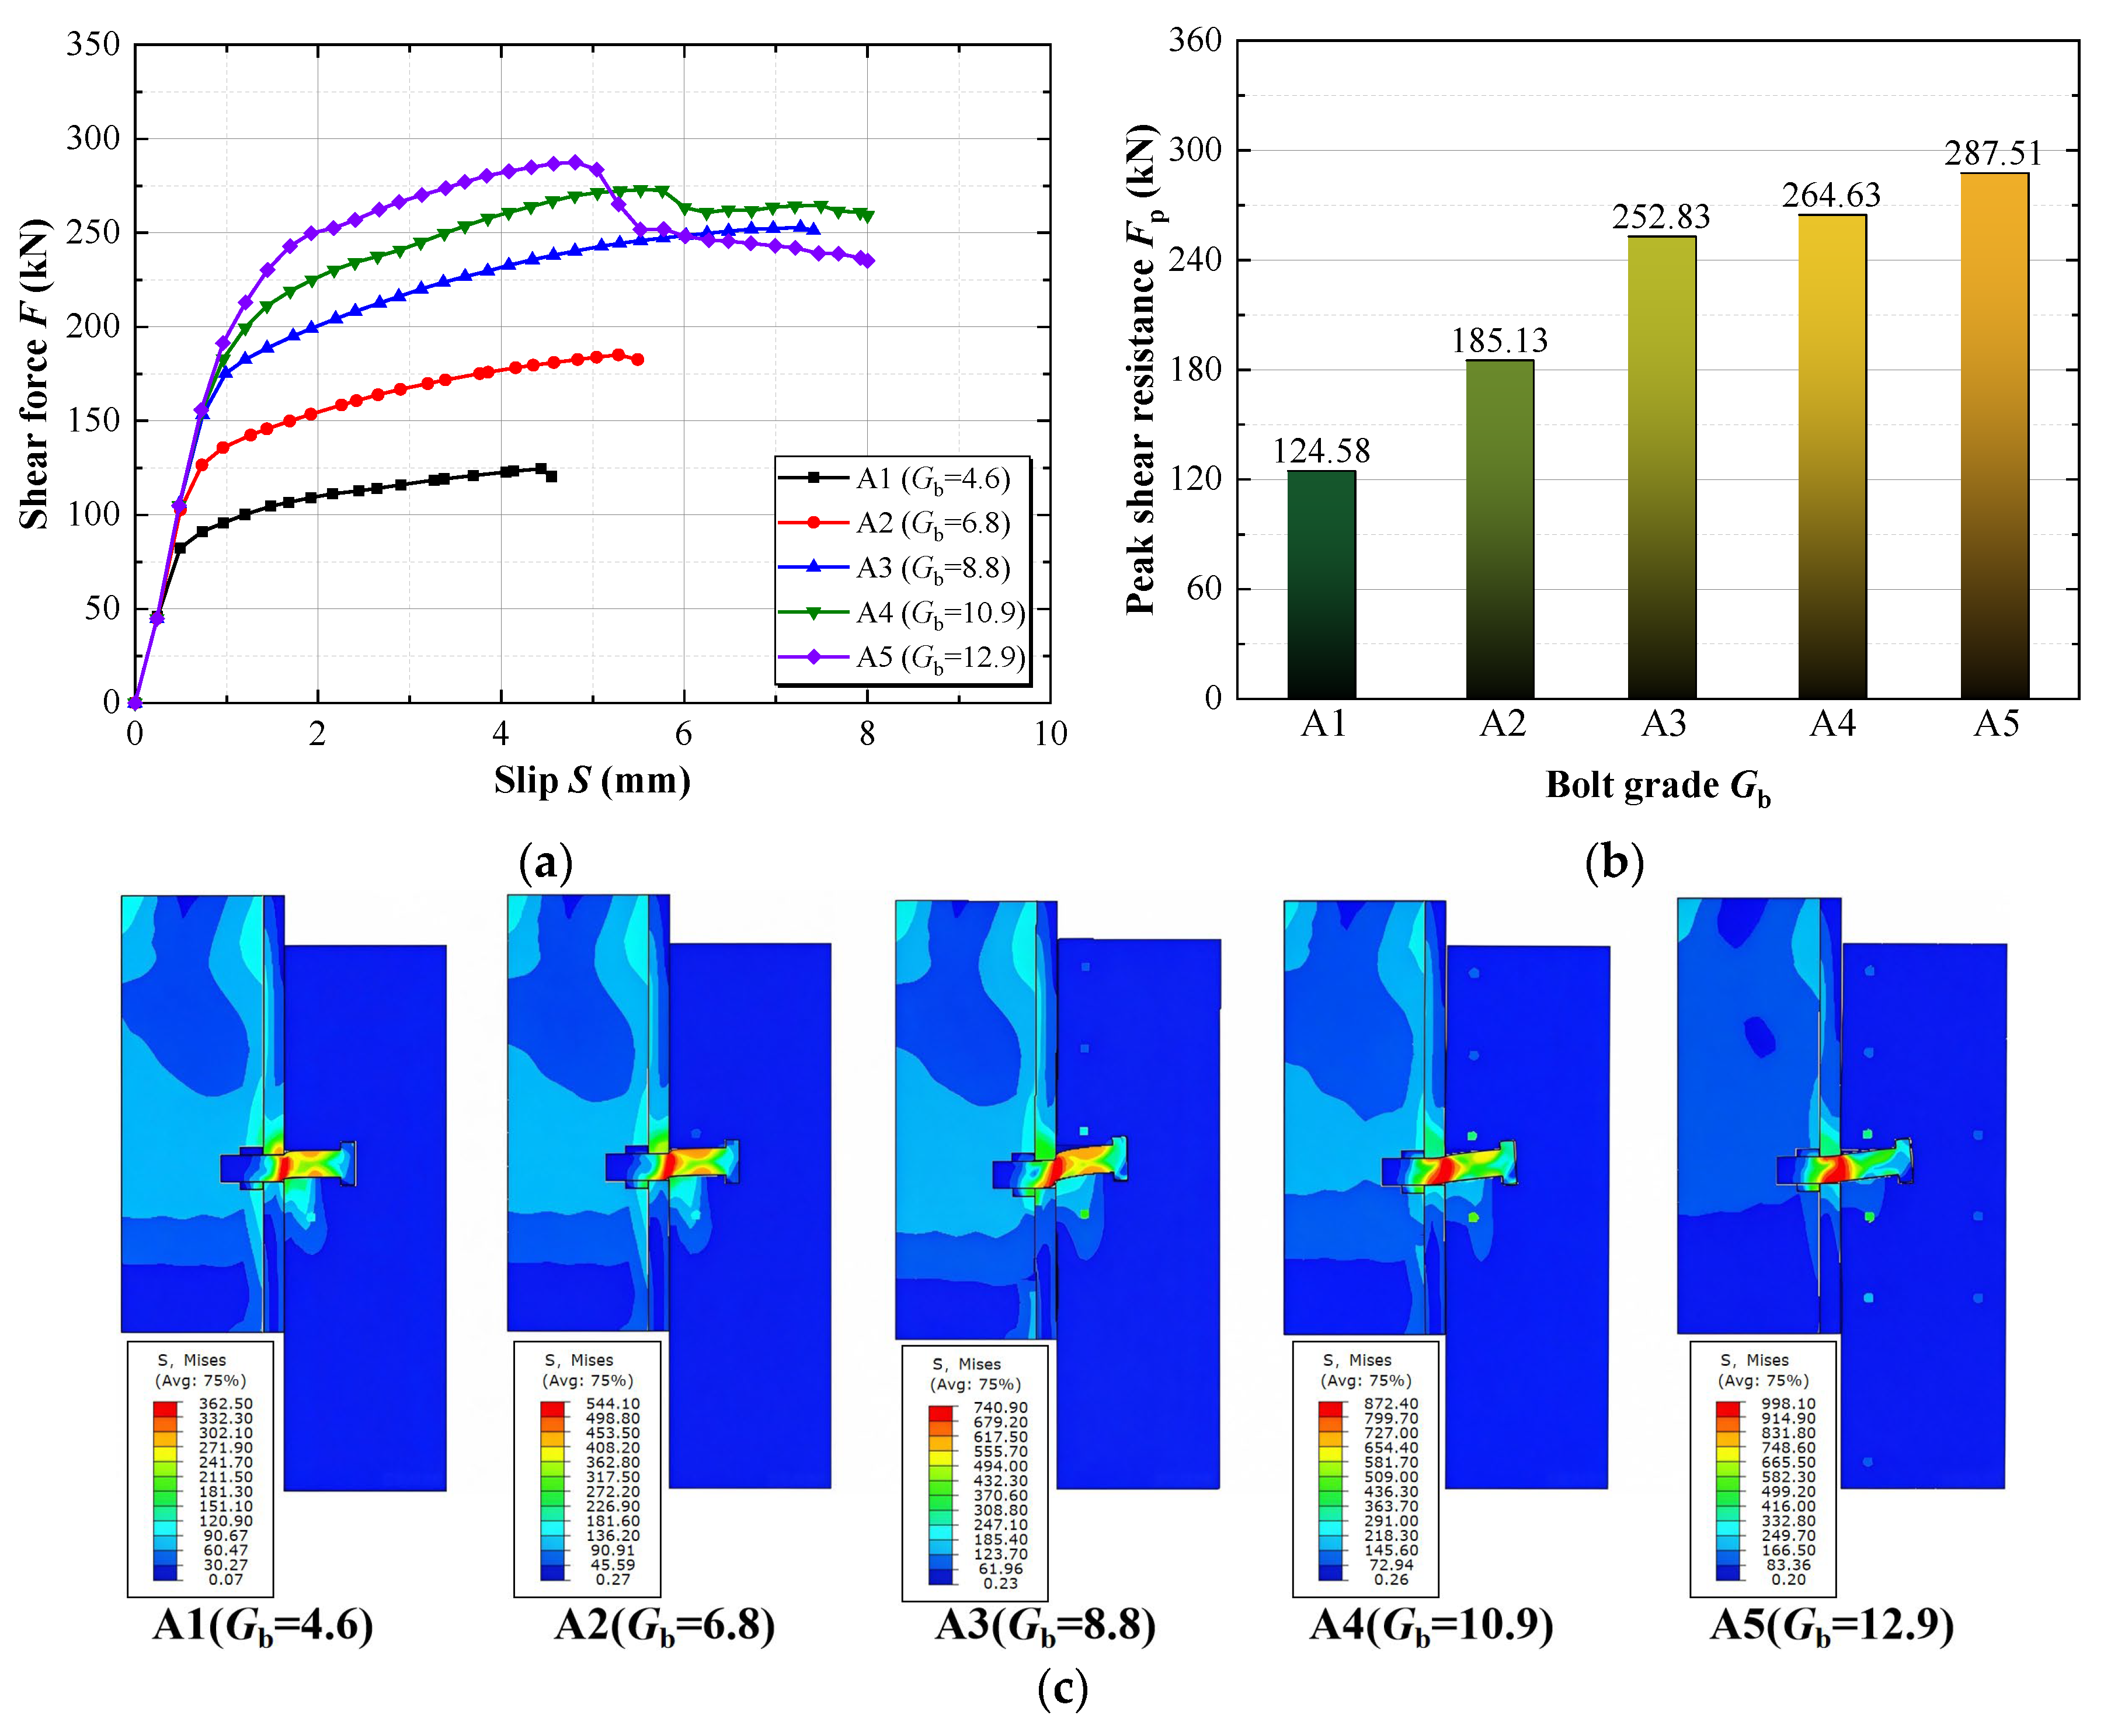
The effect of bolt grade was investigated using the JL24-1 model as the baseline. Five bolt grades, namely 4.6, 6.8, 8.8, 10.9, and 12.9, were considered. The measured tensile properties were adopted for the grade 8.8 bolt, whereas nominal yield and ultimate tensile strengths were used for the other bolt grades; the shear-damage parameters calibrated for the grade 8.8 bolt were retained throughout the parametric analysis. Figure 13 compares the corresponding load–slip responses, peak shear resistances, and stress distributions at Fp. The peak shear resistances of the grade 4.6, 6.8, 8.8, 10.9, and 12.9 models were 124.58 kN, 185.13 kN, 252.83 kN, 264.63 kN, and 287.51 kN, respectively. Relative to the grade 4.6 model, the corresponding increases were 48.6%, 102.9%, 112.4%, and 130.8%. The resistance increased markedly up to grade 8.8, whereas increasing the bolt grade from 8.8 to 12.9 produced only a further 13.7% increase. The models with bolt grades 4.6–8.8 were primarily governed by bolt shear fracture, whereas UHPC crushing became increasingly pronounced for grades 10.9 and 12.9. The stress distributions at Fp show the corresponding shift from bolt-controlled to concrete-controlled response. This behavior can be explained by the balance between the two governing components of the load-transfer path in this group: bolt shear and UHPC bearing within the effective reaction length Le. For grades 4.6–8.8, bolt shear is the weaker component, and the peak resistance scales nearly proportionally with the bolt strength; beyond grade 8.8, the UHPC bearing capacity becomes the weaker component, so that further bolt strengthening yields diminishing returns. The remaining two components of the load-transfer path—steel-flange deformation and the coupled bolt rotation and tension—are held constant in this group and are examined in Section 6.3 and Section 5.2, respectively.
Figure 13.
Effect of bolt grade on the shear behavior of the hinged-bolt connector: (a) Load–slip curves; (b) Peak shear resistance versus bolt grade; (c) Mises stress distributions at Fp.
6.2. Effect of Bolt Aspect Ratio
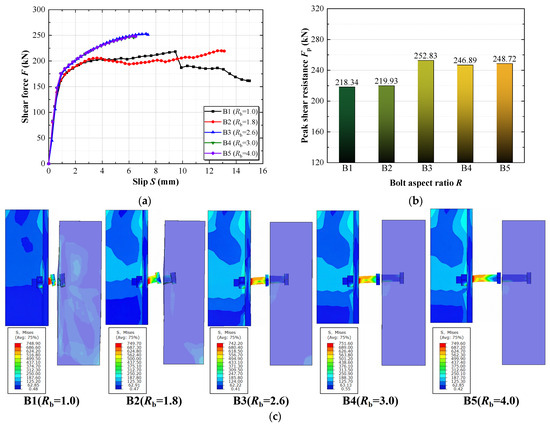
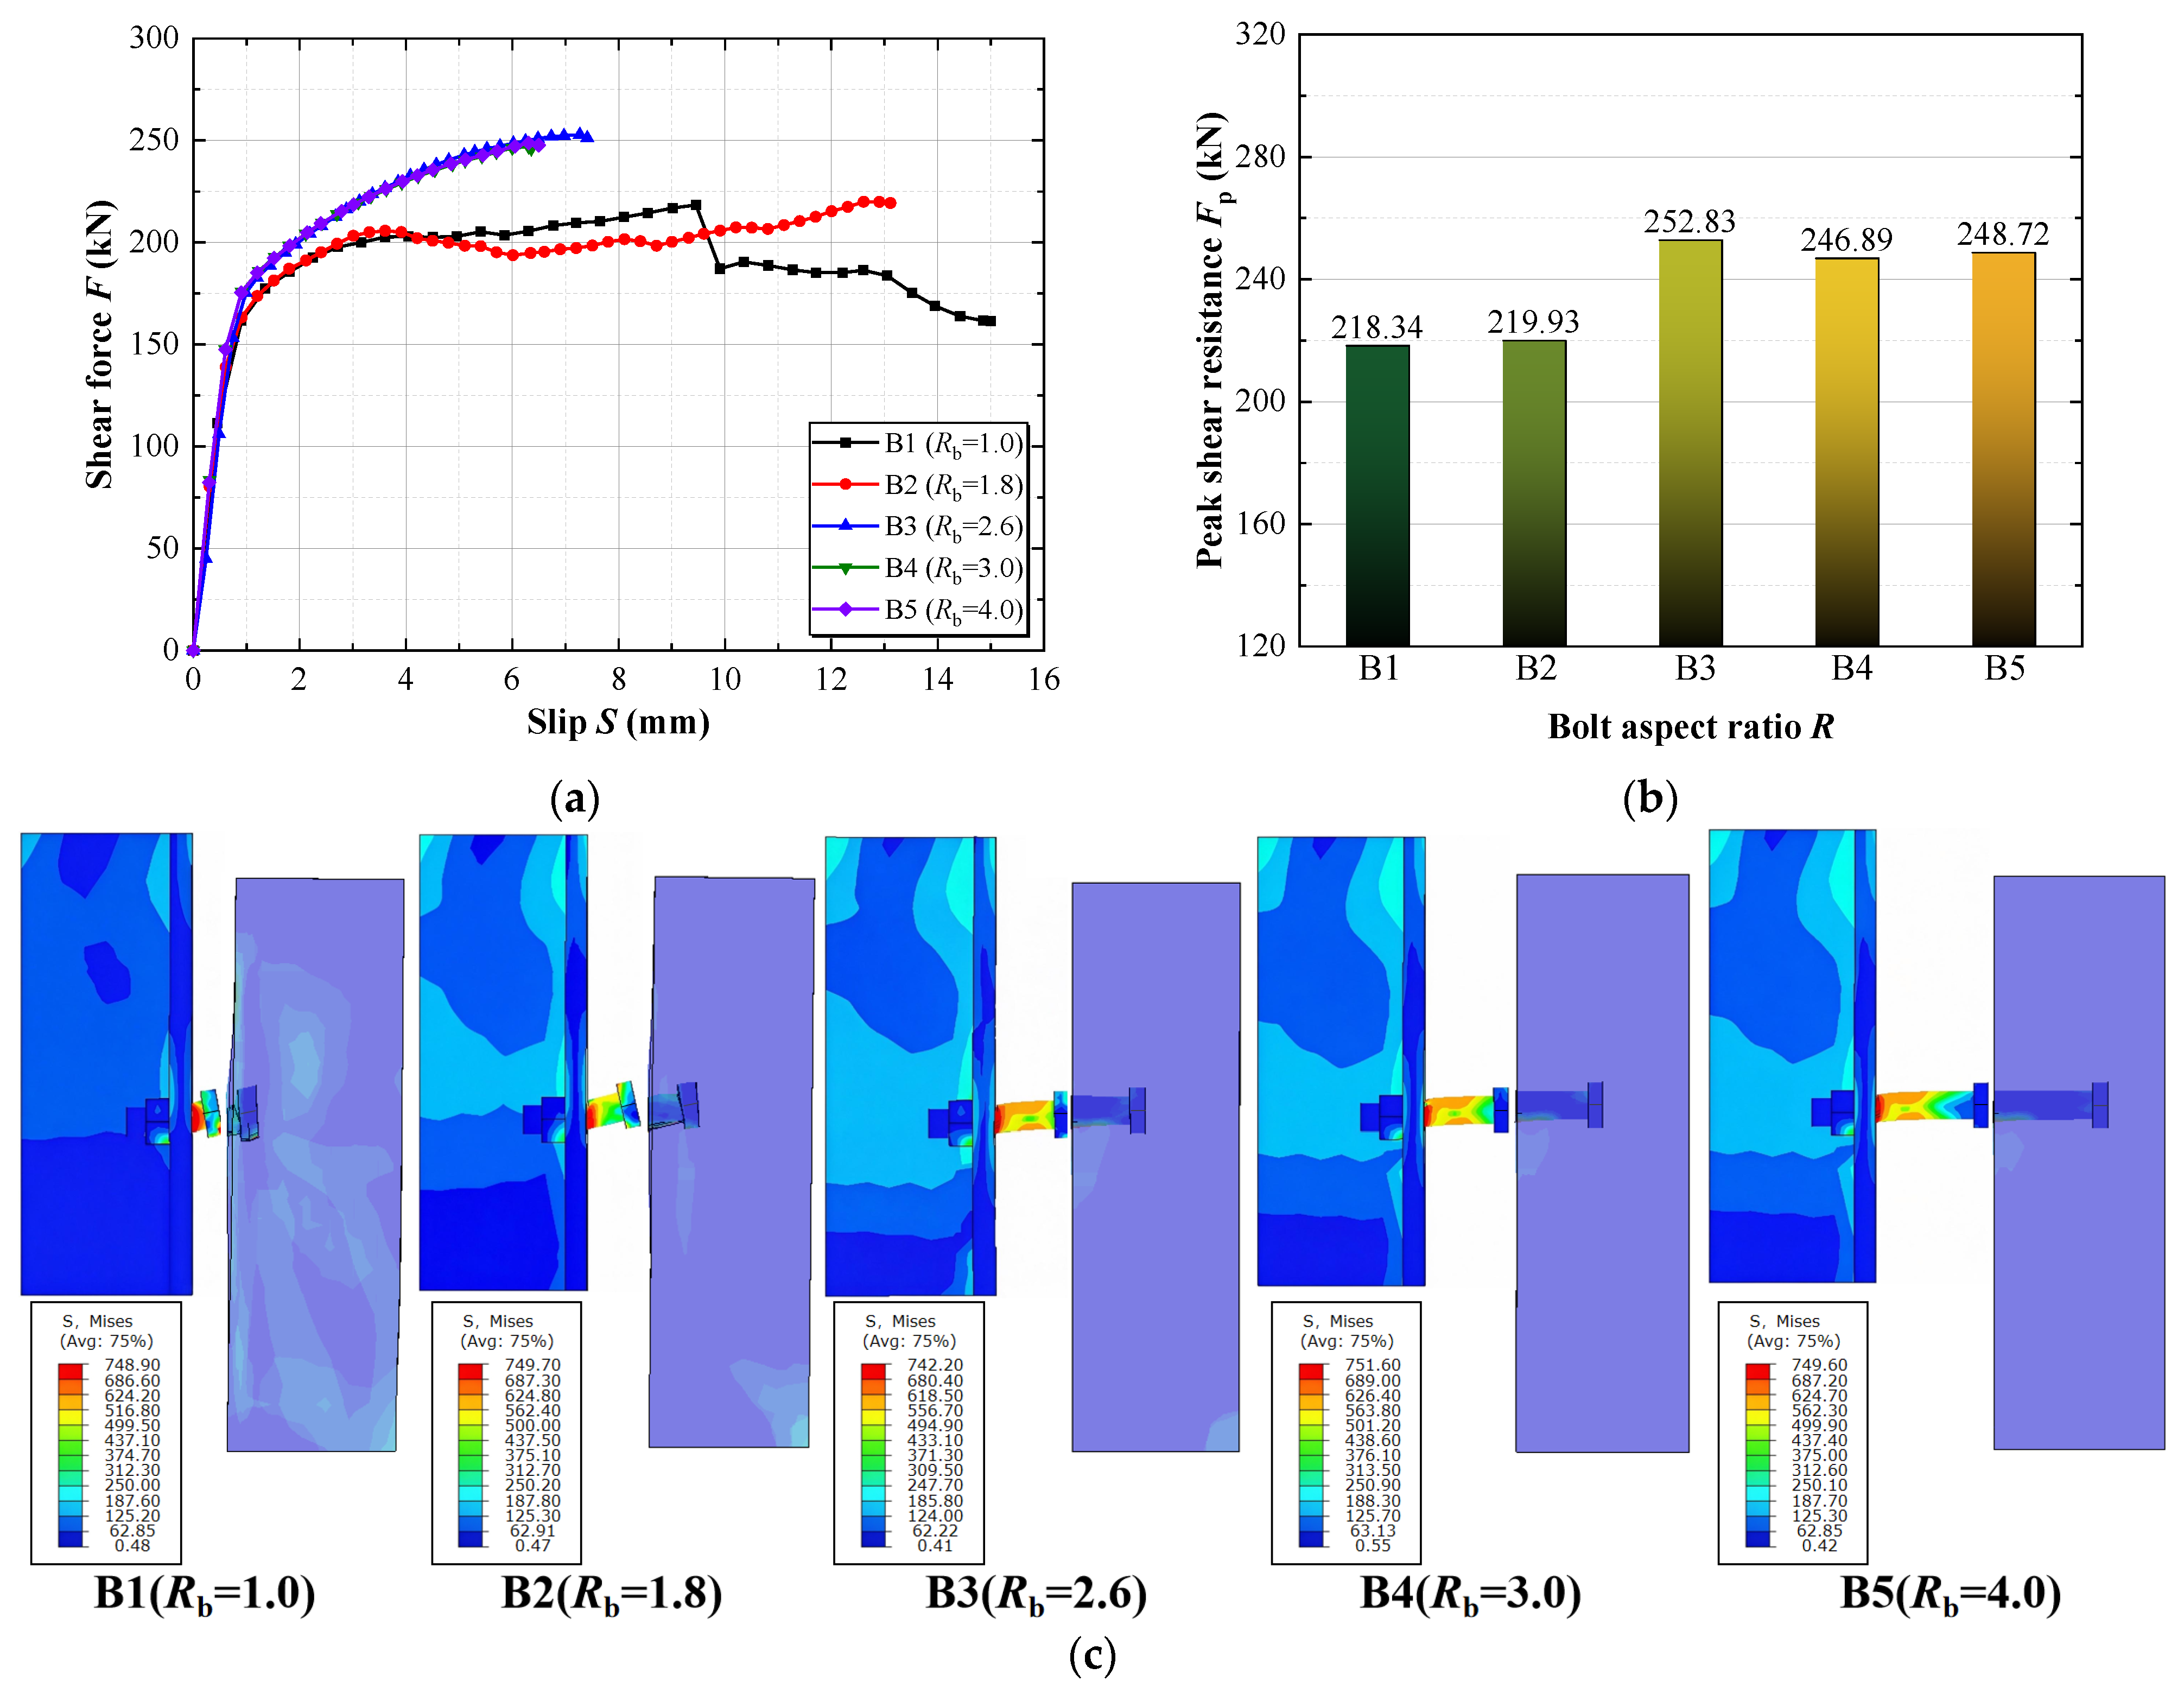
Five bolt aspect ratios, Rb = 1.0, 1.8, 2.6, 3.0, and 4.0, were investigated based on the JL24-1 model. Figure 14 compares the corresponding load–slip responses, peak shear resistances, and stress distributions at Fp. For Rb = 2.6, 3.0, and 4.0, the load–slip responses and peak shear resistances were similar, and the models were governed by bolt shear fracture. Increasing the aspect ratio above 2.6 within the investigated range produced little additional improvement in connector resistance. This observation is consistent with the effective concrete-reaction length identified in Section 5.2, indicating that only a limited portion of the embedded shank contributes significantly to shear transfer. By contrast, reducing the bolt aspect ratio markedly changed the connector response. At Rb = 1.0, insufficient embedment resulted in pronounced bolt rotation and UHPC pry-out, with a peak shear resistance of approximately 218 kN. At Rb = 1.8, the peak shear resistance was approximately 220 kN, and the response exhibited transitional characteristics between UHPC-dominated failure and bolt shear fracture. At Fp, the smaller aspect-ratio models exhibited greater local concrete stress concentration and bolt rotation. Insufficient embedment therefore reduced the restraint provided by the surrounding UHPC, whereas increasing Rb beyond 2.6 provided little additional resistance within the investigated range.
Figure 14.
Effect of bolt aspect ratio on the shear behavior of the hinged-bolt connector: (a) Load–slip curves; (b) Peak shear resistance versus bolt aspect ratio; (c) Mises stress distributions at Fp.
6.3. Effect of Steel-Beam Strength
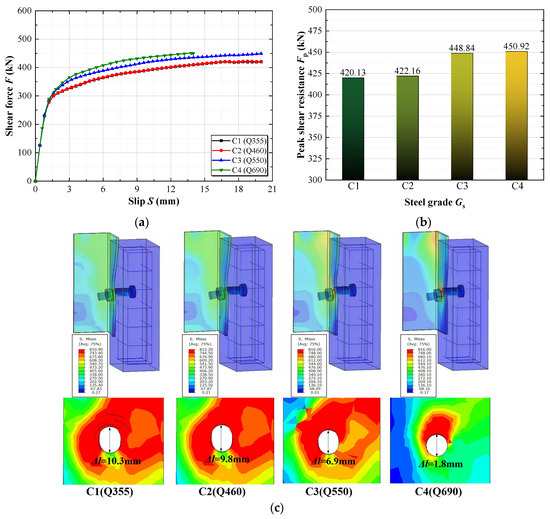
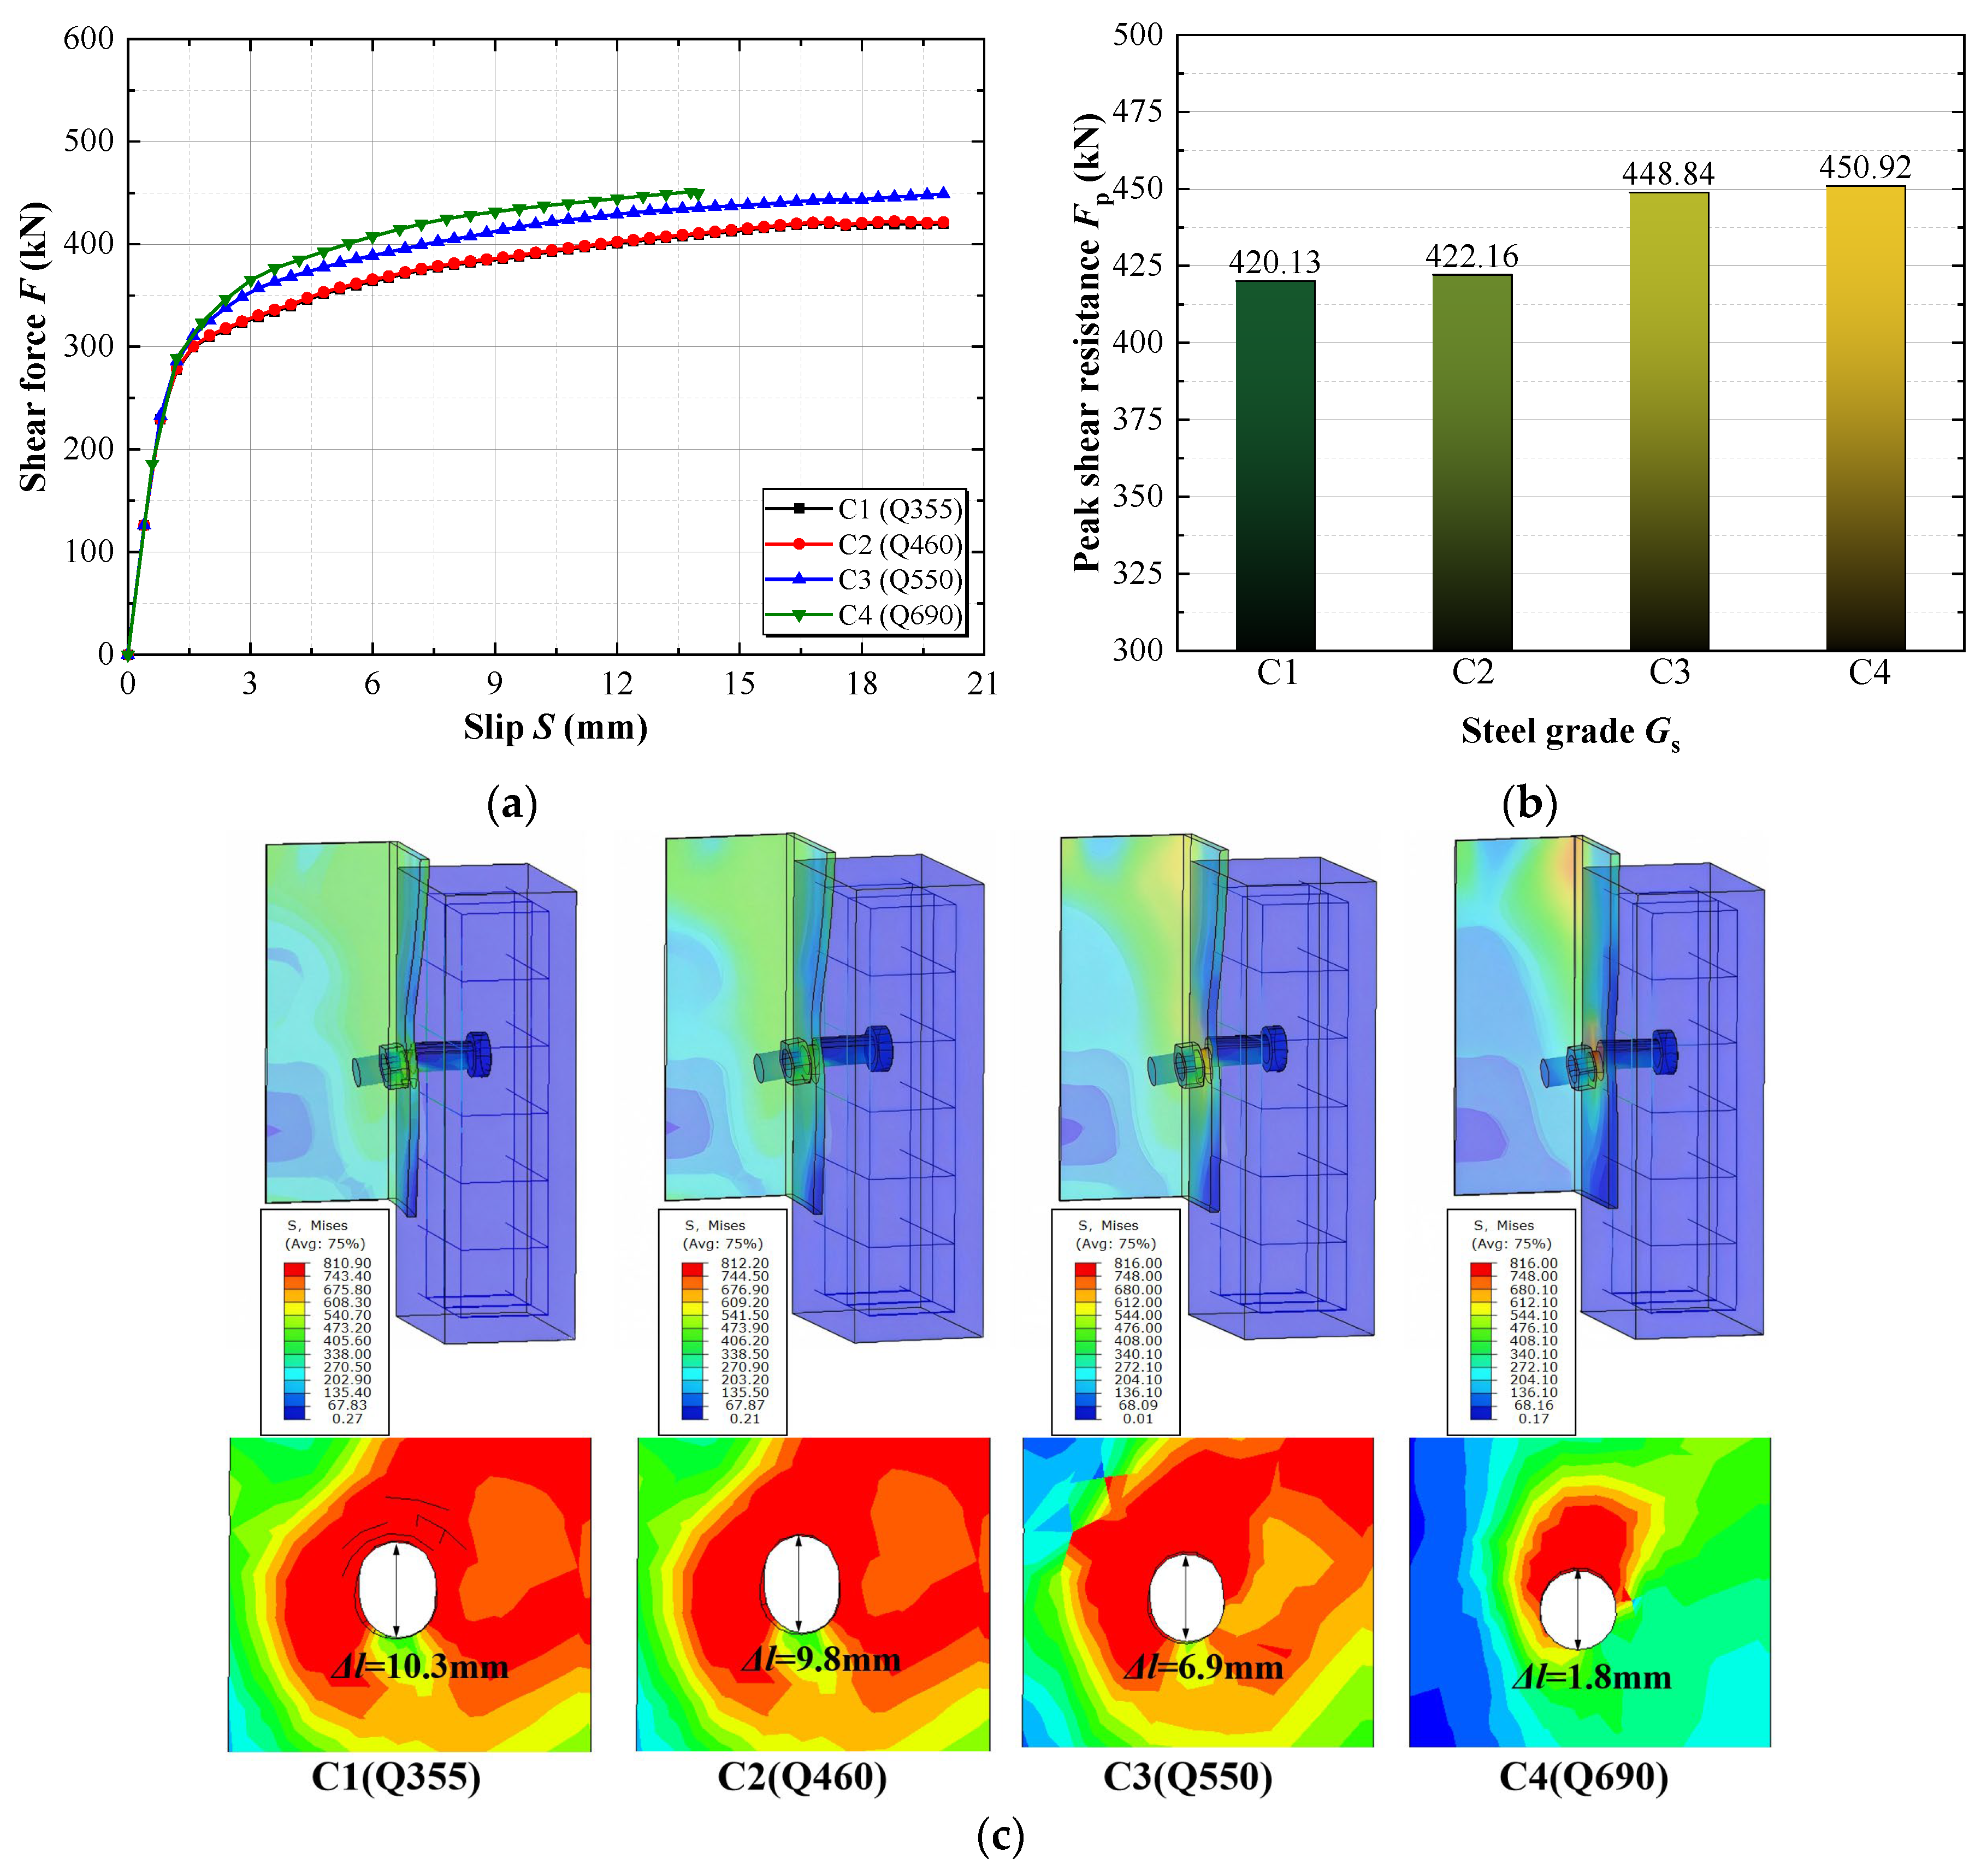
The influence of steel-beam strength was investigated using the JL30-8 model, which contained a relatively thin 10 mm steel flange. Steel grades Q355, Q460, Q550, and Q690 were considered. Consistent with the elastic–perfectly plastic material model adopted for the steel beam, the investigated steel grades were represented by varying the yield strength. Figure 15 compares the corresponding load–slip responses, peak shear resistances, and local stress and deformation characteristics at Fp. The four models exhibited nearly identical initial load–slip responses, indicating that steel-beam strength has little influence on the initial connector stiffness. Increasing the steel grade from Q355 to Q460 produced almost no change in the peak shear resistance, whereas further increases to Q550 and Q690 resulted in moderate increases. The peak shear resistance increased from approximately 420 kN for Q355 to 451 kN for Q690, corresponding to an overall increase of approximately 7.3%. The principal effect of increasing the steel-beam strength was the suppression of local flange deformation around the bolt hole. For the relatively low-strength steel flange, pronounced local deformation reduced the restraint provided to the bolt and limited the development of its shear resistance. The longitudinal elongation of the bolt hole decreased from approximately 10.3 mm for Q355 to 9.8 mm, 6.9 mm, and 1.8 mm for Q460, Q550, and Q690, respectively, indicating that the local bolt-hole deformation decreased progressively with increasing steel grade, most notably for Q690. The Q355, Q460, and Q550 models remained dominated by pronounced local steel-flange deformation, whereas the Q690 model shifted to bolt shear fracture. Nevertheless, the limited increase in peak shear resistance indicates that increasing steel-beam strength alone is not an efficient means of substantially improving connector resistance once adequate local flange resistance is provided.
Figure 15.
Effect of steel-beam strength on the shear behavior of the hinged-bolt connector: (a) Load–slip curves; (b) Peak shear resistance versus steel grade; (c) Mises stress distributions at Fp.
6.4. Effect of Longitudinal Bolt Spacing
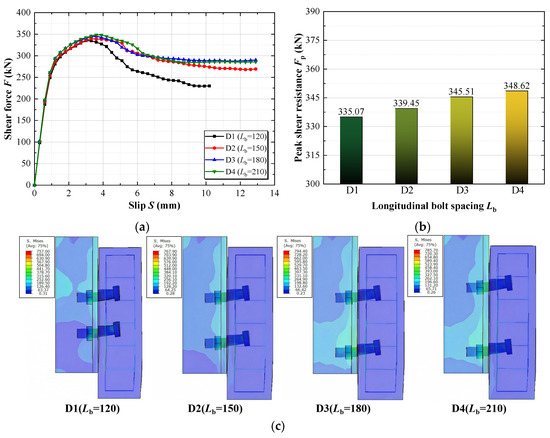
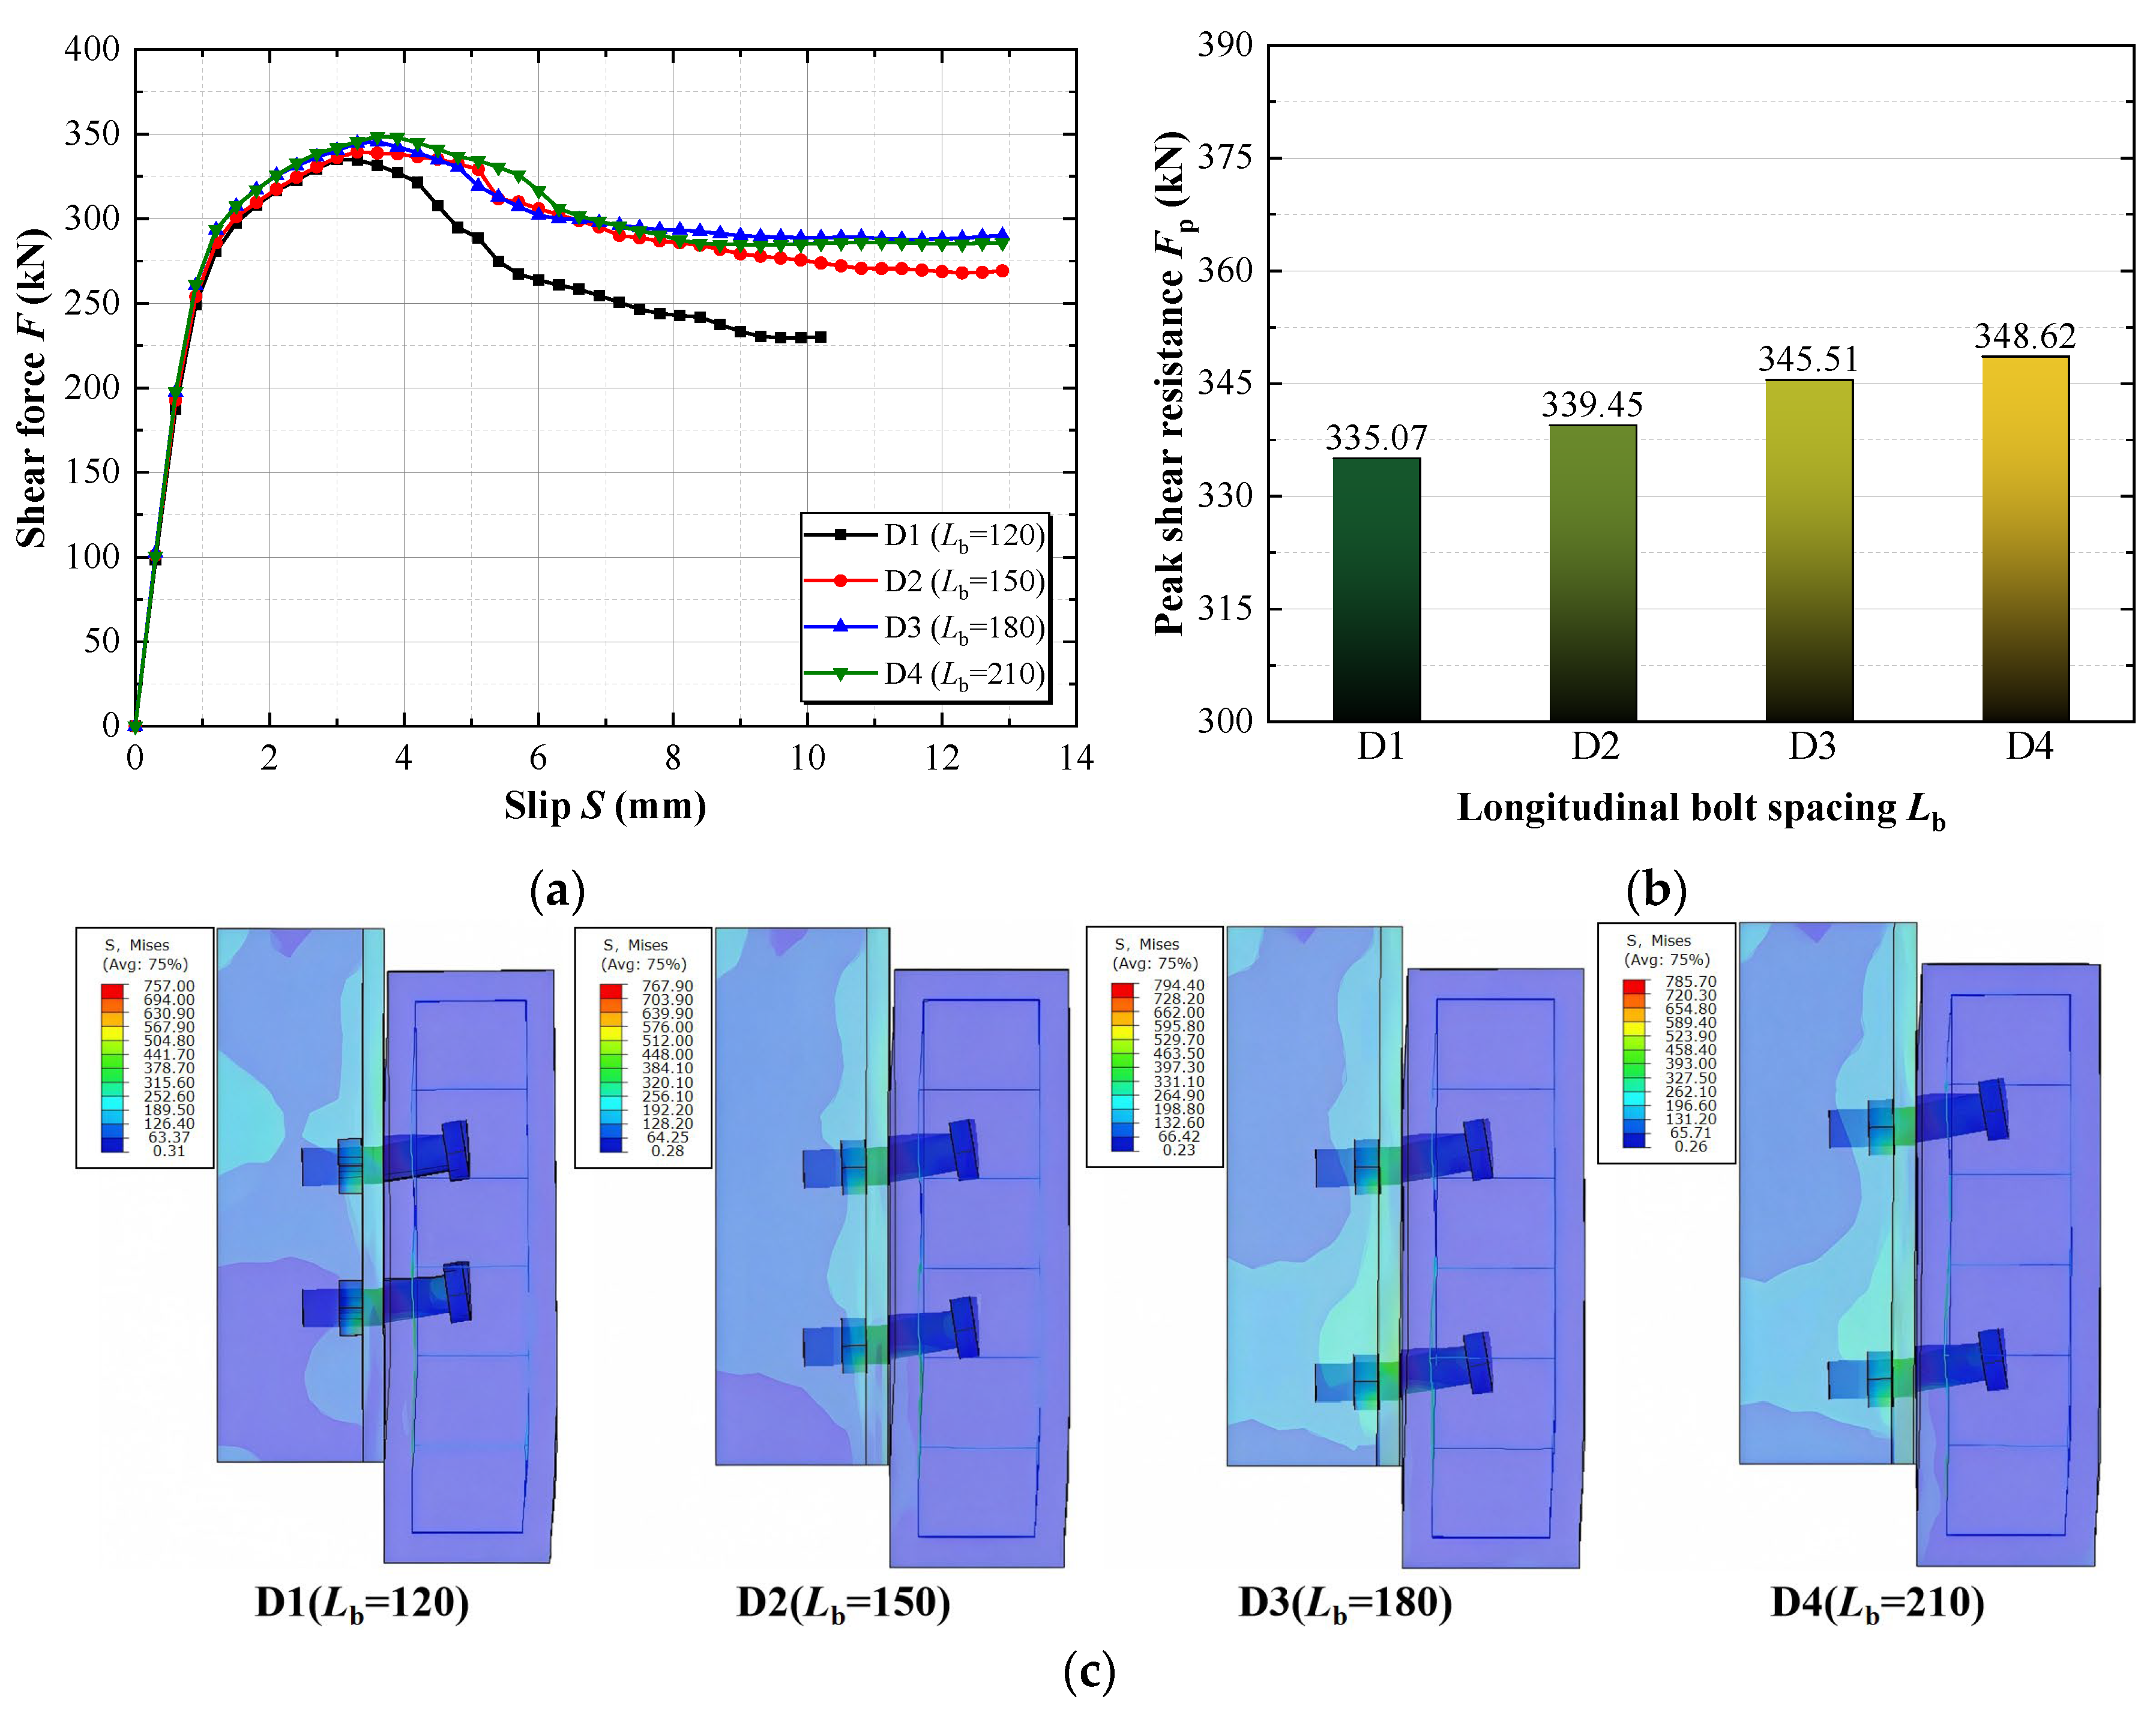
The longitudinal-spacing models were developed by modifying the validated JL30-1 FE model from a single-row configuration to two longitudinal rows of M30 hinged bolts. Compared with the single-row baseline JL30-1, the two-row spacing models exhibited stronger interaction between adjacent connector bearing zones and were governed by concrete crushing rather than bolt shear fracture. Accordingly, the per-bolt resistances of the spacing models (335.1–348.6 kN) were lower than the single-row baseline resistance (approximately 442 kN). Four longitudinal spacings of 120 mm, 150 mm, 180 mm, and 210 mm were considered, corresponding to 4dn, 5dn, 6dn, and 7dn, respectively. Figure 16 compares the corresponding load–slip responses, peak shear resistances, and stress distributions at Fp. The shear resistance reported for the spacing models represents the average resistance per hinged bolt. All four models exhibited similar overall load–slip responses and were governed by concrete crushing. Increasing the longitudinal bolt spacing progressively increased the peak shear resistance, but the effect remained limited. The peak shear resistance increased from approximately 335.1 kN at 4dn to 348.6 kN at 7dn, corresponding to an increase of only approximately 4.0%. The stress distributions remained broadly similar over the investigated spacing range. These results indicate that interaction between adjacent connectors remains relevant within the investigated spacing range. However, because the increase in resistance from 4dn to 7dn was limited, increasing the longitudinal spacing does not produce a proportional improvement in connector resistance.
Figure 16.
Effect of longitudinal bolt spacing on the shear behavior of the hinged-bolt connector: (a) Load–slip curves; (b) Peak shear resistance versus longitudinal bolt spacing; (c) Mises stress distributions at Fp.
7. Conclusions
A three-dimensional nonlinear FE model was developed to investigate the shear behavior and load-transfer mechanism of large-diameter hinged-bolt connectors in steel–UHPC composite beams. Based on the validation and parametric analyses, the main conclusions are as follows:
- The developed FE model provided quantitatively reliable predictions of the peak shear resistance, ultimate slip, and failure mode for the nine UHPC push-out specimens governed by bolt shear fracture. However, for the C60 control specimens governed by concrete crushing, the deformation predictions (including both peak slip and post-peak ultimate slip) were treated as indicative only, owing to the inability of the continuum model to fully capture the complex localized concrete-crushing behavior. Within the validated domain, the model further resolves the internal force state of the hinged bolt, providing the quantitative basis for the load-transfer findings and design implications below.
- The hinged bolt was subjected to coupled shear–tension–bending action rather than pure shear. After excluding the specimens strongly affected by concrete crushing or severe steel-flange deformation, the remaining specimens exhibited maximum bolt shear forces of approximately 68–83% of the corresponding pure-shear resistance and maximum axial forces of approximately 10–20% of the pure-tension resistance. Directly applying pure-shear design formulas developed for welded studs may therefore overestimate the shear capacity of hinged-bolt connectors; for preliminary design of bolt-fracture-controlled connections, the maximum bolt shear force may conservatively be taken as approximately 0.7 times the pure-shear resistance.
- The effective concrete-reaction length Le was limited, ranging from 1.28ds to 2.08ds with an average value of 1.53ds, and approximately 1.5ds may be adopted for preliminary design. The bolt aspect ratio governed the failure mode: Rb = 1.0 led to UHPC pry-out, Rb = 1.8 exhibited a transitional response, and Rb = 2.6–4.0 produced similar responses governed by bolt shear fracture. An aspect ratio of not less than 2.6 is therefore recommended to avoid premature pry-out failure.
- The capacity of the hinged-bolt connector was governed by the weakest component in the load-transfer path. Increasing the bolt grade from 4.6 to 12.9 increased the peak shear resistance by approximately 131%, with diminishing gains beyond grade 8.8 as UHPC crushing became more pronounced; increasing the steel grade from Q355 to Q690 increased the peak resistance by only approximately 7.3%; and increasing the longitudinal bolt spacing from 4dn to 7dn increased the peak resistance by only approximately 4.0%. Efficient design therefore requires balanced resistance among the bolt, surrounding concrete, and steel flange, rather than simply maximizing an individual material strength or geometric parameter.
Several limitations of the present study should also be acknowledged. The proposed FE model is intended for monotonic loading; its applicability to cyclic or fatigue loading requires further verification. In addition, the 0.1 mm bolt-hole interference was represented by a zero-clearance frictional contact rather than an explicit interference-fit installation analysis; its influence was preliminarily assessed through the initial-stiffness comparison. Furthermore, the double-shear characterization was conducted only for the M24 bolt, and possible size effects on the nominal shear response of the larger-diameter bolts were not independently evaluated, although the validated peak-resistance statistics remain essentially unchanged across the three bolt diameters; dedicated double-shear tests on the M30 and M36 bolts are warranted in future work. Further experimental and numerical studies are required to investigate the applicability of the proposed connector at the full member level.
Author Contributions
Conceptualization, S.F., Y.Y. (Yong Yang) and X.C.; methodology, S.F., Y.Y. (Yong Yang) and J.H.; software, S.F. and X.C.; validation, S.F. and X.C.; formal analysis, X.C., Y.X. and H.L.; investigation, S.F., X.C. and J.H.; resources, S.F. and Y.Y. (Yong Yang); data curation, X.C., Y.X. and Y.Y. (Yunlong Yu); writing—original draft preparation, S.F., X.C. and Y.X.; writing—review and editing, S.F., H.L., J.H. and Y.Y. (Yunlong Yu); visualization, S.F. and H.L.; supervision, X.C., Y.X. and H.L.; project administration, Y.Y. (Yong Yang), X.C. and Y.Y. (Yunlong Yu); funding acquisition, S.F., Y.Y. (Yong Yang) and Y.Y. (Yunlong Yu). All authors have read and agreed to the published version of the manuscript.
Funding
This research was funded by the National Natural Science Foundation of China (Grant No. 52308202 and No. 52378190), and the Scientific Research Program Funded by Shaanxi Provincial Education Department (Grant No. 25JU025). In addition, most authors of the paper are members of the Shaanxi Key Science and Technology Innovation Team Project (Grant No. 2024RS-CXTD-37).
Data Availability Statement
The original contributions presented in the study are included in the article; further inquiries can be directed to the corresponding author.
Conflicts of Interest
The authors declare no conflicts of interest.
Abbreviations
The following abbreviations are used in this manuscript:
| UHPC | Ultra-high-performance concrete |
| PBL | Perfobond leiste |
| FE | Finite element |
| CDP | Concrete damaged plasticity |
| COV | Coefficient of variation |
| LVDT | linear variable differential transformer |
Appendix A
To verify the mesh independence of the numerical results, a mesh sensitivity analysis was conducted on the representative specimen JL24-1, which is governed by bolt shear fracture. Three mesh densities were considered: coarse (bolt 5 mm, remote concrete 25 mm), medium (bolt 3 mm, remote concrete 20 mm), and fine (bolt 2 mm, remote concrete 15 mm). The key response quantities, including the number of elements, peak shear resistance (Fpf), ultimate slip (Suf), maximum bolt shear force (Vmax), and predicted failure mode, are summarized in Table A1. As shown in Table A1, the maximum relative differences in the peak shear resistance, maximum slip and maximum bolt shear force were 3.4%, 3.8%, and 0.9%, respectively. The predicted failure mode remains consistently bolt shear fracture across all three meshes. The medium mesh adopted in the main text provides a satisfactory balance between accuracy and computational efficiency. Therefore, the medium mesh was used for all subsequent analyses.
Table A1.
Mesh sensitivity analysis for specimen JL24-1.
References
- Russell, H.G.; Graybeal, B.A. Ultra-High Performance Concrete: A State-of-the-Art Report For The Bridge Community; Rep. FHWA-HRT-13-060; Federal Highway Administration: McLean, VA, USA, 2013. [Google Scholar]
- Benedetty, C.A.; Santos, V.B.; Krahl, P.A.; Rossi, A.; Silva, F.A.; Cardoso, D.C.T.; Martins, C.H. Flexural and shear behavior of steel-UHPC composite beams: A review. Eng. Struct. 2023, 293, 116649. [Google Scholar] [CrossRef] [Scilit]
- Sun, G.; Shan, B.; Kang, J.; Zhou, G. Flexural behavior of steel-UHPC composite beams with different connectors in negative moment. J. Constr. Steel Res. 2024, 216, 108617. [Google Scholar] [CrossRef] [Scilit]
- Fang, Z.; Fang, H.; Li, P.; Jiang, H.; Chen, G. Interfacial shear and flexural performances of steel–precast UHPC composite beams: Full-depth slabs with studs vs. demountable slabs with bolts. Eng. Struct. 2022, 260, 114230. [Google Scholar] [CrossRef] [Scilit]
- Ollgaard, J.G.; Slutter, R.G.; Fisher, J.W. Shear strength of stud connectors in lightweight and normal-weight concrete. Eng. J. AISC 1971, 8, 55–64. [Google Scholar] [CrossRef] [Scilit]
- EN 1994-1-1:2004; Eurocode 4: Design of Composite Steel and Concrete Structures—Part 1-1: General Rules and Rules for Buildings. European Committee for Standardization (CEN): Brussels, Belgium, 2004.
- Lee, P.G.; Shim, C.S.; Chang, S.P. Static and fatigue behavior of large stud shear connectors for steel-concrete composite bridges. J. Constr. Steel Res. 2005, 61, 1270–1285. [Google Scholar] [CrossRef] [Scilit]
- Wang, J.; Xu, Q.; Yao, Y.; Qi, J.; Xiu, H. Static behavior of grouped large headed stud-UHPC shear connectors in composite structures. Compos. Struct. 2018, 206, 202–214. [Google Scholar] [CrossRef] [Scilit]
- Xu, Q.; Sebastian, W.; Lu, K.; Yao, Y.; Wang, J. Shear behaviour and calculation model for stud-UHPC connections: Finite element and theoretical analyses. Eng. Struct. 2022, 254, 113838. [Google Scholar] [CrossRef] [Scilit]
- Ding, J.; Zhu, J.; Shi, T. Performance of grouped stud connectors in precast steel-UHPC composite bridges under combined shear and tension loads. Eng. Struct. 2023, 277, 115470. [Google Scholar] [CrossRef] [Scilit]
- Fang, Z.; Fang, S.; Liu, F. Experimental and numerical study on the shear performance of short stud shear connectors in steel–UHPC composite beams. Buildings 2022, 12, 418. [Google Scholar] [CrossRef] [Scilit]
- Chen, X.; Yang, Y.; Xue, Y.; Yu, Y.; Feng, S. Shear behavior of large studs and novel bolted connectors in steel-UHPC composite beams. Structures 2022, 45, 2091–2103. [Google Scholar] [CrossRef] [Scilit]
- Oguejiofor, E.C.; Hosain, M.U. A parametric study of perfobond rib shear connectors. Can. J. Civ. Eng. 1994, 21, 614–625. [Google Scholar] [CrossRef] [Scilit]
- Cao, Z.; Li, Z.; Deng, S.; Wang, L.; Jiang, H.; Xian, B. Experimental study on interfacial shear behavior of PBL shear connector deeply embedded in UHPC. Case Stud. Constr. Mater. 2023, 18, e02192. [Google Scholar] [CrossRef] [Scilit]
- Wu, N.; Liao, S.; Pan, Z.; Fang, Z.; Fang, S.; Liu, F.; Li, L.; Xiong, Z. Shear performance of small-rib-height perfobond strip connector groups embedded in UHPC: Experimental investigations and design recommendations. Eng. Struct. 2024, 311, 118175. [Google Scholar] [CrossRef] [Scilit]
- Pavlović, M.; Marković, Z.; Veljković, M.; Buđevac, D. Bolted shear connectors vs. headed studs behaviour in push-out tests. J. Constr. Steel Res. 2013, 88, 134–149. [Google Scholar] [CrossRef] [Scilit]
- Yang, F.; Liu, Y.; Jiang, Z.; Xin, H. Shear performance of a novel demountable steel-concrete bolted connector under static push-out tests. Eng. Struct. 2018, 160, 133–146. [Google Scholar] [CrossRef] [Scilit]
- Tzouka, E.; Karavasilis, T.; Kashani, M.M.; Afshan, S. Finite element modelling of push-out tests for novel locking nut shear connectors. Structures 2021, 33, 1020–1032. [Google Scholar] [CrossRef] [Scilit]
- Wang, J.; Guo, J.; Jia, L.; Chen, S.; Dong, Y. Push-out tests of demountable headed stud shear connectors in steel-UHPC composite structures. Compos. Struct. 2017, 170, 69–79. [Google Scholar] [CrossRef] [Scilit]
- Fang, Z.; Liang, W.; Fang, H.; Jiang, H.; Wang, S. Experimental investigation on shear behavior of high-strength friction-grip bolt shear connectors in steel-precast UHPC composite structures subjected to static loading. Eng. Struct. 2021, 244, 112777. [Google Scholar] [CrossRef] [Scilit]
- Fang, Z.; Zhang, S.; Wu, J.; Ma, Y.; Fang, S.; Zhao, G.; Jiang, H. Experimental and numerical study on shear performance of grouped bolt-UHPC pocket connections under static loading. J. Build. Eng. 2023, 76, 106966. [Google Scholar] [CrossRef] [Scilit]
- Jiao, Y.; Ouyang, G.; Wang, Y.; Zhao, Z.; Mei, Y. Finite element analysis of controlled-slip bolted shear connectors for interface deformation coordination in negative-moment regions of steel–UHPC composite beams. Buildings 2026, 16, 2814. [Google Scholar] [CrossRef] [Scilit]
- Chen, X.; Yang, Y.; Xue, Y.; Yu, Y.; Zhang, S.; Yang, S. Study on shear behavior of hinged bolted connectors in steel-UHPC composite beams. Eng. Mech. 2025, 42, 185–197. [Google Scholar] [CrossRef]
- Yang, F.; Liu, Y.; Xin, H.; Veljković, M. Fracture simulation of a demountable steel-concrete bolted connector in push-out tests. Eng. Struct. 2021, 239, 112305. [Google Scholar] [CrossRef] [Scilit]
- Deng, E.; Zhu, Y.; Liu, Z.; Wu, S.; Zhang, Z.; Li, W. Shear behavior of demountable high-strength bolt connectors for prefabricated steel-UHPC composite beams. J. Constr. Steel Res. 2026, 236, 110067. [Google Scholar] [CrossRef] [Scilit]
- Khatir, A.; Capozucca, R.; Khatir, S.; Magagnini, E.; Thanh, C.L.; Riahi, M.K. Advancements and emerging trends in integrating machine learning and deep learning for SHM in mechanical and civil engineering: A comprehensive review. J. Braz. Soc. Mech. Sci. Eng. 2025, 47, 419. [Google Scholar] [CrossRef] [Scilit]
- Khatir, A.; Capozucca, R. Artificial, convolutional, and deep neural networks for structural health monitoring: A review. HCMCOU J. Sci.-Adv. Comput. Struct. 2026, 16, 7–50. [Google Scholar] [CrossRef] [Scilit]
- Khatir, A.; Oulad Brahim, A.; Capozucca, R.; Khatir, S.; Noori, M.; Sarhosis, V.; Bhowmik, B.; Le-Thanh, C. Structural recovery and damage prediction in GFRP-BFRP patched plates using hybrid SSA-SCA-XGBoost model and vibration data. Compos. Struct. 2026, 393, 120638. [Google Scholar] [CrossRef] [Scilit]
- Feng, S.; Yang, Y.; Chen, X.; Xue, Y.; Yu, Y.; He, J.; Chen, Y.; Sun, D. Preliminary experimental study on the flexural behavior of high-strength castellated steel–UHPC composite beams with hinged-bolt shear connectors. Buildings 2026, 16, 3445. [Google Scholar] [CrossRef] [Scilit]
- GB/T 31387-2015; Reactive Powder Concrete. General Administration of Quality Supervision, Inspection and Quarantine of the People’s Republic of China: Beijing, China; China Standards Press: Beijing, China, 2015.
- GB/T 50081-2019; Standard for Test Methods of Concrete Physical and Mechanical Properties. State Administration for Market Regulation: Beijing, China; Ministry of Housing and Urban-Rural Development: Beijing, China; China Architecture & Building Press: Beijing, China, 2019.
- Xu, C.; Sugiura, K.; Wu, C.; Su, Q. Parametrical static analysis on group studs with typical push-out tests. J. Constr. Steel Res. 2012, 72, 84–96. [Google Scholar] [CrossRef] [Scilit]
- Lubliner, J.; Oliver, J.; Oller, S.; Oñate, E. A plastic-damage model for concrete. Int. J. Solids Struct. 1989, 25, 299–326. [Google Scholar] [CrossRef] [Scilit]
- Lee, J.; Fenves, G.L. Plastic-damage model for cyclic loading of concrete structures. J. Eng. Mech. 1998, 124, 892–900. [Google Scholar] [CrossRef] [Scilit]
- Ding, F.; Ying, X.; Zhou, L.; Yu, Z. Unified calculation method and its application in determining the uniaxial mechanical properties of concrete. Front. Archit. Civ. Eng. China 2011, 5, 381–393. [Google Scholar] [CrossRef] [Scilit]
- GB50010-2010; Code for Design of Concrete Structures. China Architecture and Building Press: Beijing, China, 2015.
- Wille, K.; El-Tawil, S.; Naaman, A.E. Properties of strain hardening ultra high performance fiber reinforced concrete (UHP-FRC) under direct tensile loading. Cem. Concr. Compos. 2014, 48, 53–66. [Google Scholar] [CrossRef] [Scilit]
- Shi, Z.; Su, Q.; Kavoura, F.; Veljkovic, M. Uniaxial tensile response and tensile constitutive model of ultra-high performance concrete containing coarse aggregate (CA-UHPC). Cem. Concr. Compos. 2023, 136, 104878. [Google Scholar] [CrossRef] [Scilit]
- Kmiecik, P.; Kamiński, M. Modelling of reinforced concrete structures and composite structures with concrete strength degradation taken into consideration. Arch. Civ. Mech. Eng. 2011, 11, 623–636. [Google Scholar] [CrossRef] [Scilit]
- Kupfer, H.B.; Gerstle, K.H. Behavior of concrete under biaxial stresses. J. Eng. Mech. Div. 1973, 99, 853–866. [Google Scholar] [CrossRef] [Scilit]
- Caprio, D.; Jockwer, R. Experimental investigation and probabilistic modelling of the load-displacement behaviour of steel-to-timber joints with self-tapping screws. Constr. Build. Mater. 2025, 489, 141970. [Google Scholar] [CrossRef] [Scilit]

Disclaimer/Publisher’s Note: The statements, opinions and data contained in all publications are solely those of the individual author(s) and contributor(s) and not of MDPI and/or the editor(s). MDPI and/or the editor(s) disclaim responsibility for any injury to people or property resulting from any ideas, methods, instructions or products referred to in the content. |
© 2026 by the authors. Licensee MDPI, Basel, Switzerland. This article is an open access article distributed under the terms and conditions of the Creative Commons Attribution (CC BY) license.