


Abstract
To investigate the feasibility of using molybdenum tailings (MTs) as fine aggregate in concrete production and the impact of carbonation on the performance of molybdenum tailings concrete (MTC), this study employed mechanical property testing, strain field analysis based on digital image correlation (DIC), industrial CT, and scanning electron microscopy (SEM) to systematically analyze the evolution of carbonation depth, compressive strength (fcu), splitting tensile strength (fsts), strain field distribution, pore structure, and microstructure of MTC at different carbonation ages. The relationship between porosity and fcu and the two-parameter strength model of porosity and average pore volume were established. The results show that the carbonation depth gradually increases with the increase in carbonation age and also increases with an increase in the substitution rate of MTs. The carbonation depth of MTs completely replaced is up to 13.72 mm after 56 days of carbonation. Carbonation significantly improves the fcu of concrete, but as the carbonation age increases, the rate of strength growth generally slows down. The 2D slice visualization of the pore structure shows that the pores of the concrete are gradually filled by carbonation products from outside to inside, the edge macropores gradually disappear, and the proportion of mesopores gradually increases. The total porosity is reduced (up to 37.3%). Microscopic observations confirmed that the carbonation-generated CaCO3 filled the concrete pores and optimized the structure of the interfacial transition zone (ITZ), but the DIC strain field distribution showed that the filled part increased the brittleness of the concrete. Therefore, it is inferred that excessive carbonization may cause microcrack propagation (which will be discussed in subsequent carbonization time extension studies). The study revealed the dual effects of carbonation on the mechanical properties and pore structure of MTC, providing an experimental basis for the application of tailings in the laboratory.
1. Introduction
Driven by the global carbon neutrality strategy, the building materials industry is facing the dual constraints of resource consumption and carbon emissions. According to statistics from the International Energy Agency (IEA) [1], cement production accounts for approximately 8% of global CO2 emissions, while aggregate mining consumes more than 40 billion tons of natural resources annually [2]. Cement production accounts for approximately 8% of global CO2 emissions, while aggregate extraction consumes more than 4 billion tons of natural resources annually [3]. At the same time, as the world’s largest molybdenum producer, China emits more than 36 million tons of molybdenum tailings (MTs) annually [4,5]. Its storage not only wastes land resources but also poses a risk of migration of heavy metal ions such as Mo6+ [6]. Using MT as fine aggregate in concrete not only alleviates the shortage of natural river sand (the price of sand and gravel in China has risen by 240% in the past five years) but also reduces the risk of tailings dam failures (there have been 17 major tailings accidents worldwide in the past decade) [7,8]. It has significant ecological and economic benefits.
In recent years, research on the application of tailings in concrete has shown a rapid growth trend. In terms of copper tailings [9], Cui et al. [10] found that copper tailings with a replacement rate of no more than 40% could achieve a 14% increase in compressive strength (fcu). Ghazi et al. [11] used copper tailings to replace cement in concrete production and found that the addition of copper tailings was conducive to the growth of C-S-H crystals. Concrete made with 70% copper tailings replacement had better durability. Iron tailings (ITs) are most widely used in concrete [12,13]. Zhao et al. [14] replaced natural sand with IT sand in concrete. The study showed that when 100% replacement was used, the workability and mechanical properties of the concrete were significantly reduced. When the replacement rate was less than 40%, the compressive strength of the tailings concrete decreased by less than 11%. Shi et al. [15] applied IT powder and IT sand together to ultra-high performance concrete to study their effects on mechanical properties, hydration products, microstructure, and durability. They found that UHPC with 20% IT powder and 50% IT sand had the highest compressive strength. Liu et al. [16] found that adding 10% to 30% graphite tailings could refine the pore structure of concrete and improve its freeze resistance but adding more than 40% increased defects in the concrete. However, research on MTs lags significantly behind, with existing findings mainly focused on the short-term mechanical properties of MT concrete [17,18]. For example, Gao et al. [19] conducted a detailed experimental study on the mechanical properties of circular thin-tube MT concrete short tubes. Quan et al. [20] studied the effect of MTs on the mechanical properties of autoclaved aerated concrete. However, existing research has three obvious limitations: most studies focus on short-term mechanical properties (≤28 days) and lack long-term data under carbonation coupling; there is little research on the micropore structure; and no quantitative relationship has been established between pore structure parameters, mechanical properties, and durability.
Carbonation is a key factor in the deterioration of concrete durability, especially in the context of rising CO2 concentrations (current atmospheric CO2 concentrations have reached 417 ppm, a 48% increase since the Industrial Revolution) [21]. The effect of carbonation on concrete performance is twofold: on the one hand, the reaction between CO2 and Ca(OH)2 to form CaCO3 reduces porosity and increases density; on the other hand, the decalcification of C-S-H gel leads to strength deterioration. The particularity of molybdenum tailings as fine aggregates is that its multi-angular particle characteristics (roundness coefficient of 0.35~0.55) significantly affect the structure of the interfacial transition zone (ITZ) [22]; it has a finer particle size and higher specific surface area and may absorb a large amount of water during the mixing process. In particular, the long-term performance evolution of molybdenum tailings concrete (MTC) in coastal areas (where CO2 concentrations can reach 0.1~0.15%) and industrial environments (0.2~0.5%) remains unclear.
The physical and chemical changes triggered by the carbonization process significantly alter the pore structure characteristics, but existing studies have mostly focused on the short-term mechanical properties of tailings concrete and lack long-term evolution patterns [23,24]. There is insufficient research on the correlation between mechanical properties and pore structure, making it difficult to establish a multi-scale performance prediction model. Therefore, this paper systematically studies the performance evolution mechanism of MTC under a carbonation environment, which mainly includes the following contents: (1) Macroscopic level: The variation in carbonation depth, compressive strength, and splitting tensile strength of MTC with different substitution rates under different curing ages and different carbonation erosion ages; and the distribution of the strain cloud based on digital image correlation (DIC). (2) Meso level: Using industrial CT scanning technology, visual two-dimensional (2D) slices and three-dimensional (3D) pore space distribution models were extracted to quantitatively characterize the evolution of the 2D and 3D pore structure, and a multi-scale performance prediction model of macro compressive strength, porosity, and pore volume was proposed. (3) Microscopic level: Finally, the microstructure and morphology of MTC after carbonization were explored from the microscopic level by scanning electron microscope (SEM). The long-term carbonization performance evolution of MTC was confirmed, which provided a multi-level theoretical basis for the long-term performance of MT in concrete.
2. Experimental Programs
2.1. Materials
2.1.1. Cementitious Material
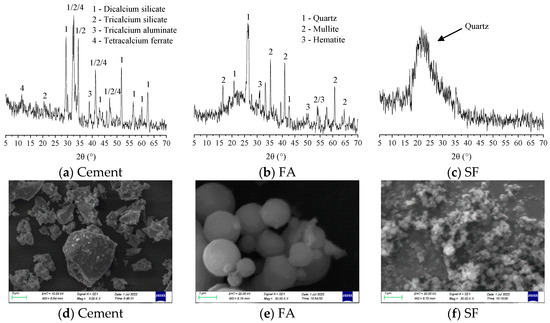
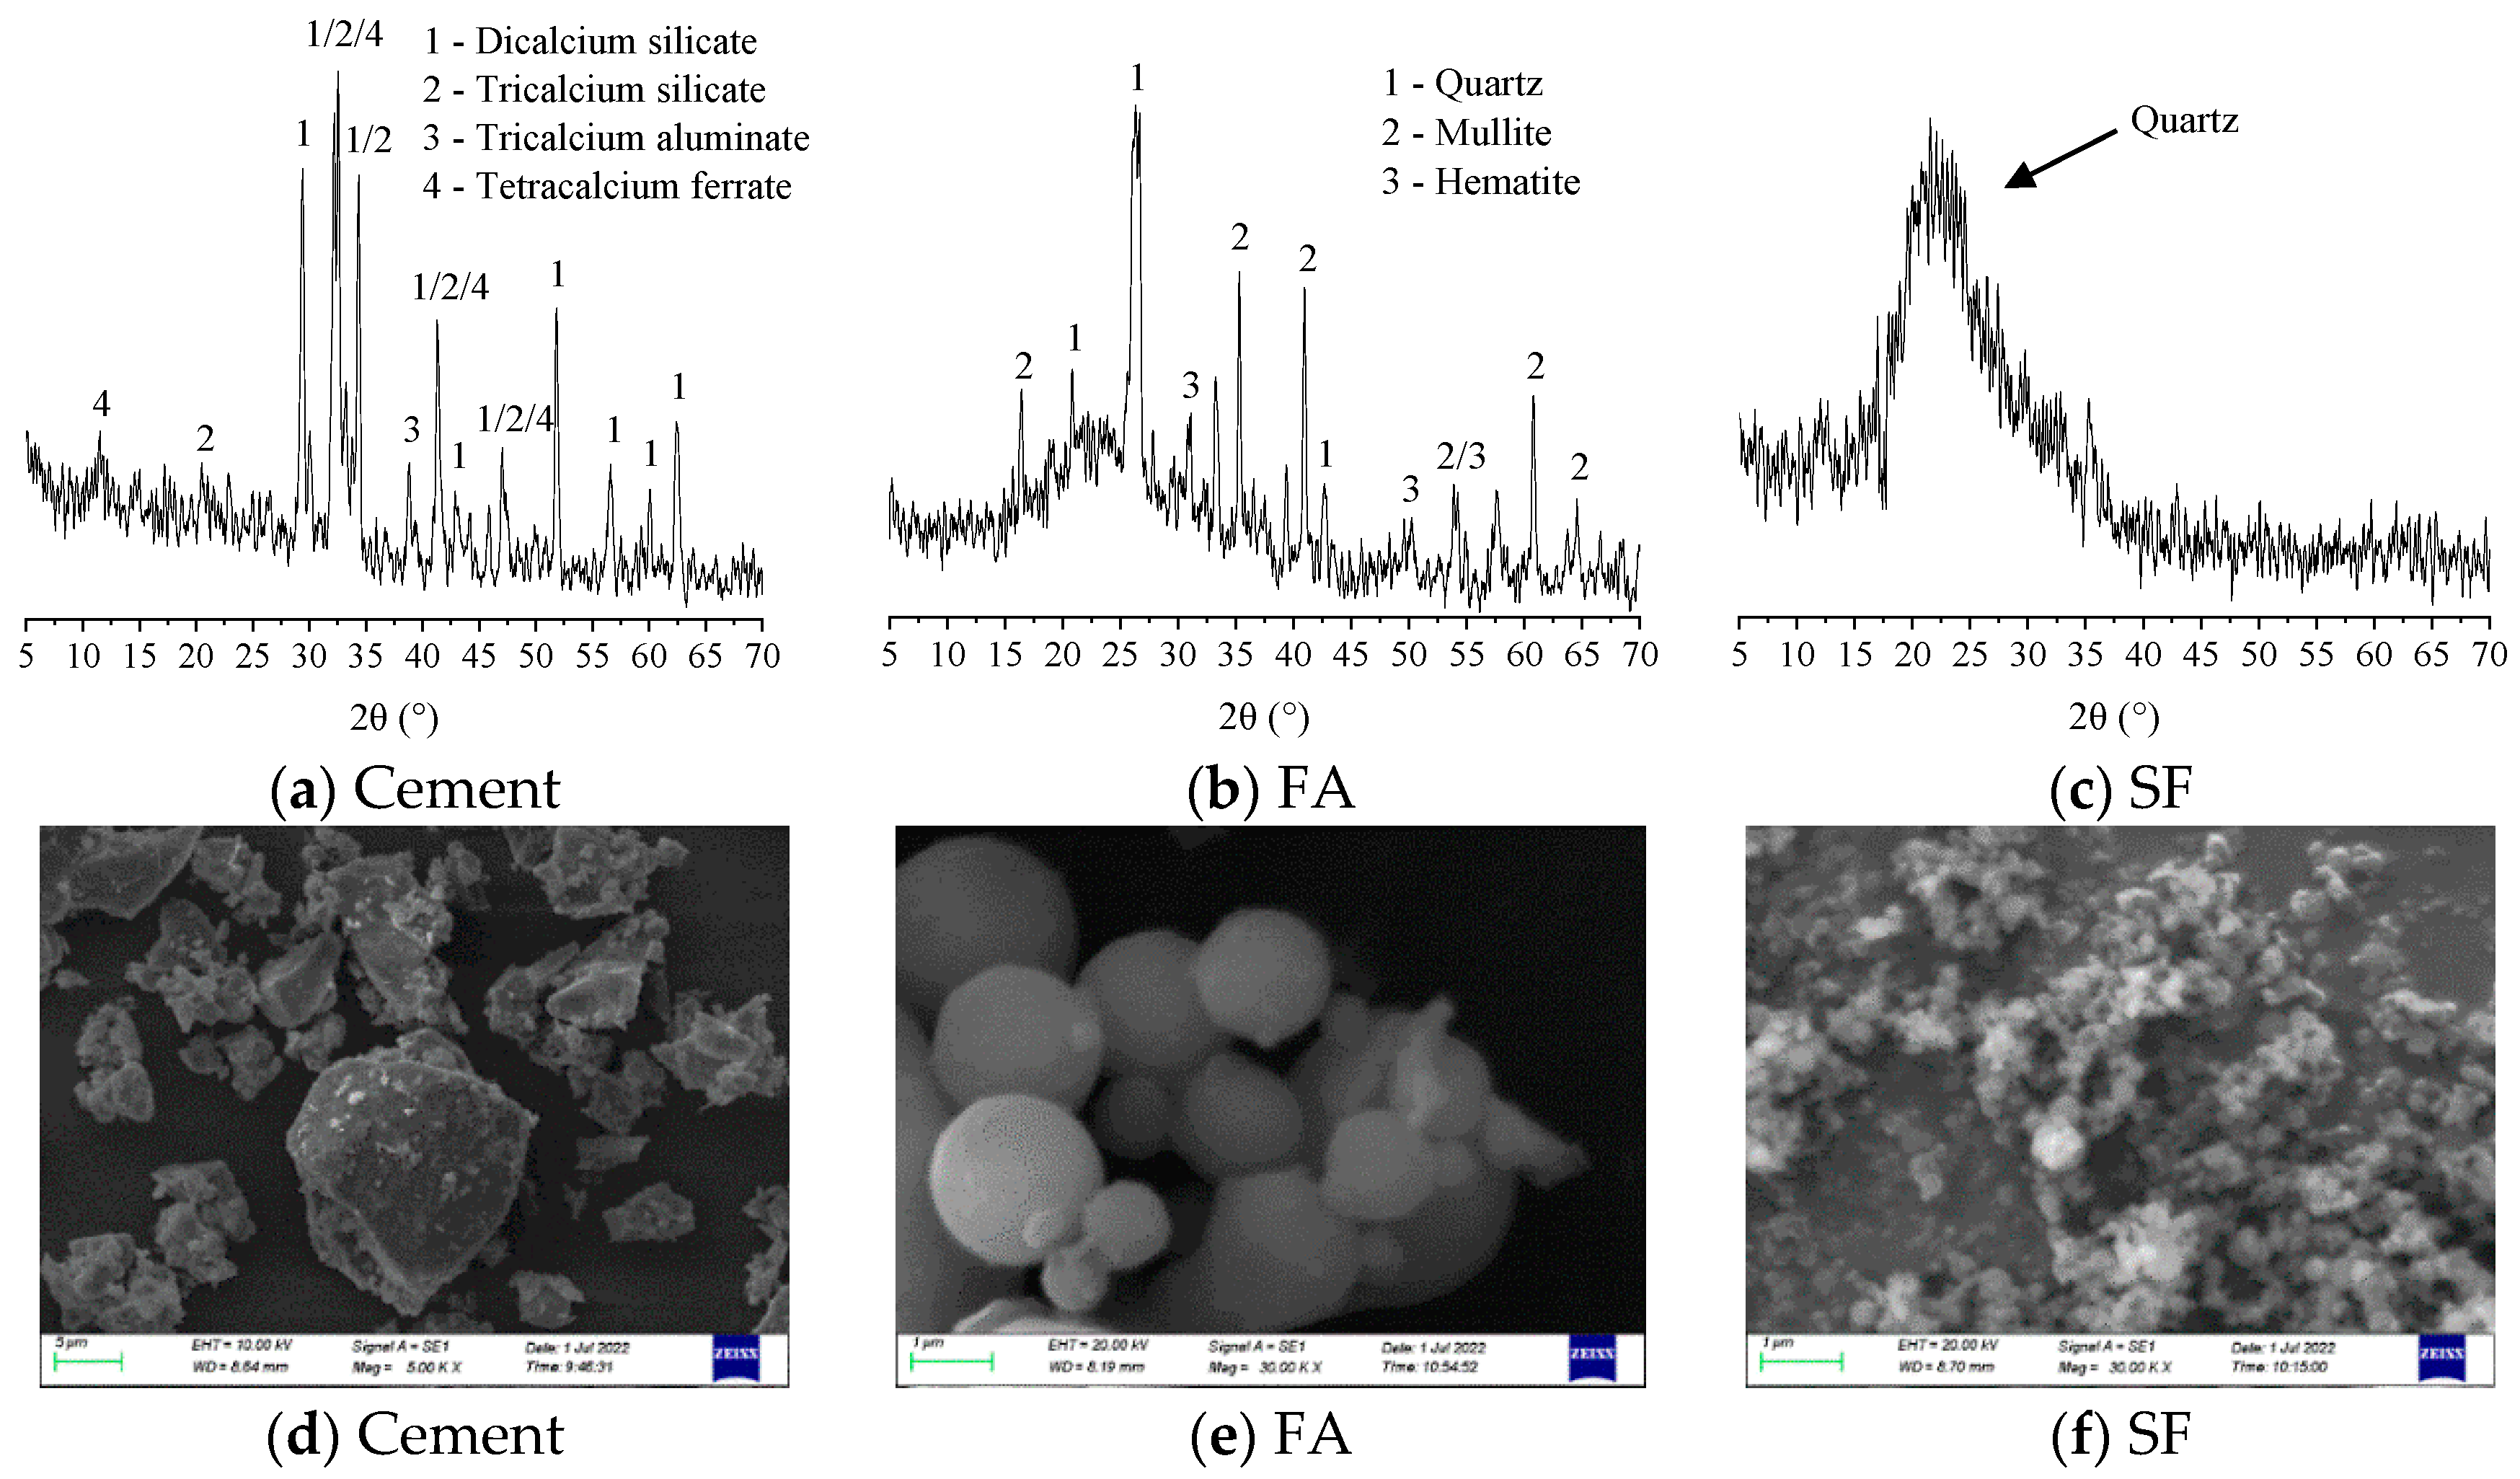
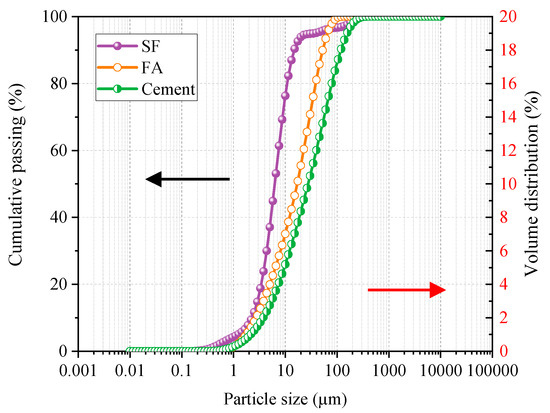
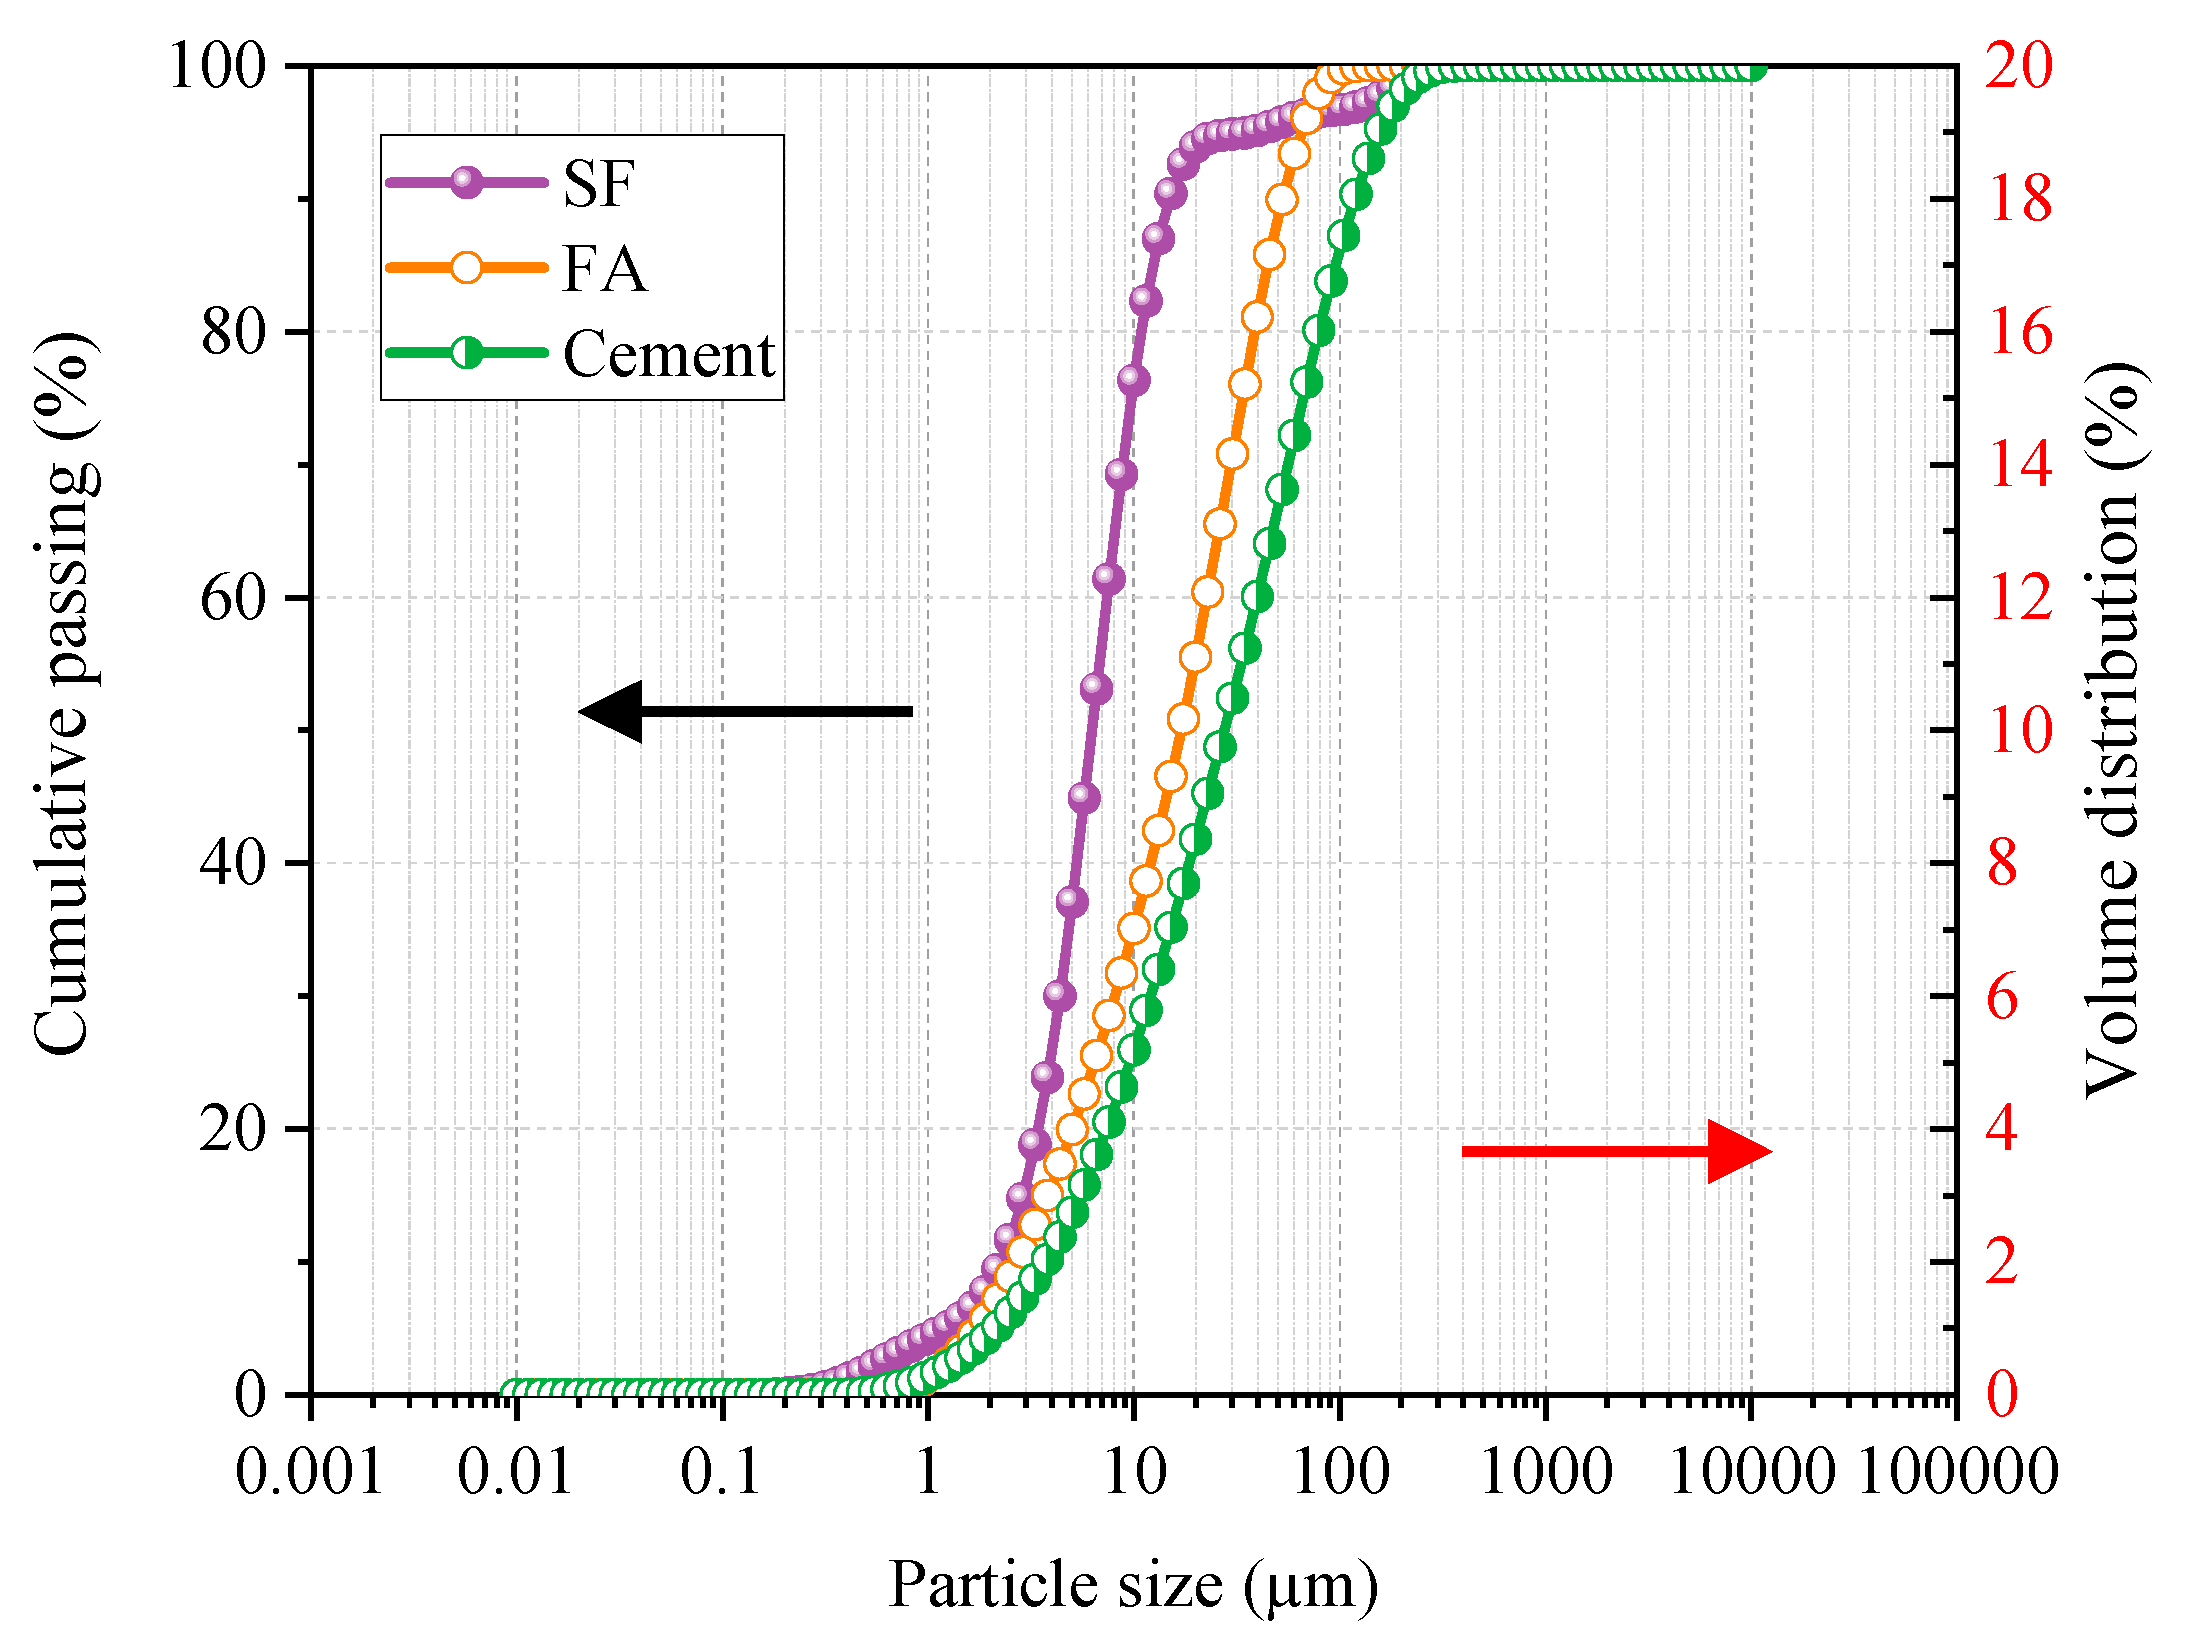
In this study, the cementitious materials used were a ternary cementitious system consisting of cement, fly ash (FA), and silica fume (SF). The cement selected is Shaanxi Qinling brand ordinary Portland cement with a strength grade of 42.5, which has good volume stability. FA is selected from Class F Grade I FA produced by Weihe Power Plant. SF is sourced from Shaanxi Xi’an Linyuan Microsilica Powder Factory. The chemical composition of the cementitious material is shown in Table 1. The physical properties of cement and FA are shown in Table 2 and Table 3. The mineral composition and appearance of the ternary cementitious material are shown in Figure 1. It can be seen that the cement particles are irregular and have sharp edges. The various indicators of the cement were tested in accordance with the national standard GB/T 1346-2011 [25]; most of the FA and SF particles were regular spherical bodies. The particle size distribution curve of the ternary cementitious material is shown in Figure 2. The particle size of FA and SF fine powder is mostly 10~100 μm. Compared with the two, most of the particles of SF are between 1~10 μm (72.18%). The content of fine powder less than 1 μm accounts for 4.14%, and the content of fine powder greater than 10 μm is 23.68%. The chemical composition of SF shows that the SiO2 content reaches 92.25%, which is much higher than that of cement and FA. This is also fully confirmed by its mineral composition chart.
Table 1.
Chemical composition of cementitious materials (%).
Table 2.
Physical and mechanical properties of cement.
Table 3.
Physical properties of fly ash (%).
Figure 1.
Mineral composition and appearance of ternary composite cementitious system.
Figure 2.
Particle size distribution of ternary composite cementitious material.
2.1.2. Aggregate
The river sand (RS) used in this study was sourced from the middle reaches of the Bahe River in Shaanxi Province. Molybdenum tailings sand comes from the mining field in Shimen Town, Luonan County, Shangluo City, Shaanxi Province. The coarse aggregate comes from crushed stone from the Wei River in Shaanxi Province, with a particle size range of 5~20 mm and good gradation. MTs have a wide particle size distribution range, from cement to fine sand. They also have a high micro-powder content of up to 35%. The main physical performance indicators of the three are shown in Table 4. The chemical composition of RS and molybdenum tailings sand is similar, with slight differences in content, as shown in Table 5.
Table 4.
Physical properties of aggregates.
Table 5.
Chemical composition of RS and MT (%).
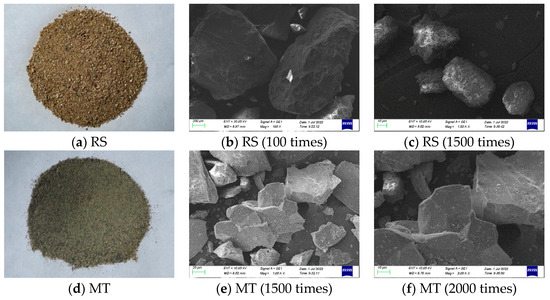
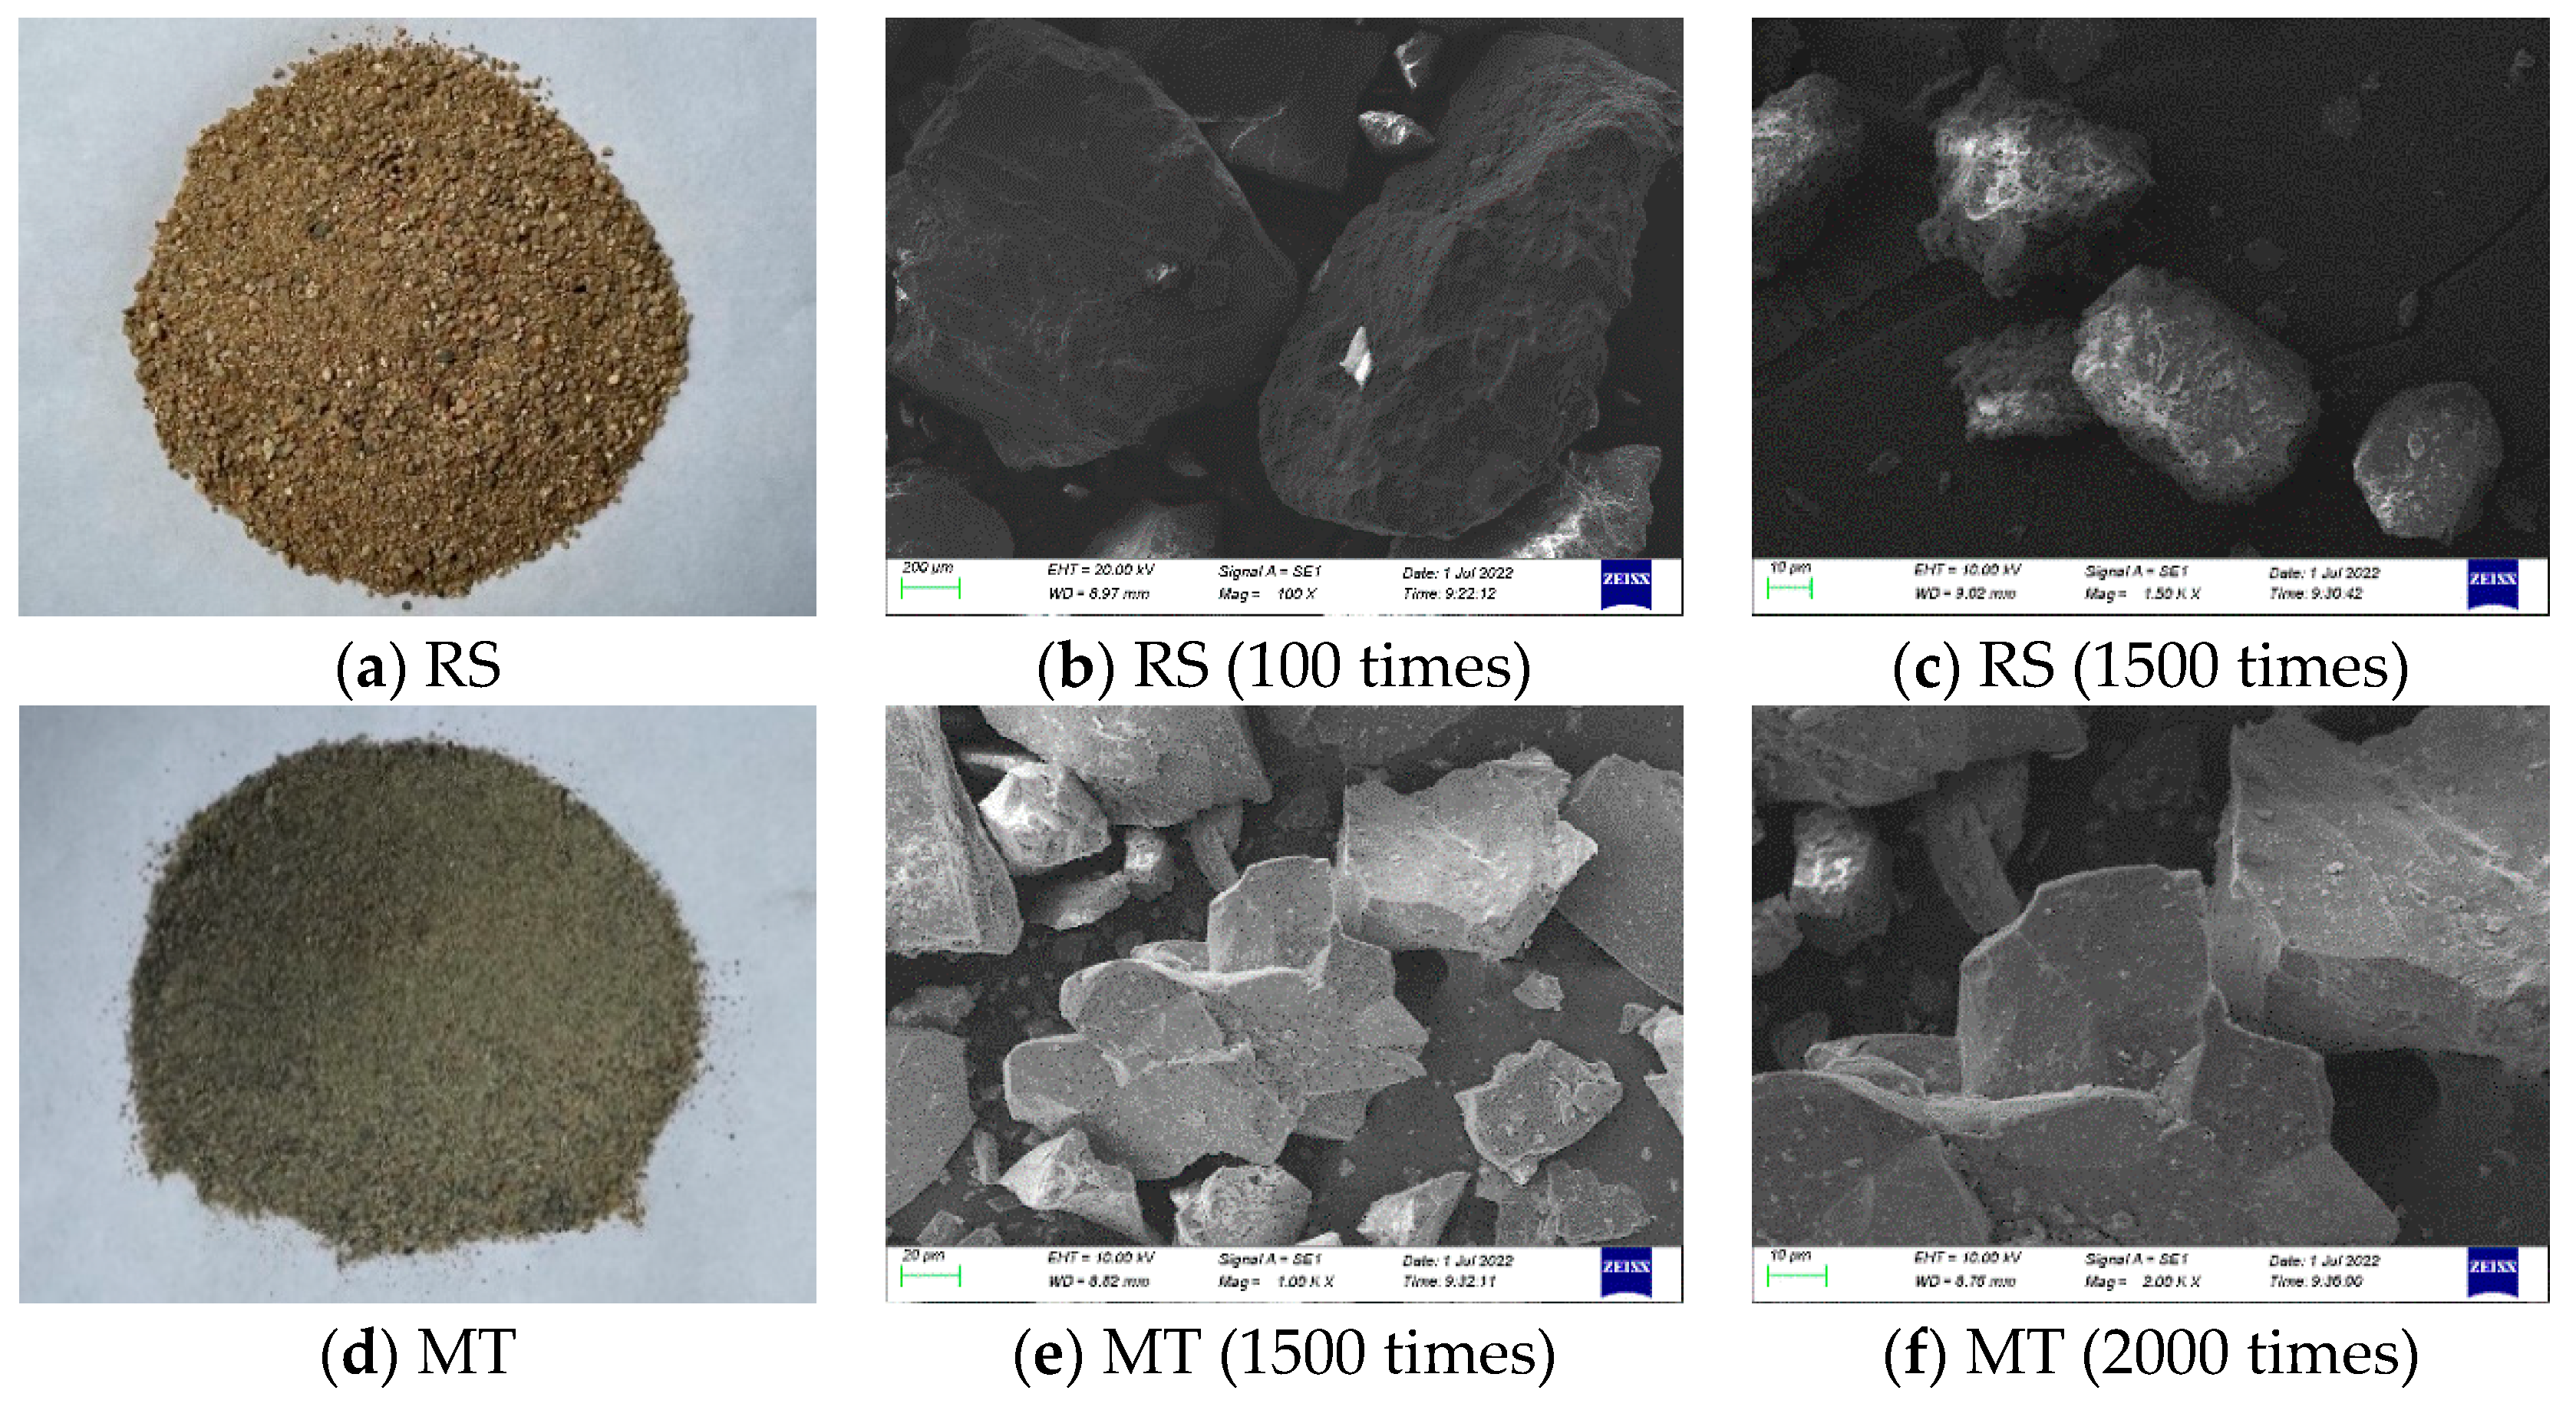
Figure 3 shows the appearance of RS and MTs. It can be seen that MTs are rougher than RS. When magnified a thousand times, RS particles are smooth and rounded, with a higher degree of fullness than MTs. MT particles have sharp edges and rough, uneven surfaces. The roundness coefficient is 0.38. Similarly, Liu et al. [26] observed under an optical microscope that MT particles had irregular shapes, with many uneven surfaces and good mechanical interlocking forces, which were conducive to enhancing the bond strength with cement slurry.
Figure 3.
Particle morphology of RS and MT.
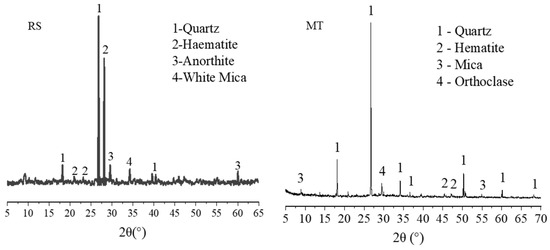
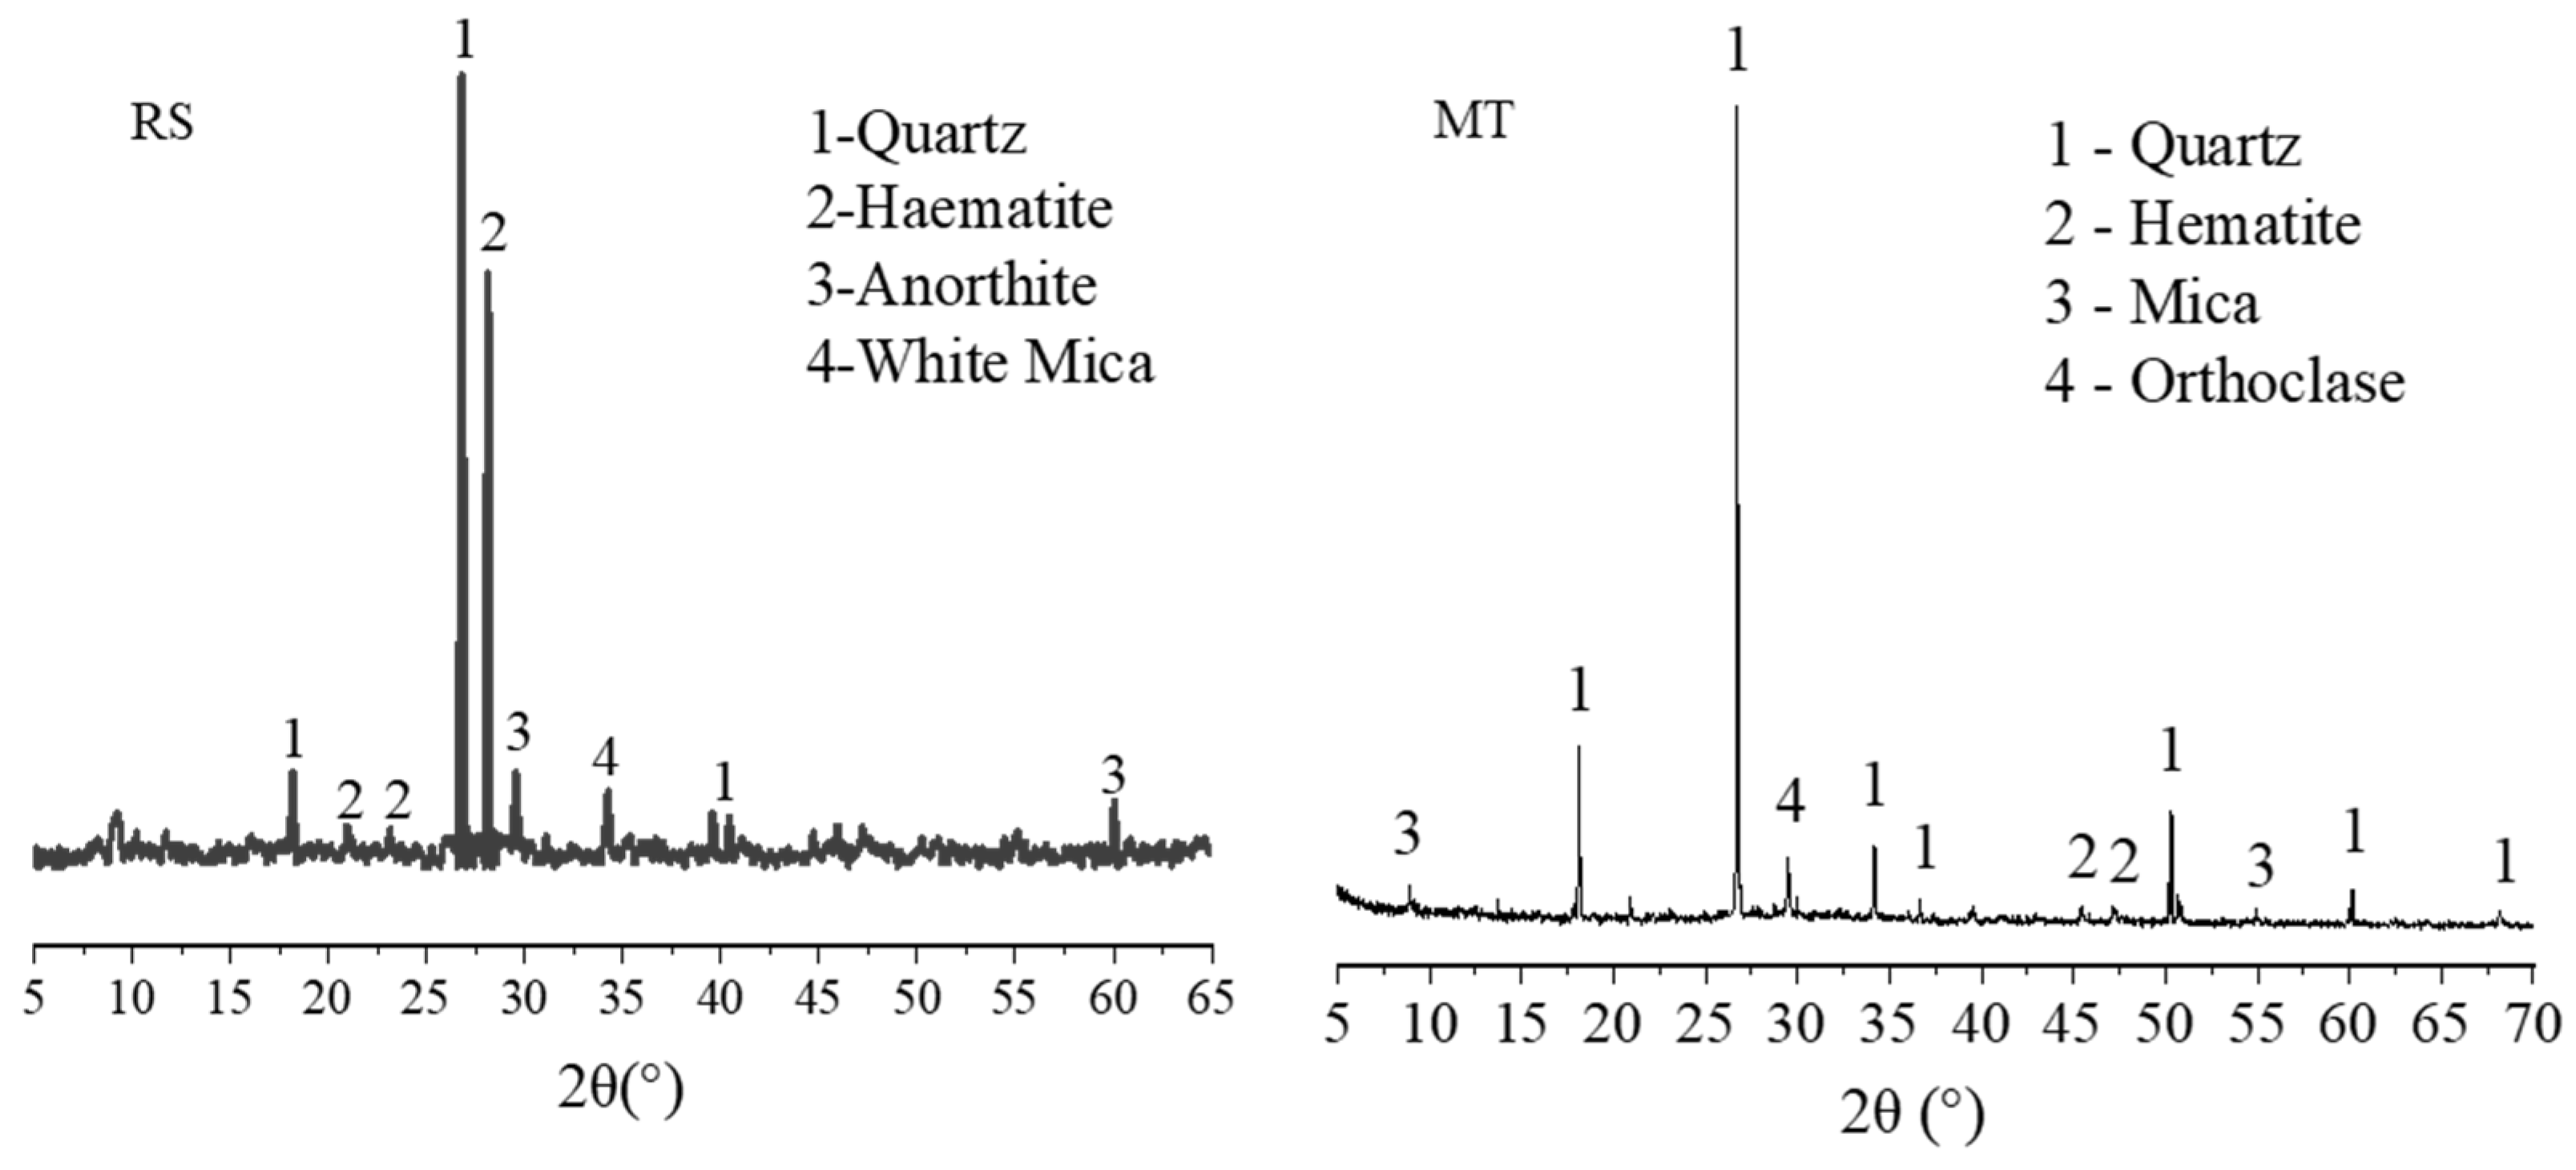
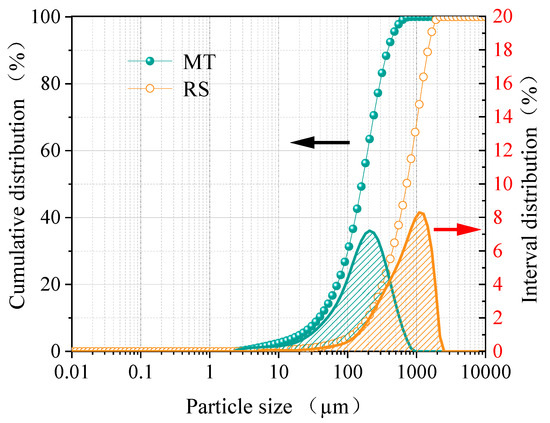
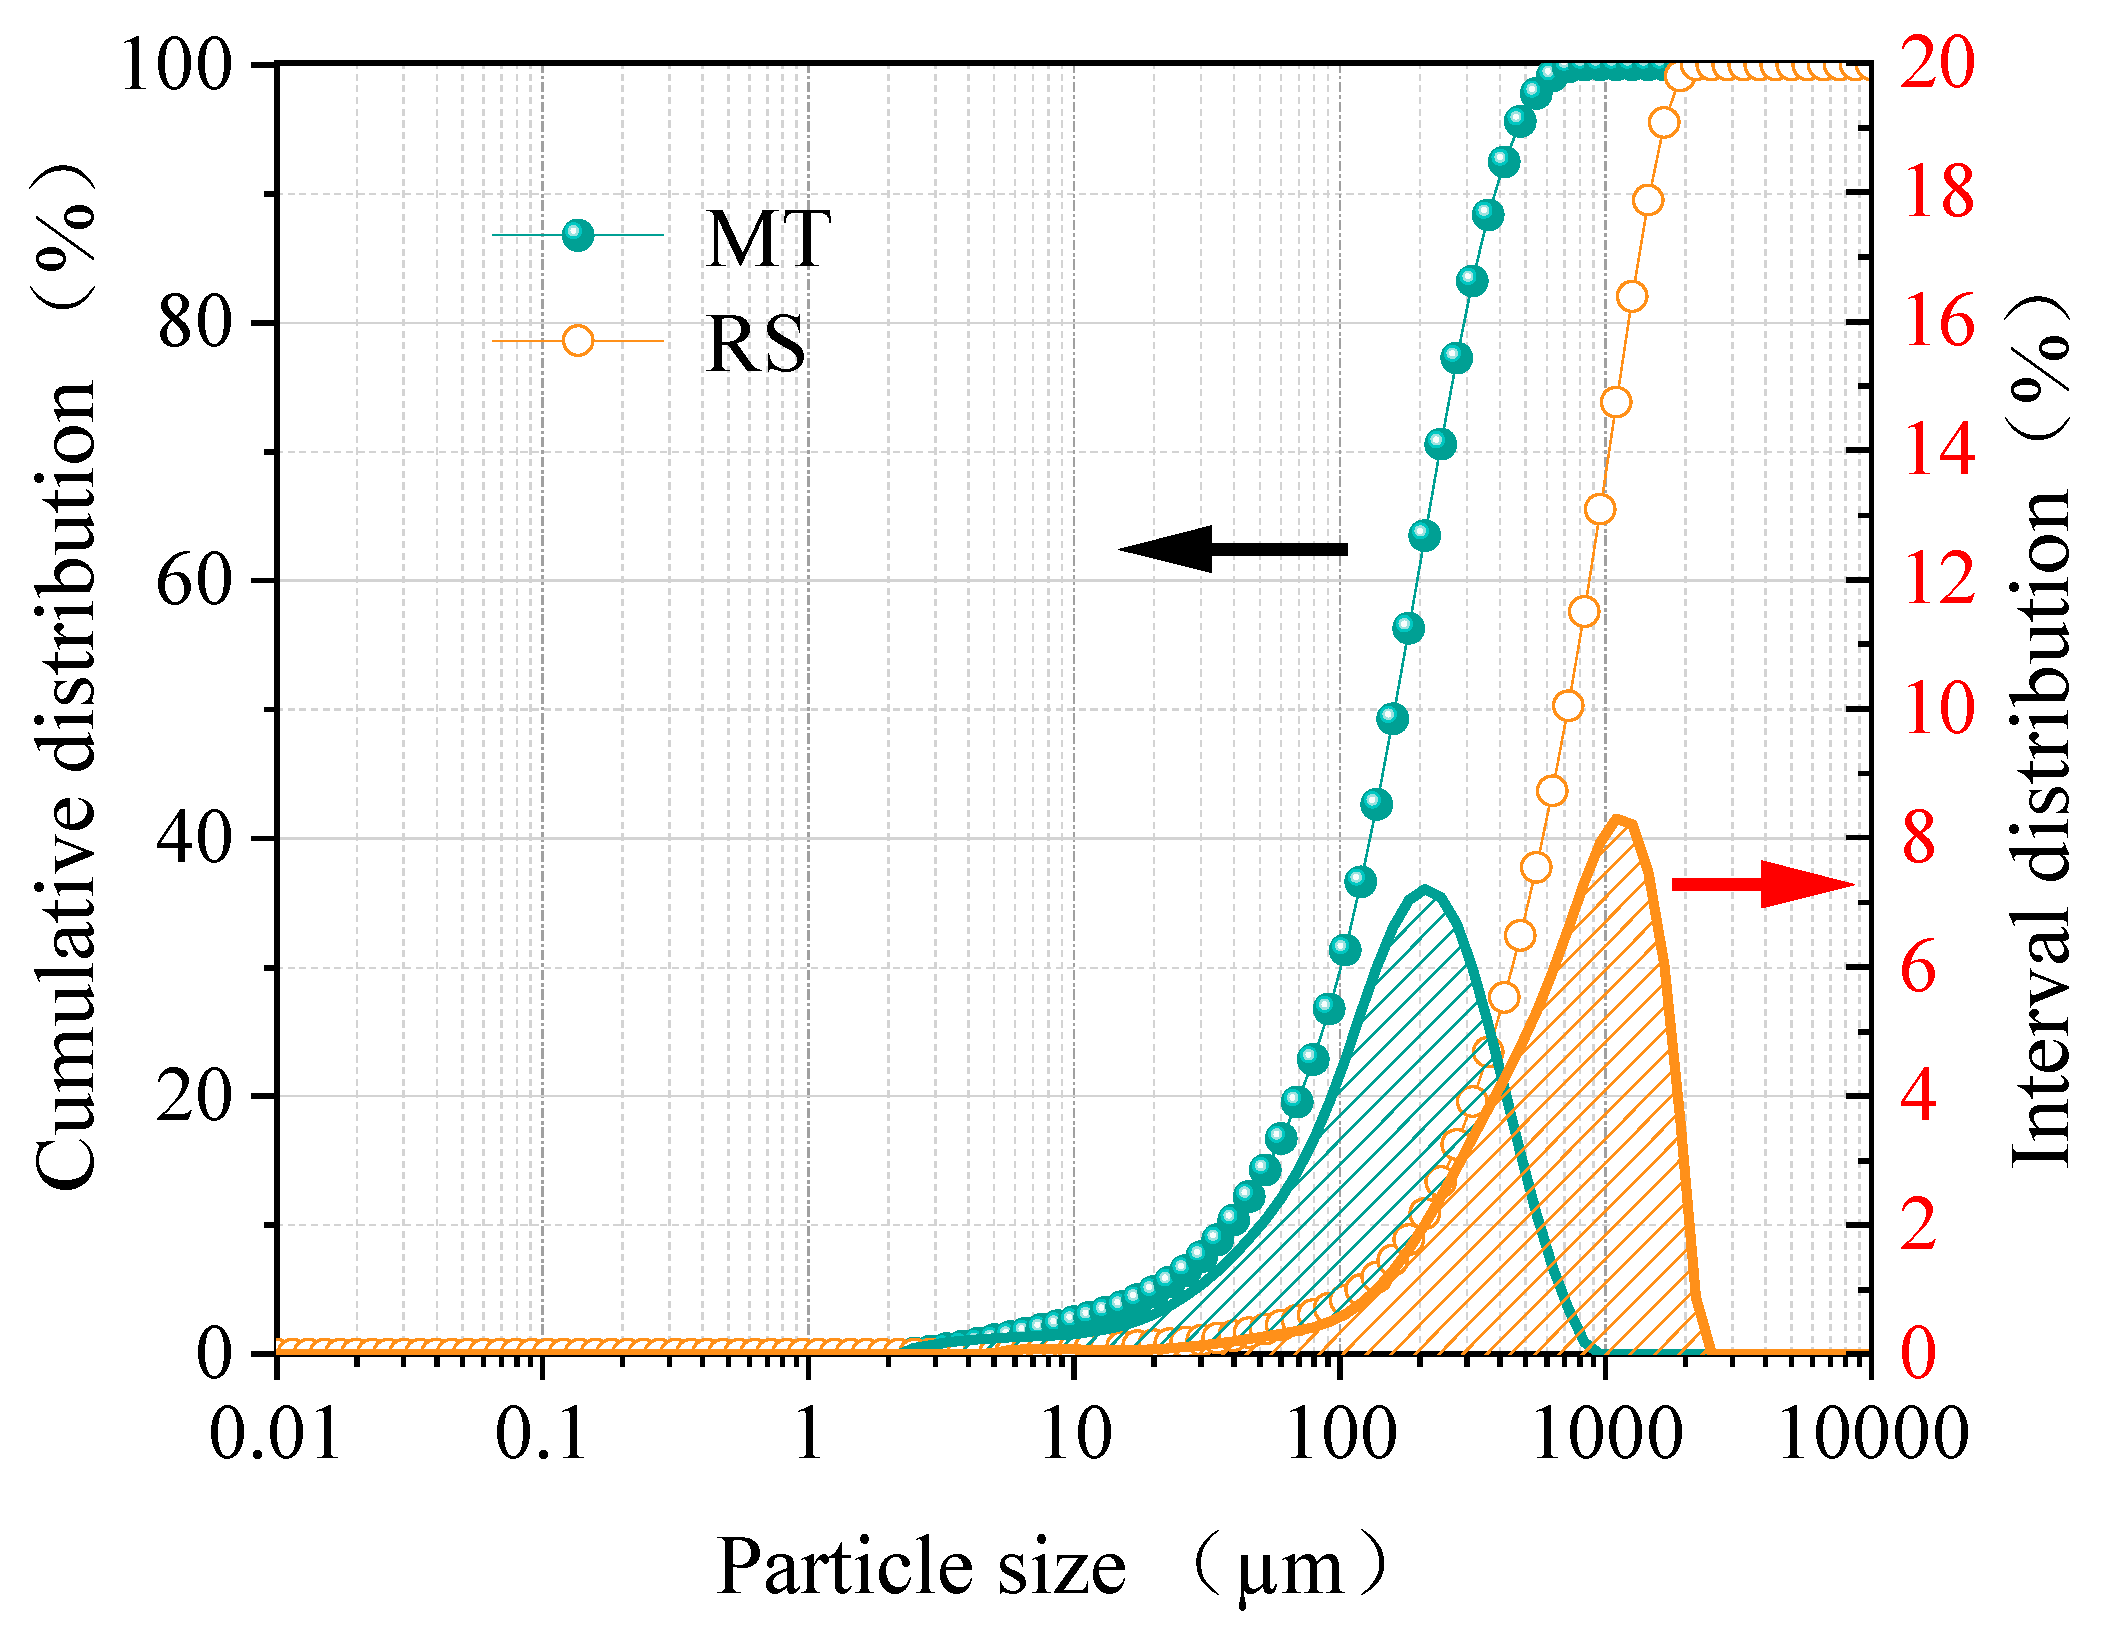
Figure 4 shows the X-ray diffraction patterns of RS and MTs. The main mineral components of MTs are similar to those of RS, with quartz as the main component and small amounts of pyrite, muscovite, and orthoclase. Most mineral components exist in the form of stable oxides, so their chemical activity is relatively stable. The particle size distribution curves of the two materials are shown in Figure 5. It can be seen that the MTs are finer than RS, with most of the particles in both falling within the 10~1000 μm range, accounting for 97.48% and 65.19%, respectively. The content of particles smaller than 10 μm is 2.52% and 0.33% respectively, while the content of particles larger than 1000 μm is 0% and 34.48%, respectively.
Figure 4.
Mineral composition of RS and MTs.
Figure 5.
Particle size distribution of RS and MTs.
Radionuclides in MTs should be evaluated before they are used as building materials. According to the limit standard of radionuclides in building materials [27], the specific activity of Ra226, Th232, and K40 in the material shall not exceed the limits according to different usage conditions. The internal exposure index IRa and external exposure index Iγ should meet the following requirements:
IRa = CRa/200 ≤ 1.0
Iγ = CRa/370 + CTh/260 + Ck/4200 ≤ 1.0
In the formula, CRa, CT, and CK are the specific activities of Ra226, Th232, and K40 in MTs, respectively.
Table 6 shows the evaluation of radioactive nuclides in MTs in Zhejiang Province and Shaanxi Province. It can be seen that the internal exposure index IRa and external exposure index Iγ of MTs both meet the requirements for use as structural materials. Due to the differences in the above chemical compositions, the radioactive nuclide indicators of MTs also vary depending on the mineral resources.
Table 6.
Assessment of radioactive nuclides in MTs.
2.2. Test Procedure
Mix Proportion Design of MTC
According to the design method of the “Technical Specification for Application of High Performance Concrete” (CECS 207: 2006) [30], the design grade of concrete strength is C50. In this study, FA and SF were added to enhance the performance of MTC. According to technical specifications, the FA content should not exceed 30% and the SF content should not exceed 10%. On this basis, referring to the relevant literature research [31], the proportion of the ternary composite cementitious system is cement:FA:SF = 7:2:1. The effects of different substitution rates of MTs (0%, 20%, 40%, 60%, 80% and 100%) on the properties of concrete were studied. Before mixing, river sand and MTs were dried to a constant weight to control the initial moisture content of the aggregate. The content of each admixture is calculated according to different substitution rates, and the proportion is adjusted appropriately through an on-site trial. Finally, the water–cement ratio is set to 0.30, and the sand ratio is 0.33. The mix ratio of MTC is shown in Table 7.
Table 7.
MTC mix proportion (kg/m3).
2.3. Test Method
2.3.1. Carbonation Test
- (1)
- Carbonation test method
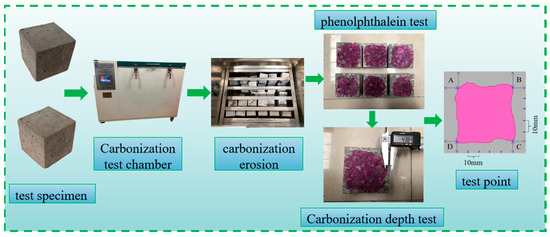
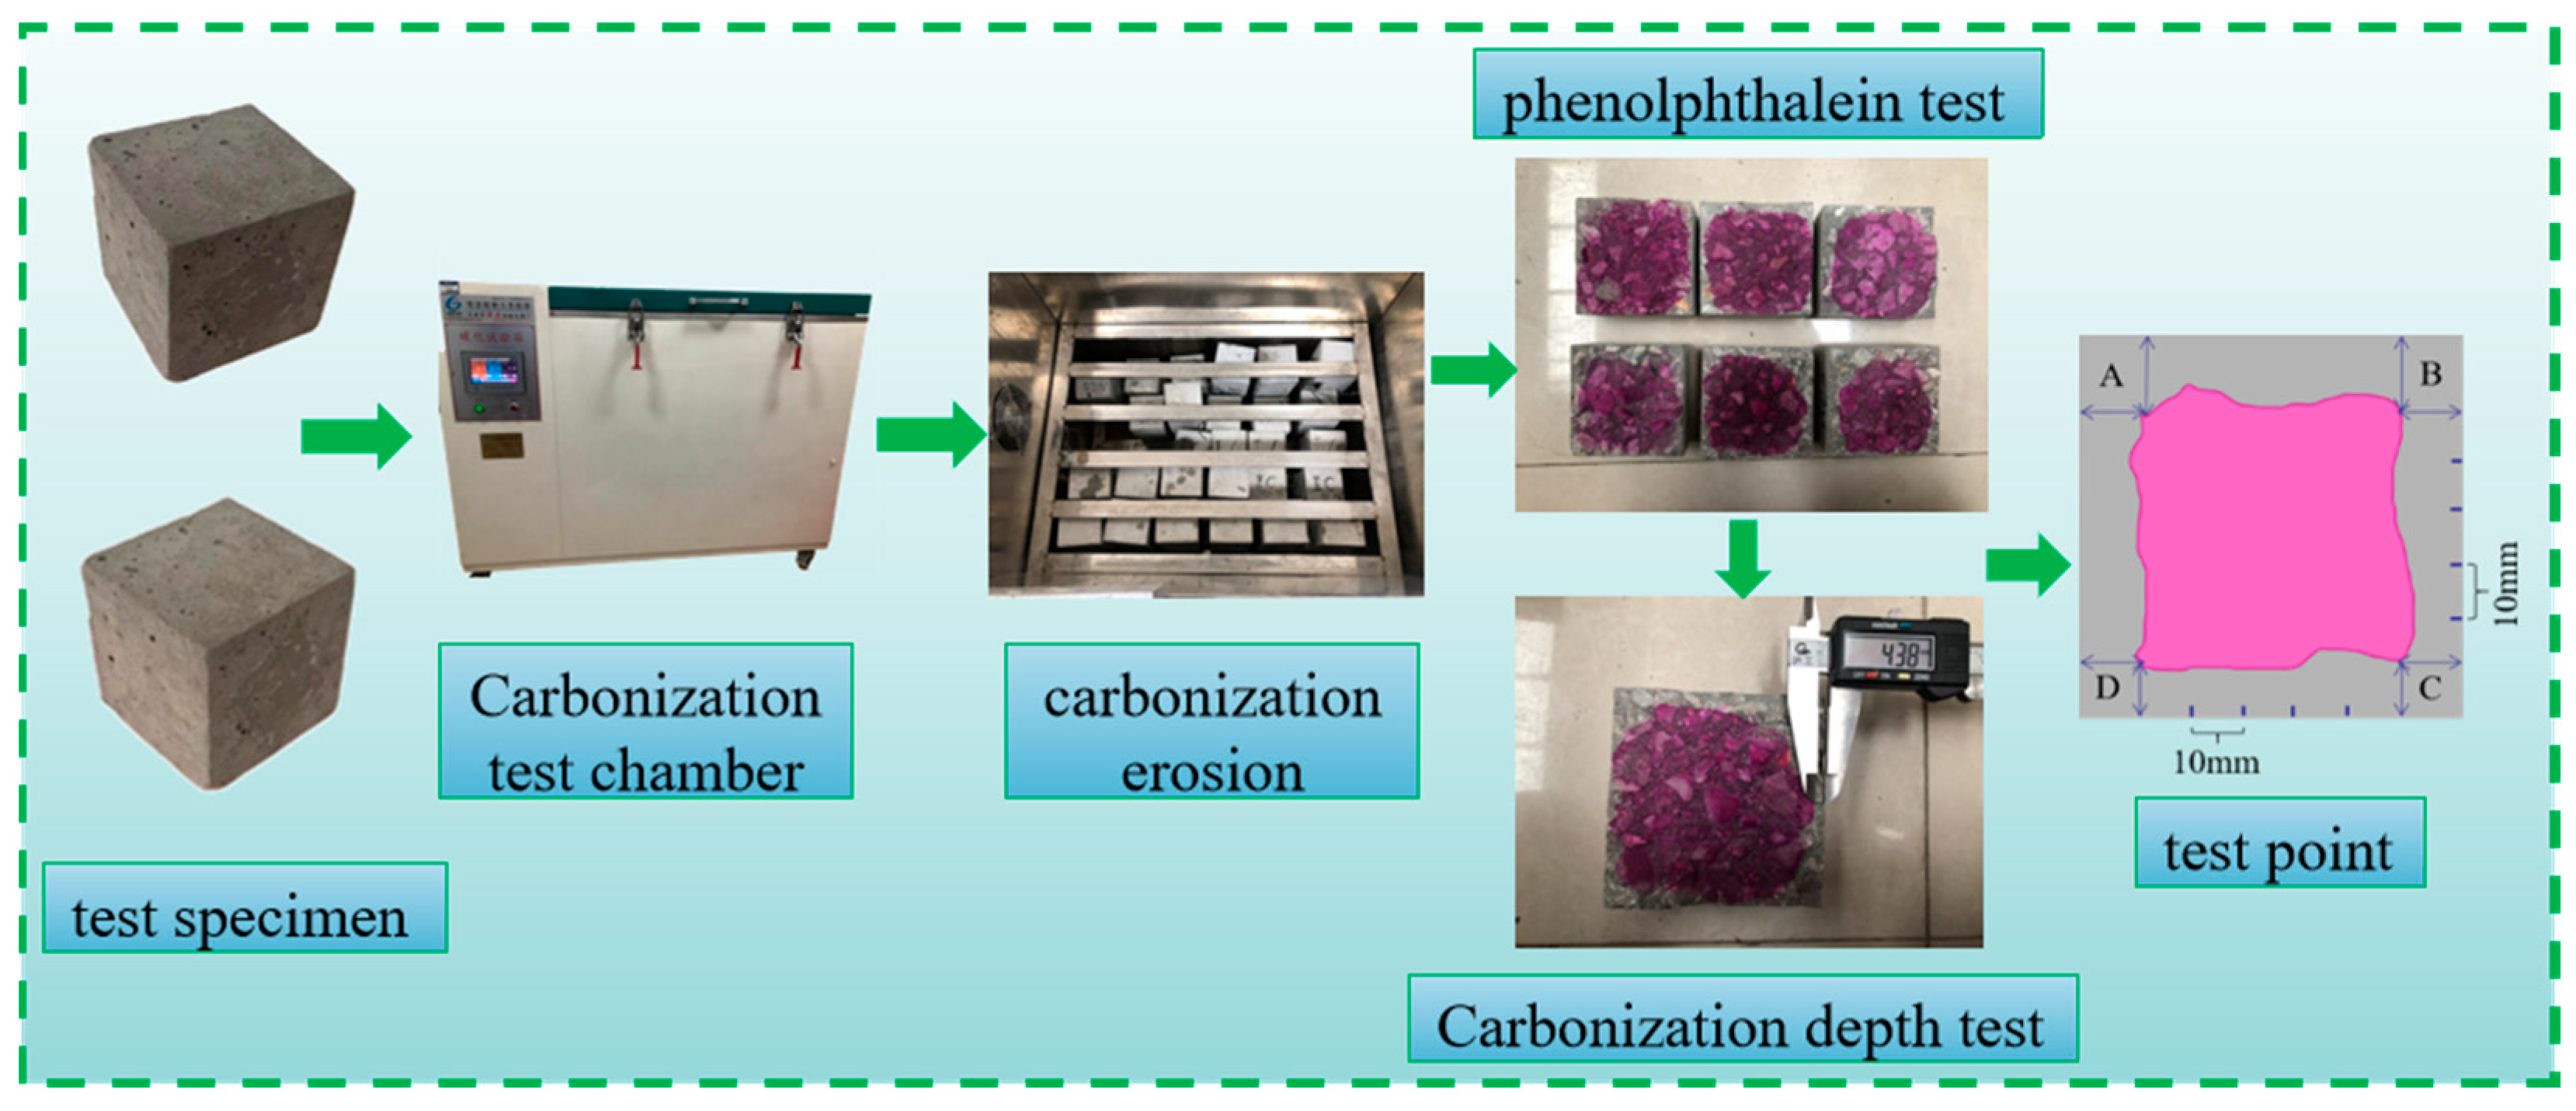
Concrete carbonation testing is based on “the relevant provisions of the Standard Test Methods for Long-Term Performance and Durability of Ordinary Concrete” (GB/T 50082-2009) [32]. Before the test begins, concrete specimens are first placed in a drying oven at 60 ± 2 °C and dried for 48 h. Afterward, the specimens are placed on the specimen rack of the concrete carbonation chamber at intervals of 50 mm. The carbonation chamber should comply with the current industry standard “Concrete Carbonation Test Chamber” (JG/T 247-2009) [33], as shown in Figure 6. The temperature inside the control chamber should be maintained at 20 ± 3 °C, the relative humidity at 70 ± 5%, and the carbon dioxide concentration at 20 ± 3% [34,35].
Figure 6.
Carbonation test and carbonation depth test of MTS.
- (2)
- Carbonation depth test procedure
After carbonation for 7 days, 14 days, 28 days, and 56 days, the concrete specimens were removed for mechanical property testing and carbonation depth measurement. When the carbonation depth is measured, the residual powder of the concrete section is cleaned, 1% phenolphthalein solution is sprayed on the surface of the split surface, and the chemical principle of phenolphthalein solution turning red in alkali is used for measurement. A pink color on the split surface indicates that the part has not been carbonized, while a part that has not changed color indicates that it has been carbonized. After air drying for 60 s, the cross-section was marked at intervals of 10 mm to indicate measurement points. The carbonization depth at each measurement point was measured using a vernier caliper, with results accurate to 0.01 mm, as shown in Figure 6. When the selected measurement point is located exactly at the position of coarse aggregate, the average carbonization depth on both sides of the measurement point is taken as the carbonation depth of that measurement point. The average carbonization depth of all test points is the carbonization depth of the sample. The average carbonization depth of the three specimens is calculated as the carbonization depth of the mix ratio. Equation (3) is shown below:
where D is the average carbonation depth, mm; N is the total number of measuring points; i is the i-th measuring point; and di is the carbonization depth of the i-th measuring point, mm.
2.3.2. Macro Mechanical Properties Test
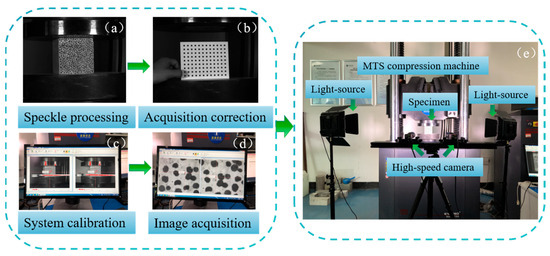
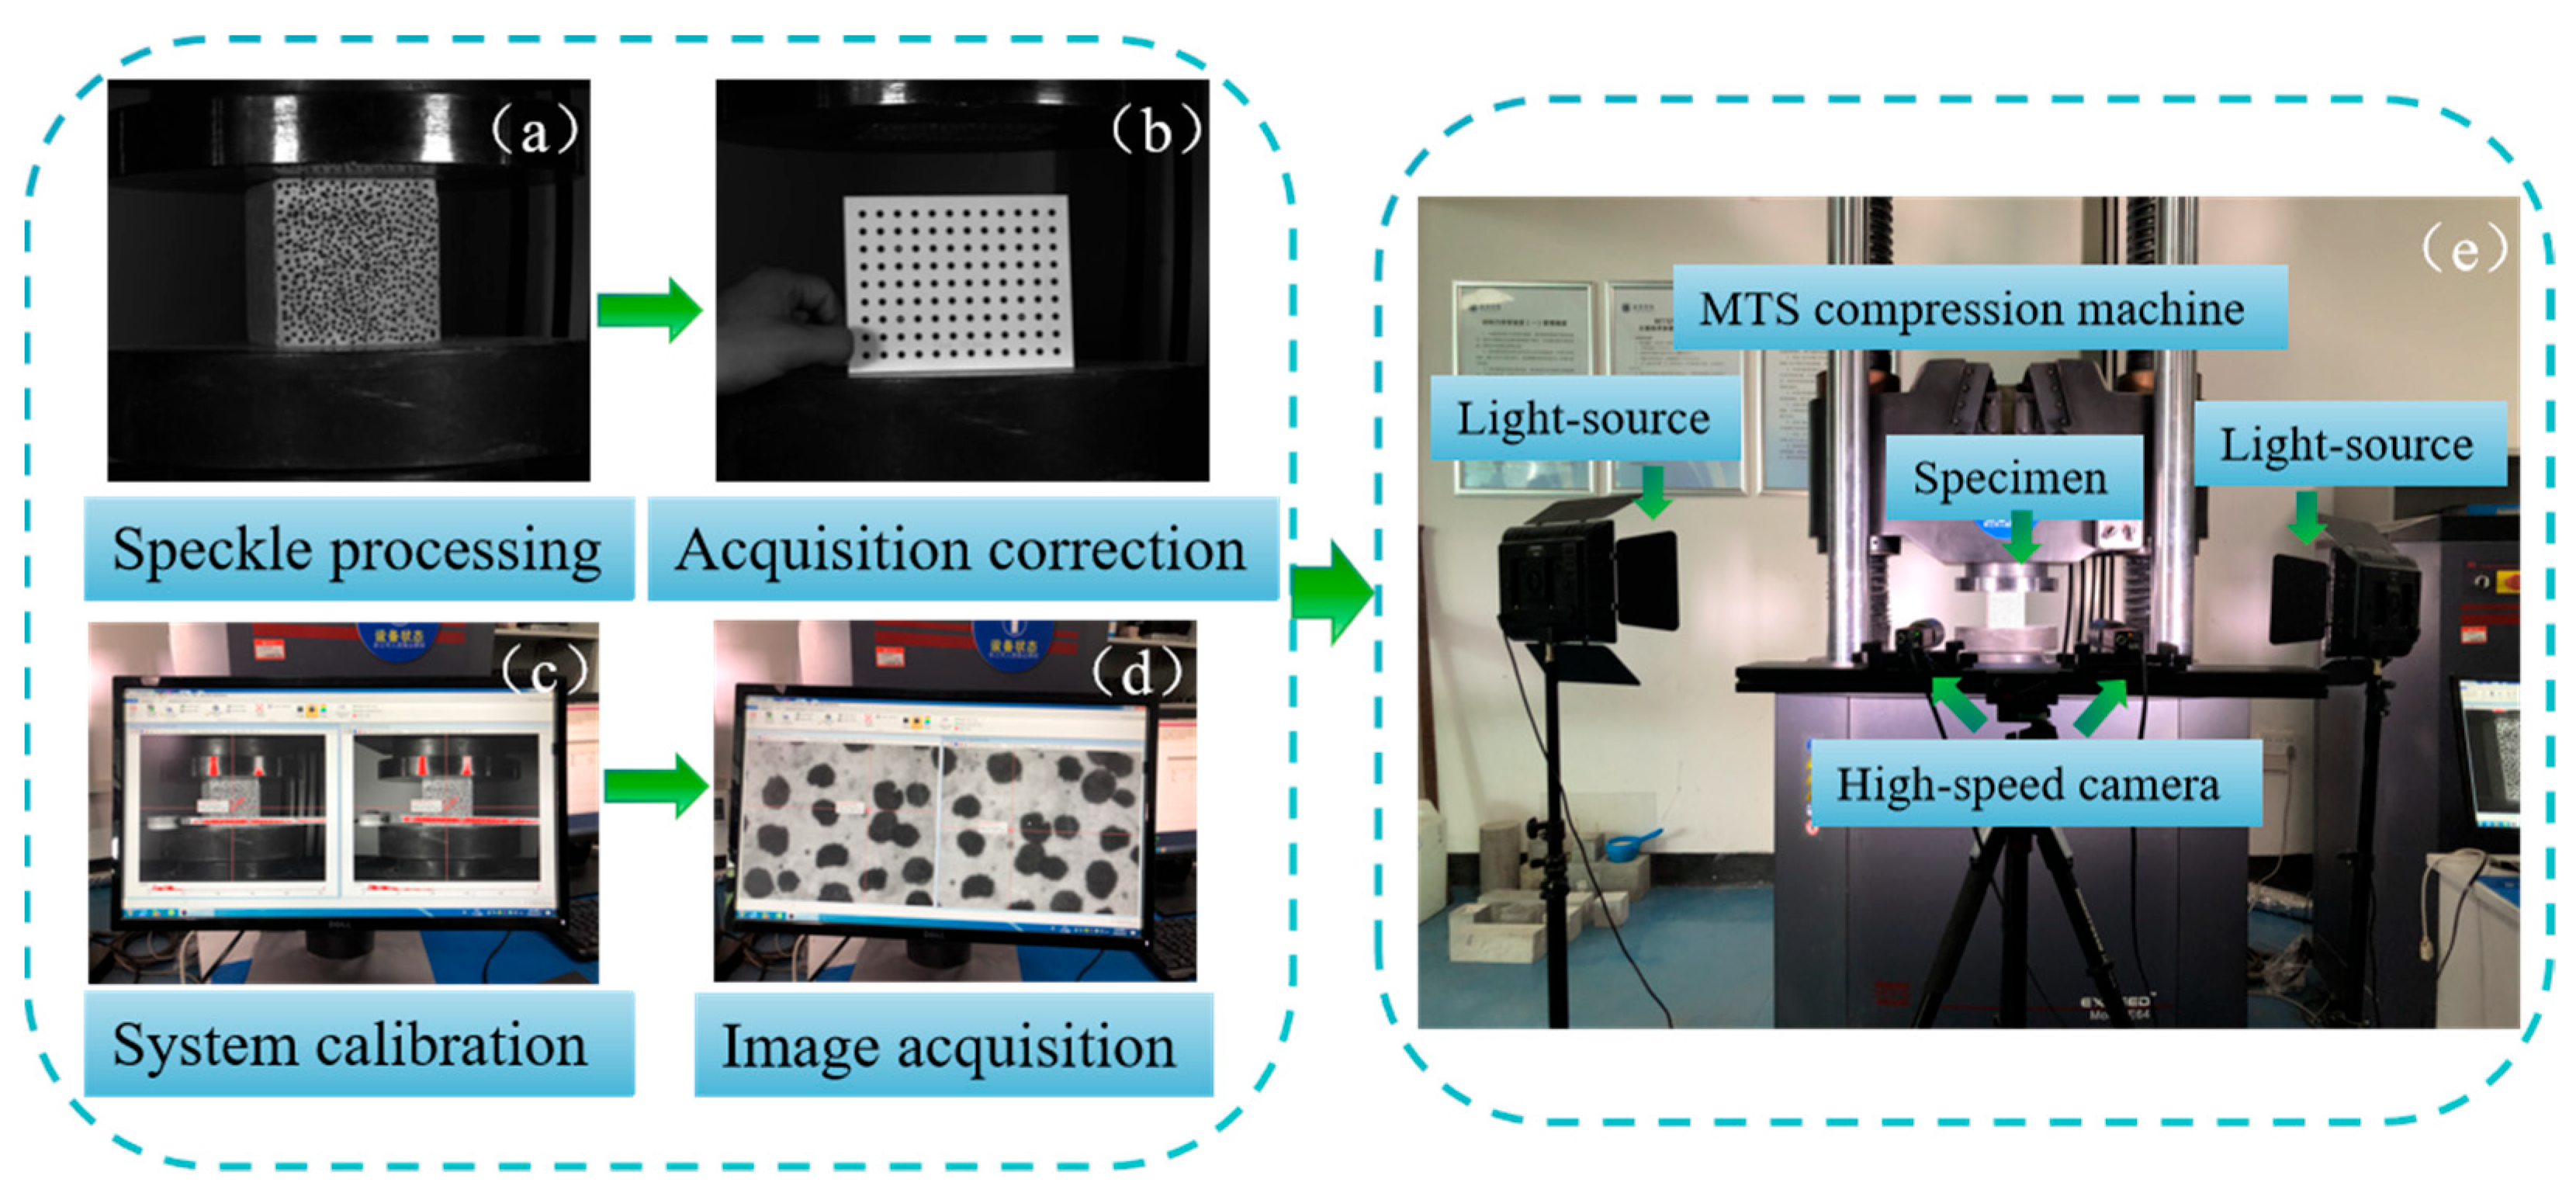
The mechanical properties of MTS were tested using an MTS-2000kN microcomputer-controlled electro-hydraulic servo universal pressure testing machine (MTS Systems (China) Co., Ltd., Shanghai, China). To study the effect of carbonation on the mechanical properties of MTC, this study combined the digital image correlation (DIC) method with the real-time non-contact measurement of full-field displacement and strain. The DIC system includes a low-speed CCD camera (Basler AG, Ahrensburg, Germany), light source, and Match ID non-contact strain operating system. The test system is shown in Figure 7.
Figure 7.
DIC system.
A CCD camera is used to collect digital information of the whole process of surface crack change in MTC. Based on the Match ID system, the digital information collected by the CCD is combined with DIC technology and the virtual field method to extract the deformation information of the speckle field randomly distributed on the surface of the test block. The displacement field u and strain field Exx in the horizontal direction of molybdenum tailings concrete and the displacement field v and strain field Exy in the vertical direction are obtained. The variation law of the displacement field and strain field of MTC and the change in surface crack during compression are further analyzed. Three parallel samples were set up for the characterization of strain field distribution. In order to control the length, representative strain cloud images were selected for qualitative analysis.
Artificial random distribution speckle treatment was performed on concrete samples before the compression test (Figure 7a). Then, the position of the CCD camera on the rigid support was adjusted so that it was aligned with the loaded sample. Then, the aperture, light source and focus were adjusted so that the computer could clearly display the sample photos. A CCD camera and Match ID system are used to collect information from calibration plates at different positions to ensure that all speckles during the sample loading process can be collected (Figure 7b–d). The Match ID non-contact strain measurement system synchronizes with the pressure testing machine to collect data, with a loading speed of 0.01 mm/min and images collected every 200 ms. The data collection process is shown in Figure 7.
2.3.3. CT Scanning and Image Reconstruction
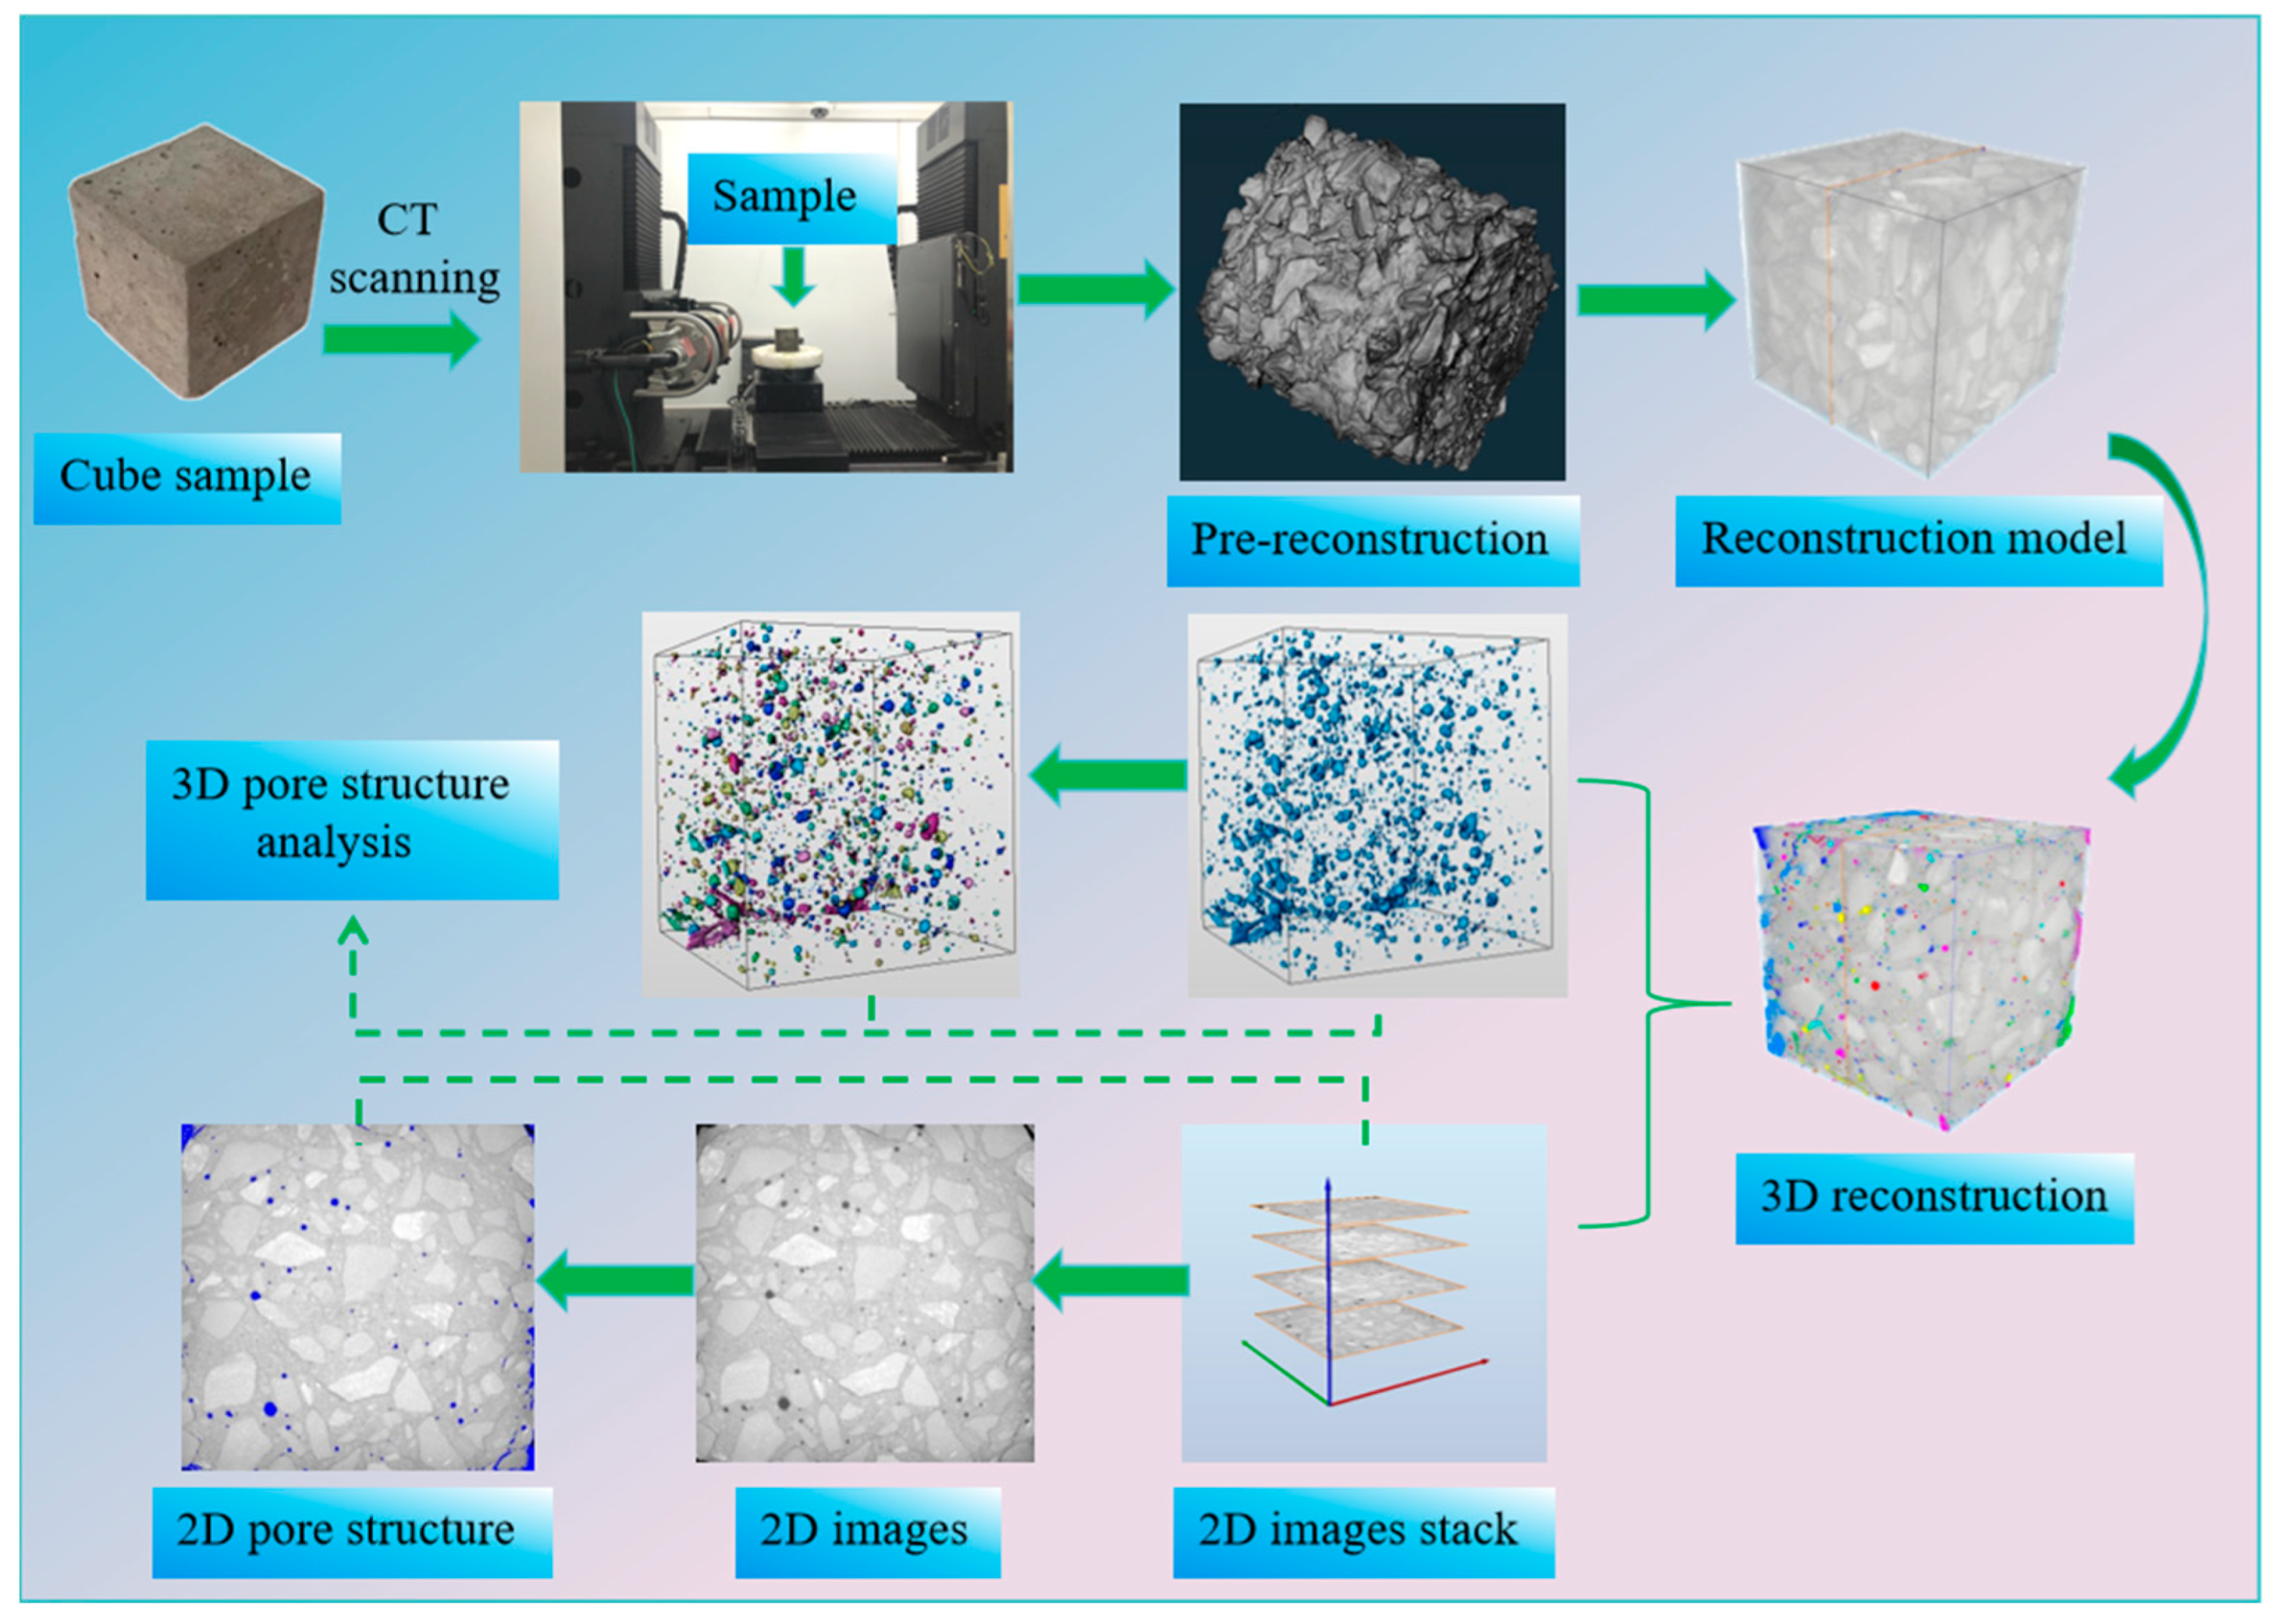
The pore structure of MTC was determined by industrial CT (MS-Voxe1450) scanning. The scanning parameters are: voltage, 380 kV; current, 1.3 mA; exposure time, 0.5 s; number of image merges, 2; number of pixel merges, 1. The isotropic voxel size was 52 μm, and the nominal spatial resolution was equal to the voxel size. The FDK cone-beam filtered back-projection algorithm was used for reconstruction, and the Shepp–Logan filter was used for reconstruction filtering. The beam hardening correction and ring artifact suppression were uniformly turned on, and all samples maintained the same reconstruction parameters. Image processing and pore quantitative analysis were completed in Avizo. The region of interest (ROI) was selected to cover the entire 100 mm cube sample, that is, the whole volume of the sample was used to analyze the pore structure, and the sample was not cut, only the central area was intercepted. The ROI size and relative position of all samples remained uniform. The segmentation threshold strategy was as follows: based on the gray histogram inflection point method, the solid phase and pore segmentation threshold were preliminarily determined and several representative two-dimensional slices were selected to visually check the pore boundary; all samples were segmented by the same global fixed threshold, and the threshold was not adjusted separately for a single sample to reduce the artificially introduced inter-group differences. The processing rules of connected pores and closed pores were as follows: before the analysis of pore connectivity, all pores intersecting with the ROI boundary were excluded, and the pore volume classification statistics were not included; only the pores completely contained in the ROI were identified, which were further divided into isolated closed pores inside the ROI and connected pores inside the ROI. The edge effect control method was as follows: the buffer distance was reserved by inward contraction of the ROI, which weakened the partial volume effect and hardening artifacts of the sample surface.
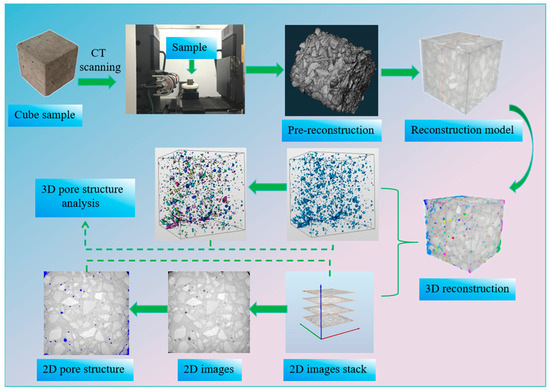
After the sample is fixed, it is rotated at a constant speed from 0 to 360° along the horizontal direction of the sample stage to generate X-ray attenuation projection images. This process is repeated until a full scan is completed, allowing the collection of data from 360°. All scanned data were first pre-reconstructed using the Voxel Studio Recon software (Version 2020) to obtain tomographic projection images, which were then further processed using the AVIZO software (Version 2021), as shown in Figure 8. Three parallel samples were set for CT scanning and post-processing characterization. In order to control the length, representative images were selected for qualitative analysis. First, two-dimensional reconstruction was performed: the porosity was calculated and the slices were analyzed, with the pore structure distribution directly observable through the slices. Then, 3D reconstruction was carried out, and boundary frames were added to generate 3D models. 3D pore analysis was then carried out. The pores were marked with different colors and divided into macropores ≥ 10 mm3, mesopores 1~10 mm3, small pores 0.1~1 mm3, and micropores ≤ 0.1 mm3 according to volume.
Figure 8.
Industrial CT scanning and data processing.
2.3.4. Microstructural Testing
The microstructures of the samples were analyzed using an S4800 field emission SEM to study the effect of the carbonation environment on the microstructure of MTC. Three parallel samples were set up for microscopic morphology characterization. In order to control the length, representative images were selected for qualitative analysis. The sample with coarse aggregates removed was adhered to the sample stage with conductive adhesive, sprayed with gold, and vacuum-treated before microscopic morphology observation. The electron energy was 15 kV, and the current was 0.8 mA.
For SEM observation, three viewing fields were randomly selected in the mortar matrix and interfacial transition zone of each specimen after avoiding obvious surface damage. The representative micrographs were selected from these viewing fields for qualitative morphological analysis. It should be noted that phase identification based on SEM micrographs is only a qualitative auxiliary judgment combined with typical morphologies reported in the literature and the carbonation/hydration conditions of this test. Without supporting EDS, XRD, or TGA results, SEM alone cannot provide the accurate and independent differentiation of CH, C-S-H, C-A-H, and CaCO3.
3. Results and Discussion
3.1. Workability
The slump is an important index to evaluate the working performance of concrete. Table 8 shows the slump values of concrete with different substitution rates of MTs. It can be seen that with the increase in MT substitution rate, the slump decreases. Because the water absorption rate of MTs (2.70%) is significantly higher than that of river sand (0.93%), and the fine particle content of tailings is higher, under the condition of fixed total mixing water consumption and the constant dosage of water reducer in this experiment, with the increase in the proportion of tailings replacing river sand, the amount of water adsorbed on the surface and inside of the aggregate increases, the free water participating in cement hydration in the system decreases, and the actual effective water–binder ratio shows a downward trend. Therefore, the slump decreases with the decrease in the effective water–binder ratio.
Table 8.
The slump of MTC.
On the one hand, higher MT water absorption will consume free water in the slurry, reduce the fluidity of the slurry, and cause the slump of the concrete to decrease with the increase in the tailings replacement rate. The large specific surface area of fine particles will further increase the water demand and aggravate the deterioration of working performance. On the other hand, the decrease in the effective water-binder ratio is not conducive to the occurrence of the cement hydration reactions and reduces the mechanical strength.
3.2. Carbonation Depth
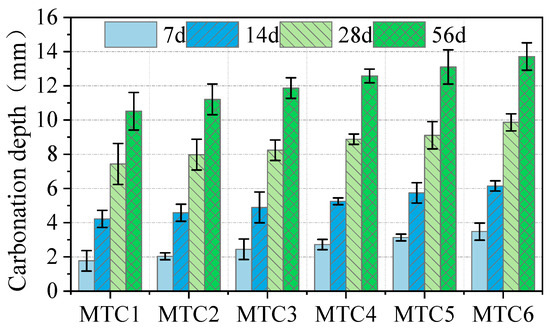
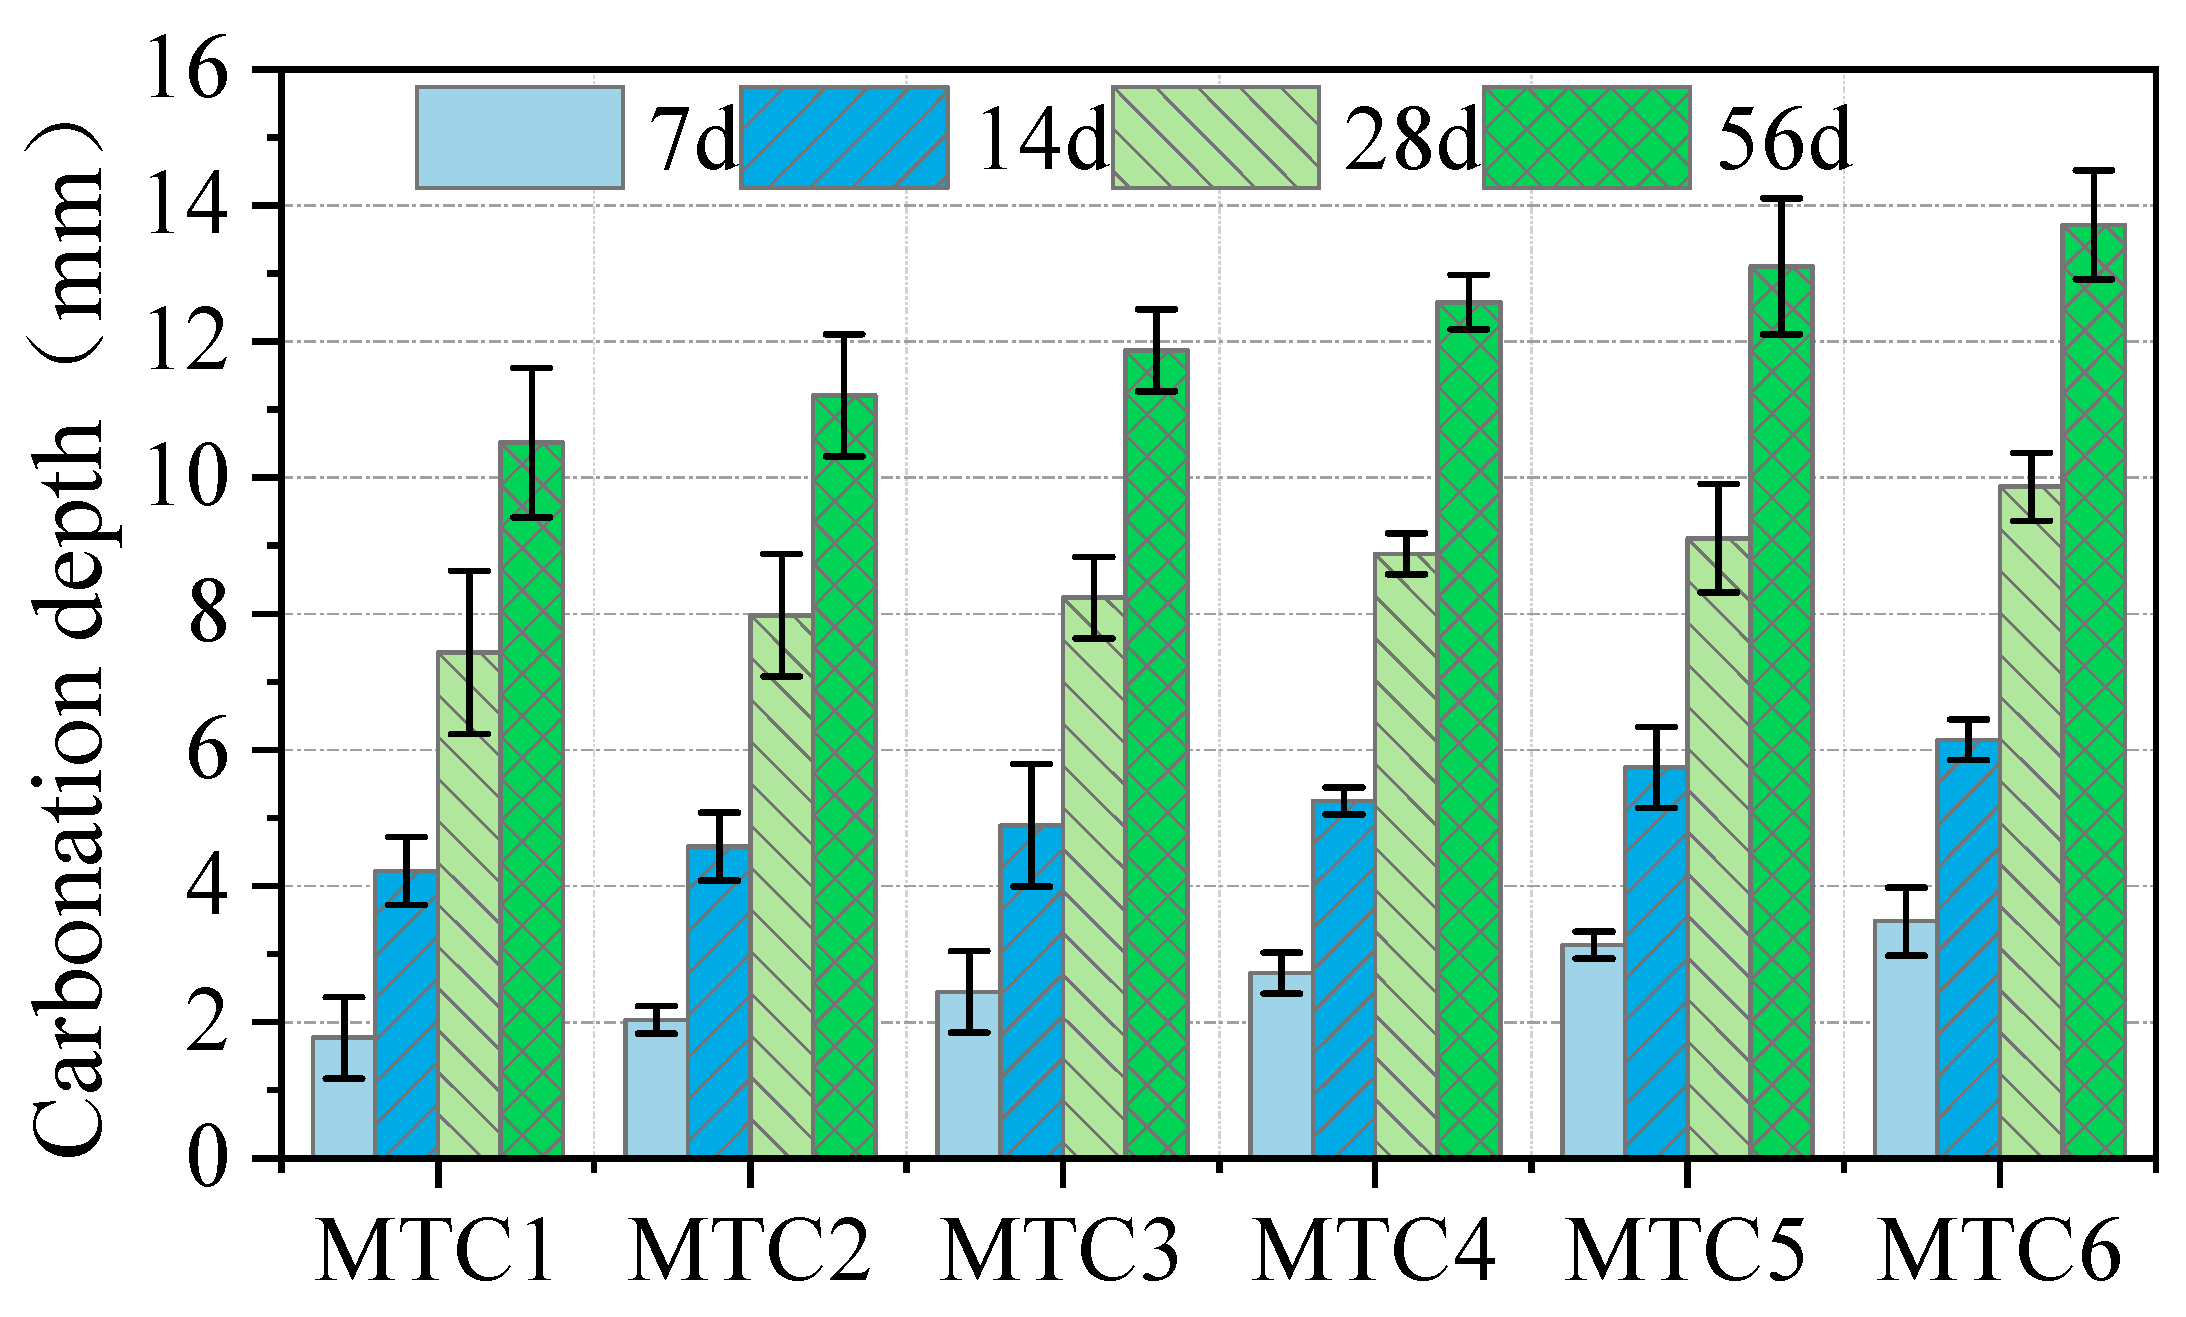
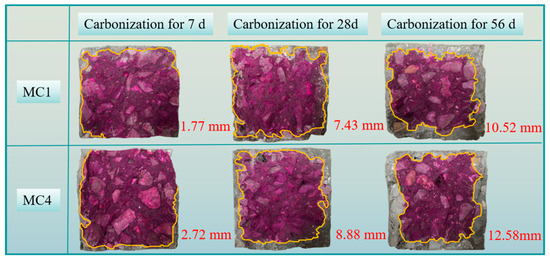
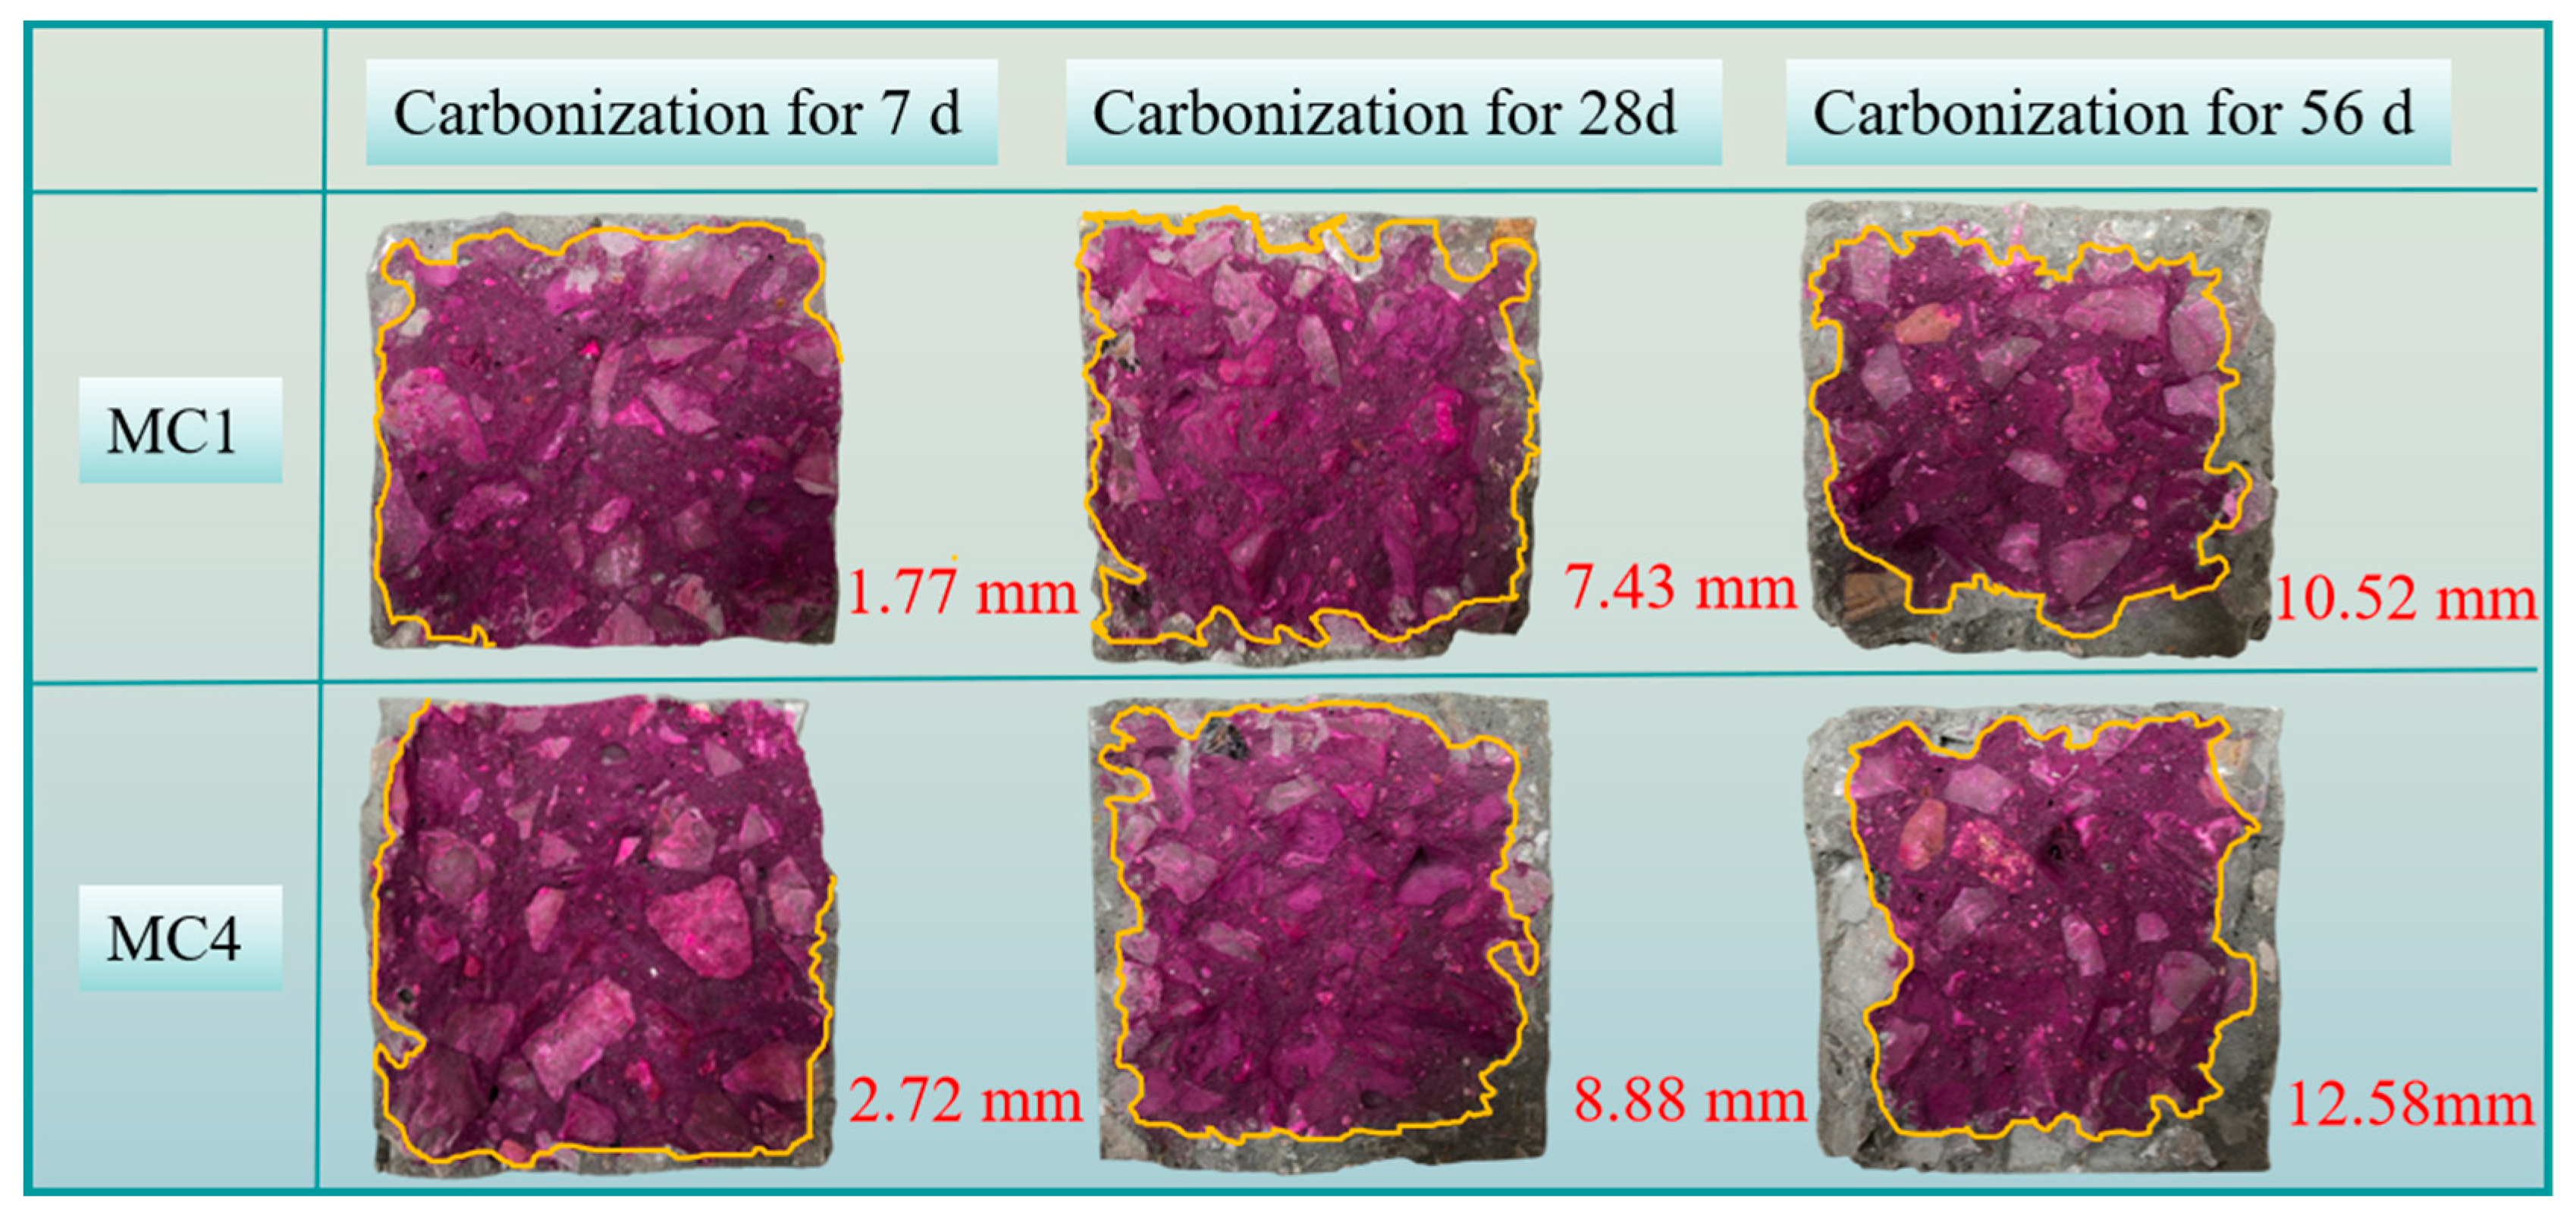
Carbonation depth can directly reflect changes in the alkaline environment within concrete, facilitating predictions about the service life of concrete structures. It is one of the key indicators for assessing the durability of concrete structures [36]. Under different carbonation ages, phenolphthalein alcohol solution is used as an indicator to measure the carbonation depth (uncarbonated areas turn pink, while carbonated areas remain unchanged). Based on the changes in carbonation depth under different carbonation ages, the study investigates the influence of the MT replacement rate on the carbonation performance of concrete. The carbonation depth of MTC is shown in Figure 9. Combined with Figure 10, it can be seen that as the carbonation age increases, the area of the red region decreases, indicating an increase in carbonation depth. At the same time, the carbonation depth also gradually increases with the increase in the MT replacement rate. At 56 days of carbonation, compared to ordinary concrete (MTC1), the carbonation depth of MTC2, MTC3, MTC4, MTC5, and MTC6 increased by 6.56%, 12.83%, 19.58%, 24.62%, and 30.42%, respectively. When the MT replacement rate reached 100%, the carbonation depth reached a maximum of 13.72 mm. The increase in the carbonation depth due to higher MTC may be attributed to the finer particle size and larger specific surface area of MTs, which allowed them to bind with more cementitious materials during concrete hardening, resulting in a relatively loose matrix with more pore defects. CO2 could more easily penetrate into the interior of the concrete, accelerating the carbonation rate and increasing the carbonation depth. The impact of these physical properties of MTs on concrete performance has also been thoroughly demonstrated in the research by Gao et al. [27].
Figure 9.
Changes in carbonation depth of MTC at different carbonation ages.
Figure 10.
Changes in carbonation depth of MTC1 and MTC4 samples.
3.3. Mechanical Properties After Carbonation
3.3.1. Compressive Strength
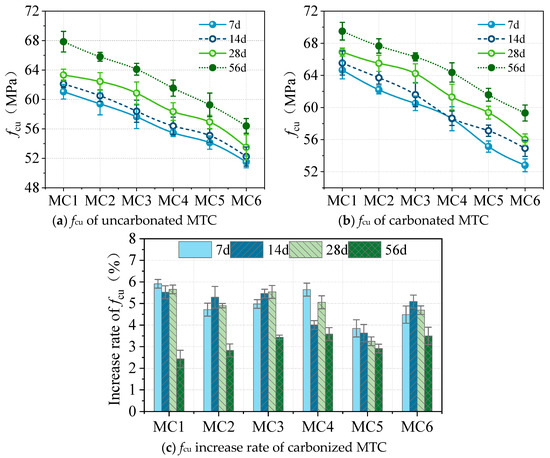
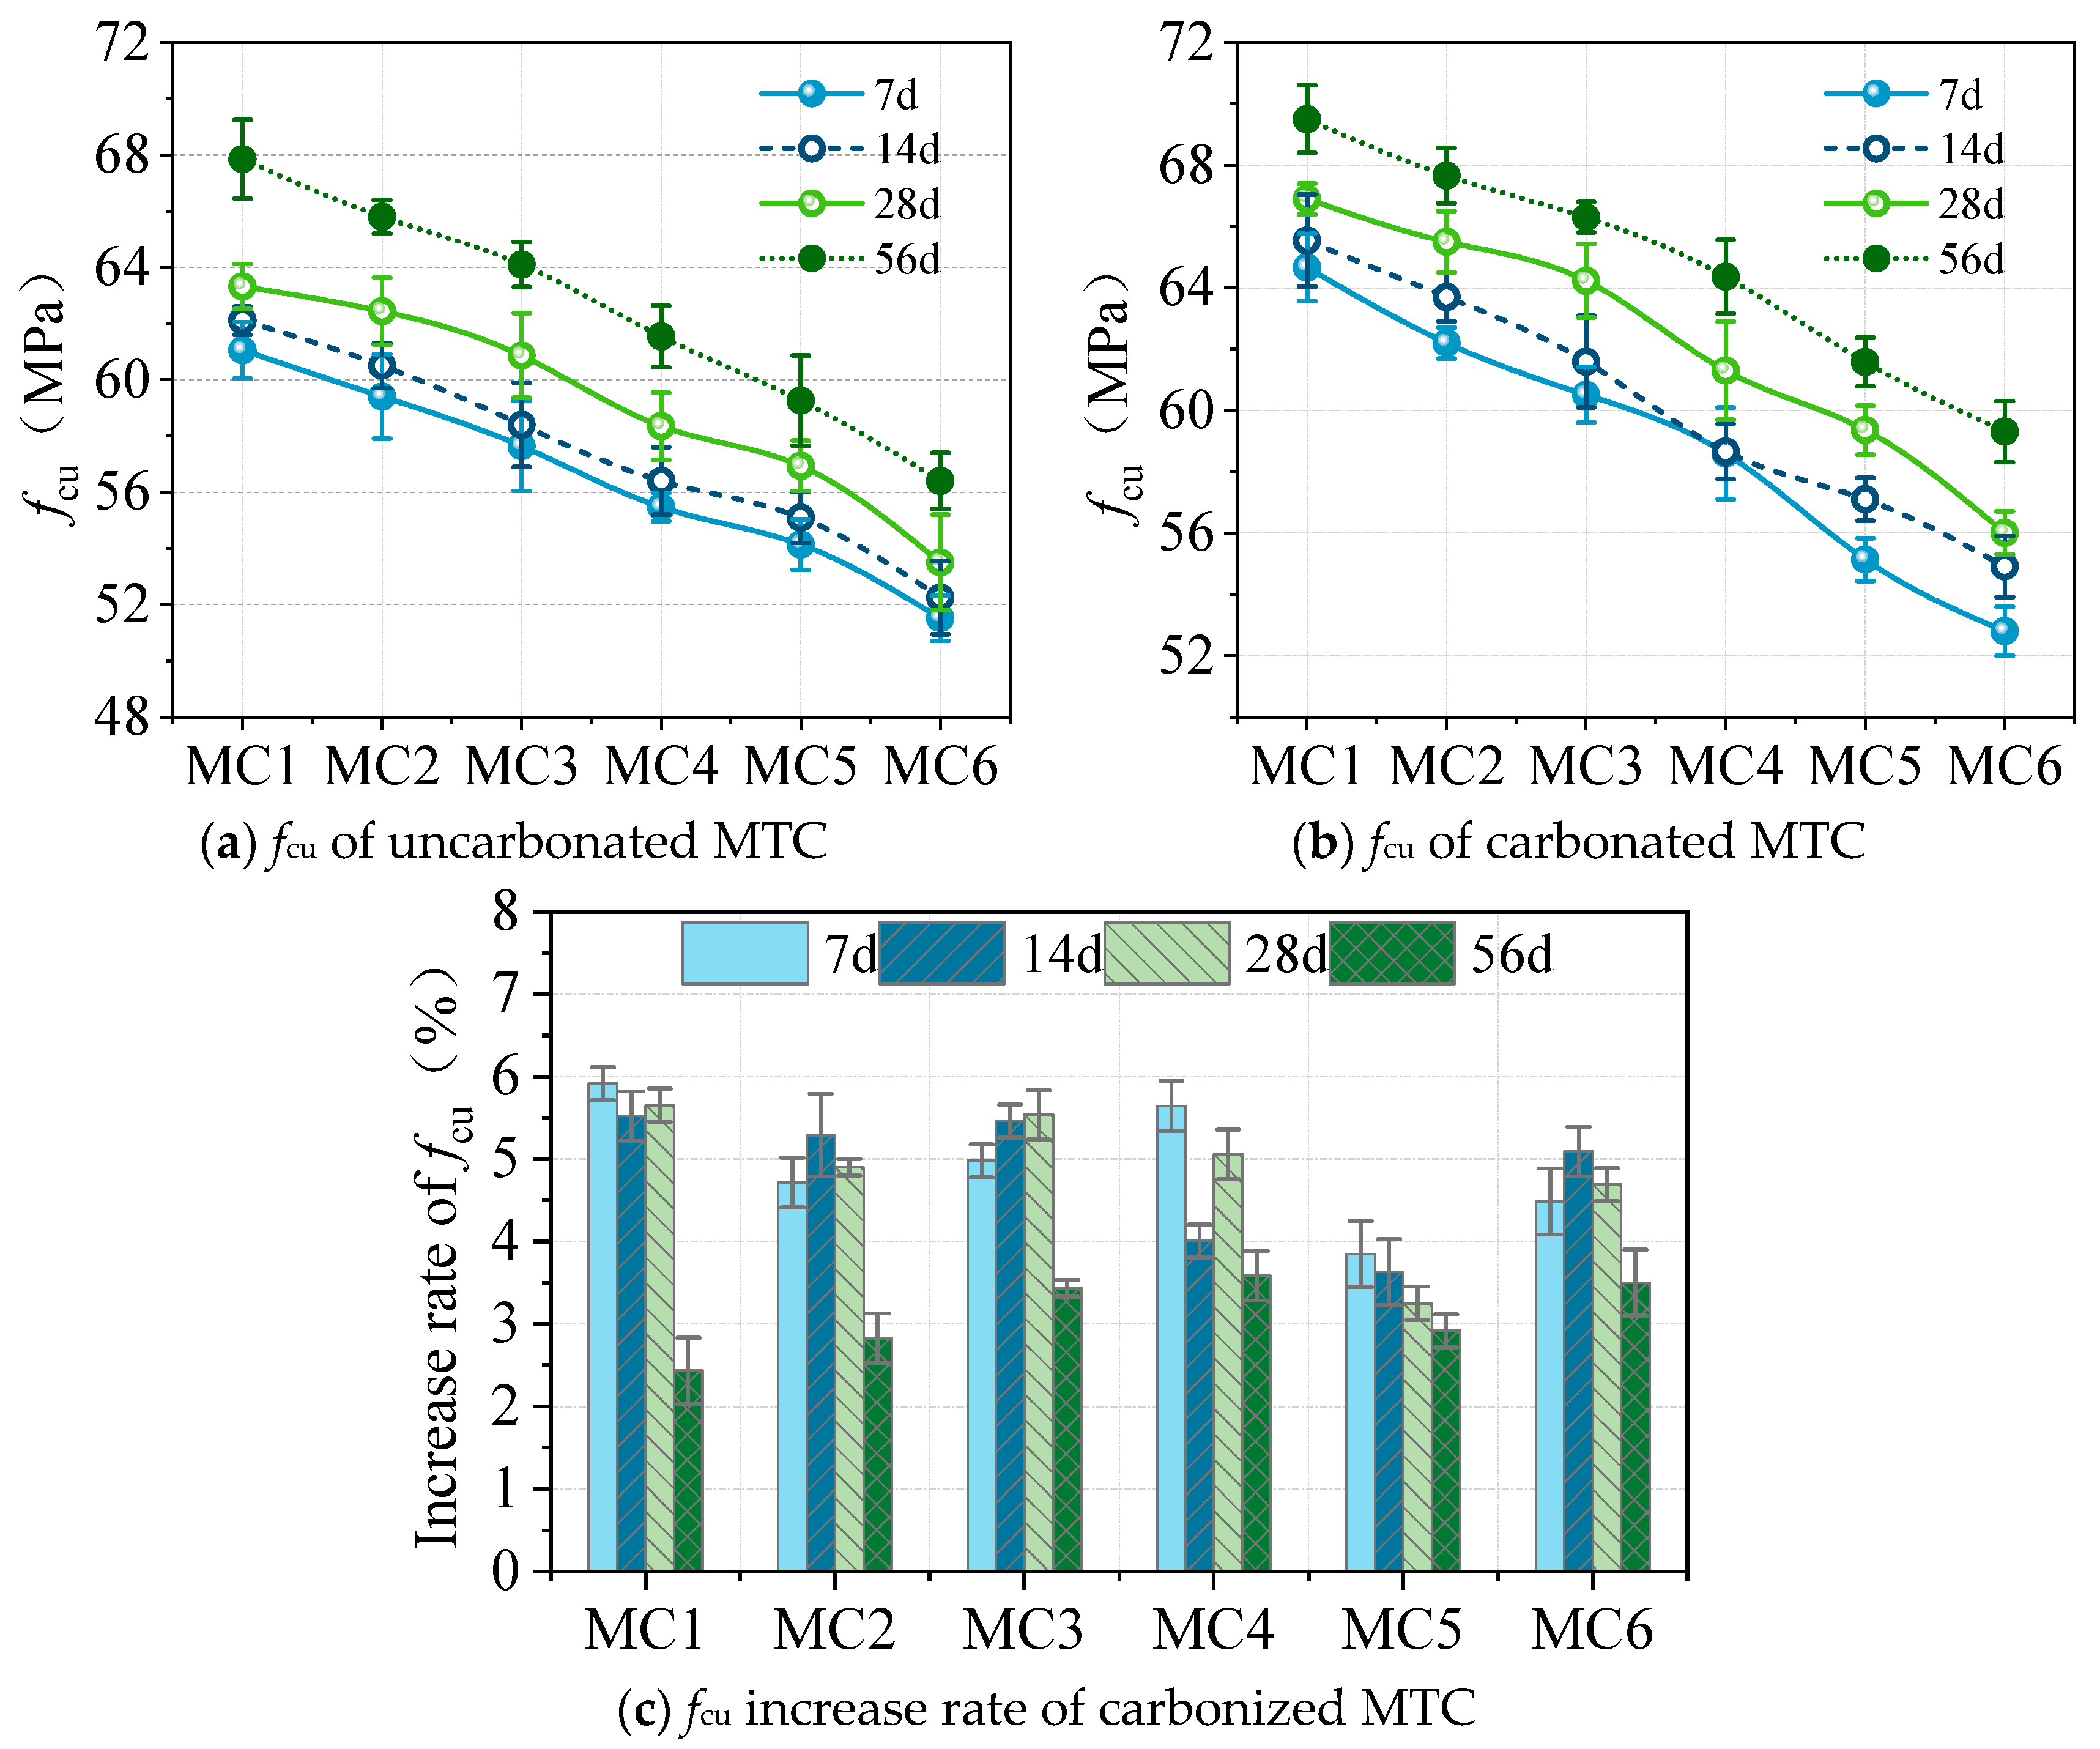
The carbonation depth of concrete increases with the increase in carbonation age, and the increase in carbonation depth will inevitably affect the mechanical properties of concrete. Compressive strength (fcu) is the most basic mechanical property of concrete. Therefore, this paper further investigates the effect of carbonation on the fcu of MTC. Figure 11 shows the fcu values of concrete at various ages after curing, including non-carbonated (control group) and carbonated (carbonation group) concrete. The fcu of the carbonation group at all ages was higher than that of the control group.
Figure 11.
Changes in fcu of MTC before and after carbonation.
Referring to the research by Li et al. [37], the fcu growth rate k of MTC was introduced, which was the ratio of the strength growth value of concrete of the same age to the fcu of natural curing, as shown in Equation (4):
In the formula, fcu and fcu′ represent the compressive strength of the control group and carbonized group MTC, respectively, and k represents the fcu growth rate.
Figure 11 shows that as the proportion of MTs increases, the fcu of concrete at various ages gradually decreases. The carbonization group showed similar results to the control group, with fcu decreasing as the proportion of MTs increased. For example, after 28 days of normal curing, the fcu of concrete with 20%, 40%, 60%, 80%, and 100% MT replacement decreased by 2.9%, 5.3%, 9.0%, 11.7%, and 15.5%, respectively, compared to concrete without replacement. It can be seen that the replacement rate of MTs is 60% and the fcu decreases by less than 10%. As can be seen from Figure 11c, carbonation increases the compressive strength of concrete, but the overall growth rate does not exceed 6%, and the fcu growth rate generally decreases with increasing carbonation age. The reason for this phenomenon may be that CO2 enters the interior of the concrete and reacts with Ca(OH)2 to form CaCO3, which is insoluble in water. The CaCO3 fills the pores and cracks in the concrete. As the carbonation age increases, the carbonation depth increases, and the pores and defects in the carbonation layer are filled, resulting in a decrease in porosity and an increase in density. In the later stages, CO2 entering the concrete interior creates an inhibitory effect. Therefore, the impact of carbonation on fcu decreases in the later stages and the phenomenon of reduced fcu growth rate in the later stages is also demonstrated in the carbonation performance of desert sand concrete [38].
It can be seen from Table 9 that the standard deviation of fcu of MTC after carbonation is generally higher than that before carbonation. Within the carbonation ages of 7 d, 14 d, 28 d, and 56 d, the strength standard deviation roughly increases gradually with the extension of carbonation age. This is mainly attributed to the heterogeneous development of the carbonation reaction in the inhomogeneous concrete matrix: the diffusion path of CO2 and the local precipitation of calcium carbonate are random. As carbonation proceeds, the difference in the carbonation degree among specimens accumulates, increasing the strength scatter among parallel samples. In addition, the standard deviation of MTC rises with the increase in the MT replacement ratio, indicating that the initial pore structure heterogeneity induced by tailings further aggravates this effect.
Table 9.
Standard deviation of MTC fcu at different ages before and after carbonation.
3.3.2. Splitting Tensile Strength
Splitting tensile strength (fsts) is one of the basic mechanical properties of concrete. In this study, we introduced the fsts growth rate k′ of MTC, which was the ratio of the strength growth value of concrete of the same age to the fsts of naturally cured concrete, as follows:
In the formula, fsts and fsts′ are the splitting tensile strengths of the control group and carbonized group MTC, respectively, and k′ is the fsts growth rate.
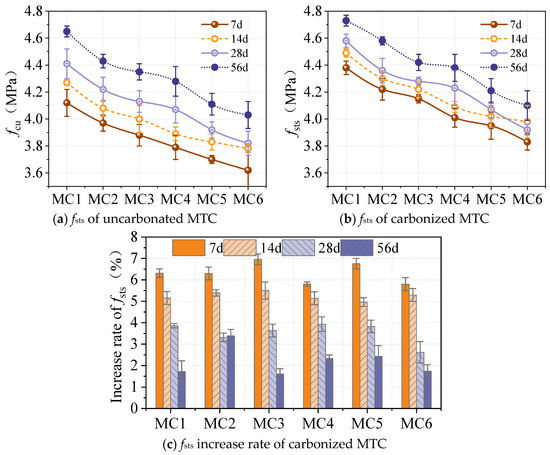
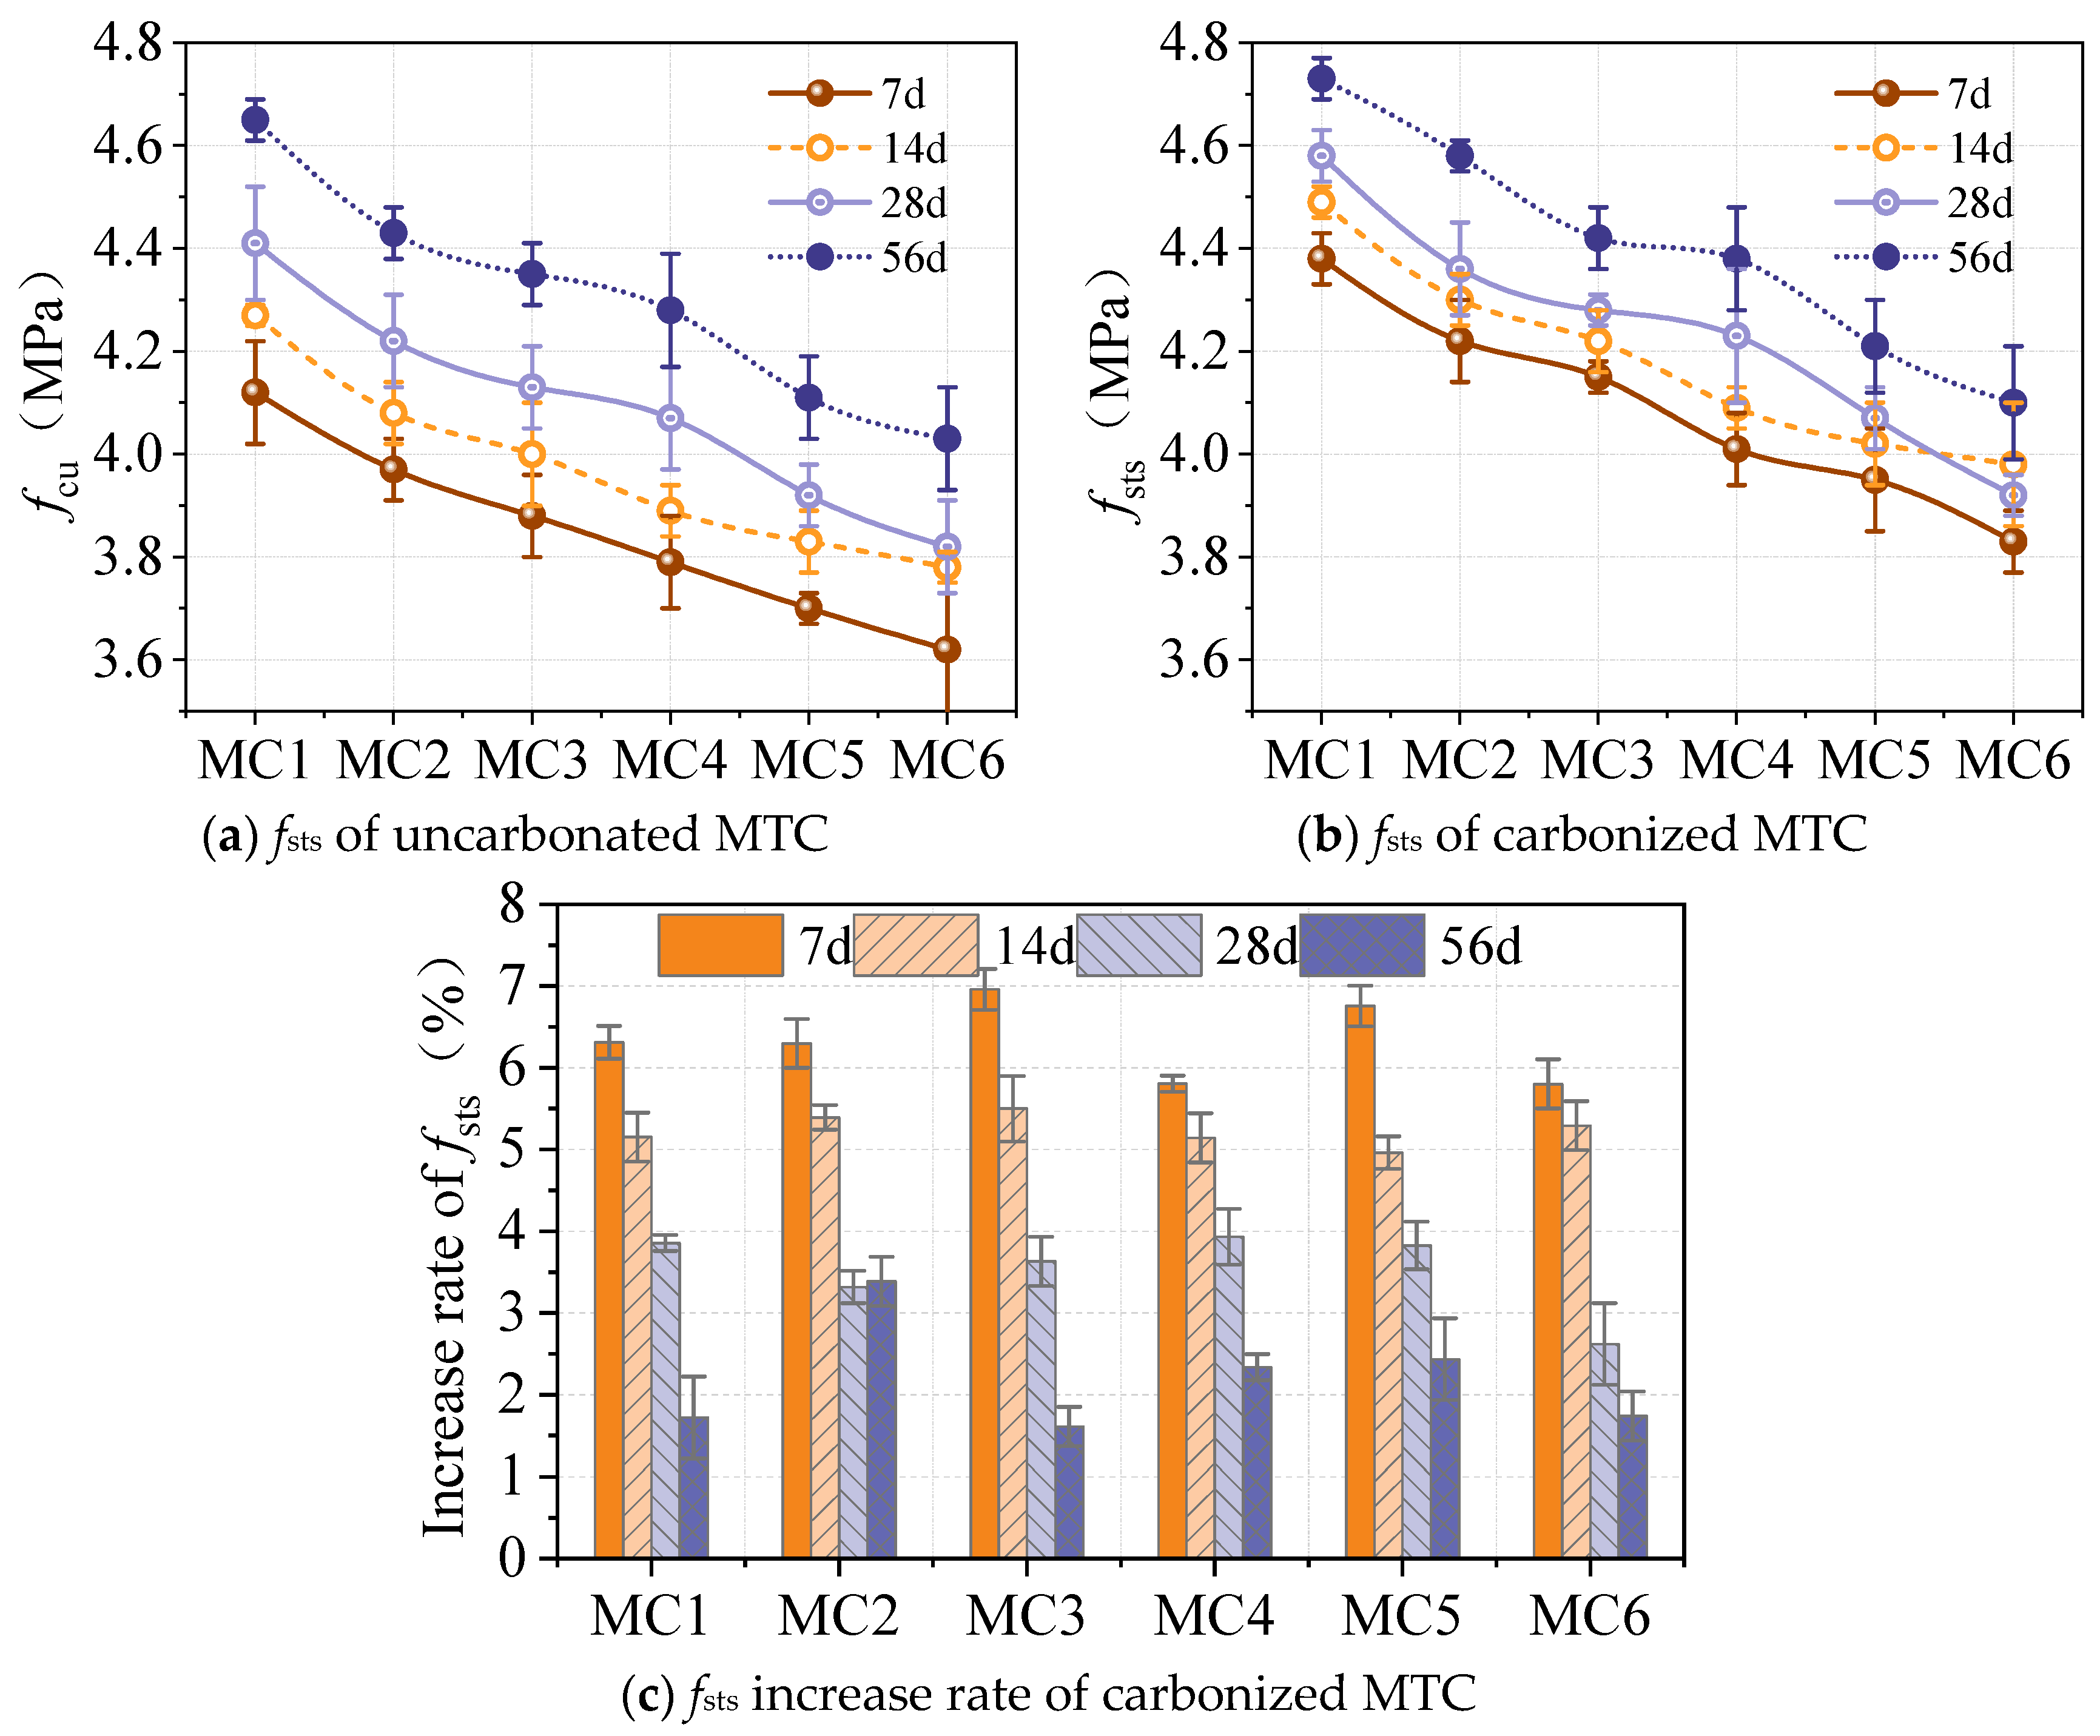
Figure 12 shows the fsts values and strength growth rates of MTC in the control group and carbonization group at different ages. As shown in Figure 12a,b, fsts gradually decreases with increasing MT replacement rate at different curing ages. Taking the 28-day curing age as an example, the fsts of MTC with replacement rates of 20%, 40%, 60%, 80%, and 100% decreased by 4.1%, 6.1%, 8.3%, 10.2%, and 12.9%, respectively, compared to ordinary concrete. It can be seen that when the MT replacement rate exceeds 60%, the decrease in fsts exceeds 10%. After carbonation, it exhibits a similar trend of change. As shown in Figure 12c, the fsts of concrete exhibits varying degrees of increase at different carbonation ages after carbonation, with an overall growth rate not exceeding 7%. It is also evident that as the carbonation age increases, the growth rate of fsts gradually decreases. This trend is similar to that observed in the previous section for fcu growth rates, but the pattern is more pronounced. The reason for this is that CO2 enters the interior of the concrete and consumes Ca(OH)2, forming CaCO3 that is insoluble in water. This CaCO3 fills the internal pores, thereby obstructing the entry of CO2 into the concrete channels. As a result, the later stages of carbonation have a smaller impact on the fsts.
Figure 12.
Changes in fsts of MTC before and after carbonation.
The standard deviation of fsts of carbonated specimens is larger than that of non-carbonated ones (Table 10). For non-carbonated samples, the standard deviation of fsts shows no obvious monotonic trend from 7 d to 56 d, while the standard deviation of carbonated samples increases with the extension of carbonation age.
fsts is highly sensitive to internal defects and weak zones at the aggregate–paste interfacial transition zone (ITZ). Once the hydration of non-carbonated specimens becomes relatively stable, the dominant defects controlling splitting failure do not evolve systematically, resulting in insignificant variations in the data scatter. Carbonation exhibits strong spatial heterogeneity in terms of CO2 diffusion and calcium carbonate precipitation. The local filling effect of precipitated CaCO3 within pores and the ITZ varies greatly among replicates. As carbonation proceeds, such heterogeneity accumulates and amplifies the random differences in weak interfacial regions, which increases the scatter of fsts.
It should be noted that this evolution of dispersion differs from fcu: fcu is dominated by the overall compactness of the matrix, whereas fsts is more sensitive to the random distribution of local interfacial defects.
Table 10.
Standard deviation of fsts of MTC at different ages before and after carbonization.
3.3.3. Strain Field Distribution Based on DIC
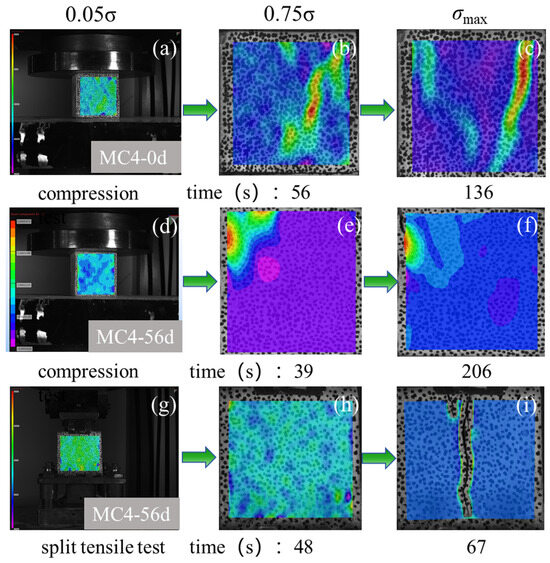
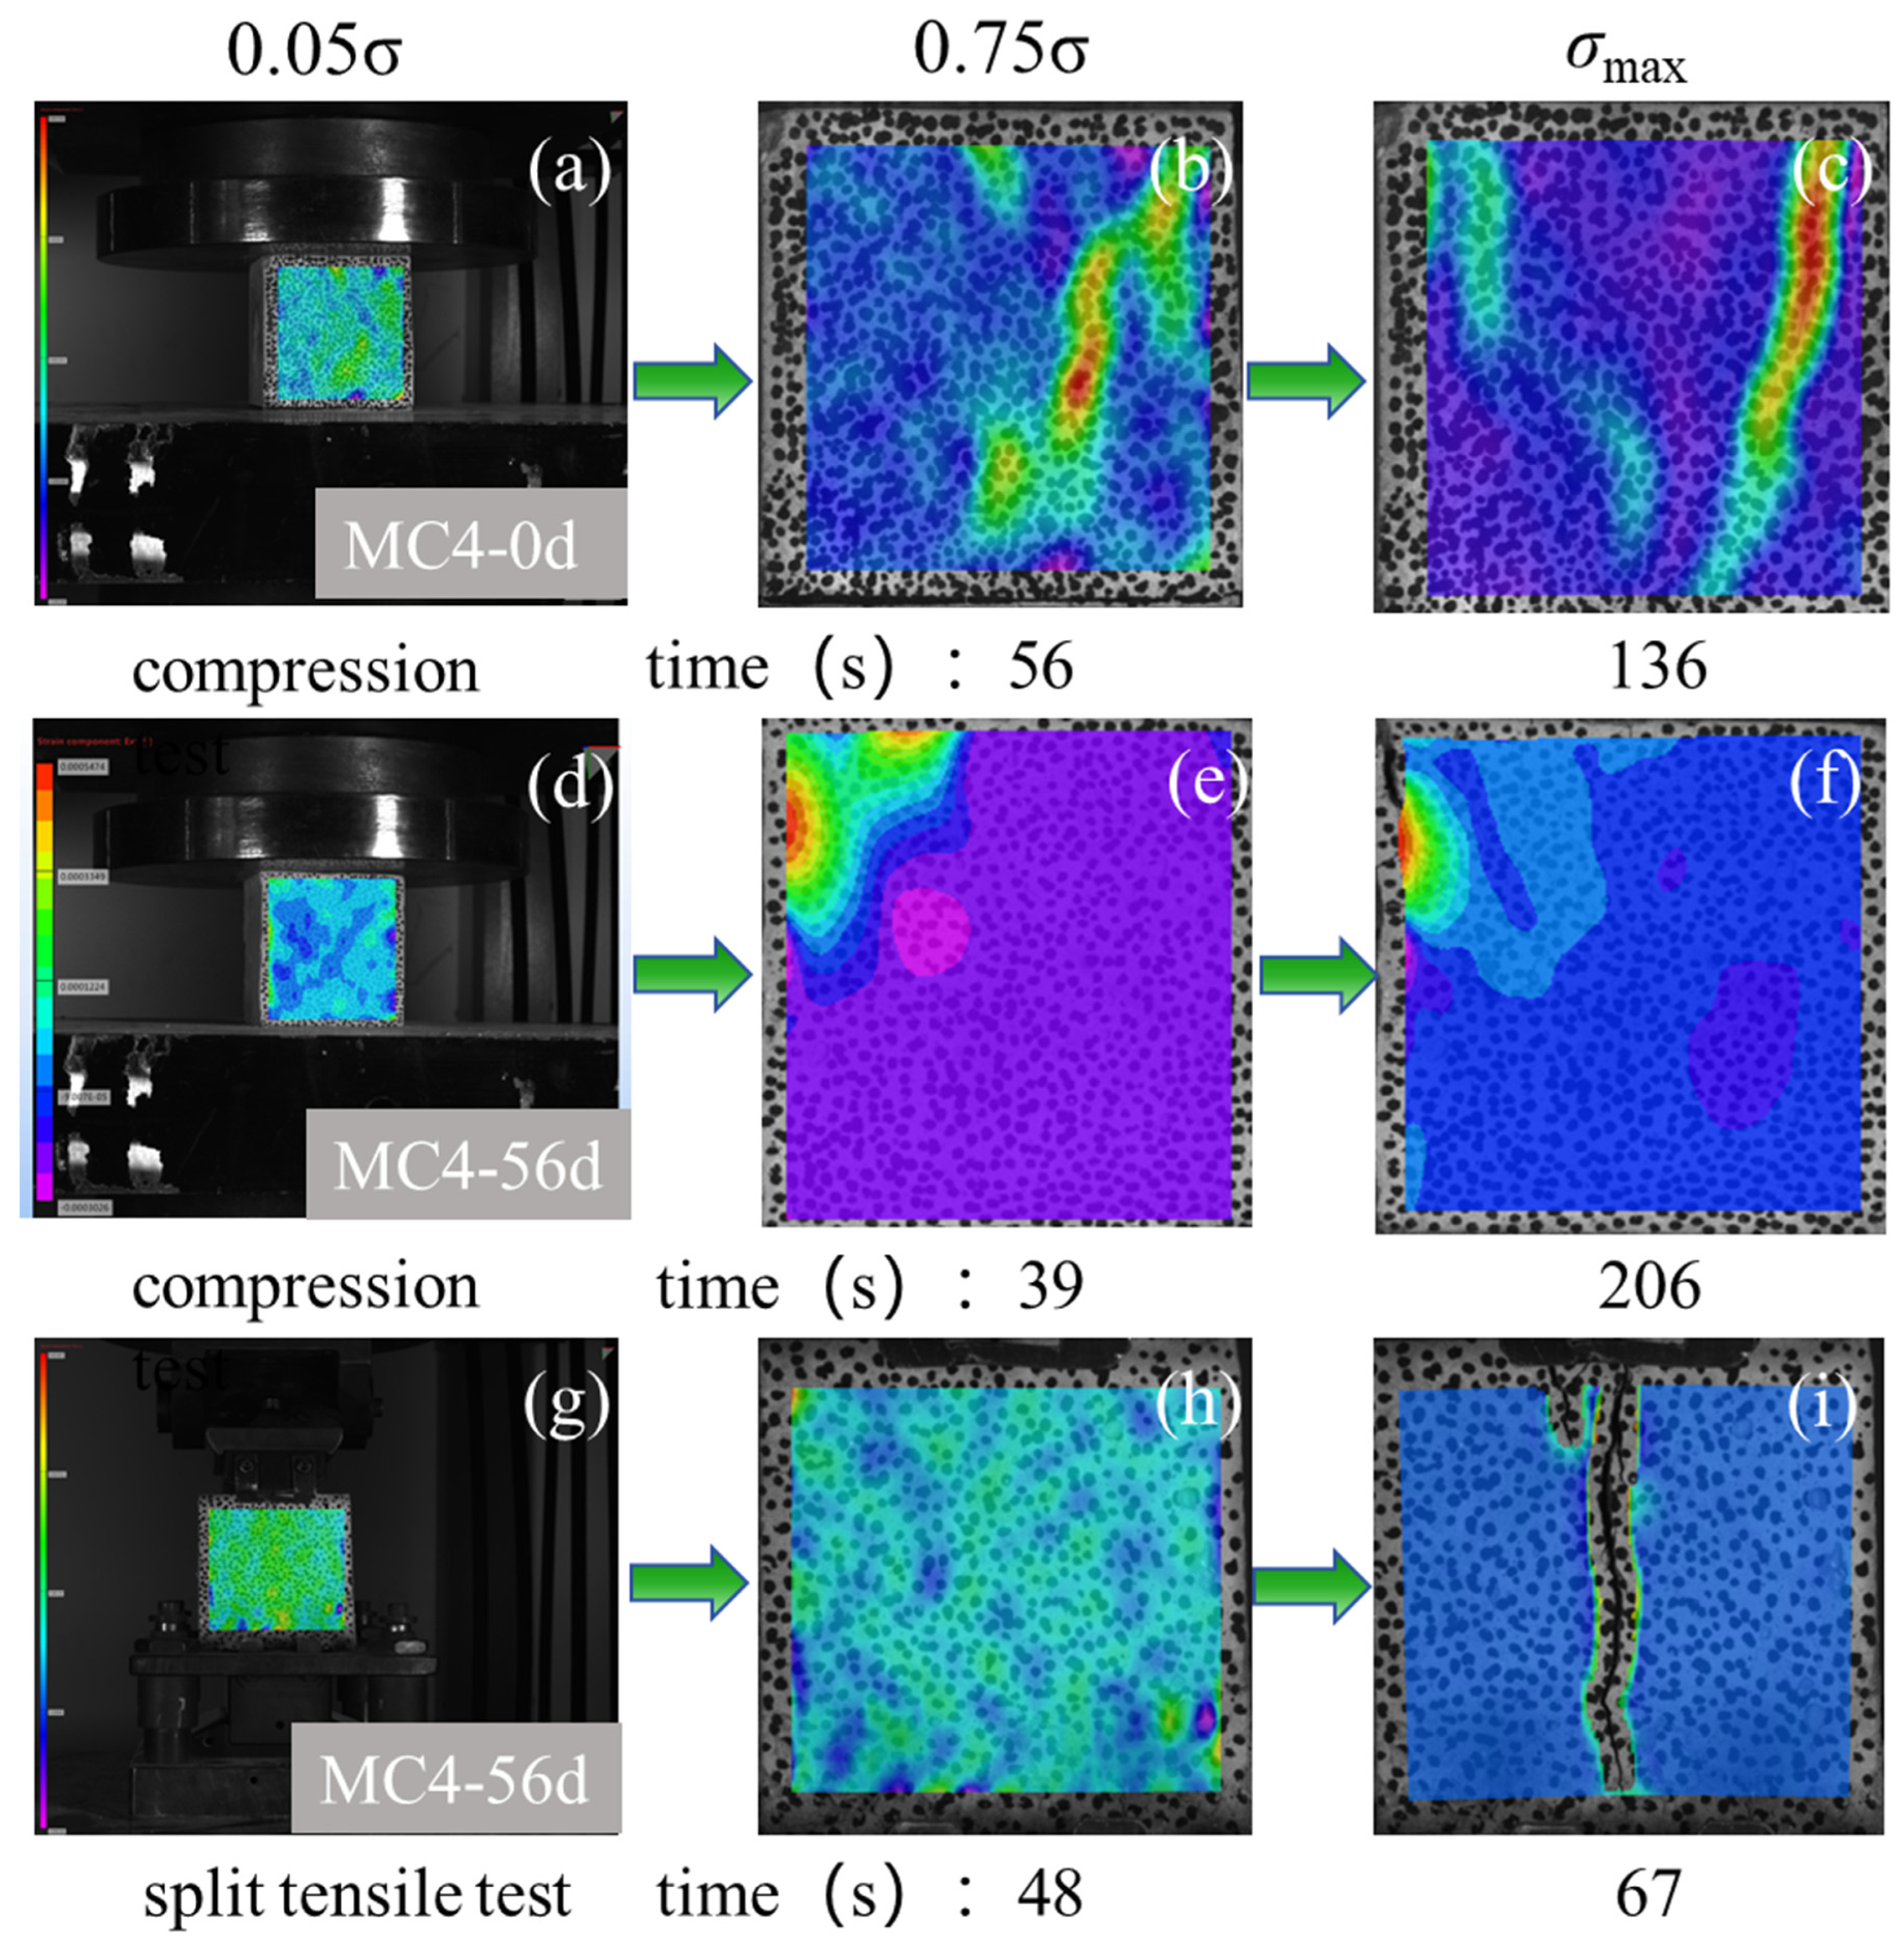
Figure 13 shows the transverse strain field distribution of the compression and splitting tensile tests of the cubic specimens before and after carbonization based on DIC technology. The strain cloud diagram of the typical specimen (MTC4) is given in this paper. It can be seen that whether it is carbonized or not at the initial stage of loading (0.05σ), the transverse strain field εx is relatively uniform and there is no obvious stress concentration phenomenon. The internal structure of MTC exhibits only elastic deformation caused by the compression of aggregates and cement hydration crystals.
Figure 13.
Stress cloud diagram of MTC4 compressive and splitting tensile stress test.
The specimen is in the elastic stage, with no obvious macroscopic deformation characteristics, and the strain cloud map shows mostly green areas. As the compressive stress continues to increase to 0.75σ, a more obvious stress concentration zone appears in the transverse strain field, but no macroscopic microcracks have yet been formed. At this stage, the concrete is in a compacted state. It can be seen that the stress concentration zone of MTC4 that has not been carbonated appears diagonally across the entire sample, while the stress concentration zone of the MTC that has been carbonated for 56 days appears in the corner area. The reason for this phenomenon may be that the edges of the carbonated molybdenum tailings concrete were the first to undergo a chemical reaction between CO2 and Ca(OH)2, producing CaCO3. The CaCO3 filled the pores and cracks in the concrete, filling the pore defects in the carbonation layer, reducing the porosity, and increasing the density. Based on this reasoning, the stress concentration zone after carbonation should not appear in the corners of the test specimen. However, since the corners underwent carbonization for 56 days, the alkalinity of this area decreased, and the C-S-H gel may have also been carbonized. Although the corners are denser, they exhibit brittle characteristics, so stress concentration zones are more likely to occur in the corners. When the peak stress σmax is reached, the strain concentration area gradually becomes more obvious, forming a distinct strain concentration zone. After peak stress, cracks are formed in the middle of the specimen. During the loading process, the cracks rapidly lengthened and widened, causing local instability within the specimen. The multiple cracks on the surface of the uncarburized specimen gradually transformed into a single through crack.
After carbonization, the development of stress concentration zones penetrating the diagonal of the specimen is significantly slower than before carbonization and the fcu increases. Carbonization makes MTC have a tendency to increase brittleness; it has a more significant effect on improving the filling of the pore structure. When the tensile load reaches its limit value for MTC, the splitting surface (vertical center section) is penetrated, the specimen breaks along the splitting surface, and the stress cloud map undergoes a sudden change. The failure occurs instantaneously, and the stress is released rapidly.
3.4. Pore Structure After Carbonization
3.4.1. 2D Slice
The porosity of 1000 cross-sectional sections was analyzed by industrial CT scanning. In this study, the plane porosity distribution of each layer is the percentage of the pore area of the slice scanned along the vertical height to the total area of the slice. Since the effects of carbonation on concrete deepen progressively from the surface inward, investigating changes in pore volume at different depths can help elucidate the mechanisms underlying carbonation’s impact on concrete.
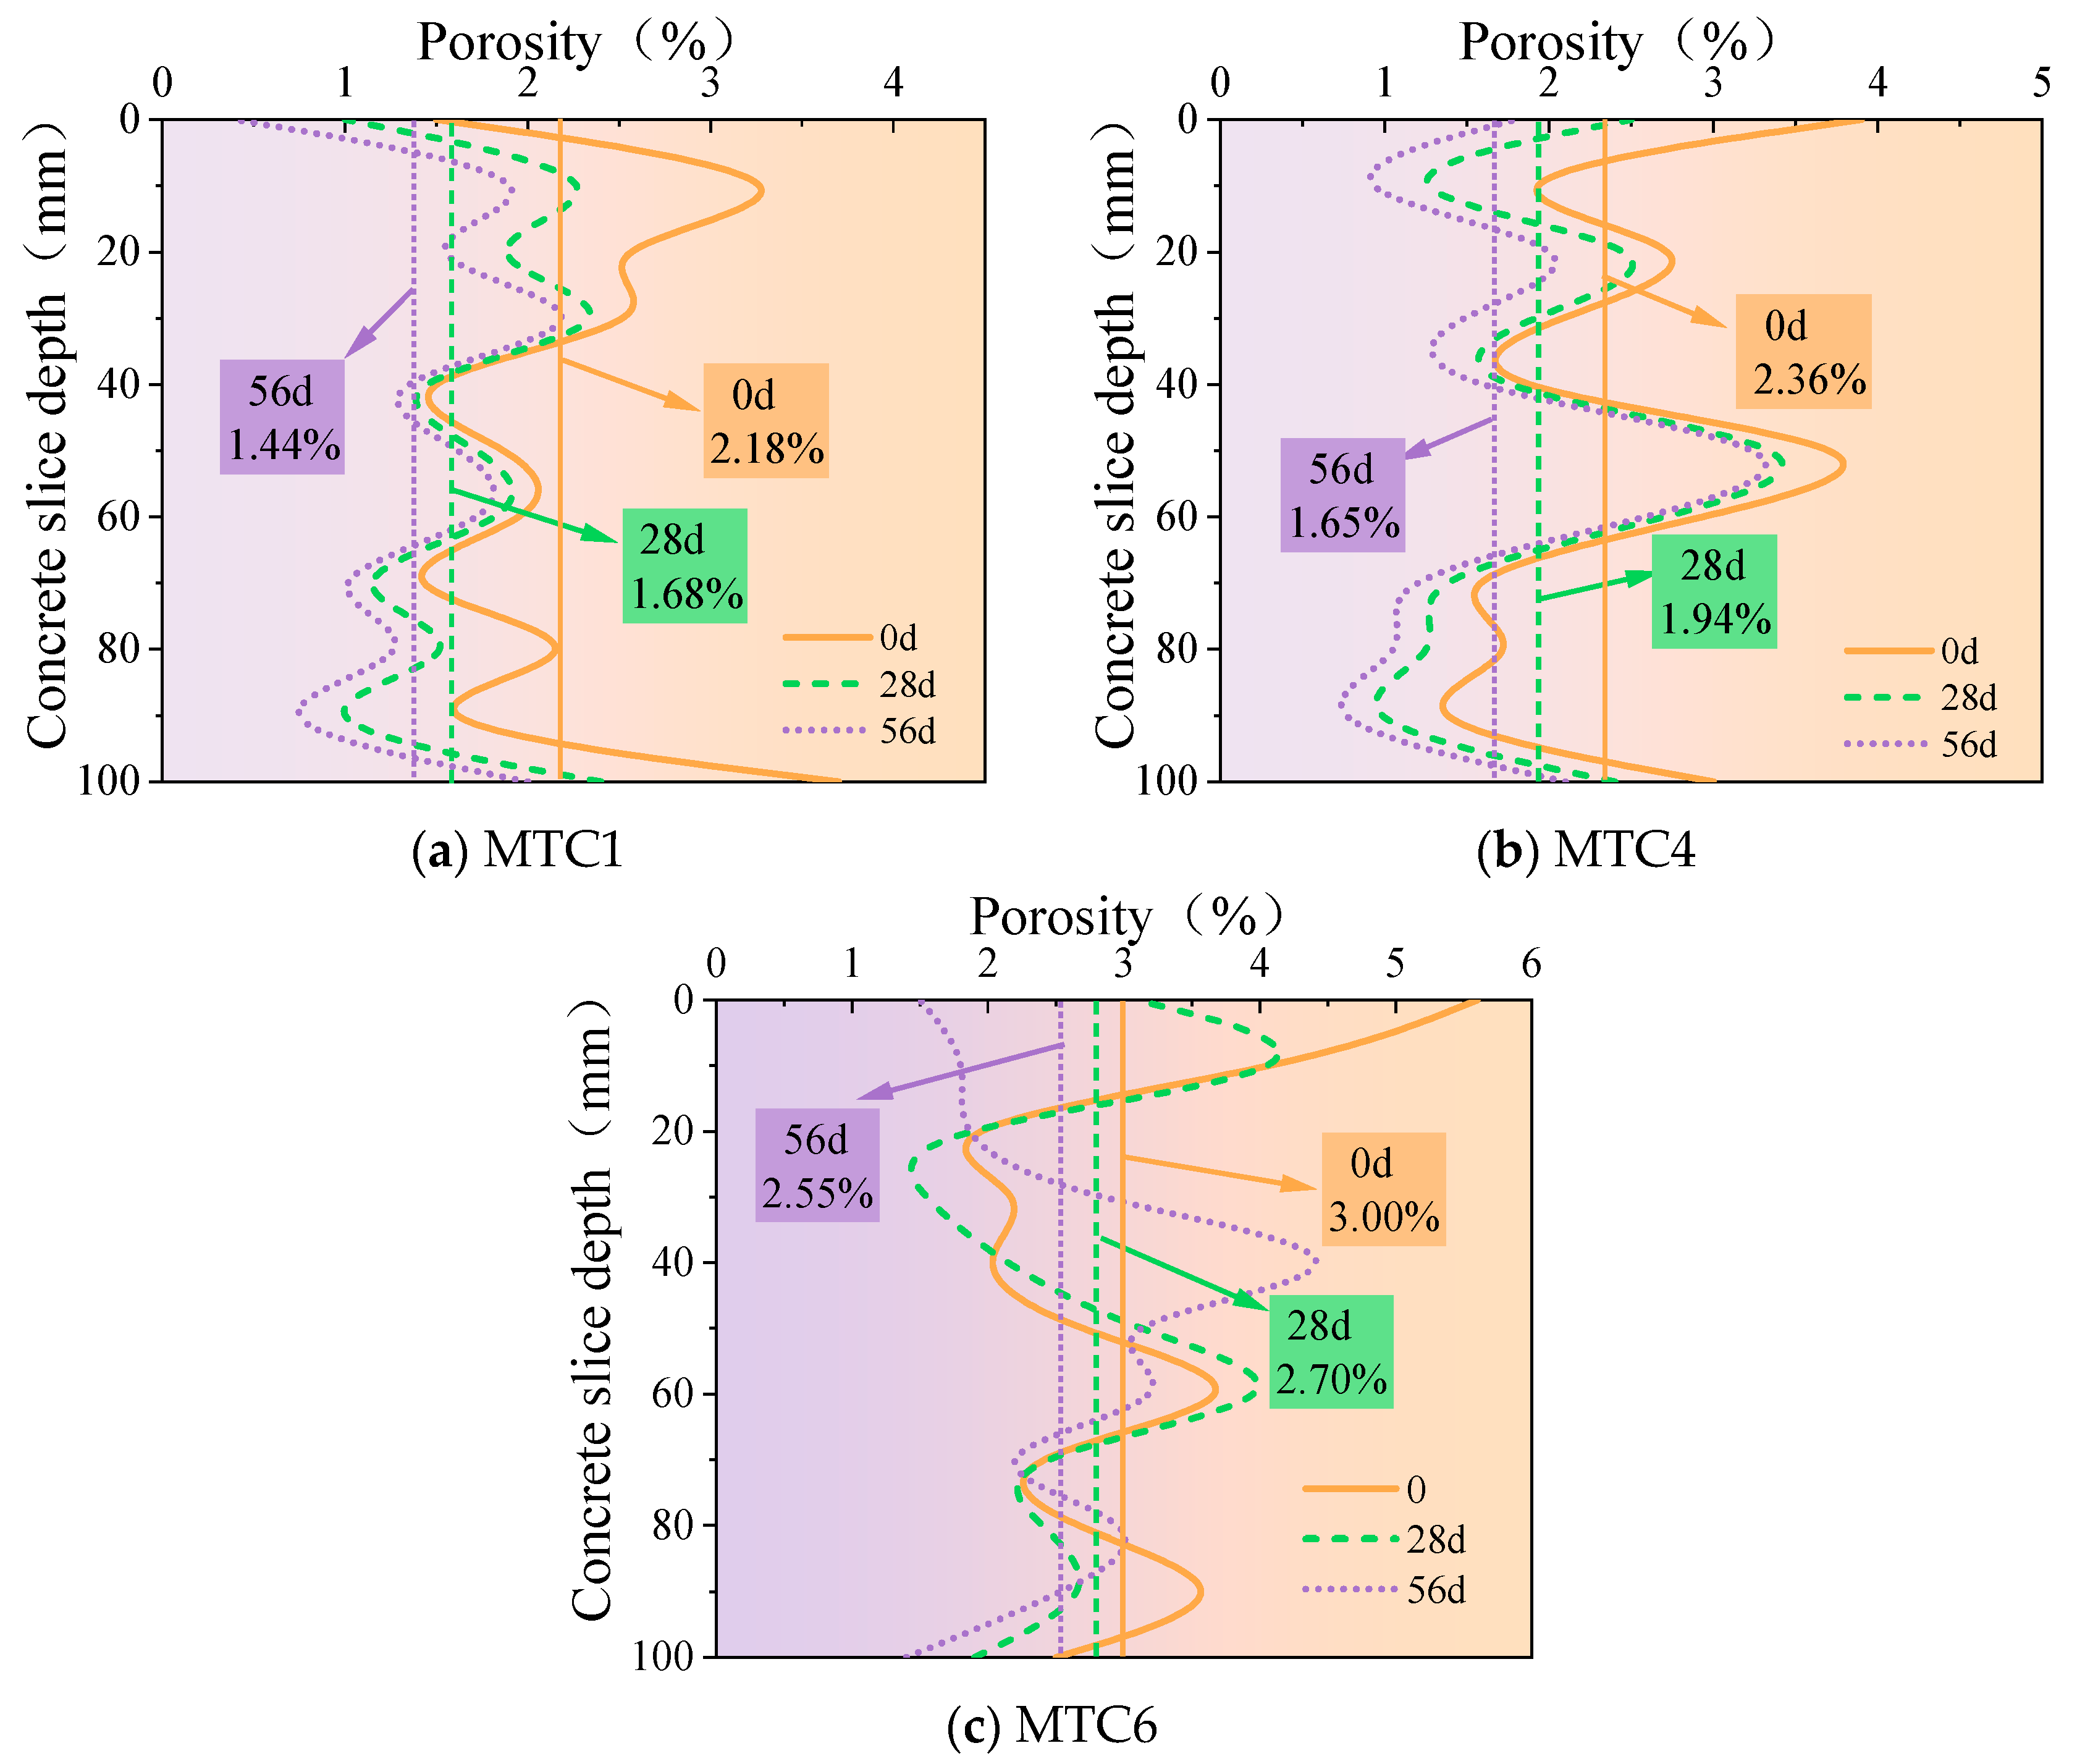
2D slices of MTC1, MTC4, and MTC6 were selected for a porosity variation analysis, as shown in Figure 14. The average porosity and porosity variance of different slices were calculated, as shown in Table 11. The dispersion of concrete porosity in the vertical direction under different MT replacement rates in a carbonation environment was further investigated. As shown in Figure 14, the porosity of concrete slices with different MT replacement rates fluctuates along the height direction without any obvious pattern. Under different carbonation ages, the average porosity of concrete decreases in the following order: MTC6 > MTC4 > MTC1. This also reflects that the addition of MTs reduces the density of concrete. Concretes with different MT replacement rates showed a decrease in porosity as the carbonation age increased, indicating that the carbonation environment reduced the porosity of MTC, with the reduction rate becoming more pronounced as the carbonation time increased. The porosity of MTC1, MTC4, and MTC6 after 28 and 56 days of carbonization decreased by 22.94% and 33.95%, 17.8% and 30.08%, and 10% and 15%, respectively, compared to the porosity of the non-carbonized samples. It can be seen that the rate of decrease in porosity after carbonation was reduced, indicating that the effect of carbonation on concrete was relatively small in the later stages of carbonation. This is consistent with the findings in Section 3.2 regarding the impact of carbonation on the macroscopic mechanical properties of concrete.
Figure 14.
Variation in 2D porosity of MTC with slice depth at different carbonation ages.
Table 11.
Average porosity and porosity variance of MTC under a carbonation environment.
The obvious change rule in MTC1, MTC4, and MTC6 is that the porosity of the upper and lower parts along the height direction changes greatly at different carbonation ages, while the porosity near the middle is close to each other and is not greatly affected by carbonation. This also reflects the influence of carbonization on concrete from the outside to the inside [39]. As can be seen from the porosity variance in Table 11, carbonation reduced the degree of dispersion in the concrete along the height direction, while the concrete with different MT replacement rates showed that the larger the average porosity, the greater the degree of porosity dispersion.
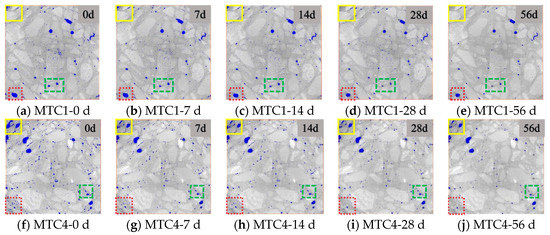
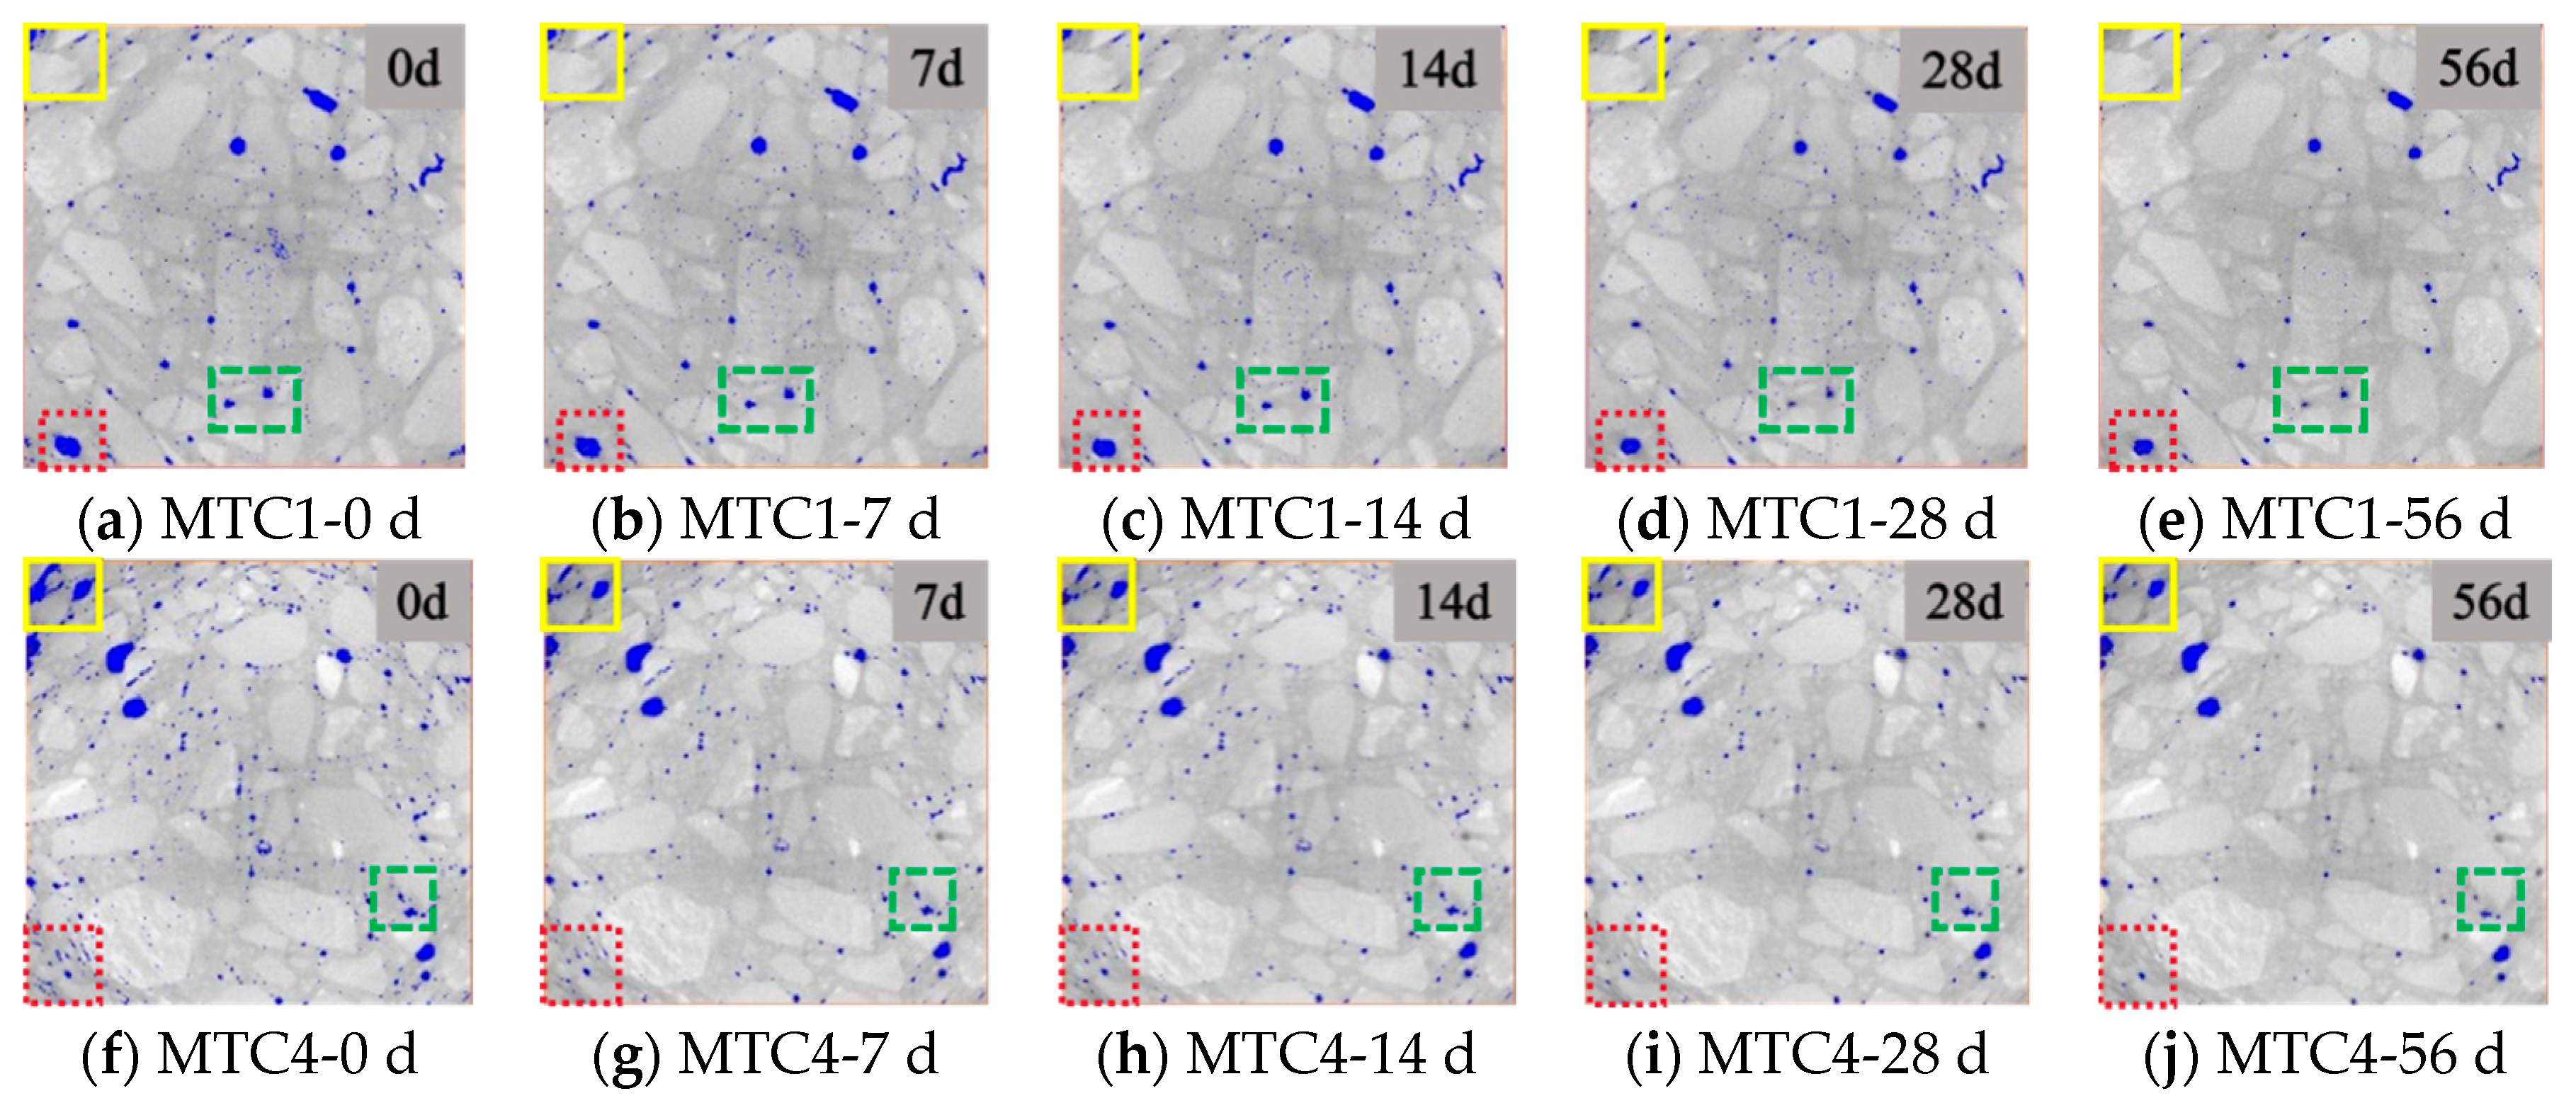
The above analysis results indicate that the porosity of each layer of concrete changes to varying degrees under different carbonation ages. To visually study the evolution of pore structure under carbonation conditions, representative CT scan images of the mid-section cross-sectional pore structure of MTC1 and MTC4 concrete at different carbonation ages are presented, as shown in Figure 15.
Figure 15.
Evolution of pore structure of MTC1 and MTC4 at different carbonization ages.
As can be seen from Figure 15, the distribution of pores, aggregates, and mortar in concrete at different carbonation ages is evident. Due to differences in aggregate density, the gray values displayed in the image also vary. Therefore, image gray value characteristics can be utilized to distinguish between different composite materials. Research shows that high-density materials usually correspond to white phases in images [40]. The white with higher brightness corresponds to the stone, while the gray area with relatively dark gray is the mortar system. After the image was processed by the AVIZO software, the pores and cracks inside the specimen were marked in blue. Consistent with the average porosity in the previous section, the initial porosity of MTC4 is greater than that of MTC1. The porosity of both materials decreases with increasing carbonization time, showing a general trend of large pore defects gradually decreasing and small pore defects gradually disappearing. The fact that carbonization causes a decrease in porosity has been widely reported [41,42,43].
From the perspective of different carbonization ages, the changes in pores after 7 days of carbonization are not obvious, mainly reflected in the initial reduction in large pores at the edges of the samples, such as the reduction in large pores at the upper left corner of the samples. After 14 days of carbonization, the large pore defects continued to decrease, but unlike after 7 days of carbonization, there was a significant disappearance of small pores inside. At the age of 28 days of carbonization, the macropore defects at the edge of the sample decreased to the lowest and the disappearance of small pores was not obvious. After 56 days of carbonization, the pore structure did not change significantly compared to that after 28 days, which was consistent with the macro-mechanical properties. The strength growth rate was relatively slow after 56 days of carbonation.
The reason for the gradual disappearance of the pores at the edge of the sample was that after carbon dioxide penetrated the concrete, it reacted with calcium hydroxide and consumed it, thereby generating calcium carbonate that was insoluble in water [44]. This calcium carbonate filled the pores inside the concrete, blocking the passage of carbon dioxide into the concrete. As a result, as the carbonation process progressed, the large pores on the outside were gradually filled and disappeared and the mechanical properties gradually strengthened.
3.4.2. 3D Reconstruction
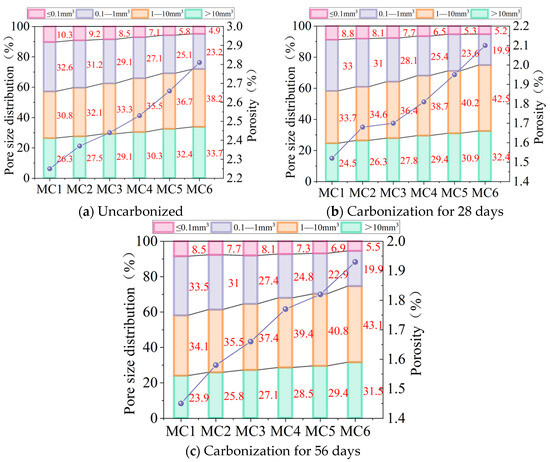
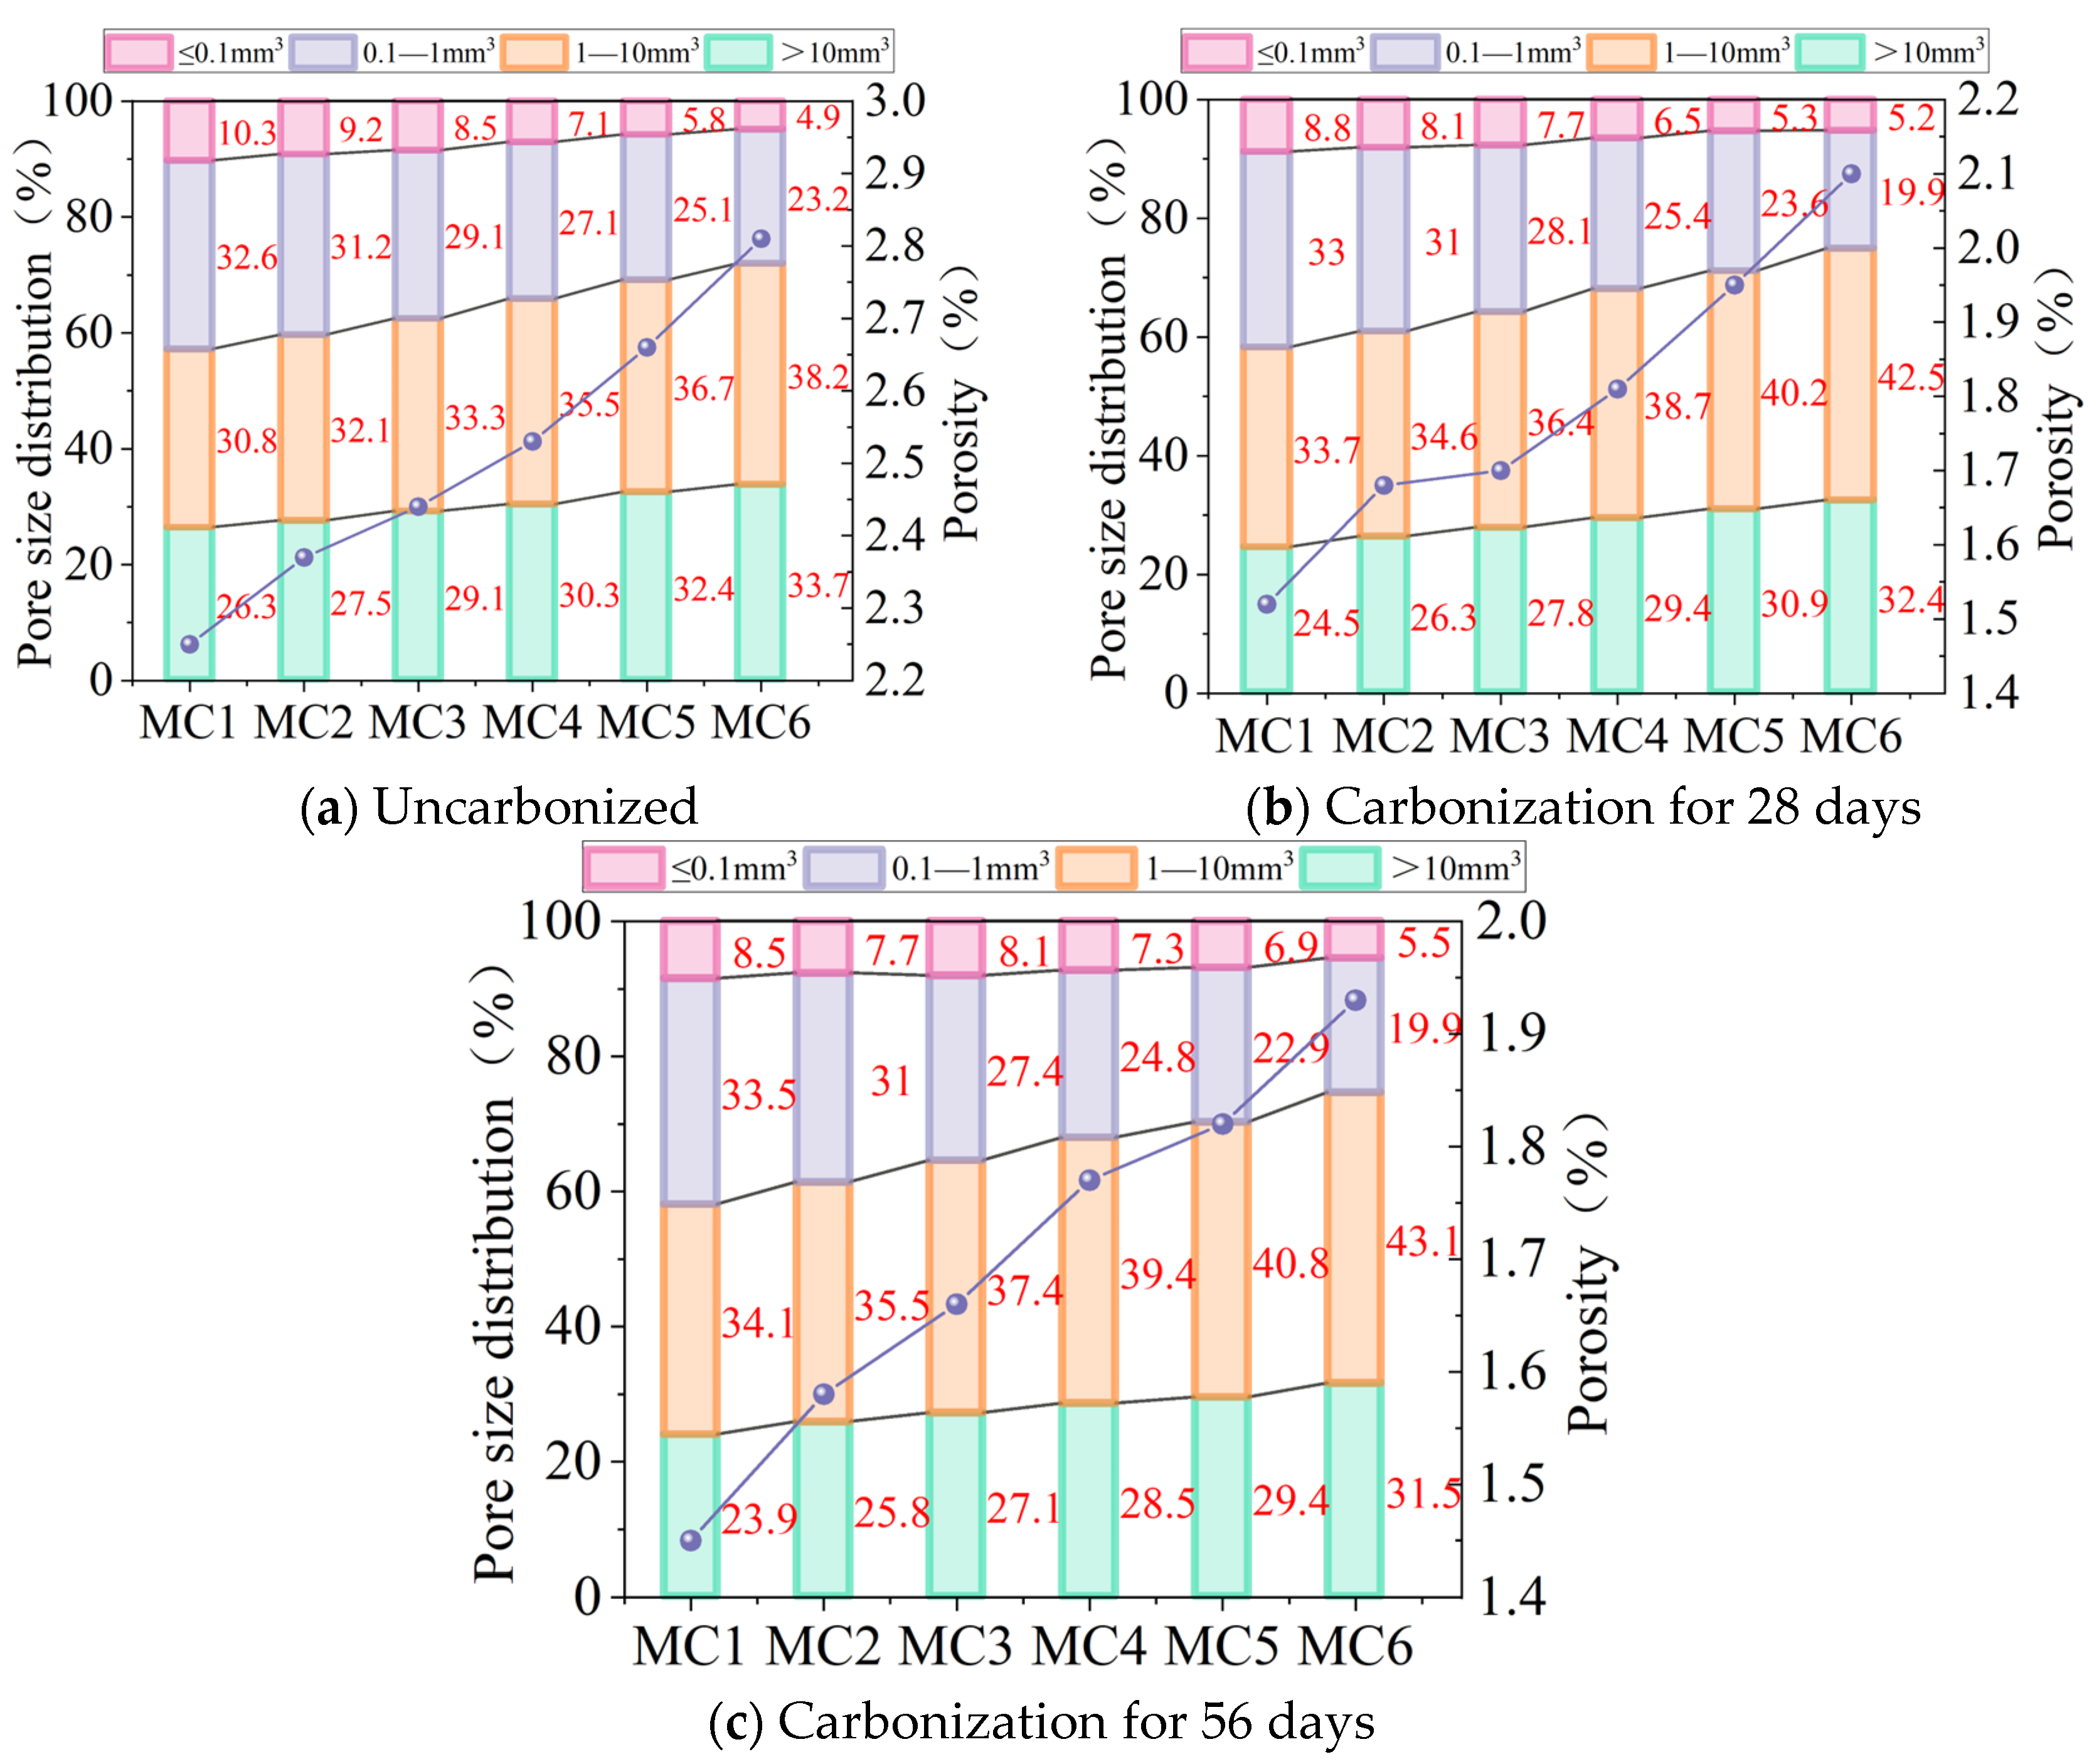
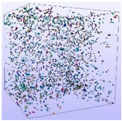
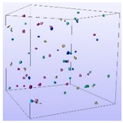
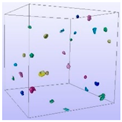
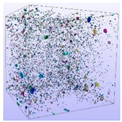
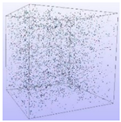
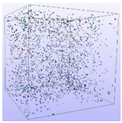
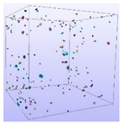
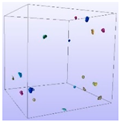
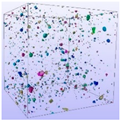
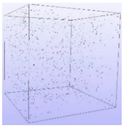
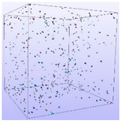
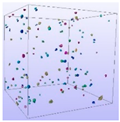
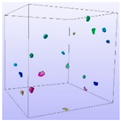
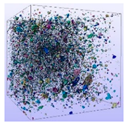
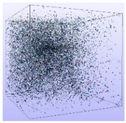
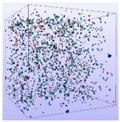
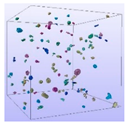
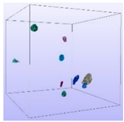
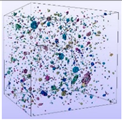
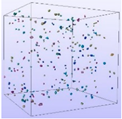
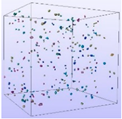
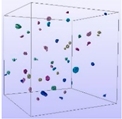
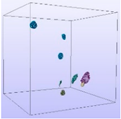
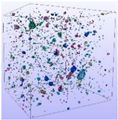
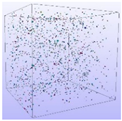
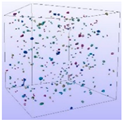
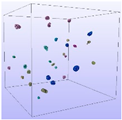
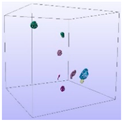
The distribution of pore space is also an important factor affecting the performance of concrete [45]. Therefore, based on industrial CT scan data, 3D reconstruction was performed to obtain the true state of the 3D spatial distribution of pores in MTC and to further understand the effect of carbonation on the spatial distribution of pores in MTC. To understand the evolution process of the pore structure, the 3D pore volume was divided into four levels [46,47] based on the industrial CT scan data—≤0.1 mm3 micropores, 0.1~1 mm3 micropores, 1~10 mm3 mesopores, and ≥10 mm3 macropores—and the four-level pores were visualized as shown in Table 12 and Table 13, respectively. Further data processing was used to quantify the volume percentage of each pore size category (pore size distribution), as shown in Figure 16.
Table 12.
3D distribution of MTC1 pores with different pore sizes at different carbonation ages.
Table 13.
3D distribution of MTC4 pores with different pore sizes at different carbonation ages.
Figure 16.
Pore size distribution and porosity changes in MTC under different carbonation ages.
From Table 12 and Table 13, it can be seen that the pore size, distribution and geometric shape of ordinary concrete and MTC are different under different carbonization ages. In general, the pore size distribution under different carbonization ages is characterized by a small number of macropores above 10 mm3 and the distribution is relatively dispersed. The number of mesopores of 1~10 mm3 is moderate, and the pore distribution is uniform. The number of small pores of 0.1~1 mm3 and micropores of ≤0.1 mm3 is large, and the pore distribution is dense and uniform.
From the quantitative data information of pore size distribution in Figure 16, it can be seen that the volume fraction of 1~10 mm3 mesopores in MTC is the largest, up to nearly 50%; although the number of micropores (≤0.1 mm3) is large, the volume fraction is the least, generally not more than 10%.
The evolution of the pore structure of MTC is mainly reflected in the overall reduction in porosity, the decrease in large pore volume and the disappearance of some micropores. After 56 days of carbonization, the porosity can be reduced by at most 37.3%. As the carbonization age increases, the proportion of macropores decreases while the proportion of mesopores increases. However, the evolution patterns of micropores and nanopores at different carbonization ages remain unclear. Compared with the uncarbonized material, the proportion of macropores generally decreases by about 4~9% after 28 days of carbonation while the proportion of micropores generally decreases by about 10~24%. The overall proportion of mesopores and micropores increases by about 15~35%. This is because CO2 enters the pores inside the concrete and reacts chemically with alkaline substances to form CaCO3, which is insoluble in water. The size of the pores determines the extent of the reaction between the CO2 and alkaline substances. Generally, the larger the pore size, the more free water there is inside, which is more conducive to acid–base neutralization reactions [48]. Therefore, the filling effect of carbonization products on macropores is more obvious. The pore size of macropores decreases and transforms into mesopores, and the proportion of mesopores gradually increases. After the carbonation age reaches 56 days, the percentage of macropores further decreases, but the decrease is not obvious. Compared with the 28-day age, the pore size distribution changes little. This also shows that the rate of the acid–base neutralization reaction in the later stage of carbonation becomes slower. The main reason is that the filling effect of the early carbonation reaction on the outer pores of the concrete hinders the passage of CO2 gas into the concrete in the later stage. This fact has been confirmed in the literature [49,50]. It is evident that carbonation has a positive effect on the pore structure of MTC by refining the pores.
The pore volume distribution results obtained in this study depend on the current segmentation threshold and image processing flow. Different thresholds, filtering, and segmentation algorithms will change the proportion of pores at all levels. Therefore, this study focuses on the comparison of the change trend between different groups, rather than the absolute value of the proportion of pores at all levels. In our subsequent research, we hope to carry out special calibration, threshold sensitivity analyses, and repeated scanning to quantify the uncertainty of micro-CT pore characterization.
3.5. The Relationship Between Pore Structure and Mechanical Properties
3.5.1. Relationship Between Porosity and Compressive Strength
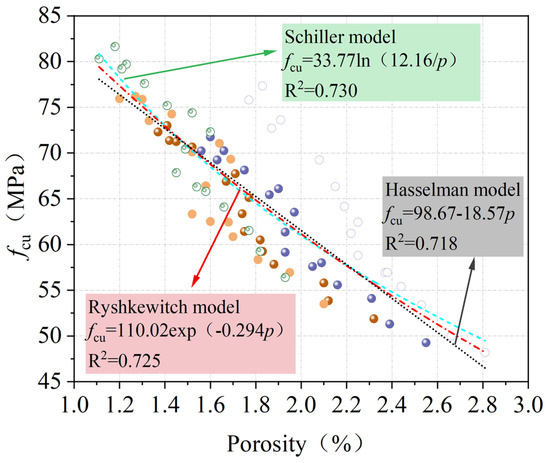
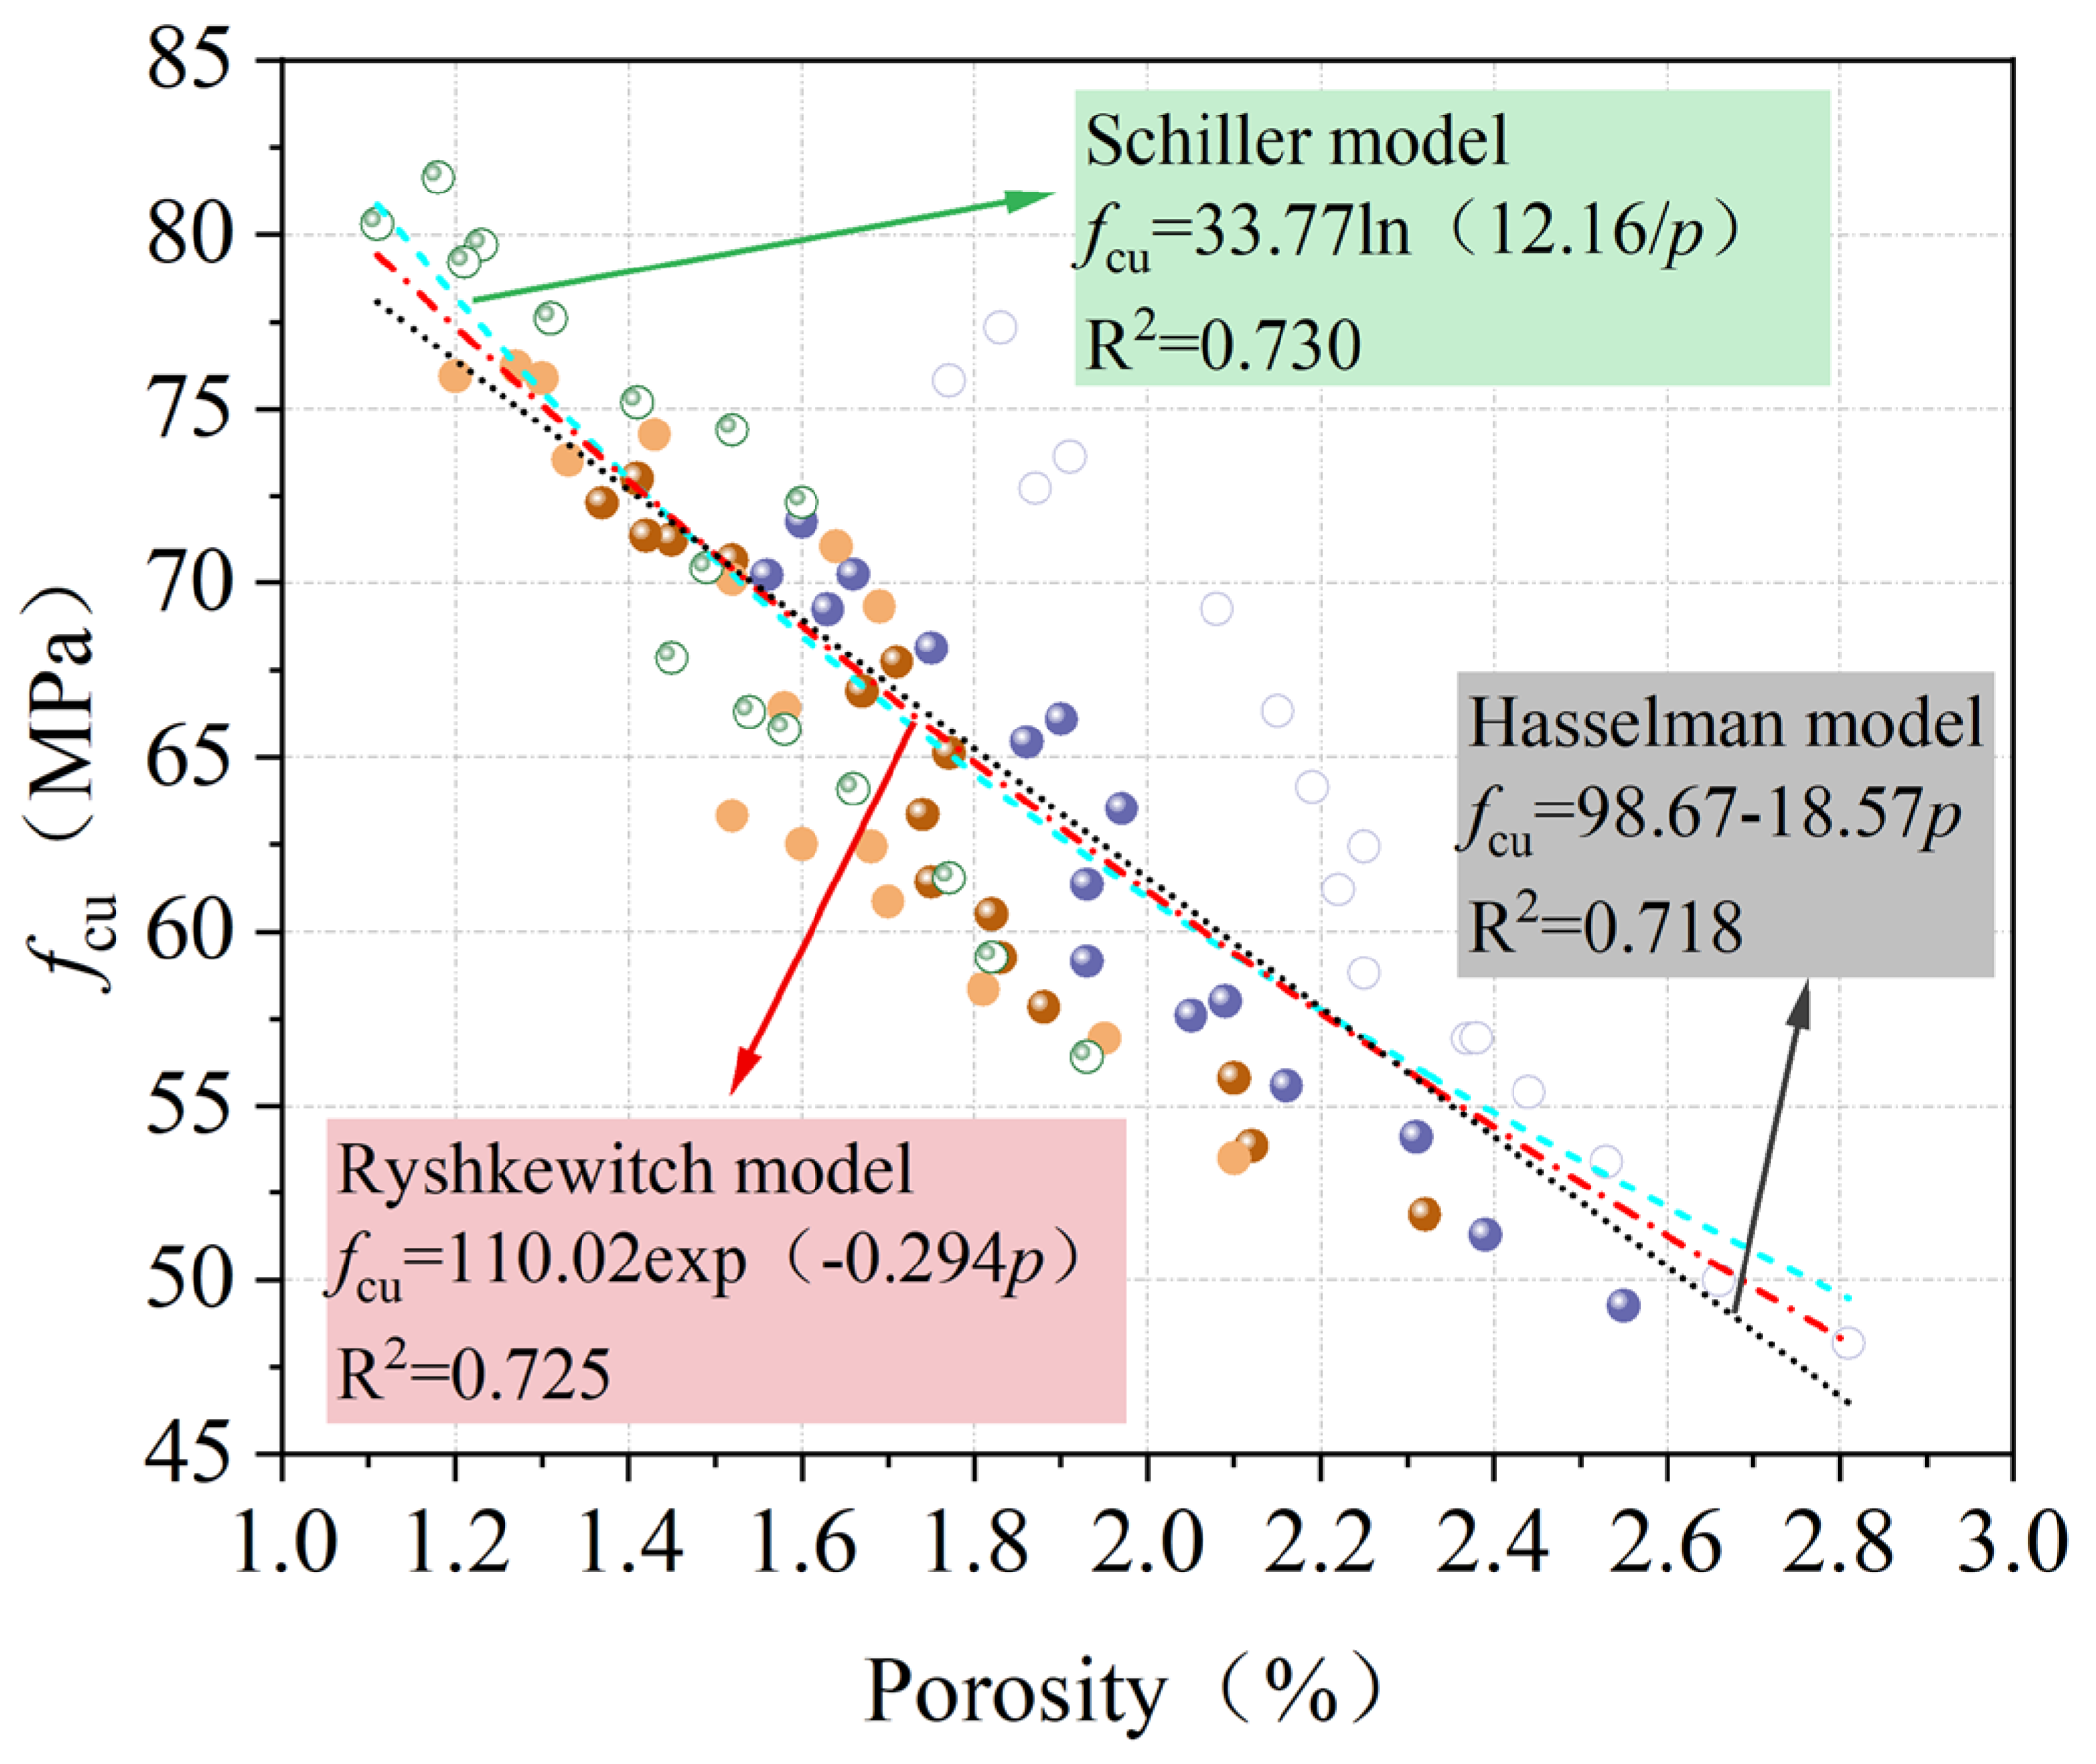
Compressive strength is an important mechanical indicator of concrete, and porosity is an important factor affecting compressive strength [51]. Based on the theoretical analysis and experimental data of previous scholars, the classic models describing the relationship between concrete compressive strength and porosity primarily include the Ryshkewitch, Hasselman, and Schiller models [52], as shown in Table 14.
Table 14.
Relationship model between compressive strength and porosity.
Based on the above mathematical models, a regression analysis was performed on the relationship between the compressive strength and porosity of MTC at different carbonation ages. The results are shown in Figure 17. It can be seen that the test results of this paper are applicable to the above three models but that the correlation coefficient R2 has not yet reached 0.75.
Figure 17.
Relationship between fcu and porosity of MTC.
3.5.2. Establishment of a Dual-Parameter Strength Model for Porosity and Average Pore Volume
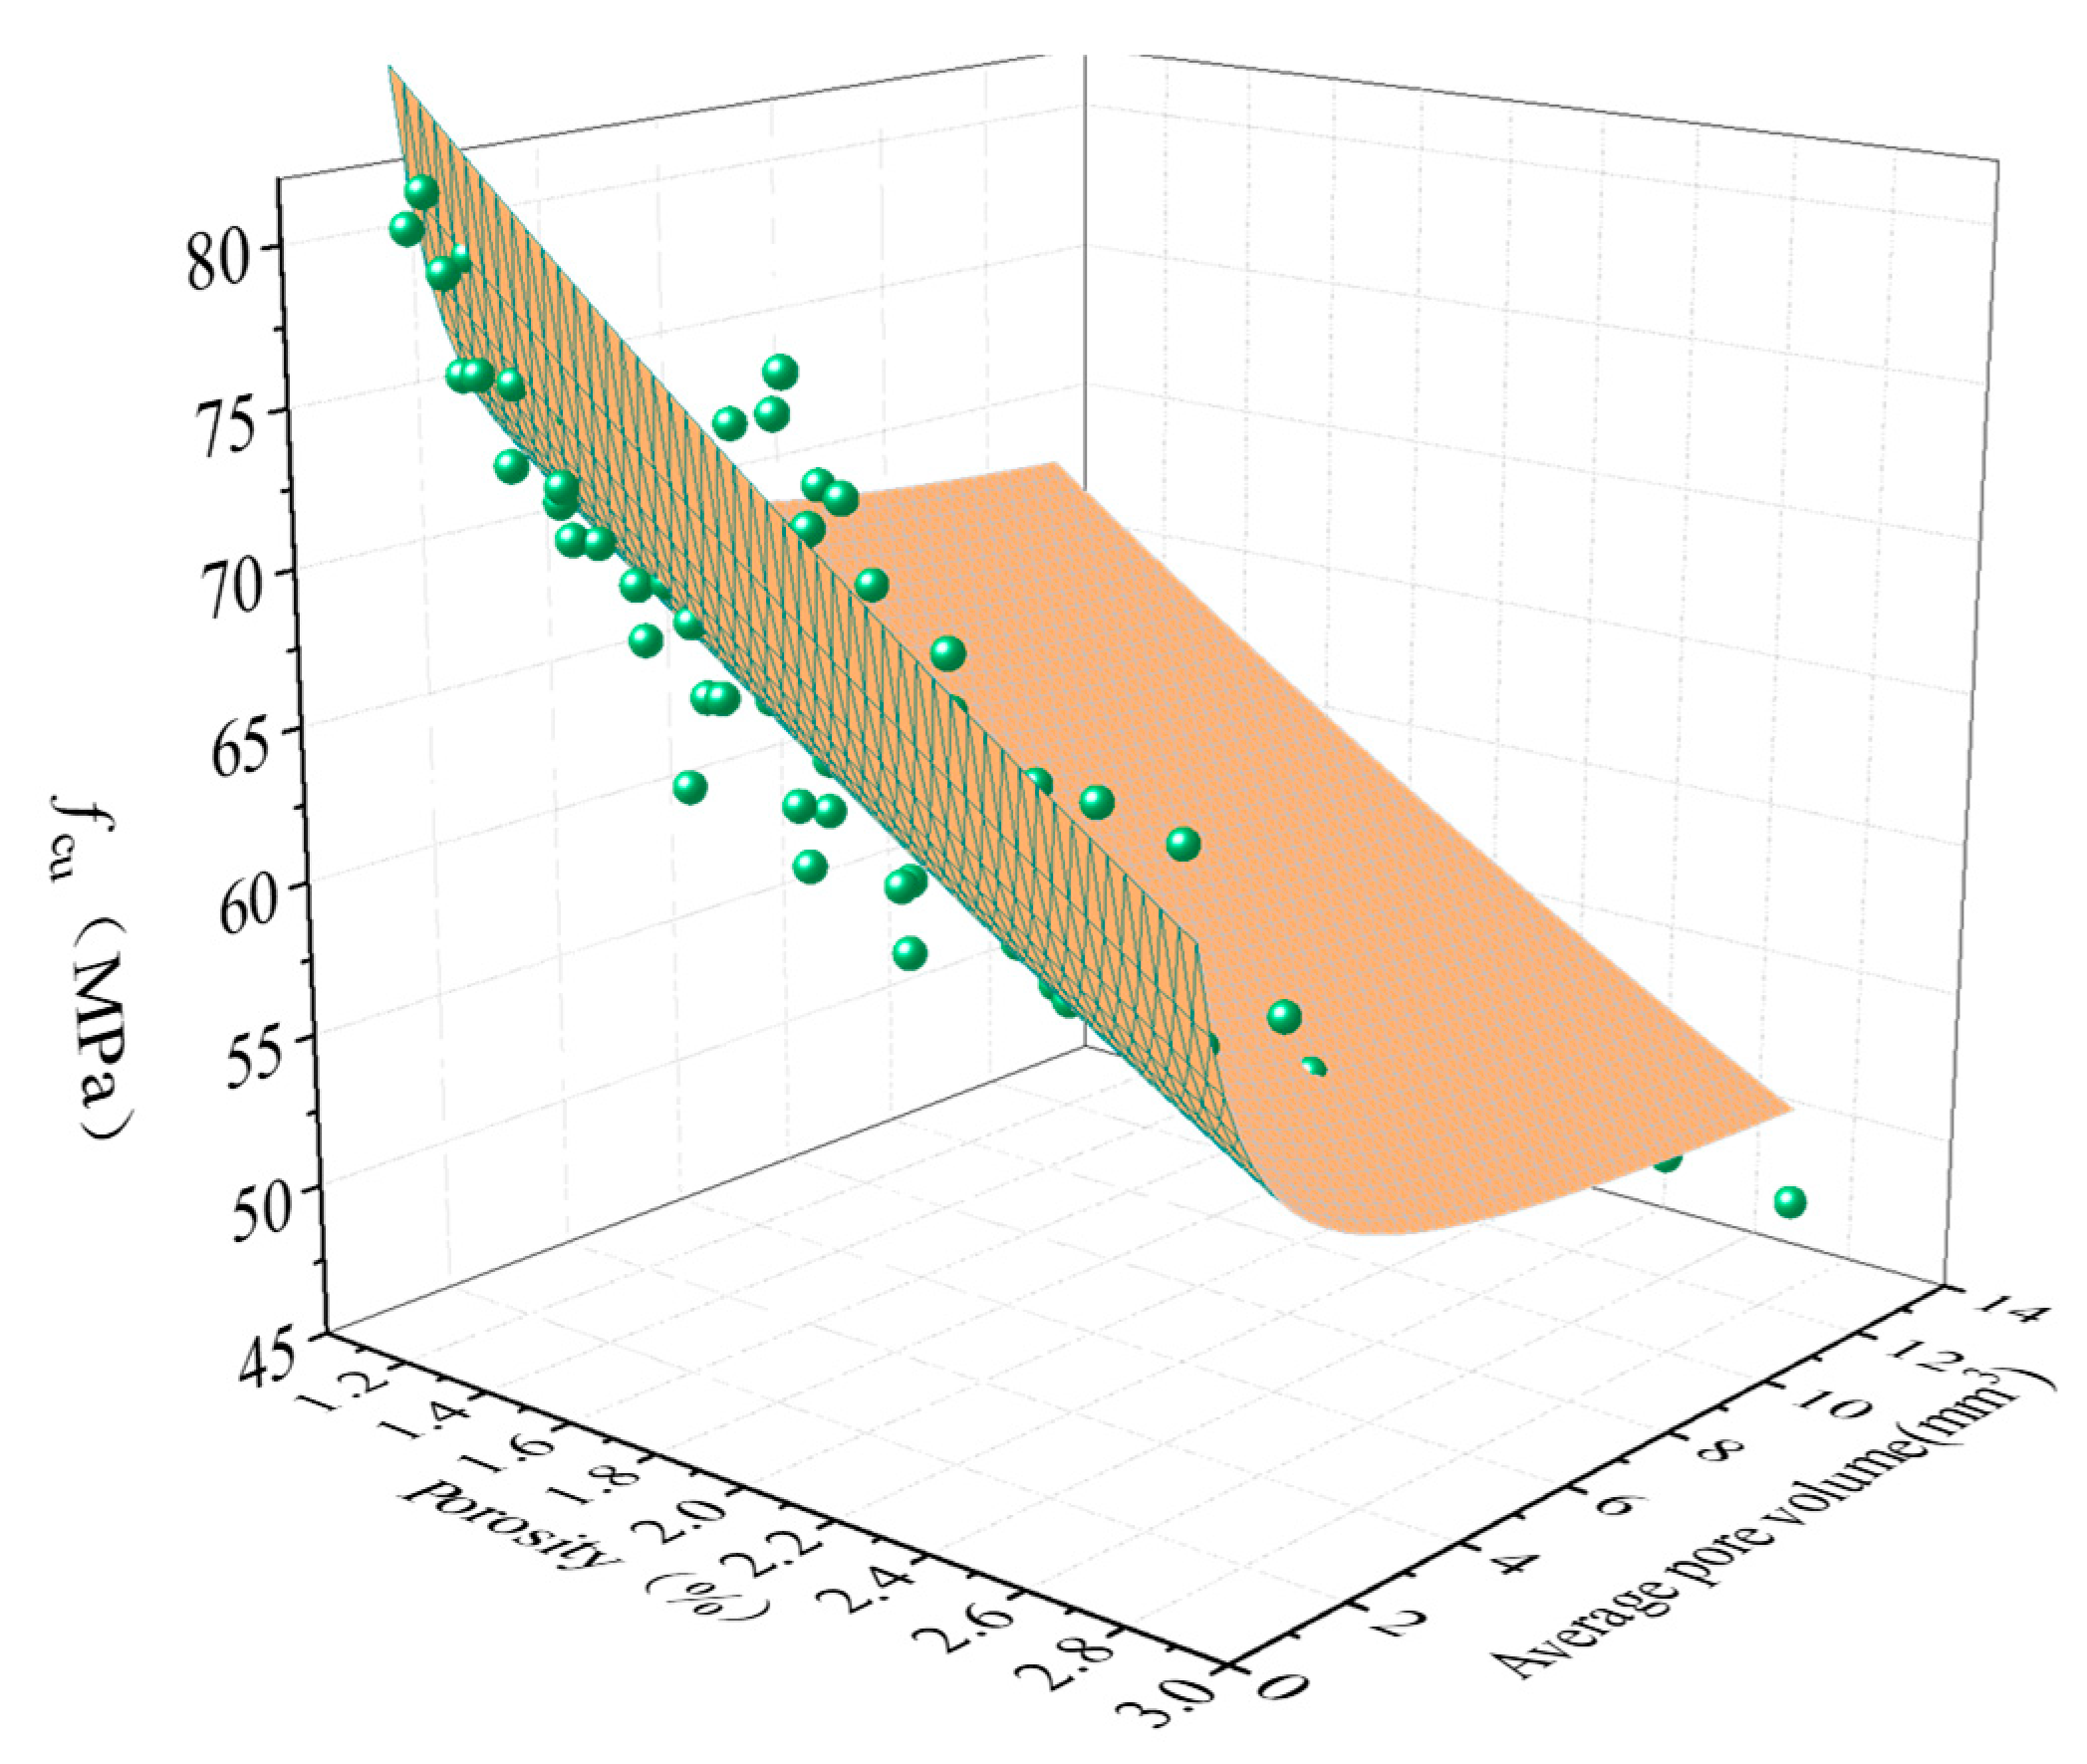
Although the above three empirical models can adequately reflect the relationship between the fcu and porosity of MTC, it is evident that the fcu of concrete should not only consider the influence of porosity but also the influence of pore volume [53,54]. Even if the total porosity of concrete is the same, the fcu of concrete with different pore volume distributions is different. Furthermore, the 3D reconstruction of the pore structure in Section 3.3 also found that pore volume may have affected concrete performance. Therefore, it is necessary to consider the effects of both porosity and pore volume on fcu. This section establishes a two-parameter model based on the effects of porosity and average pore volume on fcu. In accordance with the principle of dimensional consistency, based on the Ryshkewitch model [55], the parameter of average pore volume (V) is introduced to establish the following relationship:
where fcu is the compressive strength; f0 is the critical compressive strength; P is porosity; V is the average pore volume, mm3; V′ is the critical pore volume, mm3 (the maximum pore volume of concrete that is not affected by the microscopic pore volume); and K is the coefficient.
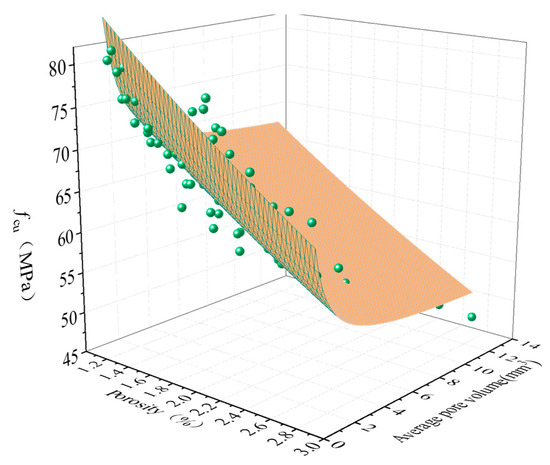
Based on Equation (6), the fcu and pore characteristics of MTC were fitted and the results are shown in Figure 18. The model expression is shown in Equation (7). It can be seen that the correlation coefficient R2 of the two-parameter fit reaches above 0.85, which is higher than the correlation coefficient of the single parameter of concrete fcu and porosity, indicating that the Ryshkewitch semi-empirical formula model can describe the quantitative relationship between the fcu of MTC and the two parameters of porosity and average pore volume well. Independent datasets for validation are unavailable, and collinearity among independent variables may impair the reliability of regression coefficients [56,57]. These models are only adopted to qualitatively reveal the correlation trend between pore structure and compressive strength under the current test conditions and cannot be used for extrapolation prediction. The regression results should not be directly applied to predict the strength of other mix proportion systems.
Figure 18.
Two-parameter relationship between fcu and porosity and average pore volume of MTC.
3.6. SEM
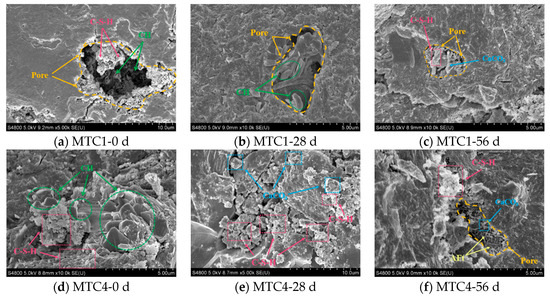
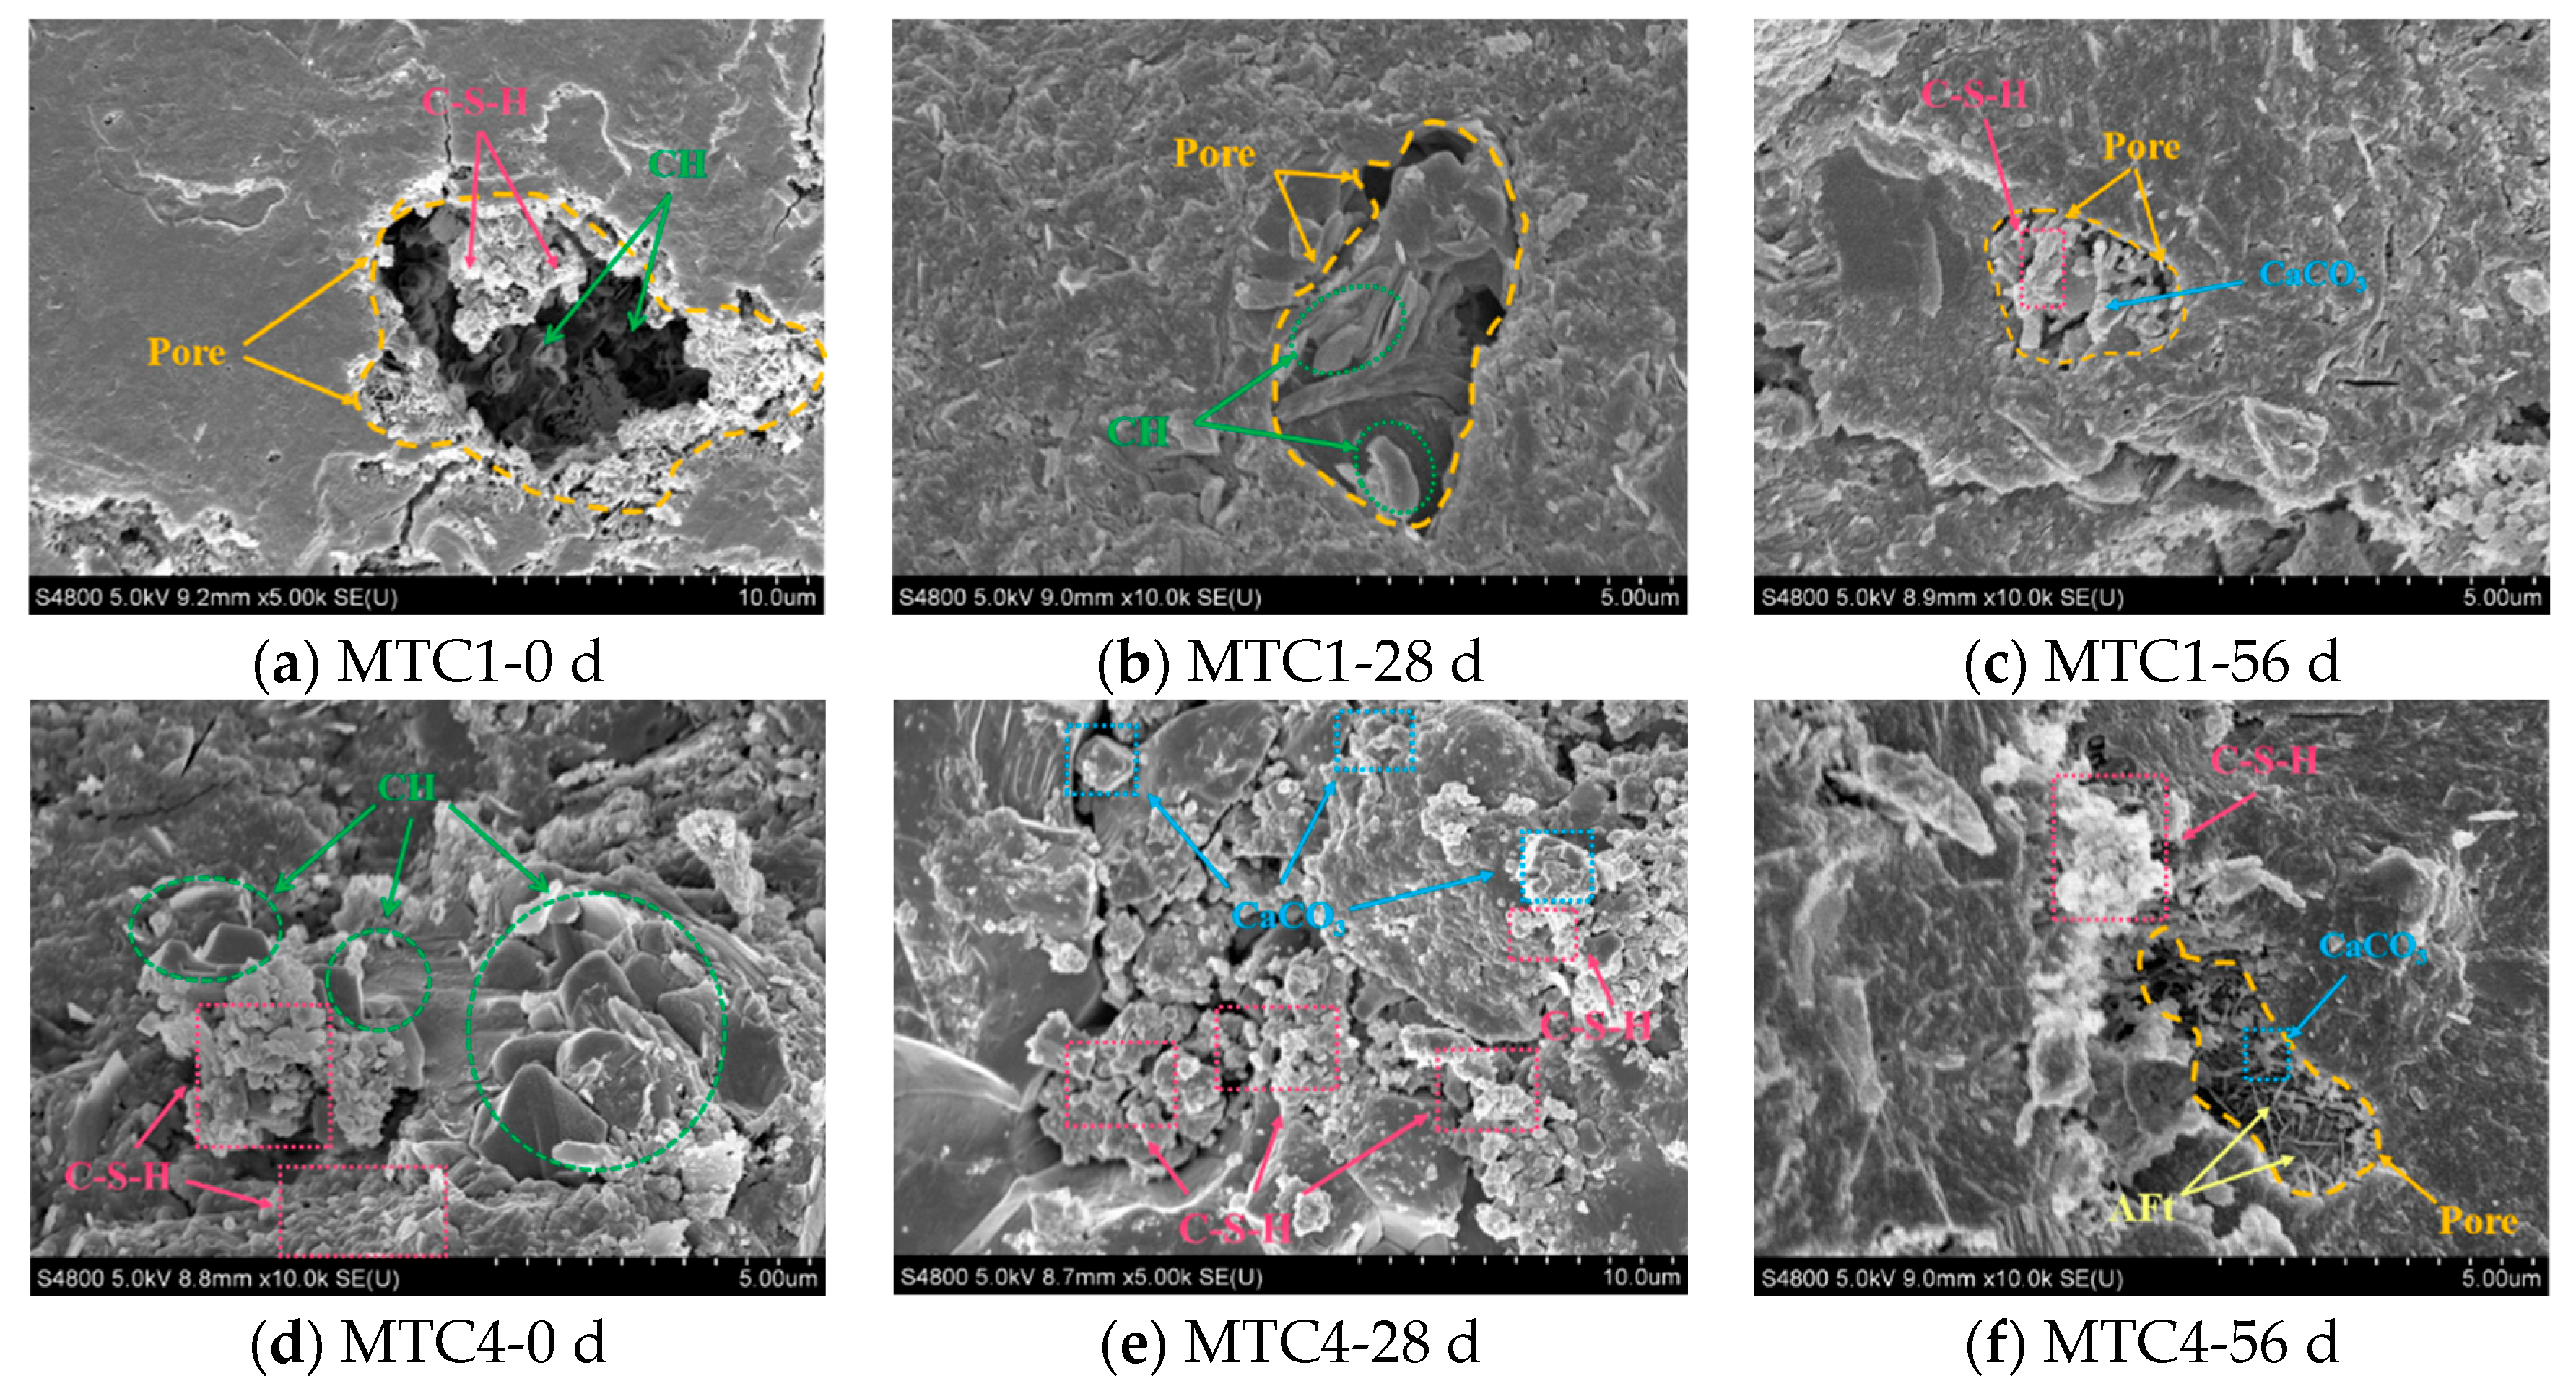
The microstructure of cement paste before carbonation, after 28 days of carbonation, and after 56 days of carbonation was examined for different MT replacement rates. The degree of the carbonation reaction and carbonation mechanism were compared and analyzed at different carbonation ages. Figure 19 shows the microstructures of MTC1 and MTC4 before carbonation, after 28 days of carbonation, and after 56 days of carbonation. Overall, both contain a large number of thin, irregularly shaped calcium hydroxide crystals (CH) and layered, dense calcium silicate hydrate gel (C-S-H) in the slurry before carbonation. After carbonization, a large amount of calcium carbonate (CaCO3) was produced [58], which existed in the form of cubic or prismatic crystals and was tightly packed together, effectively filling the pores left by alkaline substances. After 56 days of carbonation, no CH crystals were observed.
Figure 19.
Micrographs of MTC1 and MTC4 at different carbonization ages.
In detail, the evolution process of internal pores in MTC1 was selected for discussion. It can be seen that a large amount of CH crystals and C-S-H gel exist in the pores of the slurry before carbonation [59]. This is because the presence of free water in the pores makes it easier for the cement to continue to undergo hydration reactions [60]. As the carbonation reaction continues, the pores remain the primary location for the carbonation reaction. The pores are continuously filled with carbonation products, CaCO3 particles. From the MTC1 slurry sample, it can be seen that the pores are continuously filled and compacted. It can be seen that carbonation to a certain extent helps improve the compactness and overall stability of the concrete matrix. Before the carbonization of MTC4, there were mainly C-S-H gel particles and CH crystals interwoven in the matrix. After 28 days of carbonization, CaCO3 crystals were embedded in the C-S-H gel network or particles. It can be seen that CH crystals were basically consumed after 28 days of carbonation, and the generated CaCO3 expanded crystals were interwoven with C-S-H to form a more stable matrix structure. After 56 days of carbonation, CH was consumed, but C-S-H still existed and the compressive strength did not decrease, indicating that C-S-H and C-A-H had not yet been consumed at this stage. Therefore, after 56 days of rapid carbonation, carbonation still had a positive effect on the properties of MTC.
4. Conclusion
- (1)
- Carbonation significantly improved the fcu of MTC, but as the carbonation age increased, the rate of strength growth gradually slowed down, indicating that the strengthening effect of carbonation on concrete is time-dependent. This study has only investigated the strength enhancement stage, and the effect of increasing carbonation age is still being explored.
- (2)
- Carbonation products (CaCO3) fill the pores inside the concrete, reducing the total porosity. After 56 days of carbonation, the porosity can be reduced by up to 37.3%, as evidenced by the gradual disappearance of large pores at the edges and an increase in the proportion of medium-sized pores. If the carbonation time is further extended, it will affect the long-term durability of the material.
- (3)
- SEM analysis showed that the carbonation consumed the alkaline substance of CH, and the generated CaCO3 filled the macro-porous structure, optimized the structure of the ITZ, and improved the compactness of the matrix. However, the DIC strain field distribution shows that the filled part increases the brittleness characteristics of concrete (the quantitative determination of brittleness requires the post-peak curve, fracture energy, and other indicators; this study has not yet carried out the relevant tests). Therefore, it is inferred that excessive carbonation will cause CaCO3 expansion and lead to microcrack propagation, which will adversely affect the mechanical properties of concrete.
- (4)
- MTC shows good potential for improving mechanical properties and reducing porosity under a carbonation environment. The research results provide experimental support for the large-scale resource utilization of tailings solid waste.
Author Contributions
Methodology, X.Q., K.L. and J.X.; Software, J.W.; Validation, N.Z.; Formal analysis, X.Q. and J.W.; Investigation, X.Q. and X.W.; Resources, X.Q.; Data curation, X.Q., N.Z. and W.S.; Writing—original draft, X.Q.; Writing—review & editing, X.Q.; Visualization, X.Q. and K.L.; Supervision, X.W. and S.W.; Project admin-istration, X.W. and S.W.; Funding acquisition, J.X. All authors have read and agreed to the published version of the manuscript.
Funding
This research received no external funding.
Data Availability Statement
The data presented in this study are available on request from the corresponding author due to (this topic is still in the research process of the research group).
Acknowledgments
This work was supported by the Ningbo Key Research and Development Program and “Challenge-Based Recruitment” of Zhejiang, China (2024Z258) and the Ningbo Major Special Projects of Zhejiang, China.
Conflicts of Interest
The authors declare no conflict of interest.
Abbreviations
| MT | molybdenum tailings |
| MTC | molybdenum tailings concrete |
| Industrial CT | industrial computed tomography |
| SEM | scanning electron microscopy |
| fcu | compressive strength |
| fsts | splitting tensile strength |
| ITZ | interfacial transition zone |
| RS | river sand |
| FA | fly ash |
| SF | silica fume |
| DIC | digital image correlation |
| 2D | two-dimensional |
| 3D | three-dimensional |
References
- Sevim, C.; Zincir, B. Selection of optimum sustainable biofuel for maritime transportation using analytic hierarchy process. J. Mar. Eng. Technol. 2025, 25, 90–105. [Google Scholar] [CrossRef] [Scilit]
- da Veiga, R.M.; von Randow, C.; Burton, C.; Kelley, D.I.; Cardoso, M.; Morelli, F. Review article: Fire emissions in the Brazilian Cerrado—Dynamics, estimates, management, and their role in the global carbon budget. Nat. Hazards Earth Syst. Sci. 2025, 25, 3581–3601. [Google Scholar] [CrossRef] [Scilit]
- Ahmed, W.; Ye, C.S.; Lu, G.Y.; Ng, S.T.; Liu, G.; Wang, Y.L. Low-carbon concrete comprising high-volume pozzolan and recycled Aggregate: Evaluating mechanical performance, microstructure, environmental impact, and cost efficiency. J. Clean. Prod. 2025, 518, 145796. [Google Scholar] [CrossRef] [Scilit]
- Outteridge, T.; Kinsman, N.; Ronchi, G.; Mohrbacher, H. Editorial: Industrial relevance of molybdenum in China. Adv. Manuf. 2020, 8, 35–39. [Google Scholar] [CrossRef] [Scilit]
- Gao, S.; Cui, X.W.; Zhang, S.M. Utilization of Molybdenum Tailings in Concrete Manufacturing: A Review. Appl. Sci. 2020, 10, 138. [Google Scholar] [CrossRef] [Scilit]
- Yuan, J.; Zhao, X.; Tian, L.M.; Hou, Z.L.; Pan, Y.F.; He, J. Experimental Study on Axial Compression Behavior of Molybdenum Tailings Concrete Column Confined by GFRP. Buildings 2024, 14, 3779. [Google Scholar] [CrossRef] [Scilit]
- Li, Y.T.; Dang, F.N.; Zhou, M.; Zhou, J.F. Influence of molybdenum tailings replacing river sand on mechanical properties and concrete microstructure. Constr. Build. Mater. 2024, 435, 136897. [Google Scholar] [CrossRef] [Scilit]
- Yan, H.; Xiang, Y.; Song, Y. Comprehensive Utilization of Mo-Cu-Fe Polymetallic Ore. Chin. J. Rare Met. 2011, 35, 89–95. [Google Scholar]
- Habib, A.; Barakat, S.; Dirar, S.; Al-Toubat, S.; Al-Sadoon, Z.A. Evaluating suitability of regression models in small data regimes using concrete with recycled copper tailings as a case study. Sustain. Struct. 2024, 4, 000056. [Google Scholar] [CrossRef] [Scilit]
- Cui, L.Y.; Wang, L.; Xu, Y.; Lou, X.; Wang, H. Feasibility Evaluation of Replacing River Sand with Copper Tailings. Sustainability 2021, 13, 7575. [Google Scholar] [CrossRef] [Scilit]
- Ghazi, A.B.; Jamshidi-Zanjani, A.; Nejati, H. Utilization of copper mine tailings as a partial substitute for cement in concrete construction. Constr. Build. Mater. 2022, 317, 125921. [Google Scholar] [CrossRef] [Scilit]
- Hamada, H.M.; Al-Attar, A.; Askar, M.K.; Beddu, S.; Majdi, A. Enhancing sustainable concrete with iron ore tailings as fine aggregate: Environmental and engineering perspectives. Constr. Build. Mater. 2025, 470, 140707. [Google Scholar] [CrossRef] [Scilit]
- Heraiz, H.; Mu, X.L.; Li, J.J.; Lei, B.L.; Zhang, S.Q.; Li, Y.Y.; Zhu, S.T.; Ni, W.; Hitch, M. Optimization of Ultra-High-Performance Concrete Using a Clinker-Free Binder and Iron Mine Tailings Aggregate. Minerals 2025, 15, 28. [Google Scholar] [CrossRef] [Scilit]
- Zhao, S.J.; Fan, J.J.; Sun, W. Utilization of iron ore tailings as fine aggregate in ultra-high performance concrete. Constr. Build. Mater. 2014, 50, 540–548. [Google Scholar] [CrossRef] [Scilit]
- Shi, J.; Pan, W.Z.; Kang, J.Y.; Yu, Z.Y.; Sun, G.R.; Li, J.; Zheng, K.K.; Shen, J.Y. Properties of Ultra-High Performance Concrete incorporating iron tailings powder and iron tailings sand. J. Build. Eng. 2024, 83, 108442. [Google Scholar] [CrossRef] [Scilit]
- Liu, H.B.; Zhang, C.; Jia, C.; Tao, D.D. Freeze-thaw cycle characteristics of graphite tailing concrete and steel fiber reinforced-graphite tailing concrete. Constr. Build. Mater. 2025, 462, 140006. [Google Scholar] [CrossRef] [Scilit]
- Ahmed, M.; Selmi, A.; Ghazouani, N.; Raza, A.; Mabrouk, A. Mechanical and microstructural characterization of molybdenum tailings-, GGBS- and recycled aggregate based-low carbon self-compacting concrete. Mater. Lett. 2025, 382, 137960. [Google Scholar] [CrossRef] [Scilit]
- Garcia-Troncoso, N.; Baykara, H.; Cornejo, M.H.; Riofrio, A.; Tinoco-Hidalgo, M.; Flores-Rada, J. Comparative mechanical properties of conventional concrete mixture and concrete incorporating mining tailings sands. Case Stud. Constr. Mater. 2022, 16, e01031. [Google Scholar] [CrossRef] [Scilit]
- Gao, S.; Cui, X.W.; Kang, S.B.; Ding, Y. Sustainable applications for utilizing molybdenum tailings in concrete. J. Clean. Prod. 2020, 266, 122020. [Google Scholar] [CrossRef] [Scilit]
- Quan, W.L.; Huang, W.; Mao, W.Z.; Yu, X.Y.; Zhou, X.L.; Miao, X.W.; Hou, L.A. Preparing autoclaved aerated concrete using molybdenum tailings. J. Build. Eng. 2024, 95, 110138. [Google Scholar] [CrossRef] [Scilit]
- Nguyen, Q.D.; Castel, A. Long-term durability of underground reinforced concrete pipes in natural chloride and carbonation environments. Constr. Build. Mater. 2023, 394, 132230. [Google Scholar] [CrossRef] [Scilit]
- Quan, X.Y.; Wang, S.L.; Li, J.T.; Luo, J.; Liu, K.N.; Xu, J.; Zhao, N.; Liu, Y. Utilization of molybdenum tailings as fine aggregate in recycled aggregate concrete. J. Clean. Prod. 2022, 372, 133649. [Google Scholar] [CrossRef] [Scilit]
- Jain, K.L.; Sharma, D.K.; Choudhary, R.; Bhargava, S. Impact of Waste Iron Slag on Mechanical and Durability Properties of Concrete. Jordan J. Civ. Eng. 2023, 17, 45–57. [Google Scholar] [CrossRef] [Scilit]
- Ramezanianpour, A.A.; Ghahari, S.A.; Esmaeili, M. Effect of combined carbonation and chloride ion ingress by an accelerated test method on microscopic and mechanical properties of concrete. Constr. Build. Mater. 2014, 58, 138–146. [Google Scholar] [CrossRef] [Scilit]
- GB/T 1346-2011; Cement Standard Consistency Water Consumption, Setting Time, Stability Test Method. Standards Press of China: Beijing, China, 2011.
- Liu, S. Study on the Preparation of High Strength Concrete by Fine Particle Molybdenum Tailings; Hebei University of Engineering: Handan City, China, 2017. [Google Scholar]
- Gao, S.; Zhao, G.H.; Guo, L.H.; Zhou, L.Q.; Cui, X.W.; Yang, H.P. Mechanical properties of circular thin-tubed molybdenum tailing concrete stubs. Constr. Build. Mater. 2021, 268, 121215. [Google Scholar] [CrossRef] [Scilit]
- Liu, Y.; Zhang, Y.F.; Chen, F.F.; Zhang, Y. The alkaline leaching of molybdenite flotation tailings associated with galena. Hydrometallurgy 2012, 129, 30–34. [Google Scholar] [CrossRef] [Scilit]
- Romero, M.; Padilla, I.; Contreras, M.; Lopez-Delgado, A. Mullite-Based Ceramics from Mining Waste: A Review. Minerals 2021, 11, 332. [Google Scholar] [CrossRef] [Scilit]
- CECS 207: 2006; Technical Specification for Application of High Performance Concrete. China Plan Publishing House: Beijing, China, 2006.
- Sheng, X.W.; Xiao, S.M.; Zheng, W.Q.; Yang, Y.; Ma, K.L. Hydration kinetics analysis of cementitious paste composites produced by binary and ternary binder materials for potential use in massive concrete structures. Case Stud. Constr. Mater. 2023, 18, e02209. [Google Scholar] [CrossRef] [Scilit]
- GB/T 50082-2009; Standard for Test Methods for Long-Term Performance and Durability of Ordinary Concrete. Ministry of Housing and Urban-Rural Development of China: Beijing, China, 2009.
- JG/T 247-2009; Concrete Carbonation Test Box. Ministry of Housing and Urban-Rural Development of China: Beijing, China, 2009.
- Li, T.; Chen, X.Y.; Yang, W.Y.; Zhan, M.; Hao, L.Y.; Zhang, L.F.; Yang, Y. Study on Carbonization Performance of Metakaolin on Tailings- and Recycled-Concrete-Based Green Concrete. Buildings 2025, 15, 2262. [Google Scholar] [CrossRef] [Scilit]
- Zhang, B.F.; Feng, Y.; Xie, J.H.; Chen, W.; Xue, Z.X.; Zhao, G.X.; Li, Y.; Li, J.L.; Yang, J. Compressive behaviour and microstructures of concrete incorporating pretreated recycled powder/aggregates: The coupling effects of calcination and carbonization. J. Build. Eng. 2023, 68, 106158. [Google Scholar] [CrossRef] [Scilit]
- Yu, Z.; Xiao, M.; Liu, P. Research status and prospect of prediction model for carbonation depth of concrete. In Proceedings of the 26th National Conference on Structural Engineering, Changsha, China, 20–22 October 2017; p. 9. [Google Scholar]
- Li, T.; Wang, S.L.; Xu, F.; Meng, X.Y.; Li, B.B.; Zhan, M. Study of the basic mechanical properties and degradation mechanism of recycled concrete with tailings before and after carbonation. J. Clean. Prod. 2020, 259, 120923. [Google Scholar] [CrossRef] [Scilit]
- Zhaer, N. Study on Carbonation Resistance and Degradation Mechanism of Desert Sand Concrete; Shihezi University: Shihezi, China, 2023. [Google Scholar]
- Li, Z.G.; Li, S. Carbonation resistance of fly ash and blast furnace slag based geopolymer concrete. Constr. Build. Mater. 2018, 163, 668–680. [Google Scholar] [CrossRef] [Scilit]
- Trussell, N.; Hårr, M.S.; Kjeka, G.; Asadi, I.; Endrerud, P.E.; Jacobsen, S. Anisotropy and macro porosity in wet sprayed concrete: Laminations, fibre orientation and macro pore properties measured by image analysis, PF test, water penetration and CT scanning. Constr. Build. Mater. 2023, 389, 131715. [Google Scholar] [CrossRef] [Scilit]
- Zheng, W.B.; Wang, S.L.; Quan, X.Y.; Qu, Y.; Mo, Z.K.; Lin, C.J. Carbonation Resistance and Pore Structure of Mixed-Fiber-Reinforced Concrete Containing Fine Aggregates of Iron Ore Tailings. Materials 2022, 15, 8992. [Google Scholar] [CrossRef] [Scilit] [PubMed]
- Li, B.X.; Huang, L.; Yin, S.; Chen, X.; Zhao, Q.L. Carbonation resistance of recycled sand concrete and its splitting tensile strength after carbonation. J. Build. Eng. 2025, 99, 111533. [Google Scholar] [CrossRef] [Scilit]
- Li, G.; Zhuang, Z.; Lv, Y.J.; Wang, K.J.; Hui, D. Enhancing carbonation and chloride resistance of autoclaved concrete by incorporating nano-CaCO3. Nanotechnol. Rev. 2020, 9, 998–1008. [Google Scholar] [CrossRef] [Scilit]
- He, J.; Gao, Q.; Wu, Y.H.; He, J.H.; Pu, X.L. Study on improvement of carbonation resistance of alkali-activated slag concrete. Constr. Build. Mater. 2018, 176, 60–67. [Google Scholar] [CrossRef] [Scilit]
- Liu, Z.H.; Chen, X.D.; Wu, P.; Cheng, X.Y. Investigation on micro-structure of self-compacting concrete modi fi ed by recycled grinded tire rubber based on X-ray computed tomography technology. J. Clean. Prod. 2021, 290, 125838. [Google Scholar] [CrossRef] [Scilit]
- Liu, F.; Tang, R.; Ma, W.W.; Yuan, X.S. Frost Resistance and Meso-deterioration Analysis of Microcapsulated Phase Change Materials Modified Concrete. J. Build. Eng. 2022, 61, 105214. [Google Scholar] [CrossRef] [Scilit]
- Zheng, X.C.; Liu, F.; Luo, T.; Duan, Y.F.; Yi, Y.; Hua, C. Study on Durability and Pore Characteristics of Concrete Under Salt Freezing Environment. Materials 2021, 14, 7228. [Google Scholar] [CrossRef] [Scilit] [PubMed]
- Zhang, S.P.; Zhao, B.H. Research on chloride ion diffusivity of concrete subjected to CO2 environment. Comput. Concr. 2012, 10, 219–229. [Google Scholar] [CrossRef] [Scilit]
- He, R.; Li, S.Y.; Fu, C.Q.; Zhou, K.W.; Dong, Z. Influence of Cyclic Drying-Wetting and Carbonation on Oxygen Diffusivity of Cementitious Materials: Interpretation from the Perspective of Microstructure. J. Mater. Civ. Eng. 2022, 34, 04022256. [Google Scholar] [CrossRef] [Scilit]
- Shi, C.; He, T.S.; Zhang, G.; Wang, X.; Hu, Y.Y. Effects of superplasticizers on carbonation resistance of concrete. Constr. Build. Mater. 2016, 108, 48–55. [Google Scholar] [CrossRef] [Scilit]
- Liu, J.S.; Wang, L.; Quan, H.Z. Strength Prediction Formula of Eco-Concrete Based on Cementitious Paste Strength and Aggregate Size. Sci. Adv. Mater. 2021, 13, 88–97. [Google Scholar] [CrossRef] [Scilit]
- Liu, L.; He, Z.; Cai, X.H.; Fu, S.J. Application of Low-Field NMR to the Pore Structure of Concrete. Appl. Magn. Reson. 2021, 52, 15–31. [Google Scholar] [CrossRef] [Scilit]
- Lu, Q.; Qiu, Q.L.; Zheng, J.; Wang, J.Y.; Zeng, Q. Fractal dimension of concrete incorporating silica fume and its correlations to pore structure, strength and permeability. Constr. Build. Mater. 2019, 228, 116986. [Google Scholar] [CrossRef] [Scilit]
- Liu, P.; Cui, S.G.; Li, Z.H.; Xu, X.F.; Guo, C. Influence of surrounding rock temperature on mechanical property and pore structure of concrete for shotcrete use in a hot-dry environment of high-temperature geothermal tunnel. Constr. Build. Mater. 2019, 207, 329–337. [Google Scholar] [CrossRef] [Scilit]
- Shen, J.R.; Xu, Q.J. Effect of moisture content and porosity on compressive strength of concrete during drying at 105 degrees C. Constr. Build. Mater. 2019, 195, 19–27. [Google Scholar] [CrossRef] [Scilit]
- Teng, T.; Wang, Y.M. Fractal Characteristics of Coal Structure and Fluid Transport During Compression Failure Process. Fractal Fract. 2026, 10, 421. [Google Scholar] [CrossRef] [Scilit]
- Li, X.; Zhu, L.; Gao, F.; Liang, X.; Cao, Z.Z. Intelligent Digital Rock Physics: Advances and Perspectives from Imaging Reconstruction to Pore-Scale Multiphase Flow Simulation. Appl. Sci. 2026, 16, 6118. [Google Scholar] [CrossRef] [Scilit]
- Zhang, Y.; Wang, X.H.; Tang, X.J. Experimental Investigation and Service Life Prediction of Basalt Fiber-Iron Ore Tailing Recycled Concrete Under Carbonation-Freeze-Thaw Cycle Coupling. Buildings 2025, 15, 3995. [Google Scholar] [CrossRef] [Scilit]
- Zuo, W.; Zhao, X.; Luo, J.L.; He, Z.X.; Zhao, J.J. Investigating the impact of carbonation curing concentrations on the mechanical properties and microstructure of recycled concrete. J. Build. Eng. 2024, 96, 110465. [Google Scholar] [CrossRef] [Scilit]
- Han, J.G.; Wang, K.J.; Shi, J.Y.; Wang, Y. Mechanism of triethanolamine on Portland cement hydration process and microstructure characteristics. Constr. Build. Mater. 2015, 93, 457–462. [Google Scholar] [CrossRef] [Scilit]

Disclaimer/Publisher’s Note: The statements, opinions and data contained in all publications are solely those of the individual author(s) and contributor(s) and not of MDPI and/or the editor(s). MDPI and/or the editor(s) disclaim responsibility for any injury to people or property resulting from any ideas, methods, instructions or products referred to in the content. |
© 2026 by the authors. Licensee MDPI, Basel, Switzerland. This article is an open access article distributed under the terms and conditions of the Creative Commons Attribution (CC BY) license.