


Abstract
Rural heating renovation in Jilin Province requires systems that suit regional conditions while balancing household costs and indoor thermal conditions. This study combined a survey of 276 rural households with TRNSYS multizone simulations to assess five heating configurations in Yanji, Changchun, and Baicheng, China. Survey findings informed case selection, while simulations evaluated energy consumption, indoor temperatures, solar contribution, and life-cycle costs over a 4392 h heating season. Under the adopted operating conditions, floor heating configurations consumed 8.2% less biomass in Yanji and 13.0% less electricity in Changchun than their radiator counterparts. These reductions coincided with lower indoor temperatures and, therefore, reflect differences in complete system configurations and controls, rather than in emitter type alone. In Baicheng, useful solar heat supplied 28.3% of seasonal heat delivery, although biomass remained the principal heat source during the coldest months. Discounted costs over 15 years ranged from USD 5411 to USD 11,127, and sensitivity analysis identified relative installation costs as a key determinant of economic rankings. By linking household survey evidence with energy, economic, and hourly temperature assessments, this study provides a basis for regional heating decisions that account for local energy availability, household costs, and the indoor conditions provided.
1. Introduction
Rural heating renovation in northern China involves dispersed dwellings, limited household budgets, and different local energy supplies. Reviews of heating options identify both technical and adoption constraints [1,2], while household studies document fuel stacking and the influence of income and policy support [3,4,5]. These studies explain why equipment efficiency alone is an incomplete basis for technology selection. They do not, however, quantify the hourly indoor conditions delivered by the particular configurations considered here.
Envelope performance and heating schedules are equally important. Cui et al. examined how renovation changes winter temperatures in rural Shandong [6]. Hu et al. compared renovation choices for a detached rural dwelling in Harbin under different heating schedules [7], while Liu et al. linked envelope improvements to heating costs and emissions [8]. These studies support reducing building demand before selecting equipment. Their building stocks, climates, and operating assumptions also limit the direct transfer of reported savings to Jilin Province.
System studies have examined air source heat pumps in Harbin [9], solar heating with heat pumps in Beijing [10] and Lhasa [11], and solar and biomass systems in rural housing [12,13]. Comparisons of alternatives to raw coal highlight the influence of investment and operating assumptions [14]. More recent experiments on integrated solar building systems distinguish annual energy balances from continuous self-sufficiency [15] and assess how façade operation changes thermal performance [16]. Dynamic carbon accounting further shows why annual energy balance alone cannot establish carbon neutrality [17]. These findings support explicit temporal and accounting boundaries; they do not provide direct performance benchmarks for the biomass and hydronic systems studied here.
This study combines a survey of 276 rural households with TRNSYS multizone simulations of five heating configurations in Yanji, Changchun, and Baicheng to assess rural clean heating options in eastern, central, and western Jilin. The survey informs the selection of locally relevant engineering cases, which are evaluated using a common dwelling prototype. The main contribution is to make the hourly indoor temperatures delivered by each configuration an explicit basis for interpreting energy savings and life-cycle costs under different operating controls. For the solar and biomass system, the analysis relates solar heat delivered to the building to monthly heating demand, clarifying how seasonal solar contribution translates into support during peak winter conditions. Economic sensitivity analysis further examines whether the cost rankings persist as installation prices, maintenance costs, and component service lives change. These linked assessments identify the thermal, operational, and financial conditions that govern the suitability of heating options for rural renovation.
2. Materials and Methods
2.1. Study Area and Weather Data
Yanji, Changchun, and Baicheng represent eastern, central, and western Jilin, respectively. All three cities belong to the severe cold zone in the Chinese thermal design classification [18]. Their coordinates are 42.883° N, 129.467° E; 43.900° N, 125.210° E; and 45.620° N, 122.820° E, respectively. Meteonorm 8.0.2.24236 provided representative weather sequences [19]. The heating period covers 4392 h, from 15 October to 15 April inclusive. Over this period, the exported outdoor temperatures averaged −4.9, −5.8, and −6.9 °C, with minima of −23.7, −27.8, and −28.4 °C. Heating degree days calculated from hourly temperatures using an 18 °C reference were 4194, 4358, and 4570 K d, respectively.
2.2. Household Survey and Selection of Cases
An anonymous online questionnaire was administered through local community groups on 4 December 2025, with voluntary participation. Regional distribution and collection records identified 276 participating households, equally divided among eastern, central, and western Jilin. The sample was non-probabilistic. Questionnaire S1 contains the Chinese questionnaire, its English translation, and consent information. Questions covered dwelling conditions, heating methods, reported indoor temperatures, expenditure, affordability, subsidies, and equipment replacement preferences [20,21]. Responses were summarized as counts and percentages of valid responses, with each heating option coded as a binary variable. Regional differences were assessed using cross-tabulations and chi-squared or exact tests, with Cramér’s V quantifying association strength and Holm adjustment applied to comparisons of individual heating options. Ordinal logistic regression examined associations with four ordered levels of replacement willingness, coded from low to high, with assessment of the proportional odds assumption. Adjusted odds ratios and 95% confidence intervals were reported at a significance level of 0.05. Single-story dwellings accounted for 224 households (81.2%), informing the choice of building type. Reported biomass use in the east (27.2%), electric heating in the center (34.8%), and solar-assisted heating in the west (21.7%) provided context for examining biomass heating in Yanji, an air source heat pump in Changchun, and solar assistance to biomass heating in Baicheng. Electric heating included electric film and heat pumps, so its prevalence did not represent heat pump adoption alone. Radiator and floor heating variants in Yanji and Changchun yielded five engineering configurations. Table S1 links the survey findings to configuration selection.
2.3. Building Model and Heating Configurations
TRNSYS 18 (developed by the Solar Energy Laboratory, University of Wisconsin–Madison, Madison, WI, USA, and distributed by Thermal Energy System Specialists, LLC, Madison, WI, USA) was selected for its modular coupling of thermal zones, heat sources, storage, pumps, and switching controls. It allows the same dwelling geometry to be connected to different heating systems [22,23]. Experimental validation of other TRNSYS heat pump applications [24] supports the modeling approach, while verification of the present inputs and outputs is described below.
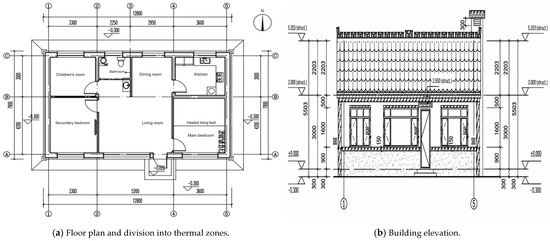
The Type-56 model represents a dwelling with 101.62 m2 gross floor area and six heated zones totaling 82.54 m2 (Figure 1). Their areas are 13.219, 9.158, 3.650, 14.443, 10.022, and 32.052 m2 for the secondary bedroom, children’s room, bathroom, main bedroom, kitchen, and living and dining room, respectively. The model uses the dimensions of the dwelling prototype directly, rather than a reduced-scale physical model. The main façade faces south. Surface azimuths follow the Northern Hemisphere TRNSYS convention: south 0°, west 90°, north 180°, and east 270°. The prototype represents the selected dwelling type, rather than every surveyed house.
Figure 1.
Dwelling geometry: (a) floor plan and division into thermal zones; (b) building elevation.
The reference envelope has wall, roof, window, and external door U values of 0.319, 0.202, 2.000, and 0.781 W/(m2 K), respectively, and floor resistance of 3.876 m2 K/W. These values describe the design inputs; the climate classification follows GB 50176 [18]. Infiltration is 0.5 h−1, with lighting and equipment gains of 5.0 and 3.8 W/m2, respectively, and room schedules. The active floor construction uses 0.20 m of XPS and two 0.10 m concrete layers surrounding the active plane, whereas the reference floor uses 0.10 m of XPS and a single 0.20 m concrete layer. Material properties, layer sequences, effective node capacitances, and initial temperatures are documented in Tables S2–S4.
All five coupled configurations were simulated with a timestep of 0.125 h (7.5 min) and integration and convergence tolerances of 0.001. The results were aggregated into hourly values. The selected timestep is consistent with previous TRNSYS studies of building energy and heat pump systems [25,26], providing a methodological basis for its use in the present simulations.
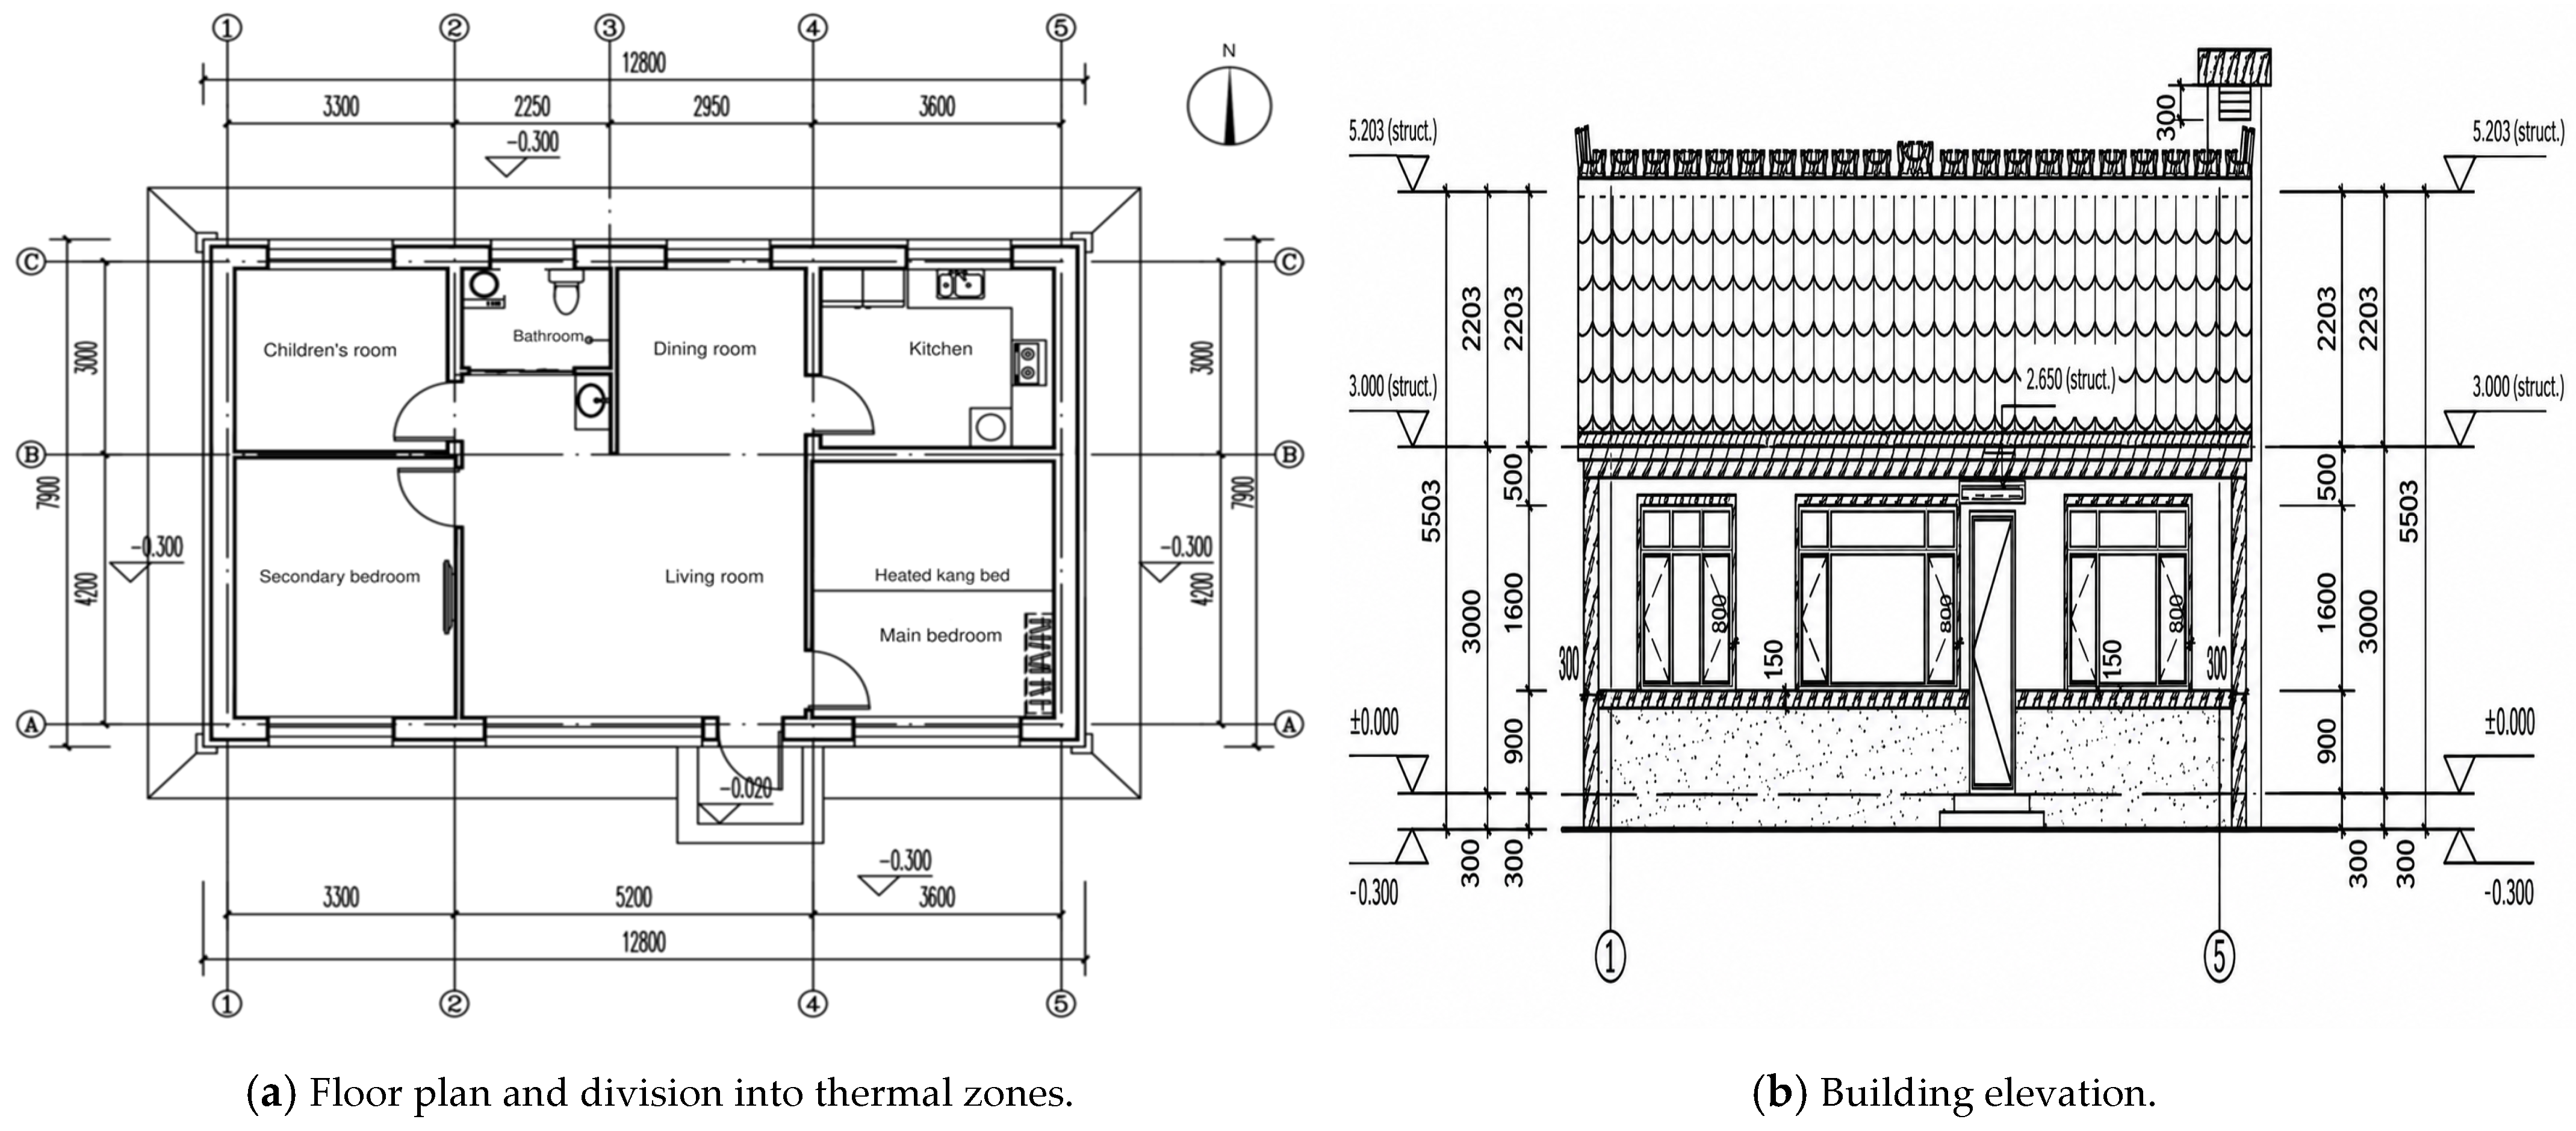
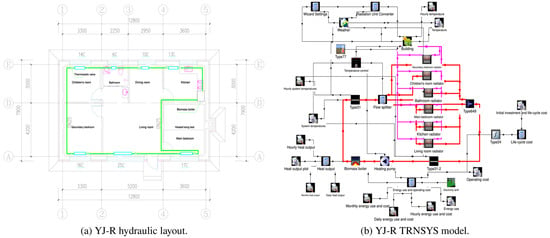
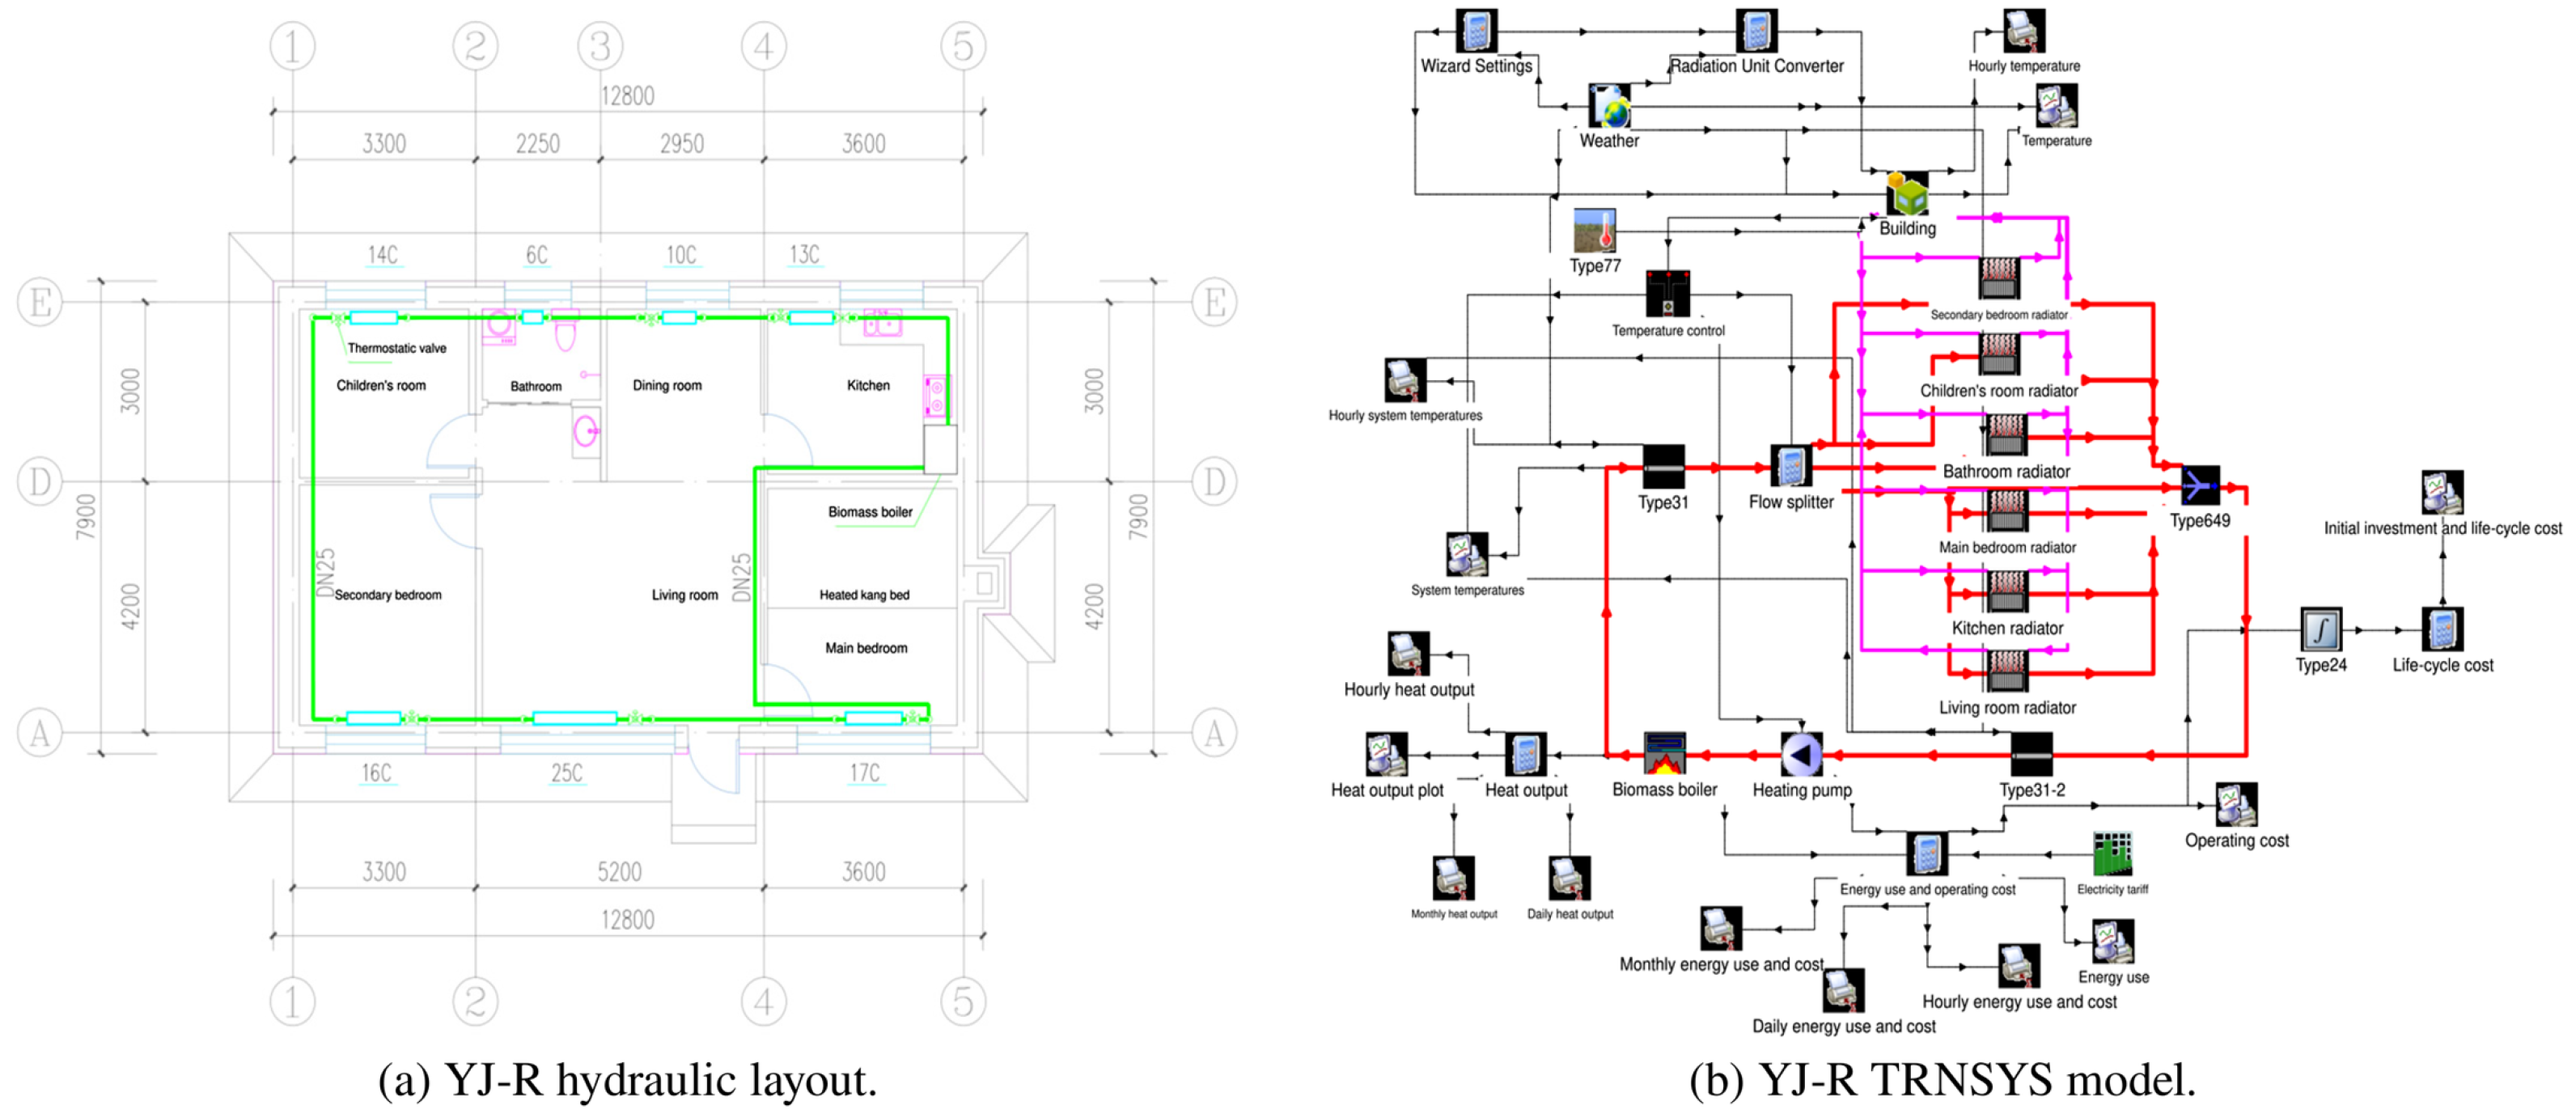
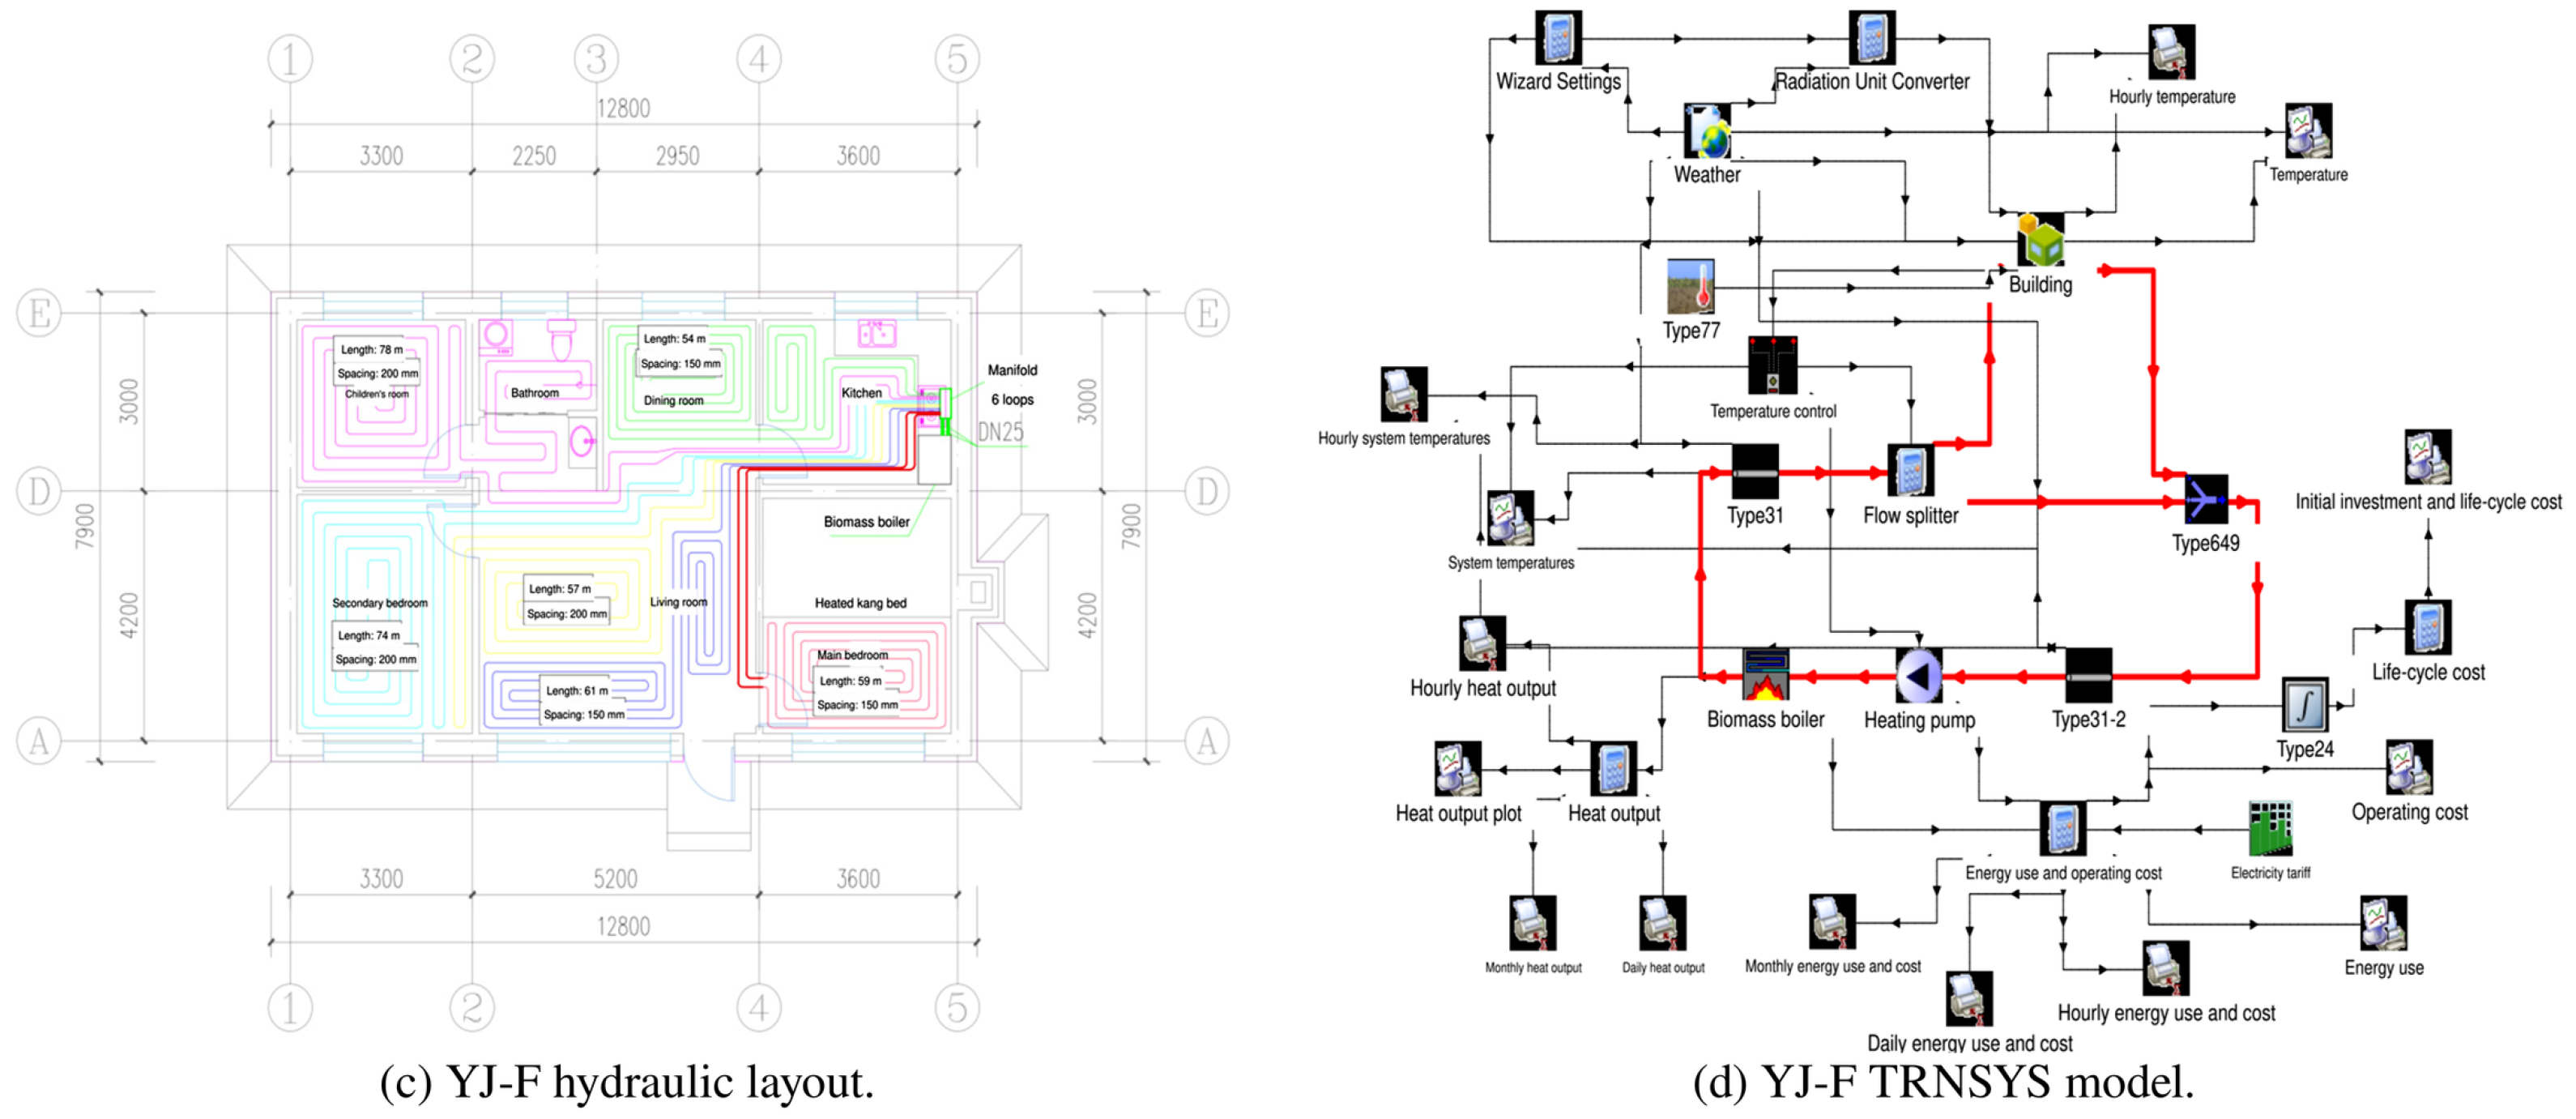
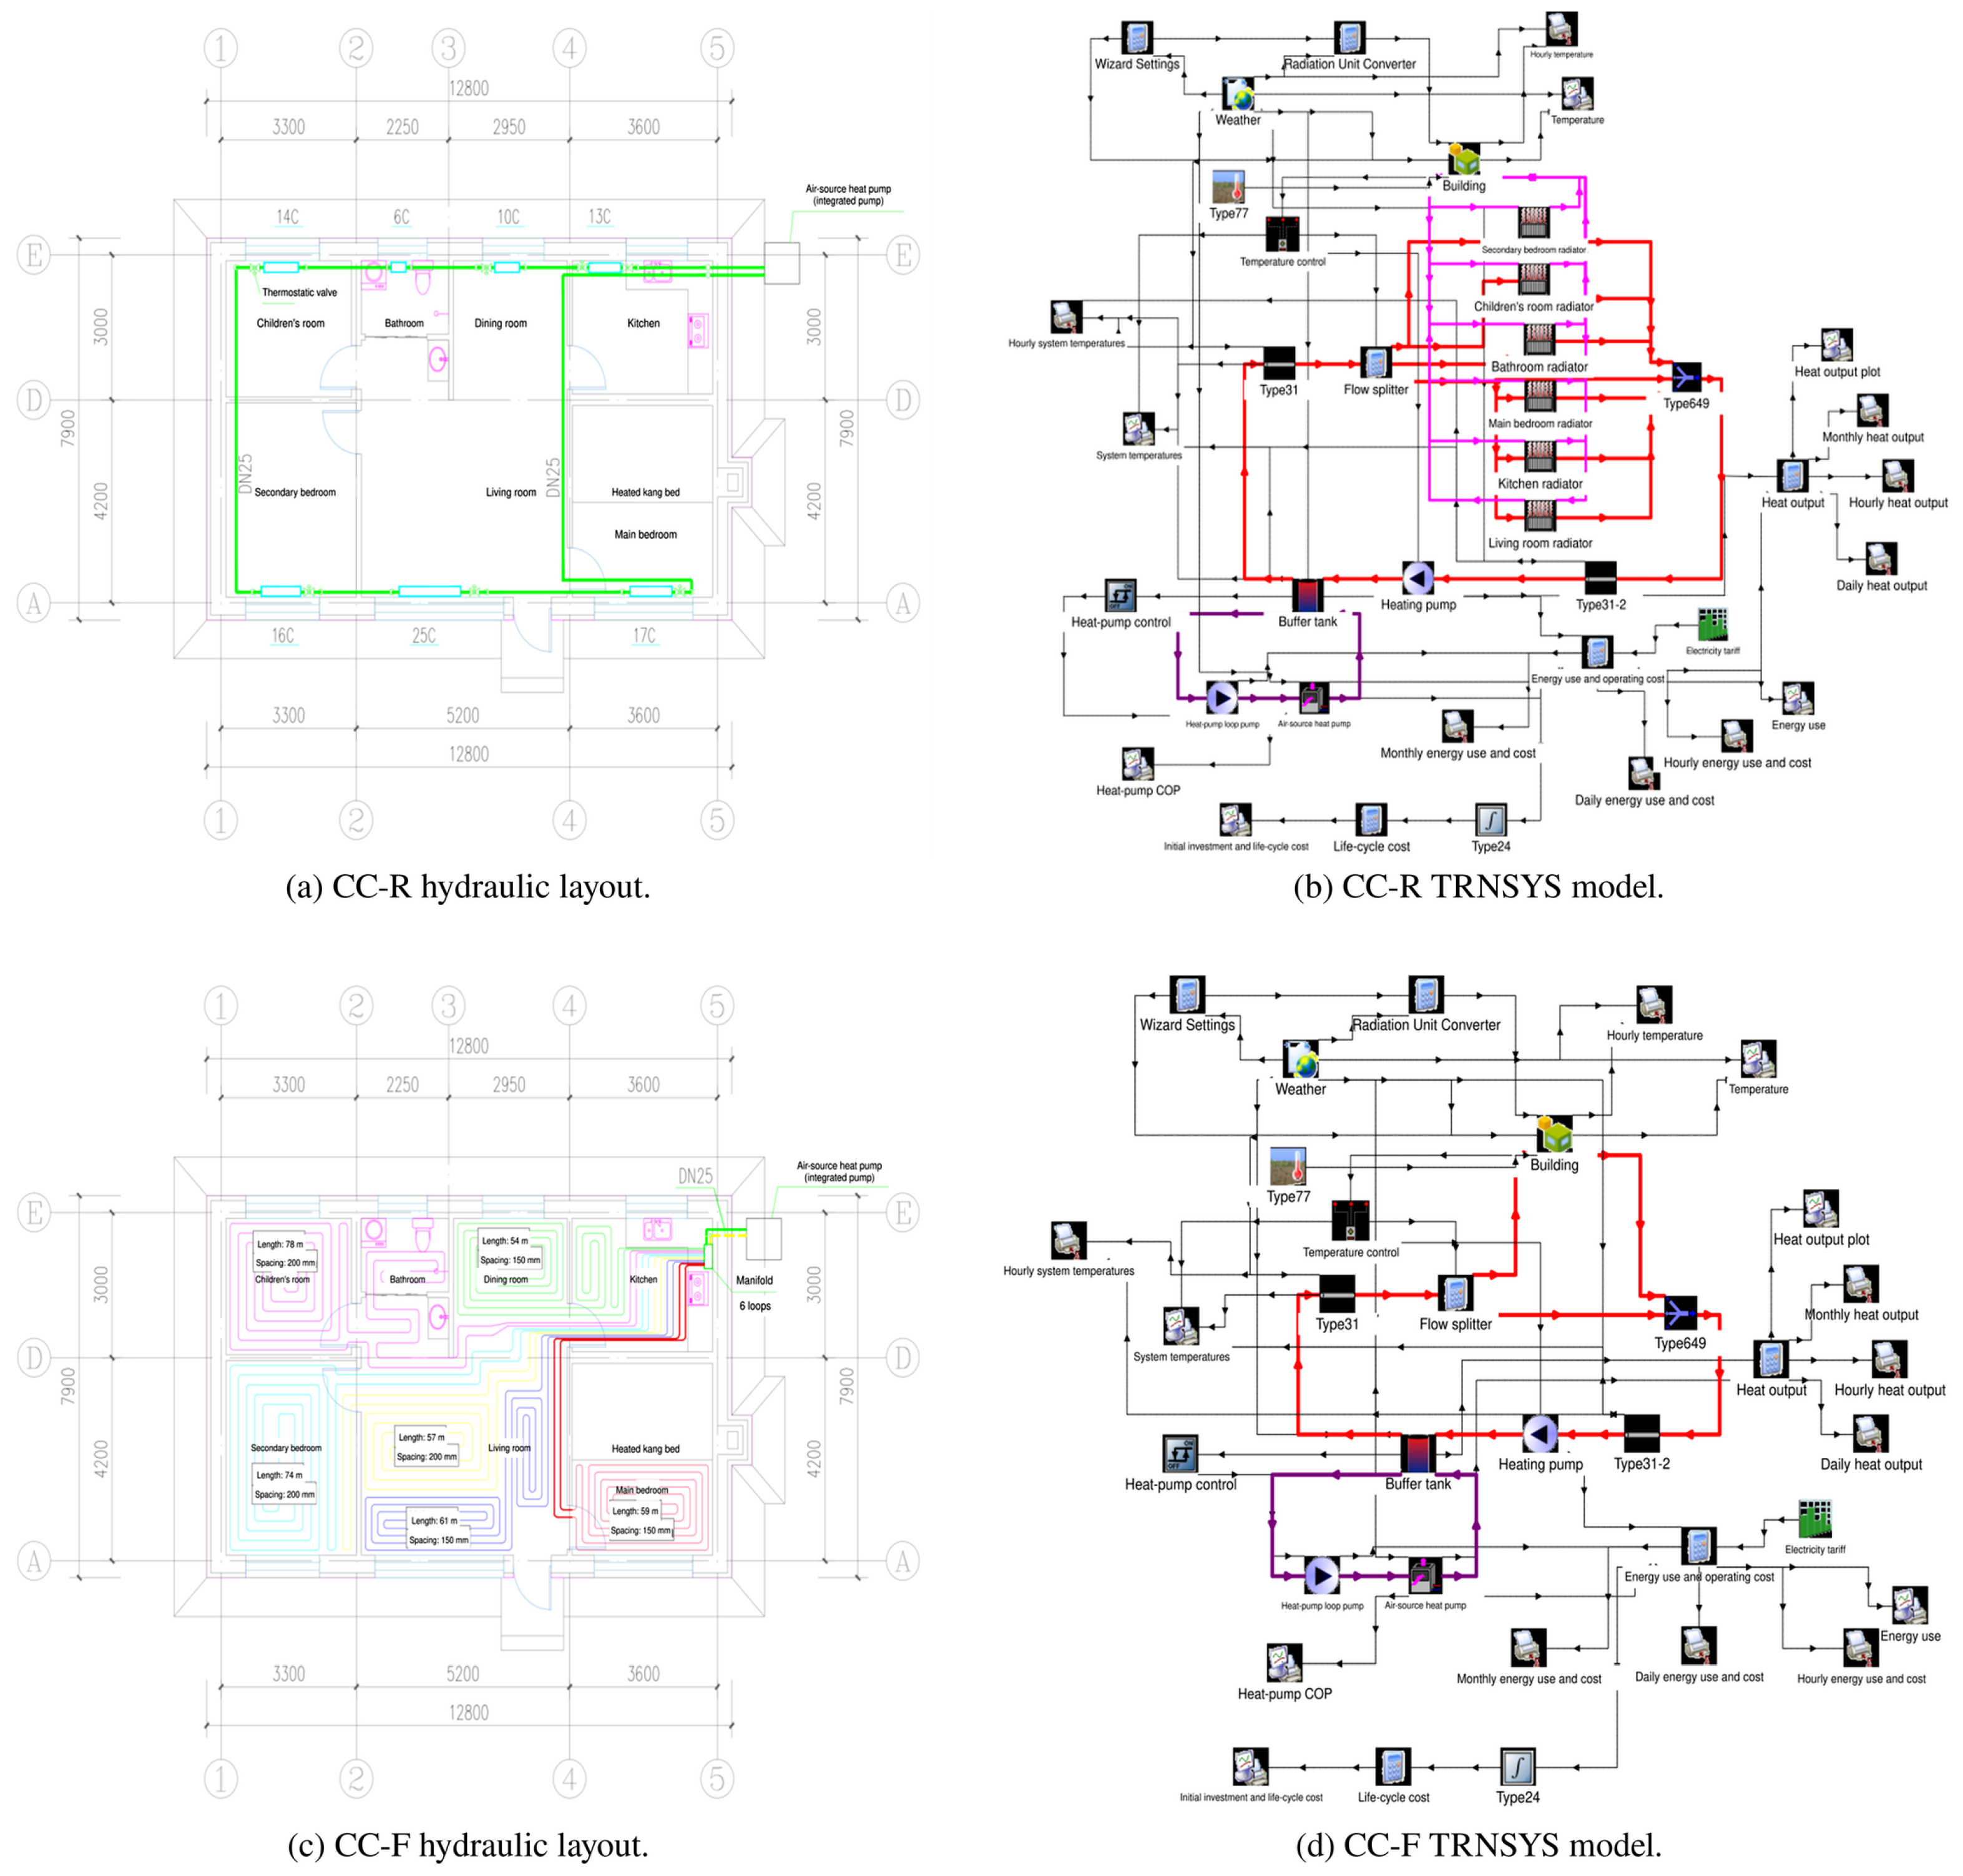
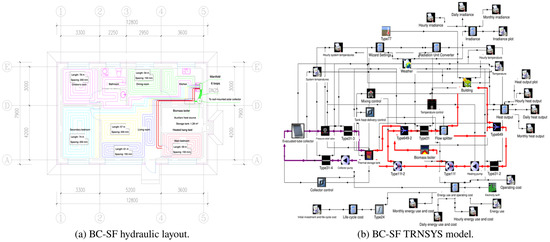
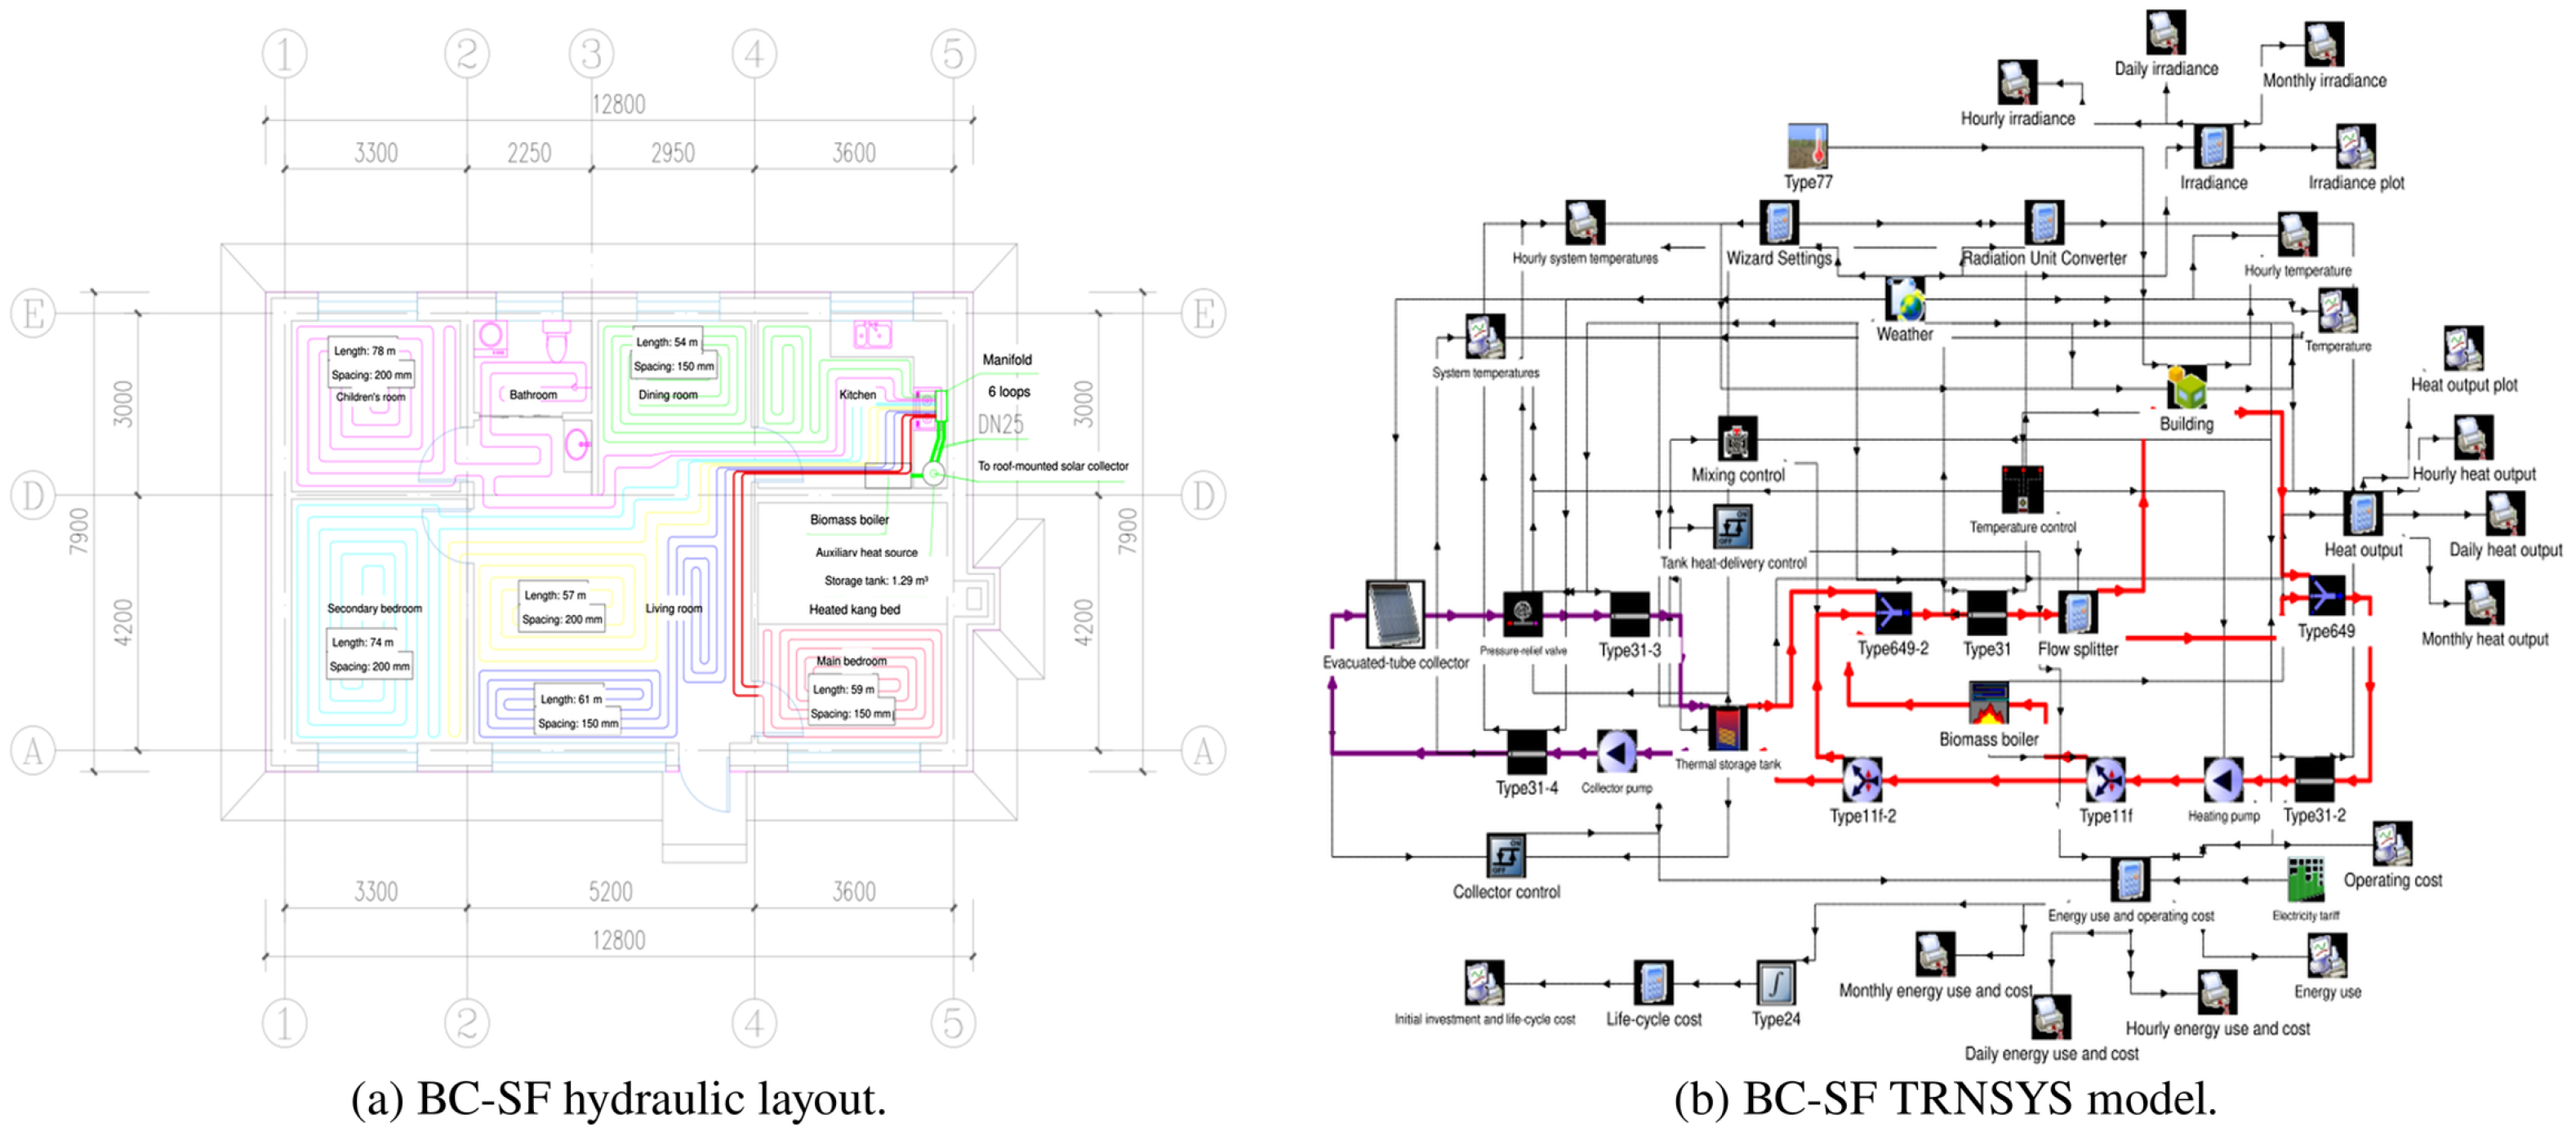
The system models use Type 700 for the biomass boiler, Type 941 for the air source heat pump, Type 538 for the collector, and Type 156 for the solar storage tank with an immersed heat exchanger. Figure 2, Figure 3 and Figure 4 show the hydraulic layouts and TRNSYS implementations. Floor heating supplies an active surface with water temperature and flow, while radiator output is assigned to each zone. The boiler efficiency is 0.80, and the biomass lower heating value is 14 MJ/kg. Temperature feedback from the six heated zones controls their heating branches; an aggregate demand signal controls circulation.
Figure 2.
Yanji biomass heating configurations: (a,b) hydraulic layout and TRNSYS model for radiators (YJ-R); (c,d) corresponding layout and model for floor heating (YJ-F).
Figure 3.
Changchun heat pump configurations: (a,b) hydraulic layout and TRNSYS model for radiators (CC-R); (c,d) corresponding layout and model for floor heating (CC-F).
Figure 4.
Baicheng solar and biomass configuration with floor heating (BC-SF): (a) hydraulic layout; (b) TRNSYS model.
Table 1 lists the configuration settings. The Type-698 room setpoints are 18 °C for radiators and 16.5 °C for floor heating, with deadband parameters of 2 °C and 1 °C, respectively. Deadband values refer to the Type-698 input parameter. They represent alternative operating specifications for the selected systems. Different radiant conditions and floor thermal inertia motivate examining different controls. In Baicheng, solar circulation starts at a collector outlet–coil outlet temperature difference of 8 °C and stops below 2 °C. Tank delivery starts at a mean tank temperature of 50 °C and stops below 45 °C; the boiler meets demand when tank delivery is unavailable.
Table 1.
Principal design and control parameters of the five configurations.
The paired configurations compare complete heating systems under their specified design and control settings. Room temperature targets, water temperatures, and floor construction differ between the radiator and floor heating cases; the Changchun configurations also differ in heat pump capacity and buffer tank volume. The reported energy and cost differences therefore reflect the combined effects of system design and operating conditions, rather than the independent effect of emitter type. These results characterize the selected configurations and do not establish an emitter ranking under equivalent indoor thermal conditions.
The Type-114 pumps were assigned the mass flow rates and electrical powers listed in Table 2. Circuit flow rates were as prescribed in the thermal models. Fluid properties, pipe dimensions, and collector settings are provided in Supplementary Material S2. For the Changchun design, the Panasonic WH-WXG16ME8 was selected according to the heating load and operating conditions [27]. The Type-941 models used the archived heating capacity and electrical power scales of 13.82 and 6.281 kW for CC-R, and 15.08 and 6.852 kW for CC-F. The normalized performance map is provided in Table S5. The product’s defrost certification [28] pertains to the physical equipment; the model does not explicitly simulate individual defrost cycles.
Table 2.
Mass flow rates and rated pump powers encoded in the system models.
2.4. Energy and Indoor Temperature Indicators
Ideal heating demand was calculated at an 18 °C target using the same dwelling geometry and weather sequence for each city. This provides a climatic reference, not the useful heat denominator of the coupled systems. The reference and coupled models retain the effective capacitances, initial states, and floor assemblies listed in Tables S2–S4. Coupled performance is evaluated from each system’s purchased electricity, biomass, delivered heat, and indoor temperature. Electricity and biomass are reported separately, without a primary energy conversion. Seasonal energy expenditure is
where Cenergy is seasonal energy expenditure, Pe(t) is purchased electrical power, pe(t) is the applicable electricity tariff, Mb is biomass consumption, pb is its unit price, and τ is the heating season. Electricity includes circulation pumps. The three tariff levels are approximately 0.0455, 0.0595, and 0.0805 USD/kWh; biomass costs 0.0658 USD/kg. The calculations use the original unrounded inputs and convert monetary results at the 2025 annual average rate of 7.1429 CNY per USD [29]. The effect of changes in these price assumptions is examined in Section 2.5.
For Changchun, seasonal performance factors (SPFs) were calculated at the heat source and system boundaries:
Instantaneous thermal and electrical powers are integrated over the same season. and PHP denote heat pump heat output and electricity input, is useful tank delivery, and Ppump is circulation electricity. The source SPF uses heat pump output and electricity, whereas the system SPF uses tank delivery and includes pump electricity [30]. Summing the corresponding integrated hourly energies gives the same ratios; SPF is not the arithmetic mean of instantaneous COP.
For Baicheng, the useful solar fraction and the ratios between solar energy quantities are
where Qs is useful solar heat delivered from the tank, Qb is boiler heat, Qcoil is net heat entering the tank through the immersed coil, and Qincident is incident energy on the collector aperture. The DCK quantity previously labeled collected heat is the sign-adjusted Type-156 coil output, not a direct Type-538 collector output. Rsolar therefore describes transfer from incident solar energy to the tank coil, and Rdelivery compares tank delivery with coil input. Neither ratio is a separate storage efficiency. All quantities retain their original signs.
Hourly indoor temperatures were summarized using an area-weighted building mean and the proportion of zone hours below 16 °C:
where Tj,h is the zone j air temperature at hour h (°C), Aj is the heated zone’s area (m2), TA,h is the building mean, and is its seasonal average. Nh is 4392, Nz is 6, and I(·) equals 1 when its condition is met and 0 otherwise. Each zone hour contributes equally to H16, whereas the building mean temperatures are weighted by floor area. The 16 °C threshold is a diagnostic indicator of exposure to low temperatures. Thermal comfort was not classified because mean radiant temperature, air speed, humidity, clothing, and activity were not evaluated.
2.5. Economic Assessment Framework
Life-cycle cost was calculated using discounted expenditure [31], with explicit terms for equipment replacement and residual value in the additional scenarios:
Here, C0 is the installed capital cost, Cenergy is the annual energy expenditure from Equation (1), Cm is annual maintenance, Cr,k is the replacement cost at year tk, Sn is the residual value at year n, r is the real discount rate, and AF is the annuity factor. The equivalent annual cost is EAC = LCC/AF. The original baseline retains n = 15 years, r = 5%, and maintenance of 0.01C0 per year, with no replacement or residual credit. Demolition, real price escalation, and subsidies are excluded. Table S7 reconstructs capital cost from component quantities and the original engineering price allowances.
Sensitivity calculations vary the discount rate from 1% to 10%, the horizon from 10 to 25 years, energy and capital prices from 0.7 to 1.3 times the baseline, and annual maintenance from 0.5% to 2% of adjusted capital. Both shared market changes and independent price changes within each city pair are examined. The ranges are deterministic stress scenarios. Seasonal energy and indoor temperatures remain those of the original simulations.
Component replacement scenarios use planning lives of 10 years for boilers and pumps; 15 years for heat pumps, tanks, and collectors; and 30 years for emitters. A shorter life case uses 10 years for heat pumps, tanks, and collectors and 25 years for emitters. These are financial assumptions, not measured failure distributions. Solar heating design guidance provides context for the collector service period [32]. Replacement occurs before, but not at, the evaluation endpoint, at 0.8, 1.1, or 1.3 times the original component cost. The residual value is either zero or proportional to the remaining asset life, excluding replacement service costs. Table S8 specifies the assumptions; Table S9 reports the results. The combined analysis covers 648 common market and service-life scenarios.
A local biomass reference for Baicheng assigns the same seasonal heat delivery entirely to the boiler using the original fuel conversion and price. Solar capital is allocated with and without retention of the tank in that reference. Common heating circulation costs are unchanged, and additional solar pump expenditure is bounded by the recorded combined pump cost. This calculation estimates equivalent fuel substitution and incremental cost; it is not a separately simulated system with identical hourly indoor temperatures. Table S10 provides the calculation.
3. Results and Discussion
3.1. Energy Use and Indoor Thermal Conditions
3.1.1. Regional Heating Demand and Its Distribution Among Rooms
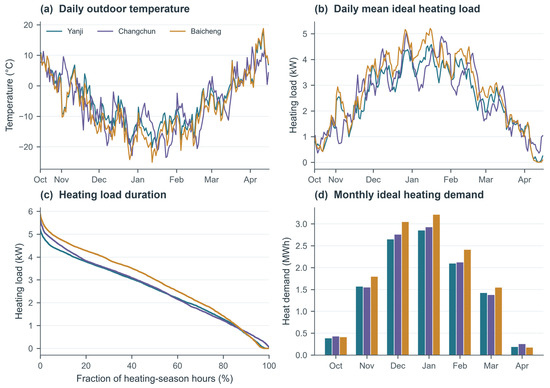
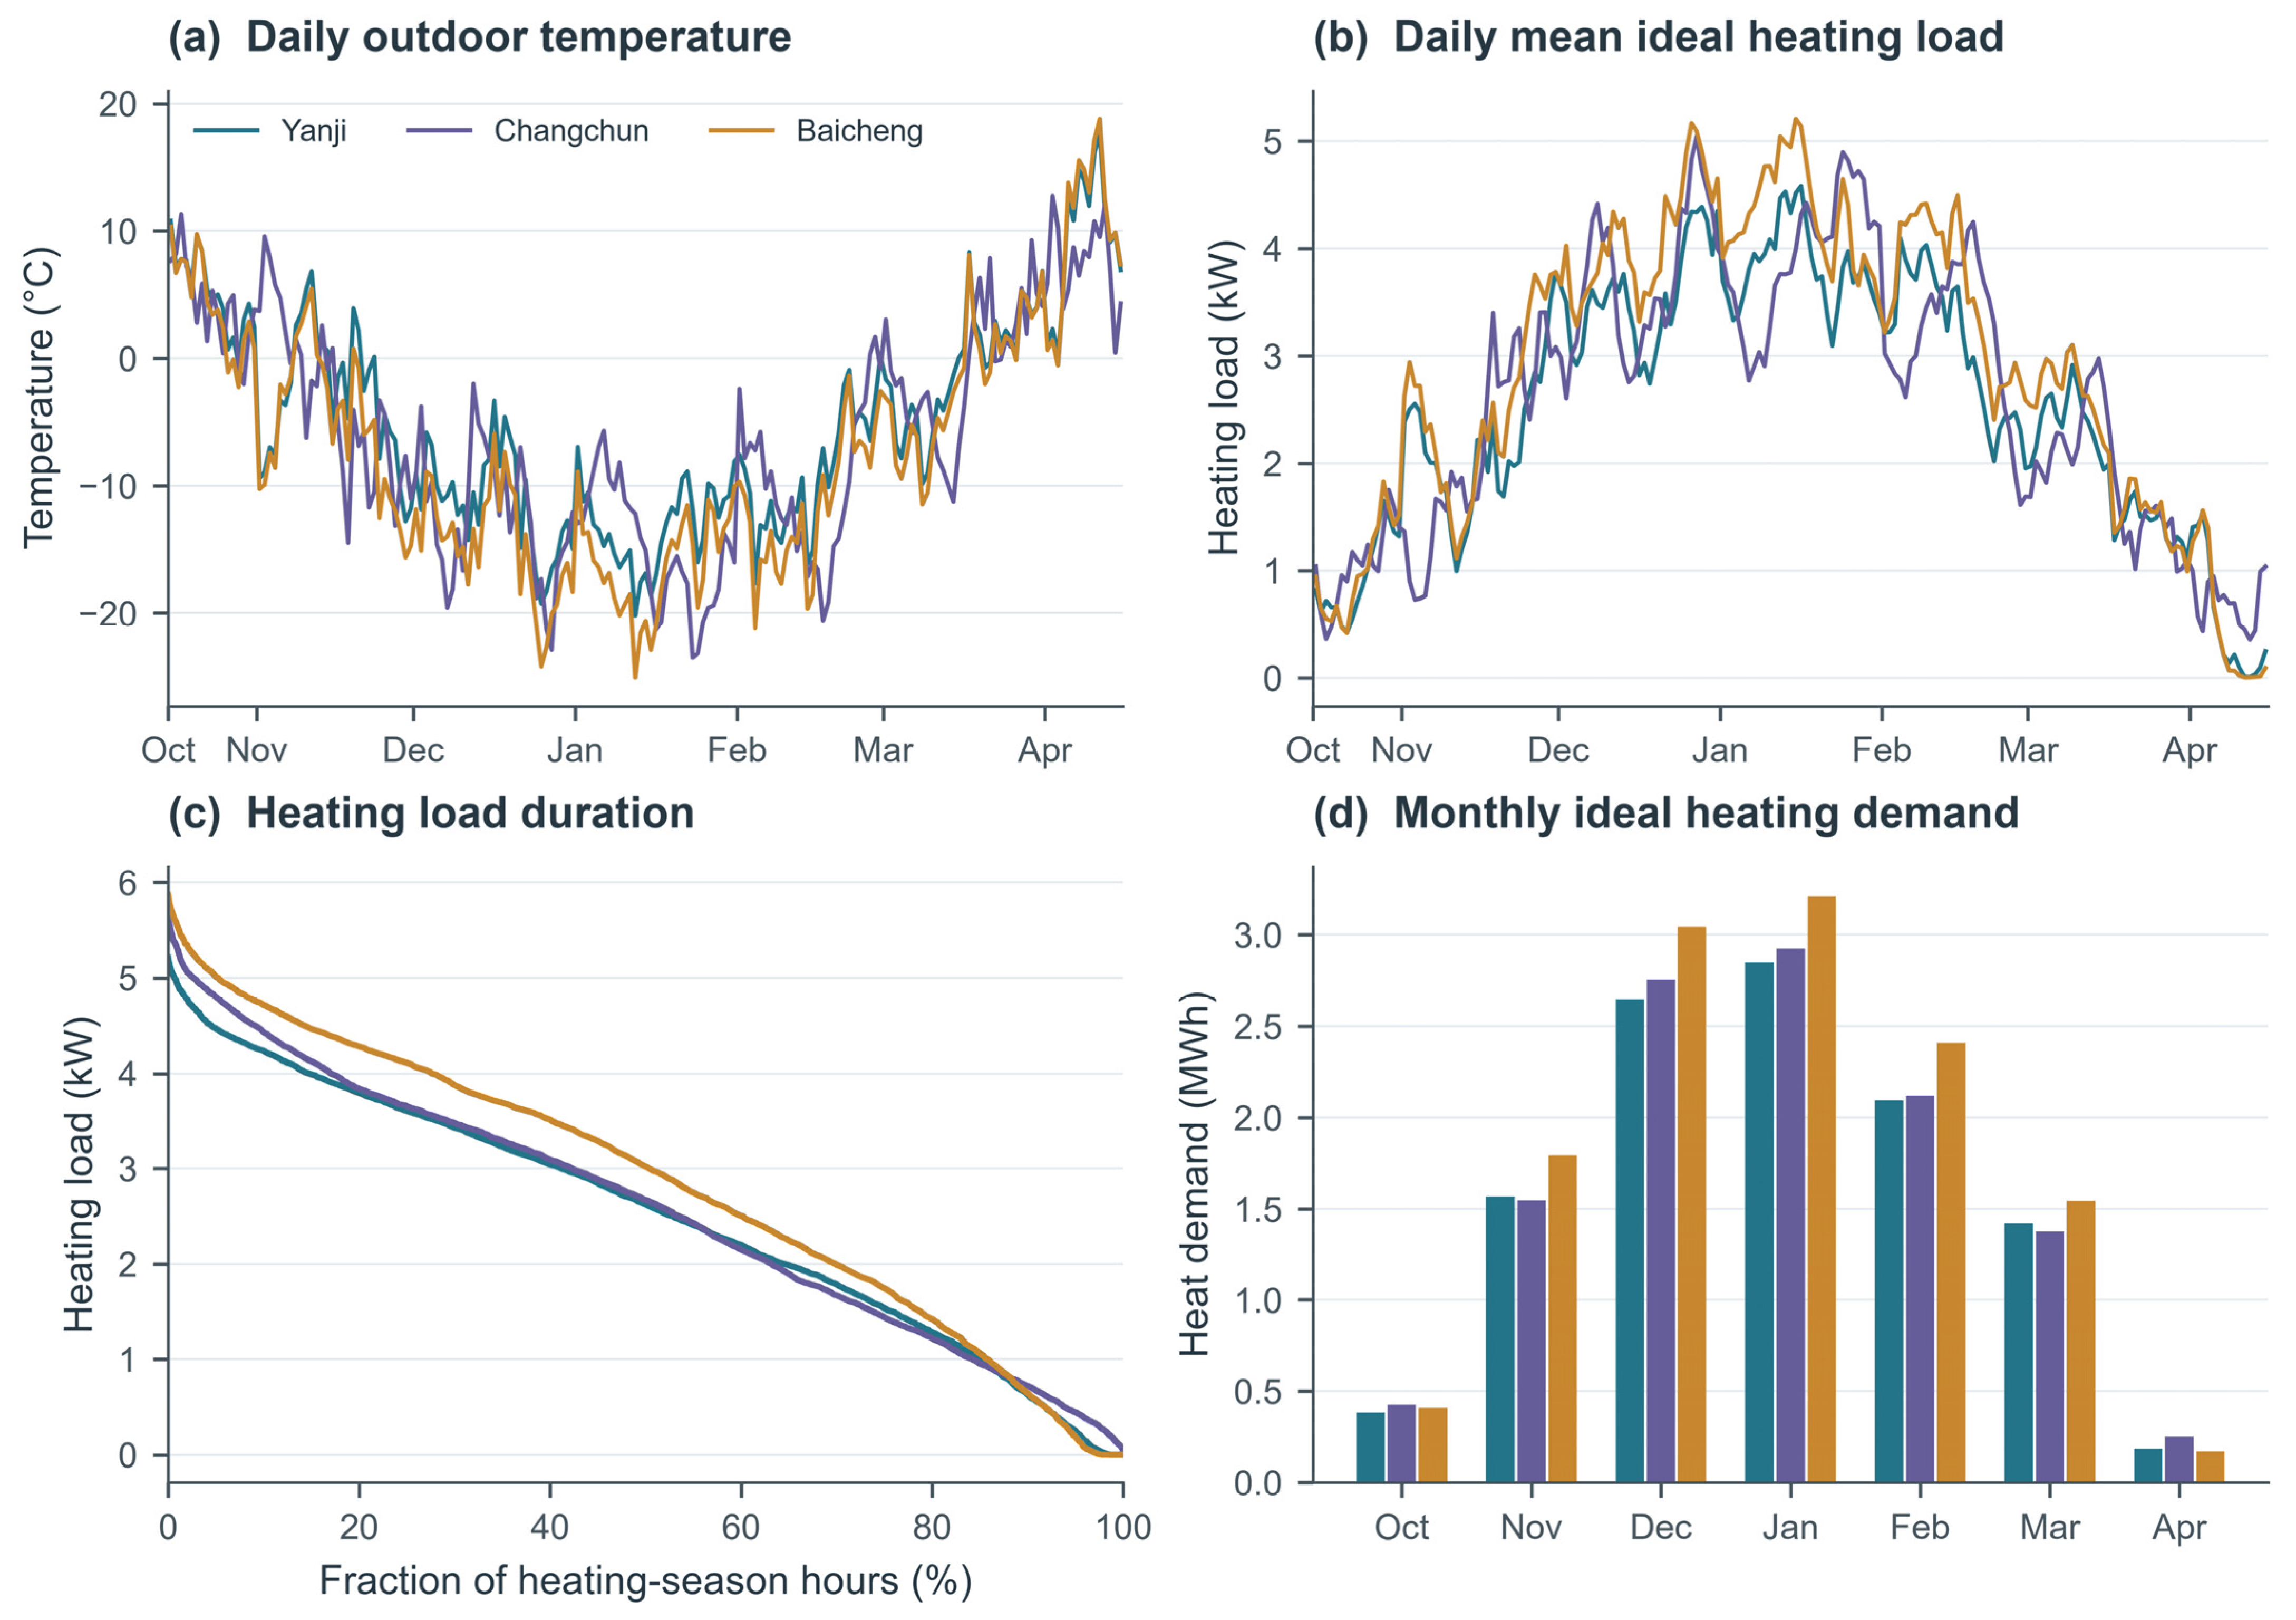
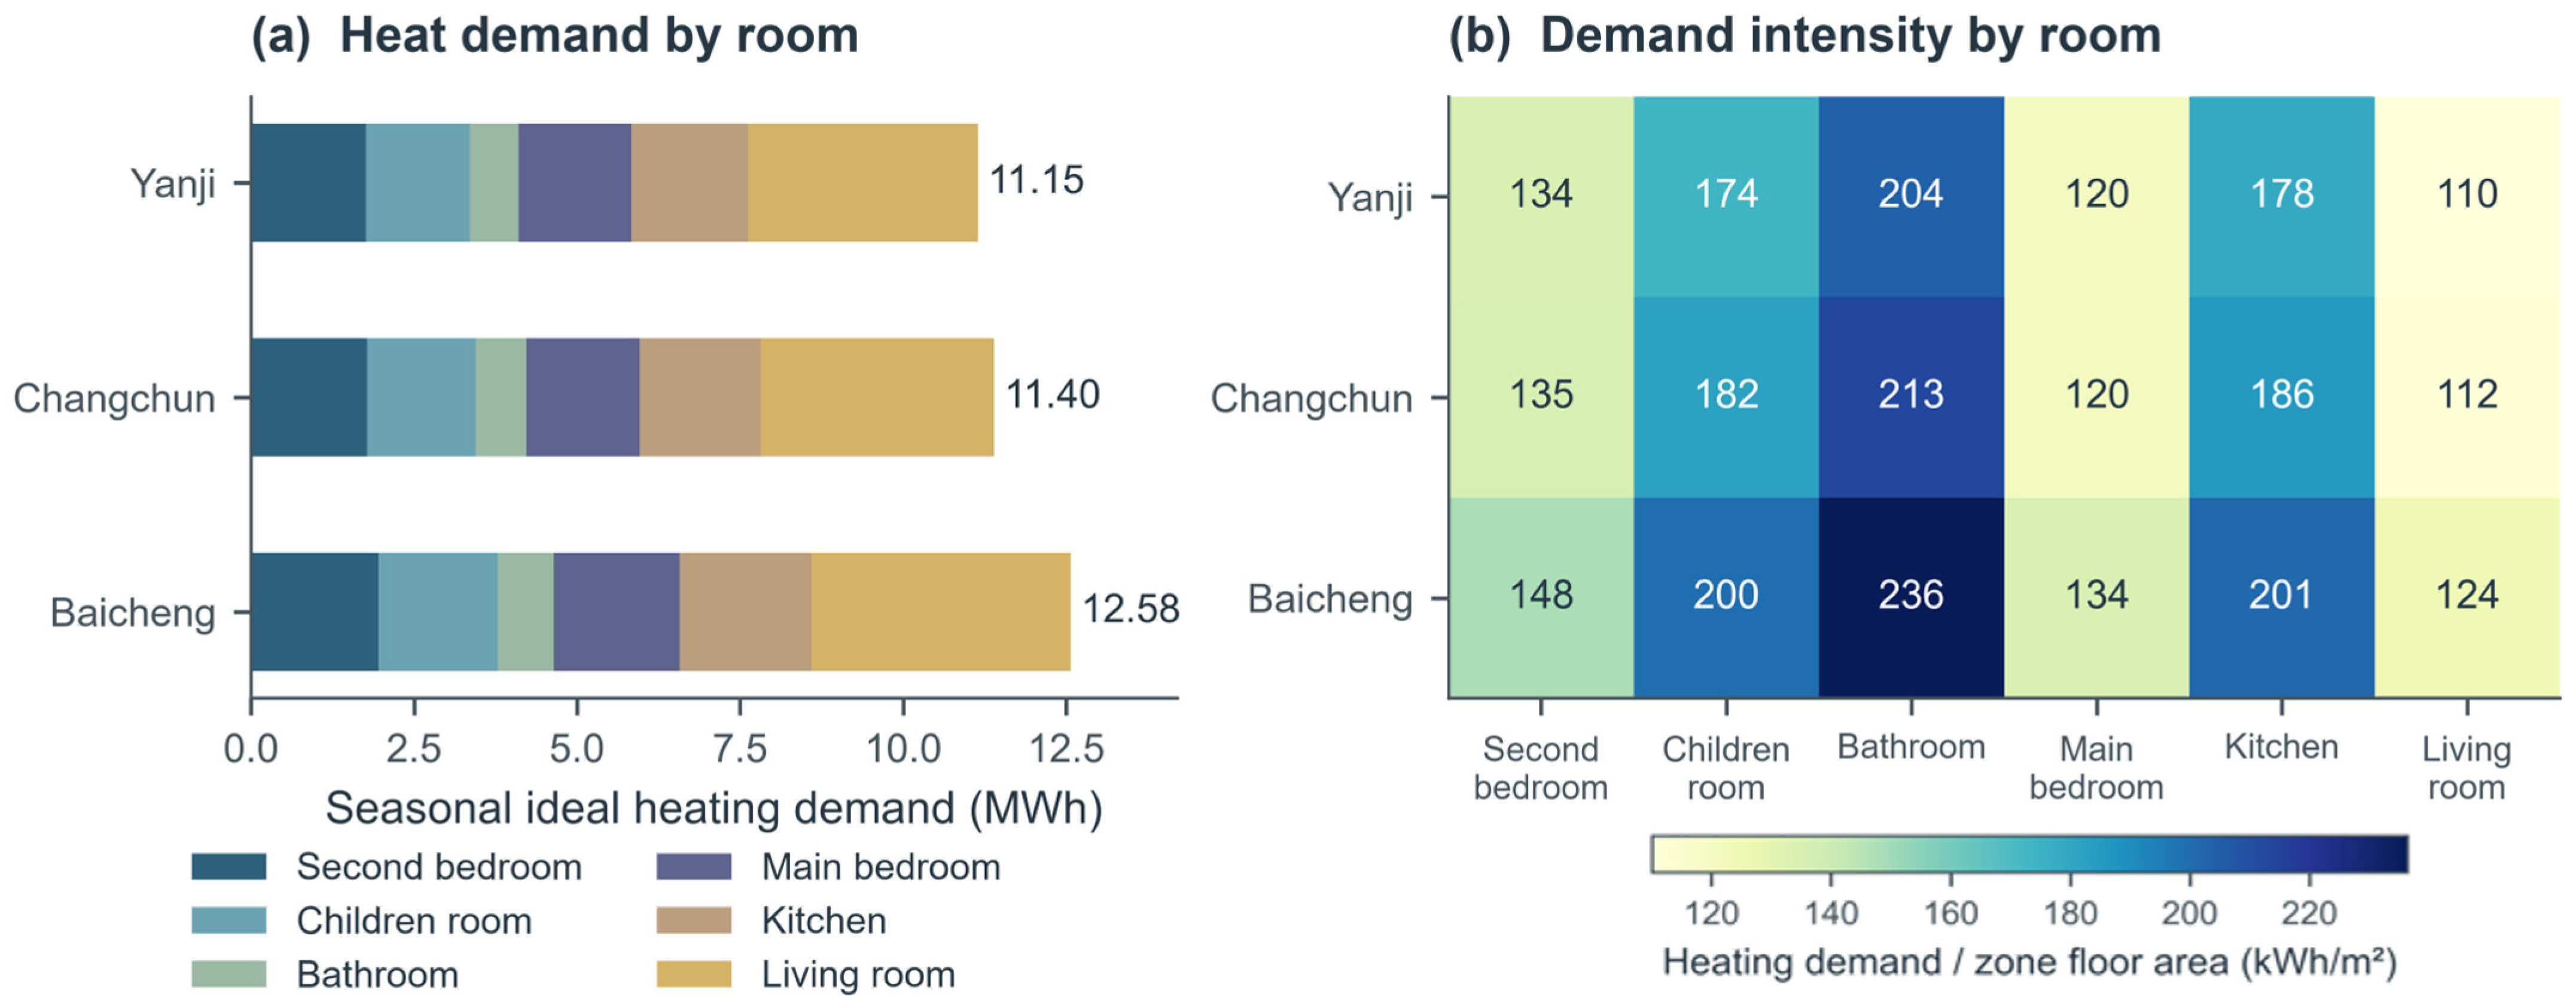
The seasonal ideal demand was 11.15 MWh in Yanji, 11.40 MWh in Changchun, and 12.58 MWh in Baicheng, with sampled hourly peaks of 5.21, 5.65, and 5.87 kW, respectively. Their common severe cold classification is consistent with broadly similar seasonal demand (Figure 5). Nevertheless, Baicheng required 12.8% more heat than Yanji and 10.4% more than Changchun. Changchun exceeded Yanji by only 2.2% in seasonal demand but by 8.5% in sampled peak load. These differences matter for fuel budgeting and capacity selection, although the sampled peaks are not statutory design loads. Demand was concentrated in December–February.
Figure 5.
Weather and ideal heating demand: (a) daily outdoor temperature; (b) daily mean heating load; (c) hourly load duration curves; (d) monthly heating demand.
The demand per unit heated area was 135, 138, and 152 kWh/m2 in Yanji, Changchun, and Baicheng, respectively. With common reference building inputs, the variation reflects the weather sequences. Work on rural envelope specifications likewise supports accounting for climate when selecting building improvements [33].
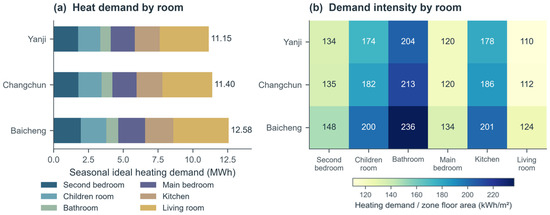
The living room had the highest total demand in each city, consistent with its larger floor area, but the lowest demand per unit area (Figure 6). The bathroom had the highest intensity, at 204, 213, and 236 kWh/m2 in Yanji, Changchun, and Baicheng, respectively; the kitchen and children’s room followed. Total demand and demand intensity therefore describe different aspects of room heating requirements. Differences in geometry, exposed surfaces, glazing, and internal gains may contribute to the observed pattern, but their separate effects were not quantified. Research on insulation and ventilation in rural dwellings [34] further supports considering building performance alongside heating equipment. The seasonal room totals provide design context; sizing individual emitters also requires coincident peak loads and the intended operating conditions.
Figure 6.
Seasonal ideal heating demand: (a) contribution by room; (b) demand per unit heated room area.
3.1.2. Seasonal Energy Use and Operating Expenditure
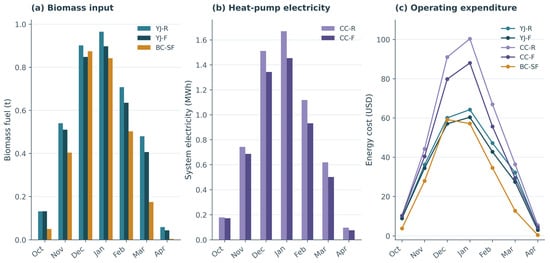
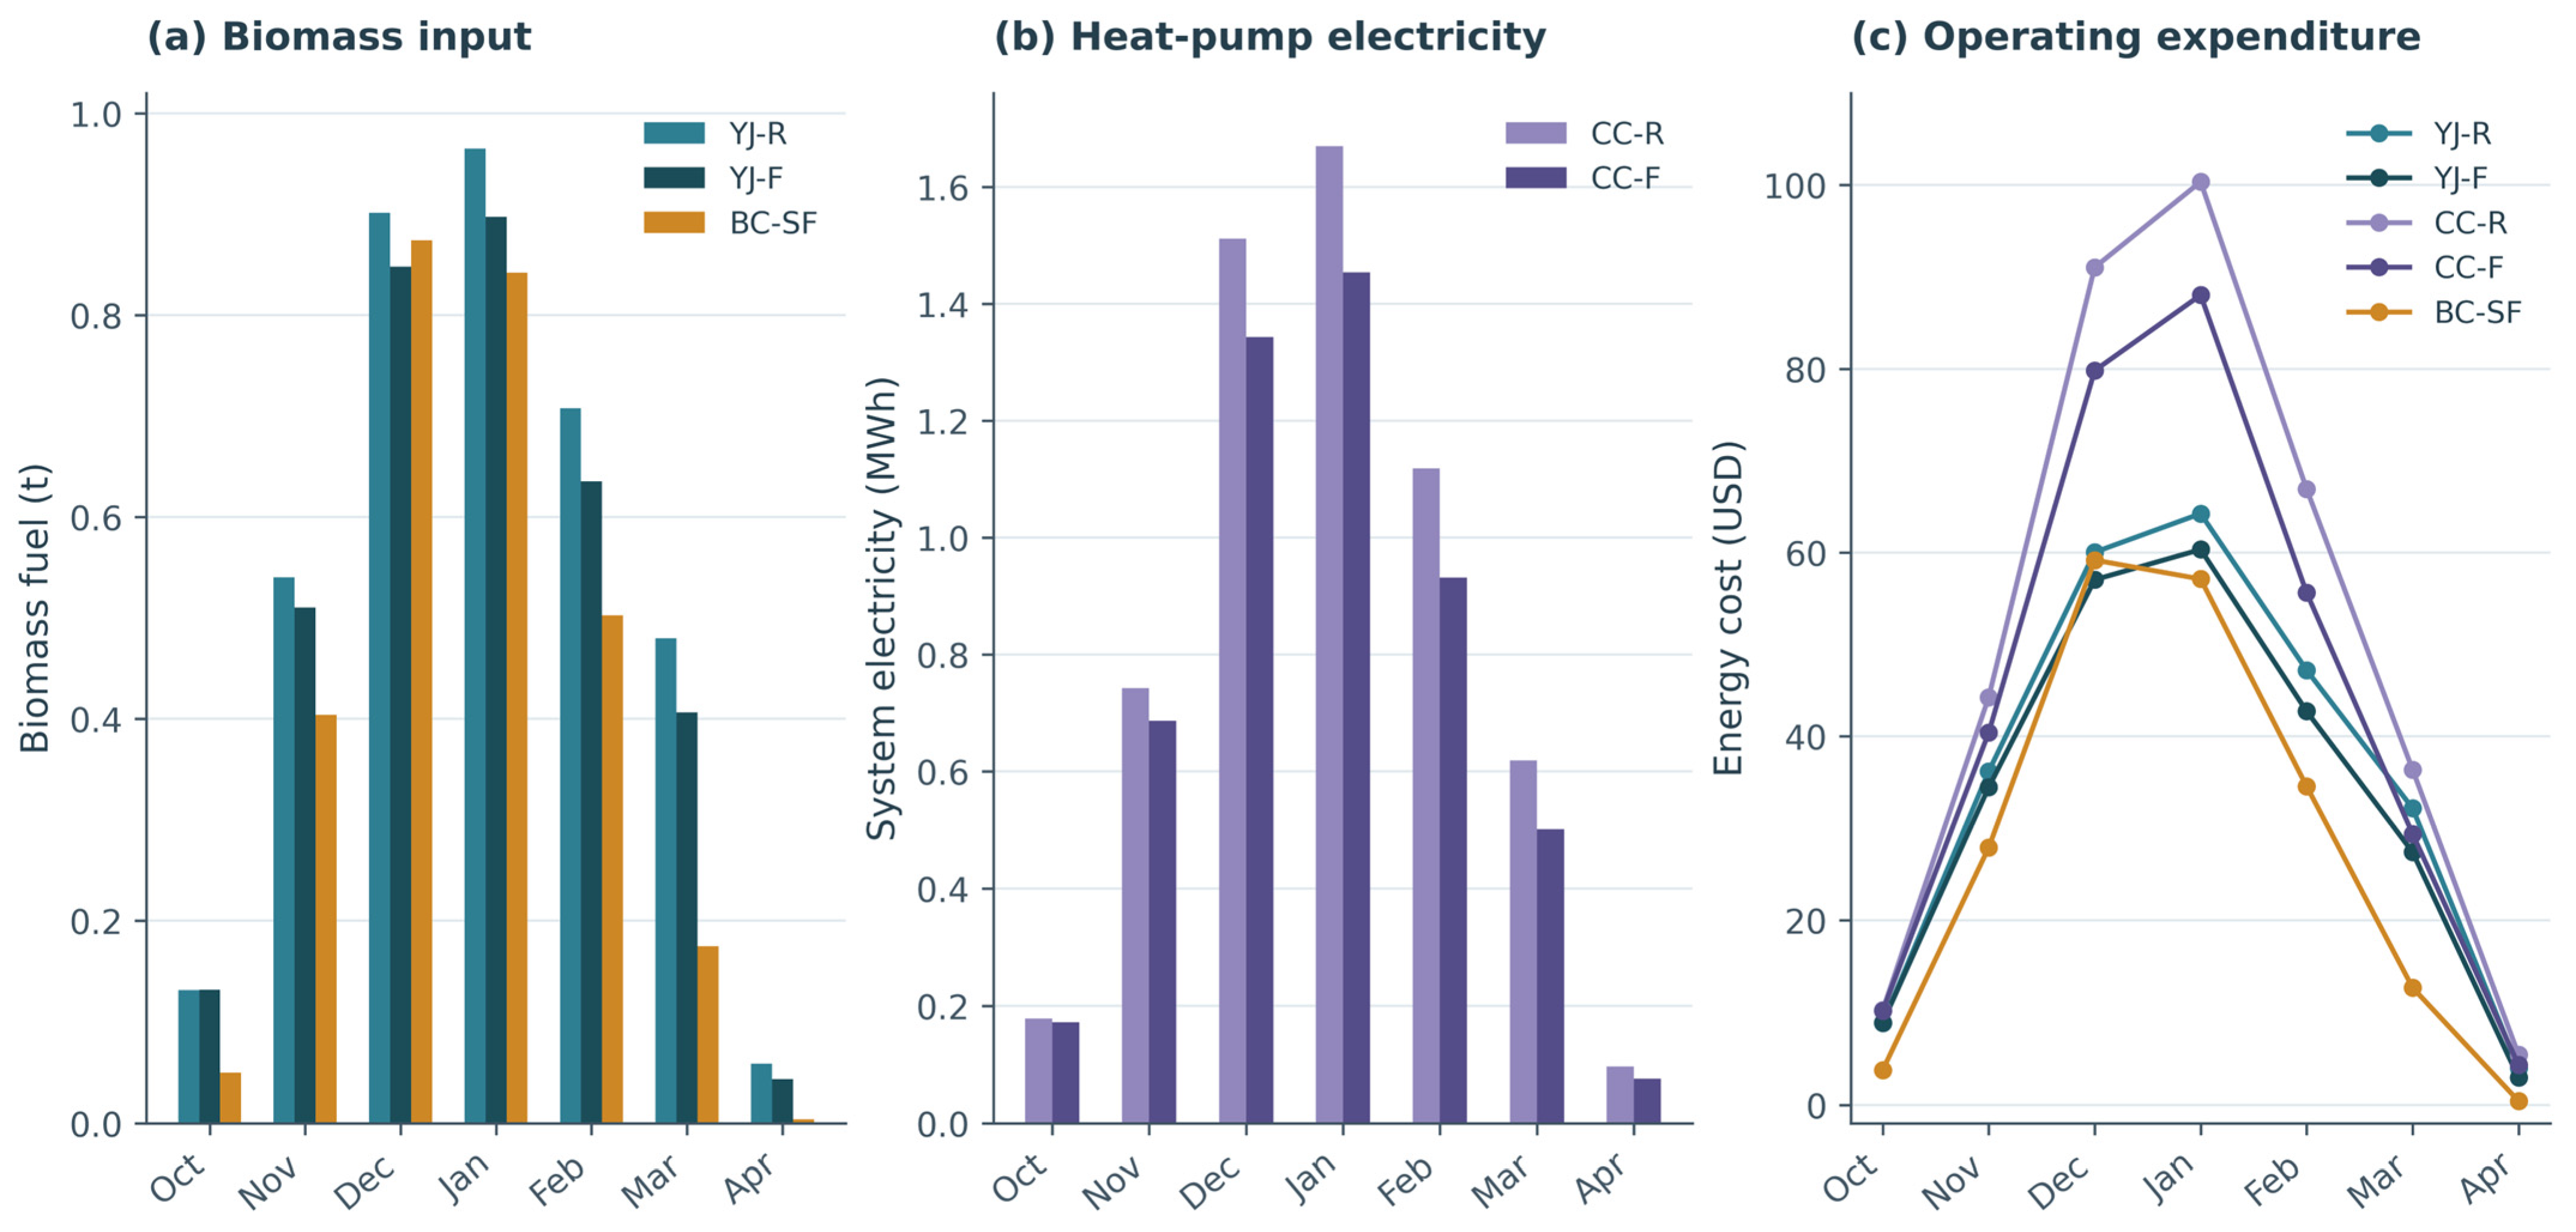
Energy use and expenditure were concentrated in December–February and peaked in January. Figure 7 combines the seasonal purchased energy totals with monthly expenditure; October and April are partial months.
Figure 7.
Monthly (a) biomass consumption, (b) heat pump electricity use, and (c) energy expenditure.
YJ-R consumed 3784 kg of biomass and 61 kWh of pump electricity, with energy expenditure of USD 253. YJ-F consumed 3473 kg and 89 kWh, costing USD 234. Biomass use was 8.2% lower and expenditure 7.5% lower in YJ-F; pump electricity was 28 kWh higher. Boiler output fell from 11.77 to 10.80 MWh. Because boiler efficiency was fixed, the lower fuel use reflects reduced heat production under the adopted controls, rather than improved boiler conversion efficiency.
These outcomes depend on the adopted controls. Experimental comparisons of radiators and floor heating, such as the study by Sarbu and Sebarchievici using a ground-coupled heat pump [35], involve different buildings and operating conditions. They do not establish an emitter ranking for the Yanji configurations, which used different room and water temperatures.
Changchun electricity use fell from 5936 kWh in CC-R to 5164 kWh in CC-F, a 13.0% reduction. Energy expenditure fell from USD 355 to USD 308, or 13.2%; the difference between these percentages reflects the timing of use under the tariff schedule. Heat pump output declined from 12.13 to 11.59 MWh, or 4.5%. The electricity reduction therefore combines lower heat output with higher modeled conversion performance. Room controls, equipment capacity, buffer volume, and water temperatures also differ, so the change cannot be assigned to emitter type alone. BC-SF consumed 2852 kg of biomass and 137 kWh of electricity, with energy expenditure of USD 196. This was the lowest seasonal energy expenditure among the five configurations.
3.1.3. Indoor Thermal Conditions and System Efficiency
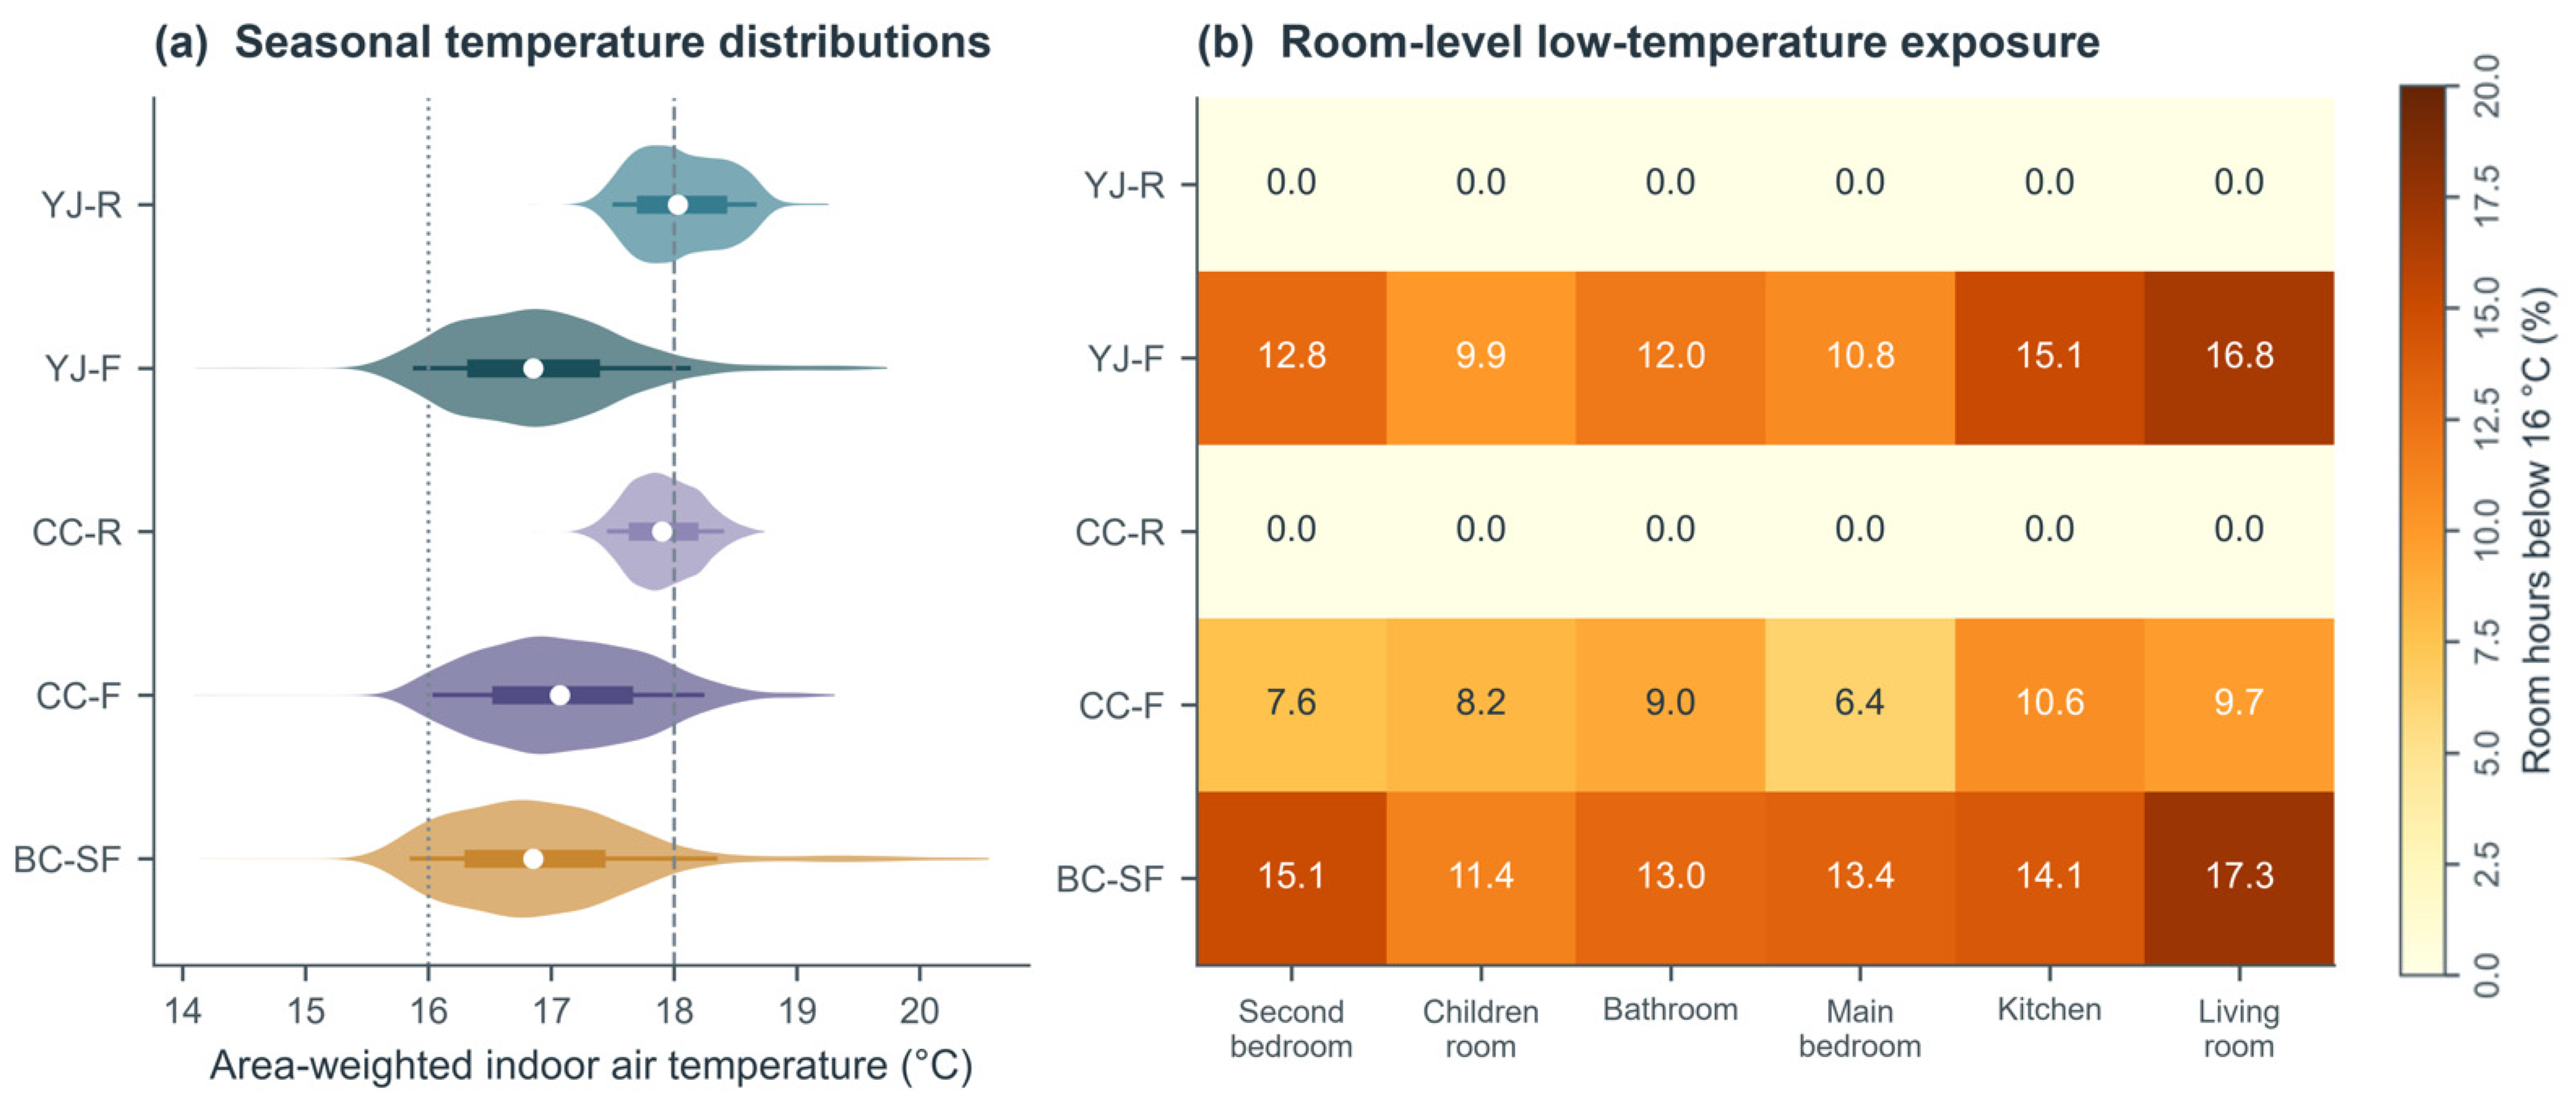
Seasonal indoor air temperatures weighted by heated area averaged 18.1 °C in YJ-R, 16.9 °C in YJ-F, 17.9 °C in CC-R, 17.1 °C in CC-F, and 16.9 °C in BC-SF (Figure 8). Neither radiator case recorded an hourly zone mean below 16 °C. The corresponding proportions of zone hours were 12.9%, 8.6%, and 14.0% for YJ-F, CC-F, and BC-SF. These equal 3404, 2263, and 3700 of the 26,352 zone hours in each case. Room-specific proportions ranged from 9.9% to 16.8%, from 6.4% to 10.6%, and from 11.4% to 17.3%, respectively. The results distinguish spatial and temporal variation from the seasonal building mean.
Figure 8.
Indoor air temperature: (a) seasonal distributions of the hourly building mean, weighted by floor area; (b) percentage of hours below 16 °C in each room.
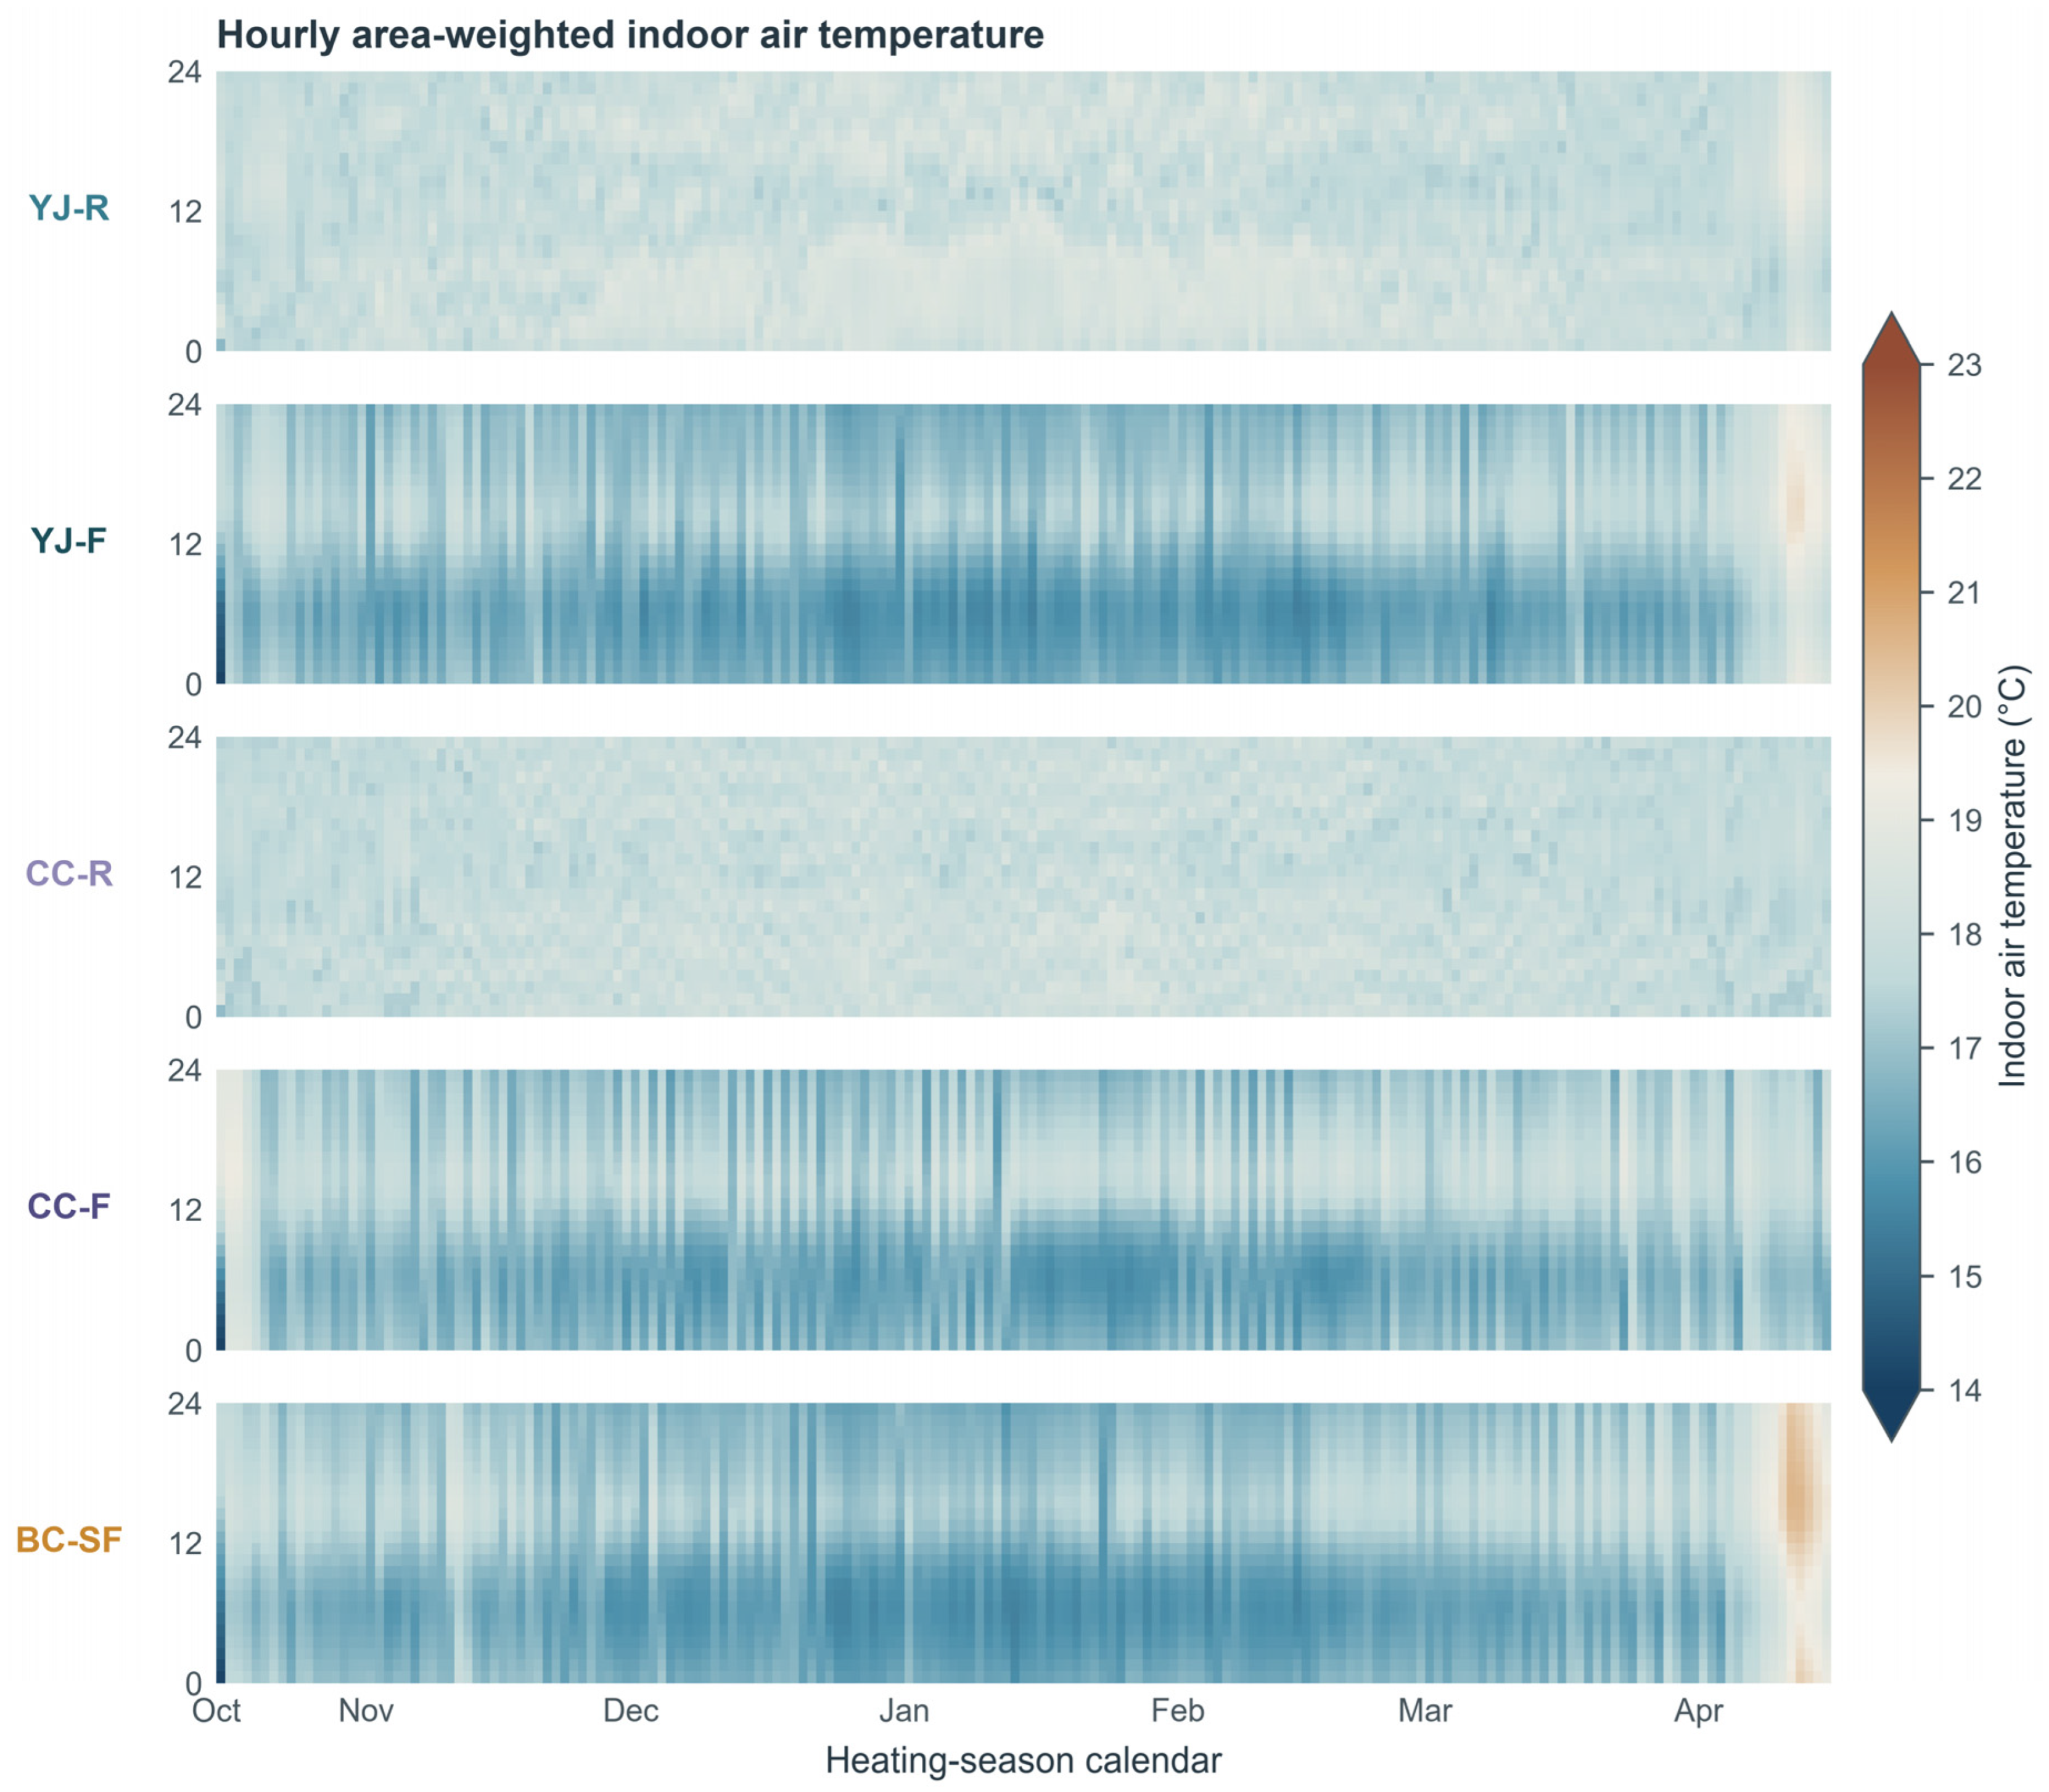
The heatmap in Figure 9 shows when these temperature differences occurred. The radiator cases maintained relatively stable temperatures, while the floor-heating cases showed recurring early-morning cooling followed by afternoon recovery, particularly from December to February. During these months, the range of the mean 24 h temperature profile was 1.5 °C in YJ-F, 1.7 °C in CC-F, and 1.5 °C in BC-SF, compared with 0.7 °C in YJ-R and 0.3 °C in CC-R. The three floor-heating profiles reached their mean minimum at about 06:00 and maximum at 14:00–15:00. This recurring pattern is obscured by seasonal averages. Because the configurations used different temperature targets and control deadbands, the temporal differences cannot be attributed to the heating emitters alone.
Figure 9.
Hourly indoor air temperature weighted by heated floor area throughout the heating season.
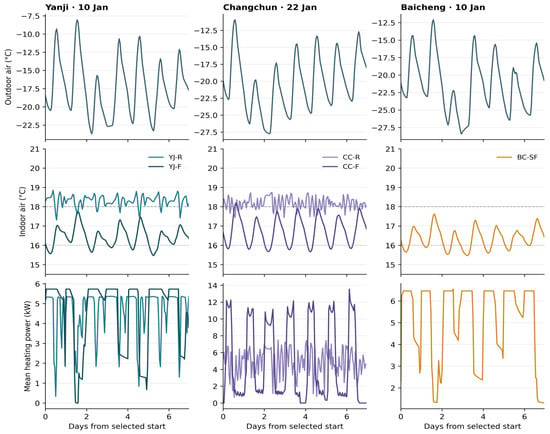
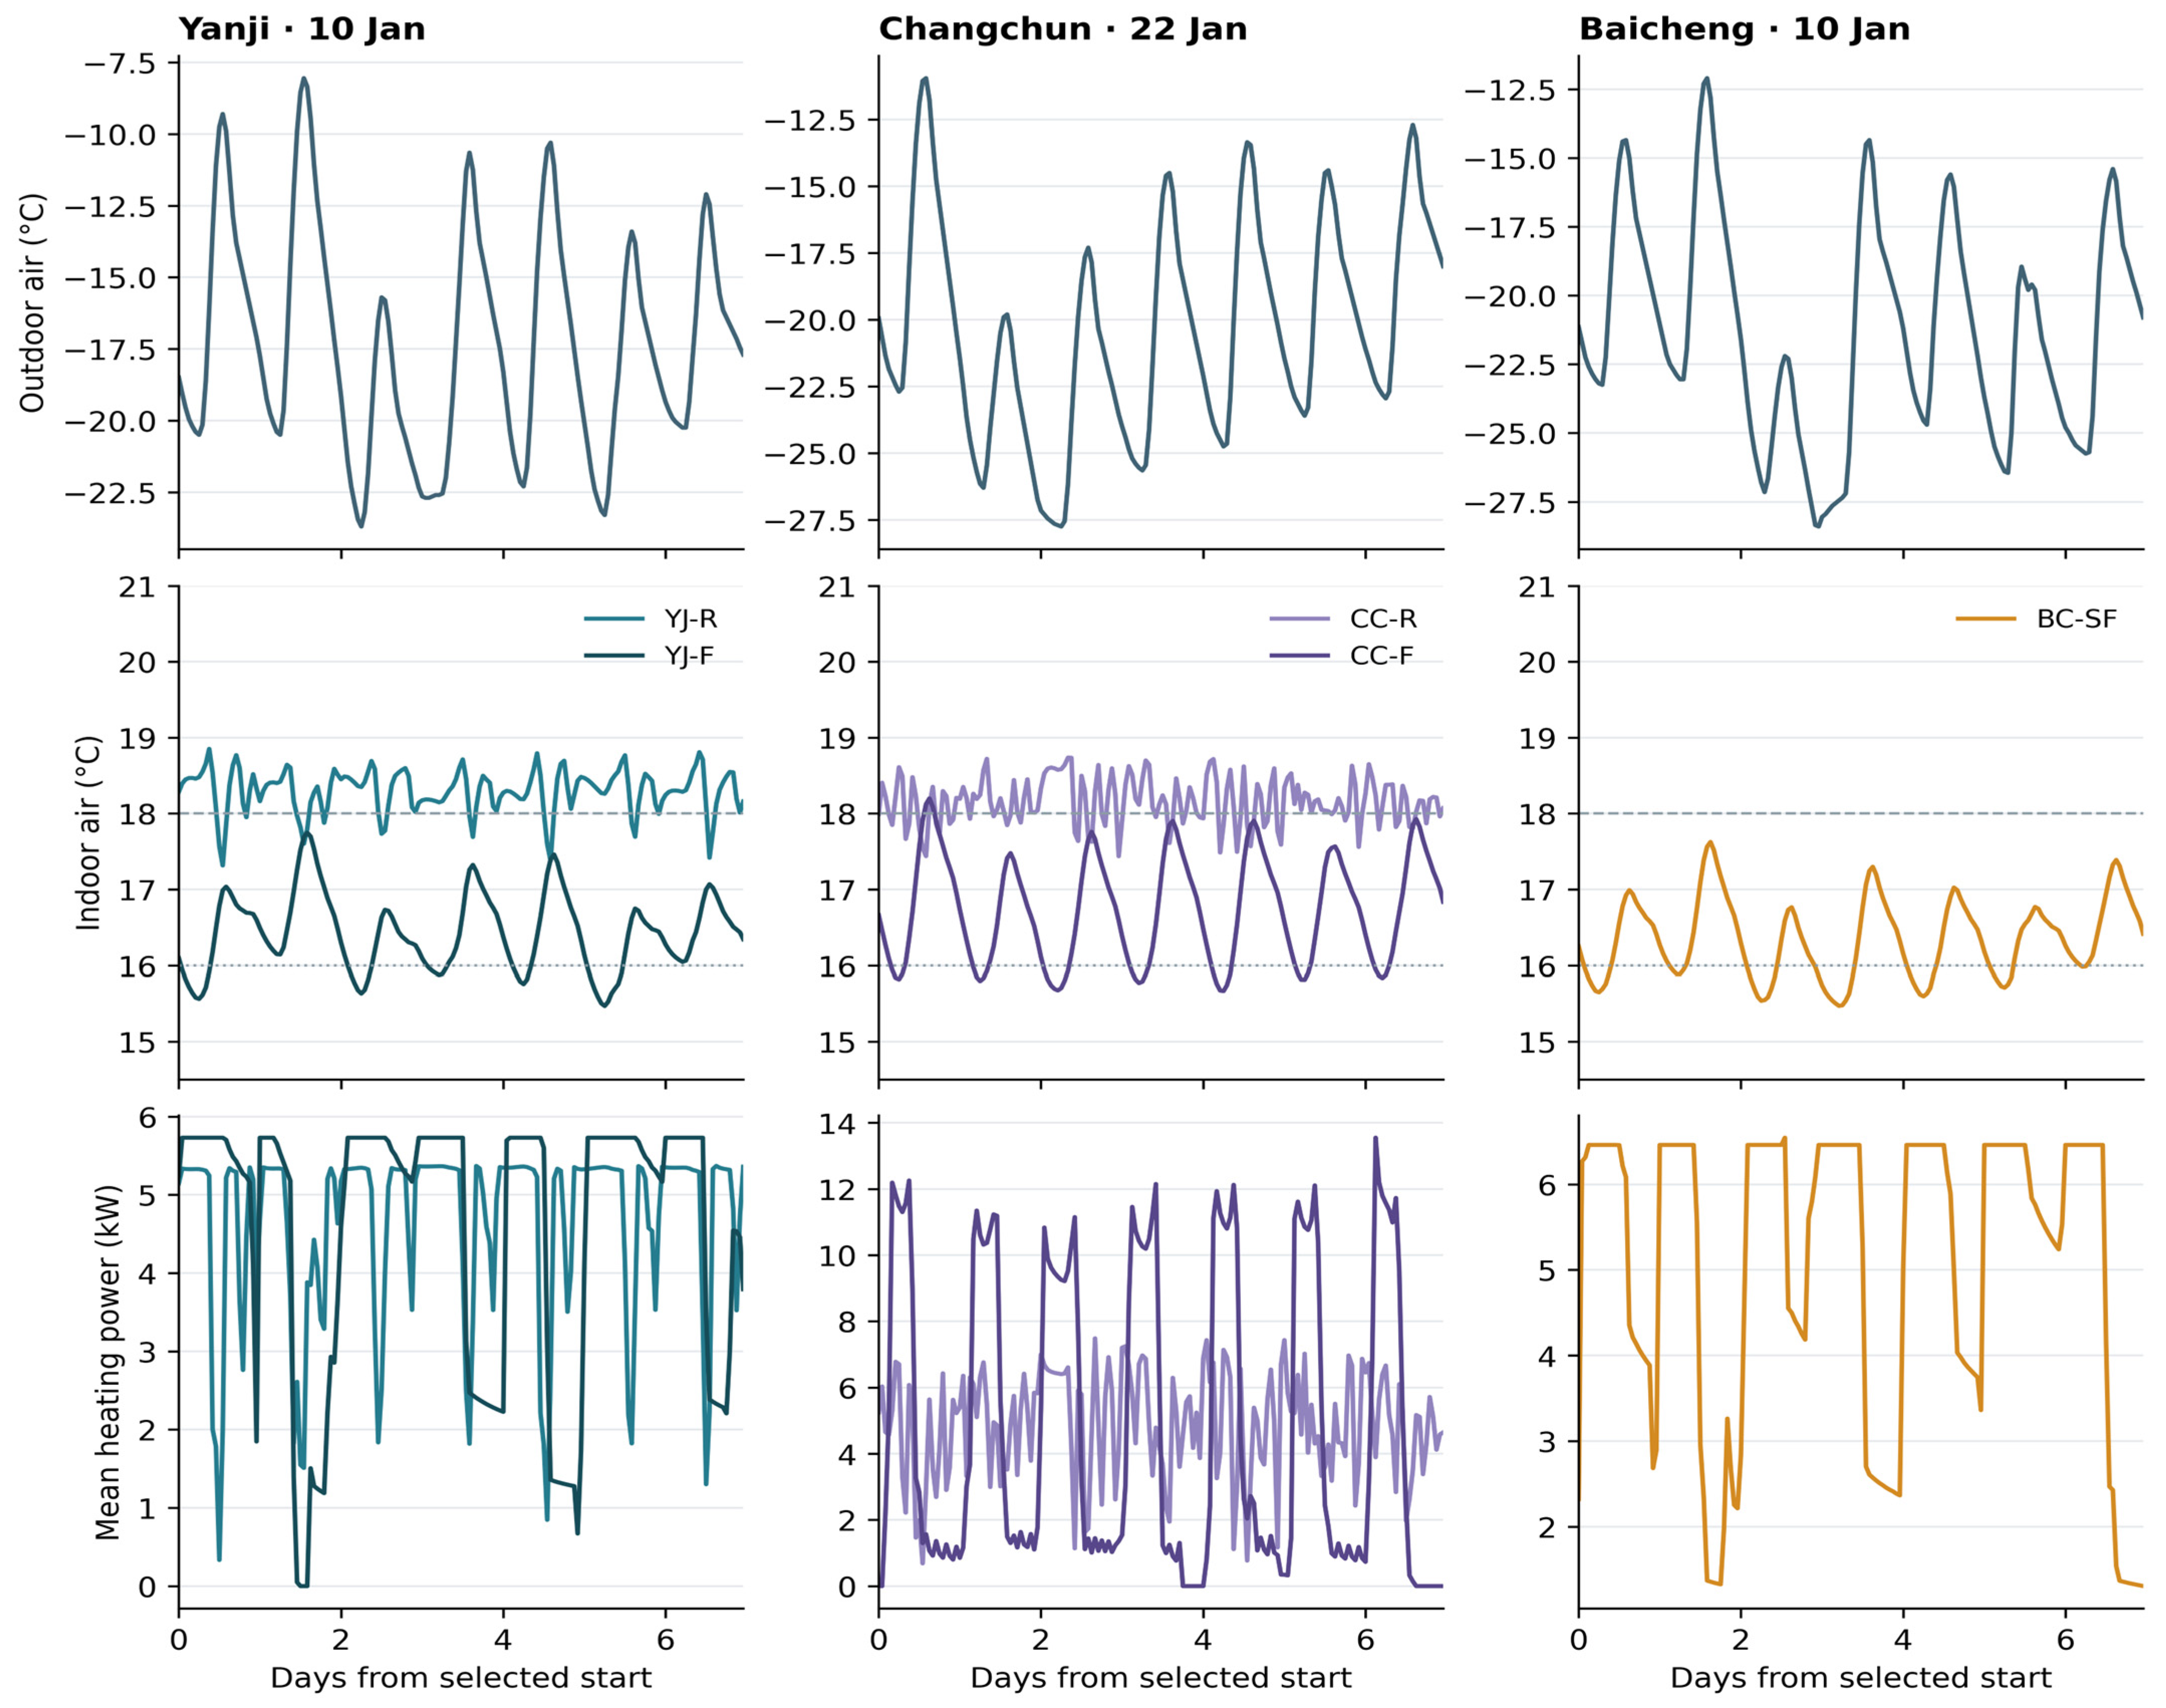
The coldest seven-day periods began on 10 January in Yanji and Baicheng and on 22 January in Changchun (Figure 10). The radiator configurations maintained indoor temperatures near 18 °C, whereas the floor heating configurations repeatedly approached or fell below 16 °C. The mean heating power was calculated from the energy delivered during each hourly interval. The reported heat output represents boiler output in Yanji, buffer tank delivery in Changchun, and combined boiler and solar tank delivery in Baicheng. These boundaries allow the thermal response to be examined within each city but do not support direct comparisons of output magnitudes across cities.
Figure 10.
Outdoor temperature, indoor temperature, and reported heat output during the coldest seven-day period in each city.
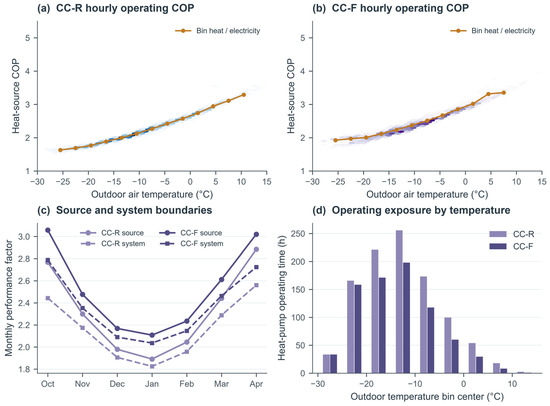
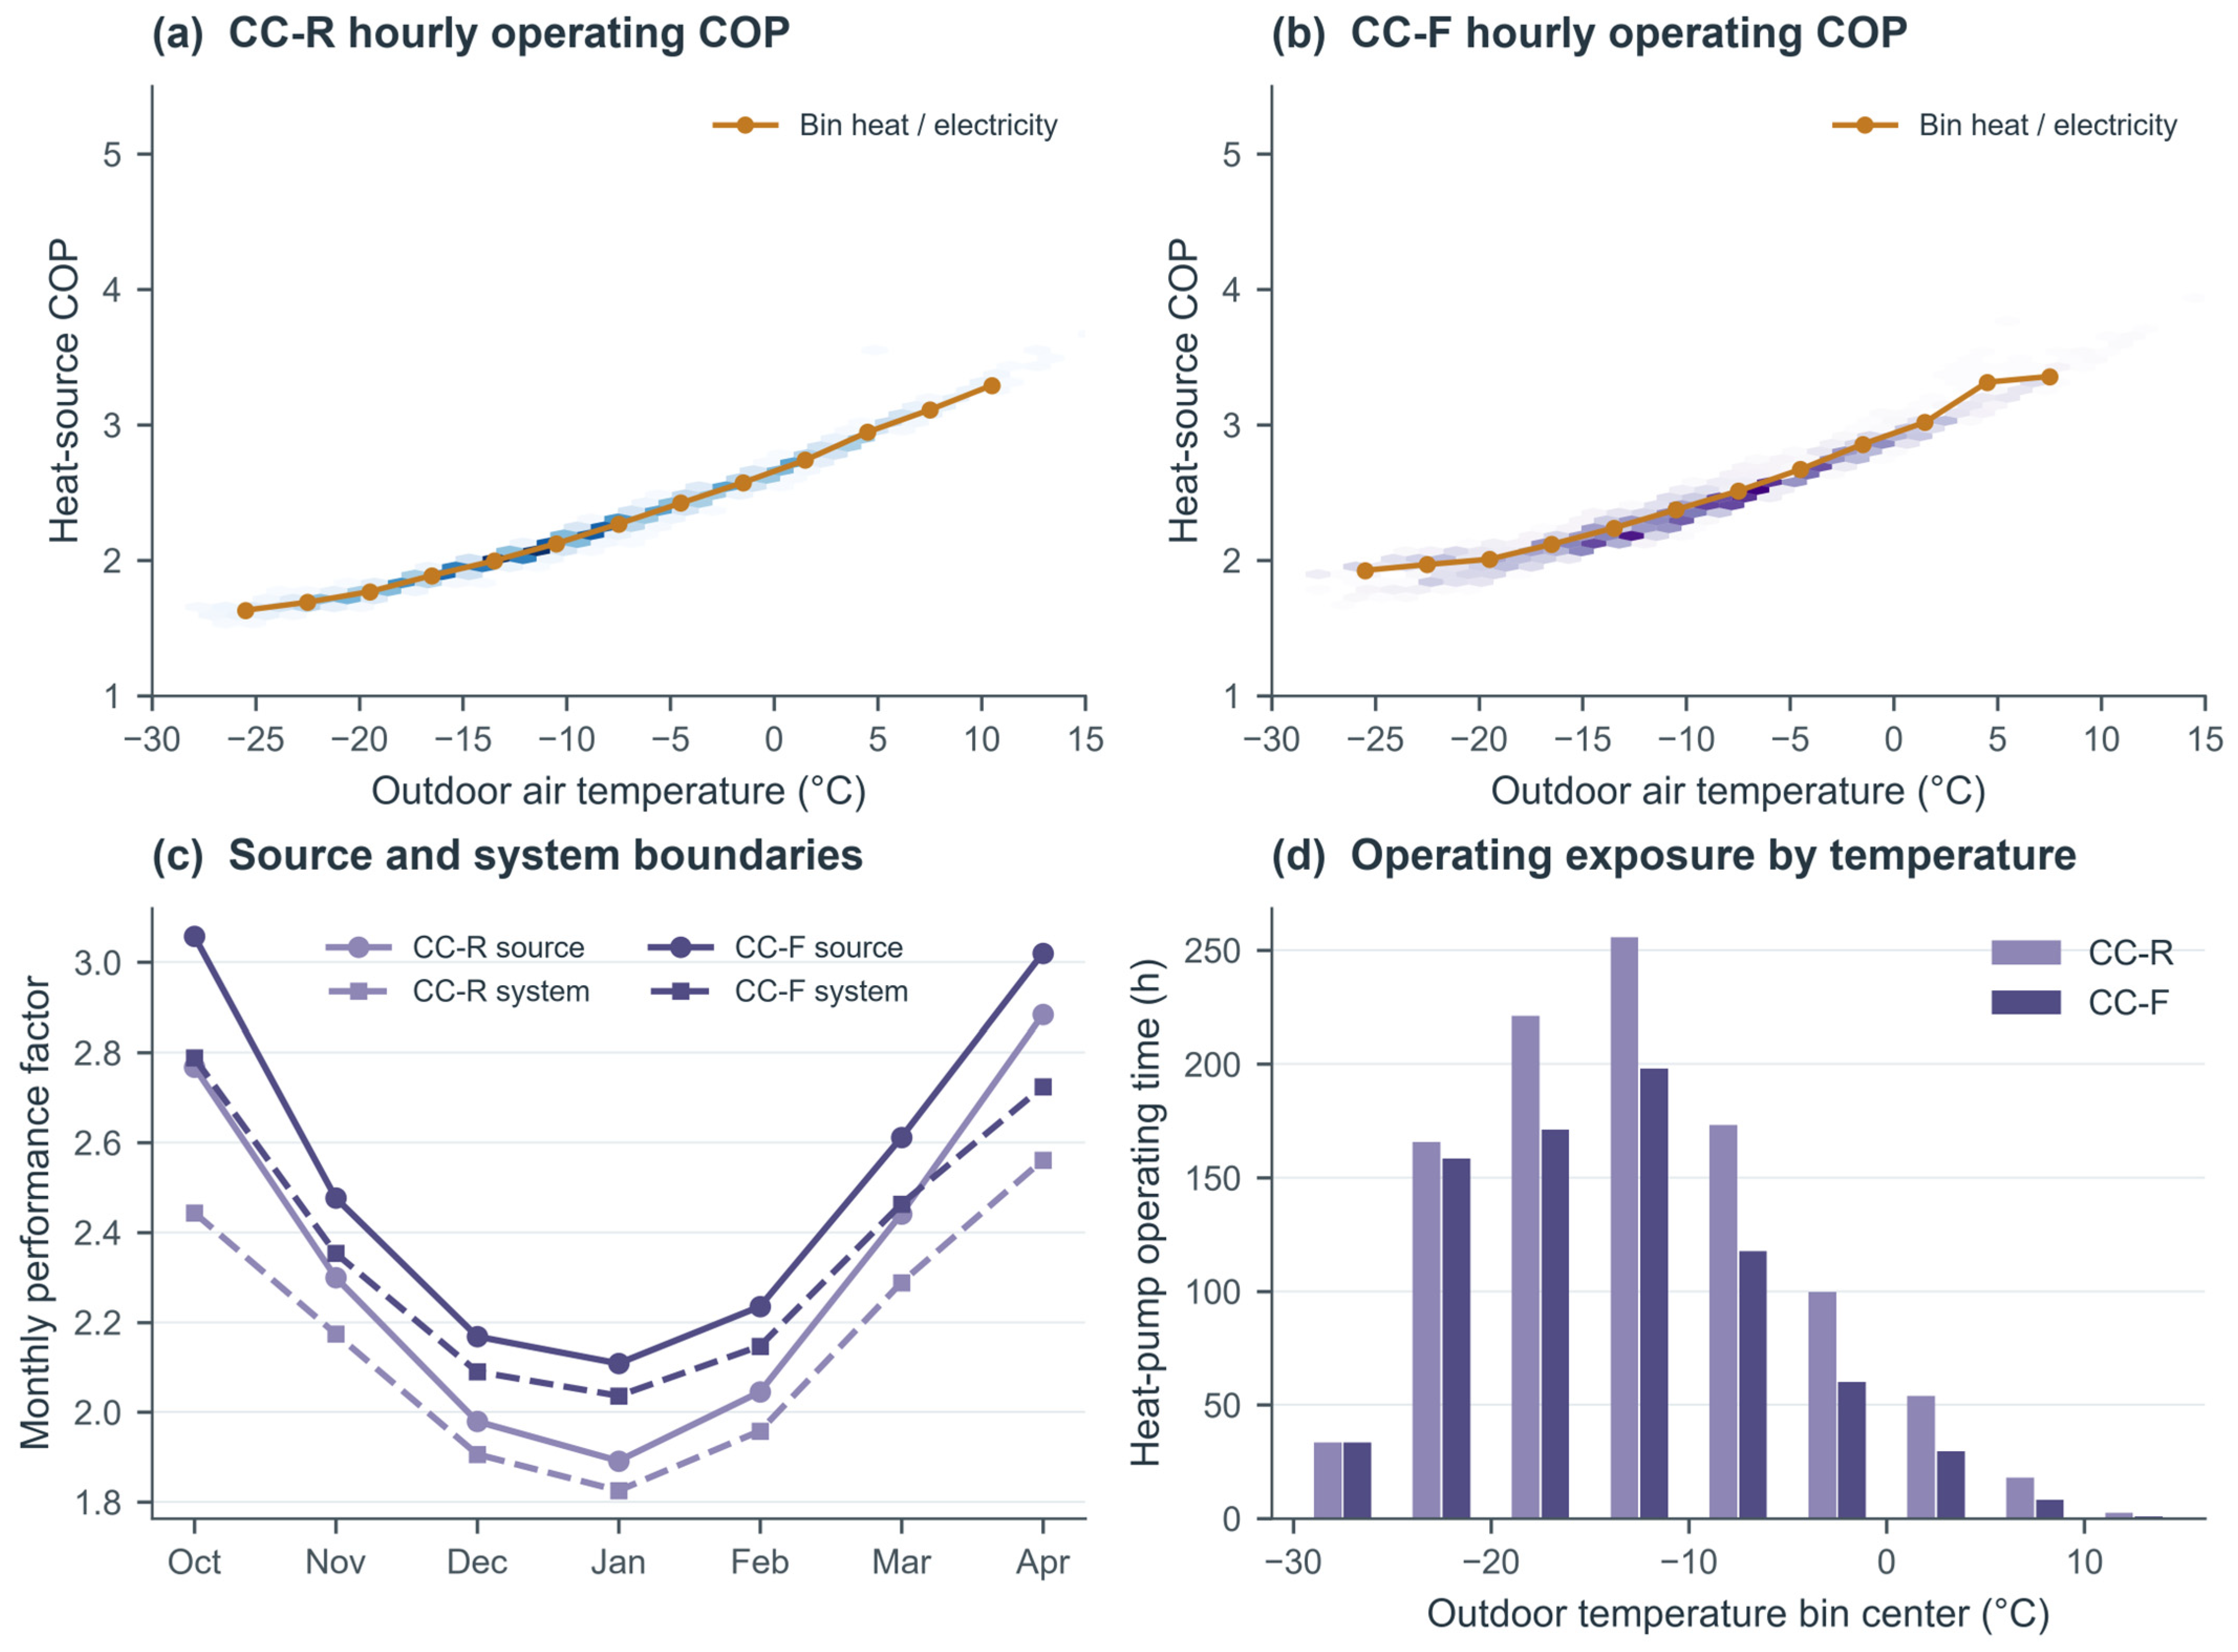
Hourly operating COP generally increased with outdoor temperature in both Changchun configurations (Figure 11). The same trend was observed in the temperature bin values, calculated as total heat pump heat output divided by total heat pump electricity consumption within each bin. CC-F generally achieved a higher COP than CC-R at comparable outdoor temperatures. Monthly source and system performance factors declined from October to January and recovered towards the end of the heating season, with CC-F consistently exceeding CC-R (Figure 11c). Seasonal source SPFs were 2.09 for CC-R and 2.29 for CC-F, corresponding to a 9.6% increase. Including pump electricity and using tank delivery as useful heat gave system SPFs of 1.99 and 2.19, respectively, reflecting the change in the heat and electricity accounting boundaries.
Figure 11.
Changchun heat pump performance: (a,b) operating COP against outdoor temperature; (c) monthly performance factors at source and system boundaries; (d) operating hours by outdoor temperature.
Heat pump operation was concentrated at subzero outdoor temperatures, with the greatest accumulated operating time in the bin centered near −12.5 °C (Figure 11d). CC-R accumulated more operating time than CC-F across most temperature bins, and both configurations operated below −20 °C. This distribution highlights the importance of performance under cold conditions when evaluating seasonal efficiency. The higher COP and SPF of CC-F are consistent with the influence of operating water temperature [36], but they also coincided with a lower delivered indoor temperature; they therefore do not establish an independent efficiency advantage of floor heating.
Frosting and defrosting can reduce seasonal heat pump performance in cold climates [37,38]. A sensitivity calculation therefore applied common COP reductions of 10% and 20% to both Changchun configurations. Seasonal heat output, tank heat delivery, and pump electricity were held at baseline, with compressor electricity increased accordingly. For CC-R and CC-F, respectively, total electricity use increased to 6581 and 5727 kWh under the 10% reduction, with system SPFs of 1.80 and 1.97. Under the 20% reduction, electricity use reached 7386 and 6430 kWh, with system SPFs of 1.60 and 1.76. CC-F retained lower electricity use and a higher system SPF under both tested penalties. This calculation assesses sensitivity to common efficiency reductions; defrost frequency and transient heating capacity losses require a separate dynamic assessment.
3.1.4. Solar Contribution and Storage Operation
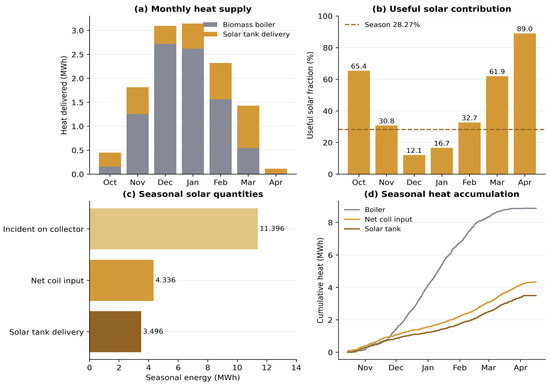
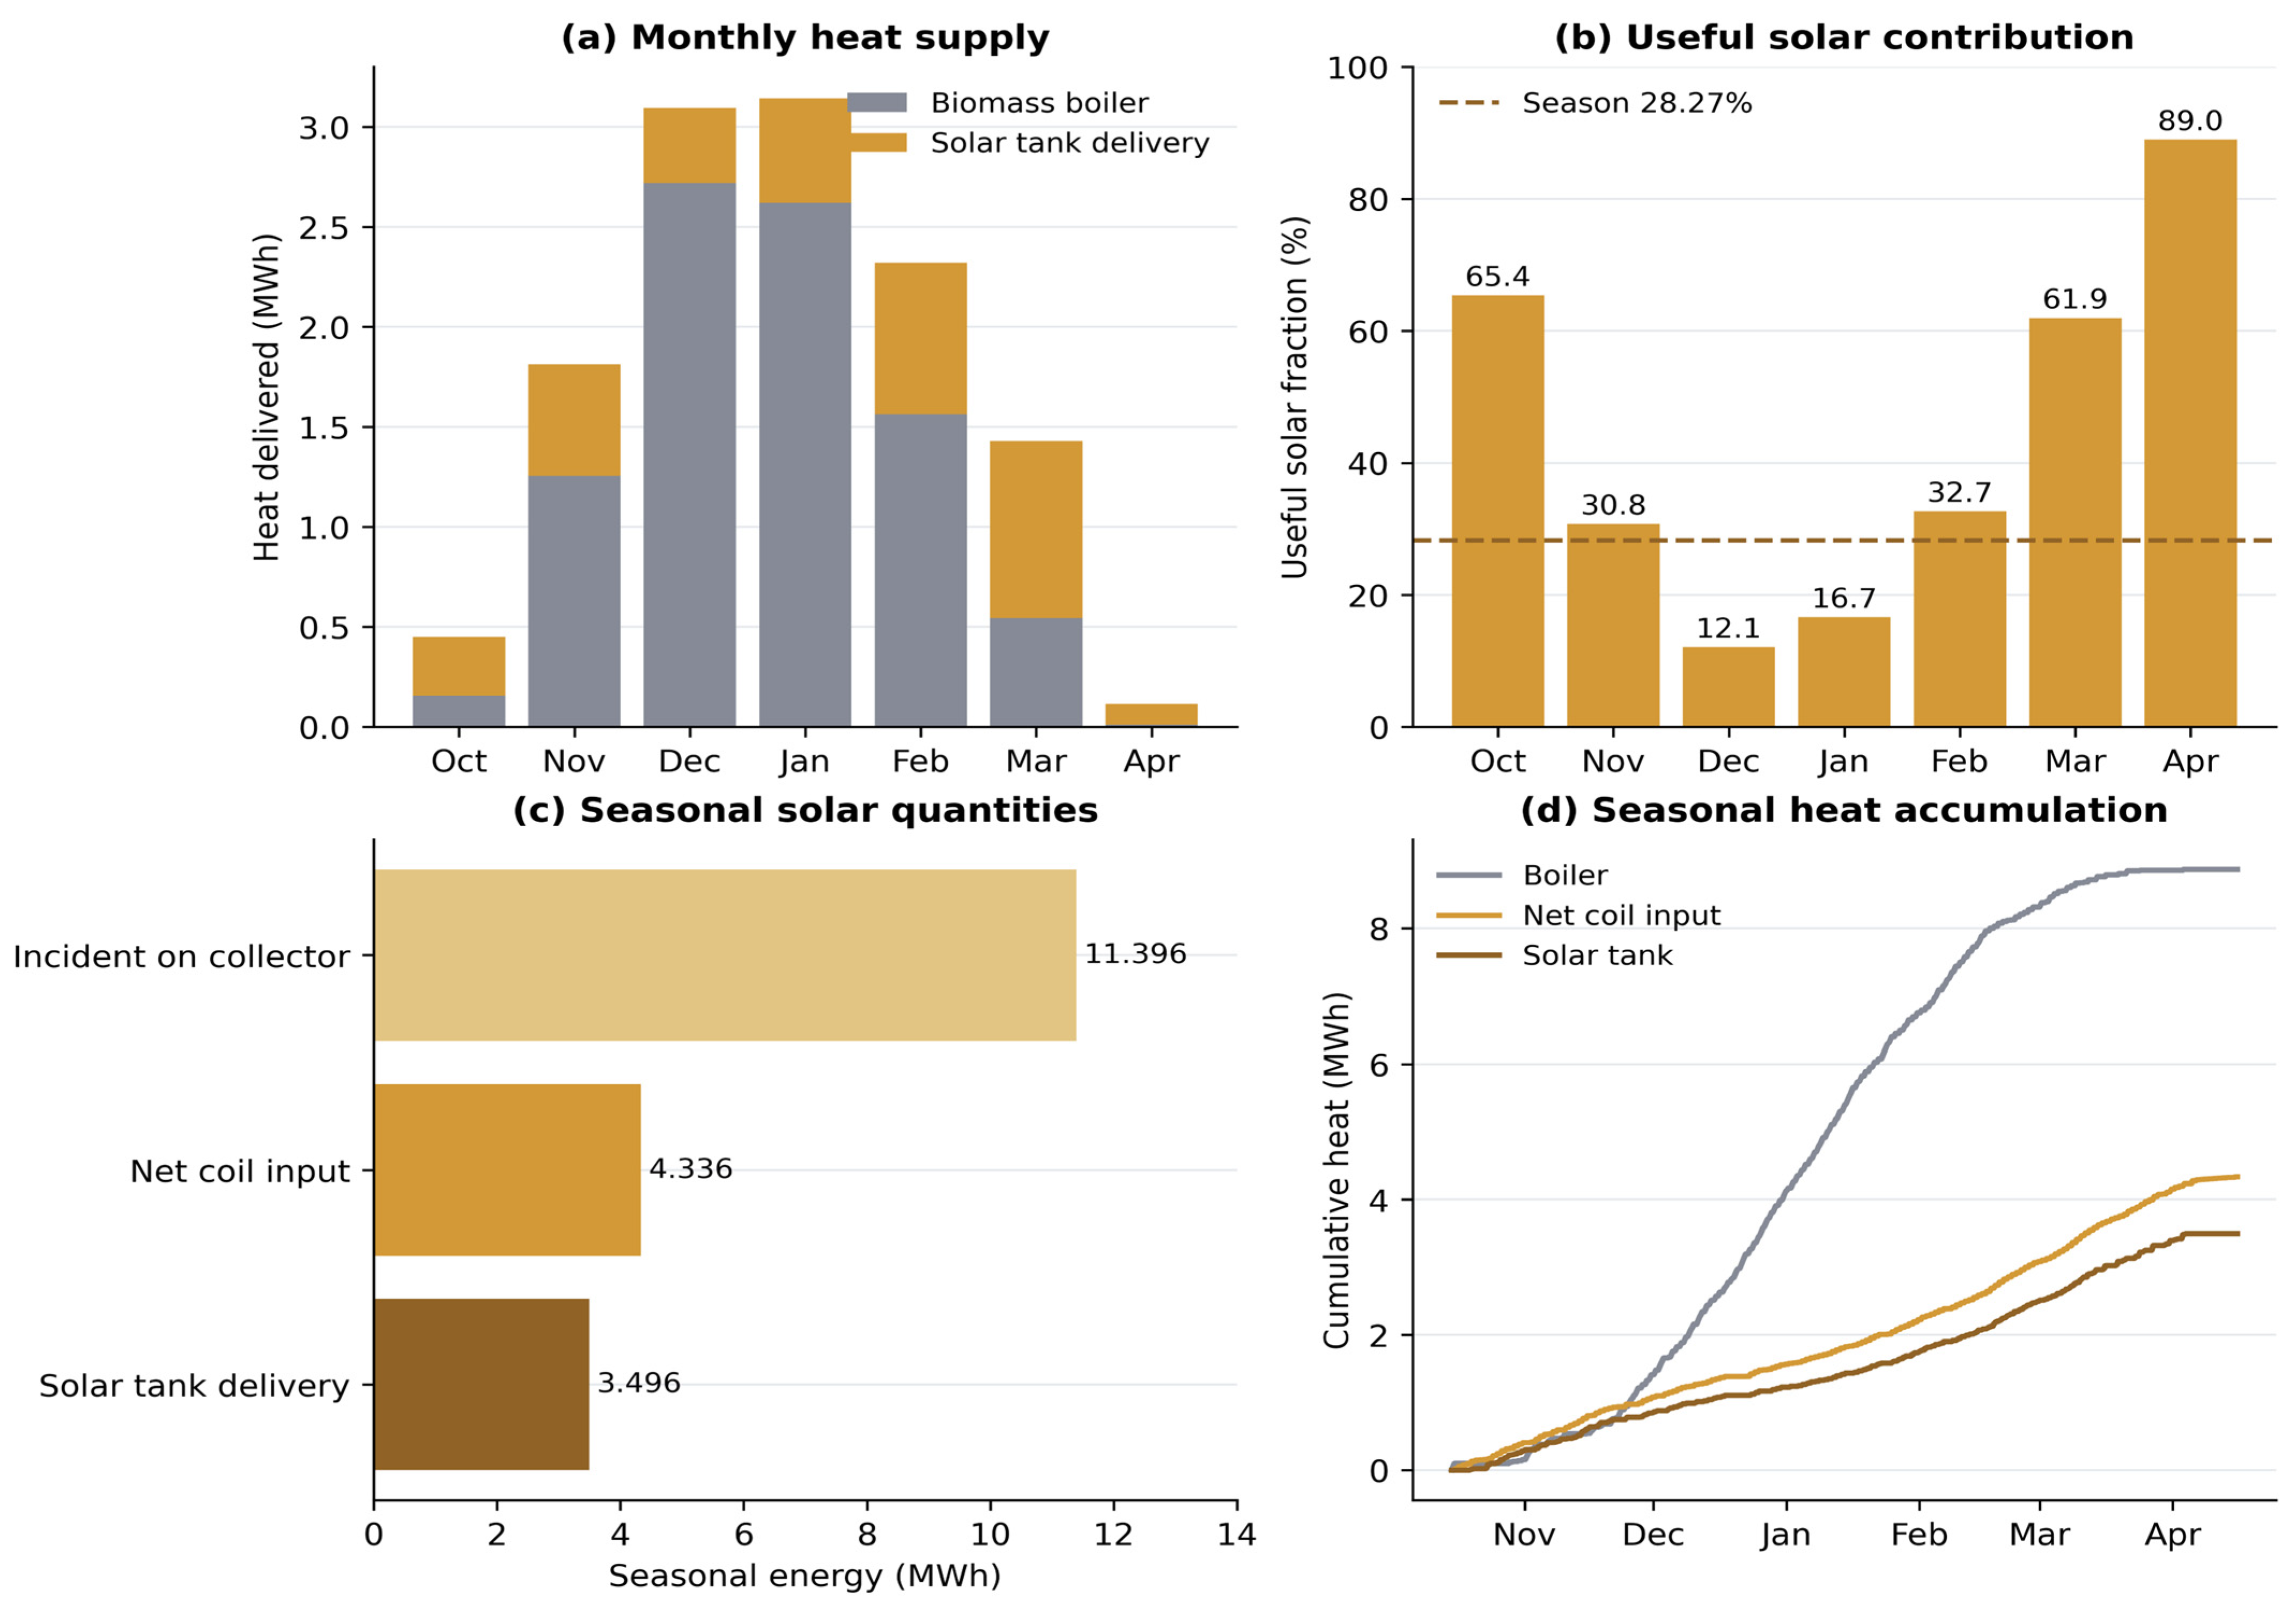
TRNSYS exports give 12.367 MWh at the combined boiler and solar tank delivery boundary for BC-SF. Boiler heat accounts for 8.871 MWh and solar tank delivery for 3.496 MWh, corresponding to 71.73% and 28.27% of seasonal delivery. The 12.86 m2 collector aperture received 11.396 MWh of incident energy. Net heat entering the immersed tank coil was 4.336 MWh, or 38.05% of incident energy (Figure 12).
Figure 12.
Baicheng solar contribution: (a) monthly heat delivery by source; (b) useful solar fraction; (c) seasonal incident energy, net coil input, and solar tank delivery; (d) cumulative heat totals.
Solar tank delivery was 80.62% of the net coil input. Of the 840 kWh difference, approximately 105 kWh represents the increase in stored water energy between the archived initial and final mean temperatures, leaving about 736 kWh for loss and other boundary terms. A separate estimate using tank geometry, heat loss coefficient, and hourly mean temperature gives approximately 738 kWh. This near agreement supports the interpretation but does not constitute exact closure: coil fluid storage and exact loss integrals are not separately archived. Table S6 gives the balance and its boundaries. The useful solar fraction was 12.1% in December and 16.7% in January, increasing to 32.7% in February and 61.9% in March. It reached 89.0% during the partial April period, when absolute demand was small. Solar availability was therefore poorly aligned with peak winter demand, and biomass remained the principal source during the coldest months.
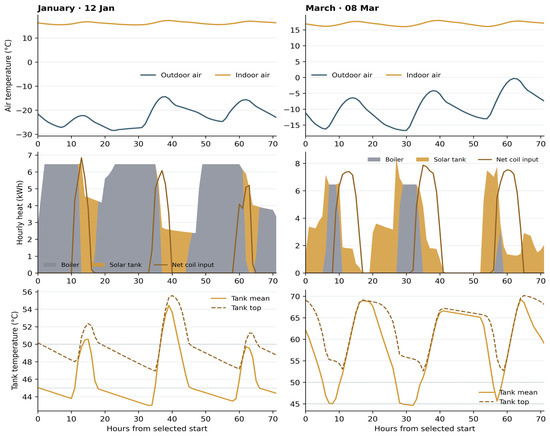
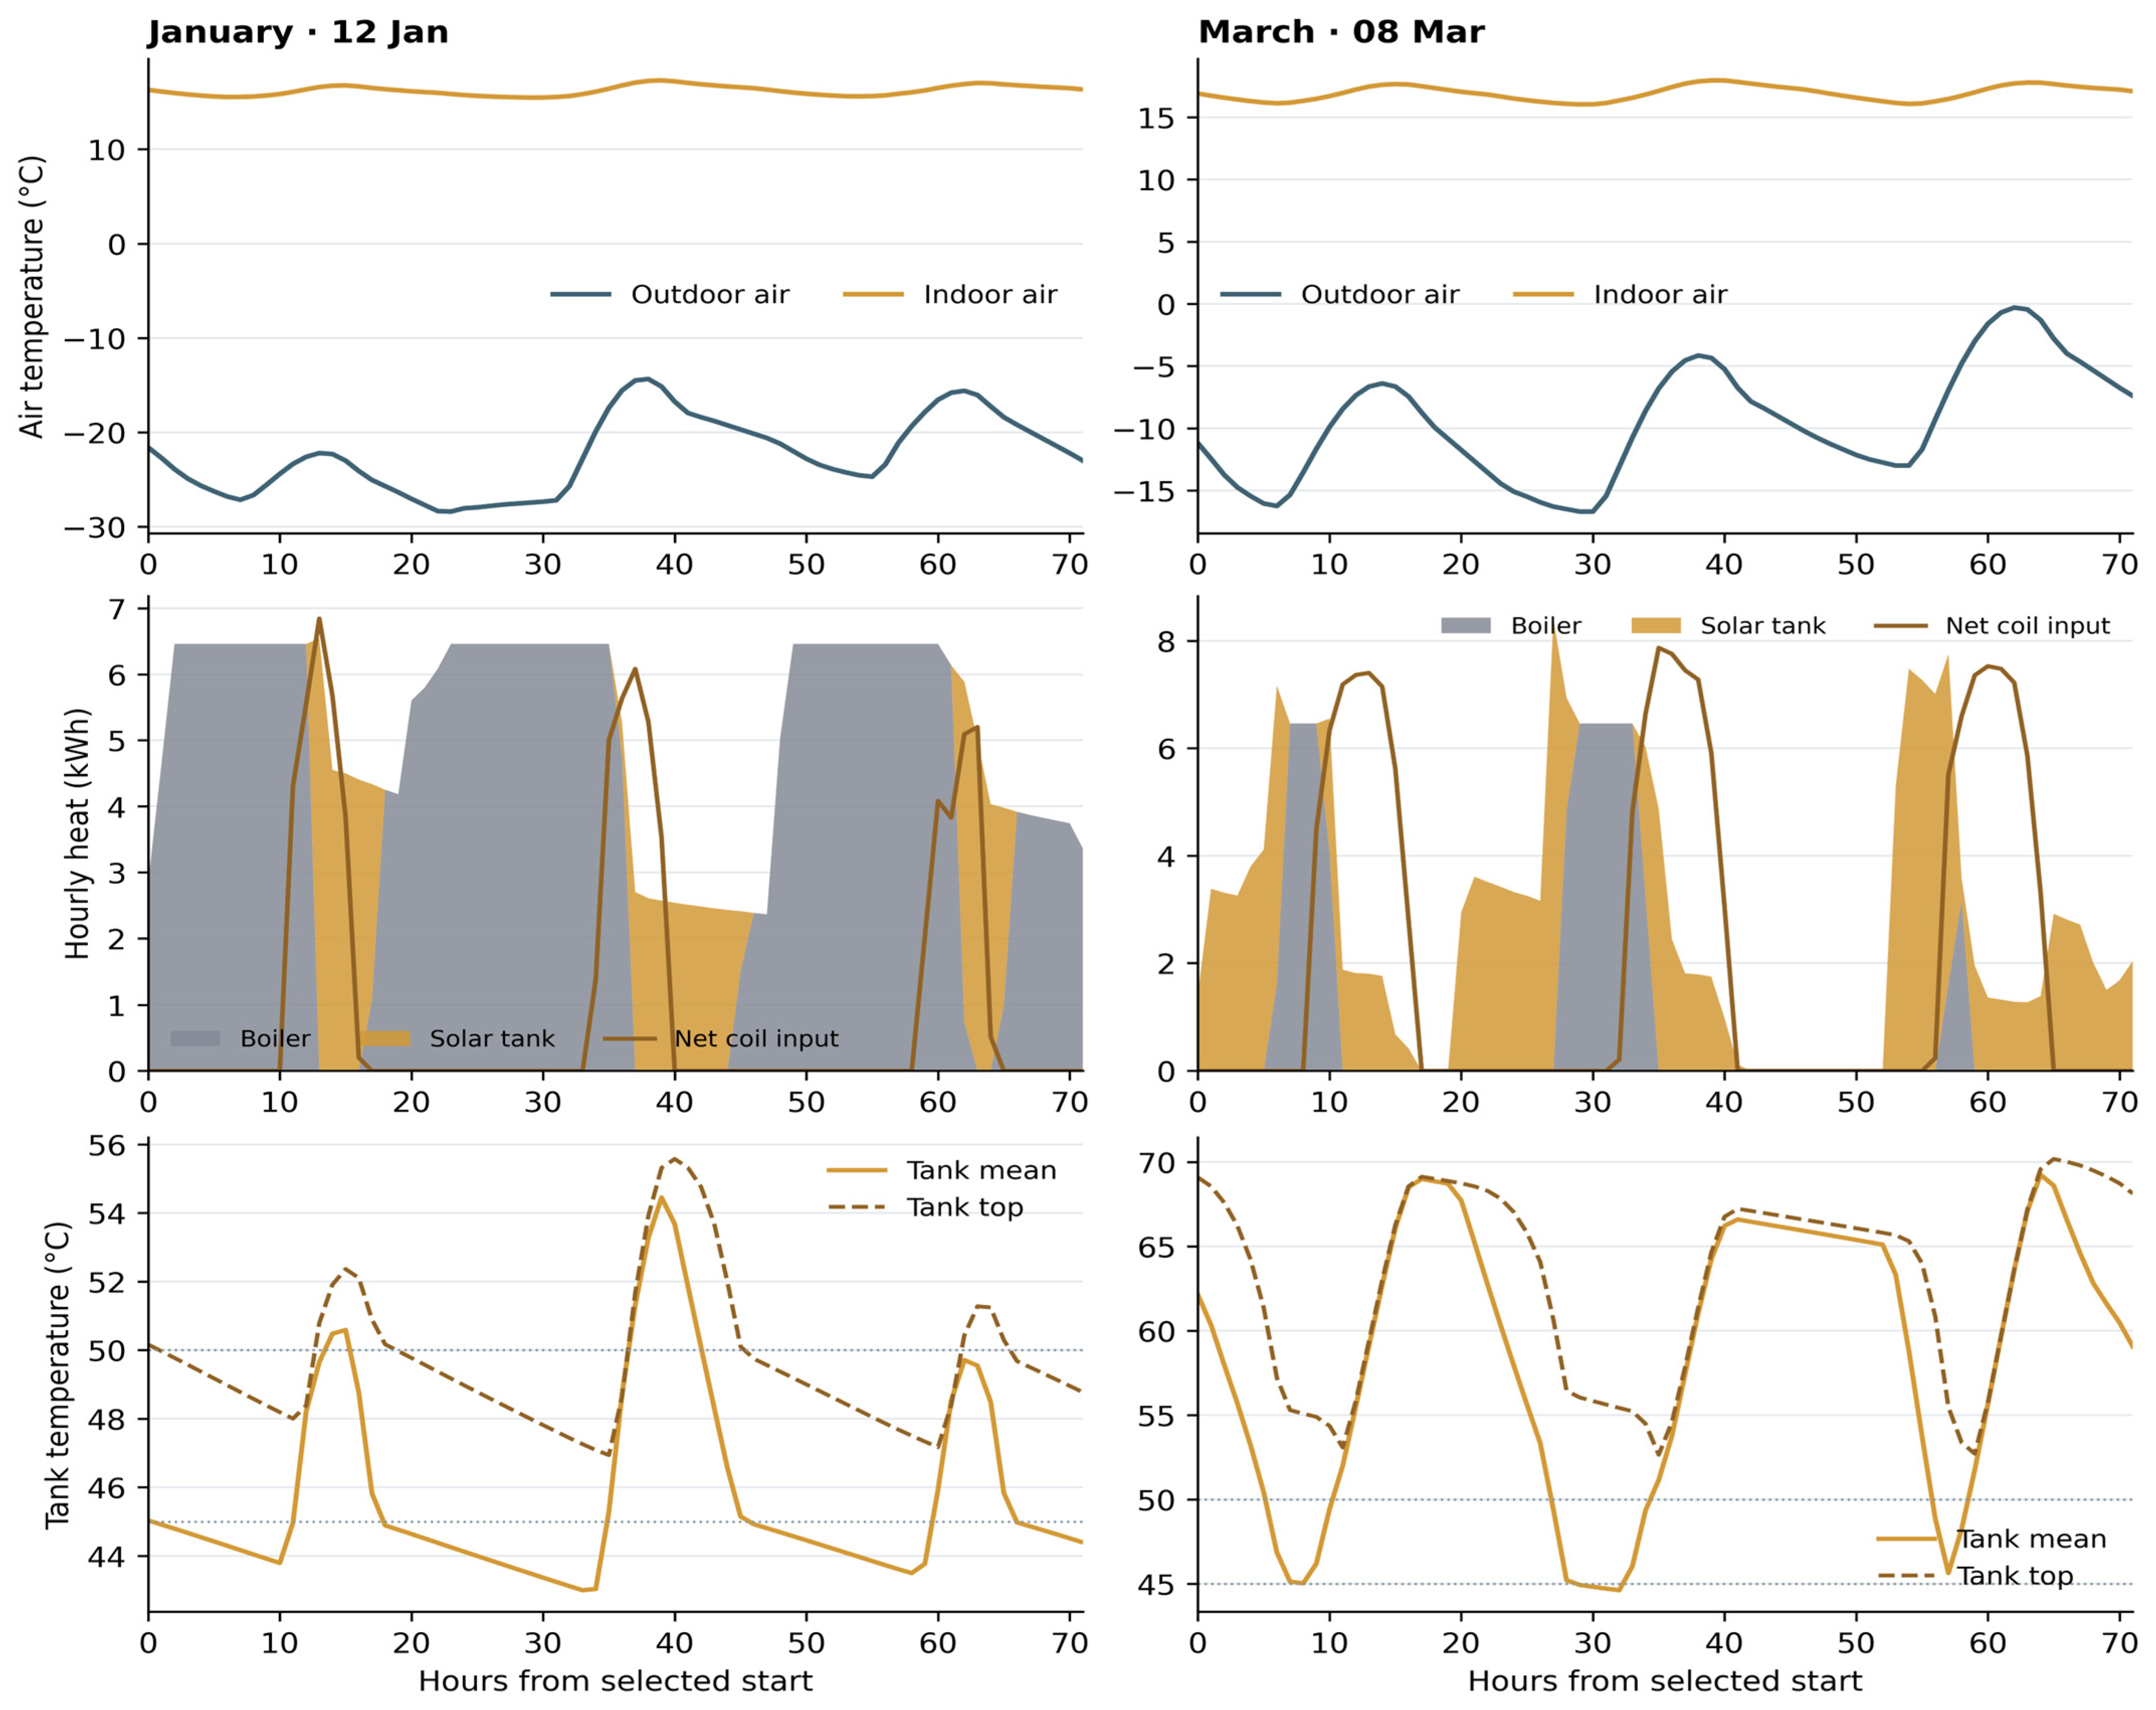
Figure 13 compares the coldest complete 72 h intervals in January and March, beginning on 12 January and 8 March. In January, the outdoor temperature fell below −25 °C and solar gains were confined to daytime periods. Tank temperature intermittently crossed the 50 °C delivery threshold, followed by discharge toward the 45 °C cutoff, while the boiler met much of the demand. In March, stronger solar gains raised the upper tank temperatures to about 65–70 °C during the selected interval and prolonged tank delivery. Daily charging and discharge indicate that the tank acted mainly as an intraday buffer under the adopted controls.
Figure 13.
Baicheng operation during selected 72 h periods in January and March: outdoor and indoor temperatures, hourly heat quantities, and mean and upper tank temperatures.
Experimental studies have evaluated solar and biomass heating in northeastern China [39] and rural dwellings [40]. At the device scale, Xu et al. showed the importance of spectral and thermal management for solar thermoelectric conversion [41]. That distinct application illustrates why a solar performance indicator must be tied to its energy boundary. Comparisons of solar fraction additionally require consistent climate and collector area relative to demand, storage, and controls. In BC-SF, solar energy reduces boiler demand when collection and tank temperature permit; biomass supplies the remaining load, especially during the core winter months.
3.2. Life-Cycle Cost and Sensitivity Analysis
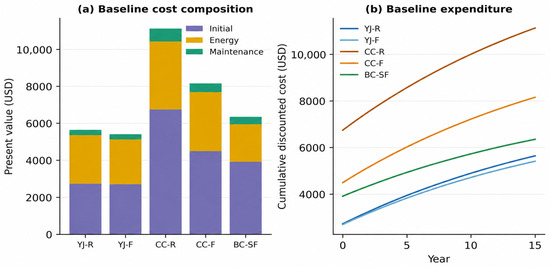
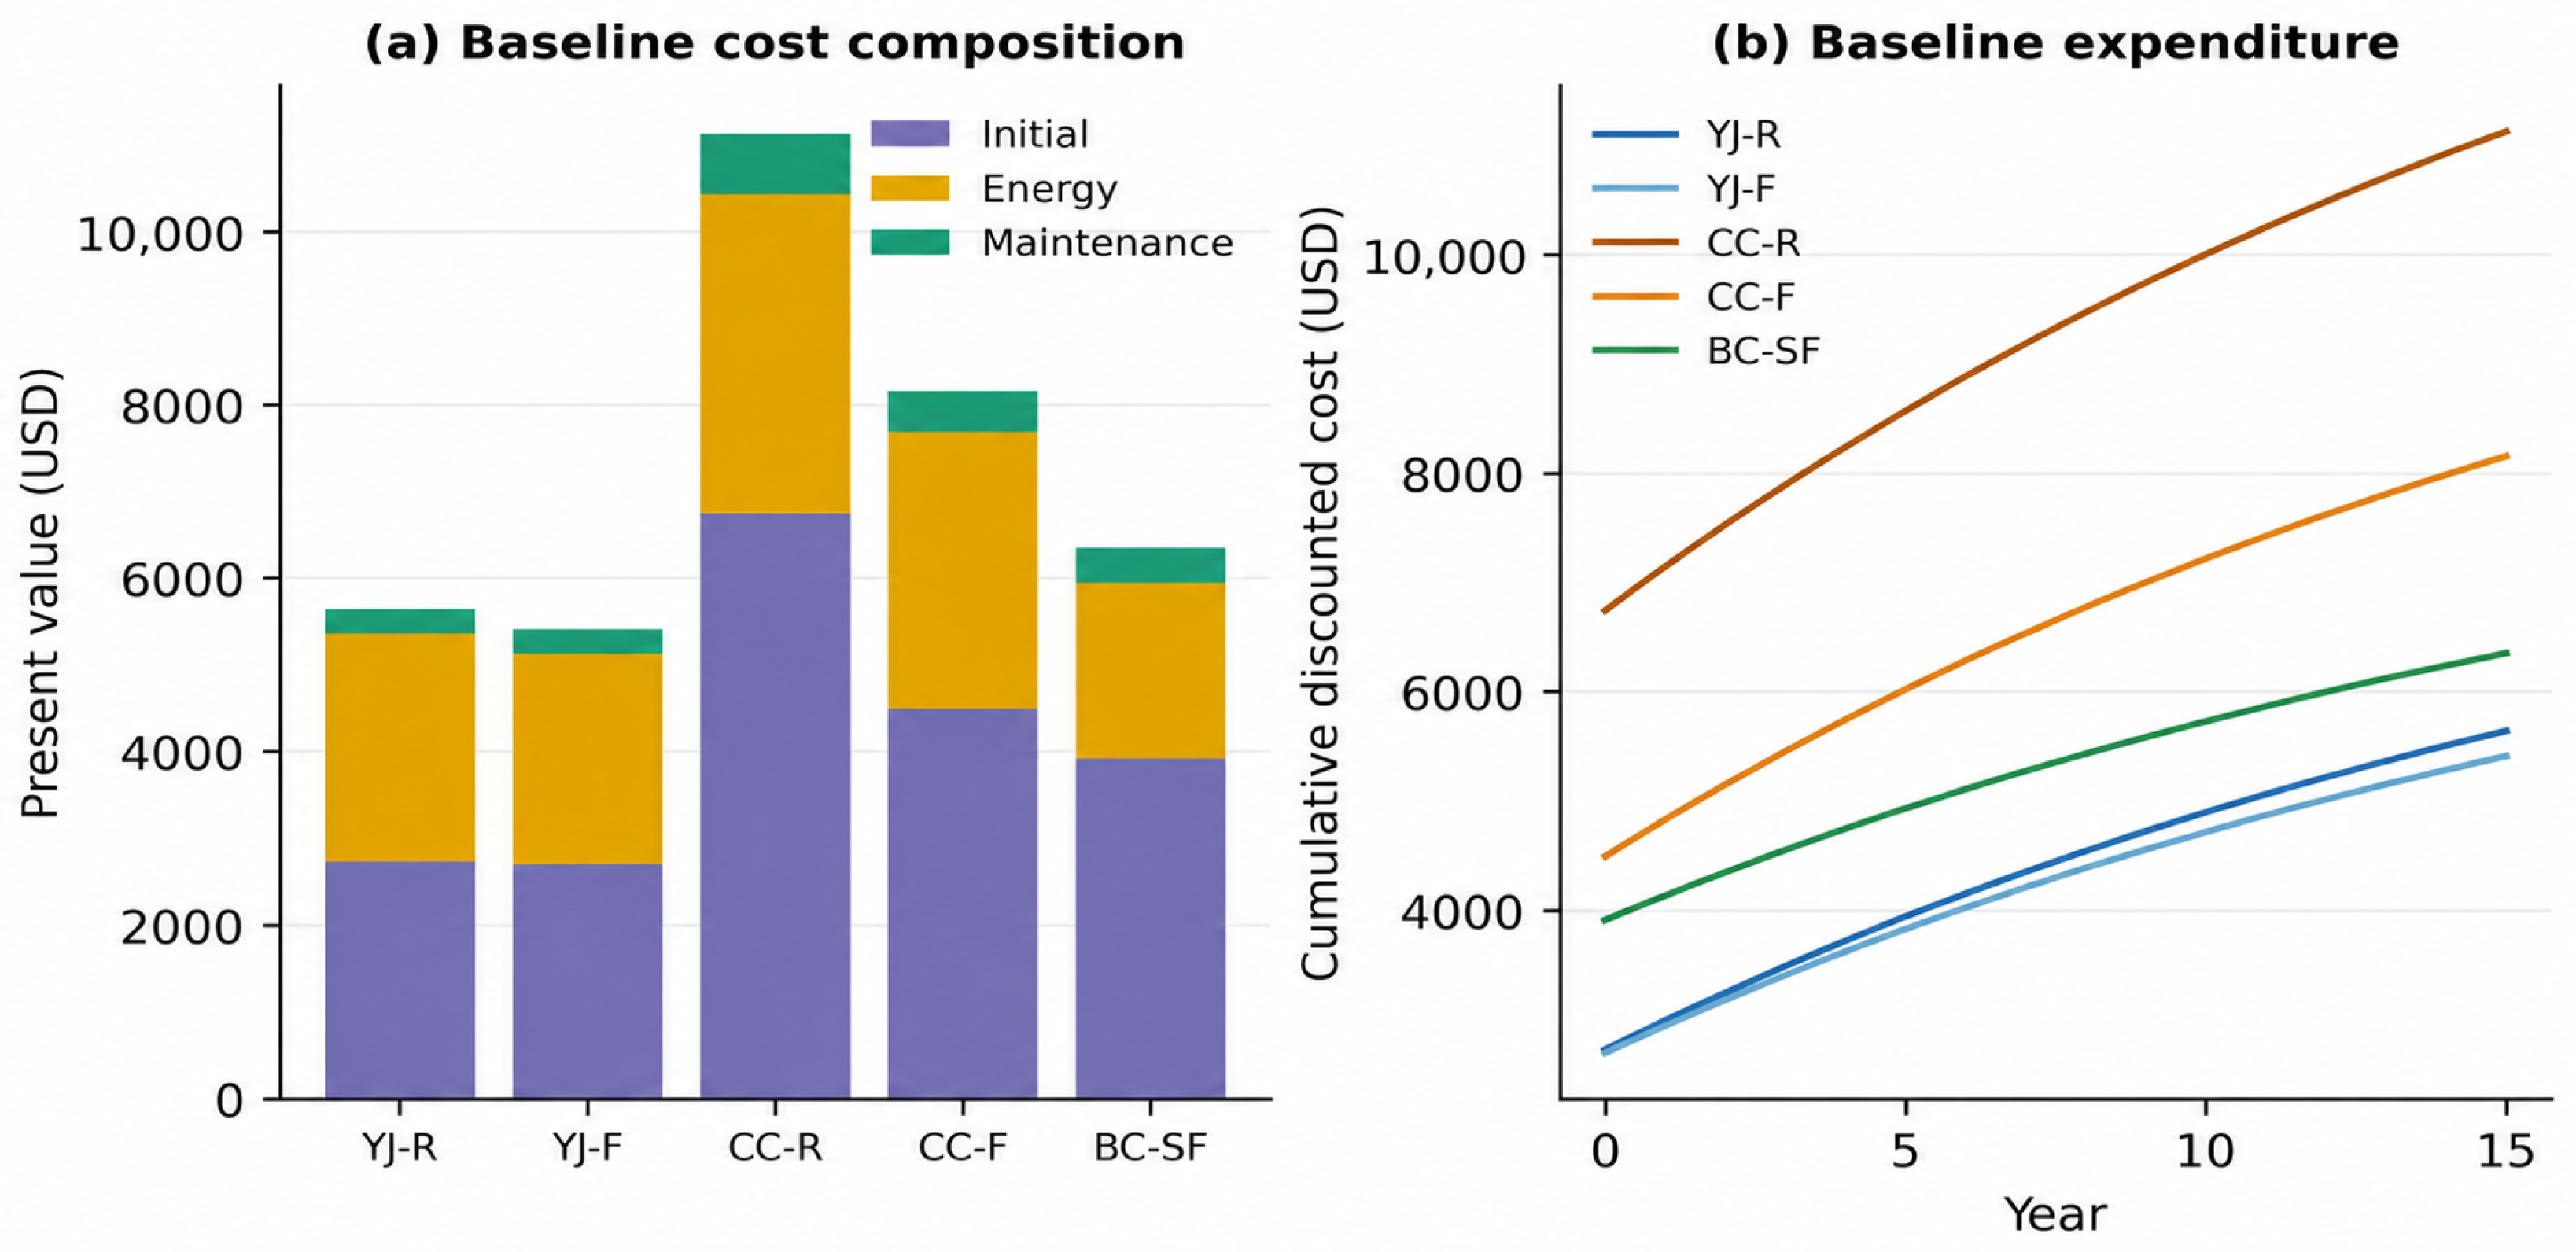
At a 5% real discount rate over 15 years, the original baseline costs are USD 5641 for YJ-R, USD 5411 for YJ-F, USD 11,127 for CC-R, USD 8156 for CC-F, and USD 6352 for BC-SF. The equivalent annual costs are USD 543, 521, 1072, 786, and 612, respectively. The currency conversion preserves all relative differences. Comparisons across cities combine different weather, technology, controls, and capital assumptions.
The baseline decomposition is retained in Figure 14. In Yanji, the YJ-F cost is approximately USD 229 (4.1%) lower; discounted energy expenditure explains about 85% of that difference. In Changchun, the difference is USD 2971 (26.7%). Initial estimates of USD 6746 for CC-R and USD 4495 for CC-F explain about 76% of the gap, maintenance about 8%, and discounted energy about 16%. The Changchun result is therefore especially sensitive to the relative installed prices.
Figure 14.
Baseline economic comparison: (a) composition of discounted cost over 15 years and (b) cumulative discounted expenditure.
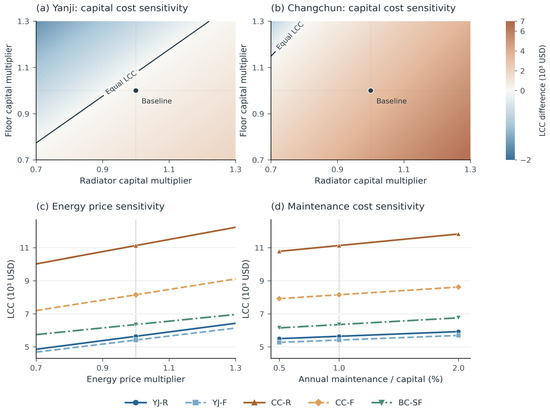
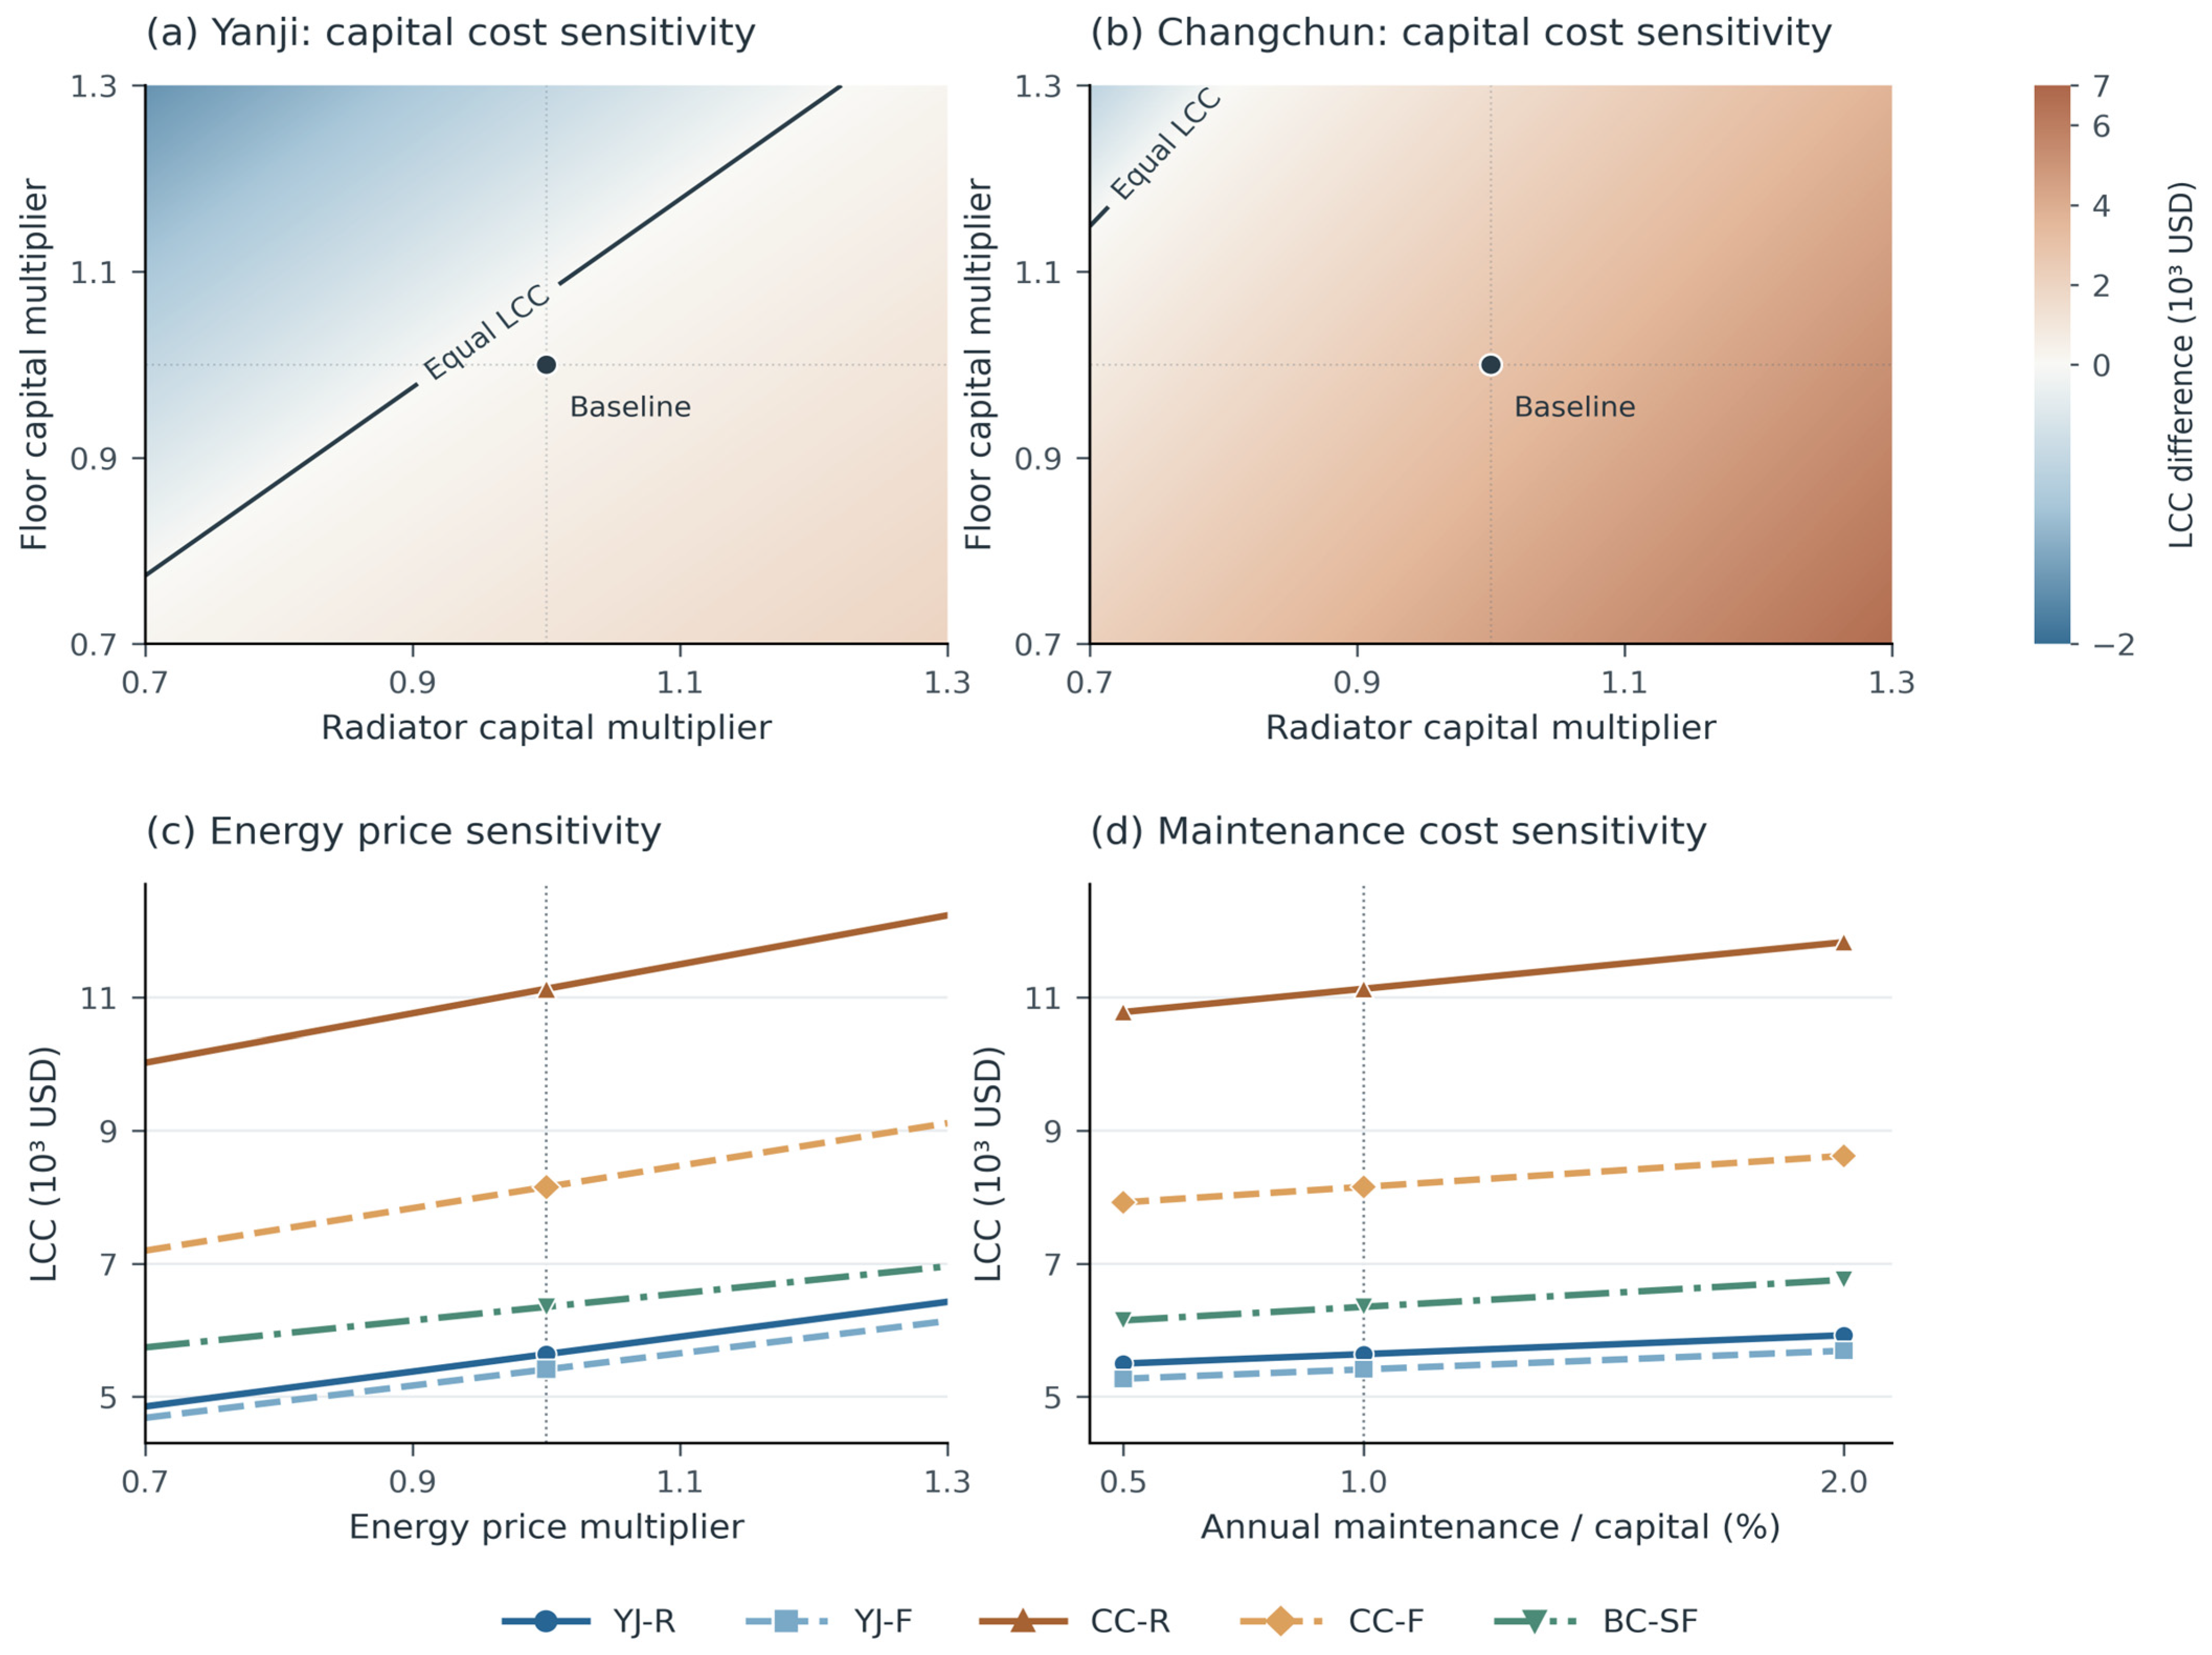
A lower assigned capital cost for CC-F does not establish a general installation cost advantage for floor heating. Published assessments also consider the balance between investment and operating expenditure [42,43,44]. In the additional calculation with equal capital cost within each city pair, the discounted energy expenditure difference alone is about USD 196 in Yanji and USD 487 in Changchun over 15 years. With maintenance still linked to capital, a floor-heating capital premium of approximately USD 177 in Yanji or USD 441 in Changchun would offset that difference in operating cost.
Figure 15 shows how independent capital changes alter paired costs. Reducing radiator capital by 30% and increasing floor-heating capital by 30% makes the floor case USD 1571 more expensive in Yanji and USD 751 more expensive in Changchun. By contrast, the floor cases retain lower costs throughout the 648 scenarios applying common market multipliers to each pair. Thus, relative component prices can reverse the baseline ranking even when common price changes do not. Table 3 gives selected maintenance and component replacement cases.
Figure 15.
Additional economic sensitivity: paired radiator minus floor LCC under independent capital multipliers for (a) Yanji and (b) Changchun, and sensitivity to (c) energy prices and (d) annual maintenance. The black contour marks equal LCC; the dot marks the original capital assumptions. Positive differences favor floor heating financially under the original indoor temperature conditions.
Table 3.
Discounted cost in the baseline and additional maintenance and replacement scenarios (USD).
Maintenance cases retain the 15-year baseline without replacement. Replacement cases use the component lives in Table S8, replacement cost at 110% of the original component cost, annual maintenance of 1%, and zero residual value. All cases use a 5% discount rate and the original energy consumption and unit prices. Remaining-life residual credits and shorter component lives are examined in Table S9. In Baicheng, 3.496 MWh of useful solar heat is equivalent to 1124 kg of biomass at the modeled boiler efficiency. The local reference requires 3975 kg per season, compared with 2852 kg in BC-SF, giving gross fuel savings of about USD 74. Depending on tank allocation, solar equipment adds USD 928–1109 to capital cost. With incremental maintenance and solar pump replacement included, its additional 15-year discounted cost is USD 276–559 under the pump expenditure bounds in Table S10. Solar assistance therefore reduces equivalent fuel requirements but does not recover its added investment within this period at the assumed prices.
3.3. Regional Implications and Study Limitations
For Yanji, biomass heating is a candidate where dependable fuel supply and maintenance can be secured. The radiator configuration delivered warmer conditions, while floor heating reduced modeled fuel use at a lower indoor temperature. For Changchun, heat pumps warrant assessment together with the building envelope, operating water temperatures, and cold-weather capacity; the advantage of CC-F requires reassessment at a common indoor temperature and with verified installed costs. For Baicheng, solar assistance can displace part of the boiler heat, but backup capacity remains essential in midwinter. These are priorities for regional assessment, not evidence that the selected technologies are optimal throughout each region.
Recent studies have examined the geographical scope of clean heating pathways in northern China [45] and compared heating modes in northeastern China [46]. The present results add hourly thermal conditions and explicit energy boundaries to such regional comparisons. They also show why economic screening should follow agreement on the indoor heating service required: a lower cost is not necessarily an improvement if it accompanies lower indoor temperatures.
The results describe one dwelling and one representative weather sequence per city. The model audit establishes consistency of the encoded inputs and energy aggregation. Independent field validation and timestep sensitivity remain priorities for further testing. The ideal demand and coupled calculations retain the documented effective capacitances and floor constructions. Separate runs would be needed to quantify the influence of performance data limits and radiation processing on seasonal results.
Room temperature feedback already provides automatic control, while occupant schedules contribute internal heat gains. A further step is to use room occupancy and daily activities to schedule heating and adjust temperature targets. Programmable room control, setback during absence, and selective room heating merit evaluation [7], with floor-heating schedules accounting for thermal inertia and reheating. Their energy, cost, and indoor temperature effects should be assessed together in future dynamic studies. Envelope improvements and appropriate operating water temperatures offer additional options [8,36].
4. Conclusions
This study links evidence from 276 rural households with hourly TRNSYS simulations and life-cycle cost analysis of five heating configurations in Jilin Province. Its contribution is a regional assessment that relates energy consumption and household expenditure to the indoor temperatures actually delivered. Three findings emerge:
Under the adopted controls, floor heating consumed 8.2% less biomass in Yanji and 13.0% less electricity in Changchun than the corresponding radiator configurations. However, temperatures below 16 °C accounted for 12.9% and 8.6% of zone hours in the two floor-heating cases, respectively, while neither radiator case recorded such exposure. The different temperature targets and control deadbands mean that these savings characterize complete operating configurations. Achieved indoor temperature is therefore essential to interpreting their energy performance.
Solar heat supplied 28.27% of seasonal heat delivery in Baicheng, but its contribution fell to 12.1% in December and 16.7% in January. Biomass remained the principal source during peak winter demand. This seasonal mismatch establishes the role of solar assistance as a means of reducing boiler demand when solar availability permits, with auxiliary capacity required throughout the coldest months.
Under the baseline assumptions, the floor-heating configurations had 15-year discounted costs 4.1% lower in Yanji and 26.7% lower in Changchun than their radiator counterparts. Changes in relative installed costs could reverse these rankings. In Baicheng, useful solar delivery was equivalent to approximately 1124 kg of biomass, yet the additional solar investment was not recovered within 15 years at the assumed prices. Fuel substitution and investment recovery therefore require separate evaluation.
For rural heating renovation, these findings support selecting emitters according to the required indoor conditions, assessing heat pumps against local electricity and installation costs, and sizing solar-assisted systems around winter auxiliary demand.
Supplementary Materials
The following supporting information can be downloaded at https://www.mdpi.com/article/10.3390/buildings16214198/s1: Questionnaire S1: Household questionnaire with consent information. Supplementary Material S2: Model parameters, performance data, energy accounting, survey summary, and economic sensitivity calculations. The accompanying data files provide numerical tables used in the figures and supplementary calculations.
Author Contributions
Conceptualization, T.Z. (Tianxiu Zhao), T.Z. (Tianyang Zhang) and H.T.; methodology, T.Z. (Tianxiu Zhao), T.Z. (Tianyang Zhang), and H.T.; software, T.Z. (Tianxiu Zhao) and Y.S.; validation, T.Z. (Tianxiu Zhao), T.S., and Z.G.; formal analysis, T.Z. (Tianyang Zhang) and Y.S.; investigation, T.S. and Z.G.; resources, T.Z. (Tianxiu Zhao), H.T. and X.W.; data curation, T.Z. (Tianxiu Zhao) and T.S.; writing—original draft preparation, T.Z. (Tianxiu Zhao); writing—review and editing, T.Z. (Tianyang Zhang), H.T., T.S., Z.G., Y.S., and X.W.; visualization, T.Z. (Tianxiu Zhao) and Z.G.; supervision, T.Z. (Tianyang Zhang) and H.T. All authors have read and agreed to the published version of the manuscript.
Funding
This research was funded by the Jilin Provincial Department of Science and Technology, grant number YDZJ202501ZYTS448.
Institutional Review Board Statement
The household questionnaire used in this study was anonymous. The questionnaire concerned 276 rural households and addressed dwelling characteristics, heating arrangements, expenditure, and preferences for replacing heating equipment. Its purpose was to provide practical context for the engineering analysis. The five heating configurations were evaluated through TRNSYS computer simulations. No experimental changes to household heating were imposed on participants, and the simulated indoor temperatures were not conditions to which participants were experimentally exposed.
Informed Consent Statement
Informed consent was obtained from all participants. Before accessing the questionnaire, the participants were informed of the study’s purpose, the voluntary and anonymous nature of participation, and their right to discontinue. Submission of the completed questionnaire constituted consent to participate.
Data Availability Statement
The data supporting the findings of this study are available from the corresponding authors upon reasonable request. Individual survey responses are not publicly available, so as to protect participant privacy.
Acknowledgments
During preparation of this manuscript, the authors used ChatGPT-6 (OpenAI) to assist with language revision and organization of the text. The authors have reviewed and edited the output and take full responsibility for the content of this publication.
Conflicts of Interest
The authors declare no conflicts of interest.
Abbreviations
| ASHP | Air source heat pump |
| BC-SF | Baicheng solar and biomass system with floor heating |
| CC-R/CC-F | Changchun heat pump with radiators/floor heating |
| COP | Coefficient of performance |
| EAC | Equivalent annual cost |
| LCC | Life-cycle cost |
| SPF | Seasonal performance factor |
| YJ-R/YJ-F | Yanji biomass boiler with radiators/floor heating |
References
- Zheng, G.; Bu, W. Review of Heating Methods for Rural Houses in China. Energies 2018, 11, 3402. [Google Scholar] [CrossRef] [Scilit]
- Wang, S.; Bleil de Souza, C.; Golubchikov, O. Recent Advances in Decarbonising Heating in Rural China: A Review. Renew. Sustain. Energy Rev. 2025, 210, 115282. [Google Scholar] [CrossRef] [Scilit]
- Shen, G.; Xiong, R.; Tian, Y.; Luo, Z.; Jiangtulu, B.; Meng, W.; Du, W.; Meng, J.; Chen, Y.; Xue, B.; et al. Substantial Transition to Clean Household Energy Mix in Rural China. Natl. Sci. Rev. 2022, 9, nwac050. [Google Scholar] [CrossRef] [Scilit] [PubMed]
- Wang, Z.; Li, C.; Cui, C.; Liu, H.; Cai, B. Cleaner Heating Choices in Northern Rural China: Household Factors and the Dual Substitution Policy. J. Environ. Manag. 2019, 249, 109433. [Google Scholar] [CrossRef] [Scilit] [PubMed]
- Zhu, L.; Liao, H.; Zhou, Y. Fuel Adoption in Rural Heating: A Field Study on Northern China. China Agric. Econ. Rev. 2023, 15, 302–322. [Google Scholar] [CrossRef] [Scilit]
- Cui, Y.; Sun, N.; Cai, H.; Li, S. Indoor Temperature Improvement and Energy-Saving Renovations in Rural Houses of China’s Cold Region—A Case Study of Shandong Province. Energies 2020, 13, 870. [Google Scholar] [CrossRef] [Scilit]
- Hu, X.; Jokisalo, J.; Kosonen, R.; Lehtonen, M.; Shao, T. Cost-Optimal Renovation Solutions for Detached Rural Houses in Severe Cold Regions of China. Buildings 2023, 13, 771. [Google Scholar] [CrossRef] [Scilit]
- Liu, S.; Liu, H.; Mauzerall, D.L. Improving Building Envelope Efficiency Lowers Costs and Emissions from Rural Residential Heating in China. Environ. Sci. Technol. 2023, 57, 595–605. [Google Scholar] [CrossRef] [Scilit] [PubMed]
- Zhang, Y.; Ma, Q.; Li, B.; Fan, X.; Fu, Z. Application of an Air Source Heat Pump (ASHP) for Heating in Harbin, the Coldest Provincial Capital of China. Energy Build. 2017, 138, 96–103. [Google Scholar] [CrossRef] [Scilit]
- Deng, J.; Tian, Z.; Fan, J.; Yang, M.; Furbo, S.; Wang, Z. Simulation and Optimization Study on a Solar Space Heating System Combined with a Low Temperature ASHP for Single-Family Rural Residential Houses in Beijing. Energy Build. 2016, 126, 2–13. [Google Scholar] [CrossRef] [Scilit]
- Wu, J.; Shen, M.; Feng, J. The Application of a Solar–Air-Source Heat Pump Dual-Supply Heating System in a High-Cold Area in China. Processes 2023, 11, 737. [Google Scholar] [CrossRef] [Scilit]
- Hou, Y.-T.; Yang, B.; Zhang, S.-Y.; Qi, Y.; Yu, X.-H. 4E Analysis of an Integrated Solar–Biomass Heating System: A Case Study in Rural Housing of Northern China. Sustain. Energy Technol. Assess. 2022, 53, 102794. [Google Scholar] [CrossRef] [Scilit]
- Li, J.; Ma, X.; Shen, G.; Ren, Y.; Ma, Y.; Yu, Z.; Wang, Q.; Reaihan, E.; Ai, N.; Li, J.; et al. Optimal Study of a Hybrid Solar–Biomass Heating System for Rural Household in Cold Regions of China. Sol. Energy 2024, 284, 113101. [Google Scholar] [CrossRef] [Scilit]
- Deng, M.; Ma, R.; Lu, F.; Nie, Y.; Li, P.; Ding, X.; Yuan, Y.; Shan, M.; Yang, X. Techno-Economic Performances of Clean Heating Solutions to Replace Raw Coal for Heating in Northern Rural China. Energy Build. 2021, 240, 110881. [Google Scholar] [CrossRef] [Scilit]
- Gür, M.; Öztop, H.F. Year-round experimental 4E assessment of an integrated PV/T-BIPV system in an nZEB-oriented test building. Sci. Rep. 2026. [Google Scholar] [CrossRef] [Scilit]
- Gür, M.; Öztop, H.F.; Yamaç, H.İ.; Gürgenç, E.; Selimefendigil, F. An experimental study on thermal effects in building integrated semi transparent double skin façades for a nearly zero energy building. Appl. Therm. Eng. 2026, 290, 129995. [Google Scholar] [CrossRef] [Scilit]
- Gür, M.; Öztop, H.F.; Hepbasli, A. When net-zero falls short of carbon neutrality: Assessing dynamic life-cycle carbon integrity in grid-connected building microgrids. Sustain. Cities Soc. 2026, 149, 107843. [Google Scholar] [CrossRef] [Scilit]
- GB 50176-2016; Code for Thermal Design of Civil Building. China Architecture & Building Press: Beijing, China, 2016. (In Chinese)
- Remund, J.; Müller, S.; Schmutz, M.; Barsotti, D.; Graf, P.; Cattin, R. Meteonorm Version 8: Handbook Part I—Software; Meteotest AG: Bern, Switzerland, 2020; Available online: https://meteonorm.com/assets/downloads/mn80_software.pdf (accessed on 17 September 2026).
- Bai, C.; Zhan, J.; Wang, H.; Yang, Z.; Liu, H.; Liu, W.; Wang, C.; Chu, X.; Teng, Y. Heating Choices and Residential Willingness to Pay for Clean Heating: Evidence from a Household Survey in Rural China. Energy Policy 2023, 178, 113617. [Google Scholar] [CrossRef] [Scilit]
- Gong, Y.; Cai, B.-F.; Sun, Y. Perceived Fiscal Subsidy Predicts Rural Residential Acceptance of Clean Heating: Evidence from an Indoor-Survey in a Pilot City in China. Energy Policy 2020, 144, 111687. [Google Scholar] [CrossRef] [Scilit]
- Solar Energy Laboratory, University of Wisconsin–Madison. TRNSYS 18: A Transient System Simulation Program; University of Wisconsin–Madison: Madison, WI, USA, 2017. [Google Scholar]
- U.S. Department of Energy. EnergyPlus. Available online: https://energyplus.net/ (accessed on 2 October 2026).
- Kassai, M. Development and Experimental Validation of a TRNSYS Model for Energy Design of Air-to-Water Heat Pump System. Therm. Sci. 2020, 24, 893–902. [Google Scholar] [CrossRef] [Scilit]
- Zhou, Y.; Cao, S. Investigation of the flexibility of a residential net-zero energy building (NZEB) integrated with an electric vehicle in Hong Kong. Energy Procedia 2019, 158, 2567–2579. [Google Scholar] [CrossRef] [Scilit]
- Cao, J.; Zhou, S.; Wang, T.; Shan, B.; Liu, X. Research on a Variable Water Supply Temperature Strategy for a Ground-Source Heat Pump System Based on TRNSYS-GENOPT (TRNOPT) Optimization. Sustainability 2023, 15, 4388. [Google Scholar] [CrossRef] [Scilit]
- Panasonic. Aquarea T-CAP M Series: Air to Water Heat Pumps with R290; Product Catalogue; Panasonic Marketing Europe GmbH: Wiesbaden, Germany, 2024; Available online: https://www.aircon.panasonic.eu/ (accessed on 10 October 2026).
- DIN CERTCO. Heat Pump KEYMARK Certificate, Registration No. 011-1W0924: Aquarea T-CAP 16 kW (M Series), WH-WXG16ME8; DIN CERTCO Gesellschaft für Konformitätsbewertung mbH: Berlin, Germany, 2024; Available online: https://www.dincertco.tuv.com/registrations/60179384?locale=en (accessed on 10 October 2026).
- National Bureau of Statistics of China. Statistical Communiqué of the People’s Republic of China on the 2025 National Economic and Social Development. 2026. Available online: https://www.stats.gov.cn/sj/zxfbhjd/202602/t20260228_1962662.html (accessed on 2 October 2026).
- Malenković, I.; Pärisch, P.; Eicher, S.; Bony, J.; Hartl, M. Definition of Main System Boundaries and Performance Figures for Reporting on SHP Systems; Deliverable B1, IEA SHC Task 44/HPP Annex 38; International Energy Agency Solar Heating and Cooling Programme: Paris, France, 2013; Available online: https://www.iea-shc.org/data/sites/1/publications/T44A38_Rep_B1_SHP_Perf_definition%20approved.pdf (accessed on 17 September 2026).
- ISO 15686-5:2017; Buildings and Constructed Assets—Service Life Planning—Part 5: Life-Cycle Costing. ISO: Geneva, Switzerland, 2017.
- GB 50495-2019; Technical Standard for Solar Heating System. China Architecture & Building Press: Beijing, China, 2019. (In Chinese)
- Deng, Q.; Zhang, S.; Shan, M.; Li, J. Research on Envelope Thermal Performance of Ultra-Low Energy Rural Residential Buildings in China. Sustainability 2023, 15, 6931. [Google Scholar] [CrossRef] [Scilit]
- Yu, L.; Han, X.; Ju, S.; Tao, Y.; Xu, X. Optimization Design of Indoor Thermal Environment and Air Quality in Rural Residential Buildings in Northern China. Buildings 2025, 15, 2050. [Google Scholar] [CrossRef] [Scilit]
- Sarbu, I.; Sebarchievici, C. Performance Evaluation of Radiator and Radiant Floor Heating Systems for an Office Room Connected to a Ground-Coupled Heat Pump. Energies 2016, 9, 228. [Google Scholar] [CrossRef] [Scilit]
- Maivel, M.; Kurnitski, J. Heating System Return Temperature Effect on Heat Pump Performance. Energy Build. 2015, 94, 71–79. [Google Scholar] [CrossRef] [Scilit]
- Wu, C.; Liu, F.; Li, X.; Wang, Z.; Xu, Z.; Zhao, W.; Yang, Y.; Wu, P.; Xu, C.; Wang, Y. Low-Temperature Air Source Heat Pump System for Heating in Severely Cold Area: Long-Term Applicability Evaluation. Build. Environ. 2022, 208, 108594. [Google Scholar] [CrossRef] [Scilit]
- Dong, J.; Deng, S.; Jiang, Y.; Xia, L.; Yao, Y. An Experimental Study on Defrosting Heat Supplies and Energy Consumptions during a Reverse-Cycle Defrost Operation for an Air Source Heat Pump. Appl. Therm. Eng. 2012, 37, 380–387. [Google Scholar] [CrossRef] [Scilit]
- Yuan, P.; Duanmu, L.; Wang, Z.; Gao, S.; Zheng, H. Thermal Performance of Solar–Biomass Energy Heating System Coupled with Thermal Storage Floor and Radiators in Northeast China. Appl. Therm. Eng. 2024, 236, 121458. [Google Scholar] [CrossRef] [Scilit]
- Zhang, X.; Yang, J.; Fan, Y.; Zhao, X.; Yan, R.; Zhao, J.; Myers, S. Experimental and Analytic Study of a Hybrid Solar/Biomass Rural Heating System. Energy 2020, 190, 116392. [Google Scholar] [CrossRef] [Scilit]
- Xu, T.; Wei, R.; Singh, S.C.; Guo, C. 15-Fold Increase in Solar Thermoelectric Generator Performance through Femtosecond-Laser Spectral Engineering and Thermal Management. Light Sci. Appl. 2025, 14, 268. [Google Scholar] [CrossRef] [Scilit] [PubMed]
- Zhang, Q.; Zhang, L.; Nie, J.; Li, Y. Techno-Economic Analysis of Air Source Heat Pump Applied for Space Heating in Northern China. Appl. Energy 2017, 207, 533–542. [Google Scholar] [CrossRef] [Scilit]
- Zhou, M.; Liu, H.; Peng, L.; Qin, Y.; Chen, D.; Zhang, L.; Mauzerall, D.L. Environmental Benefits and Household Costs of Clean Heating Options in Northern China. Nat. Sustain. 2022, 5, 329–338. [Google Scholar] [CrossRef] [Scilit]
- Wang, F.; Shang, Y.; Zhang, P.; Zhang, W.; Li, J. Exploring the Economically Sustainable Solutions for Clean Heating in Rural Northern China. Fundam. Res. 2026, 6, 455–464. [Google Scholar] [CrossRef] [Scilit] [PubMed]
- Hao, M.; Cao, Q.; Zhao, X.; Chen, J.; Yang, L.; Zhong, Y.; Li, L. Suitable Promotion Scope of Different Clean Heating Technology Paths in Northern China. Sustain. Energy Technol. Assess. 2024, 68, 103887. [Google Scholar] [CrossRef] [Scilit]
- Yuan, Y.; Lin, Y.; Qiao, X.; Kong, X. Comprehensive Evaluation on Performance and Local Impact in Energy, Environment, and Economy of Different Rural Clean Heating Modes: A Case Study in Northeastern China. J. Build. Eng. 2024, 88, 109219. [Google Scholar] [CrossRef] [Scilit]

Disclaimer/Publisher’s Note: The statements, opinions and data contained in all publications are solely those of the individual author(s) and contributor(s) and not of MDPI and/or the editor(s). MDPI and/or the editor(s) disclaim responsibility for any injury to people or property resulting from any ideas, methods, instructions or products referred to in the content. |
© 2026 by the authors. Licensee MDPI, Basel, Switzerland. This article is an open access article distributed under the terms and conditions of the Creative Commons Attribution (CC BY) license.