


Abstract
This study investigates the operational response of a two-sensor electronic heat cost allocator (HCA) installed on a high-inertia cast-iron radiator in a multi-family building. Over 164 days, reference temperatures recorded at 2-s intervals and aggregated into 30-min means were used to estimate radiator heat emission and compare it with the dimensionless units registered by the HCA. Zero allocation units were recorded on 50 of 95 days (52.6%) with positive model-based heat-emission estimates. These days accounted for 39.9% of the total estimated heat emission; after excluding the initial 24-day low-flow period, the corresponding share decreased to 10.6%. The daily Spearman rank correlation increased from 0.597 for the full period to 0.828 after this exclusion. The proposed Energy-to-Allocation-Unit Ratio (EAUR) varied from 0.20 to 4.042 kWh/unit across months, indicating substantial changes in the relationship between estimated emission and registered units. Comparisons with a theoretical allocation model revealed further differences, potentially related to transient thermal conditions, model limitations, and undisclosed HCA algorithms. As this was a single-node case study, these findings cannot be generalized to other devices or buildings without further investigation.
1. Introduction
Buildings are among the major contributors to final energy use and greenhouse-gas emissions, and the reduction in heating and cooling demand remains a key challenge in climate-change mitigation. In cold and temperate climates, space heating represents a particularly important component of residential energy consumption. Therefore, reliable measurement, estimation, and allocation of heating energy are essential not only for billing purposes but also for energy-efficiency policy and building operation. EU directives mandate individual heat consumption metering and cost allocation [1,2,3]. While direct residential heat meters are effective in new buildings with horizontal distribution systems, millions of existing multi-family buildings with vertical systems still pose a significant challenge [4,5]. Their architecture usually precludes direct apartment-level heat measurement, leading to the use of indirect electronic heat cost allocators (HCAs).
The technical requirements and calculation principles for electronic heat cost allocators in Europe are standardized by EN 834 [6]. However, EN 834 does not define a complete heat-cost settlement procedure. In practice, registered allocation units are converted into heat costs according to national regulations, building-level settlement rules, and complementary technical methodologies [2,3,5]. Previous analytical studies have also discussed the relationship between registered allocation units, radiator surface-temperature fields, and heat-cost-allocation practice [7,8,9]. Under real operating conditions, especially in partially retrofitted buildings with high-inertia radiators, intermittent loads and environmental heat gains may influence the proportionality between registered allocation units and radiator heat-emission estimates.
Recent literature points out metrological limitations in indirect HCAs. Michnikowski and Deska [10] discussed metrological limitations, while Cholewa et al. [11] analyzed technical and regulatory vulnerabilities in heat cost allocation. Under controlled conditions, Ficco et al. [12] reported measurement deviations linked to thermal coupling and mounting. Dell’Isola et al. [13] and Siggelsten [14] reported that HCA algorithms may exhibit non-linearity and susceptibility to external heat biases. Furthermore, previous research indicated that internal sensor readings may differ from actual surface and room temperatures [15], alongside foundational linearity evaluations [16]. These findings collectively suggest that steady-state models may be less reliable under dynamic conditions. Nevertheless, a methodological gap remains regarding how such thermodynamic and operational effects influence HCA integration algorithms in continuous field data collected from an actual billing HCA over a full heating season.
Foundational studies by Michnikowski [17] and Michnikowski and Skiba [18] provided analytical frameworks for evaluating allocation systems. However, their reliance on theoretical calculations, laboratory isolation, or averaged annual data may obscure short-term dynamic effects occurring during transient radiator operation. To bridge this gap, this study provides a focused empirical evaluation of an EN 834-compliant two-sensor HCA through an intensive, high-resolution single-node case study under transient real-world conditions.
The relevance of HCA outputs also extends beyond billing. Andersen et al. [19] showed that heat cost allocation can influence occupants’ control of the indoor environment, indicating that allocation signals may affect user behavior in apartments. More recently, Benakopoulos et al. [20] proposed using data from existing digital heat cost allocators to support low-temperature operation of radiator systems, including the identification of radiators not in operation. A subsequent implementation study used HCA data to calculate minimum supply temperatures and locate critical apartments with higher heat demand [21]. These approaches are further supported by recent advancements in data pre-processing [22], which enhance the usability of HCA measurements for demand-side digitalization [23], identifying system faults [24], and optimizing low-temperature district heating operations in apartment buildings [25]. These studies demonstrate the practical importance of HCA data for both cost allocation and heating-system operation and underline the need to verify whether allocator outputs remain metrologically proportional under dynamic and low-temperature operating conditions.
The main contribution of this research lies in its continuous in-situ approach, shifting the metrological verification of HCAs from theoretical models to a high-resolution, 164-day longitudinal case study. Specifically, this work identifies a zero-registration regime defined as periods with positive model-based heat-emission estimates but zero registered allocation units. Furthermore, it defines and applies the Energy-to-Allocation-Unit Ratio (EAUR) to quantify intra-seasonal variation in the model-based energy equivalent of one registered allocation unit.
The research hypothesis is that, when coupled with high-inertia cast-iron radiators characteristic of legacy systems in partially retrofitted buildings, indirect allocation algorithms may exhibit metrological discrepancies during intermittent operation. These discrepancies may affect the temporal proportionality of heat allocation and indicate the need to assess EN 834-based algorithms under non-steady-state operating conditions.
The remainder of the paper is organized as follows. Section 2 describes the study site, measurement setup, data acquisition procedure, model-based heat-emission estimate, uncertainty analysis, and statistical indicators. Section 3 presents the observed relationship between the model-based heat-emission estimate and registered allocation units, including correlation analysis, EAUR, theoretical Qcalc comparison, and a daily registration classification matrix. Section 4 discusses the implications and limitations of the findings, while Section 5 summarizes the main conclusions and directions for further research.
2. Materials and Methods
The methodology combined continuous in-situ temperature monitoring, model-based radiator heat-emission estimation, uncertainty analysis, and statistical evaluation of the allocator response. To improve clarity, this section is divided into subsections describing the study site, instrumentation and data acquisition, heat-emission modelling, uncertainty analysis, statistical indicators, theoretical allocation units, and the classification matrix. The analysis was not intended to isolate weather as a single causal factor. The observed allocator response was interpreted as the combined effect of thermal inertia, intermittent operation, sensor–ambient temperature gradients, start-up thresholds, proprietary filtering logic, and possible environmental heat gains.
2.1. Study Site and Heating-System Configuration
The empirical research was designed as a high-resolution, single-node longitudinal case study conducted in a room located on the second floor of an actual multi-family residential building in north-eastern Poland, equipped with a traditional vertical central heating system.
While macro-scale studies with large sample sizes typically average out transient operational anomalies, this study deliberately isolates a single measurement node (N = 1). This approach prioritizes temporal depth over spatial breadth, enabling an uninterrupted, high-frequency thermodynamic analysis (2-s sampling interval) over 164 days. The selection of a high-inertia cast-iron radiator was intentional; it represents the legacy thermal infrastructure predominantly active in older, partially retrofitted European building stock [26], particularly in historical buildings where accurate heat accounting measurement methods remain a critical challenge [27], providing a relevant environment for assessing EN 834-based allocation assumptions. The study period spanned 164 continuous days (1 November 2022 to 13 April 2023), capturing the full operational spectrum—from continuous winter thermal loads to transient states potentially affected by environmental heat gains.
2.2. Instrumentation and Data Acquisition
The measurement setup was installed on a standard 12-section cast-iron radiator [26,28]. Crucially, the evaluated device was not a laboratory mock-up, but an official, actively billing two-sensor electronic heat cost allocator (HCA) formally installed by the building’s property management. It was mounted precisely in the middle of the radiator’s length (on the 6th section) and at the optimal height recommended by manufacturers (2/3 of the radiator’s height from the bottom).
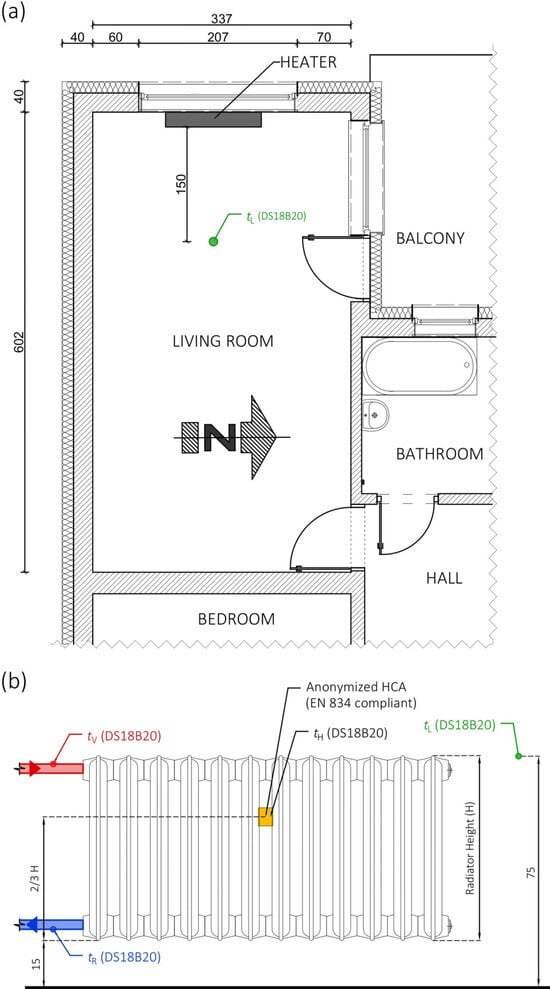
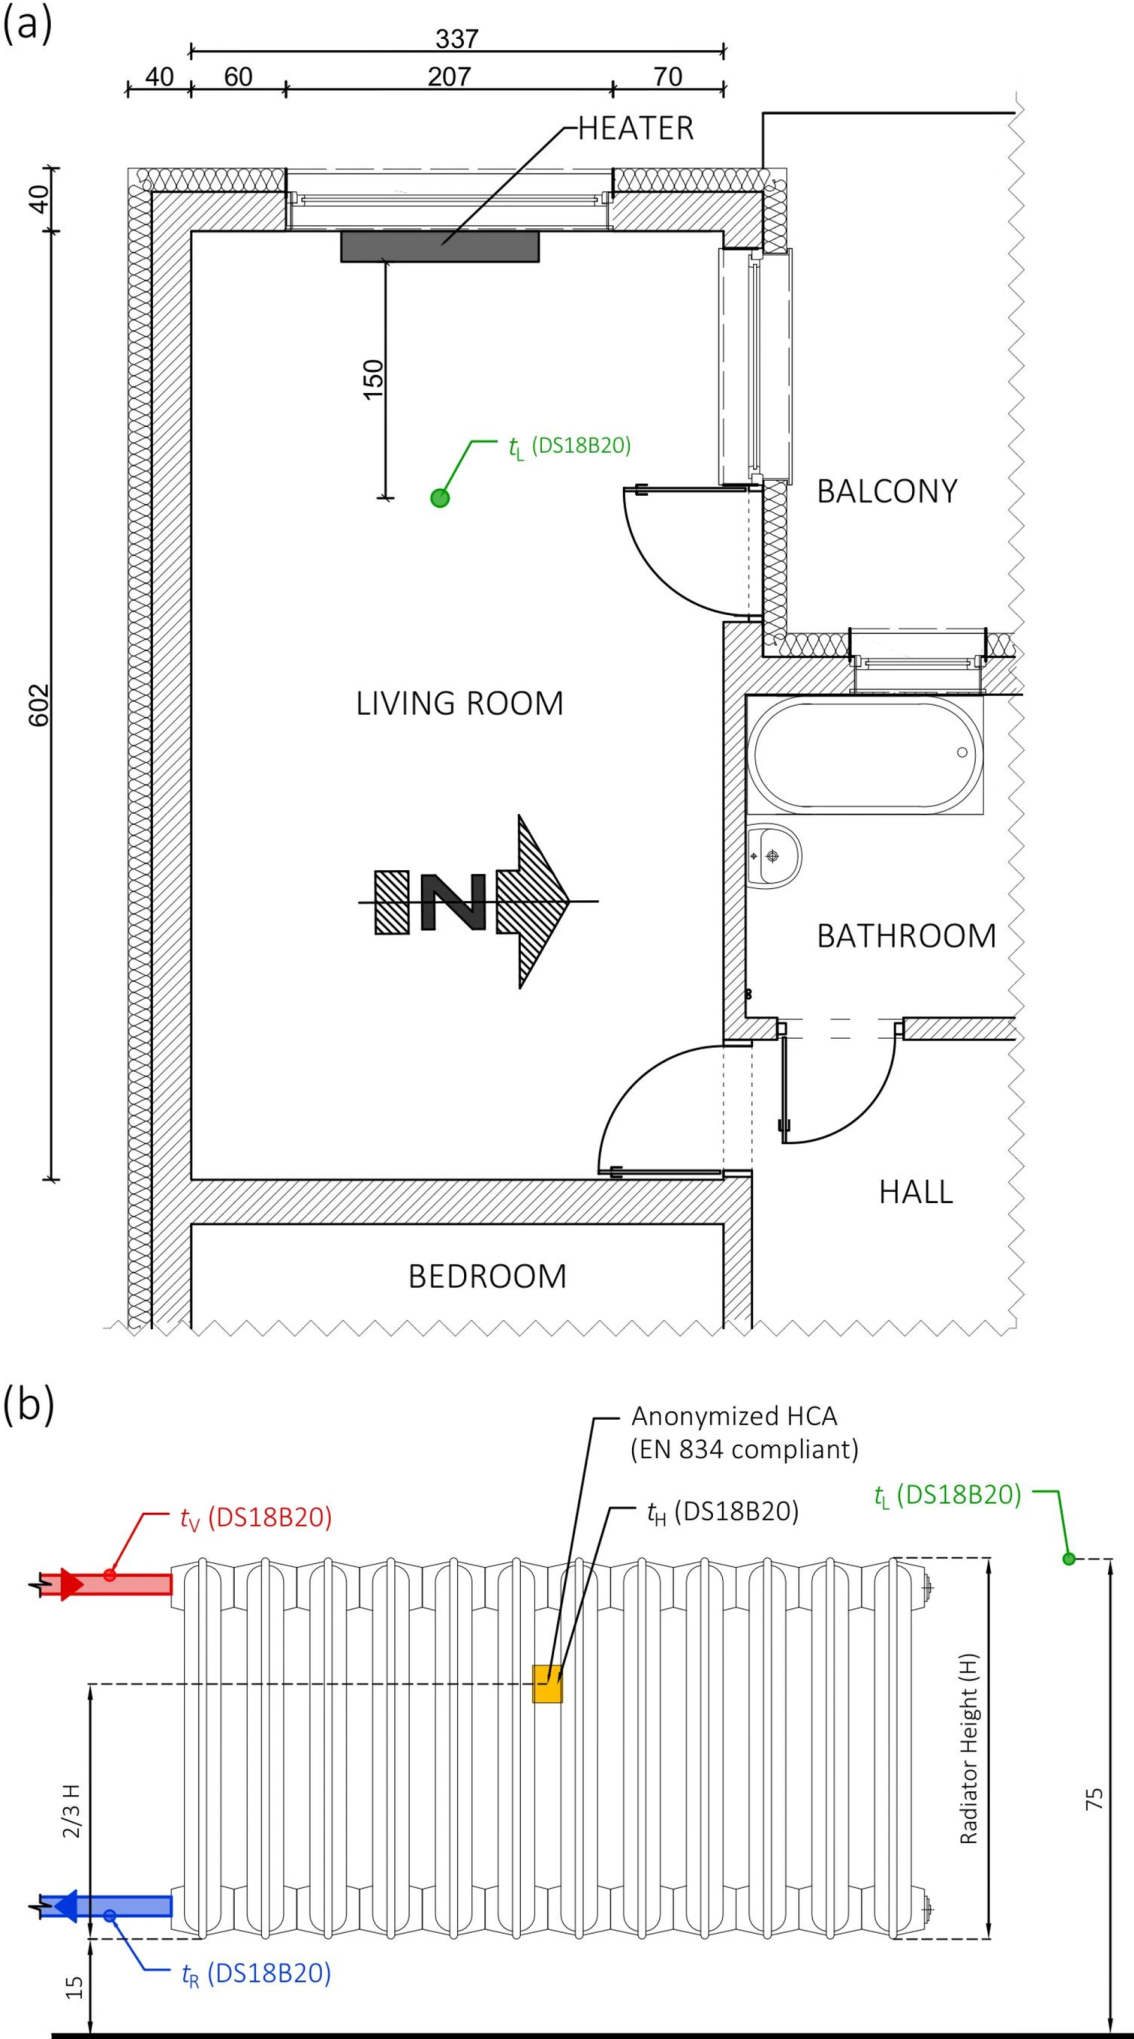
The device is certified to be fully compliant with the EN 834:2013 standard [6] and represents a contemporary type of dual-sensor HCA used in European multi-family building retrofits. While the specific make and model have been anonymized due to commercial non-disclosure restrictions, the device is a contemporary dual-sensor unit utilizing high-precision NTC thermistors. The physical parameters, mounting conditions, and continuous 164-day data log provide a complete empirical baseline for evaluating the algorithmic response of the tested EN 834-compliant device. Parallel to the HCA operation, precise daily monitoring of the actual thermodynamic parameters of the system was maintained. The radiator supply temperature (tV), radiator return temperature (tR), and room ambient air temperature (tL) were continuously recorded. Concurrently, the temperature of the HCA mounting point on the radiator (tH) was defined as the fundamental reference variable for the device’s internal allocation logic (Figure 1).
Figure 1.
Comprehensive empirical measurement framework: (a) top-down architectural schematic of the residential room illustrating the placement of the radiator beneath the window and the spatial distribution relative to internal air temperature monitoring (tL), and (b) detailed frontal view of the 12-section cast-iron radiator detailing the exact mounting coordinates of the anonymized EN 834-compliant HCA (6th section, at 2/3 of total height H) alongside the DS18B20 reference sensors tracking supply (tV), return (tR), and contact (tH) temperatures. All dimensions are given in centimetres.
To ensure full transparency of the experimental setup and explicitly distinguish between the verifiable reference instrumentation and the closed architecture of the evaluated heat cost allocator, a detailed hardware specification is presented in Table 1.
Table 1.
Metrological characteristics and limitations of the applied measurement instrumentation and the estimation device.
As demonstrated in the specification above, while the digital reference sensors allow for a rigorous determination of measurement uncertainty, the internal logic and transducer parameters of the HCA remain entirely undisclosed. This black-box character is an inherent limitation of studies based on commercial HCA devices; however, it also reflects the practical conditions under which such devices are used in real buildings.
The exact external dimensions of the HCA, the internal sensor location, and the proprietary transducer characteristics could not be disclosed or independently verified because the tested device was an anonymized commercial billing unit. However, the external mounting position was documented: the HCA was installed on the 6th section of the 12-section cast-iron radiator and at 2/3 of the radiator height, as shown in Figure 1.
The thermodynamic parameters (tV, tR, tL and tH) were continuously logged using DS18B20 digital temperature sensors. Raw data were acquired at a high-frequency sampling interval of 2 s to accurately capture rapid transient thermal states. For the longitudinal thermodynamic analysis, these high-resolution measurements were subsequently aggregated into 30-min average intervals. Data processing and calculations were performed using Microsoft Excel (Microsoft Corporation, Redmond, WA, USA).
2.3. Model-Based Heat-Emission Estimate
For comparative evaluation of the electronic allocation device, the daily radiator heat emission was estimated using an analytical heat-output model and is expressed in kilowatt-hours (kWh). Classic analytical models based on the thermal characteristics of the radiator were employed [28,29,30]. The daily model-based radiator heat-emission estimate was calculated by summing the heat-output estimates derived from 30-min mean temperatures over 48 consecutive intervals according to the following equation:
where:
- QPC—model-based daily radiator heat-emission estimate [kWh];
- Qn—nominal thermal power of the radiator for the standard parameters of 90/70/20 °C [kW];
- Δtn—reference temperature difference used for normalization, Δtn = 60 K;
- Δti—logarithmic mean temperature difference during the i-th calculation interval [K], calculated according to the following formula:
- tV—radiator supply temperature [°C];
- tR—radiator return temperature [°C];
- tL—room ambient air temperature [°C];
- n—radiator characteristic exponent, adopted as n = 1.33 [-];
- Δτ—calculation time interval, Δτ = 0.5 h;
- i—index of the calculation interval, i = 1,…48.
It is crucial to emphasize that the parameter QPC represents a model-based analytical estimate of radiator heat emission based on a macroscopic thermodynamic model, rather than a direct independent volumetric measurement. To ensure full reproducibility, the nominal thermal power (Qn) of the 12-section cast-iron radiator for standard 90/70/20 °C parameters was established as 1.523 kW, derived from standard characteristic curves in accordance with EN 442-2 [30]. The theoretical base calculations (Qcalc) utilized the standard unscaled evaluation factor K = 1.0 to assess the raw continuous integration algorithm shape.
The radiator characteristic exponent was set to n = 1.33, a value within the typical range used in radiator heat-output modelling. A sensitivity analysis was conducted for this exponent. Varying n within the range of 1.30 to 1.35 changed the estimated total seasonal heat emission by approximately −3.7% to +5.8% relative to the baseline value (n = 1.33). However, the reported sensitivity analysis showed no change in the number of zero-registration days and no material changes in the Spearman rank correlation coefficients. These results suggest that the main observed patterns are relatively insensitive to the assumed radiator exponent within the investigated range.
To evaluate the heat transfer dynamics, the Logarithmic Mean Temperature Difference (LMTD) was applied. Unlike the simple arithmetic mean, LMTD provides a mathematically robust representation of heat exchange during transient, low-load states, particularly when the return temperature (tR) asymptotically approaches the room ambient temperature (tL). The primary limitation of this analytical model is the assumption of uniform heat distribution across all radiator sections, which may introduce minor deviations during very rapid start-up phases; nevertheless, it remains a practical non-invasive method for continuous in-situ monitoring.
The daily model-based radiator heat-emission estimates QPC were correlated with the dimensionless units generated during the same period by the electronic heat cost allocator’s algorithm, defined as the registered allocation unit QUR.
It is crucial to emphasize that the daily QPC parameter was integrated over 48 consecutive half-hour intervals Δτ = 0.5 h rather than calculated directly from daily average temperatures. The necessity for this high-resolution integration approach becomes evident when evaluating intermittent heating regimes. Because the heat-emission equation relies on the Logarithmic Mean Temperature Difference (LMTD) raised to a non-linear radiator exponent (n = 1.33), applying daily averaged temperatures instead of 30-min measurements may introduce aggregation-related bias into the model-based heat-emission estimates, particularly under intermittent operating conditions.
To empirically validate this methodological requirement, a comparative evaluation was performed contrasting the 30-min high-resolution integration against a low-resolution approach (calculating QPC directly from 24-h average values). To isolate genuine thermodynamic distortion from low-signal measurement noise, the comparison aggregated all days with an active heat load (QPC > 0.5 kWh) across the studied months.
Table 2 demonstrates that while the low-resolution approach yielded negligible errors during steady continuous heating periods (e.g., the prolonged periods of slowly varying temperatures in November), it introduced massive and systemic overestimations during dynamic, impulsive operation states prevalent in mid-winter.
Table 2.
Aggregate comparison of model-based heat-emission estimation using high-resolution integration versus low-resolution daily averages (for days with QPC > 0.5 kWh).
Calculating heat emissions using low-resolution sampling essentially “flattens” the thermal peaks and creates artificial mathematical heat flows during periods when the radiator valve was closed but the unit remained residually warm. Consequently, high-resolution sampling ensures that acute thermal peaks and absolute zero-flow periods are mathematically isolated, providing critical empirical justification for its application in evaluating transient HCA performance.
2.4. Uncertainty Analysis
To quantify the uncertainty of the model-based heat-emission estimate QPC, the law of propagation of uncertainty was applied in accordance with the Guide to the Expression of Uncertainty in Measurement (GUM) [31]. Based on the manufacturer’s technical specifications for the DS18B20 sensors, a maximum instrumental error of ±0.5 K was adopted, accounting for both static inaccuracy and long-term thermal drift over the half-year monitoring period. Assuming a rectangular probability distribution, the standard measurement uncertainty for each temperature variable was determined as u(t) = 0.5/√3 K.
Monte Carlo simulation was not used in this study; the uncertainty analysis was based on analytical propagation of uncertainty according to the GUM framework. This approach was adopted to quantify the sensitivity of the model-based QPC estimate to the measured input variables and to characterize low-load states, rather than to perform a stochastic simulation of the entire heat-output model.
Since the nominal radiator power Qn was derived from standard characteristic curves and no individual test certificate was available for the specific radiator, a conservative type-B rectangular uncertainty with a half-width of ±4% was adopted, corresponding to a relative standard uncertainty of 2.31%.
The combined standard uncertainty, uc(QPC), was calculated using the following uncertainty propagation formula:
where:
- uc(QPC)—combined standard uncertainty of the daily model-based heat-emission estimate [kWh];
- u(Qn)—standard uncertainty of the nominal power estimation [kW];
- u(tV)—standard uncertainty of the radiator supply temperature measurement [K];
- u(tR)—standard uncertainty of the radiator return temperature measurement [K];
- u(tL)—standard uncertainty of the room ambient air temperature measurement [K].
The partial derivatives characterizing the sensitivity coefficients were determined analytically based on the heat exchange relations established in Equations (1) and (2); the full mathematical derivation is provided in Appendix B.
To quantify the relative expanded uncertainty associated with the model-based heat-emission estimate, a coverage factor of k=2 was adopted, corresponding to an approximate coverage probability of 95%:
where:
- Urel—relative expanded uncertainty [%];
- k—coverage factor, adopted as k = 2 for a 95% confidence level [-];
- uc(QPC)—combined standard uncertainty of the daily model-based radiator heat-emission estimate [kWh];
- QPC—daily model-based radiator heat-emission estimate [kWh].
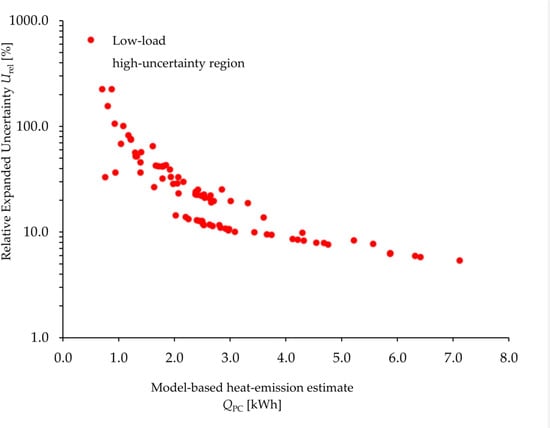
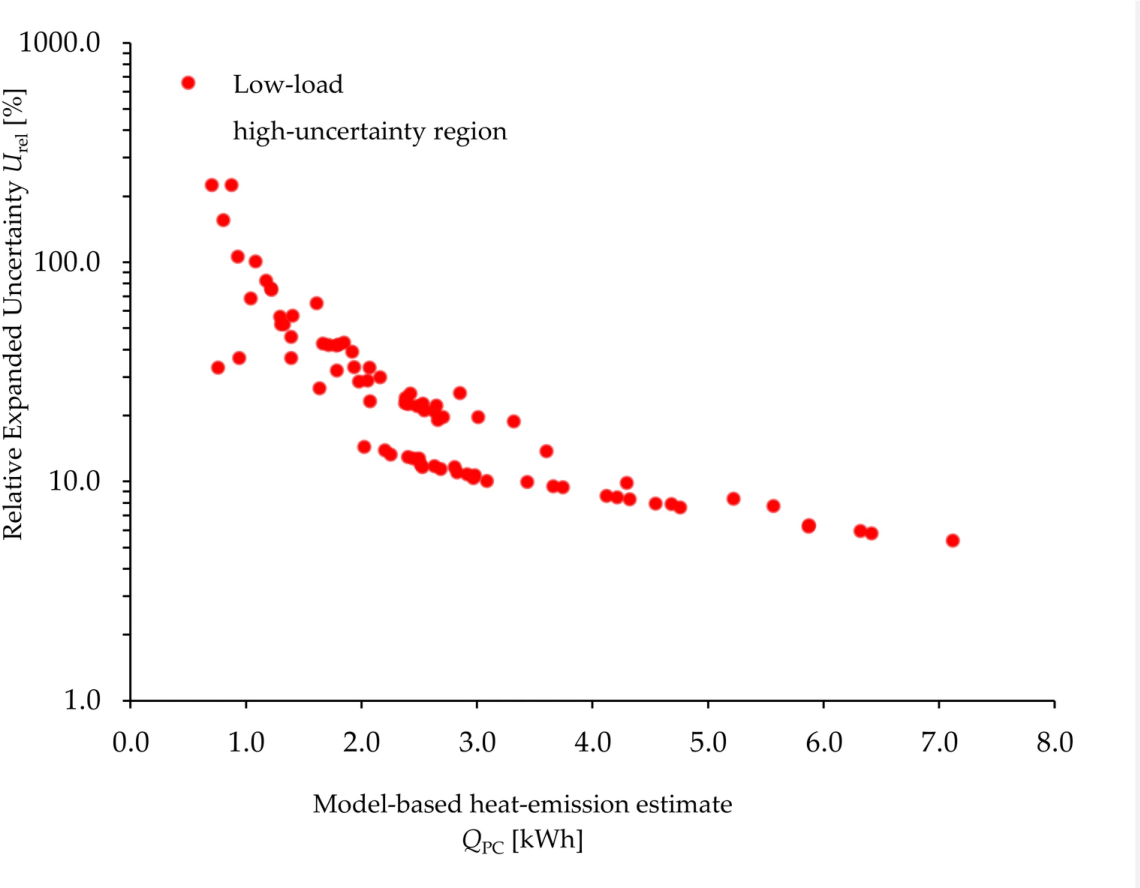
The application of this parameter revealed a clear metrological bifurcation. During stable winter conditions (QPC > 4 kWh), the relative expanded uncertainty Urel stabilized at an average of 7.5%. However, during transient states where tR approaches tL, the non-linear sensitivity coefficients in the logarithmic temperature difference cause an exponential increase in uncertainty, generating significant relative errors in low-load regimes. This rapid increase indicates that standard steady-state analytical models become less reliable under dynamic low-load conditions. This supports the interpretation that the observed discrepancies cannot be attributed solely to temperature-sensor uncertainty (Figure 2).
Figure 2.
The relative expanded uncertainty of the analytical heat emission calculation as a function of the model-based heat load. The logarithmic vertical scale illustrates the exponential uncertainty increase during low-load, transient states (QPC ≤ 4 kWh).
While days with trace heat emissions (e.g., QPC < 0.20 kWh) exhibit relative expanded uncertainties (Urel) exceeding 100% and cannot be conclusively differentiated from measurement noise, several mid-load zero-registration events significantly exceeded the uncertainty threshold. For instance, on 16 January and 18 January 2023, the model-based estimates calculated from the analytical GUM propagation framework (Appendix B) were QPC = 1.34 ± 0.65 kWh and 1.31 ± 0.71 kWh, respectively. In both instances, the absolute lower bound of the 95% confidence interval remained positive (≥0.60 kWh), and the radiator surface temperature at the allocator mounting point exceeded the ambient room temperature by an average of 6.2 K and 6.1 K, respectively (tH − tL > +6.0 K). Despite this positive thermal gradient, the HCA registered 0 allocation units on both days, indicating that such mid-load zero-registration events cannot be explained solely by reference temperature-sensor uncertainty.
The estimated instrumental uncertainty of the reference temperature measurements was substantially lower than the discrepancies observed between the model-based heat-emission estimates and the HCA output. Therefore, the uncertainty analysis supports the interpretation that the observed zero-registration events cannot be explained solely by reference sensor errors.
The reported expanded uncertainties quantify the propagation of the specified input measurement uncertainties within the adopted analytical model. They do not fully account for structural model inadequacy, spatially non-uniform radiator temperatures, or uncertainties associated with temporal aggregation.
2.5. Statistical Analysis and Performance Indicators
To analytically evaluate the severity of the allocator-response variability, the Energy-to-Allocation-Unit Ratio (EAUR) was defined:
where:
- EAUR—Energy-to-Allocation-Unit Ratio [kWh/registered unit];
- ∑QPC—sum of model-based radiator heat-emission estimates over the analyzed period [kWh];
- ∑QUR—sum of registered allocation units over the analyzed period [-].
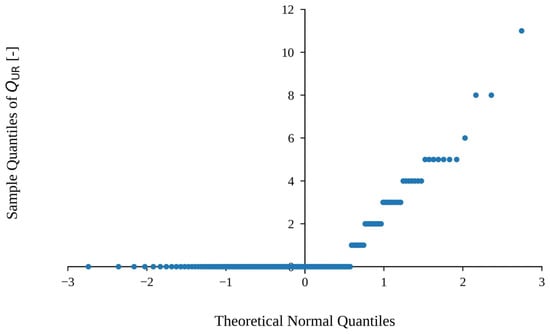
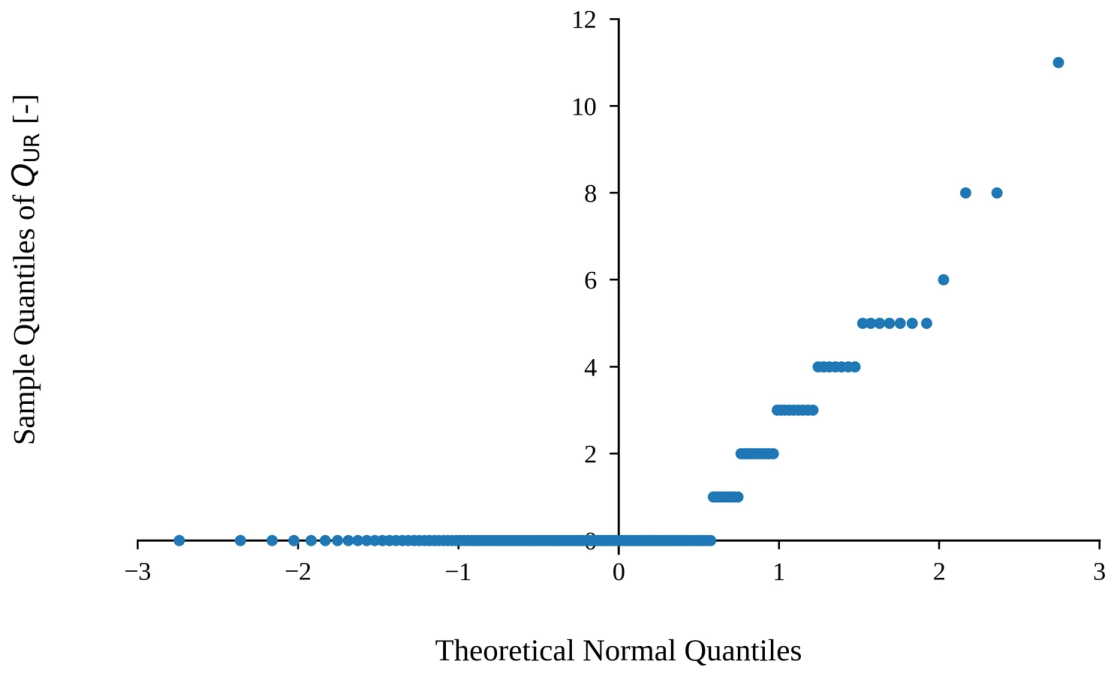
The normality of the recorded allocation units (QUR) was assessed. The variable exhibited strong right-sided asymmetry (skewness = 2.46) and high leptokurtosis (kurtosis = 7.03), resulting mainly from the high frequency of zero-value registrations. This deviation from the normality assumption was further supported by visual assessment of a quantile–quantile (Q-Q) plot (Figure 3).
Figure 3.
Quantile–quantile (Q-Q) plot for the empirical distribution of registered allocation units (QUR), illustrating a marked deviation from the theoretical normal distribution.
Given the discrete, zero-inflated distribution of the registered allocation units and the potentially non-linear relationship with model-based heat emission, Spearman’s rank correlation was selected to characterize monotonic associations without imposing a linear relationship. The coefficient was calculated for daily pairs of model-based heat-emission estimates (QPC) and registered allocation units (QUR) to assess variations in their monotonic relationship across the measurement period.
It must be noted that during transition periods characterized by substantial zero-inflation, the rank correlation inherently destabilizes, reflecting a discrete threshold-based allocator response rather than a continuous statistical trend.
The ranking process was performed using the average rank method for tied values. The resulting rank sets were then analyzed to quantify the monotonic correlation, mathematically corresponding to the Spearman coefficient. This approach provides a robust quantification of changes in the monotonic relationship while reducing the influence of non-linear outliers. The coefficient is calculated according to the following formula:
where:
- ρ—Spearman’s rank correlation coefficient [-];
- Ri, Si—ranks assigned to the i-th observation for the first and second variables, respectively [-];
- , —arithmetic means of the ranks for both variables [-];
- n—sample size [-].
For March, the Spearman coefficient calculated from unrounded daily data was 0.390, whereas the values rounded to two decimal places in Table A1 yield 0.400 due to differences in tied ranks. This coefficient was calculated for each full month to assess the metrological stability of the estimator response across varying thermal operating conditions. The detailed, daily empirical data collected throughout the 164-day study period, including the daily model-based radiator heat emission estimate (QPC) and the corresponding allocator units (QUR), are provided in Appendix A.
2.6. Theoretical Allocation Units and Classification Matrix
To evaluate differences between theoretical and registered allocation patterns, an additional parameter, Qcalc, was introduced. Qcalc represents the theoretical, dimensionless allocation units calculated using the mathematical formulation presented in [8]:
where:
- K—the evaluation factor defined in EN 834 [6], characteristic for the specific radiator and HCA coupling [-];
- tH—temperature of the HCA mounting point on the radiator [°C];
- tL—room ambient air temperature [°C];
- dτ—integration time step [h].
This provides a theoretical mathematical baseline, enabling a comparison between the theoretical calculation term and the registered output of the commercial device.
Finally, daily observations were classified using a binary registration matrix based on the status of the model-based heat-emission estimate and the HCA registration. Consistent with the two-decimal reporting resolution in Appendix A (where positive daily emissions are defined as QPC ≥ 0.01 kWh), days with QPC ≥ 0.01 kWh and QUR > 0 were classified as registered active-heating days, days with QPC ≥ 0.01 kWh and QUR = 0 as zero-registration events during model-based heat emission, days with QPC = 0.00 kWh and QUR > 0 as isolated registrations outside model-based radiator operation, and days with QPC = 0.00 kWh and QUR = 0 as no-emission/no-registration days. This classification was used to quantify the frequency of zero-registration events and isolated registrations under low-load conditions.
3. Results
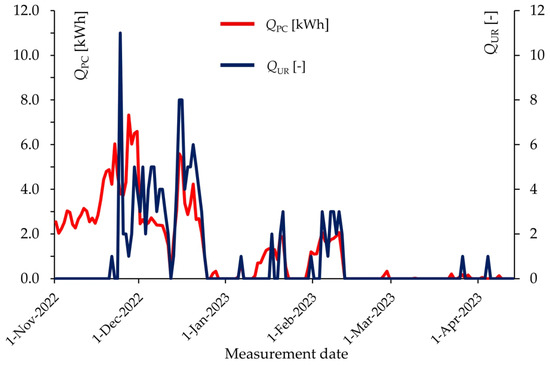
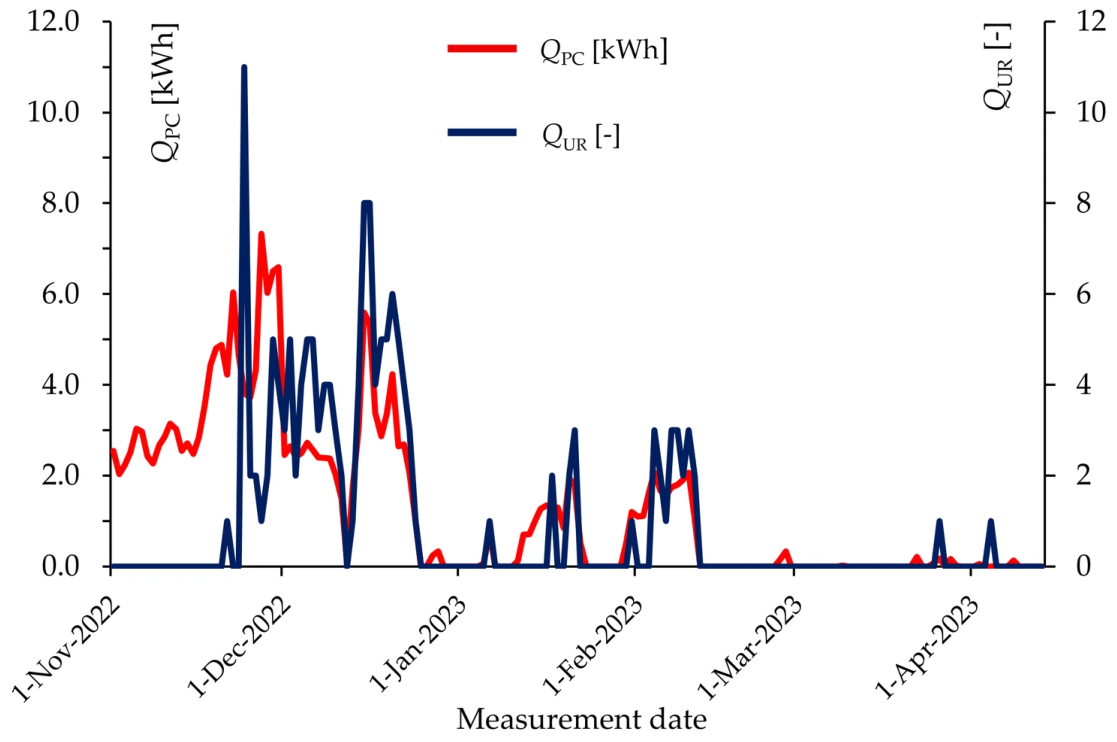
The analysis of continuous measurement data over the 164-day period indicates a marked discrepancy between the model-based heat-emission estimate and the registered allocation units in the tested configuration (Figure 4).
Figure 4.
Daily profile of the model-based radiator heat-emission estimate (QPC) compared with the registered allocation units (QUR) over the 164-day study period.
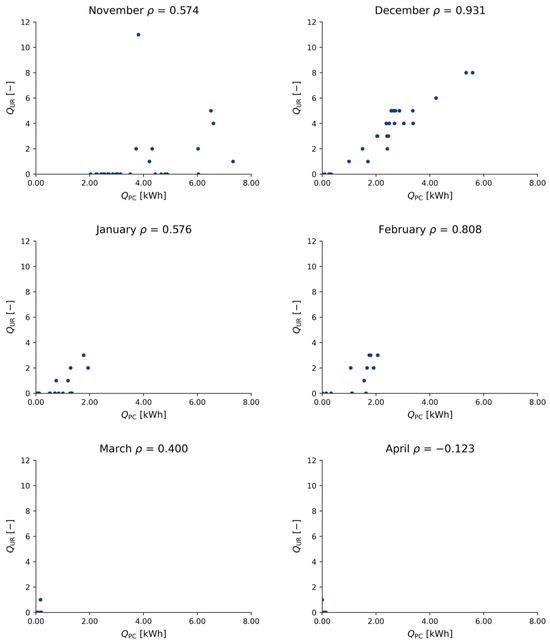
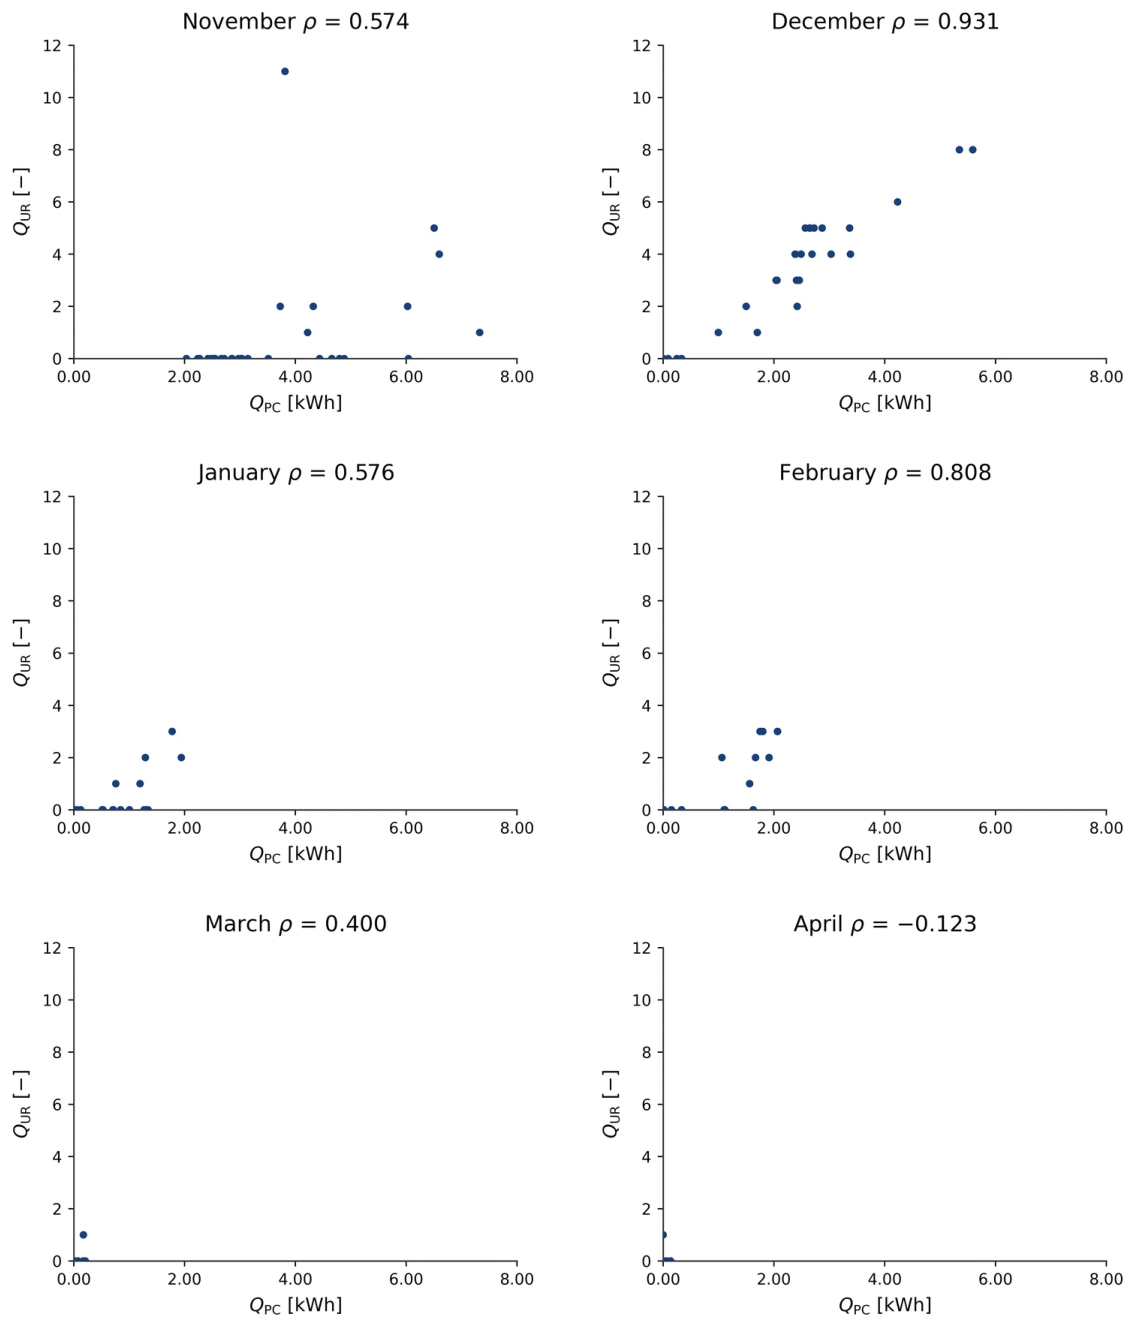
For an allocation system to support proportional cost distribution, the device readings should maintain a reasonably stable relationship with the estimated heat-emission quantity. The empirical findings presented in Figure 5 indicate reduced metrological stability in this regard. The Spearman’s rank correlation coefficient (ρ), calculated for individual months, exhibited substantial variability from a metrological perspective. In December, characterized by low outdoor temperatures and stable, continuous radiator operation at low supply parameters, the system achieved a high correlation (ρ = 0.931). However, as the installation’s operational dynamics shifted to intermittent (impulsive) patterns in November, the correlation decreased markedly (ρ = 0.574). The most significant anomaly was recorded towards the end of the heating season (April). Despite a negligible monthly model-based heat-emission estimate of only 0.20 kWh, the allocator generated one allocation unit. In this regime of substantial zero-inflation, the statistical relationship became weak and unstable; rather than indicating a meaningful inverse relationship, this anomaly is consistent with a possible isolated low-load registration event outside normal radiator operation.
Figure 5.
Spearman correlation scatter plots illustrating the relationship between the model-based radiator heat-emission estimate QPC and registered allocation units QUR.
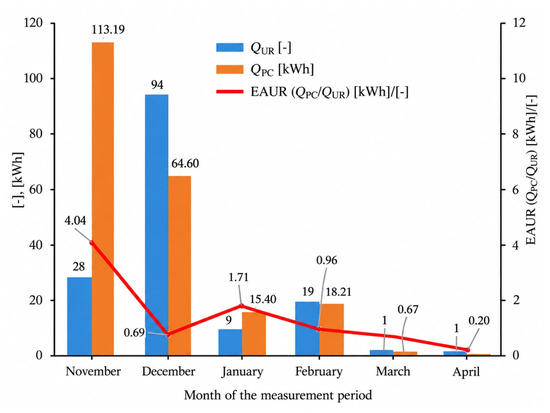
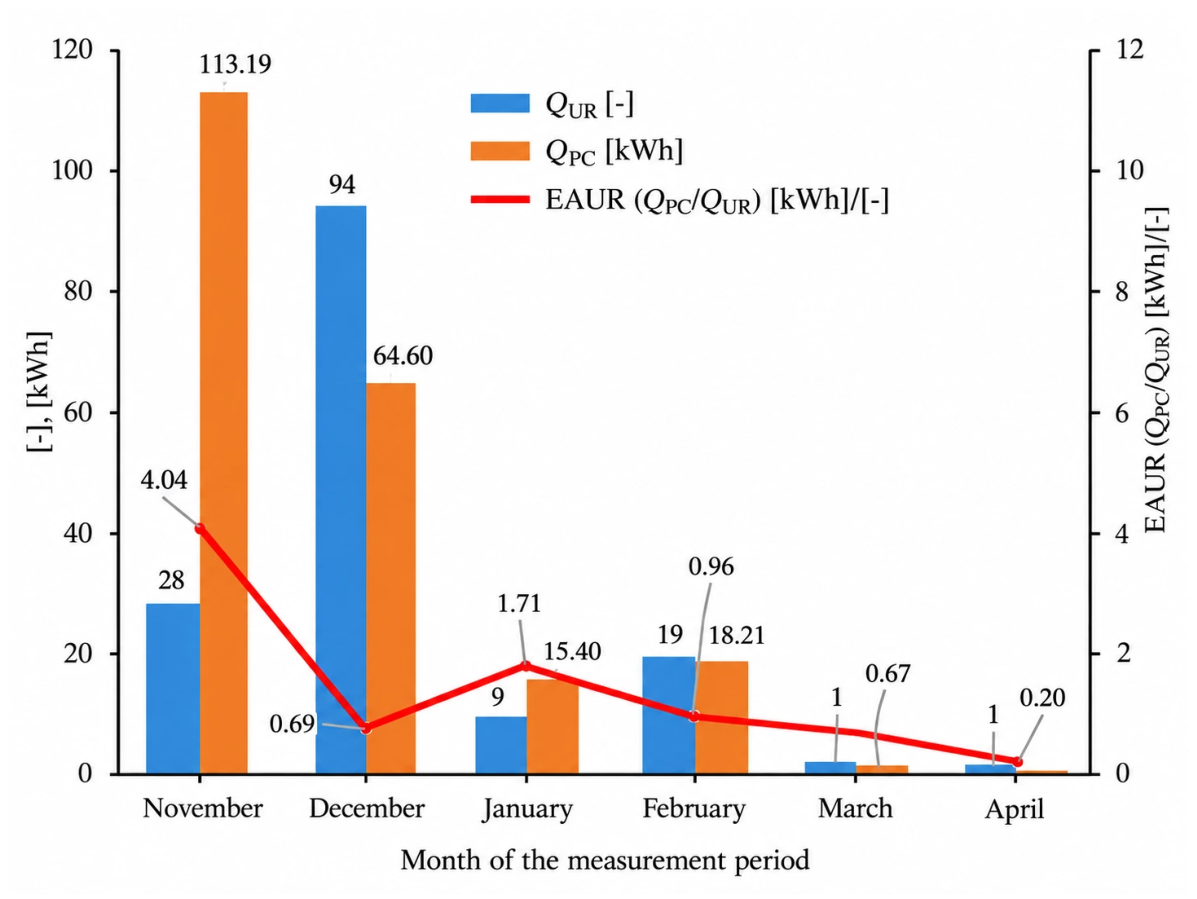
The observed allocator response was associated with substantial variation in the model-based energy equivalent of one registered allocation unit. To quantify this variation, the Energy-to-Allocation-Unit Ratio (EAUR) was tracked throughout the heating season. Empirical calculations indicate substantial variation in the model-based energy equivalent of one registered allocation unit, as detailed in Table 3 and illustrated in Figure 6. During November, characterized by high dynamics and impulsive heat demand, one registered allocation unit corresponded to 4.042 kWh of model-based radiator heat emission. Conversely, a shift to a continuous, lower-temperature load during the peak winter month (December) caused the EAUR to drop nearly sixfold, to 0.687 kWh.
Table 3.
Monthly aggregation of registered allocation units QUR, the model-based radiator heat-emission estimate QPC, and the intra-monthly Spearman’s rank correlation coefficient (ρ).
Figure 6.
Fluctuations of the allocation ratio EAUR (QPC/QUR) across the measurement period, illustrating variability under changing thermal-load conditions. Gray lines connect data labels to their corresponding values.
The analysis of subsequent months reveals further variability in the allocator response. In January, with the increasing influence of external solar heat gains, the index reached 1.711 kWh, only to decrease in February—following a drop in temperatures and a return to more stable heating—to 0.958 kWh per registered allocation unit. However, a marked change in the allocator response was observed during the spring transition months. In March, when the monthly model-based heat-emission estimate was only 0.67 kWh and one allocation unit was registered, EAUR reached 0.670 kWh/unit. During the spring transition period (March–April), the statistical proportionality became weak and unstable. The occurrence of isolated allocation units (QUR = 1) corresponding to negligible model-based heat-emission estimates (0.67 kWh and 0.20 kWh, respectively) may indicate isolated low-load registration events under spring transition conditions. Without sustained supply temperatures, this behavior suggests a reduced ability of the allocator response to distinguish radiator-related heat emission from possible unmeasured external thermal influences, such as ambient temperature fluctuations or solar heat gains.
This discrepancy in the model-based energy valuation—from 4.042 kWh in autumn to 0.20 kWh in spring—suggests that, in the tested configuration, the registered allocation units were not consistently proportional to the thermodynamic state estimated for the radiator. Such behavior may affect the perceived cost proportionality between continuous low-temperature operation and short high-temperature heating episodes. Furthermore, during periods of elevated ambient temperature and low radiator output, the allocator response may be susceptible to environmental heat gains rather than radiator-related heat emission. This may have practical implications for the interpretation of allocation units in buildings operated with continuous low-temperature heating strategies.
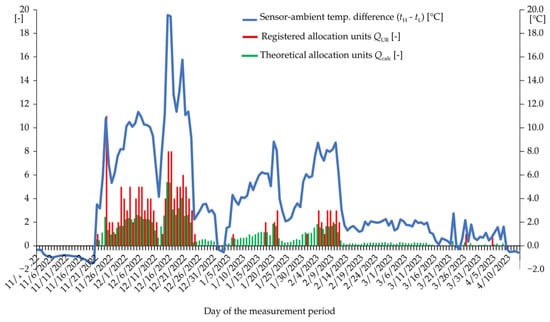
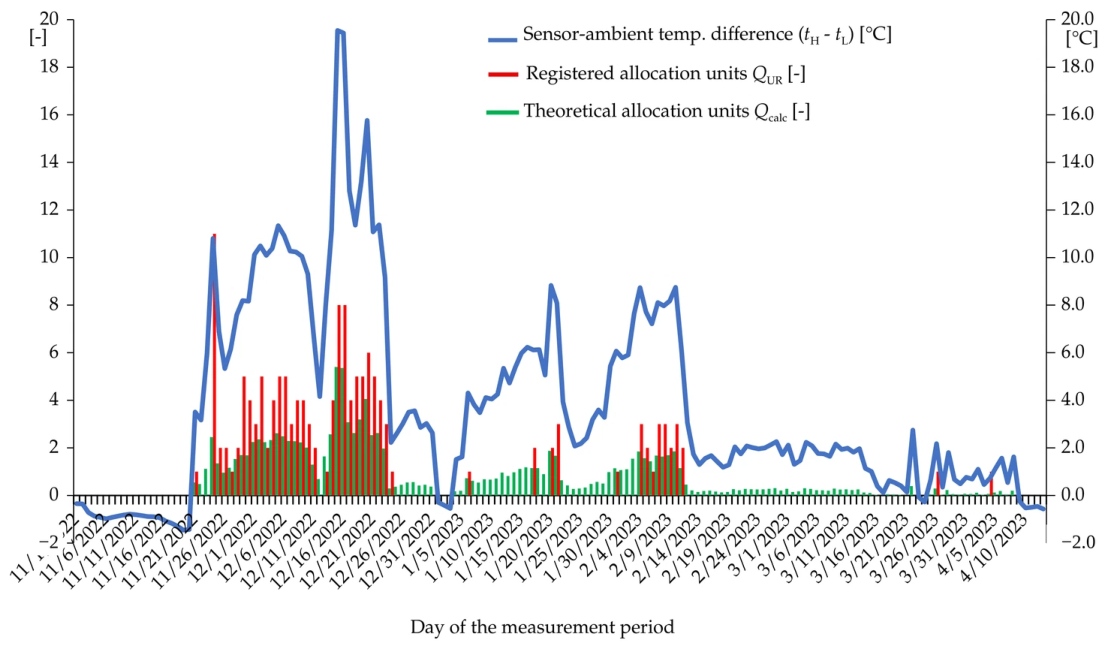
The observed fluctuations in both the Spearman correlation and the EAUR may be partly associated with the proprietary firmware logic. Figure 7 contrasts the registered allocation units QUR with the theoretical units Qcalc calculated using the analytical formulation presented in [8], plotted alongside the sensor–ambient temperature difference.
Figure 7.
Comparison of theoretical allocation units (Qcalc) with registered allocation units (QUR), plotted together with the sensor–ambient temperature difference (tH − tL).
The visual analysis indicates differences between the theoretical mathematical baseline (Qcalc) and the empirical output of the device (QUR). While the theoretical model continuously integrates fractional units proportional to the temperature gradient, the tested device recorded discrete allocation units at irregular intervals. The abrupt registration of 11 units assigned to November 24, compared with the theoretical pattern, may be associated with internal start-up thresholds, delayed integration, or buffering mechanisms, as well as the temporal assignment of discrete visual readings under transient operating conditions.
To directly quantify the operational performance of the HCA algorithm, a daily registration classification matrix (confusion matrix) was generated for the entire 164-day period. The days were categorized based on the binary status of the model-based daily radiator heat-emission estimate (QPC > 0 vs. QPC = 0) and the corresponding HCA registration (QUR > 0 vs. QUR = 0).
As Table 4 shows, out of 95 days with a positive model-based heat-emission estimate, the device recorded zero units in 50 days. This corresponds to a 52.6% zero-registration rate during active heating phases in the tested configuration and was associated with an unrecorded model-based energy estimate of 39.9% (84.77 kWh out of 212.27 kWh). Furthermore, the isolation of one registration day when the model-based heat-emission estimate was zero suggests a possible sensitivity of the allocator response to unmeasured environmental heat gains.
Table 4.
Classification matrix of HCA daily registration performance.
The pronounced lack of registration observed between 1 November and 20 November is a direct thermodynamic consequence of the radiator’s specific low-flow state. During this initial 20-day period, the vertical supply and return pipes were continuously warm (tV = 30.9–41.1 °C, tR = 25.0–27.3 °C), generating a positive model-based QPC calculation (totaling 59.94 kWh). However, because the thermostatic valve remained heavily throttled, the pipe temperatures did not represent the temperature of the entire radiator surface, reflecting an inherent limitation of the macroscopic QPC model under minimal-flow conditions. Consequently, across all 960 half-hour intervals, the temperature measured at the HCA mounting point (tH) remained lower than the ambient room air temperature due to local cooling near the window (tH = 18.06–20.50 °C vs. tL = 19.50–21.17 °C). During the initial 20-day period, the negative measured temperature gradient (tH < tL) was consistent with zero registration by both the theoretical baseline (Qcalc) and the commercial HCA. Consequently, the positive model-based heat-emission estimates during these days should not be interpreted as evidence of HCA registration errors. Two additional zero-registration days occurred on November 22 and 23, following the first positive registration on November 21. Full active cross-radiator flow commenced on November 21, followed by an abrupt increase of 11 units on November 24 (cumulative reading rising from 38 to 49). This abrupt increase may be associated with the device’s internal start-up thresholds, delayed integration, or buffering mechanisms. However, since the manufacturer’s proprietary algorithm was not available for examination, the specific mechanism responsible for this behavior could not be identified.
To assess the influence of the prolonged system start-up phase on the results, the classification matrix was recalculated after excluding the first 24 days, as summarized in Table 5.
Table 5.
Comparative classification of zero-registration days with and without the initial system start-up period.
Even after removing this entire initialization period, the zero-registration regime persisted across 28 active heating days (39.4% of the remaining 71 active days). However, a threshold distribution analysis of these 28 post-initialization days reveals that the omissions were strictly concentrated within low-to-moderate thermal load regimes: 16 days exceeded QPC > 0.20 kWh, 12 days exceeded QPC > 0.50 kWh, and 7 days exceeded QPC > 1.00 kWh, whereas no zero-registration events (0 days) occurred on days when daily heat emission exceeded QPC > 2.00 kWh. Furthermore, excluding the first 24 days substantially improved the overall monotonic rank-order relationship: the multi-month daily Spearman correlation increased from ρ = 0.597 (full 164-day dataset) to ρ = 0.828 for the remaining 140 days (ρ = 0.873 during the core winter period of November 25 to February 28), and reached ρ = 0.859 when aggregated into 21 calendar weeks. This confirms that during sustained winter operation (QPC > 2.00 kWh) and over weekly aggregation intervals, the allocator maintained a strong monotonic rank correlation, whereas proportionality breakdowns and zero-registration events were confined to low-load and intermittent operating states (≤2.00 kWh).
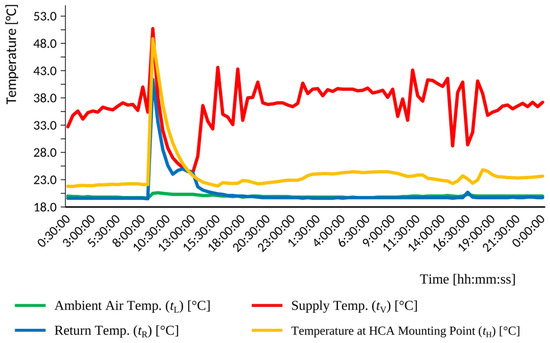
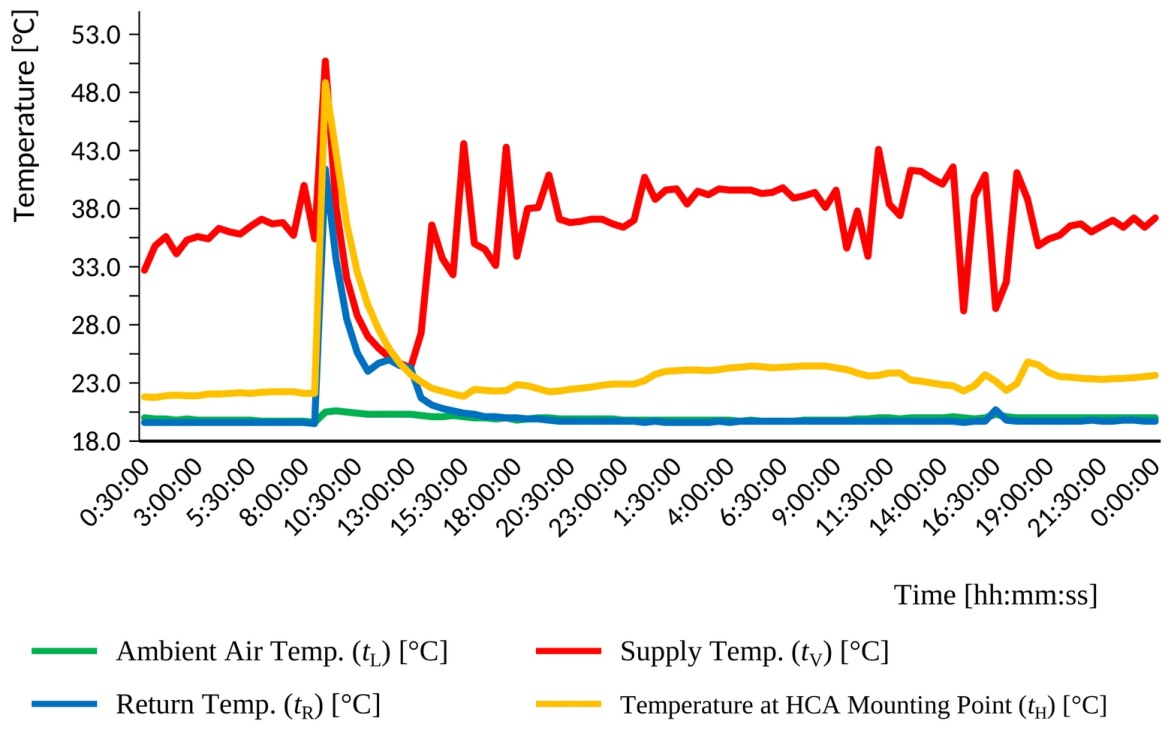
To visually contextualize these findings, Figure 8 presents a representative high-resolution (30-min) thermodynamic profile of the radiator during typical intermittent operation (recorded on 6–7 January 2023), demonstrating the thermal inertia delay between the supply temperature impulses and the sensor at the HCA mounting point response.
Figure 8.
Representative high-resolution (30-min) thermodynamic profile of the radiator during intermittent operation (6–7 January 2023). The plot illustrates the thermal inertia delay between supply temperature (tV) and the mid-panel temperature at the HCA mounting point (tH) during rapid heating impulses and subsequent cooldown phases.
As explicitly illustrated in Figure 8, the transient operation of the high-inertia cast-iron radiator creates a pronounced phase shift between the thermodynamic state of the heating medium and the temperature at the HCA mounting point. During a rapid heating impulse, the supply temperature (tV) rises sharply, yet the sensor at the HCA mounting point (tH) exhibits a significantly delayed and dampened response due to the high thermal mass of the radiator. More importantly, during the subsequent cooldown phase—when the thermostatic valve closes and tV drops precipitously—the stored thermal energy in the cast iron keeps the HCA mounting point (tH) elevated for several hours. This asymmetric heat dissipation, including phenomena such as internal thermal equalization where return temperature temporarily rises despite a drop in supply, fundamentally distorts the continuous temperature gradients assumed in steady-state theoretical models. These transient thermal effects may contribute to the observed discrepancies between model-based heat-emission estimates and registered allocation units. However, their individual contributions cannot be isolated without access to the proprietary HCA algorithm.
4. Discussion
The 164-day continuous, high-resolution case study provides empirical observations of differences between the registered allocation units and the model-based heat-emission estimate for the tested electronic heat cost allocator installed on a high-inertia cast-iron radiator. The response of this device, operating within the framework of the EN 834 standard, showed substantial variability under transient thermal dynamics typical of legacy heating installations in partially retrofitted buildings, which may affect cost proportionality within the observed node.
While previous literature has signaled the lack of metrological consistency in HCAs [9,10,11] and their non-linear response and susceptibility to external heat sources [12,13], these studies have predominantly relied on laboratory analyses or averaged annual data. Our continuous field monitoring contextualizes these theoretical vulnerabilities, showing how such effects may appear under daily operational conditions.
A primary observation is the existence of a marked zero-registration regime within the tested allocator response. On 50 days, corresponding to 30.5% of the entire 164-day study period and 52.6% of the 95 days with positive model-based heat-emission estimates, the device recorded zero units. This observation suggests that, in the tested configuration, the allocator response was less sensitive to low-temperature and transient heat-emission states than to higher-temperature operating periods. As a result, the proportionality between the model-based heat-emission estimate and the registered allocation units was not stable throughout the heating season. The weakening of the monotonic relationship during transition periods, quantified by the rank-order analysis, is consistent with previously reported concerns regarding HCA non-linearity and zero-inflation [13,14]. Under highly dynamic intermittent operation, the registered allocation units did not scale consistently with the model-based heat-emission estimate, which suggests that start-up thresholds and the dynamic temperature gradient between the sensor and the ambient environment may have influenced the observed allocator response.
This loss of proportionality was reflected by the high variability of the Energy-to-Allocation-Unit Ratio (EAUR). The high variation from 4.042 kWh to 0.20 kWh per unit suggests that, in the tested configuration, the same allocation unit may correspond to substantially different model-based heat-emission estimates depending on the operating period. This may affect the interpretation of allocation units in systems operated under stable low-temperature heating strategies.
The introduction of the theoretical allocation units (Qcalc) revealed a marked discrepancy within the studied timeframe. As shown in Figure 7, the deviation of QUR from the theoretical Qcalc pattern observed in late November indicates notable differences between continuous theoretical integration and the empirical output of the device. These discrepancies may be associated with proprietary algorithmic features, including start-up thresholds, signal filtering, or delayed integration. However, alternative explanations related to the limitations of the theoretical model and temporal aggregation of HCA readings cannot be excluded.
Finally, the spring readings suggest that the allocator response under low-load transition conditions requires cautious interpretation. Specifically, on 4 April, a cumulative increment of one unit (QUR = 1, from 188 to 189) was recorded during the morning inspection while the daily model-based heat-emission estimate was 0.00 kWh. Since a trace model-based heat emission occurred earlier on April 2nd (0.06 kWh, total monthly emission 0.20 kWh), the resulting monthly EAUR value should be interpreted with caution. While this isolated unit registration may have been triggered by unmeasured environmental thermal influences—such as ambient temperature fluctuations or local solar heat gains—elevating the sensor temperature above its threshold while the radiator valve was closed, delayed unit accrual from the preceding trace heating episode between discrete reading checkpoints cannot be ruled out.
These observations suggest that, in the tested configuration, the allocator response may have been affected by start-up thresholds, thermal inertia, and low-load environmental conditions. Therefore, the results indicate a need for further multi-device and multi-building studies to assess whether similar effects occur more broadly in EN 834-compliant heat cost allocation systems.
Limitations of the study: The findings presented in this research are limited to the specific single-node, in-situ configuration evaluated. The identified metrological discrepancies—including the observed zero-registration events and the large intra-seasonal variation in EAUR—were observed exclusively on a single, anonymized EN 834-compliant HCA coupled with a high-inertia cast-iron radiator within one specific installation setup. Consequently, these results cannot be automatically extrapolated to modern low-inertia radiators (e.g., steel panel radiators), whose thermal performance under forced convection and low heat carrier temperatures differs significantly [32,33], or to HCA devices from other manufacturers, which may employ entirely different proprietary start-up thresholds and integration logic. While this controlled single-node setup enabled detailed observation of algorithmic behavior under dynamic operation, broader multi-node studies across diverse building typologies are necessary to determine whether similar discrepancies occur on a macroscopic scale. The study did not include a full multivariable weather-normalized model of building heat demand; such modelling should be addressed in future multi-node and multi-building studies.
5. Conclusions
Based on the high-resolution, 164-day single-node case study, the following key conclusions are drawn strictly regarding the specifically evaluated configuration of an EN 834-compliant HCA coupled with a high-inertia radiator. It must be emphasized that the QPC values discussed herein represent mathematical, model-based estimates derived from thermodynamic parameters, rather than direct volumetric measurements:
- Zero-registration regime: Within the monitored setup, the allocator recorded zero units on 50 days, corresponding to 52.6% of the 95 days with positive model-based heat-emission estimates. These zero-registration days were associated with 39.9% of the total model-based seasonal heat-emission estimate for the observed node. After excluding the initial 24-day period, this proportion decreased to 10.6%, while the daily Spearman rank correlation increased from 0.597 to 0.828. This highlights the substantial influence of the initial low-flow period on the full-season results and supports a more cautious interpretation of the observed zero-registration events. This behavior suggests that thermal inertia and algorithmic start-up thresholds may have influenced the allocator response in the tested configuration.
- Variation in the Model–Allocator Relationship: The proportionality between the model-based heat-emission estimate and the registered allocation units weakened under dynamic loads. The monotonic relationship became less stable during transition periods, suggesting that the allocator response may have been affected by unmeasured environmental thermal influences and near-zero model-based heat-emission states.
- Intra-Seasonal Variation inEAUR: The application of the Energy-to-Allocation-Unit Ratio (EAUR) revealed large local variation in the model-based energy equivalent of a single registered allocation unit, ranging from 0.20 kWh to 4.042 kWh. This suggests that continuous low-temperature heating operation and short high-temperature heating episodes may not be represented with stable proportionality in this specific setup.
- Differences Between Theoretical and Registered Allocation Patterns: A visual comparison between the theoretical allocation units (Qcalc) and the registered units (QUR) revealed differences between the theoretical calculation framework and the observed device output. The available experimental data do not permit identification of the specific internal mechanisms responsible for the observed behavior. Consequently, these findings should not be interpreted as direct evidence of errors in the manufacturer’s firmware.
- Implications for Further Metrological and Regulatory Assessment: The results suggest that EN 834-compliant indirect allocation procedures may require further assessment under variable thermodynamic conditions and in high-inertia radiator systems characteristic of partially retrofitted buildings. Future metrological and regulatory work could benefit from considering dynamic thermal effects, radiator inertia, and sensitivity to environmental heat gains when evaluating allocator performance. However, further multi-device and multi-building studies are needed before general conclusions can be drawn.
Author Contributions
Conceptualization, L.B. and M.A.; methodology, L.B. and M.A.; software, L.B.; validation, L.B. and M.A.; formal analysis, L.B. and M.A.; investigation, L.B.; resources, L.B. and M.A.; data curation, L.B.; writing—original draft preparation, L.B.; writing—review and editing, L.B. and M.A.; visualization, L.B. and M.A.; supervision, M.A. All authors have read and agreed to the published version of the manuscript.
Funding
The authors gratefully acknowledge financial support for this work from the Ministry of Science and Higher Education of Poland under Bialystok University of Technology grant No. WZ/WB-IIŚ/2/2025.
Data Availability Statement
The daily aggregated dataset supporting the reported results is provided within this article in Appendix A, Table A1, including model-based heat-emission estimates and allocator readings.
Acknowledgments
During the preparation of this manuscript, the authors used Gemini (Large Language Model) for the purposes of language translation, structural editing, and ensuring consistency in scientific tone. The authors have reviewed and edited the output and take full responsibility for the content of this publication.
Conflicts of Interest
The authors declare no conflicts of interest. The funders had no role in the design of the study; in the collection, analyses, or interpretation of data; in the writing of the manuscript; or in the decision to publish the results.
Abbreviations
The following abbreviations are used in this manuscript:
| HCA | Heat Cost Allocator |
| EAUR | Energy-to-Allocation-Unit Ratio |
| GUM | Guide to the Expression of Uncertainty in Measurement |
| EU | European Union |
| LMTD | Logarithmic Mean Temperature Difference |
| NTC | Negative Temperature Coefficient |
Appendix A
Table A1.
Daily measurements of model-based heat-emission estimates and registered allocation units over the 164-day study period.
Appendix B
Analytical Derivation of Sensitivity Coefficients
To quantify the combined standard uncertainty uc(QPC), the partial derivatives of the heat emission equation with respect to each measured variable were derived. The logarithmic mean temperature difference introduces non-linear sensitivity coefficients. Defining the logarithmic denominator as , the partial derivatives are formulated as follows:
- Derivative with respect to the nominal power Qn:
- Derivative with respect to the logarithmic mean temperature difference in the i-th calculation interval, Δti:
- Sensitivity coefficients for measured temperatures (tV, tR, tL):
- Using the chain rule :
- The following derivatives are presented for a generic calculation interval; the interval index i is omitted for clarity. For supply temperature (tV):
- For return temperature (tR):
- For room ambient air temperature (tL):
References
- European Parliament; Council of the European Union. Directive (EU) 2023/1791 of the European Parliament and of the Council of 13 September 2023 on energy efficiency and amending Regulation (EU) 2023/955 (recast). Off. J. Eur. Union 2023, L 231, 1–111. Available online: https://eur-lex.europa.eu/eli/dir/2023/1791/oj (accessed on 10 August 2026).
- Regulation of the Minister of Climate and Environment of 7 December 2021 on the conditions for determining the technical feasibility and cost-effectiveness of using heat meters, heat cost allocators, and water meters for measuring domestic hot water, the conditions for selecting a method of allocating heat purchase costs, and the scope of information provided in individual billing statements. J. Laws 2021, item 2273. Available online: https://eli.gov.pl/eli/DU/2021/2273/ogl (accessed on 18 October 2026).
- Energy Law Act of 10 April 1997 (Consolidated Text). J. Laws 2026, item 43. Available online: https://eli.gov.pl/eli/DU/2026/43/ogl (accessed on 18 October 2026).
- Saba, F.; Fernicola, V.; Masoero, M.C.; Abramo, S. Experimental Analysis of a Heat Cost Allocation Method for Apartment Buildings. Buildings 2017, 7, 20. [Google Scholar] [CrossRef] [Scilit]
- Canale, L.; Dell’Isola, M.; Ficco, G.; Cholewa, T.; Siggelsten, S.; Balen, I. A comprehensive review on heat accounting and cost allocation in residential buildings in EU. Energy Build. 2019, 202, 109398. [Google Scholar] [CrossRef] [Scilit]
- EN 834:2013; Heat Cost Allocators for the Recording of Radiator Heat Consumption—Appliances with Electrical Energy Supply. European Committee for Standardization (CEN): Brussels, Belgium, 2013.
- Adamski, M.; Rebman, M.; Bargłowski, L. Normy PN-EN 834 dotyczące elektronicznych podzielników kosztów ogrzewania. Ciepł. Ogrzew. Went. 2022, 53, 36–38. (In Polish) [Google Scholar] [CrossRef] [Scilit]
- Adamski, M. Pole temperatury powierzchni grzejnika a wskazania podzielnika kosztów. Ciepł. Ogrzew. Went. 2017, 48, 398–403. (In Polish) [Google Scholar] [CrossRef] [Scilit]
- Ciuman, H. Study of the Heat Coupling Characteristics of a Radiator and an Evaporative Heat Cost Allocator. Ph.D. Thesis, Silesian University of Technology, Gliwice, Poland, 2000. (In Polish) [Google Scholar]
- Michnikowski, P.; Deska, A. Concept of a system for increasing the measuring range of heat meters. Flow Meas. Instrum. 2018, 64, 173–179. [Google Scholar] [CrossRef] [Scilit]
- Cholewa, T.; Siggelsten, S.; Balen, I.; Ficco, G. Heat cost allocation in buildings: Possibilities, problems and solutions. J. Build. Eng. 2020, 31, 101349. [Google Scholar] [CrossRef] [Scilit]
- Ficco, G.; Celenza, L.; Dell’Isola, M.; Vigo, P. Experimental comparison of residential heat accounting systems at critical conditions. Energy Build. 2016, 130, 477–487. [Google Scholar] [CrossRef] [Scilit]
- Dell’Isola, M.; Ficco, G.; Arpino, F.; Cortellessa, G.; Canale, L. A novel model for the evaluation of heat accounting systems reliability in residential buildings. Energy Build. 2017, 150, 281–293. [Google Scholar] [CrossRef] [Scilit]
- Siggelsten, S. Heat cost allocation in energy efficient multi-apartment buildings. Cogent Eng. 2018, 5, 1438728. [Google Scholar] [CrossRef] [Scilit]
- Østergaard, D.S.; Paulsen, O.; Sørensen, I.B.; Svendsen, S. Test and evaluation of a method to identify heating system malfunctions by using information from electronic heat cost allocators. Energy Build. 2019, 184, 152–162. [Google Scholar] [CrossRef] [Scilit]
- Stauffer, Y.; Saba, F.; Carrillo, R.E.; Boegli, M.; Malengo, A.; Hutter, A. Smart sensors network for accurate indirect heat accounting in apartment buildings. J. Build. Eng. 2022, 46, 103534. [Google Scholar] [CrossRef] [Scilit]
- Michnikowski, P. Analityczno-Pomiarowa Metoda Wyznaczania Zużycia Energii na Ogrzewanie Lokali w Budynkach Wielorodzinnych; Wydawnictwo Politechniki Poznańskiej: Poznań, Poland, 2012; ISBN 978-83-7775-138-1. (In Polish) [Google Scholar]
- Michnikowski, P.; Skiba, J. Testy poprawności rozliczania indywidualnych kosztów ogrzewania na podstawie wskazań nagrzejnikowych podzielników elektronicznych. Ciepł. Ogrzew. Went. 2014, 45, 347–351. (In Polish) [Google Scholar]
- Andersen, S.; Andersen, R.K.; Olesen, B.W. Influence of heat cost allocation on occupants’ control of indoor environment in 56 apartments: Studied with measurements, interviews and questionnaires. Build. Environ. 2016, 101, 1–8. [Google Scholar] [CrossRef] [Scilit]
- Benakopoulos, T.; Tunzi, M.; Salenbien, R.; Svendsen, S. Strategy for low-temperature operation of radiator systems using data from existing digital heat cost allocators. Energy 2021, 231, 120928. [Google Scholar] [CrossRef] [Scilit]
- Benakopoulos, T.; Tunzi, M.; Salenbien, R.; Hansen, K.K.; Svendsen, S. Implementation of a strategy for low-temperature operation of radiator systems using data from existing digital heat cost allocators. Energy 2022, 251, 123844. [Google Scholar] [CrossRef] [Scilit]
- Yang, Q.; Saba, F.; Orio, M.; Santiano, M.; Audrito, E.; Salenbien, R.; Tunzi, M. Data Pre-processing Methods Enhancing Heat Cost Allocator Measurement Usability. In Proceedings of the 19th International Symposium on District Heating and Cooling; Lecture Notes in Networks and Systems; Vanhoudt, D., Ed.; Springer: Cham, Switzerland, 2026; Volume 1700, pp. 153–162. [Google Scholar] [CrossRef] [Scilit]
- Tunzi, M.; Benakopoulos, T.; Yang, Q.; Svendsen, S. Demand side digitalisation: A methodology using heat cost allocators and energy meters to secure low-temperature operations in existing buildings connected to district heating networks. Energy 2023, 264, 126272. [Google Scholar] [CrossRef] [Scilit]
- Yang, Q.; Salenbien, R.; Smith, K.M.; Tunzi, M. Identifying untraced faults associated with high return temperatures from heating systems in buildings connected to district heating networks. Energy 2024, 309, 133097. [Google Scholar] [CrossRef] [Scilit]
- Yang, Q.; Salenbien, R.; Kolarik, J.; Smith, K.M.; Tunzi, M. Low-temperature district heating operations using heat cost allocators in apartment buildings. Build. Environ. 2026, 289, 114095. [Google Scholar] [CrossRef] [Scilit]
- Celenza, L.; Dell’Isola, M.; Ficco, G.; Palella, B.I.; Riccio, G. Heat accounting in historical buildings. Energy Build. 2015, 95, 47–56. [Google Scholar] [CrossRef] [Scilit]
- Dell’Isola, M.; Ficco, G.; Di Pietra, B.; Saba, F.; Masoero, M.C. A novel measurement method for accurate heat accounting in historical buildings. Measurement 2020, 161, 107876. [Google Scholar] [CrossRef] [Scilit]
- Liu, Z.; Xu, W.; Li, Z.; Zhang, L.; Li, J.; Li, A.; Feng, A. Research on Heating Performance of Heating Radiator at Low Temperature. J. Build. Eng. 2021, 36, 102016. [Google Scholar] [CrossRef] [Scilit]
- Muniak, D.P. Radiators in Hydronic Heating Installations. Historical Outline, Types and Structure. In Radiators in Hydronic Heating Installations; Studies in Systems, Decision and Control; Springer: Cham, Switzerland, 2017; Volume 101, pp. 15–47. [Google Scholar] [CrossRef] [Scilit]
- EN 442-2:2014; Radiators and Convectors—Part 2: Test Methods and Rating. European Committee for Standardization (CEN): Brussels, Belgium, 2014.
- JCGM 100:2008; Evaluation of Measurement Data—Guide to the Expression of Uncertainty in Measurement; Joint Committee for Guides in Metrology: Sèvres, France, 2008. [Google Scholar] [CrossRef] [Scilit]
- Wang, H.; Zhou, Y.; Li, X.; Wu, X.; Wang, H.; Elnaz, A.; Granlund, K.; Lahdelma, R.; Teppo, E. Study on the performance of a forced convection low temperature radiator for district heating. Energy 2023, 283, 129036. [Google Scholar] [CrossRef] [Scilit]
- Młodawski, M.; Małek, M.; Klasek, K. The influence of low temperature of the heat carrier on the modeled and actual thermal power of a steel plate central heating radiator. Instal 2024, 12, 21–25. [Google Scholar] [CrossRef]

Disclaimer/Publisher’s Note: The statements, opinions and data contained in all publications are solely those of the individual author(s) and contributor(s) and not of MDPI and/or the editor(s). MDPI and/or the editor(s) disclaim responsibility for any injury to people or property resulting from any ideas, methods, instructions or products referred to in the content. |
© 2026 by the authors. Licensee MDPI, Basel, Switzerland. This article is an open access article distributed under the terms and conditions of the Creative Commons Attribution (CC BY) license.