


Abstract
The visual environment of urban parks plays a critical role in shaping public spatial perception and environmental experience; however, systematic understanding of age-related differences and nonlinear responses to visual environments remains limited. Taking Guazhu Lake Park in Shaoxing, China, as the study area, this study developed an integrated analytical framework combining deep learning-based image recognition, spatial perception assessment, machine learning prediction, and SHAP-based interpretation. Eight visual environmental indicators, including the Green View Index (GVI), Sky View Index (SVI), water proportion, hardscape proportion, facility visibility, and visual obstruction, were extracted using semantic segmentation. These indicators were integrated with evaluations of beauty, safety, restoration, and vibrancy from children, adults, and older adults to predict spatial perception using machine learning models. SHAP analysis was further employed to identify the relative importance and nonlinear responses of key visual attributes. The results showed that the visual environment of Guazhu Lake Park exhibited pronounced spatial heterogeneity, characterized by abundant vegetation and water features, together with a coexistence of open and enclosed spaces. Different visual attributes exerted differentiated and nonlinear effects on spatial perception, while distinct age groups exhibited substantially different sensitivities to visual environmental characteristics. Based on these findings, low-perception areas were identified, and age-specific micro-landscape optimization strategies were proposed. This study provides a data-driven approach and practical basis for quantitative spatial perception assessment and age-inclusive landscape optimization in urban parks.
1. Introduction
Urban parks, as an integral component of urban green infrastructure, play an indispensable role in improving ecological conditions, mitigating urban heat islands, and promoting public physical and mental well-being. A growing body of empirical research has demonstrated that exposure to green spaces can alleviate psychological stress, facilitate emotional restoration, and enhance subjective well-being [1,2,3]. However, the health and restorative benefits of urban parks are not determined solely by the gross extent of green space or macro-scale vegetation coverage. Rather, human experiential quality and psychological evaluations are profoundly conditioned by eye-level visual compositions, spatial legibility, and individual socio-demographic characteristics. Therefore, establishing a fine-grained, human-centered spatial assessment framework is essential for advancing evidence-based landscape architecture and urban design.
To establish a rigorous theoretical baseline in spatial analysis, this study anchors its analytical framework in Kevin Lynch’s foundational theory of spatial imageability [4]. Lynch postulated that human mental mapping and environmental legibility rely on five fundamental structural elements: paths, edges, districts, nodes, and landmarks. Within the micro-spatial fabric of urban waterfront parks, these architectural components directly correspond to measurable visual environmental interfaces. Specifically, pedestrian greenways, lakeside boardwalks, and shaded circulation trails constitute circulation “paths” (quantified by the Path Ratio, PaR), governing walking movement and visual continuity. The water–land ecotones and vertical canopy–sky boundaries define spatial “edges” (Water Ratio, WR; Sky View Index, SVI; Visual Obstruction Degree, VOD), whereas continuous thematic sectors delineate spatial “districts” with distinctive typologies. Furthermore, strategic gathering plazas and play areas act as interactive “nodes” marked by concentrated amenities and paved surfaces (Facility Visibility, FV; Pavement Ratio, PR), while prominent pavilions, footbridges, and structures serve as orienting “landmarks” (Building and Structure Ratio, BR). To bridge Lynch’s morphological elements with psychological health outcomes, this framework further synthesizes Attention Restoration Theory (ART) [5] and Prospect–Refuge Theory [6]. ART posits that natural elements (e.g., dense vegetation, expansive water surfaces) elicit effortless “soft fascination” that replenishes depleted cognitive capacity, whereas Prospect–Refuge Theory emphasizes that satisfying environmental spaces provide unobstructed vantage points for outward observation (prospect/openness) alongside sheltered enclosures that afford psychological safety (refuge). Evaluating park spatial quality therefore requires understanding how micro-scale visual compositions interact with these cognitive and evolutionary psychological mechanisms.
The methodological progression of spatial perception assessment in built environments reveals a clear bifurcation between traditional non-AI methodologies and contemporary AI-driven visual computing paradigms. Historically, urban design and environmental psychology have relied primarily on topological modeling and empirical post-occupancy evaluations. Pioneered by Hillier and Hanson, Space Syntax has long served as a benchmark for spatial configuration analysis [7]. By computing axial connectivity, integration, and isovist visual fields, Space Syntax captures the mathematical potential for pedestrian circulation; however, it operates primarily on two-dimensional geometric abstractions, inherently stripping away vertical vegetative stratification, seasonal canopy textures, and ocular chromatic variety. In parallel, empirical assessments have relied on Post-Occupancy Evaluation (POE), on-site Likert surveys, and semantic differential questionnaires [8,9]. Although these direct surveys capture authentic human emotional responses, their heavy reliance on intercept interviews imposes high surveying costs, limits sample sizes, and yields spatially discontinuous cross-sectional points. Furthermore, satellite remote sensing and GIS indices (such as the Normalized Difference Vegetation Index, NDVI) have long served as ecological proxies for greenness. However, recent critical studies have demonstrated that top-down planar NDVI correlates poorly with human eye-level perceptual experiences, as aerial measurements fail to reflect three-dimensional vertical greenery and pedestrian-perspective visual enclosure [10].
Over the past three years, the rapid convergence of eye-level visual imagery, computer vision, and machine learning has established an unprecedented frontier for spatial perception modeling [11,12]. Advanced deep learning semantic segmentation architectures—transitioning from traditional convolutional networks to state-of-the-art Vision Transformers (e.g., SegFormer, Mask2Former) [13,14]—enable automated, pixel-wise extraction of granular landscape components from human-eye-level imagery with high accuracy [15]. Large-scale empirical investigations have validated the efficacy of coupling visual semantic parsing with machine learning to decode public perceptions of beauty, safety, and walkability across municipal networks [16,17]. Recent research has extended these visual computing techniques to urban park environments [18,19], while studies incorporating eye-tracking gaze fixations and multimodal sensing have begun to reveal how visual attention patterns drive spatial perception [20,21]. Most recently, Explainable Artificial Intelligence (XAI), particularly SHAP (SHapley Additive exPlanations) grounded in cooperative game theory [22], has enabled researchers to open algorithmic “black boxes” by quantifying the nonlinear marginal contributions of visual indicators and isolating critical inflection points [23,24,25].
Despite these notable breakthroughs, an examination of the state of the art reveals three critical research gaps that remain unresolved. First, existing visual computing studies remain overwhelmingly focused on municipal vehicular street canyons, while the nuanced, pedestrian-exclusive micro-spatial environments of urban waterfront parks—characterized by complex micro-topographies, delicate water–land interfaces, and layered planting arrangements—remain under-quantified because vehicular imagery cannot penetrate internal park zones [11,18]. Second, conventional machine learning models frequently emphasize predictive precision while offering limited prescriptive utility; linear assumptions obscure physiological and psychological tipping points, preventing designers from obtaining actionable numerical thresholds (such as the exact saturation threshold where additional green view ceases to promote restoration, or the precise level where dense vegetation turns into visual obstruction that impairs perceived safety) to inform landscape zoning codes [23,24]. Third, prevailing computational spatial models routinely treat park users as an undifferentiated, homogeneous demographic cohort, ignoring the divergent spatial affordance needs, visual vantage points, and perceived vulnerability thresholds across life stages [25]. In particular, children prioritize natural richness and supervisory visibility [26], adults seek cognitive restoration and aesthetic value [10,19], and older adults attach higher importance to sightline permeability, facility accessibility, and perceived safety [27,28]. Computational frameworks that simultaneously quantify micro-scale visual metrics and untangle age-stratified sensitivities remain virtually unaddressed.
To bridge these gaps, this study proposes an integrated framework for urban park spatial perception assessment that combines deep learning-based image recognition, perception evaluations across age groups, and explainable machine learning. First, deep learning-based semantic segmentation is employed to extract visual environmental indicators, including green view, sky openness, water proportion, hardscape proportion, and facility visibility. Second, perception data from children, young adults, and older adults are integrated to develop predictive models linking visual environmental characteristics with beauty, safety, restoration, and vibrancy. SHAP is then employed to quantify the contributions of key visual factors and identify their nonlinear response patterns, based on which landscape optimization strategies tailored to different age groups are proposed. This study contributes to a better understanding of age-specific perceptual responses to visual environments in urban parks, advances park assessment from experience-based judgment toward data-driven and mechanism-oriented analysis, and provides a scientific basis for age-inclusive planning and renewal of urban green spaces.
2. Materials and Methods
2.1. Study Area and Data Collection
This study selected Guazhu Lake Park in Keqiao District, Shaoxing, Zhejiang Province, China, as the empirical study area. As a core urban waterfront park, Guazhu Lake Park integrates open water bodies with refined waterfront landscapes, representing a distinctive combination of traditional Jiangnan water-town characteristics and contemporary urban park design. Lakes, ecological shorelines, woodland–grassland landscapes, lakeside walking trails, waterside viewing platforms, and public recreational plazas are distributed throughout the park. The visual openness, vegetation structure, and facility configuration of these microscale spaces exhibit substantial spatial heterogeneity and visual diversity, making the park an appropriate setting for investigating age-specific spatial perception preferences and responses to visual environmental characteristics.
To capture the diversity of microscale visual environments within the park, a systematic grid-based sampling scheme was established along the main and secondary lakeside routes, waterfront boardwalks, shaded woodland trails, open gathering plazas, and major recreational nodes used by children and older adults, as shown in Figure 1. The sampling network covered five representative spatial environments: (1) open waterfront spaces, characterized by high water visibility and sky openness; (2) shaded woodland spaces, characterized by high green visibility and varying degrees of visual obstruction; (3) open activity plazas, characterized by a high proportion of hardscape; (4) primary circulation spaces, characterized by continuous pathway views; and (5) recreational and restorative nodes, characterized by concentrated facilities and opportunities for prolonged stay. The geographic coordinates of all sampling points were simultaneously recorded using a high-precision handheld CHCNAV i73 GPS/RTK receiver equipped with Hi-Survey Road software (Version 3.2.4, CHC Navigation Technology Co., Ltd., Shanghai, China), to ensure accurate spatial registration and integration of the image, perception, and environmental datasets.
Figure 1.
Guazhu Lake Park study area and sampling point distribution.
During the image acquisition process, data collection strictly adhered to ergonomics and environmental psychology testing standards to faithfully reproduce the authentic spatial perception of pedestrians. The camera was mounted on a tripod with the lens center strictly maintained at 1.50–1.60 m above the ground, accurately simulating the horizontal eye-level perspective of a standing adult. To minimize confounding effects from extreme weather conditions, harsh shadows, and transient crowd gatherings, image collection was systematically conducted during stable meteorological windows with clear skies, uniform illumination, gentle breezes, and no direct backlighting (specifically between 9:00–11:30 AM and 14:00–16:30 PM). A fixed focal length (equivalent to a 28 mm full-frame wide-angle lens with a field of view of approximately 75°) was utilized to capture horizontal eye-level panoramic views at a standardized resolution of 4000 × 3000 pixels.
At each of the 80 designated sampling locations, four horizontal eye-level photographs were systematically captured along four orthogonal cardinal headings (0°, 90°, 180°, and 270°), generating an initial collection of 320 raw spatial images (80 sampling nodes × 4 headings). Subsequently, a rigorous three-tier quality control protocol was executed:
Pedestrian Interference: Twelve images were eliminated due to transient pedestrians entering within 1.0 m of the camera lens, creating unrepresentative foreground occlusion;
Optical Flare and Irregular Illumination: Nine images were excluded due to severe direct solar lens flare or localized shadow anomalies caused by sudden intermittent cloud cover;
Severe Lens Occlusion: Nine images were discarded where extreme foreground foliage or drooping branches obstructed more than 85% of the frame.
Following this screening, exactly 30 invalid images were removed, leaving a finalized dataset of 290 high-quality valid images spanning 76 unique geographic sampling locations (four sampling nodes were culled entirely due to multiple rejected directional views). This curated corpus of 290 valid images across 76 distinct spatial nodes served as the standardized empirical dataset for semantic segmentation, multi-age perception assessments, and predictive machine learning.
Furthermore, acknowledging that a camera height of 1.50–1.60 m reflects an adult visual height, a sensitivity verification test was conducted across 20 representative park nodes to assess potential perspective variations between adults and children. Paired photographs were captured simultaneously at 1.55 m (adult eye level) and 1.20 m (child eye level). Paired t-tests and correlation analyses revealed that the extracted major indicators remained highly consistent across both heights (Pearson r = 0.94 for GVI, r = 0.96 for WR, and r = 0.91 for SVI; all p < 0.001). Although the Visual Obstruction Degree (VOD) showed a minor increase (+3.8%) at the 1.20 m height due to closer vertical proximity to low shrubbery, the relative spatial hierarchy across the sample nodes remained invariant. This validates that standardized 1.50–1.60 m eye-level imagery provides an objective and robust spatial stimulus for evaluating overall spatial configurations across demographic cohorts.
2.2. Deep Learning-Based Extraction of Visual Environmental Attributes
2.2.1. Deep Learning Architecture, Preprocessing, and Implementation Details
To automatically quantify visual elements from park images, this study employed SegFormer-B4, a hierarchical Vision Transformer architecture specifically developed for semantic segmentation [13]. SegFormer integrates a multi-scale Transformer encoder that captures both fine-grained local textures and broad landscape contexts, coupled with a lightweight All-MLP decoder to generate pixel-level semantic predictions . The network optimization was supervised using the multi-class categorical cross-entropy loss function:
where denotes the semantic categories of the benchmark dataset, is the ground-truth binary label for pixel belonging to class , is the predicted probability, and represents the total valid pixels per frame.
Training and Fine-Tuning: The model backbone was pre-trained on ImageNet and fine-tuned on the authoritative ADE20K dataset, which covers 150 outdoor landscape and urban categories (e.g., vegetation, water, sky, pathways, and public amenities). Fine-tuning was executed using the AdamW optimizer (initial learning rate = , weight decay = ) with a polynomial learning rate decay schedule across 160,000 iterations. Standard data augmentations, including random horizontal flipping and multi-scale cropping, were applied during training to improve model generalization.
Image Preprocessing and Normalization: Prior to model inference, all collected photographs ( pixels) were downscaled to a standardized resolution of pixels using bilinear interpolation, preserving the native 4:3 aspect ratio. Channel pixel values were normalized into tensor format using ImageNet standard RGB channel distributions (mean = , standard deviation = ).
Software and Hardware Stack: The semantic segmentation pipeline was implemented in Python 3.10 within the OpenMMLab MMSegmentation framework (v1.2.2) on top of PyTorch 2.1. Inference was executed on an NVIDIA GeForce RTX 4090 GPU (24 GB VRAM) and an Intel Core i9-13900K CPU, utilizing FP16 mixed-precision acceleration for computational efficiency.
2.2.2. Extraction and Operational Definitions of Visual Environmental Attributes
To ensure complete experimental transparency and reproducibility, all eight visual environmental indicators were rigorously operationalized by linking environmental psychological constructs to specific pixel subsets derived from the ADE20K semantic segmentation ontology [13]. Let denote the pixel-level semantic classification map output by the SegFormer-B4 model, where corresponds to the ADE20K class dictionary, and represents the total number of valid pixels per frame. The quantitative proportion of any visual indicator is formulated as:
where denotes the predefined, mutually exclusive semantic class subset mapped to indicator , and is the indicator function that equals 1 if the predicted class of pixel belongs to and 0 otherwise.
The physical delineations, semantic class subsets, and hierarchical relationships among the eight visual environmental indicators are systematically documented in Table 1:
Table 1.
Operational definitions, ADE20K semantic mappings, and mathematical formulations of visual environmental indicators.
Green View Index (GVI): Represents total visible eye-level vegetative greenness, aggregating canopy foliage, ground turf, and understory plants ().
Sky View Index (SVI): Measures visual overhead openness, computed from the pixel proportion of unobstructed open sky ().
Water Ratio (WR): Captures blue space exposure, including natural lakes, shoreline waters, and landscape ponds ().
Pavement Ratio (PR) vs. Path Ratio (PaR): To prevent conceptual ambiguity, artificial horizontal ground surfaces are hierarchically differentiated. Pavement Ratio (PR) measures the comprehensive presence of artificial hardscapes, encompassing wide plazas, gathering terraces, concrete squares, and outdoor steps (). In contrast, Path Ratio (PaR) specifically isolates linear, continuous pedestrian circulation corridors (e.g., walking paths, running tracks, and waterfront boardwalks), forming a functional subset of total pavement ().
Building and Structure Ratio (BR): Measures artificial vertical built interfaces, including park pavilions, landscape bridges, covered corridors, and architectural shelters ().
Facility Visibility (FV): Quantifies public resting and service infrastructure supporting recreational stays, including benches, fitness gear, playground equipment, lighting columns, and informational signage ().
Visual Obstruction Degree (VOD): Grounded in Prospect–Refuge Theory, VOD captures visual barriers located within the pedestrian horizontal eye-level sightline band (0.8 m to 2.0 m above the ground plane). It aggregates opaque elements that disrupt continuous visual penetration, specifically dense understory shrubs, opaque security walls, and perimeter fences (), while excluding high tree canopies that permit sightlines underneath.
2.2.3. Segmentation Accuracy and Ground-Truth Validation
To empirically evaluate the reliability and precision of the fine-tuned SegFormer-B4 model in recognizing specific park landscapes, a ground-truth validation experiment was conducted against manually annotated images. A stratified subsample of 40 representative images (accounting for 13.8% of the valid dataset, encompassing open waterfront spaces, shaded woodland areas, activity plazas, primary pathways, and recreational nodes) was randomly selected. Pixel-level manual annotation was executed using the Labelme tool by two trained landscape architecture researchers, with cross-verification conducted by a senior researcher to establish standard ground-truth masks.
Model segmentation performance was quantitatively evaluated using category-level Intersection-over-Union (), mean IoU (), Dice/F1 score, and category Pixel Accuracy ():
where , , , and represent the counts of true-positive, false-positive, false-negative, and true-negative pixels for visual category , respectively. The mean IoU () and mean F1 score are computed as the macro-average across all categories.
As summarized in Table 2, the model achieved high recognition accuracy across all eight visual indicators, with an overall of 84.76%, a mean Dice/F1 score of 91.66%, and an overall pixel accuracy of 92.73%. Primary natural elements demonstrated excellent segmentation consistency, with sky (SVI), water (WR), and vegetation (GVI) reaching IoU values of 93.15%, 91.20%, and 88.42%, respectively. Public facilities (FV) and visual obstructions (VOD) yielded IoUs of 76.50% and 80.15% due to their complex geometries and varying lighting conditions, yet maintained F1 scores above 86%. These results confirm that the automated semantic segmentation model provides accurate and objective visual indicators for subsequent spatial perception modeling.
Table 2.
Segmentation accuracy validation of the SegFormer-B4 model against manually annotated ground truth (N = 40).
2.3. Perception Data Collection Across Age Groups
2.3.1. Ethics Statement and Informed Consent Protocols
This research involving human participants strictly complied with the ethical guidelines set forth in the Declaration of Helsinki and was formally reviewed and approved by Universiti Kebangsaan Malaysia. Prior to the commencement of data collection, comprehensive ethical protocols were implemented for all participant cohorts:
(1) Adult Informed Consent: All adult participants (in both the adult cohort, aged 18–59 years, and the older adult cohort, aged years) were provided with an explanatory participant information sheet detailing the study objectives, evaluation tasks, data handling procedures, and the voluntary nature of the experiment. Written informed consent was secured from each adult participant prior to testing.
(2) Parental Consent and Child Assent for Minors: For all participating minors (children aged 7–14 years), a dual-layer consent protocol was enforced. First, formal written informed consent was obtained from parents or legal guardians following a thorough briefing on the survey content, visual stimuli, and data confidentiality. Second, an age-appropriate child assent script—incorporating simplified verbal explanations and illustrative pictorial cues—was administered to each child. Participation commenced only after the child verbally assented and demonstrated clear willingness to participate. Children and their guardians were explicitly informed that participation was entirely voluntary and could be paused or discontinued at any moment without any adverse consequences.
(3) Data Anonymity and Protection: No private demographic identifiers, contact records, or facial photographs of participants or minors were collected. All perceptual ratings were assigned random alphanumeric identifiers to guarantee strict confidentiality.
2.3.2. Participant Demographics and Multi-Age Cohort Screening
To establish adequate statistical power and representative demographic stratification, participant sampling adhered to standardized environmental psychology and pedestrian perception modeling protocols [29]. An a priori sample size calculation was conducted using 3.1.9.7 (linear multiple regression and ANOVA: medium effect size , significance level , statistical power , and number of predictors = 8). The minimum required sample size was calculated as 138. To ensure robust group-level statistical validity and capture fine-grained demographic variation across life stages, a total of participants were recruited, evenly distributed across three cohorts ( per cohort):
Children Group (): Aged 7–14 years (mean age = years; range 7–14; 48.8% female, 51.2% male), capturing early-stage spatial exploration, sensory affordances, and parental supervision needs;
Adult Group (): Aged 18–59 years (mean age = years; range 18–58; 51.3% female, 48.7% male), representing working-age park visitors seeking daily recreational activities, stress alleviation, and psychological restoration;
Older Adult Group (): Aged years (mean age = years; range 60–79; 52.5% female, 47.5% male), examining the visual perception needs, spatial legibility, and environmental vulnerability associated with healthy aging.
Participants were recruited through a diversified multi-channel approach within Keqiao District, Shaoxing, combining on-site random intercept invitations within Guazhu Lake Park, public flyers on community center announcement boards, and invitations coordinated through local primary and secondary school parent-teacher networks.
Candidate eligibility was rigorously governed by predefined inclusion and exclusion criteria:
Inclusion Criteria: (a) Normal or corrected-to-normal visual acuity with verified absence of color blindness or chromatic deficiencies; (b) continuous residence in the local Shaoxing metropolitan region for more than six months, ensuring adequate familiarity with regional Jiangnan waterfront park topologies; and (c) cognitive capacity to independently understand and execute the Likert evaluative tasks.
Exclusion Criteria: (a) Uncorrected severe visual impairment; (b) cognitive impairment or neurodegenerative conditions among older adults, screened a priori using the validated Mini-Mental State Examination (MMSE required for inclusion; mean sample score = ); and (c) educational background or professional practice in landscape architecture, urban planning, architecture, or computer vision, thereby eliminating professional design preconceptions and ensuring that the collected data reflect authentic, lay-public spatial perceptions.
The complete socio-demographic breakdown of the participant cohort is summarized in Table 3.
Table 3.
Socio-demographic characteristics and screening profiles of the participant cohorts (N = 240).
2.3.3. Perceptual Dimensions and Standardized Visual Prompt Protocols
To establish a psychometrically robust interface between human cognition and environmental visual features, four core perceptual dimensions were operationalized: Beauty, Safety, Restoration, and Vibrancy. These dimensions were systematically grounded in classical environmental psychology paradigms: Kevin Lynch’s theory of cognitive imageability (Beauty), Appleton’s Prospect–Refuge Theory and Newman’s Defensible Space Theory (Safety), Kaplan’s Attention Restoration Theory (Restoration), and Gibson’s Theory of Environmental Affordances (Vibrancy).
To minimize semantic ambiguity, cognitive fatigue, and individual interpretative divergence, a standardized Visual Prompt Protocol was formulated. Before presenting each visual stimulus, participants were provided with uniform, validated guiding instructions:
Beauty (Aesthetic Preference & Visual Quality): “To what extent do you perceive this park landscape as aesthetically harmonious, visually pleasing, and attractively composed?” (Anchored to natural balance, plant color contrast, and clean waterscapes).
Safety (Perceived Security & Legibility): “How safe, visually transparent, and free from potential physical or social threats do you feel when imagining yourself standing at this spot?” (Anchored to clear sightlines, absence of blind corners behind dense low foliage, and visible pedestrian paths).
Restoration (Psychological Recovery & Stress Relief): “How effectively could being in this space help you relieve mental fatigue, escape daily pressure, and restore inner calmness?” (Anchored to vegetative immersion, open sky views, and tranquil water surfaces).
Vibrancy (Environmental Affordance & Activity Attractiveness): “How strongly does this space invite you to stay, socialize, play, or engage in recreational activities?” (Anchored to visible public amenities, gathering plazas, walking tracks, and interactive spaces).
To accommodate developmental cognitive differences across the three cohorts (), the prompts were administered through calibrated presentation modes. For adult and older adult cohorts, prompts were displayed alongside standardized text descriptions with 5-point numerical Likert options (1 = “very low”, 5 = “very high”). For the children cohort (aged 7–14), prompts were accompanied by internationally validated 5-point pictorial smiley-face cards and read aloud verbatim by trained investigators using a non-directive script, eliminating linguistic comprehension barriers while ensuring strict adherence to the underlying psychological constructs.
2.3.4. Image Rating Protocol, Instrument Calibration, and Bias Control
A 5-point Likert scale was used, with scores ranging from 1 (“very low”) to 5 (“very high”). Each of the 290 valid images was presented in a randomized sequence for 15 s to eliminate order-sequence effects. For each randomly presented spatial image, participants independently rated the four perception dimensions. To reduce the influence of individual differences, each image was evaluated repeatedly by multiple participants, and the mean score across ratings was calculated as the final perception score for the corresponding spatial node.
To eliminate potential response biases arising from parental presence during children’s evaluations (such as acquiescence bias, parental proxy reporting, or subtle emotional contagion), a standardized Non-Directive Facilitation Protocol was formulated and strictly enforced:
Standardized Parental Neutrality Protocol: Before the testing session, accompanying parents or guardians were given a briefing sheet and verbally instructed to serve strictly as neutral proctors. Parents were permitted to re-read the standardized textual prompts verbatim if requested by the child, but were categorically prohibited from rephrasing questions, suggesting answers, using evaluative adjectives, or displaying non-verbal cues (such as nodding, smiling, or pointing).
Age-Appropriate Pictorial Evaluation Tool: To circumvent cognitive constraints associated with abstract numerical Likert scales, children recorded their responses using an internationally validated 5-point pictorial smiley-face scale (ranging from 1 = deep frown/strongly negative to 5 = broad smile/strongly positive). This tool enabled children (aged 7–14) to project their intuitive affective responses directly onto standardized visual anchors without adult translation.
Spatial and Ergonomic Isolation: The testing station was arranged such that the child operated the interactive screen independently. Parents were seated at an observation station 1.0 m behind the child, outside their direct forward visual field, thereby precluding eye contact and unconscious parental micro-expressions during rating selection.
On-Site Dual-Researcher Oversight: Every session involving minors was independently monitored by two researchers trained in developmental psychology protocols. The monitors possessed the authority to immediately pause the session and invalidate ratings if parental intervention was observed. All retained child evaluations were verified as independently completed.
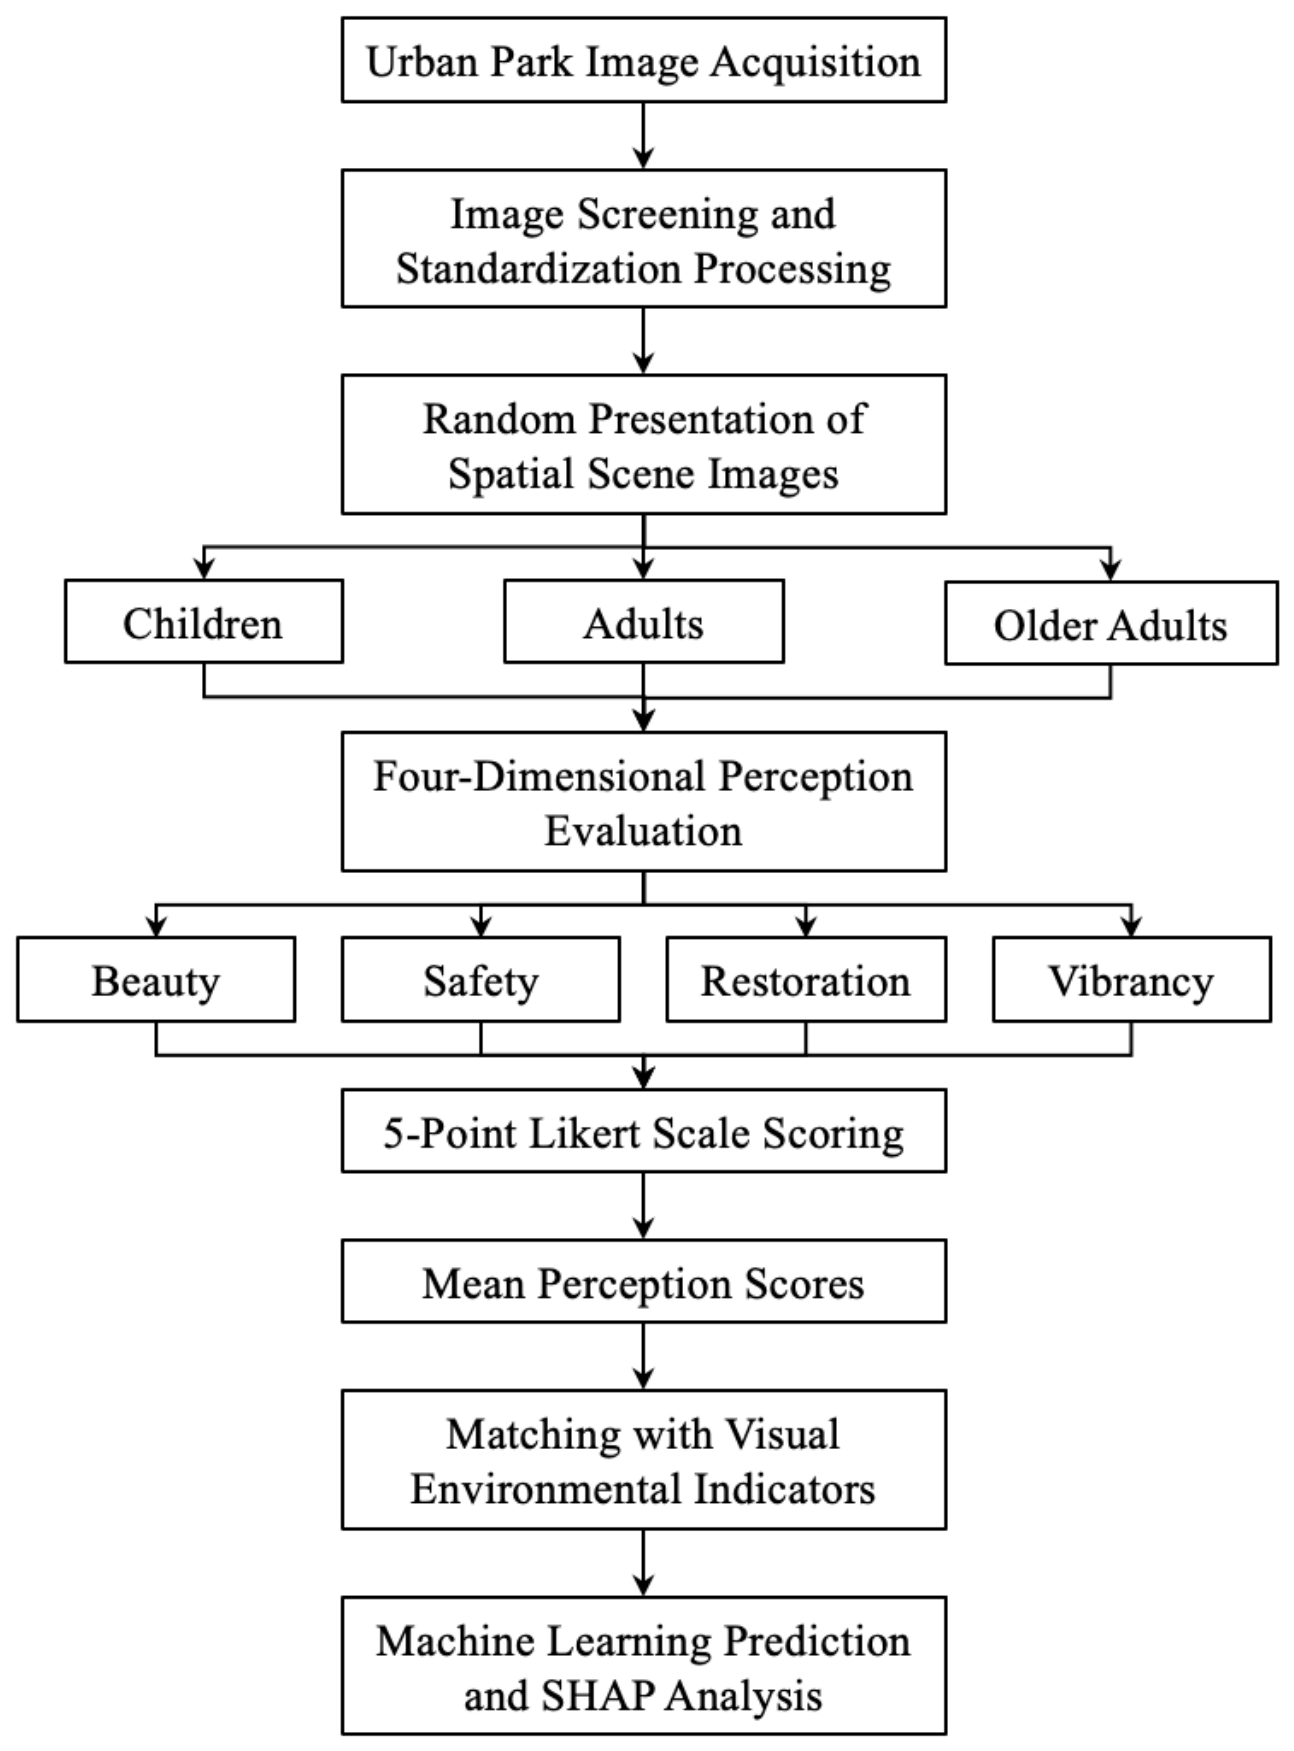
Following these calibrated procedures, individual perception scores were collected across all cohorts, aggregated, and mapped to the objective visual indicators for machine learning modeling (Figure 2).
2.3.5. Psychometric Reliability and Inter-Rater Consensus
To rigorously establish the validity and empirical reliability of the multi-age spatial perception assessment, psychometric evaluations were executed across both internal scale consistency and inter-rater consensus dimensions.
Internal Consistency Reliability: Cronbach’s alpha () was calculated to verify the internal consistency of the psychometric instrument across demographic strata. Across all three participant cohorts, the evaluation battery exhibited high internal consistency: Children (), Adults (), and Older Adults (), yielding an overall pooled scale reliability of . All calculated coefficients substantially surpassed the widely accepted psychometric threshold of , indicating that the questionnaire items reliably capture consistent psychological response patterns across participants.
Inter-Rater Reliability and Consensus: Because multiple independent evaluators assessed identical visual stimuli across the 290 valid spatial scenes, a two-way random-effects, average-measures Intraclass Correlation Coefficient () based on absolute agreement was computed to quantify the degree of consensus among evaluators:
where is the mean square between spatial image rows, is the mean square for residual error, is the mean square between participant columns, and denotes the number of evaluators. As summarized in Table 4, high inter-rater agreement was observed across all four perception dimensions: Beauty (, 95% CI: [0.865, 0.915]), Safety (, 95% CI: [0.831, 0.892]), Restoration (, 95% CI: [0.882, 0.926]), and Vibrancy (, 95% CI: [0.812, 0.879]). In accordance with standard measurement guidelines, values exceeding indicate excellent agreement, confirming that the collected perception scores reflect shared, robust public environmental evaluations rather than idiosyncratic rating noise.
Table 4.
Internal consistency and inter-rater reliability across perception dimensions.
Figure 2.
Flowchart of the multi-age spatial perception assessment and analytical workflow.
2.4. Statistical Analysis and Explainable Machine Learning Models
2.4.1. Image-Level Aggregation and Modeling Justification
To link visual environment attributes with subjective spatial experiences, individual participant ratings were aggregated into mean scores for each image across the four perception dimensions (Beauty, Safety, Restoration, and Vibrancy). This image-level aggregation is both practically necessary and statistically sound:
(1) Practical Planning Relevance: The primary objective of this research is to propose actionable landscape optimization strategies (e.g., vegetation density control, shrub pruning, and amenity provision) for physical park spaces. Because physical park landscape renovations are deployed at concrete spatial nodes rather than tailored to individual persons, the average perception score of a spatial node serves as the most objective and practical benchmark for landscape architects and municipal managers.
(2) Preservation of Demographic Heterogeneity: To preserve life-stage perceptual sensitivities, ratings were not combined into a single homogeneous pool. Instead, mean target scores were calculated and modeled independently for each of the three age cohorts (children, adults, and older adults).
(3) Statistical Validity: An intraclass correlation analysis demonstrated that over 60% of the total variance in perception scores was driven by objective visual differences between the park scenes, confirming that aggregated mean scores reliably capture the shared environmental qualities of the physical nodes.
2.4.2. Predictive Learning Framework and Mathematical Formulations
To examine the complex nonlinear relationships between microscale visual attributes and residents’ multi-dimensional spatial perceptions, machine learning predictive models were developed. The input feature space was strictly standardized to an 8-dimensional visual attribute vector:
comprising Green View Index (), Sky View Index (), Water Ratio (), Pavement Ratio (), Building Ratio (), Facility Visibility (), Path Ratio (), and Visual Obstruction Degree (), as operationalized in Section 2.2.2 and Table 1. The subjective perception scores across the four evaluative dimensions (Beauty, Safety, Restoration, and Vibrancy) for each of the three demographic cohorts (Children, Adults, and Older Adults) served as the continuous target variables ().
All subsequent model training runs (Random Forest, XGBoost, and Deep Neural Networks), hyperparameter optimizations, and SHAP explainability analyses were executed within this identical 8-predictor parameter space, ensuring rigorous structural consistency throughout the empirical modeling pipeline.
Given the potential nonlinear relationships and interactions among visual environmental factors and residents’ perceptions, three machine learning algorithms were selected: Random Forest (RF), Extreme Gradient Boosting (XGBoost), and Deep Neural Network (DNN). RF improves model robustness by aggregating multiple decision trees and is well suited to high-dimensional features and complex variable relationships [30]. XGBoost adopts a gradient-boosting framework and progressively optimizes weak learners to achieve high predictive accuracy, making it particularly suitable for nonlinear regression problems [31]. DNNs can learn latent mappings between visual environmental variables and perceptual outcomes through multilayer architectures and have been widely applied to complex pattern-recognition tasks [32].
XGBoost adopts a scalable second-order gradient boosting framework, progressively optimizing decision trees to minimize a regularized objective function:
where denotes the squared error loss between the observed score and predicted value , is the -th boosting tree, is the number of terminal leaves, represents leaf weights, and and penalize tree complexity to mitigate overfitting.
2.4.3. Data Partitioning, Cross-Validation, and Evaluation Metrics
In spatial perception modeling, standard random train–test partitioning is highly prone to spatial data leakage: photographic vistas captured at the same geographic coordinate (or within adjacent visual buffers) share continuous background landscape textures and illumination profiles, artificially inflating predictive accuracy via spatial autocorrelation. To rigorously prevent spatial leakage and demonstrate genuine spatial generalizability across unseen park areas, a 5-Fold Spatial Block Cross-Validation (Spatial Block CV) protocol was deployed.
The 76 unique geographic sampling locations (comprising 290 valid images) were clustered into five spatially disjoint, contiguous geographic blocks (designated Blocks A through E) based on natural landscape boundaries and park functional zoning. Each spatial block encompassed 14 to 16 physical locations (54 to 62 images), and spatial buffer zones () were maintained between block centroids to decouple localized spatial dependencies. All directional vista images (0°, 90°, 180°, and 270°) belonging to the same physical sampling node were strictly assigned to the same spatial block, eliminating both repeated-location and neighboring-location data leakage.
The cross-validation proceeded iteratively across five folds: in each fold, four spatial blocks were combined to train the candidate algorithms (Random Forest, XGBoost, and DNN) and calibrate hyperparameters via Bayesian optimization (100 iterations), while the remaining spatially independent block was held out strictly as an out-of-block blind test set. For XGBoost, the optimized hyperparameter search space encompassed maximum tree depth (), learning rate (), number of boosting estimators (), subsample ratio (), column subsampling (), and regularization penalties (). Model performance was averaged across all five held-out spatial blocks to quantify genuine spatial generalizability.
Model predictive accuracy across the four perceptual dimensions (Beauty, Safety, Restoration, and Vibrancy) was evaluated using the out-of-block coefficient of determination (), root mean square error (RMSE), and mean absolute error (MAE):
where denotes the observed perception score, denotes the model-predicted score, represents the mean of observed perception scores, and represents the number of validation test samples.
2.4.4. Model Interpretability via Game-Theoretic SHAP
To improve the interpretability of the optimal machine learning models, SHAP (SHapley Additive exPlanations) was employed to quantify the contributions of different visual environmental factors to spatial perception. Based on cooperative game theory, SHAP calculates the marginal contribution of each input variable across all possible feature subsets [22]:
where represents the full set of eight visual indicators, is a subset excluding indicator , and denotes conditional model expectations.
Compared with conventional feature-importance measures, SHAP not only quantifies the relative importance ranking of visual factors but also reveals the direction, inflection points, and nonlinear patterns of their effects [33]. Accordingly, SHAP summary distributions and partial dependence curves were utilized to identify the key visual drivers and sensitive threshold ranges of green view, water proportion, sky openness, and visual obstruction across demographic cohorts, establishing a quantitative empirical basis for subsequent park landscape optimization.
3. Results
3.1. Quantification of Visual Environmental Attributes in the Park
Based on the deep learning-based semantic segmentation results, the visual environmental attributes at different sampling points within the study area were quantitatively analyzed. As shown in Table 5, all eight visual indicators exhibited a certain degree of spatial heterogeneity, with vegetation, sky, pavement, and water constituting the dominant visual environmental characteristics. The mean values of GVI, SVI, PR, and WR were 0.43, 0.34, 0.28, and 0.16, respectively, indicating that the park was characterized overall by prominent green and waterfront visual features.
Table 5.
Descriptive statistics of visual environmental indicators.
The mean GVI was 0.43, with a maximum of 0.82, while the mean SVI was 0.34, reaching a maximum of 0.78. These results indicate that the study area combined relatively high vegetation visibility with a certain degree of spatial openness, with the two attributes showing a complementary pattern across different spaces. The mean water ratio was 0.16, with a maximum of 0.58 and a CV of 93.75%, indicating pronounced spatial variability. Higher values were mainly observed along the lakeshore, waterways, and waterfront spaces, reflecting the characteristic water-network environment of urban parks in Shaoxing.
The mean values of PR and PaR were 0.28 and 0.19, respectively, indicating a relatively high visual presence of built spaces such as entrances, plazas, and pedestrian paths. Although the mean BR was only 0.07, its CV reached 114.29%, suggesting that buildings and structures were concentrated primarily at specific spatial nodes. The mean FV and VOD were 0.10 and 0.32, respectively, indicating substantial spatial variation in both the visibility of public facilities and the degree of visual obstruction.
Overall, the visual environment of the study area was characterized by high vegetation coverage, abundant water features, and a coexistence of open and enclosed spaces. These characteristics provide a basis for subsequent spatial perception prediction and analysis of age-specific visual responses.
3.2. Performance Validation of Deep Learning-Based Spatial Perception Prediction Models
Based on the visual environmental feature–spatial perception dataset constructed in Section 2.4, RF, XGBoost, and DNN models were separately employed to predict beauty, safety, restoration, and vibrancy, and their predictive performance was compared using cross-validation. Model performance was evaluated using three metrics: , RMSE, and MAE. A higher and lower RMSE and MAE indicate better predictive performance, as shown in Table 6.
Table 6.
Predictive performance of different machine learning models for spatial perception.
The model comparison results showed that XGBoost achieved the best overall performance across the four perception dimensions, with values of 0.81, 0.80, 0.82, and 0.77 for Beauty, Safety, Restoration, and Vibrancy, respectively. Its corresponding RMSE and MAE values were also lower than those of the other models. In contrast, the DNN model showed relatively weaker predictive performance, indicating differences among algorithms in their ability to capture the nonlinear relationships between visual environmental characteristics and spatial perception.
Figure 3 presents the scatter plots and density distributions of the predicted and observed perception scores for the four dimensions (Beauty, Safety, Restoration, and Vibrancy) based on the optimal XGBoost model and an independent test set. Kernel density estimation was used to visualize the distribution of sample points. An ideal reference dashed line and a linear regression trend line with a 95% confidence interval were also included to assess the agreement between predicted and observed values.
Figure 3.
Scatter plots and density distributions of actual versus XGBoost-predicted scores for the four spatial perception dimensions on the test set.
As shown in Figure 3, the predictions of the optimal model generally followed the distribution of the observed values, indicating that the visual environmental indicators effectively explained variations in spatial perception. Among the four perception dimensions, Restoration and Beauty showed the highest prediction accuracy, with values of 0.82 and 0.81, respectively. In contrast, Vibrancy exhibited relatively larger prediction errors (), suggesting that different perceptual dimensions vary in their responses to visual environmental characteristics.
Considering both predictive performance and model stability, XGBoost was selected as the basis for subsequent SHAP analysis to identify the relative contributions of different visual environmental attributes and characterize their nonlinear effects on spatial perception.
3.3. Spatial Distribution Patterns and Spatial Heterogeneity of Spatial Perception
Based on the spatial perception predictions generated by the optimal machine learning model (XGBoost), the predicted scores for Beauty, Safety, Restoration, and Vibrancy at each sampling point were mapped onto their corresponding spatial locations within the study area to generate spatial distribution maps for the four perception dimensions. The results showed that all four perceptual dimensions exhibited pronounced spatial heterogeneity within the park, with substantial differences in perception levels across different spatial nodes, as shown in Figure 4.
Figure 4.
Spatial distribution and heterogeneity of the four perceptual dimensions across Guazhu Lake Park.
In terms of spatial distribution, the four perceptual dimensions exhibited pronounced spatial heterogeneity. High-value areas for beauty were concentrated along the waterfront greenbelts and landscape zones with rich plant communities (>3.8 points), whereas low-value areas were predominantly situated at entrance plazas characterized by high pavement ratios and monotonous landscapes (<2.6 points). Safety scored high at spatial nodes featuring open sightlines and clustered amenities, such as open lawns and primary path intersections (>3.9 points), while heavily obstructed forest corners and shadowed park edges received lower ratings (<2.5 points). High-value clusters for restoration were significantly aggregated along waterfront greenways and tranquil tree-lined paths with elevated Green View Index (GVI) and Water Ratio (WR) values (>4.0 points). Conversely, vibrancy was strongly associated with open spaces endowed with high paved road ratios (PaR) and facility visibility (FV), such as central activity plazas and fitness/playground nodes (>3.7 points).
To further identify internal spatial deficits and exemplary benchmark nodes within the park, spatial zones were classified using quartile thresholds derived from the predicted scores of each perception dimension, as shown in Figure 5. Specifically, spatial nodes with scores below the 25th percentile () were delineated as “Spatial Deficit Areas,” whereas those scoring above the 75th percentile () were defined as “High-Perception Benchmark Areas.”
Figure 5.
Identification of high-perception benchmark zones and low-perception deficit.
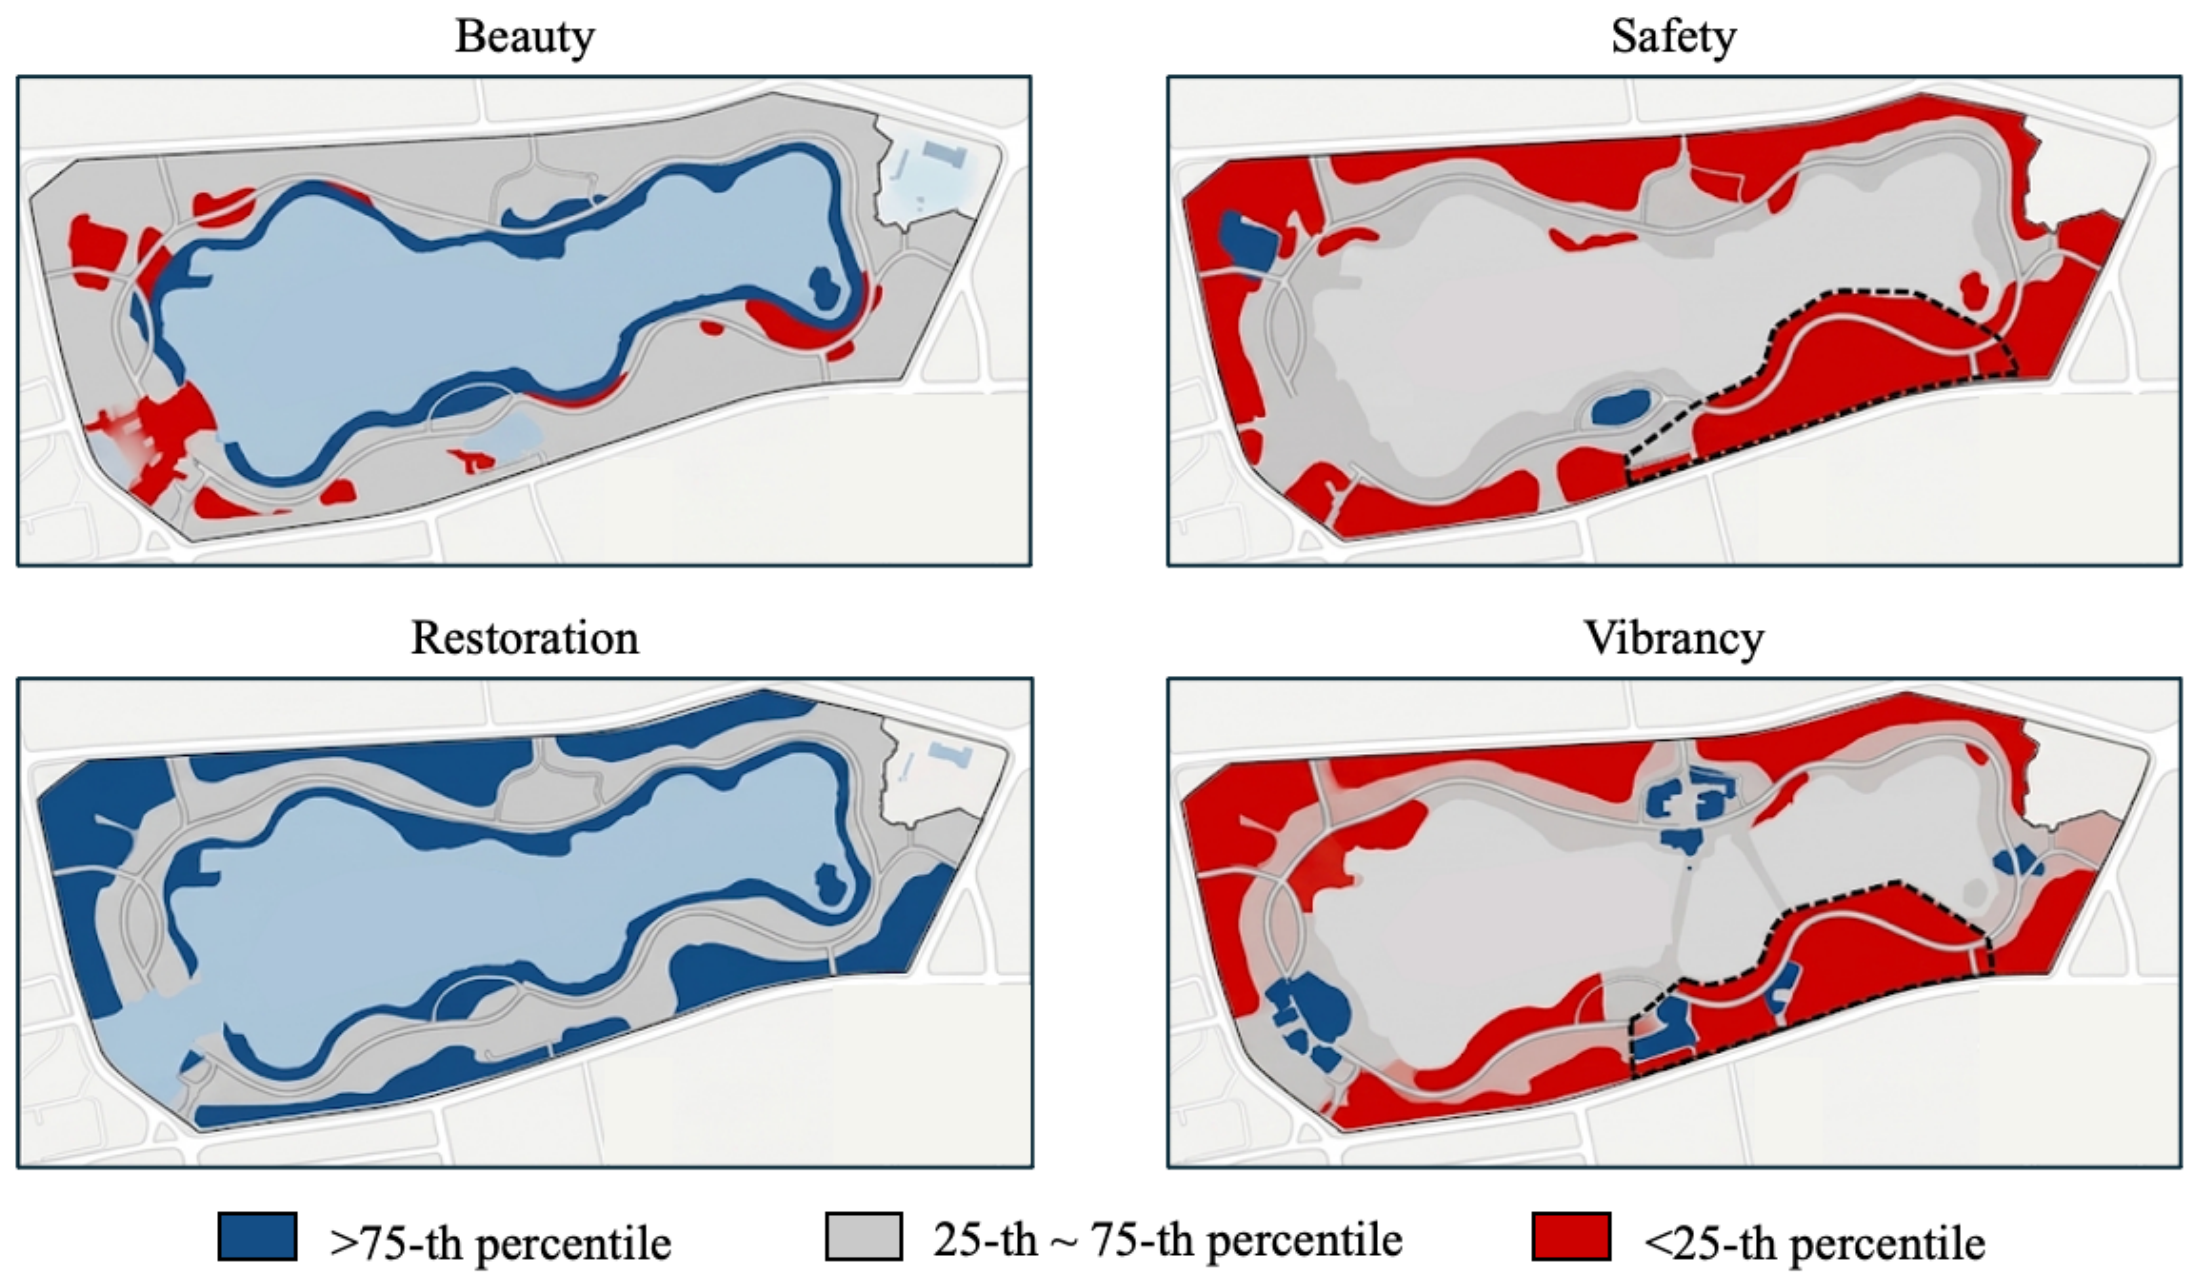
The results showed that the high- and low-value areas of the different perceptual dimensions did not completely overlap, indicating that no single visual environmental attribute can simultaneously satisfy diverse spatial perception needs. For example, some waterfront woodland spaces exhibited high levels of Beauty and Restoration, but their Safety scores were relatively low due to visual obstruction caused by dense vegetation (high VOD) and limited visibility of lighting and resting facilities (low FV). In contrast, some activity plazas showed high Vibrancy and spatial openness, but their Restoration and perceived natural Beauty were constrained by excessive pavement (high PR) and low vegetation visibility (low GVI), particularly under hot and strongly illuminated conditions.
Overall, spatial perception in urban parks exhibited pronounced local clustering and multidimensional heterogeneity. Different areas demonstrated distinct strengths and deficiencies in Beauty, Safety, Restoration, and Vibrancy. These spatial patterns provide a basis for further using SHAP analysis to identify the mechanisms through which visual environmental factors influence perception and to develop targeted, quantitative strategies for micro-scale landscape optimization.
3.4. Driving Mechanisms of Visual Attributes on Spatial Perception and Age-Related Heterogeneity
Based on the optimal machine learning model (XGBoost), SHAP (SHapley Additive exPlanations) was further employed to quantify the contributions of the eight visual environmental attributes to different perceptual dimensions and to compare response differences among Children, Adults, and Older Adults, as shown in Figure 6, Figure 7 and Figure 8. The SHAP analysis simultaneously captured the relative importance, direction, and nonlinear effects of each visual attribute on spatial perception.
Figure 6.
Relative importance of visual environmental attributes in predicting spatial perception for the Children Group.
Figure 7.
Relative importance of visual environmental attributes in predicting spatial perception for the Adults Group.
Figure 8.
Relative importance of visual environmental attributes in predicting spatial perception for the Older Adults Group.
The results revealed pronounced age-related heterogeneity in perceptual sensitivity to visual attributes. Children were most sensitive to GVI, FV, and WR, reflecting their greater need for natural richness and accessible recreational facilities. Adults showed stronger responses to GVI, SVI, and WR, suggesting a preference for open natural landscapes and psychologically restorative environments, as shown in Table 7. Older Adults were most responsive to VOD, FV, and SVI, with the negative effect of visual obstruction and the visibility of resting facilities being particularly prominent.
Table 7.
SHAP-based ranking of visual attributes across age groups (top three dominant attributes).
Further analysis using SHAP dependence plots enables the identification of non-linear response characteristics and threshold effects between visual environmental indicators and spatial perceptions. As illustrated in Figure 9, critical visual indicators exhibited pronounced non-linear responses and threshold effects across perceptual dimensions. The Green View Index (GVI) significantly enhanced perceived beauty and restoration within the range of 0.10–0.45; however, its marginal gains saturated beyond 0.50, and an excessively high GVI (>0.55) combined with vegetation occlusion tended to trigger a decline in perceived safety among older adults. Water Ratio (WR) demonstrated the strongest positive driving effect within the 0.00–0.25 interval before plateauing after 0.30. View Obstruction Degree (VOD) exerted a continuous negative inhibition on safety, with this adverse effect accelerating markedly for older adults once VOD exceeded 0.30. Although moderate Pavement Ratio (PR, <0.20) contributed to elevating perceived vibrancy, levels exceeding 0.40 significantly suppressed psychological restoration. Overall, the SHAP dependence analysis unravels the non-linear sensitivity intervals of visual elements alongside distinct age-group heterogeneities, providing empirical data support for formulating age-inclusive, quantitative landscape optimization strategies.
Figure 9.
SHAP dependence plots and threshold effects across all four perceptual dimensions and five visual indicators.
4. Discussion
4.1. Environmental Psychological Interpretation of Age-Specific Perceptual Needs
The results indicate that the relationship between the visual environment of urban parks and spatial perception is not simply linear, and that different visual elements exert differentiated effects on beauty, safety, restoration, and vibrancy. This finding is generally consistent with theories of environmental psychology. According to Attention Restoration Theory (ART), natural landscapes can reduce directed-attention demands and promote psychological restoration through naturalness, richness, and moderate fascination. Accordingly, higher GVI and appropriate water visibility may enhance perceptions of beauty and restoration. However, when vegetation becomes excessively dense and creates substantial visual obstruction, its positive effects may diminish, suggesting that greater naturalness does not necessarily produce greater restorative benefits.
From the perspective of Prospect–Refuge Theory, high-quality park spaces generally require a balance between visual openness and moderate enclosure. Higher SVI provides greater visual depth and spatial visibility, whereas excessive VOD may restrict visual continuity and reduce perceived safety. Nevertheless, completely open spaces may also weaken privacy and spatial hierarchy. Therefore, an appropriate range may exist between visual openness and visual obstruction.
Differences among age groups further indicate that spatial perception is influenced by life-stage-specific needs. Children may be more sensitive to the visual richness created by water, vegetation, and recreational facilities. Adults tend to place greater emphasis on natural landscapes, spatial openness, and environmental comfort, whereas Older Adults are more sensitive to safety-related factors such as visual transparency and facility visibility. These differences suggest that urban park landscape optimization should not rely on a single visual standard, but should instead incorporate differentiated design strategies according to the spatial needs of different age groups.
Overall, the findings demonstrate that effective optimization of park visual environments does not simply involve increasing vegetation coverage or expanding open space. Rather, it requires an appropriate combination of vegetation, water, spatial openness, facility visibility, and visual obstruction to create environments that integrate naturalness, legibility, and perceived safety.
4.2. Research Innovations and Methodological Comparison
Compared with traditional urban park spatial perception studies that primarily rely on on-site questionnaires, this study integrates deep learning image recognition, spatial perception evaluation, and explainable machine learning, establishing a complete analytical framework from visual environment quantification to perception prediction and driving-mechanism identification. Traditional questionnaire-based methods can effectively capture residents’ subjective evaluations, but visual environmental variables often depend on manual surveys or expert judgment, resulting in relatively low efficiency and strong subjectivity. In contrast, this study uses semantic segmentation to transform park images into quantifiable indicators, such as GVI, SVI, water ratio, pavement ratio, and visual obstruction degree, thereby improving the objectivity and reproducibility of visual environmental assessment.
Compared with large-scale street-view studies, this study further focuses on micro-spatial nodes within urban parks. Due to their strong landscape heterogeneity, parks contain substantial visual differences among waterfront spaces, understory spaces, activity plazas, and resting nodes that are difficult to fully capture using conventional road-based street-view data. Spatial analysis based on sampling-point images therefore enables more precise identification of high-perception areas and spatial deficiencies within parks.
Furthermore, this study goes beyond model prediction accuracy by introducing SHAP-based explainable analysis to identify the relative contribution, influence direction, and nonlinear response characteristics of visual environmental factors, while incorporating Children, Adults, and Older Adults into the comparative framework. Consequently, the study not only addresses “which visual factors influence spatial perception”, but also further examines “which factors different age groups are sensitive to and within what ranges these factors exert their effects.”
Overall, the methodological advantages of this study are reflected in four aspects: micro-spatial research scale, automated quantification of visual elements, explainable perception prediction, and age-heterogeneity analysis. This framework provides a new data-driven pathway for advancing urban park spatial perception assessment from subjective description toward quantitative analysis, mechanism interpretation, and fine-grained landscape optimization.
4.3. Research Limitations
Although this study establishes an urban park spatial perception assessment framework based on deep learning image recognition and explainable machine learning, several limitations remain. First, the analysis is primarily based on static visual images, and the visual environmental indicators and perception evaluations cannot fully capture the effects of non-visual environmental factors, such as soundscape, odor, temperature and humidity, and air quality. Second, the study data were mainly collected during a specific season and time period. Seasonal vegetation changes, weather conditions, and diurnal variations may alter both the visual environment and spatial perception; therefore, the seasonal applicability of the findings requires further validation.
In addition, this study uses cross-sectional data to examine the relationship between visual environmental characteristics and spatial perception. Although machine learning and SHAP can identify important visual factors and their nonlinear response patterns, they cannot fully establish causal relationships. Differences in sample size and individual characteristics among age groups may also affect the robustness of the model results. Future research could conduct continuous sampling across multiple seasons and time periods and integrate on-site environmental monitoring, soundscape data, and long-term behavioral trajectories to develop a more dynamic and multisensory framework for urban park spatial perception assessment.
5. Landscape Optimization Strategies
5.1. Data-Driven Guidelines for Micro-Landscape Parameter Control
Based on the SHAP feature importance and nonlinear response analysis, this study further translates the quantified visual environmental indicators into operational landscape planning and design parameters, as shown in Table 8. Unlike traditional qualitative design approaches that primarily rely on subjective experience, the proposed guidelines use the sensitive inflection points and saturation ranges identified by the explainable machine learning model as the basis for micro-spatial regulation. By further incorporating the perceptual heterogeneity of different age groups, the study establishes quantitative landscape control thresholds for age-inclusive park environments.
Table 8.
Optimization Ranges of Key Visual Environmental Indicators Based on Spatial Perception Responses.
Specific control thresholds were rigorously established based on the inflection points and sensitivity intervals identified in the SHAP dependence plots in Section 3.4. Specifically:
- Green View Index (GVI) Regulation: When GVI reached 35–45%, its positive marginal gains on perceived beauty and restoration were the most pronounced. Beyond 50%, these gains plateaued markedly; moreover, when accompanied by dense shrub obstruction, elevated GVI triggered safety concerns among older adults. Consequently, the 35–45% range is designated as the baseline benchmark for park-wide planting design.
- Sightline Permeability Control: When VOD exceeded 30%, the SHAP contribution to perceived safety among older adults exhibited a precipitous decline. Therefore, the landscape design must strictly cap view obstruction below 30% by pruning or removing dense, obstructing hedges within the eye-level zone (0.8–1.8 m), thereby establishing clear visual corridors.
- Waterfront Interface Optimization: According to the logarithmic growth response curve of WR, maintaining water visibility within the 20–25% range yields the maximum psychological restoration benefit, while preventing the sense of detachment from waterfront activities that can result from excessively expansive water bodies.
It should be emphasized that the aforementioned visual elements should not be regulated in isolation; rather, a “multi-element synergistic control” framework must be implemented according to the specific functional zoning of each microspace:
- Waterfront Recreation Spaces: Prioritize the combination of high WR (20–25%) + moderate GVI (35–45%) + moderate SVI (15–30%) + minimal VOD (<20%) to maximize environmental stress relief and emotional restoration efficacy.
- Child-Exclusive Activity Spaces: Emphasize the configuration of high FV (15%) + moderate PR (15–25%) + minimal VOD (<20%), ensuring rich activity variety and engaging play facilities while maintaining unobstructed sightlines for parental supervision.
- Age-Friendly Restorative Spaces: Prioritize the combination of strictly controlled VOD (<25%) + enhanced FV (dense, highly visible benches) + moderate SVI (ample sunlight and openness) to substantially elevate perceived spatial safety and a sense of belonging among older adults.
Consequently, this paradigm facilitates a transition from conventional qualitative heuristics to a fully integrated, data-driven framework encompassing “visual indicators–sensitive threshold intervals–perception dimensions–microspace design.”
5.2. Fine-Grained Micro-Renovation Strategies for Spatial Deficiencies
Based on the low-perception areas identified in Section 3.3 and the visual-factor driving results obtained in Section 3.4, corresponding micro-renovation measures are proposed for different types of spatial deficiencies. The optimization focuses not on large-scale changes to the overall park layout, but on improving spatial perception through localized adjustments to plant configuration, visual organization, waterfront interfaces, and facility layout.
For low-safety areas, particular attention should be given to spaces characterized by high VOD and low FV. In forest corners, narrow pathways, and areas with excessive vegetation enclosure, low-level shrubs and overly dense branches can be selectively thinned to establish continuous visual corridors. At the same time, the visibility of facilities such as seating, lighting, and signage should be improved to reduce visual blind spots. While maintaining the integrity of the vegetation landscape, the spatial relationship of “moderate enclosure–visual continuity–facility visibility” should be established.
For low-restoration areas, the primary focus should be on addressing insufficient natural visual elements and excessive hardscape. Multi-layered vegetation consisting of trees, shrubs, and groundcover can be introduced, together with plants featuring seasonal variation, while visual connections with rivers and lakes can be strengthened to increase GVI and maintain an appropriate WR. In areas dominated by extensive hard pavement, localized softening can be achieved through permeable paving, integrated planting, and small-scale resting nodes.
For low-beauty areas, the emphasis should be placed on improving monotonous visual composition and insufficient landscape layering. Vegetation communities can be reorganized, waterfront landscapes enhanced, and built interfaces refined to increase visual richness, while excessive PR and BR should be controlled. For low-vibrancy areas, seating, fitness equipment, and children’s activity facilities can be introduced according to spatial location to increase FV, while improving the connections between pathways and activity spaces can further enhance spatial accessibility.
Overall, micro-renovation should adopt differentiated interventions according to the perceptual deficiencies of individual areas, translating the key visual indicators identified by the model into specific adjustments to vegetation, water features, paving, and facilities, thereby shifting landscape optimization from “problem identification” to “targeted improvement.”
5.3. Park Spatial Zoning and Optimization Guidelines for All-Age Needs
Based on the SHAP importance rankings and response differences among different age groups, park spatial optimization should shift from a unified design approach toward age-inclusive and differentiated configuration. Considering the primary perceptual needs of Children, Adults, and Older Adults, park spaces can be categorized into children-oriented activity spaces, adult-oriented leisure spaces, and older-adult-friendly spaces, with differentiated optimization strategies implemented according to their respective visual environmental characteristics.
Children-oriented spaces should prioritize visual richness, activity-facility visibility, and unobstructed supervision. GVI and FV should be appropriately increased while VOD is controlled to avoid continuous visual obstruction caused by tall shrubs or built structures. The combination of water, vegetation, and activity facilities can further enhance spatial interest and visual stimulation.
Adult-oriented spaces can be primarily located in waterfront areas, understory spaces, and open green areas. A relatively high GVI, together with appropriate SVI and WR, can create a leisure environment that combines naturalness and spatial openness. For activity spaces such as fitness trails and waterfront paths, the continuity between vegetation and pedestrian circulation should be strengthened to maintain vibrancy while providing opportunities for psychological restoration.
Older-adult-friendly spaces should prioritize perceived safety and spatial legibility. VOD should be reduced while SVI and FV are enhanced, ensuring good visual accessibility to resting facilities, entrances, and pedestrian paths. Continuous vegetation and waterfront landscapes can also be incorporated to improve restorative qualities while avoiding excessively enclosed spaces or visual blind spots.
Overall, all-age-oriented optimization does not simply mean adding different types of facilities. Instead, it requires the differentiated combination of key visual indicators such as GVI, SVI, WR, FV, and VOD according to the visual sensitivities of different age groups, thereby creating park environments that balance safety, naturalness, restoration, and vibrancy.
6. Conclusions
6.1. Core Findings
By integrating hierarchical Vision Transformer semantic segmentation (SegFormer-B4), standardized multi-age psychometric protocols (), and explainable machine learning with Spatial Block Cross-Validation, this study successfully quantified the complex nonlinear linkages between microscale visual attributes and multi-dimensional spatial perceptions (Beauty, Safety, Restoration, and Vibrancy) in Guazhu Lake Park. The key empirical findings are as follows:
Dominance of Natural Elements and Saturation Thresholds: The Green View Index (GVI) and Water Ratio (WR) emerged as the primary positive drivers for visual beauty and psychological restoration across all demographic groups. However, explainable SHAP partial dependence curves identified clear non-linear saturation thresholds: restorative benefits plateau when GVI exceeds approximately 35–40%, while excessive vegetation density without adequate visual clearance leads to heightened obstruction and diminished perceived safety.
Divergent Demographic Sensitivities: Multi-age comparisons revealed pronounced life-stage perceptual heterogeneity. Children demonstrated the highest sensitivity to Facility Visibility (FV) and dynamic interactive water edges, aligning with physical affordance needs; older adults placed paramount importance on unobstructed sightlines (Visual Obstruction Degree, ) and clearly defined pedestrian paths (PaR), corroborating safety and postural security requirements under Prospect–Refuge principles; working-age adults exhibited balanced preferences for open sky vistas (SVI 25–40%) that alleviate cognitive fatigue.
6.2. Theoretical and Methodological Contributions
This research provides significant theoretical and methodological advancements to the disciplines of urban landscape architecture, environmental psychology, and computational urban design:
Methodological Triad Integration: This work operationalizes an end-to-end framework harmonizing standardized psychometric prompt design, state-of-the-art computer vision segmentation, and game-theoretic machine learning. By replacing conventional global-level linear regressions with spatially blocked XGBoost and SHAP interpretations, the framework decodes nuanced non-linear tipping points and threshold boundaries that were previously inaccessible via traditional survey techniques.
Multi-Age Inclusivity Paradigm: While existing urban visual perception studies overwhelmingly rely on homogeneous adult student samples or crowdsourced geotagged imagery, this study empirically bridges the developmental divide by capturing the spatial preferences of children, adults, and older adults within a unified, ethically certified experimental pipeline.
6.3. Research Limitations
Despite its empirical contributions, several intrinsic limitations should be acknowledged:
Temporal and Meteorological Boundaries: Image collection was conducted during stable daylight meteorological windows under clear skies. Seasonal vegetation variations (such as winter defoliation versus summer lushness), nocturnal lighting dynamics, and inclement weather conditions (e.g., rain or overcast days) were not captured, which may alter visual openness and perceptual safety.
Visual Proxy vs. Multisensory Experience: While visual information constitutes over 80% of human environmental perception, real-world park experiences are intrinsically multisensory. Acoustic landscape elements (e.g., birdsong, wind, water murmurs, or urban traffic noise), microclimatic thermal sensations, and tactile material qualities were not modeled in the current photographic dataset.
Geographic and Cultural Specificity: The empirical investigation was rooted in a representative Jiangnan water-town park in Shaoxing, China. While the methodological pipeline is universally transferable, specific numeric threshold values may reflect regional landscape preferences and could exhibit subtle variations in arid inland parks or distinct socio-cultural contexts.
6.4. Avenues for Future Research
Building upon these findings, future research will pursue several prospective trajectories:
Multimodal and Multisensory Sensor Fusion: Future investigations will couple computer vision with wearable physiological sensors (e.g., mobile eye-tracking, galvanic skin response, portable EEG) and synchronized acoustic monitors to capture dynamic, real-time physiological restoration during continuous pedestrian movement.
Longitudinal and Multi-Season Monitoring: Implementing multi-temporal data acquisition across all four seasons will enable researchers to model dynamic phenological changes and establish resilient landscape design guidelines across varying climatic cycles.
Generative AI Closed-Loop Design Systems: Integrating explainable SHAP threshold parameters directly into generative computer-aided landscape design (such as diffusion-based generative inpainting and 3D parametric landscape modeling) will establish closed-loop, automated workflows from diagnostic spatial evaluation to generative design optimization.
Author Contributions
Conceptualization, W.C. and M.I.B.A.M.; methodology, W.C. and M.K.A.B.M.S.; software, W.C.; validation, W.C., M.K.A.B.M.S. and Y.M.; formal analysis, W.C.; investigation, W.C. and Y.M.; resources, M.I.B.A.M.; data curation, W.C. and Y.M.; writing—original draft preparation, W.C.; writing—review and editing, M.I.B.A.M. and M.K.A.B.M.S.; visualization, W.C. and Y.M.; supervision, M.I.B.A.M.; project administration, M.I.B.A.M. All authors have read and agreed to the published version of the manuscript.
Funding
This research received no funding.
Data Availability Statement
Dataset available on request from the authors.
Conflicts of Interest
The authors declare no conflict of interest.
References
- Reyes-Riveros, R.; Altamirano, A.; De La Barrera, F.; Rozas-Vásquez, D.; Vieli, L.; Meli, P. Linking public urban green spaces and human well-being: A systematic review. Urban For. Urban Green. 2021, 61, 127105. [Google Scholar] [CrossRef] [Scilit]
- Chen, K.; Zhang, T.; Liu, F.; Zhang, Y.; Song, Y. How does urban green space impact residents’ mental health: A literature review of mediators. Int. J. Environ. Res. Public Health 2021, 18, 11746. [Google Scholar] [CrossRef] [Scilit] [PubMed]
- Kwon, O.H.; Hong, I.; Yang, J.; Wohn, D.Y.; Jung, W.S.; Cha, M. Urban green space and happiness in developed countries. EPJ Data Sci. 2021, 10, 28. [Google Scholar] [CrossRef] [Scilit] [PubMed]
- Lynch, K. The Image of the City; MIT Press: Cambridge MA, USA, 1960; p. 208. [Google Scholar]
- Kaplan, R.; Kaplan, S. The Experience of Nature: A Psychological Perspective; Cambridge University Press: Cambridge, UK, 1989. [Google Scholar]
- Appleton, J. The Experience of Landscape; John Wiley: New York, NY, USA, 1975. [Google Scholar]
- Van Nes, A.; Yamu, C. Introduction to Space Syntax in Urban Studies; Springer: Cham, Switzerland, 2021. [Google Scholar]
- Soga, M.; Evans, M.J.; Tsuchiya, K.; Fukano, Y. A room with a green view: The importance of nearby nature for mental health during the COVID-19 pandemic. Ecol. Appl. 2021, 31, e2248. [Google Scholar] [CrossRef] [Scilit] [PubMed]
- Palliwoda, J.; Priess, J.A. What do people value in urban green? Linking characteristics of urban green spaces to users’ perceptions of nature benefits, disturbances, and disservices. Ecol. Soc. 2021, 26, 28. [Google Scholar] [CrossRef] [Scilit]
- Teeuwen, R.; Milias, V.; Bozzon, A.; Psyllidis, A. How well do NDVI and OpenStreetMap data capture people’s visual perceptions of urban greenspace? Landsc. Urban Plan. 2024, 245, 105009. [Google Scholar] [CrossRef] [Scilit]
- Yu, Y.; Huang, G.; Sun, D.; Dewancker, B. Exploring Subjective Perception of Urban Street Environments Based on Street View Images and Machine Learning: A Review. J. Asian Urban Environ. 2024, 2024, 79. [Google Scholar]
- Li, K. Research on the factors influencing the spatial quality of high-density urban streets: A framework using deep learning, street scene images, and principal component analysis. Land 2024, 13, 1161. [Google Scholar] [CrossRef] [Scilit]
- Xie, E.; Wang, W.; Yu, Z.; Anandkumar, A.; Alvarez, J.M.; Luo, P. SegFormer: Simple and efficient design for semantic segmentation with transformers. Adv. Neural Inf. Process. Syst. 2021, 34, 12077–12090. [Google Scholar]
- Cheng, B.; Misra, I.; Schwing, A.G.; Kirillov, A.; Girdhar, R. Masked-attention mask transformer for universal image segmentation. In Proceedings of the 2022 IEEE/CVF Conference on Computer Vision and Pattern Recognition (CVPR); IEEE: New York, NY, USA, 2022; pp. 1280–1289. [Google Scholar]
- Xia, Y.; Yabuki, N.; Fukuda, T. Sky view factor estimation from street view images based on semantic segmentation. Urban Clim. 2021, 40, 100999. [Google Scholar] [CrossRef] [Scilit]
- Zhang, F.; Zhou, B.; Liu, L.; Liu, Y.; Fung, H.H.; Lin, H.; Ratti, C. Measuring human perceptions of a large-scale urban region using machine learning. Landsc. Urban Plan. 2018, 180, 148–160. [Google Scholar] [CrossRef] [Scilit]
- Zhang, T.; Wang, L.; Hu, Y.; Zhang, W.; Liu, Y. Measuring urban green space exposure based on street view images and machine learning. Forests 2024, 15, 655. [Google Scholar] [CrossRef] [Scilit]
- Zhao, X.; Lin, G. Research on the perception evaluation of urban green spaces using panoramic images and deep learning: A case study of Zhujiang park in Guangzhou. Landsc. Archit. Front. 2024, 12, 7–18. [Google Scholar] [CrossRef] [Scilit]
- Kang, W.; Kang, N.; Wang, P. Predicting Perceived Restorativeness of Urban Streetscapes Using Semantic Segmentation and Machine Learning: A Case Study of Liwan District, Guangzhou. Buildings 2025, 15, 3671. [Google Scholar] [CrossRef] [Scilit]
- Yang, N.; Deng, Z.; Hu, F.; Chao, Y.; Wan, L.; Guan, Q.; Wei, Z. Urban perception by using eye movement data on street view images. Trans. GIS 2024, 28, 1021–1042. [Google Scholar] [CrossRef] [Scilit]
- Lin, M.; Chau, C.K.; Hou, H.C.; Tang, S.K.; Chung, W.K.; Yu, H.M. Assessing the impact of landscape context on soundscape quality in multifunctional urban open spaces. J. Urban Manag. 2026, 30, 1757–1769. [Google Scholar] [CrossRef] [Scilit]
- Lundberg, S.M.; Lee, S.I. A unified approach to interpreting model predictions. Adv. Neural Inf. Process. Syst. 2017, 30, 4768–4777. [Google Scholar]
- Kuang, B.; Yang, H.; Zhu, Y.; Chang, Z. Explaining urban street perception inequities between residents and tourists using interpretable machine learning. PLoS ONE 2026, 21, e0345073. [Google Scholar] [CrossRef] [Scilit] [PubMed]
- Guan, Y.; Du, X.; Zhao, H. An XGBoost–SHAP Explainable Machine Learning Approach Linking Urban Park Cooling Effects in a Megacity Core to Landscape Features Inside and Outside the Parks. Land 2026, 15, 900. [Google Scholar] [CrossRef] [Scilit]
- Chen, L.; Liu, L.; Liu, Z. Deep Learning-Based Aesthetic Perception of Spring Zone Street View Images: A Case Study of Jinan Mingfu City Area. Buildings 2026, 16, 2925. [Google Scholar] [CrossRef] [Scilit]
- Yin, S.; Kasraian, D.; van Wesemael, P. Children and urban green infrastructure in the digital age: A systematic literature review. Int. J. Environ. Res. Public Health 2022, 19, 5906. [Google Scholar] [CrossRef] [Scilit] [PubMed]
- Wu, S.; Chen, J.; Song, J.; Pan, C.; Li, E. Assessment of Elderly-Oriented Spatial Visual Quality in Pocket Parks: A New Method Based on Panoramic Semantic Segmentation. Res. Sq. 2026. [Google Scholar] [CrossRef] [Scilit] [PubMed]
- Song, Q.; Tian, S.; Zheng, L.; Zheng, Y.; Qiu, L.; Huang, B.; Van Ameijde, J. Beyond sentiment: Using large language models to decode multidimensional urban park perceptions for enhanced equality. Landsc. Urban Plan. 2026, 268, 105571. [Google Scholar] [CrossRef] [Scilit]
- Owais, M.; Salah, A. From Perception to Prediction: Modeling Pedestrian Satisfaction Using Multilevel Statistical and Sensitivity Methods. Transp. Res. Rec. 2026, 03611981261429469. [Google Scholar] [CrossRef] [Scilit]
- Breiman, L. Random forests. Mach. Learn. 2001, 45, 5–32. [Google Scholar] [CrossRef] [Scilit]
- Chen, T.; Guestrin, C. Xgboost: A scalable tree boosting system. In Proceedings of the 22nd Acm Sigkdd International Conference on Knowledge Discovery and Data Mining, San Francisco, CA, USA, 13–17 August 2016; pp. 785–794. [Google Scholar]
- LeCun, Y.; Bengio, Y.; Hinton, G. Deep learning. Nature 2015, 521, 436–444. [Google Scholar] [CrossRef] [Scilit] [PubMed]
- Lundberg, S.M.; Erion, G.G.; Lee, S.I. Consistent individualized feature attribution for tree ensembles. arXiv 2018, arXiv:1802.03888. [Google Scholar]
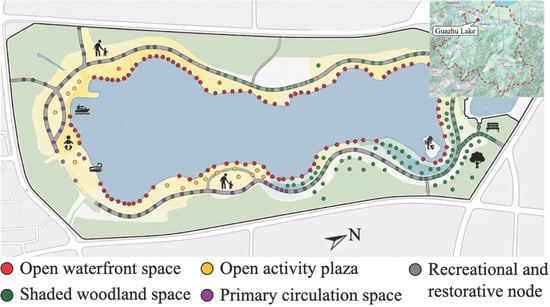
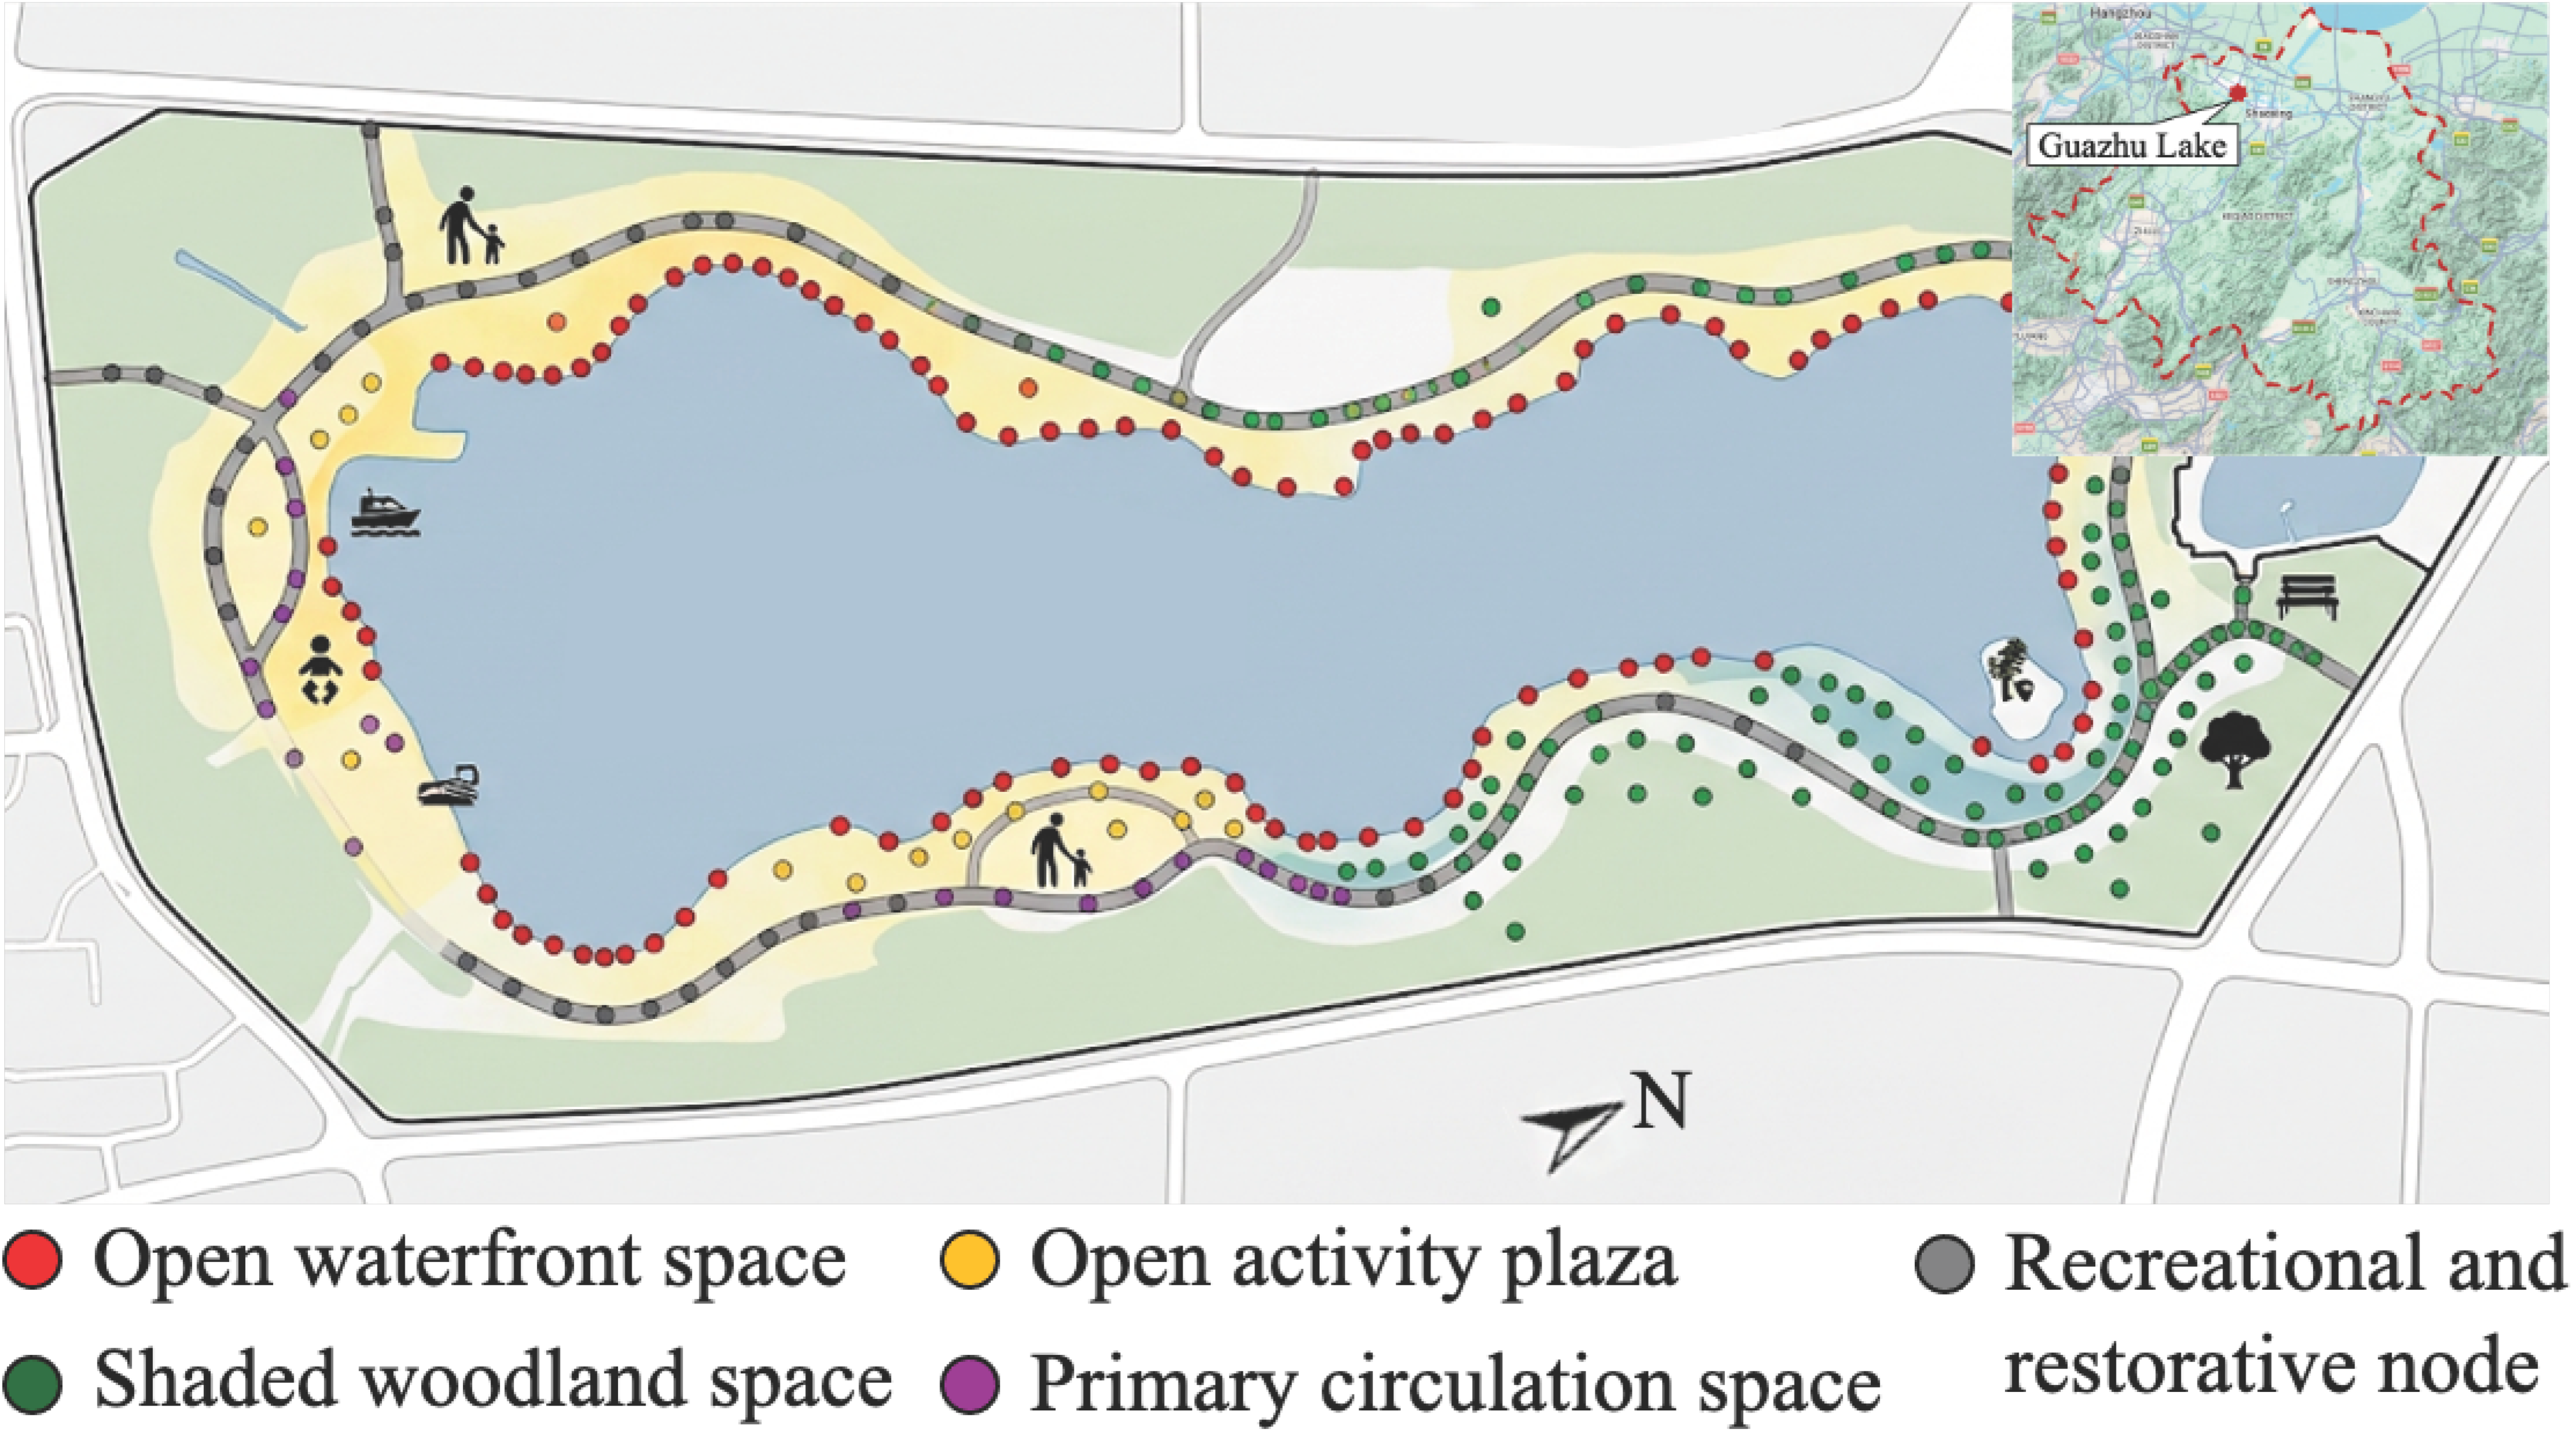
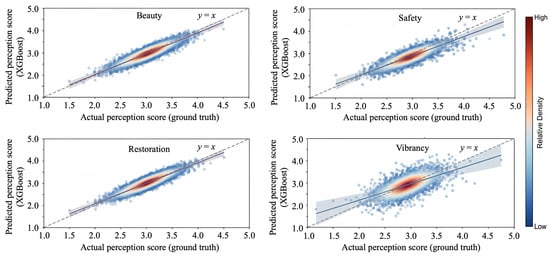
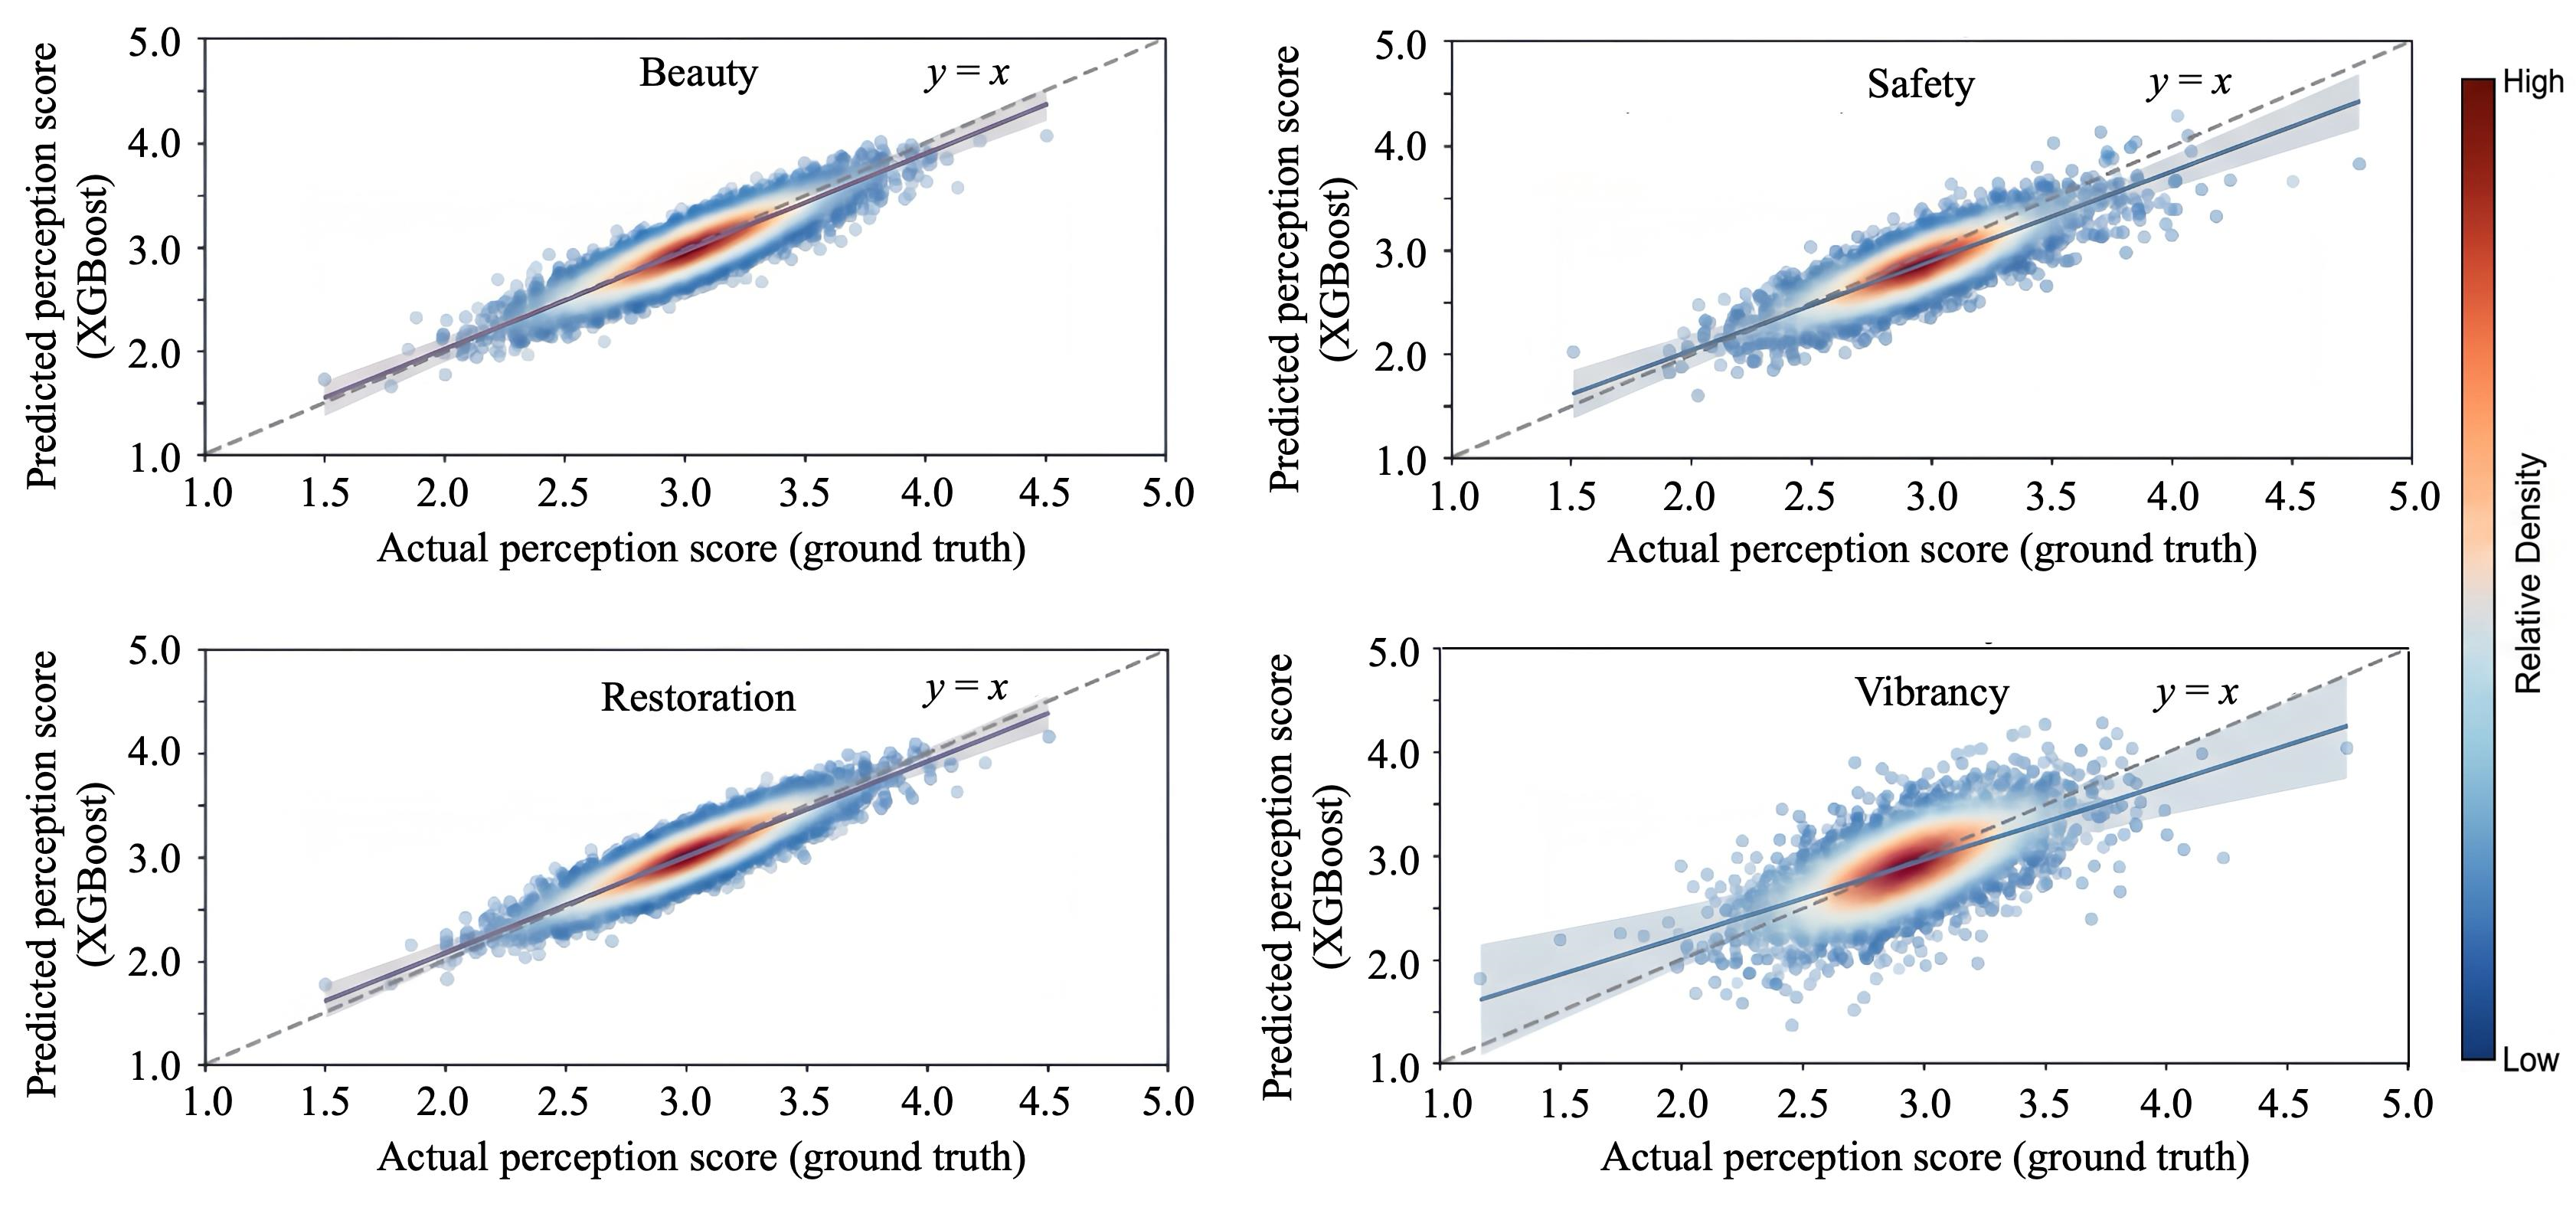
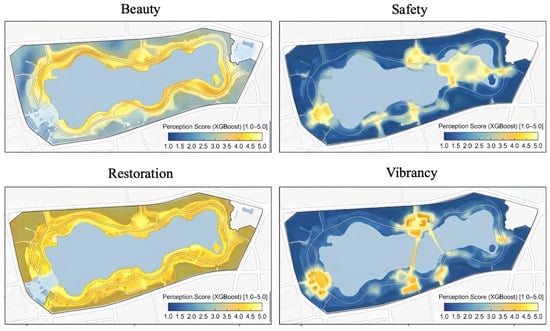
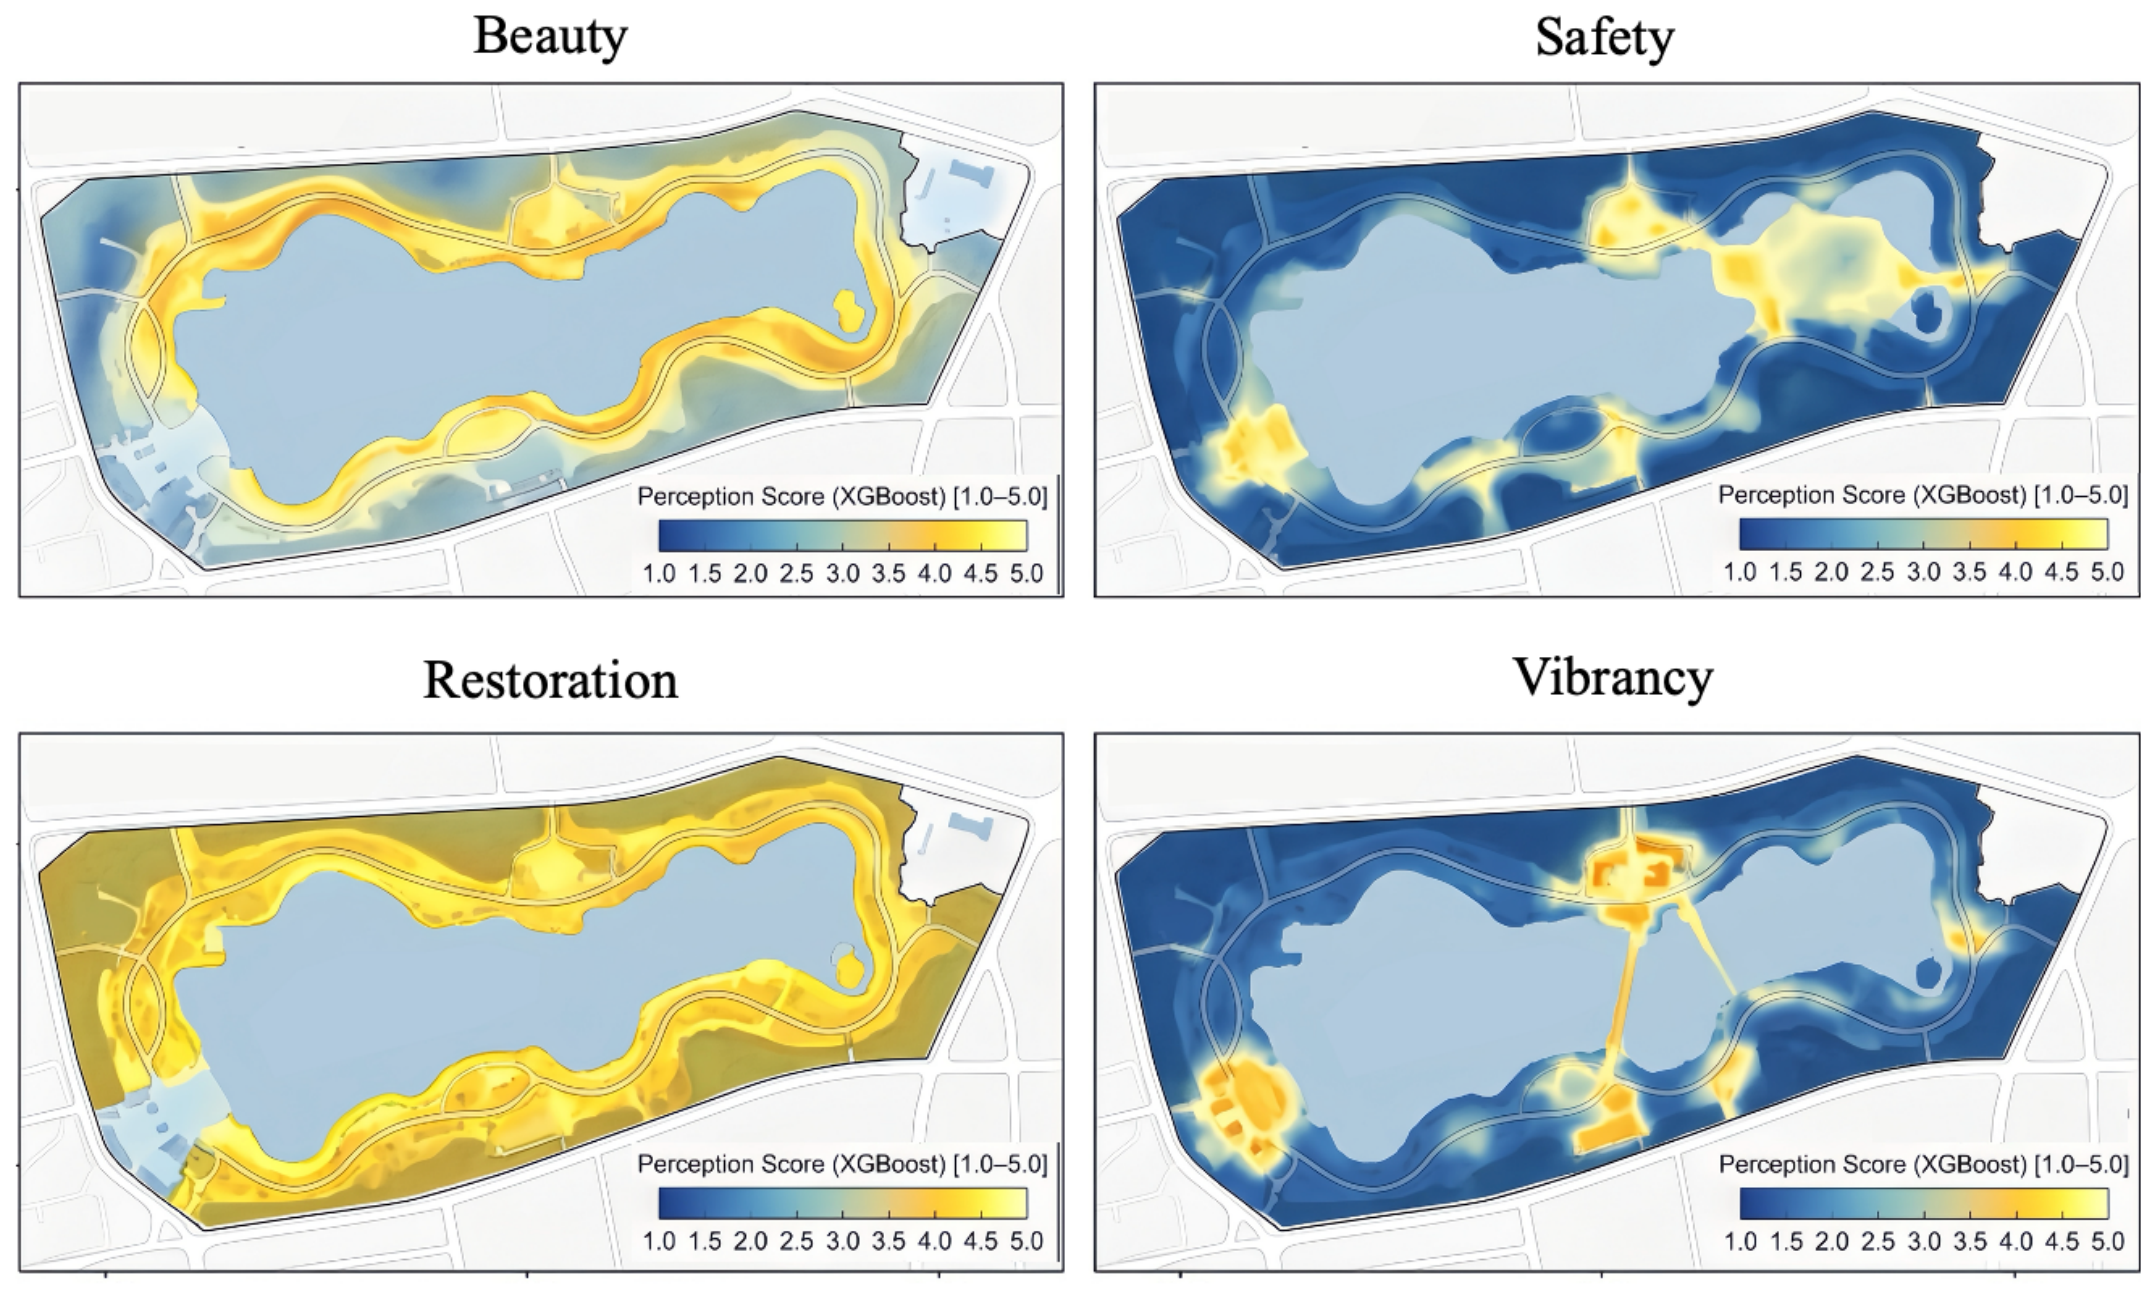
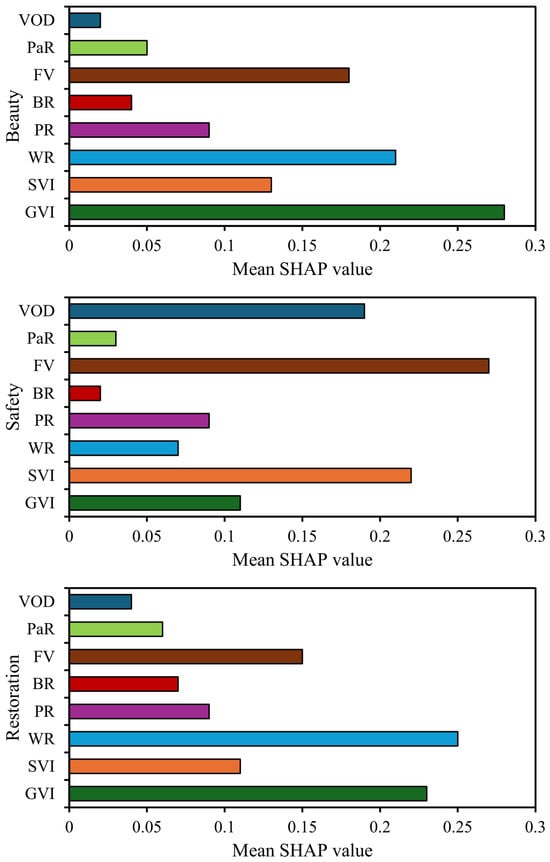
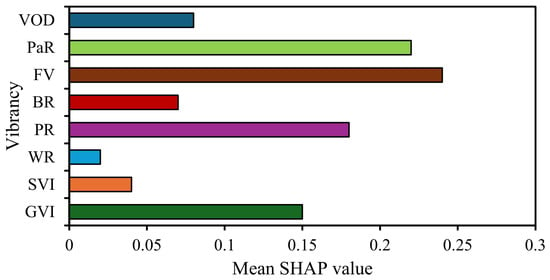
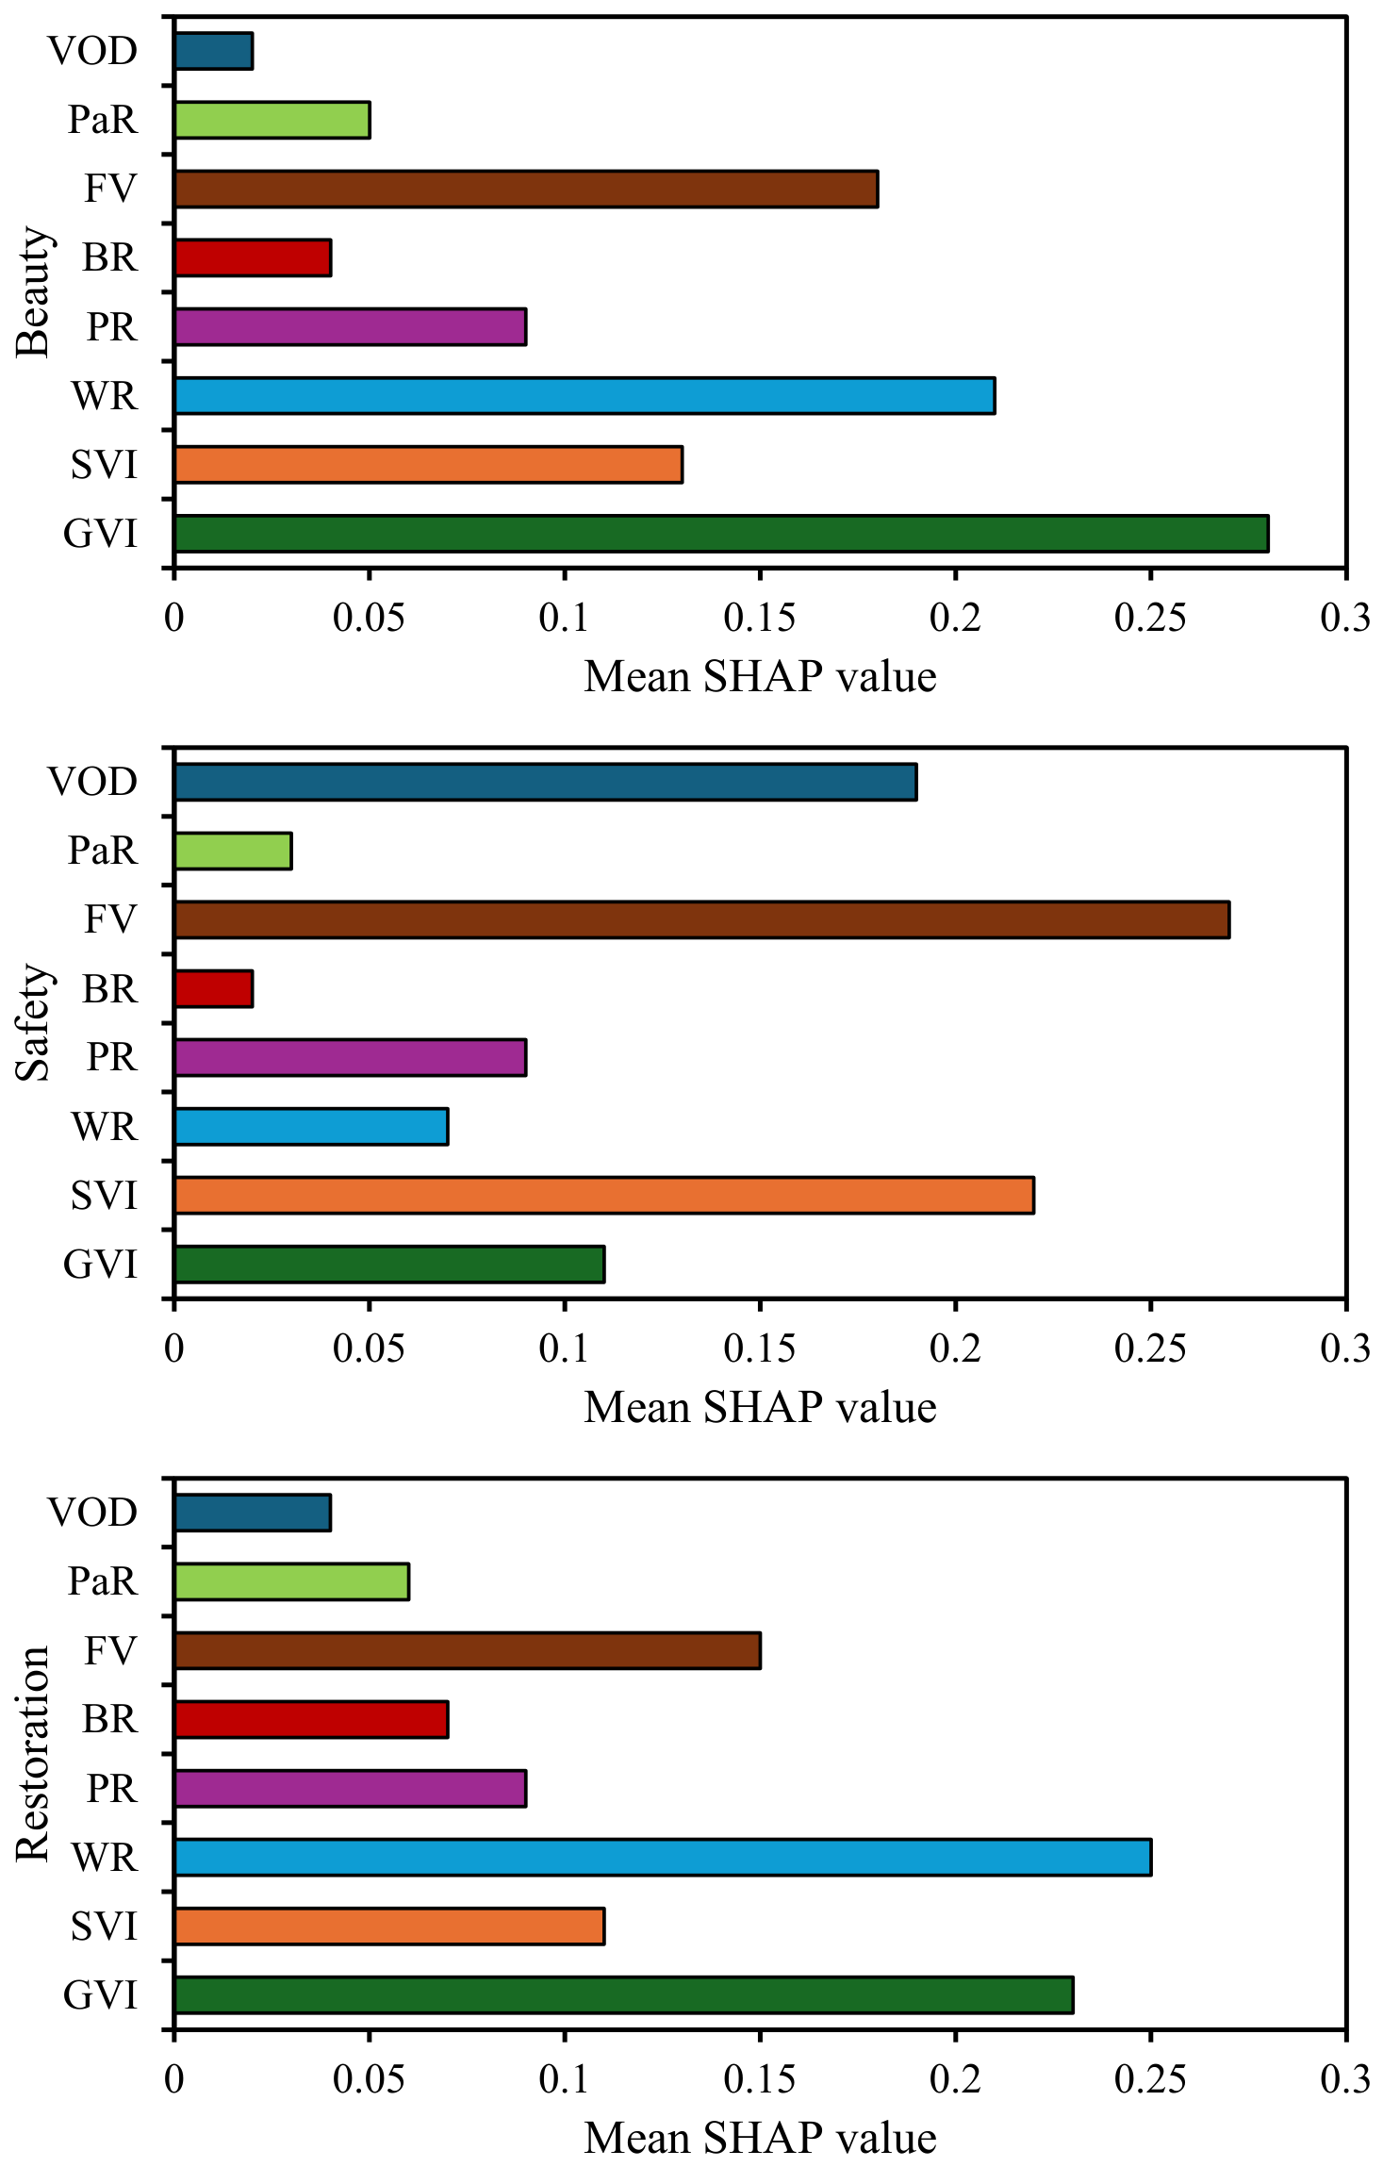
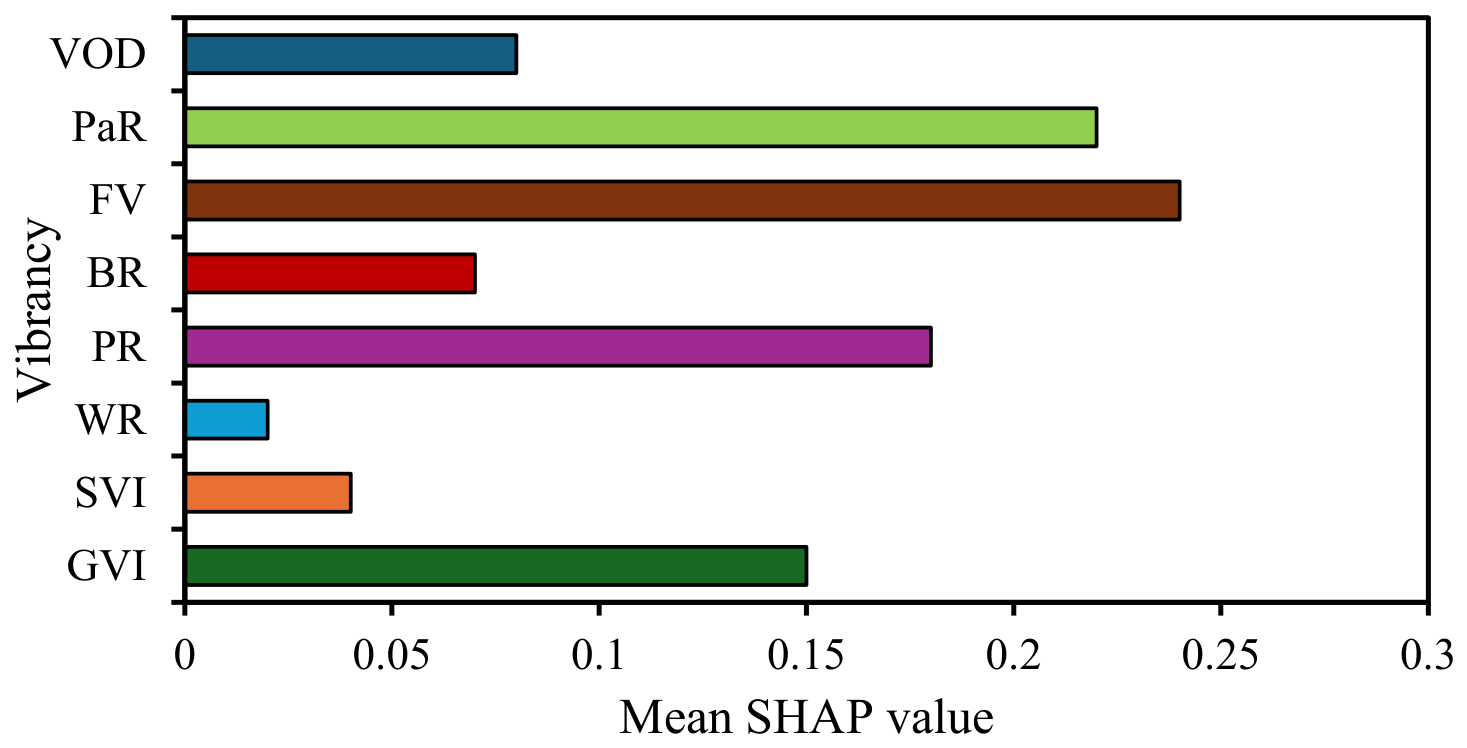
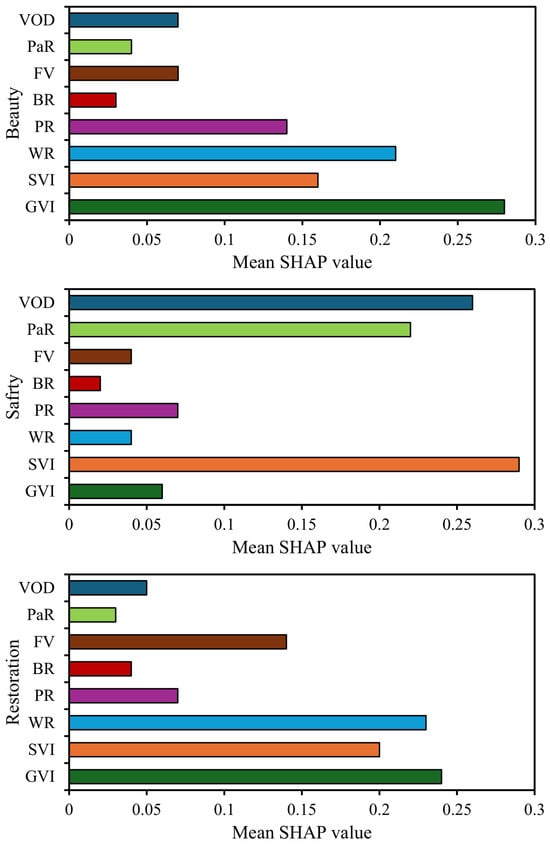
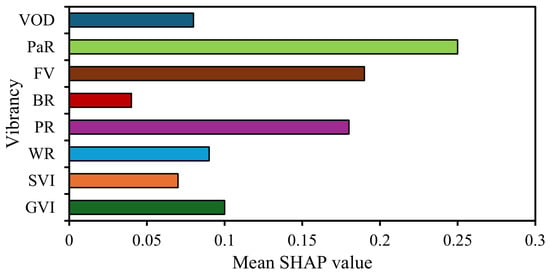
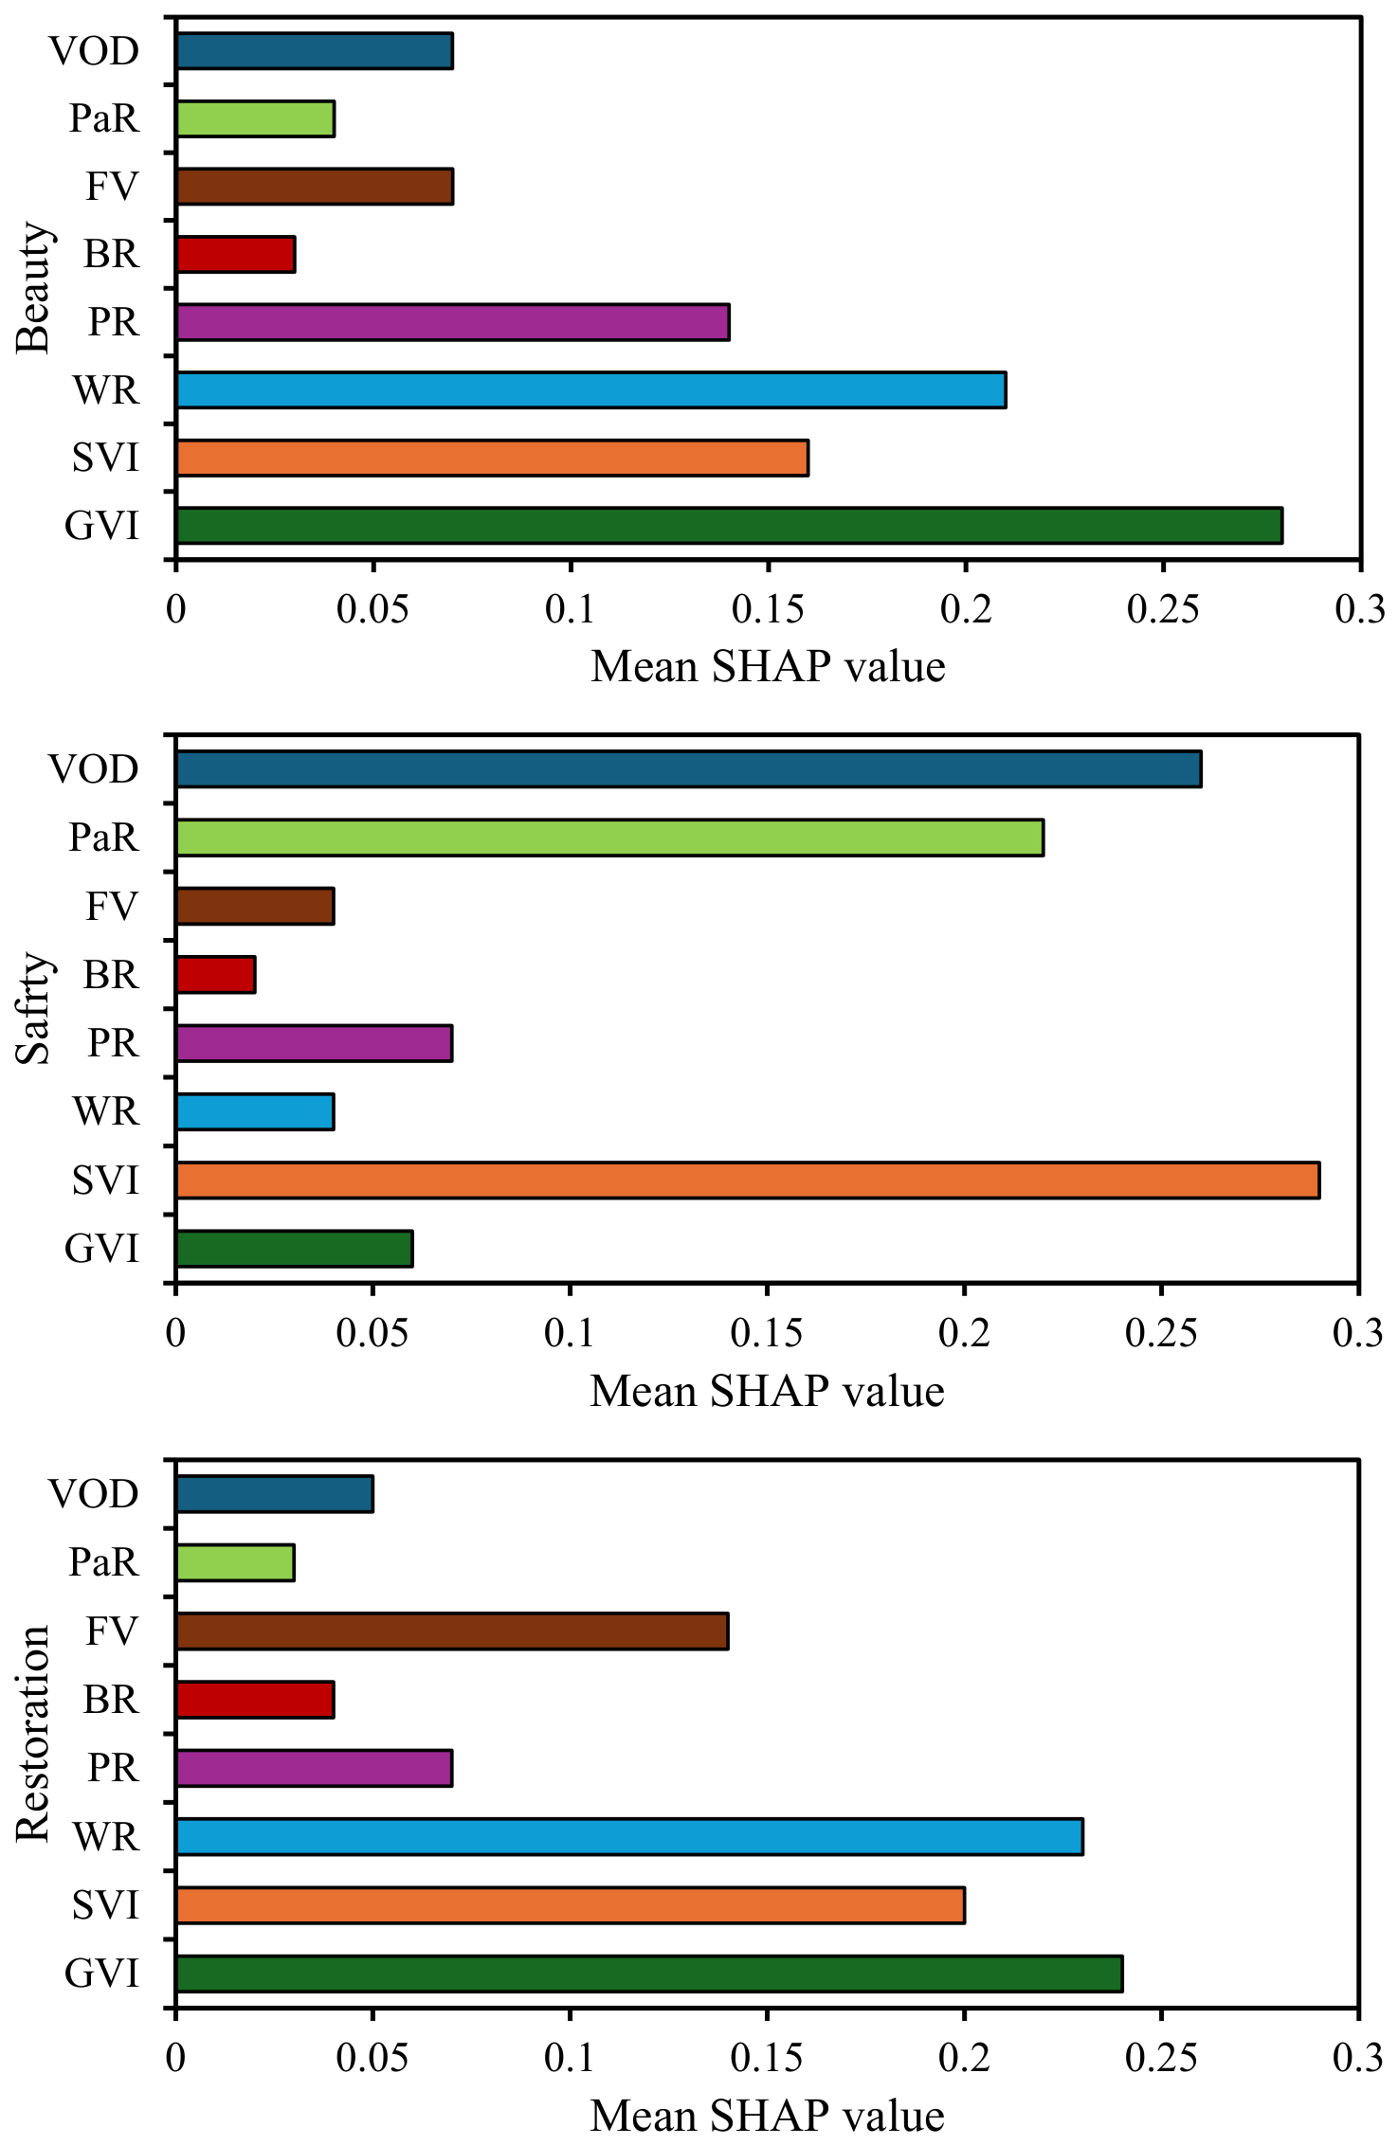
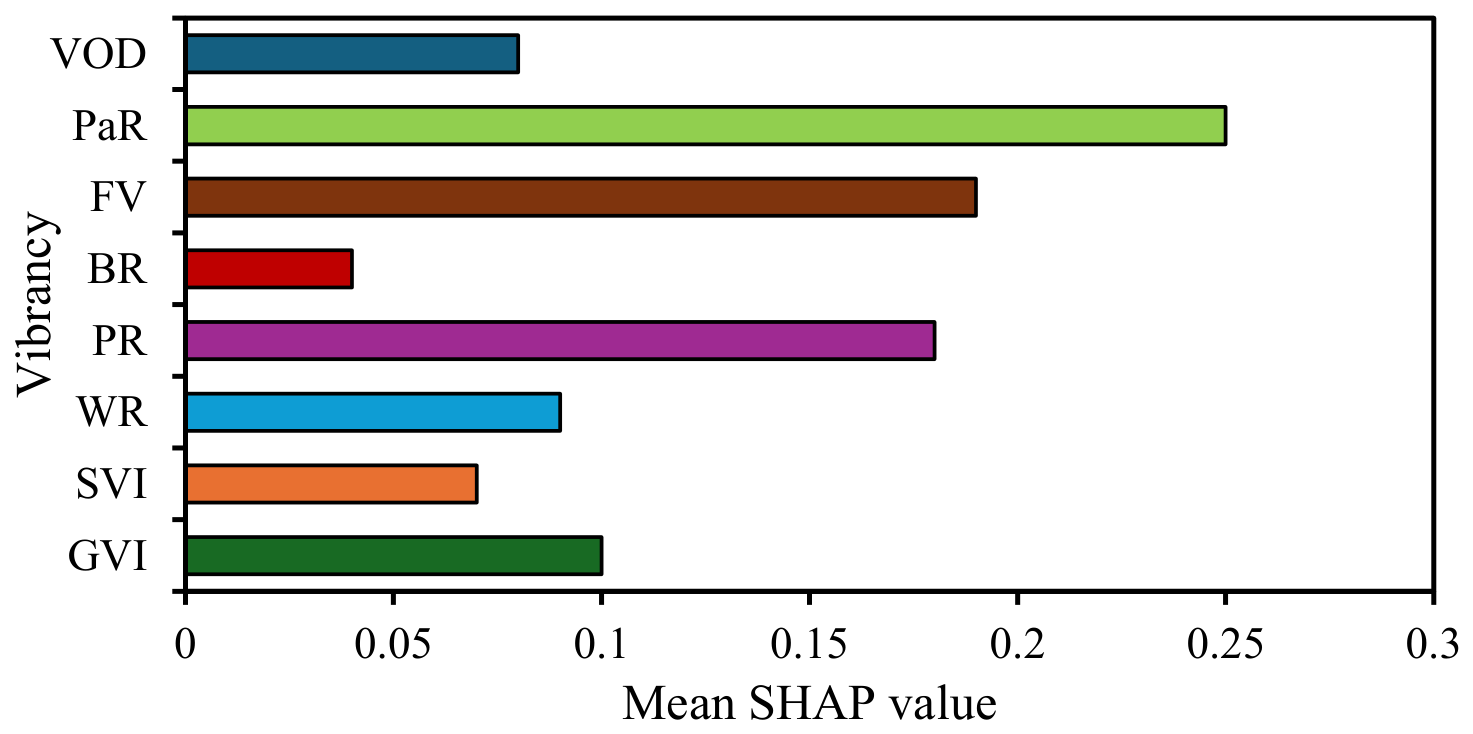
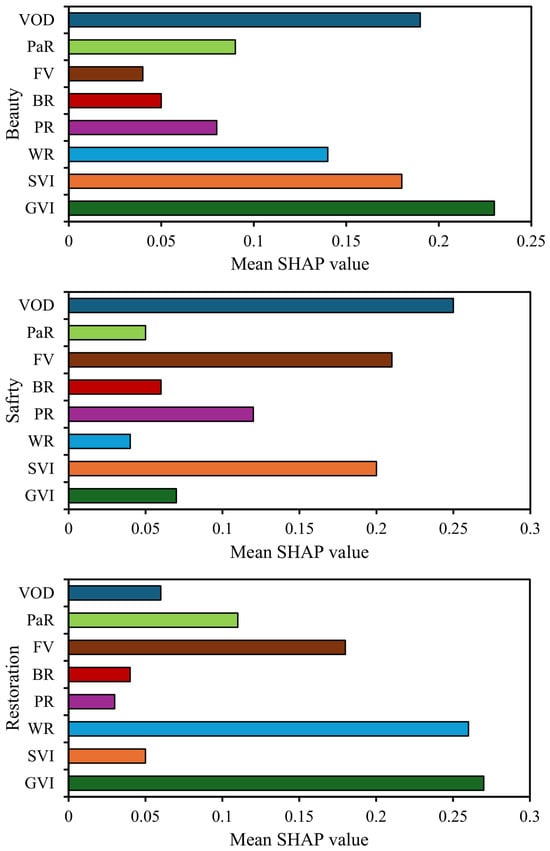
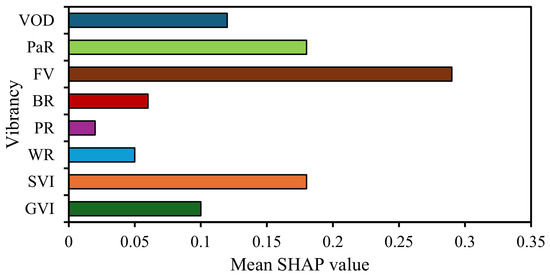
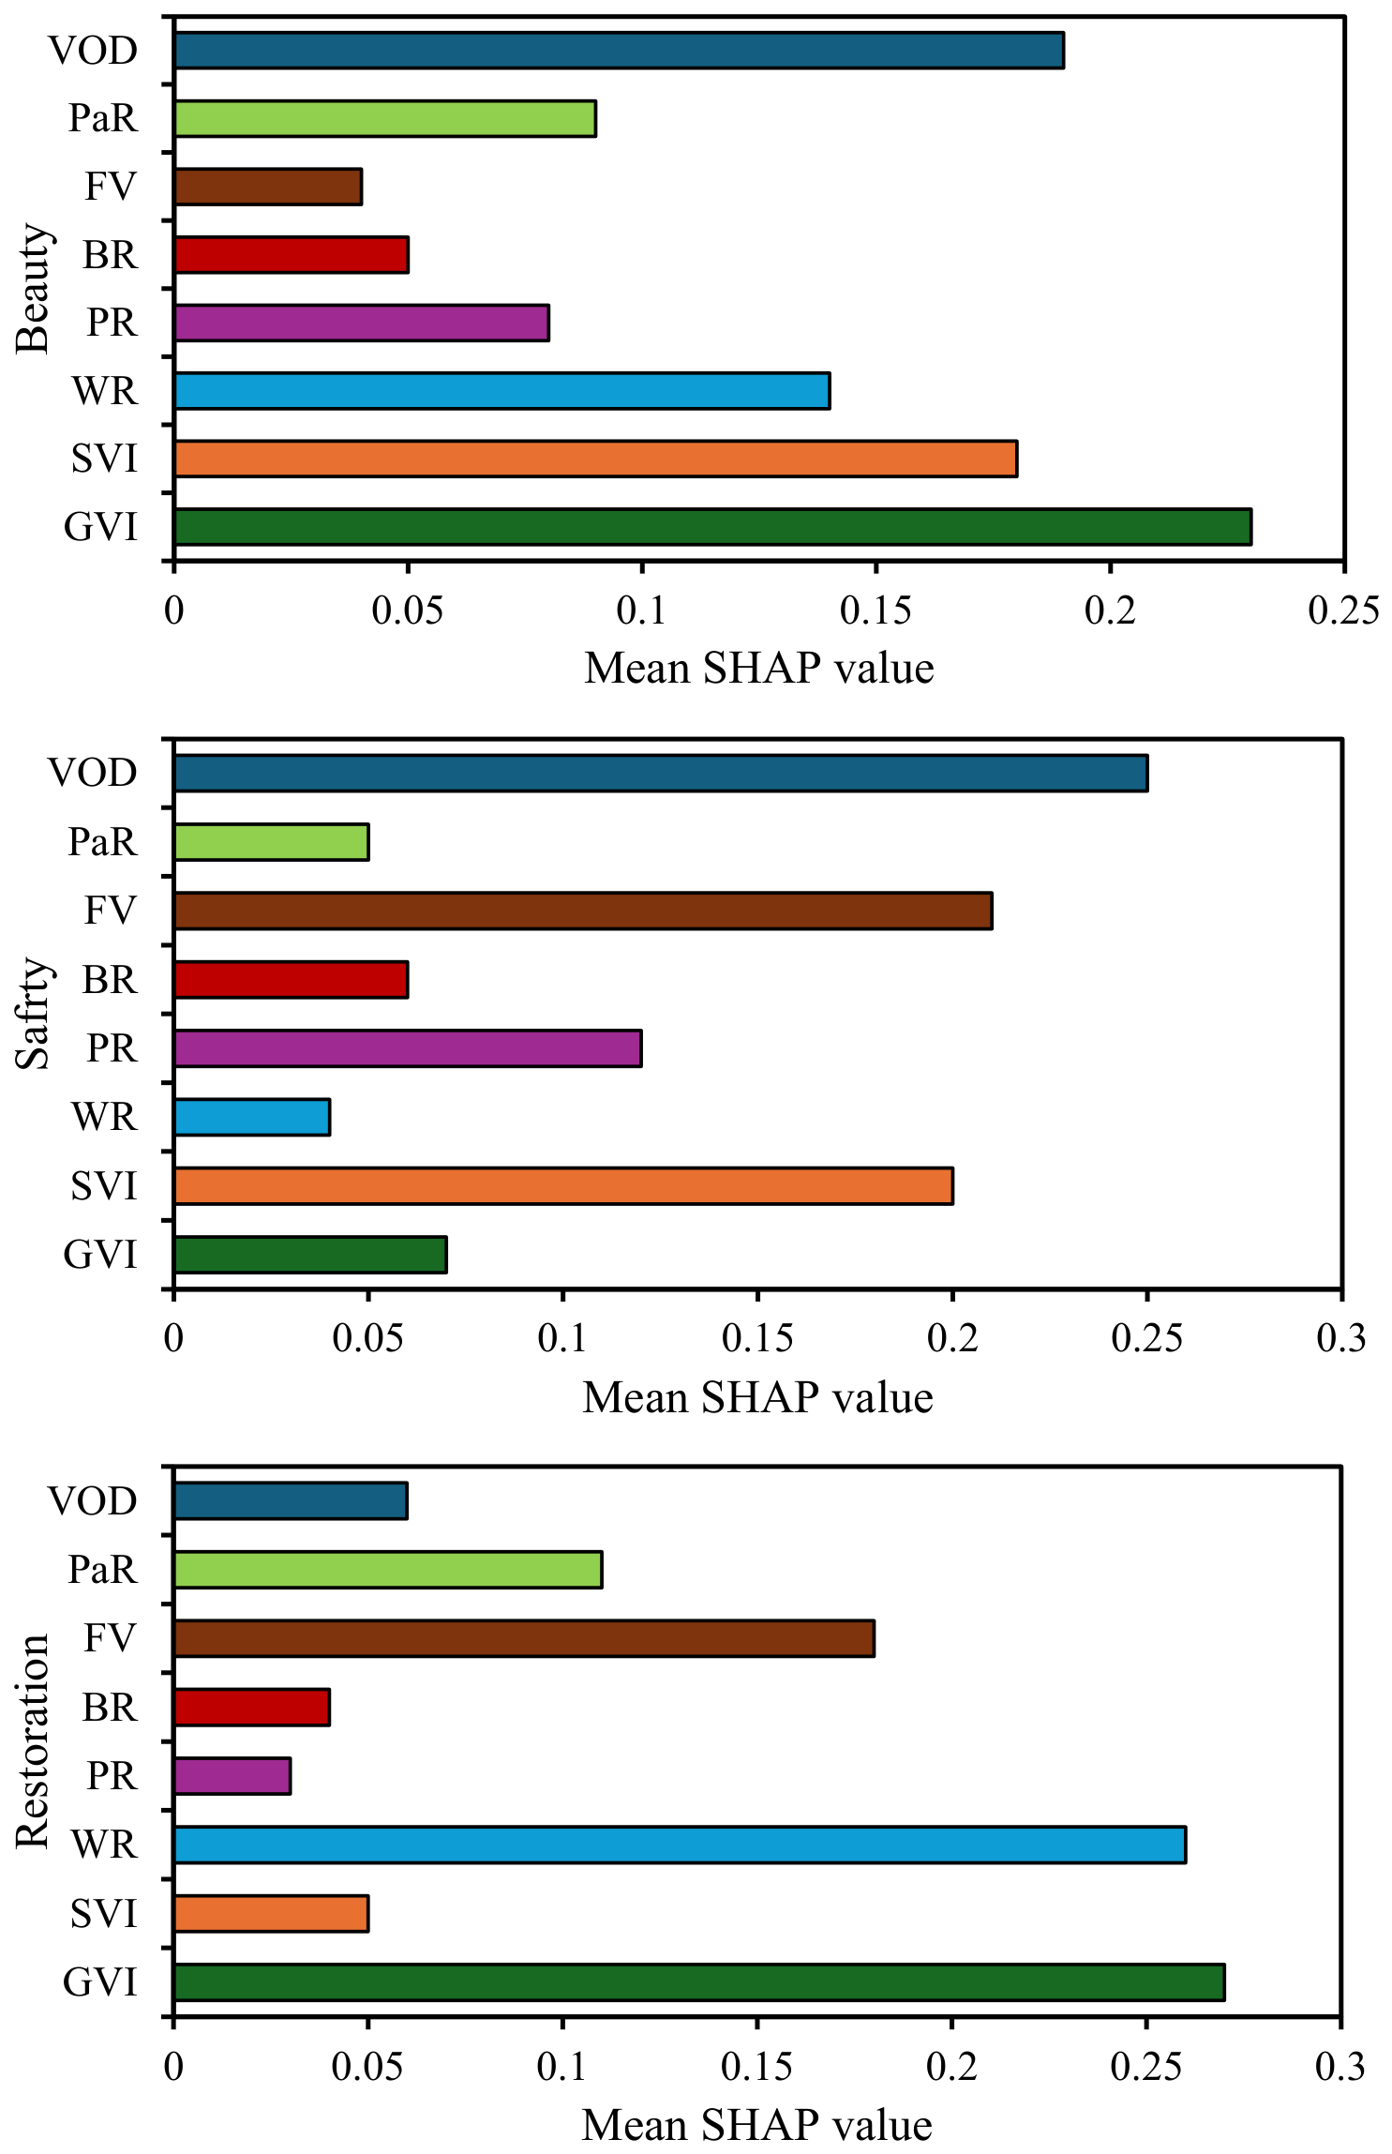
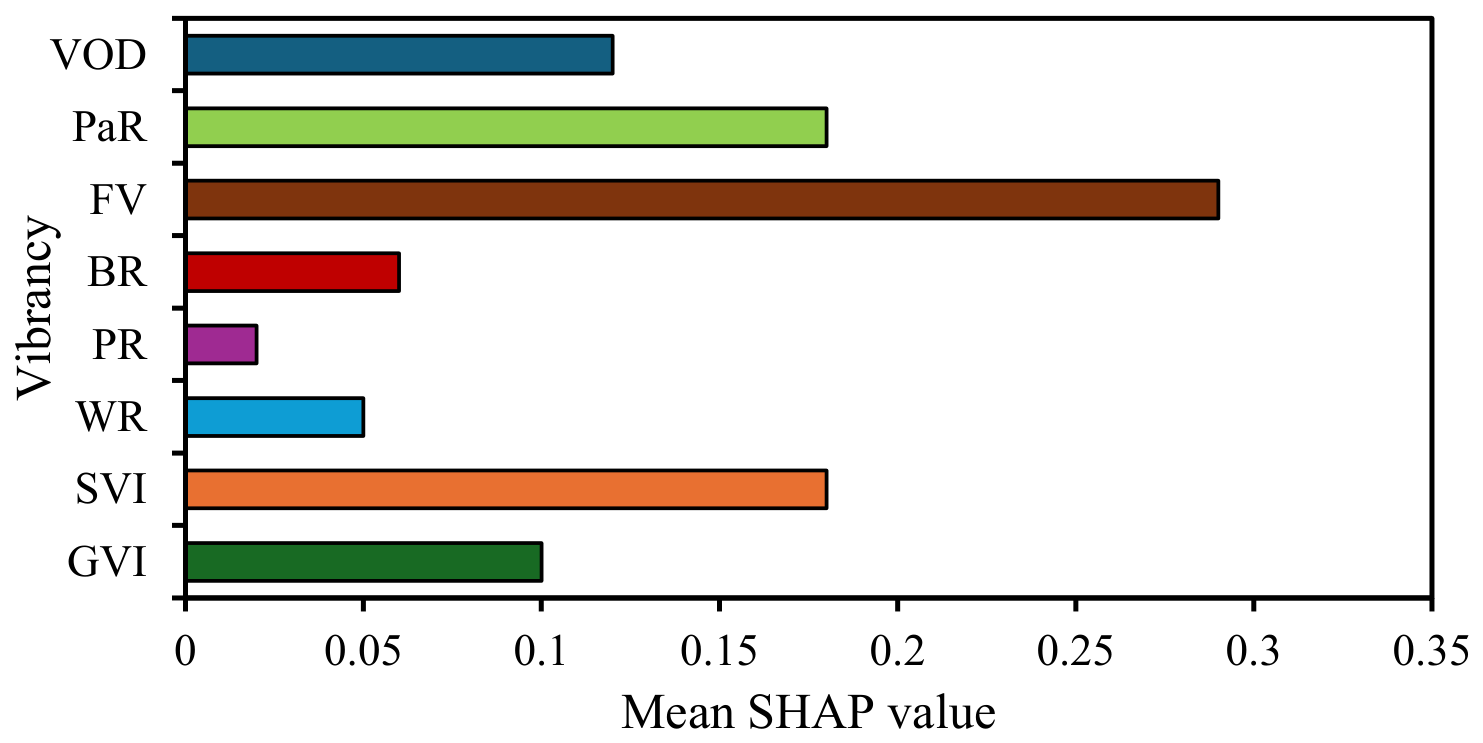
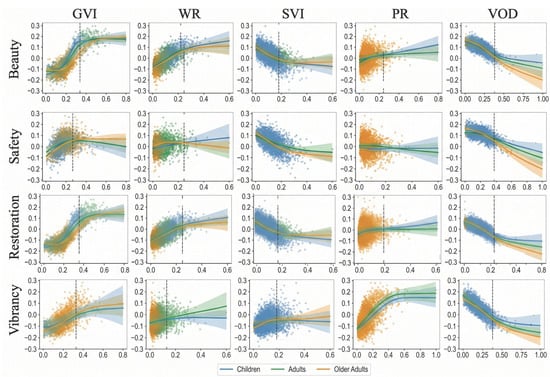
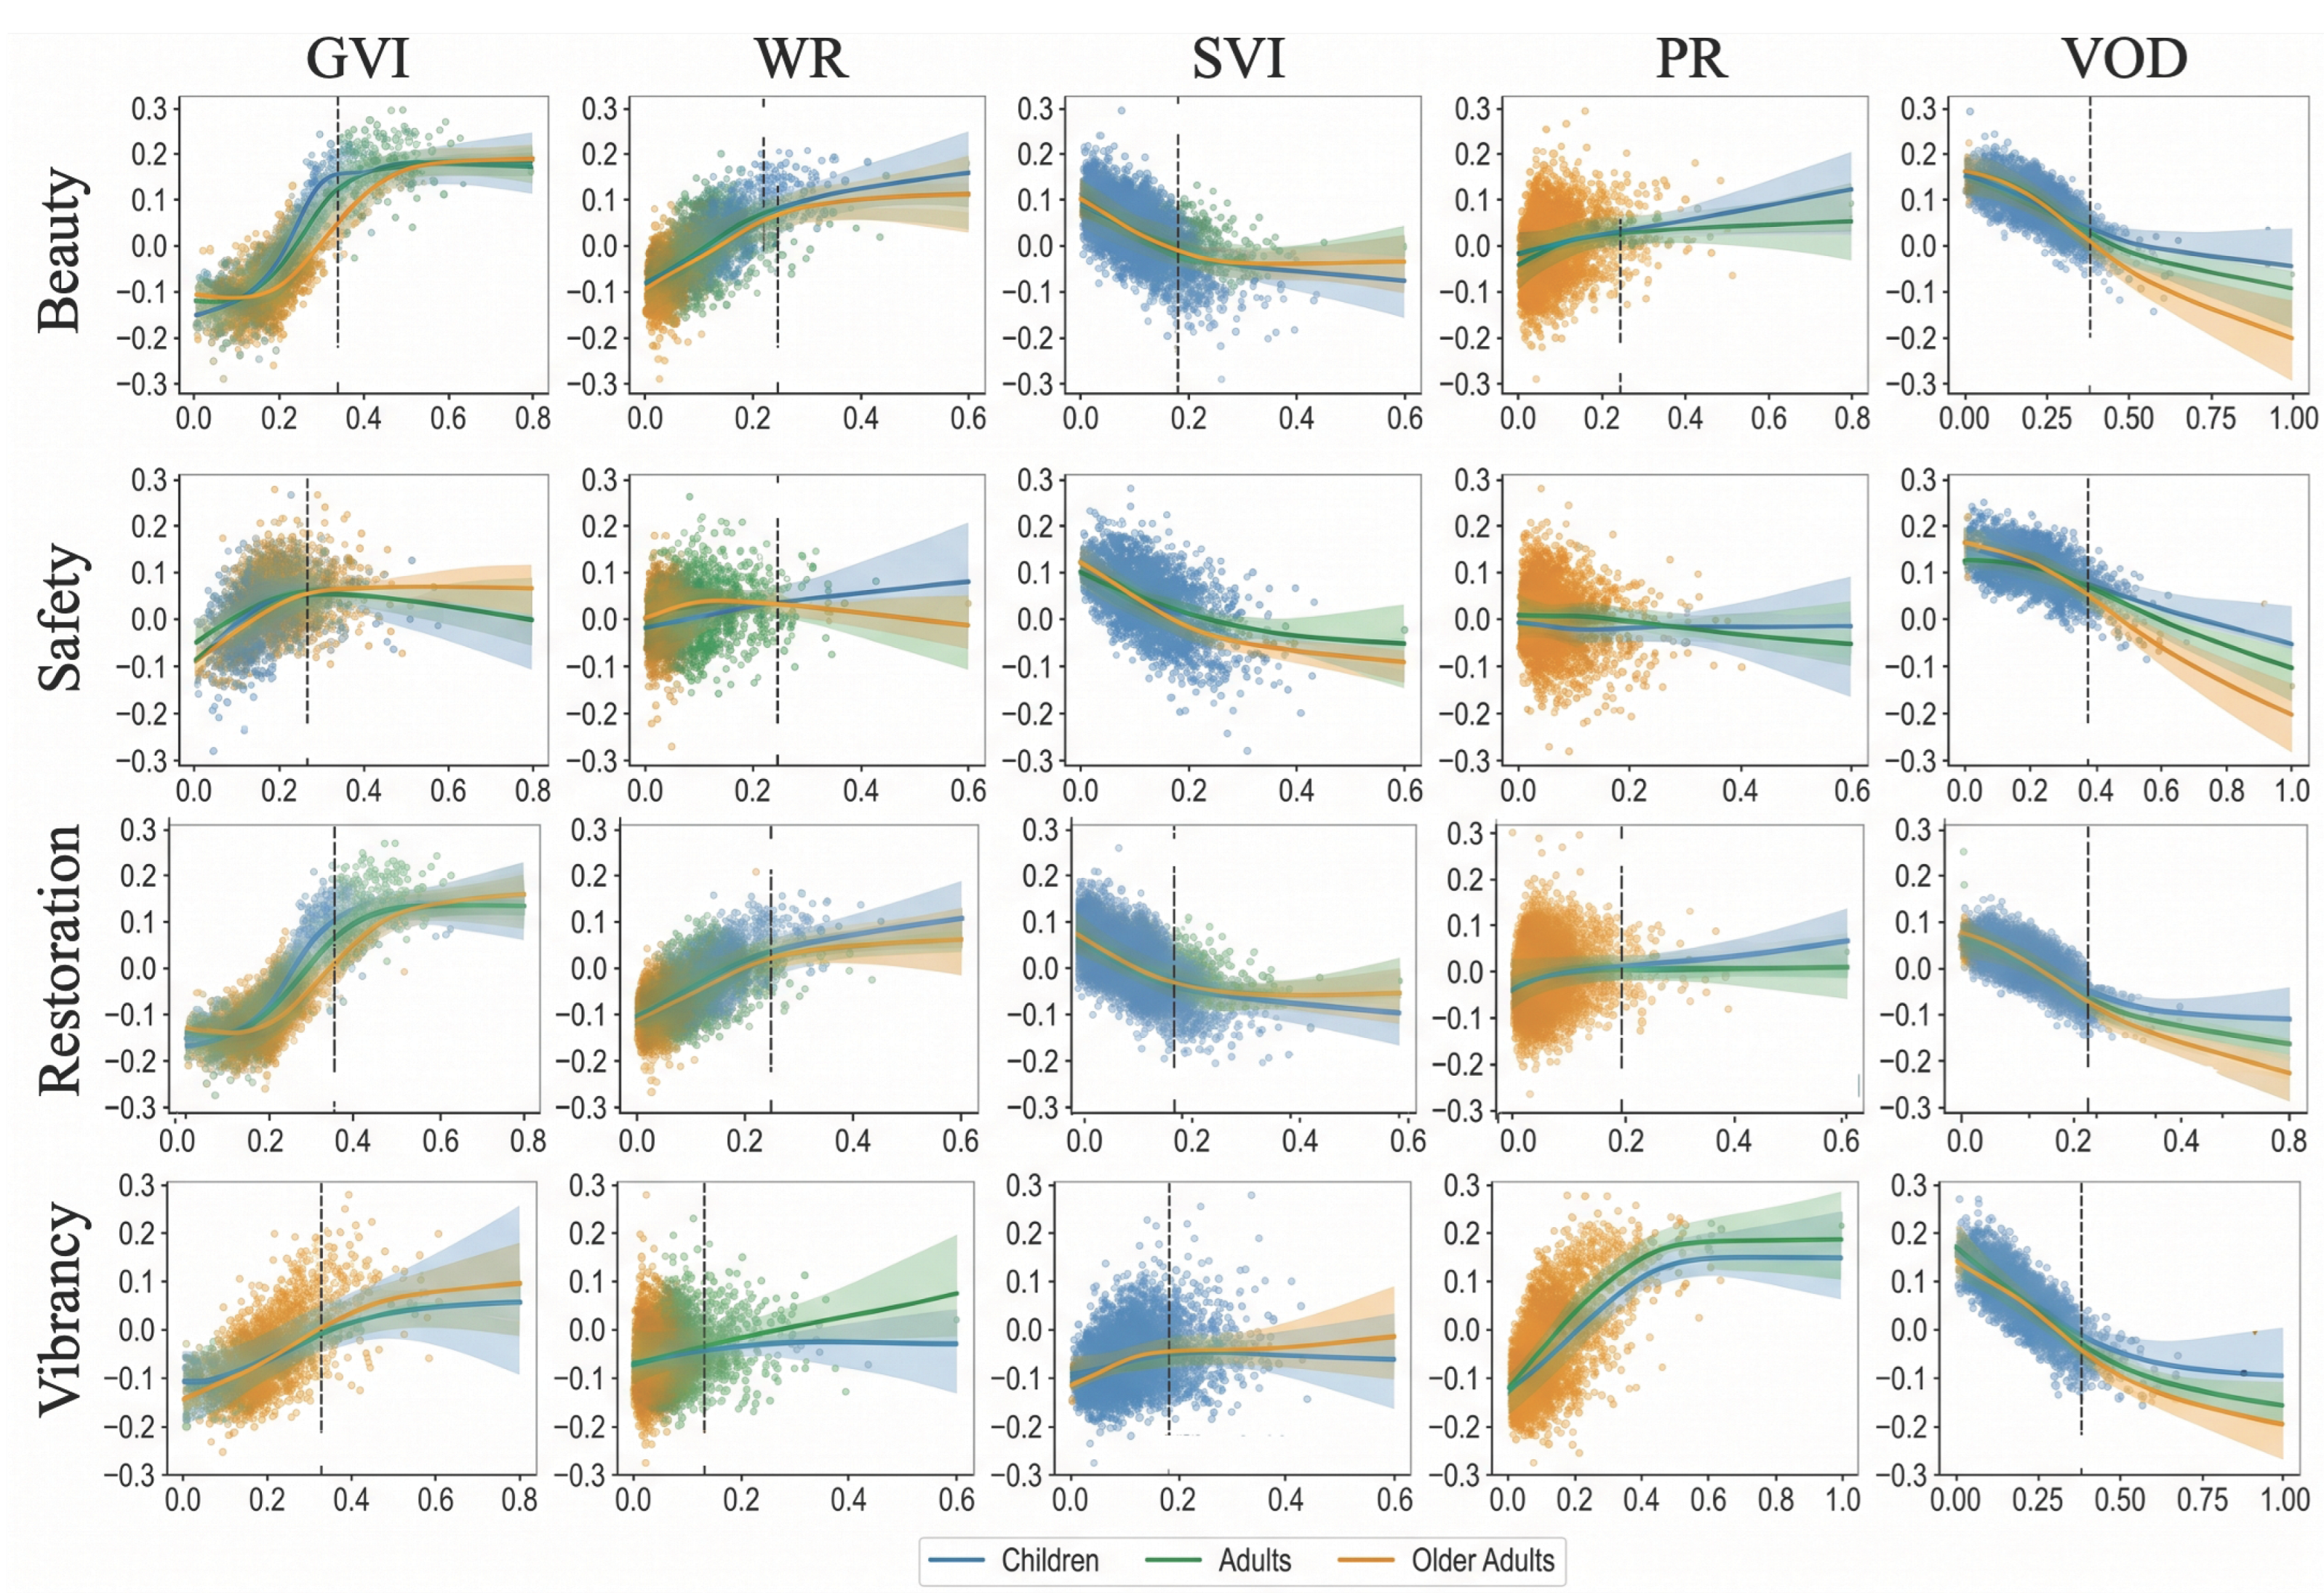

Disclaimer/Publisher’s Note: The statements, opinions and data contained in all publications are solely those of the individual author(s) and contributor(s) and not of MDPI and/or the editor(s). MDPI and/or the editor(s) disclaim responsibility for any injury to people or property resulting from any ideas, methods, instructions or products referred to in the content. |
© 2026 by the authors. Licensee MDPI, Basel, Switzerland. This article is an open access article distributed under the terms and conditions of the Creative Commons Attribution (CC BY) license.