


Abstract
Accurate detection of structural damage is essential for ensuring the safety and reliability of bridges. However, traditional vibration-based approaches often struggle to capture rich feature representations and adequately model spatial dependencies among sensors. This study proposes a novel bridge damage detection framework, LGSTA-GNN, which integrates local–global spatiotemporal learning with graph neural networks. The framework first extracts multi-scale temporal–frequency features using a multi-scale feature extraction module. A local graph feature extraction module then models intrinsic spatial relationships through graph convolutions, while a global graph attention module adaptively captures inter-sensor dependencies by emphasizing structurally informative nodes. A benchmark dataset generated from a scaled bridge model under progressive damage states is used to evaluate the proposed method. Extensive experiments demonstrate that LGSTA-GNN outperforms multiple graph neural network variants and conventional deep learning techniques, achieving superior accuracy, precision, recall, and F1-score. The confusion matrix and t-SNE visualization further verify its enhanced discriminative capability and robustness. Ablation studies confirm the contribution of each module, highlighting the effectiveness of global attention in identifying subtle structural deterioration. Overall, LGSTA-GNN provides an effective and interpretable solution for intelligent bridge damage detection, with strong potential for practical structural health monitoring and real-time safety assessment.
1. Introduction
With the increasing traffic load, degradation of material properties [1], and the impact of harsh environmental conditions and unforeseen events, bridges are facing varying degrees of structural damage. These damages not only lead to a reduction in the load-bearing capacity but also significantly affect the reliability and durability of bridges, thereby shortening their service life [2,3]. Therefore, timely and accurate identification and assessment of the damage state of bridges have become some of the core tasks in ensuring the safe operation of bridges. Advances in sensor technology and data acquisition methods have led to the widespread deployment of Structural Health Monitoring (SHM) systems on numerous large-scale bridges, providing a solid data foundation for bridge structural damage analysis [4,5]. However, the complexity, volume, and high dimensionality of the monitoring data present new challenges for damage identification. Efficiently processing this data and extracting valuable damage-related information has become a key focus of current research.
Structural damage detection relies heavily on the identification of changes in modal parameters. While early studies utilizing modal curvature indicators faced challenges, it is crucial to recognize that these limitations were largely due to the reliance on stationary assumptions and spectral averaging, which serve to mask the transient non-linear behaviors characteristic of extreme events. Real-world damage produces strongly non-stationary effects associated with stiffness degradation and localized energy dissipation [6]. Consequently, methods based on stationary assumptions fail to capture the true evolution of damage. However, substantial progress has been made by adopting Time-Frequency (TF) analysis to extract instantaneous modal parameters. Studies have demonstrated that curvature-based indicators become highly effective when evaluated using the Stockwell transform (S-transform) [7] or band-variable filters [6]. A critical insight from the extant literature is that extracting instantaneous modal curvature at the moment when the oscillation frequency reaches its minimum yields a metric strongly correlated with local stiffness reduction [8]. Additionally, techniques such as the Short-Time Impulse Response Function (STIRF) have been developed to automatically evaluate instantaneous frequency variations and damping factors [9], with validity confirmed in real-world scenarios like the Navelli earthquake study [10]. Although these physics-based time-frequency analysis methods perform exceptionally well in capturing non-stationary characteristics, challenges remain regarding automated feature extraction when dealing with massive, high-dimensional SHM data. Some researchers have employed signal processing techniques, such as wavelet transform [11,12] and Hilbert transform [13], to manually extract node damage features and combined these with methods like BP neural networks [14] and support vector machines [15] for structural damage identification. However, the extracted features are still single-layer, lacking hierarchical structure. Moreover, as the amount of monitoring data increases, the training parameters grow exponentially, further restricting their practical application.
In recent years, deep learning technologies have made breakthrough advancements across various fields, offering new opportunities for structural damage detection in bridges [16,17]. For instance, Convolutional Neural Networks (CNNs), with their powerful feature extraction capabilities, can extract local features related to damage from time-series monitoring data [18]. Recurrent Neural Networks (RNNs), on the other hand, are adept at processing time-dependent sequential data, effectively capturing long-term dependencies in monitoring data and thus more accurately reflecting the influence of damage on the dynamic response of bridge structures [19]. However, single models often fail to fully capture the spatiotemporal correlations in monitoring data. Hybrid deep learning models, by combining multiple neural network architectures, can simultaneously account for spatial features and temporal dependencies, effectively overcoming the limitations of single models [20,21]. Nevertheless, these models are highly complex, leading to long training times and significant computational costs, which limits their application in resource-constrained environments. Additionally, the parameter optimization of hybrid models is challenging, often resulting in overfitting or underfitting issues.
Graph Neural Networks (GNNs), as a deep learning model based on graph structures, can integrate the topological configuration of sensors with time-series monitoring data. By leveraging the advantages of graph structures, GNNs can more comprehensively capture the spatiotemporal correlations between data collected from different monitoring points. This capability has been extensively explored in fields such as Internet of Things (IoT) monitoring [22], smart grids [23], and traffic flow prediction [24]. GNNs have demonstrated significant potential in handling complex spatiotemporal data and multidimensional information, providing a novel technological paradigm for structural damage detection in bridges [25].
Therefore, to address the limitations of existing deep learning models in spatiotemporal correlation modeling of bridge structural monitoring data and the integration of local-global information, a bridge structural damage detection model that integrates local-global spatiotemporal correlation information has been developed. This model captures the spatiotemporal dependencies between monitoring points, the variation patterns of local damage features, and the overall response of the global structure through the construction of spatiotemporal topological graphs, multi-scale feature extraction, and local-global graph feature learning. The specific contributions of this paper are as follows:
(1) A sensor spatiotemporal correlation graph construction method is proposed, which combines spatial deployment and temporal dependencies. By introducing distance thresholds and correlation coefficients, redundant connections are effectively reduced, enhancing the efficiency and accuracy of spatiotemporal data modeling.
(2) A Multi-Scale Feature Extraction (MSFE) module is proposed to extract multi-resolution time-frequency representations from raw sensor data. By applying multiple convolutional kernels with different receptive fields, the model effectively captures high-frequency local transients and low-frequency global responses, enabling comprehensive vibration feature description.
(3) A Local Graph Feature Extraction (LGFE) module is designed to construct feature maps within the sensors, using graph convolution operations to model local structural dependencies. This mechanism enhances the representation of internal feature correlations through topology-aware information propagation while suppressing noise.
(4) A Global Graph Attention Feature Extraction (GGAFE) module is introduced to perform adaptive feature aggregation on the sensor spatiotemporal correlation graph. The graph attention mechanism learns the relative importance of connections between nodes, enabling the model to emphasize key structural relationships and improving the interpretability of damage inference.
2. Related Works
With the continuous development of Structural Health Monitoring (SHM) technology, deep learning-based methods have gradually become an important direction in bridge structural damage detection research. Recent studies have mainly focused on the in-depth exploration of Convolutional Neural Networks (CNNs), Recurrent Neural Networks (RNNs), hybrid neural networks, and the preliminary exploration of Graph Convolutional Networks (GCNs) [26].
CNNs, through components such as convolutional layers, pooling layers, and fully connected layers, are capable of extracting local features related to damage from time-series monitoring data [27]. For example, Sun et al. [28] used CNNs and Partial Least Squares Regression (PLSR) to estimate deviations in node loads before and after damage for bridge damage detection and localization. However, CNNs have limitations when processing time-dependent sequential data, as they struggle to capture long-term dependencies within time-series data. This limitation restricts their further application in bridge structural damage detection. Li et al. [29] combined the inverse Finite Element Method (iFEM) with CNNs for structural damage detection by analyzing strain mode differences. Ai et al. [30] integrated 1D CNNs with Electromechanical Impedance (EMA) techniques to automatically identify minor damage in concrete structures, eliminating the need for complex data preprocessing during network training and testing. Although CNNs perform excellently in local feature extraction, their ability to model long-term dependencies in time-series data is limited. As a result, within a single CNN framework, it is difficult to fully capture the complex relationship between bridge damage and long-term structural dynamic responses.
Given the limitations of CNNs in capturing long-term temporal dependencies in time-series monitoring data, Recurrent Neural Networks (RNNs) and their variants, such as Long Short-Term Memory (LSTM) networks and Gated Recurrent Units (GRUs), have been introduced for bridge structural damage detection. For instance, Min et al. [31] combined Deep Neural Networks (DNNs) with LSTM algorithms to propose a hybrid model for processing long-term responses from different sensors in the time domain and reflecting statistical characteristics. Wang et al. [32] used the computed changes in contact point displacement (CPDV) as input variables for an LSTM network to monitor the damage location and extent of a bridge. However, RNN models have higher complexity, longer training times, and may encounter problems like vanishing or exploding gradients when processing large-scale long-sequence data.
To overcome the limitations of single models, hybrid neural network models have been widely applied in structural damage detection tasks. These models combine the advantages of different neural network architectures, such as CNNs and RNNs, enabling them to simultaneously consider spatial features and temporal dependencies, thereby more comprehensively capturing the complex information in bridge structural monitoring data. For example, Yang et al. [33] proposed a new hybrid framework combining hierarchical convolutional neural networks and GRUs to model spatial and temporal relationships, called HCG, for structural damage detection. Bui-Tien et al. [34] proposed a 1DCNN-GRU-ResNet network architecture, where a 1D convolutional neural network (1DCNN) is used for feature extraction, GRU is applied to capture long-term dependencies, and a residual network (ResNet) is incorporated to avoid the common gradient vanishing problem in deep learning models during training. Rautela et al. [35] utilized CNNs and RNNs, along with other deep learning networks, to numerically approximate the solution to inverse problems, proposing a classification and regression hybrid strategy under a supervised setting for comprehensive damage detection and localization. Fathnejat et al. [36] combined 1DCNNs with RNN variants and incorporated attention mechanisms to identify structural damage.
Although the aforementioned hybrid neural network models have made progress in handling spatial features and temporal dependencies in bridge structural damage detection, these models have not fully accounted for the multi-level nonlinear relationships between sensor nodes when modeling the complex spatial relationships and topological dependencies among structures. To address these issues, Graph Neural Networks (GNNs), as a deep learning method capable of handling graph-structured data, provide a new solution. For example, Eslamlou et al. [37] proposed a hybrid framework that combines GNNs with a physics-based finite element (FE) model updating approach to estimate the location and severity of structural damage, and optimized the GNN architecture and hyperparameters using an evolutionary AutoML framework. Kim et al. [38] introduced a near-real-time damage detection method based on Dynamic Graph Neural Networks (DynGNN), where infrastructure is represented as a graph, and a dynamic adjacency matrix based on Proper Orthogonal Decomposition (POD) is used to capture the dynamic characteristics and spatial correlations of the responses. He et al. [39] proposed a Physics-informed Graph Transformation Network (PiGTN), which utilizes a physical information adjacency matrix derived from structural mechanics to encode sensor dependencies. The enhanced second-order Graph Convolutional Network (GCN) captures spatial correlations, while the Transformer encoder models the temporal dynamics. Peng et al. [40] established an end-to-end mapping from explosive load input to structural damage response using the unique message-passing mechanism of graph networks, and introduced a multi-scenario feature coupling training strategy, enabling the trained GNN model to adapt to different reinforcement ratios, explosive charges, and blast locations, significantly enhancing its generalization ability under varying loading conditions.
3. Method
3.1. Overall Framework
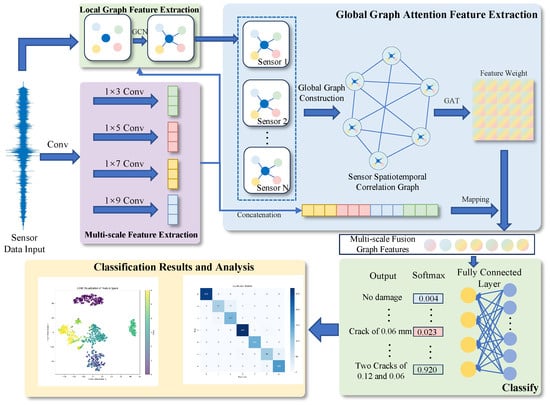
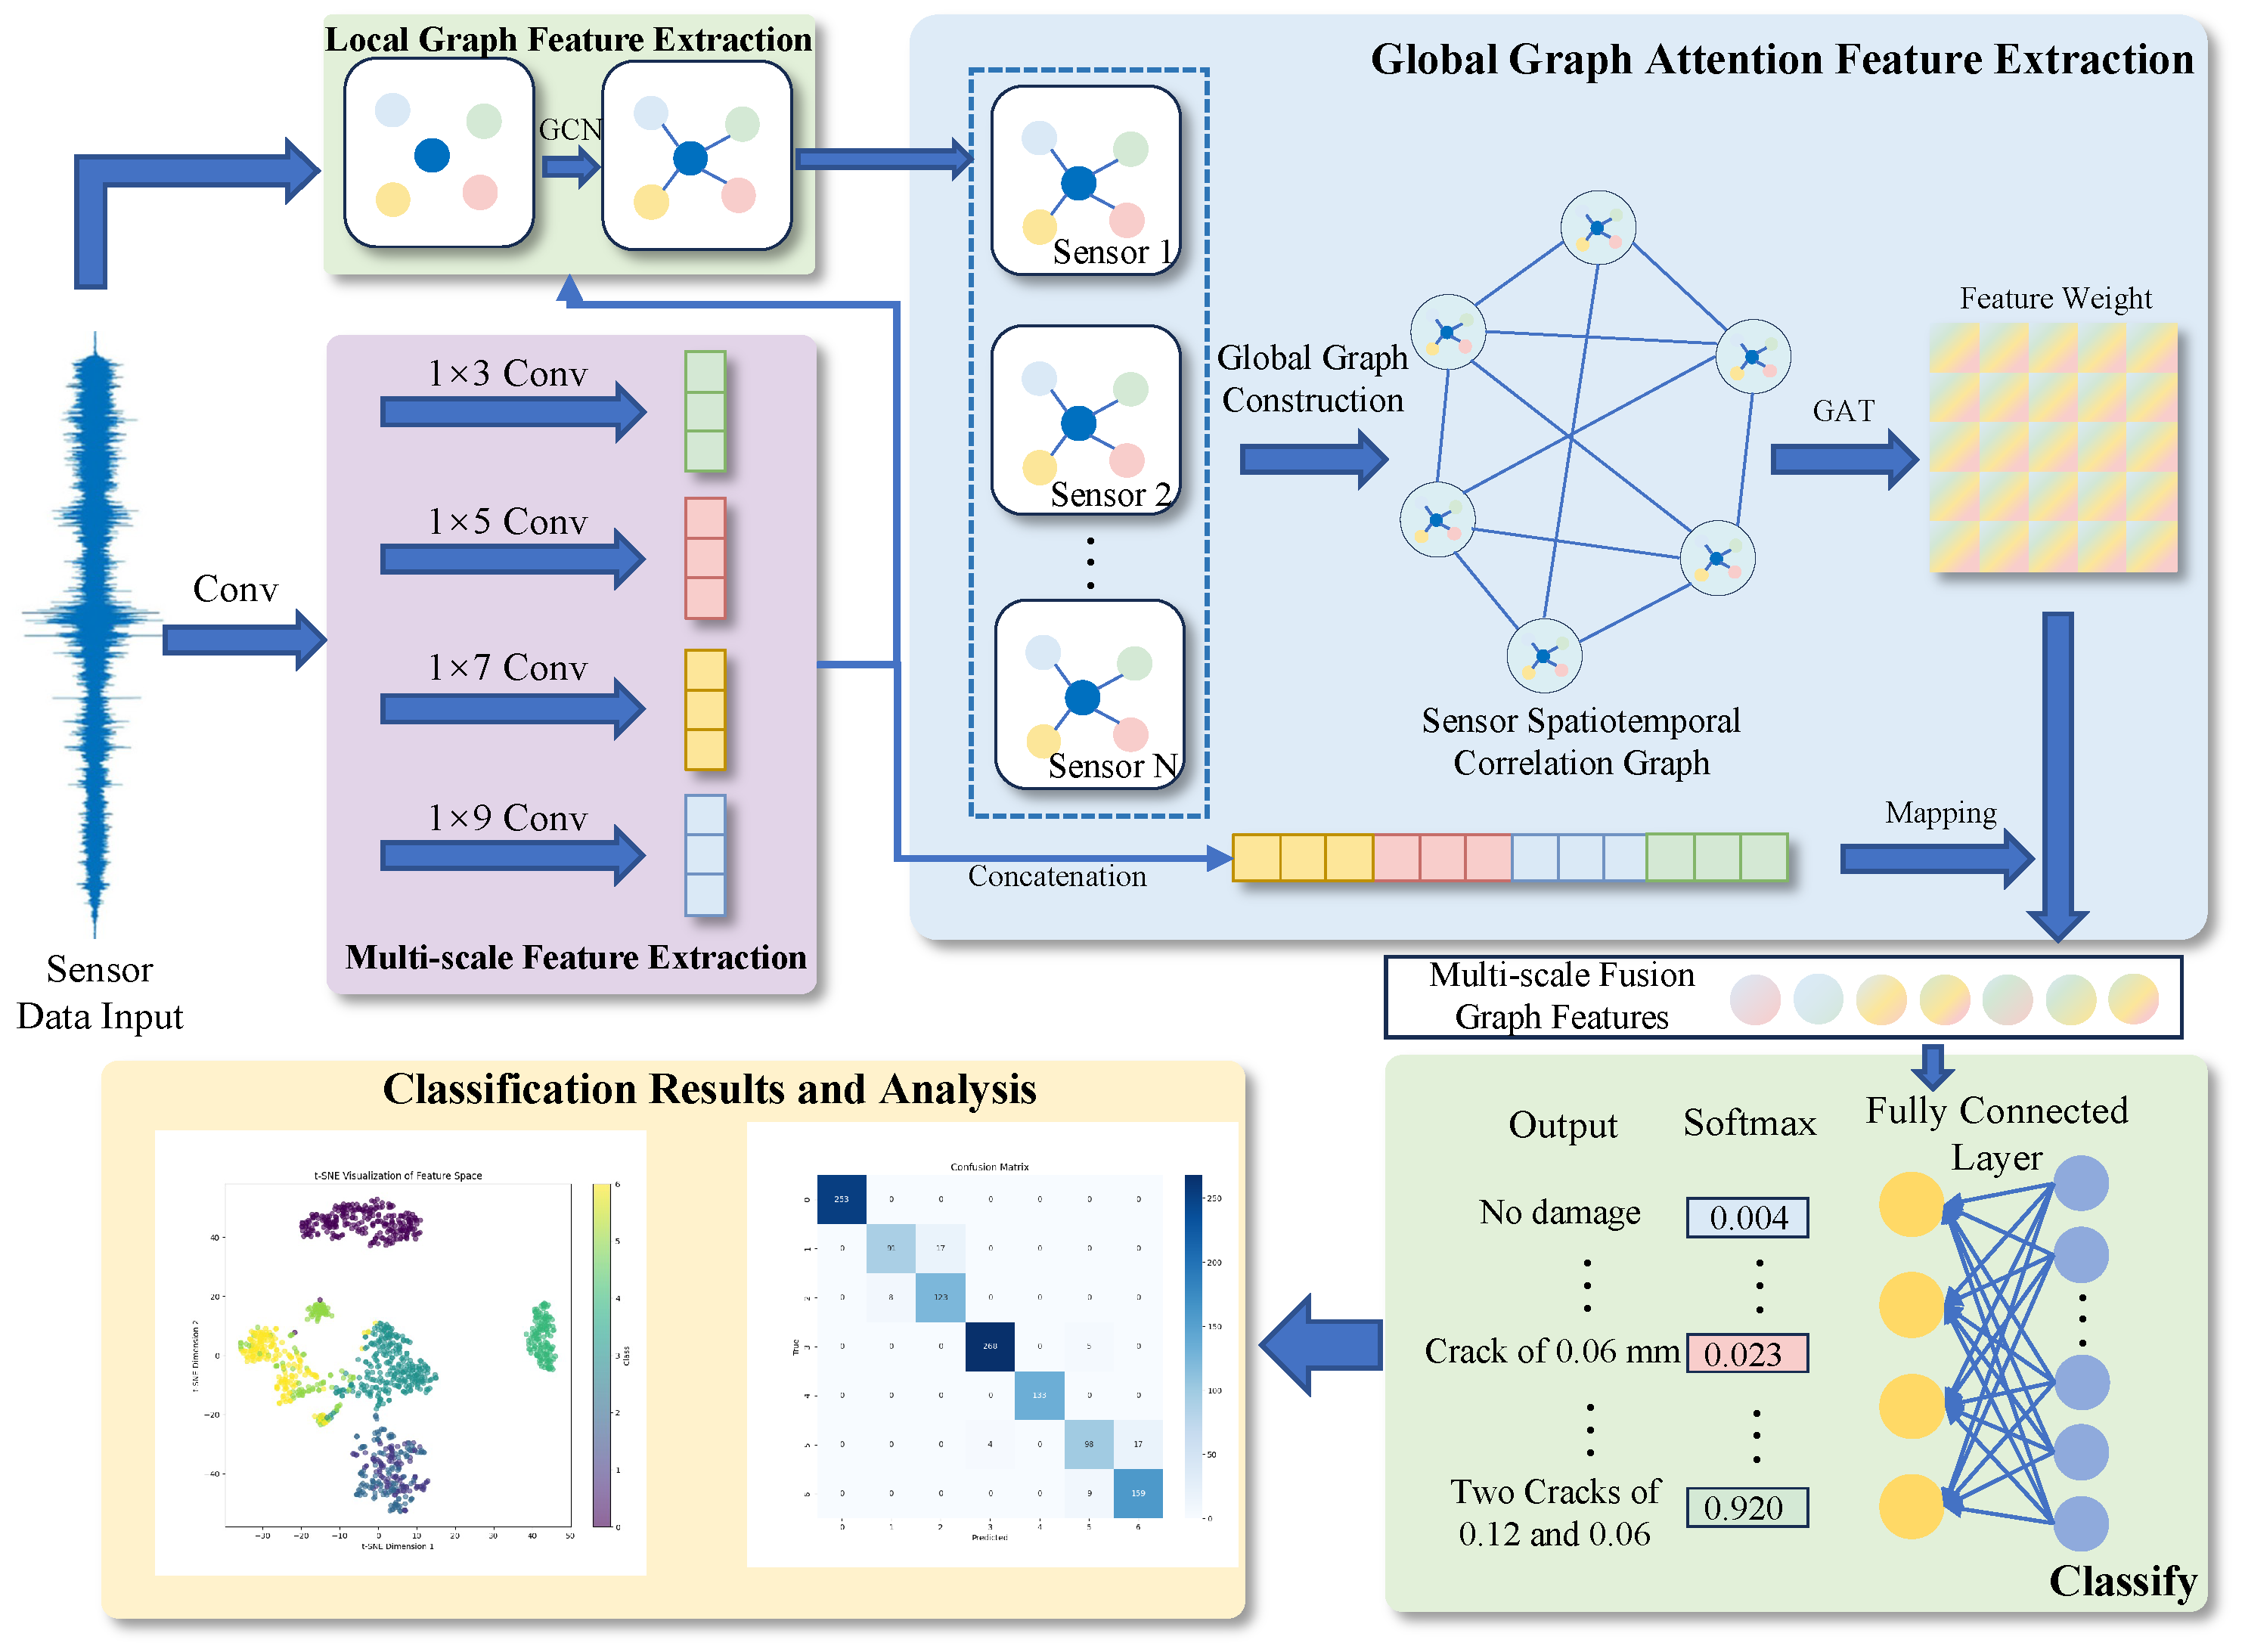
As illustrated in Figure 1, the proposed bridge damage detection framework is composed of three primary components: Multi-scale Feature Extraction, Local Graph Feature Extraction, and Global Graph Attention Feature Extraction. The overall pipeline aims to effectively capture both intra-sensor and inter-sensor relationships for robust damage classification. First, each sensor signal is processed through the Multi-scale Feature Extraction module to obtain rich multi-level representations. Specifically, this module generates four feature vectors corresponding to different receptive fields, allowing the model to preserve both local and global temporal–spatial patterns within the sensor data. Subsequently, the extracted multi-scale feature vectors are passed into the Local Graph Feature Extraction module, where a Graph Convolutional Network (GCN) is employed to model the internal correlations among the features of each individual sensor. This step enables the model to capture the structural dependencies within a sensor’s feature space, enhancing its local representational capability. Next, all sensors are integrated into a Global Graph Attention Feature Extraction module, in which each sensor node is treated as a vertex in a global graph. A Graph Attention Network (GAT) is applied to compute the attention-based edge weights, thereby emphasizing the most informative inter-sensor relationships. This process effectively models the spatial dependencies across different sensors distributed on the bridge structure. Finally, the four multi-scale feature vectors are concatenated and mapped with the learned global graph attention weights to form a classification feature vector. This fused representation integrates both local and global graph-based information, which is subsequently fed into a fully connected layer for bridge damage classification. The steps of our proposed method are as shown in Algorithm 1.
| Algorithm 1 Bridge Damage Detection Framework Based on Global Graph Attention |
| Require: Sensor signals ; Ensure: Damage classification label y;
|
Figure 1.
Overall architecture of the proposed LGSTA-GNN framework.
3.2. Construction of Sensor Spatiotemporal Correlation Graph
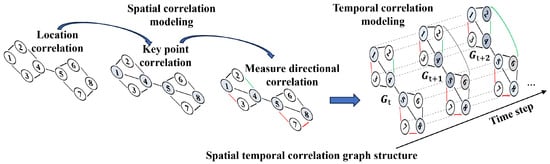
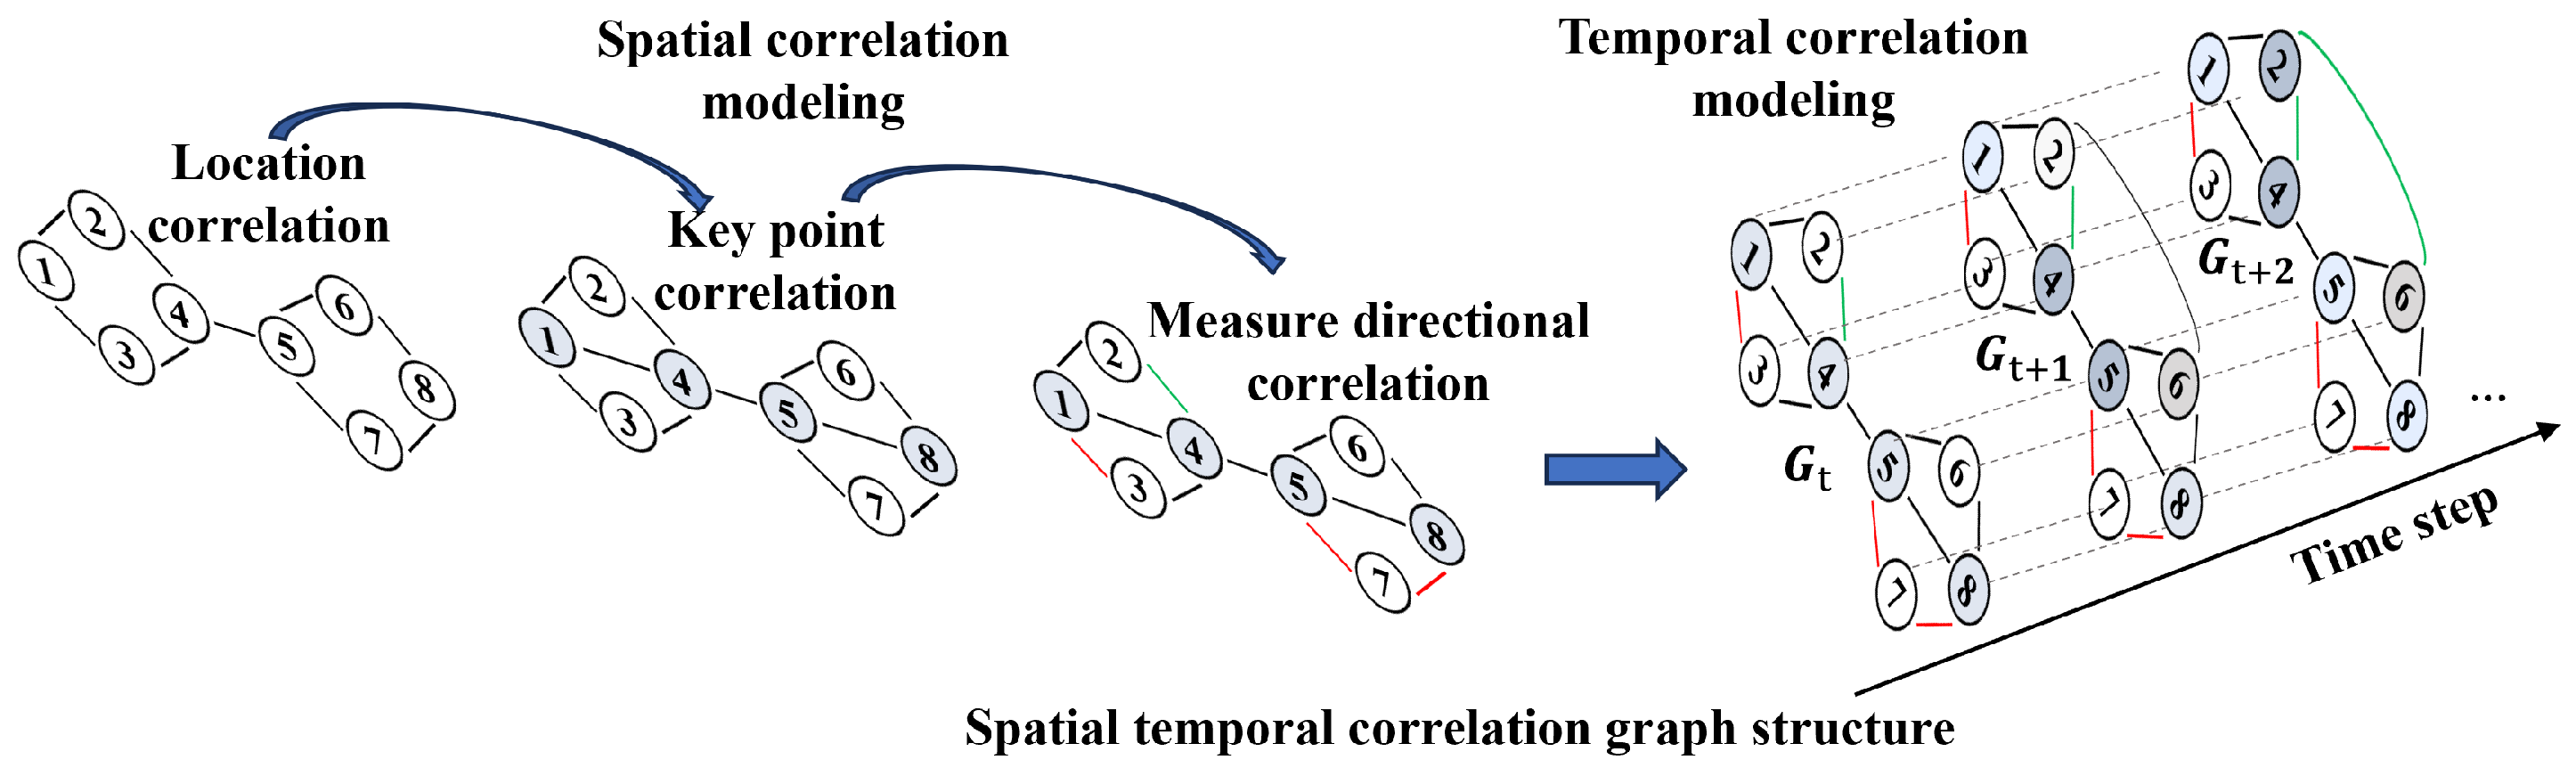
The deployment of sensors follows a clear topological structure, and the data collected exhibits continuous variations under temporal dependencies. Therefore, to deeply analyze and understand the complex relationships between sensor data, particularly the interactions in both time and space dimensions, we conducted an exploration of sensor spatiotemporal correlation graph construction. The nodes of the spatiotemporal graph represent data points from sensors at different time steps, while the edge weights represent the spatial correlations and temporal dependencies between sensors. The construction process, as illustrated in Figure 2, includes the following steps:
Figure 2.
Multi-sensor spatiotemporal graph.
(1) Spatial Correlation Modeling Spatial dependencies are determined not only by the distance between sensors but also by factors such as the structural deployment of sensors, measurement directions, and key measurement points. To avoid information redundancy and reduce computational complexity in dense graphs, a distance threshold is introduced to limit the dense connections between sensors, excluding key measurement points. Additionally, the influence of the acceleration measurement direction on the spatial correlation between sensors is considered, and a measurement direction similarity coefficient is introduced to constrain the spatial dependencies. This results in the final spatial correlation matrix:
(2) Temporal Correlation Modeling To capture the temporal dependencies in the monitoring data, we model the temporal correlations between sensor data at different time steps. Each sensor’s data at different time instants is treated as independent nodes, and edges are established based on the similarity or changes in the data across time series. The Pearson correlation coefficient is used to measure the linear correlation between sensor data. For sensors i and j at different time steps t, with acceleration data and , we quantify their temporal dependency by calculating their Pearson correlation coefficient. A correlation threshold is set to avoid redundant connections of irrelevant data between time steps:
where and represent the mean values of sensors i and j across all time steps, respectively.
3.3. Multi-Scale Feature Extraction
Structural vibration signals collected from bridge monitoring sensors are inherently non-stationary and exhibit multi-frequency characteristics due to varying structural components, load types, and environmental influences. Each damage pattern often manifests differently across distinct frequency bands and temporal resolutions [41]. Therefore, a single-scale feature representation is insufficient to capture the full spectrum of dynamic behaviors present in the structural response data.
To address this issue, the proposed framework employs a Multi-scale Feature Extraction (MSFE) module that decomposes each sensor signal into multiple receptive-field representations. The rationale behind this design lies in two aspects: (1) Temporal and frequency diversity. Bridge vibration data contain both short-term transient responses and long-term global oscillations. A multi-scale representation enables the model to perceive both fine-grained local fluctuations and large-scale structural trends simultaneously [3]. (2) Hierarchical structural sensitivity. Different types of bridge damage (e.g., girder cracks, bearing looseness, deck degradation) influence vibration signals at different frequency levels.
By extracting features through multiple convolution kernels with varying receptive fields, the model can adaptively learn discriminative features sensitive to different spatial and temporal scales.
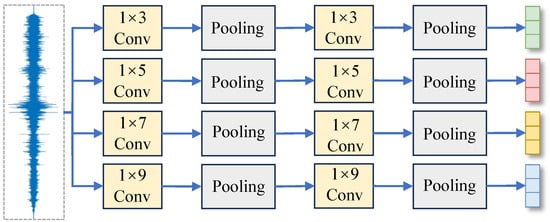
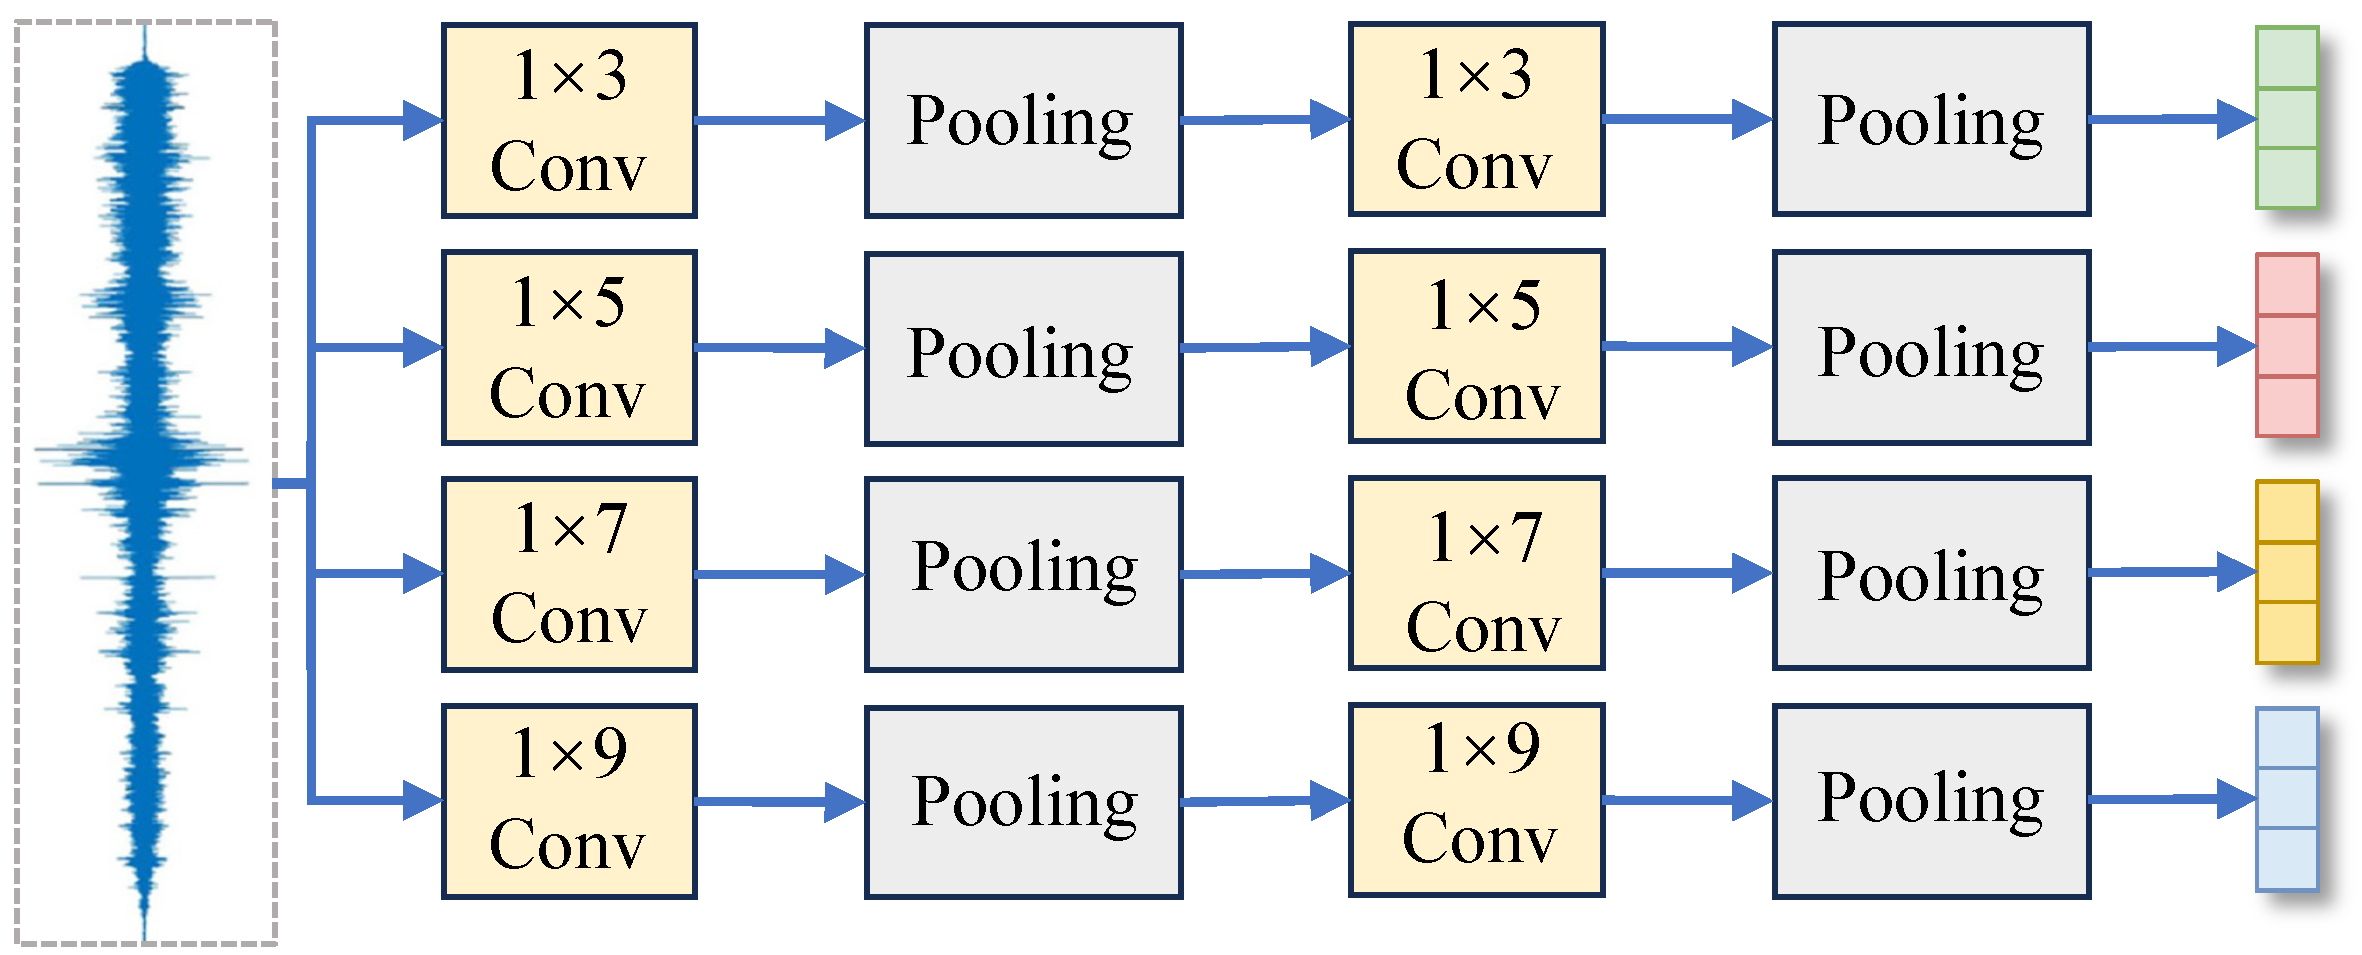
As illustrated in Figure 3, the proposed Multi-scale Feature Extraction (MSFE) module is designed to capture vibration characteristics of bridge structures at multiple temporal and frequency resolutions.
Figure 3.
The Multi-scale Feature Extraction module.
To achieve this, four parallel convolutional branches with kernel sizes of 1 × 3, 1 × 5, 1 × 7, and 1 × 9 are employed to process each sensor signal sequence independently. This architecture enables the model to perceive both fine-grained local fluctuations and long-range temporal dependencies within the vibration data.
Formally, given the input signal sequence of the i-th sensor , the first convolution–pooling operation is defined as:
where denotes the convolutional operation with kernel size , is the nonlinear activation function (e.g., ReLU), and represents the pooling operation for temporal downsampling while preserving key features.
Then, each branch performs a second convolution–pooling operation to further enhance the representational capacity:
producing four feature vectors with the same output length but distinct receptive-field characteristics.
Finally, the four feature vectors are concatenated to form the multi-scale feature representation:
Bridge health monitoring data collected from distributed vibration sensors are characterized by non-stationary properties, high noise levels, and complex temporal dependencies influenced by diverse operational and environmental factors. The proposed Multi-scale Feature Extraction (MSFE) module is specifically designed to address these characteristics by enabling a more expressive and resilient representation of vibration signals.
The MSFE module provides a comprehensive temporal–frequency representation of structural responses. Vibration signals from different bridge components, such as girders, bearings, and decks, exhibit distinct frequency behaviors under various excitations. Through multiple convolutional kernels with varying receptive fields, the module captures both low-frequency global responses and high-frequency local transients, allowing the representation to reflect the hierarchical nature of bridge dynamics beyond the capability of single-scale convolutional approaches.
The multi-scale convolutional architecture enhances the sensitivity of extracted features to structural degradation. Minor alterations in amplitude, phase, or spectral energy distribution, which often indicate early-stage damage, can be emphasized through receptive fields of different scales. This mechanism allows the model to detect small-scale or incipient structural anomalies that might otherwise remain undetected in a uniform-scale representation.
Robustness against environmental noise is inherently improved through multi-scale feature fusion. Since bridge vibration data are susceptible to variations in temperature, humidity, and dynamic loading, combining information across multiple temporal scales enables the network to suppress environmental perturbations and retain essential structural response patterns. This property ensures that the extracted features remain stable and informative under complex and variable monitoring conditions.
The fused representation generated by MSFE provides each sensor node with a hierarchically enriched embedding that supports downstream graph reasoning. Such representation enhances the discriminative power of local and global graph modules by capturing more diverse structural dependencies and damage propagation patterns. Through this hierarchical signal encoding, MSFE establishes an effective bridge between raw sensor measurements and high-level structural inference, improving both the precision and robustness of bridge damage detection.
3.4. Local Graph Feature Extraction
The vibration data obtained from each sensor after multi-scale feature extraction contain complex internal relationships that cannot be fully represented by simple sequential operations. To model these intrinsic dependencies within each sensor’s feature graph, a Local Graph Feature Extraction (LGFE) module based on the Graph Convolutional Network (GCN) is introduced. This module captures local structural correlations among the multi-scale feature components, allowing the model to encode spatially aware and topology-consistent representations.
Given the multi-scale feature representation of the i-th sensor , where N denotes the number of local feature nodes and d the feature dimension, a local adjacency matrix is constructed to describe the similarity among intra-sensor features. The GCN operation propagates and aggregates neighboring features as:
where is the adjacency matrix with self-connections, is the degree matrix, denotes the trainable weight matrix of the l-th layer, and represents the nonlinear activation function. The operation integrates feature information from neighboring nodes, effectively capturing localized correlations among the extracted multi-scale features.
After L layers of graph convolution, the final local representation is obtained as:
which encodes the intra-sensor structural dependencies and local dynamic behaviors. The resulting local embedding serves as a refined input for the subsequent global graph attention feature extraction module, where inter-sensor relationships are further modeled.
The Local Graph Feature Extraction (LGFE) module effectively addresses the intrinsic spatial and structural relationships embedded within the vibration features of each sensor. Bridge vibration signals exhibit strong local dependencies arising from the mechanical continuity of structural components, such as girders, decks, and bearings. By constructing an intra-sensor graph and applying graph convolutional operations, LGFE transforms these implicit correlations into explicit topological representations that enhance feature interpretability.
The graph-based representation allows each local node feature to aggregate contextual information from its neighboring nodes, leading to a more consistent description of the underlying physical behavior. This process helps suppress random noise and measurement uncertainty that typically arise in field-acquired bridge monitoring data, thereby producing smoother and more discriminative latent representations. The ability to capture local spatial smoothness is particularly beneficial for identifying damage-induced irregularities, which often manifest as local discontinuities or abnormal vibration patterns.
Unlike conventional convolutional or recurrent architectures that process feature sequences independently, LGFE incorporates structural constraints through its adjacency matrix , enabling the model to learn connectivity-aware feature embeddings. This facilitates the identification of damage-related changes that propagate through interconnected structural regions, a property that is difficult to achieve using purely temporal or frequency-domain approaches. Moreover, the localized graph learning provides an adaptive receptive field that automatically adjusts to the complexity of sensor responses, ensuring that both short-range and moderate-range interactions are effectively captured.
The resulting local embedding thus encodes intrinsic structural coherence within each sensor node, forming a robust intermediate representation for subsequent global reasoning. Through this hierarchical process, LGFE enhances the framework’s ability to detect subtle and spatially correlated damages in bridge structures under complex environmental and operational conditions.
3.5. Global Graph Attention Feature Extraction
The Global Graph Attention Feature Extraction (GGAFE) module aims to learn the global-level representation of bridge vibration responses by applying a graph attention mechanism on the previously constructed spatiotemporal correlation graph. Unlike graph convolutional operations that assume fixed and uniform aggregation weights, the graph attention network (GAT) adaptively learns the contribution of each neighboring node according to the current feature context, enabling more flexible and discriminative feature propagation.
Given the graph with M sensor nodes, and the local feature embedding matrix obtained from the LGFE module, a shared linear transformation is first applied to project the features into a latent subspace:
where is a learnable weight matrix.
The attention coefficient between node i and its neighbor j is computed as:
where is a learnable vector, and ∥ denotes the concatenation operation. To normalize the attention coefficients and emphasize relative importance, the softmax function is applied over the neighborhood of node i:
The updated feature representation for node i is obtained by aggregating information from its neighbors with attention weights:
where denotes a nonlinear activation function, such as ELU or ReLU.
To enhance stability and improve the expressive capacity, the GGAFE module adopts a multi-head attention strategy:
where K denotes the number of attention heads, and each and represent the learnable transformation and attention weights in the m-th head, respectively.
Finally, all global node embeddings are aggregated to form the global structural representation:
This output serves as the high-level feature input for the subsequent fusion and classification stages.
The GAT-based design in the GGAFE module enables adaptive feature propagation guided by learned attention scores, thereby enhancing the discriminability of vibration-based features and improving the overall robustness of bridge damage detection under varying operational conditions.
3.6. Feature Fusion and Damage Classification
For each sensor node i, the fusion operation is defined as:
where and denote the trainable weight matrix and bias term of the fusion layer, ∥ represents vector concatenation, and is a nonlinear activation function such as ReLU. The resulting vector serves as a compact discriminative representation of sensor i, encoding both localized vibration features and global structural relationships.
The fusion layer jointly embeds the local spatiotemporal features and the global structural information into a single node-level representation. This allows the model to retain fine-grained patterns while incorporating broader contextual relationships. The subsequent aggregation across nodes produces a unified feature vector that reflects both local sensitivity and global structural behavior. During training, the model automatically learns how to balance and integrate these complementary cues, ensuring that the classification network benefits from multi-scale information.
All sensor-wise fused representations are then aggregated into a unified feature vector:
where denotes an operation such as mean pooling, max pooling, or learned attention-based fusion across sensors. This step transforms the distributed sensor-level information into a global feature descriptor representing the overall bridge condition.
The final classification is achieved by feeding the fused feature into a fully connected layer:
where and are the parameters of the classification layer, and represents the predicted probability distribution over C damage categories.
During training, the cross-entropy loss is minimized:
where is the ground-truth label in one-hot form. The entire network is trained in an end-to-end manner, enabling joint optimization of the feature extraction, graph learning, and classification components.
The fusion and classification design ensures that the model captures the complementary nature of temporal–frequency features and graph-based structural dependencies. This integration significantly enhances the discriminative ability and robustness of the proposed framework in identifying various bridge damage states under complex environmental and operational conditions.
4. Experiments
4.1. Data Description
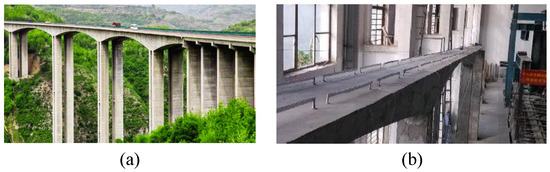
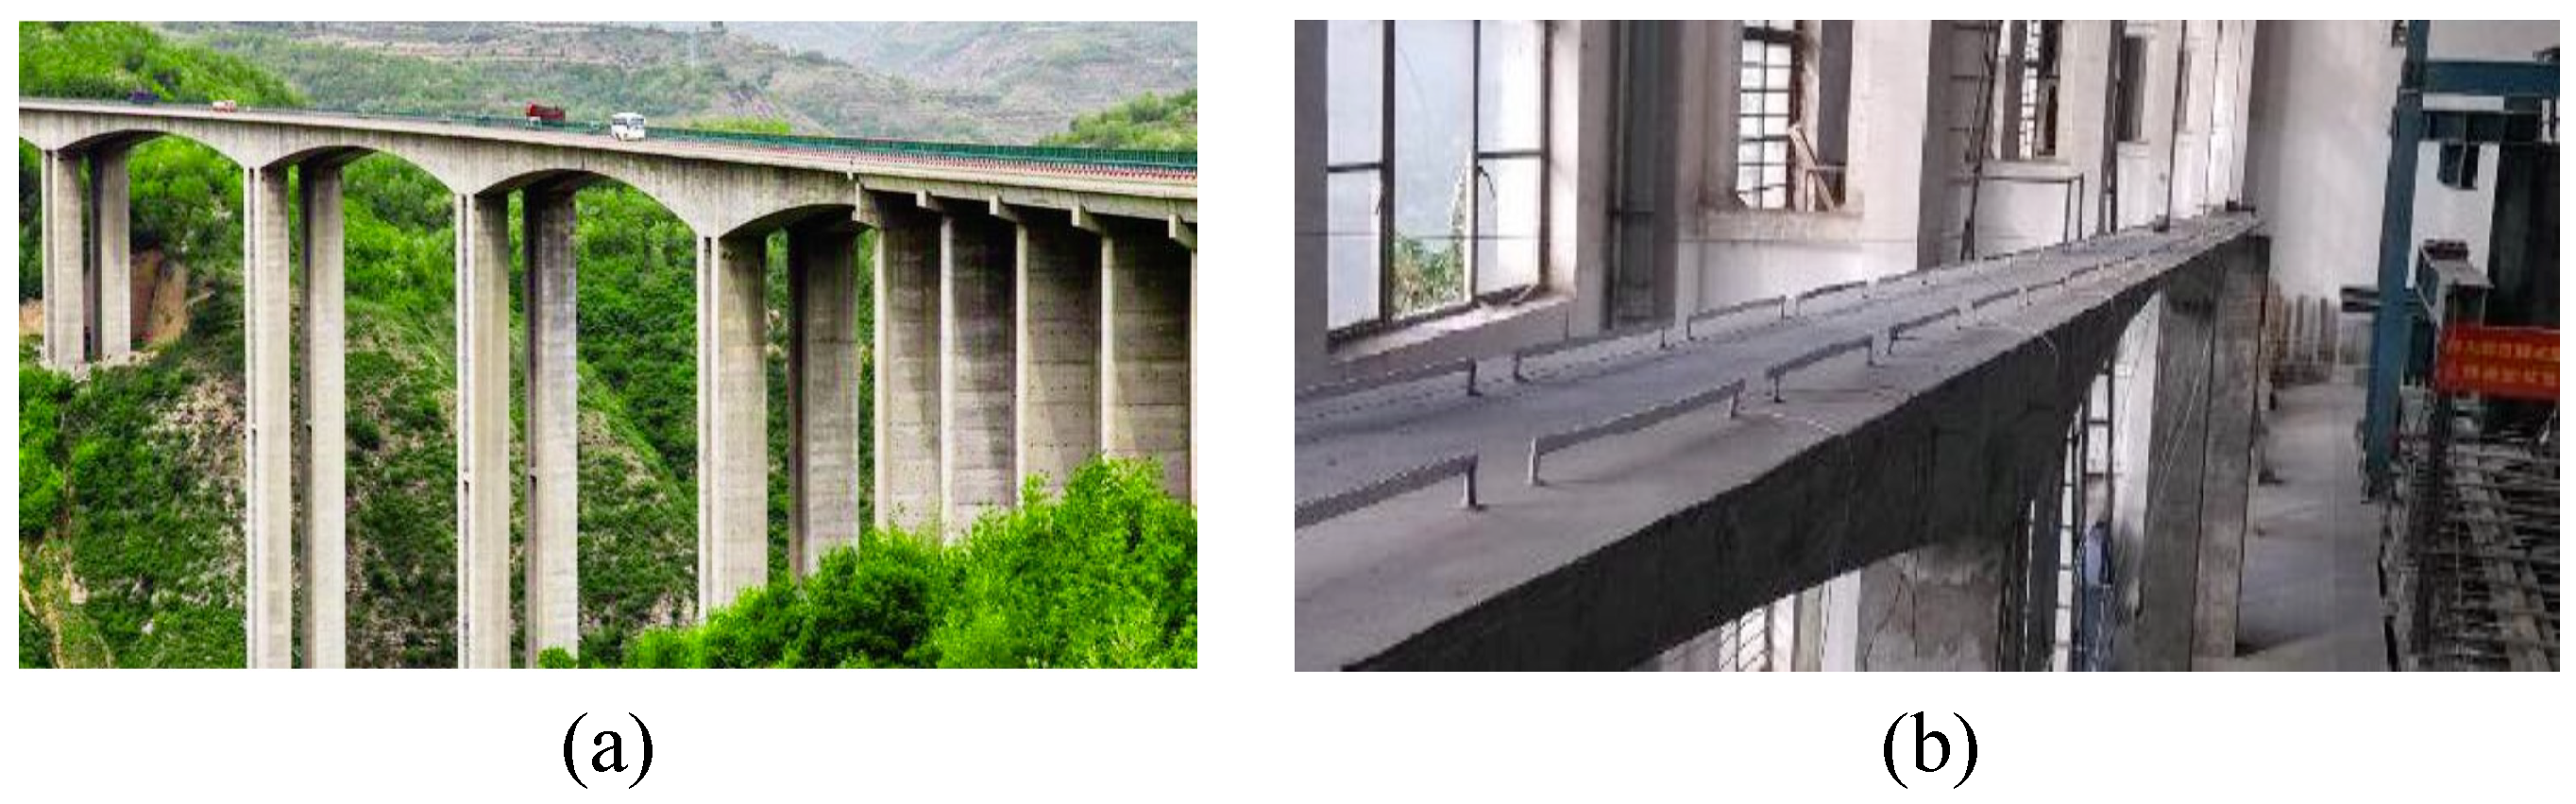
The experimental data used in this study were obtained from a scaled bridge model based on the prototype of the Heichonggou Grand Bridge located in Yunnan Province, China. The Heichonggou Bridge is a two-span continuous rigid-frame bridge, and a scaled physical model of its left span was constructed for controlled laboratory testing. As illustrated in Figure 4a, the original bridge structure is taken as the reference prototype, while Figure 4b shows the corresponding scaled model. The model was fabricated at a geometric scale ratio of 1:20 relative to the original prototype.
Figure 4.
Heichonggou Grand Bridge (a), and its scaled model (b).
The prototype bridge has a total length of 397 m, with a continuous rigid-frame configuration of m for the three spans. The superstructure is a prestressed concrete continuous box girder with a single-cell, single-box cross-section equipped with vertical diaphragms. The top width of the box girder is 12.5 m, and the bottom width is 6.5 m. The scaled model retains the same structural proportions and material similarity relationships as the prototype to ensure accurate simulation of its dynamic behavior.
To emulate the damage and deterioration conditions of the actual bridge, static loading tests were applied at the mid-span region of the scaled model to induce flexural cracking under concentrated loads. Three different static loading cases were conducted to generate distinct levels of structural damage, as summarized in Table 1.
Table 1.
Description of structural damage cases under different loading conditions.
The structural damage cases listed in Table 1 represent distinct modeled conditions that produce separable patterns in the response data. Each case corresponds to a well-defined structural state, ensuring that the dataset provides clear and consistent label categories suitable for supervised deep learning.
During the first excitation, an external load of 2.889 kg was applied at mid-span, resulting in a transverse crack on the bottom slab with a width of 0.06 mm and a length of 14.3 cm. In the second excitation, when the applied load increased to 6.097 kg, two transverse cracks were observed at the same location, with widths ranging from 0.11–0.13 mm and 0.02–0.04 mm, respectively, while the crack length remained unchanged. During the third excitation, a load of 8.519 kg was applied, and the widths of the two transverse cracks further increased to 0.12 mm and 0.06–0.08 mm, respectively, while their lengths remained constant.
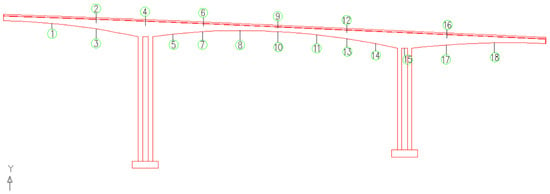
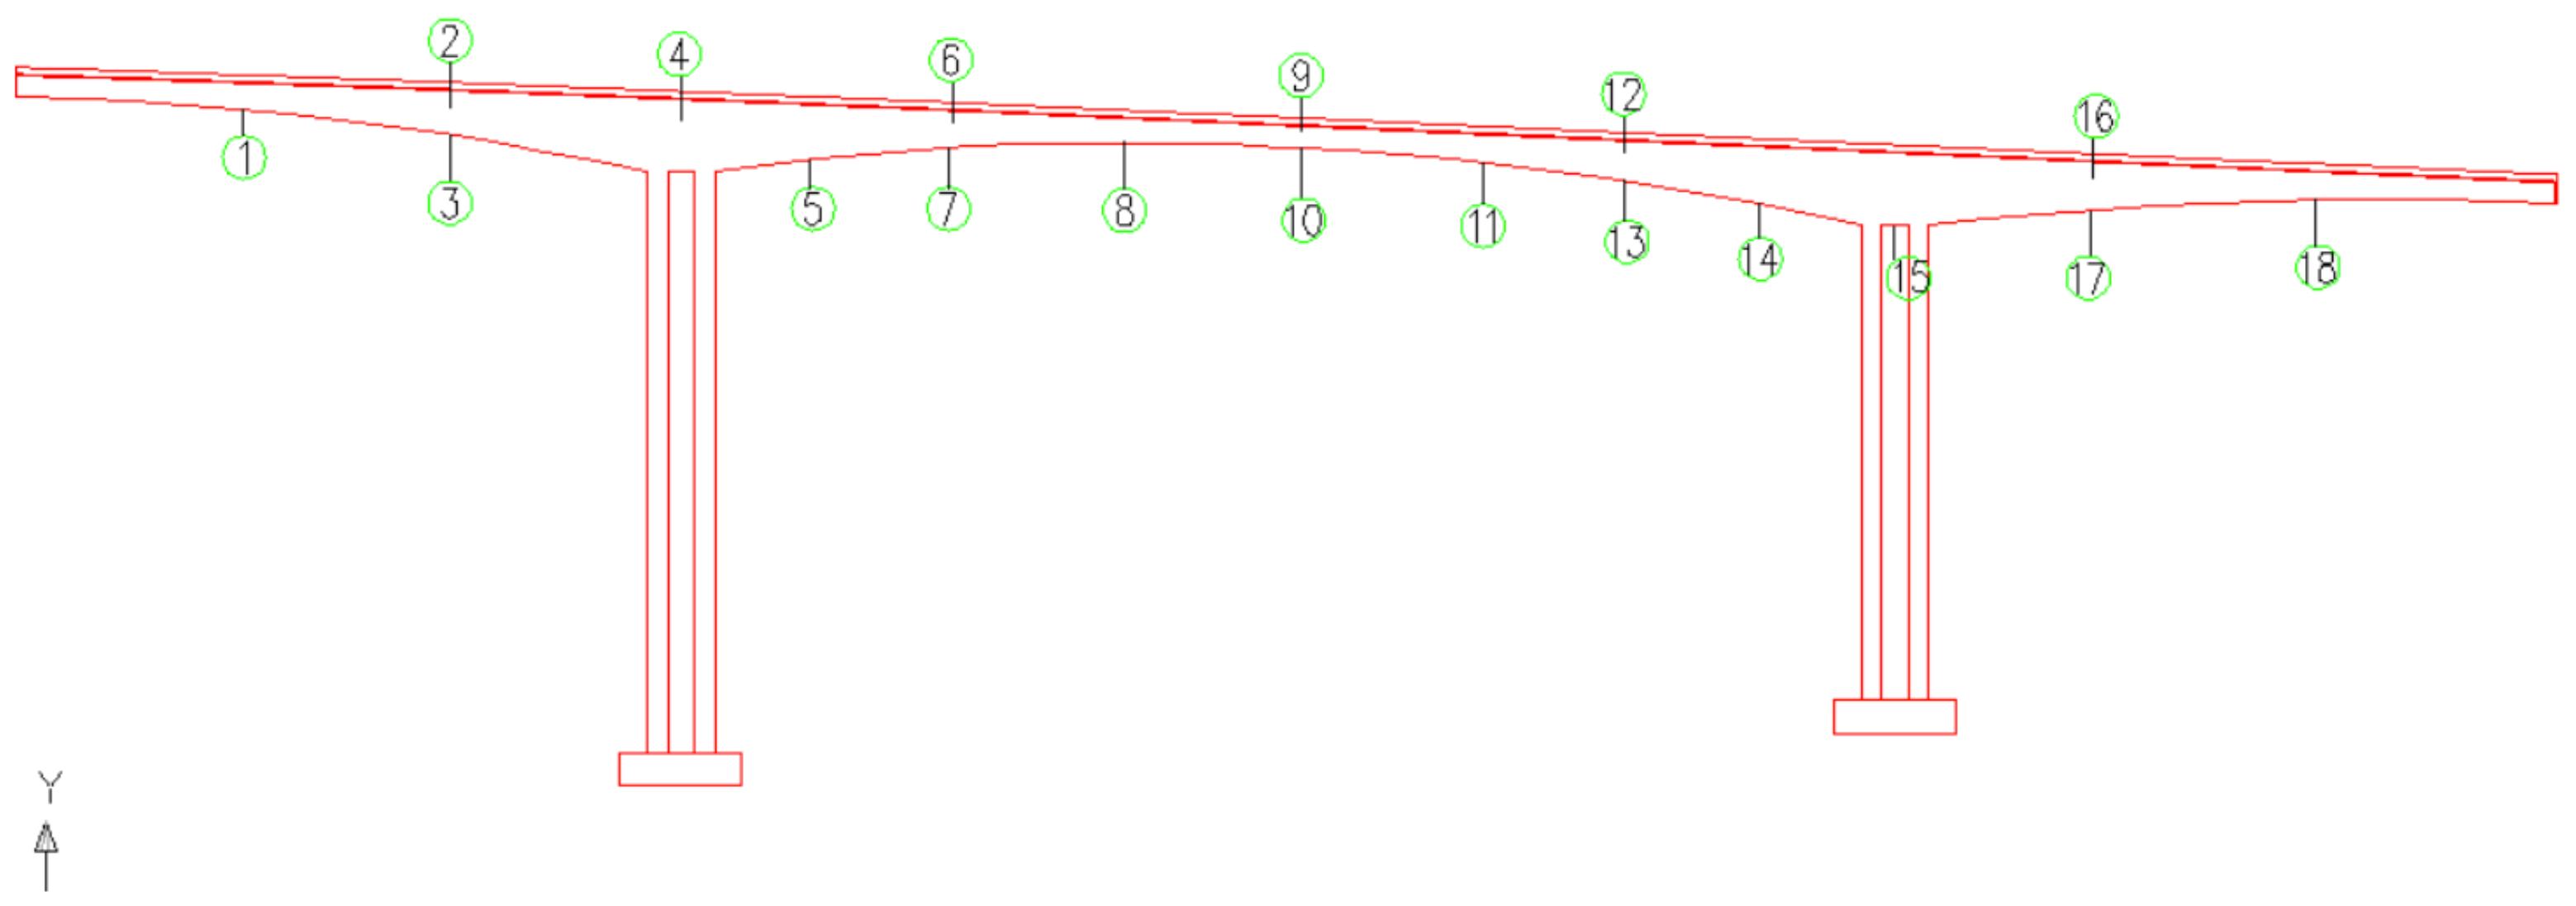
A total of 18 acceleration sensors were installed on the scaled bridge model to capture its vibration responses under different structural conditions. The layout of the measurement points is illustrated in Figure 5, and the detailed sensor configuration is listed in Table 2. Among these sensors, 12 were configured to record vertical accelerations and 6 were used to capture horizontal accelerations. The sensors were mounted at critical structural positions along the bridge model to ensure comprehensive coverage of both span and pier regions.
Figure 5.
Heichonggou Grand Bridge, and its scaled model.
Table 2.
Details of acceleration sensor arrangement on the scaled bridge model.
Specifically, four accelerometers were installed on the outer web and bottom slab at the position of the side span, two accelerometers were installed on the bottom slab at the position of the side span, and two accelerometers were mounted on the outer web of the side-span pier top. The remaining sensors were distributed across the mid-span and central region of the bridge model to accurately capture global and local vibration responses. The directions of acceleration measurements were defined as: X for the longitudinal direction (along the bridge axis), Y for the transverse direction (perpendicular to the web), and Z for the vertical direction (perpendicular to the ground).
During each damage scenario (D1–D4), the acceleration signals were collected synchronously from all sensors using a multi-channel data acquisition system. The sampling frequency was set sufficiently high to capture the dominant vibration modes of the structure and to ensure accurate modal identification. Each measurement lasted for several seconds to guarantee the stationarity of the acquired data, and the signals were subsequently preprocessed using standard filtering and normalization procedures before feature extraction.
4.2. Experimental Settings
The proposed bridge damage detection framework was implemented using PyTorch 2.2.1 on an NVIDIA RTX 3090 GPU with 24 GB memory. All models were trained using the Adam optimizer with an initial learning rate of 0.001 and a weight decay coefficient of to prevent overfitting. The batch size was set to 128, and the maximum number of training iterations was fixed at 100. The cross-entropy loss function was adopted to measure the classification error between predicted and true damage labels. The learning rate was adaptively adjusted using a cosine annealing schedule during training to ensure stable convergence. The detailed experimental setup is shown in Table 3.
Table 3.
Hyperparameter settings for the proposed model training.
The dataset was randomly divided into three subsets: 60% for training, 20% for validation, and 20% for testing. To guarantee reproducibility, all experiments were repeated five times with different random seeds, and the average accuracy was reported as the final performance metric. During training, dropout and batch normalization were incorporated to enhance the generalization ability of the network. All input signals were normalized to zero mean and unit variance before being fed into the model.
4.3. Evaluation Metrics
To quantitatively evaluate the performance of the proposed bridge damage detection framework, four standard classification metrics were adopted: Accuracy, Precision, Recall, and F1-score. These metrics comprehensively assess the model’s capability from both overall and class-wise perspectives, providing insights into its correctness and robustness in damage identification tasks.
Let TP, TN, FP, and FN denote the numbers of true positives, true negatives, false positives, and false negatives, respectively. The definitions of the evaluation metrics are as follows:
Accuracy reflects the overall proportion of correctly classified samples, while Precision measures the reliability of positive predictions. Recall evaluates the model’s sensitivity to actual positive samples, i.e., its ability to correctly identify damaged cases. The F1-score is the harmonic mean of Precision and Recall, providing a balanced indicator when both false positives and false negatives are considered important. For multi-class bridge damage classification, the metrics were computed for each class and averaged using the macro-averaging strategy to ensure fair comparison among different damage levels.
4.4. Performance Comparison of Different Models
To validate the effectiveness of the proposed Global Graph Attention (GGA)-based framework, its performance was compared with both non-graph-based deep learning models and various graph convolutional network (GCN) variants. All models were trained and evaluated under identical experimental settings to ensure fair comparison. Four widely used evaluation metrics, namely Accuracy, Precision, Recall, and F1-score, were adopted for quantitative assessment.
The proposed method was first compared with several representative deep learning baselines, including CNN [42], 1D-CNN [43], LSTM [44], BiLSTM [45], and Transformer [46]. These models primarily focus on temporal feature extraction but do not explicitly consider spatial or structural dependencies among sensor nodes. The results are summarized in Table 4.
Table 4.
Performance comparison between the proposed method and non-graph-based deep learning models.
As shown in Table 4, the proposed LGSTA-GNN model significantly outperforms conventional deep learning approaches. While the Transformer achieves relatively high accuracy (92.16%), it still fails to capture the complex spatial correlations among bridge sensor nodes, resulting in performance limitations. The LGSTA-GNN method effectively integrates multi-scale temporal features with global structural dependencies, yielding an F1-score improvement of approximately 5.2% compared with the Transformer baseline.
To evaluate the effectiveness of the proposed LGSTA-GNN framework, we compare its performance with several representative graph-based models, including Graph Convolution Network (GCN) [47], Chebyshev Graph Convolution Network (ChebNet) [48], Anti-symmetric Graph Convolution Network (Anti-SGCN) [49], Cluster Graph Convolution Network (ClusterGCN) [50], and Adaptive Filters and Aggregator Fusion GCN (AFGCN) [51]. The evaluation metrics include Accuracy, Precision, Recall, and F1-score, which collectively reflect the classification performance across different bridge damage levels.
As shown in Table 5, the conventional GCN achieves an Accuracy of 89.77%, a Precision of 88.07%, a Recall of 89.78%, and an F1-score of 88.84%. ChebNet improves slightly to 90.38% Accuracy and 89.54% F1-score. Anti-SGCN and ClusterGCN further enhance the classification performance, achieving 90.87% and 91.74% Accuracy, respectively, with corresponding F1-scores of 90.04% and 90.92%. AFGCN achieves 92.36% Accuracy and 91.62% F1-score, demonstrating the benefit of adaptive filters and aggregation mechanisms for graph convolutional operations.
Table 5.
Performance comparison of different models on bridge damage classification.
The proposed LGSTA-GNN model surpasses all baseline models, achieving 93.48% Accuracy, 92.30% Precision, 93.48% Recall, and 92.86% F1-score. This improvement can be attributed to the combination of multi-scale feature extraction, local graph feature modeling, and global graph attention, which allows the network to effectively capture both intra-sensor and inter-sensor structural dependencies. In particular, the global attention mechanism enables the model to focus on critical sensor nodes that are most indicative of bridge damage, thereby enhancing classification accuracy and robustness. Overall, the results confirm that the proposed LGSTA-GNN framework provides superior discriminative capability and better generalization performance in the context of bridge damage detection.
Based on the above results, the proposed LGSTA-GNN framework exhibits distinct advantages over both non-graph and graph-based counterparts. From a methodological viewpoint, the superior performance can be attributed to the synergistic integration of multi-scale temporal feature extraction, localized structural modeling, and global attention mechanisms. The MSFE module effectively captures vibration characteristics at multiple temporal scales, enabling the network to represent both local transient responses and long-term global trends. The LGFE component further strengthens the internal structural representation of each sensor by exploiting localized topological information through graph convolutions. Building upon this foundation, the GGA mechanism adaptively assigns importance weights to sensor nodes according to their structural relevance, allowing the model to focus more on critical regions that are sensitive to damage.
In terms of application to bridge damage detection, the LGSTA-GNN model demonstrates notable advantages in both accuracy and interpretability. By incorporating graph attention into the global representation learning process, the model can not only achieve highly accurate classification of different damage states but also identify sensors that contribute most significantly to the decision-making process. This interpretability provides valuable insights into the spatial distribution of potential damages, which is crucial for practical structural health monitoring. Overall, the proposed framework achieves an optimal balance between detection precision, model generalization, and physical interpretability, making it a promising and effective approach for intelligent bridge damage assessment.
4.5. Visualization of Prediction Results
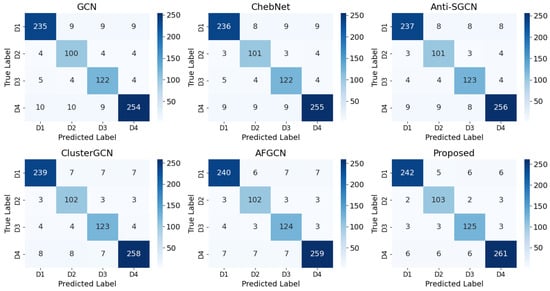
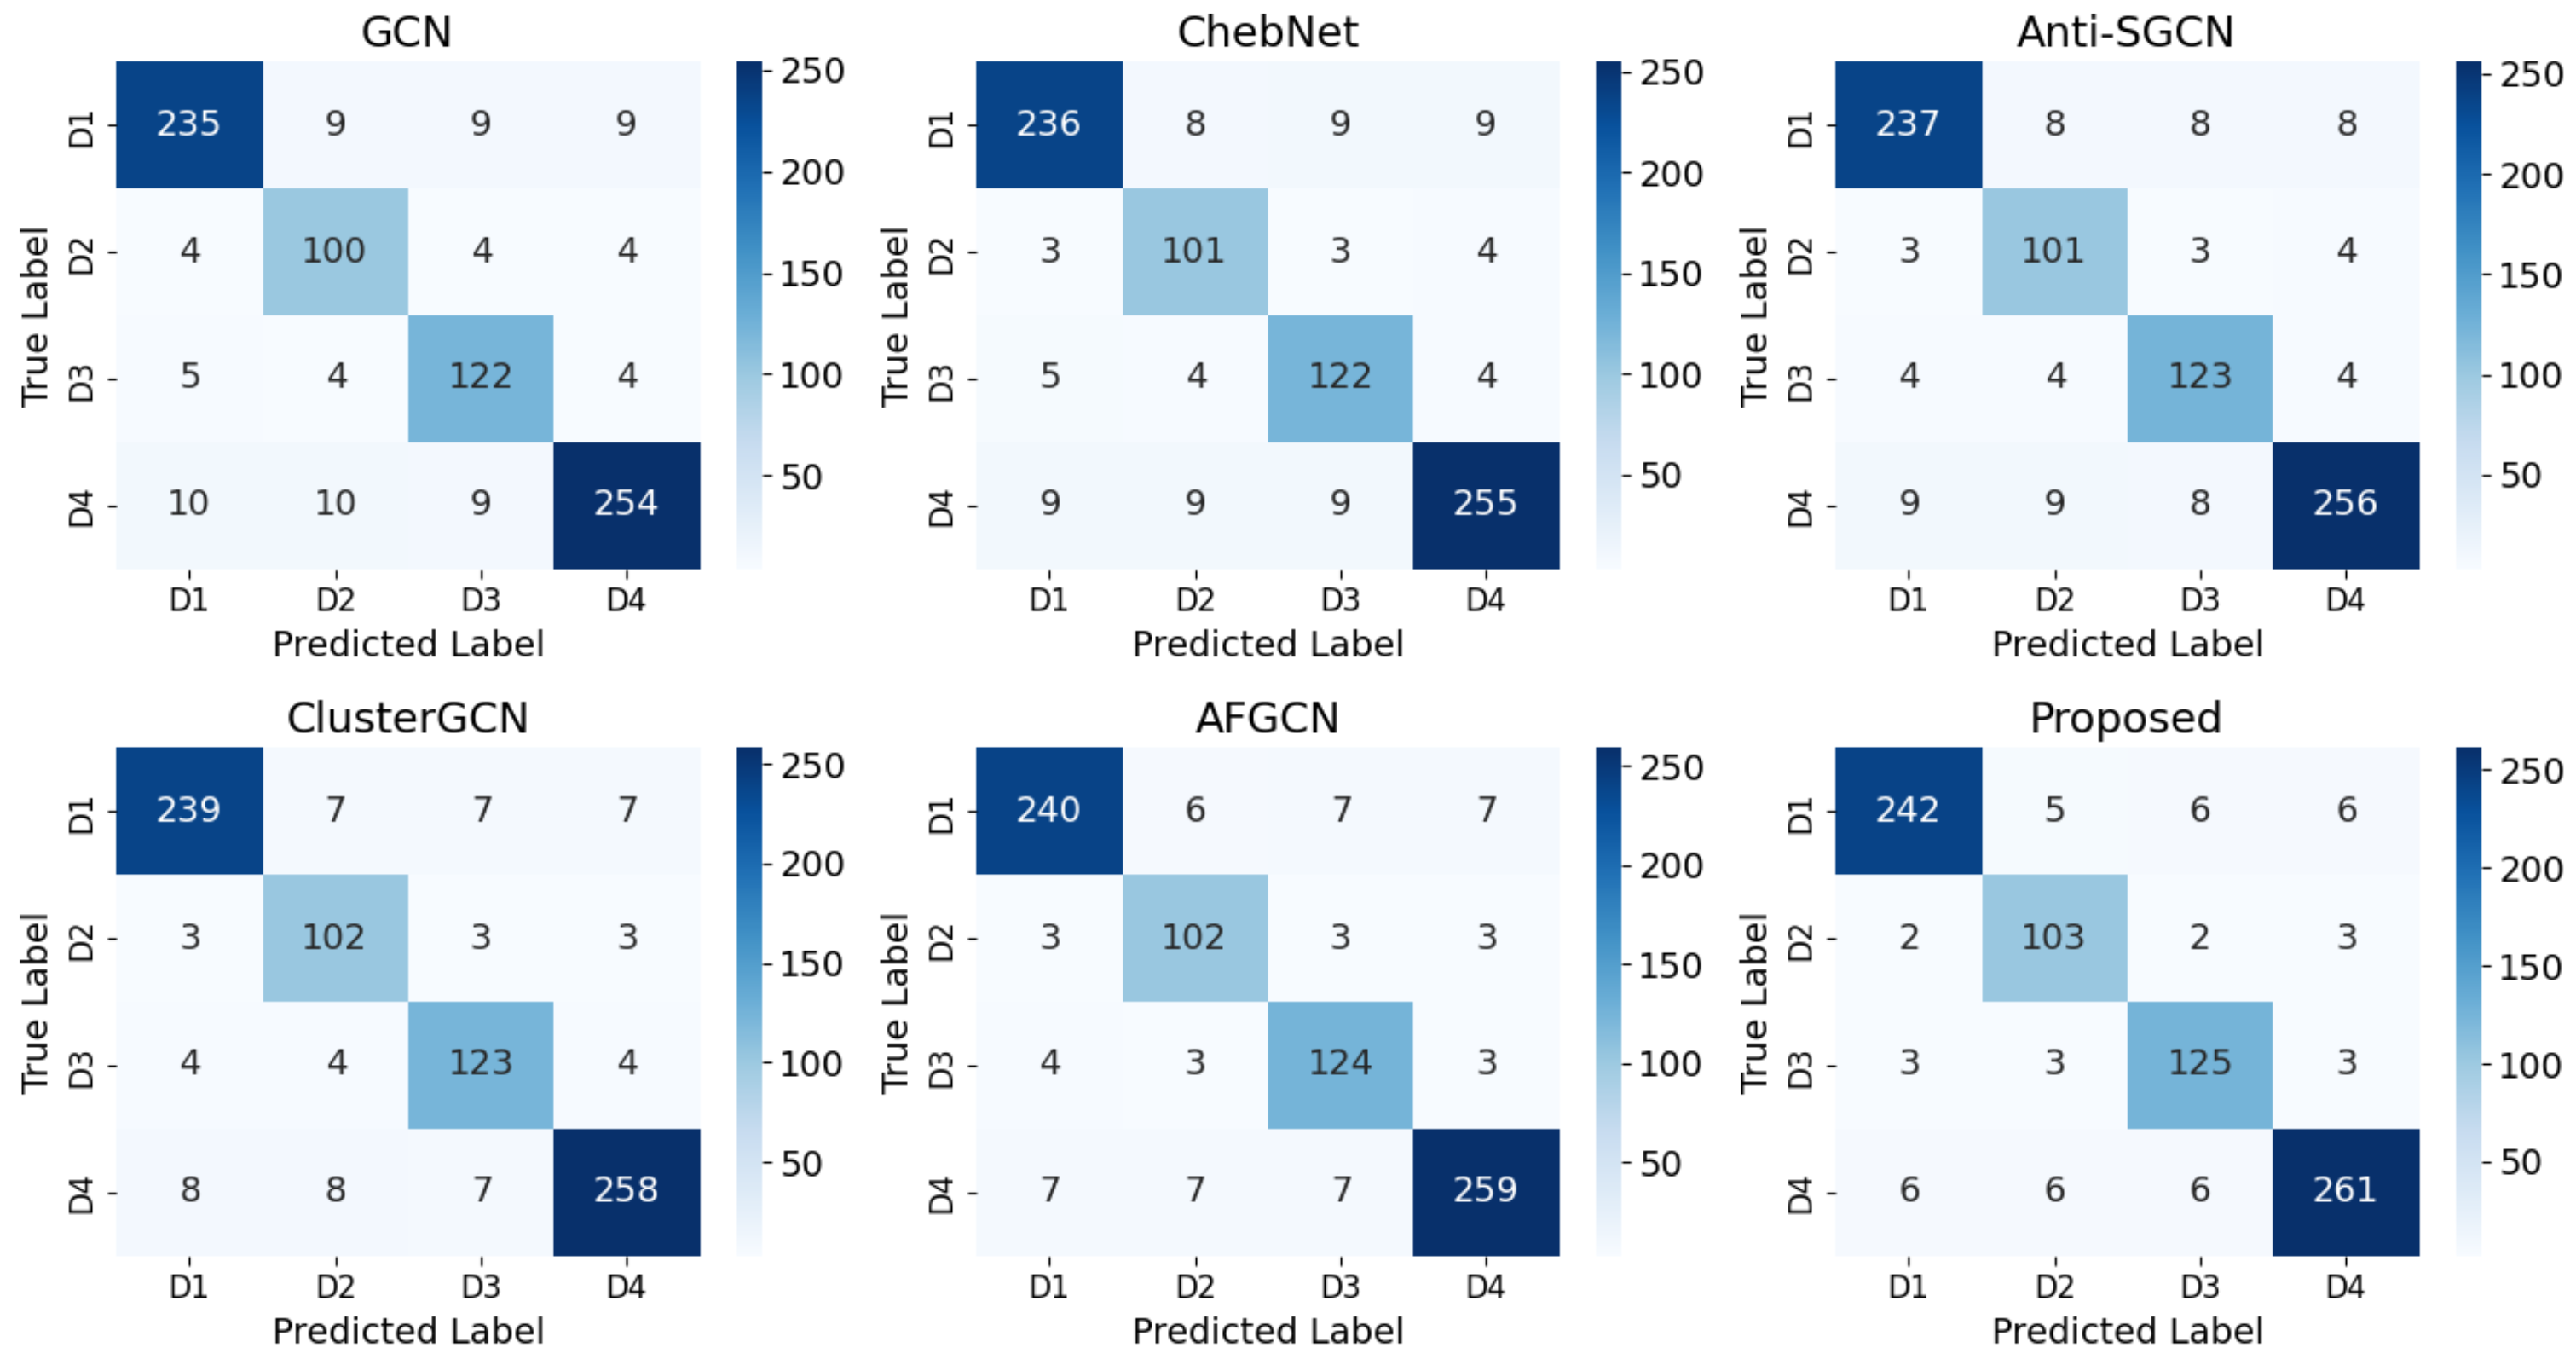
To further explore the model performance on bridge damage classification, the confusion matrices of different models are illustrated in Figure 6. It can be observed that the proposed LGSTA-GNN framework achieves significantly improved prediction consistency across all four damage levels compared with other graph convolutional models.
Figure 6.
Confusion matrices of different models.
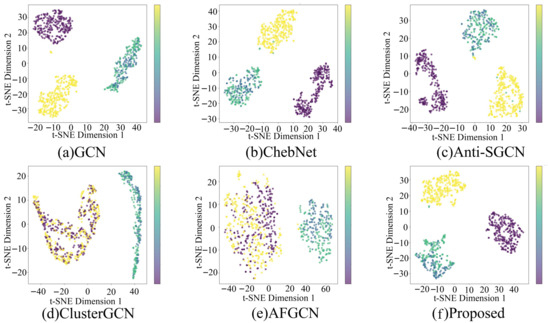
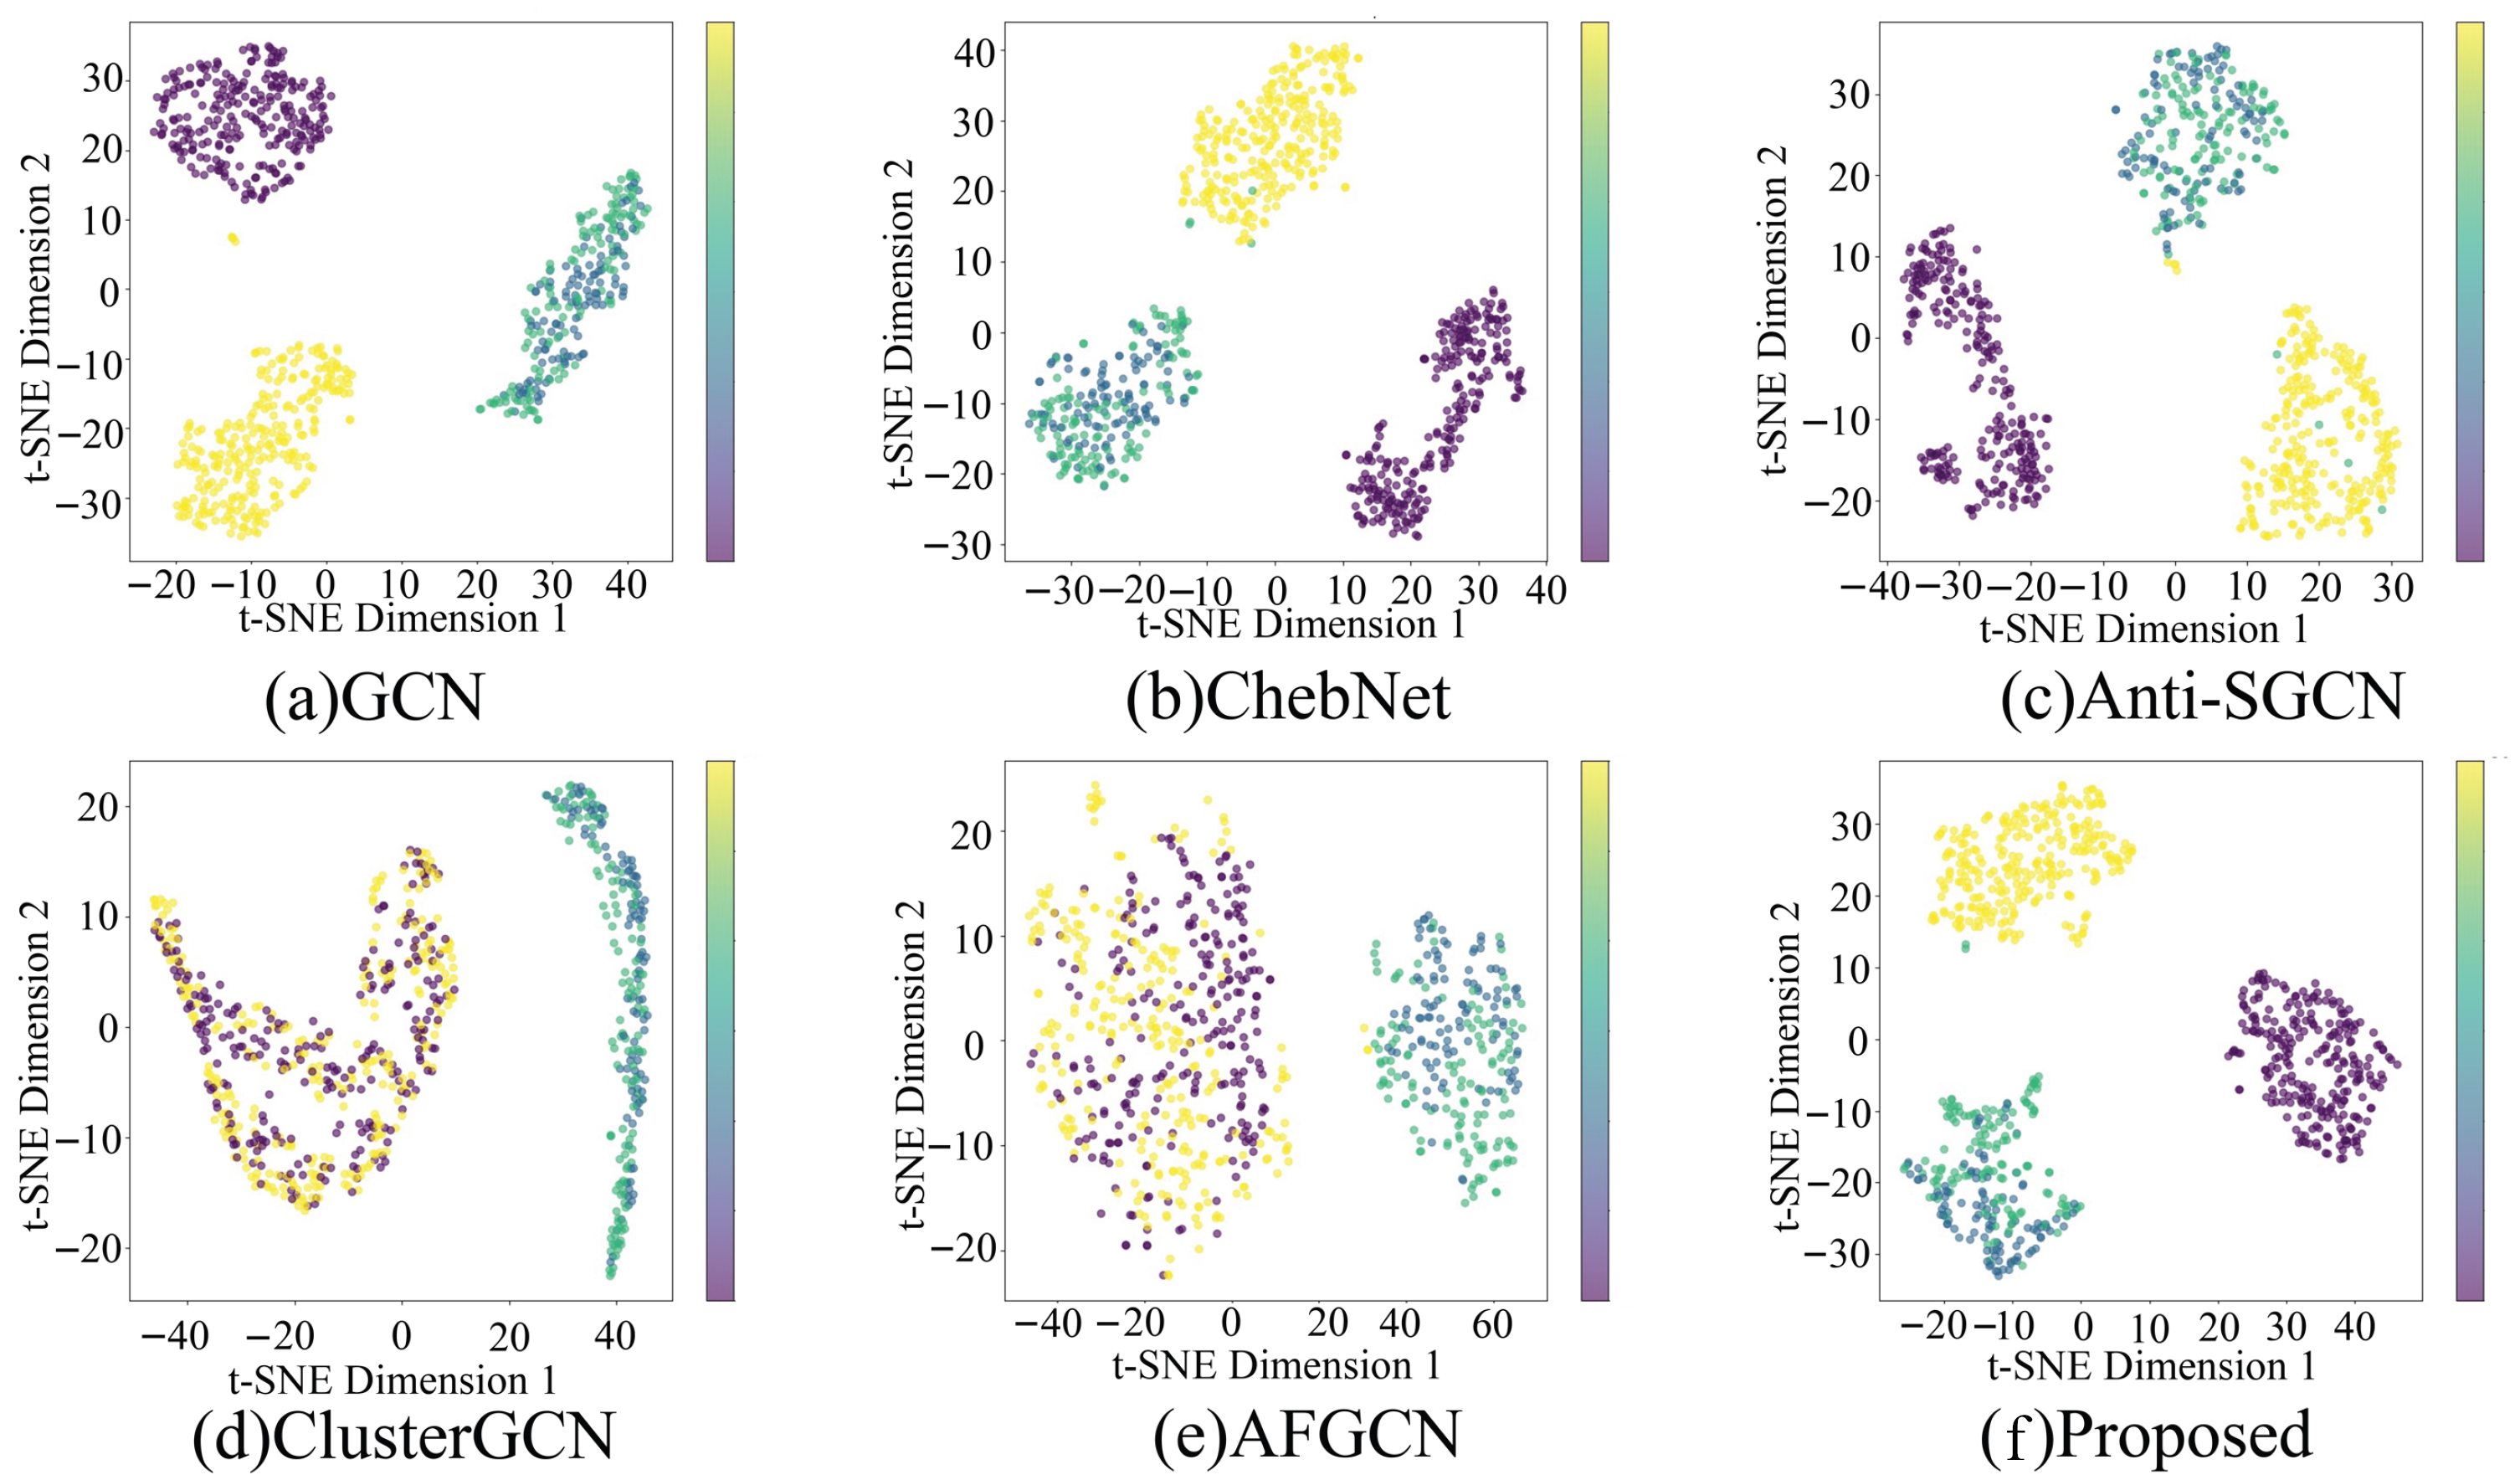
To further evaluate the learned feature representation capability of different models, the t-SNE visualizations of the high-dimensional embeddings are shown in Figure 7. These results intuitively reflect how well the different bridge damage states can be separated in the latent feature space.
Figure 7.
Visualization of t-SNE for each method.
For the GCN model, although the four classes generally form independent clusters, significant overlaps can still be observed between D2 and D3 samples, indicating limited discrimination of subtle structural degradation. ChebNet and Anti-SGCN achieve moderate improvements by enhancing message propagation, yet the boundary between adjacent damage levels remains unclear, suggesting that these models still struggle to characterize complex structural variations.
ClusterGCN and AFGCN further improve the distribution compactness, and the inter-class margins increase noticeably. However, some D3 and D4 samples still intersect and scatter, demonstrating that the learned features are not sufficiently robust to distinguish moderate and severe damage conditions under noisy monitoring environments.
In contrast, the proposed LGSTA-GNN framework produces the most compact intra-class clusters and the largest inter-class separation. The feature distribution of each damage category shows clear structural grouping, and the transitions between adjacent classes are significantly reduced. This superiority demonstrates that the integrated multi-scale feature extraction, local graph dependency modeling, and global attention mechanisms enable the model to effectively capture both local vibration characteristics and global structural behavior changes.
Overall, the t-SNE visualization results clearly verify that the proposed approach generates a well-organized and highly discriminative latent feature space, which leads to more reliable bridge damage identification and stronger robustness against misclassification between closely related damage states. As shown, the proposed LGSTA-GNN generates representations with clearer cluster separation and more compact intra-class distributions compared with other approaches. This indicates that the model is able to extract more discriminative and structurally meaningful features from the spatiotemporal data. In contrast, the other methods exhibit more overlap between classes and less coherent embedding structures, suggesting weaker capability in distinguishing different structural conditions. These differences in embedding organization highlight the advantage of incorporating both local and global spatiotemporal attention mechanisms, which enable LGSTA-GNN to form a more informative latent representation space that aligns with the structural damage classification task.
4.6. Ablation Study
To further investigate the contribution of each component in the proposed LGSTA-GNN framework, ablation experiments were conducted by selectively removing the Multi-scale Feature Extraction (MSFE), Local Graph Feature Extraction (LGFE), and Global Graph Attention (GGA) modules. All variants were trained and evaluated under identical settings to ensure a fair comparison. The results are summarized in Table 6.
Table 6.
Ablation study results of different architectural variants.
The removal of MSFE results in a performance drop of 1.22% in Accuracy, demonstrating its importance in capturing multi-scale structural vibration characteristics. Eliminating LGFE leads to a degradation of 1.91% in F1-score, confirming that modeling local structural dependencies enhances the discriminability of sensor features. Notably, removing the GGA component causes the largest performance drop (2.46% in Accuracy), which highlights the crucial role of global dependency learning in distinguishing closely related bridge damage states.
These results clearly verify that each module contributes positively to the overall performance, and the full configuration achieves the best classification capability due to the complementary strengths of multi-scale temporal feature extraction and hierarchical graph representation learning.
5. Discussion
Although bridge design specifications provide comprehensive guidelines on structural design, load requirements, and conventional inspection procedures, they currently do not include explicit quantitative criteria for vibration-based or machine-learning-based structural damage detection. Existing codes focus on structural safety and inspection protocols, but they do not prescribe thresholds, performance metrics, or evaluation standards for data-driven detection methods such as those proposed in this study. The lack of specification-defined benchmarks also highlights the potential for future integration of data-driven structural health monitoring techniques into formal engineering guidelines. The proposed approach contributes toward this direction by providing spatiotemporal insights into structural behavior that are not explicitly addressed in current specifications.
Moreover, the hierarchical architecture and adaptive attention mechanism of the LGSTA-GNN framework provide a strong basis for scaling to long-span bridges equipped with hundreds of sensors. The local graph module processes each sensor independently and can be parallelized, enabling efficient computation as the network size increases, while the global attention mechanism automatically highlights structurally critical inter-sensor relationships and suppresses redundant information. These characteristics improve robustness in dense monitoring systems. Nevertheless, large-scale deployments also introduce challenges. Fully connected graphs may incur significant computational overhead and may include weak or noisy correlations, which can degrade performance. To address these issues, sparse or clustered graph constructions—such as region-based grouping or correlation thresholding—become essential for retaining efficiency without sacrificing accuracy.
An important conceptual consideration is the limitation associated with the use of static or window-averaged estimators in the current implementation of the framework. Damage-induced nonlinear effects often occur over short time intervals—sometimes within only a few vibration cycles—such as the transient partialization and tension-loss phenomena observed during the passage of heavy vehicles on prestressed concrete girders. When responses are averaged over windows of several seconds, these short-lived nonlinearities may be attenuated, thereby reducing the diagnostic sensitivity of the extracted features. The proposed LGSTA-GNN framework, as presented, assumes quasi-stationarity within each fixed analysis window, and therefore may not fully capture these rapid transient behaviors. Nevertheless, the architecture is amenable to extension through adaptive windowing, sliding time segments, or event-triggered segmentation, which would allow the model to perform time-localized analysis and preserve short-duration nonlinear signatures. Incorporating such mechanisms will be a key direction for future work to enhance the method’s applicability to highly non-stationary structural events.
6. Conclusions
This paper proposes a novel bridge damage detection framework based on Global Graph Attention (GGA), which integrates multi-scale temporal feature extraction and hierarchical graph representation learning for improving vibration-based structural condition assessment. The main conclusions are summarized as follows:
(1) A multi-scale temporal feature extraction strategy (MSFE) is introduced, enabling the model to effectively capture both local transient responses and global low-frequency vibration characteristics that are essential for damage-sensitive representation learning.
(2) A hierarchical graph-based architecture combining Local Graph Feature Extraction (LGFE) and Global Graph Attention (GGA) is developed, allowing the model to jointly learn intra-sensor structural patterns and inter-sensor spatial dependencies, thereby enhancing feature discriminability.
(3) Experimental results on a scaled bridge model demonstrate superior performance, showing that the proposed framework significantly outperforms state-of-the-art graph convolutional networks and conventional deep learning methods in damage state identification.
(4) Visualization analyses (confusion matrices and t-SNE) confirm the robustness of the extracted features, revealing more compact class clusters and improved separability across progressive damage levels.
(5) Ablation studies validate the contribution of each module, with the global attention mechanism playing the most critical role in boosting diagnostic accuracy.
(6) The proposed LGSTA-GNN framework shows strong potential for practical SHM applications, and future work will focus on extending the framework to field-scale monitoring systems, incorporating environmental variability, and enabling real-time damage localization through interpretable attention mechanisms.
Author Contributions
Conceptualization, J.Y. and Y.Z.; methodology, J.Y. and D.L.; software, D.L. and J.S.; validation, D.L., J.L. and L.C.; formal analysis, D.L. and J.S.; investigation, D.L. and L.C.; resources, J.Y. and Y.Z.; data curation, J.S., L.C. and L.Z.; writing—original draft preparation, D.L.; writing—review and editing, J.Y. and Y.Z.; visualization, D.L.; supervision, J.Y.; project administration, J.Y. and Y.Z.; funding acquisition, J.Y. All authors have read and agreed to the published version of the manuscript.
Funding
This research was funded by the National Natural Science Foundation of China under Grant 62572087, the Chongqing Natural Science Foundation Innovation and Development Joint Fund under Grant CSTB2025NSCQ-LZX0094, the Science and Technology Research Program of Chongqing Municipal Education Commission under Grants KJZD-M202300703 and KJZD-K202400709, and the Technology Innovation and Application Development Special Major Program of Chongqing Science and Technology Bureau under Grants CSTB2023TIAD-STX0015.and Supported by the Science and Technology Research Program of Chongqing Municipal Education Commission Grant KJZD-K202503403, and Project number in the field of technology Grant CSTB2024NSCQ-MSX0545, Chongqing Science and Technology Research Project under Grants KJQN202301803, and the Hechuan District of Chongqing Municipal Research Project HCKJ-2025-79, School-level research project CRKZK2023001, and the 2025 National Undergraduate Innovation Training Program Research Project 202513548006.
Data Availability Statement
The data generated and/or analyzed during the current study are not publicly available due to legal/ethical reasons but are available from the corresponding author upon reasonable request.
Conflicts of Interest
The authors declare no conflicts of interest.
References
- Wang, Y.; Luk, W.S.; Song, Y.; Yam, M.C.; Lin, X.M.; Zhang, P. Net section failure of stainless steel staggered bolted connections. Thin-Walled Struct. 2025, 217, 113884. [Google Scholar] [CrossRef] [Scilit]
- Sun, H.; Song, L.; Yu, Z. Bridge damage identification using a small amount of damage labeling data. Comput.-Aided Civ. Infrastruct. Eng. 2025, 40, 2729–2750. [Google Scholar] [CrossRef] [Scilit]
- Wang, Y.; Chen, B.; Dai, P.; Chen, Y.; Zhang, Z.; Lu, P.; Huang, C. Design recommendations for perforated S32001 high-strength stainless steel girders under concentrated loading. In Proceedings of the Structures; Elsevier: Amsterdam, The Netherlands, 2025; Volume 78, p. 109295. [Google Scholar]
- Ritto, T.; Rochinha, F. Digital twin, physics-based model, and machine learning applied to damage detection in structures. Mech. Syst. Signal Process. 2021, 155, 107614. [Google Scholar] [CrossRef] [Scilit]
- Wang, Y.; Chen, B.; Dai, P.; Wang, Y.; Song, Y.; Jiang, K.; Hai, L. Experimental and numerical study on lateral-torsional buckling of welded QN1803 high-strength stainless steel I-girders. Thin-Walled Struct. 2025, 212, 113190. [Google Scholar] [CrossRef] [Scilit]
- Ditommaso, R.; Mucciarelli, M.; Ponzo, F.C. Analysis of non-stationary structural systems by using a band-variable filter. Bull. Earthq. Eng. 2012, 10, 895–911. [Google Scholar] [CrossRef] [Scilit]
- Ditommaso, R.; Ponzo, F.C.; Auletta, G. Damage detection on framed structures: Modal curvature evaluation using Stockwell Transform under seismic excitation. Earthq. Eng. Eng. Vib. 2015, 14, 265–274. [Google Scholar] [CrossRef] [Scilit]
- Ditommaso, R.; Mucciarelli, M.; Parolai, S.; Picozzi, M. Monitoring the structural dynamic response of a masonry tower: Comparing classical and time-frequency analyses. Bull. Earthq. Eng. 2012, 10, 1221–1235. [Google Scholar] [CrossRef] [Scilit]
- Ditommaso, R.; Ponzo, F.C. Automatic evaluation of the fundamental frequency variations and related damping factor of reinforced concrete framed structures using the Short Time Impulse Response Function (STIRF). Eng. Struct. 2015, 82, 104–112. [Google Scholar] [CrossRef] [Scilit]
- Mucciarelli, M.; Bianca, M.; Ditommaso, R.; Gallipoli, M.; Masi, A.; Milkereit, C.; Parolai, S.; Picozzi, M.; Vona, M. Far field damage on RC buildings: The case study of Navelli during the L’Aquila (Italy) seismic sequence, 2009. Bull. Earthq. Eng. 2011, 9, 263–283. [Google Scholar] [CrossRef] [Scilit]
- Silik, A.; Noori, M.; Ghiasi, R.; Wang, T.; Kuok, S.C.; Farhan, N.S.; Dang, J.; Wu, Z.; Altabey, W.A. Dynamic wavelet neural network model for damage features extraction and patterns recognition. J. Civ. Struct. Health Monit. 2023, 13, 925–945. [Google Scholar] [CrossRef] [Scilit]
- Chen, D.; Zhang, Y.; Xu, S.; Li, Z.; Yang, C. Experimental Study on Bridge Structural Damage Identification Based on Quasi-Static Displacement Effects and Wavelet Packet Decomposition. Buildings 2023, 13, 2974. [Google Scholar] [CrossRef] [Scilit]
- Cuomo, S.; Boccaccio, M.; Meo, M. Damage identification during an impact event using the Hilbert-Huang transform of decomposed propagation modes. Mech. Syst. Signal Process. 2023, 191, 110126. [Google Scholar] [CrossRef] [Scilit]
- Gordan, M.; Razak, H.A.; Ismail, Z.; Ghaedi, K.; Tan, Z.X.; Ghayeb, H.H. A hybrid ANN-based imperial competitive algorithm methodology for structural damage identification of slab-on-girder bridge using data mining. Appl. Soft Comput. 2020, 88, 106013. [Google Scholar] [CrossRef] [Scilit]
- Bisheh, H.B.; Amiri, G.G. Structural damage detection based on variational mode decomposition and kernel PCA-based support vector machine. Eng. Struct. 2023, 278, 115565. [Google Scholar] [CrossRef] [Scilit]
- Malekloo, A.; Ozer, E.; AlHamaydeh, M.; Girolami, M. Machine learning and structural health monitoring overview with emerging technology and high-dimensional data source highlights. Struct. Health Monit. 2022, 21, 1906–1955. [Google Scholar] [CrossRef] [Scilit]
- Niyirora, R.; Ji, W.; Masengesho, E.; Munyaneza, J.; Niyonyungu, F.; Nyirandayisabye, R. Intelligent damage diagnosis in bridges using vibration-based monitoring approaches and machine learning: A systematic review. Results Eng. 2022, 16, 100761. [Google Scholar] [CrossRef] [Scilit]
- Jamshidi, M.; El-Badry, M. Structural damage severity classification from time-frequency acceleration data using convolutional neural networks. In Proceedings of the Structures; Elsevier: Amsterdam, The Netherlands, 2023; Volume 54, pp. 236–253. [Google Scholar]
- Li, S.; Wang, W.; Lu, B.; Du, X.; Dong, M.; Zhang, T.; Bai, Z. Long-term structural health monitoring for bridge based on back propagation neural network and long and short-term memory. Struct. Health Monit. 2023, 22, 2325–2345. [Google Scholar] [CrossRef] [Scilit]
- Dang, H.V.; Tran-Ngoc, H.; Nguyen, T.V.; Bui-Tien, T.; De Roeck, G.; Nguyen, H.X. Data-driven structural health monitoring using feature fusion and hybrid deep learning. IEEE Trans. Autom. Sci. Eng. 2020, 18, 2087–2103. [Google Scholar] [CrossRef] [Scilit]
- Peng, K.; Zhou, W.; Jiang, L.; Xiong, L.; Yan, W.J. Multimodal fusion hybrid neural network approach for multi-class damage classification in high-speed rail track-bridge systems with multi-parameter. Eng. Struct. 2025, 328, 119710. [Google Scholar] [CrossRef] [Scilit]
- Wu, Y.; Dai, H.N.; Tang, H. Graph neural networks for anomaly detection in industrial Internet of Things. IEEE Internet Things J. 2021, 9, 9214–9231. [Google Scholar] [CrossRef] [Scilit]
- Peng, S.; Liu, M.; Chai, L.; Deng, R. Dst-gnn: A dynamic spatiotemporal graph neural network for cyberattack detection in grid-tied photovoltaic systems. IEEE Trans. Smart Grid 2024, 16, 330–343. [Google Scholar] [CrossRef] [Scilit]
- Chen, L.; Shao, W.; Lv, M.; Chen, W.; Zhang, Y.; Yang, C. AARGNN: An attentive attributed recurrent graph neural network for traffic flow prediction considering multiple dynamic factors. IEEE Trans. Intell. Transp. Syst. 2022, 23, 17201–17211. [Google Scholar] [CrossRef] [Scilit]
- Zhan, P.; Qin, X.; Zhang, Q.; Sun, Y. A novel structural damage detection method via multisensor spatial–temporal graph-based features and deep graph convolutional network. IEEE Trans. Instrum. Meas. 2023, 72, 2504814. [Google Scholar] [CrossRef] [Scilit]
- Tapeh, A.T.G.; Naser, M. Artificial intelligence, machine learning, and deep learning in structural engineering: A scientometrics review of trends and best practices. Arch. Comput. Methods Eng. 2023, 30, 115–159. [Google Scholar] [CrossRef] [Scilit]
- Teng, S.; Chen, X.; Chen, G.; Cheng, L.; Bassir, D. Structural damage detection based on convolutional neural networks and population of bridges. Measurement 2022, 202, 111747. [Google Scholar] [CrossRef] [Scilit]
- Sun, H.; Song, L.; Yu, Z. A deep learning-based bridge damage detection and localization method. Mech. Syst. Signal Process. 2023, 193, 110277. [Google Scholar] [CrossRef] [Scilit]
- Li, M.; Jia, D.; Wu, Z.; Qiu, S.; He, W. Structural damage identification using strain mode differences by the iFEM based on the convolutional neural network (CNN). Mech. Syst. Signal Process. 2022, 165, 108289. [Google Scholar] [CrossRef] [Scilit]
- Ai, D.; Mo, F.; Cheng, J.; Du, L. Deep learning of electromechanical impedance for concrete structural damage identification using 1-D convolutional neural networks. Constr. Build. Mater. 2023, 385, 131423. [Google Scholar] [CrossRef] [Scilit]
- Min, S.; Lee, Y.; Byun, Y.H.; Kang, Y.J.; Kim, S. Merged LSTM-based pattern recognition of structural behavior of cable-supported bridges. Eng. Appl. Artif. Intell. 2023, 125, 106774. [Google Scholar] [CrossRef] [Scilit]
- Wang, C.; Yang, Z.; Gao, K.; Xia, Y.; Li, Y.; Ng, C.T.; Wu, G. An LSTM-based detection model for breathing cracks with multiple damage positions and degrees of beam-like bridges under vehicle loads. Struct. Health Monit. 2025. [Google Scholar] [CrossRef] [Scilit]
- Yang, J.; Zhang, L.; Chen, C.; Li, Y.; Li, R.; Wang, G.; Jiang, S.; Zeng, Z. A hierarchical deep convolutional neural network and gated recurrent unit framework for structural damage detection. Inf. Sci. 2020, 540, 117–130. [Google Scholar] [CrossRef] [Scilit]
- Bui-Tien, T.; Nguyen-Chi, T.; Le-Xuan, T.; Tran-Ngoc, H. Enhancing bridge damage assessment: Adaptive cell and deep learning approaches in time-series analysis. Constr. Build. Mater. 2024, 439, 137240. [Google Scholar] [CrossRef] [Scilit]
- Rautela, M.; Gopalakrishnan, S. Ultrasonic guided wave based structural damage detection and localization using model assisted convolutional and recurrent neural networks. Expert Syst. Appl. 2021, 167, 114189. [Google Scholar] [CrossRef] [Scilit]
- Fathnejat, H.; Ahmadi-Nedushan, B.; Hosseininejad, S.; Noori, M.; Altabey, W.A. A data-driven structural damage identification approach using deep convolutional-attention-recurrent neural architecture under temperature variations. Eng. Struct. 2023, 276, 115311. [Google Scholar] [CrossRef] [Scilit]
- Eslamlou, A.D.; Ghasemlou, A.; Barros, B.; Riveiro, B. A hybrid data-physics framework with conformal GNN for enhanced damage identification. Adv. Eng. Inform. 2025, 68, 103718. [Google Scholar] [CrossRef] [Scilit]
- Kim, M.; Song, J.; Kim, C.W. Near-real-time damage identification under vehicle loads using dynamic graph neural network based on proper orthogonal decomposition. Mech. Syst. Signal Process. 2025, 224, 112175. [Google Scholar] [CrossRef] [Scilit]
- He, Z.j.; Huang, T.L.; Chen, B. Physics-informed graph transformer network for predicting cable-stayed bridge structural deflection response. Adv. Eng. Inform. 2026, 69, 103897. [Google Scholar] [CrossRef] [Scilit]
- Peng, J.Z.; Pan, L.J.; Wang, Z.Q.; Gao, G.f.; Wang, M.; Hu, J.; He, Y.; Wu, W.T. Self-adaptive graph neural network for predicting blast-induced damage in RC columns across multiple scenarios. Eng. Struct. 2025, 337, 120505. [Google Scholar] [CrossRef] [Scilit]
- Yang, F.; Song, X.; Yi, W.; Li, R.; Wang, Y.; Xiao, Y.; Ma, L.; Ma, X. Lost data reconstruction for structural health monitoring by parallel mixed Transformer-CNN network. Mech. Syst. Signal Process. 2025, 224, 112142. [Google Scholar] [CrossRef] [Scilit]
- Li, Z.; Liu, F.; Yang, W.; Peng, S.; Zhou, J. A survey of convolutional neural networks: Analysis, applications, and prospects. IEEE Trans. Neural Netw. Learn. Syst. 2021, 33, 6999–7019. [Google Scholar] [CrossRef] [Scilit]
- Kiranyaz, S.; Avci, O.; Abdeljaber, O.; Ince, T.; Gabbouj, M.; Inman, D.J. 1D convolutional neural networks and applications: A survey. Mech. Syst. Signal Process. 2021, 151, 107398. [Google Scholar] [CrossRef] [Scilit]
- Greff, K.; Srivastava, R.K.; Koutník, J.; Steunebrink, B.R.; Schmidhuber, J. LSTM: A search space odyssey. IEEE Trans. Neural Netw. Learn. Syst. 2016, 28, 2222–2232. [Google Scholar] [CrossRef] [Scilit]
- Wang, S.; Wang, X.; Wang, S.; Wang, D. Bi-directional long short-term memory method based on attention mechanism and rolling update for short-term load forecasting. Int. J. Electr. Power Energy Syst. 2019, 109, 470–479. [Google Scholar] [CrossRef] [Scilit]
- Vaswani, A.; Shazeer, N.; Parmar, N.; Uszkoreit, J.; Jones, L.; Gomez, A.N.; Kaiser, Ł.; Polosukhin, I. Attention is all you need. Adv. Neural Inf. Process. Syst. 2017, 30, 6000–6010. [Google Scholar]
- Bhatti, U.A.; Tang, H.; Wu, G.; Marjan, S.; Hussain, A. Deep learning with graph convolutional networks: An overview and latest applications in computational intelligence. Int. J. Intell. Syst. 2023, 2023, 8342104. [Google Scholar] [CrossRef] [Scilit]
- Tang, S.; Li, B.; Yu, H. ChebNet: Efficient and stable constructions of deep neural networks with rectified power units via Chebyshev approximation. Commun. Math. Stat. 2024, 1–27. [Google Scholar] [CrossRef] [Scilit]
- Sun, K.; Yin, A. Multi-sensor temporal-spatial graph network fusion empirical mode decomposition convolution for machine fault diagnosis. Inf. Fusion 2025, 114, 102708. [Google Scholar] [CrossRef] [Scilit]
- Zheng, W.; Jing, X.Y.; Liu, W.; Wu, F.; Hu, C.; Du, B. Cluster-graph convolution networks for robust multi-view clustering. Knowl.-Based Syst. 2025, 327, 114163. [Google Scholar] [CrossRef] [Scilit]
- Malmqvist, L. AFGCN: An Approximate Abstract Argumentation Solver. In Proceedings of the 9th International Conference on Control, Mechatronics and Automation (ICCMA) 2021, Luxembourg, 11–14 November 2021. [Google Scholar]

Disclaimer/Publisher’s Note: The statements, opinions and data contained in all publications are solely those of the individual author(s) and contributor(s) and not of MDPI and/or the editor(s). MDPI and/or the editor(s) disclaim responsibility for any injury to people or property resulting from any ideas, methods, instructions or products referred to in the content. |
© 2026 by the authors. Licensee MDPI, Basel, Switzerland. This article is an open access article distributed under the terms and conditions of the Creative Commons Attribution (CC BY) license.