


Abstract
Türkiye’s shopping center count increased from 69 in the 2000s to 241 in 2024, as investors recognized shopping center investment as lucrative. The location and type of shopping center significantly affect future revenue. The development phase involves construction and non-construction costs. Consultants and contractors use past data to estimate these costs, though actual figures are unavailable. While the impact ratios of these sub-cost items on the overall cost are known based on the experience of real estate consultants and contracting companies, they cannot be presented as actual figures for investors to evaluate. This study aims to reveal how the cost items that constitute the development costs of a shopping center project impact each other, and to what degree they affect it, using a random forest model that can model non-linear relationships and determine the degree to which development cost items influence each other in shopping center investments. The feature importance levels obtained from the random forest model suggest that physical size and capacity are the most significant factors in estimating shopping center construction costs.
1. Introduction
The real estate sector is an important indicator of a country’s economic and social structure. As in other countries, the sector has undergone various phases throughout its historical development in Türkiye. While it was initially driven primarily by public institutions, construction companies, and cooperatives, it began to grow rapidly from the late twentieth century onwards, owing to the increasing involvement of institutional real estate investors and the professionalization of related sectors. Shopping centers constitute one of the most important commercial components of the real estate sector. In particular, shopping center investments undertaken through real estate investment trusts (REITs) remained an attractive investment vehicle until the COVID-19 pandemic in 2020. Despite facing significant challenges during the pandemic, shopping centers experienced a strong recovery after 2022, particularly in 2023.
The primary purpose of real estate investment is to preserve and increase purchasing power over time [1]. The first modern shopping center, Southdale Center, was designed by Victor Gruen and opened in 1956. It was conceived as a response to traffic congestion, transportation, and parking problems associated with increasingly polycentric urban structures, particularly in American cities, while also providing social spaces. Shopping centers first emerged in the United States and subsequently spread rapidly to other continents. However, the development of shopping centers in Europe did not progress at the same pace as the American model. The first European shopping centers appeared in the 1950s, and their numbers gradually increased over time [2].
The 1990s and 2000s are considered the first phase of retail development in Türkiye, during which shopping centers increasingly became an integral part of daily life in major cities. Developments between 2000 and 2010 are regarded as the second phase, while those occurring from 2010 onwards are considered the third phase [3]. With the adoption of liberal economic policies, modern shopping centers began to emerge in Türkiye. Galleria Shopping Center in Istanbul, opened in 1988, and Atakule Shopping Center in Ankara, opened in 1989, were among the country’s earliest examples. Even during the global financial crisis of 2008–2009, 70 shopping centers were opened in Türkiye [4].
Companies invest in the real estate sector because real estate is generally perceived as a relatively stable and lower-risk investment. Such investments are typically financed through a combination of equity and debt. Shopping centers are considered attractive investment vehicles because of strong demand, potential supply shortages in suitable locations, and their capacity to generate relatively stable rental income. In shopping center investments, companies generally lease retail units rather than sell them individually. Shopping centers are ideally located within or near densely populated residential areas in cities experiencing population growth and urban development. The size of the site and the socioeconomic characteristics of the surrounding population influence both the scale of the shopping center and its tenant mix [5]. Real estate valuation studies in Türkiye indicate that payback periods based on rental income for retail investments are generally considered to be approximately 200 months (16–17 years). However, this period varies depending on factors such as the property’s location, size, intended use, and rental income [6].
In Türkiye, the shopping center sector recorded a significant increase in turnover per square meter in 2024. According to data published by AYD and Akademetre, the shopping center turnover index increased by 65%, exceeding the rate of inflation [7]. This increase occurred despite visitor numbers rising by only 2%, suggesting that shopping center visitors became more purchase-oriented and that spending efficiency per visitor increased [7].
Due to their complex structures and the large number of variables involved, shopping center investments are particularly important from the perspective of cost management [8]. The success of these investments depends largely on the accurate identification, analysis, and management of cost components from the earliest stages of a project. In this context, determining the extent to which major cost components in construction projects deviate from the projected budget is critical for minimizing potential risks [9]. Studies by Skitmore et al. [10] demonstrate that machine learning techniques can be used for contract value estimation and that factors such as contractor selection methods, contract structures, and project types can influence these estimates [11]. Furthermore, artificial intelligence-based analyses can help identify potential problems in construction processes at an early stage, thereby reducing costs and time requirements, facilitating proactive risk management, and enabling more efficient use of resources [12].
2. Materials and Methods
This study employs a combination of qualitative and quantitative research methods to determine the impact of cost items arising during the shopping center development phase on overall cost. Within this framework, the relevant cost factors were analyzed in detail to assess their relative contribution to the total investment cost of shopping centers and their potential influence on project expenditure. To this end, the study investigated shopping centers constructed over the past 38 years in Istanbul, one of Türkiye’s largest commercial and touristic cities. Throughout this period, the Turkish economy has undergone distinct phases, and the shopping center sector has experienced substantial transformation.
A comprehensive literature review of Istanbul’s shopping centers was conducted, followed by field data collection, which was subsequently compiled into a structured shopping center dataset. The variables considered in the shopping center cost estimation process are complex and multidimensional, encompassing both project-specific and economic factors such as project location, total construction area, number of floors, and functional characteristics.
The study employed the random forest algorithm—an ensemble learning method based on decision trees—which yields more consistent results with limited data. Using this algorithm, results closer to reality were obtained with lower RMSE. Furthermore, its ability to capture nonlinear relationships and complex interactions among variables enabled the relative importance of factors affecting shopping center construction costs to be determined (Figure 1). The model achieved an R2 value of 0.84, indicating that approximately 84% of the variation in shopping center construction costs within the analyzed dataset was explained by the model. This result suggests relatively strong explanatory performance, while the remaining unexplained variance indicates that additional factors not included in the dataset may also influence total shopping center costs.
Figure 1.
Performance metrics used to evaluate the random forest regression model (adapted by the author based on [13,14,15,16,17,18,19,20,21,22]).
Model Training: The random forest model was trained using all 75 shopping center projects, and the relative importance levels of the variables were determined using the MDI-based feature importance method.
Model Validation: The leave-one-out cross-validation (LOOCV) method was used to evaluate the model’s out-of-sample performance.
2.1. Random Forest Methodology
Artificial neural networks (ANNs) are a type of computational modeling method developed based on the operating principles of the biological neural networks found in the human brain. ANNs can learn from examples and generate predictions based on the relationships they have learned. ANNs are widely used for prediction and classification problems, alongside regression and other statistical methods. Unlike traditional statistical methods, ANNs can learn complex, non-linear input–output relationships without the need to define the mathematical form of the relationship between variables in advance. Furthermore, with appropriate data pre-processing and model configuration, they can produce accurate predictions on noisy datasets. The learning process of an ANN involves iteratively updating weights, which represent the connections between neurons in the network, in a way that minimizes prediction error [23]. However, the performance of ANN models depends significantly on the size of the dataset, the network architecture, the selection of hyperparameters, and the data pre-processing procedures.
The random forest algorithm is an ensemble learning method used for classification and regression problems. It combines the predictions of many decision trees, which are created during the training phase. In this algorithm, the decision trees are trained using different samples generated by the bootstrap method, and randomly selected subsets of variables are evaluated at each split. This approach reduces correlation among the trees and variance compared to a single decision tree, thereby improving the model’s generalization performance. In regression problems, the final prediction is obtained by averaging the predictions produced by the decision trees [13,24] (Figure 2). The model was evaluated using the leave-one-out cross-validation (LOOCV) method. Additionally, variable importance scores were calculated to rank the project characteristics that contribute most significantly to the AVM cost estimate. These scores reflect the variables’ relative contributions to the model’s prediction process, not their causal effects.
Figure 2.
Schematic representation of the random forest regression process. Developed by the author based on [13].
This reduces the risk of overfitting in a single decision tree. The random forest algorithm is based on two key randomization mechanisms. The first involves training the decision trees on different subsamples generated using the bootstrap method, and the second involves evaluating a randomly selected subset of variables rather than all variables at each split. This approach reduces the correlation among decision trees and improves the generalization performance of the ensemble model [13]. Thanks to the structure of its decision trees, random forest can model complex, non-linear input–output relationships. Furthermore, analyzing feature importance after model training enables an evaluation of which input variables contribute most significantly to the model’s predictive performance [13,18].
2.2. Types of Shopping Centers
A shopping center is defined as an organized retail space with over 5000 m2 of leasable area, comprising at least 15 independent units, with a unified, collaborative management approach that creates synergy. Key elements of modern shopping centers include major tenants, free parking, a good mix of stores, centralized management, controlled architecture, and attractive landscaping. In terms of its range of shops, the shopping center is a city unto itself, housing a wide variety of outlets offering products in the lower to upper mid-range segments. The only brands absent are those in the true luxury category. Attractive features include the large, free leisure space on the roof, the two massive food courts, the hypermarket, and the presence of some very affordable everyday fashion labels, making the shopping center appealing even to consumers with lower spending power [25].
According to the International Council of Shopping Centers [26], shopping centers are characterized by being managed as a single unit, featuring a balanced tenant mix and providing dedicated on-site parking for customers. In the US, shopping centers are grouped into five distinct categories based on their size and distance from the city center. Shopping centers in Türkiye are also constructed in accordance with this classification. Additionally, Türkiye has “Carrefour”-style shopping centers—low-rise, sprawling developments—alongside European-style shopping centers. Of the shopping center types listed in the ICSC table and used in this study, the most common in Türkiye are: Regional Center, Superregional Center, Neighborhood Center, Community Center, Lifestyle Center, Theme Center and Outlet Center (Table 1).
Table 1.
Table of shopping center types, 2017 [26].
2.3. Costs Incurred in Shopping Center Investment
The development and operation phases of a shopping center are shown in Figure 3. The diagram shows the activities, revenues, and expenses associated with these phases. The development process refers to the procedures carried out from the project’s conceptual stage until the building is completed. The operating phase begins after completion with the process of finding tenants, signing leases, and appointing management. It continues until the building reaches the end of its economic life and is demolished.
Figure 3.
Stages of the shopping center project development process (developed using source [5]).
Investors wishing to invest in a shopping center conduct or commission market research and feasibility studies on their land and the surrounding area. Based on these studies, as well as demographic research, they decide on the type of shopping center to build. Depending on the type of shopping center, the total construction area, the number of parking spaces, and the number of suitable stores for the plot of land are determined. After calculating the estimated costs, the investor decides how much of the investment will be financed through loans and how much through equity, based on prevailing market interest rates. They then begin the ‘shopping center project development’ process. Figure 4 shows the revenues and expenses for the project’s development and operation phases if we consider the investment process as a business. As shopping center projects are long-term investments, the return on funds spent during the development phase takes a long time; however, this period should not exceed an average of seven years. Investments are divided into three groups: short-term, medium-term, and long-term [27,28]. In Türkiye, banks provide loans for large-scale, long-term projects of up to 10 years. Investors, however, are expected to cover 30–35% of the investment cost with their own equity [29].
Figure 4.
The process of determining total expenses at a shopping center (developed using source [5]).
In the construction industry, the total cost of a building comprises the initial investment cost, the costs incurred during its operational use, and the cost of demolition at the end of its economic life. The same categories apply to a shopping center; however, the factors affecting these main cost items and their subcategories increase due to the building’s large capacity and complexity, and the greater difficulty in managing it (see Figure 4).
Figure 4 shows the development-phase costs of a shopping center project, categorized as construction and non-construction costs, with the factors affecting these costs presented within dotted boxes. The factors affecting construction-phase costs include the project development process, ongoing construction, and advertising and sales/leasing processes, while factors affecting non-construction costs include market interest rates and contingency reserves.
Effective management of total costs in shopping center investments requires more than static budget control; it necessitates a dynamic process of risk and efficiency management. Projections for Türkiye for the period 2024–2026 demonstrate just how closely interconnected each cost component is. The increased efficiency observed at the Akasya Shopping Center shows that digitalization is not just an option, but a survival strategy [30].
In the coming period, it will be crucial for shopping center investors to focus on the three strategic areas listed below in order to achieve overall cost success:
- Flexible design and smart capital expenditures: Prioritizing modular and energy-efficient systems during the construction phase to avoid high operating costs in the future.
- Financial diversification: Evaluating capital market instruments and strategic partnerships, rather than relying solely on bank loans, in a high-interest-rate environment [31,32].
- Experience-driven efficiency: Moving beyond mere leasing to adopt ‘active management’ models that optimize the visitor experience and increase revenue per square meter using digital data [33,34].
2.4. Shopping Centers Built in Istanbul (1988–2026)
When Migros, a Swiss company, entered the Turkish market as the first retail chain in 1954, it led to a change in commerce, which had previously been conducted on a local scale. This change led to private and public investments, such as the Gima, Yeni Karamürsel, İGS, and 19 Mayıs stores. Liberalization in the Turkish economy facilitated the import of new technologies and made it easier for foreign capital to enter the market. The retail industry in Türkiye began to take shape in the 1980s, with shopping centers being built to meet the new demand. Initially appearing in major cities such as Istanbul and Ankara, these shopping centers later opened in other growing cities, including Gaziantep, Adana, Antalya, Izmir, and Izmit. Outlet shopping centers selling American-style discounted products, regional shopping centers catering to neighborhoods and their immediate surroundings, and European-style shopping centers featuring a large chain supermarket spread across large, low-rise plots have all been favored in Türkiye. As of the end of 2025, Türkiye had a total of 441 shopping centers, 134 of which were located in Istanbul [35].
Of the 75 shopping centers in Istanbul included in the study (see Table 2), 26 are regional centers, 12 are outlet centers, eight are neighborhood centers, one is a specialty center, one is a super-regional center, six are thematic centers, 15 are lifestyle centers, and six are luxury centers. Of these, 42 are mixed-use, while the remainder are single-use shopping centers. Mixed-use shopping centers are designed to include hotels, residences, housing, offices, hospitals, public buildings, commercial centers, and entertainment centers. The table shows that construction of these mixed-use developments generally increased after the 2000s. A review of the literature reveals that some of the plots of land on which shopping centers were built in Istanbul belong to municipalities and private companies. In shopping centers built on land owned by municipalities, it has been observed that the shopping center developer provides stores to the municipalities in exchange for the land. The land for approximately 15 projects either belongs to the contractor or has been leased from institutions such as the Municipality, Kiptaş, or the General Directorate of Foundations, either through a lease agreement, in exchange for retail space, or under a build-operate-transfer model. For the sake of consistency in this study, however, it has been assumed that the land for all projects was purchased. Table 2 provides information on the opening years of the shopping centers, the districts in which they are located, the importance coefficients of these districts, the land area, the leasable area of the shopping centers, the floor area, the number of stores and restaurants, the number of building floors, the ownership of the shopping center, and whether the building holds an environmental certification [36,37,38,39,40,41,42,43,44,45,46,47,48,49,50,51,52,53,54,55,56,57,58,59,60,61,62,63,64,65,66,67,68,69,70,71,72,73,74,75,76,77,78,79,80,81,82,83,84,85,86,87,88,89,90,91,92,93,94,95,96,97,98,99,100,101,102,103,104,105,106,107,108,109,110,111,112,113,114,115,116,117,118,119,120,121,122,123,124,125,126,127,128,129,130,131,132,133,134,135,136,137,138,139,140,141,142,143,144,145,146,147,148,149,150,151,152,153,154,155,156,157,158,159,160,161,162,163,164,165,166,167,168,169,170,171,172,173,174,175,176,177,178,179,180,181,182,183,184,185,186,187,188,189,190,191,192,193,194,195,196,197,198]. To represent the comparative retail attractiveness of Istanbul’s districts based on socioeconomic characteristics, commercial intensity, accessibility, tourism activity, and retail development, shopping importance values were developed as relative weighting factors rather than measured variables, ultimately indicating project location values [199,200,201,202,203].
Table 2.
Shopping centers in Istanbul and their features (created by the author using sources [36,37,38,39,40,41,42,43,44,45,46,47,48,49,50,51,52,53,54,55,56,57,58,59,60,61,62,63,64,65,66,67,68,69,70,71,72,73,74,75,76,77,78,79,80,81,82,83,84,85,86,87,88,89,90,91,92,93,94,95,96,97,98,99,100,101,102,103,104,105,106,107,108,109,110,111,112,113,114,115,116,117,118,119,120,121,122,123,124,125,126,127,128,129,130,131,132,133,134,135,136,137,138,139,140,141,142,143,144,145,146,147,148,149,150,151,152,153,154,155,156,157,158,159,160,161,162,163,164,165,166,167,168,169,170,171,172,173,174,175,176,177,178,179,180,181,182,183,184,185,186,187,188,189,190,191,192,193,194,195,196,197,198]).
Companies investing in shopping centers consider information regarding land and construction costs to be confidential and do not share it with the public. Therefore, within the scope of this study, a table of land value per square meter was created using comparable values, relevant articles, reports from SPK-licensed appraisal firms, and real estate data from the Istanbul Chamber of Commerce. This table was used to calculate the land costs per square meter for the identified Istanbul shopping centers, taking into account the year and district in which each shopping center was built. Due to the rapid changes in the purchasing power of the Turkish lira over time, the fact that a significant portion of construction costs is directly or indirectly affected by foreign exchange rates, and the dollar’s role as a more stable unit of comparison, all costs have been converted to “U.S. dollars”. However, land acquisition costs, which are assumed to have been incurred in different years, and building construction costs, which also arose in different years, have not been standardized to a single year. This is because the model will compare and establish relationships among data specific to each shopping center, so it was deemed unnecessary to do so in this study.
As data on the land area owned by shopping centers could not be obtained for mixed-use projects, the land share of the shopping center was determined by the ratio of its construction area to the total construction area. This approach is based on the assumption that land costs are allocated among a shopping center’s usage functions in proportion to their respective gross construction areas. Consequently, the construction costs associated with shopping centers were calculated using a table of construction costs per square meter based on the year the project was completed (Appendix B).
The 10 criteria listed above the table represent the 10 features used in the random forest analysis, for which importance values were investigated. This table was prepared based on these criteria, which were taken from a doctoral dissertation on shopping center investments. These criteria constitute the fundamental elements of shopping center investments and are the characteristics used to evaluate shopping centers built in Istanbul using the random forest algorithm.
The shopping centers listed in the table are sorted by the year they opened. As the shopping centers vary significantly in terms of land area, construction area, leasable area, and number of floors, grouping them by type was not deemed necessary for this study.
Shopping centers with sustainability certifications were specifically identified in the table prepared for this study; however, their number within the dataset is relatively limited. Therefore, sustainability certification was not incorporated into the quantitative analysis as a separate variable. Nevertheless, previous research indicates that sustainability-certified buildings may achieve higher property values and improved marketability in terms of both sales and leasing. Beyond the essential role of sustainability in promoting responsible material use and strategies such as reducing heat gain and reusing water, it may also influence both the costs incurred during the building life cycle and the revenues generated in the future. Therefore, sustainability certification is considered a potentially relevant factor in the economic performance of shopping centers and is recommended for inclusion as an additional variable in future studies.
Land acquisition and building construction costs were adjusted to their 2026 values by taking into account the years in which the respective expenditures occurred. Rather than applying an annual compound interest approach, as commonly used for the time-value adjustment of financial returns, the adjustment was based on historical inflation data and exchange rates. However, due to the substantial economic fluctuations experienced in Türkiye over the period examined—including the use of the former Turkish lira, currency redenomination, and periods in which domestic inflation increased disproportionately relative to changes in the exchange rate—the adjustment of land acquisition and construction costs was carried out progressively according to the specific economic conditions of different periods. The methodology and procedures employed for these adjustments are described in detail in Appendix D. In this study, land acquisition costs were adjusted to 2026 values using an approach consistent with that applied to building construction costs.
In recent years, the number of mixed-use shopping center developments has increased, and many newly developed shopping centers in Istanbul have been incorporated into mixed-use projects in order to broaden their market reach and diversify their functions. In the literature and available project documentation, the construction area allocated specifically to the shopping center component is generally reported separately; moreover, shopping centers have traditionally been developed as stand-alone buildings. In this study, for shopping centers forming part of mixed-use developments, data specifically attributable to the shopping center component—such as the land area allocated to the shopping center and its total construction area—were identified and separated from those of the other functions within the development. These shopping-center-specific values were subsequently used as the basis for the analyses in order to ensure consistency and comparability across the dataset.
3. Results: Factors Affecting the Cost of the Shopping Center Development
This study developed a model using a Python 3.10 application and the random forest algorithm to identify interactions between cost items during the shopping center development phase. Shopping center development costs may also include expenditures related to advertising and marketing, professional services, risk allowances, and contingencies. However, as the detailed estimation of these cost components constitutes a separate area of investigation, the present study focuses on two principal cost categories: land acquisition cost, including expenditures associated with site preparation, and building construction cost, including materials, labor, construction works, external works and landscaping, and parking facility construction. Accordingly, these two cost categories were used as the primary cost components in the analysis. The model was trained using the criteria identified in the shopping center table, which was created through a literature review. These criteria are project-specific factors that have been identified as influencing total shopping center costs during the development phase of a shopping center investment project. In the model, land costs include the costs of land acquisition and site preparation.
3.1. Dataset
This study used a dataset designed to identify the relationships between the factors that affect costs during the project development phase of shopping center construction. The dataset includes primary cost items arising from activities carried out during the development of shopping centers. It consists of data from 75 shopping centers. The factors examined in this study that are considered to influence shopping center costs are shown in Table 3.
Table 3.
The primary dataset employed for the random forest model.
Criteria 1. District weighting factor.
Criteria 2. The size of the shopping center land.
Criteria 3. The total construction area of the shopping center.
Criteria 4. The number of floors (ground + underground) in the shopping center.
Criteria 5. Gross leasable area.
Criteria 6. Number of stores.
Criteria 7. Number of restaurants and cafés.
Criteria 8. Number of parking spaces.
Criteria 9. Present value of the shopping center land purchase price.
Criteria 10. Present value of the shopping center construction cost.
Construction costs and land purchase costs were adjusted to 2026 values using the formula (Equation (1));
2026 Cost = Cost in the Relevant Year × (2026 Unit Price/Unit Price in the Year of Construction)
Historical cost adjustments were primarily based on construction cost indices published by the Turkish Statistical Institute (TURKSTAT), with preference given to the series representing commercial or non-residential buildings where available. Since the index methodology, coverage, and base years changed over the study period, different official series were linked according to their applicable periods rather than applying a single uniform coefficient across 1987–2026. This approach was adopted to account for Türkiye’s substantial inflation, currency redenomination, exchange-rate fluctuations, and changes in construction-cost index methodology over the period examined [204,205,206,207,208,209].
3.2. Training Process
This study involved running and training a random forest model to investigate the relative importance of factors affecting shopping center construction costs. The random forest algorithm was used to learn the relationship between the variables and cost, using the 75 calculated cost values as the target variable and generating feature importance values. Figure 5a,b show the output of the random forest model run on Python tom. Figure 6 and Figure 7 shows the training results. The land and construction cost values for the analyzed projects were estimated as minimum, median (or mid-point), and maximum values based on relevant sources (Appendix B and Appendix C). In this study, the exact midpoints of these ranges were adopted, and all subsequent calculations were performed using these values.
Figure 5.
(a,b) Python code that runs a random forest model.
Figure 6.
The importance factors of the 10 criteria identified as a result of the model’s training, in terms of their impact on total SC costs.
Figure 7.
The graphical presentation of the results of the important factors in the random forest model is shown here.
Before training the model, the dataset was checked to ensure that the variables were suitable for analysis. The data was divided into training and test subsets. Thus, while the model learnt the relationships between project characteristics and construction costs from the training data, its predictive performance was evaluated using previously unseen test data. During training, the random forest algorithm created multiple decision trees using different bootstrap samples of the training dataset, as well as randomly selected subsets of input variables at each split. The model’s performance was evaluated using the coefficient of determination (R2) (Figure 6). The resulting R2 value of approximately 0.84 demonstrated that the model could explain a significant proportion of the variation in shopping center construction costs. Finally, the relative contribution of each project feature to the model’s cost estimates was determined by examining the feature importance values obtained from the trained random forest model. The Python code below illustrates the section that calculates these importance levels after the model has been built.
# 4. Train the model and find the feature importance
model.fit(X, y)
importances = model.feature_importances_
feature_names = X.columns
The feature importance chart indicates that CRITERIA 9 (present value of the shopping center land purchase price) and CRITERIA 10 (present value of the shopping center construction cost) are the dominant factors driving the random forest model’s predictions, accounting for approximately 72% and 20% of the total importance, respectively (Figure 8). CRITERIA 3 (the total construction area of the shopping center) provides a minor contribution at roughly 5%, while the remaining seven criteria (1, 2, 4, 5, 6, 7, and 8) have a negligible or near-zero impact on the cost of shopping centers (Figure 7).
Figure 8.
The graphical presentation of the results of the important factors in the random forest model.
The results show a LOOCV mean absolute error (MAE) of approximately $42.96 million and a standard deviation of around $60.02 million for the distribution of absolute errors. R2, RMSE, and MAE were used to evaluate the performance of the model that generated these key metrics.
3.3. Correlation Analysis
Figure 8 presents the correlation analysis of the 10 criteria used as input variables in the random forest model. Criteria 3 and Criteria 10 exhibited the strongest correlation among the independent variables (r = 0.91), indicating a very strong positive linear relationship. The corresponding coefficient of determination (r2 = 0.828) suggests that approximately 82.8% of the variance is shared within a simple linear relationship. This high correlation indicates that the two variables may contain substantial overlapping information and therefore raises a potential multicollinearity concern. However, the correlation alone does not demonstrate that the variables measure the same construct or that one variable causes the other.
The negative correlations in the matrix are very weak (all below |0.16|) and can be considered practically negligible. In particular, CRITERIA 4 shows almost no linear relationship with the dependent variable (r = −0.01), indicating that it has little direct association with project cost. This finding is also consistent with the previous factor analysis, in which CRITERIA 4 emerged as a separate factor. Overall, the negative correlations do not indicate a significant issue within the dataset.
In random forest models, a high correlation (r = 0.91) does not necessarily impair model performance as it may in linear regression [210]. However, when two variables contain highly overlapping information, their feature importance may be distributed between them. Consequently, the individual importance values of CRITERIA 3 and CRITERIA 10 may appear lower or less stable than their actual combined contribution to the model.
3.4. Sensitivity Analysis
The table below (Table 4) compares the nine scenario-based random forest models developed by combining the minimum, midpoint, and maximum values of the two input variables for which exact values were unavailable. The model was retrained independently for each scenario using the same dataset of 75 shopping centers, while the remaining eight input features were kept unchanged. The term midpoint refers to the midpoint of the minimum–maximum range, calculated as (minimum + maximum)/2; it should not be interpreted as an observed statistical mean.
Table 4.
Comparison of the nine random forest scenarios.
Since exact values for two input variables were unavailable, a scenario-based sensitivity analysis was conducted using their minimum, midpoint, and maximum values, yielding nine scenarios. The random forest model was retrained for each scenario while holding the remaining eight features constant.
R2 ranged from 0.7963 to 0.8892 and RMSE from approximately US$69.97 to US$152.18 million across scenarios, indicating that model performance is sensitive to these assumptions. Despite this, Criterion 9 remained the most influential feature in all nine scenarios, with importance ranging from 0.4664 to 0.8626. Its lowest importance (0.4664) occurred under the minimum-land-cost/maximum-construction-cost scenario, where Criteria 10 and 3 gained importance (0.3239 and 0.1853, respectively), indicating a more distributed importance structure; in other scenarios, Criterion 9 alone accounted for over 80%.
This distinction between the stability of feature ranking and the variability of importance magnitude is central to interpreting the results: although the numerical value of Criterion 9’s importance is not stable, its position as the dominant feature is robust across all assumptions tested. Notably, the scenario with the highest R2 should not be interpreted as the most representative, since the purpose of this analysis is not to identify a single best scenario but to test whether the main feature-importance findings hold under varying assumptions. From this perspective, the persistent dominance of Criterion 9 supports the robustness of the principal finding.
4. Discussion
Random forest analysis indicates that the variables included in the model do not contribute equally to the estimation of shopping center construction costs. Under the midpoint–midpoint scenario (Scenario 1), the model achieved an (R2) value of 0.8428, indicating that approximately 84.3% of the variation in the dependent variable was explained by the model. In this scenario, Criterion 9 emerged as the most influential feature with an importance value of 0.7167, followed by Criterion 10 (0.1959) and Criterion 3 (0.0524). The remaining variables exhibited considerably lower individual importance values. This distribution indicates that the predictive structure of the model is strongly concentrated around a limited number of variables, particularly Criterion 9. The correlation analysis revealed strong relationships among several predictors, particularly between Criteria 3 and 10 (r = 0.91), indicating potential information overlap that should be considered when interpreting feature importance.
Overall, Table 4 demonstrates that although the absolute values of feature importance and model performance fluctuate depending on the two uncertain variables, Criterion 9 remains the top-ranked feature in every scenario. This confirms the robustness of the primary finding regarding feature order, despite variations in score magnitudes. Ultimately, the nine-scenario framework provides a more reliable assessment of uncertainty and robustness than a model based solely on midpoints.
The findings are generally consistent with those of earlier studies on the estimation of construction costs. For example, Skitmore and Ng [211] investigated 93 construction projects in Australia and demonstrated that actual construction costs and durations are influenced by various project, client, and contractual characteristics. In a comprehensive review of artificial intelligence and parametric construction cost estimation methods, Elmousalami [212] identified random forest, artificial neural networks, support vector machines, case-based reasoning, fuzzy logic, decision trees, and boosting algorithms as important alternatives to conventional statistical models. One particularly relevant comparison is with the study by Yun [213], in which a random forest analysis was used to determine which variables affect construction cost the most. The results showed that total area was the most important feature, followed by total height, site area, parking, the number of above-ground and underground floors, and building area.
5. Conclusions
This study examines the cost structure of shopping center investments, with a particular focus on the factors influencing costs during the development phase. Shopping center costs are categorized as either construction-related or non-construction-related, and the factors affecting these costs are evaluated within the broader development and operational processes. A structured dataset incorporating project-specific and economic variables was developed based on a comprehensive literature review and field data collected from 75 shopping centers. The random forest algorithm was then used to analyze the complex, non-linear relationships between these variables and determine their relative importance in influencing shopping center construction costs.
The random forest analysis showed that the features contributed differently to shopping center construction costs. In the midpoint–midpoint scenario, the model achieved an R2 of 0.8428, with Criterion 9 emerging as the dominant feature (0.7167), followed by Criterion 10 (0.1959) and Criterion 3 (0.0524). The correlation analysis revealed strong relationships among several predictors, particularly between Criteria 3 and 10 (r = 0.91), indicating potential information overlap that should be considered when interpreting feature importance.
For future research, it may be recommended to combine deep learning architectures with a random forest structure to enhance the model’s generalizability. Additionally, dynamically updating the model’s hyperparameters using broader datasets that encompass different regional projects will facilitate the analysis of temporal changes in the impact of variables on costs. Furthermore, incorporating the impact of sustainability and environmental factors on costs into the model would enable a more holistic assessment of the long-term economic performance of shopping center projects. This transformation process goes beyond technical proficiency, enhancing project stakeholders’ capacity for data-driven decision-making and supporting a vision of more transparent and accountable management across the industry. In this regard, integrating machine learning-based forecasting tools into standard bidding processes will minimize cost uncertainties in the sector and pave the way for more efficient investment strategies. Additionally, companies can improve the reliability of the models created and their data mining capabilities by making their data collection and storage processes more systematic and archiving and sharing high-quality information about their business operations.
Funding
This research received no external funding.
Data Availability Statement
The original contributions presented in this study are included in the article. Further inquiries can be directed to the author.
Acknowledgments
During the preparation of this manuscript/study, the author used Python 3.10 to model nonlinear relationships and high-dimensional interactions among variables. The authors have reviewed and edited the output and take full responsibility for the content of this publication.
Conflicts of Interest
The author declares no conflicts of interest. The funders had no role in the design of the study; in the collection, analysis, or interpretation of data; in the writing of the manuscript; or in the decision to publish the results.
Abbreviations
The following abbreviations are used in this manuscript:
| SC | Shopping Center |
| GLA | Gross Leasable Area |
| CRIT | Criterion |
Appendix A
Table A1.
** Shopping importance coefficient matrix for Istanbul districts (1988–2026) [204,205,206,207,208].
District importance coefficients are derived from the following sources: the annual ‘Retail Streets Report’ and ‘Commercial Real Estate Market Data’ reports published by Jones Lang LaSalle Türkiye; the ‘Marketbeat’ and ‘Global Cities Retail Guide’ series published by Cushman and Wakefield Türkiye; the ‘Consumer Products and Retail Sector Outlook’ reports published by Ernst and Young Türkiye; the shopping center indices published monthly by the Shopping Centers and Investors Association; and the ‘Approximate Unit Construction Costs Serving as the Basis for Architecture and Engineering Service Fees’ circular published at the beginning of each year.
The following criteria were used to determine the values:
- Retail intensity and retail attraction power: The extent to which a district serves as a shopping attraction center across Istanbul.
- Main shopping streets and commercial density.
- Socioeconomic profile: Concentration of high-income groups, consumption and spending capacity, and demand for premium/luxury retail.
- Tourism impact: Shopping demand generated by domestic and international tourists, especially in districts like Beyoğlu and Fatih.
- Transportation and accessibility: Metro, metrobüs, Marmaray, and primary arterial roads, etc. The district’s role as a regional transportation/transfer hub.
- Existing retail and shopping mall density: Presence of large shopping malls and commercial centers, and characteristics of being a regional shopping attraction center.
- Urban development and new residential/office investments: The impact of emerging development areas, particularly in districts such as Ataşehir, Maltepe, Kartal, and Başakşehir.
- Nature of shopping behavior: Luxury/premium consumption, regional shopping, neighborhood-scale traditional shopping, and price-sensitive consumption.
Appendix B
Table A2.
*** Estimated historical commercial land value ranges in selected Istanbul submarkets, 1988–2026 (USD/m2) [208,214,215,216,217,218,219,220].
Appendix C
Table A3.
**** Estimated historical construction cost ranges by shopping center type in Türkiye (1988–2026) [214,217,221,222,223,224,225,226] 1.
Crisis Years (1994, 2001, 2018, and Devaluation Periods): During economic crises in Türkiye, local construction costs experienced sharp declines when expressed in US dollar terms. The decreases in USD-denominated costs observed in the table for 1994, 2001, 2018, and 2019 reflect this trend.
Construction Cost Surge (2022–2026): Due to the simultaneous effects of post-pandemic global supply-chain disruptions, high inflation in Türkiye, and exchange-rate fluctuations, construction costs per square meter have risen to record levels in recent years, particularly between 2022 and 2026, even when expressed in US dollar terms.
Segments:
Luxury Shopping Centers: Luxury shopping centers (e.g., Zorlu Center, İstinyePark, and luxury retail/mixed-use developments around Galataport in Istanbul) consistently represent the upper cost range due to customized imported façade systems, high-quality finishes, and specialized workmanship.
Outlet Centers: Outlet projects (e.g., open-air outlet developments located on the outskirts of Istanbul, Ankara, and İzmir) generally represent the lowest-cost segment due to their relatively simple structural systems and construction characteristics.
Appendix D
When updating construction costs in Turkey between 1987 and 2026, two main datasets are used: the TÜİK Construction Cost Index (İME) and the Estimated Unit Costs for Buildings from the Ministry of Environment, Urbanisation and Climate Change. Due to high inflation between 1987 and 2004, and the removal of six zeros in 2005 (when the New Turkish Lira was introduced), the most reliable method of converting past expenditure figures to the present day is to derive an index coefficient using either the Ministry’s unit costs for the relevant period or the USD/CPI deflator. The table below presents an official time series of unit cost changes for commercial buildings (specifically, typical Class IV Groups A/B buildings, such as business centers, shops and administrative and commercial buildings) and the conversion factors to the 2026 level (based on the current TL, with six zeros removed prior to 2005) [213,214].
Table A4.
***** Coefficients for updated sc building construction costs (as of 2026).
Reason for Fluctuations in Certain Years:
1994 and 2001: As the sharp devaluations that occurred did not immediately raise Turkish lira (TL) costs to the same level as foreign currency costs, costs per square meter in dollar terms fell temporarily (the conversion rate rose in those years).
2018–2020: Similarly, the sharp increase in exchange rates temporarily reduced construction costs in Turkey when measured in dollars.
Between 2021 and 2026, as exchange rates remained below the rate of inflation and labor and energy costs remained high, unit prices in dollar terms rose rapidly.
Note (1987–2004): The figures have been adjusted to reflect the removal of six zeros from the currency in 2005, based on the new Turkish lira (TL).
Note (2004–2005 transition): As the definitions of building classes and scope coefficients were restructured in the 2005 official unit cost notification, a technical jump occurred in the TL-based base price.
References
- Tappan, W.T. Handbook for the Financial Analyses of Real Estate Investments; McGraw-Hill Inc.: New York, NY, USA, 1993. [Google Scholar]
- Ceylan, R.; Özbakır, B.A.; Erol, I. Alışveriş Merkezlerinin Türkiye’deki Mevzuat Çerçevesinde Değerlendirilmesi. METU J. Fac. Archit. 2017, 34, 245–264. [Google Scholar] [CrossRef] [Scilit]
- Erkip, F.; Özüduru, B. Retail development in Türkiye: An Account After Two Decades of Shopping centers in the Urban Scene. Prog. Plan. 2015, 102, 1–33. [Google Scholar] [CrossRef] [Scilit]
- AARREC. Available online: http://aarrec.ozyegin.edu.tr/research-projects/ (accessed on 1 October 2025).
- Şahin, B. Alışveriş Merkezi Yatırımlarının Türkiye Koşullarında İrdelenmesi ve Antalya Örneği. Ph.D. Thesis, Mimar Sinan University, Institute of Science and Technology, Istanbul, Türkiye, 2001. [Google Scholar]
- Fuzul Gayrimenkul Yatırım Ortaklığı A.Ş. Real Estate Appraisal Report. Available online: https://www.fuzulgyo.com.tr/assets/files/degerleme-raporlari/2024/2024REV900_FUZUL_GYO_ISTANBUL_BASAKSEHIR_NERIVA_1_ADET_DUKKAN.pdf (accessed on 1 April 2026).
- Shopping Center Index 2024 Annual Report. Available online: https://www.ayd.org.tr/avm-ciro-endeksi-yillikendeks-2023 (accessed on 1 April 2026).
- Ayyarkın, T.F.; Bayram, S. Çevre, Şehircilik ve İklim Değişikliği Bakanlığı’nın inşaat kaynak analizlerinin değerlendirilmesi. Harran Univ. J. Eng. 2023, 8, 179–187. [Google Scholar] [CrossRef] [Scilit]
- Çolak, E.; Uğur, L.O. İnşaat maliyet risklerinin simülasyon yöntemi ile analizi. Düzce Univ. J. Sci. Technol. 2023, 11, 466–486. [Google Scholar] [CrossRef] [Scilit]
- Skitmore, R.M.; Ng, S.T. Building and Environment Forecast Models for Actual Construction Time and Cost. Build. Environ. 2003, 38, 1075–1083. [Google Scholar] [CrossRef] [Scilit]
- Aslay, S.E. Construction Contract Price Prediction Using Machine Learning with Bidding Parameters. Karaelmas J. Sci. Eng. 2024, 14, 64–73. [Google Scholar] [CrossRef] [Scilit]
- Abioye, S.O.; Oyedele, L.O.; Akanbi, L.; Ajayi, A.; Delgado, J.M.D.; Bilal, M.; Akinade, O.O.; Ahmed, A. Artificial intelligence in the construction industry: A review of present status, opportunities and future challenges. J. Build. Eng. 2021, 44, 103299. [Google Scholar] [CrossRef] [Scilit]
- Breiman, L. Random forests. Mach. Learn. 2001, 45, 5–32. [Google Scholar] [CrossRef] [Scilit]
- Grinsztajn, L.; Oyallon, E.; Varoquaux, G. Why do tree-based models still outperform deep learning on typical tabular data? Adv. Neural Inf. Process. Syst. 2022, 35, 507–520. [Google Scholar] [CrossRef] [Scilit]
- Goodfellow, I.; Bengio, Y.; Courville, A. Deep Learning; MIT Press: Cambridge, MA, USA, 2016. [Google Scholar]
- Géron, A. Hands-on Machine Learning with Scikit-Learn, Keras, and TensorFlow: Concepts, Tools, and Techniques to Build Intelligent Systems, 3rd ed.; O’Reilly Media: Santa Rosa, CA, USA, 2022. [Google Scholar]
- Pedregosa, F.; Varoquaux, G.; Gramfort, A.; Michel, V.; Thirion, B.; Grisel, O.; Blondel, M.; Prettenhofer, P.; Weiss, R.; Dubourg, V.; et al. Scikit-learn: Machine learning in Python. J. Mach. Learn. Res. 2011, 12, 2825–2830. [Google Scholar]
- Scikit-Learn Developers. Available online: https://scikit-learn.org/stable/modules/generated/sklearn.ensemble.RandomForestRegressor.html (accessed on 1 August 2026).
- Scikit-Learn Developers. Available online: https://scikit-learn.org/stable/modules/generated/sklearn.neural_network.MLPRegressor.html (accessed on 1 August 2026).
- Chai, T.; Draxler, R.R. Root mean square error (RMSE) or mean absolute error (MAE)? Arguments against avoiding RMSE in the literature. Geosci. Model Dev. 2014, 7, 1247–1250. [Google Scholar] [CrossRef] [Scilit]
- Willmott, C.J.; Matsuura, K. Advantages of the mean absolute error (MAE) over the root mean square error (RMSE) in assessing average model performance. Clim. Res. 2005, 30, 79–82. [Google Scholar] [CrossRef] [Scilit]
- James, G.; Witten, D.; Hastie, T.; Tibshirani, R.; Taylor, J. An Introduction to Statistical Learning: With Applications in Python; Springer: Berlin/Heidelberg, Germany, 2023. [Google Scholar]
- Aras, S. Yapay Sinir Ağlarında Duyarlılık Analizleri. Master’s Thesis, Dokuz Eylül University, Institute of Social Sciences, Department of Econometrics, Izmir, Türkiye, 2008. [Google Scholar]
- Uyanık, F.; Kasapbaşı, M.C. Telekomünikasyon sektörü için veri madenciliği ve makine öğrenmesi teknikleri ile ayrılan müşteri analizi. Düzce Univ. J. Sci. Technol. 2021, 9, 172–191. [Google Scholar] [CrossRef] [Scilit]
- Meyer-Ohle, H. Two Asian malls: Urban shopping centre development in Singapore and Japan. Asia Pac. Bus. Rev. 2009, 15, 123–135. [Google Scholar] [CrossRef] [Scilit]
- ICSC. Available online: https://www.icsc.com/ (accessed on 1 July 2026).
- Isaac, D. Property Development: Appraisal and Finance; Macmillan: London, UK, 1996; ISBN 9780333646908. [Google Scholar] [CrossRef] [Scilit]
- Ratcliffe, J.; Stubbs, M. Urban Planning and Real Estate Development; UCL Press: London, UK, 1996. [Google Scholar]
- ISO. Available online: https://www.iso.org.tr/duyurular/genel-duyurular/yatirim-taahhutlu-avans-kredisi-ytak-programi/ (accessed on 6 July 2026).
- Şantiye. Available online: https://www.santiye.com.tr/bir-avm-de-dijital-bir-donusumle-enerji-maliyetlerinden-milyonlarca-lira-tasarruf-edilebilir-mi-akasya-avm-ornegi (accessed on 7 July 2026).
- State. Available online: https://www.state.gov/reports/2025-investment-climate-statements/Türkiye (accessed on 9 July 2026).
- S&P Global. Available online: https://www.spglobal.com/ratings/en/regulatory/article/banking-industry-country-risk-assessment-turkiye-s101653017 (accessed on 15 July 2026).
- Global AYD. Available online: https://www.ayd.org.tr/avm-ciro-endeksi-yillik-endeks-2024 (accessed on 12 July 2026).
- GYODERPORTAL. Available online: https://portal.gyoder.org.tr/_lib/file/doc/GYODER%20G%C3%B6sterge%20-say%C4%B1%2041-%20WEB.pdf (accessed on 12 July 2026).
- AVM GYODER. Available online: https://portal.gyoder.org.tr/_lib/file/doc/GYODER%20G%C3%B6sterge%20-say%C4%B1%2041-%20WEB%281%29.pdf (accessed on 10 June 2026).
- Kiralacar. Available online: https://www.kiralacar.com/blog/turkiyenin-en-buyuk-alisveris-merkezleri/ (accessed on 6 June 2026).
- Torunlar Real Estate Investment Trust, Inc. Available online: https://www.torunlargyo.com.tr/Content/upload/20256_Deerleme_Rap/TRGYO-2503065B%C5%9EEH%C4%B0RSHOPPİNG (accessed on 15 June 2026).
- Ekonomim. Available online: https://www.ekonomim.com/ekonomi/istanbuldaki-unlu-avm-satiliyor-mu-zorlu-avm-icin-carpici-iddia-haberi-819531 (accessed on 6 June 2026).
- Türkiye Journal. Available online: https://www.turkiyegazetesi.com.tr/ekonomi/istanbulun-unlu-avmsinin-arsasi-satisa-cikiyor-iste-istenen-ucret-1064607?s=1 (accessed on 6 May 2026).
- Dünya. Available online: https://www.dunya.com/ekonomi/viaport-turkiye039nin-en-buyuk-outlet-merkezini-29-temmuz039da-haberi-37876 (accessed on 16 June 2026).
- AVM. Available online: https://www.avm.gen.tr/avm/viaport-asia-outlet-avm/?utm_source=chatgpt.com (accessed on 10 May 2026).
- Ypu. Available online: https://www.ypu.com.tr/tr/proje/watergarden (accessed on 12 June 2026).
- Kleidco. Available online: https://kleidco.com/portfolio/watergarden-avm/ (accessed on 14 June 2026).
- Capital. Available online: https://www.capital.com.tr/sektorler/diger-sektorler/grubu-ikiye-katliyoruz-mantikli-buyuyecegiz (accessed on 14 July 2026).
- Ekoyapı. Available online: https://ekoyapidergisi.org/iki-tepe-arasinda-kivrilan-bir-nehri-animsatiyor/ (accessed on 14 April 2026).
- Ekohaber. Available online: https://www.ekohaber.com.tr/ozdilek-leventte-ilk-kazmayi-vurdu (accessed on 14 May 2026).
- Milliyet. Available online: https://www.milliyet.com.tr/ekonomi/akis-yonunu-akbati-ya-cevirdi-1188227 (accessed on 14 May 2026).
- Endeksa. Available online: https://www.endeksa.com/tr/malls/akbati-avm/1165 (accessed on 14 May 2026).
- NTV. Available online: https://www.ntv.com.tr/ekonomi/akbati-bahcesehirde-yukselecek,xTi13pEkH0W6hDX4NGonnQ (accessed on 14 May 2026).
- Akis. Available online: https://www.akisgyo.com/akis-yonunu-akbatiya-cevirdi/ (accessed on 14 May 2026).
- Residence. Available online: https://residenceindex.com/en/proje/246/emaar-square.html (accessed on 12 May 2026).
- Emaar. Available online: https://www.emaarsquaremall.com/tr/ (accessed on 14 May 2026).
- Hürriyet. Available online: https://www.hurriyet.com.tr/gundem/toprakin-arsasi-seyh-maktuma-gitti-8255633 (accessed on 14 May 2026).
- Hürriyet. Available online: https://www.hurriyet.com.tr/ekonomi/zorlu-800-milyon-dolar-verdi-sembol-arazi-yi-seyh-el-maktum-a-kaptirmadi-6082373 (accessed on 14 May 2026).
- Zorlu. Available online: https://www.zorlu.com.tr/tr/faaliyet-alanlari/sektorler/gayrimenkul (accessed on 5 May 2026).
- Zorlu. Available online: https://www.zorlucenter.com.tr/kurumsal/ (accessed on 14 April 2026).
- Endeksa. Available online: https://www.endeksa.com/en/malls/zorlu-center-avm-shopping-mall/1252 (accessed on 12 June 2026).
- Hürriyet. Available online: https://www.hurriyet.com.tr/bilgi/galeri/zorlu-avm-satiliyor-mu-sirketten-aciklama-geldi-42809876/1 (accessed on 18 May 2026).
- Milliyet. Available online: https://www.milliyet.com.tr/ekonomi/akmerkez-25-milyon-dolara-yenileniyor-236377 (accessed on 1 May 2026).
- Kap. Available online: https://kap.org.tr/en/sirket-finansal-bilgileri/1399-akmerkez-gayrimenkul-yatirim-ortakligi-a-s (accessed on 4 April 2026).
- Terra. Available online: https://www.akmgyo.com/media/1178/25-06-2021-tarihli-kira-degerleme-raporu-1.pdf (accessed on 2 June 2026).
- Yapı. Available online: https://www.yapi.com.tr/haberler/metrocity-avm-ortadogulu-yatirimcilarin-ilgisini-cekiyor_132883.html (accessed on 14 May 2026).
- Milliyet. Available online: https://www.milliyet.com.tr/emlak/istanbulda-gokdelen-savaslari-66446#google_vignette (accessed on 10 May 2026).
- Hürriyet. Available online: https://bigpara.hurriyet.com.tr/haberler/genel-haberler/metrocity-nin-kriz-inadi_ID453559/ (accessed on 16 June 2026).
- Terra. Available online: https://www.isgyo.com.tr/files/gayrimenkul-degerleme-raporlari/2016/degerleme-raporlari/Kanyon_AVM_Degerleme_Raporu-_Aralik_2016-9920.pdf (accessed on 10 July 2026).
- Profilo. Available online: https://web.archive.org/web/20100516115931/http://www.pam.com.tr/pam/index.php (accessed on 18 May 2026).
- Profilo. Available online: https://tr.wikipedia.org/wiki/Profilo_AVM (accessed on 14 June 2026).
- Halk TV. Available online: https://halktv.com.tr/ekonomi/turkiyenin-en-unlu-avmsiydi-yikim-islemleri-basladi-bakin-yerine-ne-yapiliyor-831884h (accessed on 12 May 2026).
- Emlak Metrekare. Available online: https://www.emlakmetrekare.com/is-gyodan-profilo-avm-kat-karsiligi-insaat-sozlesmesi-imzalanmasi-hakkinda-aciklama/146028.html (accessed on 23 May 2026).
- Analiz Journal. Available online: https://www.analizgazetesi.com.tr/haber/metrekare-birim-fiyatlari-160-bin-tl-463/ (accessed on 25 June 2026).
- Avrupakent. Available online: https://www.avrupakentgyo.com/tr/proje/avm/armonipark-avm/ (accessed on 18 July 2026).
- Armonipark. Available online: https://www.armonipark.com/ (accessed on 14 July 2026).
- Hesapmatik. Available online: https://hesapmatik.com/hesapla/insaat-maliyet-hesaplama/ (accessed on 24 May 2026).
- Lotus. Available online: https://www.akisgyo.com/wp-content/uploads/2025/06/Akasya-AVYM-Degerleme-Raporu_Aralik-2024.pdf (accessed on 27 May 2026).
- Timeout. Available online: https://www.timeout.com/istanbul/tr/alisveris-stil/citys-nisantasi (accessed on 9 May 2026).
- Citys. Available online: https://citysnisantasi.com/hakkimizda (accessed on 14 May 2026).
- Capital. Available online: https://www.capital.com.tr/sektorler/emlak/konutta-maliyetin-seyri-nasil?sayfa=+2& (accessed on 14 May 2026).
- Kdmavm. Available online: https://www.kdmavm.com.tr/tamamlanan-projeler/capacity-avm (accessed on 2 June 2026).
- Hürriyet. Available online: https://bigpara.hurriyet.com.tr/haberler/genel-haberler/cevahir-i-1-milyar-dolarin-altina-satmam_ID537965/ (accessed on 8 July 2026).
- Cevahir. Available online: https://www.bizcevahir.com.tr/hakkimizda/ (accessed on 10 May 2026).
- İstinyepark. Available online: https://tips.istinyepark.com/hakkimizda (accessed on 18 May 2026).
- İstinyepark. Available online: https://www.istinyeparkgyo.com.tr/cdn/Delivery/Public/File/istinyepark-gayrimenkul_tr-31-12-2024-konsolide-restated-2- (accessed on 12 July 2026).
- Cumhuriyet. Available online: https://www.cumhuriyet.com.tr (accessed on 18 May 2026).
- mimdaporg. Available online: https://mimdap.org/haberler/ystinye-park-kapylaryny-acty/ (accessed on 18 May 2026).
- Vadistanbul. Available online: https://www.vadistanbul.com/en/park (accessed on 24 June 2026).
- İnvestinşaat. Available online: https://www.investinsaat.com/tr/projeler/tamamlanan-projeler/vadistanbul-bulvar (accessed on 26 May 2026).
- Hilltown. Available online: https://rgy.com.tr/portfoy/hilltown-kucukyali (accessed on 9 July 2026).
- Retail Türkiye. Available online: https://retailturkiye.com/avm/hilltown-avm-kucukyalida-acildi/ (accessed on 12 July 2026).
- Burgan Invest. Available online: https://www.burganyatirim.com.tr/files/halka-arz/rgyas/kucukyali-hilltown-31122023.pdf (accessed on 7 May 2026).
- Tripadvisor. Available online: https://www.tripadvisor.com.tr/Attraction_Review-g293974-d7014161-Reviews-Aqua_Florya_Alisveris_Merkezi-Istanbul.html (accessed on 6 July 2026).
- Ece. Available online: https://www.ece.com/tr/center-portfolio/center/aqua-florya (accessed on 14 April 2026).
- Hürriyet. Available online: https://www.hurriyet.com.tr/kelebek/florya-akvaryumu-na-yap-islet-devret-cozumu-7645987 (accessed on 24 April 2026).
- Bayraktar. Available online: https://www.bayraktar.com//tr/stat/real-estate-development (accessed on 3 May 2026).
- Dati. Available online: https://dati.com.tr/galleri%cc%87a/ (accessed on 14 May 2026).
- Nek İstanbul. Available online: https://nek.istanbul.edu.tr/ekos/TEZ/35775.pdf (accessed on 18 June 2026).
- Arkiv. Available online: https://www.arkiv.com.tr/proje/palladium-alisveris-merkezi-ve-residence/1489?lang=tr (accessed on 14 July 2026).
- Habertürk. Available online: https://www.haberturk.com/ekonomi/makro-ekonomi/haber/99240-anadolu-yakasina-dev-cam-kure (accessed on 9 April 2026).
- Dome. Available online: https://dome.ws/tr/project/metropol-2/ (accessed on 12 July 2026).
- Viaport. Available online: https://viaportmarina.com/tr/alisveris-merkezi/kurumsal (accessed on 12 April 2026).
- Metdan İstanbul. Available online: https://meydan-istanbul.com/hakkimizda (accessed on 10 May 2026).
- Metro. Available online: https://www.metro-properties.com.tr/en/projects/retail-assets-development-projects/meydan-umraniye-shopping-centre-istanbul (accessed on 17 June 2026).
- Mutlu Construction. Available online: https://mutluinsaat.com/Projeler/tamamlanan-projeler/Canpark-Avm (accessed on 16 May 2026).
- İHA. Available online: https://www.iha.com.tr/haber-sancaktepenin-ilk-avmsi-acildi-391183 (accessed on 14 May 2026).
- Rings Sc. Available online: https://www.ringsavm.com.tr/tr/rings-avm-hakkinda (accessed on 18 June 2026).
- Selçuk Holding. Available online: https://www.selcukluholding.com.tr/tr/sektorler/gayrimenkul?c=selininsaat (accessed on 17 April 2026).
- Avm Journal. Available online: https://www.avmdergi.com/carousel-30-yildir-nesilden-nesle-bulusma-noktasi-olmaya-devam-ediyor/ (accessed on 2 May 2026).
- Keleşoğlu Holding. Available online: https://www.kelesogluholding.com/projeler/flyinn-alisveris-merkezi/ (accessed on 8 June 2026).
- Anneysen. Available online: https://www.anneysen.com/carsi/cocuk-eglence-merkezleri/oyun-alani-kadir-has-cocuk-dunyasi_867 (accessed on 5 July 2026).
- Mutlu Construction. Available online: https://mutluinsaat.com/Projeler/tamamlanan-projeler/Kadir-Has-avm (accessed on 15 May 2026).
- Tepe Grup. Available online: https://www.tepe.com.tr/ (accessed on 11 May 2026).
- Kozzy Sc. Available online: https://kozzyavm.com/tr/hakkimizda (accessed on 12 April 2026).
- Rönesans Gayrimenkul. Available online: https://kap.org.tr/tr/api/file/download/33E834370B27023CE0530A4A622B5826 (accessed on 14 June 2026).
- Kdm Sc. Available online: https://www.kdmavm.com.tr/tamamlanan-projeler/astoria-avm (accessed on 18 April 2026).
- Astoria. Available online: https://www.astoria.com.tr/ (accessed on 14 April 2026).
- Katalog Marmara. Available online: https://katalog.marmara.edu.tr/veriler/yordambt/cokluortam/2E/T0071921.pdf (accessed on 11 May 2026).
- Wikipedia. Available online: https://en.wikipedia.org/wiki/Atirus_Shopping_Center (accessed on 10 July 2026).
- Researchgate. Available online: https://www.researchgate.net/publication/389636477_Alisveris_merkezleri_ve_alisveris_caddelerinin_donusumunde_gelecek_yaklasimlari_Future_approaches_to_the_transformation_of_shopping_centers_and_shopping_streets (accessed on 11 June 2026).
- Terra. Available online: https://www.isgyo.com.tr/files/gayrimenkul-degerleme-raporlari/2018/degerleme-raporlari/2018_ISGYO_MARMARA_PARK_AVM__%281%29-19142.pdf (accessed on 24 April 2026).
- İş Gyo. Available online: https://kap.org.tr/tr/api/file/download/4028328c5988d42f015a70605dc94029 (accessed on 17 May 2026).
- Metro. Available online: https://www.metro-properties.com.tr/en/ (accessed on 1 May 2026).
- Edip real Estate. Available online: https://kap.org.tr/en/api/file/download/33E8343748D9023CE0530A4A622B5826 (accessed on 14 April 2026).
- Avmdergi. Available online: https://www.avmdergi.com/indeks/akvaryum-avm/ (accessed on 13 May 2026).
- Airport Sc. Available online: https://airportavm.com.tr/hakkimizda/ (accessed on 8 May 2026).
- Ataköy Plus. Available online: https://atakoyplus.com/iletisim/ (accessed on 11 May 2026).
- Beyaz Construction. Available online: https://www.beyazinsaat.com/iletisim/proje/atakoy-a-plus-avm/ (accessed on 19 May 2026).
- Keleşoğlu Holding. Available online: https://www.kelesogluholding.com/projeler/atakoy-a-plus-avm/ (accessed on 14 May 2026).
- Historia. Available online: https://www.historia.com.tr/EN/about-us (accessed on 22 May 2026).
- Keleşoğlu Holding. Available online: https://www.kelesogluholding.com/projeler/historia/ (accessed on 4 May 2026).
- Torunlar. Available online: https://torunlargyo.com.tr/torium-avm-istanbul (accessed on 12 July 2026).
- Pd Global. Available online: https://www.pd-global.com/tr/project/neomarin (accessed on 11 June 2026).
- Neomarin. Available online: https://www.neomarin.com.tr/hakkimizda (accessed on 20 May 2026).
- Tskb. Available online: https://kap.org.tr/tr/api/file/download/4028328d998eebe8019a2623566f72e4 (accessed on 22 May 2026).
- Pendorya. Available online: https://www.pendorya.com/en/corporate (accessed on 24 June 2026).
- Venezia. Available online: https://veneziamegaoutlet.com/aboutus (accessed on 9 May 2026).
- Sealand Trip. Available online: https://sealandtrip.com/venezia-mega-outlet/ (accessed on 28 June 2026).
- Linkedin. Available online: https://www.linkedin.com/in/nil-ar%C4%B1n-atabey-ocak%C3%A7i-17229347/ (accessed on 1 June 2026).
- Yumpu. Available online: https://www.yumpu.com/en/document/view/15040852/international-construction-cost-survey-2012 (accessed on 14 April 2026).
- Rönesans Real Estate. Available online: https://cdn.ataonline.com.tr/ata/ContentFiles/pdf/rgyas/izahname.pdf (accessed on 17 July 2026).
- İng Invest. Available online: https://www.ingyatirim.com.tr/media/HalkaArz/RönesansHalkaArz/Ek4-Kucukyali-Hilltown-2023REV1023.pdf (accessed on 10 July 2026).
- AA Business World. Available online: https://www.aa.com.tr/tr/isdunyasi/gayrimenkul/ronesanstan-250-milyon-avroluk-avm-yatirimi/639215 (accessed on 2 July 2026).
- Marmara Forum. Available online: https://www.marmaraforum.com.tr/hakkimizda/ (accessed on 17 June 2026).
- Zinco. Available online: https://zinco-greenroof.com/references/marmara-forum-istanbul (accessed on 19 May 2026).
- Hayat Holding. Available online: https://www.hayatholding.com.tr/faaliyetlerimiz/gayrimenkul-gelistirme (accessed on 8 May 2026).
- Axis İstanbul. Available online: https://www.axisistanbulavm.com.tr/Kurumsal/Sur-Yapi (accessed on 3 June 2026).
- Sur building. Available online: https://suryapi.com.tr/basin-odasi/haberler/axis-istanbul-alisveris-merkezi-acildi (accessed on 24 June 2026).
- Optimum. Available online: https://optimumistanbul.com/tr/hakkimizda (accessed on 11 May 2026).
- İng Invest. Available online: https://www.ingyatirim.com.tr/media/HalkaArz/RönesansHalkaArz/Ek4-Optimum-Istanbul-2023REV1028.pdf (accessed on 18 June 2026).
- Kalyon Holding. Available online: https://kalyonholding.com/yatirim-isletme/florentia-village-luxury-designer-outlet-istanbul (accessed on 7 May 2026).
- We Consult. Available online: https://www.weconsult.com.tr/florentina-village/ (accessed on 14 May 2026).
- AA Business World. Available online: https://www.aa.com.tr/tr/isdunyasi/gayrimenkul/florentia-village-10-eylulde-acilacak-/703392 (accessed on 9 June 2026).
- Hürriyet. Available online: https://www.hurriyet.com.tr/ekonomi/40-milyon-dolar-daha-yatirdi-26130796 (accessed on 12 May 2026).
- İş Gyo. Available online: https://www.isgyo.com.tr/files/gayrimenkul-degerleme-raporlari/2010/degerleme-raporlari/Istanbul_Marmara_Park_AVM%28Esenyurt_110_Parsel%29-230.pdf (accessed on 18 June 2026).
- İfc Shopping Center. Available online: https://www.istanbulalisverismerkezi.com/?lang=tr (accessed on 20 May 2026).
- Sovereign Wealth Fund of Türkiye. Available online: https://www.tvf.com.tr/portfoyumuz/gayrimenkul (accessed on 19 May 2026).
- Nata Holding. Available online: https://www.nataholding.com/sektor-avm.html (accessed on 14 May 2026).
- Vega Sc. Available online: https://www.vegaavmsilivri.com/ (accessed on 18 June 2026).
- Mekanlar. Available online: https://mekanlar.com/avm/carrefour-icerenkoy-avm (accessed on 12 May 2026).
- Mekanlar. Available online: https://mekanlar.com/mekan/carrefour-icerenkoy-avm/yorumlar (accessed on 12 May 2026).
- Beylikdüzü Migros Sc. Available online: https://www.beylikduzumigrosavm.com/kurumsal (accessed on 2 June 2026).
- Maltepe Park Sc. Available online: https://maltepeparkavm.com/tr/hakkimizda (accessed on 14 May 2026).
- Lotus. Available online: https://kap.org.tr/tr/api/file/download/4028328d9b827483019b8ece096e284f (accessed on 4 May 2026).
- Mimdap. Available online: https://mimdap.org/haberler/ya-buralar-yethil-alan-ya-mulkiyet-hakky-yalan/ (accessed on 18 June 2026).
- Via Real Estate. Available online: https://kap.org.tr/en/Bildirim/529313 (accessed on 14 July 2026).
- İş Gyo. Available online: https://www.isgyo.com.tr/files/gayrimenkul-degerleme-raporlari/2010/degerleme-raporlari/Istanbul_Esenyurt_Real_Hipermarket_Binasi_ve_Cevre_Parseller-224.pdf (accessed on 19 May 2026).
- Kiler Gyo. Available online: https://www.kilergyo.com/istanbul-sapphire.php (accessed on 3 May 2026).
- Pd Global. Available online: https://www.pd-global.com/tr/project/sapphire-istanbul (accessed on 14 April 2026).
- Office of Investment and Finance of the Presidency of the Republic of Türkiye. Available online: https://www.invest.gov.tr/tr/news/news-from-Türkiye/sayfalar/1011200811619.aspx (accessed on 19 April 2026).
- Beylicium. Available online: https://beylicium.com.tr/icerik/ (accessed on 24 April 2026).
- Ayna Construction. Available online: https://aynainsaat.com.tr/tr/projeler/emaar-square-avm (accessed on 14 April 2026).
- Tav Construction. Available online: https://tavconstruction.com/tr/bulding-project-07.html (accessed on 9 May 2026).
- Via Real Estate. Available online: https://kap.org.tr/en/api/file/download/33E8343A0172023CE0530A4A622B5826 (accessed on 14 June 2026).
- Emaar. Available online: https://www.emaarsquaremall.com/tr/hakkimizda/ (accessed on 13 May 2026).
- On Design. Available online: https://ontasarim.com.tr/en/project/emaar-square-istanbul-59 (accessed on 11 May 2026).
- Emaar. Available online: https://cdn.tr.emaar.com/wp-content/uploads/2020/07/Emaar-Square-General-ENG-TR.pdf (accessed on 10 June 2026).
- Keleşoğlu Holding. Available online: https://www.kelesogluholding.com/projeler/capacity-alisveris-merkezi/ (accessed on 14 June 2026).
- Mes Group. Available online: http://www.mesgroup.com.tr/capacity.aspx (accessed on 11 June 2026).
- Beyaz Construction. Available online: https://beyaz-insaat.com/En/capacity-shopping-center/Beyaz_P12/ (accessed on 20 May 2026).
- Capacity. Available online: https://www.capacity.com.tr/magazalar (accessed on 12 April 2026).
- Esas Real Estate. Available online: https://www.esasgayrimenkul.com.tr/yatirimlar/olivium-outlet-avm-yatirim (accessed on 14 April 2026).
- Alikişioğlu. Available online: https://alikisioglu.com.tr/proje-1.html (accessed on 10 May 2026).
- İş Gyo. Available online: https://www.isgyo.com.tr/files/gayrimenkul-degerleme-raporlari/2022/degerleme-raporlari/22_400_313_ISGYO_KANYON_PAZAR_EKSIZ-27592.pdf (accessed on 24 May 2026).
- Tepe Grup. Available online: https://www.tepe.com.tr/tr/kanyon (accessed on 26 May 2026).
- İş Gyo. Available online: https://www.isgyo.com.tr/files/gayrimenkul-degerleme-raporlari/2023/degerleme-raporlari/KANYON_AVM_DEGERLEME_RAPORU-27670.pdf (accessed on 12 July 2026).
- İstinyepark. Available online: https://istinyepark.com.tr/about/ (accessed on 17 April 2026).
- Bulutlar Construction. Available online: https://www.bulutlarinsaat.com.tr/nmerkez (accessed on 10 June 2026).
- Emlak Offstage. Available online: https://emlakkulisi.com/guncel/ozyurtlar-nmerkez/255402 (accessed on 22 May 2026).
- Turner and Down Send. Available online: https://publications.turnerandtownsend.com/international-construction-market-survey-2024/methodology (accessed on 18 June 2026).
- Polat Piyalepaşa Market. Available online: https://polatpiyalepasacarsi.com/ (accessed on 12 May 2026).
- Polat. Available online: https://www.polat.com/assets/img/image/2023-faaliyet-raporu.pdf (accessed on 10 May 2026).
- Perspektif Grup. Available online: https://www.perspektifgrup.com/projeler/piyalepasa-istanbul/ (accessed on 17 June 2026).
- Polat Real Estate. Available online: https://polatgayrimenkul.com.tr/projeler/polat-piyalepasa-carsi (accessed on 10 April 2026).
- Emaar. Available online: https://www.emaarsquaremall.com/tr/magazalistesi/ (accessed on 11 May 2026).
- Emaar. Available online: https://tr.emaar.com/tr/properties/emaar-square-office/ (accessed on 20 May 2026).
- City Center Outlet. Available online: https://www.citycenteroutlet.com/hakkimizda (accessed on 14 May 2026).
- Kdm Sc. Available online: https://kdmavm.com.tr/avm-yonetim-danismanligi/brandium-avm (accessed on 24 May 2026).
- Gazete Ataşehir. Available online: https://www.atasehir.com.tr/haber/brandium-avm-acildi-7057 (accessed on 4 April 2026).
- Housing Projects. Available online: https://www.konutprojeleri.com/nevbahar-uskudar (accessed on 11 June 2026).
- Kalyon Holding. Available online: https://kalyonholding.com/yatirim-isletme/uskudar-nevcarsi (accessed on 12 June 2026).
- TÜİK Veri Portalı. Available online: https://veriportali.tuik.gov.tr/tr/press/18685 (accessed on 11 September 2026).
- TÜİK Veri Portalı. Available online: https://veriportali.tuik.gov.tr/tr/press/58297 (accessed on 14 September 2026).
- Yılmaz, K.Ç. The Relation Between Divorce and Woman Labor Force, Savings and Male Unemployment: Evidence from Turkey. J. Emerg. Econ. Policy 2022, 7, 56–63. [Google Scholar]
- TCMB. Available online: https://evds3.tcmb.gov.tr/arsiv/9998006/bie_prarz (accessed on 14 September 2026).
- ISI CEIC. Available online: https://www.ceicdata.com/en/indicator/turkey/exchange-rate-against-usd (accessed on 15 September 2026).
- Yenikonutemlak. Available online: https://yenikonutemlak.com/turkiye-ticari-gayrimenkul-pazari-verileri-aciklandi/ (accessed on 1 July 2026).
- Cushman and Wakefield. Available online: https://www.cw-tr.com/en/research (accessed on 5 June 2026).
- EY. Available online: https://www.ey.com/tr_tr/newsroom/2026/4/ey-tuketici-urunleri-perakende-gorunumu-raporu-yayimlandi (accessed on 8 June 2026).
- Shopping Center Indices. Available online: https://www.ayd.org.tr/avm-endeksleri (accessed on 6 June 2026).
- Istanbul Commodity Exchange. Available online: https://www.istib.org.tr/raporlar (accessed on 10 June 2026).
- Endeksa. Available online: https://www.endeksa.com/tr/analiz/turkiye/istanbul/endeks/satilik/arsa (accessed on 14 June 2026).
- Borup, D.; Christensen, B.J.; Mühlbach, N.S.; Nielsen, M.S. Targeting predictors in random forest regression. Int. J. Forecast. 2022, 39, 841–868. [Google Scholar] [CrossRef] [Scilit]
- Elmousalami, H.H. Artificial intelligence and parametric construction cost estimate modeling: State-of-the-art review. J. Constr. Eng. Manag. 2020, 146, 03119008. [Google Scholar] [CrossRef] [Scilit]
- Yun, S. Performance analysis of construction cost prediction using neural network for multioutput regression. Appl. Sci. 2022, 12, 9592. [Google Scholar] [CrossRef] [Scilit]
- TEKHA. Available online: https://tekha.com.tr/tuik-temmuz-ayi-insaat-maliyet-endeksi-verilerini-duyurdu (accessed on 13 September 2026).
- TÜİK Veri Portalı. Available online: https://veriportali.tuik.gov.tr/tr/ (accessed on 12 September 2026).
- Hepsiemlak. Available online: https://www.hepsiemlak.com/?gad_source=1&gad_campaignid=1037868470&gbraid=0AAAAADP4NMZocE1J7yZZ9a2q3J8lfuDMo&gclid=Cj0KCQjw7eXTBhDBARIsAKF-w47lCydyuYkLcakJsQ8MmuLOpD4trzAz4yN1BHTR2r-cakZAqhNUdoUaAjleEALw_wcB (accessed on 14 June 2026).
- Emlakjet Commercial-Zoned Land Listings. Available online: https://www.emlakjet.com/satilik-ticari-imarli-arsa/istanbul/emlakcidan (accessed on 10 September 2026).
- TCMB Commercial Property Price Index. Available online: https://www.tcmb.gov.tr/wps/wcm/connect/tr/tcmb+tr/main+menu/istatistikler/reel+sektor+istatistikleri/tgfe (accessed on 10 September 2026).
- Tapusor/AA Istanbul Land Value Study. Available online: https://www.aa.com.tr/tr/turkiye/istanbulun-arsa-degeri-23-4-trilyon-liraya-ulasti/2269200 (accessed on 11 September 2026).
- Colliers Türkiye Research. Available online: https://www.colliers.com/en-tr/services/research-services (accessed on 11 September 2026).
- Municipal Assessed Land Values. Available online: https://www.turkiye.gov.tr/avcilar-belediyesi-arsa-rayic-degeri-sorgulama-v2 (accessed on 9 September 2026).
- Unit Prices. Available online: https://yfk.csb.gov.tr/birim-fiyatlar-100468 (accessed on 12 July 2026).
- Building Construction Cost Schedule. Available online: https://www.gib.gov.tr/yardim-kaynaklar/yararli-bilgiler/bina-insaat-maliyetleri (accessed on 12 July 2026).
- Türkiye Statistical Institute. Available online: https://www.tuik.gov.tr/ (accessed on 12 July 2026).
- Arcadis. Available online: https://www.arcadis.com/en/insights/international-construction-costs-2026/ (accessed on 12 July 2026).
- Construction Cost Report. Available online: https://www.rlb.com/americas/insights/theme/construction-cost-report/ (accessed on 12 July 2026).
- Insights. Available online: https://insights.aecom.com/insights/meh (accessed on 12 July 2026).
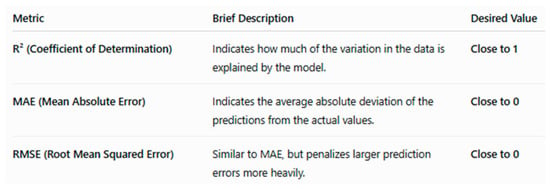
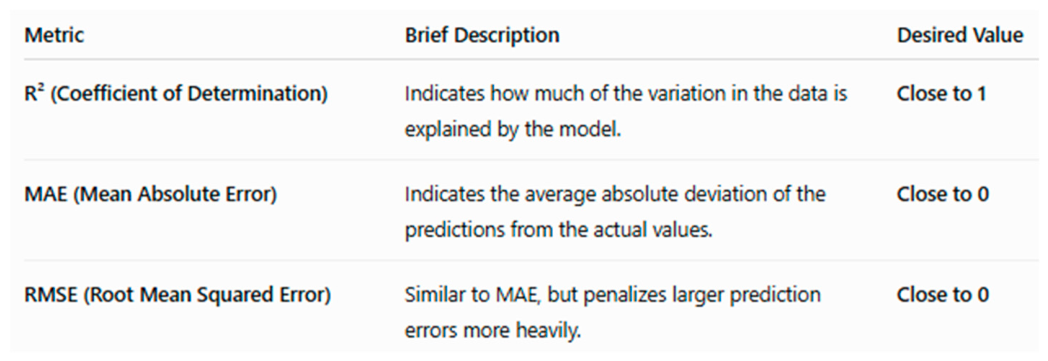
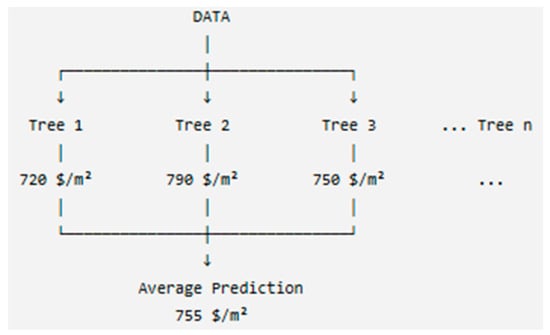
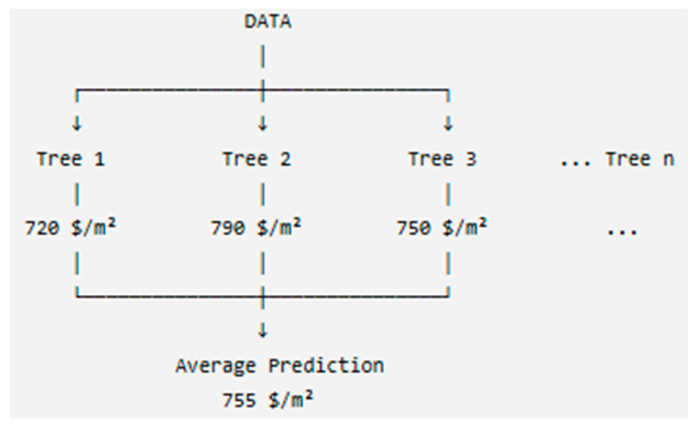
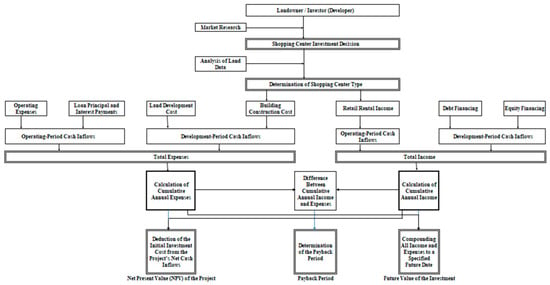
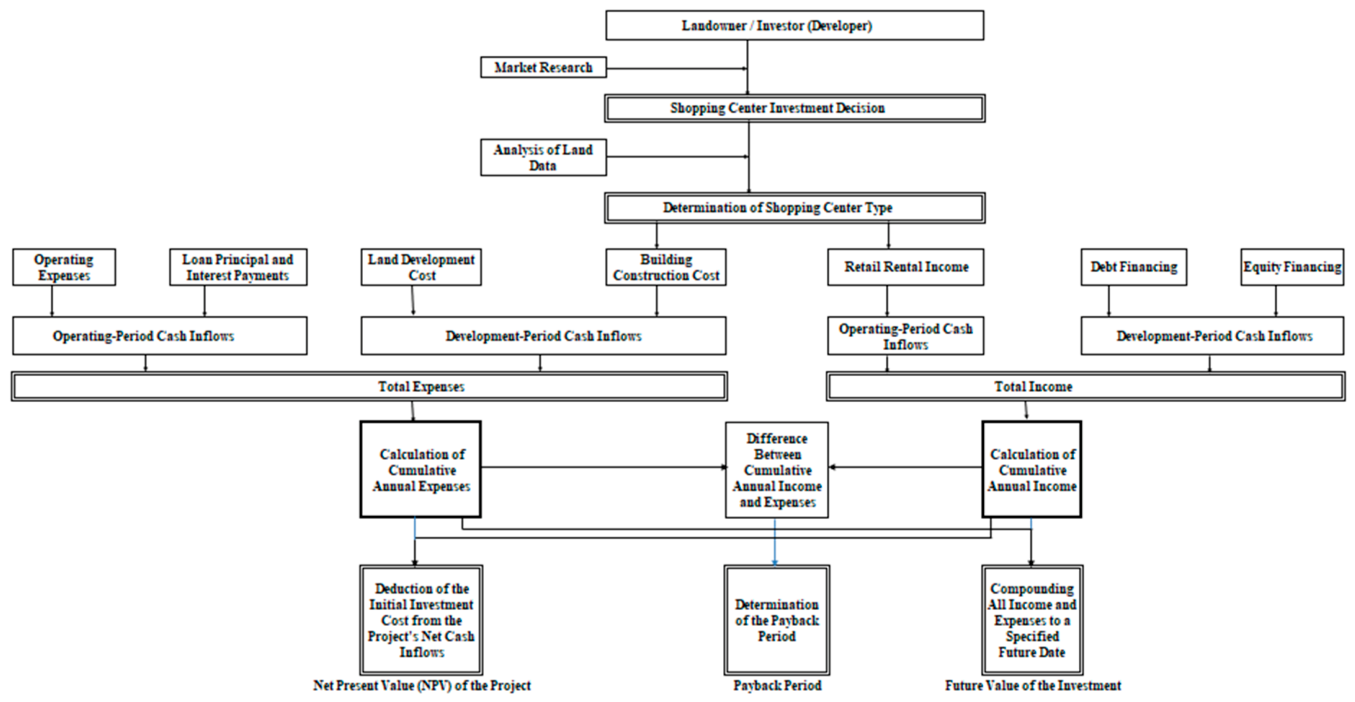
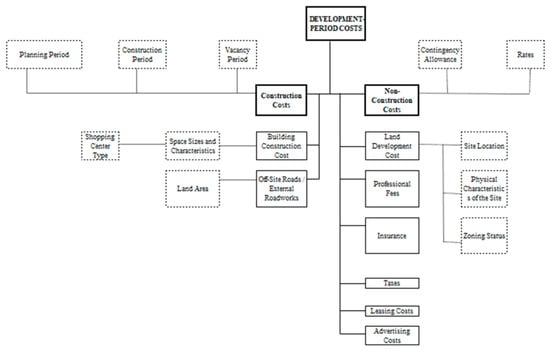
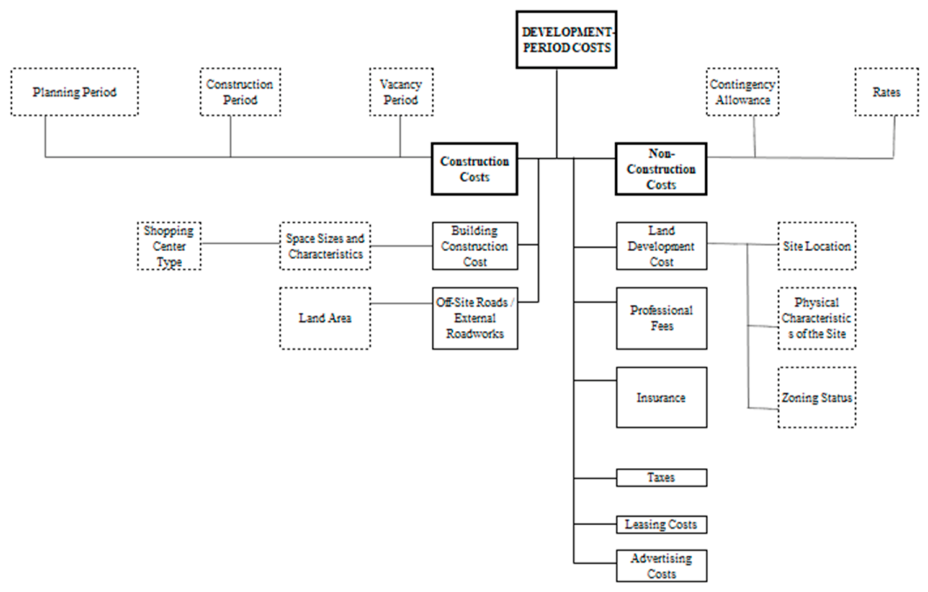
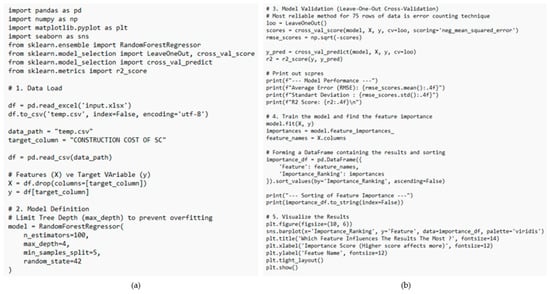
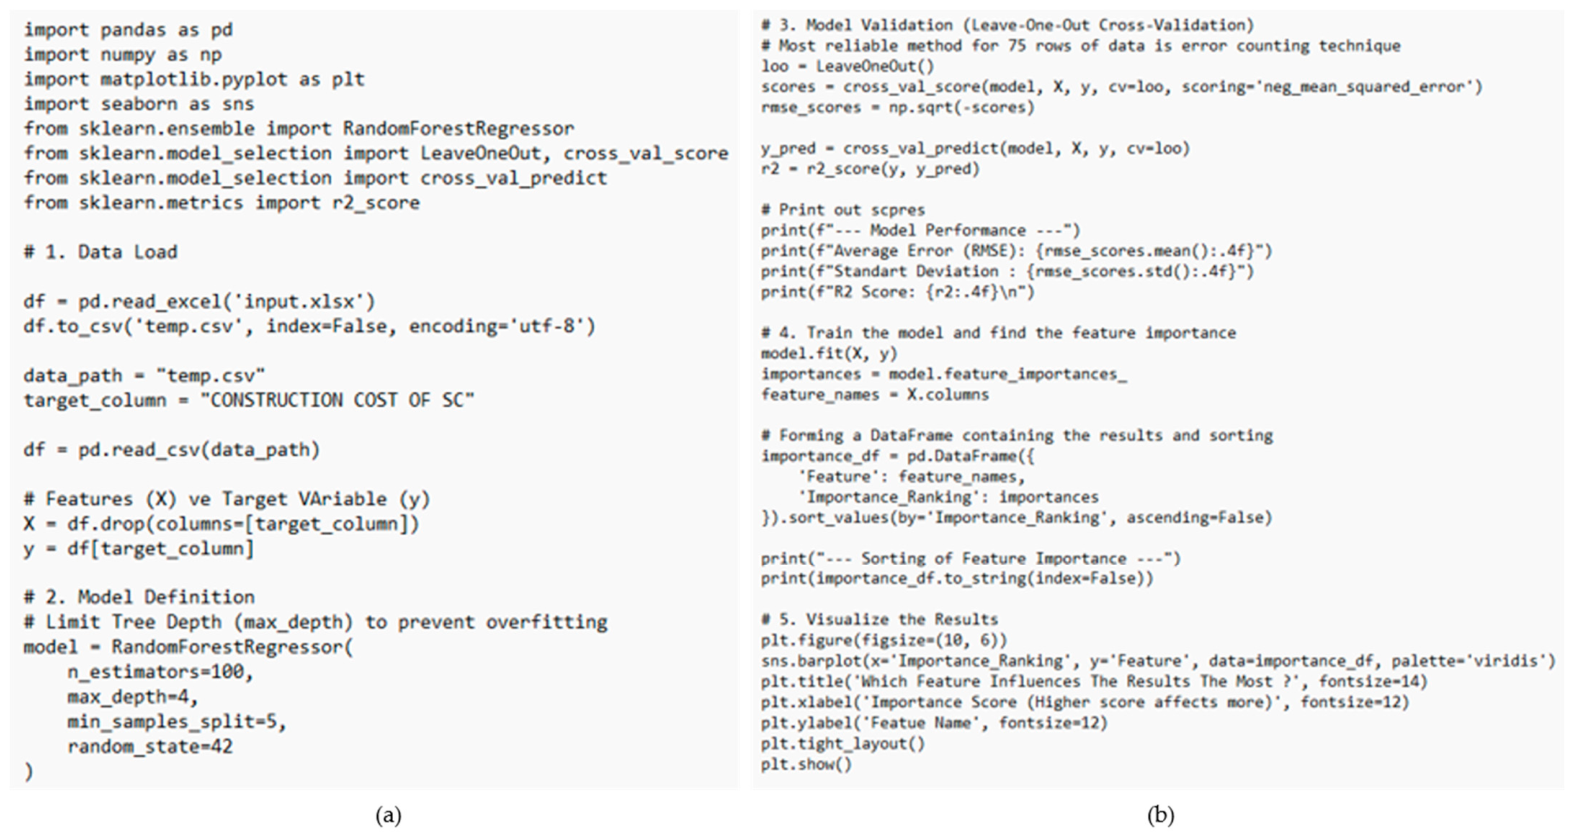
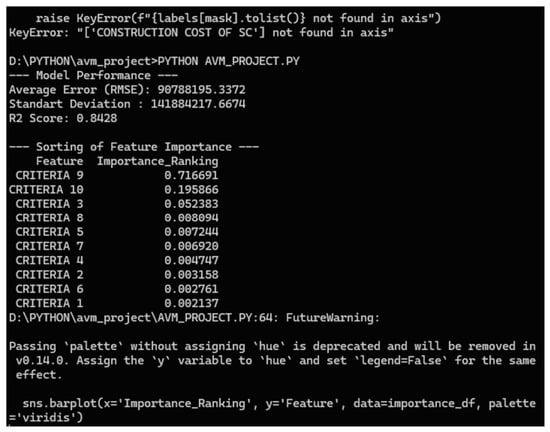
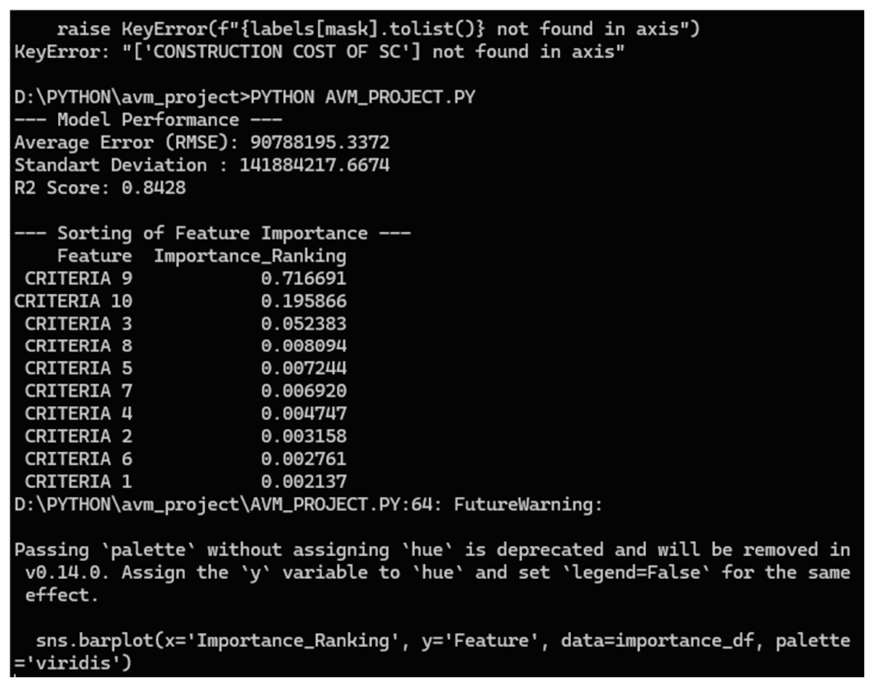
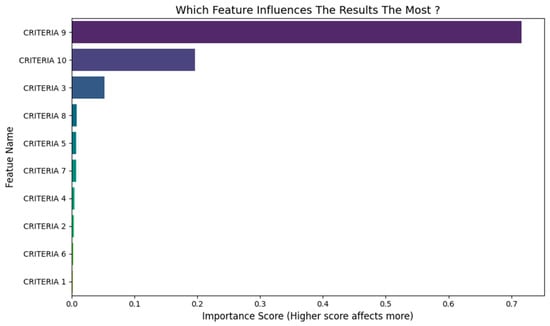
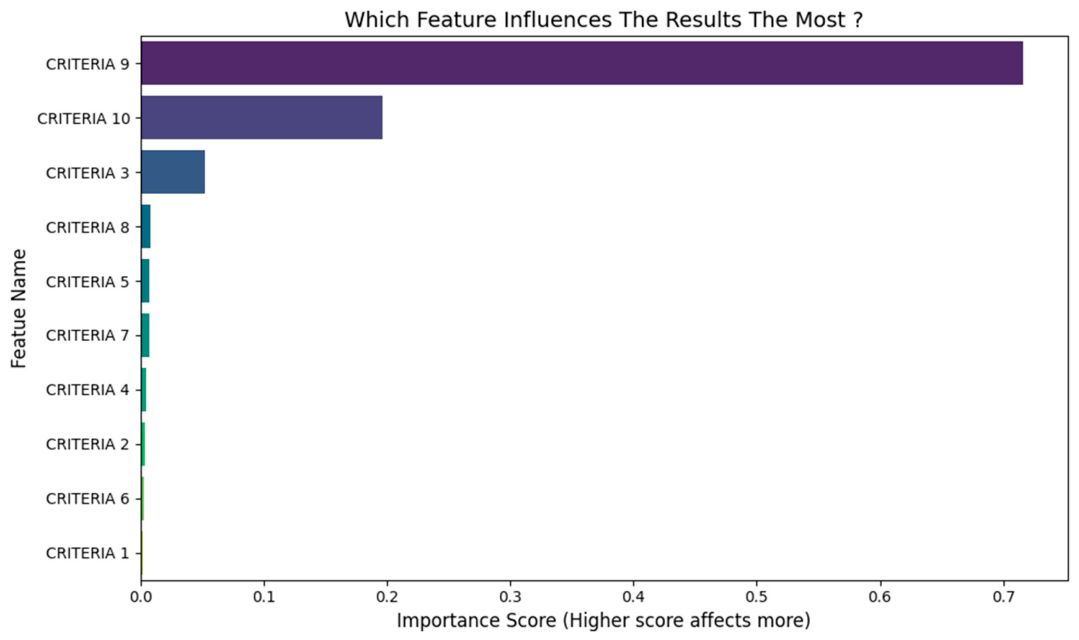
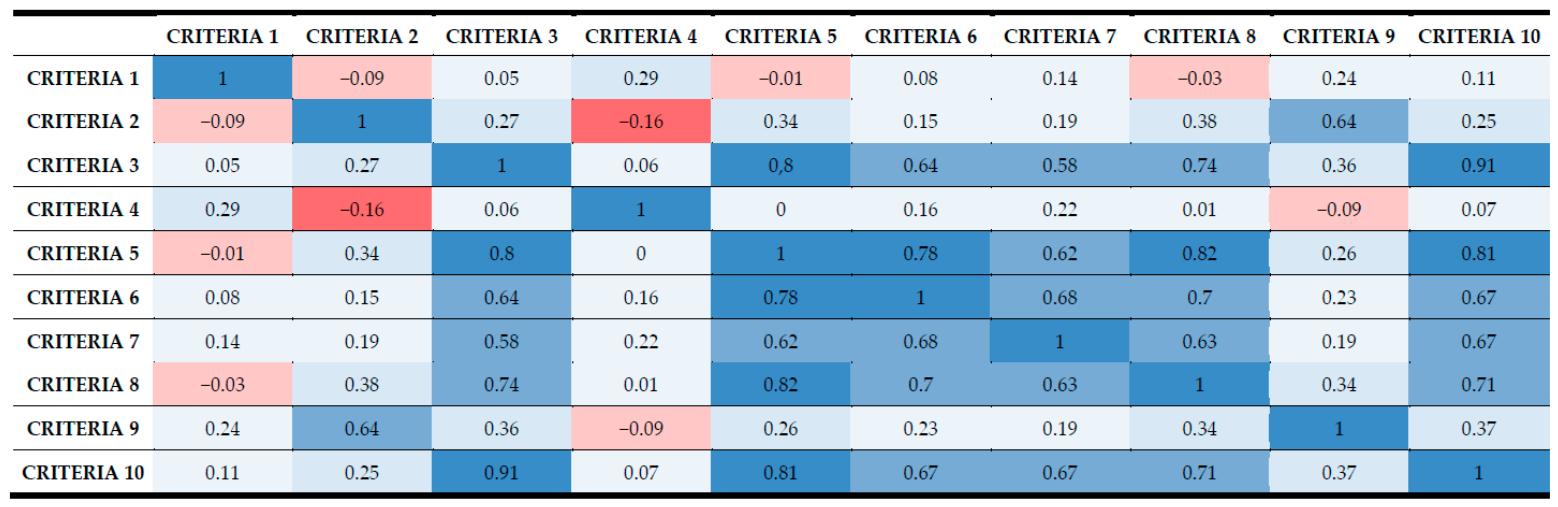

Disclaimer/Publisher’s Note: The statements, opinions and data contained in all publications are solely those of the individual author(s) and contributor(s) and not of MDPI and/or the editor(s). MDPI and/or the editor(s) disclaim responsibility for any injury to people or property resulting from any ideas, methods, instructions or products referred to in the content. |
© 2026 by the author. Licensee MDPI, Basel, Switzerland. This article is an open access article distributed under the terms and conditions of the Creative Commons Attribution (CC BY) license.