


Abstract
Explicit bond-slip modeling for glass fiber-reinforced polymer (GFRP)-reinforced concrete (RC) members is computationally inefficient for structural-scale parametric analyses. This study develops a calibrated equivalent finite-element (FE) framework for GFRP-RC isolated footings on Winkler foundations. A GFRP-RC two-way slab test was used for calibration. After boundary correction, a tensile stress-scaling factor was introduced into the concrete tensile model to compensate for stiffness overestimation caused by the embedded-reinforcement assumption. The calibrated model was then transferred to a full-scale isolated footing, and the effects of subgrade modulus, bar diameter, reinforcement spacing, and footing thickness were examined. The results show that the footing response is governed mainly by settlement development, concrete cracking, and stiffness degradation, while the GFRP stress remains far below its tensile strength. Footing thickness is the most effective structural parameter for improving stiffness and reducing damage, whereas increasing bar diameter provides limited improvement despite higher reinforcement consumption. Reducing reinforcement spacing mainly improves tensile-demand distribution and damage control. The proposed calibrated equivalent FE framework provides an efficient numerical approach for comparative deformation- and damage-based assessment of GFRP-RC isolated footings within the investigated parameter range.
1. Introduction
Glass fiber-reinforced polymer (GFRP) bars have been increasingly used as alternatives to steel reinforcement in concrete structures because of their corrosion resistance, low density, high tensile strength, and electromagnetic neutrality [1,2,3,4]. These advantages are attractive for reinforced concrete foundations exposed to aggressive environments or special service conditions. Nevertheless, the elastic modulus of GFRP bars is much lower than that of steel reinforcement, which makes the post-cracking response more sensitive to serviceability limits [2,4]. After concrete cracking, the limited tensile stiffness of GFRP reinforcement may lead to larger deflection, wider cracks, and more pronounced stiffness degradation [5]. For isolated footings, this issue is further complicated by the combined action of column loads and subgrade reactions, which produces two-way bending, local compression, and compression–shear interaction near the load-transfer region [6]. Therefore, the behavior of GFRP-reinforced concrete isolated footings should be evaluated from deformation and damage perspectives, rather than only by reinforcement strength utilization.
Extensive studies have examined GFRP-reinforced concrete beams, slabs, and slab–column connections. Experimental results have shown that the flexural and shear responses of GFRP-reinforced members are often governed by crack width, deflection, and post-cracking stiffness rather than reinforcement rupture [5,7,8]. For slab-type members, previous studies have further demonstrated that the low stiffness and distinct bond characteristics of GFRP bars significantly affect crack propagation and deformation capacity under flexural, impact, and punching-type actions [6,9,10]. In addition, FRP–concrete hybrid slabs and bridge-deck systems have been investigated to improve durability, reduce self-weight, and enhance structural efficiency [11,12,13]. However, most existing studies focus on beams, slabs, slab–column connections, or hybrid deck components. Systematic numerical investigations on GFRP-reinforced isolated footings supported by elastic foundations remain limited, especially regarding the relative effects of subgrade stiffness, bar diameter, reinforcement spacing, and footing thickness.
A major difficulty in structural-scale finite-element analysis of GFRP-reinforced concrete foundations is the treatment of reinforcement–concrete interaction. Explicit bond-slip models can describe interfacial mechanisms such as mechanical interlocking, debonding, and slip development [14,15]. However, these models require refined meshes, nonlinear contact definitions, and high computational cost, making them unsuitable for multi-case parametric analyses [16,17]. By contrast, embedded-reinforcement models are efficient and robust, but they enforce perfect displacement compatibility between GFRP bars and concrete. This assumption suppresses local slip and may overestimate post-cracking stiffness when the structural response is controlled by cracking and stiffness degradation [18,19]. Therefore, an efficient equivalent structural-scale model is required to retain computational robustness while reproducing the global post-cracking response through appropriate calibration.
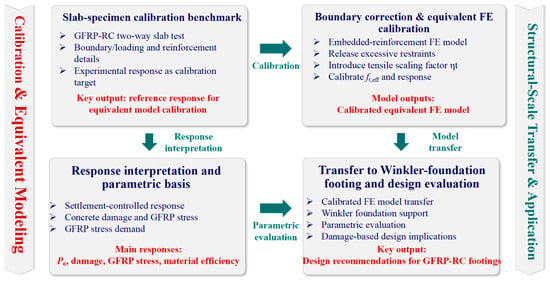
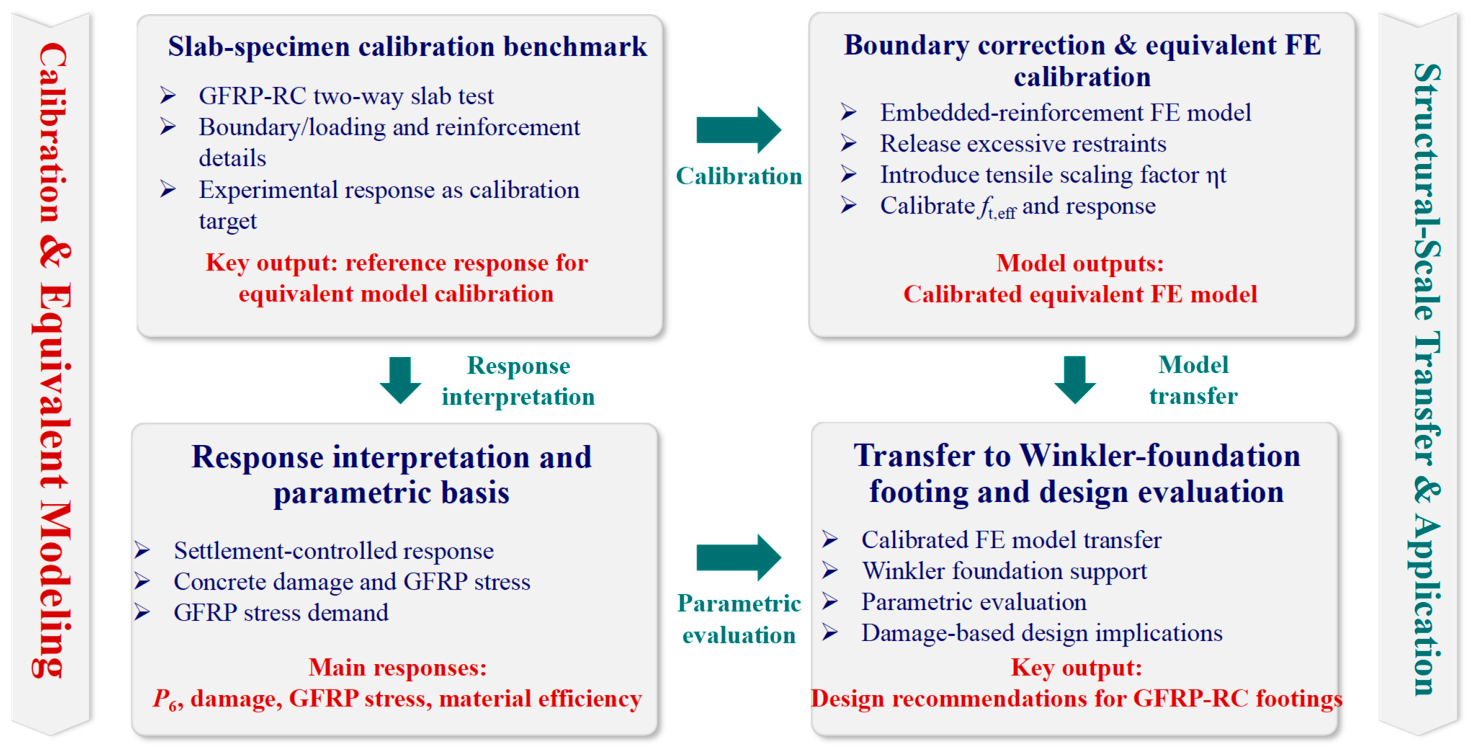
To address this issue, this study develops a calibrated equivalent finite-element framework for GFRP-reinforced concrete isolated footings on Winkler foundations, as illustrated in Figure 1. A GFRP-reinforced concrete two-way slab test is first used as the member-scale calibration benchmark [20]. Then, excessive boundary restraints are released, and an equivalent tensile stress-scaling factor is introduced to calibrate the embedded-reinforcement FE model. Based on the calibrated response, the key response indicators, including settlement-controlled load, concrete damage, GFRP stress, and material efficiency, are interpreted to establish the parametric evaluation basis. Finally, the calibrated equivalent FE model is transferred to a full-scale GFRP-RC isolated footing supported by a Winkler elastic foundation, and the effects of subgrade modulus, bar diameter, reinforcement spacing, and footing thickness are evaluated. The main contributions are threefold: (1) a calibrated structural-scale equivalent FE method is proposed for GFRP-RC foundation analysis; (2) the deformation- and damage-controlled response mechanism of GFRP-RC isolated footings is clarified; and (3) the relative effects of the investigated parameters are compared to provide engineering interpretation of their influence on the deformation- and damage-controlled response within the investigated ranges.
Figure 1.
Research framework.
2. Calibration of the Equivalent FE Model
As outlined in Figure 1, the equivalent FE model was established through a calibration-to-transfer procedure. A GFRP-RC two-way slab was first used to calibrate the equivalent post-cracking response of the embedded-reinforcement model. The support boundary condition was then corrected, and the concrete tensile response was adjusted using an equivalent tensile stress-scaling factor. After calibration, the modeling strategy was transferred to the isolated footing on a Winkler foundation for structural-scale parametric evaluation. This section presents the reference slab model, boundary correction, equivalent tensile calibration, and numerical reliability assessment.
2.1. Reference Slab and FE Model
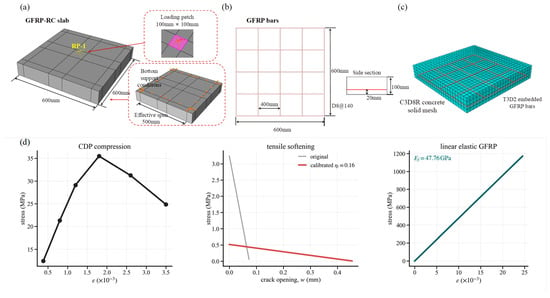
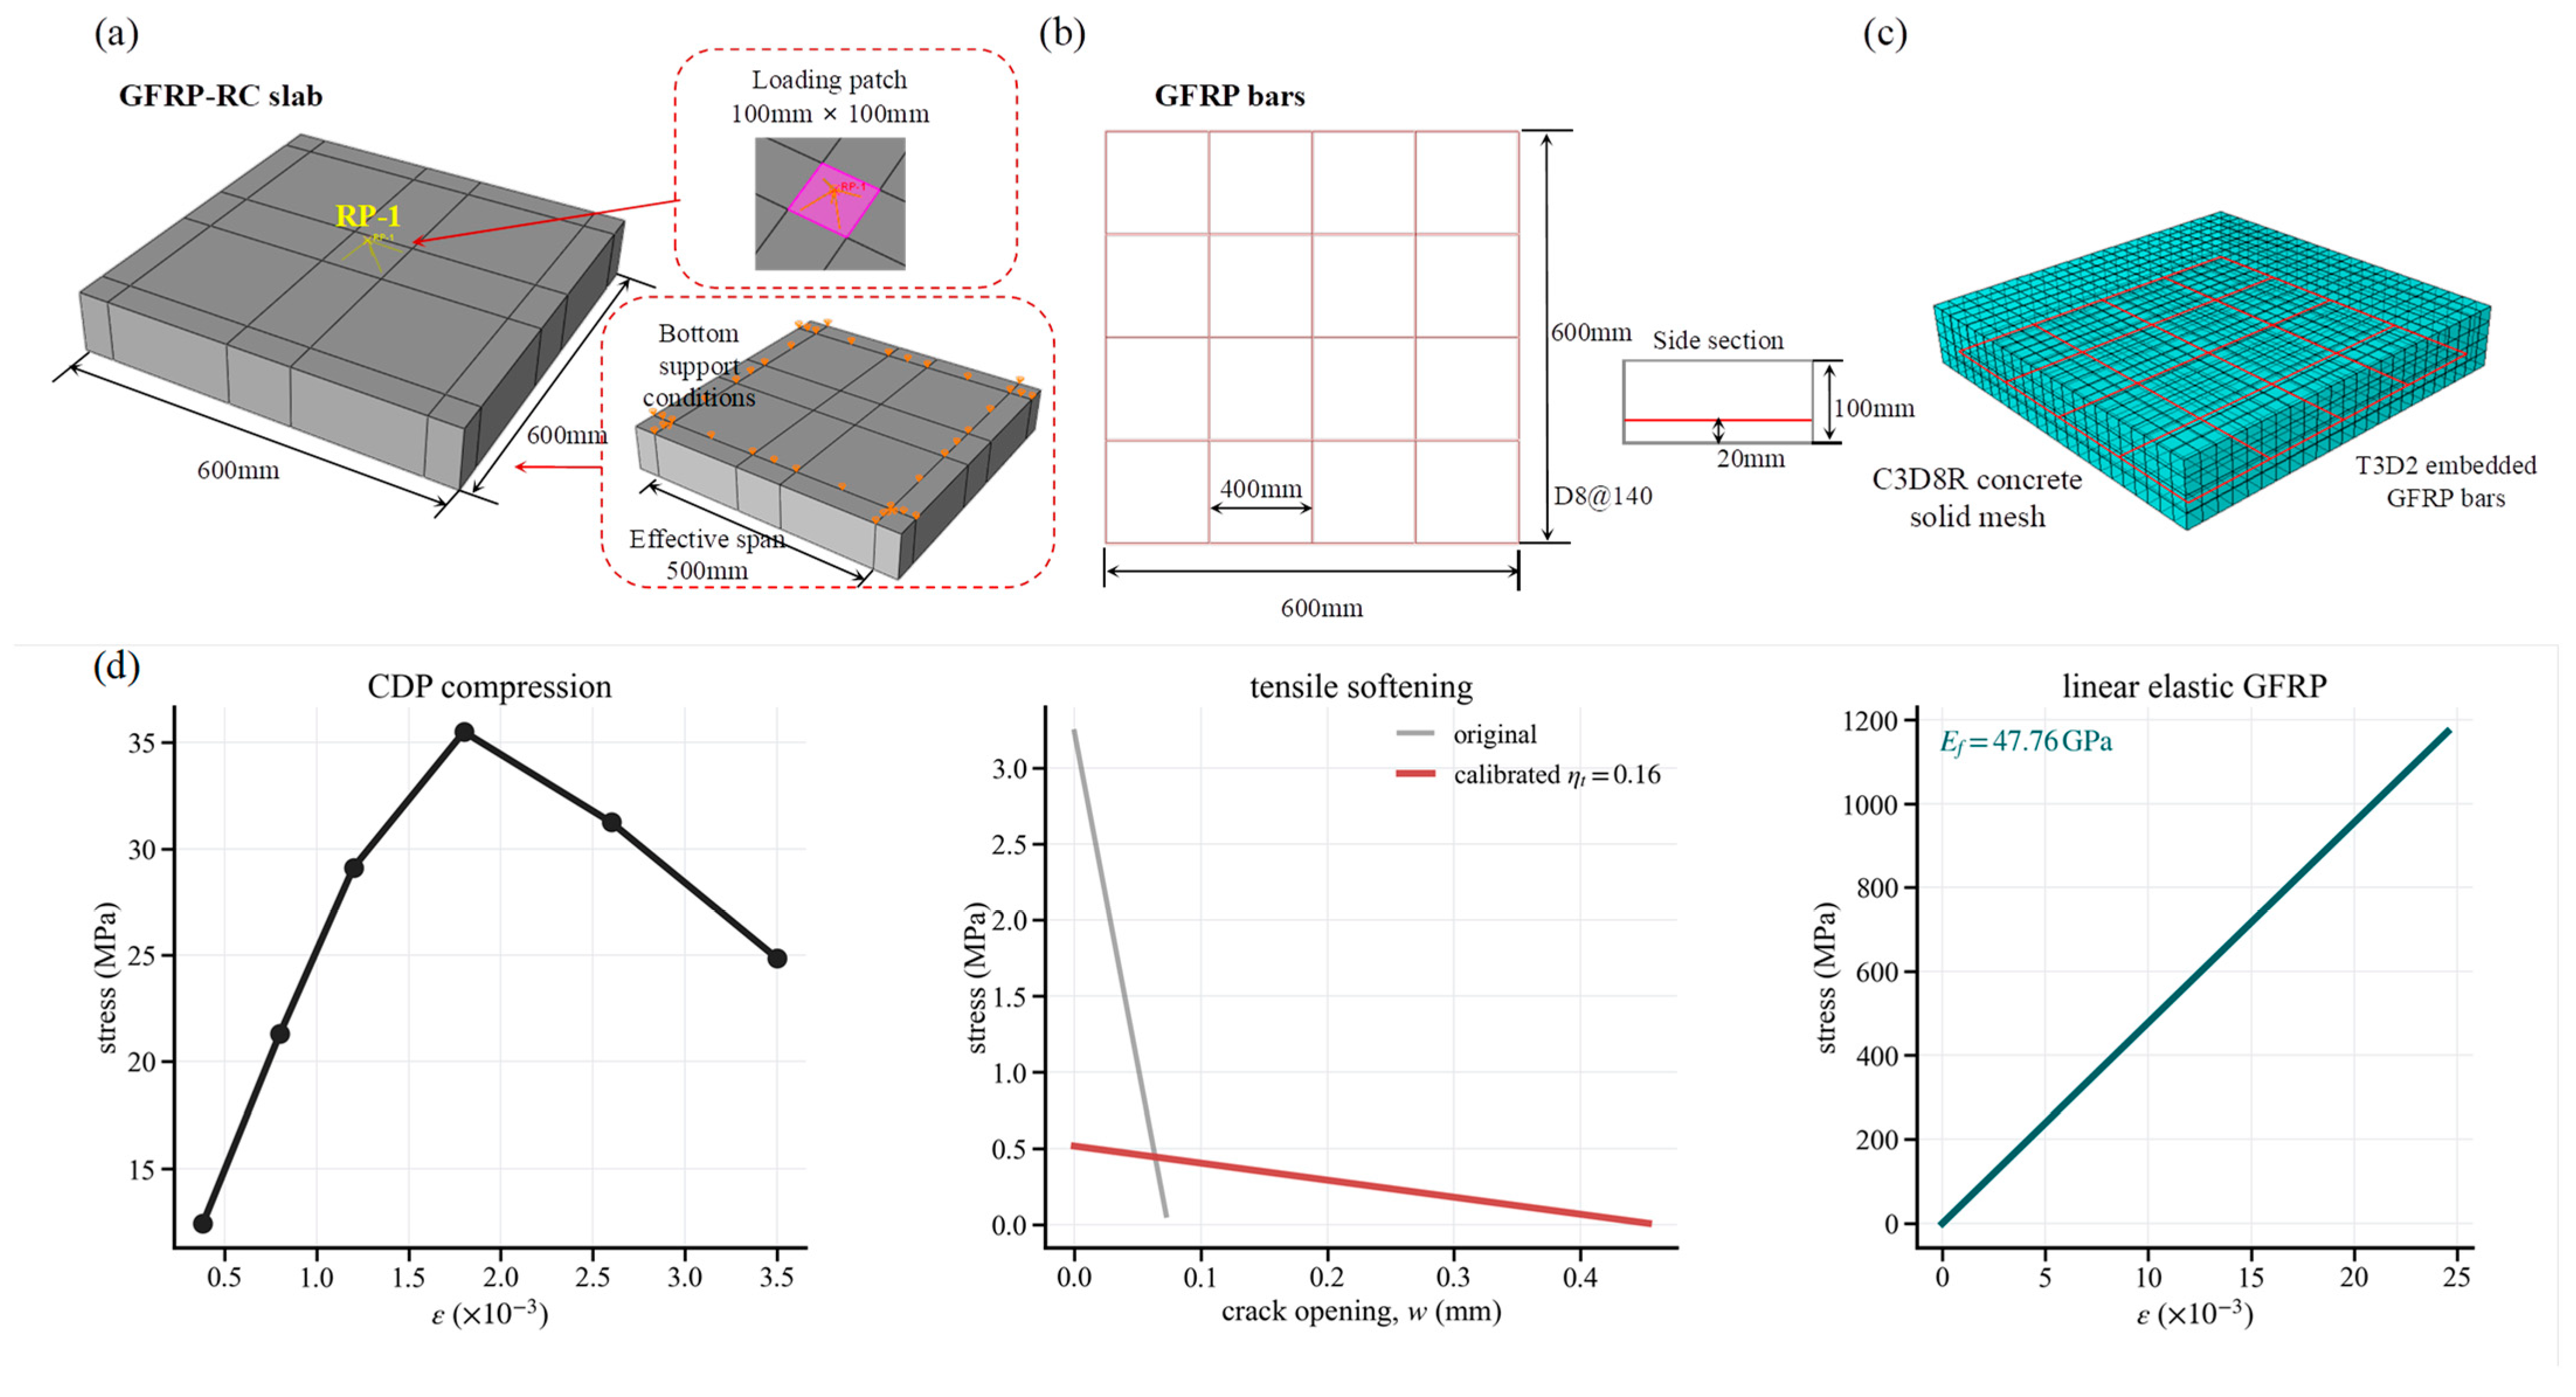
A GFRP-reinforced concrete two-way slab tested by Tian [20] was selected as the calibration benchmark. The slab measured 600 mm × 600 mm × 100 mm and was simply supported along four edges, with an effective span of 500 mm in both directions. A vertical load was applied through a 100 mm × 100 mm central loading patch.
The bottom reinforcement consisted of an orthogonal GFRP grid with 8 mm diameter bars spaced at 140 mm in both directions. Five bars were arranged in each direction, and the reinforcement layer was located 20 mm above the bottom surface.
Concrete was modeled using C3D8R solid elements with the concrete damaged plasticity model, while GFRP bars were represented by T3D2 truss elements with a linear-elastic constitutive law. The bars were embedded in the concrete domain to provide an efficient structural-scale approximation. This simplification does not explicitly resolve local bond-slip mechanisms, which are affected by bar surface characteristics, concrete properties, and environmental conditions [14,15,21]. However, it avoids the high computational cost associated with refined interface modeling and is therefore suitable for the subsequent structural-scale parametric analysis. A concrete mesh size of 25 mm was adopted, resulting in four element layers through the slab thickness. The main parameters of the reference slab and baseline footing are summarized in Table 1. The reference-slab geometry, reinforcement configuration, concrete compressive strength, and GFRP mechanical properties were adopted from ref. [20]. The footing model retained the same concrete and GFRP properties, whereas its geometry and reinforcement configuration were defined for the present parametric study. The original tensile parameters ft and Gf were adopted as constitutive inputs, while ft,eff was obtained through the equivalent-response calibration described in Section 2.2.
Table 1.
Main numerical parameters of the reference slab and baseline footing.
For reproducibility, the principal constitutive and numerical settings used in the FE analyses are further specified here. Concrete was modeled with an elastic modulus Ec = 32,500 MPa, Poisson’s ratio νc = 0.20, and density ρc = 2.40 × 10⁻⁹ tonne/mm3. The CDP parameters were a dilation angle of 38°, eccentricity of 0.10, fb0/fc0 = 1.16, Kc = 0.667, and viscosity parameter of 0.0001. The original concrete tensile strength was ft = 3.24 MPa with Gf = 0.12 N/mm, while the calibrated model used ηt = 0.16 and ft,eff = 0.5184 MPa. The GFRP reinforcement was modeled with Ef = 47,760 MPa, νf = 0.30, density ρf = 2.85 × 10⁻⁹ tonne/mm3, and tensile strength ffu = 1171.73 MPa. Concrete was discretized using C3D8R elements with reduced integration and enhanced hourglass control, whereas the GFRP bars were represented by T3D2 truss elements. The analyses were performed in Abaqus/Standard 2021 using displacement-controlled Static, General steps with NLGEOM enabled and automatic incrementation. The initial, minimum, and maximum increments were 0.02, 1.0 × 10⁻⁶, and 0.05, respectively. The adopted concrete compression, tension, and damage-evolution relationships are shown in Figure 2d.
Figure 2.
Member-scale slab used for calibration of the equivalent structural-scale FE model: (a) slab geometry and loading patch, (b) bottom GFRP reinforcement layout, (c) FE mesh and embedded reinforcement, and (d) material constitutive models, including the original and calibrated equivalent tensile laws. The calibrated tensile law retains Gf = 0.12 N/mm while reducing the tensile stress level, resulting in an extended cracking-displacement range.
2.2. Boundary Correction and Equivalent Tensile Calibration
The initial embedded-reinforcement model overestimated the slab stiffness because of two numerical simplifications. First, excessive in-plane restraints along the support lines introduced artificial compressive membrane action. Second, the embedded constraint enforced perfect displacement compatibility between the GFRP bars and concrete, thereby suppressing local bond-slip deformation. Since global stiffness and equivalent modeling assumptions can significantly affect structural response prediction [22], the in-plane translations along the support lines were released. The four support lines were located at x = 50, x = 550, y = 50, and y = 550 mm and were restrained in U3. To suppress rigid-body motion, the node at (50, 50, 0) mm was restrained in U1 and U2, while the node at (550, 50, 0) mm was restrained only in U2. Both nodes retained the support-line condition U3 = 0.
After boundary correction, the remaining stiffness difference was calibrated by introducing an equivalent tensile stress-scaling factor, ηt, into the concrete tensile model:
where ft is the original tensile strength of concrete, and ft,eff is the effective tensile strength used in the structural-scale model.
ft,eff = ηtft
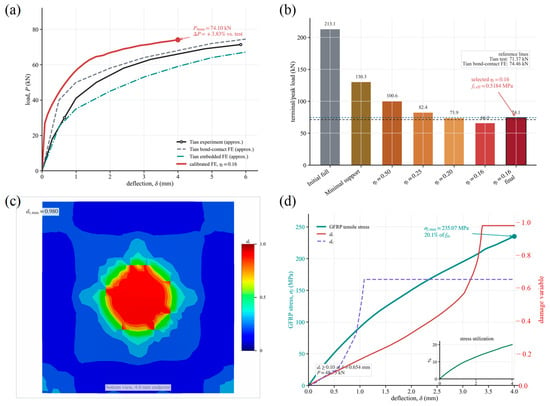
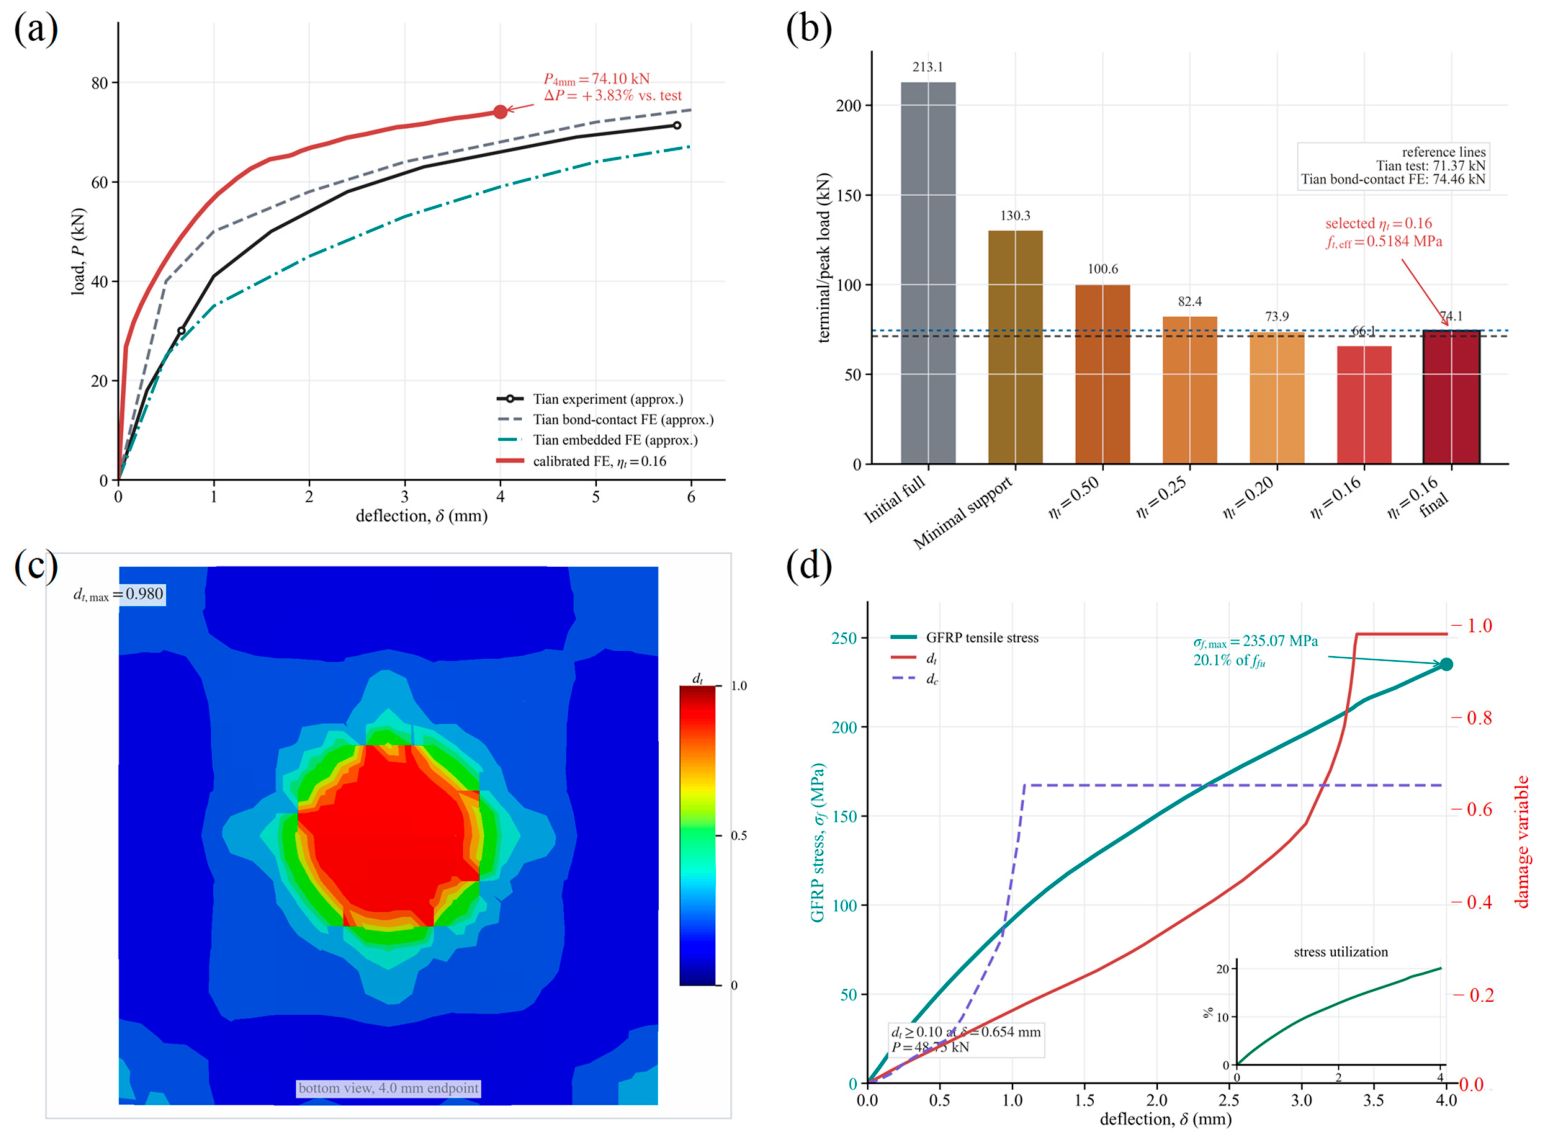
As shown in Figure 3b, the initial fully restrained embedded model significantly overestimated the slab response. Releasing unnecessary in-plane restraints reduced the artificial stiffness, and further decreasing ηt progressively weakened the post-cracking tensile contribution of concrete. By comparing different scaling factors, provided the closest agreement with the reference response. With ft = 3.24 MPa and ηt = 0.16, the calibrated effective tensile strength was ft,eff = 0.5184 MPa.
Figure 3.
Calibration of the equivalent FE model and assessment of numerical reliability: (a) load–deflection calibration, (b) calibration path and selected tensile scaling, (c) bottom tensile damage pattern, and (d) damage evolution and GFRP stress demand.
For the linear tensile-softening law, the critical cracking displacement was calculated as:
where Gf is the fracture energy and wf is the critical cracking displacement corresponding to complete tensile stress degradation. For the original tensile law, ft = 3.24 MPa and Gf = 0.12 N/mm give wf = 0.0741 mm. After applying ηt = 0.16, ft,eff = 0.5184 MPa while Gf remains unchanged, resulting in wf = 0.4630 mm. Thus, the calibrated tensile law reduces the tensile stress level while extending the cracking-displacement range by a factor of 6.25. The retained fracture energy and the associated extension of the cracking-displacement range are deliberate features of the response-equivalent calibration rather than material-property identification. Accordingly, the calibrated tensile parameter should be interpreted as a response-equivalent parameter that reflects the combined effects of bond-slip omission, tensile-softening regularization, diffuse cracking, and structural-scale discretization, rather than as a true material tensile strength.
2.3. Calibration Results and Response Assessment
The calibrated load–deflection response is compared with the experimental and reference numerical results in Figure 3a. The initial embedded model showed an evident stiffness overestimation, while the calibrated equivalent FE model reproduced the experimental response more closely after boundary correction and tensile stress scaling. Within the adopted calibration range, the calibrated model reached a maximum calculated load of 74.10 kN, which differed by only +3.83% from the experimentally reported maximum load of 71.37 kN and remained close to the refined bond-contact FE result of 74.46 kN. The comparable load levels, together with the overall load–deflection response, indicate that the calibrated equivalent model can reasonably reproduce the global flexural response of the reference GFRP-RC slab.
The calibration path in Figure 3b illustrates the effects of both boundary correction and tensile scaling. Releasing the excessive in-plane restraints reduced the artificial stiffness of the initial embedded model, while decreasing ηt further reduced the post-cracking response and brought the predicted response level closer to the experimental reference. Among the investigated trial values, ηt = 0.16 provided the closest agreement in terms of the overall response trend and load level. The selected value therefore serves as a response-equivalent calibration parameter rather than a true material tensile strength.
The simulated damage pattern was also examined to interpret the response of the calibrated model. As shown in Figure 3c, tensile damage mainly developed in the central bottom region and expanded outward along the two bending directions, which is consistent with the expected two-way flexural cracking mechanism. The maximum tensile damage reached dt,max = 0.980 at the 4.0 mm endpoint, indicating pronounced post-cracking degradation in the slab.
The evolution of damage and reinforcement stress is shown in Figure 3d. Tensile damage initiated at approximately δ = 0.654 mm and then increased rapidly with deflection, while the GFRP tensile stress increased continuously but remained far below its nominal tensile strength. At the endpoint, the maximum GFRP stress was 235.07 MPa, corresponding to approximately 20.1% of ffu. Therefore, the calibrated slab response was governed by concrete cracking and stiffness degradation rather than GFRP rupture. The numerical energy balance of the calibrated slab model was also checked. At the end of loading, the external work ALLWK and internal energy ALLIE were 246.64 and 247.18 kN·mm, respectively, corresponding to a difference of 0.22%; the maximum difference during the loading process remained below 0.38%. Based on these results, the calibrated equivalent FE model was used for the subsequent footing analysis. It should be emphasized that the slab calibration establishes the response-equivalent parameterization of the embedded-reinforcement model, but does not constitute an independent validation of the transferred footing model. The subsequent footing analysis should therefore be interpreted as a calibrated numerical parametric study.
3. FE Model of the GFRP-RC Isolated Footing
After calibration, the equivalent FE strategy was transferred to a GFRP-RC isolated footing supported by a Winkler elastic foundation. The footing model was used to evaluate the settlement-controlled response, damage evolution, and parameter sensitivity of GFRP-reinforced foundation elements.
3.1. Geometry, Reinforcement, and Loading
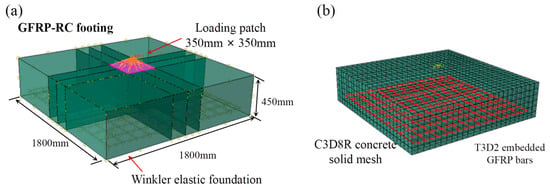
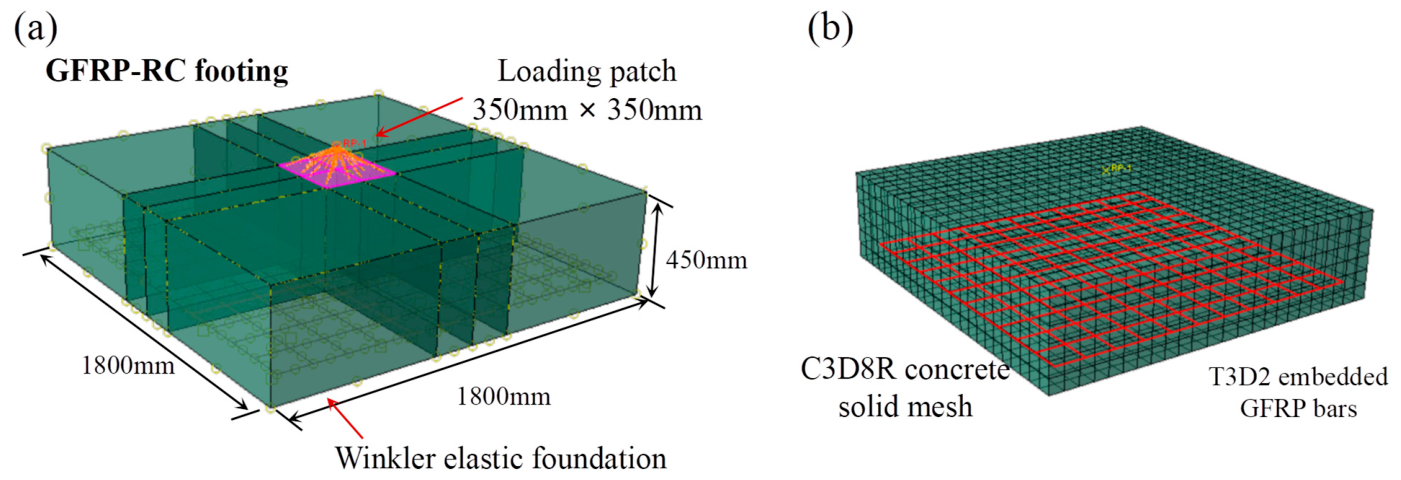
As shown in Figure 4a, the baseline footing had plan dimensions of 1800 mm × 1800 mm and a thickness of 450 mm. A 350 mm × 350 mm square loading patch was arranged at the center of the top surface to represent the column load-transfer region. Vertical loading was applied through a reference point connected to the loading patch by a distributing coupling constraint, ensuring that the imposed displacement was transferred uniformly to the loading area.
Figure 4.
Baseline GFRP-RC isolated footing model on Winkler foundation: (a) geometry, central loading patch, reference point and bottom support conditions, and (b) FE mesh and embedded GFRP reinforcement layout.
The bottom reinforcement consisted of one orthogonal GFRP grid embedded near the tensile face. The baseline layout used 12 mm diameter bars spaced at 150 mm in both directions, with a clear bottom cover of 69 mm. The calibrated concrete and GFRP material parameters from Section 2 were adopted.
The baseline D12@150 layout contained 12 bars in each orthogonal direction, and each bar had an actual length of 1650 mm. The D10@150, D12@150, and D14@150 diameter cases retained the same bar-centerline positions and bar count, resulting in clear bottom covers of 70, 69, and 68 mm, respectively. For the spacing cases, the actual bar counts were 17, 12, and 9 per direction for nominal spacings of 100, 150, and 200 mm, respectively. The D12@100 and D12@200 layouts were generated using a fixed 75 mm starting edge offset, resulting in a terminal edge offset of 125 mm and a 25 mm offset of the reinforcement-grid centroid from the footing centerline. All bars had an actual length of 1650 mm. The reinforcement ratios and GFRP material quantities were calculated from the actual generated bar counts and bar cross-sectional areas rather than from nominal spacing alone. The reinforcement ratio in each direction was calculated as ρf,x = nxAf/(BH) and ρf,y = nyAf/(BH), where nx and ny are the actual numbers of bars in the two orthogonal directions, Af is the cross-sectional area of one GFRP bar, B = 1800 mm is the footing width, and H is the footing thickness.
The FE discretization and embedded reinforcement layout are shown in Figure 4b. Concrete was modeled using C3D8R solid elements, while the GFRP bars were represented by T3D2 truss elements embedded in the concrete domain. A displacement-controlled scheme was used, and the prescribed settlement was increased to 6.0 mm. The reaction force extracted from the reference point was taken as the footing load; therefore, the reported load values represent settlement-controlled responses rather than ultimate bearing capacities.
A nominal concrete mesh size of 50 mm was adopted for the baseline footing and for all subsequent parametric cases, corresponding to approximately nine element layers through the 450 mm thickness of the baseline footing. The numerical resolution was further examined using nominal mesh seeds of 100, 75, 50, and 37.5 mm. With progressive refinement, the global load–settlement response showed a clear stabilization trend. Between the 50 and 37.5 mm meshes, the normalized difference between the full load–settlement curves was 3.48%, while the differences in P6 and maximum GFRP tensile stress were 5.39% and 0.52%, respectively. These results indicate that the global response and reinforcement-stress prediction become progressively less sensitive to further refinement. The 50 mm mesh was retained for the parametric study to provide a consistent numerical basis for comparison among all cases.
3.2. Winkler Foundation and Boundary Conditions
The soil–footing interaction was represented by a Winkler elastic foundation applied to the footing base, as illustrated by the bottom support conditions in Figure 4a. The vertical subgrade reaction was assumed to be proportional to the local settlement of the footing base:
where q(x,y) is the vertical subgrade reaction, ks is the subgrade modulus, and w(x,y) is the local settlement. In the FE model, the Winkler support was implemented using the surface-based ElasticFoundation formulation in Abaqus/Standard 2021 and was applied directly to the bottom element faces of the footing. The foundation stiffness was defined per unit area, with ks expressed in N/mm3; therefore, no discrete nodal springs or separate tributary-area conversion were required. The foundation response was linear and bidirectional in the normal direction, allowing both compressive and tensile reactions. No compression-only condition, uplift/separation criterion, tangential resistance, or soil shear coupling was introduced. The baseline value of ks was 0.08 N/mm3. The investigated values of ks = 0.04, 0.08, and 0.16 N/mm3, corresponding to 40, 80, and 160 MN/m3, respectively, were used to represent low, intermediate, and high support-stiffness levels in the comparative parametric study. These values are treated as equivalent foundation-stiffness parameters rather than unique material constants associated with specific soil types, because the modulus of subgrade reaction may vary with footing dimensions, shape, stress level, and the method used for its determination. Accordingly, the investigated range is intended to characterize the influence of support stiffness within the adopted Winkler idealization rather than to establish a one-to-one correspondence with particular soil classifications. To avoid artificial lateral confinement while eliminating rigid-body motion, one bottom corner node was restrained in U1 and U2, while a second bottom corner node was restrained only in U2; U3 remained free at both nodes. Thus, the vertical response was governed by the Winkler foundation rather than by fixed vertical supports.
q(x,y) = ksw(x,y)
The numerical equilibrium was checked by comparing the reference-point reaction with the integrated Winkler reaction over the footing base. At a prescribed settlement of 6.0 mm, the reference-point reaction was 997.01 kN, while the integrated foundation reaction was 994.33 kN. The relative difference was only 0.27%, confirming the consistency of the load extraction and foundation reaction calculation.
The energy balance of the baseline footing model was additionally checked. Because the Winkler foundation stores elastic energy, the structural internal energy was combined with the elastic energy stored in the foundation support. At the end of loading, ALLWK was 3522.35 kN·mm, while the combined structural internal energy and foundation energy was 3519.08 kN·mm, corresponding to a difference of 0.093%. The Winkler representation neglects shear interaction between adjacent soil regions, stress-dependent soil stiffness, plastic yielding, and other nonlinear soil responses. The footing results are therefore interpreted as comparative structural responses within the adopted linear foundation idealization.
3.3. Parametric Cases and Evaluation Indices
Based on the baseline footing model shown in Figure 4, a single-factor parametric analysis was conducted to evaluate the effects of subgrade stiffness, GFRP bar diameter, bar spacing, and footing thickness. The baseline values and parametric levels are summarized in Table 2. In each parameter group, only one variable was changed, while the other parameters were kept identical to the baseline model.
Table 2.
Baseline footing geometry and numerical settings.
These parameters were selected to represent the main factors governing the stiffness and damage response of GFRP-reinforced footing-type members. Previous studies on FRP-reinforced slab systems have shown that structural response may vary significantly with loading condition, reinforcement configuration, and member geometry [23,24,25]. Therefore, the selected variables were used to distinguish the effects of foundation support, reinforcement contribution, tensile demand distribution, and sectional stiffness. For the bar-diameter cases, the same nominal GFRP elastic modulus of 47.76 GPa and tensile strength of 1171.73 MPa were retained so that the numerical comparison primarily reflected the effect of reinforcement cross-sectional area. The same calibrated equivalent representation was consistently adopted for all diameter cases, thereby providing a common modeling basis for evaluating the relative effect of bar diameter. Accordingly, the diameter study should be interpreted as a geometric reinforcement-area comparison within the adopted equivalent FE framework.
All cases were compared at the same prescribed settlement of 6.0 mm. The reaction force extracted from the loading reference point was denoted as P6, and the corresponding secant stiffness was calculated as:
where K6 represents the settlement-controlled secant stiffness at 6.0 mm. Since the imposed settlement was used as a unified comparison state, P6 should be interpreted as a settlement-controlled load response rather than an ultimate bearing capacity. The prescribed settlement of 6.0 mm corresponds to approximately 0.33% of the 1800 mm footing width and was selected as a common deformation state for comparative evaluation of the numerical cases. It is not intended to represent a code-defined serviceability limit.
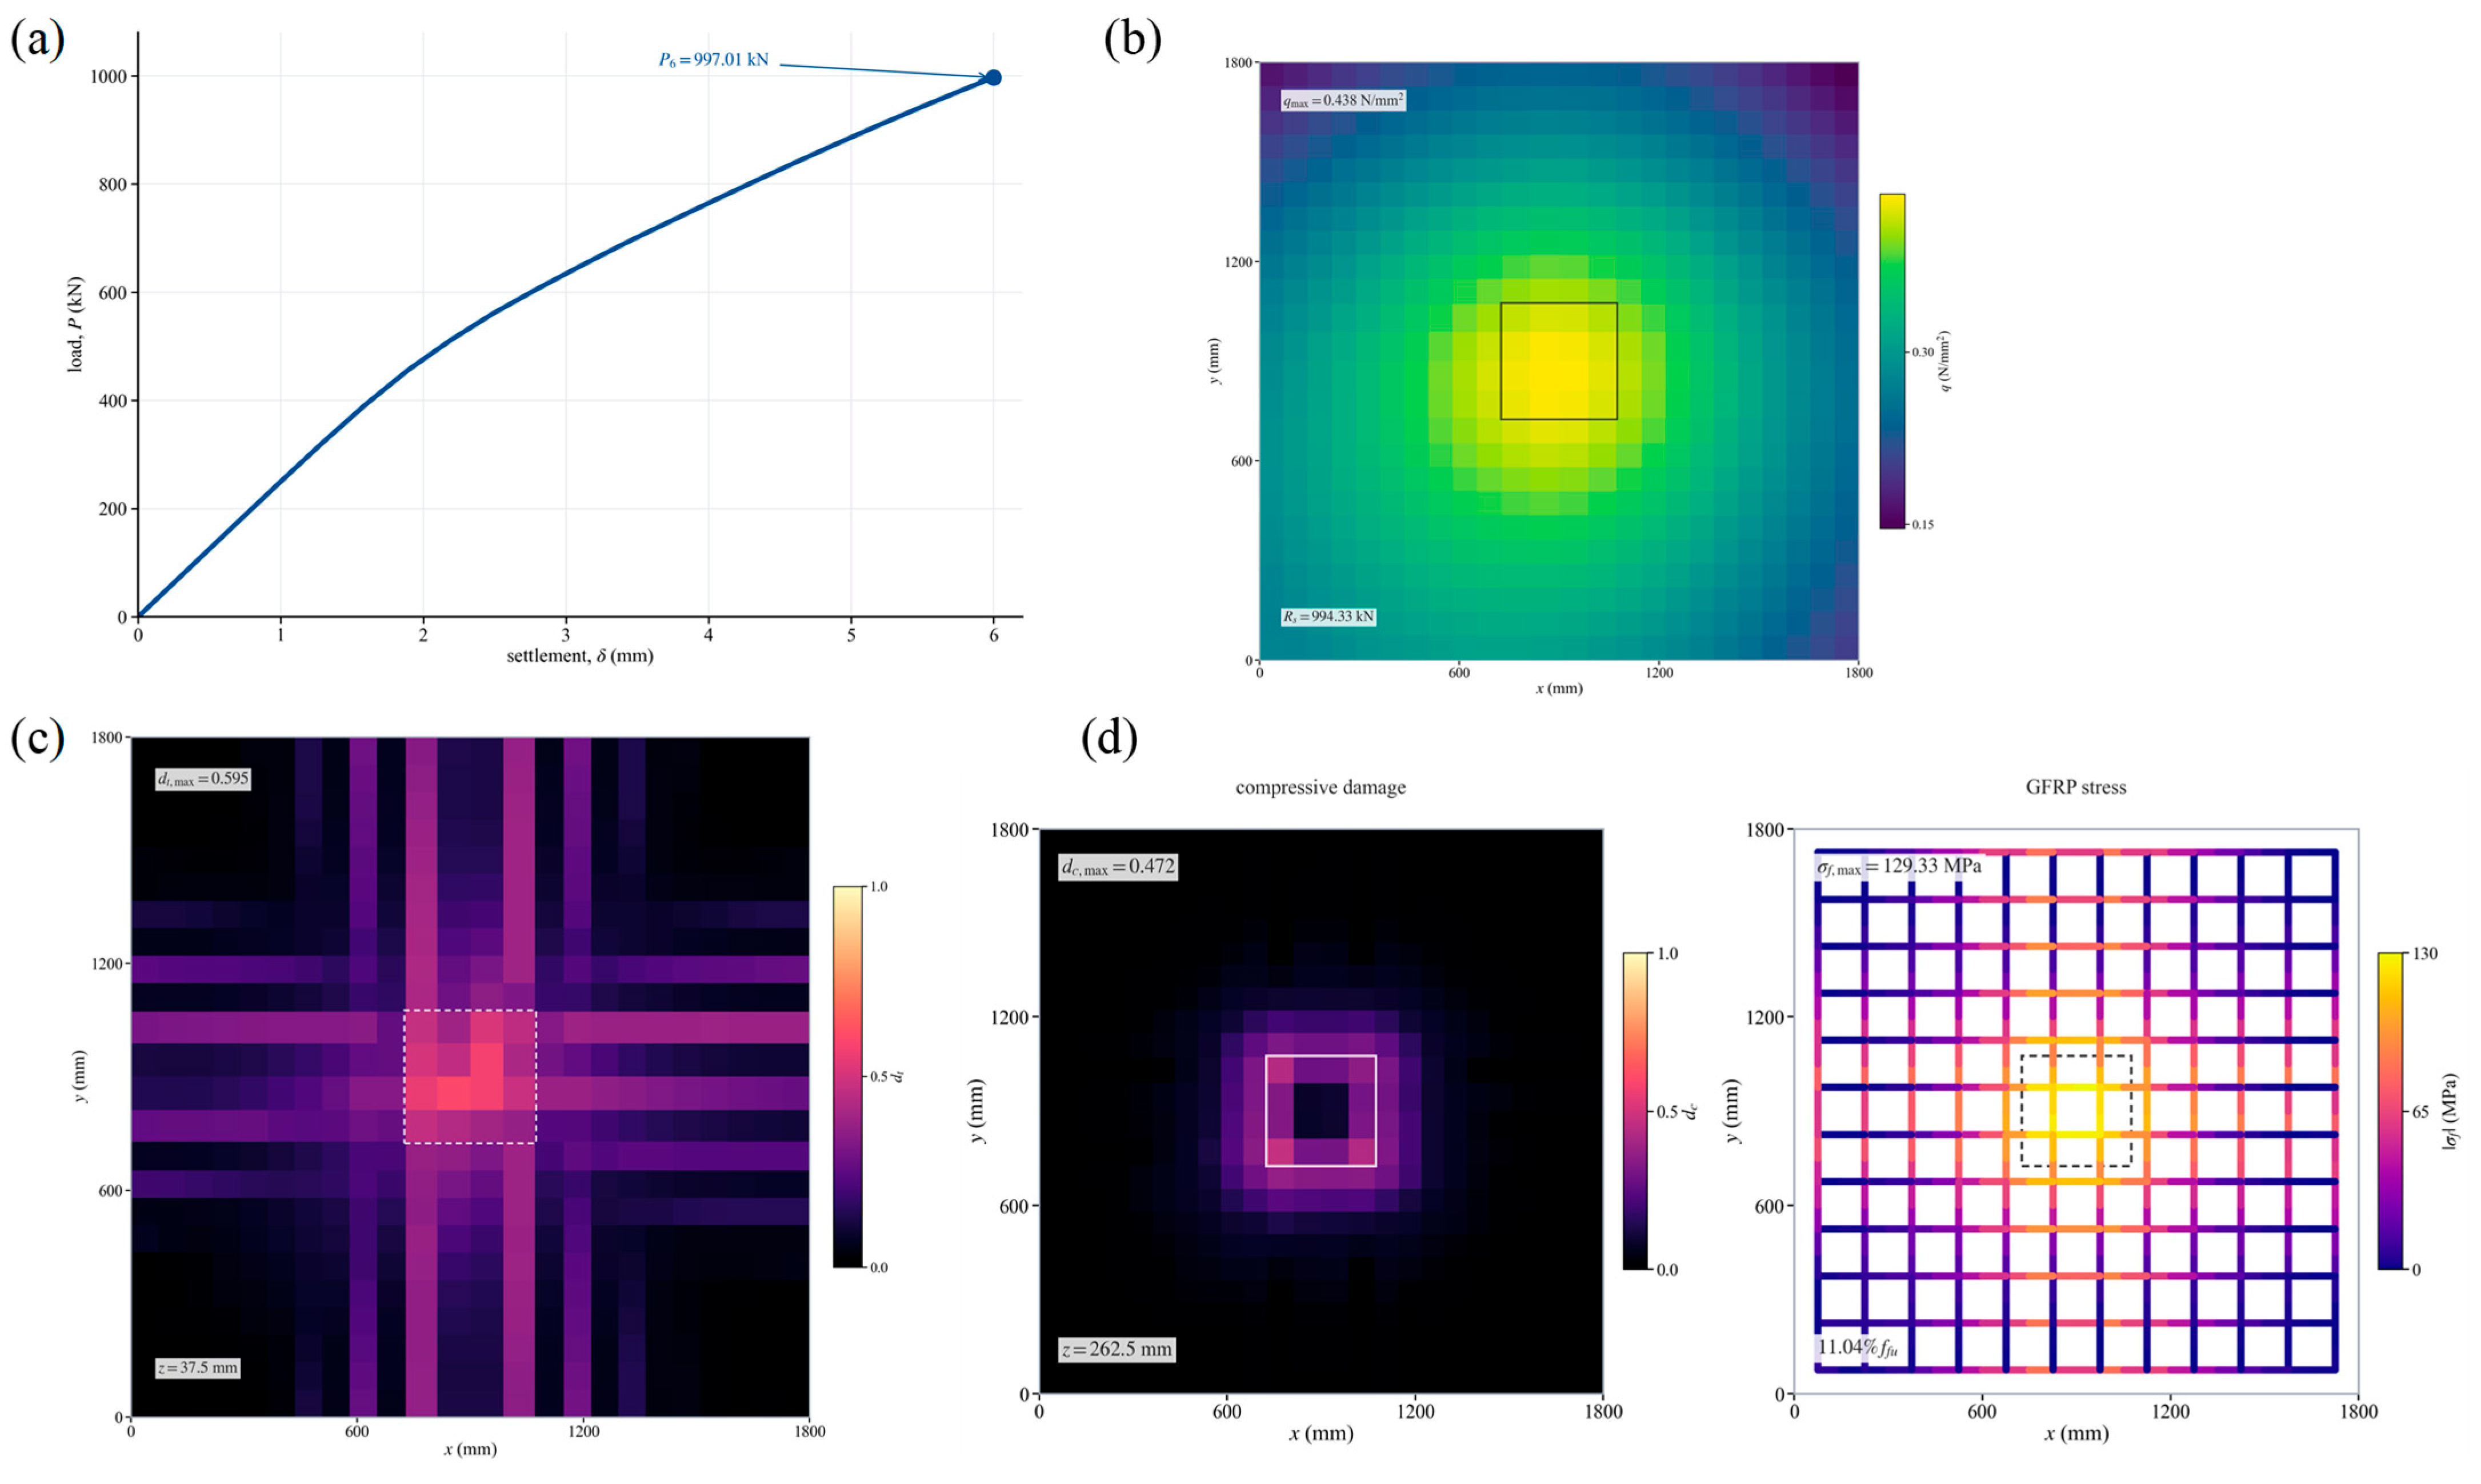
In addition to the load–settlement response, the maximum tensile and compressive CDP damage variables and the maximum GFRP tensile stress were extracted for comparative evaluation. The CDP damage variables are local integration-point quantities and are therefore interpreted as numerical descriptors of the relative development and localization of concrete damage rather than as direct design limit-state parameters. Accordingly, the numerical values of maximum damage are considered together with the corresponding spatial damage distributions when comparing the investigated cases. The baseline response, subgrade reaction, and damage mechanism are first presented in Figure 5. The parametric response curves and local damage indicators are then compared in Figure 6, and the normalized local sensitivity and material-efficiency results are summarized in Figure 7. The key numerical response indicators at a prescribed settlement of 6.0 mm are summarized in Table 3.
Figure 5.
Baseline footing response, subgrade reaction, and damage mechanism: (a) load–settlement response, (b) Winkler reaction distribution, (c) bottom tensile damage, and (d) compressive damage and GFRP stress. The boxes in the contour and stress plots indicate the projected boundary of the 350 mm × 350 mm central loading patch.
Figure 6.
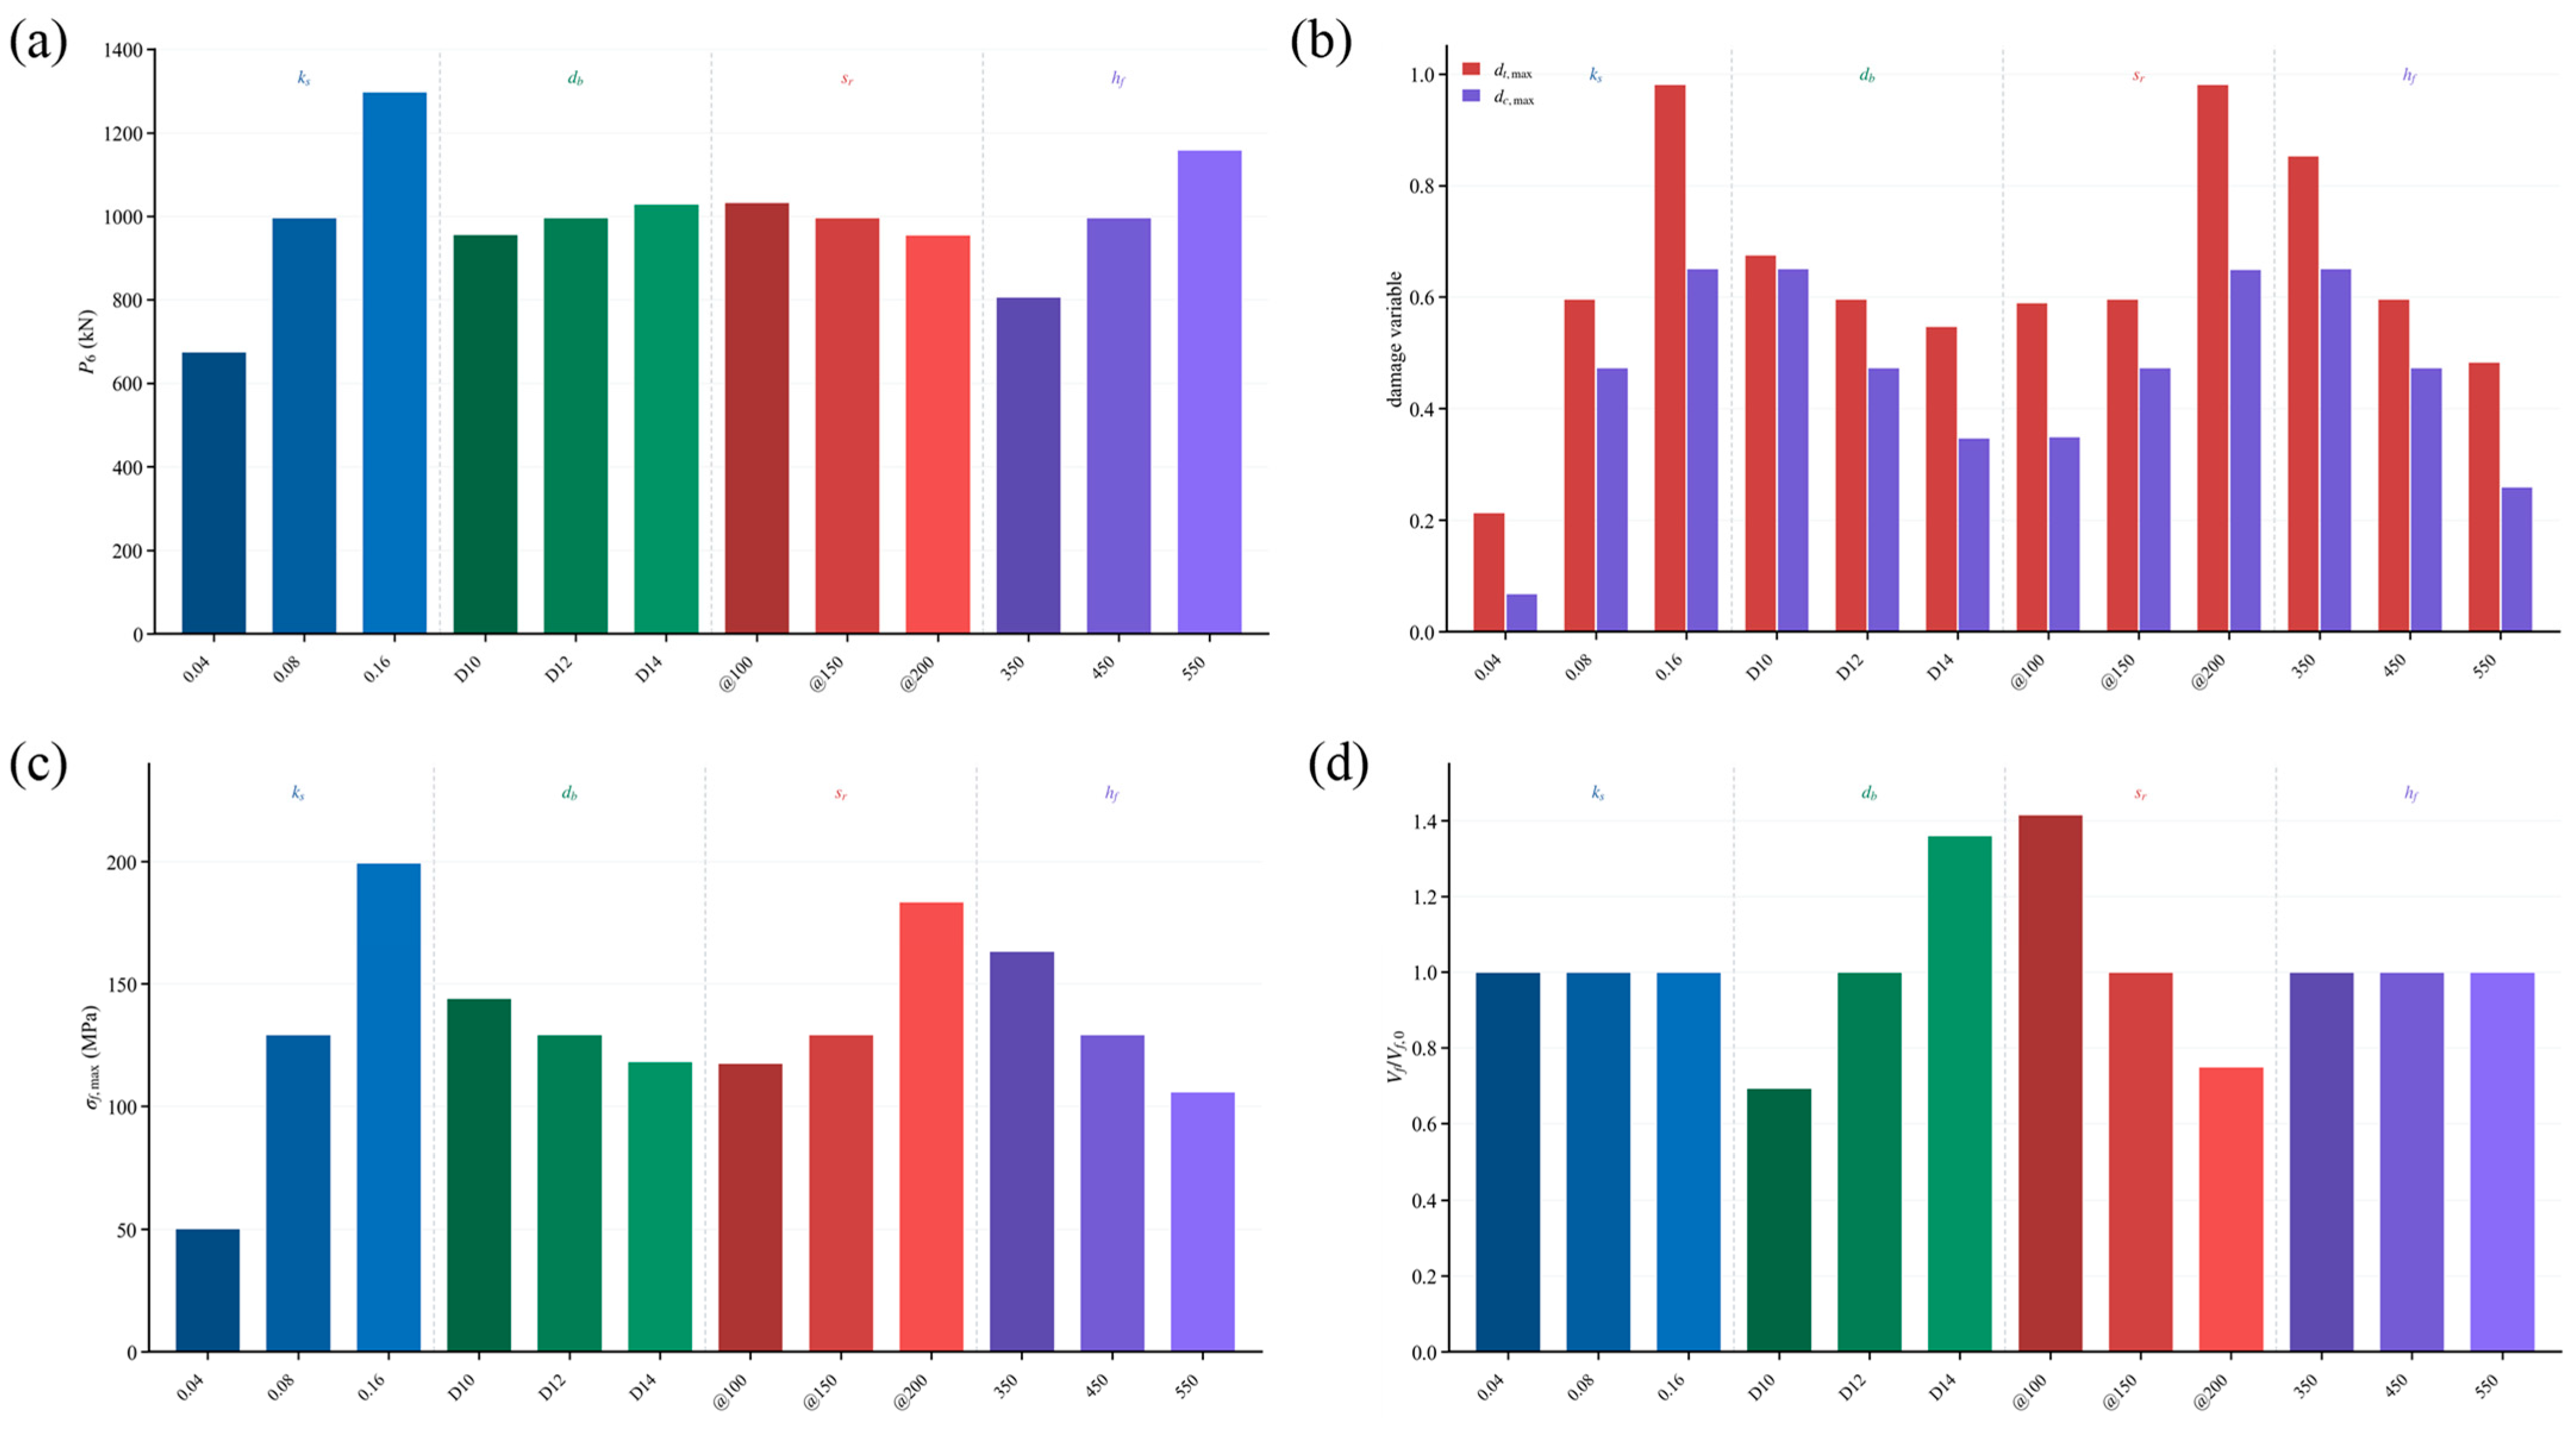
Parametric effects on key response indicators at s = 6.0 mm: (a) load response P6, (b) maximum tensile and compressive damage indices, (c) maximum GFRP tensile stress, and (d) material consumption ratio.
Figure 7.
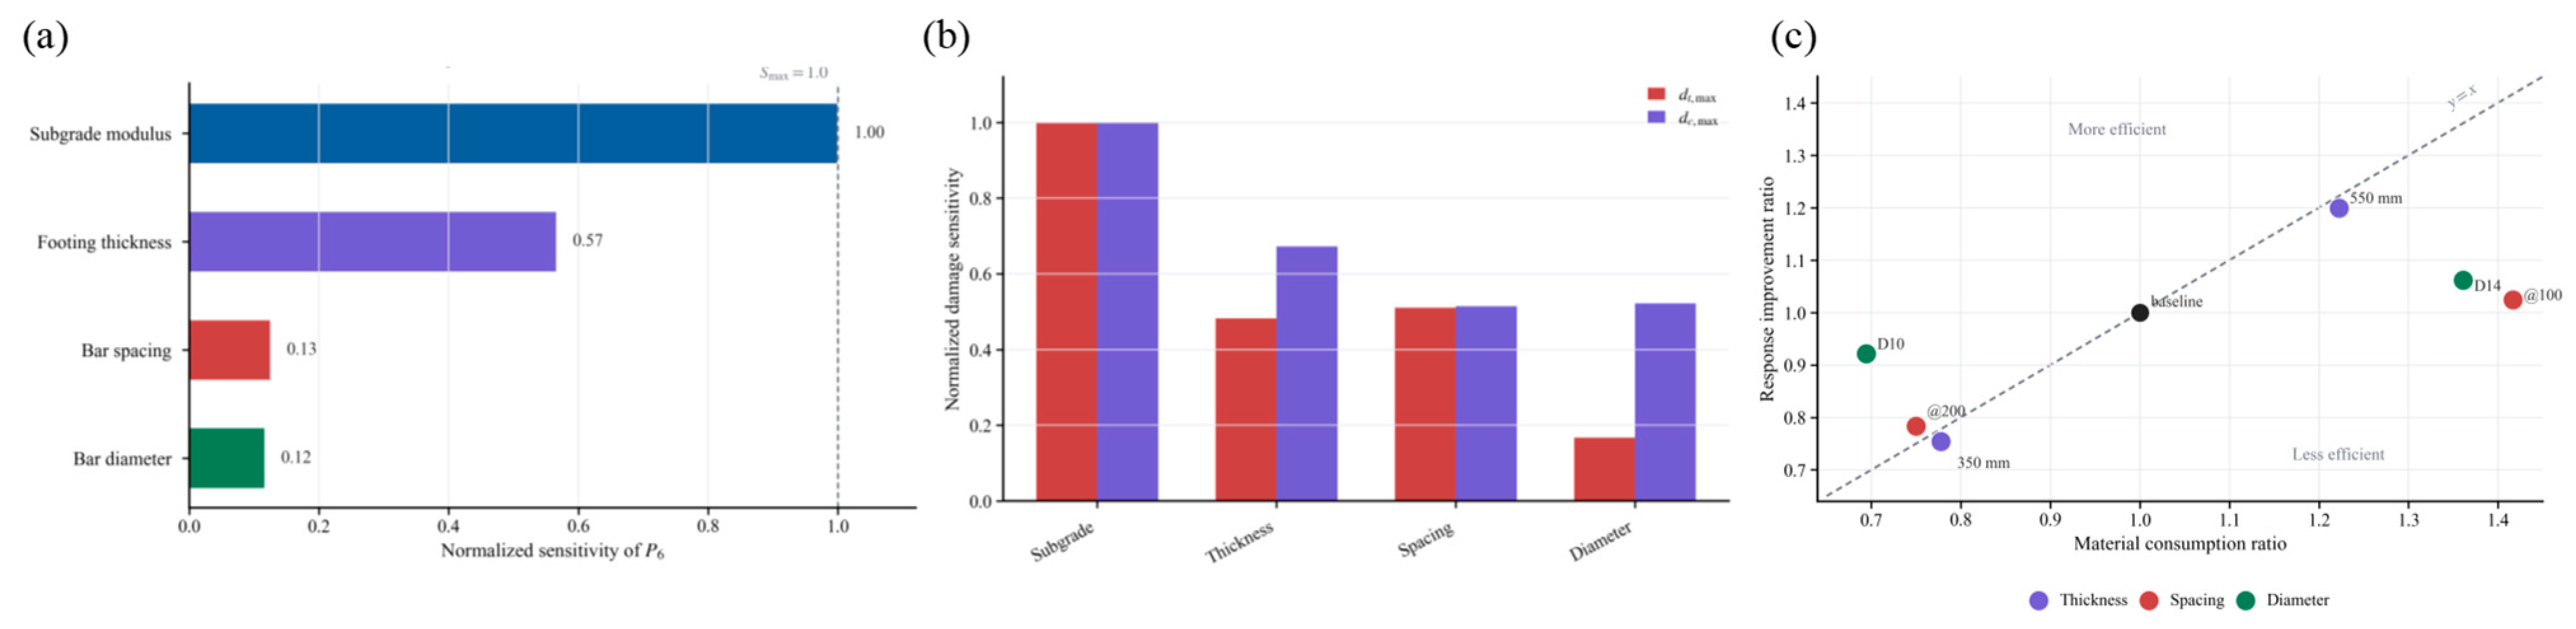
Local range-based sensitivity and material-efficiency evaluation: (a) normalized sensitivity of P6, (b) normalized sensitivity of the local CDP damage response, and (c) normalized material-use ratio versus P6 response ratio.
Table 3.
Summary of key response indicators at a prescribed settlement of 6.0 mm.
4. Results and Discussion
The numerical results are discussed in terms of baseline response, parametric effects, and normalized sensitivity. All cases were evaluated at a prescribed settlement of 6.0 mm; therefore, the reported load values represent settlement-controlled responses rather than ultimate bearing capacities.
4.1. Baseline Response and Damage Mechanism
The baseline response is shown in Figure 5. Under the prescribed settlement of 6.0 mm, the footing reaction reached P6 = 997.01 kN, corresponding to a secant stiffness of 166.17 kN/mm. The load–settlement curve in Figure 5a shows an initially rapid increase in load followed by gradual stiffness degradation, indicating that the response was controlled by progressive cracking and damage accumulation rather than by a sudden strength failure.
The Winkler reaction distribution at the 6.0 mm settlement endpoint is shown in Figure 5b. The reaction was symmetrically distributed beneath the footing, with a higher reaction concentrated below the central loading region and a lower reaction toward the outer area. The maximum local reaction reached qmax = 0.438 N/mm2, and the integrated subgrade reaction was Rs = 994.33 kN, which was close to the reaction force extracted from the loading reference point. This agreement confirms the consistency between the applied settlement-controlled load and the mobilized Winkler foundation reaction.
As shown in Figure 5c, tensile damage mainly developed in the lower tensile zone around the central region and extended along the two orthogonal reinforcement directions. The maximum tensile damage reached dt,max = 0.595, indicating pronounced local tensile stiffness degradation in the bottom region. Meanwhile, compressive damage was localized near the upper load-transfer region, with a maximum value of dc,max = 0.472, as shown in Figure 5d. These damage patterns indicate that the baseline footing response involved pronounced bottom tensile damage and localized upper compressive damage. The CDP tensile damage variable dt represents local tensile stiffness degradation in the smeared-cracking formulation and is not a direct crack-width variable. Accordingly, dt,max is not interpreted as a quantitative measure of physical or visible crack width. The damage contours are used primarily to identify the location and relative development of tensile-damage regions. Direct crack-width prediction would require a dedicated crack-opening evaluation or a modeling approach capable of resolving localized displacement discontinuities, which may be considered in future work.
The GFRP stress distribution in Figure 5d shows that the reinforcement stress was concentrated near the central region but remained at a relatively low utilization level. The maximum GFRP tensile stress was σf,max = 129.33 MPa, corresponding to approximately 11.04% of the nominal tensile strength. Therefore, the baseline footing response was not governed by GFRP rupture within the investigated settlement range. Instead, the numerical results were characterized by settlement development, progressive concrete cracking and damage localization, and post-cracking stiffness degradation. Accordingly, the global deformation response, reinforcement stress, and spatial damage patterns are considered together in the subsequent comparative evaluation.
4.2. Effects on Key Response Indicators
The effects of subgrade modulus, GFRP bar diameter, reinforcement spacing, and footing thickness on the key response indicators are summarized in Figure 6. All cases were evaluated at the common settlement level of s = 6.0 mm. Therefore, the reported load P6 represents the settlement-controlled reaction rather than the ultimate bearing capacity. Figure 6a compares the load response, Figure 6b summarizes the maximum tensile and compressive damage indices, Figure 6c presents the maximum GFRP tensile stress, and Figure 6d shows the corresponding material consumption ratio.
As shown in Figure 6a, variation in the subgrade modulus produced the largest change in P6 within the investigated parameter range under the adopted settlement-controlled condition. When ks increased from 0.04 N/mm3 to 0.08 N/mm3 and 0.16 N/mm3, P6 increased from approximately 676 kN to 997 kN and 1298 kN, respectively. This trend should be interpreted in the context of the adopted Winkler relation q = ksw, because a larger ks directly mobilizes a larger foundation reaction under the same prescribed settlement. However, Figure 6b shows that the tensile and compressive damage indices also increased with ks. This indicates that a stiffer Winkler foundation mobilizes a larger vertical reaction under the same prescribed settlement, but it also induces a higher bending and damage demand in the footing. Therefore, the increase in P6 caused by ks should be interpreted as a support-condition effect rather than an intrinsic improvement of the footing itself.
The influence of GFRP bar diameter was comparatively limited. Increasing the bar diameter from D10 to D12 and D14 only increased P6 from approximately 957 kN to 997 kN and 1030 kN, respectively, as shown in Figure 6a. Meanwhile, Figure 6c indicates that the maximum GFRP tensile stress decreased as the bar diameter increased. This suggests that larger bars mainly reduce reinforcement stress demand, while their contribution to global settlement-controlled stiffness remains limited. Considering the increased reinforcement consumption shown in Figure 6d, increasing bar diameter alone is not an efficient strategy for improving the overall response of GFRP-RC isolated footings.
The effect of reinforcement spacing is shown in Figure 6a–d. Reducing the spacing from @200 to @150 and @100 increased P6 from approximately 956 kN to 997 kN and 1036 kN, respectively. The improvement in global load response was moderate, but smaller spacing helped redistribute tensile demand among more reinforcement bars and reduced stress concentration. Therefore, reinforcement spacing is more closely related to crack distribution, damage localization, and serviceability control than to a substantial increase in apparent load response.
Footing thickness exhibited a more evident structural effect. As h increased from 350 mm to 450 mm and 550 mm, P6 increased from approximately 807 kN to 997 kN and 1159 kN, respectively. Figure 6c also shows that the maximum GFRP tensile stress decreased with increasing thickness, indicating improved load-spreading capacity and reduced reinforcement demand. Although increasing thickness increases material consumption, as shown in Figure 6d, it provides a more effective improvement in global stiffness and damage control than reinforcement-area enhancement.
4.3. Normalized Sensitivity and Material Efficiency
To further quantify the relative importance of the examined parameters, the endpoint response indicators in Figure 6 were normalized and compared in Figure 7. Figure 7a shows the normalized sensitivity of P6, Figure 7b compares the normalized concrete-damage sensitivity, and Figure 7c compares the normalized material-use ratio with the normalized P6 response for the investigated geometric and reinforcement cases. These normalized results should be interpreted as local sensitivity measures within the investigated parameter ranges rather than as global sensitivity indices.
For each investigated parameter i, the local range-based sensitivity of a response quantity R was evaluated from the response range over the three investigated levels:
ΔRi = Ri,max − Ri,min
The normalized sensitivity was then defined as:
where ΔRmax = max(ΔRj) is the largest response range among all investigated parameters. Accordingly, the maximum normalized sensitivity is Smax = 1.0. The reported values therefore represent local range-based sensitivities within the investigated parameter levels rather than global sensitivity indices. Because the study adopts a one-factor-at-a-time approach, interaction effects between parameters are not included.
Si = ΔRi/ΔRmax
As shown in Figure 7a, the subgrade modulus exhibited the highest local range-based sensitivity for P6 and was therefore set as the reference level with Smax = 1.0. Footing thickness showed a normalized sensitivity of 0.57, whereas reinforcement spacing and bar diameter showed much lower values of 0.13 and 0.12, respectively. These results indicate that, within the investigated parameter ranges and under the adopted settlement-controlled condition, P6 is more sensitive to variations in support stiffness and footing sectional stiffness than to reinforcement-area variation.
For the material-use comparison in Figure 7c, the material-use ratio for the footing-thickness cases was defined as the concrete volume relative to that of the baseline footing, Cc = Vc/Vc,0, whereas for the reinforcement-diameter and spacing cases it was defined as the total GFRP volume relative to that of the baseline reinforcement layout, Cf = Vf/Vf,0, where Vc and Vf are the concrete and GFRP volumes of the investigated case, respectively, and Vc,0 and Vf,0 are the corresponding baseline values. Because concrete and GFRP represent different material resources, these normalized ratios are used only to describe the relative material change within each parameter group and are not interpreted as directly commensurate measures of mass, cost, or embodied carbon.
The normalized material-use comparison is shown in Figure 7c. The baseline case is located at the reference point with both material consumption and response ratios equal to 1.0. Increasing footing thickness to 550 mm produced a clear response improvement with a moderate increase in material consumption, whereas reducing the thickness to 350 mm caused a significant response reduction. In contrast, increasing bar diameter or reducing reinforcement spacing required additional reinforcement consumption but produced only limited improvement in P6. Because the concrete- and GFRP-based ratios represent different material resources, Figure 7c is interpreted as a parameter-specific comparison of response change relative to material change rather than as a unified material-efficiency metric. This result indicates that the contribution of GFRP reinforcement should not be evaluated solely by its nominal tensile strength. Because GFRP bars exhibit stress-state-dependent mechanical characteristics [26], increasing the reinforcement area does not necessarily lead to a proportional improvement in settlement-controlled stiffness. Within the investigated cases, changes in footing thickness produced a more pronounced change in P6 than changes in reinforcement area, although the associated concrete and GFRP material-use ratios should not be directly compared on a common efficiency basis.
4.4. Engineering Implications Within the Investigated Range
The numerical results in Figure 6 and the normalized sensitivity and material-efficiency evaluation in Figure 7 provide several design implications for GFRP-RC isolated footings on Winkler foundations. As shown in Figure 6a and Figure 7a, footing thickness should be prioritized when stiffness enhancement and damage control are required. Increasing the sectional depth improves load-spreading capacity, increases the settlement-controlled reaction, and more effectively reduces reinforcement stress demand than increasing the reinforcement diameter alone. The normalized material-use comparison in Figure 7c shows that the response changes associated with footing thickness and reinforcement variation follow different material-use trends; however, the concrete- and GFRP-based ratios are not treated as directly commensurate efficiency measures. This indicates that sectional stiffness, rather than reinforcement strength utilization, is the governing design factor for the settlement-controlled response of GFRP-RC isolated footings.
Second, reinforcement spacing should be carefully controlled. A smaller spacing helps distribute tensile demand among more GFRP bars and limits localized damage development, whereas excessive spacing may lead to higher GFRP stress and more severe cracking even when the global load response changes only slightly. From a serviceability perspective, limiting damage development is also important because GFRP–concrete composite members may experience additional deformation under sustained loading or long-term service conditions [27].
Third, increasing bar diameter alone is not an efficient design strategy. Its main contribution is to reduce reinforcement stress and moderate local damage, rather than to substantially improve settlement-controlled stiffness. This interpretation is consistent with the long-term and stress-state-dependent characteristics of pultruded GFRP composites, which differ from those of steel reinforcement [28]. Therefore, larger GFRP bars should be regarded as a local stress-moderation measure rather than a direct substitute for increasing sectional stiffness.
Finally, the effect of subgrade stiffness should be interpreted according to the loading condition. Under the fixed-settlement comparison used in this study, a larger subgrade modulus mobilizes a higher reaction force but may also increase local damage demand. Therefore, both settlement response and concrete damage indices should be considered in the design evaluation of GFRP-RC footings.
4.5. Limitations and Scope of Applicability
The present study has several limitations that should be considered when interpreting the results. First, the equivalent FE model was calibrated against one GFRP-RC two-way slab test, and independent experimental validation of the transferred footing model was not performed. Therefore, the calibrated tensile scaling factor should be regarded as a response-equivalent parameter within the adopted modeling framework rather than a universal material parameter. Second, the embedded-reinforcement approach does not explicitly represent local GFRP–concrete bond-slip behavior. Third, the Winkler foundation idealization neglects soil shear coupling and nonlinear soil behavior. Finally, the parametric study was conducted using a one-factor-at-a-time approach within limited parameter ranges. Accordingly, the results are intended primarily for comparative interpretation of parameter effects within the investigated numerical framework.
5. Conclusions
This study developed a calibrated equivalent FE model for analyzing the structural response of GFRP-RC isolated footings on Winkler foundations. The model was first calibrated using a reference GFRP-RC two-way slab and then applied to evaluate the effects of subgrade stiffness, bar diameter, reinforcement spacing, and footing thickness. The main conclusions are as follows:
- (1)
- A calibrated equivalent FE model was established based on a GFRP-RC two-way slab. After boundary correction and equivalent tensile calibration, the model reproduced the reference load–deflection response with an error of +3.83% at 4.0 mm displacement. This agreement supports the use of the calibrated equivalent model in the subsequent exploratory footing parametric analysis.
- (2)
- The baseline GFRP-RC isolated footing showed a deformation- and damage-controlled response. At 6.0 mm settlement, the footing reaction reached 997.01 kN, while the GFRP stress remained far below its tensile strength. The response was mainly governed by concrete cracking, local compression damage, and stiffness degradation.
- (3)
- The investigated parameters affected the footing behavior through different mechanisms. Subgrade stiffness controlled the settlement-induced reaction, bar diameter mainly reduced local stress, bar spacing influenced damage distribution, and footing thickness had the most significant effect on stiffness and damage control.
- (4)
- From a design perspective, increasing footing thickness and controlling reinforcement spacing are more effective than simply increasing GFRP bar diameter. The reported load values correspond to a prescribed settlement state rather than ultimate bearing capacity, and the conclusions should be interpreted within the investigated parameter ranges.
Author Contributions
Conceptualization, S.H. and S.P.; Methodology, Y.J. and S.P.; Software, Y.J.; Validation, S.P.; Formal analysis, Y.J. and S.P.; Investigation, T.J.; Resources, S.H. and T.J.; Data curation, T.J.; Writing—original draft, Y.J. and S.P.; Writing–review and editing, S.H., S.P., T.J. and R.F.; Visualization, Y.J.; Project administration, S.H. and R.F.; Funding acquisition, S.H. and R.F. All authors have read and agreed to the published version of the manuscript.
Funding
This study was supported by the project “Key Technologies for Foundation Design and Construction of Flexible Anti-Eddy-Current Fiber-Reinforced Composite Bars for Reactors”, which belongs to the Science and Technology Project of State Grid Jiangsu Electric Power Co., Ltd., with Project No. J2025194.
Data Availability Statement
The original contributions presented in this study are included in the article. Further inquiries can be directed to the corresponding author.
Conflicts of Interest
Authors Shijun Huang and Tiancheng Ji were employed by the company State Grid Jiangsu Electric Power Co., Ltd. Construction Branch. The remaining authors declare that the research was conducted in the absence of any commercial or financial relationships that could be construed as a potential conflict of interest.
References
- Nepomuceno, E.; Sena-Cruz, J.; Correia, L. Review on the bond behavior and durability of FRP bars to concrete. Constr. Build. Mater. 2021, 287, 123042. [Google Scholar] [CrossRef] [Scilit]
- ACI Committee 440. Guide for the Design and Construction of Structural Concrete Reinforced with FRP Bars: ACI 440.1R-06; American Concrete Institute: Farmington Hills, MI, USA, 2006. [Google Scholar]
- Guo, X.; Xiong, C.; Jin, Z.; Pang, B. A review on mechanical properties of FRP bars subjected to seawater sea sand concrete environmental effects. J. Build. Eng. 2022, 58, 105038. [Google Scholar] [CrossRef] [Scilit]
- ACI Committee 440. Building Code Requirements for Structural Concrete Reinforced with Glass Fiber-Reinforced Polymer (GFRP) Bars—Code and Commentary (ACI CODE 440.11-22); American Concrete Institute: Farmington Hills, MI, USA, 2022. [Google Scholar]
- Barris, C.; Torres, L.; Turon, A.; Baena, M.; Catalan, A. An experimental study of the flexural behaviour of GFRP RC beams and comparison with prediction models. Compos. Struct. 2009, 91, 286–295. [Google Scholar] [CrossRef] [Scilit]
- Nguyen-Minh, L.; Rovňák, M. Punching shear resistance of interior GFRP reinforced slab-column connections. J. Compos. Constr. 2013, 17, 2–13. [Google Scholar] [CrossRef] [Scilit]
- Goldston, M.; Remennikov, A.; Sheikh, M.N. Experimental investigation of the behaviour of concrete beams reinforced with GFRP bars under static and impact loading. Eng. Struct. 2016, 113, 220–232. [Google Scholar] [CrossRef] [Scilit]
- Nguyen-Minh, L.; Rovňák, M. Shear resistance of GFRP-reinforced concrete beams. Mag. Concr. Res. 2011, 63, 215–233. [Google Scholar] [CrossRef] [Scilit]
- Sadraie, H.; Khaloo, A.; Soltani, H. Dynamic performance of concrete slabs reinforced with steel and GFRP bars under impact loading. Eng. Struct. 2019, 191, 62–81. [Google Scholar] [CrossRef] [Scilit]
- La-Hong, H.; Pham, T.M.; Nguyen-Minh, L. Structural behavior of concrete slabs made of seawater sea sand and reinforced with GFRP reinforcement under flexural loading. Structures 2024, 63, 106351. [Google Scholar] [CrossRef] [Scilit]
- Zou, X.; Lin, H.; Feng, P.; Yao, Y.; Bao, J.; Wang, J. A review on FRP-concrete hybrid sections for bridge applications. Compos. Struct. 2020, 254, 113336. [Google Scholar] [CrossRef] [Scilit]
- Keller, T.; Schaumann, E.; Vallee, T. Flexural behavior of a hybrid FRP and lightweight concrete sandwich bridge deck. Compos. Part A 2007, 38, 879–889. [Google Scholar] [CrossRef] [Scilit]
- Mendes, P.J.D.; Barros, J.A.O.; Correia, J.R.; Taheri, M. Development of a pedestrian bridge with GFRP profiles and fiber reinforced self-compacting concrete deck. Compos. Struct. 2011, 93, 2969–2982. [Google Scholar] [CrossRef] [Scilit]
- Bazli, M.; Ashrafi, H.; Oskouei, A.V. Experiments and probabilistic models of bond strength between GFRP bar and different types of concrete under aggressive environments. Constr. Build. Mater. 2017, 148, 429–443. [Google Scholar] [CrossRef] [Scilit]
- Yan, F.; Lin, Z. Bond behavior of GFRP bar-concrete interface: Damage evolution assessment and FE simulation implementations. Compos. Struct. 2016, 155, 63–76. [Google Scholar] [CrossRef] [Scilit]
- Alachek, I.; Reboul, N.; Jurkiewiez, B. Experimental and finite element analysis of the long-term behaviour of GFRP-concrete hybrid beams fabricated using adhesive bonding. Compos. Struct. 2019, 207, 148–165. [Google Scholar] [CrossRef] [Scilit]
- Peng, S.; Feng, R.; Huang, S.; Cui, L. Physics-aware edge-centric graph neural networks for full-field mechanics simulation of reticulated shells. Eng. Struct. 2026, 360, 122759. [Google Scholar] [CrossRef] [Scilit]
- Gonilha, J.A.; Correia, J.R.; Branco, F.A.; Sena-Cruz, J. Durability of GFRP-concrete adhesively bonded connections: Experimental and numerical studies. Eng. Struct. 2018, 168, 784–798. [Google Scholar] [CrossRef] [Scilit]
- Deskovic, N.; Meier, U.; Triantafillou, T.C. Innovative design of FRP combined with concrete: Long-term behavior. J. Struct. Eng. 1995, 121, 1079–1089. [Google Scholar] [CrossRef] [Scilit]
- Tian, W.M. Research on the Flexural Performance of GFRP Bar Concrete Two-Way Slabs. Master’s Thesis, Shaoxing University, Shaoxing, China, 2024. [Google Scholar] [CrossRef]
- Mai, G.; Xiong, Z.; Zhou, H.; Zhou, L.; Zhu, H.; Li, L. Bond durability between GFRP bars and seawater sea sand concrete in marine environments. Eng. Struct. 2025, 330, 119808. [Google Scholar] [CrossRef] [Scilit]
- Pham, T.M.; Hao, H. Influence of global stiffness and equivalent model on prediction of impact response of RC beams. Int. J. Impact Eng. 2018, 113, 88–97. [Google Scholar] [CrossRef] [Scilit]
- Lin, C.; Yan, Y.; Liu, Z.; Lu, Y. Behavior of FRP seawater sea-sand ECC composite slabs under different loading conditions. Eng. Struct. 2025, 327, 119679. [Google Scholar] [CrossRef] [Scilit]
- AlAjarmeh, O.S.; Manalo, A.C.; Benmokrane, B. Novel testing and characterization of GFRP bars in compression. Constr. Build. Mater. 2019, 225, 1112–1126. [Google Scholar] [CrossRef] [Scilit]
- Wang, L.; Chen, Z.W.; Zhang, M.Q.; Sun, Z.W.; Chen, H.; Lai, J.W.; Feng, R.Q. Dynamic characteristics and comfort of rack vehicles under different slopes for empty and fully loaded conditions. Mech. Based Des. Struct. Mach. 2026, 54, 2618539. [Google Scholar] [CrossRef] [Scilit]
- Wang, L.; Chen, Z.W.; Chen, J.S.; Chen, Z.H.; Du, H.B.; Feng, R.Q. Dynamic characteristics of bridge-mounted rack railway systems with different rack-sleeper connections under seismic loads. Soil Dyn. Earthq. Eng. 2026, 211, 110683. [Google Scholar] [CrossRef] [Scilit]
- Gonilha, J.A.; Correia, J.R.; Branco, F.A. Creep response of GFRP-concrete hybrid structures: Application to a footbridge prototype. Compos. Part B 2013, 53, 193–206. [Google Scholar] [CrossRef] [Scilit]
- Scott, D.W.; Zureick, A.-H. Compression creep of a pultruded E-glass/vinylester composite. Compos. Sci. Technol. 1998, 58, 1361–1369. [Google Scholar] [CrossRef] [Scilit]

Disclaimer/Publisher’s Note: The statements, opinions and data contained in all publications are solely those of the individual author(s) and contributor(s) and not of MDPI and/or the editor(s). MDPI and/or the editor(s) disclaim responsibility for any injury to people or property resulting from any ideas, methods, instructions or products referred to in the content. |
© 2026 by the authors. Licensee MDPI, Basel, Switzerland. This article is an open access article distributed under the terms and conditions of the Creative Commons Attribution (CC BY) license.