


Abstract
Historic urban areas are important repositories of urban history, cultural memory, and local identity. Yet how historical and cultural resources (HCRs) are associated with street vitality, particularly in comparison with streetscape factors, remains insufficiently understood. Taking Chengdu’s historic urban area as a case study, this study integrates streetscape images, point-of-interest (POI) data, and HCR data. It employs machine learning with model interpretation techniques to identify key predictors and nonlinear relationships. The study evaluates the associations of HCRs with street vitality in terms of density, hierarchy, and accessibility, while also assessing streetscape factors within the same analytical framework Results show that HCRs are among the most important explanatory variables associated with street vitality. General HCRs are associated with broadly distributed everyday vitality, whereas high-tier HCRs show stronger localized associations with vitality patterns. The association between high-tier HCRs and street vitality exhibits a clear distance-decay pattern, with the strongest positive associations observed within approximately 650 m. Streetscape factors also exhibit threshold effects: the positive association between vegetation and vitality levels off above a visual proportion of approximately 0.25, whereas building visual proportions between 0.20 and 0.40 are associated with greater vitality. This study broadens the analytical framework for street vitality by incorporating HCRs as key explanatory factors and examining their associations with vitality patterns.
1. Introduction
1.1. Research Background
Against the backdrop of rapid urbanization and the growing emphasis on the regeneration of existing urban areas, streets are not merely channels for movement but also important settings for residents’ daily activities, social interactions, and public life [1,2]. Street vitality, as an important indicator of the intensity of use and publicness of urban space, has become a central concern in urban geography, urban planning, and built-environment research. In historic urban areas, street vitality has a more complex meaning: it reflects not only pedestrian agglomeration, spatial use, and environmental attractiveness, but also the embedding of heritage resources within everyday street life [3,4]. However, in many renewal practices of historic urban areas, spatial optimization often focuses more on traffic organization or commercial development, while lacking sufficient attention to the intrinsic connections among HCRs, streetscape environments, and street vitality, which may limit the capacity of physical improvements to sustain everyday street activity [3,5]. Therefore, identifying the key factors associated with street vitality in historic urban areas and clarifying their directions of association, nonlinear patterns, and conditional relationships have become important issues for the fine-grained regeneration of such areas [3].
1.2. Research Review
1.2.1. Factors Associated with Street Vitality
Existing studies on the influencing mechanisms of street vitality can be broadly categorized into three perspectives. The first perspective emphasizes the role of the built environment and spatial structure and is rooted partly in Hillier’s space syntax theory [6]. This perspective argues that spatial organization affects the distribution of human activities; thus, factors such as street connectivity, land-use mix, functional density, accessibility, and neighborhood scale are often used to explain variations in street vitality [7,8]. With the widespread application of GIS and POI data, researchers have been able to depict urban spatial structures and functional configurations at larger scales. Beyond these static spatial representations, subsequent studies have used heatmaps, mobile-data-derived indicators, and social-sensor data to characterize population activity intensity and its temporal fluctuations [7,9,10], thereby advancing street vitality research toward the analysis of dynamic spatial-use processes.
The second category focuses more on streetscape environments and perceptual experiences, drawing on Lynch’s work on urban imageability [11] and Gehl’s research on public-space behavior [1], and emphasizes the impact of street visual characteristics, spatial quality, and pedestrian experience on activities and spatial evaluation. Related studies generally suggest that visual features, spatial openness, and interface continuity are associated with people’s lingering behavior, pedestrian movement, and spatial evaluations. For example, Li and Pang evaluated the spatial visual quality of Tianjin Binjiang Road and found that buildings, street width, vegetation, facilities, and landscape elements jointly influence pedestrian visual perception [12]. Following this logic, streetscape elements such as buildings, vegetation, sky, roads, and street furniture have gradually been incorporated into street vitality research.
The third category emphasizes the dynamics of human activities from a spatiotemporal behavioral perspective. Sagl et al. used mobile-network and social-media data as social-sensor data to reveal spatiotemporal patterns of collective human activity and mobility [10]. Overall, these studies have significantly deepened the understanding of street vitality, but their analysis objects mostly focus on general urban streets or commercial districts. Compared with typical urban streets, HCRs in historic districts are not merely environmental backdrops; through spatial clustering, hierarchical differences, and accessibility patterns, they may form part of the conditions under which street vitality emerges.
However, the role of HCRs in shaping variations in street vitality remains insufficiently examined. Although research on historic urban areas and historic districts has increased in recent years, existing studies have mainly focused on vitality assessment, built-environment associations, and regeneration strategies [3,4,13,14]. HCRs are often treated as contextual conditions or locational attributes rather than systematically incorporated as explanatory variables in street vitality models [15,16]. Consequently, the structural characteristics of HCRs and their associations with street vitality remain unclear, particularly regarding how different heritage categories, spatial concentrations, and accessibility conditions relate to vitality patterns. This limitation constrains a deeper understanding of how heritage resources participate in the formation of street vitality within historic urban areas.
A further consideration is that HCRs should not be regarded as a homogeneous spatial attribute. Different heritage resources vary in their protection status, historical significance, spatial scale, and degree of integration into everyday urban life. Landmark heritage sites with higher protection status may provide symbolic and cultural values, whereas numerous local-scale resources may be more closely connected with routine street activities. Therefore, the relationship between HCRs and street vitality cannot be fully understood through a single heritage indicator. Instead, examining HCRs through dimensions such as hierarchy, density, and accessibility may provide a more nuanced understanding of how heritage resources are associated with vitality patterns in historic urban areas [3,4,17].
1.2.2. Methodological Advances
Methodologically, statistical and regression-based approaches remain common in research on street vitality and the built environment [2,8], but average-effect specifications can be insufficient for capturing complex nonlinear relationships and multi-factor interactions [18]. In recent years, machine learning methods have expanded in urban studies, particularly for high-dimensional data, nonlinear patterns, and complex relationships among predictors. At the same time, semantic segmentation of street-view imagery has enabled more systematic quantification of street-scale environmental features [19,20]. Ma used street view imagery and deep learning methods to identify urban-vitality-related street features in Qingdao [21], while Nagata et al. developed an automated streetscape walkability scoring method using semantic segmentation of Google Street View imagery [22]. For model interpretation, XGBoost provides a scalable gradient-boosted-tree framework [23], SHAP decomposes model predictions into additive feature attributions [24], and partial dependence plots can be used to characterize marginal response patterns [25]. Urban and spatial applications have increasingly combined these tools to interpret complex prediction models. For example, Wang et al. used XGBoost and SHAP to quantify the effects of urban morphology on flood susceptibility [26], and Zhang et al. applied interpretable machine learning methods to crime prediction [27]. Together, these methods provide a practical analytical pathway for identifying variable importance, nonlinear thresholds, and conditional relationships in street vitality research [18,28,29].
1.3. Research Contributions
In summary, existing research has examined the relationships between street environments and vitality from the perspectives of spatial configuration, streetscape perception, and human activity dynamics. However, two shortcomings remain. On the one hand, most studies focus on general urban streets or commercial blocks, with insufficient attention to historic urban areas, where cultural resources, distinctive spatial forms, and complex daily activities are closely intertwined. As a result, the factors associated with variations in street vitality in such contexts remain insufficiently understood. On the other hand, although previous studies have recognized that HCRs, streetscape environments, and built-environment factors are jointly associated with street vitality, the treatment of HCRs remains relatively coarse. These resources are often regarded as background conditions or locational attributes, with limited attention to their structural characteristics, such as density, hierarchy, and spatial distance. Moreover, few studies have simultaneously examined nonlinear relationships and conditional relationships among HCRs, streetscape factors, and other built-environment characteristics within an integrated analytical framework.
Accordingly, this study addresses three main questions: first, which factors are most strongly associated with street vitality in historic urban areas, and how important are variables across different dimensions? Second, do key variables exhibit threshold-like patterns, diminishing marginal relationships, and other nonlinear associations? Third, what conditional relationships emerge among HCRs, streetscape environments, and built-environment factors in relation to street vitality in historic urban areas?
This study contributes to existing research in two respects: its conceptual framing and its methodological approach. Conceptually, it explicitly incorporates HCRs into the analytical framework for examining variations in street vitality, thereby extending existing research to the cultural-resource dimension and its spatial associations in historic urban areas. Methodologically, it combines street view image semantic segmentation and road-network analysis and employs interpretable machine learning techniques to characterize nonlinear relationships and conditional response patterns, thereby addressing the limitations of linear assumptions in conventional regression models.
2. Materials and Methods
2.1. Study Area and Objects
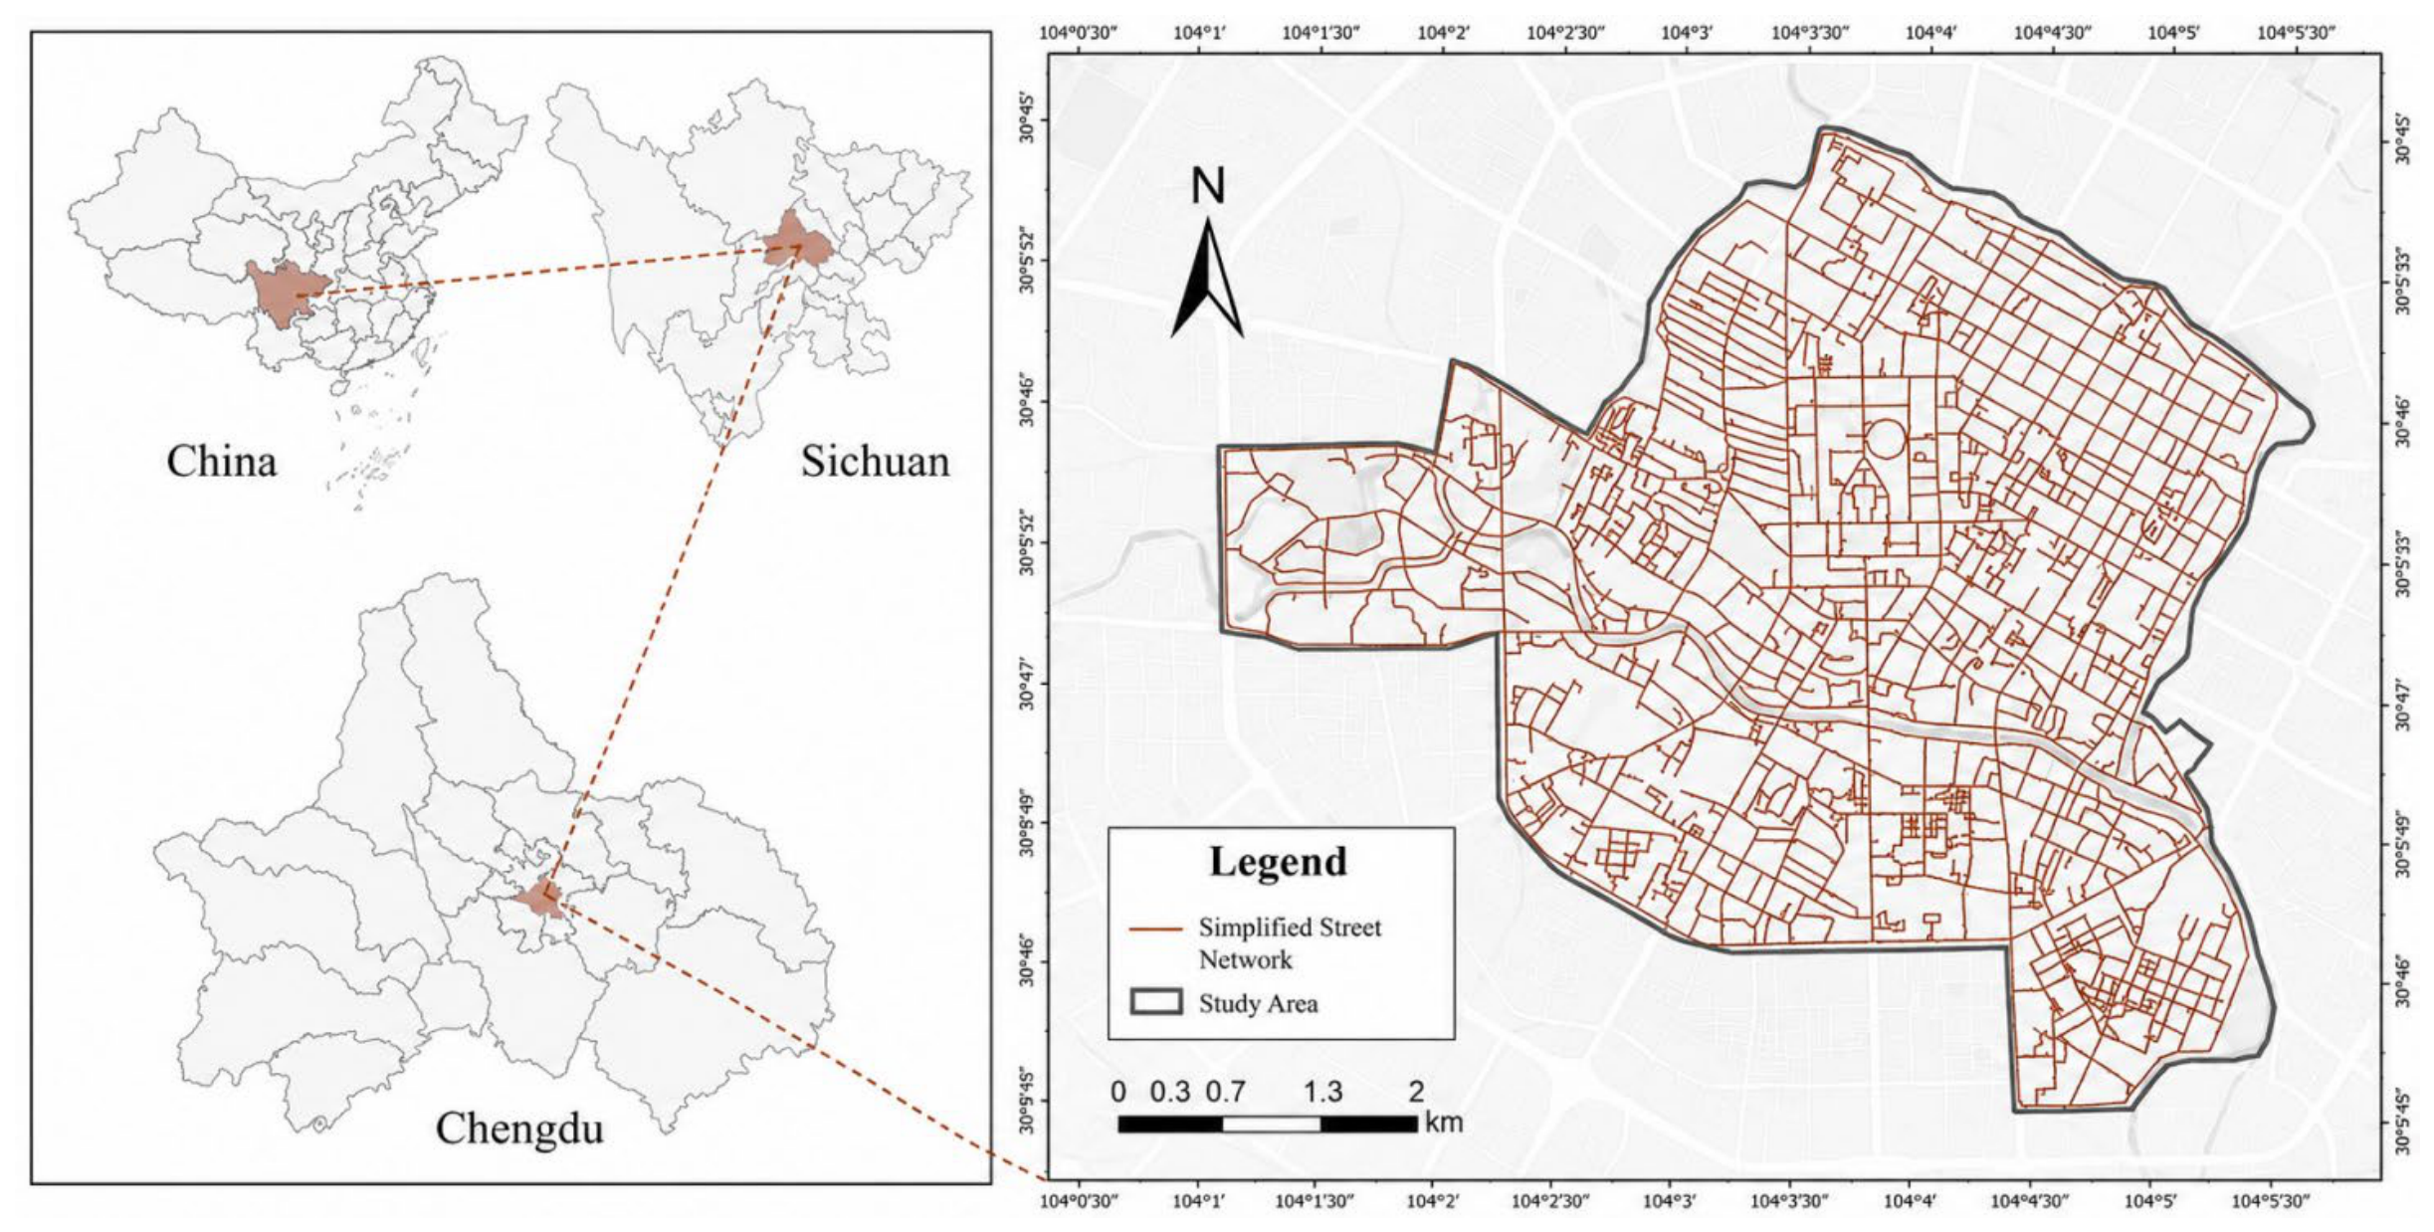
Chengdu, the capital of Sichuan Province and an important central city in western China, has an urban history of more than 2300 years. Since the Qin dynasty, the city site and city name have remained largely unchanged [30]. As shown in Figure 1, the study area is the protection scope of Chengdu’s historical urban area defined by the Chengdu Historical and Cultural City Protection Plan (2019–2035) [17]. This area constitutes the historical core of the city’s long-term urban development and contains a high concentration of historical and cultural heritage. Its total area is approximately 24.66 square kilometers [17], and the study area encompasses historical and cultural landscape districts such as Shaocheng, Wenshuyuan, and Shuijingfang, as well as their surrounding areas.
Figure 1.
Study area.
The historical urban area of Chengdu provides a representative setting for examining the relationships between heritage-related spatial characteristics and street vitality in a heritage-rich urban context. On the one hand, this region concentrates typical HCRs and urban-renewal practices, making it a useful setting for observing relationships among heritage preservation, functional succession, and street vitality. On the other hand, street vitality presents significant spatial differentiation within the region, a pattern also reported in recent studies of historic urban areas [3,4]. Selecting this region as the study object therefore provides an empirical basis for examining the spatial differentiation of street vitality and its associations with historical, spatial, and environmental characteristics in historic urban areas.
2.2. Workflow
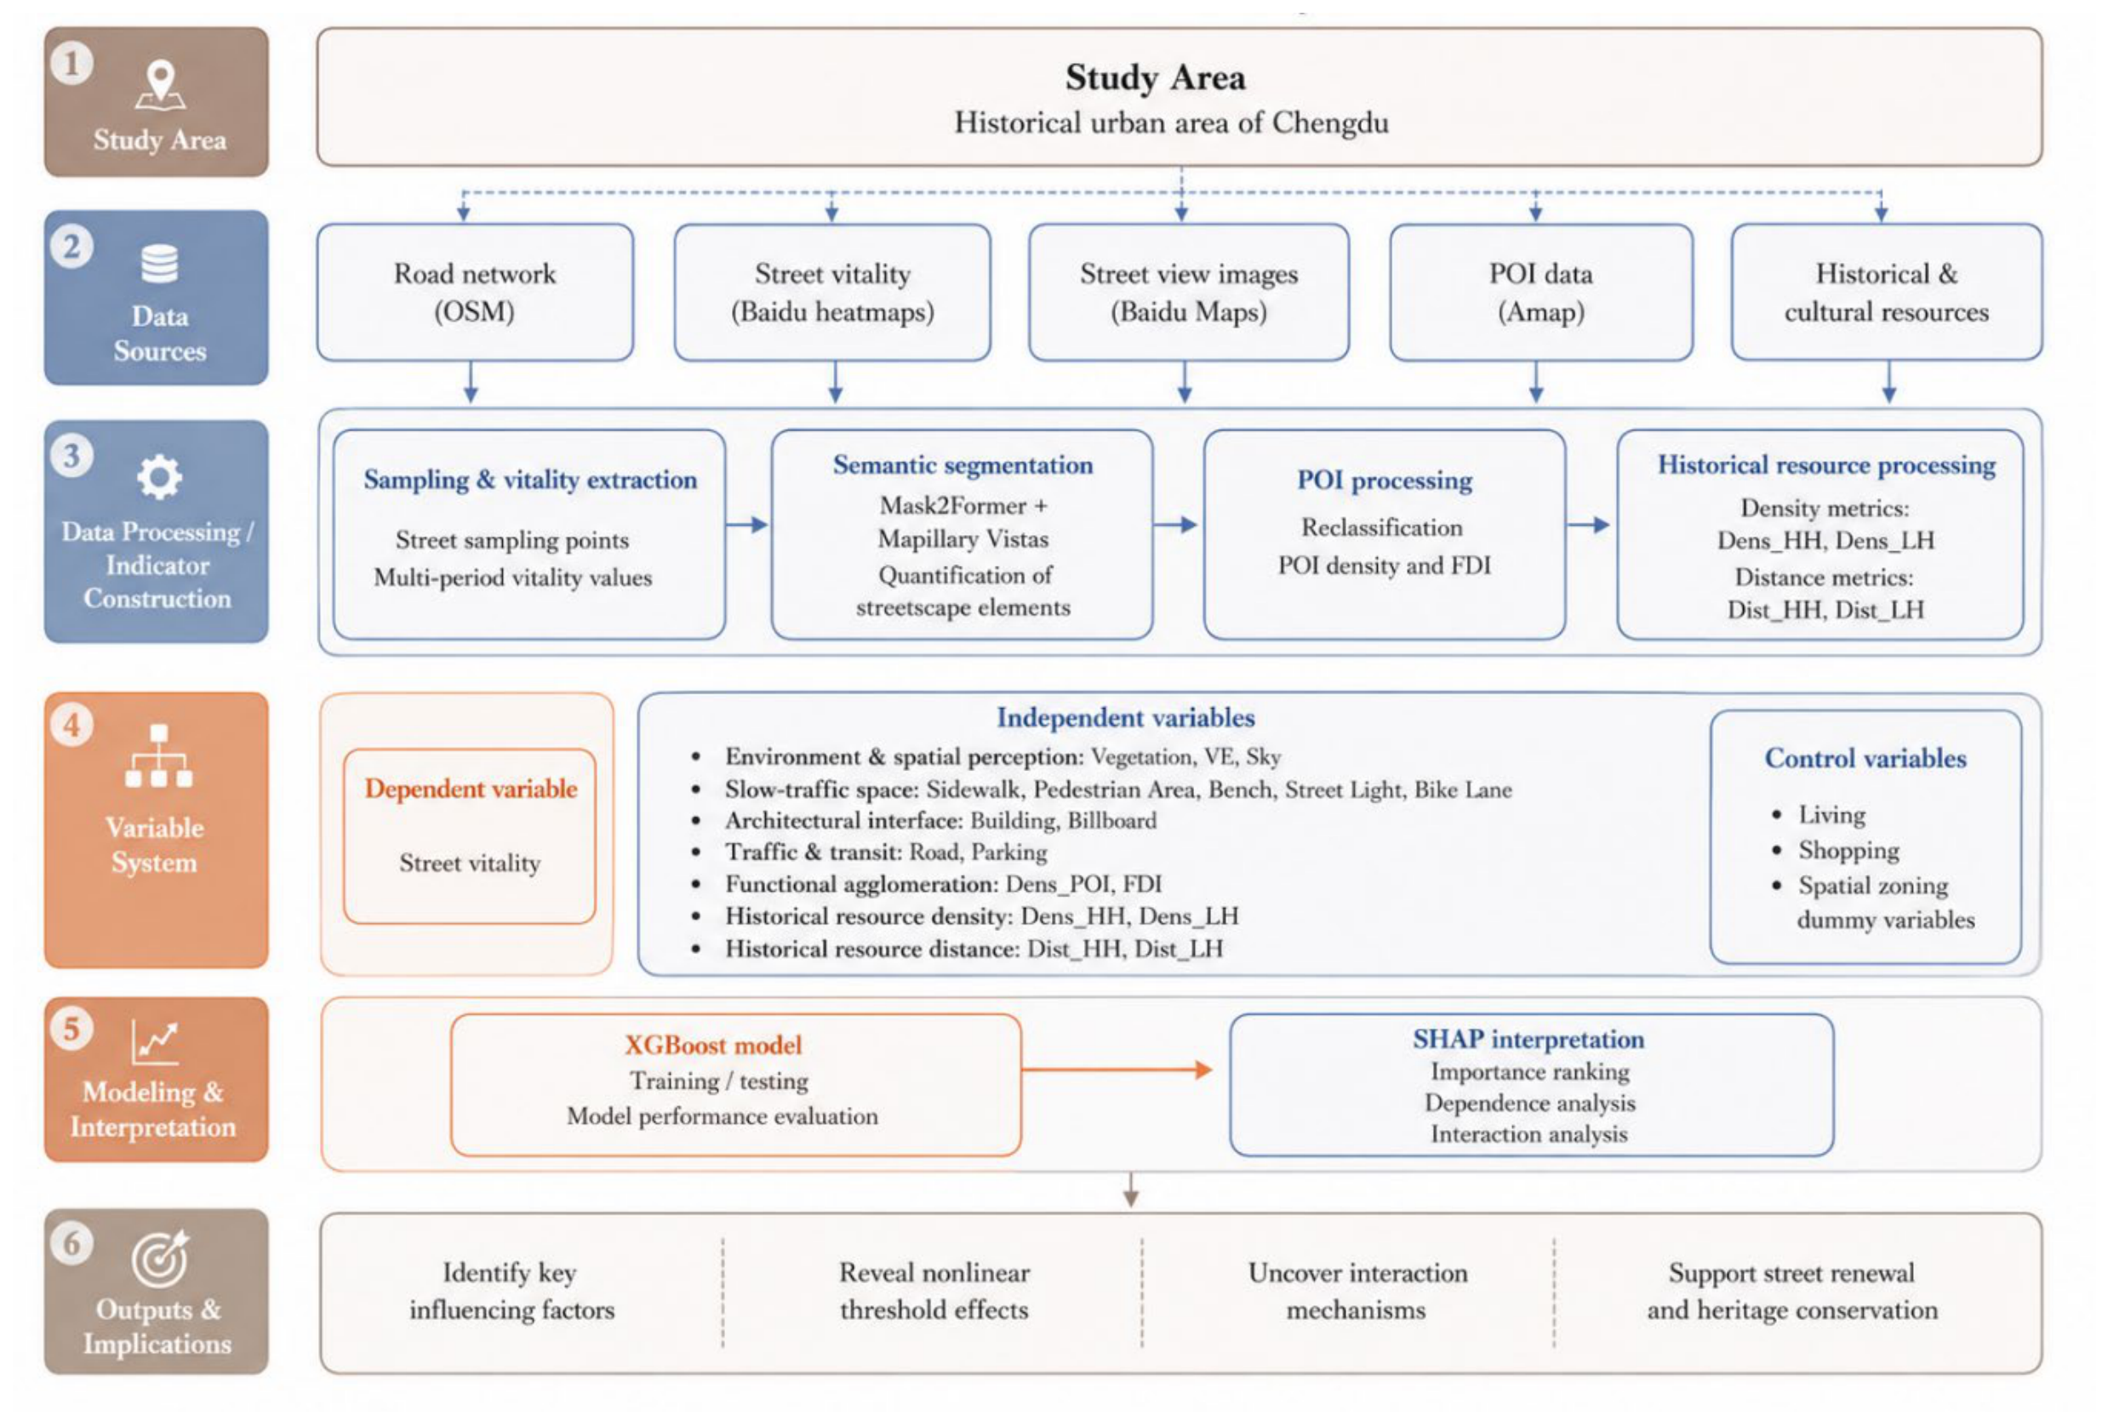
As shown in Figure 2, the workflow of this study consists of six main steps: (1) Defining the study area as the historical urban area of Chengdu. (2) Collecting multi-source data, including OSM road networks, Baidu heatmaps, Baidu street view images, Amap POI data, and HCRs data. (3) Conducting data processing and indicator construction, including street sampling and vitality extraction, streetscape semantic segmentation, POI reclassification and density calculation, and historical resource density and distance measurement. (4) Constructing the variable system, including street vitality as the dependent variable; streetscape, functional, historical-resource density and distance variables as independent variables; and living, shopping, and spatial zoning dummy variables as control variables. (5) Employing the XGBoost model for training, testing, and performance evaluation, followed by SHAP interpretation to identify variable importance, dependence relationships, and interaction effects. (6) The final step summarizes the model outputs to identify important explanatory variables, characterize nonlinear threshold patterns and conditional relationships, and discuss their implications for street renewal and heritage conservation.
Figure 2.
Research framework.
2.3. Data Sources and Variable Selection
2.3.1. Data Sources
The data for this study mainly consists of five parts: road networks, public space vitality, streetscape images, POIs, and HCRs. First, OpenStreetMap (OSM) was used to obtain the road network of Chengdu’s historical urban area. Road types irrelevant to the study were removed, after which a 10 m buffer was constructed and road centerlines were extracted as the sampling baselines. This processing helps improve the continuity and clarity of the street sampling baselines, facilitating the subsequent extraction of sampling points along the centerlines at fixed intervals, and avoiding duplicate sampling points or confusing affiliations caused by intersections, overlaps, or fragmentation of the original road networks.
In terms of measuring street vitality, this paper adopts Baidu heatmap data as the base dataset for public-space vitality in the study area. Baidu heatmaps are widely used as a dynamic proxy for population gathering and activity intensity in Chinese urban studies [8]. The data are derived from location-based-service activity and represented as relative heat values rather than direct population counts. After processing, the heat values provide a dynamic representation of the spatial distribution of human activity. As a form of urban sensing data, Baidu heatmaps have relatively high temporal resolution, low acquisition cost, scalability, and broad spatial coverage.
To depict the micro-environmental characteristics of street spaces, this paper further introduces streetscape image data. The streetscape images used in the study are derived from Baidu Maps. Street view imagery has been broadly applied in urban analytics, including environmental perception and built-environment measurement [31]. By invoking the Baidu Maps API and setting relevant parameters according to interface requirements, this paper obtained streetscape images of the study area for subsequent streetscape-element identification and environmental-feature extraction.
In addition to streetscape images, this paper incorporates point-of-interest (POI) data from Amap to represent the distribution of functional facilities around the streets. POI data are widely used to characterize urban functional density, facility agglomeration, and functional mix in multi-source vitality studies [32,33]. Compared with road-network and streetscape representations of spatial form and visual environment, POI data provide a complementary description of functional supply around street locations.
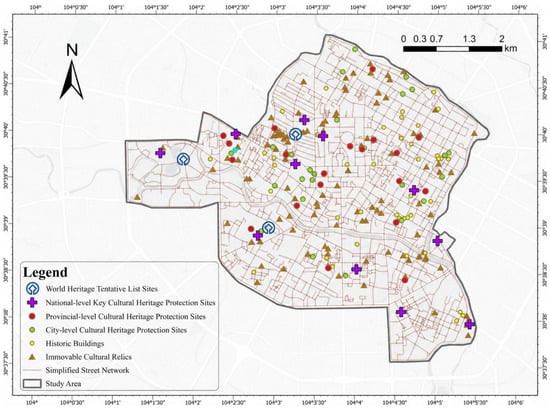
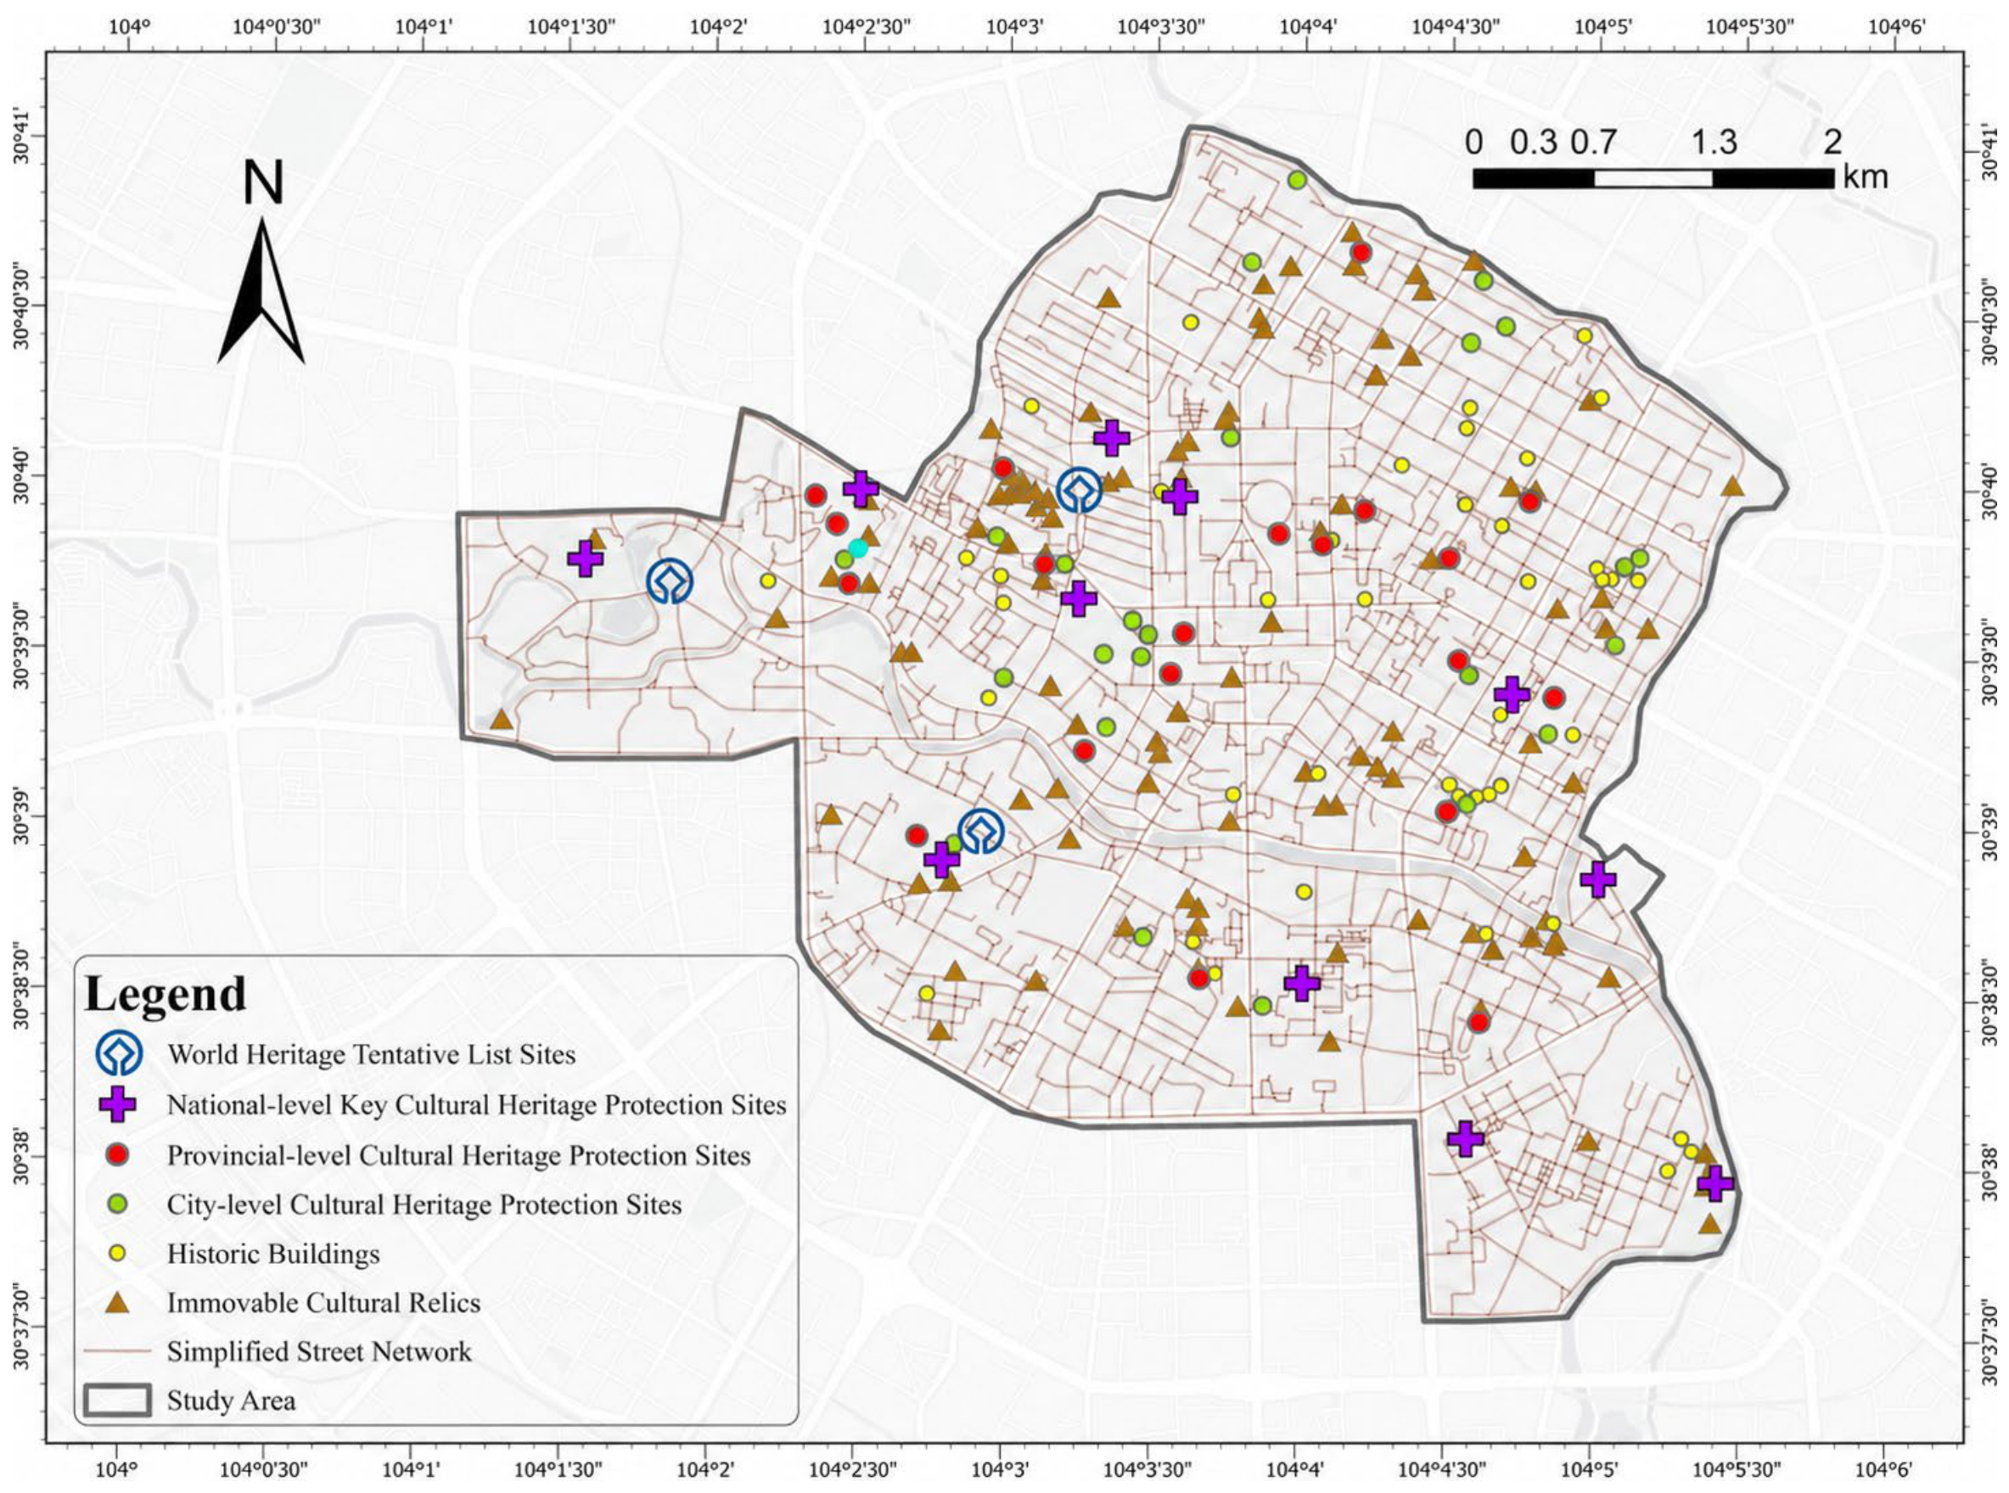
Finally, to examine the associations between HCRs and street vitality, this study developed HCR-related indicators based on official planning documents and georeferenced heritage records. The primary data source was the Chengdu Historical and Cultural City Protection Plan (2019–2035), which documents heritage resources with different levels of official protection and provides the official basis for subsequent HCR classification, density estimation, and accessibility analysis [17]. After spatial cleaning and geocoding, the analytical HCR dataset contained 207 georeferenced records, including 3 World Heritage Tentative List Sites, 11 National-level Key Cultural Heritage Protection Sites, 20 Provincial-level Cultural Heritage Protection Sites, 25 City-level Cultural Heritage Protection Sites, 106 Immovable Cultural Relics, and 42 Historic Buildings. The spatial distribution of these HCRs is shown in Figure 3.
Figure 3.
HCR spatial distribution.
2.3.2. Dependent Variable: Street Vitality
This paper sets street vitality as the dependent variable and uses vitality values extracted from Baidu heatmaps as the core data to characterize the external manifestation of street vitality in the Chengdu historical urban area. The original thermal values originate from “Baidu Huiyan” data, which summarizes the number of Location-Based Service (LBS) requests in a 200 m × 200 m grid at fixed time intervals and assigns thermal values to the grid centroids that can represent population activity intensity. Subsequently, Kernel Density Estimation (KDE) is employed in geographic information software to process these centroid-based thermal values, generating a continuous spatial surface of street vitality distribution and further extracting the KDE value of each sampling point to indicate the localized vitality intensity at a specific position.
Furthermore, considering the differences in human activities across different date types and intra-day periods, this paper conducts time-segmented and categorized processing on the vitality data. Specifically, three representative periods are selected daily: morning (10:00), afternoon (16:00), and evening (20:00); concurrently, three types of representative dates are chosen, including weekdays (16 October 2025), weekends (19 October 2025), and public holidays (3 October 2025). To eliminate the effects of differences in overall activity levels and data scales across different date types and intraday time periods, this paper standardizes the street activity values for each of the nine time-period combinations and calculates the equally weighted average of the standardized activity values for each sampling point at different observation times. The resulting values are used to measure the activity levels of streets in the historic district. This method accounts for activity differences across different date types and intraday time periods, reducing the randomness associated with observations from a single date or time period, and making the measurement of street vitality more objective and comprehensive.
Temporal robustness was assessed by estimating separate XGBoost models for the three date categories (weekday, weekend, and public holiday) using the same explanatory variables and model specification. The consistency of model performance and HCR-related feature importance was evaluated across these temporal contexts.
2.3.3. Independent Variables of Street Vitality
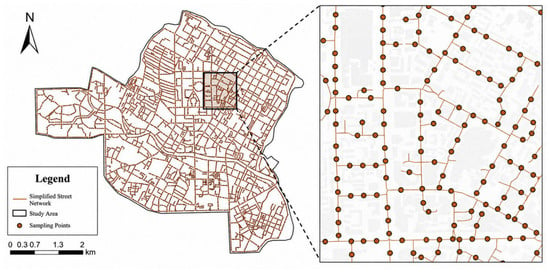
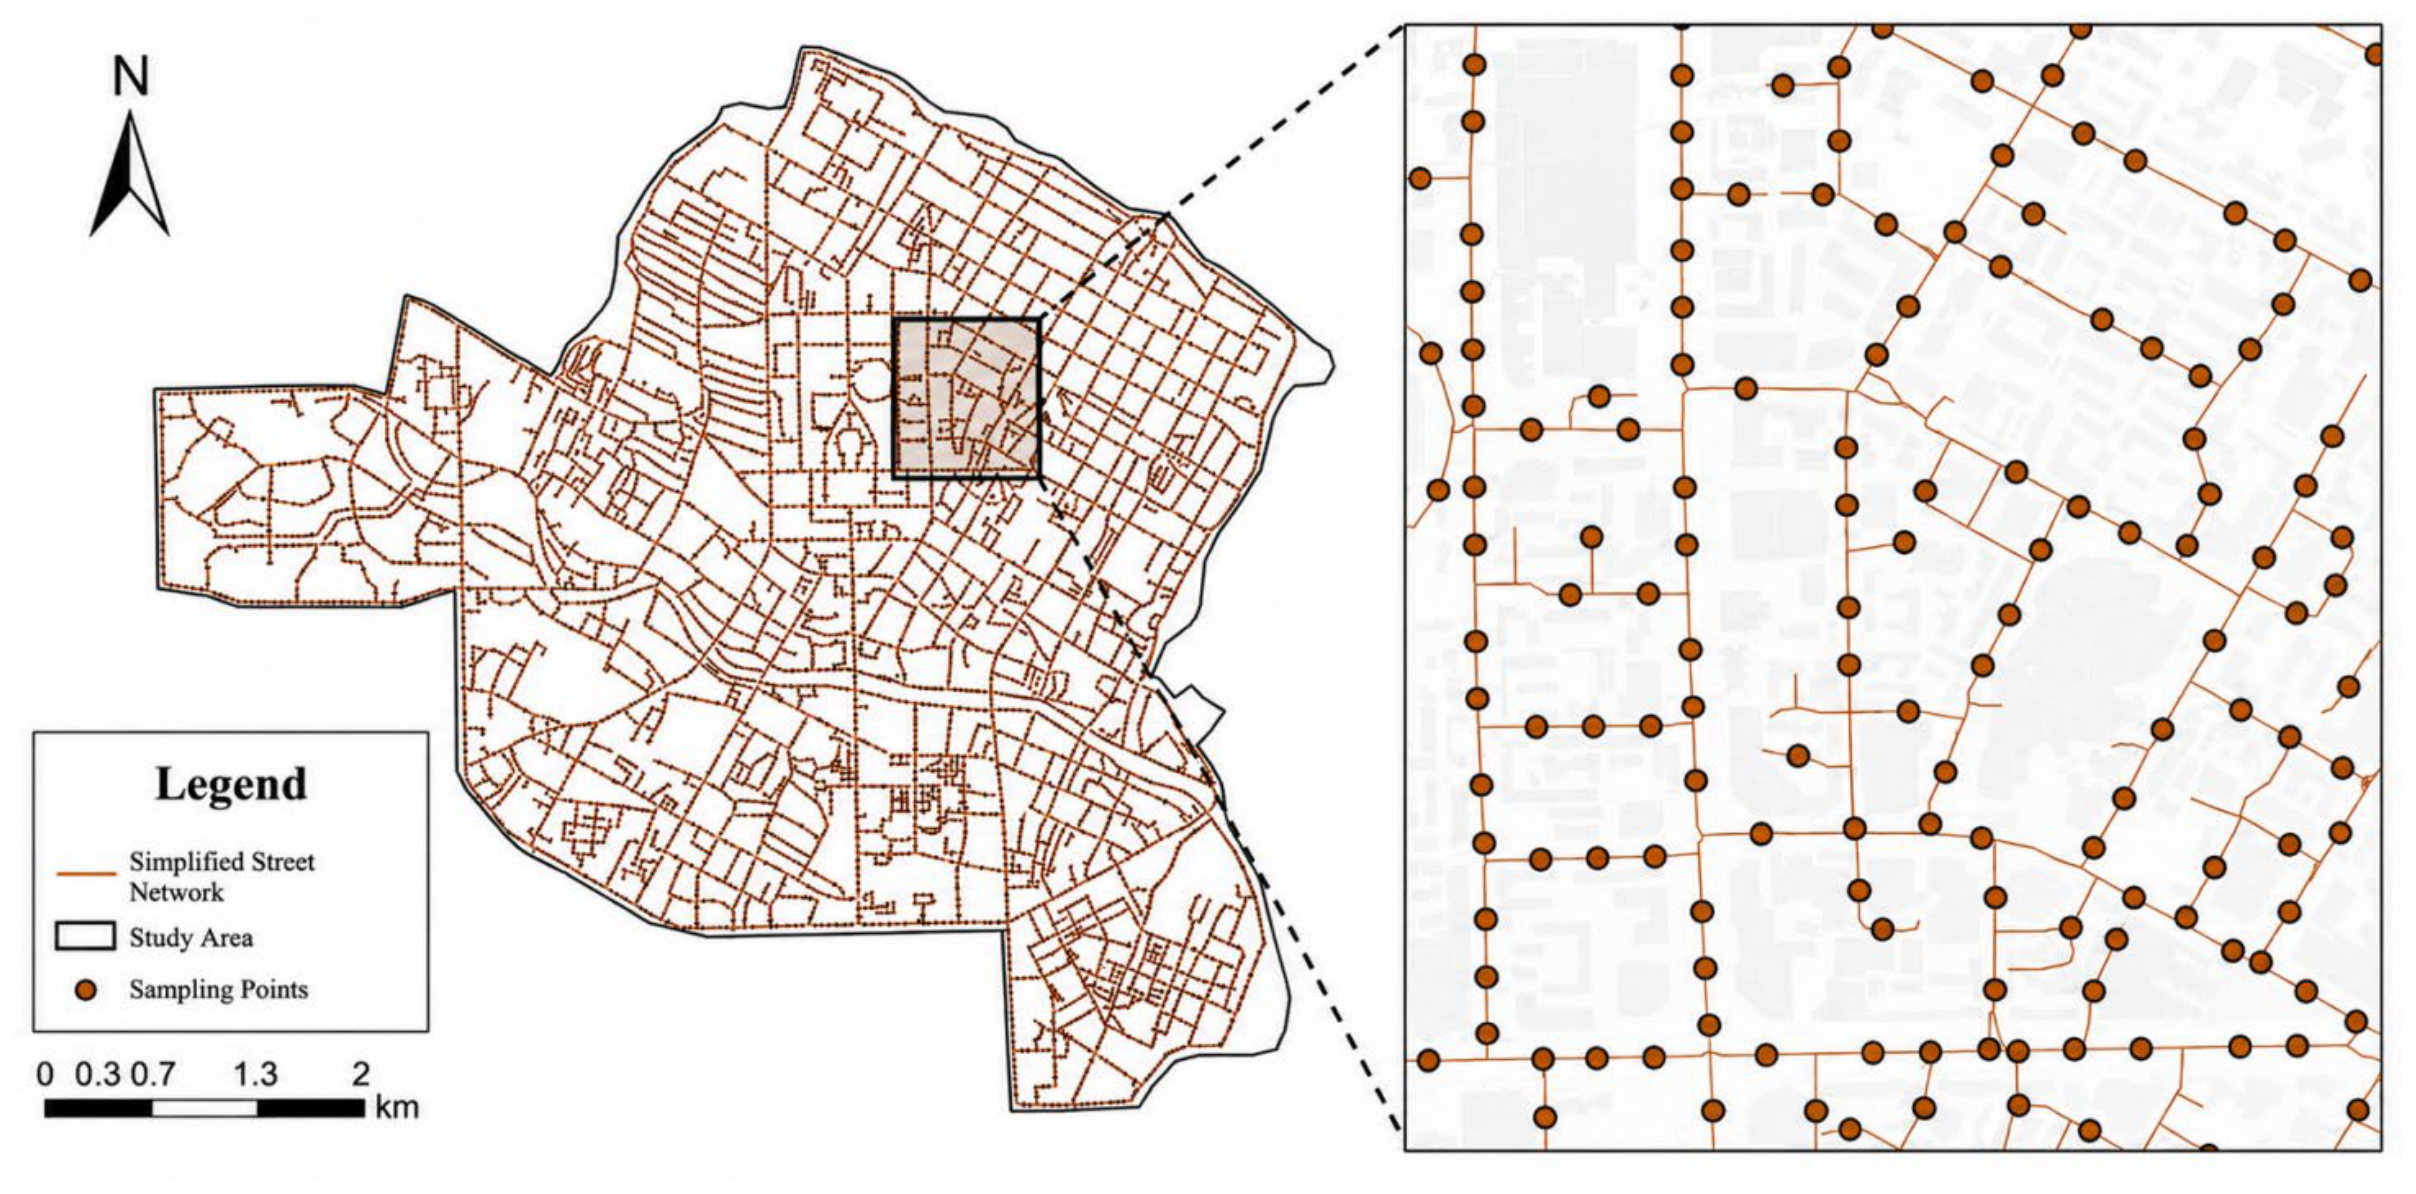
Spatial visual indicators derived from streetscape images were incorporated as part of the explanatory-variable system for street vitality. To capture the local street-environment conditions of the study area, sampling locations were generated along the road network at 50 m intervals (Figure 4). The geographic coordinates of these locations were obtained through the Baidu Maps API and then transformed into the BD-09 coordinate system. A batch collection program developed in Python (version 3.9.21) was subsequently used to request Baidu Street View images after specifying the heading, pitch, field of view, and image resolution. For each sampling location, images were collected from four viewing directions, namely 0°, 90°, 180°, and 270°, with the pitch fixed at 0°. This study set up a total of 3359 sampling points, yielding 13,436 streetscape images.
Figure 4.
Distribution of sampling points.
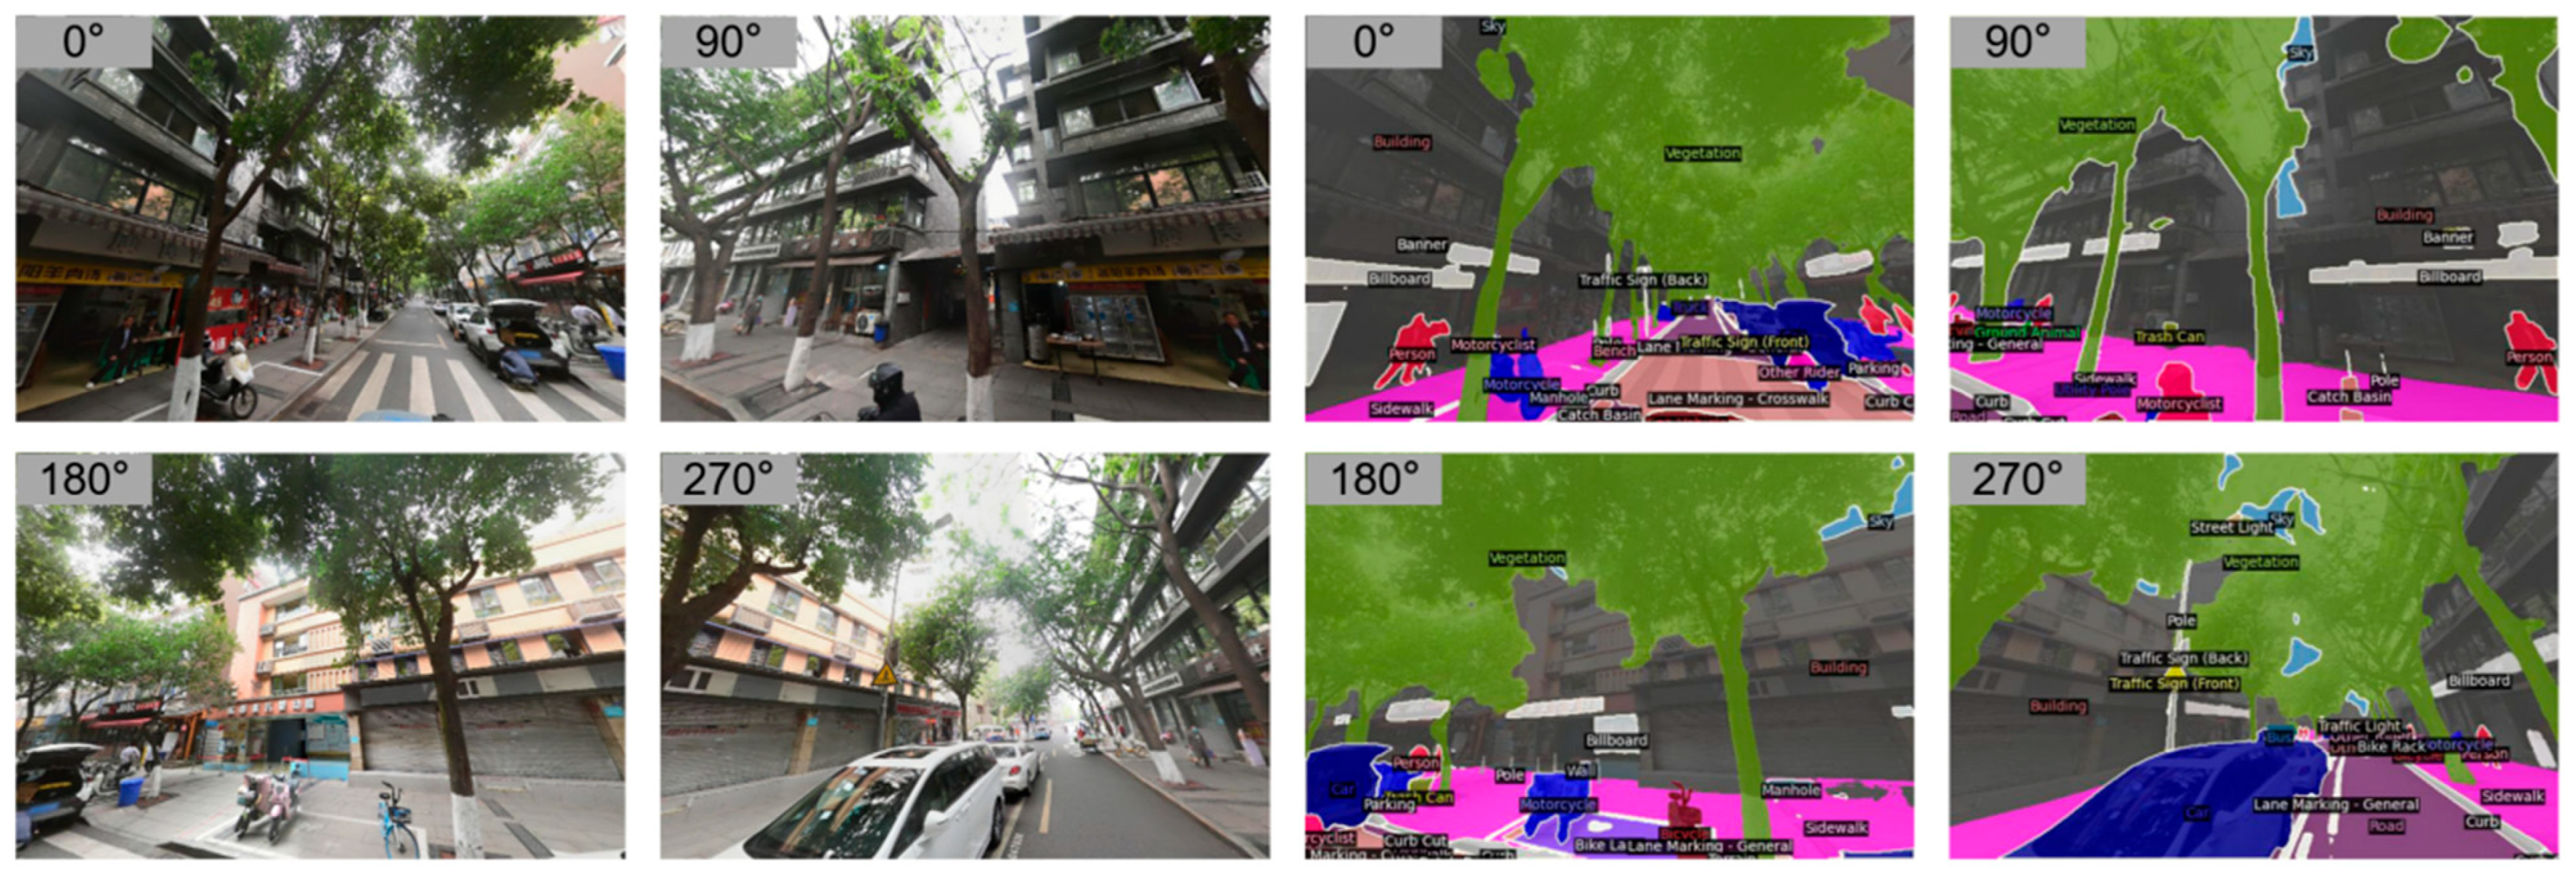
After obtaining the streetscape images, this paper uses the Mask2Former model to perform semantic segmentation and extract quantifiable street-environment elements. Mask2Former is a universal segmentation architecture based on masked attention and can address semantic, instance, and panoptic segmentation tasks [34]. The model is applied with the Mapillary Vistas label system, a large-scale street-scene dataset annotated into 66 object categories [35]. Based on the segmentation results, streetscape images are transformed into structured, quantifiable environmental features. To illustrate the image collection and segmentation results, this paper selected four directional street view images from a typical sampling point and their corresponding segmentation outputs (Figure 5).
Figure 5.
Streetscape images and semantic segmentation rendering.
On this basis, and with reference to the variable selection approaches used in existing studies, this paper selects 12 key streetscape factors and visual entropy from the semantic segmentation results as independent variables for street vitality analysis, while balancing variable representativeness, model accuracy, and computational complexity. These variables include Vegetation, Visual Entropy (VE), and Sky in the environment and spatial perception dimension; Sidewalk, Pedestrian Area, Bench, Street Light, and Bike Lane in the slow-traffic space dimension; Building and Billboard in the architectural interface dimension; and Road and Parking in the traffic and transit dimension. Among them, VE is used to measure the diversity and disorder of different visual elements in streetscape images, reflecting the visual complexity of the street space, as calculated in Equation (1).
where Pi is the proportion of visual element category i in the image, and n is the total number of visual element categories [36].
To reflect the functional distribution within the region, we also utilized the Amap API to extract POI data for the Chengdu historical urban area in 2025. After refining the original POI categories and removing those irrelevant to street vitality, the remaining POIs were reclassified into 12 functional categories. Then, POI density (Dens_POI) and Functional Diversity Index (FDI) within a 55 m buffer of each sampling point were calculated [4], with the FDI calculated according to Equation (2). These two independent variables are categorized into the functional and facility agglomeration dimension (FDI, Dens_POI).
where Di is the number of POIs belonging to functional category i, Dj is the total number of POIs within the street segment, and j is the total number of functional categories [4].
HCR-related spatial indicators were constructed from the collected heritage records to characterize different dimensions of heritage distribution and accessibility. Official heritage categories were first classified into two analytical groups for the baseline specification according to the existing protection hierarchy (Table 1). The analytically defined high-tier HCR group consisted of World Heritage Tentative List Sites, National-level Key Cultural Heritage Protection Sites, and Provincial-level Cultural Heritage Protection Sites (n = 34), whereas the low-tier HCR group consisted of City-level Cultural Heritage Protection Sites, Immovable Cultural Relics, and Historic Buildings (n = 173). This two-tier classification represents an analytical operationalization based on the official protection hierarchy rather than an officially defined two-level classification. For consistency with the established variable names, these two groups are referred to as high-tier HCRs (HH) and low-tier HCRs (LH) in the subsequent analyses. Kernel-density surfaces were generated separately for the two groups, and the corresponding density values were extracted at each sampling point to derive Dens_HH and Dens_LH. In addition, the network-based distance from each sampling point to the nearest HCR within each group was calculated to obtain Dist_HH and Dist_LH. Higher density values indicate stronger local concentrations of HCRs, whereas smaller distance values indicate greater accessibility to HCRs.
Table 1.
HCR categories, resource counts, and baseline analytical classification.
The robustness of the baseline classification was further evaluated using two alternative classification strategies while keeping all other model settings unchanged. Under the strict high-tier classification, only World Heritage Tentative List Sites and National-level Key Cultural Heritage Protection Sites were included in the high-tier group (n = 14), while Provincial-level Cultural Heritage Protection Sites, City-level Cultural Heritage Protection Sites, Immovable Cultural Relics, and Historic Buildings were assigned to the low-tier group (n = 193). Under the broad high-tier classification, City-level Cultural Heritage Protection Sites were additionally included in the high-tier group (n = 59), whereas Immovable Cultural Relics and Historic Buildings remained in the low-tier group (n = 148). For each classification scheme, HCR density and network-distance indicators were recalculated, and the same XGBoost specification was re-estimated. These alternative classifications were used as robustness checks, while the baseline grouping was predefined according to the official protection hierarchy rather than selected based on predictive performance.
Based on the above indicator construction, the variable dimensions and corresponding variables used in the street vitality analysis are summarized in Table 2.
Table 2.
Variable dimensions and corresponding variables.
2.3.4. Control Variables
To reduce the confounding impact of commercial agglomeration on the analysis of street vitality in historic urban areas, this study incorporates the number of commercial facilities as a control variable into the model. Street segments with dense commercial facilities are usually equipped with more complete street furniture, lighting, and signage systems [37], thereby reinforcing the manifestation of streetscape features to a certain extent. If commercial facility density is not controlled, the environmental enhancements brought by such commercial agglomeration and its supporting investments might be misjudged as the independent effects of streetscape factors.
Spatial zoning dummy variables are constructed based on latitude and longitude quantile binning, and are included in the model as location controls to absorb unobserved spatial heterogeneity within the historical urban area caused by locational endowments and district backgrounds, reducing estimation bias caused by omitted spatial variables, and thus identifying the independent impacts of streetscape built-environment characteristics on street vitality more robustly.
2.4. XGBoost Model and Interpretability Analysis
XGBoost is an ensemble learning algorithm based on gradient-boosted trees, with strong predictive performance and the ability to capture nonlinear relationships and variable interactions [23]. It has increasingly been applied to urban and spatial problems involving complex built-environment predictors [18,38]. Considering that street vitality in historic urban areas may be jointly associated with multiple types of factors, this study uses XGBoost to model street vitality and identify the relative importance and response characteristics of explanatory variables.
To explain the trained XGBoost model, this paper employs SHAP (SHapley Additive exPlanations), which decomposes a prediction into additive feature-attribution values based on Shapley-value principles [24]. SHAP can be used to summarize global feature importance while also examining the direction and heterogeneity of feature contributions across observations. Its additive explanation framework is shown in Equation (3), and the feature-attribution expression is shown in Equation (4) [24]. Interpretable machine learning approaches of this kind have also been applied in urban and spatial studies, including urban flood-susceptibility analysis [26] and crime prediction [27].
where g denotes the local explanation model, zi′ ∈ {0,1}M indicates whether feature i is included in the feature coalition, M is the total number of simplified input features, φ0 represents the expected model output, and φi denotes the attribution value assigned to feature i [24].
The contribution of each feature can be further expressed as
where f represents the trained prediction model, F denotes the complete feature set, and S refers to a subset of features excluding feature i [24].
The interpretability analysis in this paper consists of four levels. First, feature importance is summarized using mean absolute SHAP values, and variables are aggregated by dimension to compare their overall explanatory contributions. Second, SHAP beeswarm plots are used to identify the direction, magnitude, and heterogeneity of feature contributions. Third, SHAP dependence plots are used to characterize nonlinear response patterns and potential threshold intervals. Finally, bivariate partial dependence plots are used to examine the model-predicted response to pairs of explanatory variables while averaging over the distribution of the remaining features [25]. Through this sequence, the analysis focuses on key historical-resource and streetscape variables and their conditional relationships.
where Xs are one or two features, Xc is the remaining features, f is the model we utilized in this study [25].
3. Results
3.1. Model Performance Evaluation
Model performance was first evaluated by comparing linear regression, random forest, and XGBoost under the same random cross-validation framework. The dataset was randomly divided into training and test sets at a ratio of 75% to 25%, and 10-fold cross-validation was applied to the training data. Model performance was assessed using R2, RMSE, and MAE.
As summarized in Table 3, XGBoost achieved the strongest overall predictive performance, with a mean cross-validated R2 of 0.534 ± 0.055, an RMSE of 0.502 ± 0.033, and an MAE of 0.356 ± 0.024. Random forest achieved an R2 of 0.491 ± 0.061, an RMSE of 0.503 ± 0.038, and an MAE of 0.378 ± 0.027, whereas linear regression produced an R2 of 0.304 ± 0.049, an RMSE of 0.589 ± 0.041, and an MAE of 0.451 ± 0.029. The superior performance of the two tree-based models relative to linear regression suggests that nonlinear relationships are important in explaining variations in street vitality, while the consistently stronger performance of XGBoost supports its selection as the primary model for subsequent interpretation.
Table 3.
Comparison of predictive performance among machine learning models.
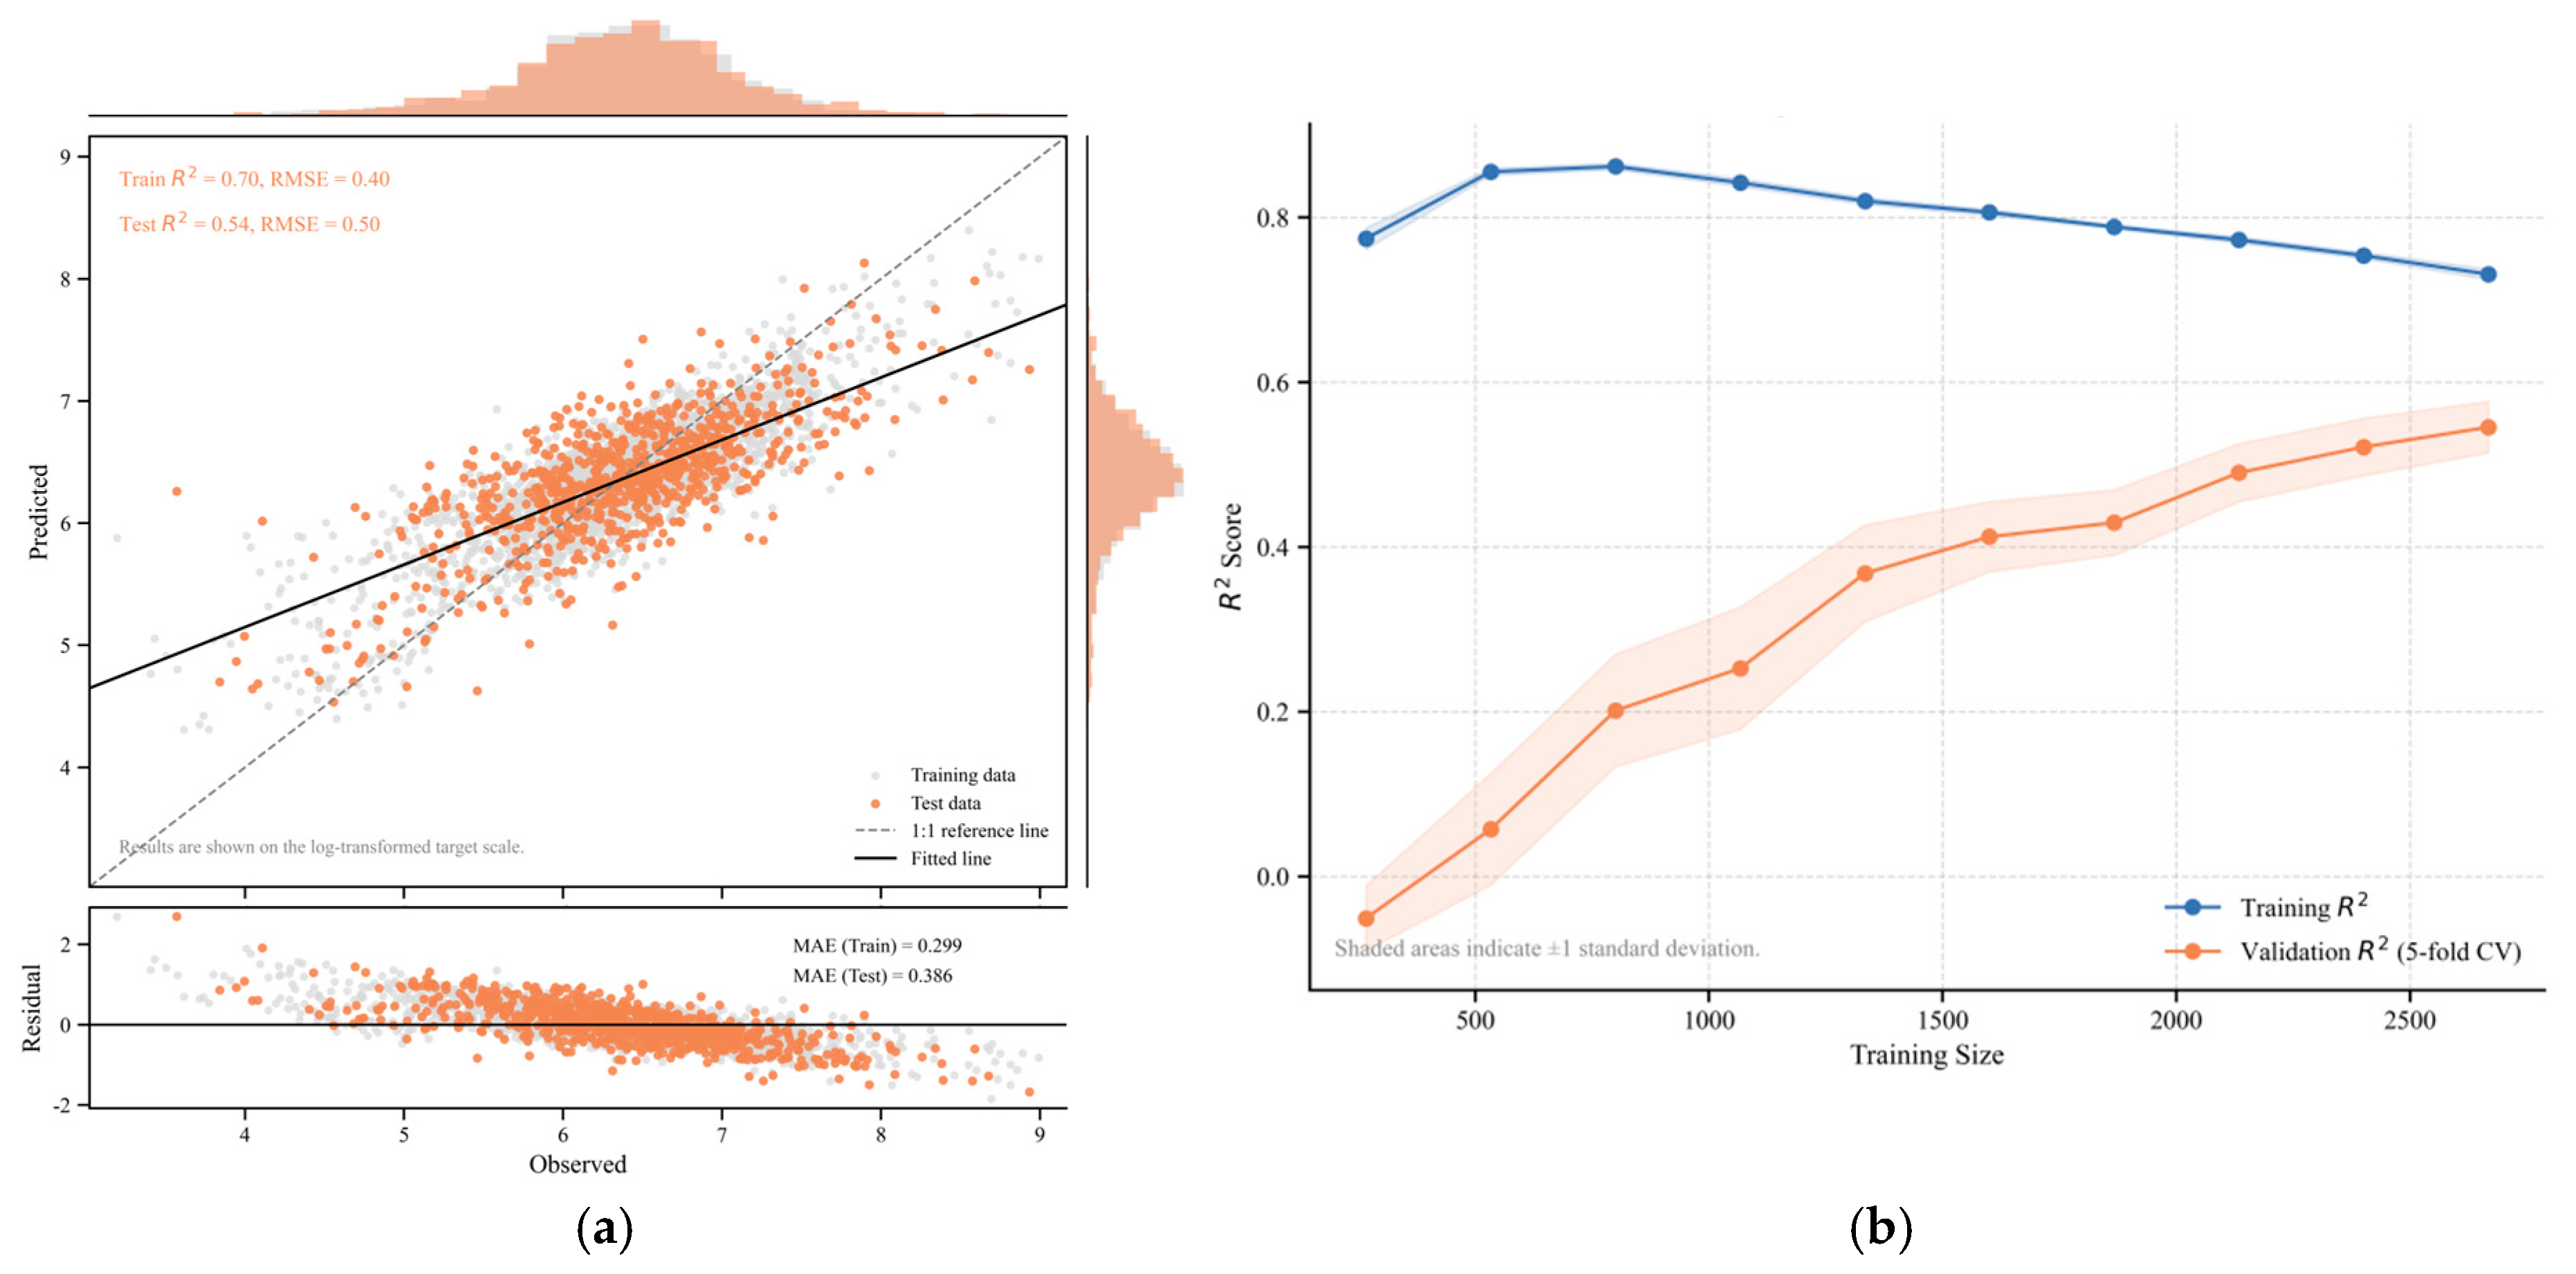
After selecting XGBoost as the optimal modeling framework, grid search was applied to optimize its hyperparameters. The final model consisted of 500 trees, with a learning rate of 0.05, a maximum tree depth of 3, a minimum child weight of 5, a node-splitting threshold (gamma) of 0.2, a subsample ratio of 0.7, and a feature-sampling ratio of 0.8. As shown in Figure 6, the optimized XGBoost model achieved a test-set R2 of approximately 0.54. Predicted values were generally distributed close to the 1:1 reference line, residuals were concentrated around zero, and the learning curve gradually stabilized as the training sample size increased. These results indicate satisfactory predictive performance and provide the basis for the subsequent SHAP-based analyses of variable importance, nonlinear response patterns, and interaction effects.
Figure 6.
Performance evaluation of the XGBoost model. (a) Predicted versus observed street vitality values and residual distribution; (b) learning curve of the XGBoost model.
The spatial robustness of the selected XGBoost model was subsequently assessed using an additional block-based spatial cross-validation approach. The simplified street network was converted into 726 road-enclosed urban block polygons, of which 568 contained at least one valid modeling sample. Each sampling point was assigned to its corresponding urban block, and the block ID was used as the grouping variable in 10-fold GroupKFold cross-validation. Consequently, observations from the same urban block were assigned to the same fold and were never divided between training and validation sets, allowing model performance to be evaluated across spatially separated urban contexts.
The predictor set and XGBoost specification were kept consistent with the main model. Under 10-fold urban-block spatial cross-validation, the model achieved a mean R2 of 0.446 ± 0.092, with an RMSE of 0.523 ± 0.062 and an MAE of 0.391 ± 0.045 on the log-transformed vitality scale. Compared with random cross-validation, spatially grouped validation produced more conservative estimates of predictive performance (mean R2 = 0.446 vs. 0.534). Nevertheless, the model retained a stable level of predictive ability across spatially separated urban blocks.
3.2. Importance Analysis of Influencing Factors
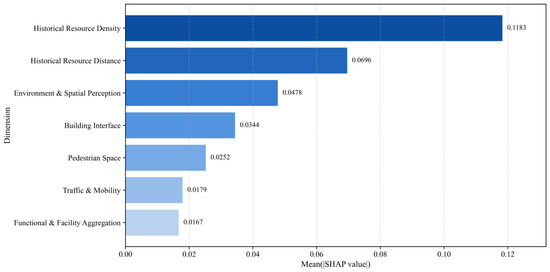
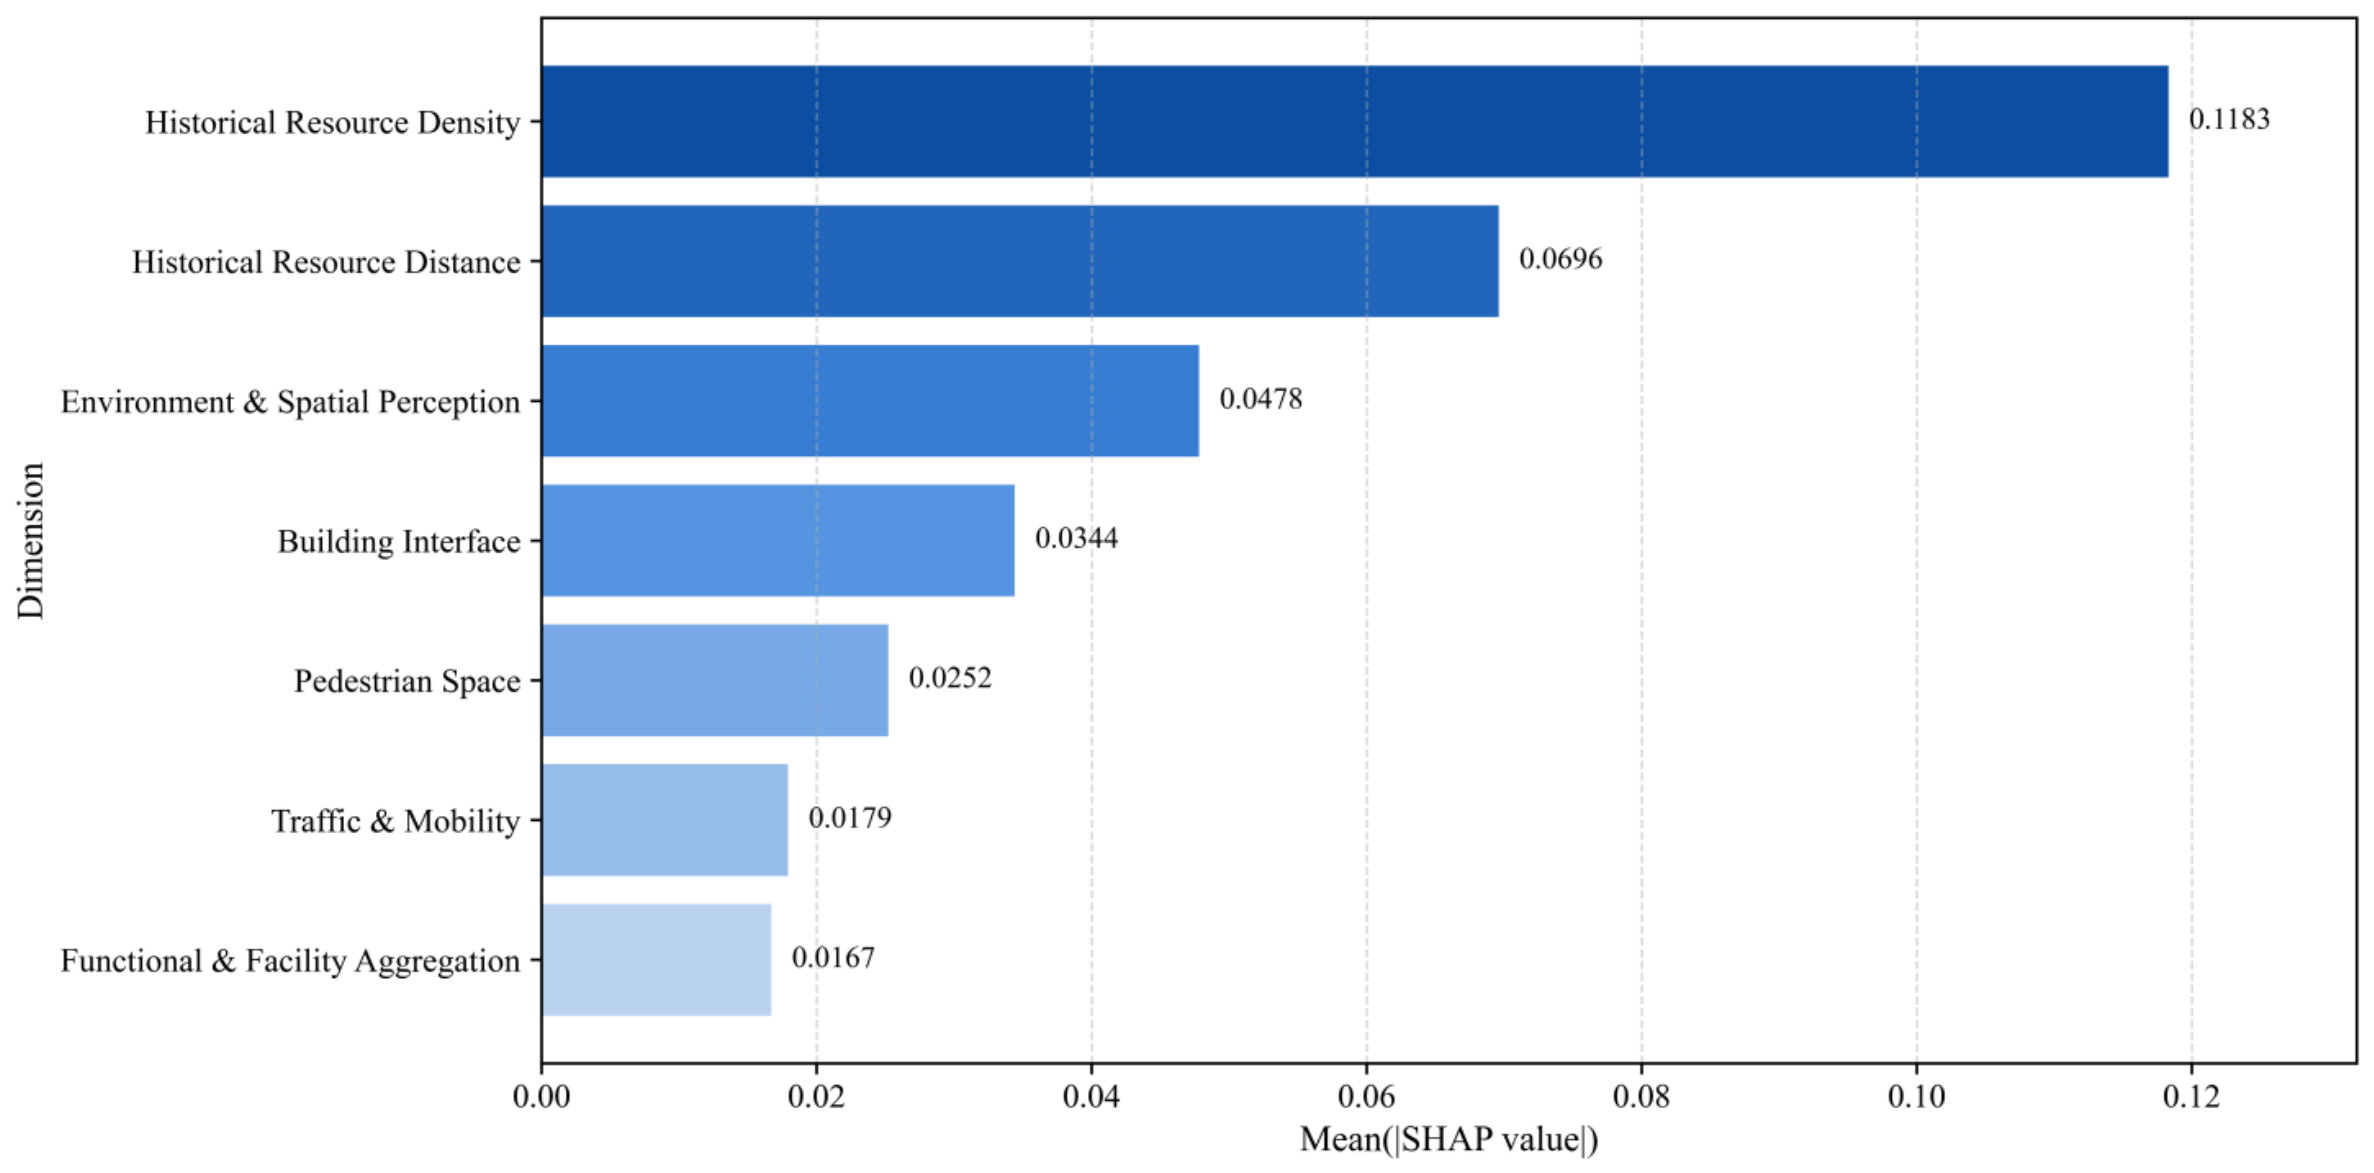
From the dimension aggregation results, the explanatory power of the historical resource-related dimensions on street vitality in the historical urban area is relatively higher than that of other dimensions. Among them, the historical resource distribution density dimension has the highest contribution (0.12), the historical-resource distance dimension (0.07), indicating that the spatial agglomeration degree and distance relationships of historical resources are the core factors affecting street vitality. Looking at specific variables, the density dimension is mainly composed of Dens_LH and Dens_HH, where Dens_LH has the highest mean absolute SHAP value (0.15), followed by Dens_HH (0.08); the distance dimension consists of Dist_HH and Dist_LH, with mean absolute SHAP values of 0.07 and 0.06 respectively, both ranking at the forefront. Overall, the historical and cultural-resource dimensions not only rank in the top two in the aggregated bar chart but also occupy a dominant position at the specific variable level.
In addition to HCRs, the environment and spatial perception dimension ranks third (0.05), with Vegetation and Sky contributing relatively higher, followed by VE, indicating that environmental perception variables generally have strong explanatory power. The architectural interface dimension (0.03) and the slow-traffic space dimension (0.03) are at moderate levels, the former primarily composed of Building and Billboard, and the latter mainly consisting of Pedestrian Area and Sidewalk. In contrast, the traffic and transit dimension (0.02) and the functional and facility agglomeration dimension (0.02) have the lowest contributions, with the overall importance of related variables ranking relatively low.
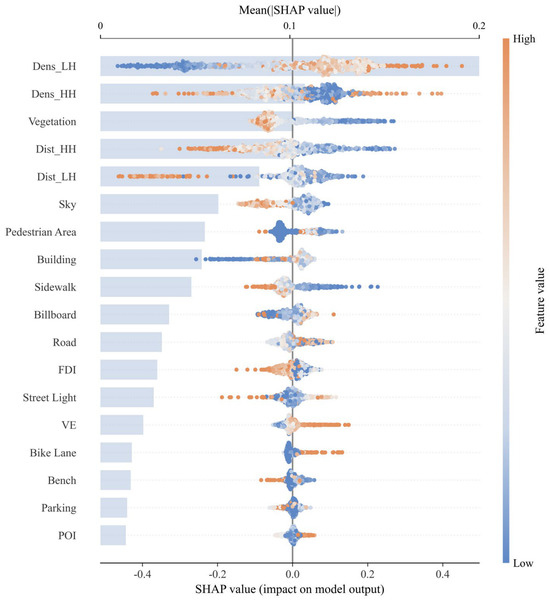
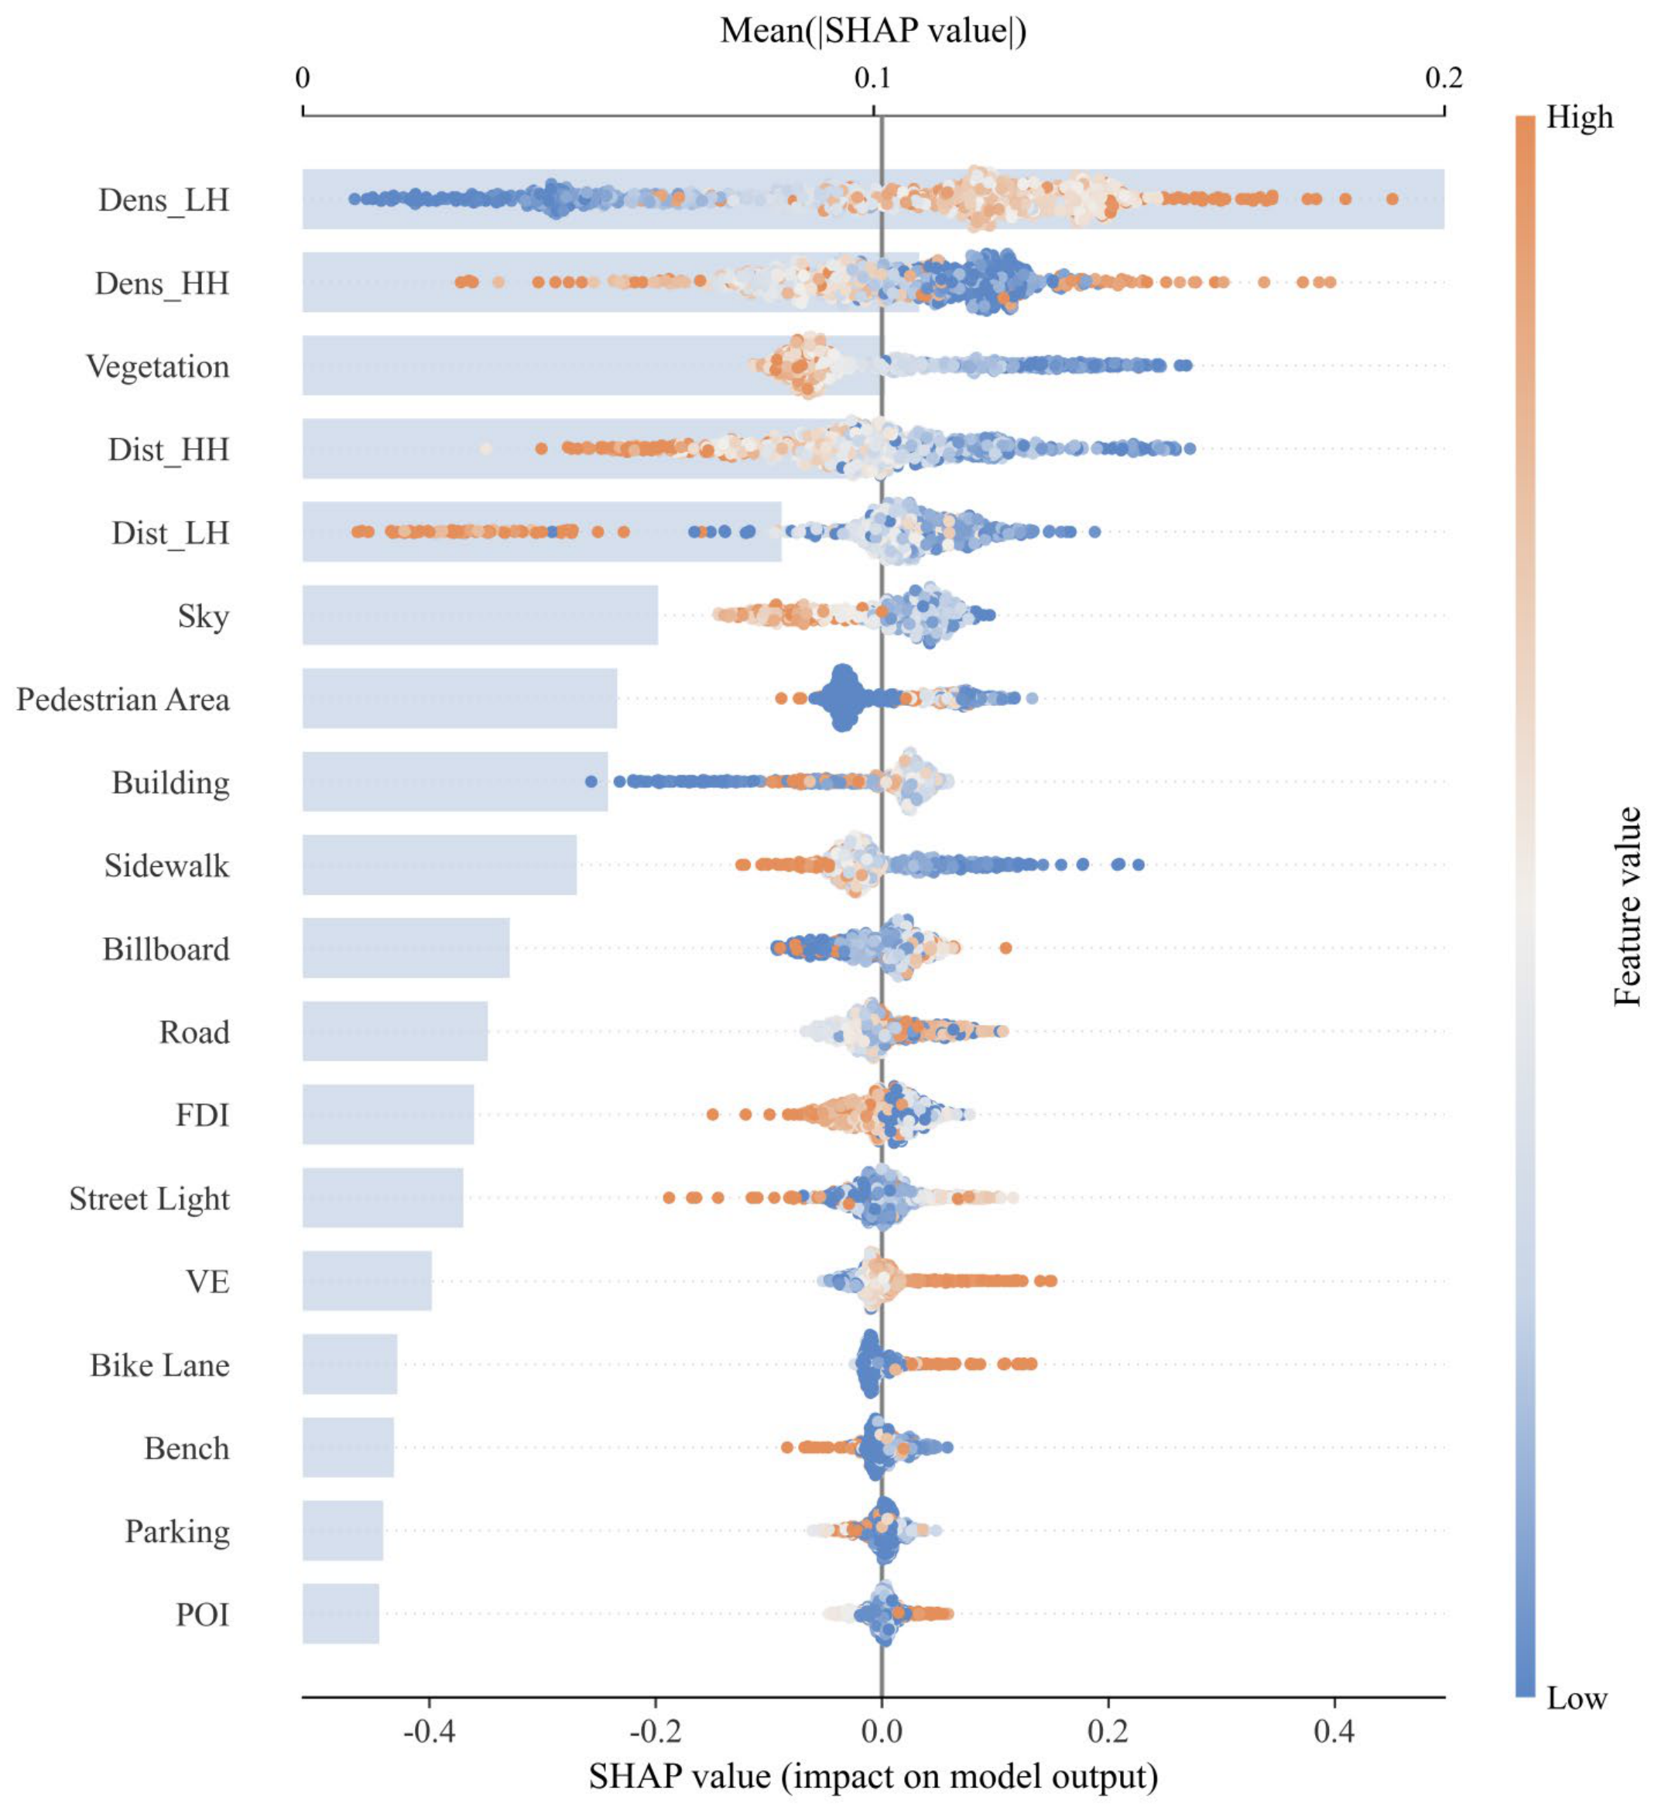
Overall, as shown in Figure 7 and Figure 8, the dimension aggregation results are highly consistent with the SHAP contribution ranking of specific variables: the distribution density and accessible distance of historical resources constitute the primary explanatory sources for street vitality in the historical urban area, while environment and spatial perception, architectural interfaces, and slow-traffic spaces play supplementary roles to a moderate degree, whereas the overall contributions of traffic and transit, and functional and facility agglomeration, are relatively limited. This demonstrates that street vitality in the historical urban area is primarily associated with HCRs and secondarily manifests as differences in streetscape environments and spatial interfaces.
Figure 7.
Aggregated SHAP importance of variables by dimension.
Figure 8.
SHAP summary plot.
At the specific variable level, the mean absolute SHAP value for Dens_LH is the highest (0.2), significantly higher than other variables; followed by Dens_HH (0.15), Vegetation (0.1), Dist_HH (0.08), and Dist_LH (0.06) sequentially. Based on the beeswarm plot, the high-value samples of Dens_LH are mainly distributed in the positive SHAP interval, while the low-value samples mostly fall on the negative side, illustrating that a higher density of low-tier HCRs usually corresponds to higher street vitality. In contrast, the point cluster distribution for Dens_HH is more dispersed, with high-value and low-value samples appearing simultaneously on both positive and negative sides, indicating that its effect exhibits stronger heterogeneity. Among the two distance variables, the high-value samples for Dist_HH and Dist_LH are more concentrated in the negative interval, while the low-value samples are mostly located on the positive side, showing that the farther away the HCRs are, the weaker their contribution to street vitality.
Apart from the historical and cultural-resource variables, Sky (0.05), Pedestrian Area (0.04), Building (0.04), and Sidewalk (0.04) are at a moderate contribution level. The beeswarm plot reveals that high-value samples of Vegetation and Sky are mostly located in the negative or near-zero intervals, indicating that these two variables do not have obvious promoting effects on street vitality at higher values. The beeswarm distribution for Pedestrian Area is relatively concentrated, with samples distributed in both positive and negative intervals, and the overall directionality is not obvious enough, showing only a certain trend of positive aggregation. The higher values of Building are mostly concentrated near zero or in slightly positive intervals, indicating that it provides a certain supporting role. At the same time, although the overall importance of VE (0.02) is not high, its high-value samples are clearly concentrated in the positive SHAP interval, implying that greater visual complexity can still bring a certain promoting effect. Billboard (0.03) also shows similar characteristics, with high-value samples distributed more on the positive side.
By comparison, the mean contributions of Road (0.02), FDI (0.02), Street Light (0.02), Bike Lane (0.01), Bench (0.01), Parking (0.01), and Dens_POI (0.01) are relatively low, with the beeswarm points of these variables mostly distributed around zero, illustrating that their average impact on the overall prediction results is limited.
3.3. Robustness Checks
3.3.1. Robustness to Alternative HCR Classifications
The classification-sensitivity analysis produced closely comparable model performance across the three schemes, with mean cross-validated R2 values ranging from 0.519 to 0.538 (Table 4).
Table 4.
Sensitivity of HCR importance and model performance to alternative classification schemes.
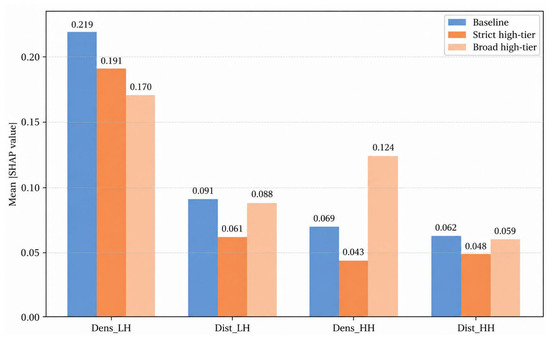
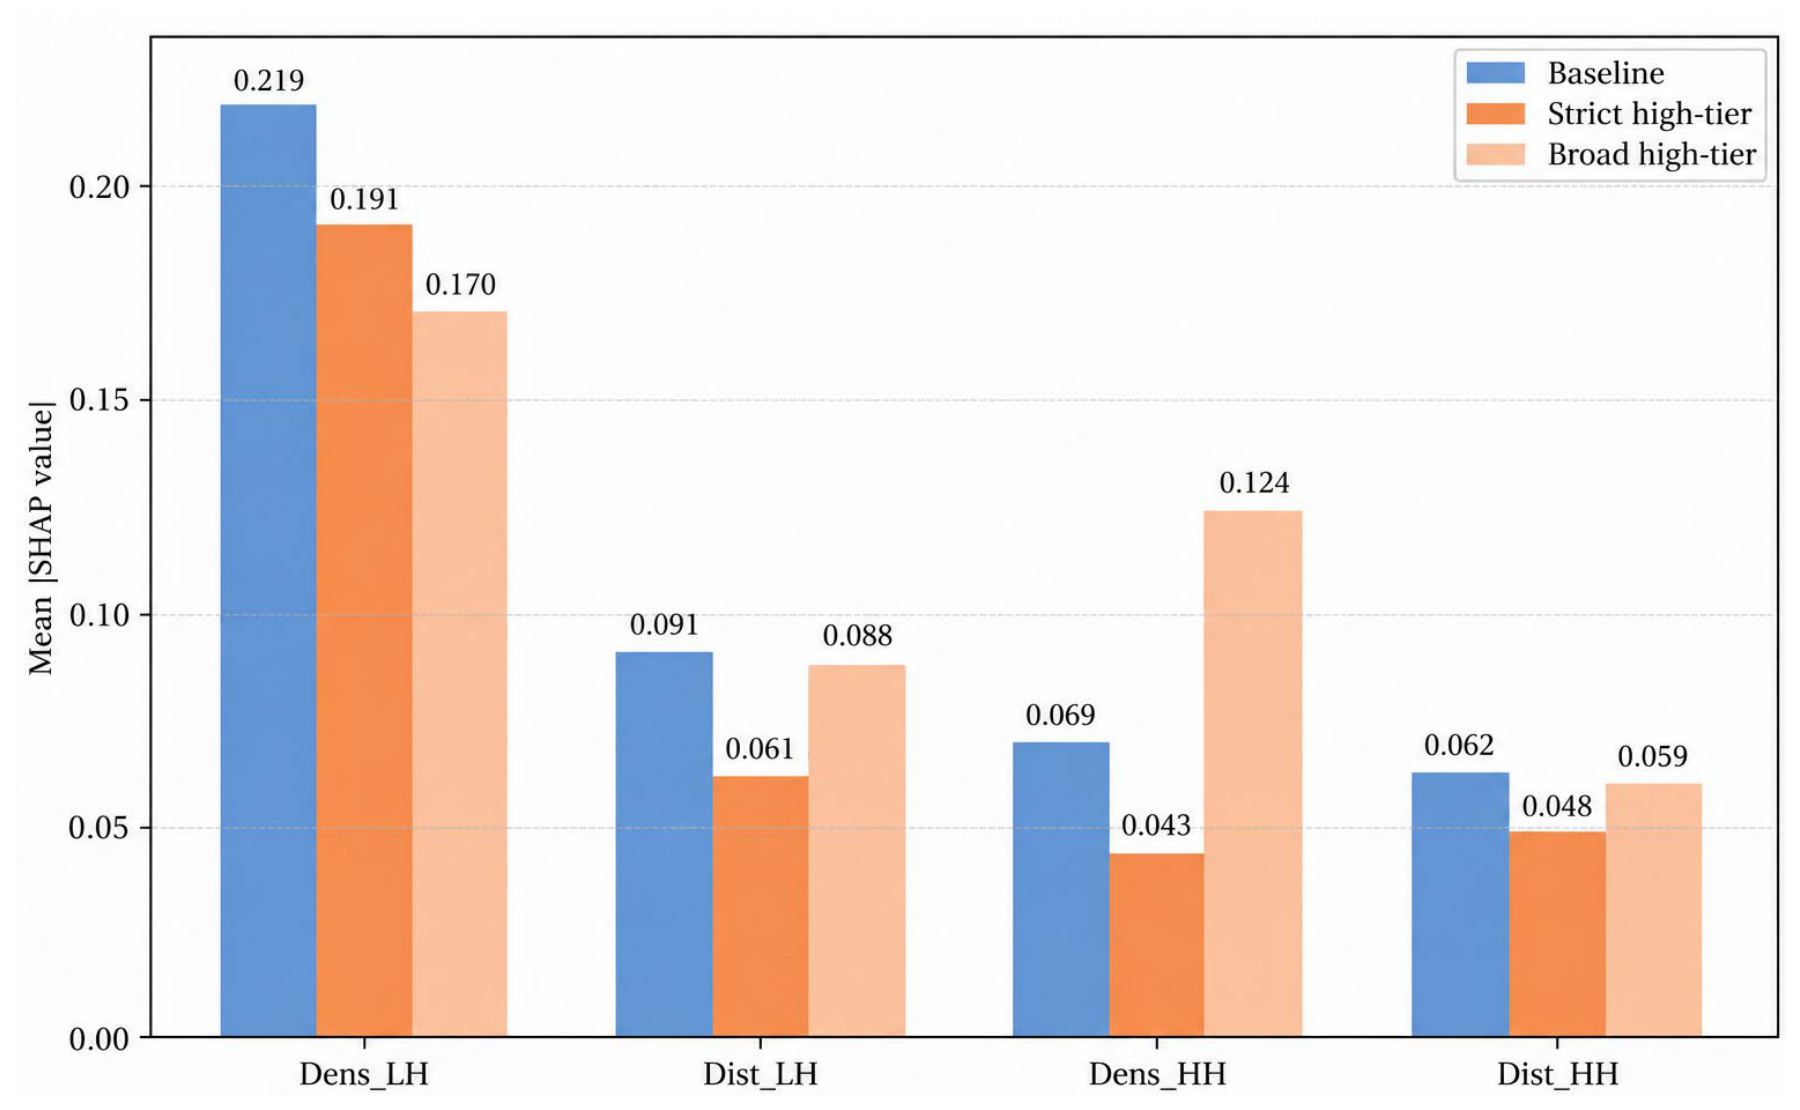
Dens_LH remained the highest-ranked substantive predictor in all three specifications. The relative importance of high-tier indicators was more sensitive to the cutoff: Dens_HH ranked 4th, 7th, and 2nd across the baseline, strict, and broad schemes, respectively, whereas Dist_HH ranked 5th in all three. These results support the robustness of the broader conclusion that HCR-related characteristics are prominent predictors of street vitality, while indicating that the exact magnitude and tier-specific interpretation of higher-tier effects should be treated cautiously (Figure 9).
Figure 9.
SHAP importance of HCR-related variables under alternative classification schemes.
3.3.2. Temporal Robustness of HCR-Related Associations
The date-specific models retained comparable predictive performance across the three temporal contexts. The mean cross-validated R2 values were 0.628 ± 0.052, 0.562 ± 0.061, and 0.601 ± 0.056 for the public-holiday, weekday, and weekend models, respectively (Table 5). The four HCR indicators consistently remained among the leading explanatory variables across temporal contexts. Specifically, Dens_HH ranked 1st, 1st, and 3rd; Dist_HH ranked 2nd, 2nd, and 1st; Dens_LH ranked 4th, 3rd, and 2nd; and Dist_LH ranked 6th, 4th, and 6th across the public-holiday, weekday, and weekend models, respectively. These results indicate that the overall importance of HCR-related characteristics is stable across different temporal contexts, although the relative importance of individual HCR indicators varies to some extent.
Table 5.
Date-specific XGBoost model performance and robustness of HCR importance.
3.4. SHAP Dependency Analysis of Key Variables
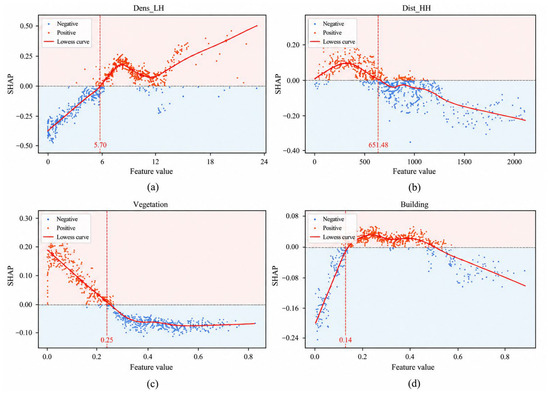
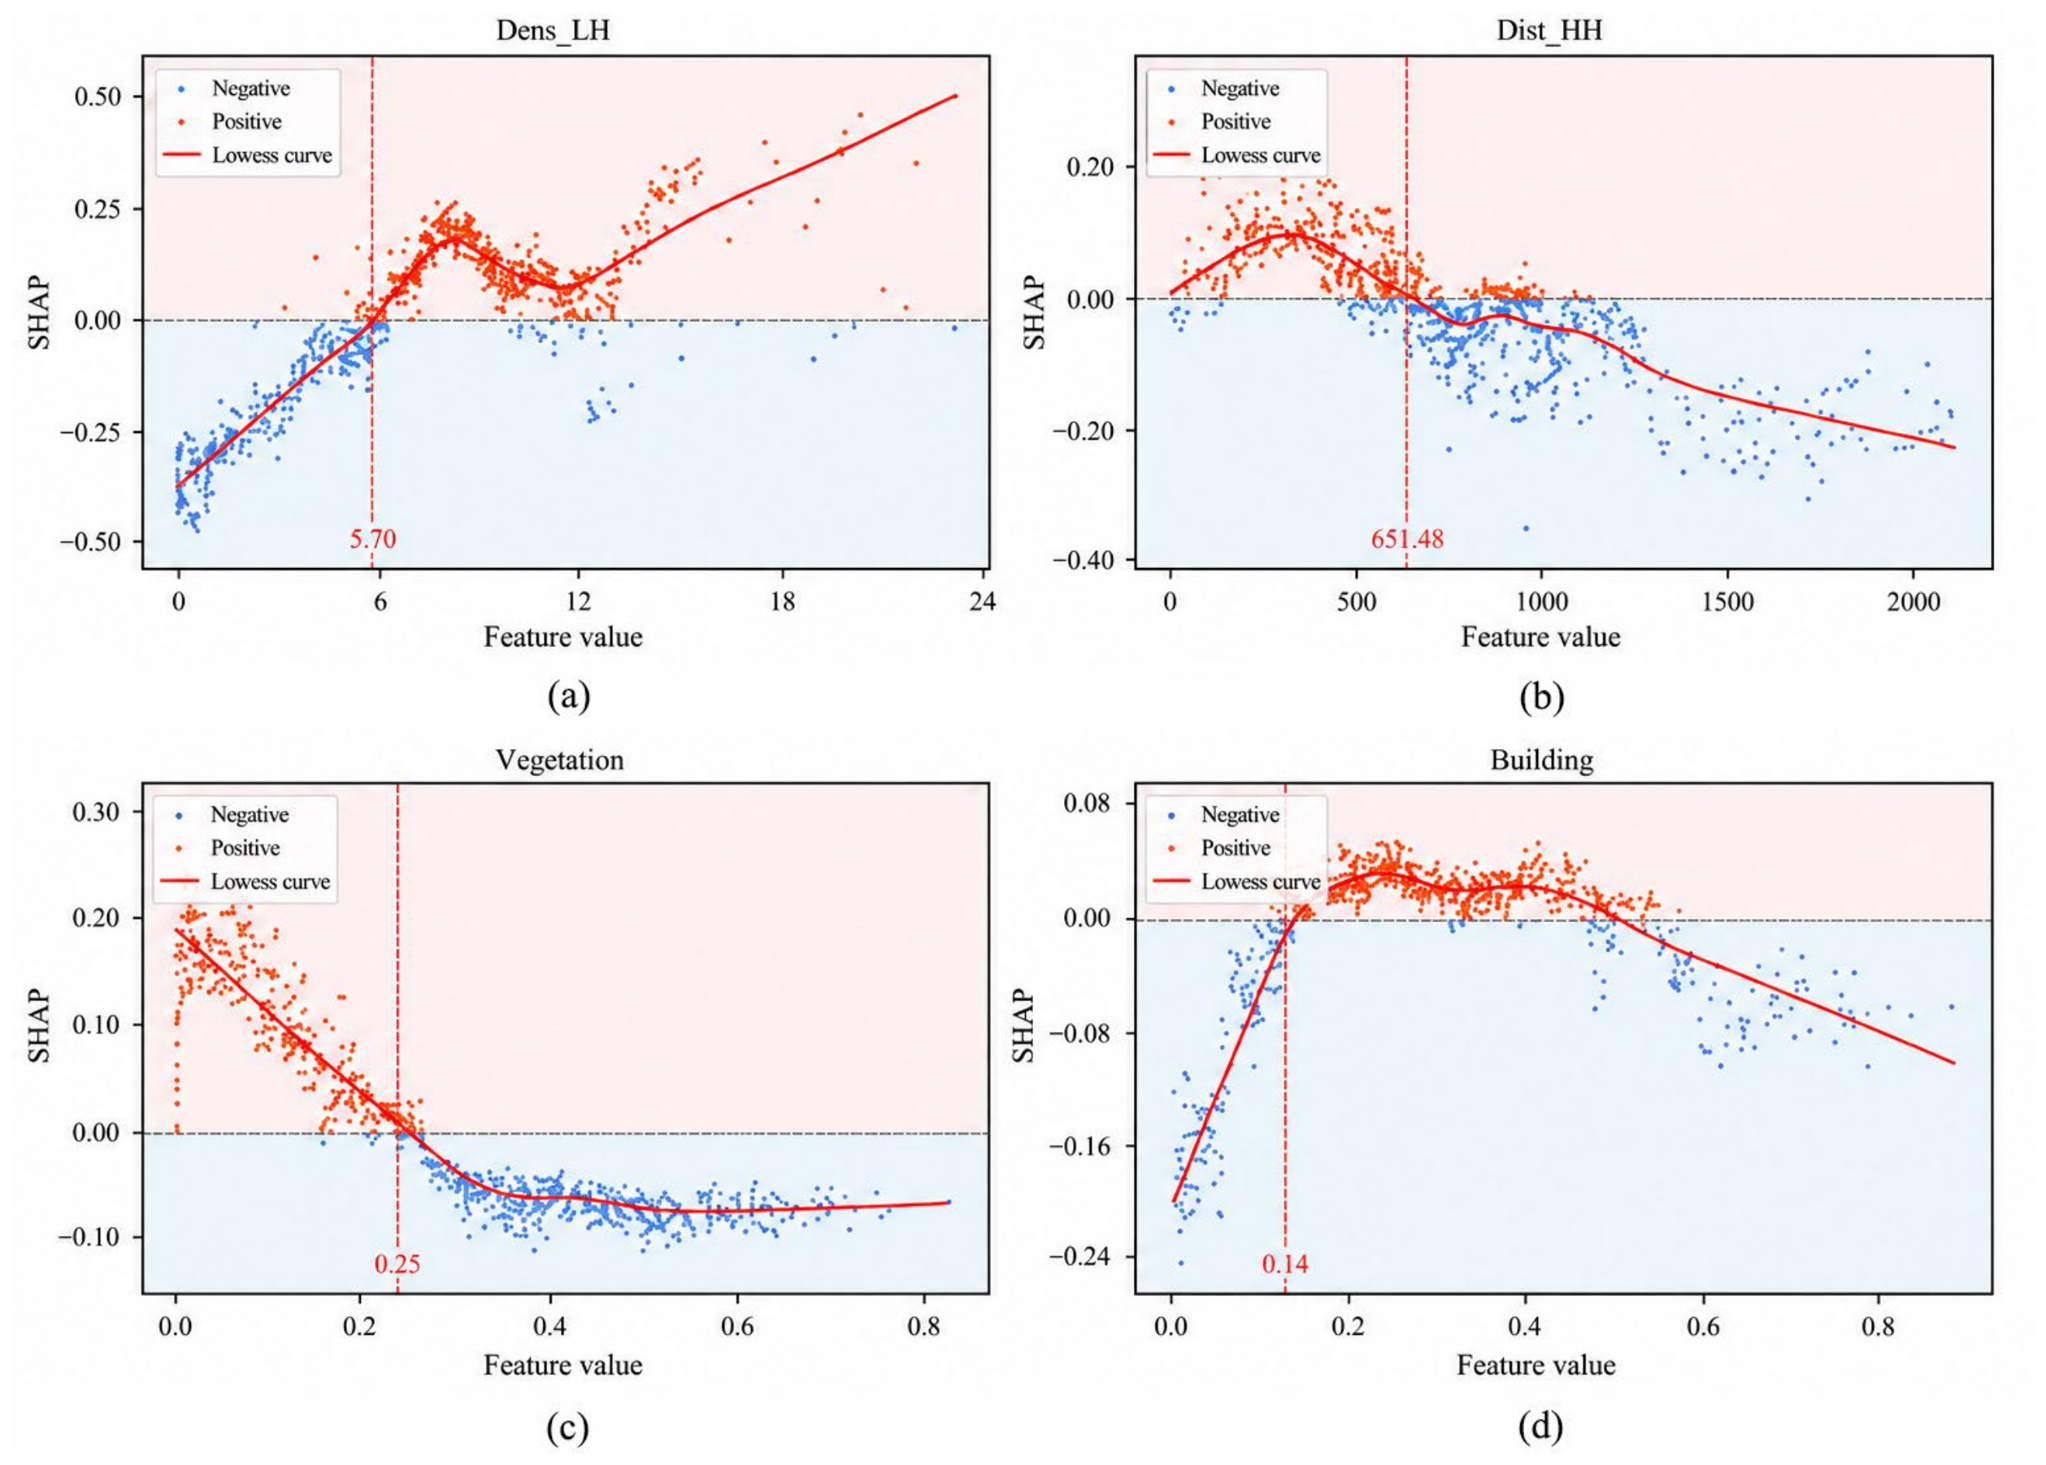
To highlight the action characteristics of key variables, as shown in Figure 8, this paper selects four variables with high SHAP contributions and obvious dependency relationships for SHAP dependency analysis, as shown in Figure 10. These variables exhibit clear nonlinear responses in different value intervals and hold strong explanatory value.
Figure 10.
SHAP dependence plots showing nonlinear effects of key variables. (a) Low-tier HCRs density; (b) distance to high-tier HCRs; (c) vegetation coverage; (d) building proportion.
Dens_LH presents an nonlinear response characteristic, with a threshold roughly located at about 5.7. Before the threshold, the SHAP value remains negative, indicating that in the lower density interval, the contribution of low-tier historical and cultural points to street vitality generally appears negative, but as density increases, this negative effect gradually weakens. After exceeding 5.7, the SHAP value rapidly jumps and turns positive, signifying that low-tier points begin to is associated with higher street vitality. Near 7.5–8, the curve reaches a local peak and then shows a certain decline, where the positive effect weakens somewhat, but subsequently the SHAP value rises again, demonstrating that low-tier points can still produce a strong positive driving role in high-density areas.
Dist_HH presents a clear threshold effect, with the threshold located at around 650 m. Before this threshold, the SHAP value generally remains above zero, indicating that street locations closer to high-tier HCRs tend to receive stronger vitality-supporting effects. However, once the distance exceeds this threshold, the SHAP value gradually decreases and turns negative, suggesting that when street locations are farther from high-tier HCRs, the vitality-supporting effect of these resources weakens noticeably. This process is relatively smooth and does not show abrupt changes.
Vegetation appears to show a nonlinear diminishing trend, with a threshold around 0.25. Before this threshold, the curve drops rapidly from a higher positive value to near zero, indicating that vegetation under low to moderate coverage has a certain promoting effect on street vitality, but its positive effect decays quickly. After exceeding 0.25, the curve swiftly enters the negative value zone and forms a low-tier plateau, suggesting that under high-coverage conditions, vegetation mainly exhibits a relatively stable slight negative effect on street vitality; combining this with the spatial characteristics of the Chengdu historical urban area, this might reflect that the visual comfort and micro-climate regulation provided by low to moderate vegetation coverage benefit street activities, whereas high-coverage areas may weaken positive impacts on street vitality due to obstructed sightlines or impeded traffic.
Building presents a distinct inverted “U”-shaped nonlinear response characteristic, with the threshold roughly at 0.14. Before this threshold, the SHAP value is mostly negative, and the curve rises rapidly from a lower position, indicating that in the interval of a low building proportion, the contribution of Building to street vitality is overall negative, but this negative effect will quickly weaken as the building proportion increases. Approaching 0.14, the curve crosses the zero line and turns positive, showing that after the building proportion reaches a certain level, it begins to exert a promoting effect on street vitality. In the middle interval of about 0.18–0.45, the curve as a whole remains above the zero line and forms a relatively flat positive plateau with only slight fluctuations, implying that under moderate building proportion conditions, Building makes a relatively stable positive contribution to street vitality. Thereafter, as the building proportion continues to increase, the curve drops back to around the zero line near 0.5 and subsequently continues to decline, entering the negative zone. Especially in the high-value intervals, the SHAP value gradually decreases, suggesting that excessively high building proportions weaken their promoting effect on street vitality. Overall, the impact of Building on street vitality exhibits a changing trend of “rapid initial rise—mid-stage positive plateau—continuous late-stage decline,” indicating that its effect is more likely to manifest within a moderate interval, rather than increasing monotonically with building proportion.
3.5. Interaction Analysis of Key Variables
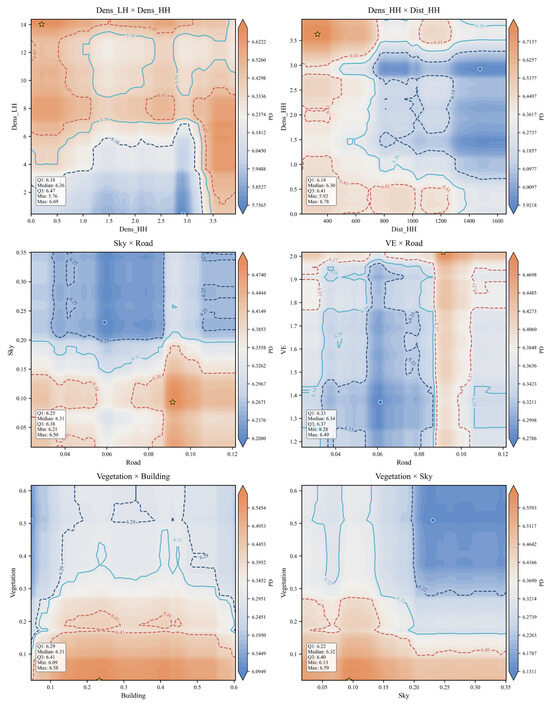
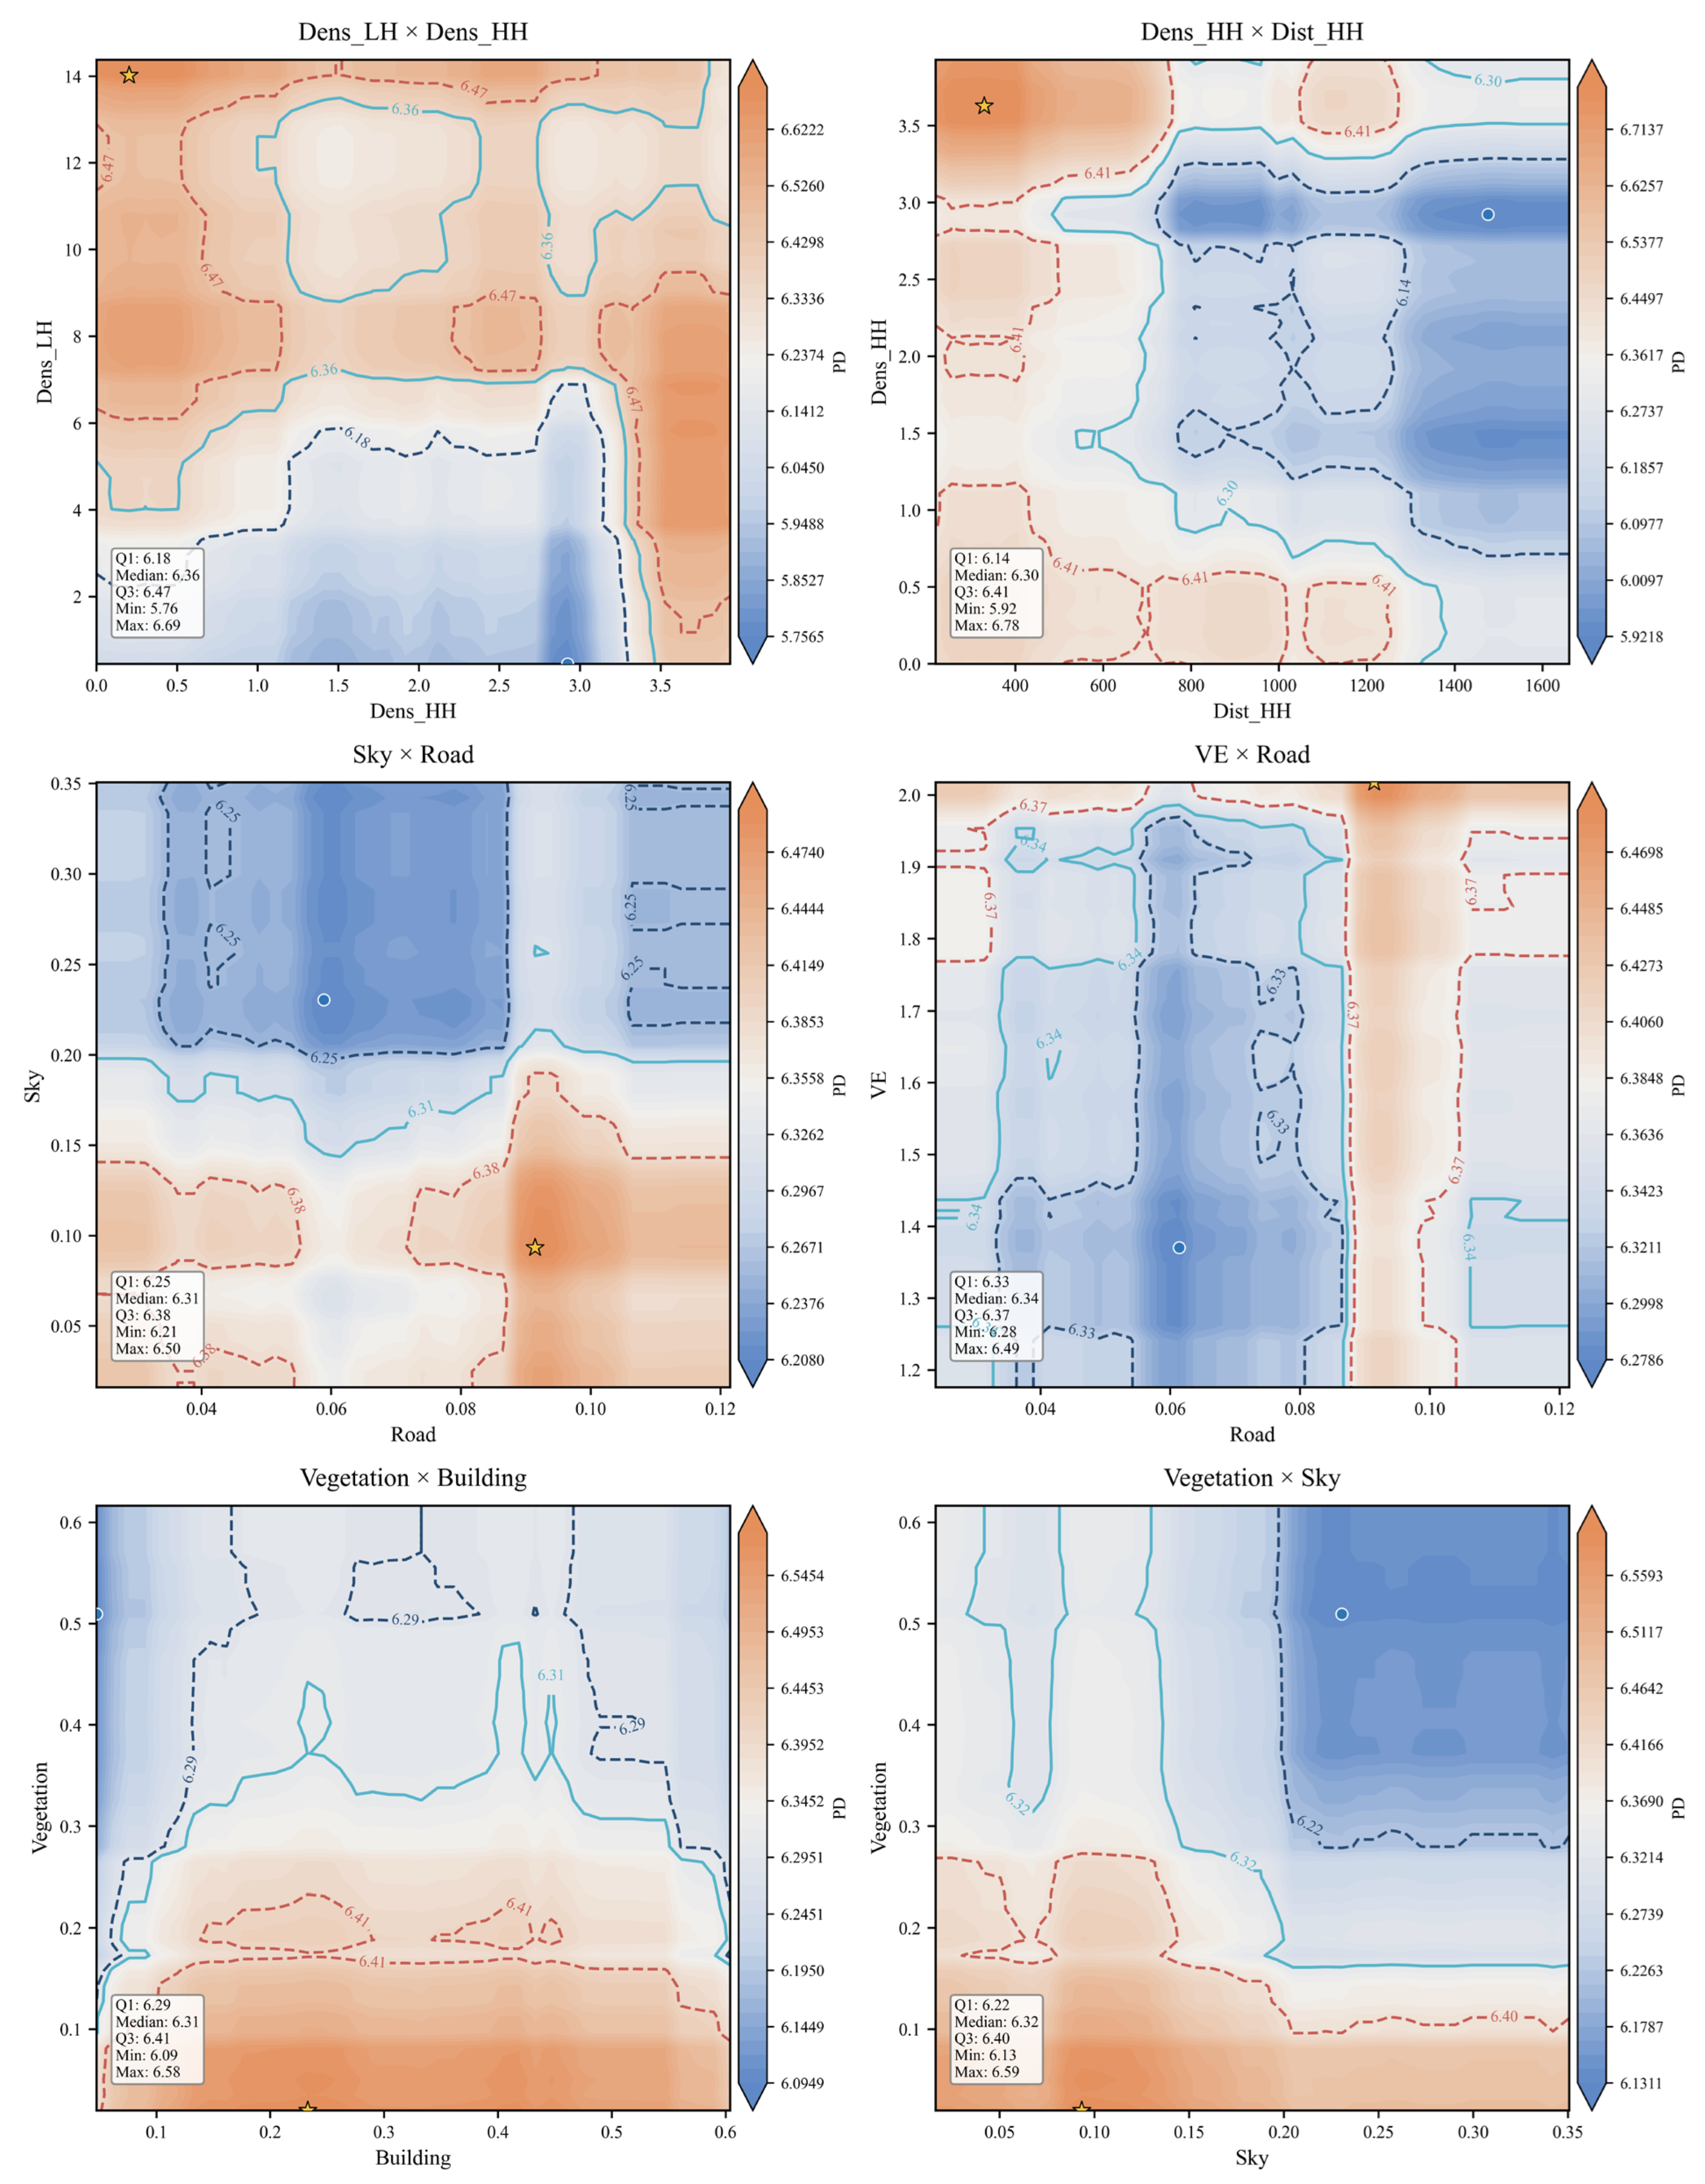
Bivariate Partial Dependence Plots (Bivariate PDPs) are used to examine how model-predicted street vitality changes under different combinations of two explanatory variables while averaging over the distribution of the remaining predictors [25]. This type of interpretation is increasingly used to inspect nonlinear and interaction patterns in built-environment models [39], as shown in Figure 11.
Figure 11.
Bivariate PDP for key variables.
In each plot, the two axes indicate the values of the selected variable pair, while the color surface represents the corresponding predicted vitality level. Based on these plots, this section explores the conditional response patterns among key variables. The bivariate PDP results suggest a joint nonlinear association between Dens_LH, Dens_HH, and street vitality in the historical urban area, with Dens_LH showing a relatively more stable positive contribution overall. When Dens_LH is below 5, street vitality is generally weak across most Dens_HH intervals; but when Dens_HH further rises above approximately 3.5, an obvious high-value area appears on the right side of the plot, illustrating that a higher density of high-tier historical and cultural points can, to some extent, compensate for the vitality disadvantage caused by the lack of low-tier points. When Dens_LH exceeds the range of 5–7, the plot mostly maintains a higher level, though it still exhibits certain local fluctuations with changes in Dens_HH. Overall, the continuous distribution of low-tier historical and cultural points constitutes the foundational support for street vitality, while the density of high-tier historical and cultural points possesses a strong conditionally reinforcing effect, and its enhancement effect is more evident especially when Dens_HH is at a high level. The results for Dens_HH × Dist_HH indicate a clear combined effect between the local density of high-tier HCRs and the distance from street locations to the nearest high-tier resource. When Dist_HH is relatively close, street vitality is overall higher, with the maximum value around 6.78; however, when Dist_HH increases above about 1400–1600, the plot entirely enters a low-value area, where regardless of the Dens_HH value, street vitality is generally weak, suggesting that excessively large spatial spacing between high-tier historical and cultural points significantly weakens their supporting effect on street vitality.
Sky × Road overall presents an oblique differentiation pattern increasing from top-left to bottom-right. Specifically, when Sky is at a high level and Road is low, the top-left area generally appears as a low-value zone; as Sky decreases and Road increases, street vitality gradually strengthens, forming a relatively clear high-value agglomeration in the bottom-right area, where when Road rises to about 0.09 and Sky is maintained at around 0.10, street vitality reaches its peak, approximately 6.50. By comparison, when Sky exceeds about 0.20, the upper half of the plot mostly transitions into a low-value zone, indicating that a higher degree of sky openness is overall detrimental to the maintenance of street vitality. VE × Road presents more obvious threshold-type features, and the effect of Road is stronger than that of VE. A continuous high-value band forms near a Road value of about 0.09 in the plot, where the maximum street vitality is approximately 6.49; whereas a relatively continuous low-value band appears in the Road interval of about 0.05–0.07. This indicates that reaching a certain threshold for the road proportion significantly boosts street vitality, but this enhancement is not linearly and continuously strengthened, instead being more effective within a specific interval. VE mainly plays a regulatory role, but when its value rises close to 2.0, this regulatory effect significantly strengthens and further promotes the enhancement of street vitality.
The combination of Vegetation × Building shows that the impact of Vegetation is more prominent. When vegetation coverage is at a low level, street vitality is overall high, with high values being more noticeable in the Building interval of about 0.2–0.4, peaking at around 6.58; whereas when vegetation coverage rises above 0.30, even if the building proportion changes, the overall vitality level tends to decline, indicating that street vitality in historic urban areas relies more on the spatial environment under conditions of low to moderate vegetation coverage, while architectural interfaces mainly play an auxiliary reinforcing role. The high-value areas of Vegetation × Sky are mainly distributed in regions with low vegetation coverage, appearing more prominently especially when Sky is at low to moderate levels, with a maximum value of about 6.59. As Vegetation increases, the overall vitality level on the plot gradually drops; when Vegetation rises above roughly 0.30 and Sky further increases above roughly 0.20, the top-right area obviously transitions into a low-value zone. This demonstrates that in historic urban areas, higher greening and openness are not necessarily better. The formation of street vitality requires a balance among greening, openness, and spatial enclosure. Excessive sky visibility and overly high vegetation coverage may jointly weaken the continuity and recognizability of street interfaces, transforming the space from a stayable and perceptible street into an overly open or interface-weakened space, thereby hindering the agglomeration of vitality.
4. Discussion
The results of the XGBoost model and SHAP aggregation analysis suggest that HCRs constitute the central explanatory dimension of street vitality in historic urban areas. Specifically, the density and accessibility of these resources show relatively higher explanatory power than the other dimensions, whereas environmental and spatial perception, architectural interfaces, and slow-traffic spaces mainly play supporting roles. Traffic and facility-agglomeration variables make comparatively limited direct contributions. These findings indicate that, within the present dataset and model, variation in street vitality is more strongly associated with the density and accessibility of HCRs than with general traffic convenience or facility agglomeration.
This finding does not contradict the established understanding that streetscape quality and mixed-use development can influence street vitality. Rather, it further suggests that, within the specific spatial context of historic urban areas, general built-environment factors do not always play a dominant role. Compared with studies focusing on ordinary urban streets or commercial districts, this study highlights the stronger explanatory role of the spatial concentration and accessibility of HCRs, indicating that street vitality in historic urban areas is closely related to how cultural resources are embedded in and organized within street spaces.
The SHAP dependence analysis further suggests that street vitality in historic urban areas is not fully explained by simple linear relationships, but instead presents certain threshold effects, diminishing marginal effects, and balanced interval characteristics. In terms of historical-resource variables, Dens_LH makes a relatively stable positive contribution, suggesting that widely distributed general HCRs may provide continuous everyday support for street vitality. Dist_HH reflects a distance-decay pattern: the contribution of high-tier historical resources tends to weaken when street locations are farther away from them, particularly after approximately 650 m. In terms of streetscape variables, Vegetation and Building show interval-dependent effects rather than monotonically increasing contributions. Excessive vegetation coverage may weaken visual accessibility and street-interface continuity, while building proportion is more beneficial within a moderate range. Although the overall importance of Visual Entropy (VE) is relatively low, samples with high VE values are partly distributed in the positive interval, suggesting that visual complexity may provide a localized supplementary contribution to street vitality. Overall, these results indicate that streetscape elements in historic urban areas should be understood through the logic of moderate configuration rather than simple unidirectional enhancement.
The bivariate PDP results further suggest that street vitality in historic urban areas may be shaped by conditional interactions among key variables. First, HCRs do not appear to exert simply additive effects. Instead, they show a relationship of foundational support and nodal reinforcement, in which continuously distributed general resources provide stable support, while high-tier historical resources strengthen vitality under specific spatial conditions. Second, the interaction between Dens_HH and Dist_HH indicates that the vitality-supporting effect of high-tier historical resources depends not only on their local agglomeration, but also on whether street locations maintain accessible spatial connections with these resources. Third, Road and Sky show a threshold-and-balance relationship, suggesting that road conditions may contribute to vitality under certain levels of spatial openness, while excessive openness may weaken this effect. Fourth, the interaction between VE and Road indicates that visual richness tends to exert a supplementary effect under specific road-environment conditions, rather than independently determining street vitality. Fifth, Vegetation, Building, and Sky jointly reflect a balancing relationship, suggesting that higher vitality is more likely to occur under coordinated combinations of moderate greening, moderate openness, and continuous architectural interfaces.
Building on existing research on street vitality, this study further clarifies the conditional relationship between HCRs and the streetscape environment. Previous studies have recognized the potential nonlinear and interactive effects among the built environment, functional facilities, and street vitality, but HCRs are often treated as contextual or locational factors. This study instead incorporates HCRs into the analytical framework as measurable variables characterized by density, hierarchy, and accessibility, thereby extending the explanation of street vitality formation in historic urban areas. This shift helps reveal why the vitality of historic urban areas is associated with heritage-resource distribution and its spatial coupling with everyday street activities alongside general built-environment conditions [40].
The reliability and generalizability of these findings were further considered from three complementary perspectives: classification schemes, temporal contexts, and spatial validation. The classification-sensitivity analysis indicates that formal protection hierarchy does not necessarily correspond to a simple gradient of contribution to street vitality. The consistently high importance of Dens_LH suggests that numerous local-scale resources may be closely associated with everyday activity patterns, while the relative importance of higher-tier HCR density varies across classification schemes. Therefore, formal heritage significance and empirical associations with street vitality should be considered related but distinct dimensions. Beyond classification uncertainty, the temporal robustness analysis further confirms the stability of HCR-related associations across different contexts. HCR-related variables remained among the leading predictors across the public-holiday, weekday, and weekend models, although the relative importance of individual indicators varied across temporal contexts. These results indicate that the overall explanatory role of the HCR dimension is not limited to a specific observation period. In addition to temporal variation, spatial robustness was further examined through block-based validation. Compared with random cross-validation, spatial validation produced more conservative estimates of predictive performance, while the overall feature-importance structure remained stable across validation settings. These results suggest that the identified importance of HCR-related predictors remains robust when spatial dependence is explicitly considered.
These findings also offer practical implications for the renewal and design optimization of streets in historic urban areas. First, compared with simply increasing commercial facilities or strengthening traffic efficiency, vitality-oriented renewal should consider the protection, activation, and spatial reconnection of HCRs as potential strategies associated with vitality patterns, especially general HCRs embedded in everyday street life. Second, streetscape optimization should avoid treating higher greening or stronger openness as inherently beneficial. Instead, vegetation coverage, sky visibility, road conditions, and architectural interfaces should be coordinated according to street scale and spatial context. Third, although roads, architectural interfaces, and environmental perception factors do not play a dominant role comparable to HCRs, they may exert context-dependent regulatory effects within suitable intervals. Therefore, renewal strategies for historic urban areas should emphasize fine-grained intervention, cultural-resource activation, and interval-based streetscape optimization rather than large-scale demolition or single-item facility additions.
Several limitations remain. First, street vitality was measured using Baidu heatmap data collected from three representative dates in October 2024. Although additional temporal robustness analyses across weekday, weekend, and public-holiday contexts confirmed the consistency of the main findings, longer-term and higher-frequency observations would provide further insights into temporal variations caused by weather conditions, seasonal changes, and temporary events. Second, this study incorporated multiple indicators capturing historical and cultural resources, built environments, urban functions, and spatial contexts. Nevertheless, additional contextual characteristics, such as transportation accessibility and population density, may provide further explanations for variations in street vitality. Their integration requires compatible fine-scale spatial datasets and is therefore suggested as an important direction for future research. Third, this study focuses on Chengdu’s historical urban area as an empirical case to explore the relationship between historical and cultural resources and street vitality. Although this case provides a representative context with rich heritage resources and active urban activities, differences in urban morphology, cultural backgrounds, heritage management systems, and planning contexts may lead to variations when applying the findings to other neighborhoods, cities, or countries. Future comparative studies across multiple urban contexts are encouraged to further examine the transferability of the proposed analytical framework. Finally, the interpretable machine learning framework used in this study identifies important variables, nonlinear relationships, and interaction patterns within the observed data structure. These findings should therefore be interpreted as empirical associations rather than strict causal effects, and future research combining longitudinal data or causal inference approaches may further examine the underlying mechanisms.
5. Conclusions
This study constructed an interpretable machine learning framework to examine the factors associated with street vitality in historic urban areas by integrating HCRs, streetscape environmental variables, functional and facility-agglomeration indicators, and spatial control variables. The findings suggest that the density and accessibility of HCRs constitute the main explanatory dimension associated with street vitality, while environmental and spatial perception, architectural interfaces, and slow-traffic spaces mainly play supplementary roles. The results further show that street vitality is shaped by nonlinear and interactive relationships among multiple factors rather than by isolated linear effects.
The main contribution of this study lies in extending existing street vitality frameworks by incorporating the spatial characteristics of HCRs and revealing their interactions with streetscape environments through interpretable machine learning approaches. These findings provide an empirical basis for coordinated decision-making regarding heritage conservation, streetscape improvement, and vitality-oriented renewal in historic urban areas.
Future research could proceed in three directions. First, the research scope could be expanded to historic urban areas across different regions, types, and preservation intensities, and cross-city comparisons could be conducted to test the stability of the identified relationships. Second, more continuous long-term monitoring data could be incorporated, together with weather conditions, festive events, and public transportation accessibility, to further analyze the dynamic evolution of street vitality and its response to external disturbances. Third, panel data before and after renewal projects could be collected where possible, and more rigorous causal identification methods could be used to control for spatial autocorrelation and potential endogeneity, so as to examine the direct and indirect effects of historical resource allocation and streetscape improvement on street vitality.
Author Contributions
Conceptualization, J.L.; methodology, J.L.; software, J.L.; formal analysis, J.L.; investigation, J.L. and Y.Z.; data curation, J.L. and Y.Z.; visualization, J.L.; writing—original draft preparation, J.L.; writing—review and editing, N.M. and Z.F.; supervision, N.M.; funding acquisition, N.M. All authors have read and agreed to the published version of the manuscript.
Funding
This work was supported by the Soft Science Project of the Sichuan Science and Technology Program, China under Grant No. 2021JDR0198.
Data Availability Statement
The data supporting the findings of this study were derived from OpenStreetMap, Baidu Maps, Amap, official planning documents, and the Mapillary Vistas dataset. Due to third-party platform restrictions, some raw data cannot be publicly redistributed. Processed data are available from the corresponding author upon reasonable request, subject to relevant data-use restrictions.
Acknowledgments
The authors acknowledge the support of the Department of Architecture, Chengdu University of Technology, and the providers of the open-source and publicly available data used in this research. The authors also thank colleagues who provided helpful comments and assistance during the study.
Conflicts of Interest
The authors declare no conflicts of interest. The funder had no role in the design of the study; in the collection, analyses, or interpretation of data; in the writing of the manuscript; or in the decision to publish the results.
References
- Gehl, J. Life Between Buildings: Using Public Space; Island Press: Washington, DC, USA, 2011. [Google Scholar]
- Liu, M.; Jiang, Y.; He, J. Quantitative Evaluation on Street Vitality: A Case Study of Zhoujiadu Community in Shanghai. Sustainability 2021, 13, 3027. [Google Scholar] [CrossRef] [Scilit]
- Long, Y.; Jiao, S.; Yu, Y.; Xiao, K. An analysis of spatial vitality distribution and formation mechanisms in historic urban areas based on multi-source big data: A case study of Changsha. Front. Archit. Res. 2025, 14, 1727–1749. [Google Scholar] [CrossRef] [Scilit]
- Liu, F.; Lu, Y.; Hu, J.; Chen, L. Spatiotemporal Effects and Nonlinear Characteristics of Mechanisms Driving Street Vitality in Historic Districts: A Multi-Source Data-Driven Approach. Buildings 2026, 16, 2056. [Google Scholar] [CrossRef] [Scilit]
- Wang, X.; Lin, Z.; Xie, M.; Dai, F. Spatial Association of Building Network Connectivity and Vitality in Urban Historic Districts: A Case Study of Changsha. Buildings 2026, 16, 2158. [Google Scholar] [CrossRef] [Scilit]
- Hillier, B. A theory of the city as object: Or, how spatial laws mediate the social construction of urban space. Urban Des. Int. 2002, 7, 153–179. [Google Scholar] [CrossRef] [Scilit]
- Lv, G.; Zheng, S.; Hu, W. Exploring the relationship between the built environment and block vitality based on multi-source big data: An analysis in Shenzhen, China. Geomat. Nat. Hazards Risk 2022, 13, 1593–1613. [Google Scholar] [CrossRef] [Scilit]
- Li, M.; Pan, J. Assessment of Influence Mechanisms of Built Environment on Street Vitality Using Multisource Spatial Data: A Case Study in Qingdao, China. Sustainability 2023, 15, 1518. [Google Scholar] [CrossRef] [Scilit]
- Long, Y.; Zhou, Y. Quantitative evaluation of street vitality and analysis of its influencing factors: A case study of Chengdu. New Archit. 2016, 1, 52–57. (In Chinese) [Google Scholar]
- Sagl, G.; Resch, B.; Hawelka, B.; Beinat, E. From Social Sensor Data to Collective Human Behaviour Patterns: Analysing and Visualising Spatio-Temporal Dynamics in Urban Environments. In Proceedings of the GI-Forum; Herbert Wichmann Verlag: Berlin, Germany, 2012; pp. 54–63. [Google Scholar]
- Lynch, K. The Image of the City; MIT Press: Cambridge, MA, USA, 1960. [Google Scholar]
- Li, X.; Pang, C. A Spatial Visual Quality Evaluation Method for an Urban Commercial Pedestrian Street Based on Streetscape Images—Taking Tianjin Binjiang Road as an Example. Sustainability 2024, 16, 1139. [Google Scholar] [CrossRef] [Scilit]
- Zhang, G.; Huang, Z. LightGBM–SHAP-Based Study of the Threshold and Synergistic Effects of Physical and Perceptual Scene Elements on Spatial Vitality in Historic Cultural Districts. Sustainability 2026, 18, 2778. [Google Scholar] [CrossRef] [Scilit]
- Wang, Z.; Gao, Y.; Wei, X.; Lyu, C.; Li, L. Beyond Homogenization: Spatio-Temporal Dynamics of Urban Vitality and the Nonlinear Role of Built Environment in Shenyang’s Historic Urban Area. Land 2026, 15, 431. [Google Scholar] [CrossRef] [Scilit]
- Han, C.; Zhang, Z. Nonlinear effects of built environment perception and objective features on street vitality in historic districts. Front. Archit. Res. 2026, 15, 1075–1091. [Google Scholar] [CrossRef] [Scilit]
- Xu, Z.; Yang, R.; Jia, X.; Wang, X.; Qian, H.; Yao, Y. Study on the Impact of Built Environment on Street Vitality: A Case Study of the Historical Urban Area of Suzhou. Front. Archit. Res. 2026, in press. [Google Scholar] [CrossRef] [Scilit]
- Chengdu Municipal Bureau of Planning and Natural Resources. Chengdu Historical and Cultural City Protection Plan (2019–2035). 2021. Available online: https://mpnr.chengdu.gov.cn/ghhzrzyj/zxghgb/2021-12/24/content_e0aa8a08025d482989c7f590fb59288f.shtml (accessed on 19 August 2026).
- Lian, A.; Zhang, Y.; Cai, Y.; Wang, Z.; Sun, X.; Jiao, Y.; Dong, R. Exploring the nonlinear relationship and interaction effects between the built environment and street vitality using machine learning methods. Ecol. Front. 2026, 46, 932–946. [Google Scholar] [CrossRef] [Scilit]
- Dong, G.; Yan, Y.; Shen, C.; Wang, H. Real-time high-performance semantic image segmentation of urban street scenes. IEEE Trans. Intell. Transp. Syst. 2021, 22, 3258–3274. [Google Scholar] [CrossRef] [Scilit]
- Li, Y.; Yabuki, N.; Fukuda, T. Exploring the association between street built environment and street vitality using deep learning methods. Sustain. Cities Soc. 2022, 79, 103656. [Google Scholar] [CrossRef] [Scilit]
- Ma, Z. Deep exploration of street view features for identifying urban vitality: A case study of Qingdao city. Int. J. Appl. Earth Obs. Geoinf. 2023, 123, 103476. [Google Scholar] [CrossRef] [Scilit]
- Nagata, S.; Nakaya, T.; Hanibuchi, T.; Amagasa, S.; Kikuchi, H.; Inoue, S. Objective scoring of streetscape walkability related to leisure walking: Statistical modeling approach with semantic segmentation of Google Street View images. Health Place 2020, 66, 102428. [Google Scholar] [CrossRef] [Scilit] [PubMed]
- Chen, T.; Guestrin, C. XGBoost: A scalable tree boosting system. In Proceedings of the 22nd ACM SIGKDD International Conference on Knowledge Discovery and Data Mining (KDD ’16), San Francisco, CA, USA, 13–17 August 2016; Association for Computing Machinery: New York, NY, USA, 2016; pp. 785–794. [Google Scholar] [CrossRef] [Scilit]
- Lundberg, S.M.; Lee, S.-I. A Unified Approach to Interpreting Model Predictions. In Advances in Neural Information Processing Systems 30 (NeurIPS 2017); Curran Associates, Inc.: Red Hook, NY, USA, 2017; pp. 4765–4774. [Google Scholar]
- Friedman, J.H. Greedy Function Approximation: A Gradient Boosting Machine. Ann. Stat. 2001, 29, 1189–1232. [Google Scholar] [CrossRef] [Scilit]
- Wang, M.; Li, Y.; Yuan, H.; Zhou, S.; Wang, Y.; Ikram, R.M.A.; Li, J. An XGBoost-SHAP approach to quantifying morphological impact on urban flooding susceptibility. Ecol. Indic. 2023, 156, 111137. [Google Scholar] [CrossRef] [Scilit]
- Zhang, X.; Liu, L.; Lan, M.; Song, G.; Xiao, L.; Chen, J. Interpretable machine learning models for crime prediction. Comput. Environ. Urban Syst. 2022, 94, 101789. [Google Scholar] [CrossRef] [Scilit]
- Li, Z. Extracting spatial effects from machine learning model using local interpretation method: An example of SHAP and XGBoost. Comput. Environ. Urban Syst. 2022, 96, 101845. [Google Scholar] [CrossRef] [Scilit]
- Shao, J.; Long, Y.; Liu, X.; Zheng, Y.; Song, Y.; Wang, J.; Liu, B.; Yang, J.; Chen, Y.; Zhang, F. Machine Learning-Based Study on Factors Influencing Street Vitality in Urban Fringe Commercial Districts: A Case of Wuhan. Front. Archit. Res. 2026, 15, 582–608. [Google Scholar] [CrossRef] [Scilit]
- Chengdu Municipal People’s Government. Chengdu Overview: Historical Evolution. Available online: https://www.chengdu.gov.cn/cdsrmzf/c169546/zjcd.shtml (accessed on 19 August 2026).
- Biljecki, F.; Ito, K. Street view imagery in urban analytics and GIS: A review. Landsc. Urban Plan. 2021, 215, 104217. [Google Scholar] [CrossRef] [Scilit]
- Hua, C.; Lv, W.; Zhang, Y. Spatiotemporal Coupling Analysis of Street Vitality and Built Environment: A Multisource Data-Driven Dynamic Assessment Model. Sustainability 2025, 17, 9517. [Google Scholar] [CrossRef] [Scilit]
- Wang, Y.; Wang, Y.; Liu, Z.; Liu, C. Research on Spatial Characteristics and Influencing Factors of Urban Vitality at Multiple Scales Based on Multi-Source Data: A Case Study of Qingdao. Appl. Sci. 2025, 15, 8767. [Google Scholar] [CrossRef] [Scilit]
- Cheng, B.; Misra, I.; Schwing, A.G.; Kirillov, A.; Girdhar, R. Masked-Attention Mask Transformer for Universal Image Segmentation. In Proceedings of the 2022 IEEE/CVF Conference on Computer Vision and Pattern Recognition (CVPR); IEEE: New York, NY, USA, 2022; pp. 1280–1289. [Google Scholar] [CrossRef] [Scilit]
- Neuhold, G.; Ollmann, T.; Rota Bulò, S.; Kontschieder, P. The Mapillary Vistas Dataset for Semantic Understanding of Street Scenes. In Proceedings of the 2017 IEEE International Conference on Computer Vision (ICCV), Venice, Italy, 22–29 October 2017; IEEE: New York, NY, USA, 2017; pp. 5000–5009. [Google Scholar] [CrossRef] [Scilit]
- Zhang, J.; Fan, W.; Zhu, L. Visual Evaluation of Urban Street Landscape Based on Streetscape Data: A Case Study of the Main Urban Area of Fuzhou. J. Heilongjiang Vocat. Inst. Ecol. Eng. 2022, 35, 19–23. (In Chinese) [Google Scholar]
- Hou, Y.; Zhang, X.; Jia, J. Capturing the Footsteps of Mobility: A Machine Learning-Based Study on the Relationship Between Streetscape and Consumption Vitality. ISPRS Int. J. Geo-Inf. 2025, 14, 422. [Google Scholar] [CrossRef] [Scilit]
- He, S.; Zhang, Z.; Yu, S.; Xia, C.; Tung, C.-L. Investigating the effects of urban morphology on vitality of community life circles using machine learning and geospatial approaches. Appl. Geogr. 2024, 167, 103287. [Google Scholar] [CrossRef] [Scilit]
- Wang, X.; Zhang, Y.; Li, C.; Yin, C.; Shao, C. Investigating nonlinear and spatially heterogeneous impacts of the built environment on urban vitality. Sustain. Cities Soc. 2025, 135, 107033. [Google Scholar] [CrossRef] [Scilit]
- Long, Y.; Hu, S.; Lu, Z.; Cheng, L.; Zhen, C.; Shao, J.; Zheng, Y.; Zhou, X.; Li, J.; Lin, Y.; et al. A Study on the Influence Mechanisms of Neighborhood Vitality and the Characteristics of Spatial and Temporal Differentiation in the Urban Fringe Areas of Wuhan City. Land 2024, 13, 1771. [Google Scholar] [CrossRef] [Scilit]

Disclaimer/Publisher’s Note: The statements, opinions and data contained in all publications are solely those of the individual author(s) and contributor(s) and not of MDPI and/or the editor(s). MDPI and/or the editor(s) disclaim responsibility for any injury to people or property resulting from any ideas, methods, instructions or products referred to in the content. |
© 2026 by the authors. Licensee MDPI, Basel, Switzerland. This article is an open access article distributed under the terms and conditions of the Creative Commons Attribution (CC BY) license.