


Abstract
Human factors remain a leading cause of occupational accidents and fatalities in the construction industry. Although human factors are a major contributor to construction accidents, their relative impact across different construction subsectors has not been fully quantified. This study presents a comparative analysis of accident and fatality data from the U.S. Occupational Safety and Health Administration (OSHA) for three major construction subsectors, NAICS 236 (Construction of Buildings), 237 (Heavy and Civil Engineering Construction), and 238 (Specialty Trade Contractors) from January 2010 through June 2025. Seventy human-factor-related keywords were categorized into eight categories, and accident counts, fatality counts, and fatality rates, defined as the proportion of investigated cases that were fatal, were computed. Twenty-four high-frequency keywords (≥60 investigated accidents) were further analyzed across the three subsectors. Descriptive methods, including risk matrices, Pareto analysis, and category-level fatality rate comparisons, were applied to identify the factors contributing most to fatalities. Differences between subsectors were tested using permutation-based chi-square tests with Benjamini–Hochberg correction for multiple comparisons. Results indicate substantial variation in both frequency and severity among keywords. At the category level, cognitive or perceptual errors, procedural violations and unsafe acts, and judgment and awareness failures in equipment use showed significantly higher fatality proportions in Heavy and Civil Engineering Construction than in the other two subsectors, whereas at the keyword level only lost balance and inattention differed significantly once the correction was applied. The findings provide a data-driven basis for prioritizing targeted safety interventions and tailoring human factor mitigation strategies to subsector-specific risks.
1. Introduction
The construction industry consistently ranks among the most hazardous sectors in the United States, accounting for a substantial share of occupational injuries and fatalities each year. According to the U.S. Bureau of Labor Statistics, of the 5070 fatal work injuries recorded nationally in 2024, 1032 involved construction and extraction workers, which is approximately 20% of all workplace fatalities, despite these occupations representing a much smaller proportion of the workforce [1,2]. Falls, slips, and trips alone accounted for 370 of these deaths, and the fatal injury rate for construction and extraction occupations, at 12.9 per 100,000 full-time equivalent workers in 2023, is roughly four times the corresponding all-occupation rate of 3.5 [2]. The nature of construction work, which is dynamic, complex, and often performed in challenging environments, creates numerous conditions for incidents to occur. While environmental hazards, equipment failures, and structural deficiencies are often emphasized, a growing body of research highlights the critical role of human factors in both accident causation and severity. Human factors encompass a broad spectrum of elements, including worker training, cognitive decision making, physical condition, communication, procedural adherence, and ergonomic limitations. These factors are not isolated; they interact with environmental and organizational conditions to influence risk. A lapse in communication, for example, can exacerbate the consequences of equipment misuse, while inexperience can increase vulnerability to hazards even when technical safeguards are in place. Identifying and quantifying the impact of these human factors is therefore essential to designing effective prevention strategies.
The U.S. Occupational Safety and Health Administration (OSHA) maintains one of the most comprehensive publicly available accident databases in the country. Each reported case includes structured fields such as NAICS code, date, injury severity, and presence or absence of fatalities, as well as narrative summaries and keyword descriptors. While this database has been widely used to study trends in safety performance, prior research has often focused on aggregate accident counts or fatality rates at the industry level. Few studies have systematically categorized human-factor-related keywords and compared their frequency and severity across different construction subsectors.
The U.S. construction industry is classified into three primary NAICS subcodes relevant to this study, which include NAICS 236 Construction of Buildings (including residential and commercial structures), NAICS 237 Heavy and Civil Engineering Construction (including highways, bridges, and utilities), and NAICS 238 Specialty Trade Contractors (including electrical, plumbing, and concrete work). Each subsector operates under distinct work environments, project types, and task complexities, which may influence the prevalence and consequences of certain human factors. For example, heavy civil projects may involve more complex coordination and heavy equipment operation, whereas specialty trades may face higher exposure to repetitive strain and task specific hazards.
There have been studies focusing on the role of human factors in construction safety (e.g., [3,4,5,6,7,8,9,10]). More specifically, examples include the study of Garrett and Teizer [3], who examined accident causation through the evaluation of the Human Factors Analysis and Classification System (HFACS) and the Human Error Awareness Training (HEAT) framework. Their study recognized that human error is the primary cause of up to 80% of incidents and accidents in high-risk industries such as aviation, petrochemical, healthcare, mining, and construction. Chen [5] developed and validated the Human Factors Analysis and Classification System for the Construction Industry (HFACS-CI), enhancing the traditional HFACS by adding Level 5 factors such as “attitude of owner” and “regulation of engineering firm,” and Level 4 factors like “management for change” and “management for subcontractors.”
Forsythe [4] reviewed BIM-based proactive safety systems, noting a research gap in addressing unpredictable human behavior during construction. He evaluated the real-time hazard warnings via worker tracking, and studied its challenges including mistrust, over-reliance, and ergonomic issues. The study suggests behavioral testing to improve worker–technology interaction and safety outcomes. Tang et al. [6] enhanced HFACS by integrating personalized, context-aware technology for construction safety management. Unlike traditional post-accident HFACS models, their approach focuses on near-real-time, individualized safety states, enabling more direct and adaptive prevention of human-related construction accidents. Bochkovskyi and Sapozhnikova [11] proposed a system-based approach to minimize the influence of the “human factor” in occupational health and safety. Using methods including graph theory, Markov processes, and formalization, they developed principles for automated monitoring and legal compliance systems, aiming to reduce errors and risks related to human errors through continuous control and optimized work and rest periods.
More recent studies have continued to quantify the human contribution to construction accidents and have begun to differentiate it by type of work. Wang et al. [12] combined HFACS with complex network analysis to identify the critical causal factors of construction accidents in China, finding that upstream organizational and supervisory conditions, rather than frontline errors alone, carry the greatest causal weight. Ren et al. [13] examined structural design and construction tasks in the Dutch construction industry and isolated 14 critical human and organizational factors that generate error-prone situations, validating them against actual structural failures. Working directly from accident records, Liu et al. [14] analyzed 267 prefabricated construction accident reports from 2014 to 2023 and identified 101 risk nodes, of which 39 were human factors and 20 were management factors, against 30 physical and 12 environmental factors, with insufficient safety education and training ranking as the single most critical node. Khan et al. [15] narrowed the scope further, investigating the patterns and causes of struck-by accidents in roadway construction and showing that the mix of human and operational contributors shifts once attention is restricted to one type of construction work. Taken together, these recent studies confirm that human and organizational conditions dominate construction accident causation, while also indicating that their composition is not uniform across work types.
Other studies include that by Sawacha et al. [16], who explored a wide range of influences on construction site safety, from historical and economic conditions to psychological and organizational aspects, highlighting company policy and management engagement as decisive factors. Su et al. [17] studied the problem of poor visibility and blind spots in construction equipment operation, discussing how external viewing systems could improve safety while also cautioning about added mental workload for operators. In the maritime construction activities, Galieriková [18] applied the HFACS framework to accident investigations, offering practical recommendations for categorizing causal factors in shipping incidents. Burlov et al. [19] approached the human factor in safety management through a theoretical viewpoint, proposing a synthesis-based model that integrates threat formation, recognition, and elimination to improve safety outcomes across various industries. Nykänen et al. [20] investigated whether immersive virtual reality, lecture-based safety instruction, and human factors tools, could enhance construction worker safety knowledge, motivation, and performance, testing these interventions in a large randomized trial.
Despite these contributions on evaluation of human errors on construction accidents, as mentioned earlier, existing research on human factors in construction safety has largely treated the industry as a homogeneous whole industry without investigating effects of human factors in different construction subsectors. Building construction, heavy civil works, and specialty trade activities each operate under distinct physical environments, organizational structures, hazard profiles, and workforce dynamics. These sector specific characteristics can significantly influence both the prevalence and the nature of human-factor-related incidents. Addressing this gap is essential for developing targeted safety strategies that reflect the realities of each sector rather than relying on generalized approaches. This study responds to this need by comparing human factor contributions to accidents and fatalities across these three core sectors of the U.S. construction industry. OSHA accident data from 2010 to 2025 were analyzed to compare the role of human factors across three construction subsectors. Seventy human-factor-related keywords were grouped into eight categories: procedural violations, cognitive and perceptual errors, physical conditions, inadequate training, communication failures, time pressure, ergonomic and behavioral strain, and equipment-related judgment errors. Accident frequency, fatality counts, and fatality rates were calculated for each keyword and category. A subset of 24 high frequency keywords was further analyzed for subsector-specific differences.
By combining descriptive statistics, risk matrices, Pareto analysis, and category-level comparisons, this paper aims to (1) quantify the relative contribution of different human factors to accidents and fatalities, (2) identify subsector-specific patterns that can guide targeted safety interventions, and (3) provide a methodology for leveraging OSHA data to assess human factor risk. The findings are intended to assist safety managers, policy makers, and industry stakeholders in prioritizing prevention strategies, allocating training resources, and developing hazard control measures that address the most critical human factors in each construction subsector.
2. Materials and Methods
2.1. Data Source and Case Selection
Accident and fatality data were obtained from the U.S. OSHA publicly accessible accident investigation database for the period of January 2010 through June 2025. The database contains structured information on incident date, NAICS code, injury classification, and fatality occurrence, as well as narrative summaries and keyword descriptors. The dataset was filtered to include only incidents classified under the three major U.S. construction subsectors including NAICS 236 Construction of Buildings (residential, commercial, and institutional structures), NAICS 237 Heavy and Civil Engineering Construction (highways, bridges, utility systems), and NAICS 238 Specialty Trade Contractors (electrical, plumbing, concrete, and related trades). Records lacking a valid NAICS code or a populated fatality indicator were excluded, as both fields are required for the comparisons reported here. It is important to state at the outset that OSHA investigates a selected subset of reportable incidents rather than a random sample of all construction accidents. The dataset analyzed here is therefore best understood as a census of investigated cases rather than a probability sample of the underlying accident population, and every metric defined below is conditional on a case having been investigated.
2.2. Human Factor Keyword Identification and Categorization
A preliminary review of OSHA keyword descriptors was conducted to identify terms directly associated with human factors. In this study, the term “human factors” is used broadly to capture the human role in accident causation, spanning worker-related conditions (behavioral, cognitive, physical), management-related conditions (supervision, procedures, training), and engineering-related conditions (equipment design, guarding, controls) that shape how workers interact with their work environment. Based on reviewing the data, 70 distinct keywords were selected based on their relevance to worker-related behavioral, cognitive, or physical conditions contributing to accidents. Keyword selection and classification followed a structured content-analysis approach [21]. Keywords were included when they described behavioral, cognitive, physical, supervisory, or organizational conditions related to an accident. These keywords were then organized into eight categories including:
- Procedural Violations and Unsafe Acts
- Cognitive Perceptual Errors
- Physical-Condition-Related Factors (Fatigue, Illness)
- Lack of Training and Experience
- Communication and Coordination Failures
- Time Pressure
- Ergonomic Behavioral Strain
- Judgment and Awareness Errors in Equipment Use
Two aspects of this procedure warrant explicit statement, as together they define the unit of analysis for the results that follow. First, the keyword descriptors used here are those recorded within the OSHA database itself rather than codes generated by the authors from free-text accident narratives. The linkage between an individual accident and a given keyword is therefore a property of the source data and is not subject to author-side coding error. Author judgment enters at two points only: the selection of the 70 human-factor-related descriptors from the broader OSHA descriptor vocabulary, and the assignment of each selected descriptor to one of the eight categories listed above. Both steps were performed by the lead author and independently reviewed by the co-authors, with disagreements resolved by discussion until consensus was reached. Second, a single investigated accident may carry more than one keyword descriptor, and may therefore contribute to the accident and fatality counts of more than one keyword and, in some instances, of more than one category. Keyword-level and category-level counts are accordingly not mutually exclusive and should not be summed to recover the total number of investigated cases. Each keyword is instead treated as a separate, overlapping subpopulation of cases in which that condition was recorded, and all comparisons are made within a keyword or within a category rather than between them.
2.3. Outcome Metrics and Descriptive Analysis
From the dataset, accident counts (ACs), fatality counts, and fatality rates (FRs) were calculated for all construction works combined, each of the three NAICS subsectors, and each individual keyword and category. Fatality rate was defined based on Equation (1).
It should be noted that this fatality rate reflects the proportion of OSHA-investigated cases that resulted in a fatality, rather than a population-based rate normalized by number of workers or hours worked. As such, it is more accurately described as a fatal-case proportion among reported incidents, and should be interpreted with this limitation in mind, particularly for keywords with a small number of total cases. Keywords with ≥60 accident cases over the study period were classified as high-frequency and considered for more detailed sector-specific comparisons. This threshold was selected to focus the subsector analysis on frequently reported keywords with sufficient observations for meaningful comparison. A combination of descriptive statistics and graphical methods was used for the data analysis. Risk matrices were constructed by evaluating frequency against fatality rate to classify human factors into priority tiers. Factors in the high-frequency/high-severity quadrant were identified as candidates for targeted intervention. The Pareto analysis further refined priorities by identifying the smallest subset of factors contributing to the majority of fatalities. For each subsector, the median accident count and fatality rate defined the risk-matrix quadrants. For the Pareto analysis, keywords were ranked by fatality count, and their cumulative percentage of fatalities was calculated. Two consequences of this definition are carried forward into the interpretation of the results. Because OSHA investigation is itself triggered by incident characteristics that correlate with severity, the absolute level of FR is expected to be inflated relative to the fatality risk of construction accidents generally, and no claim about absolute risk is made from it. Comparisons across the three subsectors are nevertheless drawn from a single database governed by common reporting and investigation criteria, so the relative comparison of FR between subsectors is substantially less exposed to this selection effect than is the absolute value of FR within any one of them. FR is not normalized by employment or by hours worked and is therefore not comparable to the incidence rates published by the Bureau of Labor Statistics; it is a case-fatality proportion conditional on investigation, and it is used here only for relative comparison.
2.4. Statistical Analysis
The descriptive comparisons described above establish whether the fatality proportions observed in the three subsectors differ in magnitude, but not whether those differences are larger than would be expected from sampling variation alone. To address this, each high-frequency keyword and each human factor category was subjected to a formal test of association between subsector and outcome. For each keyword, a 3 × 2 contingency table was constructed, with rows corresponding to the three NAICS subsectors (236, 237, and 238) and columns to the fatal and non-fatal investigated cases recorded for that keyword, and the Pearson chi-square statistic [22] was computed for the null hypothesis that the fatality proportion is independent of subsector [22]. The same construction was applied at the category level after aggregating the constituent high-frequency keywords within each category.
Several of the resulting tables contain cells with small expected counts. For keywords such as Communication, Underlying Medical Condition, and Climbing on Ladder the minimum expected cell count falls below five, which is the conventional threshold below which the asymptotic chi-square approximation becomes unreliable [22]. Rather than discard these keywords or pool them into coarser groupings, p-values were obtained by Monte Carlo permutation instead of from the asymptotic distribution. Holding the row and column margins fixed, fatal and non-fatal labels were randomly permuted across cases 20,000 times per keyword and 50,000 times per category, and the exact p-value was computed as the proportion of permuted tables whose chi-square statistic equalled or exceeded the observed value, with the standard add-one correction applied to both numerator and denominator [23]. This is the Freeman–Halton generalization of Fisher’s exact test [24] to the r × c case, and it makes no distributional assumption about expected cell counts.
Because 24 keyword-level tests and six category-level tests were performed, an uncorrected significance threshold would be expected to produce one or more spurious rejections by chance alone. The Benjamini–Hochberg procedure [25] was therefore applied to control the false discovery rate, treating the keyword-level and the category-level tests as two separate families of inference, and results are reported as FDR-adjusted q-values with significance declared at q < 0.05. Because one accident may carry several keyword descriptors, the keyword-level tests are not strictly independent of one another; the Benjamini–Hochberg procedure remains valid under the positive regression dependency that such overlap induces, and no accident is compared against itself within any single contingency table. All computations were carried out in Python 3 using the SciPy library [26], with the permutation sampler initialized to a fixed random seed so that the reported p-values are exactly reproducible.
The quantity being tested is the proportion of investigated cases that were fatal, conditional on the keyword having been recorded. A significant result therefore indicates that the severity composition of investigated accidents involving that human factor differs across subsectors. It does not by itself establish that a worker in one subsector faces a higher probability of a fatal accident than a worker in another, because the tests do not incorporate exposure. This distinction is maintained throughout the interpretation of the results in Section 3.
3. Analysis Results
The findings of this study offer a comprehensive view of how human factors influence accident occurrence and fatality risk within the U.S. construction industry. By examining data over a 15-year period and comparing patterns across major subsectors, the results highlight both the pervasive nature of certain human errors and the unique ways in which sector-specific conditions shape safety outcomes. The discussion that follows interprets these patterns in the context of existing knowledge on construction safety, drawing connections between empirical trends and the practical realities of managing human factor risks on diverse job sites.
Table 1 provides the accident counts (AC), number of fatalities, and corresponding fatality rates (FR) for all construction works combined (NAICS Code 23) and for each of its three primary subsectors: Construction of Buildings (NAICS 236), Heavy and Civil Engineering Construction (NAICS 237), and Specialty Trade Contractors (NAICS 238). The data span the period from 2010 to 2025 and reflect the collected results derived from OSHA accident investigation records [27]. This table is the baseline reference for subsequent comparative analyses of human-factor-related incidents across the mentioned subsectors. The keywords shown in the table are high-frequency accident keywords from 2010 to 2025. The criterion considered for the high-frequency accident was keywords with equal to or more than 60 accidents through the studied period. The keywords were put into the human categories mentioned earlier. Note that in the categories of Time Pressure and Ergonomic Behavioral Strain, no keywords were identified with high-frequency accidents (more than 60 accidents), and therefore, in Table 1 these two mentioned categories are not listed in the tabulation.
Table 1.
Accident Counts (AC), Fatalities, and Fatality Rates (FR) for All Construction Works and Subcategories including Construction of Buildings, Heavy and Civil Engineering Construction, and Specialty Trade Contractors.
Table 2 reports the corresponding tests of statistical significance for each of the 24 high-frequency keywords, and the results temper the descriptive picture considerably. Of the 24 keywords examined, only two, Lost Balance (χ2 = 14.62, q = 0.008) and Inattention (χ2 = 14.12, q = 0.008), show differences in fatality proportion across the three subsectors that survive correction for multiple comparisons, with Unstable Position falling just outside the threshold (χ2 = 10.07, q = 0.051). For Lost Balance, the fatality proportion rises from 18% in Construction of Buildings to 32% in Specialty Trade Contractors. For Inattention the contrast is sharper still: 12 of the 14 investigated cases in Heavy and Civil Engineering Construction were fatal, against 16 of 33 in Specialty Trade Contractors and none of the seven recorded in Construction of Buildings. The remaining keywords, including several whose subsector fatality rates differ substantially in absolute terms, do not reach significance once the number of cases underlying each comparison and the number of tests performed are taken into account. Lack of Engineering Controls illustrates the point. Its fatality proportion exceeds 80% in all three subsectors, but those proportions are statistically indistinguishable from one another (χ2 = 0.08, q = 1.00), so the elevated severity of this factor is a finding about the factor itself rather than about any particular subsector.
Table 2.
Statistical Comparison of Fatality Proportions Across the Three U.S. Construction Subsectors for the 24 High-Frequency Human Factor Keywords.
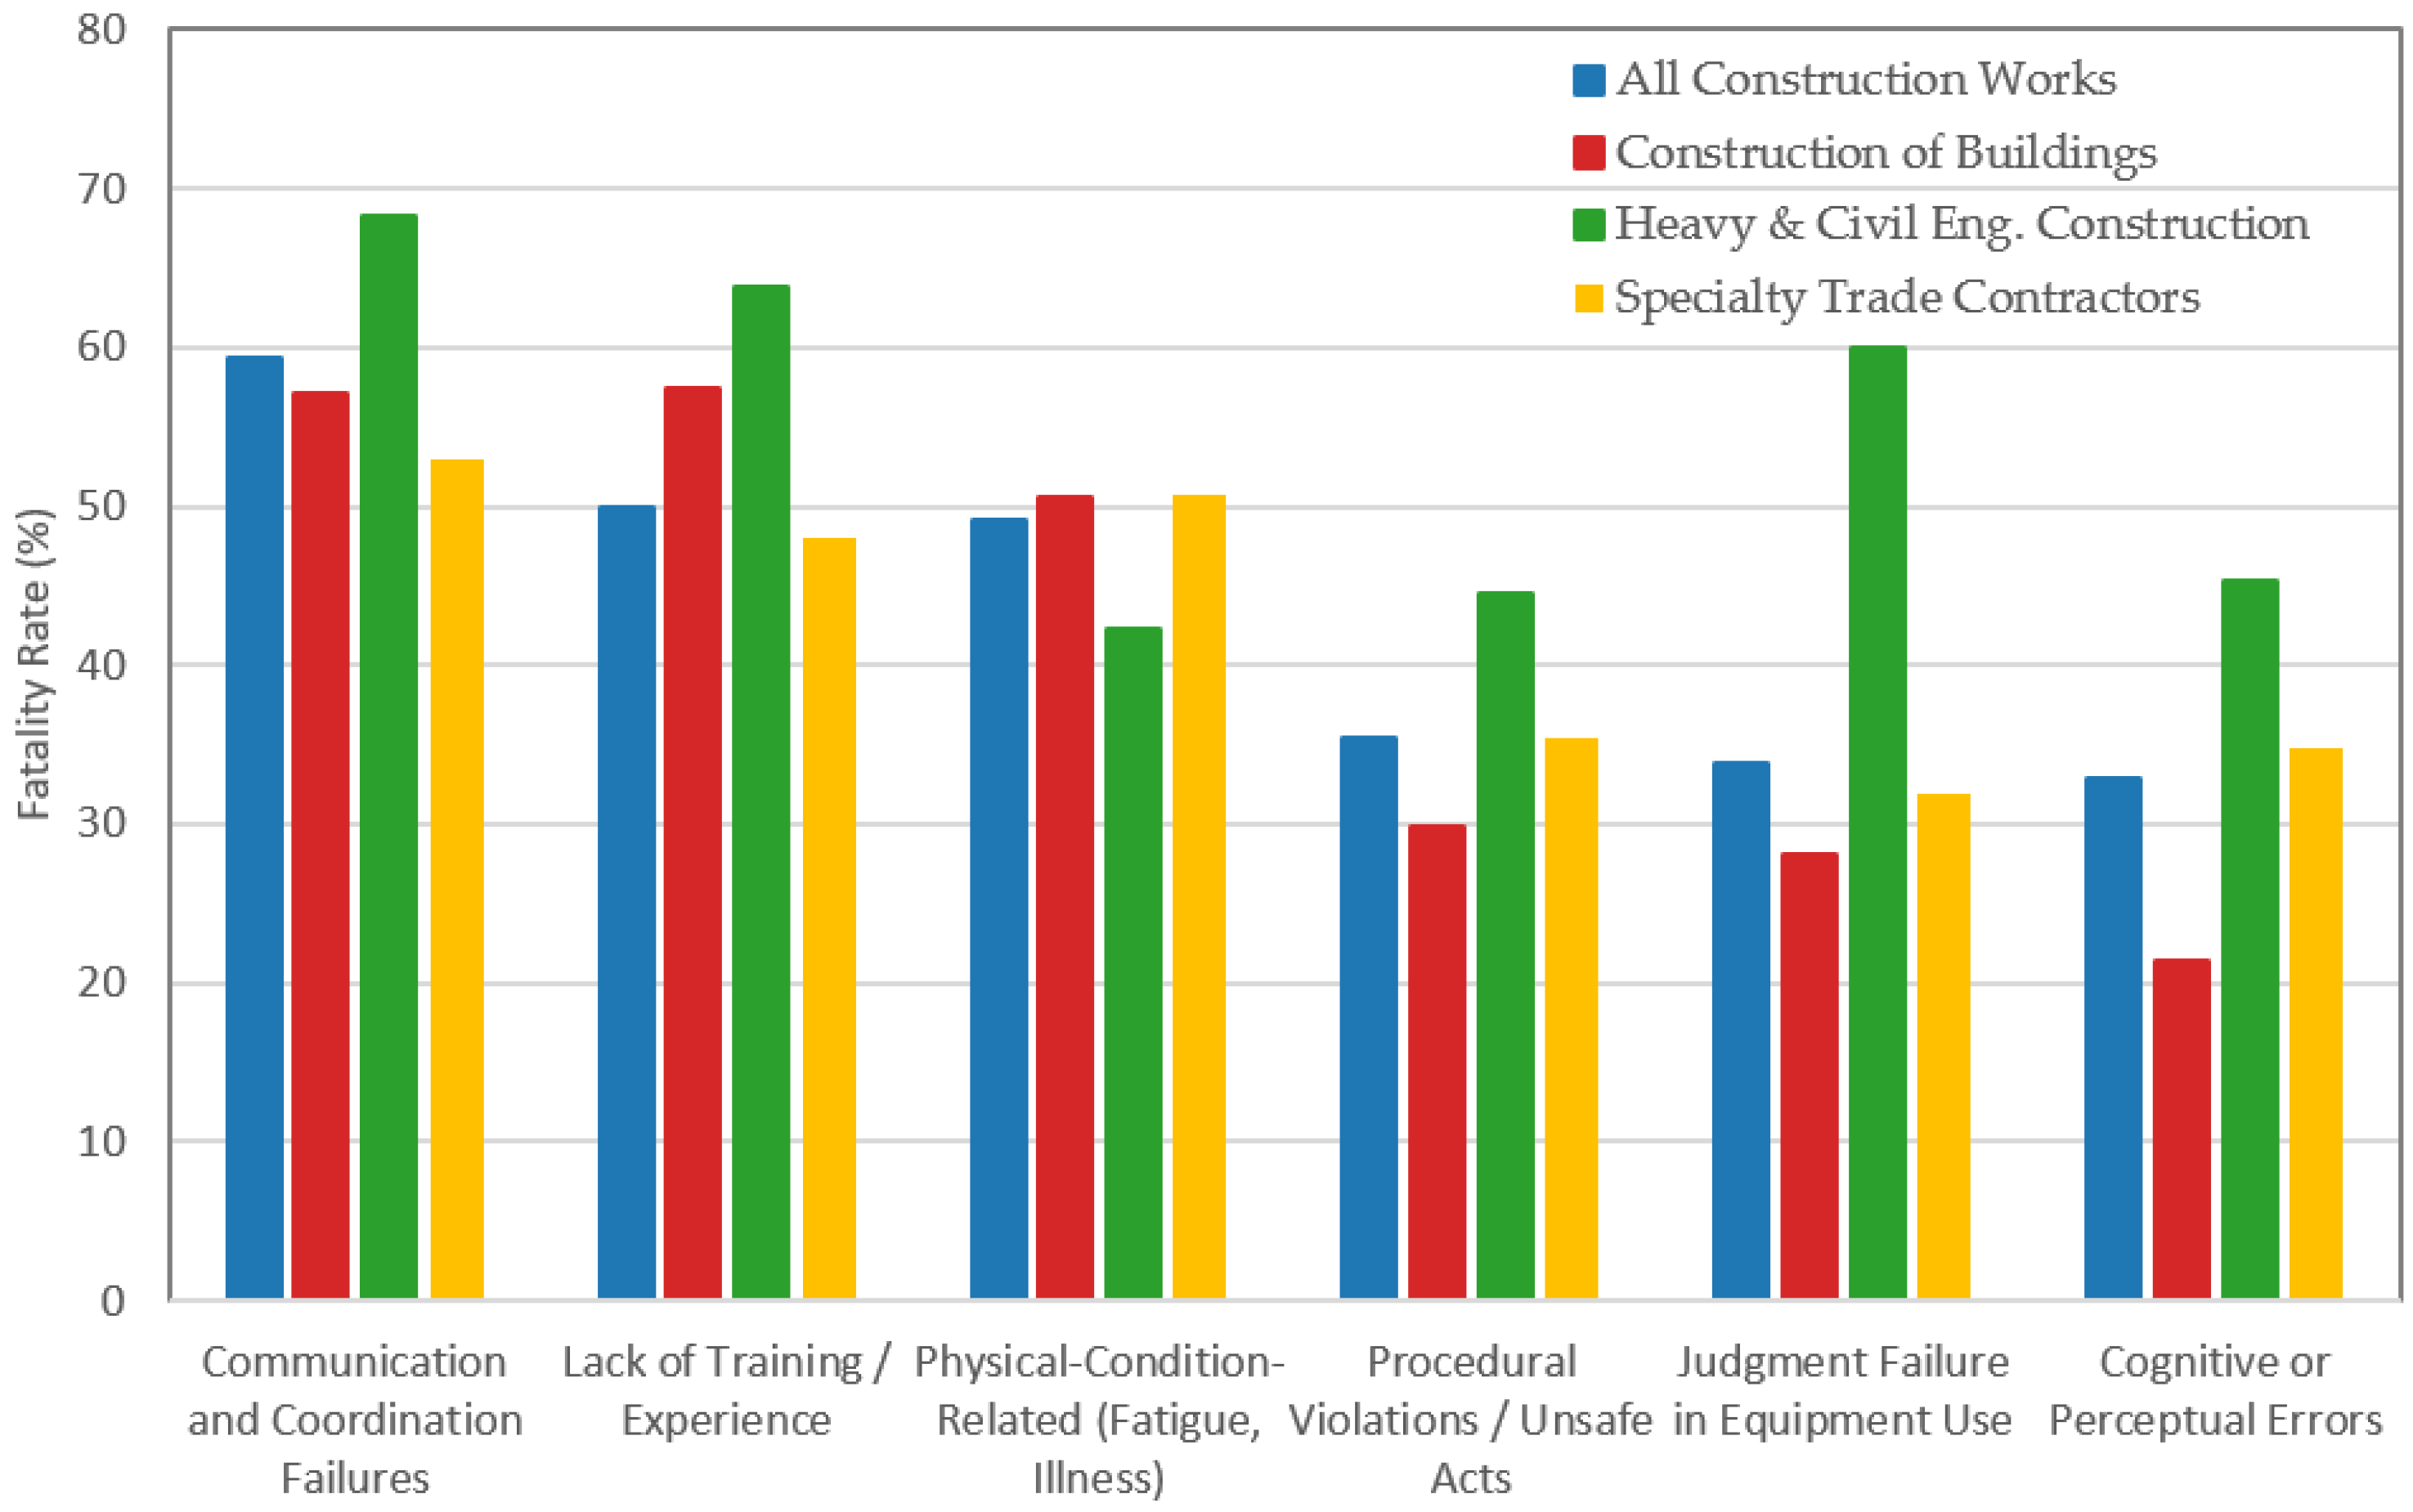
Aggregating the constituent keywords within each category increases the number of cases underlying each comparison and correspondingly increases statistical power, and Table 3 shows that at this level of aggregation the subsector differences are more clearly resolved. Three of the six categories differ significantly across subsectors after correction: Cognitive or Perceptual Errors (χ2 = 26.59, q < 0.001), Procedural Violations and Unsafe Acts (χ2 = 16.03, q = 0.001), and Judgment and Awareness Failure in Equipment Use (χ2 = 10.51, q = 0.010). In each of these three categories the fatality proportion is highest in Heavy and Civil Engineering Construction, at 45%, 44%, and 60% respectively, against 21%, 30%, and 28% in Construction of Buildings. By contrast, Physical-Condition-Related Factors (q = 0.262) and Communication and Coordination Failures (q = 0.227) do not differ significantly across subsectors, and Lack of Training and Experience falls marginally short of the corrected threshold (χ2 = 6.30, q = 0.063). The absence of a significant difference in the physical condition category is itself informative: fatality proportions in this category are uniformly high, between 42% and 51% across all three subsectors, indicating a hazard that is severe wherever it appears rather than one concentrated in a particular type of construction work.
Table 3.
Statistical Comparison of Fatality Proportions Across the Three U.S. Construction Subsectors at the Human Factor Category Level, Aggregated Across the High-Frequency Keywords Within Each Category.
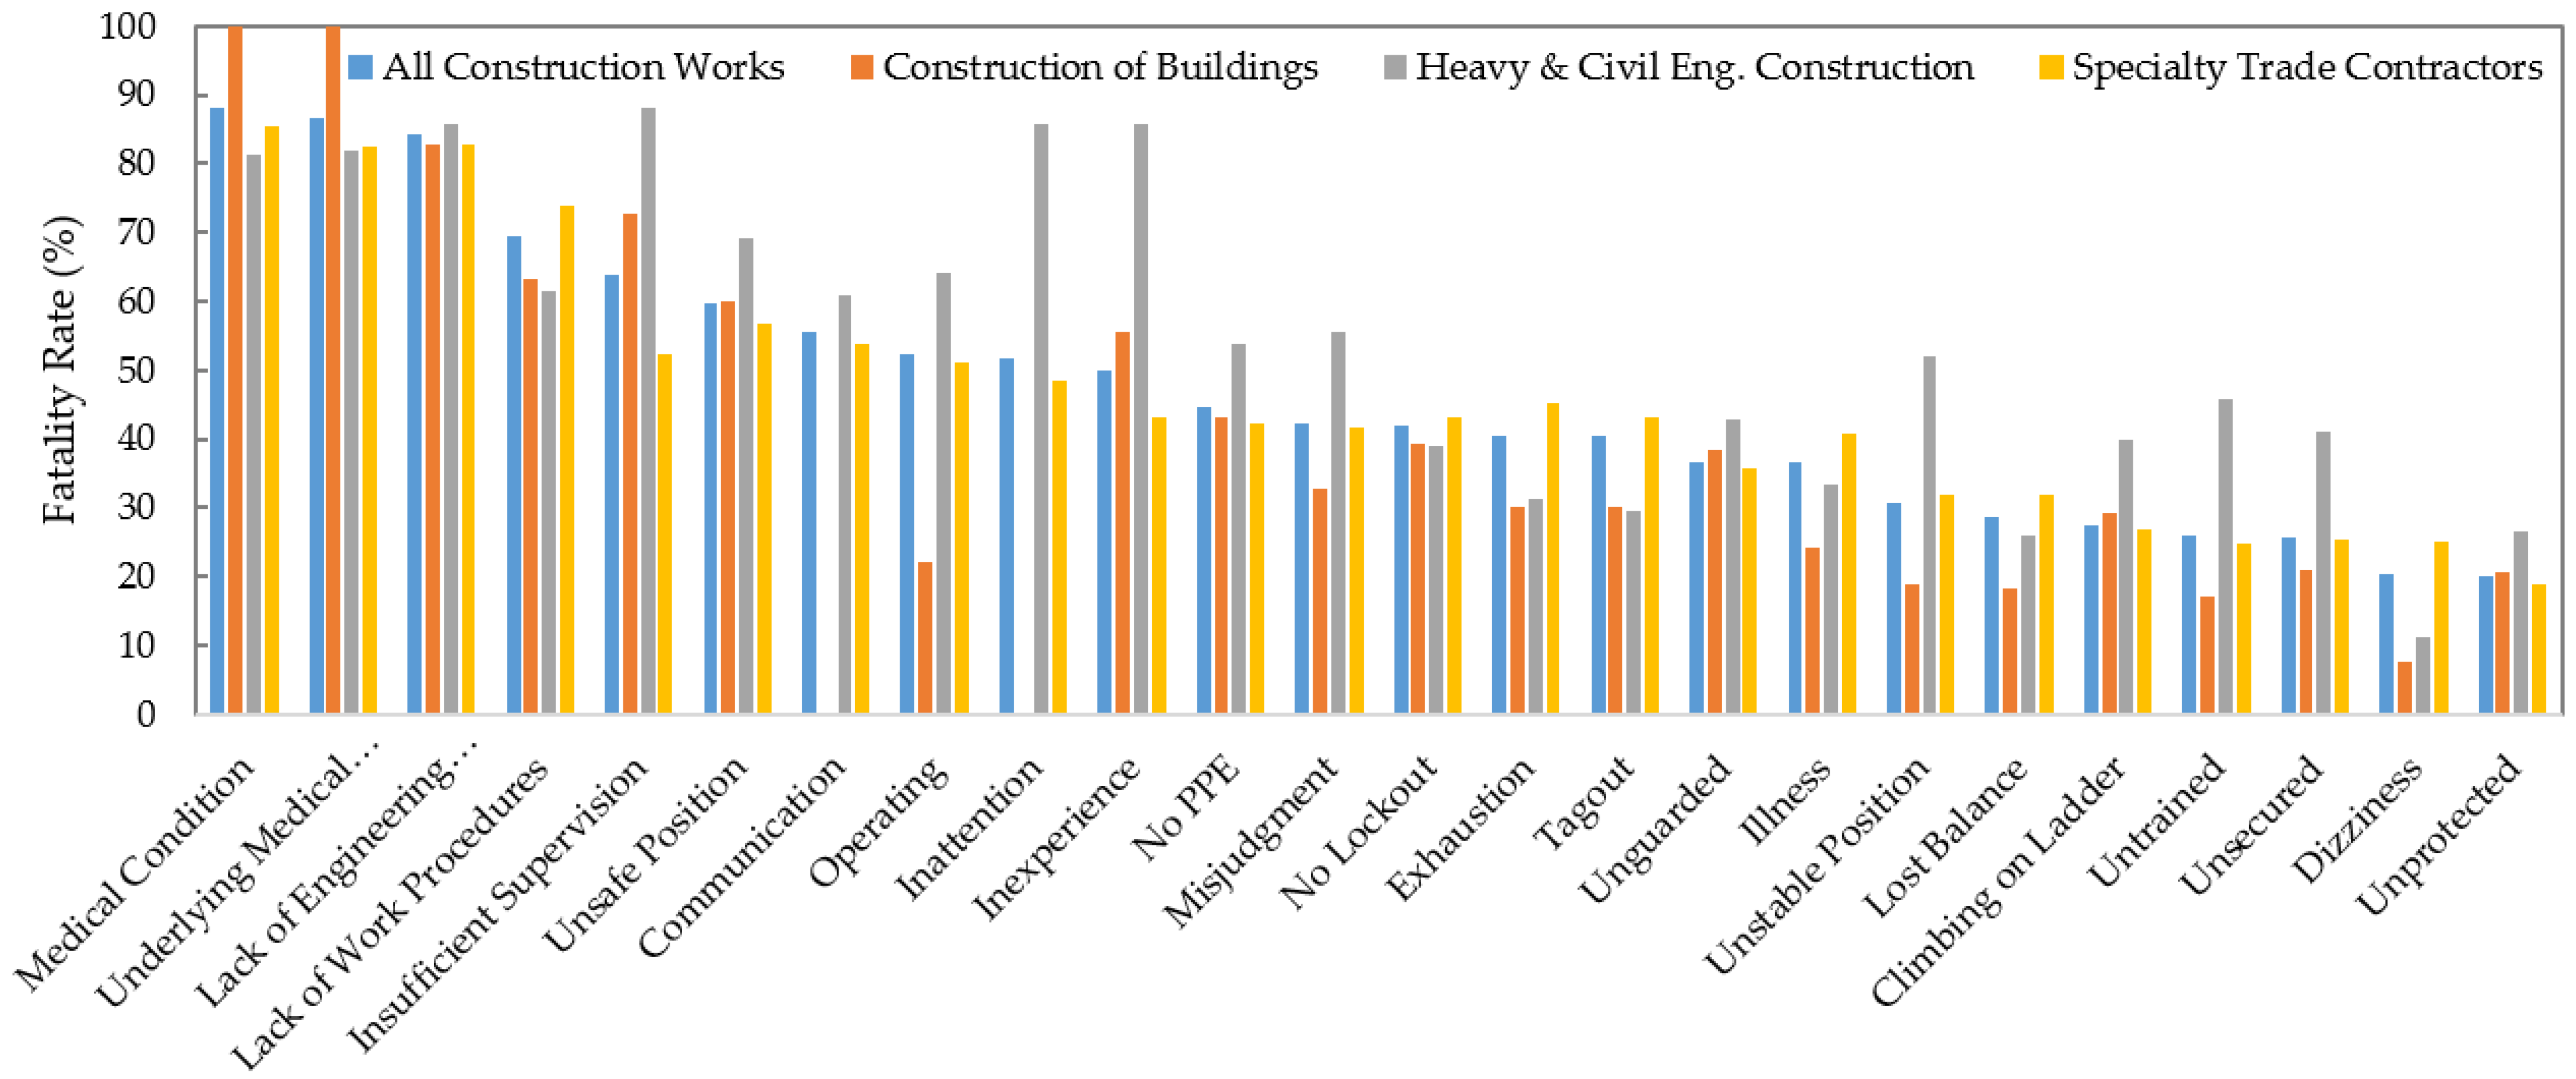
Read together, Table 2 and Table 3 indicate that the sector-specific patterns discussed in the remainder of this section are best supported at the category level and, at the keyword level, for cognitive factors in particular. Where a difference visible in Figure 1, Figure 2, Figure 3, Figure 4 and Figure 5 is not accompanied by a significant test result in Table 2 or Table 3, it is described below as an observed pattern rather than as an established difference between subsectors.
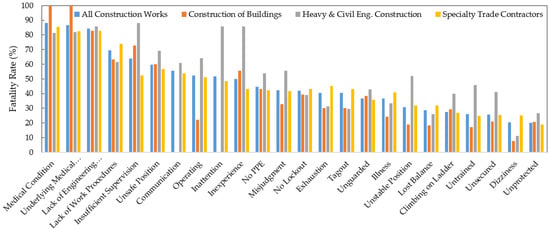
Figure 1.
Fatality Rate (%) for High-Frequency Accident Keywords from 2010 to 2025 Across All Construction Works and Three Major Construction Sectors.
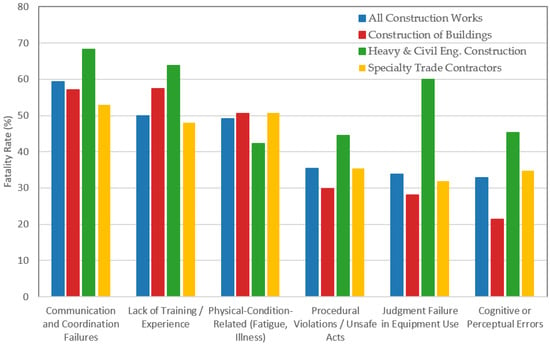
Figure 2.
Fatality Rate (%) by Accident Category from 2010 to 2025 Across All Construction Works and Three Major Construction Sectors: Construction of Buildings (NAICS 236), Heavy and Civil Engineering Construction (NAICS 237), and Specialty Trade Contractors.
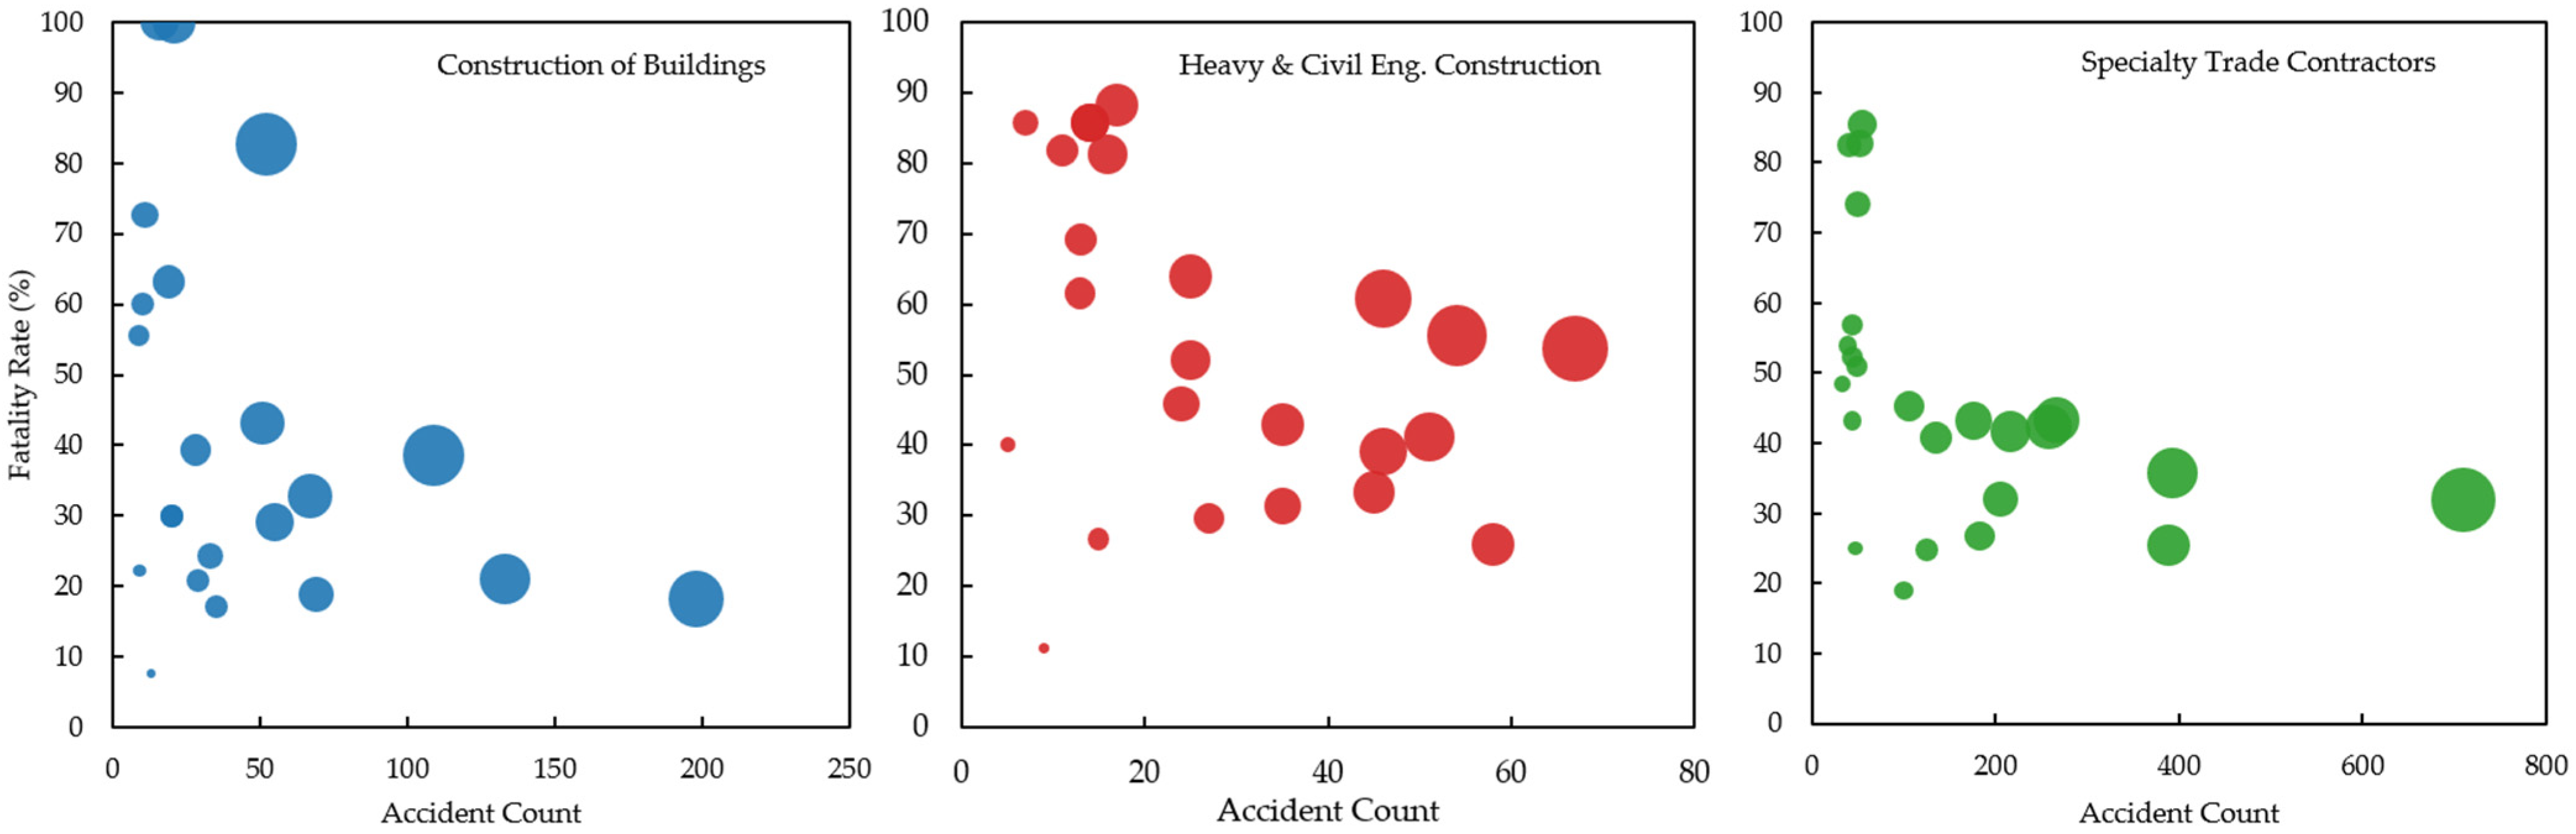
Figure 3.
Accident Count Versus Fatality Rate (%) for Three Major Construction Sectors: Construction of Buildings (NAICS 236), Heavy and Civil Engineering Construction (NAICS 237), and Specialty Trade Contractors.
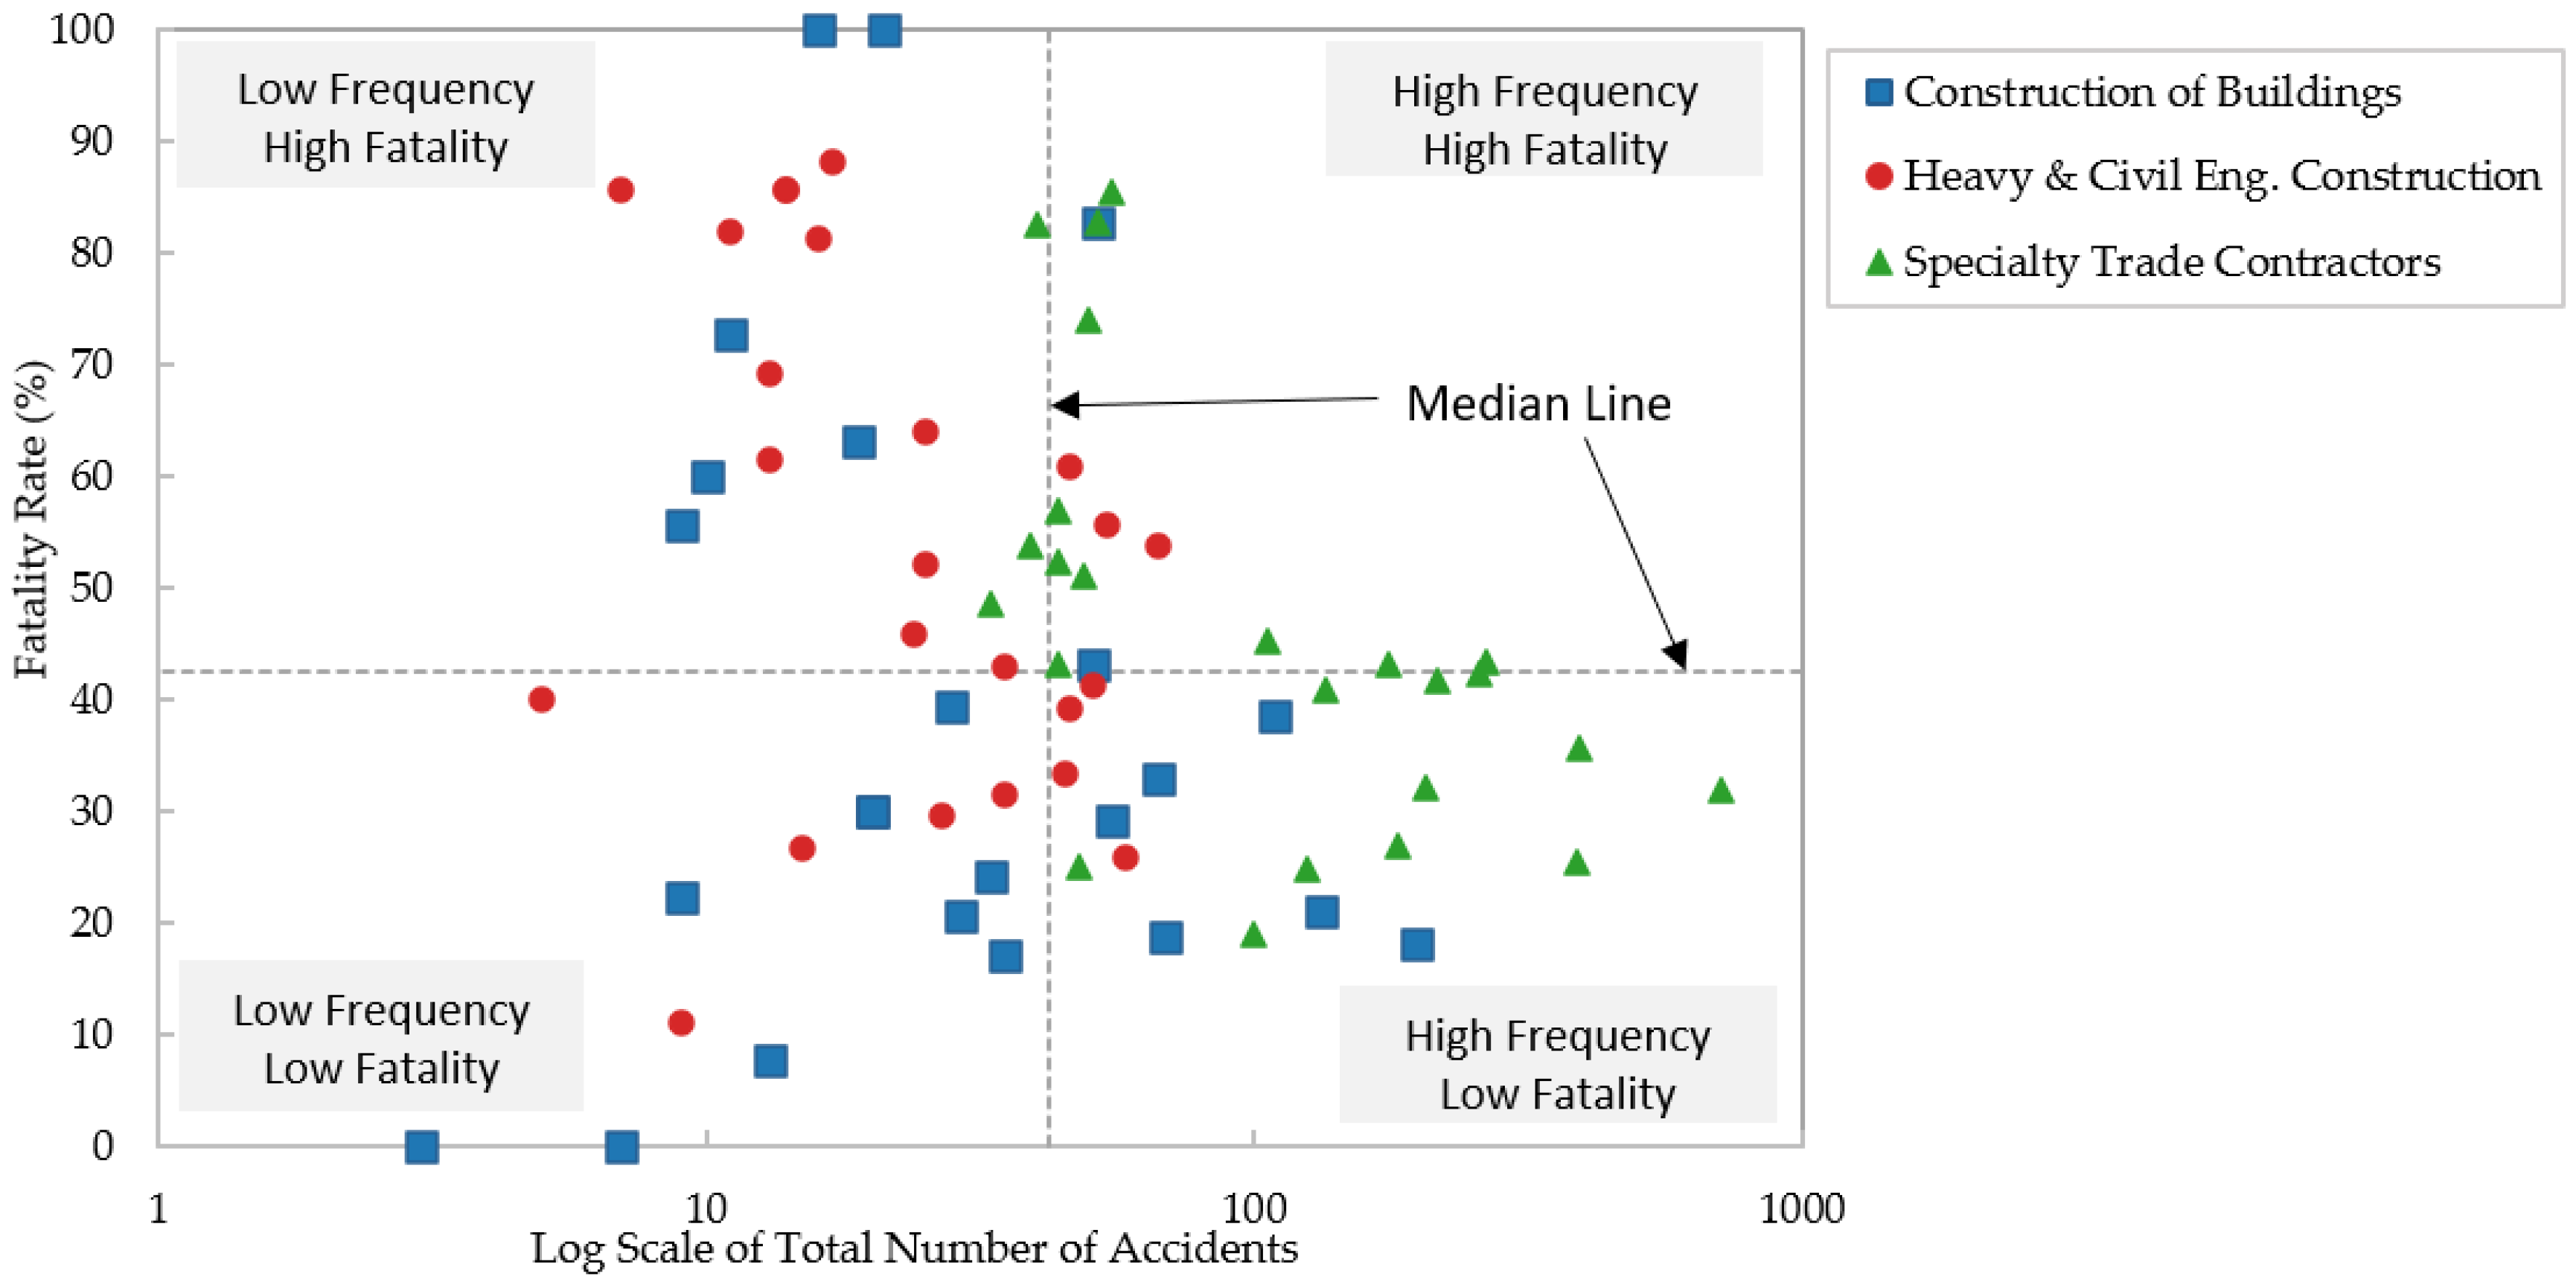
Figure 4.
Fatality Rate (%) Versus Log Scale of Total Number of Accidents for Construction of Buildings, Heavy and Civil Engineering Construction, and Specialty Trade Contractors.
Figure 5.
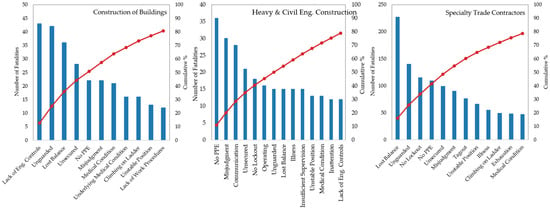
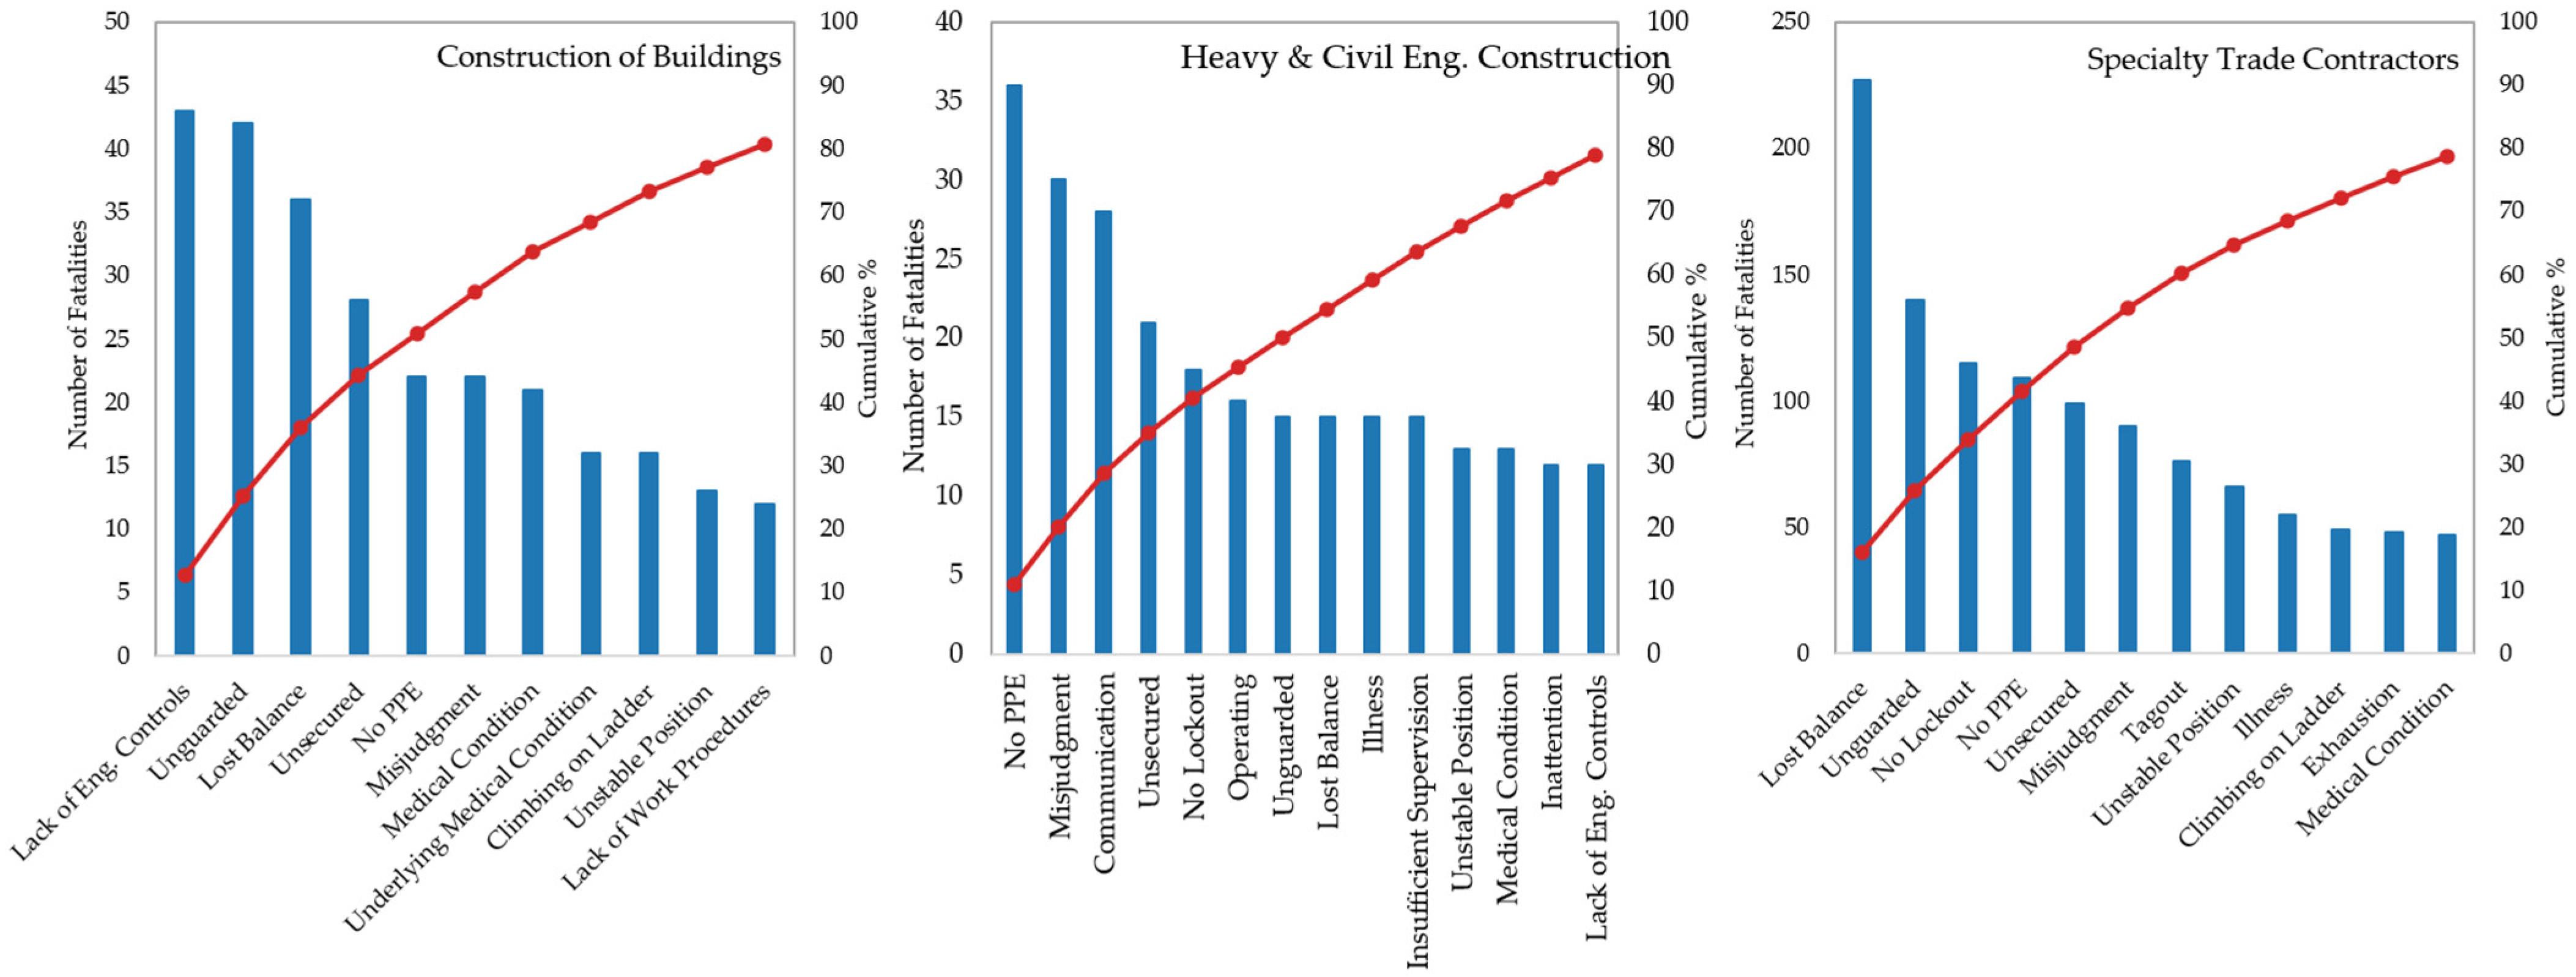
Pareto Charts of Number of Fatalities (Bars) and Cumulative Percentage (Line) for Construction of Buildings, Heavy and Civil Engineering Construction, and Specialty Trade Contractors.
Figure 1 illustrates the fatality rates associated with the high-frequency accident keywords from 2010 to 2025, comparing results for all construction works with each of the three primary NAICS subsectors. The chart reveals that certain human-factor-related conditions, such as medical condition, underlying medical condition, lack of engineering controls, and lack of work procedures, consistently exhibit the highest fatality rates across sectors. Notably, Heavy and Civil Engineering Construction shows elevated fatality rates for several operational factors, including inattention, inexperience, and unsafe position, suggesting greater exposure to high-risk, complex tasks in this subsector. Of these, however, only the difference for inattention is statistically significant after correction for multiple comparisons (Table 2); the elevated rates for inexperience and unsafe position rest on small numbers of investigated cases and are reported here as observed patterns. In contrast, Construction of Buildings and Specialty Trade Contractors demonstrate more moderate rates for most factors, though specific keywords such as medical condition and lack of work procedures still present substantial risks. The overall distribution underscores that while frequency of occurrence is important, certain human factors, regardless of how often they appear, pose a disproportionately high fatality risk and require targeted safety interventions. Figure 2 compares fatality rates across major accident categories with high-frequency accidents for all construction works and the three primary NAICS subsectors. The results indicate that Heavy and Civil Engineering Construction consistently shows higher fatality rates in several categories, most notably communication and coordination failures, lack of training/experience, and judgment failure in equipment use. As Table 3 shows, this difference is statistically significant for judgment and awareness failure in equipment use, whereas the differences for communication and coordination failures and for lack of training and experience do not reach the corrected significance threshold. These elevated rates likely reflect the complex, large-scale, and equipment-intensive nature of heavy civil projects, where errors in coordination or decision-making can have severe consequences. Construction of Buildings shows comparatively higher fatality rates in physical-condition-related incidents, suggesting a heightened vulnerability to fatigue- and illness-related hazards in this sector. Meanwhile, Specialty Trade Contractors display more balanced fatality rates across categories but still face notable risks in communication failures and lack of training/experience. Overall, the figure underscores that while all sectors share certain high-risk categories, sector-specific operational demands and hazard profiles shape the relative severity of human-factor-related incidents.
In Figure 3 bubble charts show the relationship between accident count and fatality rate for each of the three major construction subsectors. Bubble size reflects the total number of fatalities, allowing simultaneous visualization of frequency, severity, and absolute fatality impact. In Construction of Buildings, most factors cluster at lower accident counts, though some high-fatality-rate keywords occur even with limited frequency, indicating severe consequences for certain rare events. In Heavy and Civil Engineering Construction, several factors exhibit both high fatality rates and moderate accident counts, suggesting a concentration of risk in fewer but more severe incidents. Specialty Trade Contractors display a wide spread of accident counts, with a few factors reaching extremely high frequencies but generally moderate fatality rates, implying that high-volume incidents may not always be the most lethal. These patterns illustrate the need for sector-specific prioritization, focusing not only on frequently occurring factors but also on those that, even when rare, carry a disproportionate risk of fatality.
In Figure 4, the scatter plot positions each high-frequency human factor keyword according to its fatality rate and the log-transformed total number of accidents, separated by sector. The vertical and horizontal median lines divide the chart into four quadrants, highlighting factors that are high-frequency/high-fatality, high-frequency/low-fatality, low-frequency/high-fatality, and low-frequency/low-fatality. Most of the factors located in the high-frequency/high-fatality quadrant are within the Heavy and Civil Engineering Construction and Specially Trade Contractors subsectors. Specialty Trade Contractors are more concentrated in the high-frequency/low-fatality quadrant, suggesting that many of their recurring incidents, while numerous, tend to be less lethal. In contrast, Construction of Buildings shows a wider spread, with some factors in the low-frequency/high-fatality quadrant, rare events that nonetheless produce severe consequences. This quadrant-based view allows practitioners to quickly pinpoint which factors require both preventive measures for common hazards and targeted controls for rare but deadly incidents.
Figure 5 presents Pareto charts showing the distribution of fatalities by human factor keyword for each construction subsector. In each sector, a limited number of factors contribute to a substantial portion of total fatalities. For Construction of Buildings, lack of engineering controls, unguarded, and lost balance rank highest. In Heavy and Civil Engineering Construction, no PPE, misjudgment, and communication are among the leading contributors. For Specialty Trade Contractors, lost balance, unguarded, and no lockout appear most frequently among top contributors. The cumulative percentage curves indicate that addressing the highest-ranked factors could reduce a large share of fatalities within each sector.
4. Discussion
The results from Figure 1, Figure 2, Figure 3, Figure 4 and Figure 5 show that frequency and severity do not always align. Some factors with high accident counts present moderate fatality rates, while others occur infrequently but have a disproportionate fatal impact. This distinction is important for prioritizing safety interventions, as it highlights the need to balance efforts between common hazards and rare but severe events. Across all analyses, the results indicate that while certain human factors are common to multiple subsectors, their relative frequency and fatality rates vary in ways that reflect sector-specific work conditions. For example, factors such as no PPE and communication failures appear across all subsectors but have notably higher fatality rates in heavy civil works, likely due to the scale of equipment and complexity of operations. Conversely, incidents related to lost balance and unguarded hazards are more prominent in specialty trades, where tasks often involve work at height or in confined spaces. These differences suggest that sector-level characteristics, such as equipment type, work environment, and task specialization, play an important role in shaping both the likelihood and consequences of human-factor-related incidents.
These patterns can be read against the international literature, which allows the present findings to be located rather than simply reported. The most direct point of comparison is the recurring conclusion, in studies drawn from countries with construction sectors and regulatory regimes broadly comparable to those of the United States, that organizational and supervisory conditions outweigh frontline worker error in accident causation. Ren et al. [13] reached this conclusion for the Netherlands by isolating the human and organizational factors that generate error-prone situations in structural design and construction, and Sawacha et al. [16] reached it for the United Kingdom, identifying company policy and management engagement as the decisive influences on site safety performance. Outside that group, Wang et al. [12] and Liu et al. [14] report the same ordering for China, the latter ranking insufficient safety education and training as the single most critical node among 101 risk factors. The present results are consistent with this body of work. The categories that differ significantly across subsectors after correction, namely procedural violations and unsafe acts, cognitive or perceptual errors, and judgment and awareness failures in equipment use, describe conditions produced by how work is planned, supervised, and sequenced rather than by individual carelessness, and the two keywords carrying the highest fatality proportions in Table 1, lack of engineering controls and lack of work procedures, are organizational by definition.
There are, however, two respects in which the present findings qualify the literature rather than simply confirming it. First, the studies cited above are built on detailed reconstructions of a relatively small number of accidents, such as the 267 reports examined by Liu et al. [14] or the 14 critical factors isolated by Ren et al. [13]. That design permits causal depth but limits generalization. The present analysis makes the opposite trade-off: several thousand investigated cases allow subsector contrasts to be tested statistically, but the OSHA keyword descriptors carry no information about the organizational chain behind any individual event. This study can therefore establish that judgment and equipment-use failures are disproportionately fatal in heavy civil work without being able to identify the supervisory conditions that produced them, and the causal interpretations offered by HFACS-based studies [3,5,6,12] should not be treated as established by the associations reported here. Second, the comparative literature generally treats construction as a single industry. Khan et al. [15] is an exception in restricting attention to roadway construction, and the shift in the mix of contributors they observe once scope is narrowed is consistent with the subsector differences found here. The present results suggest that this exception should become the rule, since pooling NAICS 236, 237, and 238 into a single industry average conceals differences in fatality composition that are statistically significant at the category level. It should also be noted that national fatality statistics are not directly comparable in magnitude, because reporting thresholds, investigation triggers, and case definitions differ between jurisdictions. The comparison drawn here is therefore one of the relative ordering of causal categories rather than of absolute rates, and cross-national work of this kind would be sharpened by disaggregating national datasets along equivalent subsector lines before comparing them.
From a prevention perspective, the combination of frequency-severity analysis, category-level comparisons, and Pareto charting provides a clear basis for prioritizing safety interventions. Focusing on the most recurrent high-risk factors within each subsector can help allocate training, supervision, and engineering controls where they are likely to have the greatest impact. At the same time, attention to low-frequency but high-fatality factors remains important, as these events, though less common, carry severe consequences when they occur. By applying targeted strategies that address both recurring and severe but infrequent hazards, stakeholders can work toward reducing the overall burden of human-factor-related fatalities in the U.S. construction industry.
5. Theoretical and Policy Implications
At a theoretical level, these results bear on how human factors are conceptualized in construction safety research. The dominant frameworks in this literature, HFACS and its construction-specific extensions [3,5,6], treat the industry as a single domain within which a common taxonomy of unsafe acts, preconditions, supervisory failures, and organizational influences applies. The findings reported here do not contradict that taxonomy, but they indicate that its distribution is subsector-dependent, since the same categories carry materially different fatality consequences depending on whether work is performed in building construction, heavy civil engineering, or the specialty trades. Human factor models applied to construction would therefore be strengthened by treating subsector as a conditioning variable rather than as background context, and the severity weight attached to a given category should not be assumed to transfer across types of construction work.
These findings also have practical implications for developing subsector-specific safety programs. Heavy and Civil Engineering Construction should emphasize controls addressing cognitive errors, procedural violations, and equipment-related judgment failures, while Specialty Trade Contractors should prioritize fall prevention, guarding, and lockout/tagout practices. More broadly, contractors and regulators can use the proposed frequency–severity framework to prioritize training, inspections, and engineering controls. Because the analysis is based on OSHA-investigated cases, these findings should be used for risk prioritization rather than for estimating population-level accident probabilities.
Taken together, the study contributes a data-driven framework for examining human-factor risks across construction subsectors. For researchers, it provides a reproducible methodology for analyzing OSHA accident data using frequency–severity metrics and statistical comparisons. For policymakers, it identifies subsector-specific priorities that can guide targeted regulations, inspections, and safety initiatives. For practitioners, it supports more effective allocation of training, supervision, and engineering controls toward the human factors associated with the greatest safety consequences.
6. Conclusions
This study examined OSHA accident investigation data from 2010 to 2025 to assess the contribution of human factors to fatalities in three major U.S. construction subsectors including Construction of Buildings, Heavy and Civil Engineering Construction, and Specialty Trade Contractors. Seventy human-factor-related keywords were identified and grouped into eight categories, with accident counts, fatalities, and fatality rates calculated for each. Comparative analysis using frequency–severity metrics, category-level summaries, and Pareto charts revealed both commonalities and differences among the subsectors. Differences in fatality proportion between subsectors were additionally tested using permutation-based chi-square tests with Benjamini–Hochberg correction for multiple comparisons, so that the sector-specific contrasts reported here are distinguished from variation attributable to chance.
The results suggest that certain human factors, such as insufficient engineering controls, absence of PPE, and communication breakdowns, are consistently linked with higher fatality numbers, though their impact and intensity differ across subsectors. In Heavy and Civil Engineering Construction, fatalities were more strongly tied to operational and coordination-related issues, whereas Specialty Trade Contractors faced more frequent risks involving balance and guarding. These trends highlight how sector-specific environments and work demands shape the prevalence of human factor risks. At the category level, the differences that remain statistically significant after correction are concentrated in cognitive or perceptual errors, procedural violations and unsafe acts, and judgment and awareness failures in equipment use, each of which carries its highest fatality proportion in Heavy and Civil Engineering Construction. Differences in the physical condition and communication categories were not statistically significant, and the corresponding contrasts are therefore presented as observed patterns rather than as established subsector effects.
The results suggest that safety strategies should be tailored to address the factors most relevant to each subsector while maintaining attention to infrequent but severe hazards. Prioritizing interventions for the highest impact factors, supported by ongoing monitoring and sector-specific training, could contribute to reducing fatalities linked to human factors in construction. Future research may expand this approach by incorporating additional contextual variables, such as project size, workforce composition, or seasonal effects, to further refine risk assessments and prevention strategies. The approach demonstrated in this study can be incorporated into routine safety performance reviews, enabling companies and regulators to monitor emerging high-risk factors and adjust prevention programs accordingly.
Author Contributions
Conceptualization, S.Z., M.S., K.W., and F.F.; methodology, S.Z., M.S.; validation, S.Z.; analysis, S.Z.; investigation, S.Z., M.S., K.W., and F.F.; resources, M.S., K.W., and F.F.; data curation, S.Z., M.S.; writing—original draft preparation, S.Z., M.S., K.W., and F.F.; writing—review and editing, S.Z., M.S., K.W., and F.F.; visualization, S.Z.; supervision, S.Z.; project administration, S.Z. All authors have read and agreed to the published version of the manuscript.
Funding
This research received no external funding.
Data Availability Statement
Data is available in the Occupational Safety and Health Administration (OSHA) occupational safety database here: https://www.osha.gov/data (accessed on 23 September 2026).
Conflicts of Interest
The authors declare no conflicts of interest.
References
- Bureau of Labor Statistics, U.S. Department of Labor. A Look at Workplace Deaths and Nonfatal Injuries and Illnesses for Workers’ Memorial Day. The Economics Daily, 28 April 2023. Available online: https://www.bls.gov/opub/ted/2023/a-look-at-workplace-deaths-and-nonfatal-injuries-and-illnesses-for-workers-memorial-day.htm (accessed on 22 August 2026).
- Bureau of Labor Statistics, U.S. Department of Labor. National Census of Fatal Occupational Injuries in 2024; USDL-26-0230; Bureau of Labor Statistics: Washington, DC, USA, 19 February 2026. Available online: https://www.bls.gov/news.release/cfoi.nr0.htm (accessed on 23 September 2026).
- Garrett, J.W.; Teizer, J. Human factors analysis–classification system relating to human error awareness taxonomy in construction safety. J. Constr. Eng. Manag. 2009, 135, 784–798. [Google Scholar] [CrossRef] [Scilit]
- Forsythe, P. Proactive construction safety systems and the human factor. Proc. Inst. Civ. Eng. Manag. Procure. Law 2014, 167, 242–252. [Google Scholar] [CrossRef] [Scilit]
- Chen, Y. The development and validation of a Human Factors Analysis and Classification System for the construction industry. Int. J. Occup. Saf. Ergon. 2020, 28, 479–493. [Google Scholar] [CrossRef] [Scilit] [PubMed]
- Tang, N.; Hu, H.; Xu, F.; Yeoh, J.K.W.; Chua, D.K.H.; Hu, Z. A personalized Human Factors Analysis and Classification System (HFACS) for construction safety management based on context-aware technology. Enterp. Inf. Syst. 2022, 16, 141–166. [Google Scholar] [CrossRef] [Scilit]
- Park, J.; Seong, S.; Park, S.; Kim, M.; Kim, H.Y. Multi-label material and human risk factors recognition model for construction site safety management. J. Saf. Res. 2024, 91, 354–365. [Google Scholar] [CrossRef] [Scilit] [PubMed]
- Marchiori, R.; Song, S.; Moon, J. Developing heat stress training assessments: A training-driven methodology approach to enhance safety in the construction industry. J. Saf. Res. 2025, 92, 262–271. [Google Scholar] [CrossRef] [Scilit] [PubMed]
- Xu, Y.; Wang, L.; Fang, D. A quantitative analysis framework for cognitive process of construction workers: Exploring impacts of safety leadership and safety culture. J. Saf. Res. 2025, 95, 251–264. [Google Scholar] [CrossRef] [Scilit] [PubMed]
- Zhang, F.; Wu, Z.; Zhang, Y.; Wang, Y. The effect mechanism of construction workers’ emotion on unsafe behavior: Mediating role of safety attitude and moderating role of emotional intelligence. J. Saf. Res. 2025, 95, 318–329. [Google Scholar] [CrossRef] [Scilit] [PubMed]
- Bochkovskyi, A.; Sapozhnikova, N. Minimization of the “human factor” influence in occupational health and safety. Sci. Bull. Natl. Min. Univ. 2019, 6, 95–102. [Google Scholar] [CrossRef] [Scilit]
- Wang, X.; Hu, X.; Wang, L.; Dong, B.; Tong, R. Identification of critical causes of construction accidents in China using a hybrid HFACS-CN model. Int. J. Occup. Saf. Ergon. 2024, 30, 378–389. [Google Scholar] [CrossRef] [Scilit] [PubMed]
- Ren, X.; Terwel, K.C.; Yang, M.; van Gelder, P.H.A.J.M. Critical human and organizational factors for structural safety in the Dutch construction industry. Am. J. Ind. Med. 2025, 68, S115–S130. [Google Scholar] [CrossRef] [Scilit] [PubMed]
- Liu, W.; Luo, X.; Liang, B.; Xie, J. Causal analysis and prevention strategies for safety risks in prefabricated building construction based on accident data and complex network theory. Buildings 2025, 15, 152. [Google Scholar] [CrossRef] [Scilit]
- Khan, M.; Gbiengu, P.; Ibrahium, A.; Nnaji, C. Investigating patterns and causes of struck-by accidents in roadway construction projects. Int. J. Occup. Saf. Ergon. 2025, 31, 1225–1246. [Google Scholar] [CrossRef] [Scilit] [PubMed]
- Sawacha, E.; Naoum, S.; Fong, D. Factors affecting safety performance on construction sites. Int. J. Proj. Manag. 1999, 17, 309–315. [Google Scholar] [CrossRef] [Scilit]
- Su, X.; Pan, J.; Grinter, M. Improving construction equipment operation safety from a human-centered perspective. Procedia Eng. 2015, 118, 290–295. [Google Scholar] [CrossRef] [Scilit]
- Galieriková, A. The human factor and maritime safety. Transp. Res. Procedia 2019, 40, 1319–1326. [Google Scholar] [CrossRef] [Scilit]
- Burlov, V.; Andreev, A.; Gomazov, F. Mathematical model of human decision–a methodological basis for the realization of the human factor in safety management. Procedia Comput. Sci. 2018, 145, 58–65. [Google Scholar] [CrossRef] [Scilit]
- Nykänen, M.; Puro, V.; Tiikkaja, M.; Kannisto, H.; Lantto, E.; Simpura, F.; Uusitalo, J.; Lukander, K.; Räsänen, T.; Teperi, A.-M. Evaluation of the efficacy of a virtual reality-based safety training and human factors training method: Study protocol for a randomized-controlled trial. Inj. Prev. 2020, 26, 503–510. [Google Scholar] [CrossRef] [Scilit] [PubMed]
- Krippendorff, K. Content Analysis: An Introduction to Its Methodology, 4th ed.; SAGE Publications: Thousand Oaks, CA, USA, 2018. [Google Scholar]
- Agresti, A. Categorical Data Analysis, 3rd ed.; John Wiley & Sons: Hoboken, NJ, USA, 2013. [Google Scholar]
- Phipson, B.; Smyth, G.K. Permutation p-values should never be zero: Calculating exact p-values when permutations are randomly drawn. Stat. Appl. Genet. Mol. Biol. 2010, 9, 39. [Google Scholar] [CrossRef] [Scilit] [PubMed]
- Freeman, G.H.; Halton, J.H. Note on an exact treatment of contingency, goodness of fit and other problems of significance. Biometrika 1951, 38, 141–149. [Google Scholar] [CrossRef] [Scilit]
- Benjamini, Y.; Hochberg, Y. Controlling the false discovery rate: A practical and powerful approach to multiple testing. J. R. Stat. Soc. Ser. B Stat. Methodol. 1995, 57, 289–300. [Google Scholar] [CrossRef] [Scilit]
- Virtanen, P.; Gommers, R.; Oliphant, T.E.; Haberland, M.; Reddy, T.; Cournapeau, D.; Burovski, E.; Peterson, P.; Weckesser, W.; Bright, J.; et al. SciPy 1.0: Fundamental algorithms for scientific computing in Python. Nat. Methods 2020, 17, 261–272, Correction in Nat. Methods 2020, 17, 352. https://doi.org/10.1038/s41592-020-0772-5. [Google Scholar] [CrossRef] [Scilit] [PubMed]
- Occupational Safety and Health Administration (OSHA), U.S. Department of Labor. Commonly Used Statistics. Available online: https://www.osha.gov/data/commonstats (accessed on 6 August 2026).

Disclaimer/Publisher’s Note: The statements, opinions and data contained in all publications are solely those of the individual author(s) and contributor(s) and not of MDPI and/or the editor(s). MDPI and/or the editor(s) disclaim responsibility for any injury to people or property resulting from any ideas, methods, instructions or products referred to in the content. |
© 2026 by the authors. Licensee MDPI, Basel, Switzerland. This article is an open access article distributed under the terms and conditions of the Creative Commons Attribution (CC BY) license.