


Abstract
Determining the construction age of vernacular buildings is essential for the conservation and documentation of historical and cultural heritage. Traditional approaches, however, rely heavily on questionnaire surveys and expert judgment, which can be time-consuming and may be affected by incomplete historical information and variability in expert interpretation. To reduce reliance on direct expert assessment of construction age and improve the reproducibility of the dating process, this paper presents a machine-learning-assisted method for predicting construction age from manually coded facade features derived from building images. First, we visited 29 villages in the Dezhou region of China and compiled 630 vernacular building cases, creating a facade image dataset that spans multiple periods and architectural styles, with construction ages labeled as time intervals; human observers then coded 14 facade attributes for each building before model training. Random forest and decision tree models were then introduced to identify the core factors influencing age determination from a wide range of facade features and to establish their quantitative criteria. The results reveal that wall finishing materials, the presence of sunrooms, window materials, and wall body materials are the core factors affecting the judgment of construction age. Based on these factors, a decision tree model was constructed for age determination. This model achieved an accuracy of 97.62% on the test set, with both precision and recall exceeding 97% and an F1 score of 0.975, demonstrating the effectiveness and robustness of the proposed quantitative classification system. Within the Dezhou study setting and the coded time intervals, the method offers an interpretable and accurate technical pathway for supporting the dating of vernacular architectural heritage.
1. Introduction
As an essential component of historical and cultural heritage, vernacular architecture embodies the social memory, construction wisdom, and cultural genes of specific regions [1]. Unlike official buildings, which benefit from relatively systematic documentary records and formalized regulations, vernacular buildings are typically constructed by local craftsmen relying on traditional experience and customs. Information about their construction age is often scattered across oral histories, genealogies, and local chronicles, or is preserved only in the material traces of the buildings themselves [2]. Accurately determining the construction period of vernacular buildings not only plays a fundamental role in value assessment, conservation strategy formulation, and restoration interventions for architectural heritage [3], but also provides key clues for understanding the evolution of regional settlements, socio-economic development, and changes in vernacular construction systems [4]. However, traditional methods, including documentary research, stylistic comparison, and carbon-14 dating [5], encounter problems such as data scarcity, insufficient sample representativeness, and high costs. When applied to vernacular building complexes that are widely distributed, large in number, and span a long time period, such as those in Dezhou City [6,7], these methods struggle to systematically support large-scale age determination. Therefore, developing an accurate and practical intelligent dating method for vernacular dwellings is not only a technical necessity in the era of digital humanities, but also an urgent requirement to address critical issues such as chronological misalignment in conservation practice.
In recent years, the interdisciplinary integration of architectural archaeology [8] with computer vision [9], machine learning [10], and related technologies has opened up new possibilities for dating vernacular buildings. Previous studies on architectural typology and morphological analysis have shown that facade characteristics can reflect changes in construction materials, building techniques, proportions, and decorative practices across different historical periods [8,11]. Accordingly, facade elements may provide observable indicators for identifying chronological differences in vernacular architecture. By collecting facade images on a large scale, manually identifying and encoding quantifiable facade characteristics [11], and employing highly interpretable machine learning models such as random forests and decision trees [12] for age classification, it becomes possible to reveal statistical regularities between architectural characteristics and age while also establishing a relatively low-cost and reusable inference pathway for vernacular building groups that lack written records.
2. Research Review
2.1. Different Methods for Determining Building Dates
The dating of vernacular architecture has drawn on an increasingly diverse range of methods, spanning historical documentary research, field surveys and interviews, and computational analysis techniques that have emerged in recent years. To clarify the scope and limitations of each approach, this paper classifies them into three categories, namely documentary analysis, field survey, and machine learning, and evaluates their respective advantages and disadvantages by drawing on existing studies (Table 1).
Table 1.
Comparison of different methods for determining building dates.
Table 1 shows that these methods serve different and complementary purposes. Documentary methods provide relatively reliable chronological evidence when records are available, while field surveys help fill information gaps for vernacular buildings without written documentation. Machine-learning methods offer a scalable approach for identifying relationships between architectural features and construction periods. In this study, documentary and field evidence are used to establish or verify construction-period labels, while machine learning is used for systematic classification based on coded facade features.
2.1.1. Documentary Analysis
Documentary analysis relies mainly on written materials such as local gazetteers, stone inscriptions, inscriptions on beams, genealogies, and related poetry and prose notes to infer the construction date of a building either directly or indirectly. It remains the most fundamental tool in traditional architectural historiography. Direct evidence includes records in local gazetteers specifying the construction date and scale of particular buildings. For example, the Zhangpu County Gazetteer records that after the 40th year of the Jiajing reign, coastal communities built large numbers of tulou, a reference that can be used to establish the upper chronological limit for a group of such buildings [19]. Many public buildings feature steles that record the year and month of their construction, such as bridge head steles and temple steles, thereby providing precise dates [15]. Scholars like Liang Sicheng found that the inscription on a beam in the East Hall of Foguang Temple and the text on the scripture pillar outside the hall corroborated each other, thus dating the hall to the 11th year of the Dazhong reign of the Tang dynasty, a classic case of mutual verification between documents and physical evidence [13]. Some literary works also preserve the renovation history of buildings. Fan Zhongyan’s Record of Yueyang Tower documents the year when Teng Zijing renovated Yueyang Tower, which is of considerable value for determining the construction and reconstruction periods of such famous structures [13]. Apart from direct records, documentary analysis frequently adopts indirect inference strategies, that is, deducing the date of the target building through the activities of related figures, genealogical lineages, or the construction dates of connected projects. For instance, if the wall of a vernacular dwelling rests on the steps of Tongji Bridge, whose construction date is known, the dwelling’s date can be inferred from the bridge stele that records the reason for and time of the bridge’s construction [14]. Such indirect textual research uses associated written records to establish upper or lower time limits for a building’s date, thereby expanding the application scope of the documentary method.
In terms of strengths, ancient books, steles, and gazetteers carry high authority and often provide precise dates or relatively reliable temporal cross-sections. The limitations of this method, however, are equally prominent. Official histories, gazetteers, and steles predominantly focus on official buildings or important public structures, while a vast number of scattered vernacular dwellings are virtually absent from written records [15]. Moreover, steles are susceptible to weathering, damage, or deliberate destruction, resulting in incomplete texts and loss of information [14]. Although indirect inference can overcome the dilemma of having no direct records, it is highly dependent on the complete preservation of related documents and physical remains. Once a link in the chain is missing, the inference lacks a solid foundation.
2.1.2. Field Survey
The field survey method relies primarily on interviews and questionnaires, collecting oral accounts of the construction and renovation history of buildings through face-to-face communication with local residents, craftsmen, or informants. Interviews are especially suitable for the numerous ordinary vernacular dwellings that have never left any written records, filling gaps in the literature and offering references for establishing the relative chronology of building dates [8]. Questionnaire surveys, on the other hand, are better suited to conducting large scale general surveys of vernacular architecture, allowing the rapid collection of batch information on the distribution of regional building dates and facilitating statistical analysis and comparison [16].
The key strength of the field survey method lies in its flexibility and directness, enabling the collection of living information not recorded in documents and holding considerable significance for the study of architectural history in nonliterate societies and marginal settlements. Its limitations, however, are equally evident. Oral accounts depend heavily on the memory and expression of interviewees, often suffering from memory biases, chronological ambiguity, and even the conflation of construction events from different periods. Questionnaire results are even more subjective, since the personal judgment and educational background of respondents can significantly affect the accuracy of chronological descriptions [16]. Consequently, the chronological information obtained through field surveys can typically serve only as clues or corroborative evidence and must be cross-verified with documents or other objective evidence through multi-source triangulation.
2.1.3. Machine Learning Method
In recent years, machine learning techniques, especially deep learning, have been introduced into the identification and dating of architectural heritage, aiming to achieve automated or semi-automated batch dating. Existing approaches can be broadly grouped into two categories. The first involves directly learning to classify building images. For example, researchers constructed a dataset of Longzhong vernacular architecture images spanning four periods and compared different algorithmic models, finding that EfficientNet performed best in the date classification task, with an accuracy of 85.1% and an F1 score of 81.1% [17]. The second approach builds an object detection and classification system upon a typological framework. For instance, researchers applied a machine learning clustering scheme to develop a vernacular architecture classification system comprising 9 major categories and 23 subcategories, and trained a recognition model using the YOLOv8 algorithm, achieving good accuracy and robustness [18].
The primary advantage of machine learning methods is their high efficiency. They can process massive quantities of building images in batches and detect morphological and stylistic features that are not easily discernible to the human eye, free from interference by subjective experience [20]. However, these methods depend heavily on large volumes of high-quality, manually annotated data. The scale of the dataset, its geographic coverage, and the accuracy of the chronological labels directly determine model performance. Furthermore, vernacular architecture images commonly suffer from class imbalance and gradual stylistic transitions. Without targeted adjustments to training strategies, models tend to be biased toward the majority class, leading to systematic misjudgments for buildings of certain periods. In the present study, the relatively sharp material discontinuities observed in the Dezhou dataset—notably the 1980s shift from lime plaster to red brick and the 1990s transition from lime to cement finishes—should not be interpreted as evidence that construction periods can generally be separated by single variables. Because we prioritized buildings with clear chronological evidence and relatively good preservation, the dataset overrepresents well-preserved buildings with typical period features and underrepresents buildings that underwent later renovation, material mixing, or stylistic transition. These omitted cases would blur class boundaries and weaken the apparent dominance of any single variable. We therefore now interpret the decision tree as capturing the most typical feature combinations within the selected sample, rather than as demonstrating that construction periods can be universally distinguished by a single attribute. This sample-selection effect may also explain why the simple CART model achieves high accuracy without contradicting the broader observation that architectural transitions are often gradual in other contexts [21]. Machine learning methods are therefore currently best suited as auxiliary tools, complementing documentary analysis and field surveys in the comprehensive assessment of building dates.
The present study is positioned within this gap. Rather than replacing documentary and field methods, documentary evidence and oral-history information are first used to establish construction-period labels, while manually coded facade characteristics are subsequently analyzed using machine learning [22]. The objective is therefore to examine whether observable facade features can support a reproducible and interpretable construction-period classification system within a geographically controlled regional context.
2.2. Factors Influencing the Dating of Vernacular Architecture
A building’s physical form and stylistic features carry distinct temporal information and provide the primary basis for inferring the construction date of vernacular architecture in the absence of direct written records. Based on existing research, these features can be categorized into three dimensions: structural form, building materials, and façade characteristics, which respectively reflect the temporal coordinates of building traditions, technological evolution, and aesthetic trends at different scales.
2.2.1. Structural Form
The structural system forms the fundamental skeleton of a building, and its evolution follows a clear technological trajectory. Traditional vernacular architecture has long been dominated by timber structures. For example, in the Longzhong region, farmhouses built before 1911 commonly employed a load-bearing system combining rammed earth walls and timber frames [17]. In the first half of the 20th century, hybrid structures began to emerge. The first multi-story residences in Shanghai in 1923 already used concrete block load-bearing walls [23], and during the same period, stone houses in northern Taiwan were retrofitted with light steel under Japanese rule, signaling the introduction of modern structural materials [24]. In rural Gansu, sporadic use of brick–concrete construction occurred between 1912 and 1949 but did not become widespread; brick–concrete structures gradually entered villages from 1950 to 1980, and after 1981 they extensively replaced traditional earth–wood structures [17]. In the rural areas of Hunan, the boom in two-story house construction around 1995 clearly witnessed brick–concrete structures replacing brick–wood ones [25]. In the villages of southern Jiangsu, self-built houses in the 1980s were mostly of mixed brick–wood construction and predominantly used hand-processed building materials, whereas after the turn of the 21st century they shifted entirely to cast-in-situ brick–concrete structures, with industrialized prefabrication and on-site pouring becoming the norm [16]. This orderly succession of structural forms provides a relatively reliable macro-level benchmark for dating vernacular architecture and also points to potential regional variations in structural preferences and evolutionary trajectories. Given that the present study focuses on Shandong, China, the above review primarily draws on representative cases from selected regions of China; although the specific trajectories and timing of structural evolution vary across countries and regions, the general pattern remains comparable, whereby buildings constructed in different historical periods tend to exhibit characteristic structural forms associated with the prevailing technologies and construction practices of their time.
2.2.2. Building Materials
The emergence, spread, and combination of materials carry strong period imprints, making them the most intuitive material indicators for dating [14]. Between the two world wars, new materials such as steel and concrete frames began to be gradually adopted by builders [23]. Coastal areas exhibited distinct regional and temporal characteristics. For instance, in self-built houses along the Quanzhou coast in the 1960s, both single-story and multi-story detached dwellings were entirely constructed of stone, with stone slab roofs becoming mainstream [26]. The evolutionary sequence of building materials in the rural Longzhong region of Gansu is particularly illustrative. Before 1911, rammed earth and wood predominated; over the following nearly half a century, brick gradually infiltrated; and it was not until after 1981 that brick and concrete completely replaced traditional raw earth materials [17]. After the 1990s, industrial building materials such as red brick, concrete blocks, steel reinforcement, and even glass spread rapidly in rural areas, replacing indigenous materials like earth, wood, and stone [27,28,29]. The choice of building materials in different periods not only reflects available construction resources and technological levels but also provides highly practical references for dating.
2.2.3. Façade Characteristics
The building façade offers a concentrated display of period style and regional customs. Façade characteristics are not identical across geographical regions; rather, their forms, materials, and decorative expressions vary according to local climate, available materials, construction traditions, and cultural context. Nevertheless, within a specific regional context, their morphological elements can provide important supporting evidence for dating. The form, color, and material of the roof directly reflect temporal shifts in aesthetics and craftsmanship [30]. The transition of windows from small wooden lattice types to large aluminum-alloy frames and glass curtain walls, in both material and shape, provides subtle clues for periodization [31,32]. The materials and decoration of doors likewise embody the craftsmanship characteristics of specific periods [33]. Façade decorations such as murals, wood carvings, and colored stones are often closely linked to the folk customs and artisan traditions of particular historical periods, and the rise and fall of styles and techniques can serve as dating references [34]. The evolution of spatial configuration, including the shift from single-bay to multi-bay plans, from single-story to multi-story buildings, and the increase in the number of floors, reflects the construction era in terms of overall volume [35]. The development of walls from traditional masonry walls to the appearance of glass curtain walls also marks the temporal boundary of construction technology and style [36,37]. Together with structural forms and materials, these façade features form a comprehensive basis for determining the age of vernacular architecture.
3. Research Methods
3.1. Research Process
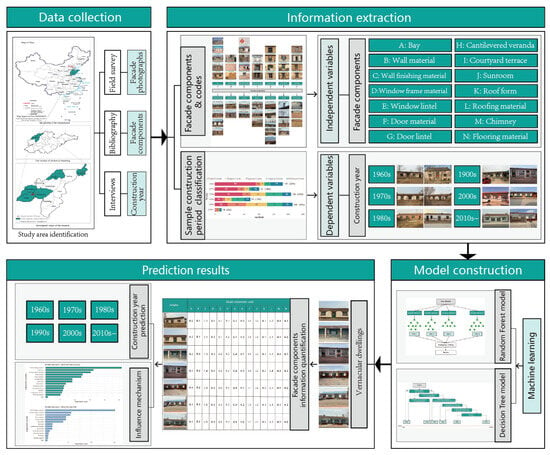
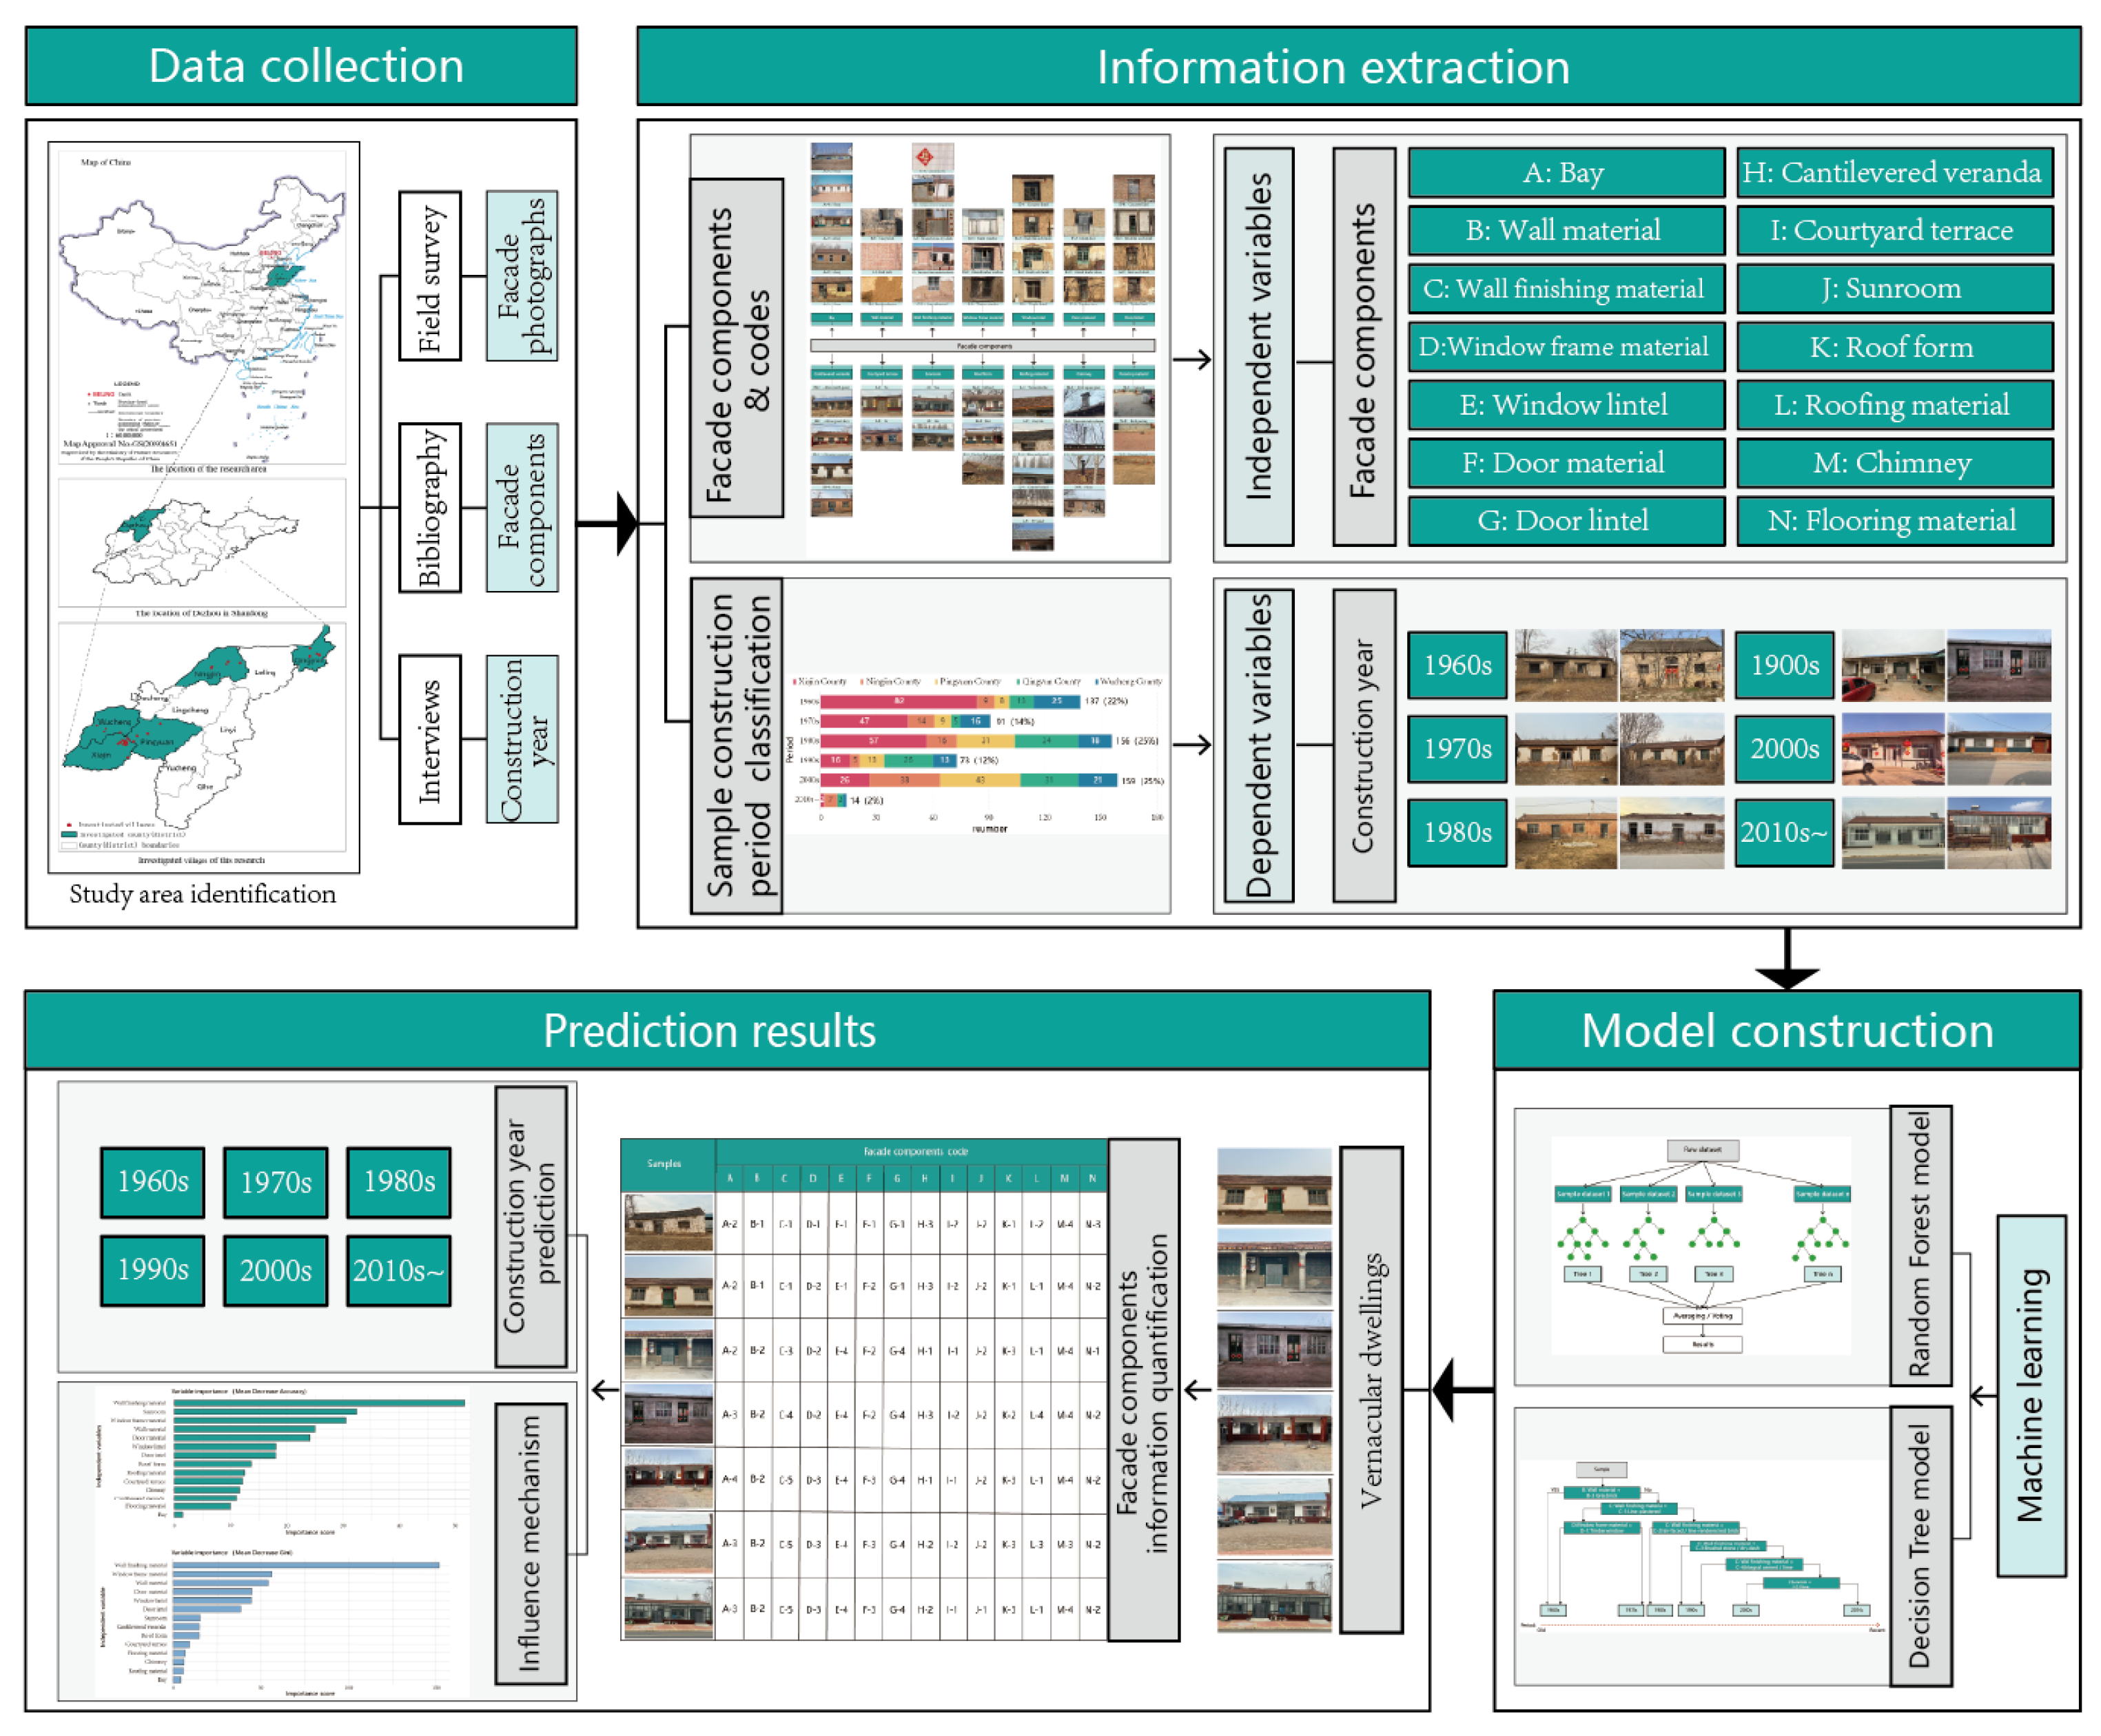
The overall research workflow consists of four main stages, as illustrated in Figure 1. First, the research object and scope are defined. Given that architectural facade characteristics vary considerably across regions, a geographical unit with relatively homogeneous facade styles is selected to minimize the confounding effects of other factors on construction date prediction. Second, within the delineated study area, the facade features and construction dates of vernacular buildings are collected through fieldwork and interviews. Third, the facade characteristics are manually identified and coded into standardized categorical variables, after which random forest and CART models are constructed to examine their relationship with construction period. The random forest is used for predictive evaluation and feature-importance analysis, whereas the CART model is used to derive an interpretable set of classification rules. Finally, the model is applied to estimate the construction dates of vernacular buildings in the study area based on their coded facade features, and its predictive accuracy is verified using an independent test set that is not involved in feature selection or model tuning.
Figure 1.
The proposed research workflow of the study.
3.2. Research Area
Dezhou is situated on the Northwest Shandong Plain. Its vernacular architecture integrates the dual influences of the vernacular dwellings of northwestern Shandong and the courtyard houses of Beijing as the imperial capital, resulting in a distinctive regional architectural character in which facade materials, construction techniques, and architectural components exhibit recognizable changes over successive construction periods. This relative regional consistency provides a controlled setting in which the relationship between facade characteristics and construction period can be examined while reducing, although not completely eliminating, geographical heterogeneity.
Drawing on facade images of 630 vernacular buildings in Dezhou as the data foundation, as summarized in Table 2, this study manually records 14 facade attributes from the orthophotographs and constructs a Random Forest model and a Decision Tree model. The aim is to explore the applicability, accuracy, and interpretability of machine learning methods in dating vernacular architecture on the North China Plain, thereby addressing gaps in existing research concerning regional coverage and methodological frameworks and providing technical support for the conservation and management of vernacular architectural heritage. The study is intended as a regionally bounded validation of this methodological framework rather than evidence of universal applicability to vernacular buildings in different geographical and cultural contexts.
Table 2.
Distribution of surveyed village samples in Dezhou.
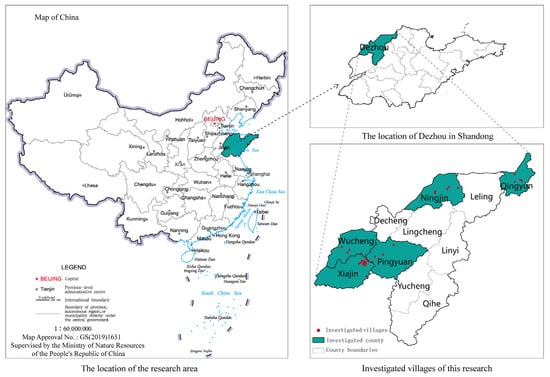
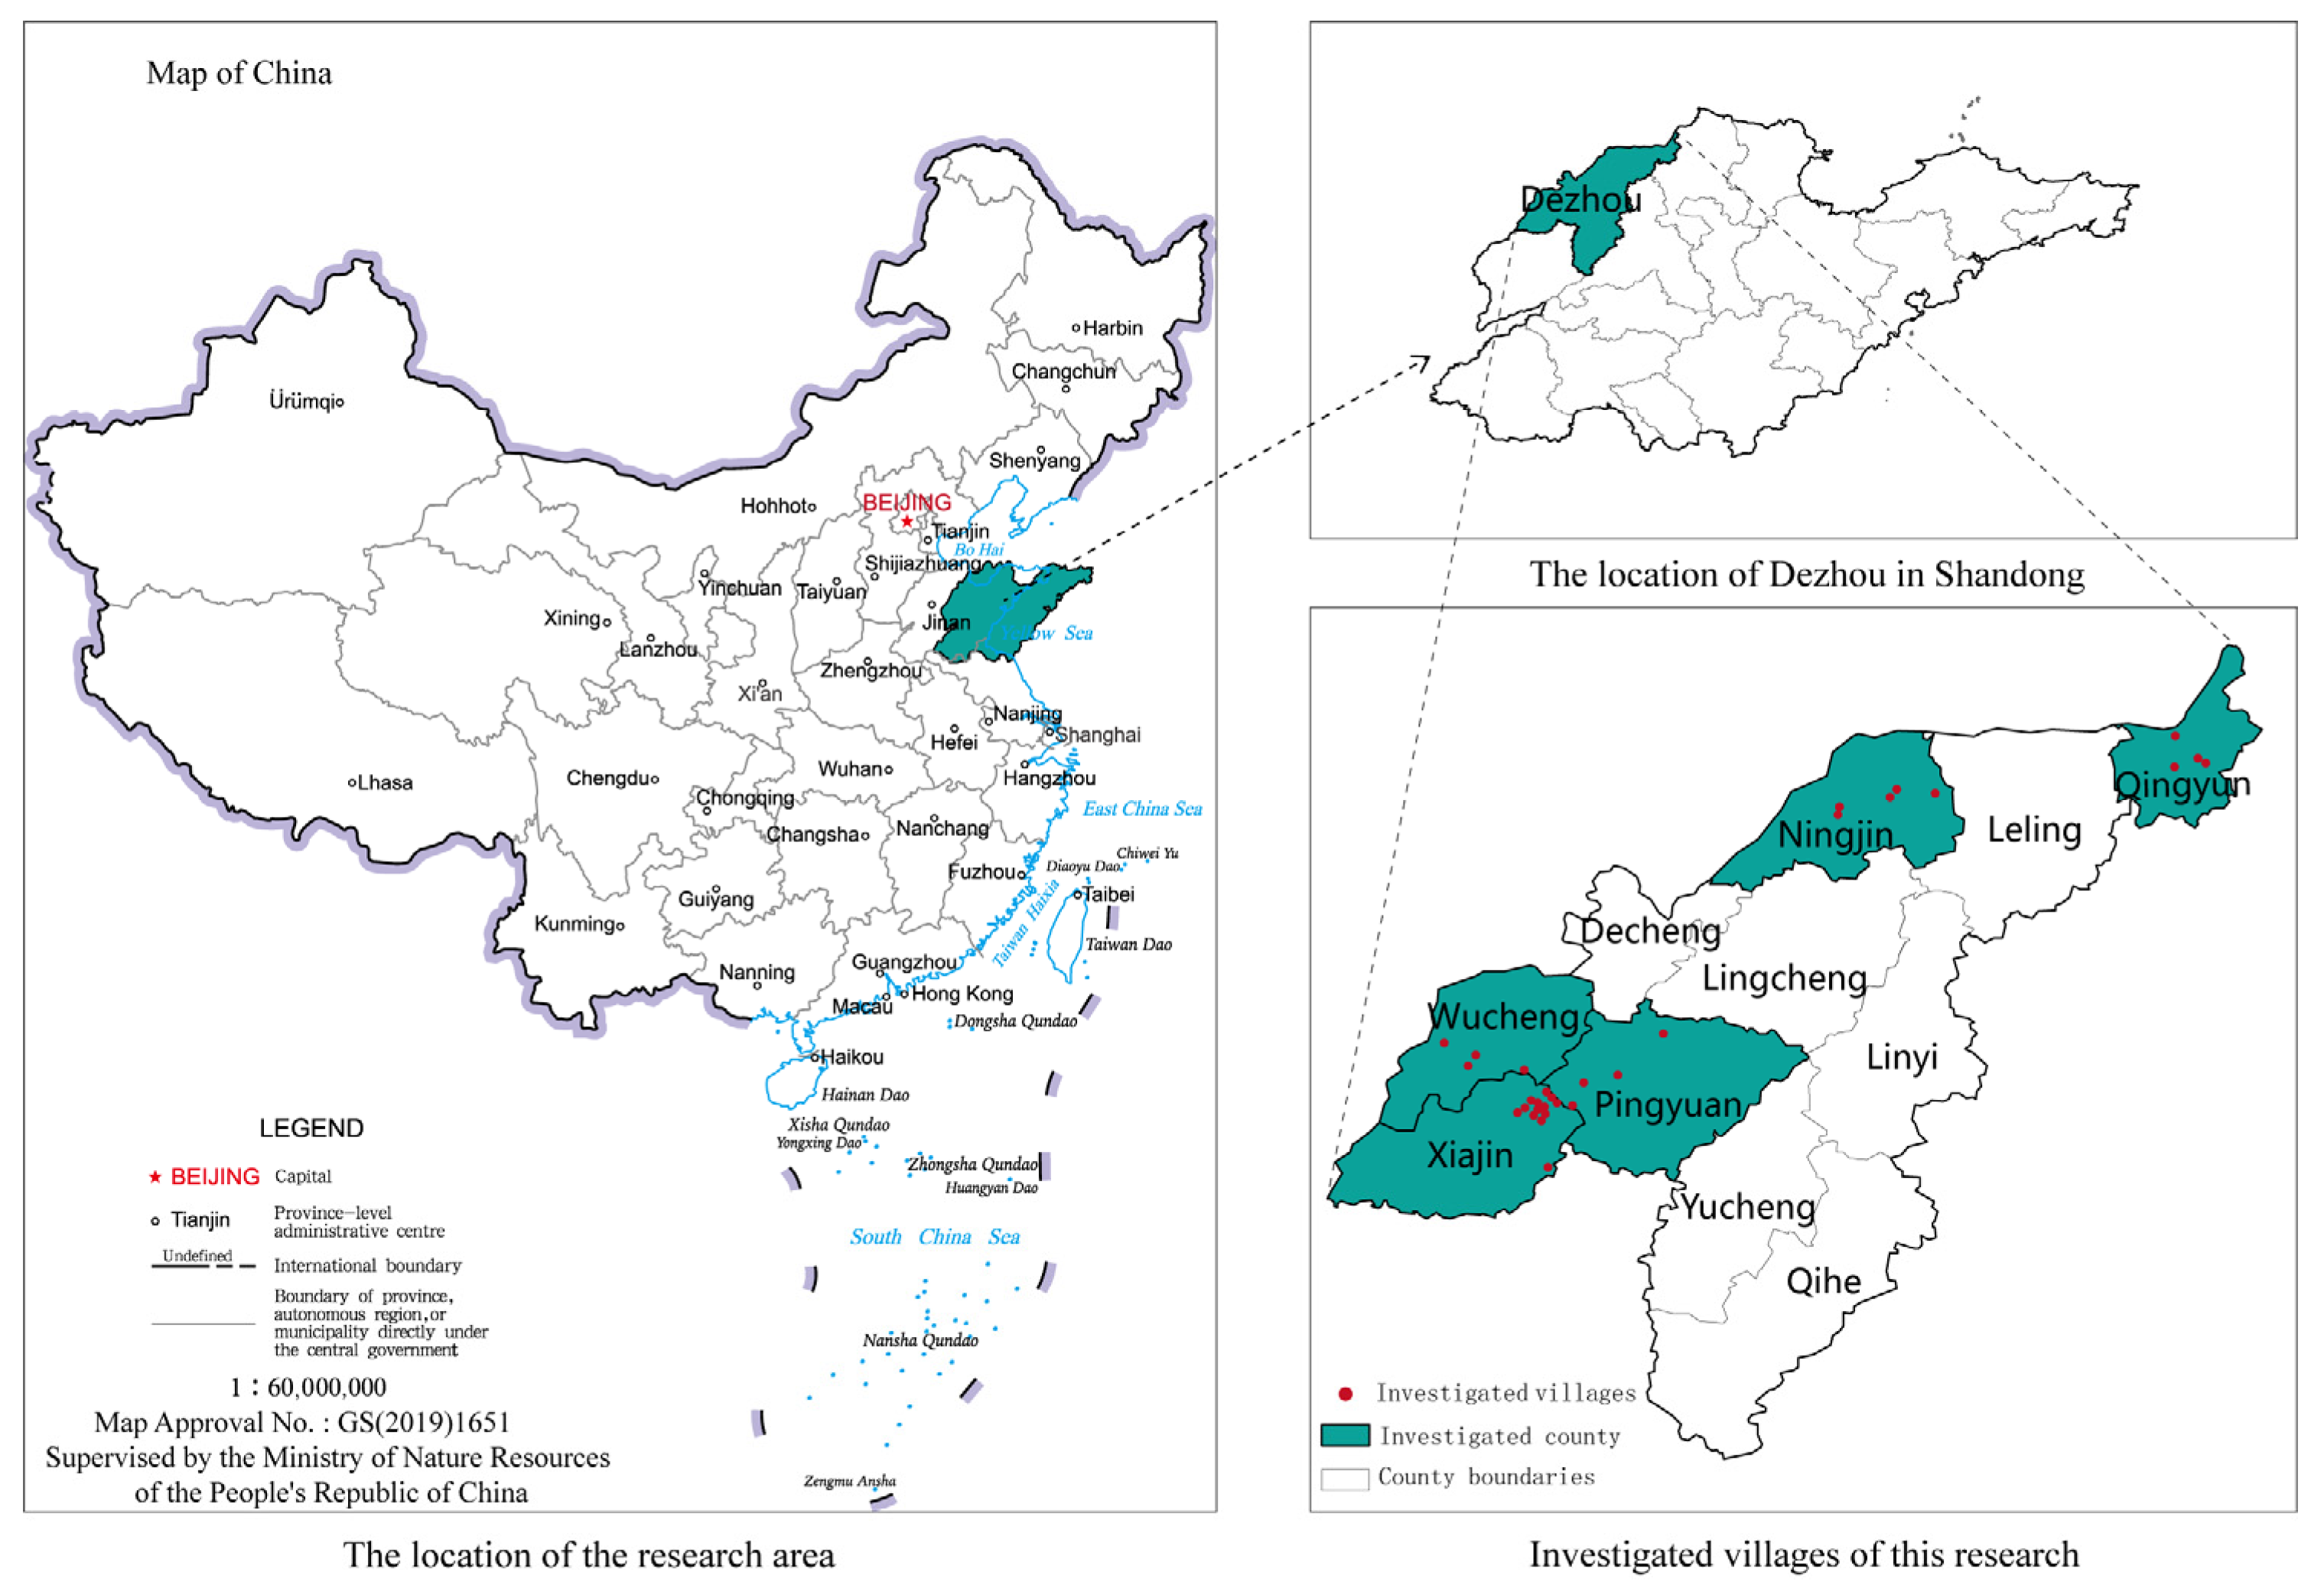
The research team conducted fieldwork from January to February 2026 in typical traditional villages across five counties under the jurisdiction of Dezhou City, Shandong Province, namely Ningjin County, Pingyuan County, Wucheng County, Xiajin County, and Qingyun County (Figure 2). A combined strategy of stratified sampling and convenience sampling was adopted. Vernacular buildings with explicit construction date information from inscriptions, genealogies, title deeds, and building inscriptions were selected as research subjects, with selection guided by the historical evolution of the villages, building preservation conditions, and geographical distribution. A total of 630 orthophotos of building façades were collected, each corresponding to a single vernacular building. The photographs were taken under even lighting conditions, with minimal obstructions and while maintaining the structural integrity of the main building. Each building was subsequently assigned a construction date label through documentary research and oral history interviews.
Figure 2.
The selection of the study area and its geographical location in China.
3.3. Data Collection
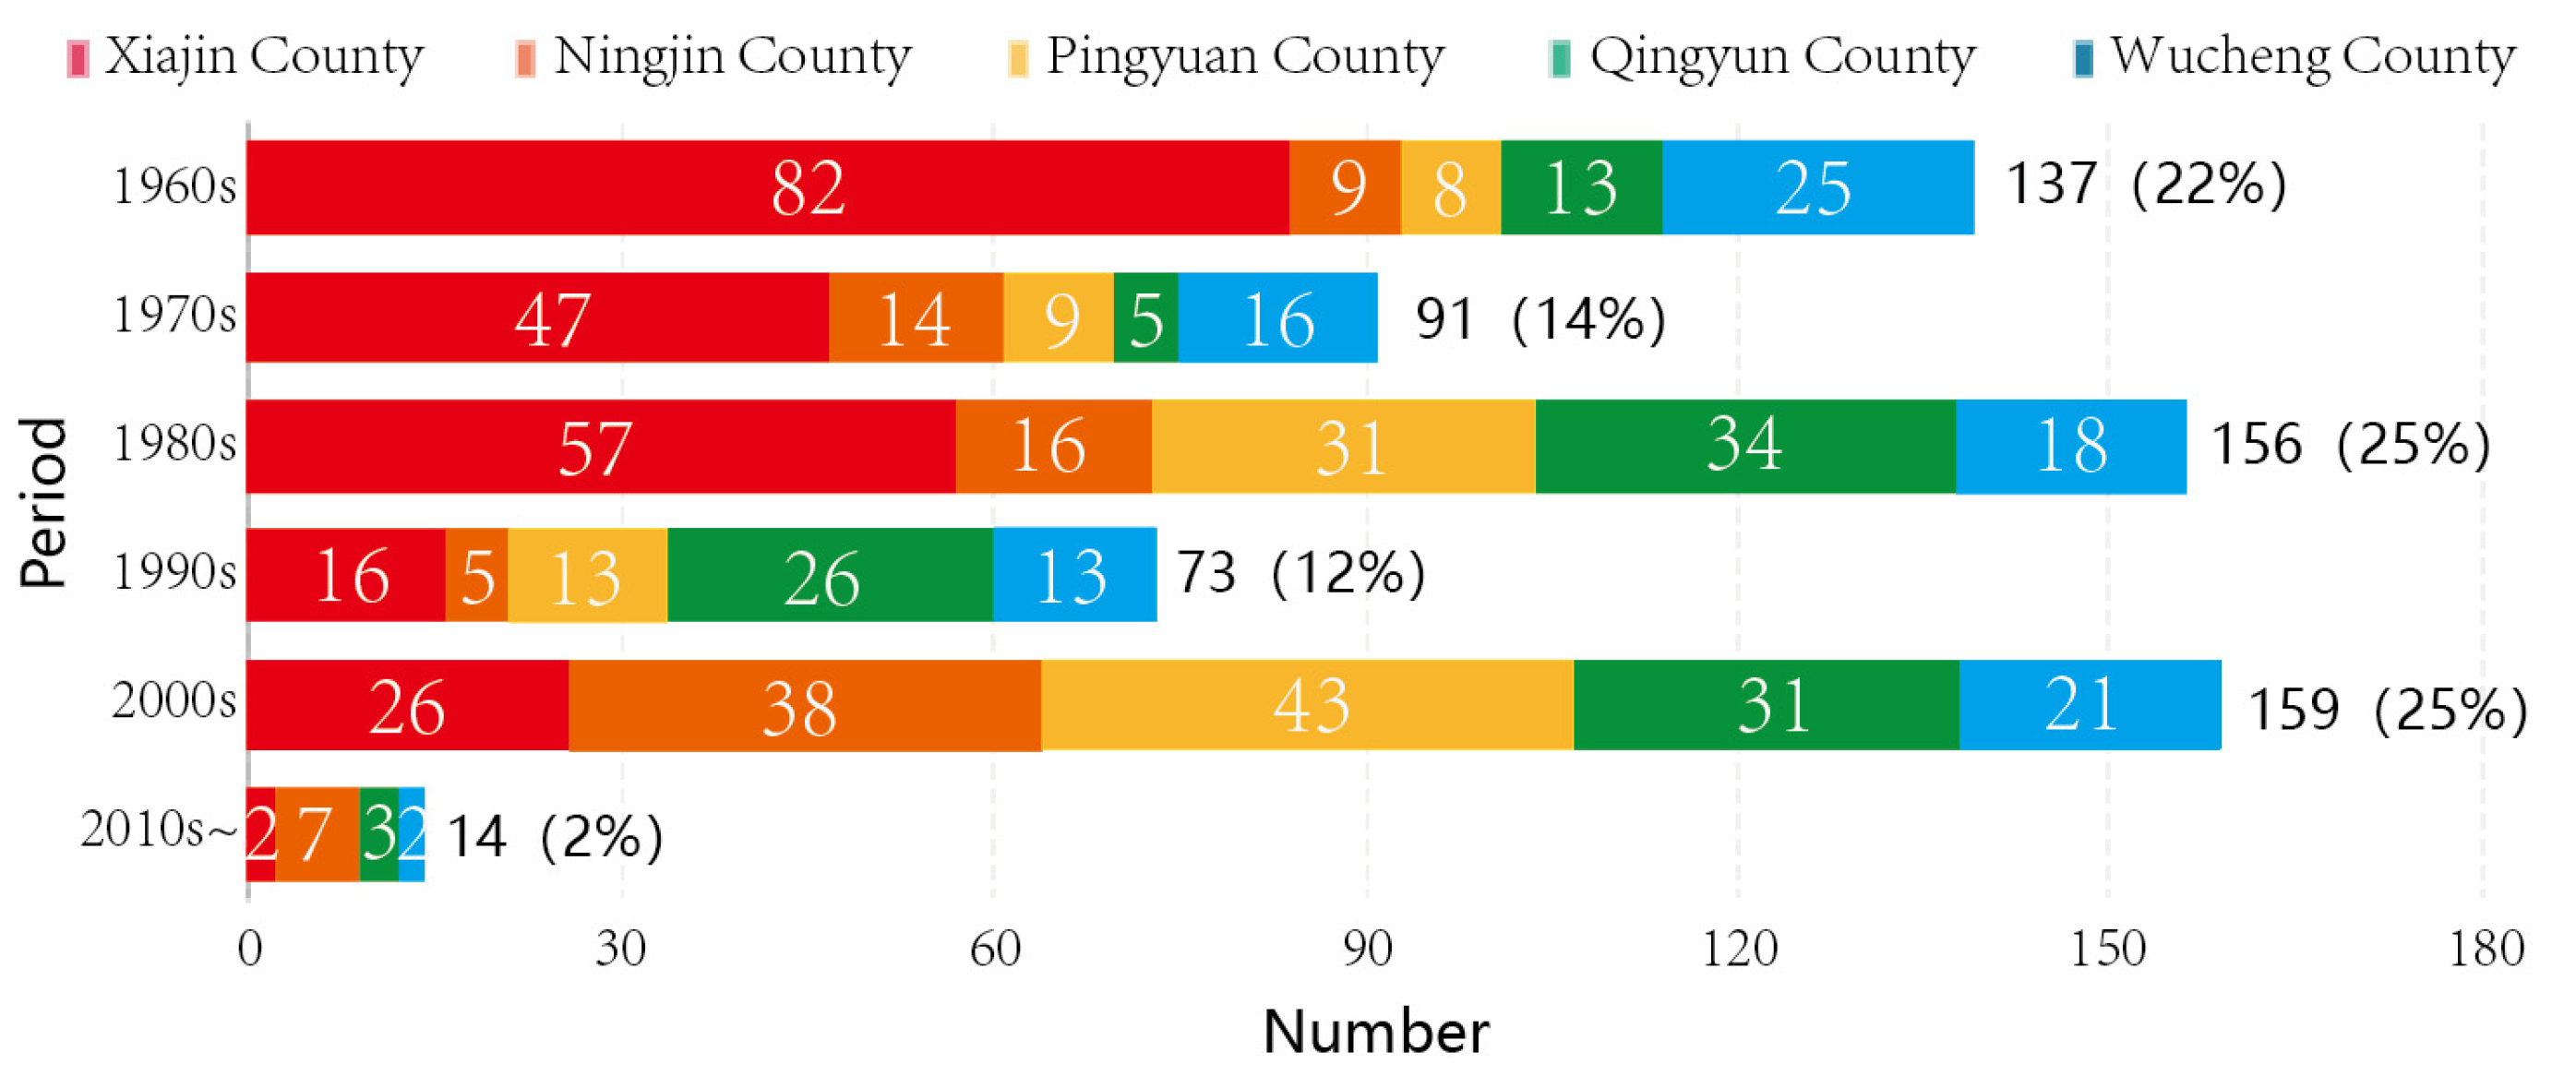
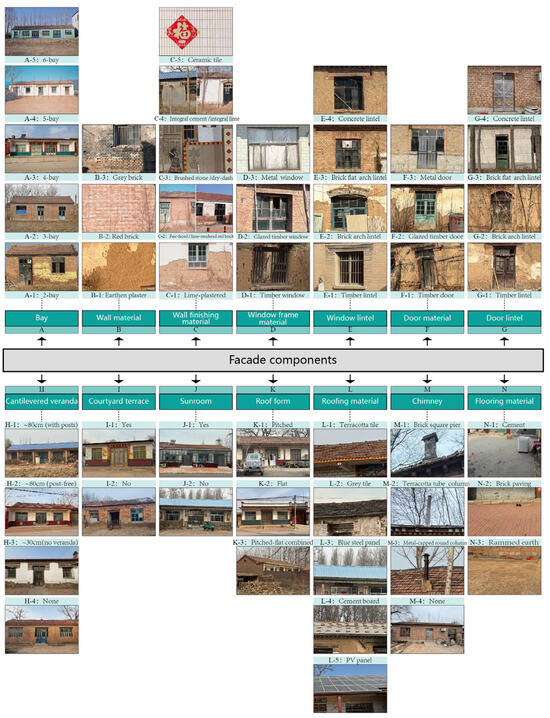
Drawing on a review of the building dating literature, the classification and summarization of field survey samples, and the historical periodization of vernacular architecture on the North China Plain together with the local architectural evolution patterns of Dezhou, this study extracted facade feature elements from the 630 samples and identified 14 facade elements that influence the determination of construction dates (Figure 3). These elements are wall material, roof material, door material, window material, floor material, bay, wall finish material, overhanging eaves and veranda, roof form, courtyard platform, chimney, sunroom, window lintel, and door lintel [38].
Figure 3.
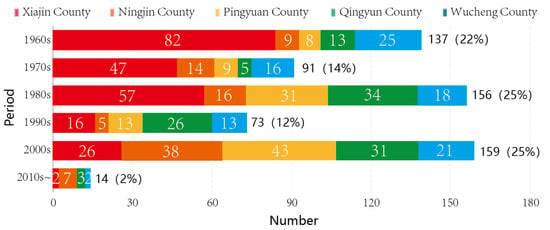
Distribution of samples by construction period.
The construction dates of the surveyed samples were divided into six periods: the 1960s, 1970s, 1980s, 1990s, 2000–2012, and 2013 onward. The year 2013 was adopted as a local chronological threshold rather than following a strict decade-based division. This threshold reflects changes in rural housing construction around this period following the implementation of the Regulations of Shandong Province on Urban–Rural Planning in December 2012 and the continued strengthening of provincial policies on rural housing construction and dilapidated-house renovation. These policy changes were accompanied by more standardized rural housing construction and noticeable changes in self-built dwellings. After screening, a total of 630 valid samples were obtained. The number of samples in each period category is as follows: 137 from the 1960s, 91 from the 1970s, 156 from the 1980s, 73 from the 1990s, 159 from 2000–2012, and 14 from 2013 onward.
3.4. Information Extraction
During field visits, facade photographs and construction-period evidence were collected together. All attribute coding followed a pre-defined feature inventory (e.g., wall material categories, finish types, window materials) applied uniformly across samples. Period labels were not included on the coding forms. However, because facade photographs and construction-period evidence were collected during the same field visit, and because no separate coding team, anonymization procedure, or delayed linkage was used, we do not claim full field-level or coding-stage blinding.
- (1)
- Matching each building with its case name and construction-period label.
For each building sample, the facade feature information was first matched one-to-one with the corresponding case name and construction-period label.
- (2)
- Converting categorical facade attributes into standardized numeric codes.
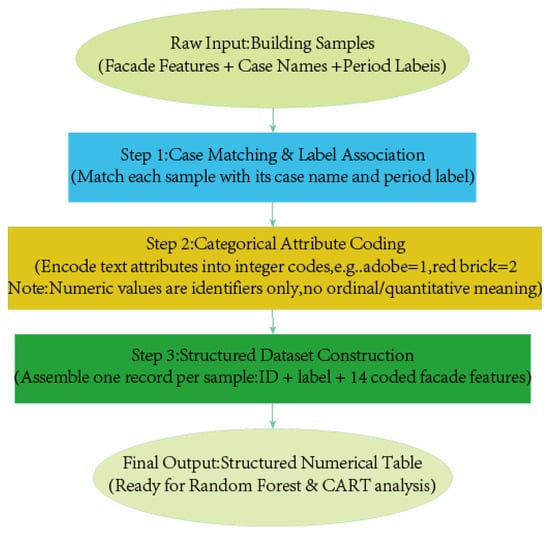
The categorical facade attributes were then converted into standardized numeric codes, as illustrated in Figure 4. For example, different wall materials such as adobe, red brick, and blue brick were assigned different category codes. This coding process was used only to standardize data input; the numerical values do not represent any ordinal or quantitative relationship among categories. Converting the original text-based facade information into standardized codes also reduces potential errors caused by inconsistent text formats, punctuation, or character encoding and facilitates subsequent data processing in RStudio (version 4.5.3, released on 2026-03-11).
Figure 4.
Facade elements and their coding.
- (3)
- Organizing the coded 14 facade features as structured inputs for the Random Forest and CART models.
The structured categorical data were then used as the input for the subsequent Random Forest and CART analyses (Figure 5). Although the decision tree algorithm in the rpart package (version 4.1.24) can handle factors, memory or splitting performance problems can easily arise when there are too many levels. By assigning numeric codes, for instance 1 for pure wood windows and 2 for glass wood windows, the data become a clean integer vector and parsing errors are completely avoided. When searching for the best split point, the internal algorithm of random forest processes numeric integer variables in a manner that is generally simpler and more efficient than processing categorical factor variables.
Figure 5.
Information extraction process steps.
To ensure accurate correspondence among facade feature elements, construction periods, and case names, and to facilitate model input and result traceability, each building sample was organized using a standardized coding structure consisting of three components: a unique case identifier, a construction-period label, and numerical codes for the 14 facade features. A separate coding mapping table was established to define the meaning of each numerical value for every facade variable. Each surveyed sample was assigned a unique identifier, as shown in Table 3, and all facade features were converted to numerical values following this coding system. This structure ensures that each coded feature can be traced back to its original architectural meaning and corresponding building sample, thereby improving data consistency and result interpretability.
Table 3.
Example of the building facade feature element information table.
3.5. Model Construction
This study adopts a data-driven approach, treating the construction period as the dependent variable and the 14 facade element features extracted from over 600 building samples as independent variables. Considered comprehensively from the dimensions of time, mechanics and construction, and social culture, these elements can reflect the era’s technological level, social aesthetics, mechanical properties, lifestyles, and foreign cultural influences. A machine learning classification framework based on Random Forest and Decision Tree was constructed to perform this inference [39]. To prevent information leakage from the test set, the complete modeling procedure followed a strictly separated training–validation–testing workflow. The independent test set was excluded from all stages of feature ranking, feature selection, model tuning, and tree pruning, and was used only once for the final evaluation of predictive performance. The underlying principles and specific steps of the analytical process are described below.
3.5.1. Data Preprocessing and Feature Attribute Definition
In the field survey data stored in Excel, attributes such as wall material are recorded numerically, for instance, 1 for adobe, 2 for red brick, and 3 for blue brick. However, these values represent nominal categorical variables with no inherent order, magnitude, or proportional relationship. At the initial stage of model execution, the code performs feature factorization, which prevents the algorithm from mistakenly treating these numbers as continuous variables for regression computation and ensures that each building material category is recognized as a parallel categorical feature.
To verify the model’s generalization capability, i.e., its accuracy when encountering unseen building samples, a cross-validation mechanism is introduced. A stratified random sampling strategy (stratified by construction period) is employed to ensure that each era is proportionally represented in both subsets. The over 600 samples are randomly split at an 8:2 ratio into a training set of approximately 480 samples and a test set of approximately 120 samples. This stratification maintains the class distribution of the original dataset across the training and test partitions, preventing potential sampling bias that could arise from purely random splitting, especially for less frequent construction periods. The training set is used for the model to learn the mapping patterns between facade elements and construction periods, while the test set serves as an independent benchmark to objectively assess the model’s true predictive performance and avoid overfitting
3.5.2. Principles of Random Forest Classification Model Construction
The dependent variable in this study comprises six periods, from the 1960s to the 2010s, making it a typical multi-class classification problem. The relationship between architectural form and construction period is often not a simple linear mapping but a complex combination. For instance, a specific wall material combined with a specific wall finish material can clearly point to a particular period.
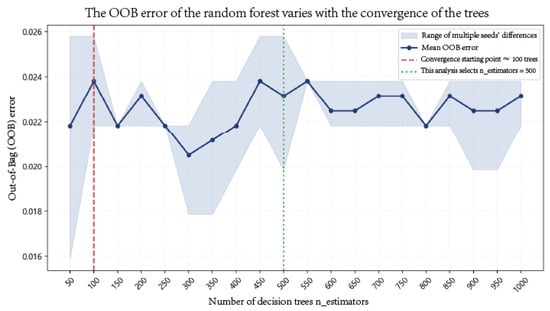
The random forest model builds 500 parallel decision trees, with the number of trees (ntree) set to 500 based on a systematic evaluation of out-of-bag (OOB) error convergence. Specifically, we trained the model with incremental tree counts (from 50 to 1000, at intervals of 50) and monitored the stabilization of OOB error rates. The OOB error decreased sharply up to approximately 200 trees, thereafter exhibiting marginal fluctuations with diminishing returns beyond 500 trees (Figure 6) [40]. Setting ntree = 500 thus represents a conservative choice that balances computational efficiency against predictive stability—a threshold beyond which additional trees yield negligible improvement in classification accuracy. The algorithm employs the bootstrap resampling method to repeatedly draw data from the original samples for training. Each time a node is split, the algorithm randomly selects a subset of building elements, such as considering only wall finish material and sunroom, for evaluation. The final period determination for each sample is decided by majority voting among these 500 trees. This ensemble strategy effectively mitigates data noise caused by later alterations or renovations of individual building samples and enhances the fault tolerance of period identification. In addition to test-set accuracy, the OOB error was calculated as an internal estimate of the generalization error of the random forest model. Because approximately one-third of the samples are excluded from each bootstrap sample, these OOB observations can be predicted by trees for which they were not used during training, providing an additional evaluation of model performance without requiring a separate validation set [41].
Figure 6.
OOB error convergence graph.
3.5.3. Design of the Model Evaluation System
For the prediction results on the test set, a confusion matrix is generated to output multi-dimensional evaluation metrics. Overall Accuracy reflects the overall proportion of buildings whose construction period is correctly identified among all test buildings, serving as a macro indicator of the model’s usability.
where TP stands for true positive, TN for true negative, FP for false positive, and FN for false negative.
Precision refers to the proportion of buildings predicted as belonging to a certain period that actually belong to that period. For example, when the model determines a building is from the 1990s, precision indicates how certain this judgment is. High precision means a low false positive rate.
Recall, also called Sensitivity, refers to the proportion of actual buildings from a certain period that are successfully identified by the model. For instance, it measures whether all buildings from the 1970s are recognized, or if some are missed and wrongly classified as belonging to another period. High recall means a low false negative rate.
The F1-score, defined as the harmonic mean of precision and recall, was also calculated for each construction-period class to provide a balanced assessment of classification performance. In addition to the aggregate metrics, the number of test samples (support) for each period was reported to make differences in class size transparent. For the random forest model, test-set accuracy and OOB error were additionally calculated. The full 6 × 6 confusion matrix was used to identify the specific construction periods between which misclassification occurred.
3.5.4. Evaluation of Feature Importance of Building Elements
This step addresses the core question of this study: which elements exert the greatest influence on the construction period. Two classic variable importance assessment methods within the random forest model are employed: Mean Decrease Accuracy (MDA) and Mean Decrease Gini (MDG). Since the evaluation logic of these two methods differs intrinsically, the ranking of variable importance may show some deviation.
For a node t with K classes, assuming the proportion of the k-th class samples is pk, the Gini index of this node is defined as:
The Gini index measures the impurity of a node. When all samples in the node belong to the same class, i.e., pk = 1 for one class and 0 for others, Gini(t) = 0, representing the purest state.
However, it is important to note that MDG carries a documented bias that systematically favors variables with more categories [42], irrespective of their actual predictive value. A variable with more levels offers the algorithm more candidate splits than a binary one, so a favorable-looking split may arise more often by chance alone. To address this methodological concern and verify the robustness of the importance ranking, conditional permutation importance (CPI) was additionally calculated following Strobl et al. [43]. Unlike the unconditional permutation scheme underlying MDA, CPI employs a conditional permutation scheme that accounts for correlations among predictor variables, thereby reflecting the true impact of each variable more reliably.
3.5.5. Decision Tree Dimension Reduction and Visualization Based on Core Elements
This decision tree functions as a white box model. It transforms complex statistical patterns into a clear architectural period identification flowchart or logic tree based on If-Then rule sets. CART was selected because its hierarchical splitting structure can directly transform the key features identified by the random forest into explicit decision rules, providing greater interpretability and practical applicability for field-based architectural investigation than more complex classification models. In subsequent research or engineering practice, even field surveyors without machine learning expertise can quickly and systematically infer the construction period of a target building by simply checking the on-site characteristics of these key elements along the branches of the decision tree. For example, the first step is to check whether the wall material is blue brick, the second step is to check the wall finish material, and so on.
The objective of this study is not to benchmark classifiers or to identify the model with the highest accuracy, but to construct a visualizable and interpretable framework for predicting the construction period of vernacular buildings [44]. Model selection was therefore goal-driven rather than accuracy-driven. CART was selected because it produces explicit decision rules that can be directly visualized and translated into architectural criteria. Random forest was selected as an ensemble extension of tree-based learning because it improves predictive stability while retaining feature-importance information and remaining compatible with the CART-based visual framework.
SVM, gradient boosting, and logistic regression were not adopted as core components of the framework. SVM does not provide directly interpretable decision rules of the required form; gradient boosting does not yield a single readable tree structure; and logistic regression, while interpretable, represents linear log-odds rather than the threshold-based feature combinations that are central to the proposed visual framework. This is not a claim that CART or random forest is universally superior to these methods. Therefore, the contribution of this study is the visualizable framework, not a model-ranking exercise.
4. Results and Discussion
4.1. Feature Importance Results
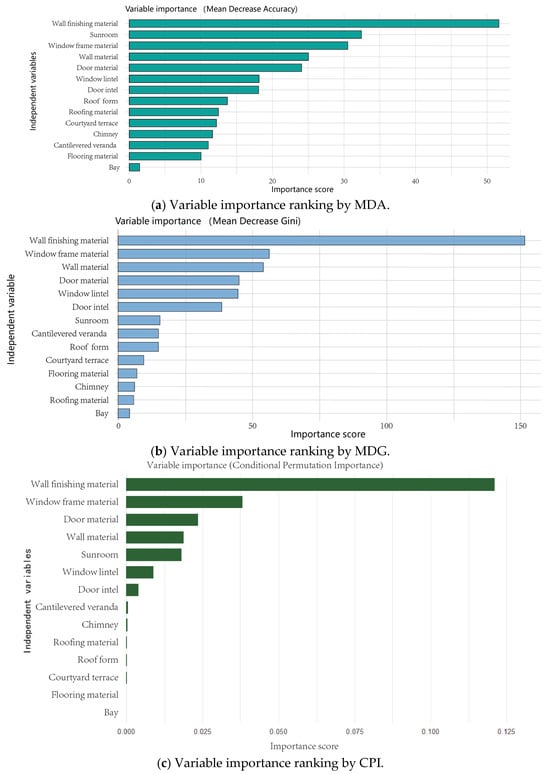
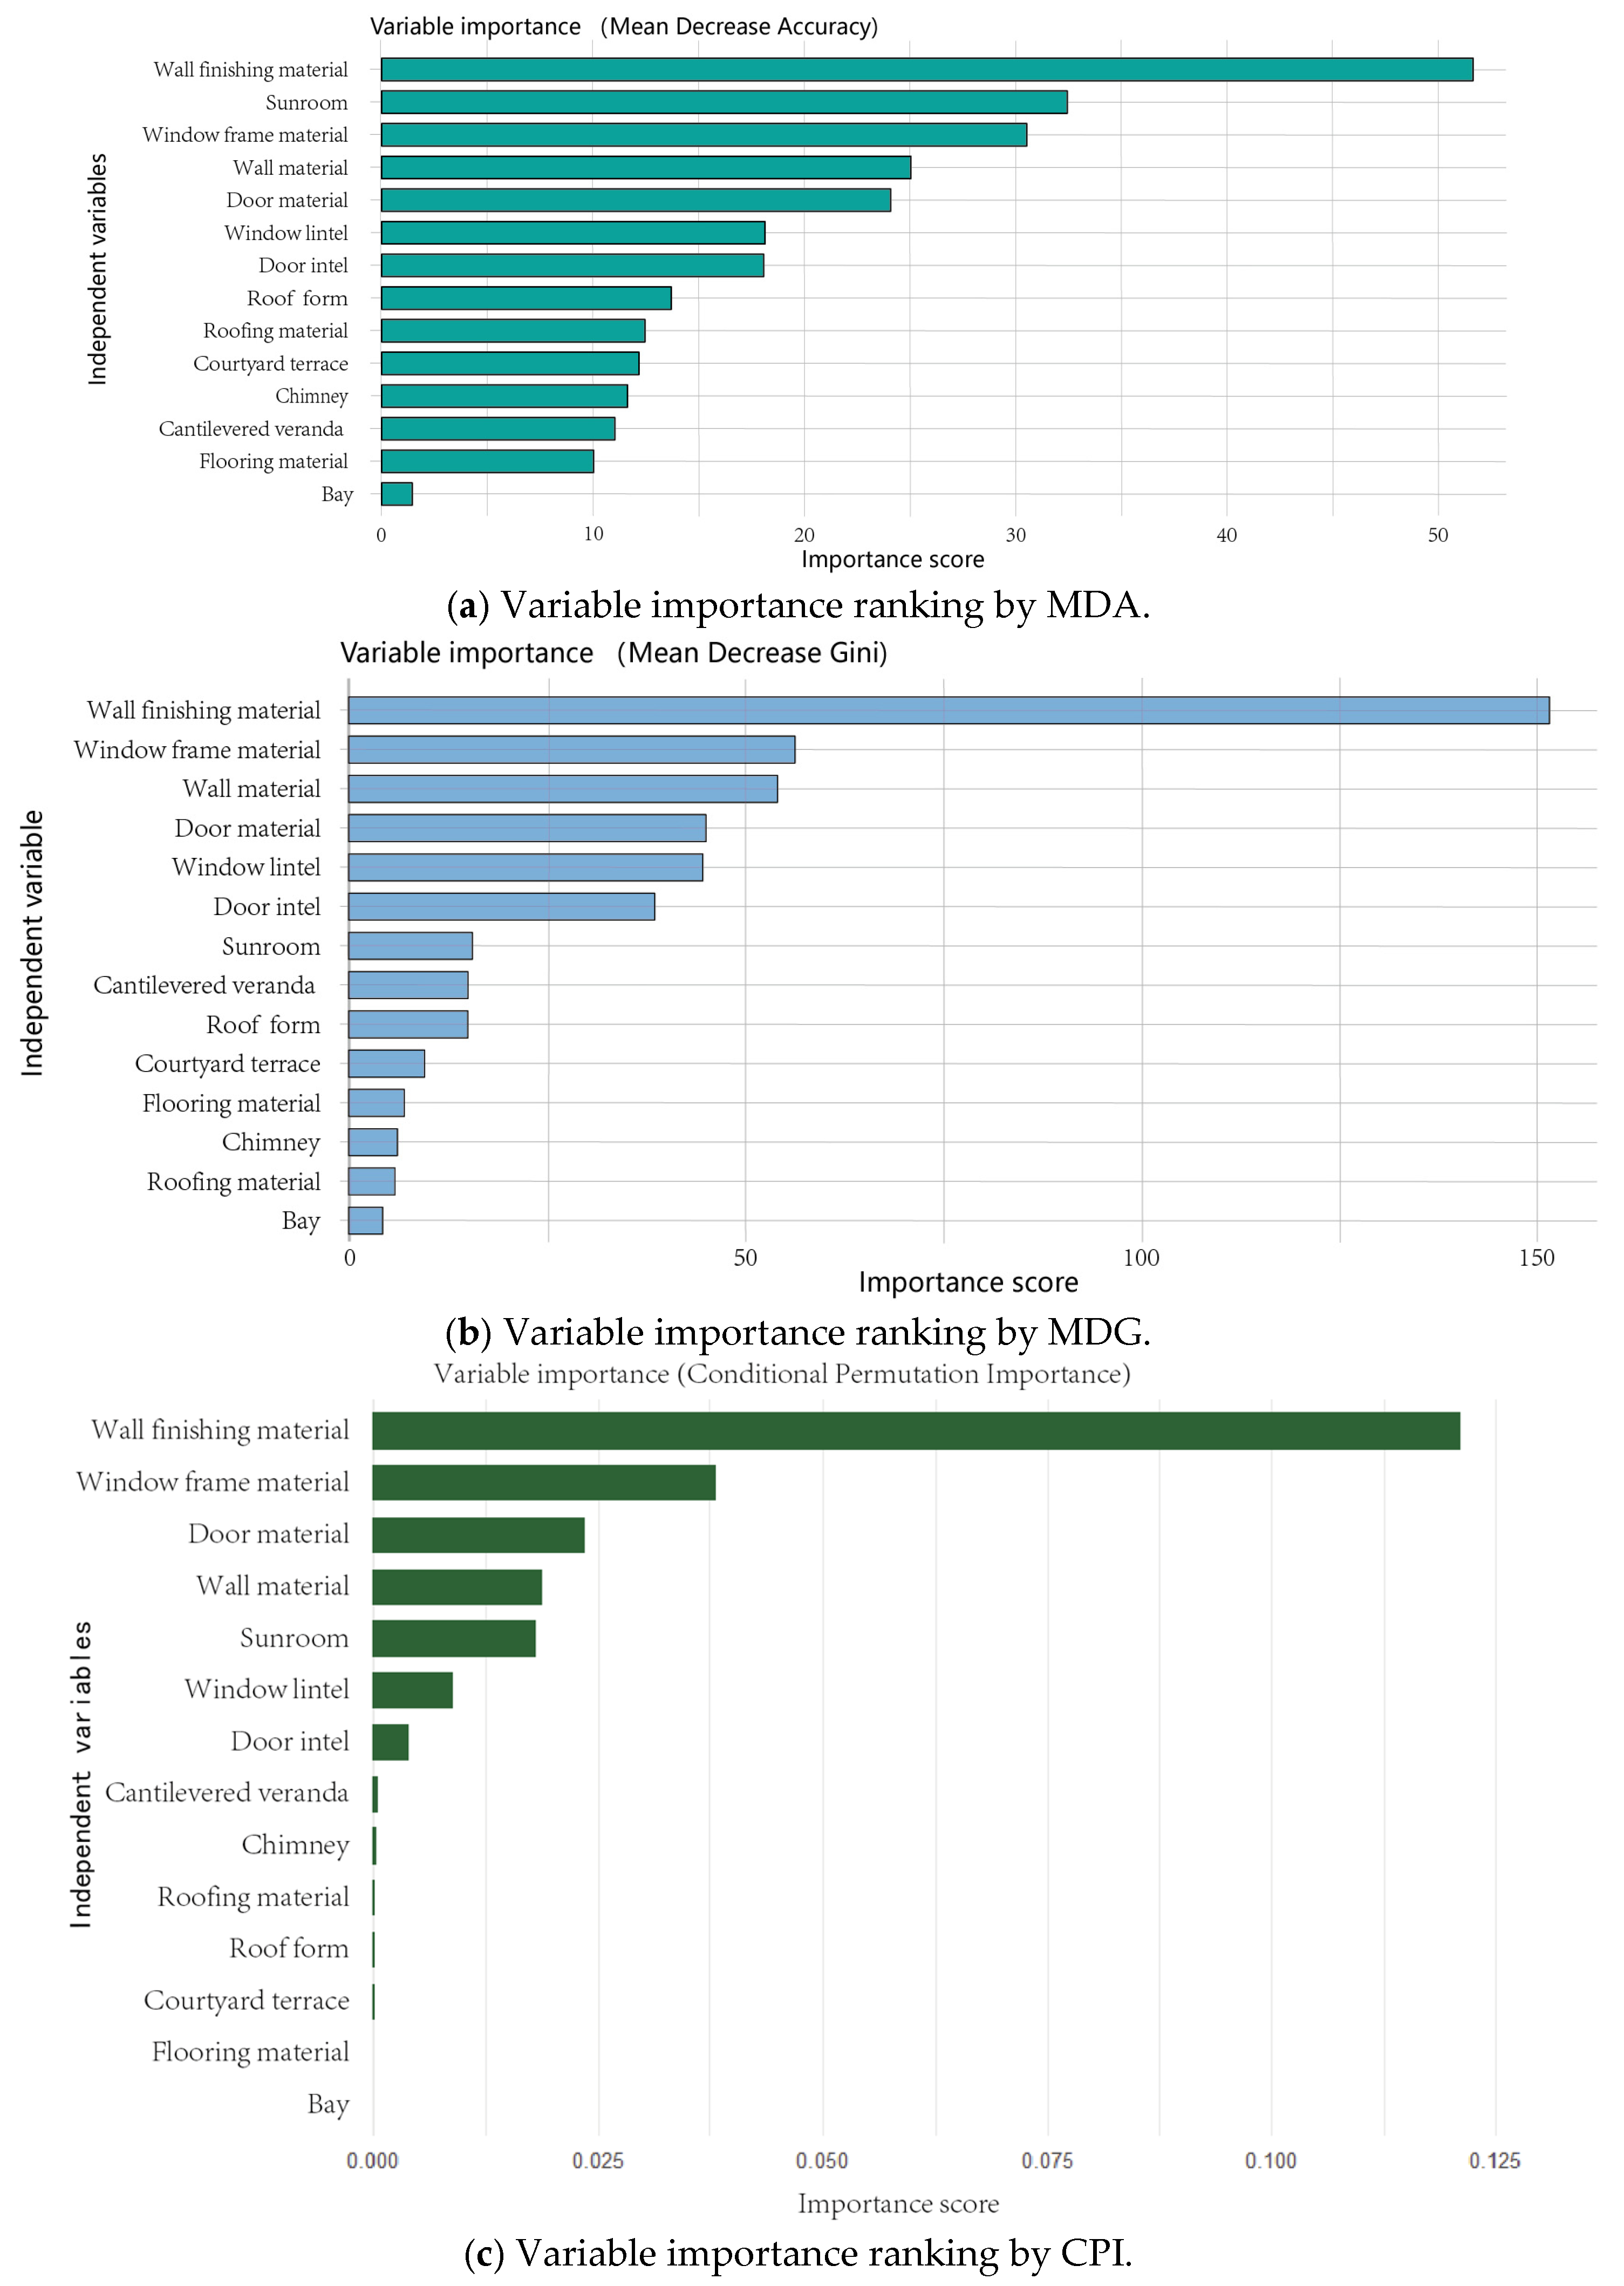
Based on the random forest model, the importance of facade features for estimating the construction age of vernacular buildings is presented in Figure 7. The results from Mean Decrease Accuracy, Mean Decrease Gini, and Conditional Permutation Importance consistently identify wall finishing material as the most influential predictor. Window frame material, door material, wall material, and sunroom also show relatively high importance, indicating their substantial contribution to distinguishing buildings constructed in different periods.
Figure 7.
Variable importance ranking by MDA, MDG and CPI.
Conditional Permutation Importance was further applied to assess the robustness of the variable importance ranking by reducing the category count bias associated with Mean Decrease Gini. As shown in Figure 7, wall finishing material remains clearly dominant after this correction, followed by window frame material, door material, wall material, and sunroom. Window lintel and door lintel show smaller but still positive contributions, whereas cantilevered veranda, chimney, roofing material, roof form, courtyard terrace, flooring material, and bay have only limited importance.
The differences among the three importance measures can largely be attributed to their calculation mechanisms. Mean Decrease Gini tends to favor variables with more categories because they provide more potential split points, while binary variables such as sunroom may receive comparatively lower importance scores. In contrast, permutation based measures are less affected by the number of categories and provide a complementary assessment of predictive contribution. The relatively strong performance of sunroom in Mean Decrease Accuracy, together with its moderate Conditional Permutation Importance, suggests that it contributes to classification primarily through its effect on overall predictive performance rather than through large impurity reductions at individual tree nodes. Overall, the three measures consistently support wall finishing material as the most informative feature for construction age classification, while window frame material, door material, wall material, and sunroom constitute an important secondary group of predictors.
4.2. Decision Tree Model Performance
The random forest and decision tree models both demonstrated high classification performance (Table 4). The random forest achieved a test-set accuracy of 98.41%, with an OOB error of 2.31%. These results indicate that the ensemble model provided stable discrimination among the six construction periods and also support its use for identifying the most influential facade features.
Table 4.
Classification performance of the random forest and decision tree models.
The decision tree model achieves an accuracy of 97.62% on the test set, with precision and recall both exceeding 97%, and an F1 score of 0.975 (Table 4). These results confirm the effectiveness and robustness of the proposed quantitative classification system. Although the random forest provides strong predictive performance, the CART model was retained as the final interpretable classification tool because its hierarchical splitting rules can be directly translated into explicit field-survey criteria.
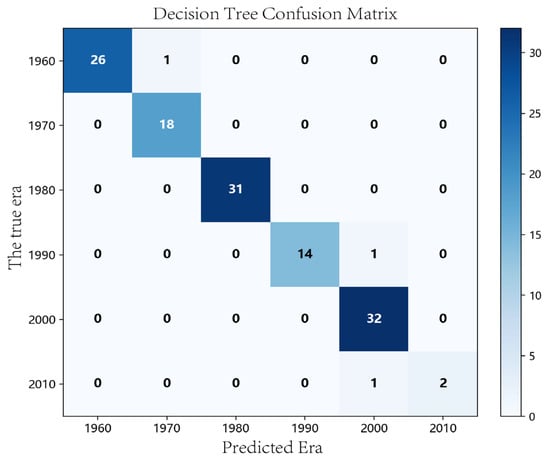
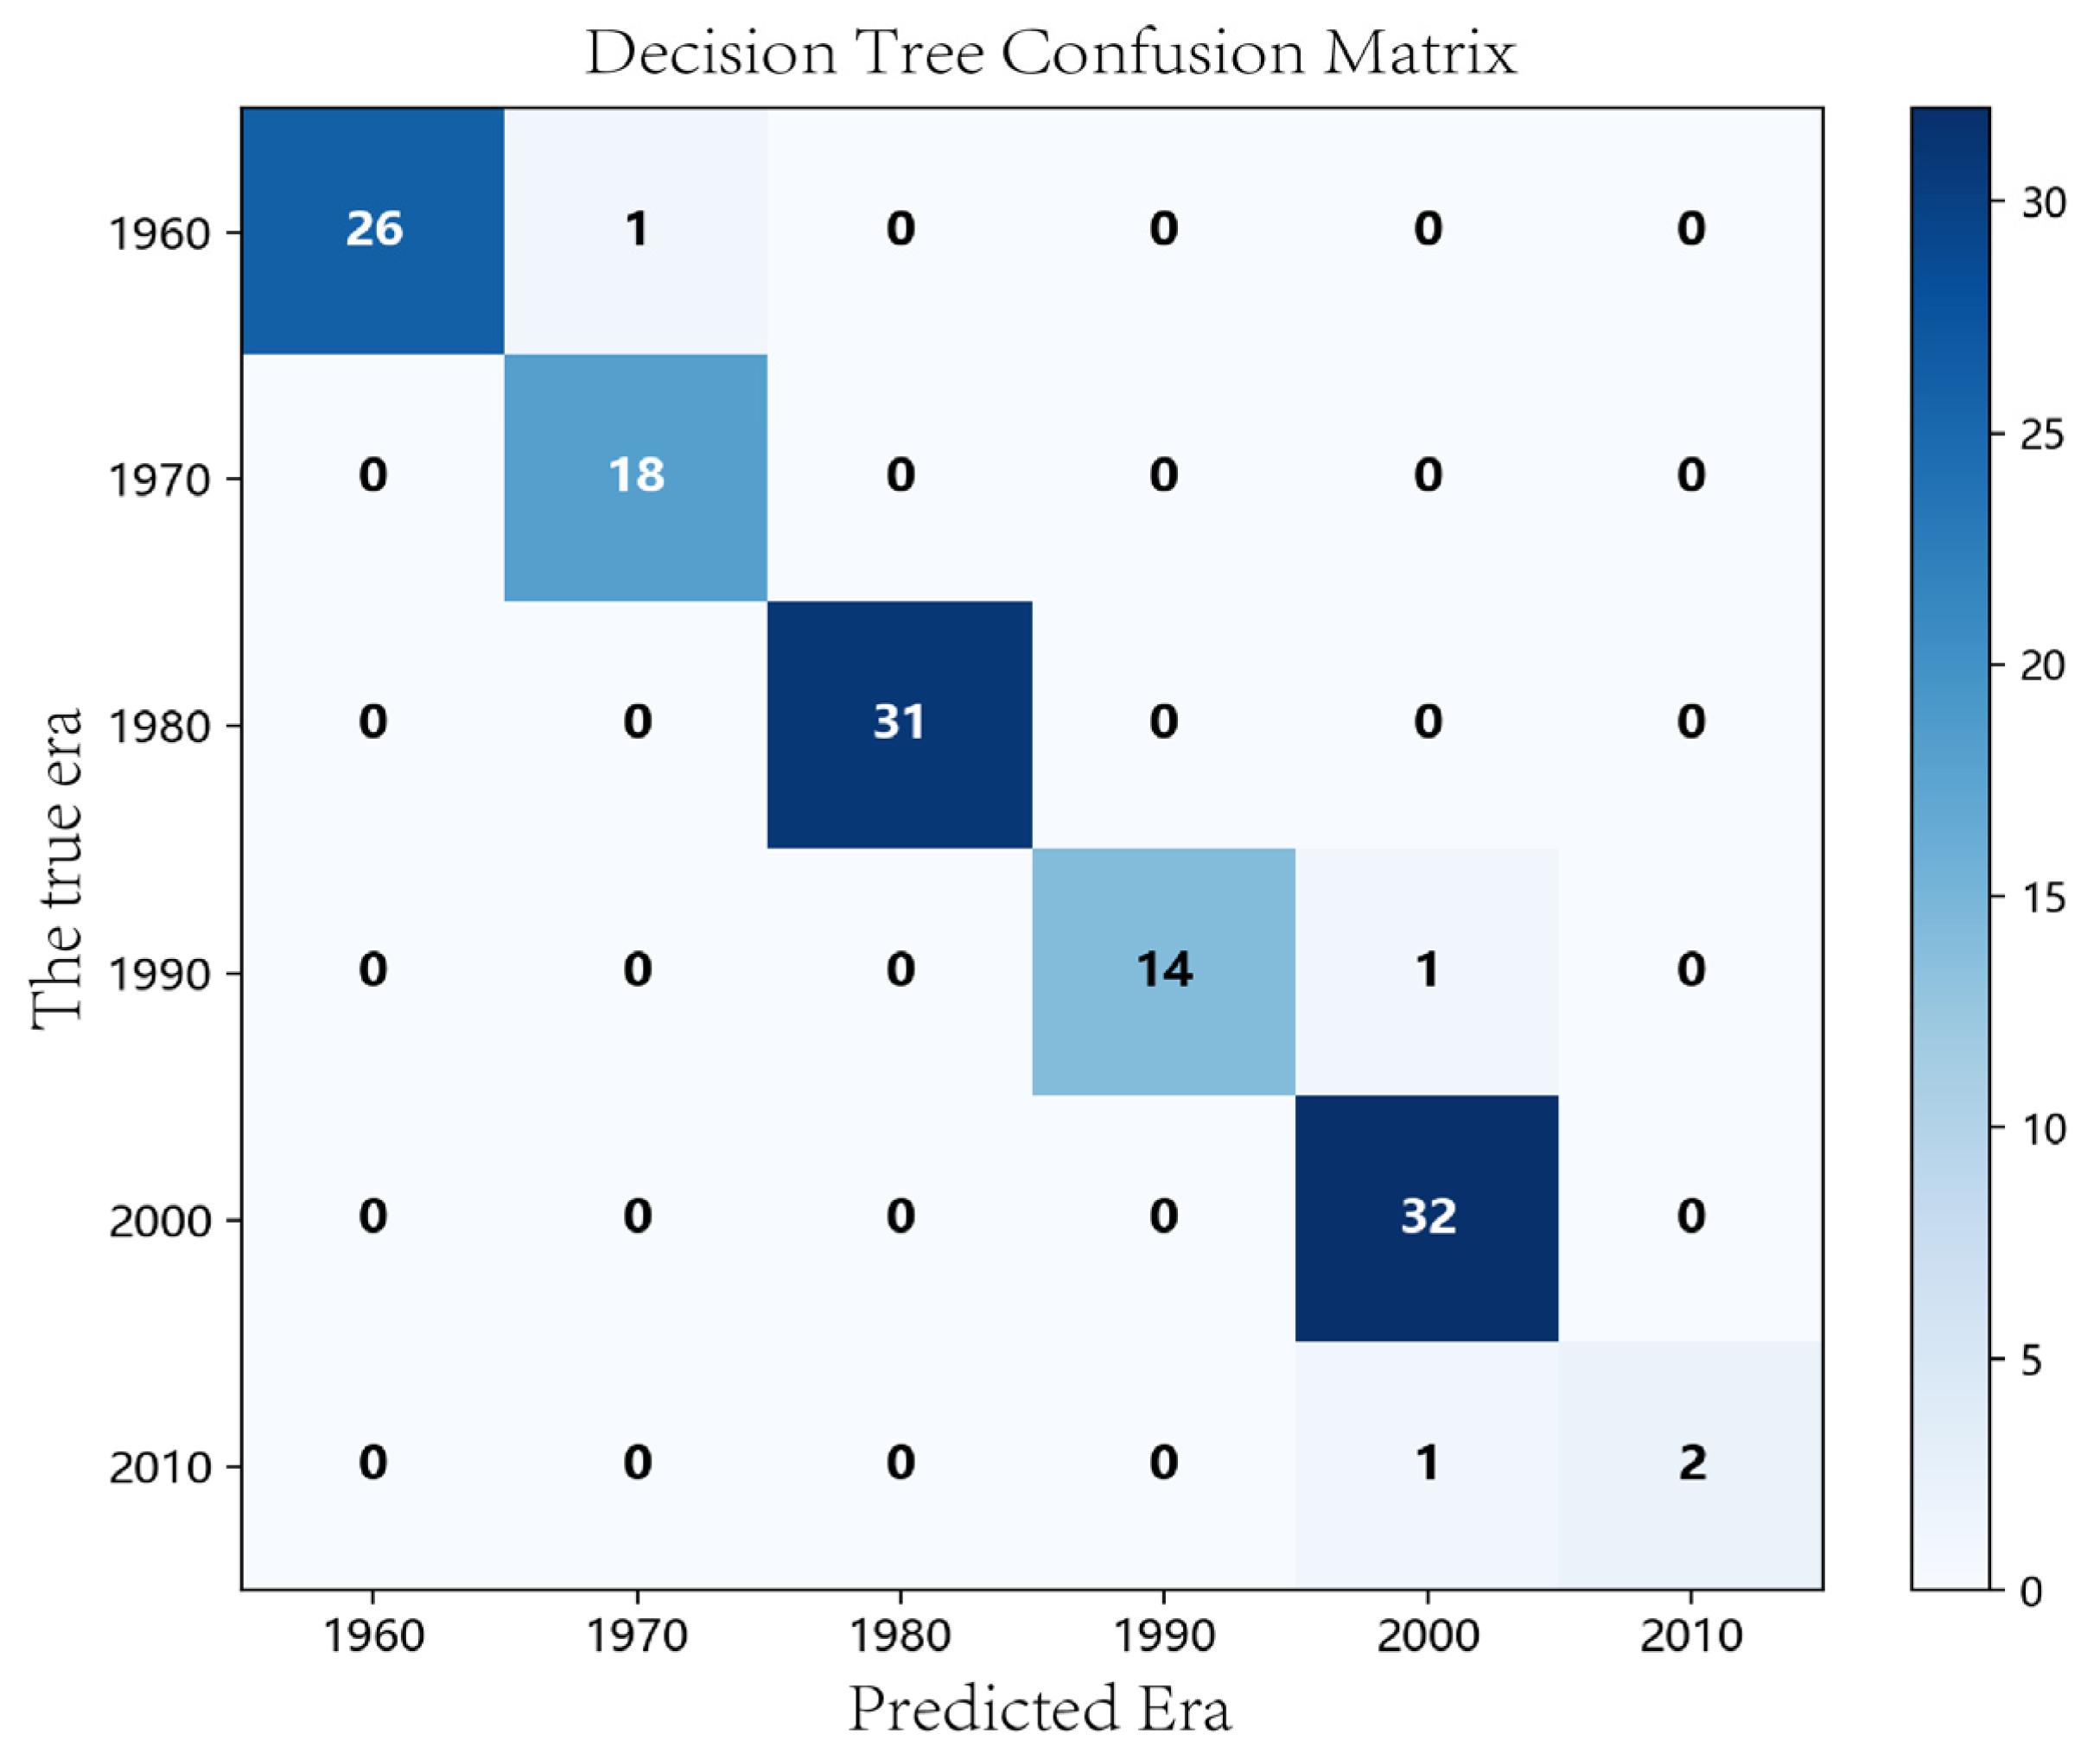
To further examine the distribution of classification errors, Figure 8 presents the complete confusion matrix of the CART model. Rows represent the actual construction periods and columns represent the predicted periods. The diagonal cells indicate correctly classified buildings, whereas off-diagonal cells represent misclassified cases. The confusion matrix shows that most samples are concentrated along the main diagonal, indicating a high level of agreement between the predicted and actual construction periods.
Figure 8.
Confusion matrix and class-specific performance of the CART model.
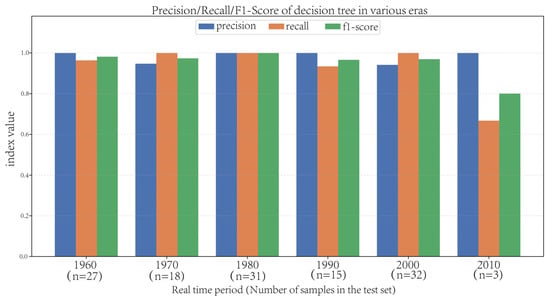
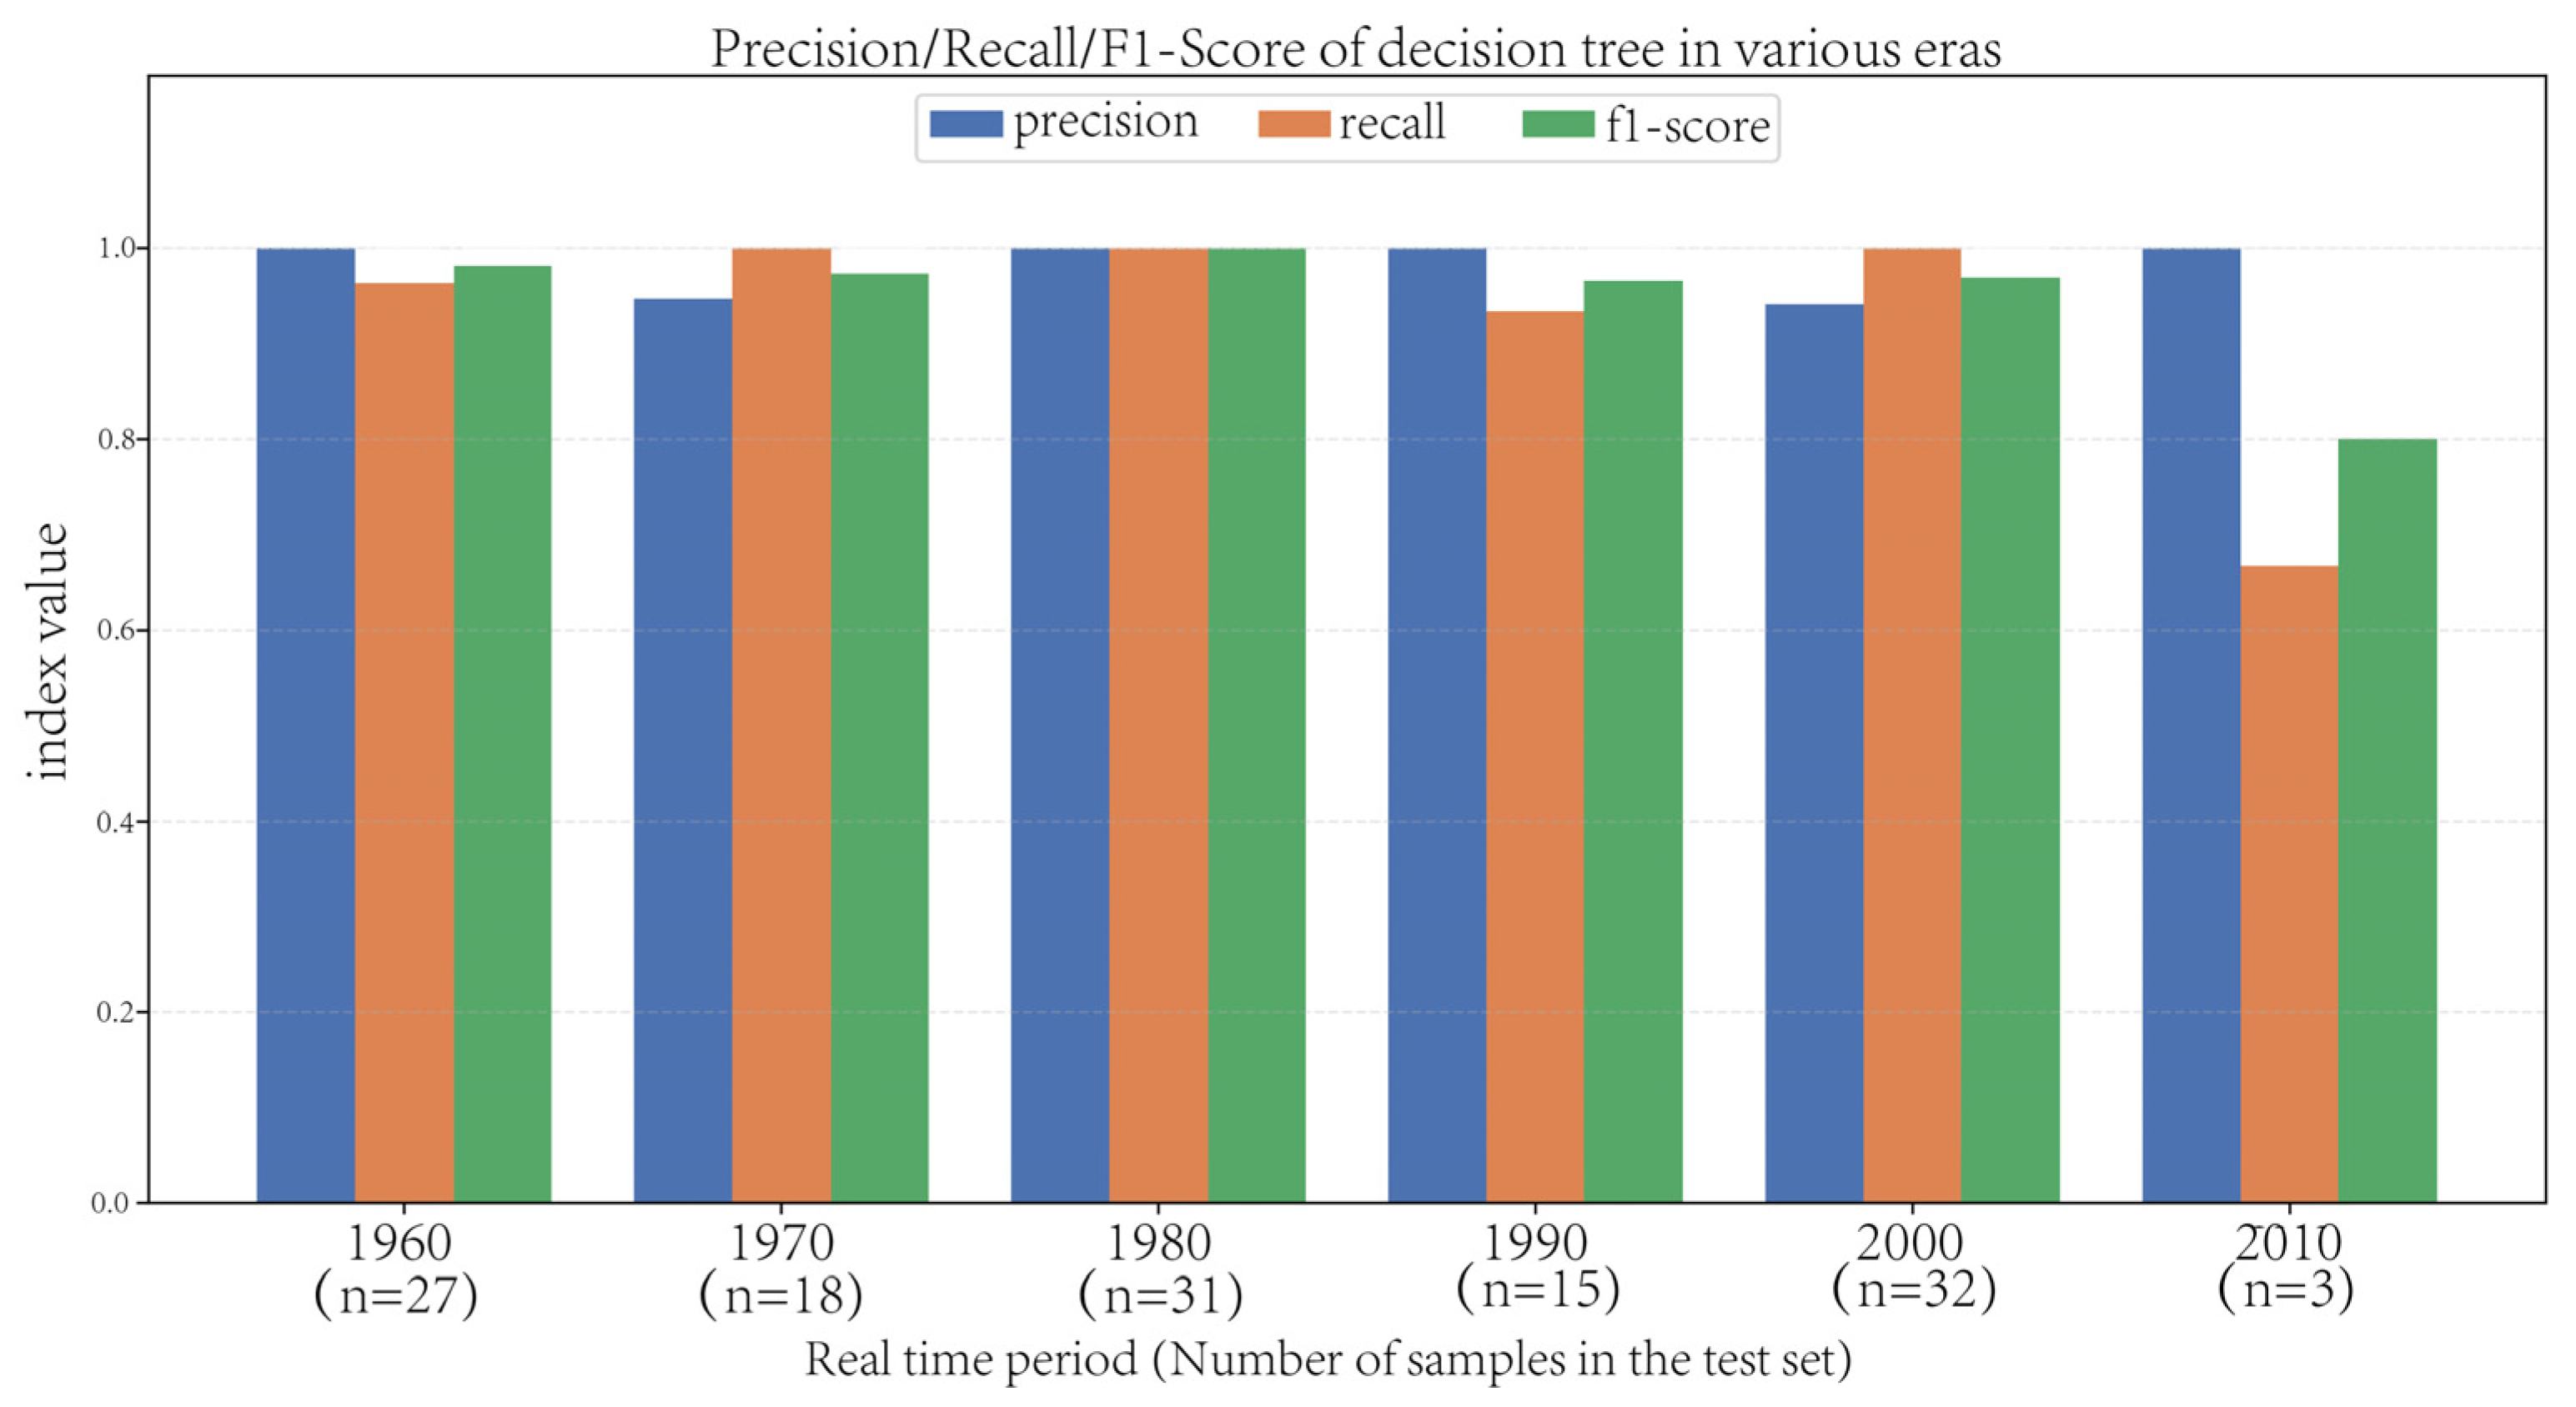
To quantitatively assess class-wise performance, Figure 9 reports the precision, recall, and F1-score for each individual construction era, with detailed values summarized in Table 5. The 1980s cohort achieves perfect classification (precision = 100.00%, recall = 100.00%, F1 = 100.00%, support = 31), reflecting its distinct and homogeneous facade features. The 2000s also exhibit strong performance (precision = 94.12%, recall = 100.00%, F1 = 96.97%, support = 32), with perfect recall but somewhat lower precision, indicating that some buildings from other eras are misclassified into this class. The 1960s cohort shows high precision (100.00%) and good recall (96.30%), yielding an F1 of 98.11% (support = 27), with only a small proportion of actual 1960s buildings missed. The 1990s cohort also maintains high precision (100.00%) but lower recall (93.33%), resulting in an F1 of 96.55% (support = 15), suggesting that a small number of 1990s buildings are misclassified into adjacent periods. The 1970s cohort, while achieving perfect recall (100.00%), exhibits relatively lower precision (94.74%, F1 = 97.30%, support = 18), implying that a non-negligible proportion of buildings from other eras are misclassified as 1970s—likely due to transitional architectural styles during that decade. The most notable deviation occurs in the 2010s: although precision reaches 100.00%, recall drops to 66.67% (F1 = 80.00%, support = 3), meaning that one-third of actual 2010s buildings are missed by the model. However, given the very small support (n = 3), this result should be interpreted with caution and may not be stable. This asymmetric pattern suggests that contemporary facade elements may overlap with features of adjacent periods, causing 2010s buildings to be absorbed into neighboring classes rather than the reverse.
Figure 9.
The construction era of each one: Precision, Recall and F1-score.
Table 5.
The construction era of each one: Precision, Recall and F1-score.
The overall accuracy is 97.62% (123 out of 126 test samples correctly classified). This result is not overwhelmingly driven by a single majority class: the 1980s and 2000s cohorts together account for approximately 50% of test samples and achieve F1 scores of 100.00% and 96.97%, respectively, while the remaining periods maintain F1 scores ranging from 80.00% to 98.11%, with the 2010s cohort being based on only three samples and the 1970s cohort contributing most of the precision-related errors.
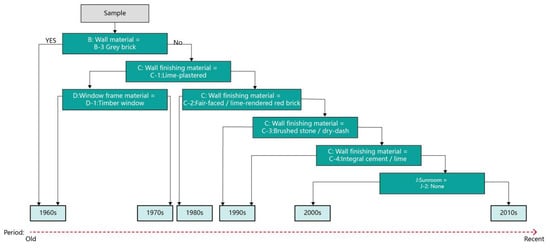
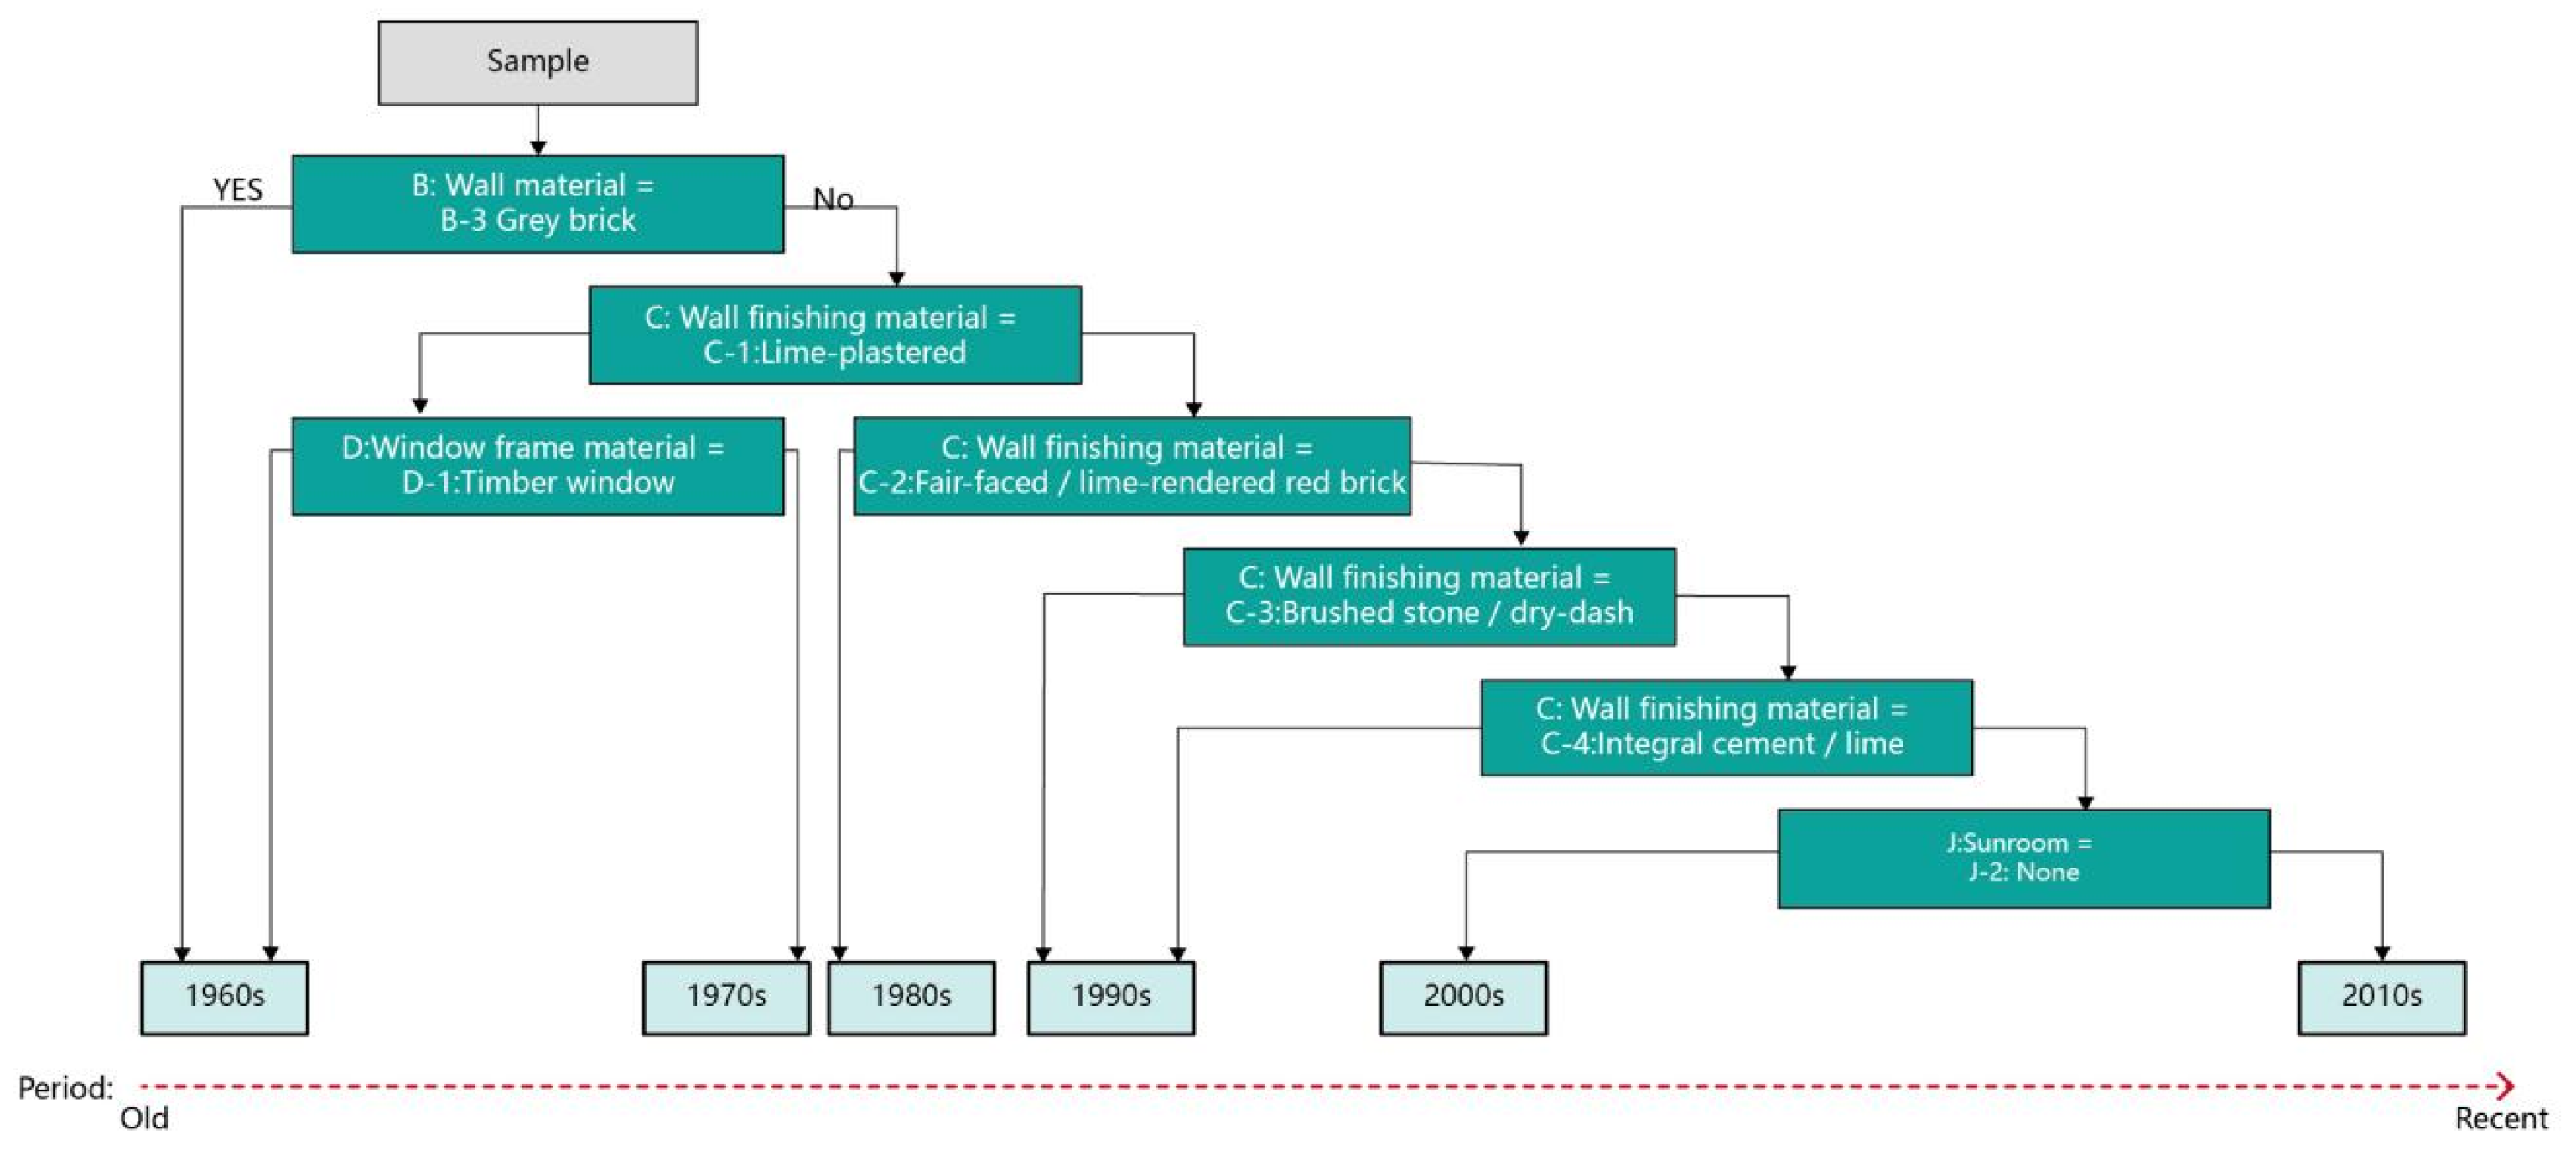
The splitting paths of the decision tree (Figure 10) illustrate a hierarchical screening process based on micro-morphological features. The variable used most frequently for splitting is wall finishing material, underscoring its central role in typological identification. The classification logic can be summarized as follows. If the wall body is blue brick, the building is directly classified as dating from the 1960s, indicating that blue brick is a highly distinctive material for early traditional dwellings. If the wall body is not blue brick, the decision tree further examines the finishing material. Adobe with white plaster combined with pure wood windows leads to a 1960s classification, whereas the same finishing with upgraded windows suggests a 1970s date. Fair-faced red brick or whitewashed red brick corresponds to the 1980s. Exposed aggregate or roughcast finishes correspond to the 1990s. Full cement or full white plaster finishes also map to the 1990s. The final finishing material, externally applied ceramic tiles, is a typical decorative feature of twenty-first century dwellings; in the absence of a sunroom, the building is assigned to the 2000s (including years prior to 2013), while the presence of a sunroom indicates a 2010s date (after 2013).
Figure 10.
The constructed decision tree model.
4.3. Discussion
The identification of wall finishing material, wall body material, and window material as core determinants is intrinsically linked to the evolution of building material technologies, construction techniques, and socioeconomic conditions across different periods. For instance, the combination of blue brick walls and pure wood windows is a typical feature of vernacular buildings from the 1960s and earlier, reflecting the dominance of traditional craftsmanship and locally sourced materials. During the 1970s to 1990s, with the spread of cement and red brick, wall finishes gradually transitioned from adobe with white plaster to fair-faced red brick and then to exposed aggregate or roughcast finishes. Window materials also diversified during this period, mirroring the impact of industrialization on vernacular architecture. These evolutionary patterns are well documented in studies of vernacular building materials across different regions of China. In the Longzhong area, for example, rammed earth and wood predominated before 1911, brick began to appear in the early twentieth century, and brick–concrete construction did not become widespread until after 1981 [17]. A similar trajectory was observed in southern Jiangsu, where hand-processed materials dominated in the 1980s and were replaced by cast-in-situ brick–concrete structures after the 2000s [16]. The pronounced transition from brick–wood to brick–concrete structures around 1995 in rural Hunan further corroborates this nationwide trend [25]. In coastal areas, locally specific material choices such as the extensive use of stone in Quanzhou’s self-built houses during the 1960s further illustrate the regional dimension of material chronology [26].
The emergence of the sunroom as a discriminating feature after the 2000s is directly associated with changes in residents’ lifestyles and the availability of new building materials such as aluminum alloys and glass. This finding aligns with observations that industrial materials including glass curtain walls and aluminum window frames have spread rapidly in rural areas since the 1990s, gradually replacing traditional materials like wood and earth [32,37]. The temporal correspondence between specific facade feature combinations and construction periods, as revealed by the decision tree, thus corresponds closely with the known development trajectory of vernacular architecture, lending strong empirical support to the model’s outputs.
Compared with traditional approaches, the proposed method demonstrates notable advantages in efficiency, coverage, objectivity, and scalability. Documentary analysis relies on the survival and accessibility of written sources, such as gazetteers, steles, and genealogies [15]. However, a vast number of ordinary vernacular dwellings lack explicit textual records, and the interpretation of available documents demands specialized historical expertise, making large-scale surveys time-consuming and impractical. Carbon-14 dating, while providing absolute dates, is costly and constrained by sample availability [5]. Field surveys based on oral interviews and questionnaires can supplement informal historical memory, but they are limited by the vagueness of interviewees’ recollections, generational discontinuity, and the inherent subjectivity of questionnaire responses, typically yielding only approximate time ranges rather than precise dates [8,16]. In contrast, the quantitative framework developed here transforms multidimensional features, including building form, construction details, materials, and decorative styles, into computable categorical indicators through manual observation and coding of the facade orthophotographs, and subsequently uses machine learning to learn the relationships between these coded attributes and known construction-age intervals. Accordingly, the method should be understood as a machine-learning-assisted rather than a fully automated image-based dating workflow. Human judgment remains necessary for identifying and coding facade characteristics, such as wall and window materials, whereas the subsequent assignment of a construction-age interval is performed by the trained model according to reproducible classification rules. In this sense, the proposed approach relocates rather than completely eliminates expert input: expertise is used to characterize observable architectural attributes rather than to make a holistic judgment of construction age.
In the present workflow, coding the 14 facade attributes required approximately 2 min per building on average, whereas, once these attributes had been coded, model-based age inference for an individual building could be completed within seconds. Therefore, the reported computational efficiency refers specifically to the classification stage following feature coding and should not be interpreted as the processing time of the complete workflow. The principal efficiency advantage is that standardized facade attributes can be recorded systematically during large-scale surveys and subsequently converted into age estimates without requiring an expert to independently assess the construction period of every building.
Crucially, this system does not entirely replace traditional methods but rather complements them. Documentary and oral historical sources can serve as verification for training labels, while the probabilistic output of the model can guide fieldwork by directing researchers’ attention to buildings with uncertain dates, thereby concentrating limited academic resources on key cases for in-depth investigation. This synergy facilitates a strategy of macro-level screening and micro-level confirmation, substantially improving the scientific rigor and systematic capability of vernacular building dating.
4.4. Validation of Prediction Accuracy
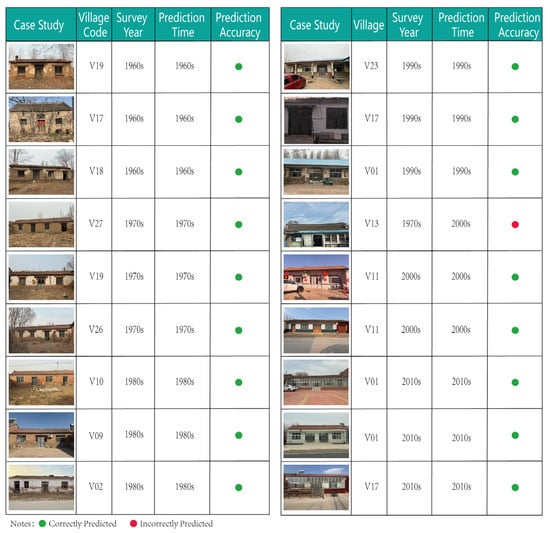
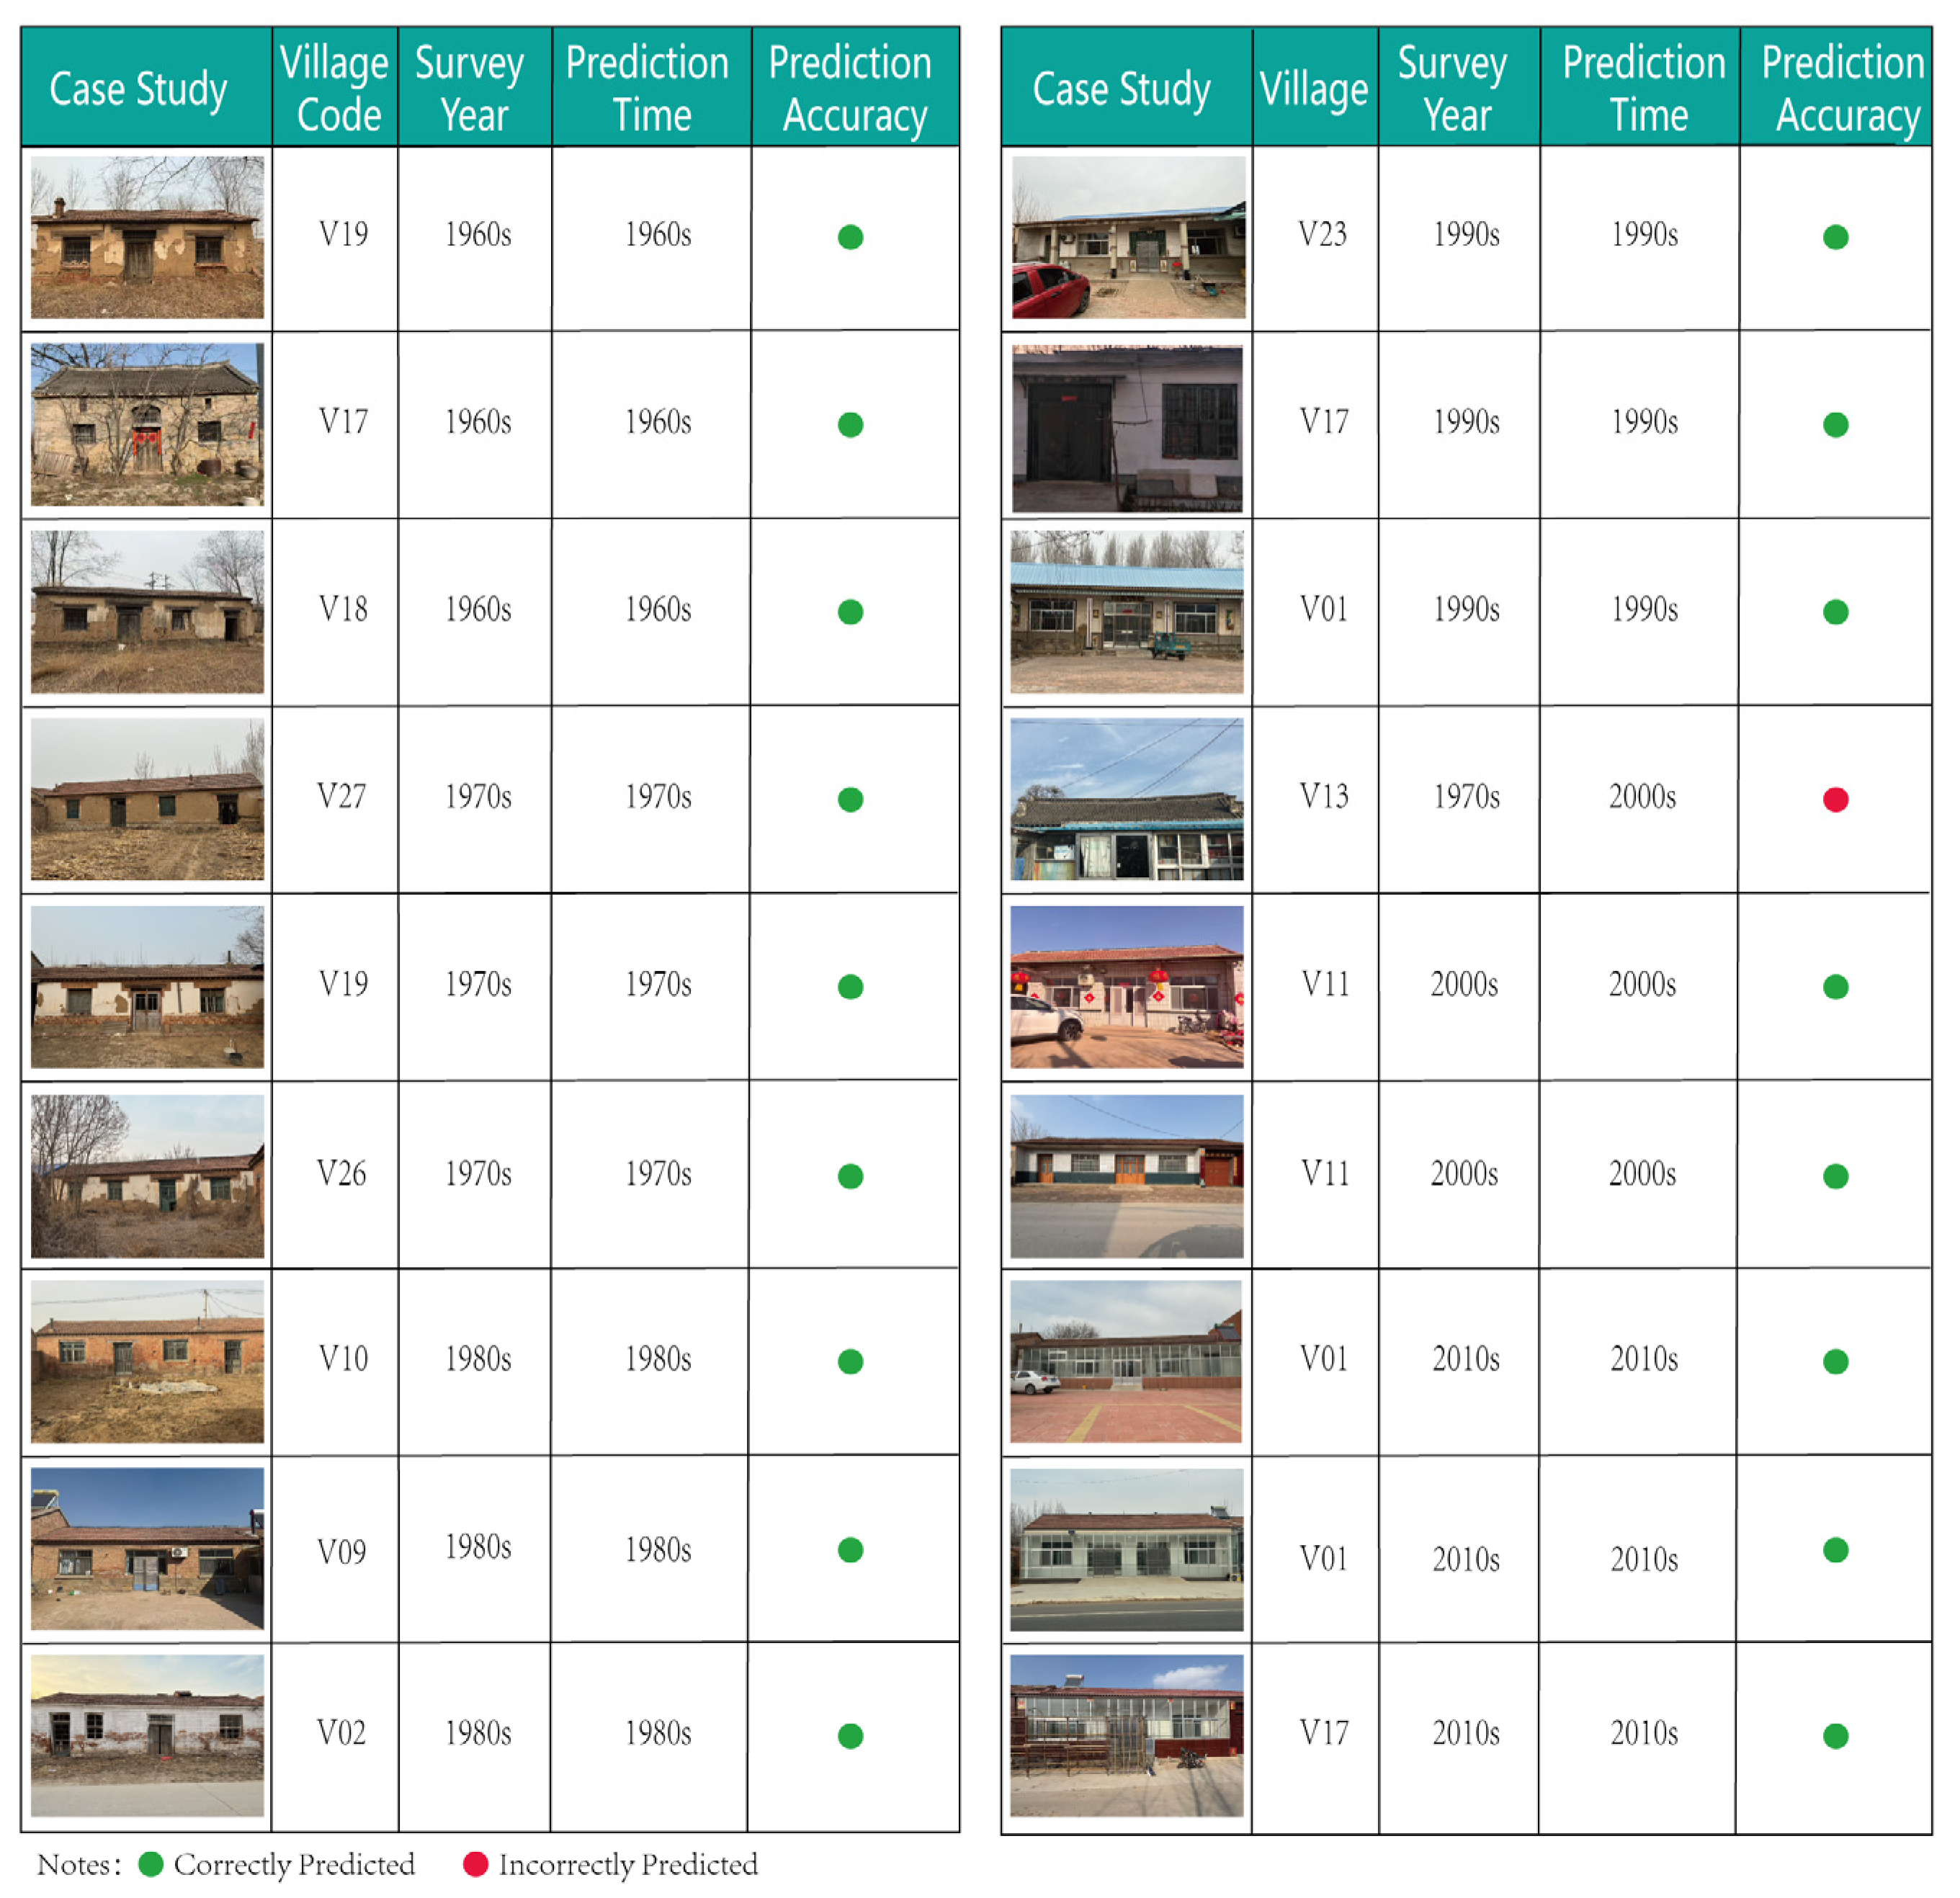
The sample photos are predicted for their construction time using the decision tree model. Then, the predicted construction time from the decision tree is compared with the actual construction time of the samples. This comparison is used to verify the accuracy of the decision tree model.
To further examine the reliability of the developed model, we used an additional supplementary validation subset of 18 buildings (Figure 11) that were not included in the training set or the 120-sample test set. According to our audit, these samples were not involved in model training, parameter tuning, or feature selection. However, they were drawn from the same 29 villages (V01–V29) that constitute the original 630-sample dataset. Their village codes are V19, V17, V18, V27, V26, V10, V09, V02, V23, V01, V13, and V11. Therefore, this subset is not an unseen-village or external validation set; it serves only as an additional check under the same village-level distribution. The predicted construction period matched the actual period for 17 of the 18 samples, yielding an accuracy of 94.44% (Figure 10). One sample, actually built in the 1970s, was misclassified as belonging to the 2000s, corresponding to an error rate of approximately 5.56%. The 97.62% accuracy from the 120-sample test set reflects building-level held-out performance within the same village pool, not cross-village generalization. The 94.44% result should likewise not be interpreted as a stricter external validation estimate. The similarity between the two figures suggests consistent performance within the sampled villages, but it does not establish robustness to unseen villages or construction batches. Because both the 120-sample test set and the 18-sample subset are drawn from the same 29 villages, and the main split was performed at the building level without village- or batch-level blocking, buildings from the same village and period may appear across partitions as near-duplicates. The reported results should therefore be interpreted as within-village-pool, building-level estimates. Future work should adopt group-aware validation.
Figure 11.
Validation of the proposed model’s prediction accuracy.
4.5. Limitations
Despite the promising outcomes, several limitations should be acknowledged. First, the sample dataset is concentrated in the Dezhou region, and the geographical generalizability of the model requires further validation. Regional differences in material availability, construction techniques, and facade characteristics may affect the model’s accuracy when applied to other area.
Second, the present study is primarily empirical and data-driven and does not establish a complete theoretical framework explaining why facade characteristics change systematically over time. The 14 facade features were selected based on previous studies and field observations, but their chronological relevance may also be influenced by changes in material availability, construction technology, economic conditions, craftsmanship, and aesthetic preferences. These mechanisms were not explicitly modeled in this study.
Third, the present study relies solely on externally visible facade elements as predictors and does not incorporate hidden features such as structural systems, internal spatial layouts, or construction techniques. Therefore, the 14 variables should be regarded as an operational set of observable indicators rather than a complete representation of chronological architectural change. Future work could integrate data on structural components and craft practices to refine the dating framework.
Fourth, by prioritizing buildings with explicit date evidence and relatively well-preserved conditions, the sample may be systematically biased toward “clear-case” examples that exhibit coherent period-defining features, while underrepresenting buildings that have undergone later renovations, mixed-material constructions, or stylistic transitions.
A further limitation concerns sample selection and its effect on the interpretation of the decision tree in Figure 10. Because buildings with clear chronological evidence and relatively good preservation were prioritized, the sample may be systematically biased toward “typical cases” with clear period characteristics, while buildings that experienced later renovation, mixed materials, or stylistic transition are underrepresented. These omitted cases are precisely those that would weaken the apparent one-to-one mapping between a single facade variable and construction period. The nearly deterministic structure of the decision tree should therefore be interpreted as a property of the selected sample and of the hard-split nature of decision trees, rather than as evidence against the gradual stylistic transitions discussed in Section 2.1.3. Future work should include a more balanced sample of renovated, mixed-material, and transitional buildings, and may adopt ordinal or soft-label models to better represent gradual change.
Fifth, although the split was stratified by construction period and each period was represented in both subsets, the partitioning unit was the individual building. Buildings from the same village and construction batch may share very similar facade attributes. If such near-duplicate buildings are distributed across training and test sets, the model may achieve optimistic performance by recognizing previously seen feature combinations rather than demonstrating true generalization to unseen villages or batches. We therefore do not claim that the current test set is fully independent at the village or batch level. The reported results should be understood as within-distribution estimates for unseen buildings. Group-aware validation remains necessary to quantify out-of-group generalization, and this is an important direction for future work.
Sixth, although period labels were not included on the coding forms, facade photographs and construction-period evidence were collected during the same field visit. No separate coding team, anonymization procedure, or delayed linkage was used. It is therefore not possible to verify that the coders were fully blinded to the period labels, and some coders may have been aware of period information through field context or prior knowledge. As a result, the possibility of circularity—whereby knowledge of a building’s construction period may have influenced the coding of facade features—cannot be fully excluded. The reported feature–period associations should therefore be interpreted with caution. Future studies should separate field data collection from attribute coding, anonymize facade images, and link period labels only after coding is completed.
Seventh, the corrected test set contains only 126 samples, distributed unevenly across construction periods: 1960s n = 27, 1970s n = 18, 1980s n = 31, 1990s n = 15, 2000s n = 32, and 2010s n = 3. This imbalance is particularly severe for the 2010s cohort, for which only three test samples are available. Consequently, a single misclassification changes the recall by 33.33 percentage points and the F1-score by a substantial margin. The reported class-wise metrics for rare periods, especially the 2010s, are therefore highly sensitive to individual samples and may not be stable. More generally, with only 126 test samples, the confidence intervals around accuracy and macro-averaged metrics are relatively wide, and the reported performance may vary considerably under a different train–test split. The results should therefore be interpreted as indicative rather than definitive, particularly for underrepresented construction periods. Future work should expand the sample size, oversample rare periods where feasible to provide more robust estimates of class-wise performance.
4.6. Original Contributions
This study makes several original contributions. It constructs a quantitative, machine-learning-assisted classification system for dating vernacular architecture based on 14 facade features manually identified and encoded from building orthophotographs. The combined use of random forest and decision tree models not only achieves high predictive accuracy but also preserves interpretability through a transparent rule-based decision tree, allowing field surveyors to apply the classification rules after the required facade attributes have been identified and coded, without the need for specialized machine-learning expertise. The resulting if-then classification logic, centered on wall finishing material, wall body material, window material, and sunroom, constitutes a practical and scientifically grounded dating tool for vernacular heritage on the North China Plain, in which standardized human-coded architectural observations are linked to reproducible machine-learning-based age classification, thereby bridging the gap between advanced machine learning techniques and everyday conservation practice.
5. Conclusions
This study developed an interpretable and low-cost method for estimating the construction age of vernacular buildings by combining random forest feature selection with CART-based decision-tree classification. Based on 630 samples from Dezhou, China, four facade features—wall finishing material, wall body material, window material, and sunroom—were identified as the most influential predictors. The model achieved 97.62% accuracy on the test set and 94.44% in independent validation.
The results confirm that the primary research objective has been largely achieved: the decision-tree rules provide explicit, field-operable inspection protocols, while the reliance on visually observable facade elements makes the method substantially more affordable than conventional dating approaches. The study offers two principal contributions: it empirically quantifies the chronological information carried by a small set of facade features, and it provides a reproducible methodological template that bridges black-box machine learning predictions with practical heritage survey applications.
The specific feature rankings and decision rules should not be directly transferred to other regions, as the chronological significance of facade materials may vary locally. However, the methodological framework—coding region-specific features, identifying influential predictors, and constructing interpretable classification models—is transferable, provided that local data collection, model retraining, and independent validation are conducted.
Future work should address four unresolved issues: extending temporal coverage beyond the 1960s–2010s range, examining geographic generalizability across villages and sub-regions, reducing subjectivity in manual feature encoding (e.g., via semi-automated image-based extraction), and conducting formal cost-benefit comparisons against traditional dating methods to better inform heritage practitioners.
Author Contributions
Conceptualization, B.W.; methodology, L.L.; software, X.L.; validation, L.L. and Z.D.; formal analysis, L.X., L.L., X.L., X.Z. and Z.Z.; investigation, B.W. and H.C.; resources, L.L.; data curation, X.L., X.Z. and H.C.; writing—original draft preparation, L.L., X.L., writing—review and editing, L.L.; visualization, X.L., X.Z. and H.C.; supervision, B.W. All authors have read and agreed to the published version of the manuscript.
Funding
This research was funded by MOE Humanities and Social Sciences Grant, grant number 24YJC850004; National Natural Science Foundation of China, grant number 52578016; Natural Science Foundation of Hunan Province, grant number 2025JJ50234; Science and Technology Program Project of Hunan Province, grant number 2025RC3096; Research Project on Teaching Reform in Degree and Graduate Education at Changsha University of Science and Technology, grant number CLYJSJG2026070; National Natural Science Foundation of China, grant number 52508006; Research Foundation of Education Bureau of Hunan Province, China, grant number 24B0285.
Data Availability Statement
The original contributions presented in this study are included in the article. Further inquiries can be directed to the corresponding author.
Acknowledgments
The authors have reviewed and edited the output and take full responsibility for the content of this publication.
Conflicts of Interest
The authors declare no conflicts of interest.
References
- Akannah, S.J.; Baffoe-Ashun, A.I.; Quagraine, V.; Oppong, R.A. A portrait of the state of vernacular architecture in Ghana: A critical review of conceptual debates and future directions. Cogent Soc. Sci. 2026, 12, 2714567. [Google Scholar] [CrossRef] [Scilit]
- Liu, H. An Exploration of Architectural Images of Hanshan Academy Illustrations in the Yongzheng Haiyang County Gazetteer. Chaozhou Stud. 2025, 134–155, 183–184. (In Chinese) [Google Scholar]
- Taher Tolou Del, M.S.; Saleh Sedghpour, B.; Kamali Tabrizi, S. The Semantic Conservation of Architectural Heritage: The Missing Values. Herit. Sci. 2020, 8, 70. [Google Scholar] [CrossRef] [Scilit]
- Wang, D.; Lu, Q.; Wu, Y.; Fan, Z. Regional Differentiation Characteristics and Formation Mechanisms of Traditional Chinese Vernacular Architectural Landscapes. J. Nat. Resour. 2019, 34, 1864–1885. (In Chinese) [Google Scholar]
- Xu, Y. On the Basic Method of Carbon-14 Dating for Determining the Construction Age of Ancient Chinese Buildings: A Case Study of the Main Hall of Jiwang Temple in Wanrong, Shanxi. Cult. Relics 2014, 70, 91–96. (In Chinese) [Google Scholar]
- Liu, Q.; Shang, B. The Impact of Geomorphological Factors on the Distribution of Typical Dwellings in Northern China. Rev. Int. Contam. Ambient. 2019, 35, 177–188. [Google Scholar] [CrossRef] [Scilit]
- Song, W. Study on the Spatial Morphology of Traditional Villages in Shandong. Master’s Thesis, Dalian University of Technology, Dalian, China, 2021. (In Chinese) [Google Scholar]
- Khashman, A.; Al-Rabady, R.; Awawdeh, S. Quantifying Attachment to Abandoned Villages in Jordan: A Pilot Survey of Connected Residents with Evidence of Empirical Fusion Between Place and Memory. Heritage 2026, 9, 302. [Google Scholar] [CrossRef] [Scilit]
- Liang, L.; Li, X.; Liu, S.; Guo, Z.; Tang, S.; Wen, B. Integrating Computer Vision and GIS for Large-Scale Morphological Mapping and Driving Force Analysis of Vernacular Courtyard Dwellings. Buildings 2026, 16, 1118. [Google Scholar] [CrossRef] [Scilit]
- Younesi, A.; Ansari, M.; Fazli, M.; Ejlali, A.; Shafique, M.; Henkel, J. A Comprehensive Survey of Convolutions in Deep Learning: Applications, Challenges, and Future Trends. IEEE Access 2024, 12, 41180–41218, Correction in IEEE Access 2024, 12, 112180. [Google Scholar] [CrossRef] [Scilit]
- Han, P.; Hu, S.; Xu, R. Formal Feature Identification of Vernacular Architecture Based on Deep Learning—A Case Study of Jiangsu Province, China. Sustainability 2025, 17, 1760. [Google Scholar] [CrossRef] [Scilit]
- Adnan, M.N.; Ip, R.H.L.; Bewong, M.; Islam, Z. BDF: A New Decision Forest Algorithm. Inf. Sci. 2021, 569, 687–705. [Google Scholar] [CrossRef] [Scilit]
- Pei, X. Several Methods for Determining the Age of Ancient Buildings. Public Archaeol. 2023, 1, 67–72. (In Chinese) [Google Scholar]
- Chen, Z. How to Determine the Construction Age of Vernacular Buildings. China Cult. Herit. Sci. Res. 2006, 3, 48–50. (In Chinese) [Google Scholar]
- Lou, Q. Reflections on the Dating of Vernacular Architecture. Treatise Hist. Archit. 2000, 13, 139–148. (In Chinese) [Google Scholar]
- Xiao, B.; Ji, G.; Hong, X.; Ma, Q. Evolution and Construction Mechanisms of Rural Housing Models: A Case Study of Rural Southern Jiangsu. Mod. Urban Res. 2022, 112, 88–94. (In Chinese) [Google Scholar]
- Miao, S.; Miao, Y.; Zhang, C.; Piao, Y. Dual-Branch EfficientNet Model with Hybrid Triplet Loss for Architectural Era Classification of Traditional Dwellings in Longzhong Region, Gansu Province. Buildings 2025, 15, 3086. [Google Scholar] [CrossRef] [Scilit]
- Bao, S.-H.; Zhuo, X.-L.; Tao, J. Using Semi-Supervised Machine Learning to Assist Classification and Recognition of Chinese Vernacular Architecture. J. Build. Eng. 2024, 98, 111327. [Google Scholar] [CrossRef] [Scilit]
- Lin, X.; Zhang, Y.; Wu, Y.; Yang, Y. Assessment of Architectural Typologies and Comparative Analysis of Defensive Rammed Earth Dwellings in the Fujian Region, China. Buildings 2024, 14, 3652. [Google Scholar] [CrossRef] [Scilit]
- Zeppelzauer, M.; Despotovic, M.; Sakeena, M.; Koch, D.; Döller, M. Automatic Prediction of Building Age from Photographs. In Proceedings of the 2018 ACM International Conference on Multimedia Retrieval (ICMR), Yokohama, Japan, 11–14 June 2018; pp. 126–134. [Google Scholar]
- Wang, M. Research on the Regional Culture of Vernacular Dwellings in Northwestern Shandong. Master’s Thesis, Shandong Jianzhu University, Jinan, China, 2014. (In Chinese) [Google Scholar]
- Wang, S. Development of an Approach to Automated Acquisition of Static Street View Images Using Transformer Architecture for Analysis of Building Characteristics. Sci. Rep. 2025, 15, 29062. [Google Scholar] [CrossRef] [Scilit]
- Kubica, J. Development of Masonry Materials and Structures from Ancient Times, Through the Present Times and the Future Perspective. J. Build. Eng. 2025, 116, 114682. [Google Scholar] [CrossRef] [Scilit]
- Wu, N.-W.; Li, E.-J. The Development and Changes of Vernacular Architecture: Exemplified by Stone Houses in North-Eastern Taiwan. J. Asian Archit. Build. Eng. 2025, 25, 1744–1762. [Google Scholar] [CrossRef] [Scilit]
- Lu, J.; Jiang, M. Changes in Rural Housing from 1979 to 2009: A Case Study of Hunan Province. Archit. J. 2009, 74–78. (In Chinese) [Google Scholar]
- Miu, T.; Zhuge, J. Characteristics and Periodization of Self-Built Houses in the Quanzhou Coastal Area Based on Archaeological Typology Method (Late 19th Century to Early 21st Century). Front. Archit. Res. 2026, 15, 522–539. [Google Scholar] [CrossRef] [Scilit]
- Soler-Estrela, A. Cultural Landscape Assessment: The Rural Architectural Heritage (13th–17th Centuries) in Mediterranean Valleys of Marina Alta, Spain. Buildings 2018, 8, 140. [Google Scholar] [CrossRef] [Scilit]
- Lin, X.; Wu, Y. Architectural Spatial Characteristics of Fujian Tubao from the Perspective of Chinese Traditional Ethical Culture. Buildings 2023, 13, 2360. [Google Scholar] [CrossRef] [Scilit]
- Jóźwik, A. Application of Glass Structures in Architectural Shaping of All-Glass Pavilions, Extensions, and Links. Buildings 2022, 12, 1254. [Google Scholar] [CrossRef] [Scilit]
- Qi, Y.; Ren, Y.; Zhou, D.; Wang, Y.; Liu, Y.; Zhang, B. Quantitative Analysis and Cause Exploration of Architectural Feature Changes in a Traditional Chinese Village: Lingquan Village, Heyang County, Shaanxi Province. Land 2023, 12, 886. [Google Scholar] [CrossRef] [Scilit]
- Jabłońska, J.; Telesińska, M.; Adamska, A.; Gronostajska, J. The Architectural Typology of Contemporary Façades for Public Buildings in the European Context. Arts 2022, 11, 11. [Google Scholar] [CrossRef] [Scilit]
- Raditya, M.Y.; Asano, J. A study on Characteristics of Historical Heritage Buildings in Makassar, Indonesia: Form Approach from Past Photograph Information. J. Asian Archit. Build. Eng. 2026, 1–31. [Google Scholar] [CrossRef] [Scilit]
- Umar, G.K.; Yusuf, D.A.; Ahmed, A.; Usman, A.M. The practice of Hausa traditional architecture: Towards conservation and restoration of spatial morphology and techniques. Sci. Afr. 2019, 5, e00142. [Google Scholar] [CrossRef] [Scilit]
- Xu, F.; Bai, Y.; Wen, B.; Xie, W.; Huang, L.; Ou, Y.; Luo, X.; Yang, Q. Contemporary evolution of Tibetan-style dwellings under urbanization: A case study of the Shannan city. J. Asian Archit. Build. Eng. 2026, 25, 2819–2836. [Google Scholar] [CrossRef] [Scilit]
- Chai, X.; Tian, Y.; Yang, S.; Wei, T. Formation, Transformation and Inheritance of Dai Dwellings Through a Typological Lens: The Case of Nongme Village, China. Buildings 2026, 16, 1411. [Google Scholar] [CrossRef] [Scilit]
- Cucuzzella, C.; Rahimi, N.; Soulikias, A. The Evolution of the Architectural Façade since 1950: A Contemporary Categorization. Architecture 2022, 3, 1–32. [Google Scholar] [CrossRef] [Scilit]
- Yang, C.; Misni, A. Exploring Comfort and Efficiency: Comparing Vernacular and Modern Dwellings in Rural Handan, Northern China. Sustainability 2026, 18, 1575. [Google Scholar] [CrossRef] [Scilit]
- Lee, A.-Y.; Oh, H.-K. A Study on the Expression Characteristics of Korean Traditionality in Restaurants & Cafes which Adopted Thatched Roof & Shingle Roofed House. J. Korean Inst. Inter. Des. 2014, 23, 147–155. [Google Scholar] [CrossRef] [Scilit]
- Karabadji, N.E.I.; Korba, A.A.; Assi, A.; Seridi, H.; Aridhi, S.; Dhifli, W. Accuracy and Diversity-Aware Multi-Objective Approach for Random Forest Construction. Expert Syst. Appl. 2023, 225, 120138. [Google Scholar] [CrossRef] [Scilit]
- Ziegler, A.; König, I.R. Mining Data with Random Forests: Current Options for Real-World Applications. WIREs Data Min. Knowl. Discov. 2014, 4, 55–63. [Google Scholar] [CrossRef] [Scilit]
- Ghosh, D.; Cabrera, J. Enriched Random Forest for High Dimensional Genomic Data. IEEE/ACM Trans. Comput. Biol. Bioinform. 2022, 19, 2817–2828. [Google Scholar] [CrossRef] [Scilit]
- Strobl, C.; Boulesteix, A.-L.; Zeileis, A.; Hothorn, T. Bias in Random Forest Variable Importance Measures: Illustrations, Sources and a Solution. BMC Bioinform. 2007, 8, 25. [Google Scholar] [CrossRef] [Scilit]
- Strobl, C.; Boulesteix, A.-L.; Kneib, T.; Augustin, T.; Zeileis, A. Conditional Variable Importance for Random Forests. BMC Bioinform. 2008, 9, 307. [Google Scholar] [CrossRef] [Scilit]
- Zhao, X.; Wu, Y.; Lee, D.L.; Cui, W. iForest: Interpreting Random Forests via Visual Analytics. IEEE Trans. Vis. Comput. Graph. 2019, 25, 407–416. [Google Scholar] [CrossRef] [Scilit]



Disclaimer/Publisher’s Note: The statements, opinions and data contained in all publications are solely those of the individual author(s) and contributor(s) and not of MDPI and/or the editor(s). MDPI and/or the editor(s) disclaim responsibility for any injury to people or property resulting from any ideas, methods, instructions or products referred to in the content. |
© 2026 by the authors. Licensee MDPI, Basel, Switzerland. This article is an open access article distributed under the terms and conditions of the Creative Commons Attribution (CC BY) license.